Gambling Module NSW Population Health Survey 2008–2009

Welcome message from author
This document is posted to help you gain knowledge. Please leave a comment to let me know what you think about it! Share it to your friends and learn new things together.
Transcript
Gambling Module
NSW Population Health Survey
2008–2009
ContentsMETHODS 2
HEALTH BEHAVIOURSAlcohol
Risk alcohol drinking 4
GamblingGambling in the last 12 months 7Gambled in the last 12 months 8Betting more than can afford to lose 11Gambled with larger amounts to get same feeling of excitement 12Tried to win back money that previously lost 13Borrowed money or sold posessions to gamble 14Self perception of gambling problem 15Health problems because of gambling 16Other people think you have a gambling problem 17Financial problems because of gambling 18Felt guilty because of gambling 19Problem Gambling Severity Index 20Problem gambler 21
Physical activityAdequate physical activity 24
SmokingCurrent smoking 27
HEALTH STATUSMental health
High and very high psychological distress 30
QUESTION MODULES 33
1
Methods
Survey sample
In 2008 and 2009, the target population for the New South Wales Population Health Survey was all residentsliving in households with private telephones. For each year, the target sample comprised approximately1,500 people in each of the 8 area health services (a total sample of 12,000) per year.
The sampling frame was developed as follows. Records from the Australia on Disk electronic white pages(phone book) were geo-coded using MapInfo mapping software.[1,2] The geo-coded telephone numberswere assigned to statistical local areas and area health services. The proportion of numbers for eachtelephone prefix by area health service was calculated. All prefixes were expanded with suffixes ranging from0000 to 9999. The resulting list was then matched back to the electronic phone book. All numbers thatmatched numbers in the electronic phone book were flagged and the number was assigned to the relevantgeo-coded area health service. Unlisted numbers were assigned to the area health service containing thegreatest proportion of numbers with that prefix. Numbers were then filtered to eliminate contiguous unusedblocks of greater than 10 numbers. The remaining numbers were then checked against the businessnumbers in the electronic phone book to eliminate business numbers. Finally, numbers were randomly sorted.
Households were contacted using random digit dialling. One person from the household was randomlyselected for inclusion in the survey.
Interviews
In 2008 and 2009, interviews were carried out continuously between February and December. Selectedhouseholds with addresses in the electronic phone book were sent a letter describing the aims and methodsof the survey 2 weeks prior to initial attempts at telephone contact. An 1800 freecall contact number wasprovided for potential respondents to verify the authenticity of the survey and to ask any questions regardingthe survey. Trained interviewers at the NSW Health Survey Program CATI facility carried out interviews. Upto 7 calls were made to establish initial contact with a household, and 5 calls were made in order to contact aselected respondent. The gambling module was collected from 1 July 2008 to December 2008 and Januaryto March 2009.
Call outcomes and response rates
In total, 9,408 interviews were conducted that included the gambling module over the 2 years. The overallresponse rate was 63.4 per cent (completed interviews divided by completed interviews and refusals).
Data analysis
For analysis, the survey sample was weighted to adjust for differences in the probabilities of selection amongsubjects. These differences were due to the varying number of people living in each household, the numberof residential telephone connections for the household, and the varying sampling fraction in each healtharea. Post-stratification weights were used to reduce the effect of differing non-response rates among malesand females and different age groups on the survey estimates. These weights were adjusted for differencesbetween the age and sex structure of the survey sample and the Australian Bureau of Statistics 2006mid-year population estimates (excluding residents of institutions) for each area health service. Furtherinformation on the weighting process is provided elsewhere.[3,4]
Call and interview data were manipulated and analysed using SAS version 8.02.[5] The SURVEYFREQprocedure in SAS was used to analyse the data and calculate point estimates and 95 per cent confidenceintervals for the estimates. The SURVEYFREQ procedure calculates standard errors adjusted for the designeffect factor or DEFF (the variance for a non-random sample divided by the variance for a simple randomsample). It uses the Taylor expansion method to estimate sampling errors of estimators based on thestratified random sample.[5]
2
Gambling Problem Index
The Canadian Problem Gambling Index (CPGI) was used. The respondents were first asked a generalquestion on their gambling activities in the last 12 months. If a person gambled in the last 12 months theneach of the nine CPGI questions were asked. However, based on the results of field testing, if a respondentonly bought instant scratch tickets, lotto, or any other lottery game; and/or only played keno at a club, hotel,casino or other place; and/or only bought raffle or art union tickets, they scored the same as a person whohad not gambled in the last 12 months, and therefore were not asked the CPGI questions. For non gamblersand for each response of: never or rarely a score of 0 was given; something a score of 1 is given; most of thetime a score of 2 is given; almost always a score of 3 is given. The four cut off points are 0 for a non-problemgambler; 1-2 for a low risk gambler; 3-7 for a moderate risk gambler and 8+ for a problem gambler.[6]
References1. Australia on Disk [software]. Sydney: Australia on Disk, 2000. 2. MapInfo [software]. Troy, NY: MapInfo Corporation, 1997. 3. Barr M, Baker D, Gorringe M, and Fritsche L. NSW Population Health Survey: Description of Methods.
Sydney: Centre for Epidemiology and Research, NSW Department of Health, 2008. Available online atwww.health.nsw.gov.au/resources/publichealth/surveys/health_survey_method.asp (accessed 27February 2009).
4. Steel D. NSW Population Health Survey: Review of the Weighting Procedures. Sydney: Centre forEpidemiology and Research, NSW Department of Health, 2006. Available online atwww.health.nsw.gov.au/pubs/2006/review_weighting.html (accessed 27 February 2009).
5. SAS Institute. The SAS System for Windows version 8.2. Cary, NC: SAS Institute Inc., 2001. 6. Wynne HJ. Introducing the Canadian Problem Gambling Index. Alberta, Canada, January 2003
3
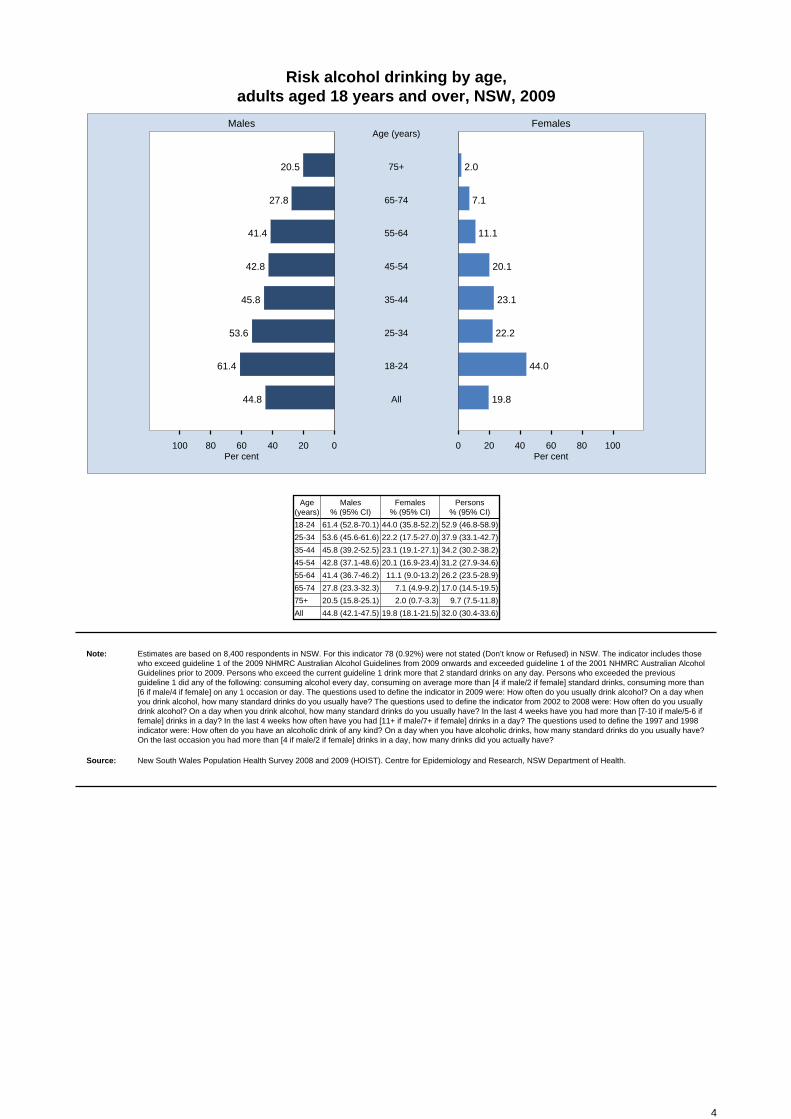
Risk alcohol drinking by age, adults aged 18 years and over, NSW, 2009
020406080100 0 20 40 60 80 100
Males Females
Per cent Per cent
20.5 2.075+
Age (years)
27.8 7.165-74
41.4 11.155-64
42.8 20.145-54
45.8 23.135-44
53.6 22.225-34
61.4 44.018-24
44.8 19.8All
Age(years)
Males % (95% CI)
Females % (95% CI)
Persons % (95% CI)
18-24 61.4 (52.8-70.1) 44.0 (35.8-52.2) 52.9 (46.8-58.9)
25-34 53.6 (45.6-61.6) 22.2 (17.5-27.0) 37.9 (33.1-42.7)
35-44 45.8 (39.2-52.5) 23.1 (19.1-27.1) 34.2 (30.2-38.2)
45-54 42.8 (37.1-48.6) 20.1 (16.9-23.4) 31.2 (27.9-34.6)
55-64 41.4 (36.7-46.2) 11.1 (9.0-13.2) 26.2 (23.5-28.9)
65-74 27.8 (23.3-32.3) 7.1 (4.9-9.2) 17.0 (14.5-19.5)
75+ 20.5 (15.8-25.1) 2.0 (0.7-3.3) 9.7 (7.5-11.8)
All 44.8 (42.1-47.5) 19.8 (18.1-21.5) 32.0 (30.4-33.6)
Note: Estimates are based on 8,400 respondents in NSW. For this indicator 78 (0.92%) were not stated (Don’t know or Refused) in NSW. The indicator includes thosewho exceed guideline 1 of the 2009 NHMRC Australian Alcohol Guidelines from 2009 onwards and exceeded guideline 1 of the 2001 NHMRC Australian AlcoholGuidelines prior to 2009. Persons who exceed the current guideline 1 drink more that 2 standard drinks on any day. Persons who exceeded the previousguideline 1 did any of the following: consuming alcohol every day, consuming on average more than [4 if male/2 if female] standard drinks, consuming more than[6 if male/4 if female] on any 1 occasion or day. The questions used to define the indicator in 2009 were: How often do you usually drink alcohol? On a day whenyou drink alcohol, how many standard drinks do you usually have? The questions used to define the indicator from 2002 to 2008 were: How often do you usuallydrink alcohol? On a day when you drink alcohol, how many standard drinks do you usually have? In the last 4 weeks have you had more than [7-10 if male/5-6 iffemale] drinks in a day? In the last 4 weeks how often have you had [11+ if male/7+ if female] drinks in a day? The questions used to define the 1997 and 1998indicator were: How often do you have an alcoholic drink of any kind? On a day when you have alcoholic drinks, how many standard drinks do you usually have?On the last occasion you had more than [4 if male/2 if female] drinks in a day, how many drinks did you actually have?
Source: New South Wales Population Health Survey 2008 and 2009 (HOIST). Centre for Epidemiology and Research, NSW Department of Health.
4
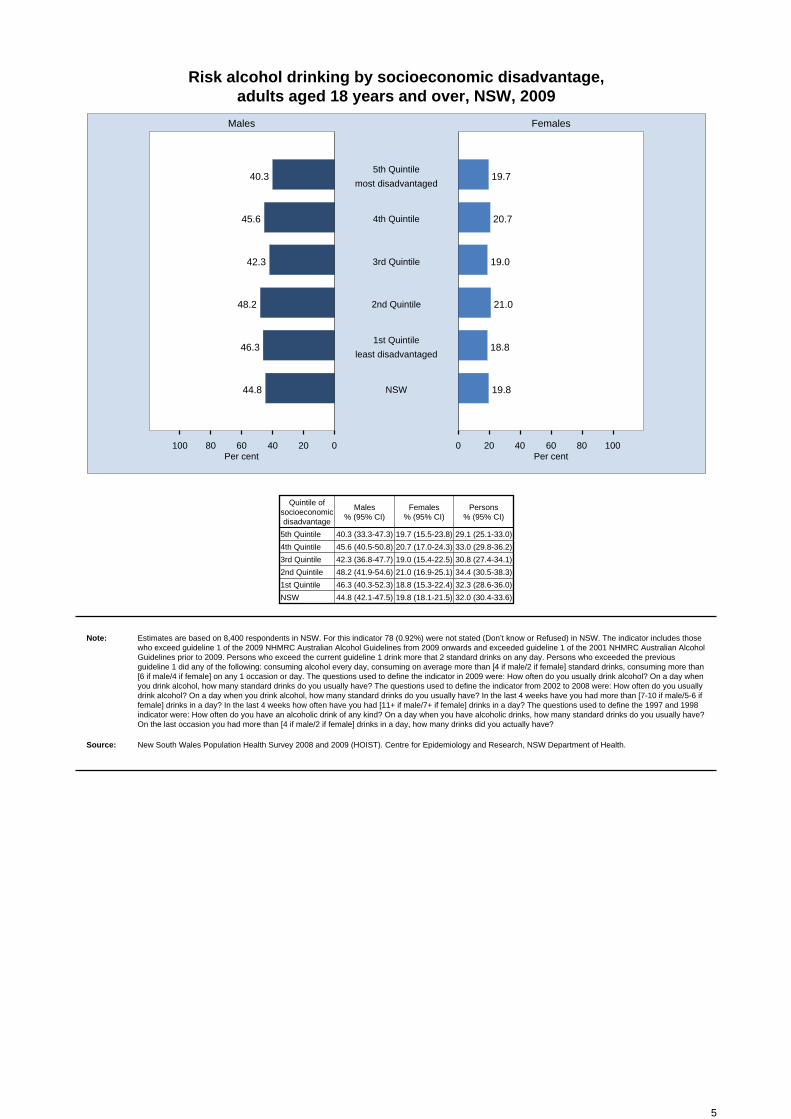
Risk alcohol drinking by socioeconomic disadvantage, adults aged 18 years and over, NSW, 2009
020406080100 0 20 40 60 80 100
Males Females
Per cent Per cent
40.3 19.75th Quintile
most disadvantaged
45.6 20.74th Quintile
42.3 19.03rd Quintile
48.2 21.02nd Quintile
46.3 18.81st Quintile
least disadvantaged
44.8 19.8NSW
Quintile ofsocioeconomicdisadvantage
Males % (95% CI)
Females % (95% CI)
Persons % (95% CI)
5th Quintile 40.3 (33.3-47.3) 19.7 (15.5-23.8) 29.1 (25.1-33.0)
4th Quintile 45.6 (40.5-50.8) 20.7 (17.0-24.3) 33.0 (29.8-36.2)
3rd Quintile 42.3 (36.8-47.7) 19.0 (15.4-22.5) 30.8 (27.4-34.1)
2nd Quintile 48.2 (41.9-54.6) 21.0 (16.9-25.1) 34.4 (30.5-38.3)
1st Quintile 46.3 (40.3-52.3) 18.8 (15.3-22.4) 32.3 (28.6-36.0)
NSW 44.8 (42.1-47.5) 19.8 (18.1-21.5) 32.0 (30.4-33.6)
Note: Estimates are based on 8,400 respondents in NSW. For this indicator 78 (0.92%) were not stated (Don’t know or Refused) in NSW. The indicator includes thosewho exceed guideline 1 of the 2009 NHMRC Australian Alcohol Guidelines from 2009 onwards and exceeded guideline 1 of the 2001 NHMRC Australian AlcoholGuidelines prior to 2009. Persons who exceed the current guideline 1 drink more that 2 standard drinks on any day. Persons who exceeded the previousguideline 1 did any of the following: consuming alcohol every day, consuming on average more than [4 if male/2 if female] standard drinks, consuming more than[6 if male/4 if female] on any 1 occasion or day. The questions used to define the indicator in 2009 were: How often do you usually drink alcohol? On a day whenyou drink alcohol, how many standard drinks do you usually have? The questions used to define the indicator from 2002 to 2008 were: How often do you usuallydrink alcohol? On a day when you drink alcohol, how many standard drinks do you usually have? In the last 4 weeks have you had more than [7-10 if male/5-6 iffemale] drinks in a day? In the last 4 weeks how often have you had [11+ if male/7+ if female] drinks in a day? The questions used to define the 1997 and 1998indicator were: How often do you have an alcoholic drink of any kind? On a day when you have alcoholic drinks, how many standard drinks do you usually have?On the last occasion you had more than [4 if male/2 if female] drinks in a day, how many drinks did you actually have?
Source: New South Wales Population Health Survey 2008 and 2009 (HOIST). Centre for Epidemiology and Research, NSW Department of Health.
5
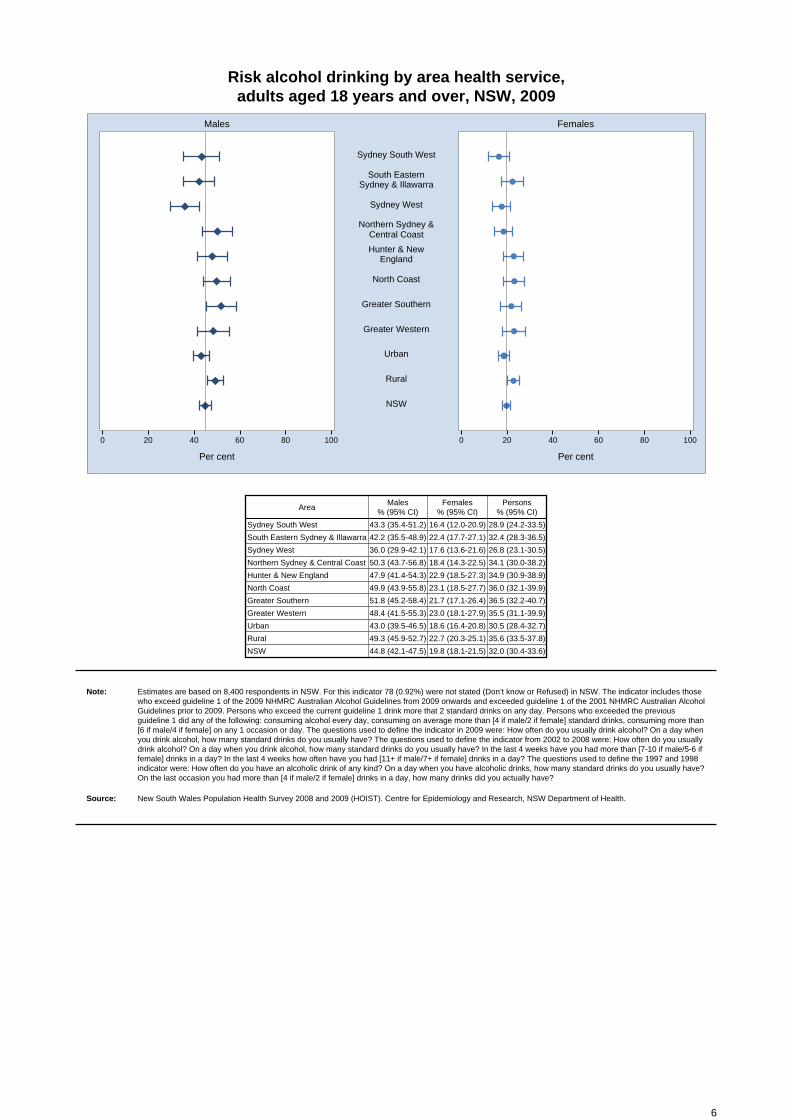
Risk alcohol drinking by area health service, adults aged 18 years and over, NSW, 2009
0 20 40 60 80 100 0 20 40 60 80 100
Males Females
Per cent Per cent
Sydney South West
South EasternSydney & Illawarra
Sydney West
Northern Sydney &Central Coast
Hunter & NewEngland
North Coast
Greater Southern
Greater Western
Urban
Rural
NSW
AreaMales
% (95% CI)Females
% (95% CI)Persons
% (95% CI)
Sydney South West 43.3 (35.4-51.2) 16.4 (12.0-20.9) 28.9 (24.2-33.5)
South Eastern Sydney & Illawarra 42.2 (35.5-48.9) 22.4 (17.7-27.1) 32.4 (28.3-36.5)
Sydney West 36.0 (29.9-42.1) 17.6 (13.6-21.6) 26.8 (23.1-30.5)
Northern Sydney & Central Coast 50.3 (43.7-56.8) 18.4 (14.3-22.5) 34.1 (30.0-38.2)
Hunter & New England 47.9 (41.4-54.3) 22.9 (18.5-27.3) 34.9 (30.9-38.9)
North Coast 49.9 (43.9-55.8) 23.1 (18.5-27.7) 36.0 (32.1-39.9)
Greater Southern 51.8 (45.2-58.4) 21.7 (17.1-26.4) 36.5 (32.2-40.7)
Greater Western 48.4 (41.5-55.3) 23.0 (18.1-27.9) 35.5 (31.1-39.9)
Urban 43.0 (39.5-46.5) 18.6 (16.4-20.8) 30.5 (28.4-32.7)
Rural 49.3 (45.9-52.7) 22.7 (20.3-25.1) 35.6 (33.5-37.8)
NSW 44.8 (42.1-47.5) 19.8 (18.1-21.5) 32.0 (30.4-33.6)
Note: Estimates are based on 8,400 respondents in NSW. For this indicator 78 (0.92%) were not stated (Don’t know or Refused) in NSW. The indicator includes thosewho exceed guideline 1 of the 2009 NHMRC Australian Alcohol Guidelines from 2009 onwards and exceeded guideline 1 of the 2001 NHMRC Australian AlcoholGuidelines prior to 2009. Persons who exceed the current guideline 1 drink more that 2 standard drinks on any day. Persons who exceeded the previousguideline 1 did any of the following: consuming alcohol every day, consuming on average more than [4 if male/2 if female] standard drinks, consuming more than[6 if male/4 if female] on any 1 occasion or day. The questions used to define the indicator in 2009 were: How often do you usually drink alcohol? On a day whenyou drink alcohol, how many standard drinks do you usually have? The questions used to define the indicator from 2002 to 2008 were: How often do you usuallydrink alcohol? On a day when you drink alcohol, how many standard drinks do you usually have? In the last 4 weeks have you had more than [7-10 if male/5-6 iffemale] drinks in a day? In the last 4 weeks how often have you had [11+ if male/7+ if female] drinks in a day? The questions used to define the 1997 and 1998indicator were: How often do you have an alcoholic drink of any kind? On a day when you have alcoholic drinks, how many standard drinks do you usually have?On the last occasion you had more than [4 if male/2 if female] drinks in a day, how many drinks did you actually have?
Source: New South Wales Population Health Survey 2008 and 2009 (HOIST). Centre for Epidemiology and Research, NSW Department of Health.
6
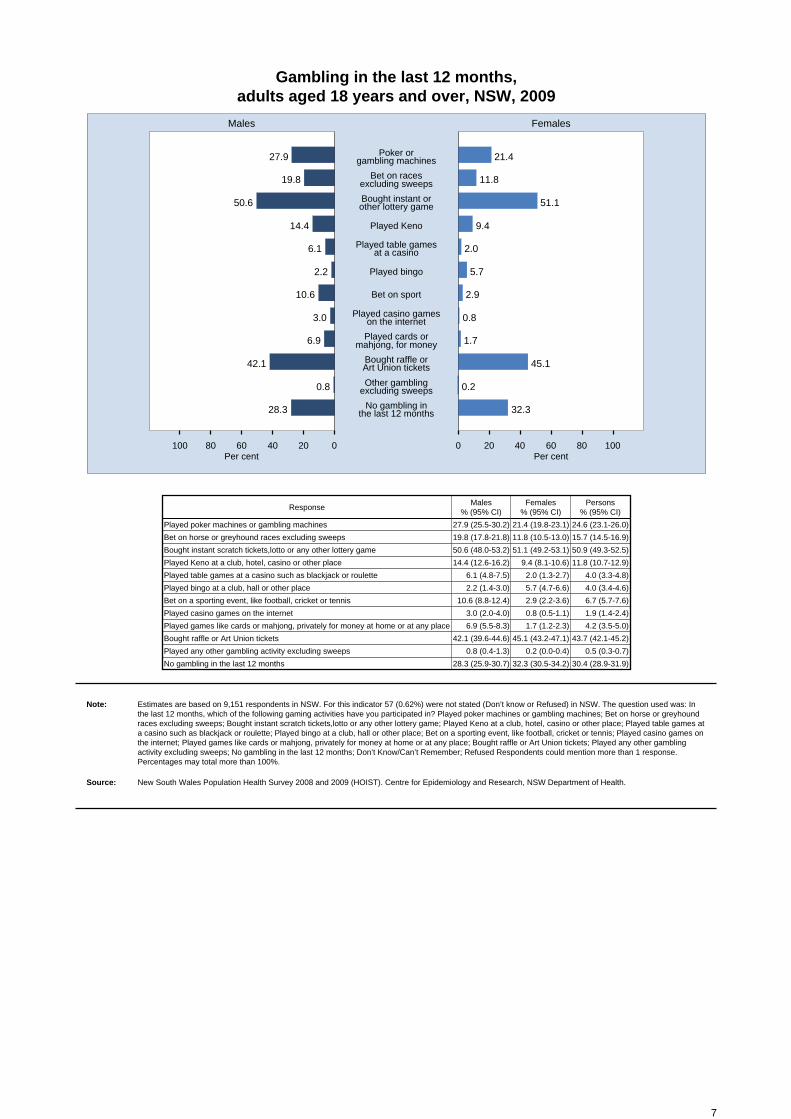
Gambling in the last 12 months, adults aged 18 years and over, NSW, 2009
020406080100 0 20 40 60 80 100
Males Females
Per cent Per cent
27.9 21.4Poker orgambling machines
19.8 11.8Bet on racesexcluding sweeps
50.6 51.1Bought instant orother lottery game
14.4 9.4Played Keno
6.1 2.0Played table gamesat a casino
2.2 5.7Played bingo
10.6 2.9Bet on sport
3.0 0.8Played casino gameson the internet
6.9 1.7Played cards ormahjong, for money
42.1 45.1Bought raffle orArt Union tickets
0.8 0.2Other gamblingexcluding sweeps
28.3 32.3No gambling inthe last 12 months
ResponseMales
% (95% CI)Females
% (95% CI)Persons
% (95% CI)
Played poker machines or gambling machines 27.9 (25.5-30.2) 21.4 (19.8-23.1) 24.6 (23.1-26.0)
Bet on horse or greyhound races excluding sweeps 19.8 (17.8-21.8) 11.8 (10.5-13.0) 15.7 (14.5-16.9)
Bought instant scratch tickets,lotto or any other lottery game 50.6 (48.0-53.2) 51.1 (49.2-53.1) 50.9 (49.3-52.5)
Played Keno at a club, hotel, casino or other place 14.4 (12.6-16.2) 9.4 (8.1-10.6) 11.8 (10.7-12.9)
Played table games at a casino such as blackjack or roulette 6.1 (4.8-7.5) 2.0 (1.3-2.7) 4.0 (3.3-4.8)
Played bingo at a club, hall or other place 2.2 (1.4-3.0) 5.7 (4.7-6.6) 4.0 (3.4-4.6)
Bet on a sporting event, like football, cricket or tennis 10.6 (8.8-12.4) 2.9 (2.2-3.6) 6.7 (5.7-7.6)
Played casino games on the internet 3.0 (2.0-4.0) 0.8 (0.5-1.1) 1.9 (1.4-2.4)
Played games like cards or mahjong, privately for money at home or at any place 6.9 (5.5-8.3) 1.7 (1.2-2.3) 4.2 (3.5-5.0)
Bought raffle or Art Union tickets 42.1 (39.6-44.6) 45.1 (43.2-47.1) 43.7 (42.1-45.2)
Played any other gambling activity excluding sweeps 0.8 (0.4-1.3) 0.2 (0.0-0.4) 0.5 (0.3-0.7)
No gambling in the last 12 months 28.3 (25.9-30.7) 32.3 (30.5-34.2) 30.4 (28.9-31.9)
Note: Estimates are based on 9,151 respondents in NSW. For this indicator 57 (0.62%) were not stated (Don’t know or Refused) in NSW. The question used was: Inthe last 12 months, which of the following gaming activities have you participated in? Played poker machines or gambling machines; Bet on horse or greyhoundraces excluding sweeps; Bought instant scratch tickets,lotto or any other lottery game; Played Keno at a club, hotel, casino or other place; Played table games ata casino such as blackjack or roulette; Played bingo at a club, hall or other place; Bet on a sporting event, like football, cricket or tennis; Played casino games onthe internet; Played games like cards or mahjong, privately for money at home or at any place; Bought raffle or Art Union tickets; Played any other gamblingactivity excluding sweeps; No gambling in the last 12 months; Don’t Know/Can’t Remember; Refused Respondents could mention more than 1 response.Percentages may total more than 100%.
Source: New South Wales Population Health Survey 2008 and 2009 (HOIST). Centre for Epidemiology and Research, NSW Department of Health.
7
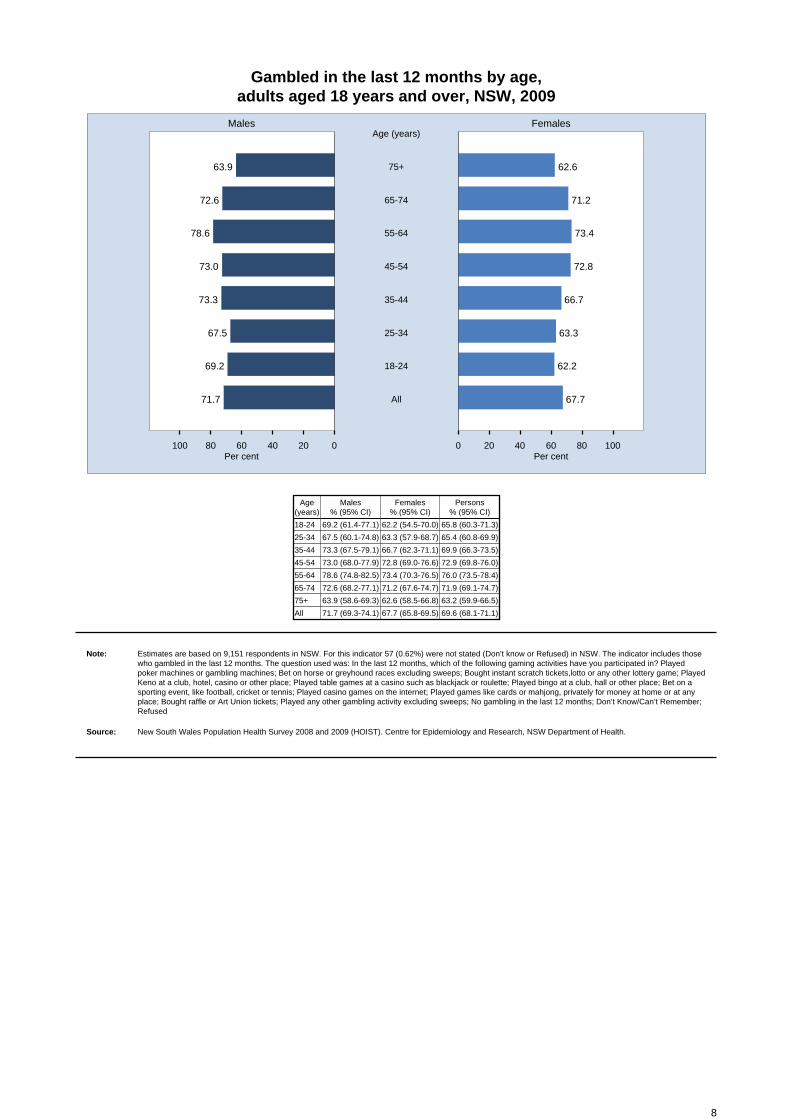
Gambled in the last 12 months by age, adults aged 18 years and over, NSW, 2009
020406080100 0 20 40 60 80 100
Males Females
Per cent Per cent
63.9 62.675+
Age (years)
72.6 71.265-74
78.6 73.455-64
73.0 72.845-54
73.3 66.735-44
67.5 63.325-34
69.2 62.218-24
71.7 67.7All
Age(years)
Males % (95% CI)
Females % (95% CI)
Persons % (95% CI)
18-24 69.2 (61.4-77.1) 62.2 (54.5-70.0) 65.8 (60.3-71.3)
25-34 67.5 (60.1-74.8) 63.3 (57.9-68.7) 65.4 (60.8-69.9)
35-44 73.3 (67.5-79.1) 66.7 (62.3-71.1) 69.9 (66.3-73.5)
45-54 73.0 (68.0-77.9) 72.8 (69.0-76.6) 72.9 (69.8-76.0)
55-64 78.6 (74.8-82.5) 73.4 (70.3-76.5) 76.0 (73.5-78.4)
65-74 72.6 (68.2-77.1) 71.2 (67.6-74.7) 71.9 (69.1-74.7)
75+ 63.9 (58.6-69.3) 62.6 (58.5-66.8) 63.2 (59.9-66.5)
All 71.7 (69.3-74.1) 67.7 (65.8-69.5) 69.6 (68.1-71.1)
Note: Estimates are based on 9,151 respondents in NSW. For this indicator 57 (0.62%) were not stated (Don’t know or Refused) in NSW. The indicator includes thosewho gambled in the last 12 months. The question used was: In the last 12 months, which of the following gaming activities have you participated in? Playedpoker machines or gambling machines; Bet on horse or greyhound races excluding sweeps; Bought instant scratch tickets,lotto or any other lottery game; PlayedKeno at a club, hotel, casino or other place; Played table games at a casino such as blackjack or roulette; Played bingo at a club, hall or other place; Bet on asporting event, like football, cricket or tennis; Played casino games on the internet; Played games like cards or mahjong, privately for money at home or at anyplace; Bought raffle or Art Union tickets; Played any other gambling activity excluding sweeps; No gambling in the last 12 months; Don’t Know/Can’t Remember; Refused
Source: New South Wales Population Health Survey 2008 and 2009 (HOIST). Centre for Epidemiology and Research, NSW Department of Health.
8
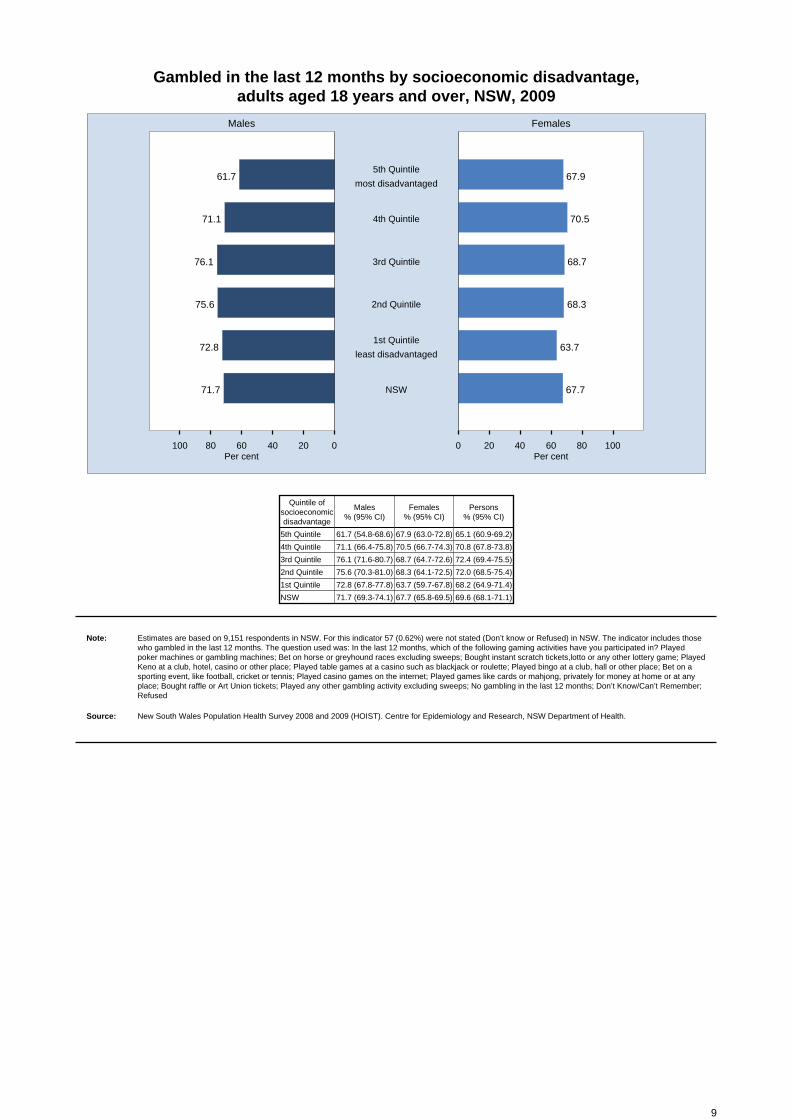
Gambled in the last 12 months by socioeconomic disadvantage, adults aged 18 years and over, NSW, 2009
020406080100 0 20 40 60 80 100
Males Females
Per cent Per cent
61.7 67.95th Quintile
most disadvantaged
71.1 70.54th Quintile
76.1 68.73rd Quintile
75.6 68.32nd Quintile
72.8 63.71st Quintile
least disadvantaged
71.7 67.7NSW
Quintile ofsocioeconomicdisadvantage
Males % (95% CI)
Females % (95% CI)
Persons % (95% CI)
5th Quintile 61.7 (54.8-68.6) 67.9 (63.0-72.8) 65.1 (60.9-69.2)
4th Quintile 71.1 (66.4-75.8) 70.5 (66.7-74.3) 70.8 (67.8-73.8)
3rd Quintile 76.1 (71.6-80.7) 68.7 (64.7-72.6) 72.4 (69.4-75.5)
2nd Quintile 75.6 (70.3-81.0) 68.3 (64.1-72.5) 72.0 (68.5-75.4)
1st Quintile 72.8 (67.8-77.8) 63.7 (59.7-67.8) 68.2 (64.9-71.4)
NSW 71.7 (69.3-74.1) 67.7 (65.8-69.5) 69.6 (68.1-71.1)
Note: Estimates are based on 9,151 respondents in NSW. For this indicator 57 (0.62%) were not stated (Don’t know or Refused) in NSW. The indicator includes thosewho gambled in the last 12 months. The question used was: In the last 12 months, which of the following gaming activities have you participated in? Playedpoker machines or gambling machines; Bet on horse or greyhound races excluding sweeps; Bought instant scratch tickets,lotto or any other lottery game; PlayedKeno at a club, hotel, casino or other place; Played table games at a casino such as blackjack or roulette; Played bingo at a club, hall or other place; Bet on asporting event, like football, cricket or tennis; Played casino games on the internet; Played games like cards or mahjong, privately for money at home or at anyplace; Bought raffle or Art Union tickets; Played any other gambling activity excluding sweeps; No gambling in the last 12 months; Don’t Know/Can’t Remember; Refused
Source: New South Wales Population Health Survey 2008 and 2009 (HOIST). Centre for Epidemiology and Research, NSW Department of Health.
9
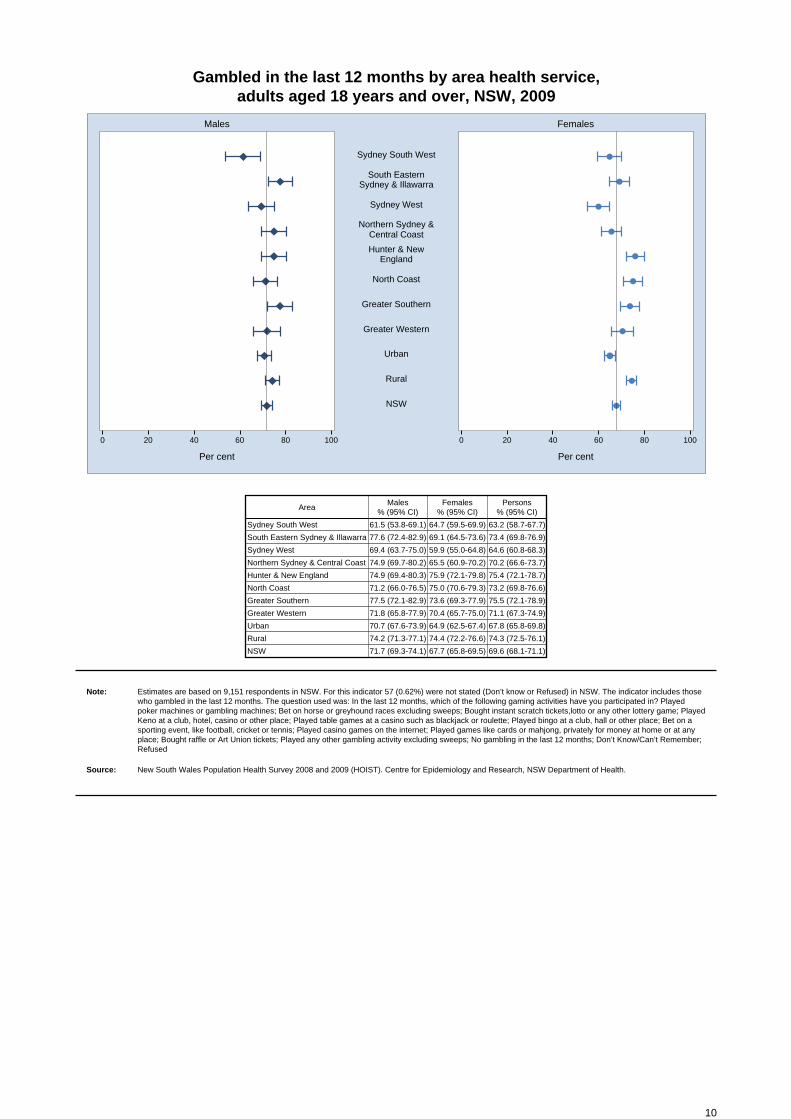
Gambled in the last 12 months by area health service, adults aged 18 years and over, NSW, 2009
0 20 40 60 80 100 0 20 40 60 80 100
Males Females
Per cent Per cent
Sydney South West
South EasternSydney & Illawarra
Sydney West
Northern Sydney &Central Coast
Hunter & NewEngland
North Coast
Greater Southern
Greater Western
Urban
Rural
NSW
AreaMales
% (95% CI)Females
% (95% CI)Persons
% (95% CI)
Sydney South West 61.5 (53.8-69.1) 64.7 (59.5-69.9) 63.2 (58.7-67.7)
South Eastern Sydney & Illawarra 77.6 (72.4-82.9) 69.1 (64.5-73.6) 73.4 (69.8-76.9)
Sydney West 69.4 (63.7-75.0) 59.9 (55.0-64.8) 64.6 (60.8-68.3)
Northern Sydney & Central Coast 74.9 (69.7-80.2) 65.5 (60.9-70.2) 70.2 (66.6-73.7)
Hunter & New England 74.9 (69.4-80.3) 75.9 (72.1-79.8) 75.4 (72.1-78.7)
North Coast 71.2 (66.0-76.5) 75.0 (70.6-79.3) 73.2 (69.8-76.6)
Greater Southern 77.5 (72.1-82.9) 73.6 (69.3-77.9) 75.5 (72.1-78.9)
Greater Western 71.8 (65.8-77.9) 70.4 (65.7-75.0) 71.1 (67.3-74.9)
Urban 70.7 (67.6-73.9) 64.9 (62.5-67.4) 67.8 (65.8-69.8)
Rural 74.2 (71.3-77.1) 74.4 (72.2-76.6) 74.3 (72.5-76.1)
NSW 71.7 (69.3-74.1) 67.7 (65.8-69.5) 69.6 (68.1-71.1)
Note: Estimates are based on 9,151 respondents in NSW. For this indicator 57 (0.62%) were not stated (Don’t know or Refused) in NSW. The indicator includes thosewho gambled in the last 12 months. The question used was: In the last 12 months, which of the following gaming activities have you participated in? Playedpoker machines or gambling machines; Bet on horse or greyhound races excluding sweeps; Bought instant scratch tickets,lotto or any other lottery game; PlayedKeno at a club, hotel, casino or other place; Played table games at a casino such as blackjack or roulette; Played bingo at a club, hall or other place; Bet on asporting event, like football, cricket or tennis; Played casino games on the internet; Played games like cards or mahjong, privately for money at home or at anyplace; Bought raffle or Art Union tickets; Played any other gambling activity excluding sweeps; No gambling in the last 12 months; Don’t Know/Can’t Remember; Refused
Source: New South Wales Population Health Survey 2008 and 2009 (HOIST). Centre for Epidemiology and Research, NSW Department of Health.
10

Betting more than can afford to lose, adults aged 18 years and over who gamble, NSW, 2009
020406080100 0 20 40 60 80 100
Males Females
Per cent Per cent
87.2 91.1Never
5.7 4.6Rarely
5.8 3.8Sometimes
0.8 0.2Often
0.5 0.3Always
ResponseMales
% (95% CI)Females
% (95% CI)Persons
% (95% CI)
Never 87.2 (84.3-90.0) 91.1 (88.6-93.7) 88.9 (87.0-90.9)
Rarely 5.7 (3.7-7.8) 4.6 (2.5-6.7) 5.2 (3.8-6.7)
Sometimes 5.8 (3.9-7.8) 3.8 (2.1-5.4) 4.9 (3.6-6.2)
Often 0.8 (0.0-1.6) 0.2 (0.0-0.4) 0.5 (0.1-1.0)
Always 0.5 (0.2-0.8) 0.3 (0.0-0.5) 0.4 (0.2-0.6)
Note: Estimates are based on 3,018 respondents in NSW. For this indicator 69 (2.24%) were not stated (Don’t know or Refused) in NSW. The questions used were: Inthe last 12 months, have you undertaken any forms of gambling? Have you bet more than you could really afford to lose?
Source: New South Wales Population Health Survey 2008 and 2009 (HOIST). Centre for Epidemiology and Research, NSW Department of Health.
11
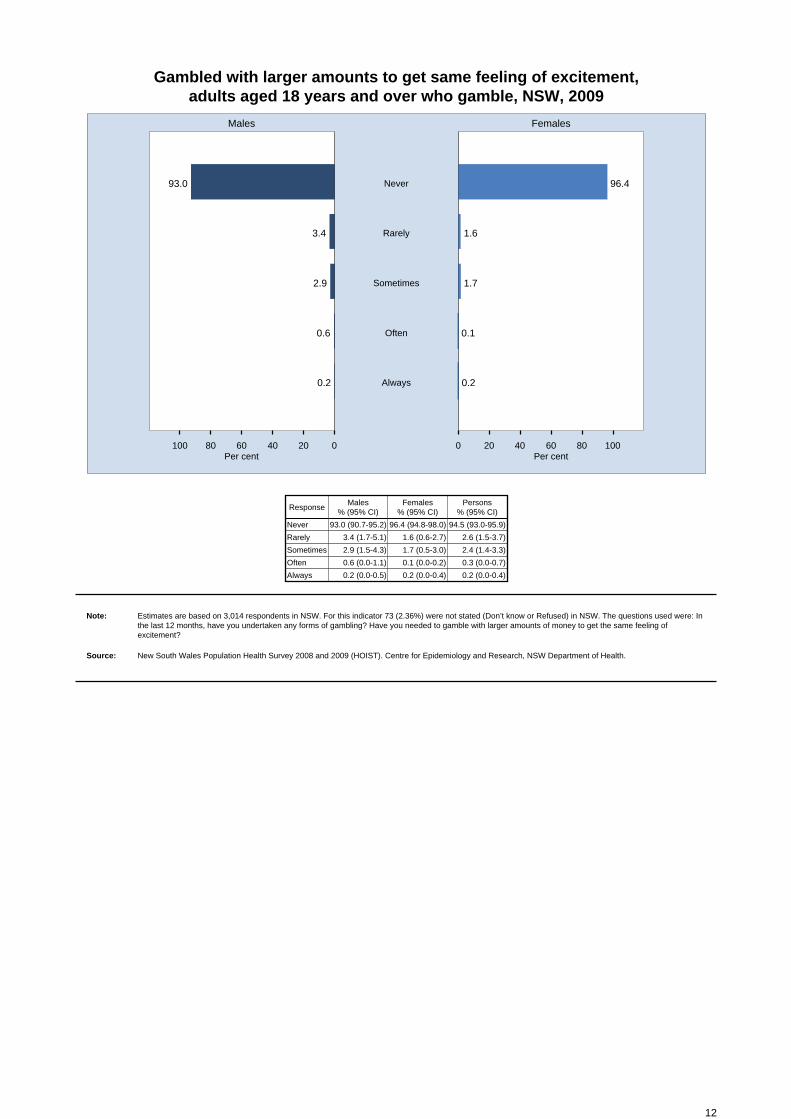
Gambled with larger amounts to get same feeling of excitement, adults aged 18 years and over who gamble, NSW, 2009
020406080100 0 20 40 60 80 100
Males Females
Per cent Per cent
93.0 96.4Never
3.4 1.6Rarely
2.9 1.7Sometimes
0.6 0.1Often
0.2 0.2Always
ResponseMales
% (95% CI)Females
% (95% CI)Persons
% (95% CI)
Never 93.0 (90.7-95.2) 96.4 (94.8-98.0) 94.5 (93.0-95.9)
Rarely 3.4 (1.7-5.1) 1.6 (0.6-2.7) 2.6 (1.5-3.7)
Sometimes 2.9 (1.5-4.3) 1.7 (0.5-3.0) 2.4 (1.4-3.3)
Often 0.6 (0.0-1.1) 0.1 (0.0-0.2) 0.3 (0.0-0.7)
Always 0.2 (0.0-0.5) 0.2 (0.0-0.4) 0.2 (0.0-0.4)
Note: Estimates are based on 3,014 respondents in NSW. For this indicator 73 (2.36%) were not stated (Don’t know or Refused) in NSW. The questions used were: Inthe last 12 months, have you undertaken any forms of gambling? Have you needed to gamble with larger amounts of money to get the same feeling of excitement?
Source: New South Wales Population Health Survey 2008 and 2009 (HOIST). Centre for Epidemiology and Research, NSW Department of Health.
12
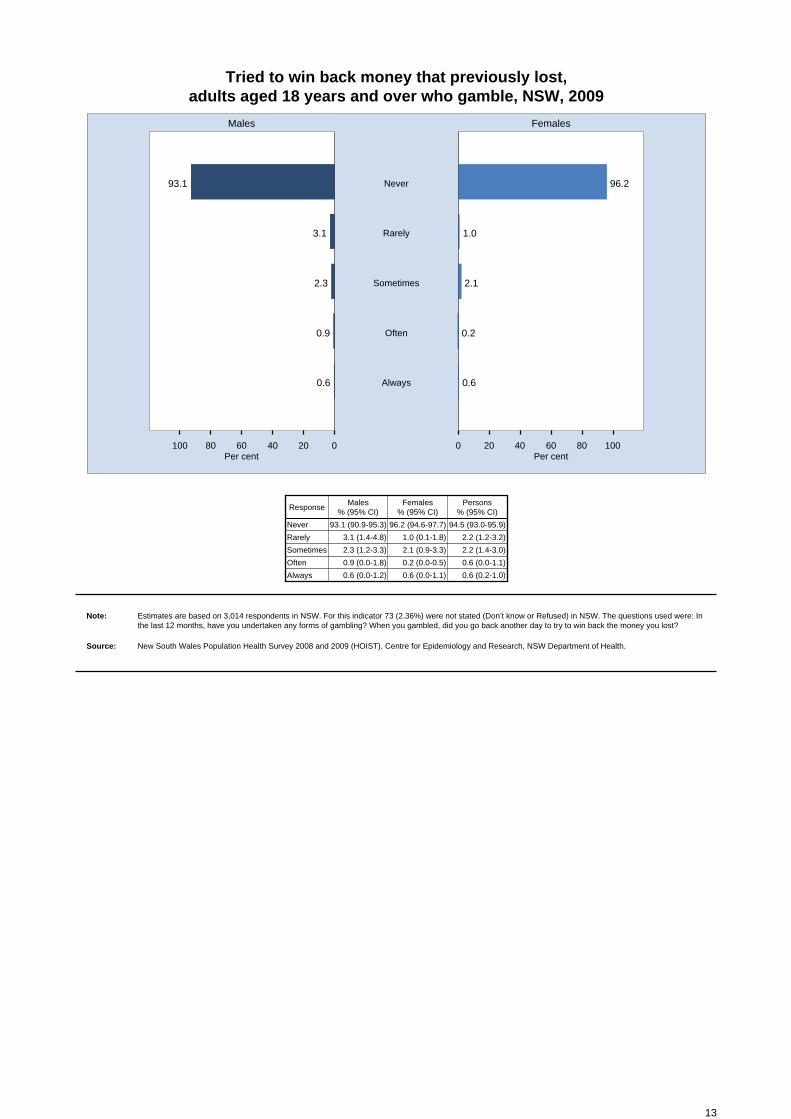
Tried to win back money that previously lost, adults aged 18 years and over who gamble, NSW, 2009
020406080100 0 20 40 60 80 100
Males Females
Per cent Per cent
93.1 96.2Never
3.1 1.0Rarely
2.3 2.1Sometimes
0.9 0.2Often
0.6 0.6Always
ResponseMales
% (95% CI)Females
% (95% CI)Persons
% (95% CI)
Never 93.1 (90.9-95.3) 96.2 (94.6-97.7) 94.5 (93.0-95.9)
Rarely 3.1 (1.4-4.8) 1.0 (0.1-1.8) 2.2 (1.2-3.2)
Sometimes 2.3 (1.2-3.3) 2.1 (0.9-3.3) 2.2 (1.4-3.0)
Often 0.9 (0.0-1.8) 0.2 (0.0-0.5) 0.6 (0.0-1.1)
Always 0.6 (0.0-1.2) 0.6 (0.0-1.1) 0.6 (0.2-1.0)
Note: Estimates are based on 3,014 respondents in NSW. For this indicator 73 (2.36%) were not stated (Don’t know or Refused) in NSW. The questions used were: Inthe last 12 months, have you undertaken any forms of gambling? When you gambled, did you go back another day to try to win back the money you lost?
Source: New South Wales Population Health Survey 2008 and 2009 (HOIST). Centre for Epidemiology and Research, NSW Department of Health.
13

Borrowed money or sold posessions to gamble, adults aged 18 years and over who gamble, NSW, 2009
020406080100 0 20 40 60 80 100
Males Females
Per cent Per cent
97.9 99.2Never
0.5 0.3Rarely
1.0 0.0Sometimes
0.4 0.2Often
0.1 0.2Always
ResponseMales
% (95% CI)Females
% (95% CI)Persons
% (95% CI)
Never 97.9 (96.8-99.0) 99.2 (98.7-99.7) 98.5 (97.8-99.1)
Rarely 0.5 (0.1-0.8) 0.3 (0.0-0.6) 0.4 (0.2-0.6)
Sometimes 1.0 (0.2-1.9) 0.0 (0.0-0.1) 0.6 (0.2-1.1)
Often 0.4 (0.0-1.0) 0.2 (0.0-0.5) 0.3 (0.0-0.7)
Always 0.1 (0.0-0.4) 0.2 (0.0-0.5) 0.2 (0.0-0.4)
Note: Estimates are based on 3,011 respondents in NSW. For this indicator 76 (2.46%) were not stated (Don’t know or Refused) in NSW. The questions used were: Inthe last 12 months, have you undertaken any forms of gambling? Have you borrowed money or sold anything to get money to gamble?
Source: New South Wales Population Health Survey 2008 and 2009 (HOIST). Centre for Epidemiology and Research, NSW Department of Health.
14
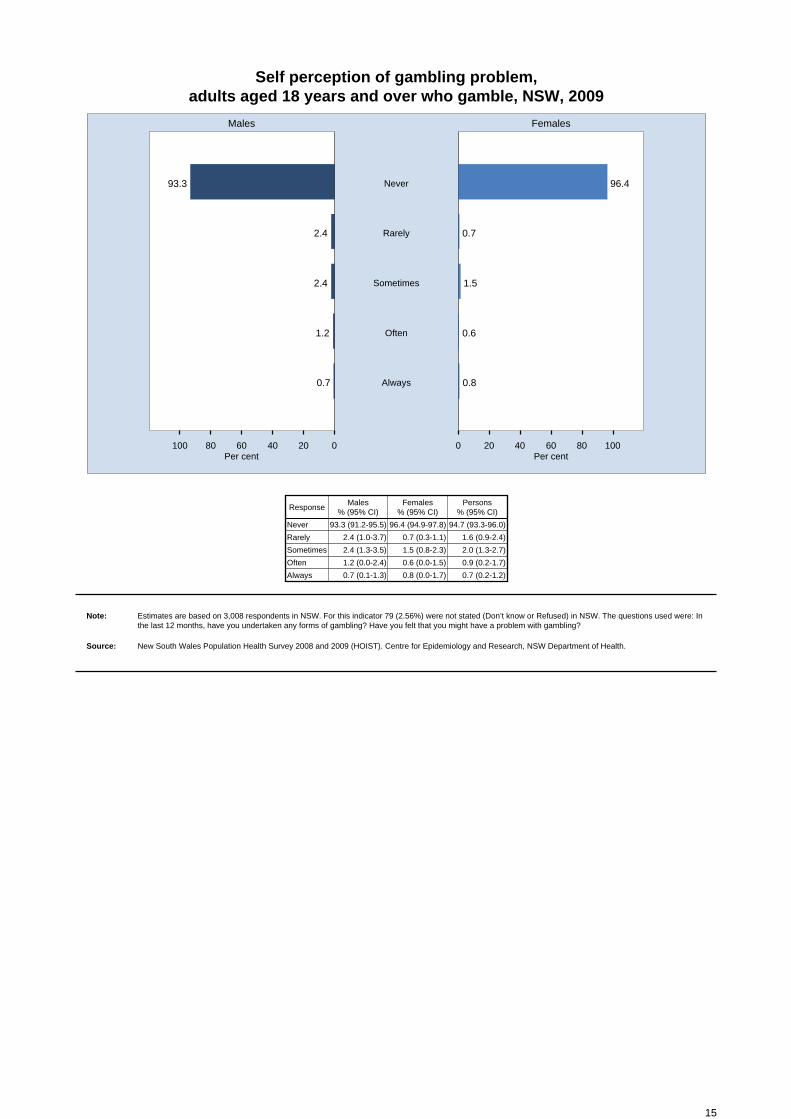
Self perception of gambling problem, adults aged 18 years and over who gamble, NSW, 2009
020406080100 0 20 40 60 80 100
Males Females
Per cent Per cent
93.3 96.4Never
2.4 0.7Rarely
2.4 1.5Sometimes
1.2 0.6Often
0.7 0.8Always
ResponseMales
% (95% CI)Females
% (95% CI)Persons
% (95% CI)
Never 93.3 (91.2-95.5) 96.4 (94.9-97.8) 94.7 (93.3-96.0)
Rarely 2.4 (1.0-3.7) 0.7 (0.3-1.1) 1.6 (0.9-2.4)
Sometimes 2.4 (1.3-3.5) 1.5 (0.8-2.3) 2.0 (1.3-2.7)
Often 1.2 (0.0-2.4) 0.6 (0.0-1.5) 0.9 (0.2-1.7)
Always 0.7 (0.1-1.3) 0.8 (0.0-1.7) 0.7 (0.2-1.2)
Note: Estimates are based on 3,008 respondents in NSW. For this indicator 79 (2.56%) were not stated (Don’t know or Refused) in NSW. The questions used were: Inthe last 12 months, have you undertaken any forms of gambling? Have you felt that you might have a problem with gambling?
Source: New South Wales Population Health Survey 2008 and 2009 (HOIST). Centre for Epidemiology and Research, NSW Department of Health.
15

Health problems because of gambling, adults aged 18 years and over who gamble, NSW, 2009
020406080100 0 20 40 60 80 100
Males Females
Per cent Per cent
95.5 97.6Never
1.1 0.7Rarely
1.8 1.2Sometimes
0.8 0.1Often
0.8 0.4Always
ResponseMales
% (95% CI)Females
% (95% CI)Persons
% (95% CI)
Never 95.5 (93.8-97.3) 97.6 (96.3-99.0) 96.5 (95.3-97.6)
Rarely 1.1 (0.4-1.8) 0.7 (0.0-1.6) 0.9 (0.4-1.5)
Sometimes 1.8 (0.7-2.9) 1.2 (0.2-2.1) 1.5 (0.8-2.3)
Often 0.8 (0.0-1.7) 0.1 (0.0-0.2) 0.5 (0.0-1.0)
Always 0.8 (0.0-1.6) 0.4 (0.1-0.7) 0.6 (0.1-1.1)
Note: Estimates are based on 3,010 respondents in NSW. For this indicator 77 (2.49%) were not stated (Don’t know or Refused) in NSW. The questions used were: Inthe last 12 months, have you undertaken any forms of gambling? Has gambling caused you any health problems, including stress or anxiety?
Source: New South Wales Population Health Survey 2008 and 2009 (HOIST). Centre for Epidemiology and Research, NSW Department of Health.
16
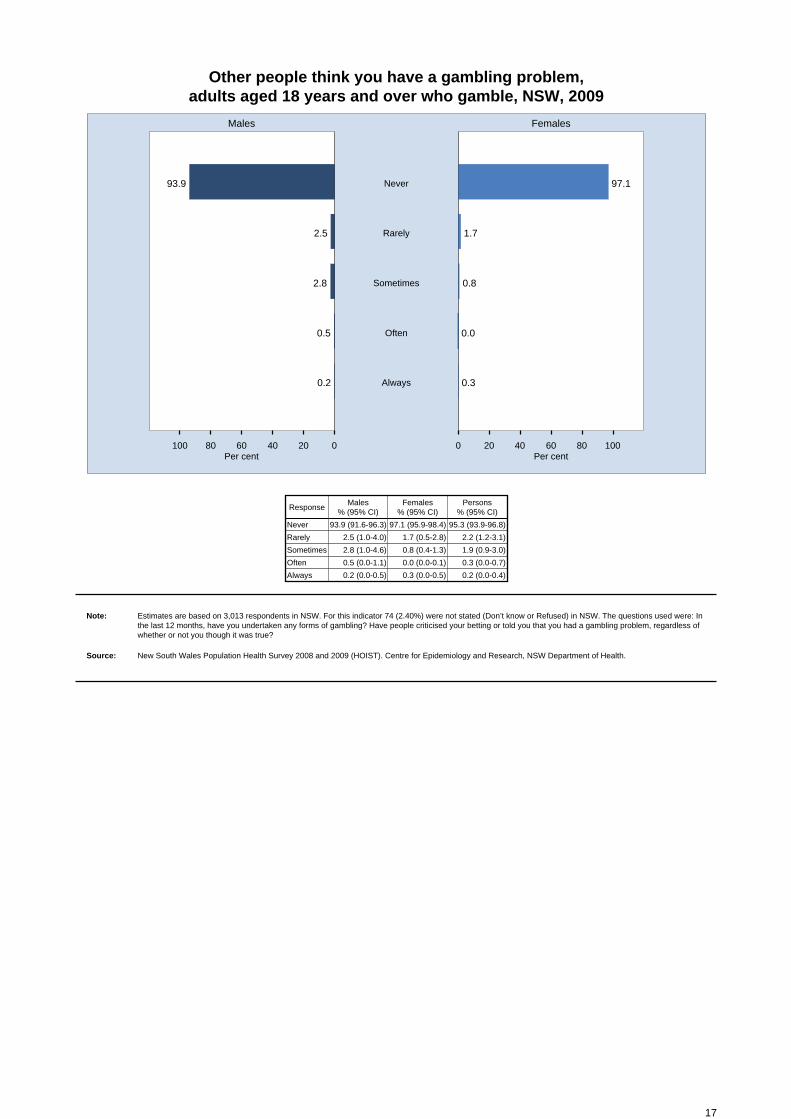
Other people think you have a gambling problem, adults aged 18 years and over who gamble, NSW, 2009
020406080100 0 20 40 60 80 100
Males Females
Per cent Per cent
93.9 97.1Never
2.5 1.7Rarely
2.8 0.8Sometimes
0.5 0.0Often
0.2 0.3Always
ResponseMales
% (95% CI)Females
% (95% CI)Persons
% (95% CI)
Never 93.9 (91.6-96.3) 97.1 (95.9-98.4) 95.3 (93.9-96.8)
Rarely 2.5 (1.0-4.0) 1.7 (0.5-2.8) 2.2 (1.2-3.1)
Sometimes 2.8 (1.0-4.6) 0.8 (0.4-1.3) 1.9 (0.9-3.0)
Often 0.5 (0.0-1.1) 0.0 (0.0-0.1) 0.3 (0.0-0.7)
Always 0.2 (0.0-0.5) 0.3 (0.0-0.5) 0.2 (0.0-0.4)
Note: Estimates are based on 3,013 respondents in NSW. For this indicator 74 (2.40%) were not stated (Don’t know or Refused) in NSW. The questions used were: Inthe last 12 months, have you undertaken any forms of gambling? Have people criticised your betting or told you that you had a gambling problem, regardless ofwhether or not you though it was true?
Source: New South Wales Population Health Survey 2008 and 2009 (HOIST). Centre for Epidemiology and Research, NSW Department of Health.
17
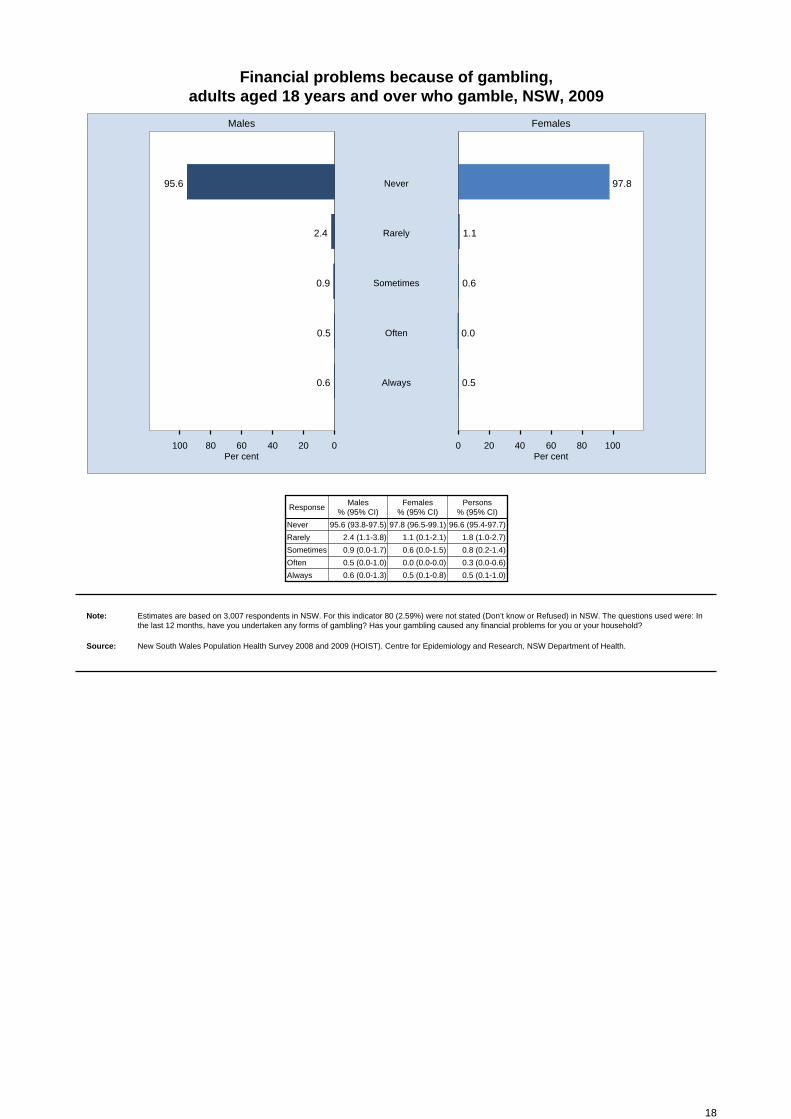
Financial problems because of gambling, adults aged 18 years and over who gamble, NSW, 2009
020406080100 0 20 40 60 80 100
Males Females
Per cent Per cent
95.6 97.8Never
2.4 1.1Rarely
0.9 0.6Sometimes
0.5 0.0Often
0.6 0.5Always
ResponseMales
% (95% CI)Females
% (95% CI)Persons
% (95% CI)
Never 95.6 (93.8-97.5) 97.8 (96.5-99.1) 96.6 (95.4-97.7)
Rarely 2.4 (1.1-3.8) 1.1 (0.1-2.1) 1.8 (1.0-2.7)
Sometimes 0.9 (0.0-1.7) 0.6 (0.0-1.5) 0.8 (0.2-1.4)
Often 0.5 (0.0-1.0) 0.0 (0.0-0.0) 0.3 (0.0-0.6)
Always 0.6 (0.0-1.3) 0.5 (0.1-0.8) 0.5 (0.1-1.0)
Note: Estimates are based on 3,007 respondents in NSW. For this indicator 80 (2.59%) were not stated (Don’t know or Refused) in NSW. The questions used were: Inthe last 12 months, have you undertaken any forms of gambling? Has your gambling caused any financial problems for you or your household?
Source: New South Wales Population Health Survey 2008 and 2009 (HOIST). Centre for Epidemiology and Research, NSW Department of Health.
18
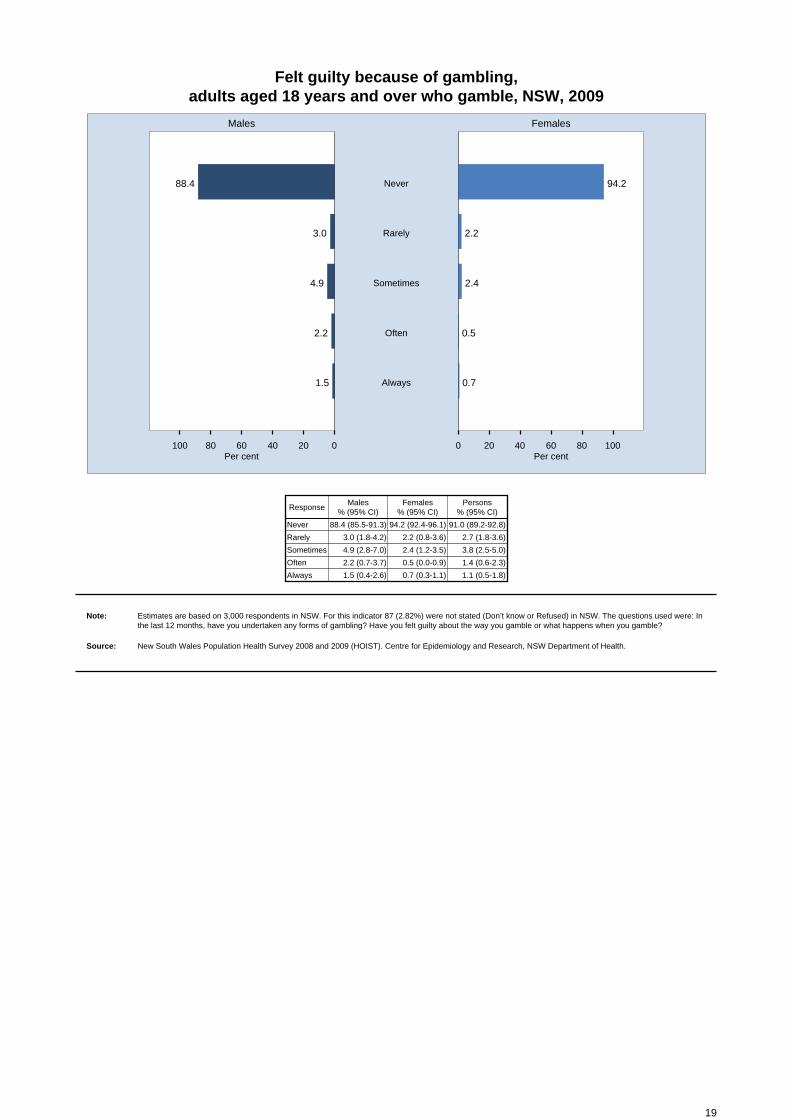
Felt guilty because of gambling, adults aged 18 years and over who gamble, NSW, 2009
020406080100 0 20 40 60 80 100
Males Females
Per cent Per cent
88.4 94.2Never
3.0 2.2Rarely
4.9 2.4Sometimes
2.2 0.5Often
1.5 0.7Always
ResponseMales
% (95% CI)Females
% (95% CI)Persons
% (95% CI)
Never 88.4 (85.5-91.3) 94.2 (92.4-96.1) 91.0 (89.2-92.8)
Rarely 3.0 (1.8-4.2) 2.2 (0.8-3.6) 2.7 (1.8-3.6)
Sometimes 4.9 (2.8-7.0) 2.4 (1.2-3.5) 3.8 (2.5-5.0)
Often 2.2 (0.7-3.7) 0.5 (0.0-0.9) 1.4 (0.6-2.3)
Always 1.5 (0.4-2.6) 0.7 (0.3-1.1) 1.1 (0.5-1.8)
Note: Estimates are based on 3,000 respondents in NSW. For this indicator 87 (2.82%) were not stated (Don’t know or Refused) in NSW. The questions used were: Inthe last 12 months, have you undertaken any forms of gambling? Have you felt guilty about the way you gamble or what happens when you gamble?
Source: New South Wales Population Health Survey 2008 and 2009 (HOIST). Centre for Epidemiology and Research, NSW Department of Health.
19
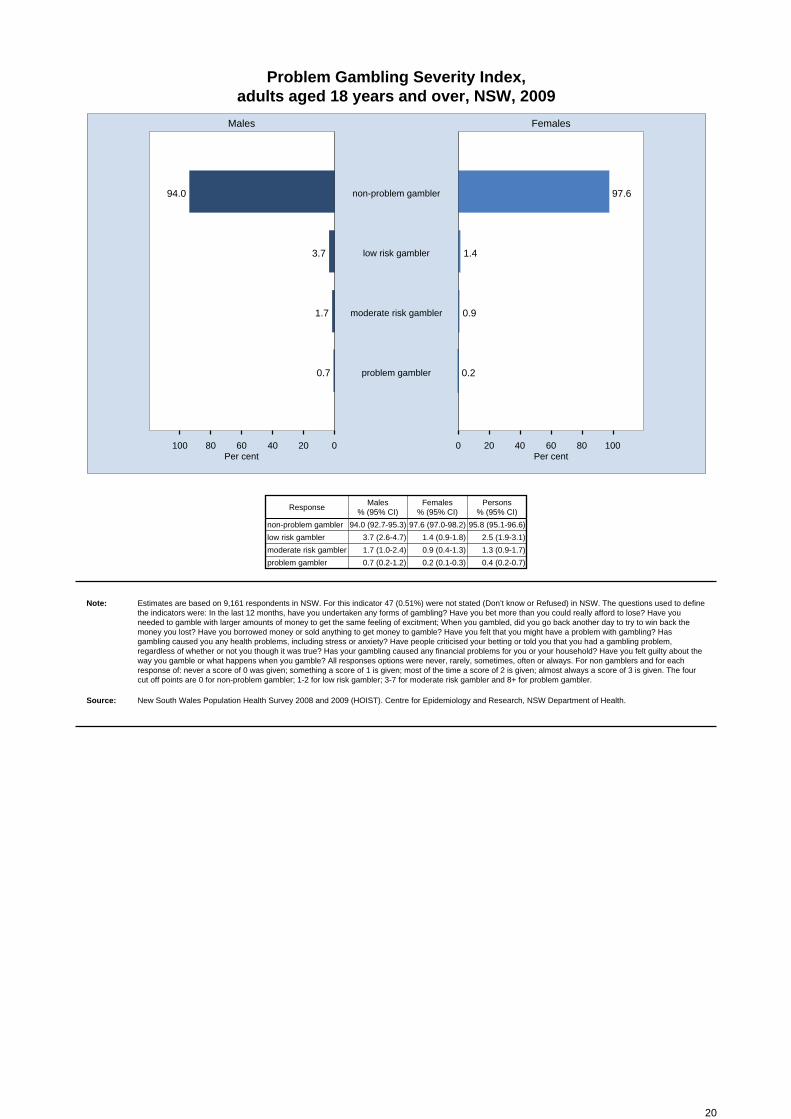
Problem Gambling Severity Index, adults aged 18 years and over, NSW, 2009
020406080100 0 20 40 60 80 100
Males Females
Per cent Per cent
94.0 97.6non-problem gambler
3.7 1.4low risk gambler
1.7 0.9moderate risk gambler
0.7 0.2problem gambler
ResponseMales
% (95% CI)Females
% (95% CI)Persons
% (95% CI)
non-problem gambler 94.0 (92.7-95.3) 97.6 (97.0-98.2) 95.8 (95.1-96.6)
low risk gambler 3.7 (2.6-4.7) 1.4 (0.9-1.8) 2.5 (1.9-3.1)
moderate risk gambler 1.7 (1.0-2.4) 0.9 (0.4-1.3) 1.3 (0.9-1.7)
problem gambler 0.7 (0.2-1.2) 0.2 (0.1-0.3) 0.4 (0.2-0.7)
Note: Estimates are based on 9,161 respondents in NSW. For this indicator 47 (0.51%) were not stated (Don’t know or Refused) in NSW. The questions used to definethe indicators were: In the last 12 months, have you undertaken any forms of gambling? Have you bet more than you could really afford to lose? Have youneeded to gamble with larger amounts of money to get the same feeling of excitment; When you gambled, did you go back another day to try to win back themoney you lost? Have you borrowed money or sold anything to get money to gamble? Have you felt that you might have a problem with gambling? Hasgambling caused you any health problems, including stress or anxiety? Have people criticised your betting or told you that you had a gambling problem,regardless of whether or not you though it was true? Has your gambling caused any financial problems for you or your household? Have you felt guilty about theway you gamble or what happens when you gamble? All responses options were never, rarely, sometimes, often or always. For non gamblers and for eachresponse of: never a score of 0 was given; something a score of 1 is given; most of the time a score of 2 is given; almost always a score of 3 is given. The fourcut off points are 0 for non-problem gambler; 1-2 for low risk gambler; 3-7 for moderate risk gambler and 8+ for problem gambler.
Source: New South Wales Population Health Survey 2008 and 2009 (HOIST). Centre for Epidemiology and Research, NSW Department of Health.
20
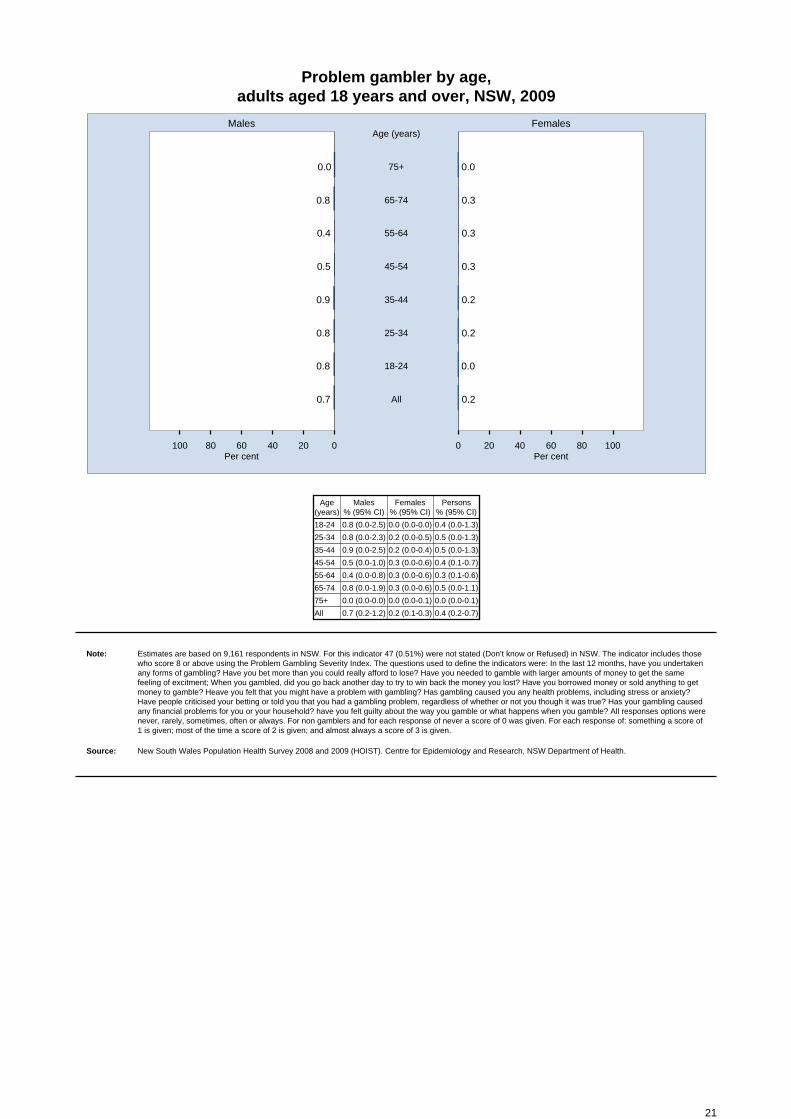
Problem gambler by age, adults aged 18 years and over, NSW, 2009
020406080100 0 20 40 60 80 100
Males Females
Per cent Per cent
0.0 0.075+
Age (years)
0.8 0.365-74
0.4 0.355-64
0.5 0.345-54
0.9 0.235-44
0.8 0.225-34
0.8 0.018-24
0.7 0.2All
Age(years)
Males % (95% CI)
Females % (95% CI)
Persons % (95% CI)
18-24 0.8 (0.0-2.5) 0.0 (0.0-0.0) 0.4 (0.0-1.3)
25-34 0.8 (0.0-2.3) 0.2 (0.0-0.5) 0.5 (0.0-1.3)
35-44 0.9 (0.0-2.5) 0.2 (0.0-0.4) 0.5 (0.0-1.3)
45-54 0.5 (0.0-1.0) 0.3 (0.0-0.6) 0.4 (0.1-0.7)
55-64 0.4 (0.0-0.8) 0.3 (0.0-0.6) 0.3 (0.1-0.6)
65-74 0.8 (0.0-1.9) 0.3 (0.0-0.6) 0.5 (0.0-1.1)
75+ 0.0 (0.0-0.0) 0.0 (0.0-0.1) 0.0 (0.0-0.1)
All 0.7 (0.2-1.2) 0.2 (0.1-0.3) 0.4 (0.2-0.7)
Note: Estimates are based on 9,161 respondents in NSW. For this indicator 47 (0.51%) were not stated (Don’t know or Refused) in NSW. The indicator includes thosewho score 8 or above using the Problem Gambling Severity Index. The questions used to define the indicators were: In the last 12 months, have you undertakenany forms of gambling? Have you bet more than you could really afford to lose? Have you needed to gamble with larger amounts of money to get the samefeeling of excitment; When you gambled, did you go back another day to try to win back the money you lost? Have you borrowed money or sold anything to getmoney to gamble? Heave you felt that you might have a problem with gambling? Has gambling caused you any health problems, including stress or anxiety?Have people criticised your betting or told you that you had a gambling problem, regardless of whether or not you though it was true? Has your gambling causedany financial problems for you or your household? have you felt guilty about the way you gamble or what happens when you gamble? All responses options werenever, rarely, sometimes, often or always. For non gamblers and for each response of never a score of 0 was given. For each response of: something a score of1 is given; most of the time a score of 2 is given; and almost always a score of 3 is given.
Source: New South Wales Population Health Survey 2008 and 2009 (HOIST). Centre for Epidemiology and Research, NSW Department of Health.
21
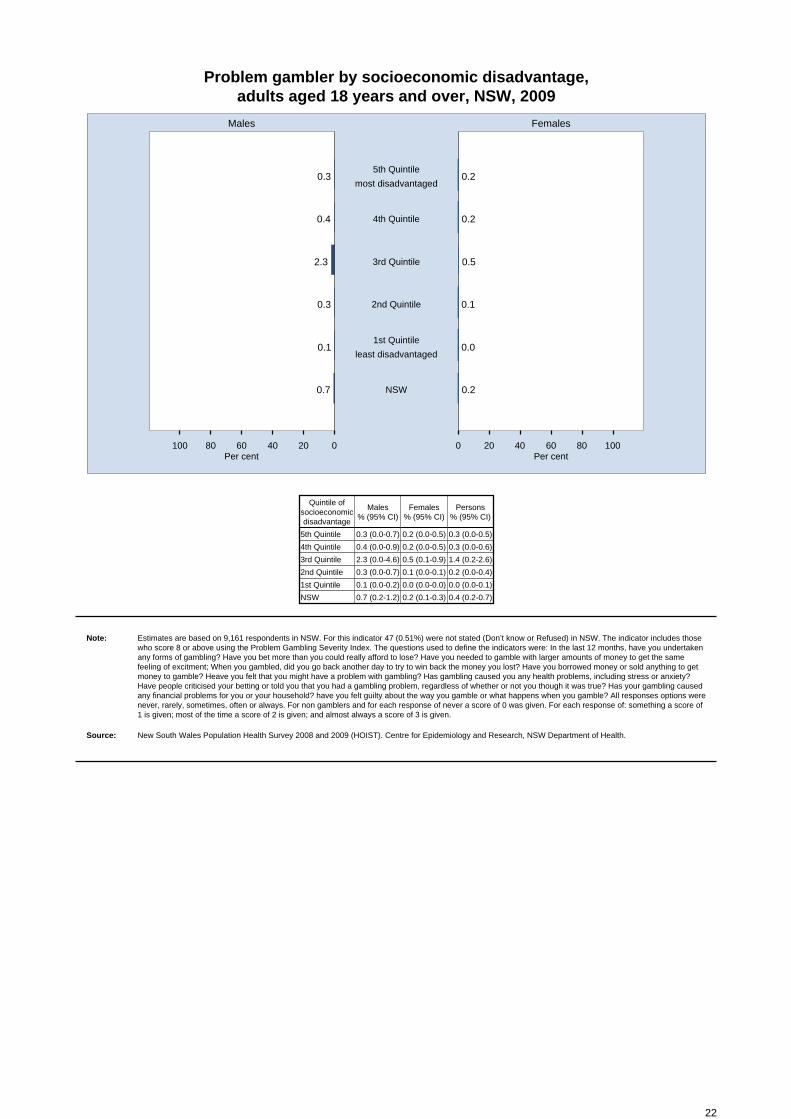
Problem gambler by socioeconomic disadvantage, adults aged 18 years and over, NSW, 2009
020406080100 0 20 40 60 80 100
Males Females
Per cent Per cent
0.3 0.25th Quintile
most disadvantaged
0.4 0.24th Quintile
2.3 0.53rd Quintile
0.3 0.12nd Quintile
0.1 0.01st Quintile
least disadvantaged
0.7 0.2NSW
Quintile ofsocioeconomicdisadvantage
Males % (95% CI)
Females % (95% CI)
Persons % (95% CI)
5th Quintile 0.3 (0.0-0.7) 0.2 (0.0-0.5) 0.3 (0.0-0.5)
4th Quintile 0.4 (0.0-0.9) 0.2 (0.0-0.5) 0.3 (0.0-0.6)
3rd Quintile 2.3 (0.0-4.6) 0.5 (0.1-0.9) 1.4 (0.2-2.6)
2nd Quintile 0.3 (0.0-0.7) 0.1 (0.0-0.1) 0.2 (0.0-0.4)
1st Quintile 0.1 (0.0-0.2) 0.0 (0.0-0.0) 0.0 (0.0-0.1)
NSW 0.7 (0.2-1.2) 0.2 (0.1-0.3) 0.4 (0.2-0.7)
Note: Estimates are based on 9,161 respondents in NSW. For this indicator 47 (0.51%) were not stated (Don’t know or Refused) in NSW. The indicator includes thosewho score 8 or above using the Problem Gambling Severity Index. The questions used to define the indicators were: In the last 12 months, have you undertakenany forms of gambling? Have you bet more than you could really afford to lose? Have you needed to gamble with larger amounts of money to get the samefeeling of excitment; When you gambled, did you go back another day to try to win back the money you lost? Have you borrowed money or sold anything to getmoney to gamble? Heave you felt that you might have a problem with gambling? Has gambling caused you any health problems, including stress or anxiety?Have people criticised your betting or told you that you had a gambling problem, regardless of whether or not you though it was true? Has your gambling causedany financial problems for you or your household? have you felt guilty about the way you gamble or what happens when you gamble? All responses options werenever, rarely, sometimes, often or always. For non gamblers and for each response of never a score of 0 was given. For each response of: something a score of1 is given; most of the time a score of 2 is given; and almost always a score of 3 is given.
Source: New South Wales Population Health Survey 2008 and 2009 (HOIST). Centre for Epidemiology and Research, NSW Department of Health.
22
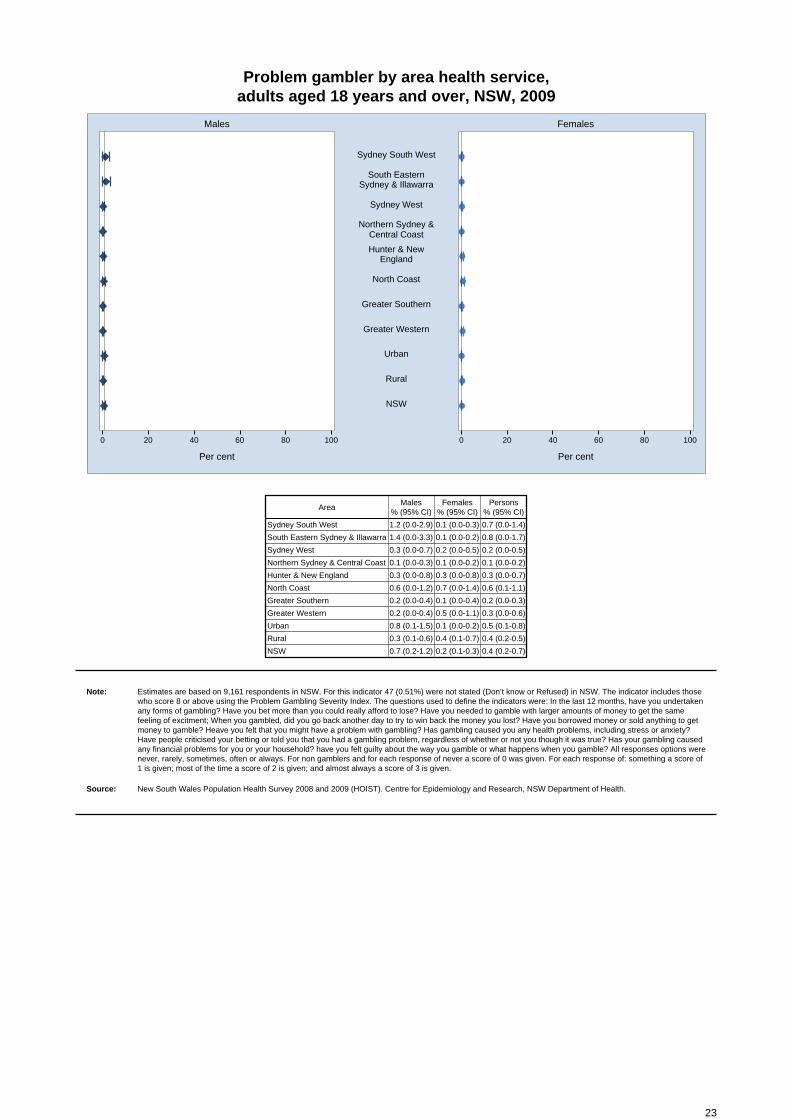
Problem gambler by area health service, adults aged 18 years and over, NSW, 2009
0 20 40 60 80 100 0 20 40 60 80 100
Males Females
Per cent Per cent
Sydney South West
South EasternSydney & Illawarra
Sydney West
Northern Sydney &Central Coast
Hunter & NewEngland
North Coast
Greater Southern
Greater Western
Urban
Rural
NSW
AreaMales
% (95% CI)Females
% (95% CI)Persons
% (95% CI)
Sydney South West 1.2 (0.0-2.9) 0.1 (0.0-0.3) 0.7 (0.0-1.4)
South Eastern Sydney & Illawarra 1.4 (0.0-3.3) 0.1 (0.0-0.2) 0.8 (0.0-1.7)
Sydney West 0.3 (0.0-0.7) 0.2 (0.0-0.5) 0.2 (0.0-0.5)
Northern Sydney & Central Coast 0.1 (0.0-0.3) 0.1 (0.0-0.2) 0.1 (0.0-0.2)
Hunter & New England 0.3 (0.0-0.8) 0.3 (0.0-0.8) 0.3 (0.0-0.7)
North Coast 0.6 (0.0-1.2) 0.7 (0.0-1.4) 0.6 (0.1-1.1)
Greater Southern 0.2 (0.0-0.4) 0.1 (0.0-0.4) 0.2 (0.0-0.3)
Greater Western 0.2 (0.0-0.4) 0.5 (0.0-1.1) 0.3 (0.0-0.6)
Urban 0.8 (0.1-1.5) 0.1 (0.0-0.2) 0.5 (0.1-0.8)
Rural 0.3 (0.1-0.6) 0.4 (0.1-0.7) 0.4 (0.2-0.5)
NSW 0.7 (0.2-1.2) 0.2 (0.1-0.3) 0.4 (0.2-0.7)
Note: Estimates are based on 9,161 respondents in NSW. For this indicator 47 (0.51%) were not stated (Don’t know or Refused) in NSW. The indicator includes thosewho score 8 or above using the Problem Gambling Severity Index. The questions used to define the indicators were: In the last 12 months, have you undertakenany forms of gambling? Have you bet more than you could really afford to lose? Have you needed to gamble with larger amounts of money to get the samefeeling of excitment; When you gambled, did you go back another day to try to win back the money you lost? Have you borrowed money or sold anything to getmoney to gamble? Heave you felt that you might have a problem with gambling? Has gambling caused you any health problems, including stress or anxiety?Have people criticised your betting or told you that you had a gambling problem, regardless of whether or not you though it was true? Has your gambling causedany financial problems for you or your household? have you felt guilty about the way you gamble or what happens when you gamble? All responses options werenever, rarely, sometimes, often or always. For non gamblers and for each response of never a score of 0 was given. For each response of: something a score of1 is given; most of the time a score of 2 is given; and almost always a score of 3 is given.
Source: New South Wales Population Health Survey 2008 and 2009 (HOIST). Centre for Epidemiology and Research, NSW Department of Health.
23
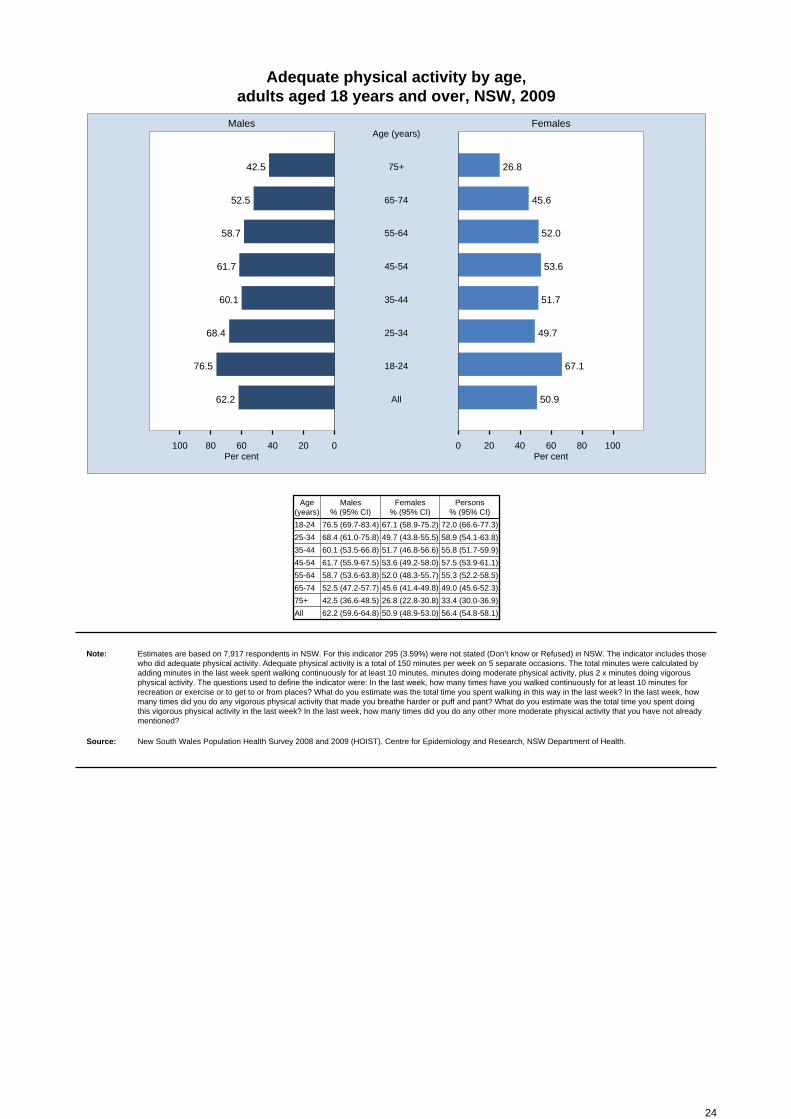
Adequate physical activity by age, adults aged 18 years and over, NSW, 2009
020406080100 0 20 40 60 80 100
Males Females
Per cent Per cent
42.5 26.875+
Age (years)
52.5 45.665-74
58.7 52.055-64
61.7 53.645-54
60.1 51.735-44
68.4 49.725-34
76.5 67.118-24
62.2 50.9All
Age(years)
Males % (95% CI)
Females % (95% CI)
Persons % (95% CI)
18-24 76.5 (69.7-83.4) 67.1 (58.9-75.2) 72.0 (66.6-77.3)
25-34 68.4 (61.0-75.8) 49.7 (43.8-55.5) 58.9 (54.1-63.8)
35-44 60.1 (53.5-66.8) 51.7 (46.8-56.6) 55.8 (51.7-59.9)
45-54 61.7 (55.9-67.5) 53.6 (49.2-58.0) 57.5 (53.9-61.1)
55-64 58.7 (53.6-63.8) 52.0 (48.3-55.7) 55.3 (52.2-58.5)
65-74 52.5 (47.2-57.7) 45.6 (41.4-49.8) 49.0 (45.6-52.3)
75+ 42.5 (36.6-48.5) 26.8 (22.8-30.8) 33.4 (30.0-36.9)
All 62.2 (59.6-64.8) 50.9 (48.9-53.0) 56.4 (54.8-58.1)
Note: Estimates are based on 7,917 respondents in NSW. For this indicator 295 (3.59%) were not stated (Don’t know or Refused) in NSW. The indicator includes thosewho did adequate physical activity. Adequate physical activity is a total of 150 minutes per week on 5 separate occasions. The total minutes were calculated byadding minutes in the last week spent walking continuously for at least 10 minutes, minutes doing moderate physical activity, plus 2 x minutes doing vigorousphysical activity. The questions used to define the indicator were: In the last week, how many times have you walked continuously for at least 10 minutes forrecreation or exercise or to get to or from places? What do you estimate was the total time you spent walking in this way in the last week? In the last week, howmany times did you do any vigorous physical activity that made you breathe harder or puff and pant? What do you estimate was the total time you spent doingthis vigorous physical activity in the last week? In the last week, how many times did you do any other more moderate physical activity that you have not already mentioned?
Source: New South Wales Population Health Survey 2008 and 2009 (HOIST). Centre for Epidemiology and Research, NSW Department of Health.
24
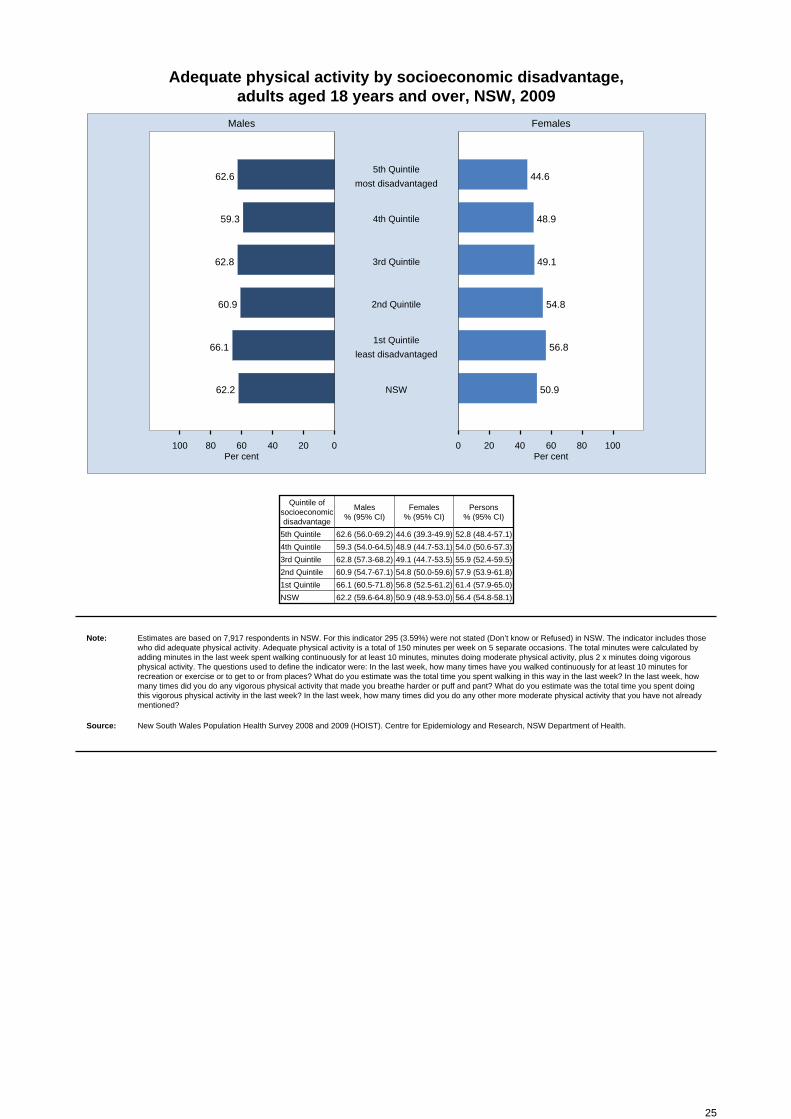
Adequate physical activity by socioeconomic disadvantage, adults aged 18 years and over, NSW, 2009
020406080100 0 20 40 60 80 100
Males Females
Per cent Per cent
62.6 44.65th Quintile
most disadvantaged
59.3 48.94th Quintile
62.8 49.13rd Quintile
60.9 54.82nd Quintile
66.1 56.81st Quintile
least disadvantaged
62.2 50.9NSW
Quintile ofsocioeconomicdisadvantage
Males % (95% CI)
Females % (95% CI)
Persons % (95% CI)
5th Quintile 62.6 (56.0-69.2) 44.6 (39.3-49.9) 52.8 (48.4-57.1)
4th Quintile 59.3 (54.0-64.5) 48.9 (44.7-53.1) 54.0 (50.6-57.3)
3rd Quintile 62.8 (57.3-68.2) 49.1 (44.7-53.5) 55.9 (52.4-59.5)
2nd Quintile 60.9 (54.7-67.1) 54.8 (50.0-59.6) 57.9 (53.9-61.8)
1st Quintile 66.1 (60.5-71.8) 56.8 (52.5-61.2) 61.4 (57.9-65.0)
NSW 62.2 (59.6-64.8) 50.9 (48.9-53.0) 56.4 (54.8-58.1)
Note: Estimates are based on 7,917 respondents in NSW. For this indicator 295 (3.59%) were not stated (Don’t know or Refused) in NSW. The indicator includes thosewho did adequate physical activity. Adequate physical activity is a total of 150 minutes per week on 5 separate occasions. The total minutes were calculated byadding minutes in the last week spent walking continuously for at least 10 minutes, minutes doing moderate physical activity, plus 2 x minutes doing vigorousphysical activity. The questions used to define the indicator were: In the last week, how many times have you walked continuously for at least 10 minutes forrecreation or exercise or to get to or from places? What do you estimate was the total time you spent walking in this way in the last week? In the last week, howmany times did you do any vigorous physical activity that made you breathe harder or puff and pant? What do you estimate was the total time you spent doingthis vigorous physical activity in the last week? In the last week, how many times did you do any other more moderate physical activity that you have not already mentioned?
Source: New South Wales Population Health Survey 2008 and 2009 (HOIST). Centre for Epidemiology and Research, NSW Department of Health.
25
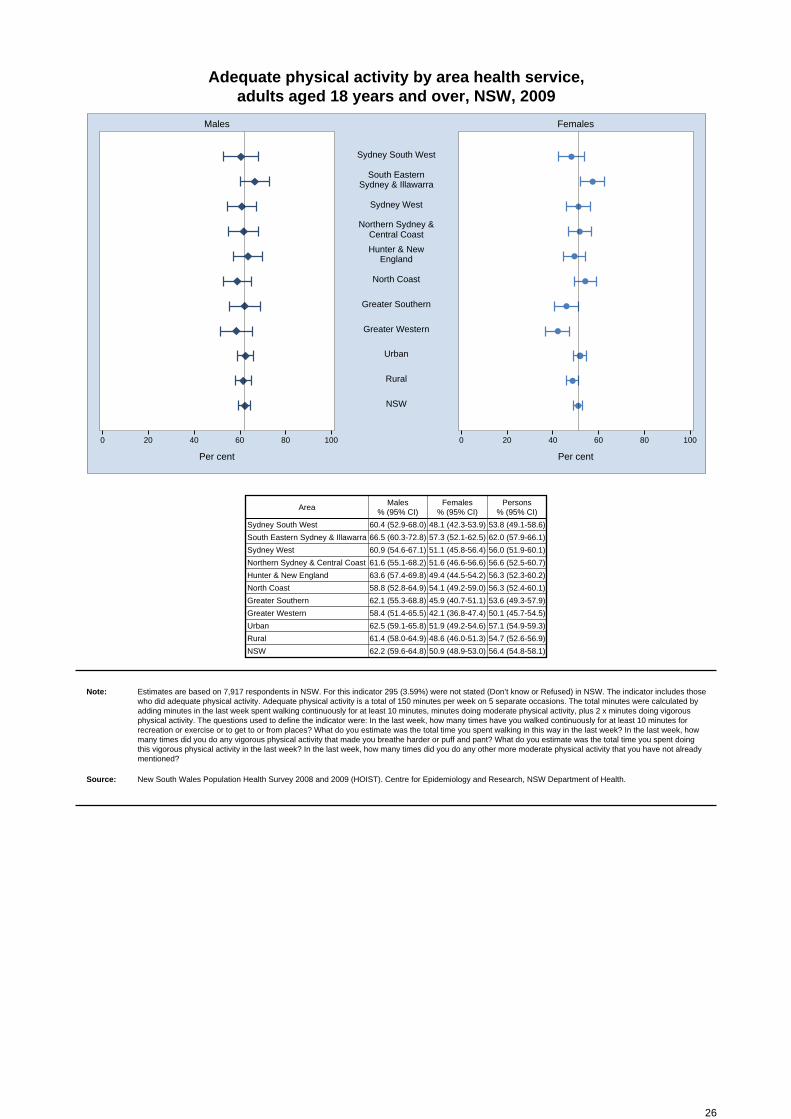
Adequate physical activity by area health service, adults aged 18 years and over, NSW, 2009
0 20 40 60 80 100 0 20 40 60 80 100
Males Females
Per cent Per cent
Sydney South West
South EasternSydney & Illawarra
Sydney West
Northern Sydney &Central Coast
Hunter & NewEngland
North Coast
Greater Southern
Greater Western
Urban
Rural
NSW
AreaMales
% (95% CI)Females
% (95% CI)Persons
% (95% CI)
Sydney South West 60.4 (52.9-68.0) 48.1 (42.3-53.9) 53.8 (49.1-58.6)
South Eastern Sydney & Illawarra 66.5 (60.3-72.8) 57.3 (52.1-62.5) 62.0 (57.9-66.1)
Sydney West 60.9 (54.6-67.1) 51.1 (45.8-56.4) 56.0 (51.9-60.1)
Northern Sydney & Central Coast 61.6 (55.1-68.2) 51.6 (46.6-56.6) 56.6 (52.5-60.7)
Hunter & New England 63.6 (57.4-69.8) 49.4 (44.5-54.2) 56.3 (52.3-60.2)
North Coast 58.8 (52.8-64.9) 54.1 (49.2-59.0) 56.3 (52.4-60.1)
Greater Southern 62.1 (55.3-68.8) 45.9 (40.7-51.1) 53.6 (49.3-57.9)
Greater Western 58.4 (51.4-65.5) 42.1 (36.8-47.4) 50.1 (45.7-54.5)
Urban 62.5 (59.1-65.8) 51.9 (49.2-54.6) 57.1 (54.9-59.3)
Rural 61.4 (58.0-64.9) 48.6 (46.0-51.3) 54.7 (52.6-56.9)
NSW 62.2 (59.6-64.8) 50.9 (48.9-53.0) 56.4 (54.8-58.1)
Note: Estimates are based on 7,917 respondents in NSW. For this indicator 295 (3.59%) were not stated (Don’t know or Refused) in NSW. The indicator includes thosewho did adequate physical activity. Adequate physical activity is a total of 150 minutes per week on 5 separate occasions. The total minutes were calculated byadding minutes in the last week spent walking continuously for at least 10 minutes, minutes doing moderate physical activity, plus 2 x minutes doing vigorousphysical activity. The questions used to define the indicator were: In the last week, how many times have you walked continuously for at least 10 minutes forrecreation or exercise or to get to or from places? What do you estimate was the total time you spent walking in this way in the last week? In the last week, howmany times did you do any vigorous physical activity that made you breathe harder or puff and pant? What do you estimate was the total time you spent doingthis vigorous physical activity in the last week? In the last week, how many times did you do any other more moderate physical activity that you have not already mentioned?
Source: New South Wales Population Health Survey 2008 and 2009 (HOIST). Centre for Epidemiology and Research, NSW Department of Health.
26
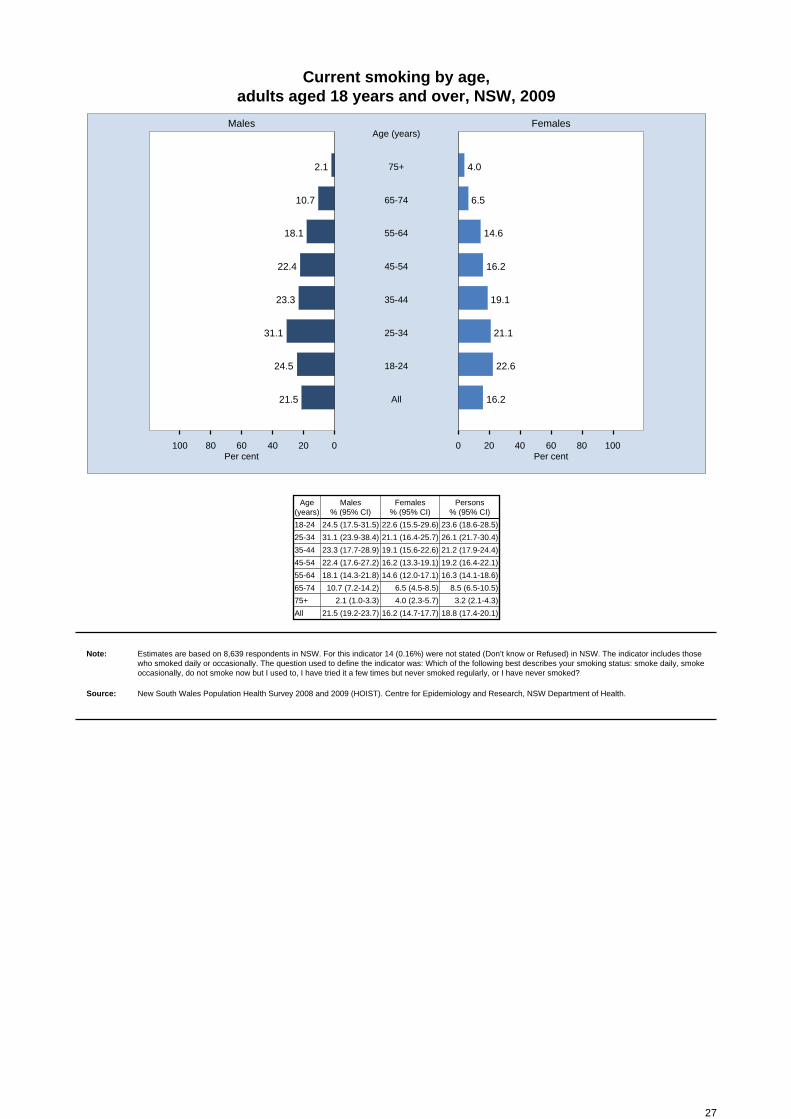
Current smoking by age, adults aged 18 years and over, NSW, 2009
020406080100 0 20 40 60 80 100
Males Females
Per cent Per cent
2.1 4.075+
Age (years)
10.7 6.565-74
18.1 14.655-64
22.4 16.245-54
23.3 19.135-44
31.1 21.125-34
24.5 22.618-24
21.5 16.2All
Age(years)
Males % (95% CI)
Females % (95% CI)
Persons % (95% CI)
18-24 24.5 (17.5-31.5) 22.6 (15.5-29.6) 23.6 (18.6-28.5)
25-34 31.1 (23.9-38.4) 21.1 (16.4-25.7) 26.1 (21.7-30.4)
35-44 23.3 (17.7-28.9) 19.1 (15.6-22.6) 21.2 (17.9-24.4)
45-54 22.4 (17.6-27.2) 16.2 (13.3-19.1) 19.2 (16.4-22.1)
55-64 18.1 (14.3-21.8) 14.6 (12.0-17.1) 16.3 (14.1-18.6)
65-74 10.7 (7.2-14.2) 6.5 (4.5-8.5) 8.5 (6.5-10.5)
75+ 2.1 (1.0-3.3) 4.0 (2.3-5.7) 3.2 (2.1-4.3)
All 21.5 (19.2-23.7) 16.2 (14.7-17.7) 18.8 (17.4-20.1)
Note: Estimates are based on 8,639 respondents in NSW. For this indicator 14 (0.16%) were not stated (Don’t know or Refused) in NSW. The indicator includes thosewho smoked daily or occasionally. The question used to define the indicator was: Which of the following best describes your smoking status: smoke daily, smokeoccasionally, do not smoke now but I used to, I have tried it a few times but never smoked regularly, or I have never smoked?
Source: New South Wales Population Health Survey 2008 and 2009 (HOIST). Centre for Epidemiology and Research, NSW Department of Health.
27
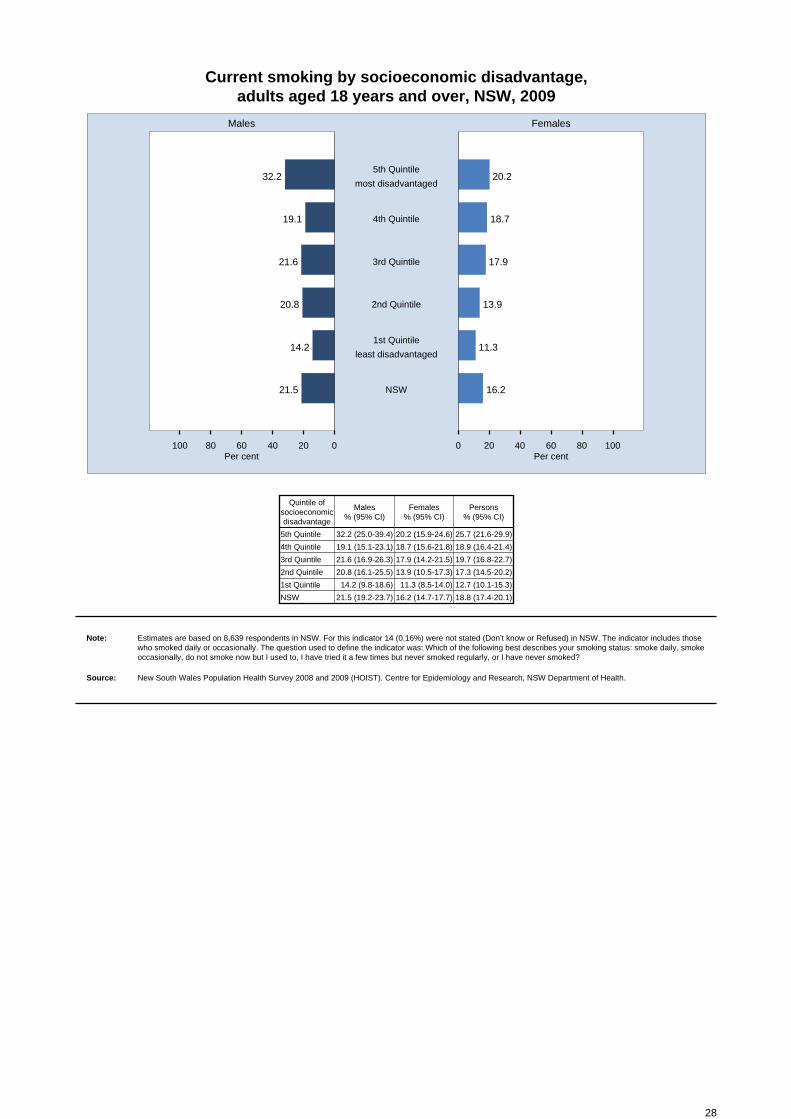
Current smoking by socioeconomic disadvantage, adults aged 18 years and over, NSW, 2009
020406080100 0 20 40 60 80 100
Males Females
Per cent Per cent
32.2 20.25th Quintile
most disadvantaged
19.1 18.74th Quintile
21.6 17.93rd Quintile
20.8 13.92nd Quintile
14.2 11.31st Quintile
least disadvantaged
21.5 16.2NSW
Quintile ofsocioeconomicdisadvantage
Males % (95% CI)
Females % (95% CI)
Persons % (95% CI)
5th Quintile 32.2 (25.0-39.4) 20.2 (15.9-24.6) 25.7 (21.6-29.9)
4th Quintile 19.1 (15.1-23.1) 18.7 (15.6-21.8) 18.9 (16.4-21.4)
3rd Quintile 21.6 (16.9-26.3) 17.9 (14.2-21.5) 19.7 (16.8-22.7)
2nd Quintile 20.8 (16.1-25.5) 13.9 (10.5-17.3) 17.3 (14.5-20.2)
1st Quintile 14.2 (9.8-18.6) 11.3 (8.5-14.0) 12.7 (10.1-15.3)
NSW 21.5 (19.2-23.7) 16.2 (14.7-17.7) 18.8 (17.4-20.1)
Note: Estimates are based on 8,639 respondents in NSW. For this indicator 14 (0.16%) were not stated (Don’t know or Refused) in NSW. The indicator includes thosewho smoked daily or occasionally. The question used to define the indicator was: Which of the following best describes your smoking status: smoke daily, smokeoccasionally, do not smoke now but I used to, I have tried it a few times but never smoked regularly, or I have never smoked?
Source: New South Wales Population Health Survey 2008 and 2009 (HOIST). Centre for Epidemiology and Research, NSW Department of Health.
28
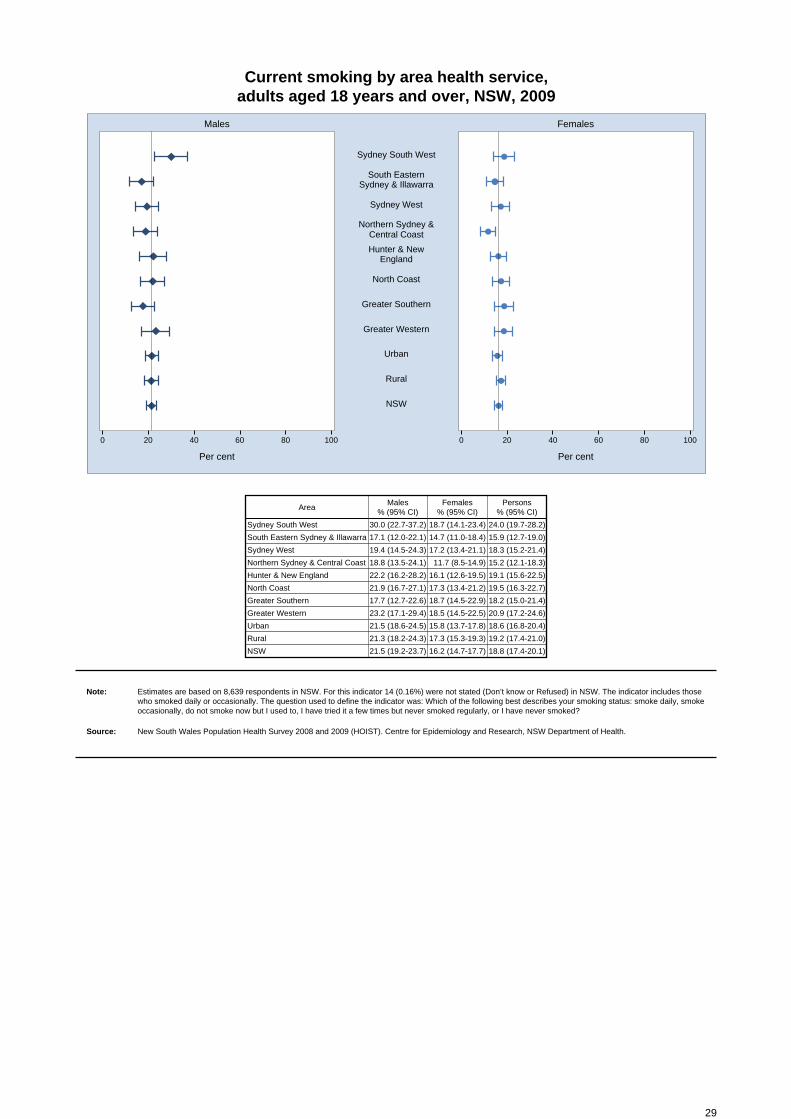
Current smoking by area health service, adults aged 18 years and over, NSW, 2009
0 20 40 60 80 100 0 20 40 60 80 100
Males Females
Per cent Per cent
Sydney South West
South EasternSydney & Illawarra
Sydney West
Northern Sydney &Central Coast
Hunter & NewEngland
North Coast
Greater Southern
Greater Western
Urban
Rural
NSW
AreaMales
% (95% CI)Females
% (95% CI)Persons
% (95% CI)
Sydney South West 30.0 (22.7-37.2) 18.7 (14.1-23.4) 24.0 (19.7-28.2)
South Eastern Sydney & Illawarra 17.1 (12.0-22.1) 14.7 (11.0-18.4) 15.9 (12.7-19.0)
Sydney West 19.4 (14.5-24.3) 17.2 (13.4-21.1) 18.3 (15.2-21.4)
Northern Sydney & Central Coast 18.8 (13.5-24.1) 11.7 (8.5-14.9) 15.2 (12.1-18.3)
Hunter & New England 22.2 (16.2-28.2) 16.1 (12.6-19.5) 19.1 (15.6-22.5)
North Coast 21.9 (16.7-27.1) 17.3 (13.4-21.2) 19.5 (16.3-22.7)
Greater Southern 17.7 (12.7-22.6) 18.7 (14.5-22.9) 18.2 (15.0-21.4)
Greater Western 23.2 (17.1-29.4) 18.5 (14.5-22.5) 20.9 (17.2-24.6)
Urban 21.5 (18.6-24.5) 15.8 (13.7-17.8) 18.6 (16.8-20.4)
Rural 21.3 (18.2-24.3) 17.3 (15.3-19.3) 19.2 (17.4-21.0)
NSW 21.5 (19.2-23.7) 16.2 (14.7-17.7) 18.8 (17.4-20.1)
Note: Estimates are based on 8,639 respondents in NSW. For this indicator 14 (0.16%) were not stated (Don’t know or Refused) in NSW. The indicator includes thosewho smoked daily or occasionally. The question used to define the indicator was: Which of the following best describes your smoking status: smoke daily, smokeoccasionally, do not smoke now but I used to, I have tried it a few times but never smoked regularly, or I have never smoked?
Source: New South Wales Population Health Survey 2008 and 2009 (HOIST). Centre for Epidemiology and Research, NSW Department of Health.
29
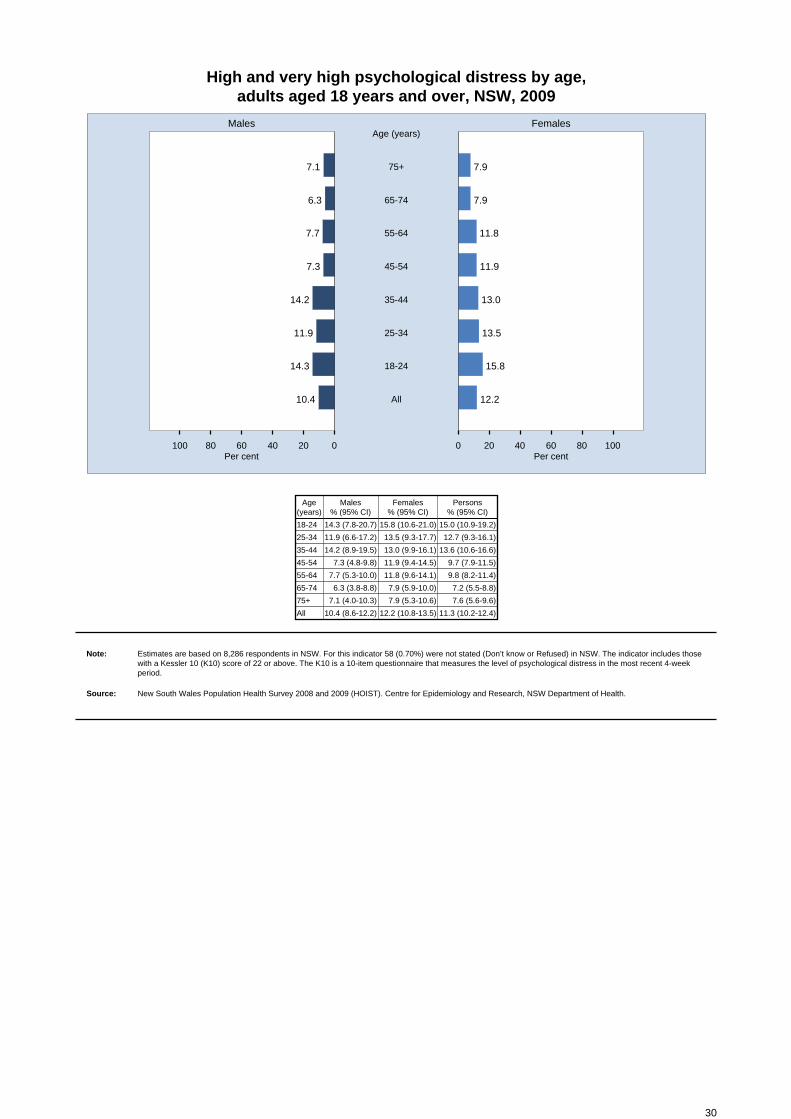
High and very high psychological distress by age, adults aged 18 years and over, NSW, 2009
020406080100 0 20 40 60 80 100
Males Females
Per cent Per cent
7.1 7.975+
Age (years)
6.3 7.965-74
7.7 11.855-64
7.3 11.945-54
14.2 13.035-44
11.9 13.525-34
14.3 15.818-24
10.4 12.2All
Age(years)
Males % (95% CI)
Females % (95% CI)
Persons % (95% CI)
18-24 14.3 (7.8-20.7) 15.8 (10.6-21.0) 15.0 (10.9-19.2)
25-34 11.9 (6.6-17.2) 13.5 (9.3-17.7) 12.7 (9.3-16.1)
35-44 14.2 (8.9-19.5) 13.0 (9.9-16.1) 13.6 (10.6-16.6)
45-54 7.3 (4.8-9.8) 11.9 (9.4-14.5) 9.7 (7.9-11.5)
55-64 7.7 (5.3-10.0) 11.8 (9.6-14.1) 9.8 (8.2-11.4)
65-74 6.3 (3.8-8.8) 7.9 (5.9-10.0) 7.2 (5.5-8.8)
75+ 7.1 (4.0-10.3) 7.9 (5.3-10.6) 7.6 (5.6-9.6)
All 10.4 (8.6-12.2) 12.2 (10.8-13.5) 11.3 (10.2-12.4)
Note: Estimates are based on 8,286 respondents in NSW. For this indicator 58 (0.70%) were not stated (Don’t know or Refused) in NSW. The indicator includes thosewith a Kessler 10 (K10) score of 22 or above. The K10 is a 10-item questionnaire that measures the level of psychological distress in the most recent 4-week period.
Source: New South Wales Population Health Survey 2008 and 2009 (HOIST). Centre for Epidemiology and Research, NSW Department of Health.
30
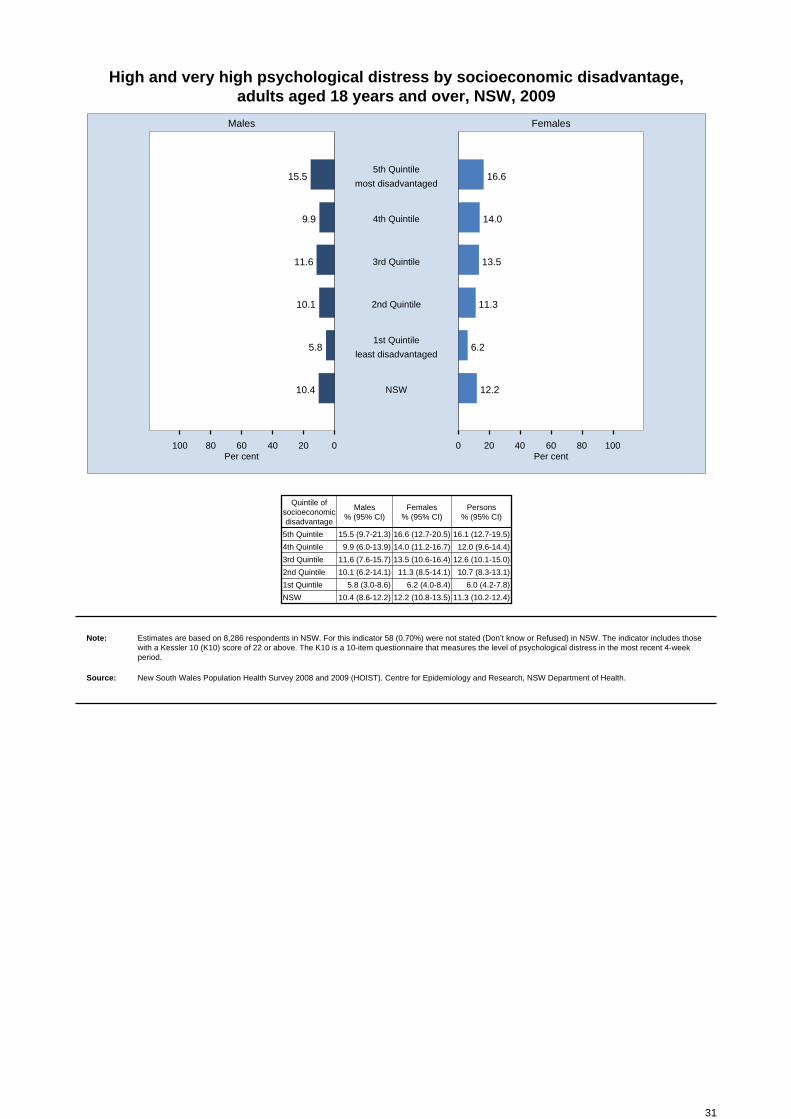
High and very high psychological distress by socioeconomic disadvantage, adults aged 18 years and over, NSW, 2009
020406080100 0 20 40 60 80 100
Males Females
Per cent Per cent
15.5 16.65th Quintile
most disadvantaged
9.9 14.04th Quintile
11.6 13.53rd Quintile
10.1 11.32nd Quintile
5.8 6.21st Quintile
least disadvantaged
10.4 12.2NSW
Quintile ofsocioeconomicdisadvantage
Males % (95% CI)
Females % (95% CI)
Persons % (95% CI)
5th Quintile 15.5 (9.7-21.3) 16.6 (12.7-20.5) 16.1 (12.7-19.5)
4th Quintile 9.9 (6.0-13.9) 14.0 (11.2-16.7) 12.0 (9.6-14.4)
3rd Quintile 11.6 (7.6-15.7) 13.5 (10.6-16.4) 12.6 (10.1-15.0)
2nd Quintile 10.1 (6.2-14.1) 11.3 (8.5-14.1) 10.7 (8.3-13.1)
1st Quintile 5.8 (3.0-8.6) 6.2 (4.0-8.4) 6.0 (4.2-7.8)
NSW 10.4 (8.6-12.2) 12.2 (10.8-13.5) 11.3 (10.2-12.4)
Note: Estimates are based on 8,286 respondents in NSW. For this indicator 58 (0.70%) were not stated (Don’t know or Refused) in NSW. The indicator includes thosewith a Kessler 10 (K10) score of 22 or above. The K10 is a 10-item questionnaire that measures the level of psychological distress in the most recent 4-week period.
Source: New South Wales Population Health Survey 2008 and 2009 (HOIST). Centre for Epidemiology and Research, NSW Department of Health.
31
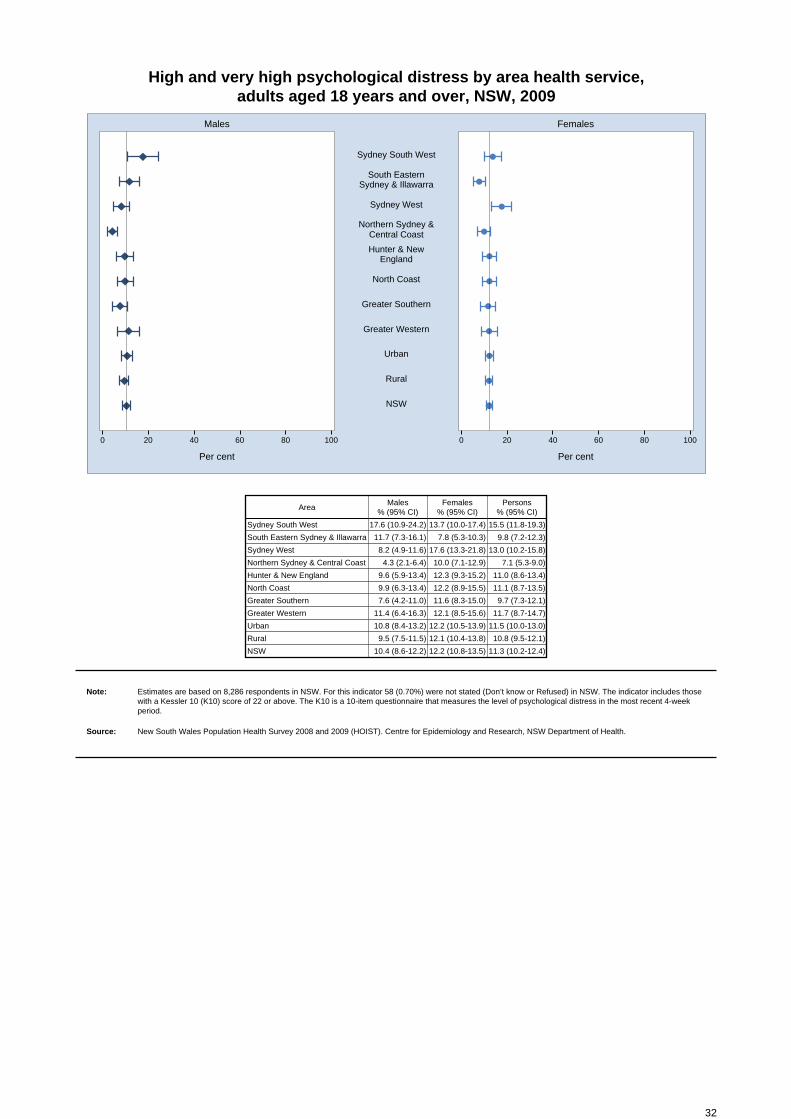
High and very high psychological distress by area health service, adults aged 18 years and over, NSW, 2009
0 20 40 60 80 100 0 20 40 60 80 100
Males Females
Per cent Per cent
Sydney South West
South EasternSydney & Illawarra
Sydney West
Northern Sydney &Central Coast
Hunter & NewEngland
North Coast
Greater Southern
Greater Western
Urban
Rural
NSW
AreaMales
% (95% CI)Females
% (95% CI)Persons
% (95% CI)
Sydney South West 17.6 (10.9-24.2) 13.7 (10.0-17.4) 15.5 (11.8-19.3)
South Eastern Sydney & Illawarra 11.7 (7.3-16.1) 7.8 (5.3-10.3) 9.8 (7.2-12.3)
Sydney West 8.2 (4.9-11.6) 17.6 (13.3-21.8) 13.0 (10.2-15.8)
Northern Sydney & Central Coast 4.3 (2.1-6.4) 10.0 (7.1-12.9) 7.1 (5.3-9.0)
Hunter & New England 9.6 (5.9-13.4) 12.3 (9.3-15.2) 11.0 (8.6-13.4)
North Coast 9.9 (6.3-13.4) 12.2 (8.9-15.5) 11.1 (8.7-13.5)
Greater Southern 7.6 (4.2-11.0) 11.6 (8.3-15.0) 9.7 (7.3-12.1)
Greater Western 11.4 (6.4-16.3) 12.1 (8.5-15.6) 11.7 (8.7-14.7)
Urban 10.8 (8.4-13.2) 12.2 (10.5-13.9) 11.5 (10.0-13.0)
Rural 9.5 (7.5-11.5) 12.1 (10.4-13.8) 10.8 (9.5-12.1)
NSW 10.4 (8.6-12.2) 12.2 (10.8-13.5) 11.3 (10.2-12.4)
Note: Estimates are based on 8,286 respondents in NSW. For this indicator 58 (0.70%) were not stated (Don’t know or Refused) in NSW. The indicator includes thosewith a Kessler 10 (K10) score of 22 or above. The K10 is a 10-item questionnaire that measures the level of psychological distress in the most recent 4-week period.
Source: New South Wales Population Health Survey 2008 and 2009 (HOIST). Centre for Epidemiology and Research, NSW Department of Health.
32
Question modules
33
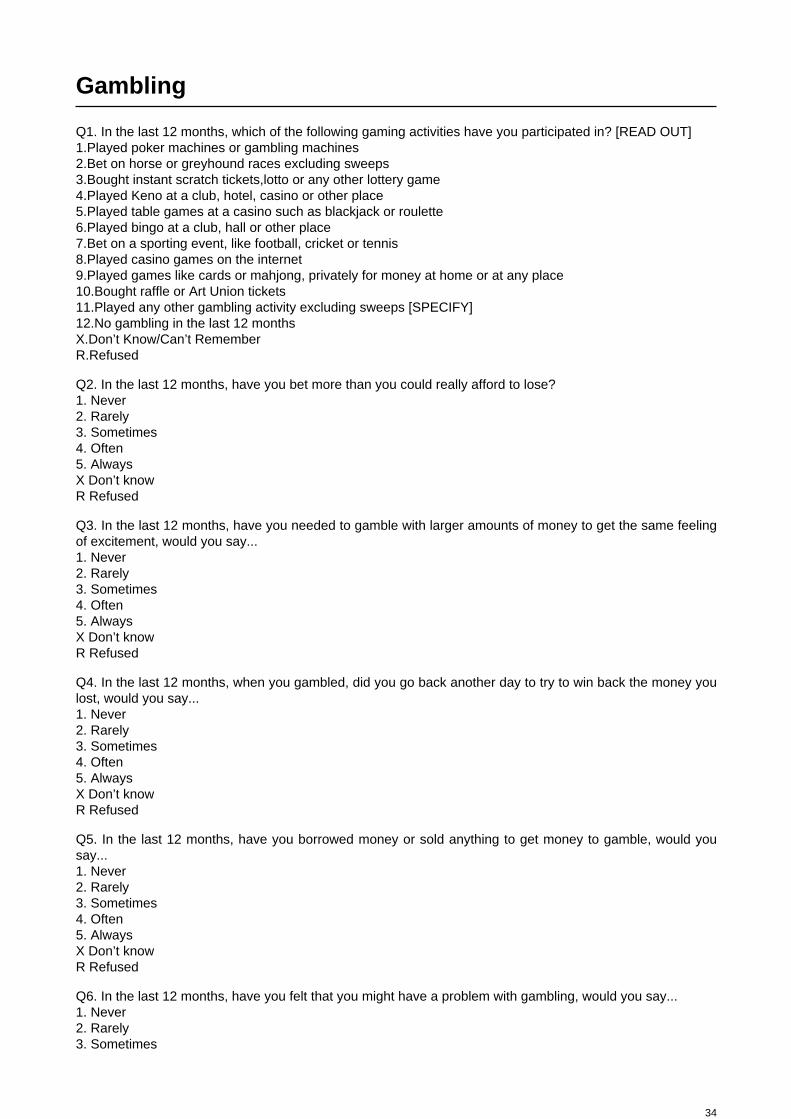
Gambling
Q1. In the last 12 months, which of the following gaming activities have you participated in? [READ OUT] 1.Played poker machines or gambling machines 2.Bet on horse or greyhound races excluding sweeps 3.Bought instant scratch tickets,lotto or any other lottery game 4.Played Keno at a club, hotel, casino or other place 5.Played table games at a casino such as blackjack or roulette 6.Played bingo at a club, hall or other place 7.Bet on a sporting event, like football, cricket or tennis 8.Played casino games on the internet 9.Played games like cards or mahjong, privately for money at home or at any place 10.Bought raffle or Art Union tickets 11.Played any other gambling activity excluding sweeps [SPECIFY] 12.No gambling in the last 12 months X.Don’t Know/Can’t Remember R.Refused
Q2. In the last 12 months, have you bet more than you could really afford to lose?1. Never2. Rarely3. Sometimes4. Often5. AlwaysX Don’t knowR Refused
Q3. In the last 12 months, have you needed to gamble with larger amounts of money to get the same feelingof excitement, would you say... 1. Never2. Rarely3. Sometimes4. Often5. AlwaysX Don’t knowR Refused
Q4. In the last 12 months, when you gambled, did you go back another day to try to win back the money youlost, would you say... 1. Never2. Rarely3. Sometimes4. Often5. AlwaysX Don’t knowR Refused
Q5. In the last 12 months, have you borrowed money or sold anything to get money to gamble, would yousay... 1. Never2. Rarely3. Sometimes4. Often5. AlwaysX Don’t knowR Refused
Q6. In the last 12 months, have you felt that you might have a problem with gambling, would you say... 1. Never2. Rarely3. Sometimes
34
4. Often5. AlwaysX Don’t knowR Refused
Q7. In the last 12 months, has gambling caused you any health problems, including stress or anxiety, wouldyou say... 1. Never2. Rarely3. Sometimes4. Often5. AlwaysX Don’t knowR Refused
Q8. In the last 12 months, have people criticised your betting or told you that you had a gambling problem,regardless of whether or not you thought it was true, would you say... 1. Never2. Rarely3. Sometimes4. Often5. AlwaysX Don’t knowR Refused
Q9. In the last 12 months has your gambling caused any financial problems for you or your household, wouldyou say... 1. Never2. Rarely3. Sometimes4. Often5. AlwaysX Don’t knowR Refused
Q10. In the last 12 months, have you felt guilty about the way you gamble or what happens when yougamble, would you say... 1. Never2. Rarely3. Sometimes4. Often5. AlwaysX Don’t knowR Refused
Physical activity
Q1. In the last week, how many times have you walked continuously for at least 10 minutes for recreation orexercise or to get to or from places?1. _______ number of times [If = 0 → Q3]X Don’t know → Q3R Refused → Q3
Q2. What do you estimate was the total time you spent walking in this way in the last week? [In hours and minutes]1. ________ hours ________ minutesX Don’t knowR Refused
Q3. The next question excludes gardening. In the last week, how many times did you do any vigoroushousehold chores which made you breathe harder or puff and pant?1. ________ number of times [If = 0 → Q5]
35
X Don’t know → Q5R Refused → Q5
Q4. What do you estimate was the total time you spent doing these vigorous household chores in the lastweek? [In hours and minutes]1. ________ hours ________ minutesX Don’t knowR Refused
Q5. In the last week, how many times did you do any vigorous gardening or heavy work around the yardwhich made you breathe harder or puff and pant?1. ________ number of times [If = 0 → Q7]X Don’t know → Q7R Refused → Q7
Q6. What do you estimate was the total time you spent doing this vigorous gardening or heavy work aroundthe yard in the last week? [In hours and minutes]1. ________ hours ________ minutesX Don’t knowR Refused
Q7. The next question excludes household chores or gardening. In the last week, how many times did youdo any vigorous physical activity which made you breathe harder or puff and pant? [For example: football,tennis, netball, squash, athletics, cycling, jogging, keep-fit exercises, and vigorous swimming]1. ________ number of times [If = 0 → Q9]X Don’t know → Q9R Refused → Q9
Q8. What do you estimate was the total time you spent doing this vigorous physical activity in the last week?[In hours and minutes]1. ________ hours ________ minutesX Don’t knowR Refused
Q9. This next question does not include household chores or gardening. In the last week, how many timesdid you do any other more moderate physical activity that you haven’t already mentioned? [For example:lawn bowls, golf, tai chi, and sailing]1. ________ number of times [If = 0 → Q11]X Don’t know → Q11R Refused → Q11
Q10. What do you estimate was the total time that you spent doing these activities in the last week? [In hoursand minutes]1. ________ hours ________ minutes X Don’t knowR Refused
Q11. How do you usually get to work? [MULIPLE RESPONSE]1. Train2. Bus3. Ferry4. Tram (including light rail)5. Taxi6. Car (as driver)7. Car (as passenger)8. Truck9. Motor bike or motor scooter10. Bicycle11. Walk only12. Work from home13. Walk part of the way14. OtherX Don’t knowR Refused
36
Smoking
Q1. Which of the following best describes your smoking status? This includes cigarettes, cigars and pipes.[READ OUT]1. I smoke daily2. I smoke occasionally3. I don’t smoke now, but I used to → Q54. I’ve tried it a few times but never smoked regularly → Q55. I’ve never smoked → Q5X Don’t know → Q5R Refused → Q5
Q2. Which of the following best describes how you feel about your smoking?[READ OUT]1. I am not planning on quitting within the next 6 months2. I am planning on quitting within the next 6 months3. I am planning on quitting within the next month4. I have not smoked in the last 24 hours but was smoking 6 months ago → Q55. I have not been smoking in the last 6 months → Q5X Don’t know → Q5R Refused → Q5
Q3. How soon after you wake do you smoke your first cigarette? [READ OUT]1. Less than or equal to 5 minutes2. 6-30 minutes3. 31-60 minutes4. Longer than 60 minutesX Don’t knowR Refused
Q4. The last time you went to your general practitioner, did the doctor discuss your smoking and advise youto quit smoking?1. Yes2. NoX Don’t knowR Refused
Q5. Which of the following best describes your home situation? [READ OUT]1. My home is smoke-free (includes smoking is allowed outside only)2. People occasionally smoke in the house3. People frequently smoke in the houseX Don’t knowR Refused
Q6. Are people allowed to smoke in your car?1. Yes2. No3. Don’t have a carX Don’t knowR Refused
Q7. If there was a total ban on smoking in hotels and licensed bars, would you be likely to go there: [READ OUT]1. More often?2. Less often?3. It would make no differenceX Don’t knowR Refused
Q8. If there was a total ban on smoking in outdoor dining areas, would you be likely to go there: [READ OUT]1. More often?2. Less often?3. It would make no difference
37
X Don’t knowR Refused
Q9. Do you support a regulation to ensure that, in shops, cigarettes are stored out of sight?1. Yes2. NoX Don’t knowR Refused
Mental health
Q1. In the last 4 weeks, about how often did you feel tired out for no good reason? [READ OUT]1. All of the time2. Most of the time3. Some of the time4. A little of the time5. None of the timeX Don’t knowR Refused
Q2. In the last 4 weeks, about how often did you feel nervous? [READ OUT]1. All of the time2. Most of the time3. Some of the time4. A little of the time5. None of the time → Q4X Don’t know → Q4R Refused → Q4
Q3. In the last 4 weeks, about how often did you feel so nervous that nothing could calm you down? [READ OUT]1. All of the time2. Most of the time3. Some of the time4. A little of the time5. None of the timeX Don’t knowR Refused
Q4. In the last 4 weeks, about how often did you feel hopeless? [READ OUT]1. All of the time2. Most of the time3. Some of the time4. A little of the time5. None of the timeX Don’t knowR Refused
Q5. In the last 4 weeks, about how often did you feel restless or fidgety? [READ OUT]1. All of the time2. Most of the time3. Some of the time4. A little of the time5. None of the time → Q7X Don’t know → Q7R Refused → Q7
Q6. In the last 4 weeks, about how often did you feel so restless you could not sit still? [READ OUT]1. All of the time2. Most of the time3. Some of the time4. A little of the time
38
5. None of the timeX Don’t knowR Refused
Q7. In the last 4 weeks, about how often did you feel depressed? [READ OUT]1. All of the time2. Most of the time3. Some of the time4. A little of the time5. None of the timeX Don’t knowR Refused
Q8. In the last 4 weeks, about how often did you feel that everything was an effort? [READ OUT]1. All of the time2. Most of the time3. Some of the time4. A little of the time5. None of the timeX Don’t knowR Refused
Q9. In the last 4 weeks, about how often did you feel so sad that nothing could cheer you up? [READ OUT]1. All of the time2. Most of the time3. Some of the time4. A little of the time5. None of the timeX Don’t knowR Refused
Q10. In the last 4 weeks, about how often did you feel worthless? [READ OUT]1. All of the time2. Most of the time3. Some of the time4. A little of the time5. None of the timeX Don’t knowR Refused
Q11. In the last 4 weeks, how many days were you totally unable to work, study or manage your day-to-dayactivities because of these feelings?1. ________ number of daysX Don’t knowR Refused
Q12. Aside from [that day-those days], in the last 4 weeks, how many days were you able to work, study ormanage your day-to-day activities, but had to cut down on what you did because of these feelings?1. ________ number of daysX Don’t knowR Refused
Q13. In the last 4 weeks, how many times have you seen a doctor or other health professional about these feelings?1. ________ number of consultationsX Don’t knowR Refused
Q14. In the last 4 weeks, how often have physical health problems been the main cause of these feelings?[READ OUT]1. All of the time2. Most of the time3. Some of the time4. A little of the time
39
5. None of the timeX Don’t knowR Refused
Alcohol and cannabis
Q1. How often do you usually drink alcohol?1. ______ number of days2. Less than once per week3. I don’t drink alcohol → Q6X Don’t know → Q6R Refused → Q6
Q2. Alcoholic drinks are measured in terms of a standard drink. A standard drink is equal to 1 middy offull-strength beer, 1 schooner of light beer, 1 small glass of wine, or 1 pub-sized nip of spirits. On a day whenyou drink alcohol, how many standard drinks do you usually have?1. ______ number of drinksX Don’t knowR Refused
Q3. In the last 4 weeks have you had more than [4 if male/2 if female] drinks in a day?1. Yes2. No → Q6X Don’t know → Q6R Refused → Q6
Q4. In the last 4 weeks how often have you had [11 or more if male/7 or more if female] drinks in a day?1. ______ number of times2. Not at allX Don’t knowR Refused
Q5. In the last 4 weeks how often have you had [7-10 if male/5-6 if female] drinks in a day?1. ______ number of times2. Not at allX Don’t knowR Refused
Q6. Which of the following best describes your marijuana or hashish smoking status? [ASKED IF 16-34YEARS - READ OUT]1. I smoke daily2. I smoke occasionally3. I don’t smoke now, but I used to → END OF MODULE4. I’ve tried it a few times but never smoked regularly → END OF MODULE5. I’ve never smoked marijuana or hashish → END OF MODULEX Don’t know → END OF MODULER Refused → END OF MODULE
Q7. When you smoke marijuana or hashish do you mix it with tobacco? [ASKED IF 16-34 YEARS - READ OUT]1. Always2. Sometimes3. Rarely4. NeverX Don’t knowR Refused
Q8. How soon after you wake do you have your first smoke of marijuana or hashish? [ASKED IF 16-34YEARS - READ OUT]1. Less than or equal to 5 minutes2. 6-30 minutes3. 31-60 minutes
40
4. Longer than 60 minutesX Don’t knowR Refused
41
Related Documents