Key drivers of population change and population forecasts in NSW August 2016

NSW population forecasts launch event: Return of the premier state?
Jan 23, 2018
Welcome message from author
This document is posted to help you gain knowledge. Please leave a comment to let me know what you think about it! Share it to your friends and learn new things together.
Transcript

Key drivers of population change and
population forecasts in NSW
August 2016

.id are population experts (demographers, spatial analysts,
forecasters, urban planners)
.id has Australia’s largest team of population forecasters
We understand how cities are growing and changing
We quantify this knowledge into detailed population
forecasts
Our clients use this knowledge to decide where and when to
invest in infrastructure, services and marketing effort
Over 1.5 million people access .id’s Demographic Resource
Centre every year
We provide the evidence-base for 300 councils Australia-
wide and numerous public and private enterprises
Who are we?

Introducing SAFi
Population growth trends: The Return of the Premier State?
Case study: Anticipating demand at the local level
Questions
Agenda

Population forecasts for New South Wales
Small Area Forecast information

Introducing SAFi
SAFi is a state-wide, micro-geography population forecast
Available for Vic, NSW, ACT & WA.
Provides unprecedented insight into the future of Australia’s population –
macro and the micro level.
Quantifies the demand for services across geographies and over time.
Reflects development activity at a local area level
Regularly updated
Proven over 5 years – third iteration for New South Wales and ACT
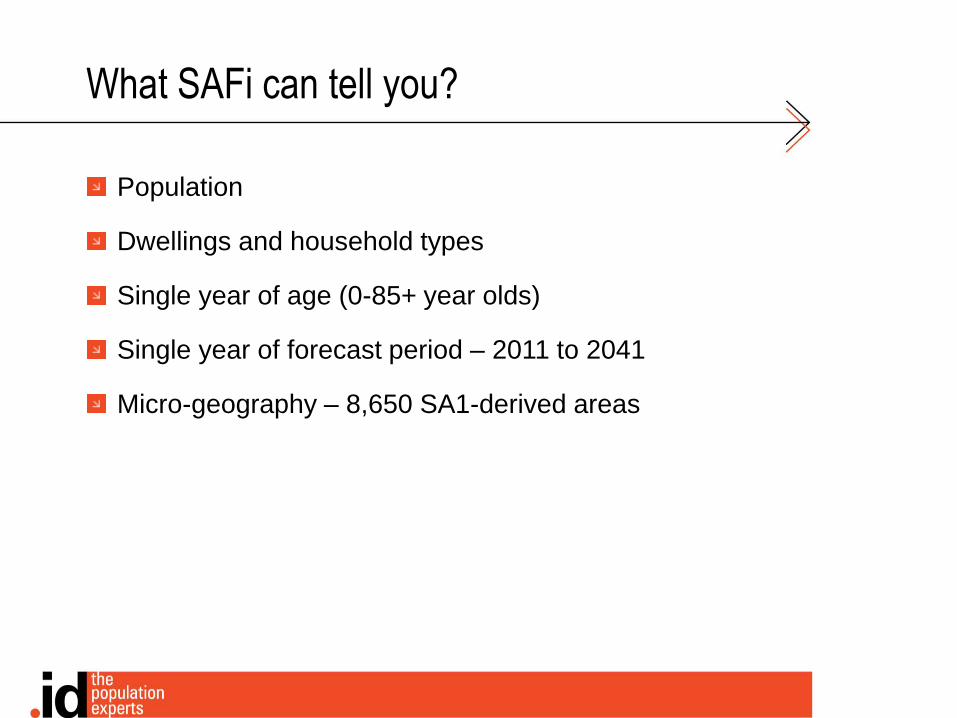
What SAFi can tell you?
Population
Dwellings and household types
Single year of age (0-85+ year olds)
Single year of forecast period – 2011 to 2041
Micro-geography – 8,650 SA1-derived areas
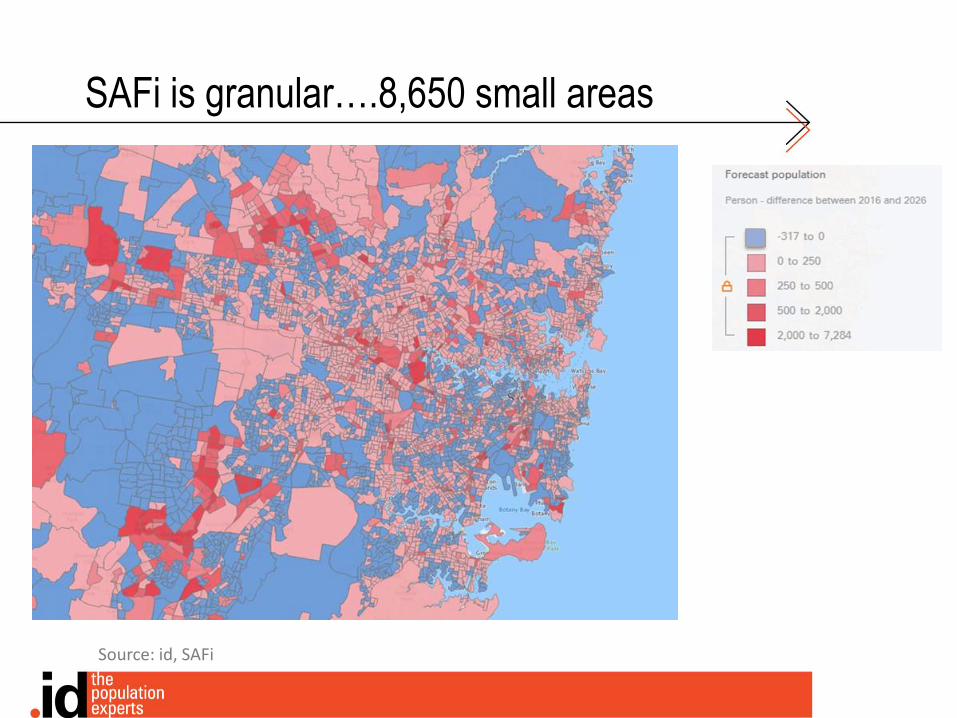
Source: id, SAFi
SAFi is granular….8,650 small areas
Who we work with…
300 Local Governments and …
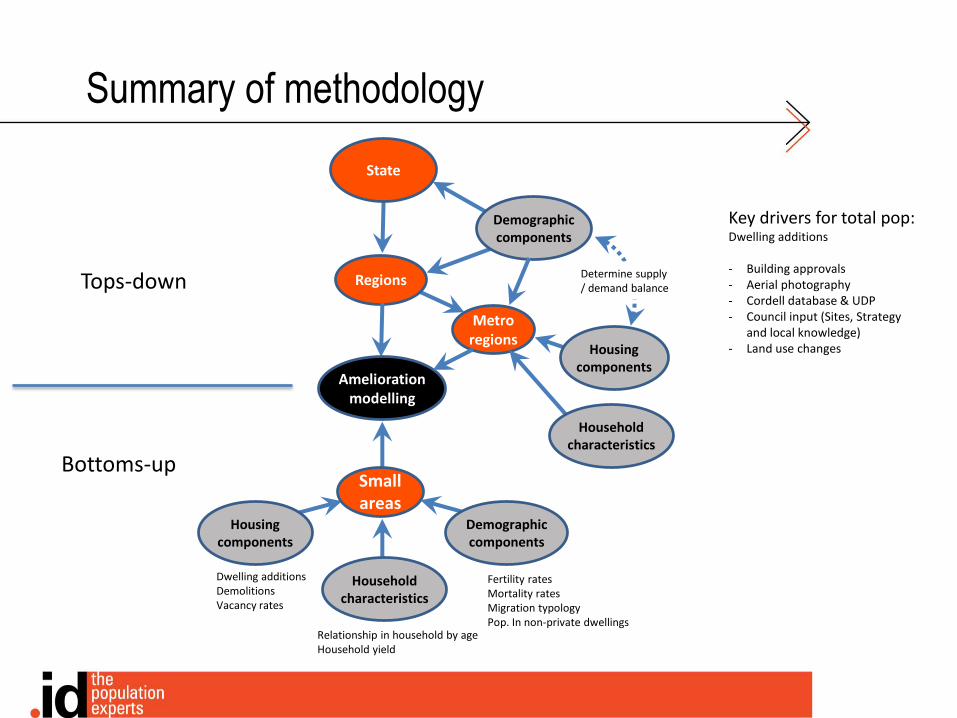
Summary of methodology
State
Regions
Metro regions
Demographic components
Housing components
Determine supply / demand balance
Household characteristics
Amelioration modelling
Small areas
Housing components
Demographic components
Household characteristics
Fertility ratesMortality ratesMigration typologyPop. In non-private dwellings
Relationship in household by ageHousehold yield
Dwelling additionsDemolitionsVacancy rates
Tops-down
Bottoms-up
Key drivers for total pop:Dwelling additions
- Building approvals- Aerial photography- Cordell database & UDP- Council input (Sites, Strategy
and local knowledge)- Land use changes
Population growth trends
Ageing of the population
Changing housing consumption
Three Growth Markets
Sub-state population trends
Conclusions
The Return of the Premier State
Population growth trends

Sydney is a major attractor of overseas migrants
NSW loses population to other States, especially to Queensland
and to a lesser degree Victoria
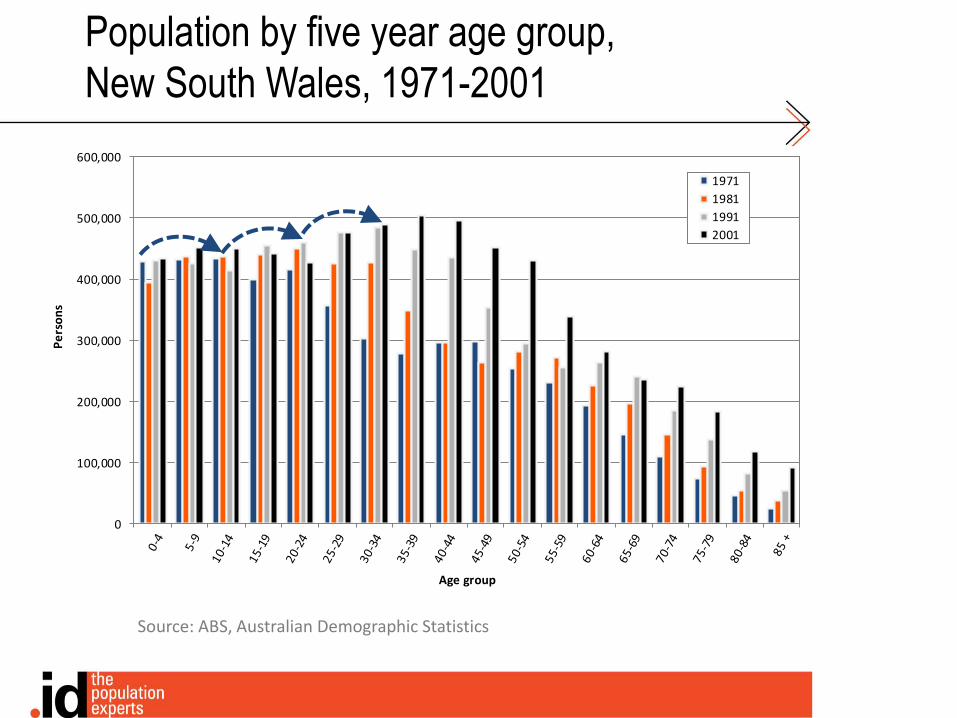
NSW is ageing but at a lower rate than expected as overseas
migration and more births have supplemented the population
under 40
Births continue to outweigh deaths, but less natural increase over
time, and more older people
How does NSW’s population grow?

Average annual population growth,
Census periods, Major States, 1976-2015*
*Data to December 2015
Source: ABS, Australian Demographic Statistics
0.0%
0.5%
1.0%
1.5%
2.0%
2.5%
3.0%
1976-81 1981-86 1986-91 1991-96 1996-01 2001-6 2006-11 2011-15
Ave
rage
an
nu
al g
row
th r
ate
Period
Australia NSW
Vic. Qld
SA WA
Source: ABS, Australian Demographic Statistics
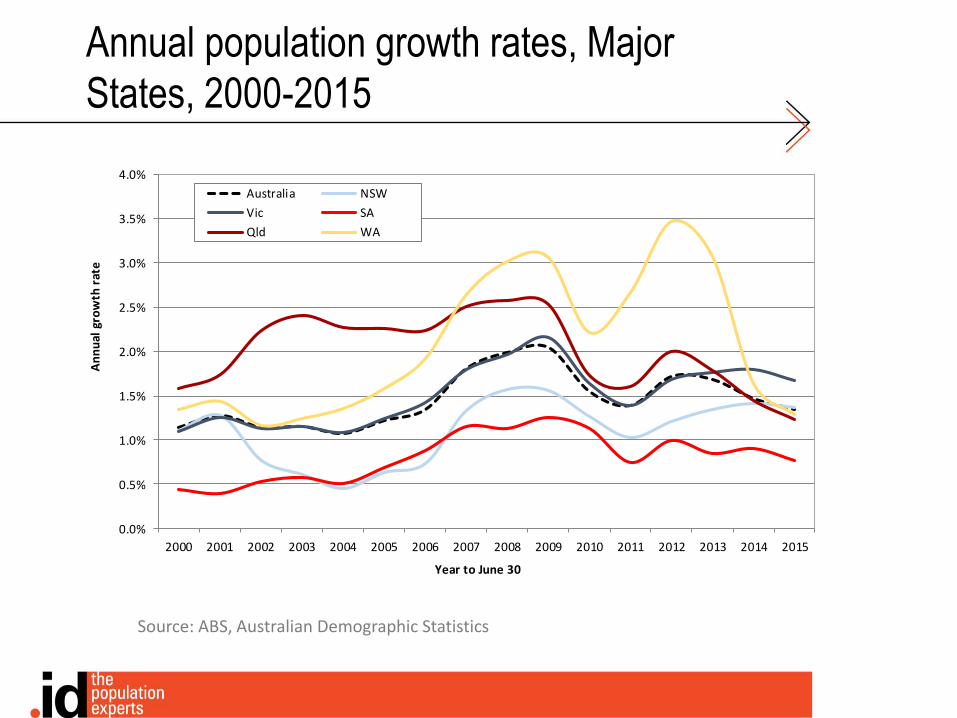
Annual population growth rates, Major
States, 2000-2015
0.0%
0.5%
1.0%
1.5%
2.0%
2.5%
3.0%
3.5%
4.0%
2000 2001 2002 2003 2004 2005 2006 2007 2008 2009 2010 2011 2012 2013 2014 2015
An
nu
al g
row
th r
ate
Year to June 30
Australia NSW
Vic SA
Qld WA

Net overseas migration has increased and the share to NSW has
increased as Western Australia and Queensland have waned
NSW is losing less population to other States, especially
Queensland and Western Australia
NSW has a solid investment pipeline, which is attractive to
migrants given the fall in construction in resource states
NSW has a stable political environment, with a handsome Premier
Fertility rates increased, leading to a greater gain in births
The return of the Premier State…..
What has changed?

Source: ABS, Australian Demographic Statistics
Net overseas migration, New South Wales,
1976-2015
0.0%
10.0%
20.0%
30.0%
40.0%
50.0%
60.0%
0
10,000
20,000
30,000
40,000
50,000
60,000
70,000
80,000
90,000
100,000
Shar
e o
f A
ust
ralia
Ne
t o
vers
eas
mig
rati
on
Year ending June 30
Net overseas Migration Share of Australia

Net overseas migration by age,
New South Wales, 2006-2011
Source: .id – SAFi (historical population reconciliation)
0
10,000
20,000
30,000
40,000
50,000
60,000
70,000
80,000
90,000
Pe
rso
ns
Age group
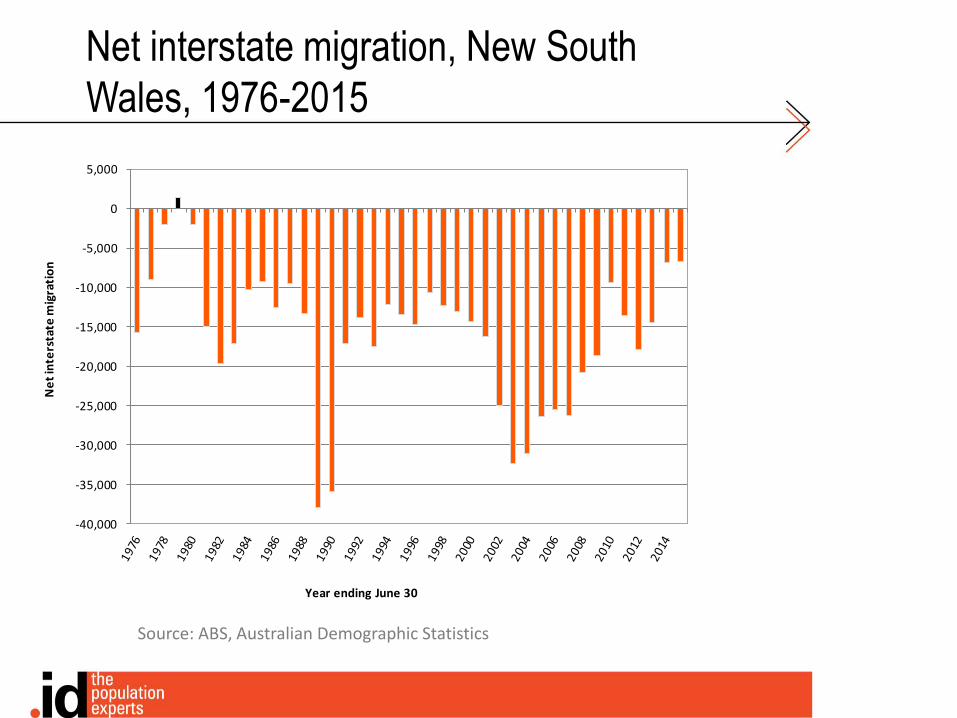
Net interstate migration, New South
Wales, 1976-2015
Source: ABS, Australian Demographic Statistics
-40,000
-35,000
-30,000
-25,000
-20,000
-15,000
-10,000
-5,000
0
5,000
Ne
t in
ters
tate
mig
rati
on
Year ending June 30

Source: ABS, Australian Historical Population Statistics, 2008ABS, Australian Demographic Statistics
Fertility rates and number of births
New South Wales, 1972-2015
0.000
0.500
1.000
1.500
2.000
2.500
3.000
0
50,000
100,000
150,000
200,000
250,000
300,000
350,000
Tota
l Fe
rtili
ty R
ate
Bir
ths
Year
Births Total Fertility Rate

Source: ABS, Australian Historical Population Statistics, 2014ABS, Deaths Australia
Life expectancy, New South Wales,
1981-2014
60
65
70
75
80
85
90
Life
exp
ect
ancy
Age group
Males
Females
Ageing of the population….
0
100,000
200,000
300,000
400,000
500,000
600,000
Pe
rso
ns
Age group
1971
1981
1991
2001
Population by five year age group,
New South Wales, 1971-2001
Source: ABS, Australian Demographic Statistics
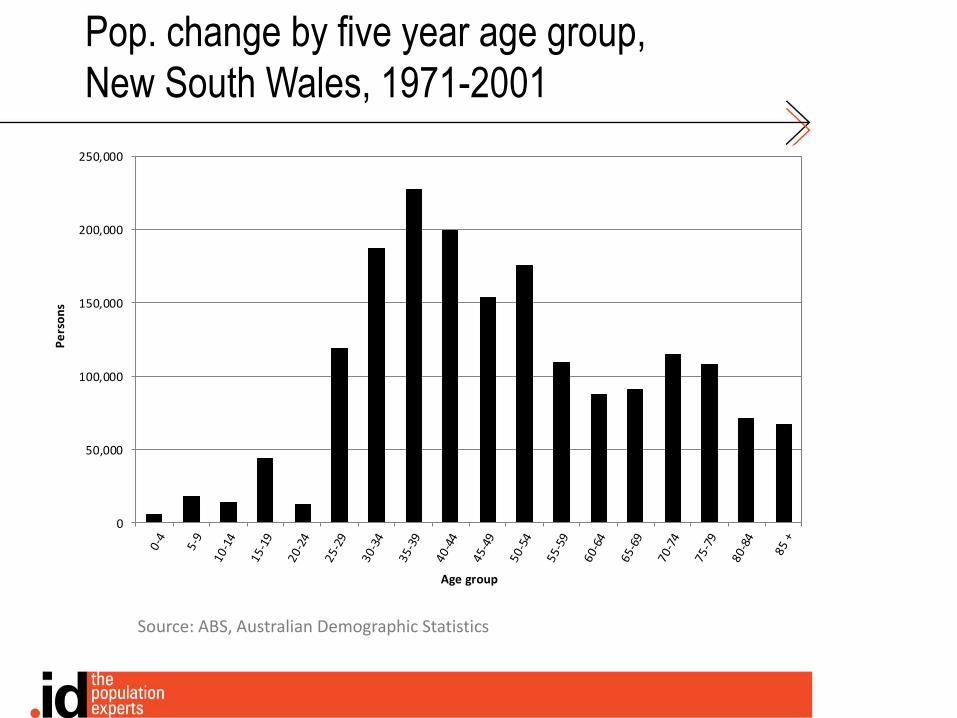
Pop. change by five year age group,
New South Wales, 1971-2001
Source: ABS, Australian Demographic Statistics
0
50,000
100,000
150,000
200,000
250,000
Pe
rso
ns
Age group
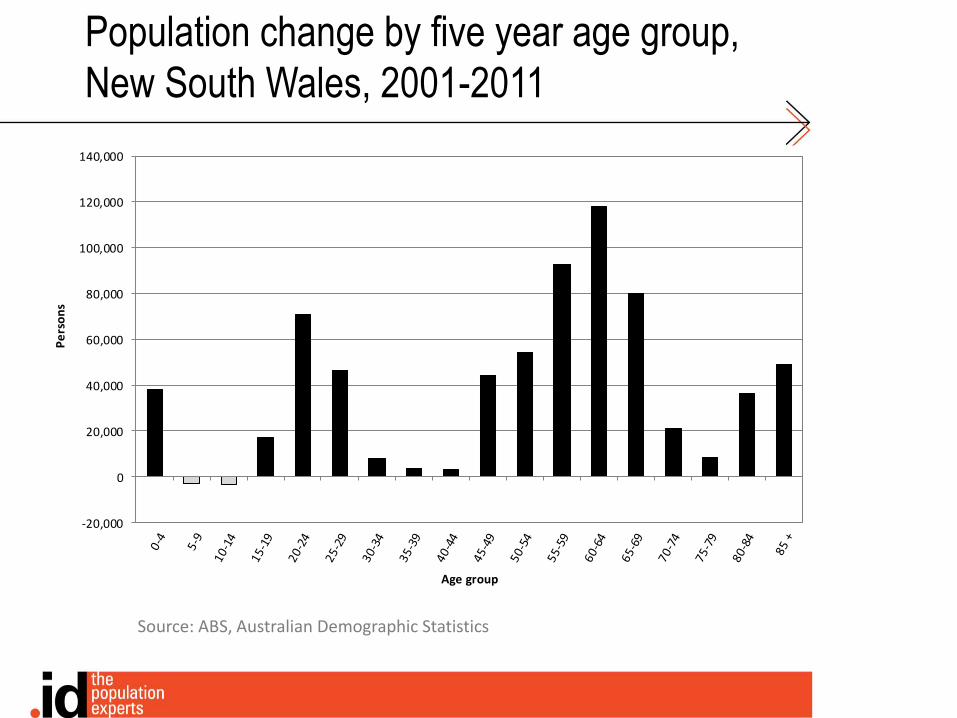
Population change by five year age group,
New South Wales, 2001-2011
Source: ABS, Australian Demographic Statistics
-20,000
0
20,000
40,000
60,000
80,000
100,000
120,000
140,000
Pe
rso
ns
Age group
Changing patterns of household formation and the
dwelling demand / supply equation
Changing housing consumption
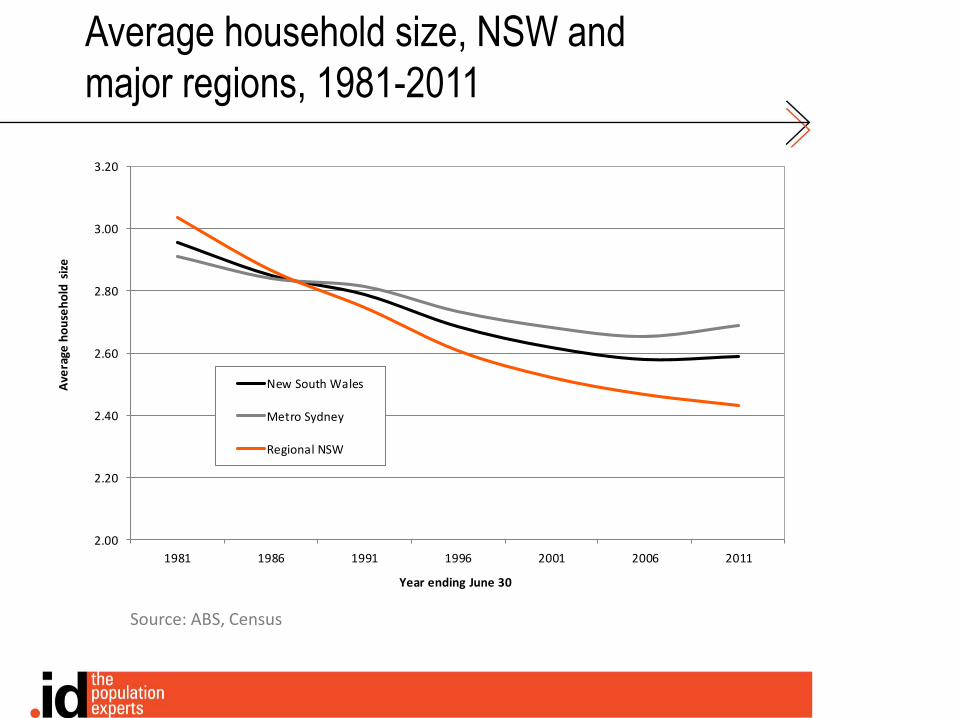
Average household size, NSW and
major regions, 1981-2011
Source: ABS, Census
2.00
2.20
2.40
2.60
2.80
3.00
3.20
1981 1986 1991 1996 2001 2006 2011
Ave
rage
ho
use
ho
ld s
ize
Year ending June 30
New South Wales
Metro Sydney
Regional NSW

Source: ABS, Australian Demographic Statistics 2015; ABS, Building Approvals AustraliaNote: 2016 data based on 11 months of data
Population growth & building approvals,
New South Wales, 1991-2016
0
20,000
40,000
60,000
80,000
100,000
120,000
Nu
mb
er
Year ending June 30
Population Change
Building approvals
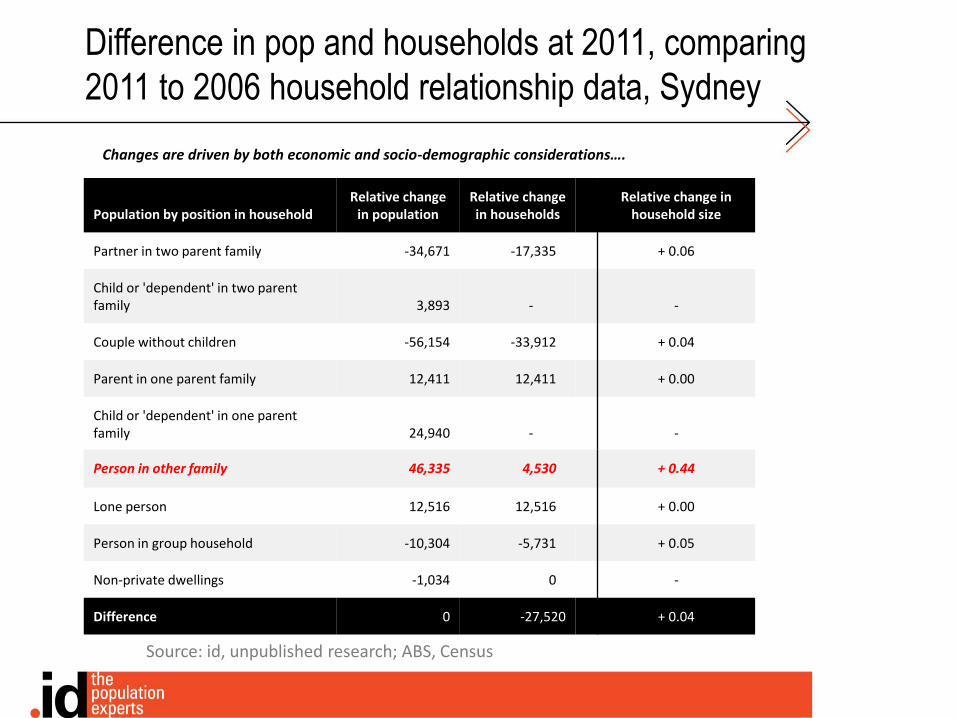
Difference in pop and households at 2011, comparing
2011 to 2006 household relationship data, Sydney
Source: id, unpublished research; ABS, Census
Population by position in householdRelative change
in populationRelative change in households
Relative change in household size
Partner in two parent family -34,671 -17,335 + 0.06
Child or 'dependent' in two parent family 3,893 - -
Couple without children -56,154 -33,912 + 0.04
Parent in one parent family 12,411 12,411 + 0.00
Child or 'dependent' in one parent family 24,940 - -
Person in other family 46,335 4,530 + 0.44
Lone person 12,516 12,516 + 0.00
Person in group household -10,304 -5,731 + 0.05
Non-private dwellings -1,034 0 -
Difference 0 -27,520 + 0.04
Changes are driven by both economic and socio-demographic considerations….
Person in other family 46,335 4,530 + 0.44
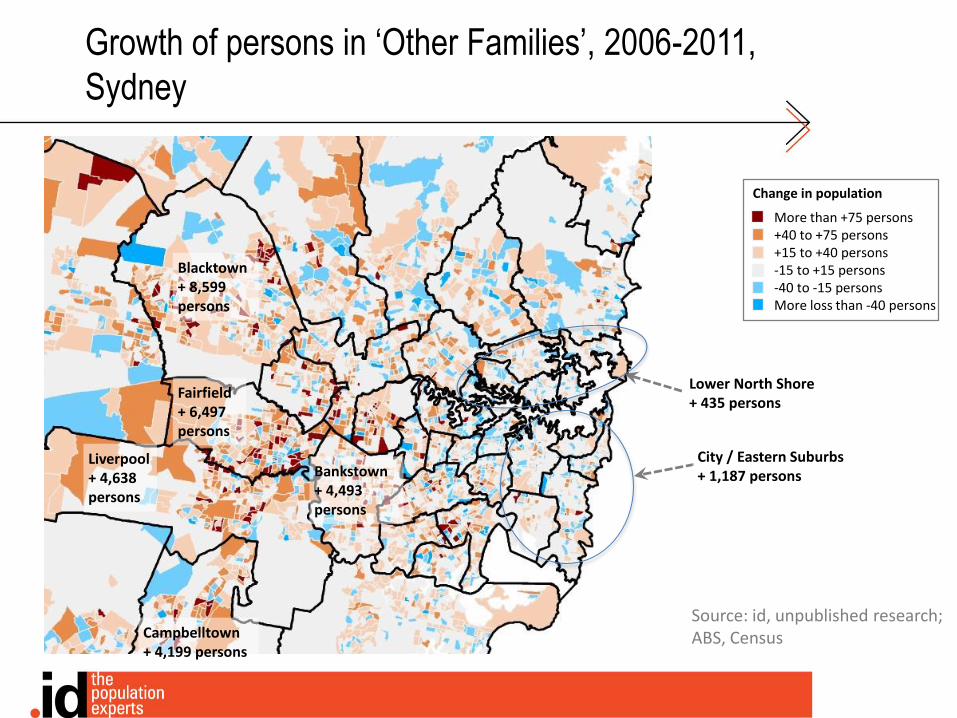
Growth of persons in ‘Other Families’, 2006-2011,
Sydney
Source: id, unpublished research; ABS, Census
Change in population
More than +75 persons+40 to +75 persons+15 to +40 persons-15 to +15 persons-40 to -15 personsMore loss than -40 persons
Liverpool + 4,638 persons
Lower North Shore + 435 persons
City / Eastern Suburbs + 1,187 persons
Fairfield + 6,497 persons
Blacktown + 8,599 persons
Campbelltown + 4,199 persons
Bankstown + 4,493 persons
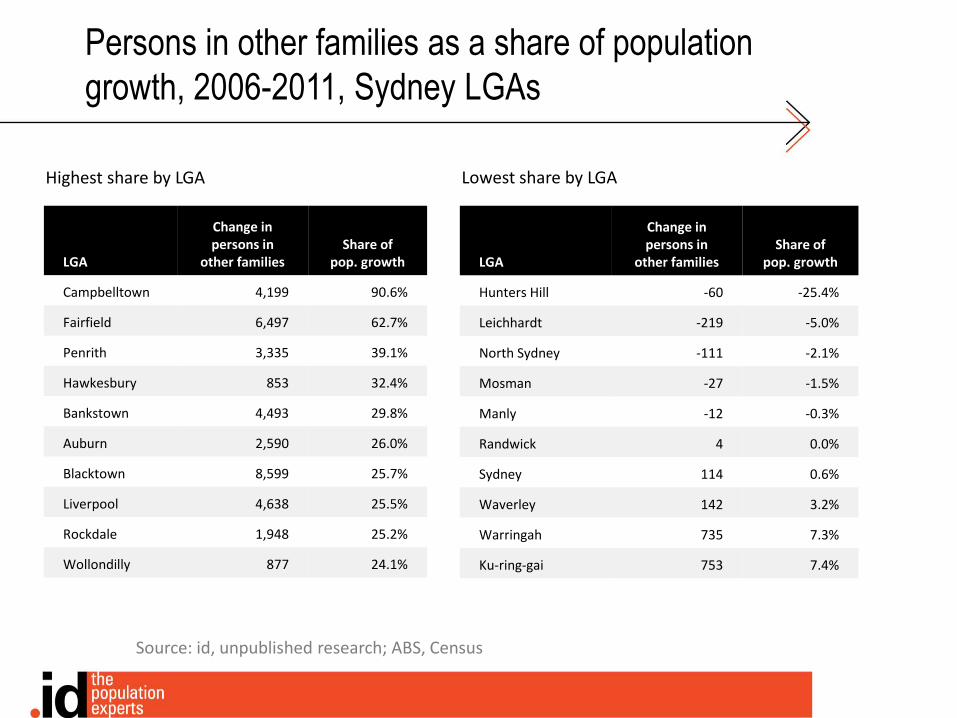
Persons in other families as a share of population
growth, 2006-2011, Sydney LGAs
Source: id, unpublished research; ABS, Census
LGA
Change in persons in
other familiesShare of
pop. growth
Campbelltown 4,199 90.6%
Fairfield 6,497 62.7%
Penrith 3,335 39.1%
Hawkesbury 853 32.4%
Bankstown 4,493 29.8%
Auburn 2,590 26.0%
Blacktown 8,599 25.7%
Liverpool 4,638 25.5%
Rockdale 1,948 25.2%
Wollondilly 877 24.1%
LGA
Change in persons in
other familiesShare of
pop. growth
Hunters Hill -60 -25.4%
Leichhardt -219 -5.0%
North Sydney -111 -2.1%
Mosman -27 -1.5%
Manly -12 -0.3%
Randwick 4 0.0%
Sydney 114 0.6%
Waverley 142 3.2%
Warringah 735 7.3%
Ku-ring-gai 753 7.4%
Highest share by LGA Lowest share by LGA
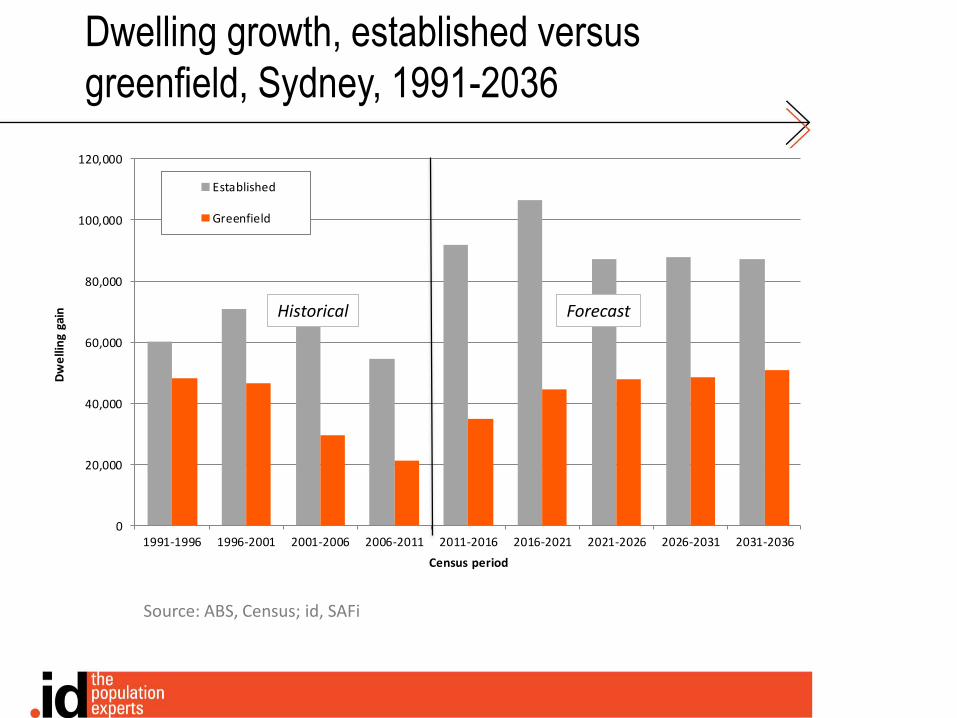
0
20,000
40,000
60,000
80,000
100,000
120,000
1991-1996 1996-2001 2001-2006 2006-2011 2011-2016 2016-2021 2021-2026 2026-2031 2031-2036
Dw
elli
ng
gain
Census period
Established
Greenfield
Source: ABS, Census; id, SAFi
Dwelling growth, established versus
greenfield, Sydney, 1991-2036
Historical Forecast
Three Growth Markets
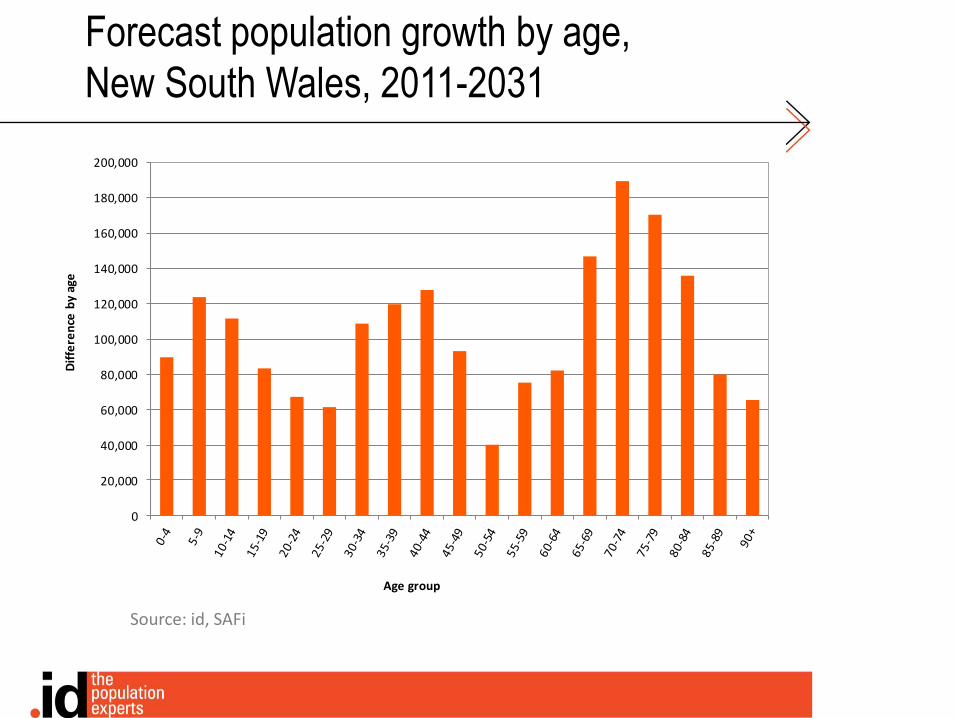
Forecast population growth by age,
New South Wales, 2011-2031
Source: id, SAFi
0
20,000
40,000
60,000
80,000
100,000
120,000
140,000
160,000
180,000
200,000
Dif
fere
nce
by
age
Age group
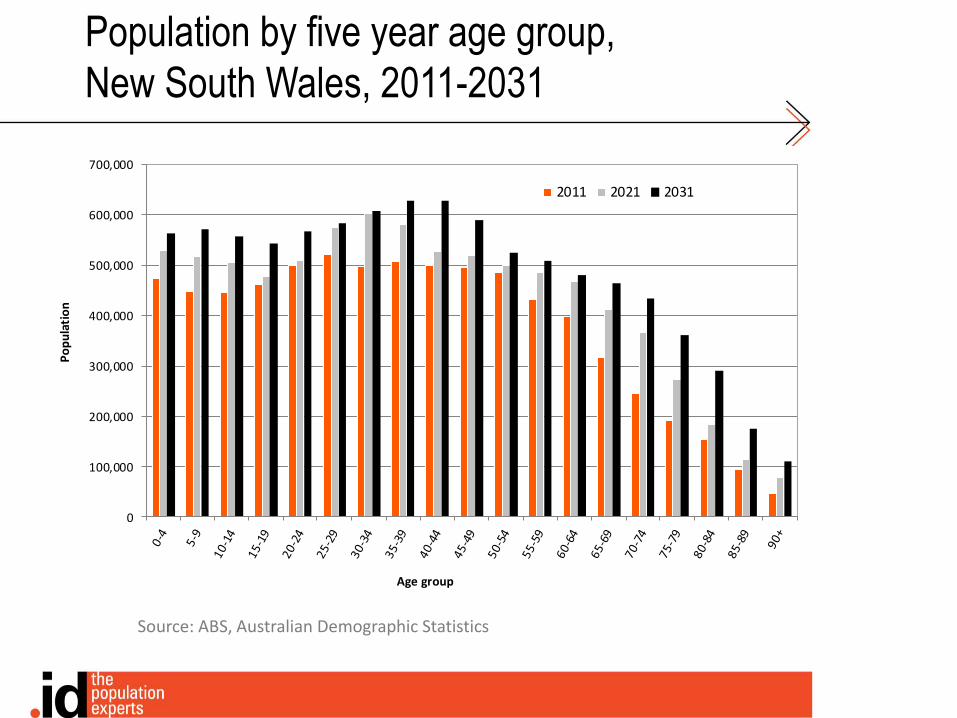
Population by five year age group,
New South Wales, 2011-2031
Source: ABS, Australian Demographic Statistics
0
100,000
200,000
300,000
400,000
500,000
600,000
700,000
Po
pu
lati
on
Age group
2011 2021 2031
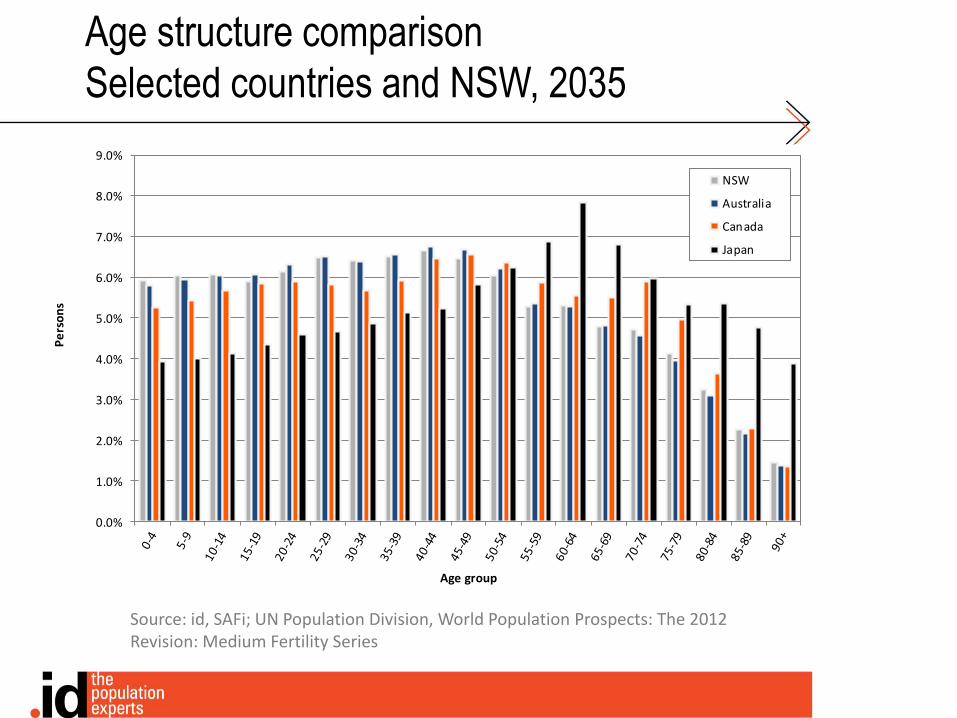
Age structure comparison
Selected countries and NSW, 2035
Source: id, SAFi; UN Population Division, World Population Prospects: The 2012 Revision: Medium Fertility Series
0.0%
1.0%
2.0%
3.0%
4.0%
5.0%
6.0%
7.0%
8.0%
9.0%
Pe
rso
ns
Age group
NSW
Australia
Canada
Japan

Regional and local changes
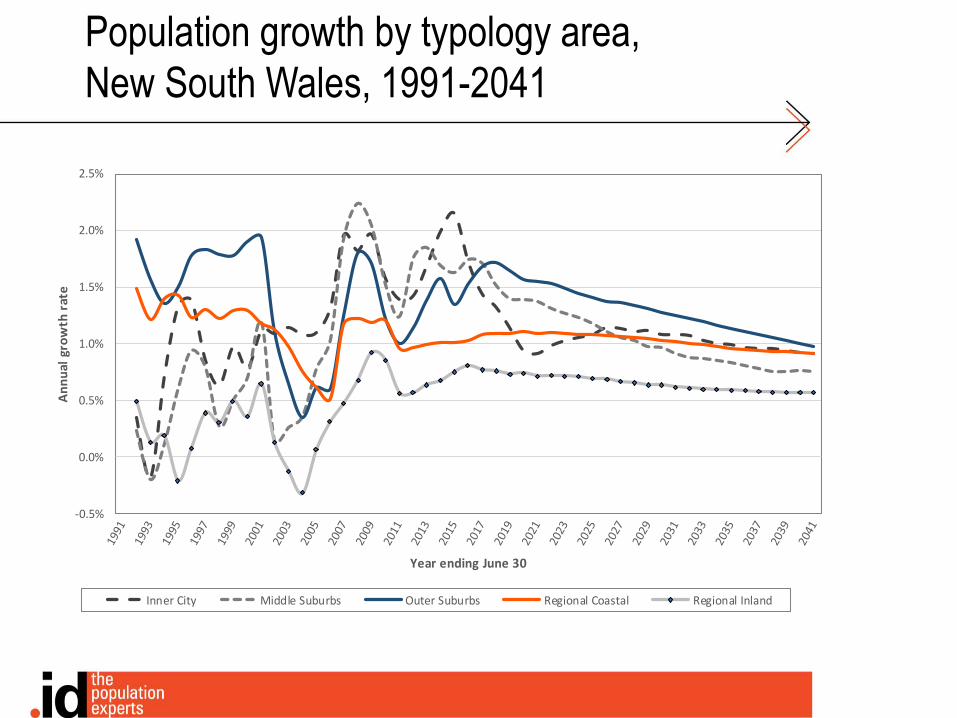
Population growth by typology area,
New South Wales, 1991-2041
-0.5%
0.0%
0.5%
1.0%
1.5%
2.0%
2.5%
An
nu
al g
row
th r
ate
Year ending June 30
Inner City Middle Suburbs Outer Suburbs Regional Coastal Regional Inland

Average annual population change
More gain than 2.5%1.0% to 2.5%0.3% to 1.0%-0.3% to 0.3%-0.3% to -1.0%More loss than -1.0%
Population growth by LGA,
New South Wales, 2011-2021
Source: id, SAFi
Camden
Auburn
Murray
Shoalhaven
Yass Valley
Tamworth
Greater Taree
Tweed
Maitland
Dubbo
See Sydney Inset
Sydney
Botany Bay
Lane Cove
Brewarrina
Conargo

Source: id, SAFi
Population growth by LGA,
New South Wales, 2021-2031
See Sydney Inset
Average annual population change
More gain than 2.5%1.0% to 2.5%0.3% to 1.0%-0.3% to 0.3%-0.3% to -1.0%More loss than -1.0%
Camden
Wollondilly
Auburn
Murray
Shoalhaven
Yass Valley
Tamworth
Greater Taree
Tweed
Coffs Harbour Pittwater
Maitland
0
50,000
100,000
150,000
200,000
250,000
300,000
350,000
400,000
450,000
500,000
Po
pu
lati
on
Year as at June 30
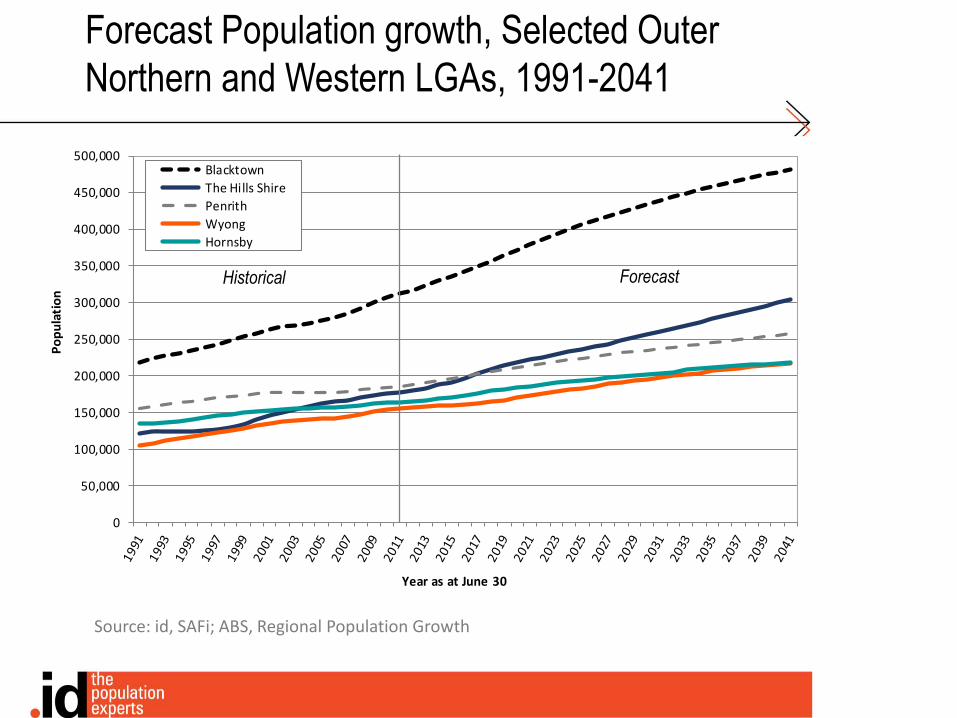
Blacktown
The Hills Shire
Penrith
Wyong
Hornsby
Forecast Population growth, Selected Outer
Northern and Western LGAs, 1991-2041
Source: id, SAFi; ABS, Regional Population Growth
Historical Forecast

0
50,000
100,000
150,000
200,000
250,000
300,000
350,000
400,000
450,000
500,000
Po
pu
lati
on
Year as at June 30
Camden
Liverpool
Sutherland Shire
Fairfield
Bankstown
Forecast Population growth, Selected Southern
and South-Western LGAs, 1991-2041
Source: id, SAFi; ABS, Regional Population Growth
Historical Forecast

0
50,000
100,000
150,000
200,000
250,000
300,000
350,000
400,000
450,000
500,000
Po
pu
lati
on
Year as at June 30
Sydney
Parramatta
Ryde
Canterbury
Auburn
Forecast Population growth, Selected Inner
and Middle Suburban LGAs, 1991-2041
Source: id, SAFi; ABS, Regional Population Growth
Historical Forecast

The final word
Conclusions
There has been a transformation of New South Wales’ population prospects over the
last decade, driven by high rates of overseas migration and higher fertility
Population growth is now likely to be higher and more ‘youthful’ than previously
expected, but the challenge of ageing remains
Growth has continued in established parts of Sydney in the past 5 years and there
are vast numbers of sites in the pipeline
Growth is assumed to hold up in coastal areas in the future
Change is driven by economic factors as well as social components (higher birth
rates / more stable household size
Volatility means timely updates are critical

Placemaker
Related Documents