GALADE: A ROUND-TRIP GRAPHICAL MODELLING TOOL FOR ABSTRACTION LAYERED ARCHITECTURE APPLICATIONS A THESIS SUBMITTED TO AUCKLAND UNIVERSITY OF TECHNOLOGY IN PARTIAL FULFILMENT OF THE REQUIREMENTS FOR THE DEGREE OF MASTER OF P HILOSOPHY Supervisors Associate Professor Roopak Sinha Mr. John Spray (Datamars Ltd) June 2021 By Arnab Sen School of Engineering, Computer and Mathematical Sciences

Welcome message from author
This document is posted to help you gain knowledge. Please leave a comment to let me know what you think about it! Share it to your friends and learn new things together.
Transcript

GALADE: A ROUND-TRIP
GRAPHICAL MODELLING TOOL
FOR ABSTRACTION LAYERED
ARCHITECTURE APPLICATIONS
A THESIS SUBMITTED TO AUCKLAND UNIVERSITY OF TECHNOLOGY
IN PARTIAL FULFILMENT OF THE REQUIREMENTS FOR THE DEGREE OF
MASTER OF PHILOSOPHY
Supervisors
Associate Professor Roopak Sinha
Mr. John Spray (Datamars Ltd)
June 2021
By
Arnab Sen
School of Engineering, Computer and Mathematical Sciences
Abstract
In recent years, a new software architecture, the Abstraction Layered Architecture
(ALA), has emerged at Datamars Ltd to help address the issue of code bases becoming
harder to maintain over time. Previous quantitative assessments, using a refined set of
metrics based on the ISO/IEC 25010 and 25023 quality models, have strongly indicated
that using ALA to develop an application allows for high modularity, testability, reusab-
ility, and analysability. These merits are largely supported through the separation of
logical software components into artefacts called domain abstractions. These domain
abstractions are wired together at runtime through common interfaces, through which
they communicate with one another.
This usage of wiring has enabled the visualisation of ALA applications as directed
port graphs, and has led ALA application development to incorporate a diagram-first
approach. The design of the application would be drawn first, from which the application
code would be written. The problem that arose, then, was that it was a manual and
time-consuming process to ensure that changes in the diagram were correctly reflected
in the code, and vice versa. After seeing promising results from a prototype code
generation tool, Datamars Ltd sought to develop a graphical tool that could visualise
ALA diagrams, automatically generate the corresponding application code, and keep
both ends synchronised.
We have systematically examined the literature, and found that no tools exist that
can holistically satisfy the requirements that such a tool would impose.
2

Therefore, this thesis presents the Graphical Abstraction Layered Architecture
Development Environment (GALADE), a novel tool to support the visualisation and
maintenance of ALA applications. The creation of this tool has been the result of
a productive partnership between Auckland University of Technology (AUT) and
Datamars Ltd. All of the development for this tool has been performed by the author,
with consultation and resources provided by Datamars Ltd.
We have used the Design Science research methodology to frame the design, devel-
opment, and evaluation of GALADE. A case study of GALADE in use at Datamars Ltd
suggested that it improves productivity in ALA-based development, and a qualitative
and quantitative evaluation has shown that GALADE shows significant improvements
to the previous diagram-first design process for ALA.
Finally, ALA is a reference software architecture that has so far shown promise
in the embedded software field, and research is underway to examine its applicability
in other software fields. This implies that GALADE has the potential to be a general-
purpose tool for the visualisation and development of highly maintainable software,
therefore GALADE may be significant for the wider community of software engineering
researchers and practitioners.
3

Contents
Abstract 2
Attestation of Authorship 11
Publications 12
Acknowledgements 13
1 Introduction 141.1 Maintainability and ALA . . . . . . . . . . . . . . . . . . . . . . . . . . 141.2 Motivation and Significance . . . . . . . . . . . . . . . . . . . . . . . . 15
1.2.1 Improving Productivity at Datamars . . . . . . . . . . . . . . . 161.2.2 Developing GALADE Using ALA . . . . . . . . . . . . . . . . 171.2.3 GALADE as a General-Purpose Tool . . . . . . . . . . . . . . . 17
1.3 Research Questions . . . . . . . . . . . . . . . . . . . . . . . . . . . . . 181.4 Primary Contributions . . . . . . . . . . . . . . . . . . . . . . . . . . . . 181.5 Additional Contributions . . . . . . . . . . . . . . . . . . . . . . . . . . 201.6 Thesis Structure . . . . . . . . . . . . . . . . . . . . . . . . . . . . . . . 22
2 Background and Literature Review 242.1 Background . . . . . . . . . . . . . . . . . . . . . . . . . . . . . . . . . . 25
2.1.1 The Abstraction Layered Architecture . . . . . . . . . . . . . . 252.1.2 Previous Development with ALA . . . . . . . . . . . . . . . . . 29
2.2 Finding a Set of Relevant Tools . . . . . . . . . . . . . . . . . . . . . . . 322.2.1 Identifying Key Research Questions . . . . . . . . . . . . . . . 342.2.2 Formulating the Search String . . . . . . . . . . . . . . . . . . . 352.2.3 Inclusion and Exclusion Criteria . . . . . . . . . . . . . . . . . 382.2.4 Filtering Down to the Final Set . . . . . . . . . . . . . . . . . . 40
2.3 Data Extraction and Synthesis . . . . . . . . . . . . . . . . . . . . . . . 422.3.1 Language Support . . . . . . . . . . . . . . . . . . . . . . . . . . 432.3.2 UML-Independent Tools . . . . . . . . . . . . . . . . . . . . . . 432.3.3 Can UML Support ALA? . . . . . . . . . . . . . . . . . . . . . 472.3.4 UML-Dependent Tools . . . . . . . . . . . . . . . . . . . . . . . 512.3.5 Finding the Gap in the Literature . . . . . . . . . . . . . . . . . 53
4
2.4 Answering Research Questions . . . . . . . . . . . . . . . . . . . . . . . 562.4.1 Answering RQ1 . . . . . . . . . . . . . . . . . . . . . . . . . . . 562.4.2 Answering RQ2 . . . . . . . . . . . . . . . . . . . . . . . . . . . 57
2.5 Limitations and Threats to Validity . . . . . . . . . . . . . . . . . . . . . 582.6 Conclusion . . . . . . . . . . . . . . . . . . . . . . . . . . . . . . . . . . 61
3 Methodology 623.1 Choosing a Research Strategy . . . . . . . . . . . . . . . . . . . . . . . 623.2 Problem Statement . . . . . . . . . . . . . . . . . . . . . . . . . . . . . . 67
3.2.1 Defining Precisely . . . . . . . . . . . . . . . . . . . . . . . . . 673.2.2 Position and Justify . . . . . . . . . . . . . . . . . . . . . . . . . 683.2.3 Find Root Causes . . . . . . . . . . . . . . . . . . . . . . . . . . 68
3.3 Requirements . . . . . . . . . . . . . . . . . . . . . . . . . . . . . . . . . 723.3.1 Outline Artefact . . . . . . . . . . . . . . . . . . . . . . . . . . . 733.3.2 Elicit Requirements . . . . . . . . . . . . . . . . . . . . . . . . . 73
3.4 Designing and Developing the Tool . . . . . . . . . . . . . . . . . . . . 753.5 Demonstrating the Tool . . . . . . . . . . . . . . . . . . . . . . . . . . . 773.6 Evaluating the Tool . . . . . . . . . . . . . . . . . . . . . . . . . . . . . . 78
4 Design and Development 794.1 GALADE Diagrams . . . . . . . . . . . . . . . . . . . . . . . . . . . . . 804.2 Development Methodology . . . . . . . . . . . . . . . . . . . . . . . . . 814.3 Features . . . . . . . . . . . . . . . . . . . . . . . . . . . . . . . . . . . . 82
4.3.1 Round-Trip Engineering . . . . . . . . . . . . . . . . . . . . . . 834.3.2 Visualisation . . . . . . . . . . . . . . . . . . . . . . . . . . . . . 914.3.3 Usability . . . . . . . . . . . . . . . . . . . . . . . . . . . . . . . 95
4.4 The ALA-Based Design of GALADE . . . . . . . . . . . . . . . . . . . 1044.4.1 The Story Abstractions Layer . . . . . . . . . . . . . . . . . . . 1044.4.2 Methods in Place of Wires . . . . . . . . . . . . . . . . . . . . . 1054.4.3 The Core Graph Data Structure . . . . . . . . . . . . . . . . . . 1064.4.4 Pre-Existing Patterns and Paradigms in ALA . . . . . . . . . . 1094.4.5 New ALA Patterns and Paradigms for GALADE . . . . . . . . 114
4.5 The Development Timeline . . . . . . . . . . . . . . . . . . . . . . . . . 1254.5.1 Sprint 1 . . . . . . . . . . . . . . . . . . . . . . . . . . . . . . . . 1254.5.2 Sprint 2 . . . . . . . . . . . . . . . . . . . . . . . . . . . . . . . . 1254.5.3 Sprint 3 . . . . . . . . . . . . . . . . . . . . . . . . . . . . . . . . 1264.5.4 Sprint 4 . . . . . . . . . . . . . . . . . . . . . . . . . . . . . . . . 1274.5.5 Sprint 5 . . . . . . . . . . . . . . . . . . . . . . . . . . . . . . . . 1284.5.6 Sprint 6 . . . . . . . . . . . . . . . . . . . . . . . . . . . . . . . . 1294.5.7 Sprint 7 and 8 . . . . . . . . . . . . . . . . . . . . . . . . . . . . 1294.5.8 Sprint 9 . . . . . . . . . . . . . . . . . . . . . . . . . . . . . . . . 1304.5.9 Sprints 10, 11, and 12 . . . . . . . . . . . . . . . . . . . . . . . 130
4.6 Summary . . . . . . . . . . . . . . . . . . . . . . . . . . . . . . . . . . . 130
5

5 An Industry Case Study 1325.1 Choosing the Use Case . . . . . . . . . . . . . . . . . . . . . . . . . . . 1325.2 Demonstrating the Artefact . . . . . . . . . . . . . . . . . . . . . . . . . 133
5.2.1 Getting the Team Started With GALADE . . . . . . . . . . . . 1335.2.2 Issue Tracking . . . . . . . . . . . . . . . . . . . . . . . . . . . . 1345.2.3 Changes in Functionality . . . . . . . . . . . . . . . . . . . . . . 1345.2.4 Measuring Increases in Productivity . . . . . . . . . . . . . . . 136
5.3 Limitations and Threats to Validity . . . . . . . . . . . . . . . . . . . . . 1405.4 Summary . . . . . . . . . . . . . . . . . . . . . . . . . . . . . . . . . . . 141
6 Evaluation 1436.1 Evaluation as a Design Science Step . . . . . . . . . . . . . . . . . . . . 1446.2 Evaluating GALADE . . . . . . . . . . . . . . . . . . . . . . . . . . . . 145
6.2.1 The Test Environment . . . . . . . . . . . . . . . . . . . . . . . 1456.2.2 The Visualisation of ALA Diagrams . . . . . . . . . . . . . . . 1466.2.3 Code Generation from ALA Diagrams . . . . . . . . . . . . . . 1536.2.4 Diagram Generation from ALA Code . . . . . . . . . . . . . . 1546.2.5 How an ALA Diagram Shows Documentation . . . . . . . . . 1566.2.6 Extensibility . . . . . . . . . . . . . . . . . . . . . . . . . . . . . 1576.2.7 Performance Overhead . . . . . . . . . . . . . . . . . . . . . . . 1576.2.8 Optional Requirements . . . . . . . . . . . . . . . . . . . . . . . 168
6.3 GALADE’s Potential Impact on ALA-Based Development . . . . . . . 1686.4 Limitations and Threats to Validity . . . . . . . . . . . . . . . . . . . . . 1706.5 Summary . . . . . . . . . . . . . . . . . . . . . . . . . . . . . . . . . . . 171
7 Conclusions 1727.1 Summary . . . . . . . . . . . . . . . . . . . . . . . . . . . . . . . . . . . 1727.2 Answering the Remaining Research Questions . . . . . . . . . . . . . . 174
7.2.1 Answering RQ3 . . . . . . . . . . . . . . . . . . . . . . . . . . . 1757.2.2 Answering RQ4 . . . . . . . . . . . . . . . . . . . . . . . . . . . 1767.2.3 Answering RQ5 . . . . . . . . . . . . . . . . . . . . . . . . . . . 1787.2.4 Answering RQ6 . . . . . . . . . . . . . . . . . . . . . . . . . . . 1797.2.5 Answering RQ7 . . . . . . . . . . . . . . . . . . . . . . . . . . . 1807.2.6 Overall Insights . . . . . . . . . . . . . . . . . . . . . . . . . . . 180
7.3 Limitations . . . . . . . . . . . . . . . . . . . . . . . . . . . . . . . . . . 1827.4 Future Work . . . . . . . . . . . . . . . . . . . . . . . . . . . . . . . . . . 1837.5 Final Thoughts . . . . . . . . . . . . . . . . . . . . . . . . . . . . . . . . 184
References 185
6
List of Tables
3.1 A table mapping the priority and optional requirements for GALADEto our research questions. . . . . . . . . . . . . . . . . . . . . . . . . . . 75
6.1 Specifications for the test environment for evaluating GALADE, XMind,and XMindParser. . . . . . . . . . . . . . . . . . . . . . . . . . . . . . . 145
6.2 Topological measurements for the small test case. . . . . . . . . . . . . 1586.3 Topological measurements for the medium test case. . . . . . . . . . . 1606.4 Topological measurements for the large test case. . . . . . . . . . . . . 1606.5 Measurements recorded for the time taken to load an ALA diagram. . 1636.6 Measurements recorded for the time taken to add a new node to an ALA
diagram. . . . . . . . . . . . . . . . . . . . . . . . . . . . . . . . . . . . . 1636.7 Measurements recorded for the time taken to delete a subtree from an
ALA diagram. . . . . . . . . . . . . . . . . . . . . . . . . . . . . . . . . 1646.8 Measurements recorded for the time taken to generate code from an
ALA diagram. . . . . . . . . . . . . . . . . . . . . . . . . . . . . . . . . 165
7
List of Figures
2.1 A template of an instance node in XMind, followed by an exampleinstance. Ports have been removed from both nodes to simplify thisexample. . . . . . . . . . . . . . . . . . . . . . . . . . . . . . . . . . . . . 30
2.2 A small subsection of an ALA diagram in XMind. Every instance nodeis coloured blue. All other nodes are ports, and all connections betweenports represent WireTo calls. The red arrows are cross-connectionsfrom ports elsewhere in the diagram, and also represent WireTo calls. 31
2.3 An example of XMindParser (bottom) being used to generate code fora small ALA diagram in XMind (top). . . . . . . . . . . . . . . . . . . . 32
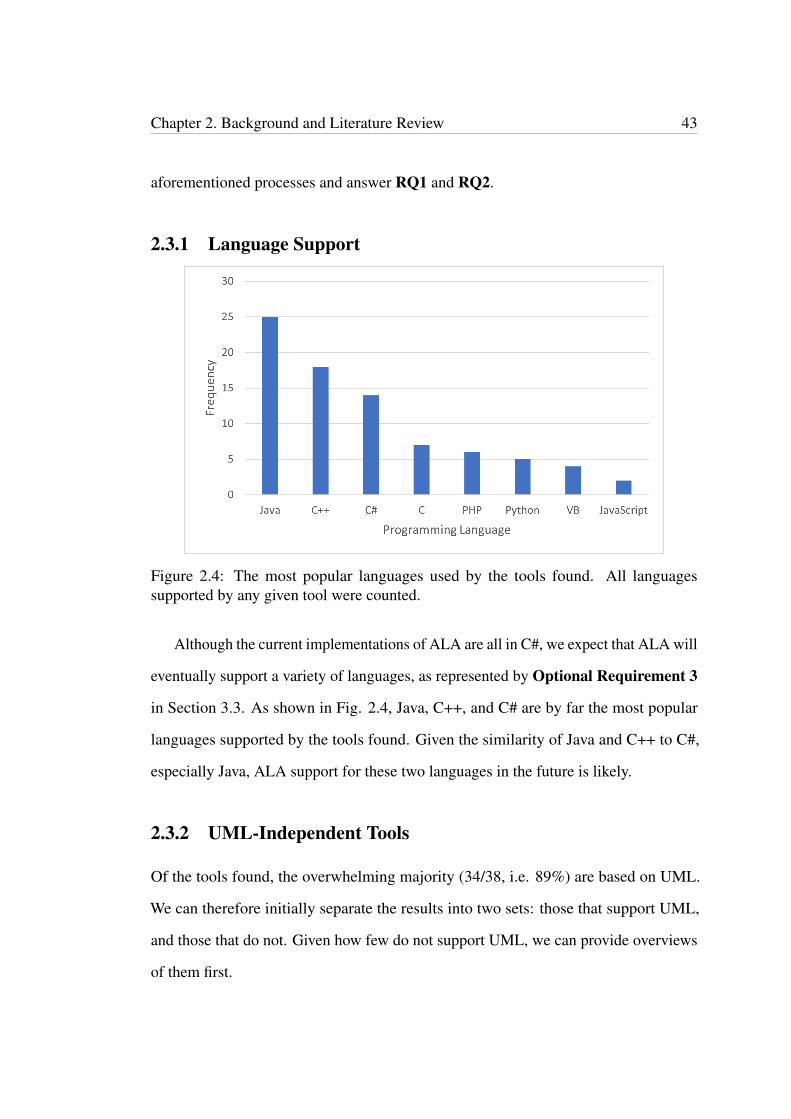
2.4 The most popular languages used by the tools found. All languagessupported by any given tool were counted. . . . . . . . . . . . . . . . . 43
2.5 A feature matrix that shows to whether the tools satisfy core featuresF1-F5 compared to GALADE. . . . . . . . . . . . . . . . . . . . . . . . 54
3.1 A summarised view of our design science process. . . . . . . . . . . . 663.2 A fishbone diagram that shows our initial root cause analysis for low
productivity with ALA-based development. . . . . . . . . . . . . . . . . 69
4.1 An annotated view of a generic ALA diagram drawn in GALADE. . . 814.2 A summary of the Agile design and development process for GALADE. 824.3 An example of a PopupWindow instance node in GALADE (top),
and its automatically generated C# instantiation code as a single word-wrapped line (bottom). . . . . . . . . . . . . . . . . . . . . . . . . . . . . 85
4.4 An example of JSON metadata in a comment for a wire’s generatedcode, including data such as the types of both the source and destination.This code is in a single line, and has been squashed and word-wrappedfor clarity. The wiring in question is of the main canvas being wired toan abstraction that emits an event whenever the Enter key is pressed. . 86
4.5 A view of the domain abstraction template creation window in GALADEv1.14.1, excluding the node preview. . . . . . . . . . . . . . . . . . . . . 87
4.6 A snippet of a story abstraction template file generated by GALADEv1.14.1. The instantiations in the Input instances and Outputinstances regions have been manually formatted to save space. . . 88
4.7 The node preview of the template generated in Figure 4.5. . . . . . . . 89
8
4.8 A comparison between low cross-connection visibilty being disabled(top) and enabled (bottom), especially regarding the impact on thereadability of the testConnector instance. . . . . . . . . . . . . . . 93
4.9 A demo of the tooltips that appear on a TextBox instance node whenmousing over the base (top), a port (middle), or a member name (bot-tom). These tooltips are showing documentation that is extracted fromthe domain abstraction and programming paradigm source files used byTextBox. . . . . . . . . . . . . . . . . . . . . . . . . . . . . . . . . . . . 98
4.10 An example of how documentation can be stored in an instance in adiagram in GALADE. . . . . . . . . . . . . . . . . . . . . . . . . . . . . 100
4.11 An example of how documentation can be stored in a wire in a diagramin GALADE. . . . . . . . . . . . . . . . . . . . . . . . . . . . . . . . . . 100
4.12 An example of searching in GALADE. Here, all nodes in the diagramthat contain a match to “textbox” in their type, name, or visible proper-ties are found. . . . . . . . . . . . . . . . . . . . . . . . . . . . . . . . . . 101
4.13 A UML class diagram of the core graph data structure abstractions. . . 1074.14 The IDataFlow interface. . . . . . . . . . . . . . . . . . . . . . . . . . 1094.15 The IDataFlowB interface. . . . . . . . . . . . . . . . . . . . . . . . . 1104.16 A simple layout in GALADE using IDataFlow<string> ports. . 1114.17 The IUI interface. . . . . . . . . . . . . . . . . . . . . . . . . . . . . . . 1124.18 A simple layout in GALADE using IUI ports. . . . . . . . . . . . . . . 1124.19 The resultant GUI from Fig. 4.18’s execution. . . . . . . . . . . . . . . 1124.20 The IEvent interface. . . . . . . . . . . . . . . . . . . . . . . . . . . . 1134.21 The IEventB interface. . . . . . . . . . . . . . . . . . . . . . . . . . . 1134.22 A simple layout in GALADE using IEvent ports. . . . . . . . . . . . 1144.23 A partial view of the Button abstraction’s constructor. . . . . . . . . 1144.24 The IEventHandler interface. . . . . . . . . . . . . . . . . . . . . . 1154.25 A diagram in GALADE showing the implementation of a feature where
a message is logged whenever the A key is pressed while the mainwindow is in focus. . . . . . . . . . . . . . . . . . . . . . . . . . . . . . . 115
4.26 There may be application-specific reasons to change how the sender ispropagated, so an optional ExtractSender parameter can be used. 116
4.27 The various diagram state flags implemented in GALADE. . . . . . . . 1174.28 An instance of StateChangeListener that listens for the diagram
becoming idle from any other state. . . . . . . . . . . . . . . . . . . . . 1184.29 An overview of the debugger plug-in diagram. The orange nodes indic-
ate nodes that are instantiated in other diagrams and merely referencedhere. . . . . . . . . . . . . . . . . . . . . . . . . . . . . . . . . . . . . . . 120
4.30 A screenshot of a live view of the debugger, connected to an instanceof Visual Studio that is debugging GALADE v1.10.1 (top), and anextended showcase of the path highlighting feature (bottom). . . . . . 121
4.31 The reference nodes used in Fig. 4.29. . . . . . . . . . . . . . . . . . . . 1224.32 The menu items to initiate various debugger commands. . . . . . . . . 123
9
4.33 The menu items to handle breakpoints in nodes. Breakpoints canbe added to any methods or property accessors found in the node’sabstraction source file. . . . . . . . . . . . . . . . . . . . . . . . . . . . . 124
4.34 The first ALA diagram drawn in GALADE. . . . . . . . . . . . . . . . 1264.35 An example of the initial ALA code generation in GALADE. . . . . . 127
5.1 Three views of the same instance node, menu_tools, which is refer-enced in the Debugger and CreateAbstractionTemplateFilediagrams. An instance node that is referenced in other diagrams willhave a blue outline in its original diagram. . . . . . . . . . . . . . . . . 136
5.2 A graph showing the total number of tickets closed in GitLab for DMA. 1385.3 A graph showing the total number of tickets closed in GitLab for DMA
per hour worked. . . . . . . . . . . . . . . . . . . . . . . . . . . . . . . . 139
6.1 A comparison of how the same subdiagram is laid out in XMind (left)and GALADE (right). They are both laid out as trees growing towardsthe right. . . . . . . . . . . . . . . . . . . . . . . . . . . . . . . . . . . . . 147
6.2 A comparison of zoomed out views for the same application diagramin XMind (top) versus in GALADE (bottom) in maximised windows ata resolution of 1920 × 1080. Both diagrams were zoomed out as far aspossible, or until the entire diagram could be viewed - whichever camefirst. . . . . . . . . . . . . . . . . . . . . . . . . . . . . . . . . . . . . . . 149
6.3 A comparison of a domain abstraction instance in XMind (top) versusin GALADE (bottom). . . . . . . . . . . . . . . . . . . . . . . . . . . . . 150
6.4 A comparison of how a node with an anonymous function appears inXMind (top) versus in GALADE (bottom). . . . . . . . . . . . . . . . . 151
6.5 A comparison of code generation by XMindParser (top) versus byGALADE (bottom) for the same set of instances and WireTo calls,with word wrap in the text editor applied. . . . . . . . . . . . . . . . . . 155
6.6 A view of the entire small test case diagram in GALADE. . . . . . . . 1586.7 A view of the entire medium test case diagram in GALADE. . . . . . . 1596.8 A view of the entire large test case diagram in GALADE, which is so
large that it is completely unreadable when fully zoomed out. . . . . . 1616.9 A comparison of the mean results for loading an ALA diagram. The
error bars for each data point are too small to be seen at this chart’s scale.1656.10 A comparison of the mean Results for adding a node to an ALA diagram.1666.11 A comparison of the mean results for deleting a subtree from an ALA
diagram. . . . . . . . . . . . . . . . . . . . . . . . . . . . . . . . . . . . . 1666.12 A comparison of the mean results for generating code from an ALA
diagram. . . . . . . . . . . . . . . . . . . . . . . . . . . . . . . . . . . . . 167
10

Attestation of Authorship
I hereby declare that this submission is my own work andthat, to the best of my knowledge and belief, it contains nomaterial previously published or written by another personnor material which to a substantial extent has been acceptedfor the qualification of any other degree or diploma of auniversity or other institution of higher learning.
Signature of student
11
Publications
Building Maintainable Software UsingAbstraction Layering
J. Spray, R. Sinha, A. Sen, and X. Cheng.In IEEE Transactions on Software Engin-eering, doi: 10.1109/TSE.2021.3119012.
12

Acknowledgements
This research would not have been possible without a significant amount of supportfrom others. I would like to give thanks to the following people:
• To my sister, mother, and father, thank you for your unconditional support andencouragement, not just during this project, but all throughout my life.
• To Dr. Roopak Sinha, thank you for accepting to be my primary supervisor andmentor in research. Your willingness to set aside time to provide advice andfeedback, no matter how busy your schedule had become, is highly appreciated.Thank you for providing me with a comprehensive and honest perspective onresearch, as well as seeing the potential in, and working with John on, ALA. Ilook forward to any research collaborations we may have in the future.
• To John Spray, thank you for being my secondary supervisor and mentor insoftware engineering. Of course many thanks are also in order for the dozens, ifnot hundreds, of hours you have put into creating, researching, and refining ALA.Thank you also for all of the advice you have given me from your many decadesof experience. It is rare for someone so early on in their software engineeringjourney, like me, to receive the amount of mentorship, guidance, and advice asyou have given me. None of this would be possible without your creativity andwisdom. Finally, thank you for seeing the potential in me all the way back when Ishowed you a neat little ALA code generator that I made. I’m sure we will worktogether again in the future.
• To my colleagues at Datamars, Shuwei, Kelly, Michael, Rosman, David, andAiden, thank you for your friendship, advice, and willingness to provide feedbackthroughout the development of GALADE, which would not have come as far asit has without your help.
• To the wonderful and brilliant minds at EMSOFT, thank you for your encourage-ment, help, and unique perspectives on research.
13
Chapter 1
Introduction
This chapter provides a overall view of this thesis. Section 1.1 details the involvement
of Datamars Ltd. (henceforth, Datamars) in developing a novel software architecture
that addresses software maintainability. Section 1.2 explains the significance of our
proposed development tool, as well as our three main motivations for creating it. Section
1.3 defines our research questions and where they have been answered. Sections 1.4 and
1.5 explain the novel contributions that this thesis is supplying to the wider community
of both software engineering researchers and practitioners. Finally, Section 1.6 gives a
concise summary of the structure of the remaining chapters in this thesis.
1.1 Maintainability and ALA
Software maintenance is typically defined as changes made to a code base after it
has been released (de Souza, Anquetil & de Oliveira, 2005). Changes to a code base
can include fixes to bugs or unexpected behaviour, the addition of new features, or
refactoring to make the addition of future improvements easier. Studies have shown that
up to 90% of the cost of developing a typical software product is spent on maintenance
(de Souza et al., 2005). Therefore, improving the maintainability of a commercial code
14

Chapter 1. Introduction 15
base can lead to significant value by reducing development costs.
Tru-Test Group, now a subsidiary of Datamars, was a New Zealand-based company
involved in creating software-heavy devices that help with livestock management. As
discussed by Spray and Sinha (2018), the company discovered that over 20 years, the
software in some of their products had become convoluted and difficult to maintain,
leading to their ongoing development being abandoned. They also found that a select
few products had remained relatively easy to maintain over time. In order to avoid
having to abandon development in the future, they performed a thorough parallel
investigation into both their code bases and the existing literature, to determine why
some of their code bases remained maintainable. They discovered a number of principles
that ultimately guided them to creating a novel software architecture: the Abstraction
Layered Architecture (ALA). We will discuss the founding principles and characteristics
of ALA in Section 2.1.
ALA is purported to enable a high degree of maintainability for code bases that use
it. Chen, Sinha and Spray (2020) conducted a quantitative evaluation of ALA through
the perspective of a refined set of metrics based on the ISO/IEC 25010 (BSI ISO, 2011)
and 25023 (BSI ISO, 2016) quality models. They found that, theoretically, using ALA
to develop an application leads to it having high modularity, testability, reusability, and
analysability, in terms of maintainability attributes laid out by ISO/IEC 25010 (BSI
ISO, 2011).
1.2 Motivation and Significance
This section will describe the main motivations behind our research. There are three in
particular: a tool to support ALA development could lead to increasing productivity at
Datamars, developing the tool using ALA could lead to novel developments in ALA
itself, and finally, a tool for ALA-based development also has the potential of being

Chapter 1. Introduction 16
a domain-agnostic tool for software development for the wider software engineering
community.
1.2.1 Improving Productivity at Datamars
The perceived benefits of ALA, as laid out in Section 1.1, led to Datamars experimenting
with developing new software using ALA. However, using a new software architecture
also came with the typical drawbacks: a lack of existing documentation and best
practices, a lack of an established track record, and a lack of specific tooling to support
development. In particular, as is detailed in Section 2.1, ALA uses a diagram-first
approach to development, with diagrams storing the design of the application, which
would then be translated into code. The key limiting factor was in keeping the diagram
and code aligned with one another. Changes in the diagram needed to be precisely
converted into code, and any changes to the code would need to be reflected in the
diagram. As their ALA applications grew, Datamars found that keeping the two ends
synchronised became more and more difficult. This was a significant problem, because
any theoretical increases in maintainability at the code level were seen as being negated
by the increasing difficulty in maintaining ALA diagrams and corresponding code.
Datamars wished to use ALA for production level code, but this issue was holding them
back. Fortunately, since this was a problem with the physical process, they expected that
this could be resolved with the right tool support, especially since an initial prototype
code generation tool they created showed promise.
In Chapter 2, we examined the literature to find whether an appropriate tool already
existed. Obviously it would be unlikely that an ALA-specific tool would exist, however
there was still the potential that a general-purpose tool, that could draw and generate
code from diagrams resembling ALA diagrams, could exist. Ultimately, we found that
a sufficiently-featured tool is not described in the literature. In particular, the tools that
Chapter 1. Introduction 17
could potentially generate appropriate ALA code did not have strong diagramming
support, and the tools that had strong diagramming capabilities were not found to have
sufficient ALA code generation support. Therefore, in partnership with Datamars, we
started work on developing a purpose-built ALA development tool: GALADE, the
Graphical Abstraction Layered Architecture Development Environment.
1.2.2 Developing GALADE Using ALA
We developed GALADE using ALA itself. At the time of conducting this research,
all major applications built using ALA have so far been made in-house for Datamars,
and all involve communicating with their proprietary devices and web services to
facilitate the movement and display of data. Creating GALADE is the first foray into
development with an ALA application unrelated to embedded systems, and therefore
our development process could reveal new innovations for ALA.
1.2.3 GALADE as a General-Purpose Tool
Nakagawa, Antonino and Becker (2011) consider a software reference architecture to be
a software architecture that “encompasses the knowledge about how to design concrete
architectures of systems of a given application domain”. Since ALA is a reference
architecture (Spray & Sinha, 2018), ALA-based applications are not constrained by
needing to belong in any particular domain. A tool purpose-built for ALA-based
application development would then be domain-agnostic, i.e. to some degree general-
purpose. Our proposed tool therefore has the potential to be significant to the wider
software engineering field as a general-purpose tool for application developement, albeit
under a specific reference architecture.

Chapter 1. Introduction 18
1.3 Research Questions
Our research questions are:
RQ1 What are the current trends in general-purpose software generation tools that are
based on visual models?
RQ2 Are the tools found in RQ1 able to support ALA-based software development?
RQ3 What are the productivity-related challenges involved with manually maintaining
consistency between ALA diagrams and corresponding code bases?
RQ4 What architectural strategies are most useful in designing a graphical modelling
tool to support ALA-based development with the goal of addressing the challenges
identified in RQ3?
RQ5 Can the tool from RQ4 be extended to provide automatic code generation from
ALA diagrams?
RQ6 Can the tool from RQ4 be adapted to be resilient to manual changes to the code
base?
RQ7 What are the improvements in productivity offered by the tool from RQ4, as
compared to the current practice of developing ALA-based code?
RQ1 and RQ2 are answered in Chapter 2, while RQ3, RQ4, RQ5, RQ6, and RQ7
are answered in Chapter 7.
1.4 Primary Contributions
The primary contributions of this research can be viewed through the lens of Research
Questions 1 through 7.

Chapter 1. Introduction 19
RQ1 and RQ2
A systematic literature review (SLR) has been conducted and is explored in depth in
Chapter 2. We have provided a summary of modern trends in visual model-based
software generation, and have generated a feature comparison in terms of the appropri-
ateness of tools found through the SLR in ALA-based application development.
RQ3
Through discussions with an expert in ALA, and performing internal reviews at
Datamars Ltd of existing ALA-based development, we have determined a set of issues
that hinder the productivity of ALA application development. In Section 3.2.3, these is-
sues have been consolidated into a set of Root Causes, from which a set of requirements,
separated into two sets based on their importance, have emerged in Section 3.3.
RQ4, RQ5, and RQ6
The most significant artefact produced from this research is a novel tool, GALADE, to
aid the design and maintenance of ALA applications. The development of GALADE
has been performed using ALA itself, which has allowed us to critically examine how an
ALA application can be produced. This is especially important as the area of developing
a visual modelling tool is a previously unexplored space for ALA.
Being a new space for ALA development, we have produced some novel additions
to the way that an ALA application can be made. In Section 4.4.1, we discuss how we
have introduced a new layer, the Story Abstractions layer, which allows for the reuse
of subgraphs of composed domain abstractions. We have also introduced the usage of
domain abstractions without wiring, which can prove to be much more convenient when
a domain abstraction have several access points. These contributions directly contribute
to answering RQ4.

Chapter 1. Introduction 20
GALADE is equipped with the ability to automatically generate ALA application
code from ALA diagrams, as detailed in Section 4.3.1, which addresses RQ5.
GALADE is also capable of recovering an ALA diagram from a modified ALA code
base, both from the main application code file and from modified abstraction source
files, as discussed in Section 4.3.1. This contribution allows GALADE’s presentation
of ALA diagrams to be resilient to code base modifications, and thus addresses RQ6.
RQ7
In Chapter 5, we explored a case study where GALADE was used in an industrial
environment to support the development of an ALA application, and produced evid-
ence that GALADE has the potential to improve the productivity of ALA application
development.
In Chapter 6, we performed both quantitative and qualitative evaluations of GALADE,
and produced evidence that it outperforms the mind-mapping tool XMind, as well as
the ALA code generator XMindParser.
1.5 Additional Contributions
A Novel Graphical Tool for ALA Application Development in C#
While not the main research contribution, GALADE itself provides a set of unique
features for ALA application development. Its key features are as follows:
• Visualisation of ALA diagrams: GALADE has the ability to display ALA dia-
grams as port graphs, and can automatically update a given diagram’s layout to
accommodate new nodes. The user is able to modify both the graph topology as
well as configure the details of each node in a single view. Care has been taken to
ensure that the diagram remains readable and easy to follow at different zoom
Chapter 1. Introduction 21
levels.
• Generation of ALA source code: As mentioned in Section 1.4, GALADE can
translate an ALA diagram into its corresponding application code, and automatic-
ally inject them into the application source file.
• Round-trip engineering: As brought up in Section 1.4, GALADE can keep both
an ALA diagram and its corresponding source code in sync. There is no need
for manually keeping either up to date with the other. This is because, instead of
storing the diagram in a separate file, as is done with other diagramming tools,
GALADE generates a diagram at runtime based on the application’s source code.
Changes can be made to either the code or the diagram, and the user can choose
to refresh the other side with the simple click of a menu option.
• Centralised documentation: Documentation stored in abstraction source files are
parsed and viewable in the diagram at runtime. Documentation can also be added
to individual nodes or wires through the diagram view or in the application code.
This allows for the relevant documentation to be viewable in a single place, rather
than be scattered.
• Multi-diagram navigation: As ALA applications grow, so too do their diagrams.
To help deal with this, GALADE allows the user to split up their main applica-
tion diagram into multiple subdiagrams, and navigate between them with ease.
Nodes that are common between diagrams are highlighted and are used as the
navigational gateways between the diagrams.
• Debugging support: GALADE can be hooked onto the debugger for Visual Studio
2017 and 2019. In the diagram view, breakpoints can be set at the method or
property accessors of any node’s source code, and when stopped at, the current
call stack can be viewed within GALADE. Initial support has also been added for

Chapter 1. Introduction 22
both highlighting the current path of data flow, as well as the current value being
sent through each wire.
GALADE is freely available to download from https://github.com/arnab
-sen/GALADE/releases/, and is open source.
A Novel Set of Open-Source Abstractions
This project builds on the works of previous ALA application development in C#.
While a variety of existing domain abstractions and programming paradigms were used,
we have also produced a large number of new and reusable domain abstractions and
programming paradigms. All of these have been made open source at https://
github.com/arnab-sen/GALADE, and can be used in future ALA projects, just
as we have reused existing abstractions from previous projects to produce GALADE.
Mapping From Agile and Scrum to Design Science
In Chapter 3, we explained how the design science methodology (Johannesson &
Perjons, 2014) was used to frame the research of this project. One part of this process
was the design and development of our software artefact, GALADE. We utilised the
popular Agile framework (Cohen, Lindvall & Costa, 2004) and Scrum methodology
(Schwaber, 1997) to produce meaningful results in a set of iterations. In Section 3.4,
we created a mapping from Agile and Scrum sub-activities to the sub-activities in the
Design and Develop Artefact portion of the design science process.
1.6 Thesis Structure
The rest of this thesis is split into six chapters. Chapter 2 discusses the background of
ALA’s guiding principles and a summarised account of the history of development with
Chapter 1. Introduction 23
ALA, explores a systematic literature review conducted to examine the current trends in
development tools that can generate code from visual models, with the aim of finding a
gap in the literature that GALADE can help fill, and contains answers to our first two
research questions. Chapter 3 details the methodology used in our research. A review of
research methodologies is conducted, and our reasoning for choosing a design science
approach is provided. Chapter 4 describes the ALA-based design and development
of GALADE, and how its various features were implemented. In Chapter 5, we
showcase a real use-case scenario for GALADE, which was used for a 10-week period
at Datamars, and we provide a quantitative analysis of the changes in productivity seen
after introducing software engineers to the tool. Chapter 6 discusses a quantitative and
qualitative assessment of GALADE. We discuss the extent to which the requirements
elicited for GALADE were satisfied, and provide the results of experiments conducted
on the performance overhead of the tool in comparison to the tools that are already used
for ALA application development at Datamars. Chapter 7 provides a summary of our
research, and details the extent to which the last five research questions were satisfied.
Final conclusions and comments on future work are also provided in this chapter.

Chapter 2
Background and Literature Review
This chapter explores the background of the design of ALA and the relevant history of
development using it, as well as a review of the software engineering literature to find
potential replacements for our tool, GALADE.
Section 2.1 explores the guiding principles and constraints behind ALA, as well
as providing a summary of the relevant history of ALA development at Datamars.
Section 2.2 details the process of a systematic literature review (B. Kitchenham, 2004),
conducted to examine the current state of the art for general-purpose tools that can
produce software from visual models, and ends with a final candidate pool of tools found
in the literature. Section 2.3 explores the final set of tools, and produces conclusions
related to their suitability as ALA application development tools. In Section 2.4 we have
answered Research Questions 1 and 2, as defined in Section 1.3. Section 2.5 covers
the limitations and threats to validity experienced in this systematic literature review.
Finally, Section 2.6 provides a summary of the results and findings of this chapter.
24

Chapter 2. Background and Literature Review 25
2.1 Background
2.1.1 The Abstraction Layered Architecture
The Abstraction Layered Architecture (ALA) is a software architecture that is con-
cerned with three key concepts: dependencies, abstractions, and organisation through
abstraction layers (Spray & Sinha, 2018). We define a dependency in the following way:
if logical code artefact A has a dependency on logical code artefact B, then A requires
knowledge of B in order to function. This is typically exhibited by A referencing B
directly in its code implementation. We define an abstraction as a logical code artefact
that contains and hides cohesive knowledge, and encapsulates a conceptual idea (Spray
& Sinha, 2018). We define an abstraction layer as a set of abstractions that have no
dependencies between one another.
As explained by Spray and Sinha (2018), the primary constraints of ALA are mostly
logical in nature, and are as follows:
1. Abstraction layers stack directly on top of one another.
2. Abstractions can only have dependencies on more abstract abstractions.
3. Dependencies can only go down layers, and cannot exist between abstractions in
the same layer.
4. The most abstract abstractions are stored in the bottom-most abstraction layer.
Constraints 1 and 4 define the high-level layered structure of an ALA application,
while constraints 2 and 3 define how dependencies are arranged. Taken at face value,
constraint 2 is similar to the dependency inversion principle, or DIP (Martin, 2000).
The DIP states that code modules with implementation details should only depend on
abstract classes and interfaces, and that no two concrete classes should have direct
dependencies on one another. However, the concept of an abstraction in the context of
Chapter 2. Background and Literature Review 26
the DIP is not the same as the concept of an abstraction in ALA. From the DIP’s point
of view, an abstraction is a code artefact that has no concrete implementation details,
and only exists for classes with concrete details to implement and reference. In ALA, an
abstraction can be what the DIP considers an abstraction, but it can also be a class with
concrete implementation details. Therefore, constraint 2 is similar to, but ultimately
more relaxed than, what is proposed by the DIP.
By following the constraints of ALA, the following convenient organisation of
layers emerged (Spray, 2020):
• Application: Being the top-most layer, the Application layer is the least abstract.
This layer contains the arrangement, instantiation, and configuration of all code
artefacts necessary for the overall application to function. Typically, this layer
hosts a composition of domain abstraction instances that together express the
application’s requirements. All artefacts in this layer are allowed to be specific
to the application itself. For example, domain abstractions that are instantiated
in this layer can be fed information specific to the application. In other words,
while the instances themselves are specific to the application, their definitions,
usually classes, are not. In terms of visualisation, this layer is represented by the
application diagrams.
• Domain Abstractions: The Domain Abstractions layer contains a pool of highly
cohesive abstractions that can be composed to express the requirements of applic-
ations. This layer typically contains the most number of source files. Artefacts in
this layer can at most be specific to a particular domain, and know nothing about
the applications that use them. They also know nothing about each other, and can
therefore be composed with one another without introducing any coupling (Spray
& Sinha, 2018). In terms of visualisation, domain abstractions typically represent
the instance nodes in the application diagrams.

Chapter 2. Background and Literature Review 27
• Programming Paradigms: The Programming Paradigms layer, like the Domain
Abstractions layer, also contains a pool of abstractions. However, as this layer
is below the Domain Abstractions layer, the abstractions in this layer are sig-
nificantly more abstract and reusable than those in above layers. In C# ALA
applications, these abstractions are usually implemented as interfaces, and serve
as the pieces that connect together domain abstractions. In terms of visualisation,
programming paradigms are typically represented by the ports on the instance
nodes in the application diagrams.
• Libraries: At the bottom sits the most abstract layer, the Libraries layer. This
layer consists of any general-purpose code that can be highly reused.
Composing Domain Abstractions to Express Requirements
To compose instances of domain abstractions together in the Application layer, we make
use of the WireTo method in the Wiring class in the Libraries layer. The WireTo
method has been implemented in C# as an extension method, which is a type of method
that can be injected into any class without modifying said class (Troelsen, 2007). For
ALA, WireTo is an extension method for the base Object class in C#, so every
abstraction instance is able to call this method.
On its surface, the WireTo method is rather simple. For domain abstractions A
and B, calling A.WireTo(B) will find the first private field in A that matches an
implemented interface type in B, which we can call I. B then gets assigned to that field
after being cast as I. In practice, I is a programming paradigm, so what this means is
that WireTo will inject B into A, and A would then be able to access B at any point in
time by using I. Since A and B are in the Domain Abstractions layer, and I is in the
Programming Paradigms layer, this follows the dependency constraint of ALA.
For greater flexibility, an additional parameter can be given to WireTo: the name of
Chapter 2. Background and Literature Review 28
the port to match. For example, instead of A.WireTo(B), if we called A.WireTo(B,
"port1"), then the field found would not only have to be a shared type between A
and B, but also have the variable name port1. Without this, WireTo would match
the first port found, so this can be useful when there are multiple valid candidates.
Executing an ALA Application
When an ALA application is run, there is a specific ordering of events that occur in the
Application layer:
1. Any named domain abstractions used in wiring are instantiated and configured.
2. All WireTo calls are executed, which constructs the application.
3. All post-wiring tasks occur, which are any additional configuration tasks that
can only be done after the initial wiring has been completed. For example, any
programming paradigms containing event subscriptions that require both a sender
abstraction and a subscriber abstraction can only proceed with the subscriptions
after the sender and subscriber are connected through wiring. These post-wiring
tasks are typically stored in a PostWiringInitialize method. Each do-
main abstraction can have its own such method. Conveniently, the Wiring class
will automatically detect and call each instance’s PostWiringInitialize
once all the wiring is complete.
4. An initial event is sent to an entry point domain abstraction instance to start the
application. For C# ALA desktop applications, this is typically an event sent to
the singleton instance of the MainWindow domain abstraction, upon receiving
which it will open and start the application.

Chapter 2. Background and Literature Review 29
2.1.2 Previous Development with ALA
Drawing ALA Diagrams in XMind
Due to the use of WireTo, an ALA application can often simply be seen as a group of
domain abstraction instances that are connected together. This therefore can be seen as
a directed port graph, which is a directed graph or digraph (Karp, 1978) where each
edge is connected to ports on nodes rather than nodes themselves. As a result, this leads
to the ability for ALA applications to be visualised in diagrams.
Development at Datamars for ALA applications prior to the introduction of GALADE
used the mind-mapping tool XMind (https://www.xmind.net) for drawing ALA
diagrams. Alternative tools, like draw.io (https://draw.io) and Microsoft Visio
(https://www.microsoft.com/en-nz/microsoft-365/visio) were also
considered. They both have comprehensive diagramming capabilities, but required too
much manual effort to ensure the correct routing. XMind, on the other hand, provided a
seamless experience where the diagram’s routing would automatically update to make
space for new nodes, which enabled new ALA diagrams to be formed quickly and
without much overhead. It should also be noted that the decision to use XMind was
made before the author got involved with ALA application development at Datamars.
Initially, the diagrams were used as purely visual documentation tools. ALA applic-
ations would be designed in XMind, then the corresponding code would be generated
by hand (Chen et al., 2020). There was no method of automatically guaranteeing that
the hand-generated code would match the diagram. Eventually, the need arose for
parsing the diagram to ensure correct code generation. This led to the adoption of
certain conventions in XMind.
For the most part, the conventions were intuitive. An instance node would be
represented by a box, and its class type and variable name, if it had one, would be
printed in the first line of text. Following that line, there would be a new line for each

Chapter 2. Background and Literature Review 30
configuration property of the instance. First would be the values for any unnamed
constructor arguments passed to the instance, then any named constructor arguments,
then any properties. An example of this can be seen in Figure 2.1.
Figure 2.1: A template of an instance node in XMind, followed by an example instance.Ports have been removed from both nodes to simplify this example.
However, some problems arose due to XMind’s own limitations. Its ability to
automatically lay out nodes was due in part to diagrams being laid out as trees, so
nodes could only have one parent from the layout’s point of view. Ports of nodes were
implemented as nodes themselves, so nodes could only have one port as a layout parent,
and the remaining ports would have to be child nodes. ALA diagrams in XMind would
be represented as trees growing from left to right, so the convention emerged to have a
node’s first input port be on its left as its parent, then any remaining input ports would
be on its right as its children, followed by any output ports. Ports would be prefixed with
> or < symbols to represent the direction of flow, to make it clear which are the input
and output ports. An example can be seen in Figure 2.2. The IEvent open port is
the first input port of PopupWindow, and the IDataFlow<bool> visible port
is the second input port. The IUI children port is its only output port. It is prefixed
with a * to represent that it can fan out to multiple input ports on other nodes.

Chapter 2. Background and Literature Review 31
Figure 2.2: A small subsection of an ALA diagram in XMind. Every instance node iscoloured blue. All other nodes are ports, and all connections between ports representWireTo calls. The red arrows are cross-connections from ports elsewhere in thediagram, and also represent WireTo calls.
XMindParser
Once the XMind conventions were in place, we were able to create a simple desktop
application called XMindParser, which would be able to parse an ALA diagram and
automatically generate its instantiation and wiring code in C#. Any instance nodes in
the diagram not given a variable name would automatically be assigned a unique ID,
from which XMindParser would produce its variable name in the code. An example
of this can be seen in Figure 2.3. It also had the ability to automatically inject the
generated code into a supplied application source file. XMindParser can be seen as a
prototype that motivated the creation of GALADE.
Figure 2.3 demonstrates an example of XMindParser in use. On top is a small ALA
diagram in XMind, and on the bottom is a view of XMindParser after having generated
that diagram’s application code. The generated code can then be injected into an ALA
application source file for compilation and execution, and this can be done automatically
if the Overwrite Application.cs checkbox is ticked and the path to the source
file is provided in the second text box.

Chapter 2. Background and Literature Review 32
Figure 2.3: An example of XMindParser (bottom) being used to generate code for asmall ALA diagram in XMind (top).
2.2 Finding a Set of Relevant Tools
B. Kitchenham (2004) provides a high-level discussion about the systematic literature
review process, applying what is a common practice in the medical field, to the field of
software engineering.
She defines a systematic literature review (SLR) as “a means of identifying, evaluat-
ing, and interpreting all available research relevant to a particular research question, or
topic area, or phenomenon of interest”. She considers systematic literature reviews as
Chapter 2. Background and Literature Review 33
secondary studies that aggregate and analyse a set of primary studies. Primary studies
are simply regular publications. While software engineering research tend to have
sections on work related to their particular topic, this is often not done in a systematic
manner. Instead, works of interest are highlighted to procure trends. Typically, when
research is being undertaken in a topic thats is dense in related publications, it can be
too time-consuming to filter through every related study, so it is of no surprise that
this method is regularly used. However, this method also suffers from the fact that
one cannot be certain that their review of a given scope is complete. When examining
related works, the main purpose is to identify that there is indeed a gap that proposed
item of research can fulfil. How can a researcher be sure that their work is truly novel?
This is a key issue that systematic literature reviews seek to resolve.
Systematic literature reviews are conducted in a manner that is reliable, which
means that if the process of an instance of a systematic literature review is given, then
this process can be repeated at a later date, with the same parameters, to achieve the
same result. This is ensured by using a well-defined search strategy that is in place
before the literature review has commenced, as well as well-defined set of criteria by
which to filter the found studies and find those that are appropriate for analysis.
As described by B. Kitchenham (2004), the systematic literature review process can
be summarised as the following:
1. Identify the research area
2. Cast a wide net to accrue a sufficiently large set of initial candidates
3. Filter the studies down to a final set
4. Extract data from the final set
5. Produce findings from the extracted data
Chapter 2. Background and Literature Review 34
2.2.1 Identifying Key Research Questions
According to B. Kitchenham (2004), the most important part of planning a systematic
literature review is to establish the research question, or questions, that should be
answered. These questions set the scope and context for the review. Ideally, the ques-
tions are meaningful to both software engineering researchers as well as practitioners,
will improve the current state of software engineering practice, and identifies whether
there is a gap between what researchers and practictioners may commonly believe to be
true about some concept, and the reality of it.
However, it is not often necessary for a systematic literature review to be held to
such idealistic standards. B. Kitchenham (2004) mentions that systematic literature
reviews can be conducted for scenarios where a researcher just wants to understand the
current body of work as they relate to a given topic, and whether there are any gaps in
this region that can motivate the production of novel research.
One of the concerns with conducting systematic literature reviews in the software
engineering field is that, compared to the medical field, which has an abundance of
primary studies, software engineering research is not as well established, perhaps mainly
because it is a newer field. In medical research, then, the research questions to ask
can be much more specific to particular populations than with software engineering
research. B. Kitchenham (2004) thus recommends that the research questions asked in
our field are not overly restrictive or specific to particular populations, unless we find
sufficient candidates to make such restrictions.
In particular, we wished to answer the following research questions:
• RQ1: What are the current trends in general-purpose software generation tools
that are based on visual models?
• RQ2: To what extent are the tools found in RQ1 able to support ALA-based
software development?
Chapter 2. Background and Literature Review 35
As mentioned in Section 1.2.3, our proposed tool has the potential to be a general-
purpose tool with the constraint of being specific to a particular reference architecture.
Therefore, our research questions have been formed to help us investigate whether the
functionality for such a tool could already exist in other tools.
2.2.2 Formulating the Search String
Creating a well-defined search strategy is crucial for ensuring that a systematic literature
review meets the high bar of quality required for reliability. Typically, the design of
the search strategy starts with first looking at the proposed research questions, and
separating them into their individual components, from which alternative words can
be derived (B. Kitchenham, 2004). Alternative words include synonyms, alternative
spellings (e.g. American vs British English), and abbreviations. Phrases can be specified
using quotation marks. All of these components can then be combined using boolean
OR’s and AND’s to construct a search string that can be submitted as a query to the
relevant academic databases. In this section, we will describe how we have ensured that
our search strategy is well-defined.
It is important to submit the formed search string to multiple academic databases
to ensure sufficient coverage, as no individual database will contain all of the known
literature of a given field, unless they aggregate all known databases.
The AUT academic database was used for the search. A search on this database
performs an aggregate search across all major academic databases, including IEEEX-
plore, ACM Digital Library, SpringerLink, ScienceDirect, Web of Science, and the
Wiley Online Library, which are the most relevant databases for software engineering
research, and are expected to provide sufficient coverage of relevant published works
(B. A. Kitchenham, Budgen & Brereton, 2015; Zhang & Babar, 2010; Singh & Singh,
2017).

Chapter 2. Background and Literature Review 36
All searches were constrained by the following conditional parameters:
• Peer-reviewed results only.
• Search in the document title, abstract, and keywords (referred to in the database
as "subject terms") only.
• The results do not have to be available in the physical AUT library.
• The results must be published between 2000 and 2020 (inclusive).
A decision was made to only include results published between 2000 and 2020
(inclusive), as the objective of this literature review is to examine current trends. Given
that the complexity in software has increased significantly since the start of the 21st
century (Boehm, 2006), we consider it unlikely that suitable tools would be found pre-
2000. We assume that any potentially relevant tools from that time are either obsolete
and no longer supported by modern operating systems, or have been iterated on and
improved to the point that they would be mentioned again in more recent literature.
It can often be the case that the initial search string conducted returns far too many
results for the researchers to process within their research timeline. It can therefore be
useful to produce preliminary search strings and submit them to the chosen academic
databases to see the scope of the results. These are considered to be pilot searches.
When too many results return, the researchers should re-evaluate whether they are
trying to examine too generic of a field. Pilot searches and query refinement can be
done incrementally until a reasonable result size is obtained (Marcos-Pablos & García-
Peñalvo, 2018). Of course, the researchers must be careful to ensure that their research
questions are also refined to match the scope of their search string.
The following search string was used as a starting point, with the intent to develop
it further by incorporating synonyms and other related keywords:

Chapter 2. Background and Literature Review 37
(visual OR (visual AND model*))
AND (programming OR tool OR ((code AND generat*))
It should be noted that keywords ending with "*" are considered by the search
database as prefixes, and will attempt to match any words starting with that keyword.
An initial pilot search was conducted using this search string on the AUT aggregate
database, which returned 300,843 results. The searched text was constrained to the title,
abstract, and keywords of peer-reviewed publications. This is obviously far too many
results to filter through in a reasonable time frame. We intended to find general-purpose
tools through this search, but we initially opted out of including “general purpose” as
keywords in the search string in order to cast as wide of a net as possible. Given the
result of the pilot search, we ultimately decided to include them as keywords to narrow
down the search. Although it is possible that we miss out on relevant tools, we do not
expect that incorporating these additional keywords will have a significant impact on
final set of results.
Hyphenation was not added to the search string because it is ignored in the AUT
database. For example, “general purpose” and “general-purpose” are treated as the
same string, and using either search string will cause the database to search for both
variants.
Synonyms and related keywords that were incorporated:
• general purpose: generic, domain agnostic
• visual: graphical
• programming: scripting, language
• tool: environment
• software: application, system, program
Chapter 2. Background and Literature Review 38
The alternative spelling for “modeling” (“modelling”) was accounted for by using
the “model*” prefix.
Incorporating synonyms and related words led to the following final search string:
(“general purpose” OR generic OR “domain agnostic”) AND
(visual OR graphical OR diagram* OR ((visual OR graphical OR
diagram*) AND model*)) AND (programming OR scripting OR
language OR tool OR environment OR ((code OR application OR
software OR system OR program) AND generat*))
3,300 results were found in the AUT database. Of those, 2699 results were exported
through its results export service.
Mendeley (https://www.mendeley.com) has been used as the reference
manager for the writing of this thesis. When importing studies into Mendeley, it
automatically looks for, and removes, duplicates, as well as otherwise invalid entries.
559 duplicates and/or invalid entries were automatically removed, leaving 2140 studies
available before the first filtering pass.
2.2.3 Inclusion and Exclusion Criteria
Given the overwhelming number of results that can be obtained even with appropriately-
worded search strings, it is not reasonable to expect that researchers should thoroughly
examine the full text of each of the set of initial candidates that have been obtained.
Therefore, the set of candidates found must be filtered such that only the truly relevant
papers are remaining. Such nuance is difficult to obtain from a refined search string
alone, and given that the search strategy must be thoroughly documented in a system-
atic literature review, a set of criteria should be created prior to the filtering process
(B. Kitchenham, 2004).
The criteria can be formed as a combination of two sets: a set of inclusion criteria,

Chapter 2. Background and Literature Review 39
i.e. the criteria that, when met by a candidate, indicates that the candidate should be
included, and conversely exclusion criteria, i.e. the criteria that indicate whether a given
candidate should be dismissed (B. Kitchenham, 2004). While it can easy to consider
that any inclusion criterion could just be the logical negation of an exclusion criterion,
and therefore question the reason for distinguishing between the two types, separating
the criteria into these two sets allows for slightly more nuanced filtering: in the case
of this research, we have elected to design the inclusion criteria in such a way that a
study must meet all of the inclusion criteria in order to be admitted into the final set,
whereas the exclusion criteria have been designed such that a candidate satisfying any
of the exclusion criteria is sufficient grounds for not including them in the final set.
The following inclusion and exclusion criteria were created:
Inclusion criteria:
• IC1: The full text of the study is available.
• IC2: The study comprehensively describes a general-purpose tool or method for
generating software from a visual model. The tool may rely on visual models
created externally rather than being able to produce them as well. The study may
also be a literature review or surveys on such tools.
Exclusion criteria:
• EC1: The study is not in English.
• EC2: The study does not relate to generating software from a visual model.
• EC3: All tools and methods mentioned in the study are specific to a domain, or a
small subset of domains, other than the programming language, operating system,
or reference software architecture supported.
• EC4: The study does not represent a tool designed for immediate or potential use
in the software engineering industry.

Chapter 2. Background and Literature Review 40
When applying these criteria, an item is rejected by the exclusion criteria if it
satisfies one or more of EC1-4. A result is accepted by the inclusion criteria if it
satisfies either IC1 or IC2.
2.2.4 Filtering Down to the Final Set
B. Kitchenham (2004) recommends that the filtering process be done in multiple
iterations, where initial iterations involve only examining the title and abstract of the
candidate studies, and that in initial iterations, the inclusion and exclusion criteria
should not be strictly enforced, so as to retain as many candidates as possible through
the iterations. At some point in the process, the full texts of the remaining candidates
should be obtained. When examining the full texts, the inclusion and exclusion criteria
can be applied rigorously to obtain an accurate final set. The reason for this is that
studies may arbitrarily leave out crucial information in their title and abstracts that,
unbeknownst to them, are pertinent to the systematic literature review at hand.
It is also recommended that the reviewer performs snowballing from the final set of
candidates, which is the process of iteratively examining studies cited by a given paper
(backwards snowballing), as well as those that cite a given paper (forward snowballing),
which is repeated in an interweaving manner until no valid candidates are left (Wohlin,
2014).
By considering all of these factors, we developed the following strategy for filtering
the candidate studies:
1. Apply the exclusion criteria to all titles and abstracts.
2. Apply the inclusion and exclusion criteria to all full texts (including titles and
abstracts) found in the studies remaining after step 1.
3. Snowball from the references of the studies remaining after step 2 is applied to
Chapter 2. Background and Literature Review 41
find a new set of studies, and apply steps 1 to 3 to them until no new studies
remain.
Given this filtering process, the inclusion criteria were designed to be much more
tailored to finding the desired result than the exclusion criteria. Due to time constraints,
studies that were not in English were excluded.
In the first pass, some studies were included when the generalisability of the tools
that they describe could not be determined from their titles and abstracts alone. For
example, a study would not be excluded by EC3 if it was unclear whether the domain
specificity of its described tool(s) was due to their implementation (to test feasibility)
or due to the target domain(s) of the tool(s). Some studies were also included when
they presented a method for generating software from a visual model, but it was unclear
whether the software would be automatically or manually generated.
Many papers were found that were “general-purpose”, but for a particular domain,
for example control systems, web applications, and GUI generation, and hence were
excluded.
After the first pass, where the exclusion criteria were applied to titles and abstracts,
11 papers were found.
After the second pass, where both the inclusion and exclusion criteria were applied
to each of the remaining full texts, 6 papers remained. The papers excluded would
either not describe their software generation in sufficient depth, or they were revealed
to be domain-specific in both their target domain and implementation after all.
The results from one secondary study conducted by Ozkaya (2019) were included,
which reviews UML modeling tools. In this study, 29 tools were found to support code
generation from UML diagrams. It should be noted that this study looked at many
commercial tools that are not otherwise referenced in the literature.
Forwards snowballing was conducted through Google Scholar (https://scholar

Chapter 2. Background and Literature Review 42
.google.com), because it provides a convenient way of searching for papers that cite
a given paper. Backwards snowballing was simply done through viewing the studies
cited as references in a given study.
Some studies were found that described general-purpose tools for educational
contexts. For example, tools such as Alice (Wang, Mei, Lin, Chiu & Lin, 2009), Scratch
(Resnick et al., 2009), and a tool by Mukhtar and Galadanci (2016), all have potential,
but are designed for the purpose of getting students interested in programming, and
so are not developed with use in the software engineering industry in mind, and are
therefore excluded by EC4.
Through backwards and forwards snowballing, we found an additional 4 studies,
leading to a final set of 10 studies, which combined to mention 38 tools. We were
surprised to see how few individual studies in the literature there were that satified
our criteria. Given the numerous commercial UML modelling tools found from the
secondary study by Ozkaya (2019), it seems that the majority of tools relevant to us
appear outside of the literature. We will nonetheless consider all 38 tools found in this
systematic literature review as the final set of tools to be analysed.
2.3 Data Extraction and Synthesis
Now that the final set of results have been found, we can begin the process of analysing
the data, drawing conclusions, and answering research questions RQ1 and RQ2.
We will begin by categorising the results by the type of visual model(s) they use,
and then for each category, explore whether those visual models are appropriate for
ALA-based development, and whether the tools themselves are able to to support ALA
code generation. Then, we will summarise the results through a feature comparison
matrix, where core features related to our research problems are identified and mapped
to each candidate in the set of tools found. Finally, we will summarise all of the
Chapter 2. Background and Literature Review 43
aforementioned processes and answer RQ1 and RQ2.
2.3.1 Language Support
Figure 2.4: The most popular languages used by the tools found. All languagessupported by any given tool were counted.
Although the current implementations of ALA are all in C#, we expect that ALA will
eventually support a variety of languages, as represented by Optional Requirement 3
in Section 3.3. As shown in Fig. 2.4, Java, C++, and C# are by far the most popular
languages supported by the tools found. Given the similarity of Java and C++ to C#,
especially Java, ALA support for these two languages in the future is likely.
2.3.2 UML-Independent Tools
Of the tools found, the overwhelming majority (34/38, i.e. 89%) are based on UML.
We can therefore initially separate the results into two sets: those that support UML,
and those that do not. Given how few do not support UML, we can provide overviews
of them first.

Chapter 2. Background and Literature Review 44
Envision
Envision (Asenov, 2011) is a visual programming language designed to support the
development of entire applications. The visual models it creates are representative of the
source code, i.e. it acts as both a code generator and a code inspector. Envision therefore
maintains some level of synchronisation between the two modes of representation.
Envision supports development using the Model-View-Controller (MVC) framework
(Krasner, Pope et al., 1988). However, unlike the standard approach to models in MVC,
where they acts as containers for compiler-supported variables, Envision allows the
developer to incorporate a variety of types of media elements in a model, including
textual documentation, images, tables, and animations, and are all visualised together in
the application diagram.
While ALA does not support MVC directly, it is possible for an ALA implementa-
tion to be designed with model, view, and controller abstractions.
By the author’s admission, it is not in a ready state for application development. It
is currently just a proof of concept, and lacks any examples of real usage in an industry
setting.
In terms of appropriateness for ALA, Envision’s approach to visualisation does not
appear to be suitable for ALA applications, as its approach substitutes code fragments
with more easily readable glyphs, but on a larger scale it does not visualise the relation-
ships in a graph. Instead, the code is visualised as hierarchically nested blocks, which is
more akin to code organisation than abstraction. We thus do not see Envision inherently
being capable of visualising an ALA application as its corresponding ALA diagram.
However, given Envision’s support for extensibility, it could be possible to write an
extension to support ALA.

Chapter 2. Background and Literature Review 45
Visula
Visula (Grant, 2006) is a visual programming language that takes inspiration from UML
sequence diagrams (Pilone & Pitman, 2005), although they are not used directly. It uses
the unique visualisation approach of using the x-axis to show the progression of time,
so each node in the diagram contains a “life-line” for every variable involved. This
means that every variable assignment, control loop, if-else block, and so on, for a code
block, are shown in the timeline for that code block’s node.
It is unclear from the paper how Visula handles code generation, and whether it has
a built-in compiler. We were also unable to find any additional information about this
language other than references to this one paper, so it appears that it is obsolete.
OpenMusic
OpenMusic (Bresson, Agon & Assayag, 2009) is another visual programming language,
built on Lisp and the Common Lisp Object System (CLOS) (Bobrow et al., 1988).
While it was made to be implemented in the audio engineering domain, OpenMusic
is generic enough that it can be used as a general-purpose visual programming language.
Nodes in the diagrams can be functions or classes, and diagrams can be contained
within other diagrams, allowing for abstraction through hierarchical separation.
One restriction that is apparent is that due to the style of functional composition
used in Lisp, the diagrams produced are directed acyclic graphs, meaning that cross-
connections are not possible. ALA poses no such limitation, and cross-connections
have been used extensively in existing ALA diagrams.
While the initial implementation of OpenMusic involved the strict usage of the
data-flow paradigm, the author has extended it to support an event-driven paradigm
(Bresson & Giavitto, 2014).
OpenMusic has seen successful usage, particularly in the audio engineering domain,
Chapter 2. Background and Literature Review 46
although usage in other domains is lacking, perhaps due to OpenMusic being advertised
as a domain-specific language for computer-aided music composition in more recent
years, even though it is technically not restricted to this domain.
Programming Without Coding Technology (PWCT)
PWCT (Fayed, Al-Qurishi, Alamri, Hossain & Al-Daraiseh, 2020) is a visual program-
ming tool that does not have a graph-based or diagrammatic approach to programming.
Instead, PWCT focuses on the visualisation of code blocks as pseudocode, in a structure
that they describe as a “Steps Tree”, which mirrors the nested structure seen in regular
textual programming languages.
PWCT contains compilers for various popular languages like C, C#, and python, and
the programming language used is hidden from the user, so they can focus on language-
independent syntax. This is still somewhat of a textual programming language, although
abstracted one level higher from common programming languages.
PWCT appears to be the most widely-used tool examined so far, reaching over
240,000 downloads on SourceForge.
Summary
Of these four tools, Visula and OpenMusic improve visualisation by being graph-based,
and Envision and PWCT do so by still supporting hierarchical encapsulation of code
blocks, but replacing fragments within with more easily readable highlighted visual
glyphs and simplifications into pseudocode. We find Visula to be the least promising
because we could find no concrete usage of it outside of one paper published 14 years
ago. Envision and PWCT do not have strong inherent support for visualising code
as diagrams, so we do not see them as having strong support for ALA applications.
OpenMusic, while the most promising from a visualisation standpoint, only has support
Chapter 2. Background and Literature Review 47
for simple data and event flow paradigms, and does not appear to have support for
extensions in languages other than Lisp.
2.3.3 Can UML Support ALA?
ALA diagrams typically aim to store all the information necessary for the developer to
understand the corresponding compositions of requirements in the application (Spray,
2020). The arbitrary pieces of information missing from UML diagrams, and the need
to have multiple different types of UML diagrams to represent a single application,
contributed to this desire of having an ALA diagram be relatively all-encompassing, and
serve as a “single source of truth” for the application. With that being said, we can still
examine whether any UML diagrams are appropriate for modelling ALA applications.
An ALA diagram in code is typically represented by a set of abstraction instan-
tiations, and then by a set of WireTo calls between the instantiations. It should be
noted that while the usage of WireTo is extremely prevalent in ALA applications, it is
merely a convenient design pattern that has emerged, and is not a constraint of ALA
itself. An ALA application only needs to follow the constraints defined in Section 2.1.
As of the UML 2.0 standard, there are a variety of UML diagrams, typically
categorised as either structural or behavioural diagrams (Pilone & Pitman, 2005). UML
behavioural diagrams are not appropriate for representing structural ALA diagrams, so
we can focus our attention on the different types of structural UML diagrams.
Class Diagrams
Class diagrams aim to show the static relationships in a piece of software (Pilone &
Pitman, 2005). They display the software’s classes and what member variables and
method signatures they contain. They do not, however, show the implementation of
those methods. There are several different types of relationships between classes that

Chapter 2. Background and Literature Review 48
can be shown, represented by different types of arrow. For example, an arrow can be
added between two classes to show that one inherits from the other, or that one contains
an internal variable reference to an instance of the other.
While class diagrams are typically the most commonly used UML diagram, they can-
not be used to represent ALA diagrams, because class diagrams show static relationships
between classes, rather than runtime connections between objects.
Due to the layered dependencies in an ALA application, a class diagram of an ALA
application can be organised to show the different abstraction classes neatly grouped in
their own layers, with no arrows going between classes in the same layer.
Package Diagrams
Package diagrams provide a way of grouping together different classes and placing
them under a single scope (Pilone & Pitman, 2005). Package diagrams can also contain
other package diagrams, so they can be used to represent hierarchical containment
relationships for an application’s classes. They can be used to plan out the compilation
order of an application, or just understand the scope of an application.
The high abstraction level and the inability to show runtime instantiations of package
diagrams mean that they are not appropriate for representing ALA diagrams.
Deployment Diagrams
Deployment diagrams show the relationship between a software system and the hard-
ware required to execute it (Pilone & Pitman, 2005). They therefore show a physical
view of the system, and are useful for identifying hardware requirements and potential
points of failure.
Needless to say, deployment diagrams typically would not have any correlation with
ALA diagrams.
Chapter 2. Background and Literature Review 49
Object Diagrams
Object diagrams are similar to class diagrams, except they show instances of classes at a
particular point in time (Pilone & Pitman, 2005). They can therefore provide a runtime
view of the software system, which a class diagram cannot do. Object diagrams share
the same types of associations as class diagrams, and are often used to show examples
of a system based on an existing class diagram (Rumbaugh, Jacobson & Booch, 2004).
Given their ability to show instances at runtime, object diagrams do have some
correlation to ALA diagrams. However, they would need to be extended to show
WireTo relationships, as well as ports defined by interfaces.
Component Diagrams
Component diagrams provide a means of separating a software system into units
called components (Pilone & Pitman, 2005). Components are connected to each other
through ports, which are connected to socket or ball joints representing interfaces that
the component either provides (or implements), i.e. contains the functionality of the
interface, or requires (or accepts), i.e. contains a variable reference to another interface.
A software system is typically designed with components to enable substituting them
with different components that implement and require the same interfaces (Rumbaugh
et al., 2004). Component diagrams can show static structures like class diagrams, or
runtime structures like object diagrams.
Domain abstractions in ALA have a lot in common with components. They both
implement and accept interfaces, and can be easily swapped out with other abstractions
that implement and accept the same interfaces. Each port in an ALA diagram represents
a single interface implementation or requirement, so component diagrams for objects
appear to represent ALA diagrams rather well, so long as the interface connections
between sockets and balls can be represented as WireTo calls.

Chapter 2. Background and Literature Review 50
Composite Structure Diagrams
Composite structure diagrams show the internal structure of instances within classes at
runtime (Pilone & Pitman, 2005). Composite structure diagrams can be seen as a special
kind of component diagram that resides inside a class. They share many similarities
with component diagrams, and can use the same ball and socket notation to represent
interface communication between the different parts in the diagram.
Given that the corresponding code of an ALA diagram typically resides in a class,
such as an Application class, composite structure diagrams, in a similar manner
to component diagrams, could be used to represent ALA diagrams. Like component
diagrams, the connections between the parts in the composite structure diagram need
to represent WireTo calls. These connectors can be instances of classes (Pilone &
Pitman, 2005), so it could be possible to create a Wire class that simply calls WireTo
on its given operands, and have the connectors in the diagram represent Wire instances.
Summary
It appears that object diagrams, component diagrams, and composite structure diagrams
can each be correlated with ALA diagrams, the latter two in particular. Since UML
typically does not enforce strict distinctions between structural diagrams (Rumbaugh et
al., 2004), composite structure diagrams can be seen as a class-encapsulated combination
of object and component diagrams, and both component and composite structure
diagrams may be able to represent ALA diagrams, so long as the connections between
instances in those diagrams can be represented as WireTo calls.
If we were to use a UML modelling tool, then we would require one that supports
both forward and reverse engineering to/from UML component or composite structure
diagrams.

Chapter 2. Background and Literature Review 51
2.3.4 UML-Dependent Tools
We found that 34 of the 38 tools found support UML in some way, however of the 34,
only 17 were found to support the visualisation of component or composite structure
diagrams. All 34 tools support code generation from either simple class diagrams,
state machines, sequence diagrams, or activity diagrams. As mentioned previously,
behavioural diagrams are not of interest for us, so the tools that can only generate
code from state machines, sequence diagrams, or activity diagrams are not of particular
interest. Only tools that could generate code from component or composite structure
diagrams would be relevant, so long as they can also generate the connections as wiring
in the code.
Overview of Forward and Reverse Code Engineering
The act of forward engineering code is the process of generating code from a model,
while the act of reverse engineering code is the process of generating a model from
code (Sendall & Küster, 2004). The 17 tools that have some visualisation support for
component and composite structure diagrams have been examined and an overview of
their capabilities to generate and reverse-engineer code is given as follows:
• Visual Paradigm, SoftwareIdeas, MagicDraw, StarUML, Power Designer,
BOUML, Enterprise Architect, Rational Rhapsody, UMLStudio, Umbrello,
GenMyModel, Altova UModel, Astah, xtUML: These tools have strong sup-
port for the UML 2.0 standard, and are able to visualise UML diagrams and
generate the corresponding code for some of them. While it is fairly simple to use
them to generate class file templates from class diagrams, generating code from
more complicated diagrams such as component or composite structure diagrams
requires the user to write their own code generation templates. Their support
for reverse engineering for structural diagrams is similarly limited to importing

Chapter 2. Background and Literature Review 52
classes into class diagrams, and none of them explicitly support the generation of
component or composite structure diagrams from code.
• Papyrus: Generates an intermediate XML schema representative of component
and composite structure diagrams and their relations. This would then need a
secondary parser to generate the relevant code (Backman, 2018). Papyrus supports
reverse engineering the models back into diagrams from the intermediate textual
format.
• Umple: Code generation and reverse engineering to/from a component or com-
posite structure diagram is supported, but generates a significant amount of
boilerplate code. Relations between instances can be defined, and their generation
can even be placed within the constructor. However, Umple models must be
generated and defined through the textual Umple modelling language. These
models cannot be instead modified through the diagram.
• MetaEdit+: This is what is known as a "meta-CASE" tool, i.e. a tool that can be
configured to produce other modelling tools (Ebert, Süttenbach & Uhe, 1997).
Instead of providing out of the box functionality, it requires the user to write
their own code generator and parser first. After that, the desired style of diagram
can be created. Given sufficient user specification, it can generate and reverse
engineer component and composite structure diagrams.
In summary, these 17 UML tools lack comprehensive support for generating code
from component and composite structure diagrams, and even less support for generating
the diagrams from code.
Chapter 2. Background and Literature Review 53
2.3.5 Finding the Gap in the Literature
Combining what has been learned from the previous sections, the final set of candidates
in this SLR will be evaluated together based on the following core functionalities, which
are simplifications of the functional requirements that have been addressed in Section
3.3:
F1 The tool can visualise ALA-style diagrams.
F2 The tool can generate executable code representative of ALA-style diagrams.
F3 The tool can generate ALA-style diagrams from their corresponding executable
code.
F4 The tool can easily synchronise an ALA-style diagram with its corresponding
code, for example in a single button press. This should not take multiple steps.
F5 The tool can easily view the source code for units in its diagrams.
Items F1 - F5 can be considered to be the fundamental features required to solve
our core research problem of improving the process of developing ALA applications.
F1 represents a feature that has always existed for ALA-based development and is
extremely important for comprehending an ALA application. F2, F3, and F4 represent
features that we wish to introduce to ALA application development, and we expect these
to have a significant impact, and F5 is part of the general idea that an ALA diagram
should be the single source of truth (Spray, 2020), i.e. the diagrams should be what
developers look to first when trying to understand an ALA application.
It can be seen from Fig. 2.5 that none of the tools found through the SLR meet all
of these requirements, whereas our proposed tool, GALADE, would. Several tools do
not meet any of the requirements - these are mainly proof-of-concept tools that are not
comprehensive.
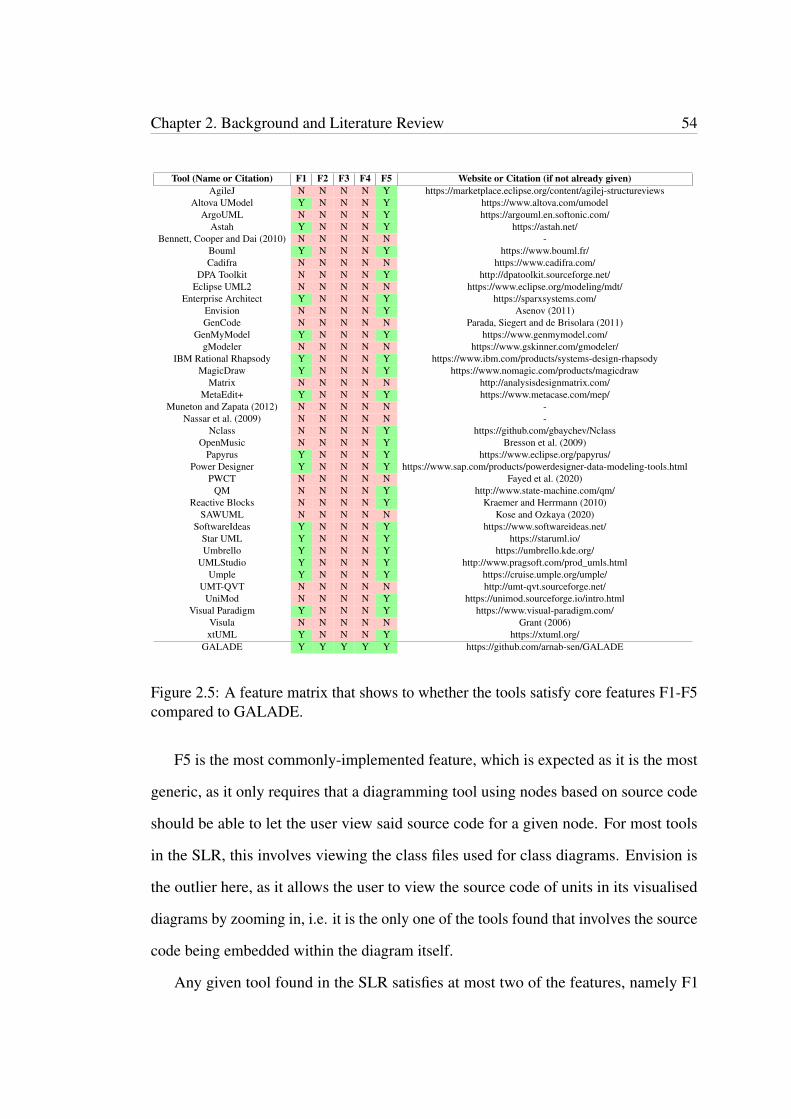
Chapter 2. Background and Literature Review 54
Tool (Name or Citation) F1 F2 F3 F4 F5 Website or Citation (if not already given)AgileJ N N N N Y https://marketplace.eclipse.org/content/agilej-structureviews
Altova UModel Y N N N Y https://www.altova.com/umodelArgoUML N N N N Y https://argouml.en.softonic.com/
Astah Y N N N Y https://astah.net/Bennett, Cooper and Dai (2010) N N N N N -
Bouml Y N N N Y https://www.bouml.fr/Cadifra N N N N N https://www.cadifra.com/
DPA Toolkit N N N N Y http://dpatoolkit.sourceforge.net/Eclipse UML2 N N N N N https://www.eclipse.org/modeling/mdt/
Enterprise Architect Y N N N Y https://sparxsystems.com/Envision N N N N Y Asenov (2011)GenCode N N N N N Parada, Siegert and de Brisolara (2011)
GenMyModel Y N N N Y https://www.genmymodel.com/gModeler N N N N N https://www.gskinner.com/gmodeler/
IBM Rational Rhapsody Y N N N Y https://www.ibm.com/products/systems-design-rhapsodyMagicDraw Y N N N Y https://www.nomagic.com/products/magicdraw
Matrix N N N N N http://analysisdesignmatrix.com/MetaEdit+ Y N N N Y https://www.metacase.com/mep/
Muneton and Zapata (2012) N N N N N -Nassar et al. (2009) N N N N N -
Nclass N N N N Y https://github.com/gbaychev/NclassOpenMusic N N N N Y Bresson et al. (2009)
Papyrus Y N N N Y https://www.eclipse.org/papyrus/Power Designer Y N N N Y https://www.sap.com/products/powerdesigner-data-modeling-tools.html
PWCT N N N N N Fayed et al. (2020)QM N N N N Y http://www.state-machine.com/qm/
Reactive Blocks N N N N Y Kraemer and Herrmann (2010)SAWUML N N N N N Kose and Ozkaya (2020)
SoftwareIdeas Y N N N Y https://www.softwareideas.net/Star UML Y N N N Y https://staruml.io/Umbrello Y N N N Y https://umbrello.kde.org/
UMLStudio Y N N N Y http://www.pragsoft.com/prod_umls.htmlUmple Y N N N Y https://cruise.umple.org/umple/
UMT-QVT N N N N N http://umt-qvt.sourceforge.net/UniMod N N N N Y https://unimod.sourceforge.io/intro.html
Visual Paradigm Y N N N Y https://www.visual-paradigm.com/Visula N N N N N Grant (2006)xtUML Y N N N Y https://xtuml.org/
GALADE Y Y Y Y Y https://github.com/arnab-sen/GALADE
Figure 2.5: A feature matrix that shows to whether the tools satisfy core features F1-F5compared to GALADE.
F5 is the most commonly-implemented feature, which is expected as it is the most
generic, as it only requires that a diagramming tool using nodes based on source code
should be able to let the user view said source code for a given node. For most tools
in the SLR, this involves viewing the class files used for class diagrams. Envision is
the outlier here, as it allows the user to view the source code of units in its visualised
diagrams by zooming in, i.e. it is the only one of the tools found that involves the source
code being embedded within the diagram itself.
Any given tool found in the SLR satisfies at most two of the features, namely F1

Chapter 2. Background and Literature Review 55
and F5. F1 has only been found to be satisfied by UML-based tools that can visualise
component or composite structure diagrams.
F2 is probably the most important feature, as it enables an ALA’s application code
to be automatically updated to match the diagram. Interestingly, none of the tools found
are able to satisfy this feature. At most, some tools that satisfy F1 are able to produce
either an intermediate textual representation of a component or composite structure
diagram, like an XML file, or they can produce code for the class files involved, but not
for the relationships between instances of classes. As mentioned previously, the only
way to implement this type of functionality for many of the tools is to write custom
code generators or plugins that handle this, but that functionality would still remain
outside of the tool itself.
F3 is notably more difficult to implement than F2, so it is of no surprise that the
tools that do not satisfy F2 do not satisfy F3 either. The difficulty stems from the notion
that requiring a parser to read and comprehend source code is more difficult to create
than an exporter that simply applies a one-to-one mapping from units in the model of a
diagram to units of code.
Similarly, F4 is not expected to be satisfied if neither F2 nor F3 are satisfied, since it
is dependent on both F2 and F3 being implemented. With that being said, being able
to synchronise in either direction without much hassle is still a fundamentally import-
ant feature to ensure that development can happen smoothly and reduce unnecessary
overhead.
In conclusion, based on the findings from the systematic literature review that we
conducted, we could not find any tools that satisfy all of our fundamental functional
requirements. In particular, we could not find a tool that can reasonably satisfy a com-
bination of visualising an ALA-style diagram, generating executable code representative
of that diagram, and generating a diagram from existing executable ALA code. We
therefore contend that a significant gap in the literature and related works exists, which

Chapter 2. Background and Literature Review 56
our proposed tool seeks to fill.
2.4 Answering Research Questions
As defined in Section 2.2.1, this systematic literature review was conducted to answer
two key research questions, RQ1 and RQ2.
2.4.1 Answering RQ1
We defined RQ1 as “What are the current trends in general-purpose software generation
tools that are based on visual models?”
We found that the majority of such tools exist as commercial tools rather than in
literature, and they mainly comprised of UML modelling tools. Since UML is such a
widely-used method of modelling software, it makes sense that those seeking to develop
commercially-viable tools would design them to support what is already popular, rather
than reinvent the wheel. The majority of these tools thus support the visualisation of
diagrams in the UML 2.0 standard, and support the workflow of designing an application
using a variety of these diagrams, then providing support for generating template class
files, and leaving the remainder of the implementation up to the developer. Class
diagrams are the most widely supported UML diagram type, and is the main source for
code generation.
In the literature, we found tools such as Envision (Asenov, 2011) and PWCT (Fayed
et al., 2020), which truly try to innovate and provide a new way of viewing software
design, under the assumption that the software development process has, over time,
iterated and improved upon text-based methods. However, such innovation comes at a
cost: Envision, even after being in development for nearly a decade, is still not ready
for widespread use, in that it is still lacking complete implementation. It would take
even longer still to become widely adopted in general.

Chapter 2. Background and Literature Review 57
2.4.2 Answering RQ2
We defined RQ2 as “To what extent are the tools found in RQ1 able to support ALA-
based software development?”
We first examined the four tools found for RQ1 that were not reliant on UML,
and found that none of them were suitable for ALA-based development. First, ALA
diagrams are graph-based, so tools like Envision and PWCT, that do not visualise code
using graph-based diagrams, are unsuitable from the start. Secondly, ALA diagrams
represent polyglot patterns, i.e. the programming paradigms used (represented by ports),
are not inherently restricted in their design scope. While we already have implemented
programming paradigms to support sequential data and event flow paradigms, based on
the ALA application, programming paradigms could be designed to support potentially
any other type of design pattern. A tool that is capable of supporting ALA-based
development must then be able to represent a variety of design patterns and program-
ming paradigms in their visualised diagram. We found that Visula (Grant, 2006) and
OpenMusic (Bresson et al., 2009) are only able to support basic data and event flow
paradigms, so we do not see them as being able to handle more complicated ALA
applications.
Since the remaining tools are all based on UML, we explored the support that UML
diagrams could have for ALA, and whether any UML diagram could be representative
of an ALA diagram. Since ALA diagrams represent the structure of an ALA application
and not its runtime behaviour, we did not look into behavioural UML diagrams, and
instead focused on the structural UML diagrams included in the UML 2.0 standard.
We found that component and composite structure diagrams are both suitable for
representing ALA diagrams as they are inherently graph-based, are able to show runtime
instantiations of domain abstractions as objects, support nodes having multiple ports,
and are able to show port connections through any kind of interface, i.e. do not

Chapter 2. Background and Literature Review 58
pose programming paradigm restrictions, enabling the visualisation of polyglot ALA
diagrams.
We then examined the remaining tools, and found that half of them (17/34) do not
support the visualisation of component or composite structure diagrams. These tools
are considered to be unsuitable for ALA-based development, because being able to
visualise an ALA diagram is the primary step in ALA design process (Spray & Sinha,
2018).
The remaining tools were then explored, and it was found that none of them are ac-
tually inherently able to generate ALA-style wiring code from component or composite
structure diagrams. While being able to visualise these diagrams, their code generation
support for structural diagrams appeared to be limited to simply generating templates
for classes.
We finalised our overview by organising all of the tools in a feature comparison
matrix, and indicated which of the core features F1-F5 were supported by each tool,
which led us to conclude that a significant gap in the literature does exist, and that the
maximum extent of support for ALA-based development that the found tools have is
for visualising ALA diagrams, but not for generating the code, let alone synchronising
between ALA diagrams and their corresponding application code.
2.5 Limitations and Threats to Validity
While we have tried to ensure that this systematic literature review has been conducted
in a fair and rigorous manner, there are still some sources of limitations and bias that
may have affected the quality of our results.

Chapter 2. Background and Literature Review 59
Keyword Coverage
Given that we had limited resources, both in terms of time and personnel, we could not
examine every piece of relevant literature that may exist as some form of publication.
In our pilot search, we found over 300,000 potential publications that could have some
relevance to our research topic. Given that we had to narrow this down by including
“general purpose” as keywords, we may have missed out on some tools that are still
general-purpose to the extent that is relevant for ALA-based development, but did not
advertise themselves as such in their respective publications.
Additionally, it may have been the case that our keywords were not sufficiently
descriptive. We tried to mitigate this by providing synonyms and alternative spellings
for our keywords. We also tried to incorporate as many different relevant keywords
as possible, but at a certain point this casts too wide of a net. For example, we considered
adding OR (“model-driven” AND (engineering OR architecture))
at the end of our search string, since software engineering using model-driven archi-
tectures is popular in industry and there are likely many general-purpose model-driven
engineering tools that exist, but this alone returned over 7,000 additional results. It is
therefore a tough balancing act to ensure that we are both getting sufficient coverage
from our search string keywords, while also not being so descriptive that we get too
many results.
Reviewer Bias
We only had the resources for one researcher to apply the inclusion and exclusion
criteria to all of the found results, which may have led to bias from that researcher when
it is a subjective decision for whether a study should be accepted or rejected by the
criteria. We tried to mitigate this bias by making the inclusion and exclusion criteria
as objective as possible. For example, criterion EC3 serves to remove domain-specific

Chapter 2. Background and Literature Review 60
studies, but domains can vary in specificity. To make it more objective, we mention
the specific subset of domain types that the found tools are allowed to be specific to.
However, criterion IC2 describes perhaps the most important final criterion that a study
needs to meet to be included in the final candidate set. It mentions that relevant studies
should “comprehensively” describe general-purpose tools, but this term is relatively
subjective. We tried to mitigate the effect of this by applying this criterion liberally. We
ended up with a sufficiently-sized final set of 38 tools, so we do not think that we were
overly liberal with this criterion’s application.
Bias From Language and Time Period Exclusion
We elected to only accept results in English, as represented by EC1. We did not have
the time to properly translate any studies that were not in English, so it is possible that
some results that were not in English described tools relevant to what we were looking
for, so this is also a potential source of bias.
We also configured the search to only return results between January 2000 to
December 2020, inclusive. It is possible that relevant tools were developed before 2000,
but we considered it unlikely. Regardless, this is another potential source of bias.
Bias Introduced by Services
Our search string returned 3,300 results in AUT’s aggregate academic database. While
it is possible to view results individually, to save time, we used the database’s export
service to save the data of the results locally. However when doing so, AUT only
exported 2,699 results. While it is likely that these “missing” 601 results were really
just invalid results or duplicates, it is possible that some relevant studies were lost due
to an error on the database’s end, so this is another source of potential bias.
Given the large number of results, it was necessary to use a reference manager to
help track progress and keep all relevant documents organised. We chose Mendeley
Chapter 2. Background and Literature Review 61
due to our existing familiarity with the software. When importing the results that were
exported from the AUT database, Mendeley automatically removed 559 entries using
its automatic duplicate detection. It is possible that Mendeley unintentionally removed
results that it thought were duplicates but were really not, so this is a potential source of
bias.
Since we used the AUT aggregate academic database, which incorporates all major
academic databases, it is possible that we retrieved results from databases unrelated to
computer science or software engineering. This is mitigated by the fact that the search
string is specific to terms in computer science and software engineering academia,
nonetheless this is another potential source of bias, and may have contributed to us
being more specific in our search string formation than we needed to be to retrieve a
reasonable number of results.
2.6 Conclusion
Through a rigorous systematic literature review process, we found a set of 38 tools
that are representative of the current state-of-the-art for general-purpose tools that
can generate code based on visual models. We found that the majority of them use
UML diagrams, so we explored different types of UML diagrams and found that two
types, component and composite structure diagrams, are suitable for representing ALA
diagrams. However, we also found that of the 38 tools, none are satisfactory in terms of
being able to support ALA code generation. With that, in combination with a few other
core features lacking support, we reasoned that there exists a significant gap in the field
that our proposed tool, GALADE, can help fill.
Chapter 3
Methodology
This chapter discusses the research approach and strategy that we implemented to
develop GALADE. Section 3.1 discusses the range of research methodologies that we
explored, and how we decided on a design science approach. Section 3.2 defines our
core research problems. Section 3.3 details the requirements imposed on GALADE.
Section 3.4 describes the design and development process for GALADE from a research
point of view. Sections 3.5 and 3.6 briefly describe how a use case for demonstrating
GALADE, and a formal evaluation for GALADE, should be defined, respectively.
Section 3.5 is further discussed in Chapter 5, and Section 3.6 is elaborated on in Chapter
6.
3.1 Choosing a Research Strategy
A research methodology or research strategy is described as a means of systematically
producing a solution to a given research problem (Kothari, 2004), so it is important to
clearly establish the chosen research plan and methodology before diving deep into the
research itself. However, selecting an appropriate research methodology for software
engineering research can often be a difficult task. Researchers may look to existing
62

Chapter 3. Methodology 63
literature to find studies that solve research problems similar to their own, only to find
that many studies do not describe their chosen methodologies in depth (Walker, 1997).
This can lead to both the valid alternatives to a given methodology, as well as the core
purposes of such methodologies, being frequently misunderstood (Easterbrook, Singer,
Storey & Damian, 2008).
By examining the literature, we have found and considered the following six research
methodologies for our research plan:
• Experiments: According to Johannesson and Perjons (2014), an experiment in-
volves an investigation to prove or disprove a testable hypothesis, and is designed
to determine whether a cause directly results in a particular effect. In particular,
this is done by observing whether controlled changes to a particular independ-
ent variable, representing the cause, has any effect on one or more dependent
variables, representing the effect. It is important to ensure that experiments are
conducted in controlled environments, in order to ensure that any changes in
dependent variables have not occurred due to variables other than the independ-
ent variables, as this would call into question the legitimacy of any measured
cause-effect relationship (Easterbrook et al., 2008).
• Surveys: Being highly effective at providing wide population coverage in terms
of collecting data, surveys involve producing a small and well-defined set of
questions and distributing them to large numbers of individuals (Johannesson &
Perjons, 2014). The primary purpose of survey research is to gather data from
a representative sample, from which generalisations can be extrapolated and
applied to a wider population (Easterbrook et al., 2008).
• Case Studies: As explained by Johannesson and Perjons (2014), a case study
involves investigating one instance of a phenomenon in order to produce a deep
and rich insight. Compared to surveys, case studies favour depth over breadth,
Chapter 3. Methodology 64
and compared to experiments, case studies favour the investigation of a variety
of factors in a real-world scenario, over observing changes in tightly controlled
variables in an artificial environment.
• Ethnography: An ethnography is a research methodology that involves the
observation of a community of individuals in their own environment (Johannesson
& Perjons, 2014). This can be useful to determine how certain cultures produce
communication strategies, as well as observe various phenomenon from the point
of view of members in these cultures (Easterbrook et al., 2008). In relation to
software engineering research, an ethnography can be in the form of a field study
in an industry setting, such as to observe how software engineers adopt certain
tools or techniques.
• Action Research: Easterbrook et al. (2008) state that action research involves
trying to solve an existing real-world problem, while also recording and analysing
the process of solving that problem. They go on to explain that in comparison
to research methods that involve observing real-world phenomena, such as case
studies and ethnographies, action research involves intervening in the real-world
scenario, and implementing potential solutions to view their impact.
• Design Science: As defined by Johannesson and Perjons (2014), design science
is a research strategy that involves the study and creation of artefacts, which
is a general term for instances that are created with the aim of solving real-
world problems. They go on to state that any artefacts produced must also solve
problems of interest to a general population. In relation to software engineering
research, design science involves creating and evaluating such artefacts to solve
organisational problems (Hevner, March, Park & Ram, 2004).
By exploring the aforementioned research strategies, we found that design science

Chapter 3. Methodology 65
most closely resembles our research intent: to produce and evaluate a software artefact
that addresses an organisational problem. Using a design science approach allowed
us to systematically break down our software development approach, from eliciting
requirements, to producing an application, to evaluating to the extent to which it satisfied
the requirements. We found that none of the other research strategies considered could
holistically satisfy our research goals as closely. On their own, experiments, surveys,
case studies, and ethnographies do not focus on the creation of a product. Additionally,
while action research does involve implementing a novel solution in a real-world
environment, like we want, it is more appropriate for evaluating changing organisational
practices, potentially through the adoption of software artefacts, rather than creating
software artefacts themselves (Easterbrook et al., 2008).
Additionally, we found that we could adapt experiments and a case study as part of
the evaluation part of the design science approach. In particular, Chapter 5 explores a
case study on our produced artefact in an industry setting, and Chapter 6 incorporates
quantitative experiments to measure whether our produced artefact performs better than
existing tools.
Following our decision to use a design science approach, the remainder of this
chapter is concerned with following the structure for describing design science problems
discussed by Johannesson and Perjons (2014). They describe the design science process
as follows:
1. Explicate Problem: Define the problem at hand in an appropriate scope.
2. Define Requirements: Define what needs to be done to solve the problem.
3. Design and Develop Artefact: Actually produce the solution.
4. Demonstrate Artefact: Provide a proof-of-concept that shows that the produced
artefact can indeed solve the defined problem.
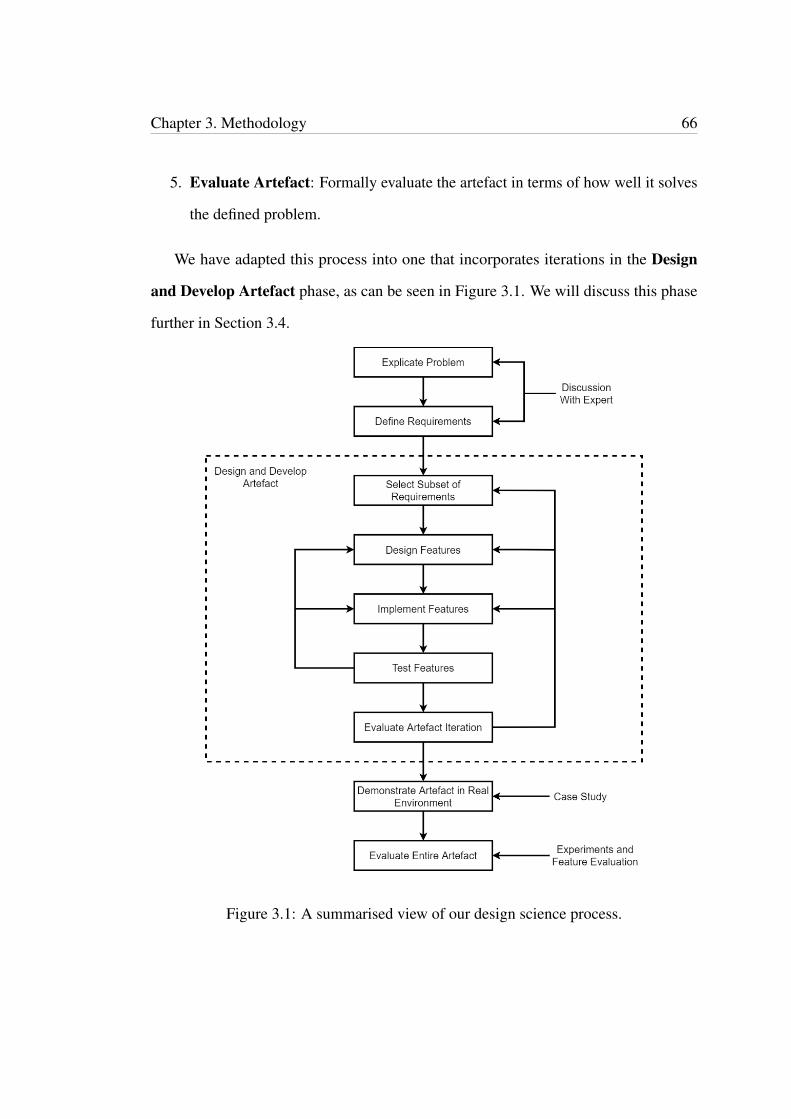
Chapter 3. Methodology 66
5. Evaluate Artefact: Formally evaluate the artefact in terms of how well it solves
the defined problem.
We have adapted this process into one that incorporates iterations in the Design
and Develop Artefact phase, as can be seen in Figure 3.1. We will discuss this phase
further in Section 3.4.
Figure 3.1: A summarised view of our design science process.
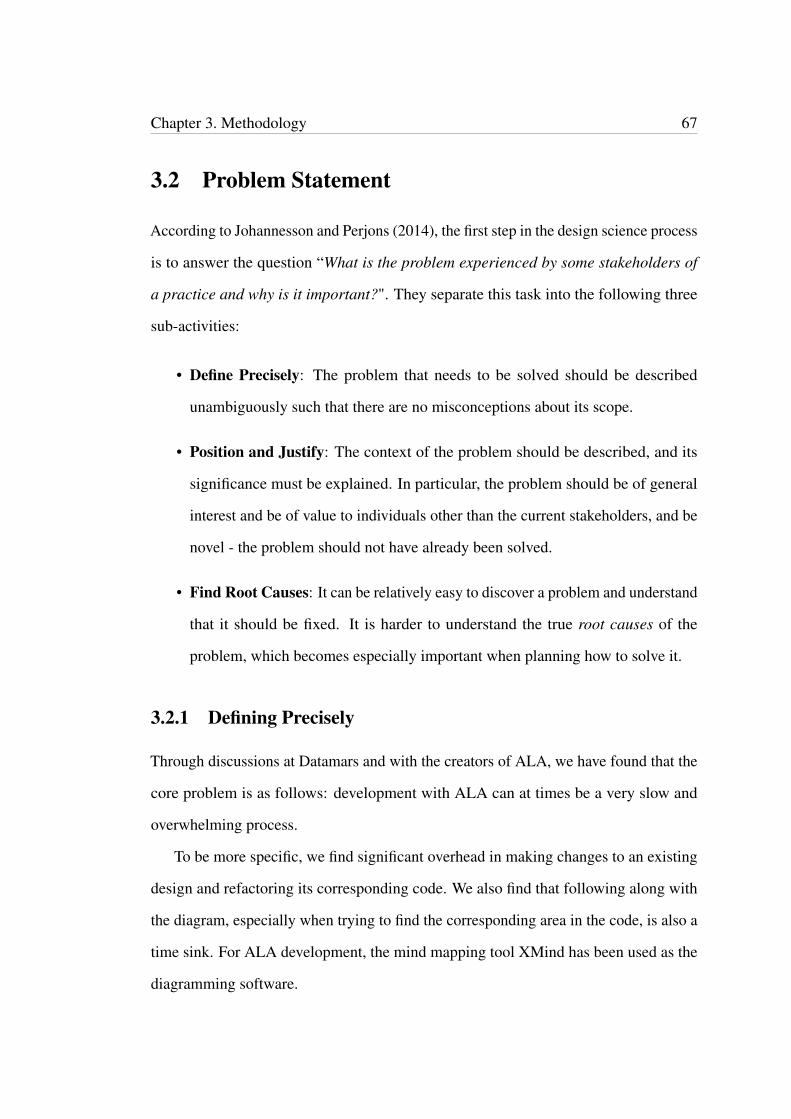
Chapter 3. Methodology 67
3.2 Problem Statement
According to Johannesson and Perjons (2014), the first step in the design science process
is to answer the question “What is the problem experienced by some stakeholders of
a practice and why is it important?". They separate this task into the following three
sub-activities:
• Define Precisely: The problem that needs to be solved should be described
unambiguously such that there are no misconceptions about its scope.
• Position and Justify: The context of the problem should be described, and its
significance must be explained. In particular, the problem should be of general
interest and be of value to individuals other than the current stakeholders, and be
novel - the problem should not have already been solved.
• Find Root Causes: It can be relatively easy to discover a problem and understand
that it should be fixed. It is harder to understand the true root causes of the
problem, which becomes especially important when planning how to solve it.
3.2.1 Defining Precisely
Through discussions at Datamars and with the creators of ALA, we have found that the
core problem is as follows: development with ALA can at times be a very slow and
overwhelming process.
To be more specific, we find significant overhead in making changes to an existing
design and refactoring its corresponding code. We also find that following along with
the diagram, especially when trying to find the corresponding area in the code, is also a
time sink. For ALA development, the mind mapping tool XMind has been used as the
diagramming software.

Chapter 3. Methodology 68
3.2.2 Position and Justify
Since ALA has the potential to be applied to a wide variety of domains (and is therefore
to some extent general-purpose) (Spray & Sinha, 2018), GALADE has the potential to
be general-purpose tool for ALA application development. GALADE is also positioned
to make the process of developing ALA applications easier, which in turn can help ALA
become more widely-accepted. We therefore think that the problem of the productivity
of ALA application development, which can be addressed by creating GALADE, is of
general interest to software engineering researchers and practitioners.
Through a systematic literature review detailed in Chapter 2, we established the gap
in the literature that our proposed tool will try to fill.
3.2.3 Find Root Causes
Through discussions at Datamars, brainstorming with the creators of the architecture
(Spray & Sinha, 2018), and reflecting on our own experience with developing software
using ALA, a root cause analysis was performed to find out what major hindrances
are affecting ALA application development. First, we developed the fishbone diagram
(Johannesson & Perjons, 2014) in Figure 3.2 to represent a high-level view of possible
root causes across four major categories. Then, we went through each of these possible
root causes, and determine what parts of them are most relevant to the solution of
introducing a new software tool. From these, we produced a set of addressable root
causes, RC1-7, defined further down below.
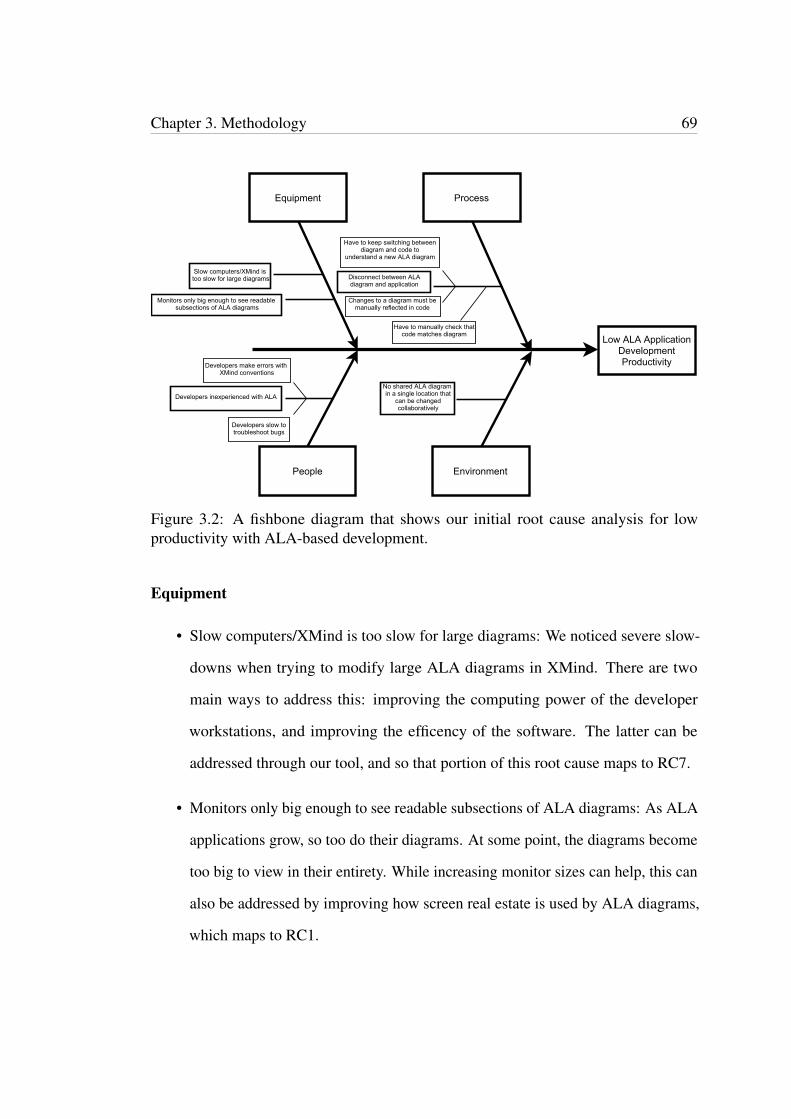
Chapter 3. Methodology 69
Low ALA ApplicationDevelopmentProductivity
Equipment
People
Slow computers/XMind is too slow for large diagrams
Monitors only big enough to see readable subsections of ALA diagrams
Developers inexperienced with ALA
Process
Environment
Have to manually check that code matches diagram
Changes to a diagram must be manually reflected in code
No shared ALA diagram in a single location that
can be changed collaboratively
Developers make errors with XMind conventions
Developers slow to troubleshoot bugs
Have to keep switching between diagram and code to
understand a new ALA diagram
Disconnect between ALA diagram and application
Figure 3.2: A fishbone diagram that shows our initial root cause analysis for lowproductivity with ALA-based development.
Equipment
• Slow computers/XMind is too slow for large diagrams: We noticed severe slow-
downs when trying to modify large ALA diagrams in XMind. There are two
main ways to address this: improving the computing power of the developer
workstations, and improving the efficency of the software. The latter can be
addressed through our tool, and so that portion of this root cause maps to RC7.
• Monitors only big enough to see readable subsections of ALA diagrams: As ALA
applications grow, so too do their diagrams. At some point, the diagrams become
too big to view in their entirety. While increasing monitor sizes can help, this can
also be addressed by improving how screen real estate is used by ALA diagrams,
which maps to RC1.
Chapter 3. Methodology 70
Process
• Disconnect between ALA diagram and application:
– Have to keep switching between diagram and code to understand a new
ALA diagram: This issue is mainly due to the documentation for individual
components of ALA diagrams being located in comments in the source
code, away from the diagram, so a developer’s attention is pulled away
from the diagram whenever they want to learn more about a particular
diagram component. This can be addressed by ensuring that the relevant
documentation for an ALA diagram’s components is accessible within the
diagram itself. This maps to RC3 and RC4.
– Changes to a diagram must be manually reflected in code: Having to make
the same change to both an ALA diagram and its corresponding code not
only creates extra work for the developer, but it also introduces a source of
human error. The implementation of XMindParser, as mentioned in Section
2.1.2, has shown a way of partially addressing this issue. This is one of the
major issues that needs addressing, and maps to three root causes: RC2,
RC3, and RC5.
– Have to manually check that code matches diagram: Similar to the previous
issue, this also introduces both extra work and an extra source of human
error. This maps to RC2 and RC5.
People
• Developers inexperienced with ALA:
– Developers make errors with XMind conventions: Since XMind itself
doesn’t know about ALA, specific conventions need to be enforced in
Chapter 3. Methodology 71
order for code generation, such as with XMindParser, to work. This issue
would be resolved if such conventions would be automatically enforced, so
this maps to RC5. Additionally, since ALA is so new, novel best practices
are also emerging, and may continue to emerge in the future, which is not
something that has been supported as of yet. This can be addressed by
introducing customisability and extendability to GALADE, so this issue
maps to RC6.
– Developers slow to troubleshoot bugs: This is a generic issue that does not
map to any of the refined set of root causes directly, however it is expected
to be addressed by the improved usability that GALADE may provide.
Environment
• No shared ALA diagram in a single location that can be changed collaboratively:
When a team is working on the same ALA application, they are also working
with the same main ALA diagram. However, there is no current way of merging
changes to a single ALA diagram from multiple developers. Developers have
to agree that only one person can make changes to the diagram at a time, and
that the most recent version must be updated. This issue could be addressed by
creating a method of merging diagrams together, and so this maps to RC2.
Our root cause analysis has led to the refined set of root causes RC1-7, as defined
below:
RC1 In the diagramming software used, the layout does not know that the diagram
should be a port graph, leading to inefficient space usage. Individual nodes require
too much space, which impacts the readability of the diagram.
RC2 The diagram and application code are two separate entities that require separate
Chapter 3. Methodology 72
maintenance. It can be hard to tell when the diagram and code are out of sync -
the only way to be sure is to manually check every node and wire.
RC3 It can be hard to read the diagram as it relates to the code, to locate where a
change needs to be made.
RC4 When viewing an ALA application diagram, it can be useful to have documenta-
tion readily available for the different abstractions used. However, documentation
for abstractions typically stay in the source files, as they are written by the de-
velopers. Moving documentation into the diagram itself would require manual
maintenance to ensure that it matches the information in the source file.
RC5 The diagramming software used has no specific knowledge about ALA. For
instance, changing properties of an abstraction’s source code, like a port name, is
not automatically reflected in the diagram.
RC6 The diagramming software cannot be easily extended to support features specific
to ALA.
RC7 The diagramming software used is slow to use for larger graphs.
As can be seen, some of these root causes refer to the inadequacy of the diagramming
software (XMind) itself. It is true that XMind has not been designed as a software
modelling tool, but instead as a general-purpose mind mapping tool, so it will be
important to investigate any alternatives that can do both diagramming and support
application development inherently, as is done in Chapter 2.
3.3 Requirements
According to Johannesson and Perjons (2014), the second step in the design science
process is to answer the question “What artefact can be a solution for the explicated
Chapter 3. Methodology 73
problem and which requirements on this artefact are important for the stakeholders?".
They separate this task into the following two sub-activities:
• Outline Artefact: The type of artefact to design must be chosen. For example, it
could be a method, a model, or an instantiation.
• Elicit Requirements: A set of requirements should be created that represent the
problem. They should be characteristics that satisfy the root causes described in
the Find Root Causes sub-activity.
3.3.1 Outline Artefact
It has been decided that a tool that supports both diagramming and code generation
would best solve the issues at hand. The arfect is thus an instantiation.
3.3.2 Elicit Requirements
The following requirements were elicited through discussions with the creators of ALA.
Most of the main requirements help to solve one of the root causes described in Section
3.2.3, while some additional optional requirements were also found, as “nice to have"
features:
Priority Requirements
PR1 The ability to to visualise wiring code as an automatically laid out port graph
ALA diagram (RC1).
PR2 The ability to convert an ALA diagram into its directly equivalent wiring code,
such that changes in the design can just be made once in the diagram, and
automatically be updated in the code (RC2, RC3, RC5).

Chapter 3. Methodology 74
PR3 The ability to provide a means of recovering the diagram from wiring code (RC2,
RC5).
PR4 The ability to support an ALA diagram being the main source of truth for the
requirements that it expresses (RC4).
PR5 The ability to be developed in such a way that facilitates developing and adding
new features to the tool itself (RC6).
PR6 The ability to not slow down significantly as the diagram size increases (RC7).
Optional Requirements
OR1 The ability to provide debugging support. This includes setting breakpoints and
viewing runtime information in the diagram view.
OR2 The ability to highlight subdiagrams as user stories.
OR3 The ability to be configurable for programming languages other than C# (RC6).
OR4 The ability to support rapid prototyping in an isolated environment.
OR5 The ability to create source files for new domain abstractions.
In Table 3.1, a mapping can be observed from these requirements to a subset of the
research questions defined in Section 1.3. PR2 and PR3 map directly to RQ5 and RQ6
respectively, while the other requirements are mapped more generically to RQ4.
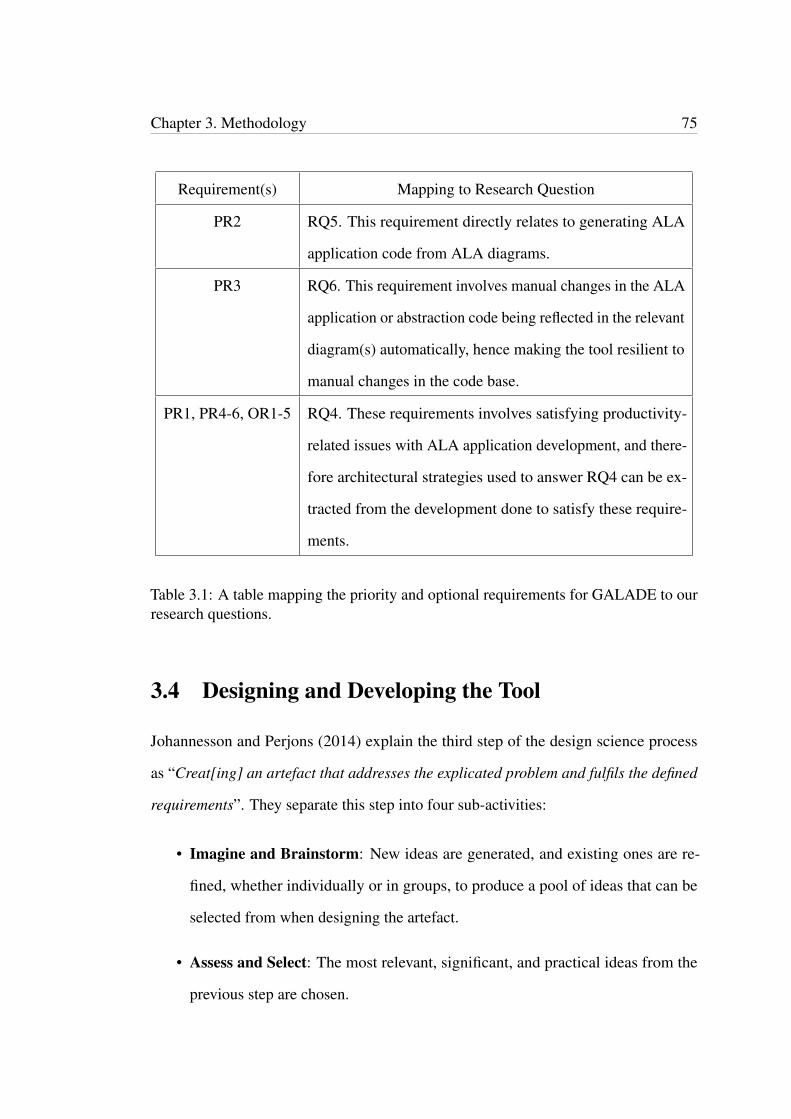
Chapter 3. Methodology 75
Requirement(s) Mapping to Research Question
PR2 RQ5. This requirement directly relates to generating ALA
application code from ALA diagrams.
PR3 RQ6. This requirement involves manual changes in the ALA
application or abstraction code being reflected in the relevant
diagram(s) automatically, hence making the tool resilient to
manual changes in the code base.
PR1, PR4-6, OR1-5 RQ4. These requirements involves satisfying productivity-
related issues with ALA application development, and there-
fore architectural strategies used to answer RQ4 can be ex-
tracted from the development done to satisfy these require-
ments.
Table 3.1: A table mapping the priority and optional requirements for GALADE to ourresearch questions.
3.4 Designing and Developing the Tool
Johannesson and Perjons (2014) explain the third step of the design science process
as “Creat[ing] an artefact that addresses the explicated problem and fulfils the defined
requirements”. They separate this step into four sub-activities:
• Imagine and Brainstorm: New ideas are generated, and existing ones are re-
fined, whether individually or in groups, to produce a pool of ideas that can be
selected from when designing the artefact.
• Assess and Select: The most relevant, significant, and practical ideas from the
previous step are chosen.

Chapter 3. Methodology 76
• Sketch and Build: A high-level view of the artefact and its core elements is
designed, and then that design is implemented.
• Justify and Reflect: The artefact developed in the previous step is examined and
evaluated, and any criticisms are fed back into the previous three steps.
We have adapted these sub-activities into an iterative process inspired by the Agile
framework (Cohen et al., 2004). The process can be seen in the “Design and Develop
Artefact" section in Figure 3.1. We have used the Scrum methodology (Schwaber, 1997),
separating iterations into monthly sprints, mapped to the above-mentioned sub-activities
as follows:
• Select Subset of Requirements: As per the Agile framework, only a select few
features should be developed in any given iteration. Therefore, this step involves
picking from the pool of defined requirements and selecting those that should be
implemented. The overall importance of a requirement and the extent to which
it depends on other features are the main factors in deciding which whether a
requirement should be chosen.
• Design Features: The dependencies and architectural constraints that relate to
the given features are established, and the ALA diagram related to these features
are drawn, including the invention of new abstractions where necessary. This
step maps directly to the Imagine and Brainstorm and Assess and Select sub-
activities, as well as the Sketch portion of the Sketch and Build sub-activity.
• Implement Features: The invented abstractions are implemented in the code,
and the application code is generated from the ALA diagram designed in the
previous step. This step maps directly to the Build portion of the Sketch and
Build sub-activity.
Chapter 3. Methodology 77
• Test Features: The implemented features are tested, and any issues found will
require either redesigning the features, such as when design or architectural-level
issues are found, or reimplementing the features, such as when bugs or instances
of unexpected behaviour in the code are found. This step involves testing the
functionality of the created abstractions, followed by testing the functionality of
a feature’s subdiagram, then finally the application is tested holistically with all
new components included, to ensure that the overall product works as intended.
This step is one of two steps that map to the Justify and Reflect sub-activity.
• Evaluate Artefact Iteration: This step occurs at the end of the monthly sprint,
and involves presenting the key stakeholder, i.e. the product owner of GALADE
at Datamars with the features implemented in the current sprint. This step
typically involves a demo showcasing the features, followed by a discussion with
the product owner regarding how well the implementation satisfies the selected
requirements. Any items of feedback received are then provided as inputs for the
previous steps and incorporated in the next sprint. This step, like the previous
step, maps to the Justify and Reflect sub-activity.
The results of this process are discussed in Chapter 4.
3.5 Demonstrating the Tool
Johannesson and Perjons (2014) consider the fourth step of the design science process
to revolve around answering the question “How can the developed artefact be used to
address the explicated problem in one case?”. They separate this step into the following
two sub-activities:
• Choose the Case: An appropriate and sufficiently complex scenario should be
chosen for the demonstration. This scenario should be representative of the core

Chapter 3. Methodology 78
problem(s) that this artefact seeks to resolve.
• Demonstrate the Artefact: The artefact should be used in the chosen case, and
the outcome should be documented. This demonstration can be seen as a proof of
concept for the artefact. It should be made clear the extent to which the artefact
has been used.
This section is discussed in detail in Chapter 5.
3.6 Evaluating the Tool
For the final step of the design science process, Johannesson and Perjons (2014) explain
that the following question needs to be answered: “How well does the artefact solve the
explicated problem and fulfil the defined requirements?”. They split this step into the
following three sub-activities:
• Analyse Evaluation Context: The context, in terms of scope and what resources
are available, is established.
• Select Evaluation Goals and Strategy: Based on the context described in the
previous sub-activity, the goals and strategy for the evaluation are selected, namely
whether the evaluation should be naturalistic, artifical, or a mix of both.
• Design and Carry Out: The necessary environments are set up, and the evalu-
ation is conducted.
This section is discussed in detail in Chapter 6.

Chapter 4
Design and Development
This chapter details the design and development process that we undertook to produce
GALADE. We go through the major design decisions that took place, as well as any
ALA-related pitfalls that we encountered and overcame.
Most ALA diagram screenshots that relay only ALA diagram design-specific inform-
ation have been taken in GALADE v1.13.0. Screenshots have been taken from different
versions of GALADE when version-specific information was relevant to show. Simil-
arly, screenshots have been taken from XMind 2020 (https://www.xmind.net/
xmind2020/) when we desired to convey information relevant to XMind.
Section 4.1 covers the background information necessary to be able to read diagrams
drawn in GALADE. Section 4.2 explains our development approach and what typical
iterations of GALADE would involve. Section 4.4 details the new additions that
we have made to ALA as a result of developing GALADE as an ALA application.
Section 4.3 describes the features that GALADE provides. In Section 4.5, we explain
our development timeline from the perspective of 12 iterations of GALADE. Finally,
Section 4.6 contains a summary of the key contributions from this chapter.
79
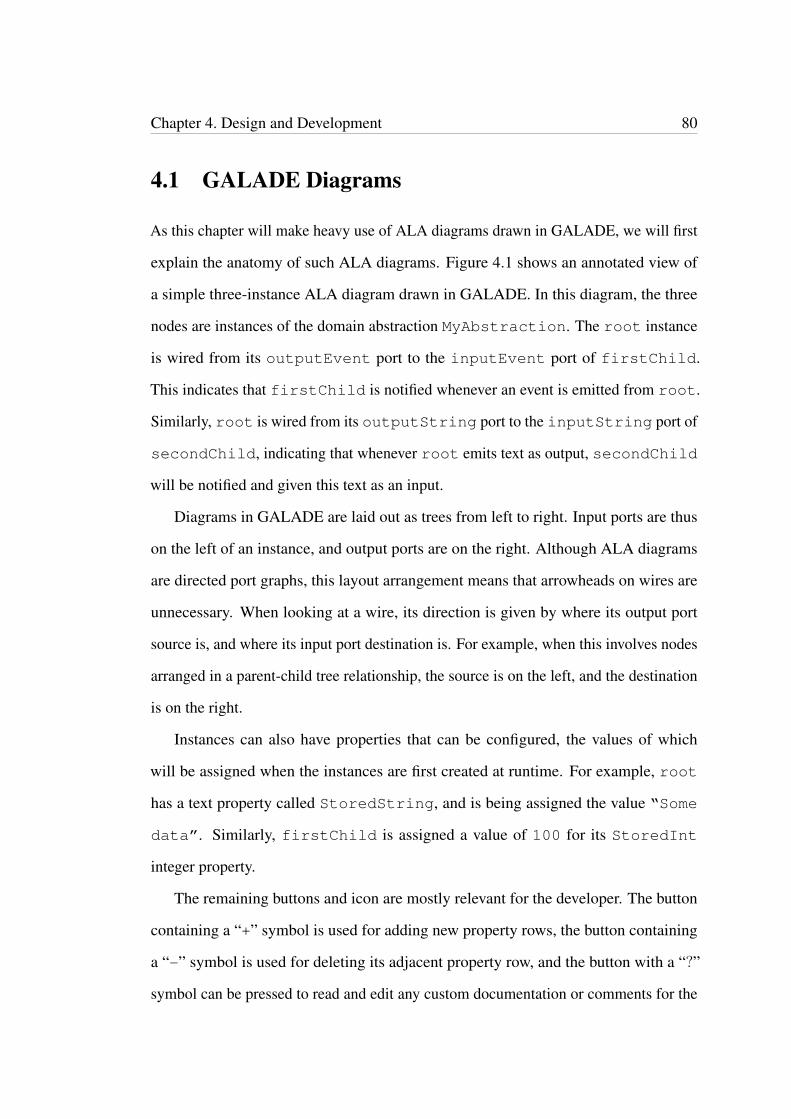
Chapter 4. Design and Development 80
4.1 GALADE Diagrams
As this chapter will make heavy use of ALA diagrams drawn in GALADE, we will first
explain the anatomy of such ALA diagrams. Figure 4.1 shows an annotated view of
a simple three-instance ALA diagram drawn in GALADE. In this diagram, the three
nodes are instances of the domain abstraction MyAbstraction. The root instance
is wired from its outputEvent port to the inputEvent port of firstChild.
This indicates that firstChild is notified whenever an event is emitted from root.
Similarly, root is wired from its outputString port to the inputString port of
secondChild, indicating that whenever root emits text as output, secondChild
will be notified and given this text as an input.
Diagrams in GALADE are laid out as trees from left to right. Input ports are thus
on the left of an instance, and output ports are on the right. Although ALA diagrams
are directed port graphs, this layout arrangement means that arrowheads on wires are
unnecessary. When looking at a wire, its direction is given by where its output port
source is, and where its input port destination is. For example, when this involves nodes
arranged in a parent-child tree relationship, the source is on the left, and the destination
is on the right.
Instances can also have properties that can be configured, the values of which
will be assigned when the instances are first created at runtime. For example, root
has a text property called StoredString, and is being assigned the value “Some
data”. Similarly, firstChild is assigned a value of 100 for its StoredInt
integer property.
The remaining buttons and icon are mostly relevant for the developer. The button
containing a “+” symbol is used for adding new property rows, the button containing
a “−” symbol is used for deleting its adjacent property row, and the button with a “?”
symbol can be pressed to read and edit any custom documentation or comments for the

Chapter 4. Design and Development 81
corresponding instance that should be stored in the diagram. This feature is explained
in Section 4.3.3, and an example is shown in Figure 4.10. Each node also contains a
circle icon, which will be red if that instance contains an active breakpoint, and grey
otherwise. This breakpoint functionality is discussed later in Section 4.4.5.
Figure 4.1: An annotated view of a generic ALA diagram drawn in GALADE.
4.2 Development Methodology
We used the well-known Agile methodology to develop GALADE in a timely manner.
The Agile method was created to address the need for a development method that
would be able to accommodate changing requirements and help maintain a consistent
level of productivity in development teams (Cohen et al., 2004). Specifically, we
chose to implement the SCRUM methodology (Schwaber, 1997), which separates the
development process into regular sprints, in which a specific set of tasks are to be
undertaken. Sprints involved regular 30-minute stand up meetings, which are meetings
where the developers in a team briefly discuss their current tasks and any obstacles that
they are facing. Prior to a sprint, the development team decides on which tasks should
be prioritised, and this process repeats once the sprint finishes. Sprints are typically
month-long, and that is what we used as well.

Chapter 4. Design and Development 82
We also used XMind and XMindParser to develop GALADE until we felt that
GALADE was ready to be used as our primary tool, after which GALADE would
become self-generating, i.e. we would be able to use GALADE to develop itself. This
would also require a transition period where our XMind diagram would be converted
such that it could be visualised in GALADE.
A summarised view of the design and development process can be seen in Figure
4.2, and has been described in Section 3.4. This process is further discussed in our
development timeline in Section 4.5.
Figure 4.2: A summary of the Agile design and development process for GALADE.
4.3 Features
This subsection details GALADE’s most prominent features. Of particular importance
is GALADE’s round-trip functionality, as this directly relates to some of our research
questions defined in Section 1.3: GALADE’s ability to generate ALA application code
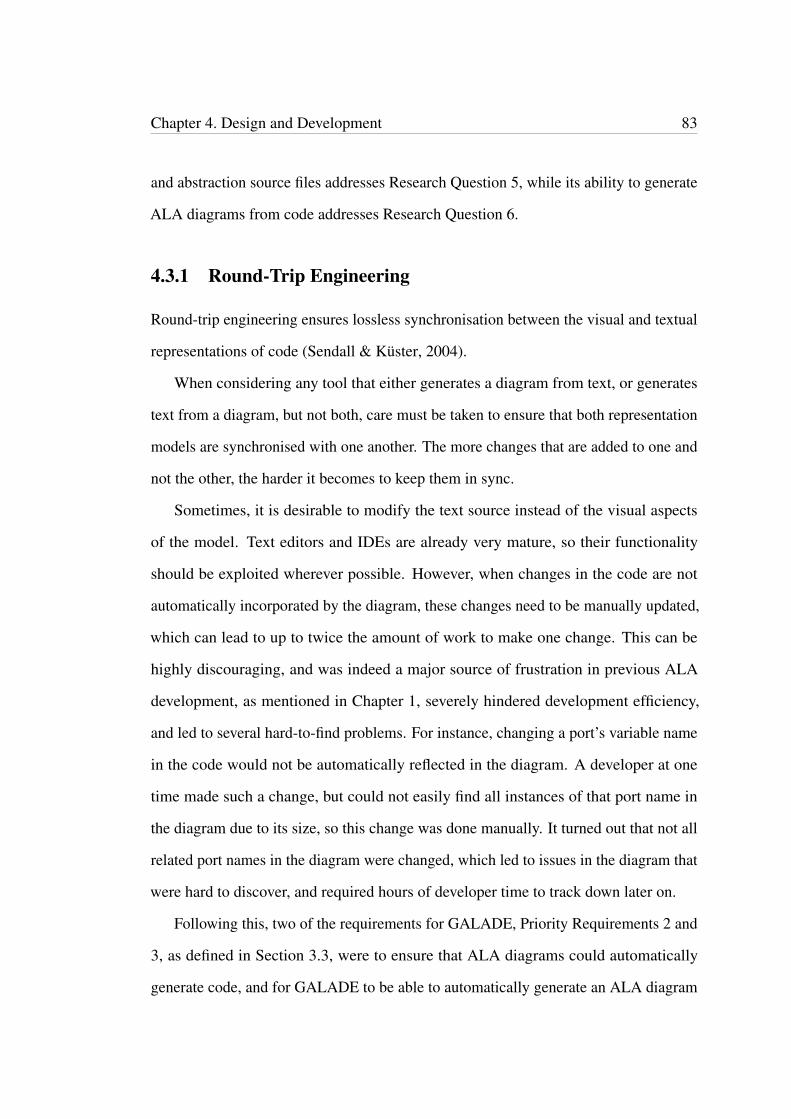
Chapter 4. Design and Development 83
and abstraction source files addresses Research Question 5, while its ability to generate
ALA diagrams from code addresses Research Question 6.
4.3.1 Round-Trip Engineering
Round-trip engineering ensures lossless synchronisation between the visual and textual
representations of code (Sendall & Küster, 2004).
When considering any tool that either generates a diagram from text, or generates
text from a diagram, but not both, care must be taken to ensure that both representation
models are synchronised with one another. The more changes that are added to one and
not the other, the harder it becomes to keep them in sync.
Sometimes, it is desirable to modify the text source instead of the visual aspects
of the model. Text editors and IDEs are already very mature, so their functionality
should be exploited wherever possible. However, when changes in the code are not
automatically incorporated by the diagram, these changes need to be manually updated,
which can lead to up to twice the amount of work to make one change. This can be
highly discouraging, and was indeed a major source of frustration in previous ALA
development, as mentioned in Chapter 1, severely hindered development efficiency,
and led to several hard-to-find problems. For instance, changing a port’s variable name
in the code would not be automatically reflected in the diagram. A developer at one
time made such a change, but could not easily find all instances of that port name in
the diagram due to its size, so this change was done manually. It turned out that not all
related port names in the diagram were changed, which led to issues in the diagram that
were hard to discover, and required hours of developer time to track down later on.
Following this, two of the requirements for GALADE, Priority Requirements 2 and
3, as defined in Section 3.3, were to ensure that ALA diagrams could automatically
generate code, and for GALADE to be able to automatically generate an ALA diagram

Chapter 4. Design and Development 84
from existing code, respectively. This was especially important for incorporating
GALADE in the development process of existing ALA applications, which can have
very large existing ALA diagrams designed and drawn in XMind. Recreating each
of these XMind diagrams as equivalent GALADE diagrams manually would not only
take a lot of developer time due to the large number of nodes, but would also require
a significant time investment to ensure that all aspects of the diagram are represented
accurately.
Initial designs for GALADE had the diagram stored in a separate file with a “.ALA"
extension. This file would contain an entire diagram serialised into the standard JSON
format. The development of GALADE was initially focused on having it generate code
correctly, and we expected round-trip engineering to be supported in the form of a
textual transformation from the application code to this JSON format. The main reason
for keeping an external diagram file was because we were building on our expectations
from XMind. We eventually realised that keeping the diagram in an external state
meant that there could still be synchronisation issues later on. This led to us deciding to
do away with the idea of keeping an external state for the diagram, and instead have
GALADE act as a code “inspector" of sorts, and displaying a snapshot of the current
application code, instead of pulling from an external source.
Given this, it seemed necessary to have a common abstraction model to facilit-
ate transformations between diagrams and code. An AbstractionModel domain
abstraction was designed to represent all information necessary about a domain abstrac-
tion’s ports, fields, properties, type parameters, methods, and constructor arguments. It
can also store documentation found in the source file.
In GALADE, we have implemented the ability to generate application wiring code,
as well as generate boilerplate source files for domain abstraction and story abstractions.

Chapter 4. Design and Development 85
Generating ALA Application Code
Application code generation involves two processes: generating instantiations, and
generating WireTo calls. Instantiations are represented by the nodes an ALA graph,
and WireTo calls are represented by directed edges.
Domain abstraction instantiations in C# include a variable name, class type, named
and unnamed constructor arguments, and properties. These are all displayed within the
nodes in GALADE, and can be relatively easily serialised from ALANodes into a valid
C# format. Roslyn, Microsoft’s C# compiler platform (Harrison, 2017), was used to
ensure correct syntax in the generated code.
Figure 4.3: An example of a PopupWindow instance node in GALADE (top), and itsautomatically generated C# instantiation code as a single word-wrapped line (bottom).
WireTo calls are generated from ALAWires, and require the source, destination,
as well as the source port. The destination port is not required in our C# implementation
because classes in C# cannot implement more than one of the same interface type.
WireTo calls are relatively simple, and thus easy to ensure the syntactical correctness
of, so a simple formatted string is generated from an ALAWire; Roslyn was not needed
here.
Once the code is generated, it needs to be correctly inserted into the application
source file. A convention was created for our previous tool, XMindParser, to use
landmarks to designate where auto-generated code should be. We continued this
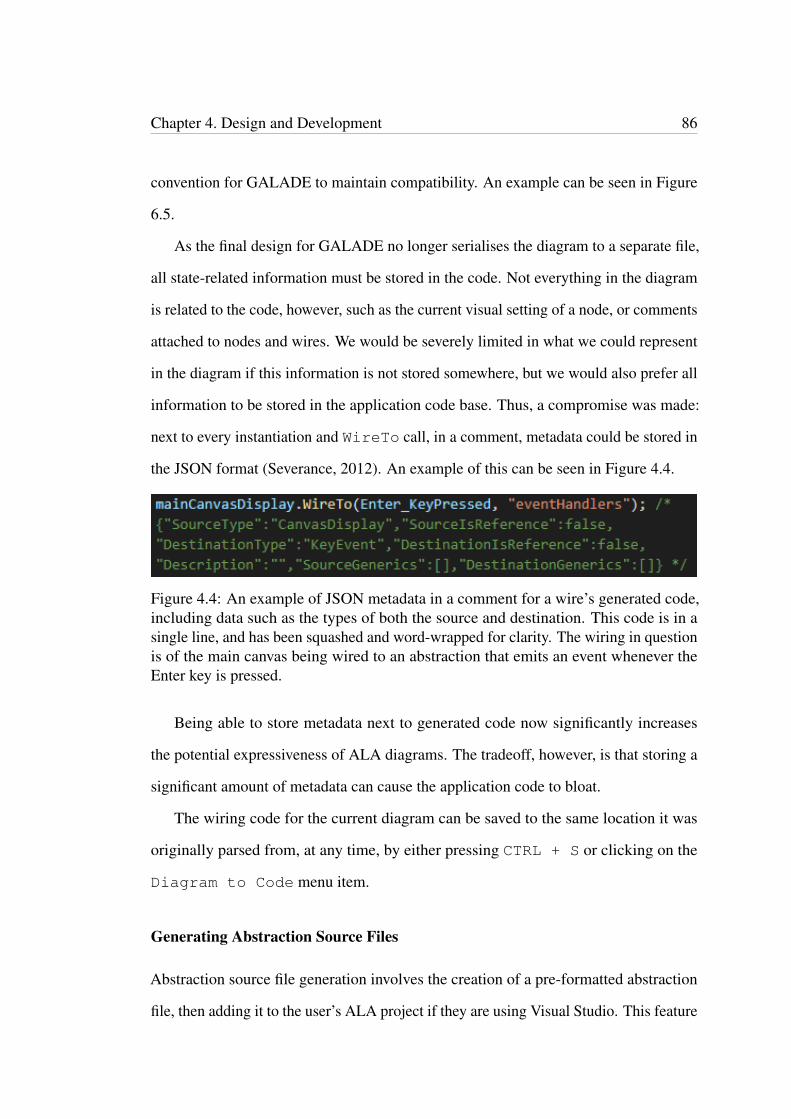
Chapter 4. Design and Development 86
convention for GALADE to maintain compatibility. An example can be seen in Figure
6.5.
As the final design for GALADE no longer serialises the diagram to a separate file,
all state-related information must be stored in the code. Not everything in the diagram
is related to the code, however, such as the current visual setting of a node, or comments
attached to nodes and wires. We would be severely limited in what we could represent
in the diagram if this information is not stored somewhere, but we would also prefer all
information to be stored in the application code base. Thus, a compromise was made:
next to every instantiation and WireTo call, in a comment, metadata could be stored in
the JSON format (Severance, 2012). An example of this can be seen in Figure 4.4.
Figure 4.4: An example of JSON metadata in a comment for a wire’s generated code,including data such as the types of both the source and destination. This code is in asingle line, and has been squashed and word-wrapped for clarity. The wiring in questionis of the main canvas being wired to an abstraction that emits an event whenever theEnter key is pressed.
Being able to store metadata next to generated code now significantly increases
the potential expressiveness of ALA diagrams. The tradeoff, however, is that storing a
significant amount of metadata can cause the application code to bloat.
The wiring code for the current diagram can be saved to the same location it was
originally parsed from, at any time, by either pressing CTRL + S or clicking on the
Diagram to Code menu item.
Generating Abstraction Source Files
Abstraction source file generation involves the creation of a pre-formatted abstraction
file, then adding it to the user’s ALA project if they are using Visual Studio. This feature
Chapter 4. Design and Development 87
Figure 4.5: A view of the domain abstraction template creation window in GALADEv1.14.1, excluding the node preview.
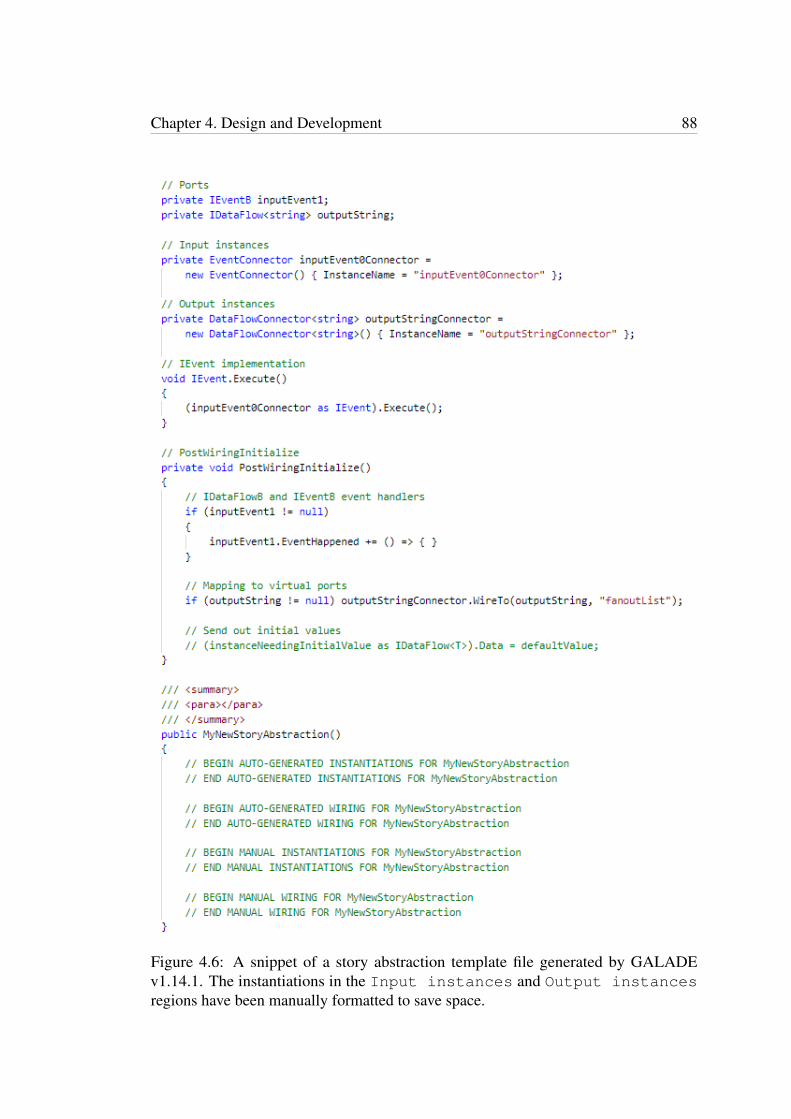
Chapter 4. Design and Development 88
Figure 4.6: A snippet of a story abstraction template file generated by GALADEv1.14.1. The instantiations in the Input instances and Output instancesregions have been manually formatted to save space.

Chapter 4. Design and Development 89
Figure 4.7: The node preview of the template generated in Figure 4.5.
can be accessed by selecting the Tools > Create Abstraction menu option
in GALADE.
Domain abstractions and story abstractions are typically implemented as classes,
so generating their source files is similar in functionality to generating class source
files from class diagrams, which is the most common code generation method found in
the tools in Chapter 2. Also similarly to the majority of those tools, generating code
source files for abstractions did not involve generating all the code required for those
abstractions to work, but instead to generate a template for the developer, and leaving
the functional implementation to them.
The main purpose of this template generation is to ease the process of developing
abstractions, not replace it. To improve readability, domain and story abstractions follow
a particular format, with comments designating where port interface implementation,
accepted port fields, public properties and methods, and the constructor, should go. The
template also contains pre-configured comments above the class definition to designate
where documentation for the abstraction should be stored, such that it is read and
displayed by GALADE in the diagram view. We also added the ability to preview the
generated template, both in terms of the source code and how the node would appear
in GALADE. Figure 4.5 shows the generation of a domain abstraction template, its
node preview is shown in Figure 4.7, and Figure 4.6 shows the generation of a story
abstraction template.
Additionally, for the IEvent, IEventB, IDataFlow, IDataFlowB, IUI, and
Chapter 4. Design and Development 90
IEventHandler port types, the template generator is pre-configured to automatically
add stubs representing their implementation details. For example, in Figure 4.5, the
Execute method stub is added for the inputEvent0 port, and an empty event
subscription for the EventHappened event is added for the inputEvent1 port.
Abstraction template generation is especially useful for the creation of story ab-
stractions that contain internal diagrams. This is because the template generation
automatically adds connectors that allow external wiring to be mapped to internal wir-
ing, as well as automatically adding the landmarks for the internal diagram. For example,
in Figure 4.6, we can see that the instance would be able to receive an input through
the inputEvent0 port, and emit a string as an output through the outputString
port. In a story abstraction, we could expect that there is an internal wiring diagram that
executes between those two ports. The template generator thus adds two connectors:
inputEvent0Connector, and outputStringConnector. As their names
imply, the generator connects inputEvent0 to inputEvent0Connector in the
Execute method, and connects outputString to outputStringConnector
in PostWiringInitialize. In GALADE, the user can then load the diagram for
this file and reference the inputEvent0Connector and outputStringConnector
instances as entry and exit points, respectively.
Generating a Diagram From Code
Under the current C# implementation of GALADE, the Roslyn platform has been used
extensively to parse existing ALA code into an intermediate format that is used to
generate a diagram.
The general process is as follows:
1. Select an application file that contains ALA wiring code.
2. If the file has multiple diagrams, choose one.

Chapter 4. Design and Development 91
3. For each instantiation, create a default ALANode, then load into it the default
AbstractionModel belonging to the type of the node.
4. For each WireTo call, if either the source or destination are not in the parsed
instantiations, create a default ALANode and treat it as a reference node, then
add an ALAWire with the source, destination, and source port. If the source has
no parent, then treat it as a root node. Add the renders of the source ALANode,
destination ALANode, and created ALAWire to the diagram’s Canvas.
5. For each root node, send it to the RightTreeLayout domain abstraction,
which is in charge of laying the nodes out in a tree that grows from left to right.
Each node and its connected wires will be laid out based the co-ordinates of nodes
that were laid out before it.
The current diagram can be refreshed and recompiled at any time, simply by clicking
on the Sync > Code to Diagram menu item.
4.3.2 Visualisation
Being able to visualise a system’s details provides a means of abstracting the sys-
tem code and processes in a more easily-understandable manner. Flowcharts are a
well-known means of representing processes - one just needs to look at how “napkin"
diagramming (Myers & Baniassad, 2009), which is a direct representation of an in-
dividual’s instinctive method of presenting complicated information, tends to involve
some kind of flowchart, in order to see the potential impact of incorporating this kind of
functionality into a diagramming tool.
One of the biggest driving factors for choosing XMind initially was its ability to
automatically lay out new nodes in a tree structure. Other tools would require the user
to manually position nodes, and the user would have to select an option to manually lay

Chapter 4. Design and Development 92
out the current diagram. Manually positioning and choosing when to force the nodes
into a visually appealing layout interrupts the “flow" of the development process, so a
highly requested feature for GALADE was to automatically lay out new nodes. Nodes
can still be moved manually through mouse clicks and drags, and the layout can be
reverted to normal with a single key press.
The flow of execution can generally be read from left to right, so input ports are
positioned at the left of their node, and output ports are positioned on the right. The
graphs are directed, however arrowcaps have not been deemed necessary because the
user can determine what the source and destination of a wire are by looking at whether
an input or output port is connected to at either end.
Wires are vertically separated at their connected ports, and are ordered from top to
bottom based on their respective ordering in the wiring code.
An ALA diagram is not restricted by having a single root, so ALA diagrams can
consist of a forest of trees. GALADE supports this, and consecutive trees are laid out
vertically, as if they were siblings in a single tree, so GALADE still ensures no overlaps
between trees in a single diagram. The trees can also have cross-connections between
them.
Additionally, connections are added in the order that they are found in the wiring
code, i.e. in chronological order.
With the tree layout of the diagram, obviously tree connections are well laid out,
and when viewing only the nodes in tree connections, the diagram is pleasant to look at,
and easy to follow at a glance. However, since the tree layout itself does not take into
account cross-connections, the diagram can become hard to understand when cluttered
by cross-connections. The impact of this can be seen in Figure 4.8.
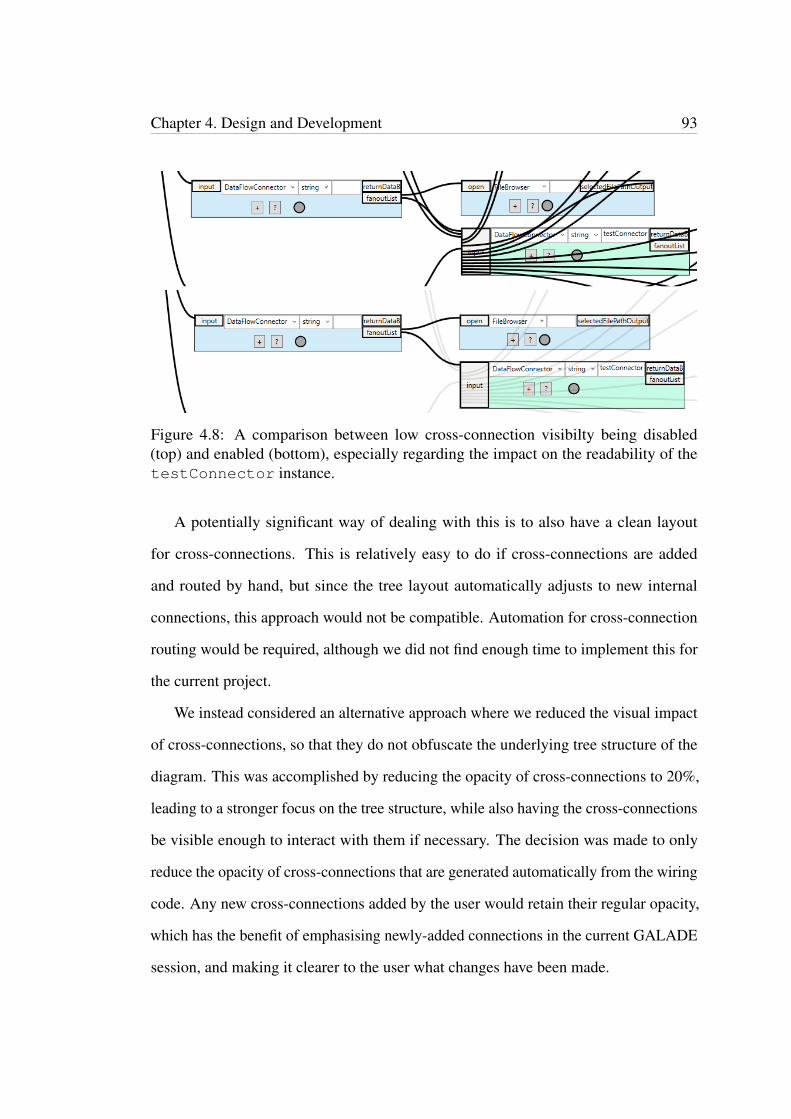
Chapter 4. Design and Development 93
Figure 4.8: A comparison between low cross-connection visibilty being disabled(top) and enabled (bottom), especially regarding the impact on the readability of thetestConnector instance.
A potentially significant way of dealing with this is to also have a clean layout
for cross-connections. This is relatively easy to do if cross-connections are added
and routed by hand, but since the tree layout automatically adjusts to new internal
connections, this approach would not be compatible. Automation for cross-connection
routing would be required, although we did not find enough time to implement this for
the current project.
We instead considered an alternative approach where we reduced the visual impact
of cross-connections, so that they do not obfuscate the underlying tree structure of the
diagram. This was accomplished by reducing the opacity of cross-connections to 20%,
leading to a stronger focus on the tree structure, while also having the cross-connections
be visible enough to interact with them if necessary. The decision was made to only
reduce the opacity of cross-connections that are generated automatically from the wiring
code. Any new cross-connections added by the user would retain their regular opacity,
which has the benefit of emphasising newly-added connections in the current GALADE
session, and making it clearer to the user what changes have been made.
Chapter 4. Design and Development 94
Graph Topology Modification
Anywhere on the main canvas, opening the global context menu and selecting Add
node will create a new default node at the current mouse position. To add a connection
between this node and an existing node, the user need only select the desired source
port on the source node, press CTRL + Q to start a new wire from that port, and select
the destination port on the destination node to complete the wiring. The graph layout
will automatically refresh to accomodate this new wiring, although if the refresh is not
desired, the View > Use automatic layout for rewiring option can be
toggled off. The user can also instead press A on the desired source port to automatically
create a new node and wire connecting to that node. If the destination of the created
wire has no other incoming wires, then the wire is a tree connection, and the destination
will be laid out in the tree. Otherwise, it will be moved to the root layer, and treated as
such until it gains an incoming tree connection.
Any individual node can be deleted through an option in its context menu. Any
connections involving it will also be deleted, but the nodes at the other ends of those
connections will not. If the user wishes to delete all nodes wired from the selected
node as well, they can select the Delete node and children option instead.
Deleting some child nodes by mistake is a possible scenario, so both options are
available, and it is usually preferable to delete nodes one by one when the set of nodes
pending deletion is not too large.
Any node can be forced into being treated as a root through the IsRoot context
menu toggle, which will reposition the node in the automatic layout to be vertically
aligned with the other roots in the diagram.
Wires can be repositioned at any time. The user can simply right click on a wire and
select Move source or Move destination to detach the respective end from
the node, and attach it to the mouse cursor, after which it can be connected to a desired

Chapter 4. Design and Development 95
node by left clicking on the desired port of that node.
A wire can also be deleted at any time through the Delete option in its context
menu. This will not delete any connected nodes however.
Through the Set as tree connection context menu option for wires, the
selected wire can be treated as the tree connection from the source to the destination, so
this can be used to rearrange the diagram and ensure that certain nodes are clustered
together.
Most, if not all, applications written using ALA have so far been heavily reliant
on the sequential execution of programming paradigms. This means that the order
of execution is very important with regards to correctness. As mentioned previously,
wires are vertically separated at their connected ports, so the user can view the order of
execution. To support easily changing the position of a wire in this order, a destination
node can be selected, then using CTRL + Up or CTRL + Down, the priority of the
destination node’s tree connection can be increased or decreased, respectively.
4.3.3 Usability
Given that GALADE is intended to be a tool for improving productivity in ALA
development, it was important to add features that serve to improve the quality of life
of the developer, rather than just generate and parse code.
Dealing With Diagram Scale
The diagram can be zoomed out with the scroll wheel to show an overview. Obviously
at a certain point, the nodes become unreadable, but ALA diagrams can easily become
large enough that they need to be zoomed out to such a level to make sense of the
application. When the diagram reaches this zoom level, each node shows a translucent
overlay which displays their type and variable name in a large, bold font, allowing for
Chapter 4. Design and Development 96
further zooming out, and allowing the developer to view the diagram as a combination
of subdiagrams. Additionally, there is no practical limit on how far out the user can
zoom - the diagram can be zoomed out from until the entire diagram is a single pixel on
the screen. XMind imposed a limit of 20% zoom, which was still not enough to get an
overview of the current diagram. A comparison between this feature in XMind and in
GALADE can be seen in Figure 6.2.
As an ALA diagram grows, it can become harder and harder to understand, and take
longer and longer to load. ALA does not support arbitrary hierarchical encapsulation
like normal object-oriented programming does with class inheritance, so addressing
the growing complexity of an ALA diagram is a significant concern. One way that
we have addressed this is by segmenting the application diagram into meaningful
subdiagrams. Usually, it is the case that some portions of the diagram have few (or no)
cross-connections with other portions of the diagram. These subdiagrams are prime
candidates for putting into their own diagram.
We have accomplished diagram separation by keeping the application diagram code
in the same scope, but separating them through the auto-generation code landmarks
mentioned in the round-trip engineering section. GALADE is able to read and visualise
specific sections within landmarks. GALADE connects diagrams together through
reference nodes, which are defined in Section 4.4.5. GALADE will not generate
instantiation code for a reference node, but any wiring code involving this node will
be generated as per usual. At any time, a node can be created in a diagram and given
the name of a node in another diagram, and then have its IsReference property
toggled on, to use it as a reference node. Any number of reference nodes can exist in
any diagram.
While any subdiagram can be exported to a new diagram, it is preferable to only
extrude those which have few cross-connections to other nodes in the diagram, because
every cross-connection needs to have at least one of the nodes be a reference node in
Chapter 4. Design and Development 97
the new diagram.
Another problem arises when the application ends up being split into several small
diagrams: there end up being too many diagrams, and it can become easy for the
developer to lose their place when opening different diagrams to follow a path of cross-
connections. Therefore, we added a feature in GALADE that allows the user to “jump"
between diagrams through nodes that they have in common. If a node is found in more
than one diagram, then all related diagrams can be viewed through its context menu,
as can be seen in Figure 5.1. If it is a reference node in the current diagram, then the
diagram that it is instantiated in will appear at the top. When another diagram’s name is
selected, GALADE will load that diagram, and navigate to, and focus on, the common
node. This feature aids the developer in following a wiring path between diagrams
without losing their footing.
When clicked on, a wire is highlighted, set to 100% opacity, and brought up above
all other wires and nodes, so following a specific cross-connection can be relatively
simple, especially when combined with zooming out. However, when cross-connections
are very long, sometimes stretching across an entire diagram, it can be cumbersome to
follow it manually. To address this, options were added to the context menus of every
wire to automatically jump to the source or destination of the selected wire. When
selected, the diagram pans, zooms in, and focuses on the source or destination node.
This functionality was highly requested as it was missing from XMind.
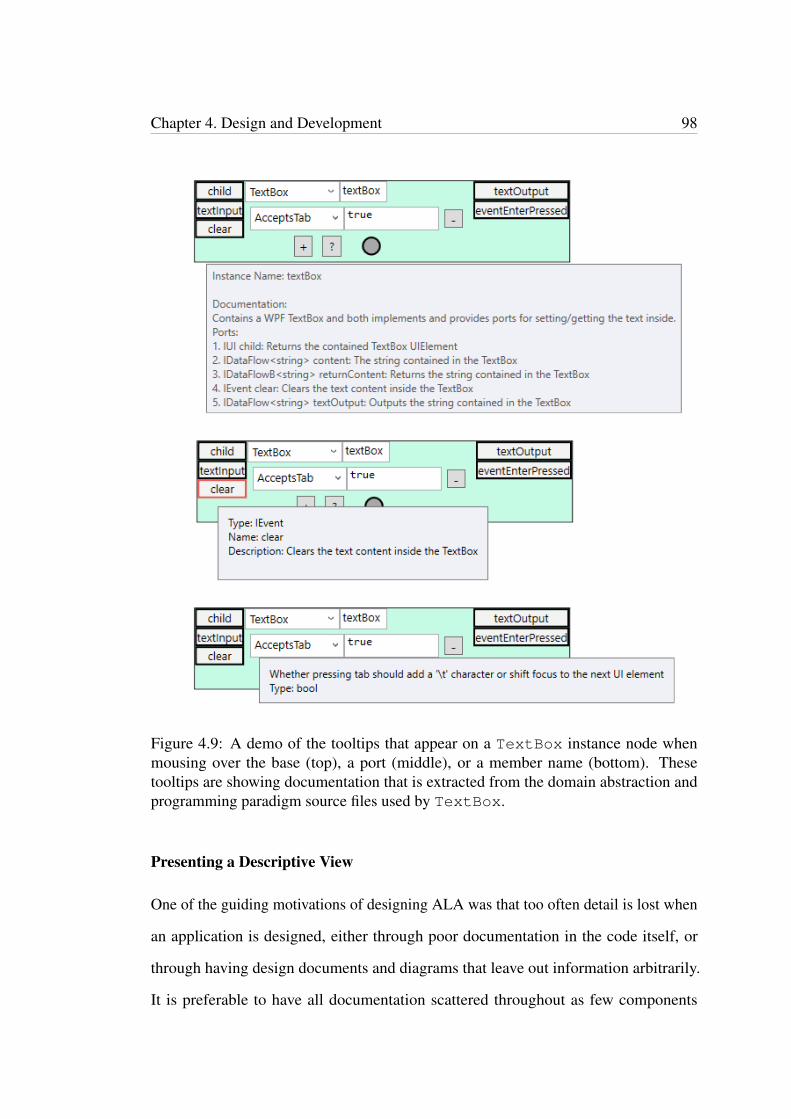
Chapter 4. Design and Development 98
Figure 4.9: A demo of the tooltips that appear on a TextBox instance node whenmousing over the base (top), a port (middle), or a member name (bottom). Thesetooltips are showing documentation that is extracted from the domain abstraction andprogramming paradigm source files used by TextBox.
Presenting a Descriptive View
One of the guiding motivations of designing ALA was that too often detail is lost when
an application is designed, either through poor documentation in the code itself, or
through having design documents and diagrams that leave out information arbitrarily.
It is preferable to have all documentation scattered throughout as few components
Chapter 4. Design and Development 99
as possible, and to be easily accessible from a single location. Several features in
GALADE have been implemented to help address this.
When designing a domain abstraction, the typical process is to have at least class-
level documentation at the top of the file, and supplementary documentation through
comments above properties, fields, and methods. The class-level documentation for a
domain abstraction should include a summary of its functionality, as well as descriptions
for its ports. This documentation is vital to understanding the diagram, even though
it is also located outside of the diagram. GALADE mends this disconnect by parsing
all abstraction documentation when loading a domain abstraction source file into an
AbstractionModel, and then having it be viewable in the diagram. This can be
seen in the topmost example in Figure 4.9.
When the mouse cursor is hovered over a node, a tooltip pops up with the parsed
class-level documentation. When a port is hovered over, a separate tooltip pops up that
shows the documentation for that particular port, including its current type (which can
be dynamically updated in the diagram). When a property or field dropdown is hovered
over, a tooltip pops up to show any documentation parsed for it specifically, including
its current type. These tooltips help to display a single source of truth, even though
individual pieces of documentation are spread out throughout several files. Examples of
these can be seen in Figure 4.9.
In addition to showing source code documentation in the diagram, GALADE also
supports storing documentation in the diagram itself. Source code documentation,
while extremely useful, only represents compile-time information. Information between
compile-time and runtime cannot be stored here for instantiated objects. Thus, we have
added a feature in GALADE that allows us to store documentation for instantiated
abstractions and wiring. In the diagram, every node has a “?" button that, when pressed,
opens a text box that can store documentation for this particular instance, for example
contextual information. This button is highlighted blue when such text already exists.

Chapter 4. Design and Development 100
An example of this feature is shown in Figure 4.10.
Similarly, every wire has a context menu option that opens up a text box, to store
information specific to that wire, for example when the data passing through a wire
needs to be in a particular format for the source and destination to work correctly. This
information would not be suitable to store in either node, as it would involve them both.
An example of this feature is shown in Figure 4.11.
Figure 4.10: An example of how documentation can be stored in an instance in adiagram in GALADE.
Figure 4.11: An example of how documentation can be stored in a wire in a diagram inGALADE.
Node and wire documentation can be stored in the metadata for the respective
node or wire instance. Unfortunately, this also means that reference nodes cannot
store documentation, as they have no instantiations within any diagram other than their
original one, but this can be somewhat remedied by storing documentation in any wires
connected to the reference node.
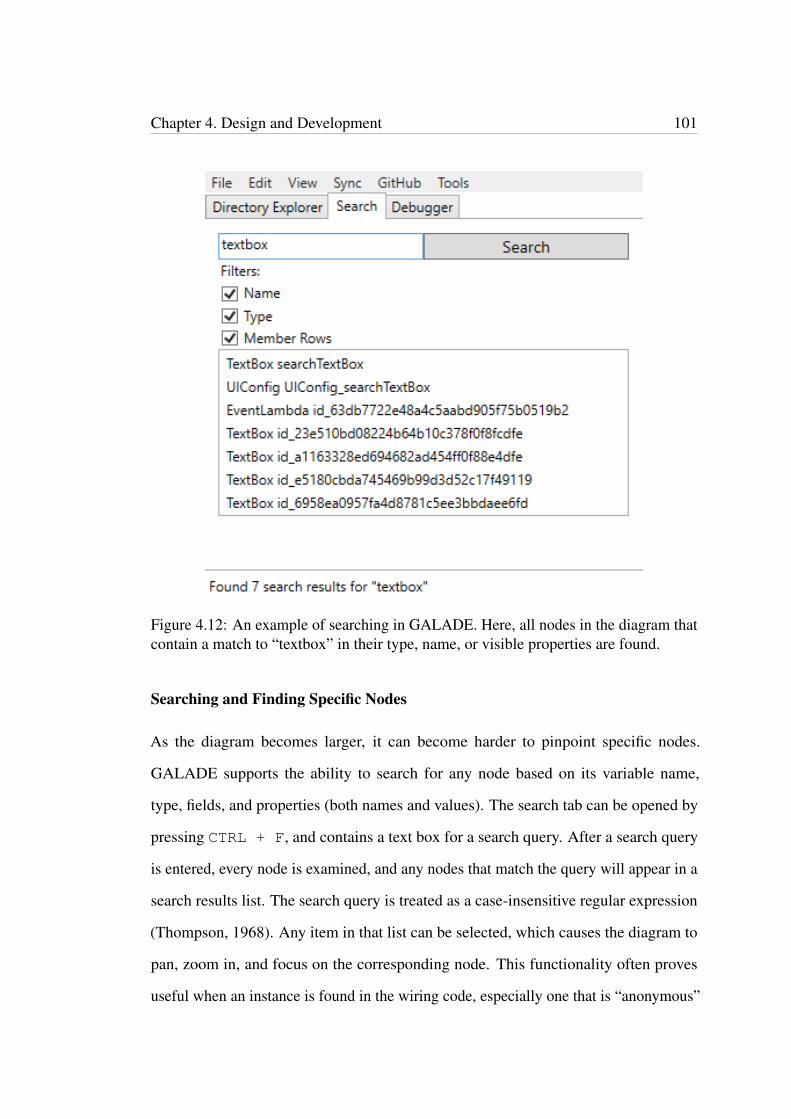
Chapter 4. Design and Development 101
Figure 4.12: An example of searching in GALADE. Here, all nodes in the diagram thatcontain a match to “textbox” in their type, name, or visible properties are found.
Searching and Finding Specific Nodes
As the diagram becomes larger, it can become harder to pinpoint specific nodes.
GALADE supports the ability to search for any node based on its variable name,
type, fields, and properties (both names and values). The search tab can be opened by
pressing CTRL + F, and contains a text box for a search query. After a search query
is entered, every node is examined, and any nodes that match the query will appear in a
search results list. The search query is treated as a case-insensitive regular expression
(Thompson, 1968). Any item in that list can be selected, which causes the diagram to
pan, zoom in, and focus on the corresponding node. This functionality often proves
useful when an instance is found in the wiring code, especially one that is “anonymous”
Chapter 4. Design and Development 102
in the diagram, i.e. it has a variable name based on the node’s ID, which is randomly
generated. The name can simply be copied from the text editor and sent as a search
query to find the node in the diagram. This functionality can be seen in Figure 4.12.
Providing Debugging Support
Debugging is an important facet of any development tool, and is one of the distinguishing
features, along with compilation and direct execution, that separates an integrated
development environment (IDE) from a text editor or diagramming tool. Developing
GALADE to the point where it is a complete IDE would both be heavily time consuming
(and outside of this project’s scope), as well as unnecessary. Mature IDEs already exist
that have become staples in the industry through many years of improvements, such
as Visual Studio and Eclipse. Given that, at this point in time, the most support for
ALA has been in C#, and Visual Studio provides direct and comprehensive support
for C#/.NET, it follows that GALADE should, at least initially, support development
in C# and Visual Studio, and following that, Visual Studio 2019 was chosen as the
development environment for creating GALADE itself. As a feature that partially
satisfies Optional Requirement 1, as described in Section 3.3.2, debugging support was
added for Visual Studio 2019.
When debugging the execution of an ALA diagram, a common scenario is when
some input is sent to an initial node A, and both data and execution flow passes from
A through the diagram to some terminal node B, from which some incorrect output is
received. Clearly, something within the path between the two nodes is likely to have
caused the issue, but, especially when a subdiagram is implemented before testing
execution through each node, it can be hard to pinpoint where.
This is where Visual Studio’s debugging capabilities come into play. Implementa-
tions of port interfaces can have debugging breakpoints placed in them. A breakpoint
on a line signals to Visual Studio that, when in the debug execution mode, execution

Chapter 4. Design and Development 103
should pause, or break, whenever said line is reached. Additionally, the breakpoint can
be configured with a condition using any variables available in the scope of the line.
We have taken advantage of this by ensuring that every domain abstraction has a public
InstanceName string property, so at any line in the domain abstraction’s source file,
the breakpoint can be set to pause execution whenever the current InstanceName
matches a certain string. As its name suggests, the InstanceName of a domain ab-
straction instance should match the variable name of that instance, and is automatically
generated by GALADE. Using the InstanceName, breakpoints can be added to the
source code of any instances in the path from A to B. Doing so manually can still be
tedious, so we added a feature to GALADE that allows adding breakpoints to Visual
Studio through interacting with the diagram, through the context menus of any nodes.
Through the context menu of any node, its methods and properties can be viewed,
and when selected, will call on Visual Studio’s Debugger API to create breakpoints at
the selected method or property in the domain abstraction’s source file. If a method is
selected, then a breakpoint will be added to all methods with the selected name found
in that file. If a property is selected, then a breakpoint will be be added to all accessors
(getters and setters in C#) of the properties matching that name in the file. Roslyn is
used to find these methods and properties, as well as the precise lines and columns to set
the breakpoint. It should be noted that GALADE is still a standalone executable, and
integration with Visual Studio’s debugger is possible by transferring data between the
separate Visual Studio and GALADE processes through the .NET library’s Marshal
class.
The generated breakpoints for a selected instance are also automatically configured
with the condition that execution is paused whenever the InstanceName matches
that of the selected instance.
Obviously, this allows for many breakpoints to be added without much effort.
Having to remove those breakpoints individually would then be counterintuitive, so the

Chapter 4. Design and Development 104
ability to clear all breakpoints in a source file was also added to GALADE.
Further details on this feature are provided in the plug-in architecture example in
Section 4.4.5.
4.4 The ALA-Based Design of GALADE
As mentioned in Section 1.2, the development of GALADE marks a novel implement-
ation of ALA. As a result, not all development practices from previous uses of ALA
carried over, and additionally, we have made some novel distinctions regarding how the
architecture can be implemented, while still adhering to the rules set out by ALA. These
novel distinctions, particularly a new layer called the Story Abstractions Layer, and the
usage of methods instead of wiring, serve to address Research Question 4, which is
defined in Section 1.3.
4.4.1 The Story Abstractions Layer
As an ALA application matures, so too does its main diagram. At some point, the main
diagram is likely to grow to a size that renders it hard to read and follow. If the main
aim of using ALA is to help improve the maintainability of software over time, then
having a main diagram grow to become too difficult to follow, and therefore difficult to
maintain, seems to be at odds with the philosophy behind ALA.
Similarly, ALA does away with the idea that hierarchical encapsulation is something
that should be allowed to be arbitrarily implemented, such as with inheritance in
standard object-oriented programming (Spray, 2020). Instead, ALA favours a flat
expression of requirements as instances in an ALA diagram. Removing hierarchical
encapsulation completely means denying an easy way of reusing convenient portions of
the diagram. For example, a UI submission form, made through a certain arrangement
Chapter 4. Design and Development 105
of UI abstractions, that will be used in multiple places in the application, could require
the redundant addition of its wiring at every location that it is used.
We attempted to solve both of the above problems by introducing a new layer
between the Domain Abstractions layer and the Application layer. Instead of arbitrarily
deep hierarchies, like the ones we may see when inheritance is used, this layer has been
carefully added and applies across the entire project. This is in contrast to common
class-based inheritance, where adding a new level of nesting only affects the inheritance
subtree that it is added to.
In keeping with ALA rules, the abstractions in this layer only have dependencies
on abstractions in the Domain Abstractions layer and below. Typically, this involved
abstractions in this layer containing wiring diagrams of domain abstractions in their
internal implementation, but would otherwise look just like domain abstractions. They
could therefore be used like regular domain abstractions in the application diagram as
well. We expected that user stories may be implemented in this layer, so we named the
layer Story Abstractions.
4.4.2 Methods in Place of Wires
When examining an ALA code base, one of the most commonly-used patterns is the
wiring of instances of abstractions with matching programming paradigm ports. It is
so commonly used that one might mistake it to be required in ALA. However, as we
have seen in Section 2.1, the wiring aspect is a convenient pattern emerging from the
application of ALA’s core rules rather than a necessity.
When we began using Story Abstractions, we found that the wiring pattern was
overly restricting in some cases. For example, we needed a way of parsing abstraction
source code to produce the necessary AbstractionModel to display an instance in
GALADE. For this, we created a CodeParser domain abstraction. This abstraction
Chapter 4. Design and Development 106
was able to read in a C# source file and output its various compilation units, such as
classes, interfaces, properties, methods, and so on.
To be able to extract our choice of compilation unit while also using wiring, we
simply created different methods in the abstraction for the different types of compilation
units. For example, a GetClasses method to extract classes, or a GetParameters
method to extract method parameters.
The alternatives to this that we considered were to either send out the parsed data
in a bundled format, like a JSON string through an IDataFlow<string> port, or
invent a new programming paradigm to facilitate the transfer of parsed compilation
units. We believe that our solution was simpler and required less design overhead. The
main downside of doing this is that this kind of domain abstraction is no longer visible
as an instance node in the diagram.
4.4.3 The Core Graph Data Structure
In general, drawing class diagrams for ALA applications does not serve much purpose.
There are no dependencies between abstractions in the same layer, only across layers.
A class diagram for a single layer would thus appear as a group of floating boxes with
no relationships drawn.
However, the core graph data structure in GALADE comprises of five key abstrac-
tions, Port, Graph, AbstractionModel, ALANode, and ALAWire, which have
meaningful connections to one another. We have shown a partial class diagram of these
abstractions in Fig. 4.13.
In Fig. 4.13, full class paths are not given. For clarity, Canvas refers to
System.Windows.Controls.Canvas, UIElement refers to
System.Windows.UIElement, and JObject refers to
Newtonsoft.Json.Linq.JObject.

Chapter 4. Design and Development 107
Figure 4.13: A UML class diagram of the core graph data structure abstractions.
Note that only the most relevant fields, properties, and methods are shown in the
boxes in Fig. 4.13 in order to save space. The reader is encouraged to view the source
code (available at https://github.com/arnab-sen/GALADE) to read their
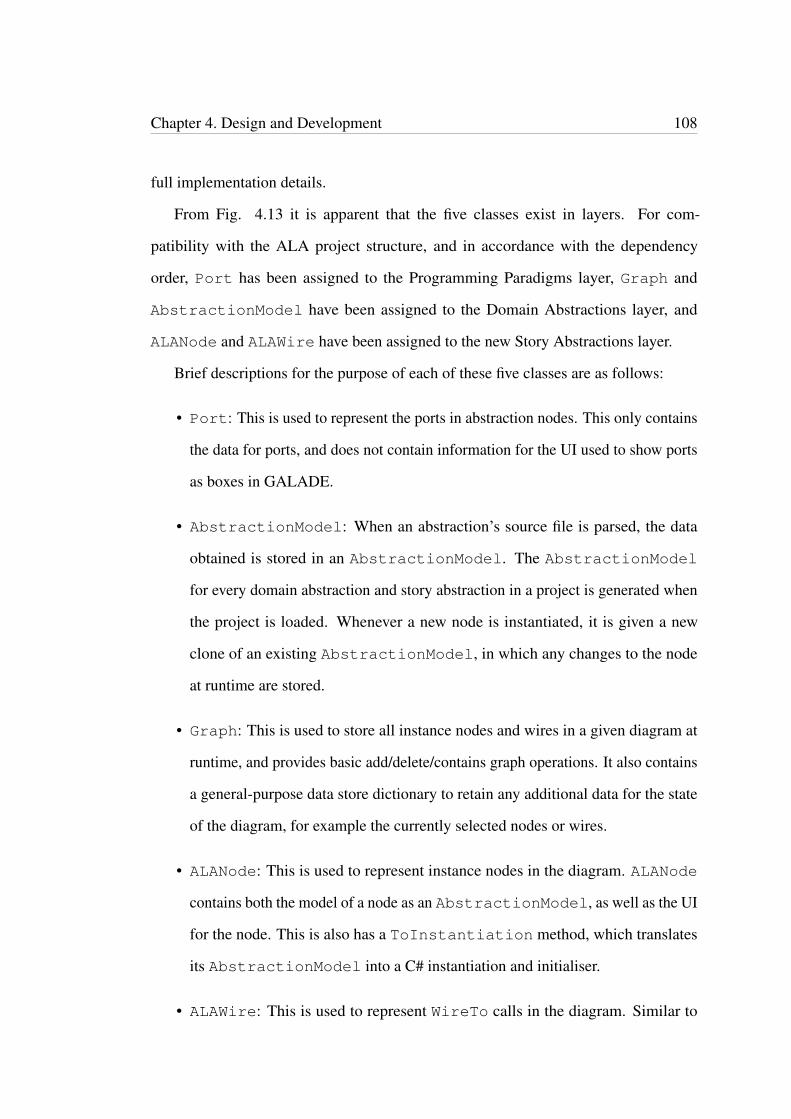
Chapter 4. Design and Development 108
full implementation details.
From Fig. 4.13 it is apparent that the five classes exist in layers. For com-
patibility with the ALA project structure, and in accordance with the dependency
order, Port has been assigned to the Programming Paradigms layer, Graph and
AbstractionModel have been assigned to the Domain Abstractions layer, and
ALANode and ALAWire have been assigned to the new Story Abstractions layer.
Brief descriptions for the purpose of each of these five classes are as follows:
• Port: This is used to represent the ports in abstraction nodes. This only contains
the data for ports, and does not contain information for the UI used to show ports
as boxes in GALADE.
• AbstractionModel: When an abstraction’s source file is parsed, the data
obtained is stored in an AbstractionModel. The AbstractionModel
for every domain abstraction and story abstraction in a project is generated when
the project is loaded. Whenever a new node is instantiated, it is given a new
clone of an existing AbstractionModel, in which any changes to the node
at runtime are stored.
• Graph: This is used to store all instance nodes and wires in a given diagram at
runtime, and provides basic add/delete/contains graph operations. It also contains
a general-purpose data store dictionary to retain any additional data for the state
of the diagram, for example the currently selected nodes or wires.
• ALANode: This is used to represent instance nodes in the diagram. ALANode
contains both the model of a node as an AbstractionModel, as well as the UI
for the node. This is also has a ToInstantiation method, which translates
its AbstractionModel into a C# instantiation and initialiser.
• ALAWire: This is used to represent WireTo calls in the diagram. Similar to

Chapter 4. Design and Development 109
ALANode, this contains both the UI for the wire, as well as the means to generate
its respective C# WireTo call, through its ToWireTo method.
4.4.4 Pre-Existing Patterns and Paradigms in ALA
Basic Data Flow
ALA has its roots in embedded software engineering. The initial few industry ALA
applications were all focused on simplifying the development for software that interacts
with embedded systems, mainly to handle the movement and display of data. As such,
one of the first programming paradigm abstractions developed was the IDataFlow
interface. As its name suggests, it is based on the well-known data-flow programming
paradigm (Lee & Messerschmitt, 1987). However, for the sake of simplicity, it handles
data sequentially, unlike the parallel execution model of the data-flow paradigm.
The following figure shows the implementation of IDataFlow in C#. The generic
type parameter T represents the type of data being passed through.
p u b l i c i n t e r f a c e IDataFlow <T>
{
T Data { get ; set ; }
}
Figure 4.14: The IDataFlow interface.
The primary usage of IDataFlow is through the set accessor (or setter). The get
accessor (or getter) is used for debugging, and should not affect the regular flow of
execution. The data should only flow in a single direction.
Because programming paradigms have been implemented as interfaces in C#, we are
also restricted by the limitations set in place by the language. Currently, there exists no
way to implement the same interface, with the same generic type parameter, more than
once. This has the effect on IDataFlow that a domain abstraction cannot be fed data
of a given type from more than one input port. The first solution that appears is to have
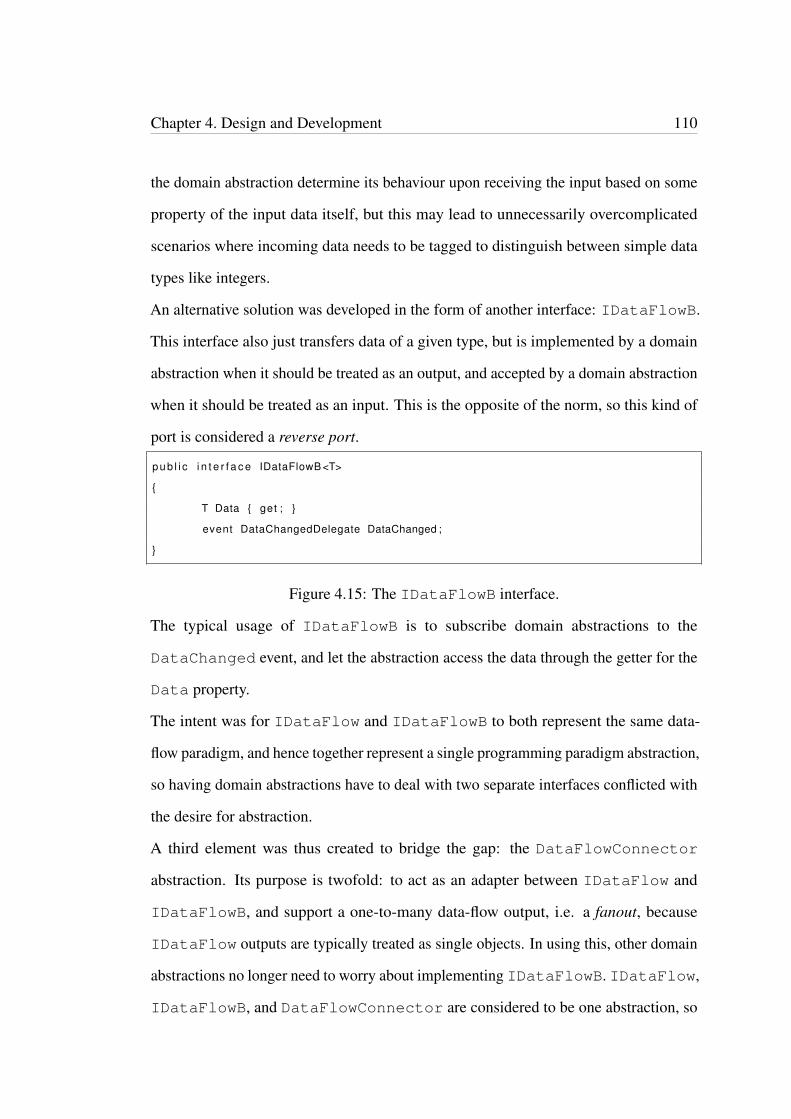
Chapter 4. Design and Development 110
the domain abstraction determine its behaviour upon receiving the input based on some
property of the input data itself, but this may lead to unnecessarily overcomplicated
scenarios where incoming data needs to be tagged to distinguish between simple data
types like integers.
An alternative solution was developed in the form of another interface: IDataFlowB.
This interface also just transfers data of a given type, but is implemented by a domain
abstraction when it should be treated as an output, and accepted by a domain abstraction
when it should be treated as an input. This is the opposite of the norm, so this kind of
port is considered a reverse port.
p u b l i c i n t e r f a c e IDataFlowB <T>
{
T Data { get ; }
event DataChangedDelegate DataChanged ;
}
Figure 4.15: The IDataFlowB interface.
The typical usage of IDataFlowB is to subscribe domain abstractions to the
DataChanged event, and let the abstraction access the data through the getter for the
Data property.
The intent was for IDataFlow and IDataFlowB to both represent the same data-
flow paradigm, and hence together represent a single programming paradigm abstraction,
so having domain abstractions have to deal with two separate interfaces conflicted with
the desire for abstraction.
A third element was thus created to bridge the gap: the DataFlowConnector
abstraction. Its purpose is twofold: to act as an adapter between IDataFlow and
IDataFlowB, and support a one-to-many data-flow output, i.e. a fanout, because
IDataFlow outputs are typically treated as single objects. In using this, other domain
abstractions no longer need to worry about implementing IDataFlowB. IDataFlow,
IDataFlowB, and DataFlowConnector are considered to be one abstraction, so
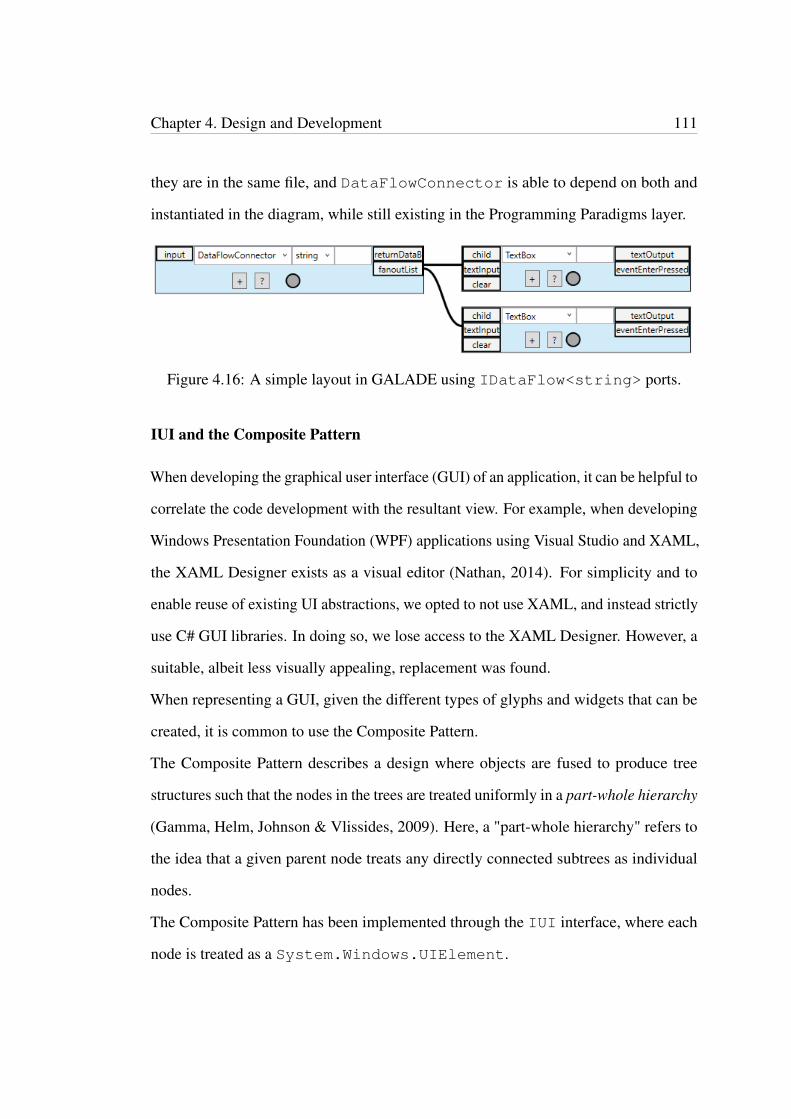
Chapter 4. Design and Development 111
they are in the same file, and DataFlowConnector is able to depend on both and
instantiated in the diagram, while still existing in the Programming Paradigms layer.
Figure 4.16: A simple layout in GALADE using IDataFlow<string> ports.
IUI and the Composite Pattern
When developing the graphical user interface (GUI) of an application, it can be helpful to
correlate the code development with the resultant view. For example, when developing
Windows Presentation Foundation (WPF) applications using Visual Studio and XAML,
the XAML Designer exists as a visual editor (Nathan, 2014). For simplicity and to
enable reuse of existing UI abstractions, we opted to not use XAML, and instead strictly
use C# GUI libraries. In doing so, we lose access to the XAML Designer. However, a
suitable, albeit less visually appealing, replacement was found.
When representing a GUI, given the different types of glyphs and widgets that can be
created, it is common to use the Composite Pattern.
The Composite Pattern describes a design where objects are fused to produce tree
structures such that the nodes in the trees are treated uniformly in a part-whole hierarchy
(Gamma, Helm, Johnson & Vlissides, 2009). Here, a "part-whole hierarchy" refers to
the idea that a given parent node treats any directly connected subtrees as individual
nodes.
The Composite Pattern has been implemented through the IUI interface, where each
node is treated as a System.Windows.UIElement.
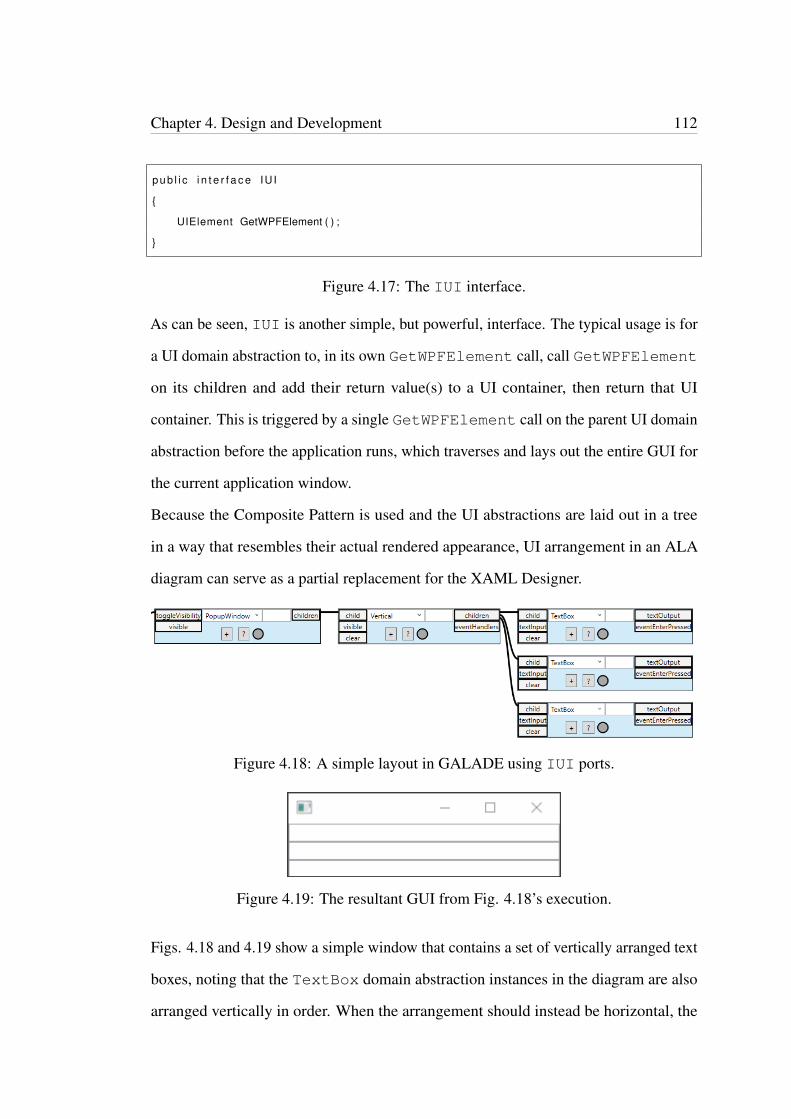
Chapter 4. Design and Development 112
p u b l i c i n t e r f a c e IU I
{
UIElement GetWPFElement ( ) ;
}
Figure 4.17: The IUI interface.
As can be seen, IUI is another simple, but powerful, interface. The typical usage is for
a UI domain abstraction to, in its own GetWPFElement call, call GetWPFElement
on its children and add their return value(s) to a UI container, then return that UI
container. This is triggered by a single GetWPFElement call on the parent UI domain
abstraction before the application runs, which traverses and lays out the entire GUI for
the current application window.
Because the Composite Pattern is used and the UI abstractions are laid out in a tree
in a way that resembles their actual rendered appearance, UI arrangement in an ALA
diagram can serve as a partial replacement for the XAML Designer.
Figure 4.18: A simple layout in GALADE using IUI ports.
Figure 4.19: The resultant GUI from Fig. 4.18’s execution.
Figs. 4.18 and 4.19 show a simple window that contains a set of vertically arranged text
boxes, noting that the TextBox domain abstraction instances in the diagram are also
arranged vertically in order. When the arrangement should instead be horizontal, the

Chapter 4. Design and Development 113
diagram would have the same layout, but Vertical abstraction would instead be a
Horizontal abstraction, indicating that the layout should be viewed as rotated 90○
clockwise.
Basic Dataless Event Flow
Similar to IDataFlow, an IEvent interface was developed for when the flow of
execution should pass from one abstraction to another, but no data is required.
p u b l i c i n t e r f a c e IEvent
{
vo id Execute ( ) ;
}
Figure 4.20: The IEvent interface.
As IEvent is a dataless version of IDataFlow, they share the same restriction
where an abstraction cannot have multiple IEvent input ports. Therefore, a similar
solution to IDataFlowB and DataFlowConnector was developed: IEventB
and EventConnector, both of which also exist in the Programming Paradigms
layer. The implementation of IEventB can be seen in Figure 4.21, and an example of
EventConnector in an ALA diagram can be seen in Figure 4.22.
p u b l i c i n t e r f a c e IEventB
{
event Cal lBackDelegate EventHappened ;
}
Figure 4.21: The IEventB interface.

Chapter 4. Design and Development 114
Figure 4.22: A simple layout in GALADE using IEvent ports.
4.4.5 New ALA Patterns and Paradigms for GALADE
Standard Event Subscription
While the IEvent interface provides a means of sequential execution flow in the dia-
gram through dataless events, if often occurs that events need to carry some contextual
data to the event handlers. This is especially prevalent in WPF itself: each UI class
in WPF has several events that can be subscribed to and handled. These are already
used internally in UI abstractions like Button, which subscribes to the Click event
of its internal System.Windows.Controls.Button instance, and not exposed
outside of the abstraction. In the case of Button, whenever the Click event fires, an
IEvent is emitted from the abstraction through an output port.
p u b l i c Button ( s t r i n g t i t l e )
{
. . .
bu t ton . C l i c k += ( sender , args ) => eventBut tonCl icked ?. Execute ( ) ;
. . .
}
Figure 4.23: A partial view of the Button abstraction’s constructor.
This works well for simpler abstractions, but restricts their customisability. To account
for another event, another port would need to be created and mapped to. For more
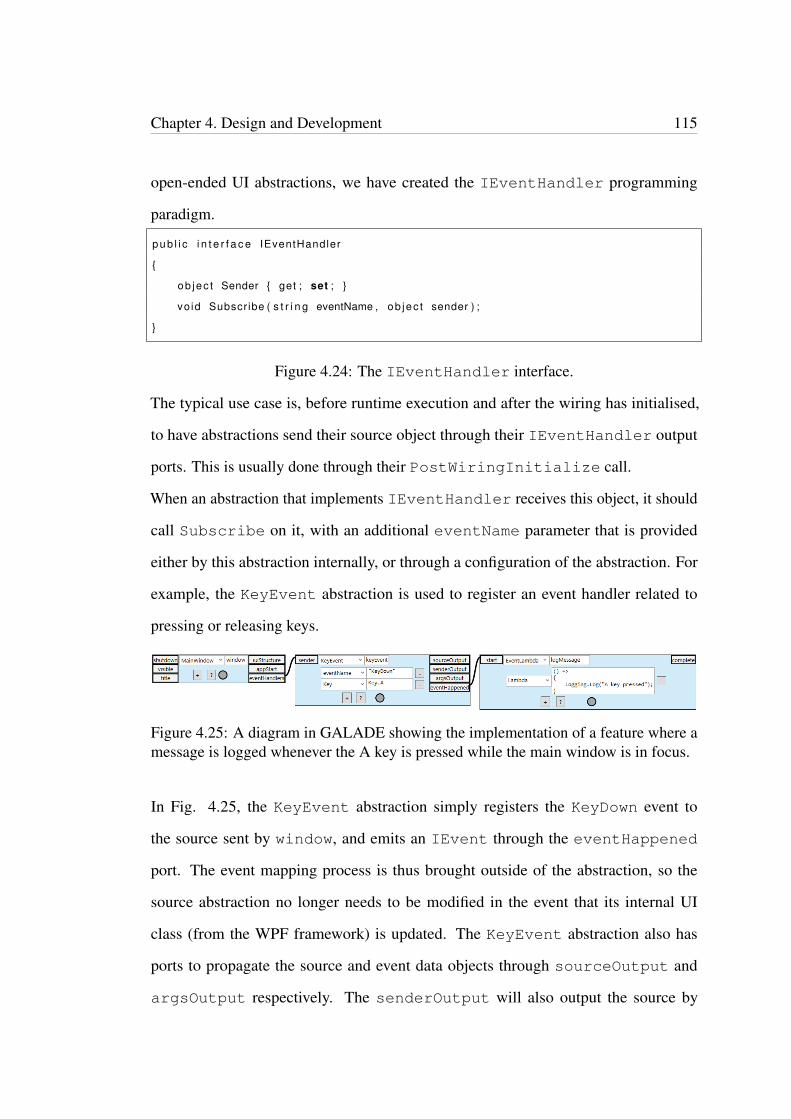
Chapter 4. Design and Development 115
open-ended UI abstractions, we have created the IEventHandler programming
paradigm.
p u b l i c i n t e r f a c e IEventHandler
{
ob jec t Sender { get ; set ; }
vo id Subscribe ( s t r i n g eventName , ob jec t sender ) ;
}
Figure 4.24: The IEventHandler interface.
The typical use case is, before runtime execution and after the wiring has initialised,
to have abstractions send their source object through their IEventHandler output
ports. This is usually done through their PostWiringInitialize call.
When an abstraction that implements IEventHandler receives this object, it should
call Subscribe on it, with an additional eventName parameter that is provided
either by this abstraction internally, or through a configuration of the abstraction. For
example, the KeyEvent abstraction is used to register an event handler related to
pressing or releasing keys.
Figure 4.25: A diagram in GALADE showing the implementation of a feature where amessage is logged whenever the A key is pressed while the main window is in focus.
In Fig. 4.25, the KeyEvent abstraction simply registers the KeyDown event to
the source sent by window, and emits an IEvent through the eventHappened
port. The event mapping process is thus brought outside of the abstraction, so the
source abstraction no longer needs to be modified in the event that its internal UI
class (from the WPF framework) is updated. The KeyEvent abstraction also has
ports to propagate the source and event data objects through sourceOutput and
argsOutput respectively. The senderOutput will also output the source by
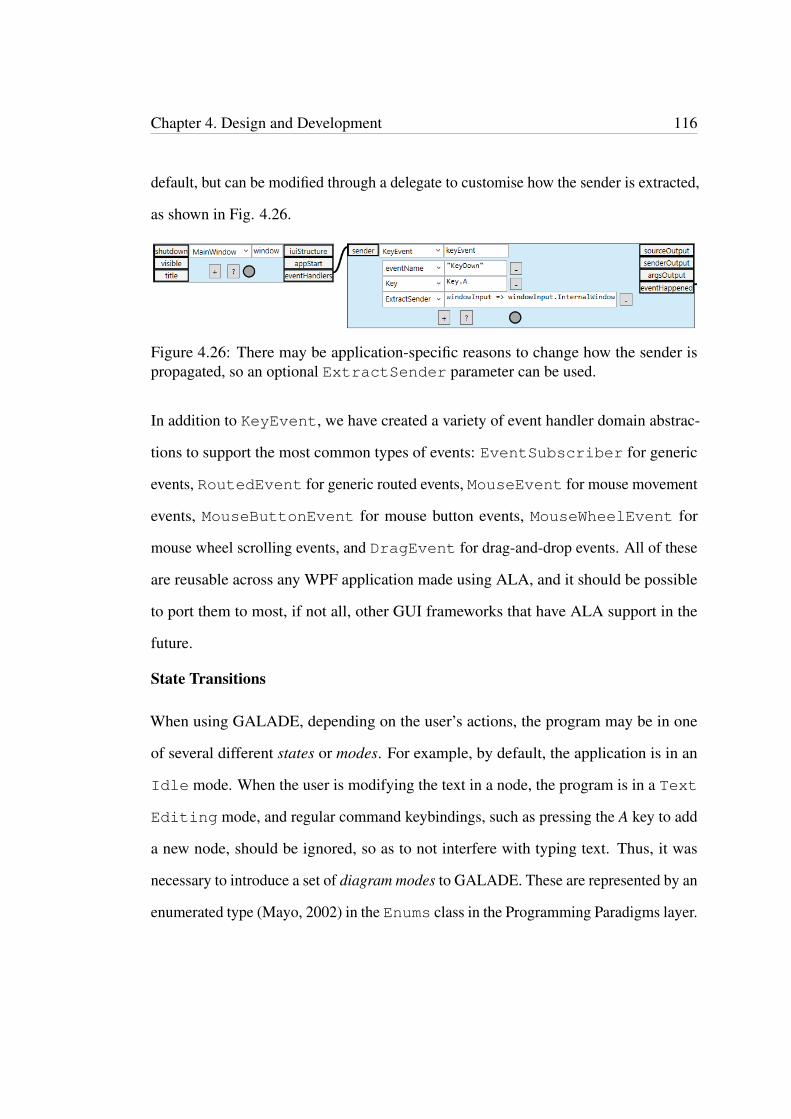
Chapter 4. Design and Development 116
default, but can be modified through a delegate to customise how the sender is extracted,
as shown in Fig. 4.26.
Figure 4.26: There may be application-specific reasons to change how the sender ispropagated, so an optional ExtractSender parameter can be used.
In addition to KeyEvent, we have created a variety of event handler domain abstrac-
tions to support the most common types of events: EventSubscriber for generic
events, RoutedEvent for generic routed events, MouseEvent for mouse movement
events, MouseButtonEvent for mouse button events, MouseWheelEvent for
mouse wheel scrolling events, and DragEvent for drag-and-drop events. All of these
are reusable across any WPF application made using ALA, and it should be possible
to port them to most, if not all, other GUI frameworks that have ALA support in the
future.
State Transitions
When using GALADE, depending on the user’s actions, the program may be in one
of several different states or modes. For example, by default, the application is in an
Idle mode. When the user is modifying the text in a node, the program is in a Text
Editing mode, and regular command keybindings, such as pressing the A key to add
a new node, should be ignored, so as to not interfere with typing text. Thus, it was
necessary to introduce a set of diagram modes to GALADE. These are represented by an
enumerated type (Mayo, 2002) in the Enums class in the Programming Paradigms layer.

Chapter 4. Design and Development 117
p u b l i c enum DiagramMode
{
None = 0 ,
I d l e = 1 ,
Tex tEd i t i ng = 1 << 1 ,
SingleNodeSelect = 1 << 2 ,
Mul t iNodeSelect = 1 << 3 ,
DragSelect = 1 << 4 ,
Id leSe lec ted = 1 << 5 ,
Any = 1 << 6 ,
Paused = 1 << 7 ,
Sing leConnect ionSelect = 1 << 8 ,
MovingConnection = 1 << 9 ,
Awa i t i ngPor tSe lec t i on = 1 << 10 ,
AddingCrossConnection = 1 << 11 ,
Panning = 1 << 12
}
Figure 4.27: The various diagram state flags implemented in GALADE.
Each entry is bit-shifted so that they can be used as flags, i.e. bitwise operators like OR
and AND can be applied to DiagramMode operands.
Each DiagramMode flag can be seen as a state. To keep track of the cur-
rent state of the program, a StateTransition class was created. Note
that both StateTransition and DiagramMode reside in the Programming
Paradigms layer, even though they are separate abstractions. This is allowed,
because StateTransition has been implemented to have no dependency on
DiagramMode. Instead, StateTransition takes a generic type parameter that is
just expected to be an enum, which is a standard C# type in the Libraries layer, and
therefore the dependency ordering is preserved.
StateTransition keeps track of the current state, and has an Update method
that can be called to change the state. Whenever its state changes, it emits a
(previousState, newState) tuple through a StateChanged event. This
is not an IEvent (as it cannot have a dependency on another programming paradigm),

Chapter 4. Design and Development 118
but is instead a regular C# event that can be subscribed to. We only need to create a
single StateTransition instance for the application.
To listen to state changes, we created a StateChangeListener domain abstrac-
tion. This can be passed the singleton StateTransition programming paradigm
instance, and its StateChanged event will be subscribed to. It can be configured to
listen for specific changes, and when they occur, propagate the transition tuple, or emit
an IEvent.
Figure 4.28: An instance of StateChangeListener that listens for the diagrambecoming idle from any other state.
The Plug-in Architecture
Taking inspiration from highly customisable environments such as Visual Studio, Visual
Studio Code, and Eclipse, GALADE has been developed to support the plug-in archi-
tecture, where a core application can have features added to it through components that
the core application does not need to have any dependencies on (Wolfinger, Dhungana,
Prähofer & Mössenböck, 2006). This is achieved in a novel way in ALA: a main
diagram has been created that contains all of the core functionality, namely including
creating automatically laid out diagrams and generating their code, and this core dia-
gram can be extended through new diagrams that connect to nodes in the core diagram
through reference nodes, which are nodes that have been instantiated in another diagram.
One such example is through the Visual Studio debugger integration feature, as de-
scribed in Section 4.3.3, where GALADE attaches to an active Visual Studio debugger
Chapter 4. Design and Development 119
process, allowing the user to be able to see a trace of the current call stack represented
as highlighted wires in the diagram, and view the current values of variables in any stack
frame. To implement this functionality, the diagram seen in Figure 4.29 was created.
The call stack trace feature can be seen in Figure 4.30, where the most recently used
wire is highlighted green, and all previously used wires in the call stack are highlighed
orange.
The execution of Figure 4.29 is shown in Fig. 4.32. Any item on the call stack can be
selected to jump to the corresponding node. The current value of an active IDataFlow
wire will be shown in floating text.
The orange nodes in Fig. 4.29 are the reference nodes instantiated in the main diagram.
The main diagram does not know about anything in this diagram.

Chapter 4. Design and Development 120
Figure 4.29: An overview of the debugger plug-in diagram. The orange nodes indicatenodes that are instantiated in other diagrams and merely referenced here.

Chapter 4. Design and Development 121
Figure 4.30: A screenshot of a live view of the debugger, connected to an instance ofVisual Studio that is debugging GALADE v1.10.1 (top), and an extended showcase ofthe path highlighting feature (bottom).
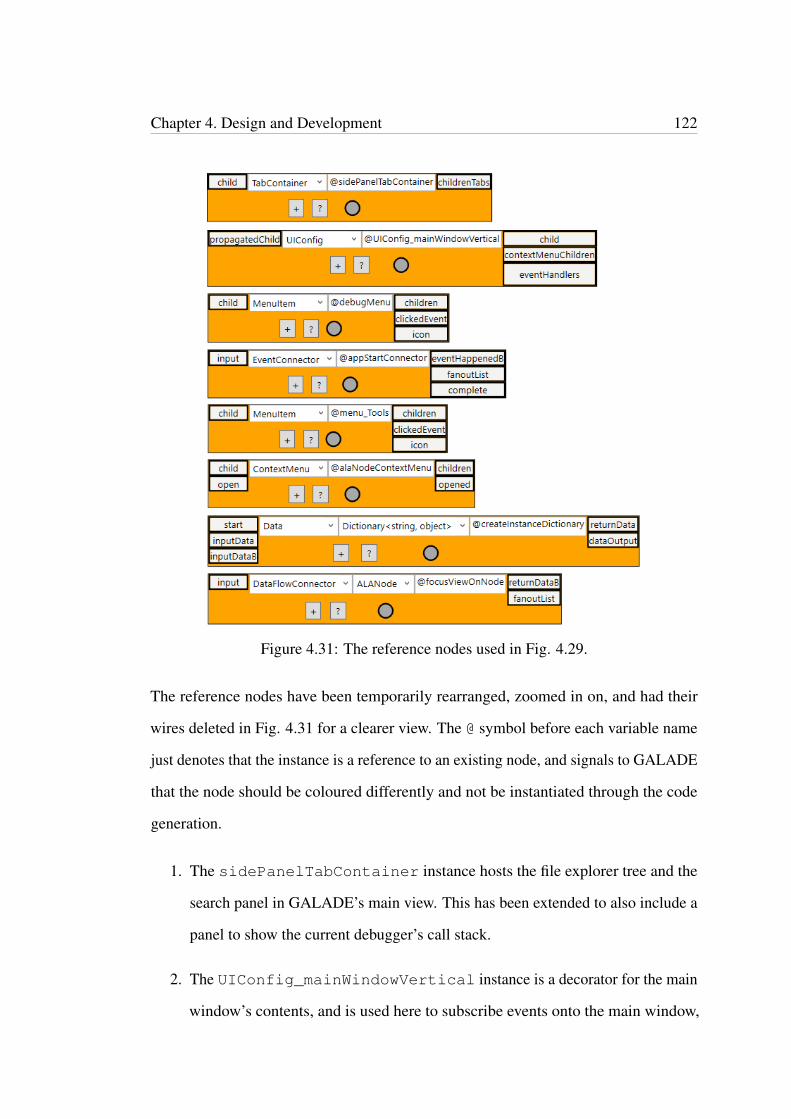
Chapter 4. Design and Development 122
Figure 4.31: The reference nodes used in Fig. 4.29.
The reference nodes have been temporarily rearranged, zoomed in on, and had their
wires deleted in Fig. 4.31 for a clearer view. The @ symbol before each variable name
just denotes that the instance is a reference to an existing node, and signals to GALADE
that the node should be coloured differently and not be instantiated through the code
generation.
1. The sidePanelTabContainer instance hosts the file explorer tree and the
search panel in GALADE’s main view. This has been extended to also include a
panel to show the current debugger’s call stack.
2. The UIConfig_mainWindowVertical instance is a decorator for the main
window’s contents, and is used here to subscribe events onto the main window,
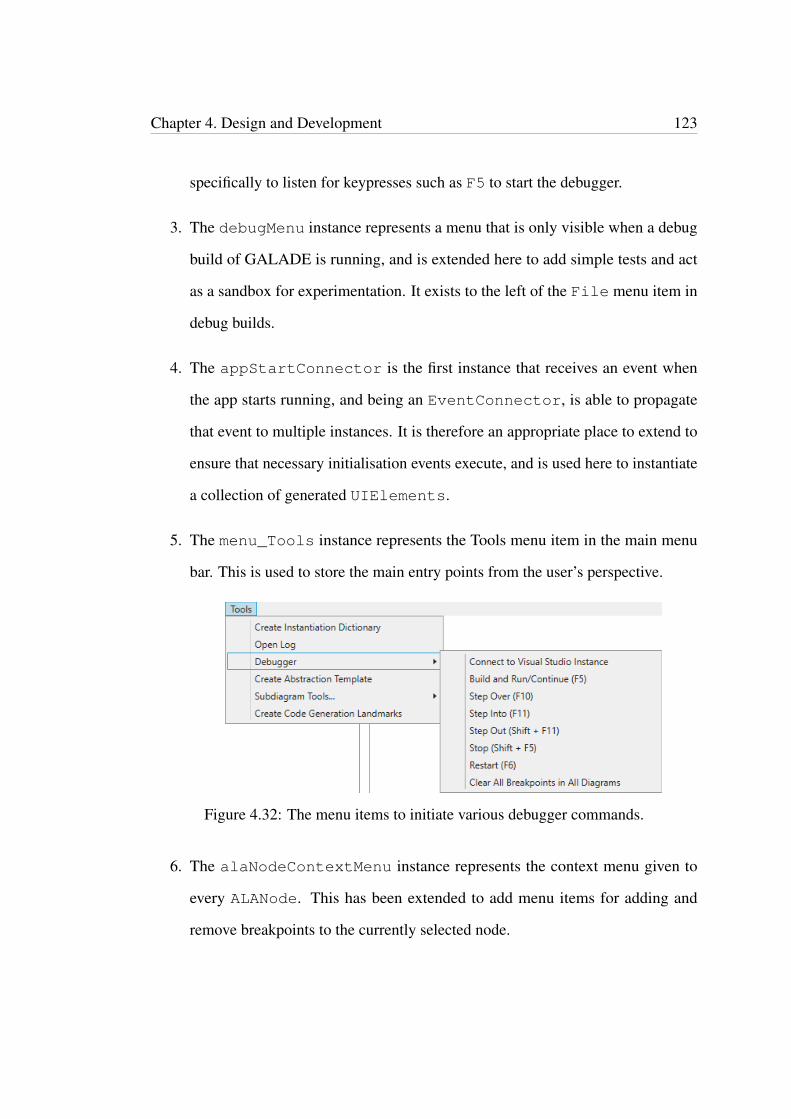
Chapter 4. Design and Development 123
specifically to listen for keypresses such as F5 to start the debugger.
3. The debugMenu instance represents a menu that is only visible when a debug
build of GALADE is running, and is extended here to add simple tests and act
as a sandbox for experimentation. It exists to the left of the File menu item in
debug builds.
4. The appStartConnector is the first instance that receives an event when
the app starts running, and being an EventConnector, is able to propagate
that event to multiple instances. It is therefore an appropriate place to extend to
ensure that necessary initialisation events execute, and is used here to instantiate
a collection of generated UIElements.
5. The menu_Tools instance represents the Tools menu item in the main menu
bar. This is used to store the main entry points from the user’s perspective.
Figure 4.32: The menu items to initiate various debugger commands.
6. The alaNodeContextMenu instance represents the context menu given to
every ALANode. This has been extended to add menu items for adding and
remove breakpoints to the currently selected node.
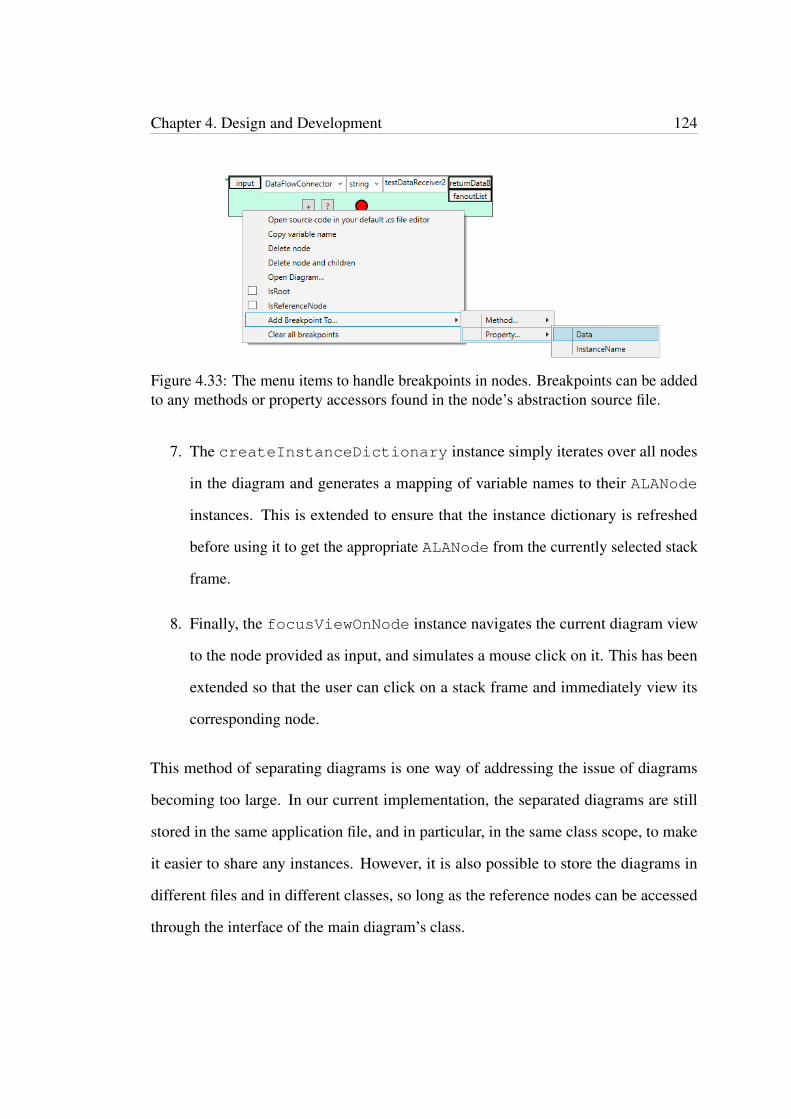
Chapter 4. Design and Development 124
Figure 4.33: The menu items to handle breakpoints in nodes. Breakpoints can be addedto any methods or property accessors found in the node’s abstraction source file.
7. The createInstanceDictionary instance simply iterates over all nodes
in the diagram and generates a mapping of variable names to their ALANode
instances. This is extended to ensure that the instance dictionary is refreshed
before using it to get the appropriate ALANode from the currently selected stack
frame.
8. Finally, the focusViewOnNode instance navigates the current diagram view
to the node provided as input, and simulates a mouse click on it. This has been
extended so that the user can click on a stack frame and immediately view its
corresponding node.
This method of separating diagrams is one way of addressing the issue of diagrams
becoming too large. In our current implementation, the separated diagrams are still
stored in the same application file, and in particular, in the same class scope, to make
it easier to share any instances. However, it is also possible to store the diagrams in
different files and in different classes, so long as the reference nodes can be accessed
through the interface of the main diagram’s class.

Chapter 4. Design and Development 125
4.5 The Development Timeline
The entire end-to-end development timeline for GALADE transpired over 12 months,
between the start of June 2020 and the end of June 2021. However, the bulk of the
development occurred over the first 6 months, at the end of which GALADE v1.0.0
was released and given to software engineers at Datamars to use. In the first 6 months,
development on GALADE was conducted full-time, whereas the second 6 months
involved part-time work, and both time periods used monthly sprints. From the pool
of requirements from Priority Requirements (PRs) and Optional Requirements (ORs)
defined in Section 3.3, PR1-4 and OR1-5 were the sets of functional requirements that
could be selected for the sprints. The remainder of this section details our account of
the 12 monthly sprints.
4.5.1 Sprint 1
For the first sprint, our focus was on PR1, i.e. visualising an ALA diagram. We
implemented basic UI layouts for the application, and produced attempts at visualising
a generic port graph. The basic right tree layout algorithm was developed, and led to the
initial diagram seen in Figure 4.34. Nodes could be added as children to the selected
node through a button press. At this stage, the ALA diagram for GALADE was being
developed in XMind, and would continue to remain on XMind until Sprint 3. Each
node, including its ports and wiring to its parent, was being instantiated through a single
domain abstraction called InstanceRender. Each instance could also be given a
type and name.
4.5.2 Sprint 2
This sprint involved the continued work on PR1, and in particular, the ability to select
ports to add nodes to. Ports and wires were extracted from the InstanceRender

Chapter 4. Design and Development 126
Figure 4.34: The first ALA diagram drawn in GALADE.
domain abstraction into PortRender and WireRender abstractions respectively, in
an attempt to improve the separation of concerns. They would all be connected through
a common interface called IRender. We also added the ability to click and drag on
nodes to move them around, the ability to store configuration properties in each instance,
seen in the diagram portion of Figure 4.35, as well as the ability to manually add wires
between nodes, therefore enabling cross-connections. By the end of this sprint, we
had a working basic implementation for PR1, although there was significant room for
improvement. We decided to try and implement other features in the next sprint before
implementing PR1 comprehensively, just in case we later need to redesign the ALA
diagram for GALADE.
4.5.3 Sprint 3
This sprint was concerned with PR2, i.e. generating code from an ALA diagram. Since
our ALA diagrams in GALADE at this stage were visualised by nodes, ports, and wires
being combined separately, we needed a method of walking through this structure and
generating the appropriate code. We implemented this through a method in IRender
called GetChildInfos. Essentially, this method would be implemented differently
in InstanceRender, PortRender, and WireRender to return different seg-
ments of the WireTo calls that they were involved in. InstanceRender would
return its instance name, PortRender would return its port name, and WireRender
would return a bridging “WireTo” substring. Each InstanceRender would
combine these pieces together, without knowing what the port and wire portions

Chapter 4. Design and Development 127
were, to form complete WireTo calls. InstanceRender would also contain a
ToInstantiation method that would print its object initialiser. The results of
this code generation can be seen in Figure 4.35. Since we had a basic working im-
plementation of PR2, the remainder of the sprint was dedicated to cleaning up and
refactoring the code. During this time, we saw that our ALA diagam for GALADE had
started to become convoluted, and realised that we would need a new layer in ALA
to accommodate future complexity in our nodes. We therefore added a new layer, the
Story Abstractions layer, between the Domain Abstractions and Application layers. We
also stored our InstanceRender and PortRender abstractions in a single story
abstraction called VisualPortGraphNode, and changed our wire abstraction into
a story abstraction called VisualPortGraphConnection.
Figure 4.35: An example of the initial ALA code generation in GALADE.
4.5.4 Sprint 4
In this sprint, we supplemented our implementation of PR2 by adding the abil-
ity to save ALA diagrams. Our initial approach was to walk through each
VisualPortGraphNode and VisualPortGraphConnection in the diagram
and save their contents in a string using the commonly-used JSON format (Severance,

Chapter 4. Design and Development 128
2012), in a file with a new .ALA extension, to denote an ALA diagram. Once that was
complete, we were able to spend the remainder of the sprint converting our XMind
diagram into a diagram in GALADE. Therefore, at this stage, GALADE had become
self-generating, and we finally had a basic version of GALADE working that could be
used to create ALA applications. We stored templates for nodes in JSON files as well,
which would contain the default parameters, port names, and port types for each type of
domain abstraction.
In this sprint, we also added an initial implementation for OR5, i.e. abstraction template
source file generation.
4.5.5 Sprint 5
In this sprint, we started working on implementing PR3, i.e. code to diagram generation.
At this stage, we realised that for the end user, a simpler method of visualising an
ALA diagram would be to dynamically generate the diagram from its corresponding
application code at runtime. As we knew that we were only two sprints away from
software engineers at Datamars using GALADE, we figured that implementing diagram
generation in this way would also make it easier for the team to transition from using
XMind to using GALADE for developing DMA, as they would otherwise have to
recreate the entire XMind diagram for DMA from hand in GALADE, like we did
when we moved from XMind to GALADE. This would also handle parsing abstraction
templates automatically from their source files, instead of having to store templates.
We needed a way of parsing application code, so instead of writing our own parser, we
opted to use the freely available Roslyn code analysis platform created by Microsoft
(Harrison, 2017). We created a CodeParser domain abstraction to handle code
parsing, but quickly realised that this abstraction would require a very large number of
ports, as CodeParser should be able to emit any necessary details from a C# class,

Chapter 4. Design and Development 129
from its class name, to its method names, to stored interfaces, properties, arguments,
and so on. This motivated us to try a new approach, where instead of accessing
CodeParser through wiring, we would use its public methods. While this was outside
of the norm for ALA, it was not breaking any of the core principles. Because of this new
approach, we also reworked our node and wire abstractions into the story abstractions
ALANode and ALAWire respectively, which made use of public methods. This also
led to the creation of the Port, Graph, and AbstractionModel abstractions, so
by this stage, we had created all of the core graph data structure abstractions described
in Section 4.4.3.
4.5.6 Sprint 6
In this sprint, we added finished adding implementation for PR3, and also implemented
PR4. Implementing PR4 involved storing documentation found in source files by
CodeParser in the diagram. We spent the rest of the sprint fixing bugs and refactoring
our application diagram. The diagram for GALADE had become very large, so we
started separating the diagram into subdiagrams of cohesive features, and connected
them to one another through reference nodes. We also implemented various other
usability features, like adding node summary overlays when the diagram is zoomed out,
and adding a search function for instances.
At the end of this sprint, we finally released GALADE v1.0.0.
4.5.7 Sprint 7 and 8
In these sprints, we spent most of our time working on bug fixes based on reports from
the software engineers at Datamars who were now using GALADE on a daily basis.
During Sprint 8, we also added the ability to navigate between diagrams seamlessly
between common nodes, to make it easier to move between subdiagrams, especially

Chapter 4. Design and Development 130
since the team at Datamars had now also split their main application diagram into
multiple subdiagrams.
4.5.8 Sprint 9
In this sprint, we worked on implementing OR1, i.e. debugging support, as shown in
Section 4.4.5.
At this point in time, the team at Datamars had to move on to other projects, so their
work with GALADE had stopped. However, their usage of GALADE was a success, as
is discussed in Section 5.2.4, so at this stage, we were able to confirm that GALADE
was fully capable of supporting ALA application development.
4.5.9 Sprints 10, 11, and 12
In the remaining three sprints, as GALADE was now a fully-featured ALA application
development tool, we spent far less time working on GALADE, mainly opting to work
on small bug fixes and refinements. We also reworked our abstraction file template
creation, which now included a preview option to see what the created file and node
would look like, as shown in Figures 4.5 and 4.7, and the created file, either a domain
abstraction or story abstraction, would automatically be added to the current project.
Sprint 12 concluded with the release of GALADE v1.14.1.
4.6 Summary
In this chapter, we have examined the design of GALADE from an ALA perspective,
and have touched on some novel additions to ALA from this project. The addition of
a new layer, the Story Abstractions layer, has allowed us to reuse subdiagrams and
implement more complicated features, such as being able to dynamically instantiate

Chapter 4. Design and Development 131
node and wire abstractions that contain changing UI arrangements and data models.
We have also examined the various features added in GALADE that may significantly
help developers create, maintain, and read ALA diagrams. We ended the chapter with a
summarised account of the development process of GALADE in terms of 12 monthly
sprints.

Chapter 5
An Industry Case Study
As described in Section 3.5, it is necessary to demonstrate the artefact created in a
single, representative use case, in order to show the potential viability of the artefact. In
this chapter, we will discuss a case study of how GALADE was used at Datamars over
a 10-week period.
In particular, we will explore how the usage of GALADE impacted the productivity of
the team working on a desktop ALA application. For confidentiality reasons, we will
refer to this application as Datamars Application (DMA).
Section 5.1 details how we decided on this particular case study. Section 5.2 discusses
how GALADE was used at Datamars, and what insights we were able to extract. Section
5.3 describes the limitations and threats to validity faced in this case study. Finally,
Section 5.4 summarises the results and findings of this chapter.
5.1 Choosing the Use Case
According to Johannesson and Perjons (2014), the use case to be chosen should be
appropriately representative of the research problem that the development of the artefact
seeks to solve. Given that our core issue revolves around improving the productivity of
132
Chapter 5. An Industry Case Study 133
ALA-based development at Datamars, it seemed appropriate to conduct a “test run” of
GALADE in that very environment to show its feasibility.
This case study was conducted on software engineers using GALADE on Windows
10 PCs with similar specifications to those provided in Table 6.1. The versions of
GALADE they used ranged from GALADE v1.0.0 to GALADE v1.13.0, as their
feedback led to us rapidly improving on GALADE and releasing increasingly stable
and feature-rich versions within this 10-week period.
5.2 Demonstrating the Artefact
We provided the software engineers at Datamars who were working on DMA with
GALADE as a replacement for XMind and XMindParser. The engineers were on a
relatively tight schedule, so we did not have the time to perform controlled experiments
or user studies. Instead, we let them use GALADE and just the recorded the number of
hours worked and number of tasks completed, in the form of issue tickets, and noted
down any general feedback they had.
5.2.1 Getting the Team Started With GALADE
To ease the transition from XMind diagrams to GALADE, we made sure that the
GALADE version provided was able to create diagrams from code previously generated
from XMind using XMindParser, so there was no need to manually recreate the existing
diagram in GALADE.
As with any tool, there existed a learning curve with getting the hang of GALADE.
However, since GALADE’s diagramming functionality resembled XMind, and its code
generation functionality resembled that of XMindParser, we found that the engineers
were able to use GALADE comfortably within a few hours. This does not account for
the learning curve of ALA development in general, so a brand new user would likely
Chapter 5. An Industry Case Study 134
take longer to get the hang of GALADE.
5.2.2 Issue Tracking
The team working on DMA did so using Agile (Cohen et al., 2004) methodologies, in
particular Scrum (Schwaber, 1997). They worked in weekly sprints, and each engineer
was assigned a set amount of issue tickets to resolve each week. The project had a
significant backlog of issues to resolve, so there were never any weeks where engineers
had little to do.
All major ALA projects have made use of version control, in particular git (Loeliger &
McCullough, 2012). GitLab (https://gitlab.com) was the designated repository
home for DMA, and all issues were tracked and assigned as tickets here. We were able
to obtain the data related to every ticket completed for DMA from GitLab.
5.2.3 Changes in Functionality
The DMA team returned plenty of feedback during their time using GALADE, mainly
bug reports, but also a few feature requests, and improvements to GALADE were made
to accommodate their feedback.
Supporting Multiple Diagrams
Since the engineers were making a transition from an old tool to a new tool, they also
sought to take this time to address their approach to ALA application development.
At this point in time, DMA consisted of two major diagrams, which had become
excessively large, affecting both understandability and performance: the diagrams were
too large to easily read, and they were so large that simple actions like panning and
modifying nodes were executed slowly by XMind.
To help avoid these issues with GALADE, we suggested, based on our experience
Chapter 5. An Industry Case Study 135
with using separate diagrams connected by reference nodes, as discussed in Section
4.4.5, to separate the existing diagrams into small diagrams that connect to one another.
This would lead to each diagram representing a significant requirement, or a small but
significant collection of requirements. This approach would also be followed for future
requirements.
One of the reasons that this approach was not used sooner was that having too many
diagrams could end up causing as much confusion as one monolithic diagram, especially
when the tool used has no knowledge of how the separate diagrams combine with one
another. This therefore led to the team requesting for GALADE to have some kind of
support for navigating between multiple diagrams.
Since the different diagrams combined to form one application, and shared instances, the
team found it easiest to store the code for the different diagrams in the same application
code file, separated by comment tags to identify which diagram a given code block
belonged to. A feature was added to GALADE that allowed for the user, at launch,
to select which diagram that they wanted to open. Given how the diagrams were
stored, this feature involved GALADE parsing the entire application file at runtime, and
keeping track of the different diagram code blocks and their associated comment tags.
The diagram names stored in the comment tags would be presented to the user, and the
appropriate diagram would be loaded upon selection through a dropdown menu.
Another feature was added to help different diagrams feel connected in GALADE.
When GALADE would parse the application file at runtime, it would now also keep
track of the same instance being used across different diagrams. In a given diagram,
any nodes that were used in multiple diagrams would either appear as orange reference
nodes, as shown in Figure 4.31, if they were instantiated elsewhere, or as regular nodes
with blue outlines, if they were instantiated in this diagram and referenced elsewhere,
as can be seen in Figure 5.1. In the context menu of either type of node, every related
diagram is shown, and when one is selected, GALADE will open that diagram and

Chapter 5. An Industry Case Study 136
navigate to the first found usage of that node.
Figure 5.1: Three views of the same instance node, menu_tools, which is referencedin the Debugger and CreateAbstractionTemplateFile diagrams. An in-stance node that is referenced in other diagrams will have a blue outline in its originaldiagram.
5.2.4 Measuring Increases in Productivity
Context
To measure the effect that GALADE had on the productivity of the DMA team, we
viewed the data for the issues stored on GitLab. In particular, we looked at how many
issue tickets were closed over time. Individual tickets represent tasks that need to be
completed, so viewing the trends in their completion was a reasonable approach to
measure productivity (Igaki, Fukuyasu, Saiki, Matsumoto & Kusumoto, 2014).
DMA went through four significant periods of development. The first three periods
occurred consecutively, and the fourth period started after a six-month gap, and is when
GALADE was used.
Chapter 5. An Industry Case Study 137
Initially, there was a six-month period where a single software engineer worked on the
project as a research endeavour regarding ALA. During this time, although the project
was stored on GitLab, issues were not tracked on tickets. As a result, no issue data
exists for this period of time, during which XMind was used, and code was generated
by hand from the diagram.
A second period of three months saw a new group of three software engineers taking
over the project. This period is when ticket creation and assignment began on GitLab,
so this is when our data starts to appear. Like the first period, only XMind was used
here, with manual code generation. This is also when the development for XMindParser
began.
A third period of another three months involved the use of XMindParser in conjunction
with XMind, and the results from this period motivated the creation of GALADE.
In the fourth period, a new team of three, with one returning member, started work on
DMA using GALADE. This latest period occurred over three months, and involved 10
weeks of active development. The fourth period also took place several months after
the third period.
Data Collection and Visualisation
We collected the ticket data from GitLab for periods 2-4 and bucketed them into their
respective weekly sprints. Periods 2-4 encompassed 42 weekly sprints in total. In terms
of tickets, 740 were opened over the 42 sprints, of which 592 were resolved and closed.
This data was then cleaned, and 46 tickets that were either duplicates or not related to
development, namely those that related to planning the project or answering queries
about the project, were removed, leaving a total of 546 closed tickets. This data has
been plotted in Figure 5.2.

Chapter 5. An Industry Case Study 138
Figure 5.2: A graph showing the total number of tickets closed in GitLab for DMA.
The amount of time spent on development for DMA was not the same for each period.
Therefore, we have also considered the total hours worked on DMA for each of periods
2-4, and have measured the number of tickets completed per hour worked, as can be
seen in Figure 5.3.

Chapter 5. An Industry Case Study 139
Figure 5.3: A graph showing the total number of tickets closed in GitLab for DMA perhour worked.
Discussion
From Figure 5.2, we can see that the rate of the total number of tickets closed increases
at a relatively linear rate from sprints 1 through 31. We can also see that the rate of
tickets being closed increased after GALADE was introduced - the number of tickets
closed increased from 288 to 546 during this period, i.e. an increase of 258 tickets. This
period of 12 weekly sprints saw a closed ticket count increase equalling 90% of the
total number of tickets closed up until that point, from weekly sprints 1 through 30.
When accounting for the number of hours worked, we can see from Figure 5.3 that
sprints 1 through 13, when code had to be manually generated from XMind diagrams,
showed the least amount of productivity in terms of tickets closed. The spike in
productivity in the first sprint can be attributed to beginner-friendly tickets being
resolved, and it took the team some time, until sprint 6, where the rate finally started
to increase, likely due to the team becoming familiar with ALA and the development

Chapter 5. An Industry Case Study 140
workflow at this point. The rate steadily increased over time, and continued to increase
after XMindParser was introduced.
We can also see that sprints 31 through 42 still show an overall upwards trend. Since
the team at this point had some new members, we can see that, like with sprints 1-6, it
took the team some time (5 sprints) until the rate increased, after which it increased to
more than that of any point in sprints 1 through 31.
The trends observed suggest that productivity increased while GALADE was used on
a daily basis, however since this is not a controlled study, we can only speculate that
the correlation between GALADE being introduced and the improvements in the rate
of tickets being closed are in fact a causal relationship. Nonetheless, we do not see
any trends suggesting that GALADE had a negative impact on ALA development, and
instead GALADE appears to show promise as a proof of concept, and works in a real
use case environment.
5.3 Limitations and Threats to Validity
During the development of DMA, the team of software engineers changed, so their
differences in experience may have impacted the level of productivity at different
stages of development. This was mitigated somewhat by hiring software engineers of
similar levels of experience. All of the software engineers hired had little professional
experience with developing software.
As the software engineers developed DMA, they became more experienced with de-
veloping using ALA, and therefore would have likely become more productive over
time on their own. It is therefore unclear to what extent the increases in productivity
measured were due to improvements in their own abilities compared to improvements
in the tooling provided.
By measuring productivity in terms of tickets completed, we have treated every ticket

Chapter 5. An Industry Case Study 141
as the same, i.e. we assumed that each ticket required the same amount of effort to
complete. We expected that given a sufficient sample size of closed tickets for each
period, the quality of tickets would average out. The first period (sprints 1 through 13)
involved 131 closed tickets, the second period (sprints 14 through 31) involved 157
closed tickets, and the final period (sprints 32 through 42) involved 258 closed tickets.
Since each period involved between 130 and 260 closed tickets, we assumed that our
sample sizes for each period were sufficiently large and roughly equal.
Another potential source of bias could be that ticket closing rates increased towards
the end of each period due to the developers feeling pressured to produce a releasable
version of DMA. One way we tried to alleviate this was to not enforce an expectation of
any given feature set to be ready by the end of any of the periods. However, it is possible
that the developers still imposed such expectations on themselves. Unfortunately, we
also did not have access to any ticket data to compare to for other projects that were
similar in scale. That being said, the development period for DMA when GALADE
was used took place several months after the end of the previous period, and for the
majority of the period, we see an improved rate of ticket completion over the previous
periods. It is therefore unlikely that any deadline pressure present actually contributed
to a significant amount of this increase when looking at the trends over the course of
the entire 42 sprints.
5.4 Summary
In this chapter, we showed an example of GALADE being used in a real environment.
As per the design science method outlined by Johannesson and Perjons (2014), the
purpose of this demonstration was to confirm whether GALADE works as intended
and is actually a viable solution. We have shown that not only does GALADE function
correctly in a real use case, but that our collected development ticket data suggests

Chapter 5. An Industry Case Study 142
that GALADE has promise and can potentially lead to significant improvements in
productivity.
Chapter 6
Evaluation
This chapter illustrates the methods used and the results found for evaluating GALADE,
and comparing it with XMind and XMindParser, with the aim of showing the degree
of improvement that GALADE exhibits over the existing methods of ALA application
development.
We have conducted both qualitative and quantitative evaluations of GALADE, XMind,
and XMindParser. In particular, we will go through each Priority Requirement PR1
- PR6, as defined in Section 3.3, and examine how GALADE satisfies these require-
ments. PR1 - PR5 are evaluated qualitatively, while PR6 is evaluated quantitatively, by
measuring the response time experienced for various common tasks when using the
aforementioned tools for ALA application development.
Section 6.1 discusses how our evaluation was designed as per the guidelines in Section
3.6. Section 6.2 discusses the setup and execution of GALADE’s formal evaluation. As
explained in Section 1.2.1, one of the main motivations for developing GALADE was
to produce a tool that would significantly improve the ALA application development
process. Section 6.3 contains the conclusions that we have drawn from the evaluation as
they link to this motivation. Section 6.4 describes the limitations and threats to validity
faced by our evaluation process. Finally, Section 6.5 summarises the key insights and
143
Chapter 6. Evaluation 144
contributions made throughout this chapter.
6.1 Evaluation as a Design Science Step
As mentioned in Section 3.6, the evaluation of GALADE is the final step in the design
science approach that we have used, and can separated into three sub-activities: Analyse
Evaluation Context, Select Evaluation Goals and Strategy, and Design and Carry
Out. This section will explain how our evaluation maps to these three sub-activities.
• Analyse Evaluation Context: In terms of scope, we had a fixed timeframe to
abide by, so the evaluation would need to be completable within a few months.
Since our main motivation for conducting this research was to produce an artefact
that is an improvement over a known pair of existing tools, we chose to focus
the evaluation scope to objective feature and performance comparisons between
GALADE, XMind, and XMindParser.
• Select Evaluation Goals and Strategy: Our goal with this evaluation is to de-
termine whether GALADE has satisfied the requirements set out in Section 3.3,
and whether it is an improvement over XMind and XMindParser in terms of being
a support tool for ALA application development. In terms of strategy, we have
elected to perform a qualitative analysis, feature by feature, as they relate to the
requirements, and we will conduct a quantitative analysis to measure improve-
ments in performance for GALADE compared to XMind and XMindParser. The
qualitative analysis is best seen as a naturalistic evaluation in the form of informed
arguments, while the quantitative analysis is an artifical evaluation composed of
experiments.
• Design and Carry Out: The remainder of this chapter will detail how the
evaluation of GALADE was designed and executed.

Chapter 6. Evaluation 145
6.2 Evaluating GALADE
As described in Section 2.1.2, XMind and XMindParser were used for ALA develop-
ment in Datamars. We will compare GALADE against the combination of XMind and
XMindParser, as they are the tools that Datamars aim to replace with GALADE.
6.2.1 The Test Environment
We used a single PC at Datamars to obtain all of the performance measurements. Table
6.1 details its specifications. This PC was also used for the majority of GALADE’s
development. This configuration is also relatively similar to other PC configurations
used at Datamars, except most of the other PCs use Windows 10. Additionally, all
screenshots were taken at 1920 × 1080 on a machine running Windows 10.
Component SpecificationMonitor(s) 2 × 23 inch @ 60 Hz, 1920 × 1080CPU Intel Core i7-4790 @ 3.6 GHzRAM 16 GBGPU NVIDIA Quadro K2200OS Windows 7 Professional Edition 64-bitGALADE GALADE v1.13.0XMind XMind 2020XMindParser XMindParser v1.6
Table 6.1: Specifications for the test environment for evaluating GALADE, XMind, andXMindParser.
With reference to Table 6.1, GALADE v1.13.0 is available at https://
github.com/arnab-sen/GALADE/releases/tag/v1.13.0, XMind
2020 is available at https://www.xmind.net/xmind2020/, and
XMindParser v1.6 is available at https://github.com/johnspray74/
ReactiveCalculator/releases/tag/XMindParser_v1.6.
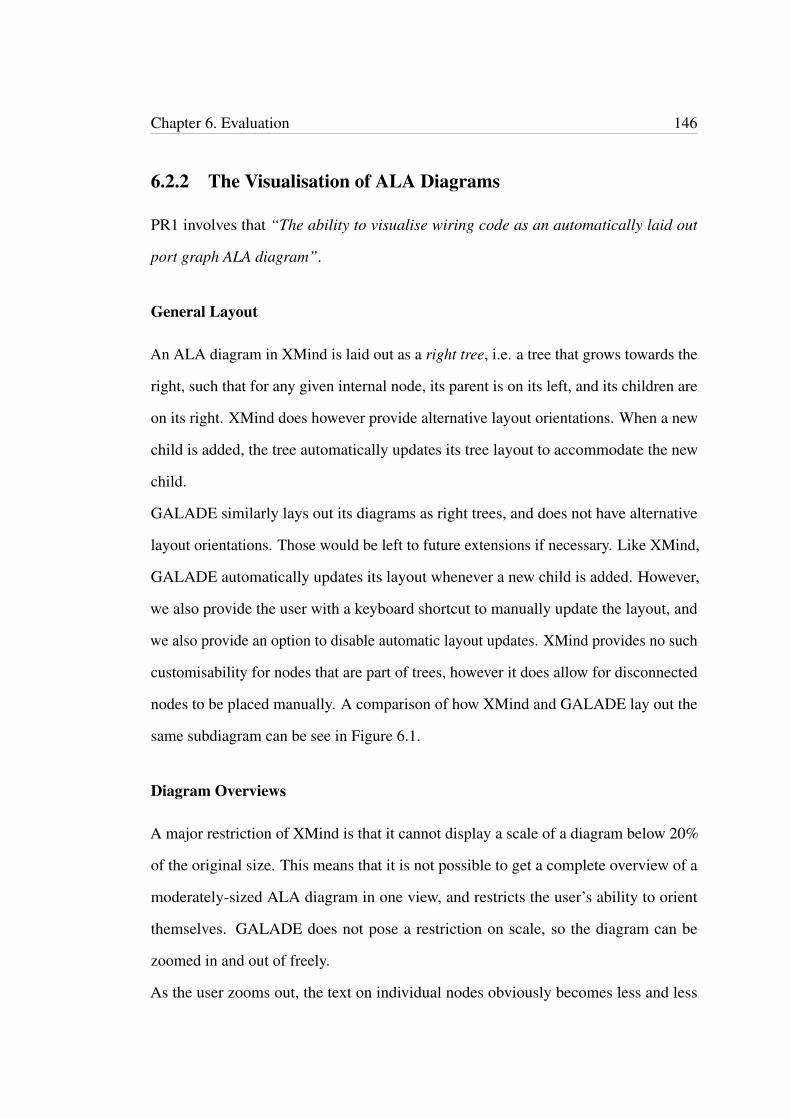
Chapter 6. Evaluation 146
6.2.2 The Visualisation of ALA Diagrams
PR1 involves that “The ability to visualise wiring code as an automatically laid out
port graph ALA diagram”.
General Layout
An ALA diagram in XMind is laid out as a right tree, i.e. a tree that grows towards the
right, such that for any given internal node, its parent is on its left, and its children are
on its right. XMind does however provide alternative layout orientations. When a new
child is added, the tree automatically updates its tree layout to accommodate the new
child.
GALADE similarly lays out its diagrams as right trees, and does not have alternative
layout orientations. Those would be left to future extensions if necessary. Like XMind,
GALADE automatically updates its layout whenever a new child is added. However,
we also provide the user with a keyboard shortcut to manually update the layout, and
we also provide an option to disable automatic layout updates. XMind provides no such
customisability for nodes that are part of trees, however it does allow for disconnected
nodes to be placed manually. A comparison of how XMind and GALADE lay out the
same subdiagram can be see in Figure 6.1.
Diagram Overviews
A major restriction of XMind is that it cannot display a scale of a diagram below 20%
of the original size. This means that it is not possible to get a complete overview of a
moderately-sized ALA diagram in one view, and restricts the user’s ability to orient
themselves. GALADE does not pose a restriction on scale, so the diagram can be
zoomed in and out of freely.
As the user zooms out, the text on individual nodes obviously becomes less and less

Chapter 6. Evaluation 147
Figure 6.1: A comparison of how the same subdiagram is laid out in XMind (left) andGALADE (right). They are both laid out as trees growing towards the right.

Chapter 6. Evaluation 148
readable. In GALADE, nodes are covered by overlays that describe their variable name
and class type when their text becomes too small to read, and specifically, when the
diagram is zoomed out to smaller than 60% of its original size. In XMind, no such
feature exists.
In Figure 6.2, we can see that for medium-sized diagrams, XMind cannot zoom out to
show the full diagram, whereas GALADE can. Additionally, individual nodes can still
be distinguished in the zoomed out view in GALADE, whereas the text in the nodes in
XMind become illegible.
Node Content
In XMind, the contents of a node are treated as plain text. The text inside can be
formatted in the standard way, such as being made bold, italicised, horizontally aligned,
and so on. The issue that the contents being treated as text creates is that all information
for an abstraction’s instantiation is grouped together into one text block. Using the
conventions described in 2.1.2, XMindParser is able to understand the contents of the
node.
In GALADE, the contents of a node are separated into visually distinct areas,
as annoted in Figure 6.3. This makes it easier to identify the different com-
ponents of a node at a glance. For example, in Figure 6.4, we can see that
text wrapping has occured in the XMind node in such a way that the vari-
able name loadNewAbstractionTypeTemplate is on a new line. At first
glance, it could be easy to assume that this is a variable being passed into the
ApplyAction<JToken> instance as a constructor argument. In GALADE, this
is not the case, as the variable name has a very clear placement in the top row of the
node.
This feature can also help reduce errors in a node’s definition: in XMindParser, there is
nothing in place to ensure that every line is correctly placed, for example the user could
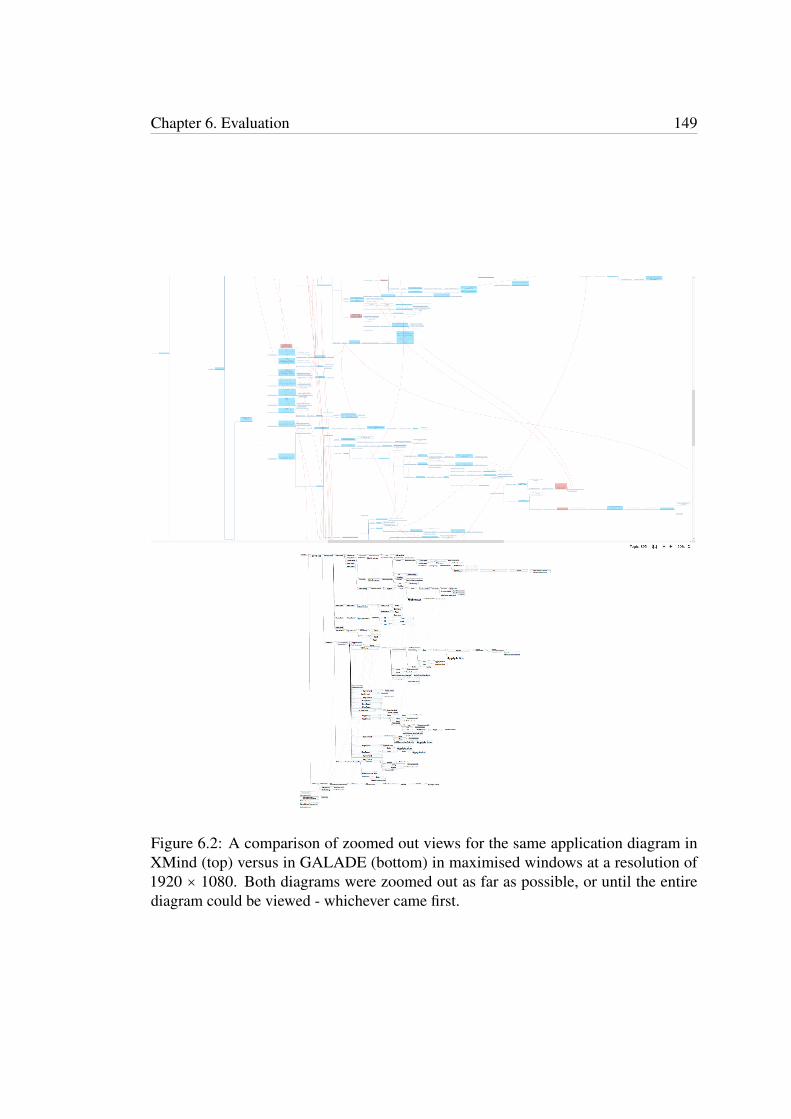
Chapter 6. Evaluation 149
Figure 6.2: A comparison of zoomed out views for the same application diagram inXMind (top) versus in GALADE (bottom) in maximised windows at a resolution of1920 × 1080. Both diagrams were zoomed out as far as possible, or until the entirediagram could be viewed - whichever came first.

Chapter 6. Evaluation 150
Figure 6.3: A comparison of a domain abstraction instance in XMind (top) versus inGALADE (bottom).
accidentally place the first constructor argument line above the line where the variable
name goes. In GALADE, the individual components in a node cannot be moved, so the
user can instead focus on just filling the fields out like a form.
Some abstractions can contain C# anonymous functions in their node definition, which
are simply inline function definitions that are assigned as variables. They are also
referred to as lambda functions both in domain abstractions in GALADE, as well as in
other languages such as JavaScript. These can span multiple lines, so a C# developer
would expect that they can be separated into new lines and indented. However, in XMind,
new lines are reserved for separating entire variable assignments, so any anonymous
functions written must be written in one line. Reading them then becomes an unusually
difficult task.
The anonymous function in Figure 6.3 is technically a single line in XMind, but appears
to span multiple lines due to the node’s word wrapping. In GALADE, the formatting

Chapter 6. Evaluation 151
Figure 6.4: A comparison of how a node with an anonymous function appears in XMind(top) versus in GALADE (bottom).
for the function is clear and in its own distinct text box.
In GALADE, every member value text box supports multiline code and indentation,
making anonymous functions much easier to read.
Additionally, Roslyn automatically formats the text of these functions to be spaced out
and indented correctly, so if changes are made at the code level, then the user does not
need to be concerned with maintaining the correct whitespace formatting, so long as
the text is still compilable C# code.
Port Layout
XMind does not support the drawing of port graphs, which means that for ALA diagrams,
ports have to be drawn as separate nodes. They then must follow the same layout rules
as regular nodes, which means that only one port can be on the left of a node as its
“parent”, and the remaining ports must be laid out as children of the instance node,
regardless of whether they are input or output ports. While conventions have been
established in Section 2.1.2 to differentiate input ports from output ports, it can still

Chapter 6. Evaluation 152
lead to confusion, especially for those new to ALA, when trying to understand the flow
of an ALA diagram in XMind. In addition, ports are separated by the standard distance
between any two nodes in XMind, so the space that a single instance node occupies
scales linearly with the number of ports that it has.
In GALADE, input ports are laid out on the left of instance nodes, and output ports are
laid out on the right. This means that it is clear when an instance node is the source or
the destination of a wire. Ports are also treated differently than instance nodes, and are
laid out compactly, which also means that the diagrams are smaller than they would be
in XMind, as can be seen in Figure 6.2. Both of these factors contribute to improving
the readability of ALA diagrams in GALADE. Examples of the port layouts can be
seen in Figure 6.3. Note how the visible port is on the right in the XMind view, and
on the left in the GALADE view.
Cross-Connections
ALA diagrams are graph-based, and allow for cross-connections between instances,
i.e. connections between a parent and a child where the child is already parented to
another node. However, since both XMind and GALADE have tree-based layouts,
cross-connections cannot be shown in the standard way, i.e. in a parent-child tree
connection. In XMind, cross-connections are represented by red curved arrows with
arrowheads, and in GALADE, cross-connections are similarly represented by curves
that do not adhere to the automatic right tree layout. Cross-connections in XMind do not
have arrowheads because whether a port is on the left or right side of a node indicates
whether it is the destination or source, respectively, of a given wire, so an arrowhead
would not provide any additional information.
In GALADE, cross-connections that are automatically generated from existing code
have their opacity reduced by default. They are still visible to the user, but noticeably

Chapter 6. Evaluation 153
help reduce the visual clutter of cross-connections overlapping nodes. Any new cross-
connections generated while GALADE is running are given their original full opacity
to help emphasise them. Saving and reloading the diagram would then make these
cross-connections have reduced opacities as well. In XMind, no such distinction is made
for cross-connections, which can lead to significant visual clutter. Cross-connections
are also not automatically routed in a way that removes overlaps with nodes in either
XMind or GALADE. Examples of cross-connections can be seen in the views shown in
Figure 6.2.
6.2.3 Code Generation from ALA Diagrams
PR2 involves “The ability to convert an ALA diagram into its directly equivalent wiring
code, such that changes in the design can just be made once in the diagram, and
automatically be updated in the code”.
XMindParser was built for generating code, so this is where its strength lies. For
the most part, generating ALA code just involves generating class instantiations and
WireTo calls involving those instantiations. XMindParser is able to do this, so long as
the ALA diagram in XMind conforms to the correct grammar. The generated code is
inserted between comment markers in the target application class file.
Code generation in GALADE is similar: instantiations and WireTo calls are generated
from the nodes and wires in the diagram, respectively. However, the user does not need
to ensure that they conform to a certain grammar, as this is inherent when creating
diagrams in GALADE.
Both programs generate code in C#. Both can also be configured to generate ALA code
in other languages by extending their source code.
In GALADE, we have also implemented the ability to generate pre-formatted abstraction
source files. This functionality is not present at all in XMind or XMindParser, and is

Chapter 6. Evaluation 154
shown in more detail in Section 4.3.1. This functionality satisfies Optional Requirement
5, as defined in Section 3.3.
Application code generation is at a similar level between GALADE and XMindParser.
A comparison between the two can be seen in Figure 6.5. They differ in three main
ways:
1. Generated comments: XMindParser generates a summary of the ports and types
involved through a visual aid, whereas GALADE generates metadata for the
respective instantiation or wiring.
2. Instance Names: GALADE always generates an InstanceName property for an
instance equivalent to its variable name, whereas XMindParser does so only when
manually added to the node in XMind, and generates “Default” otherwise.
3. Spacing: GALADE splices together segments generated by Roslyn, and they do
not include spaces between code units. XMindParser generates spaces between
all tokens through a custom code builder.
Overall, instantiation and wiring generation in GALADE is approximately the same to
that in XMindParser, and GALADE provides the novel functionality of producing pre-
formatted abstraction template files. Therefore, we consider the ALA code generation
in GALADE to be improved over that in XMindParser.
6.2.4 Diagram Generation from ALA Code
PR3 involves “The ability to provide a means of recovering the diagram from wiring
code”.
XMindParser provides no means of generating an ALA diagram from an ALA applica-
tion’s code. This means that if changes are made to the code, they must also be made
to the diagram. In addition, an XMind diagram is a standalone entity, meaning that

Chapter 6. Evaluation 155
Figure 6.5: A comparison of code generation by XMindParser (top) versus by GALADE(bottom) for the same set of instances and WireTo calls, with word wrap in the texteditor applied.
Chapter 6. Evaluation 156
the representation of the application resides in both the source code and the XMind
diagram.
With GALADE, the diagram it shows is not actually stored anywhere separate from the
source code at any time except while GALADE is open. This is because GALADE
“loads” a diagram by being provided an ALA application source file. On load, it produces
a visualisation based on the source code provided, which is stored in a temporary
data structure. The diagram can be easily reloaded through the Sync > Code to
Diagram menu option. GALADE also uses Roslyn to parse the application C# code,
so GALADE can generate a diagram from any valid compilable C# code that involves
WireTo calls.
Before loading the diagram, GALADE requires that the user point it to the ALA
application’s project folder, so that it can parse all of the ALA-specific info from the
abstractions to show in the diagram. This also means that changes in any class or
interface file, such as port names, can easily be reflected in the diagram by reloading
the project and diagram. This is not possible in XMind.
6.2.5 How an ALA Diagram Shows Documentation
PR4 involves “The ability to support an ALA diagram being the main source of truth
for the requirements that it expresses”.
XMind can only show documentation that has been placed there manually, so de-
scriptions for domain abstractions and programming paradigms, along with individual
requirements expressions, would be placed in the diagram. This also meant that even if
a description for a domain abstraction’s class was added to its source code, the same
documentation would have to be copied into the diagram. Like the code, changes to doc-
umentation in the source code would have to manually be reflected in the documentation
in the diagram.
Chapter 6. Evaluation 157
GALADE allows the user to add documentation to any node or wire, and it is retained
by being generated alongside their respective instantiation or wiring in a comment.
When the source code for abstractions are parsed, their documentation is also stored.
Specifically, text above the class/interface definition, and any documentation above
public properties and fields are stored in the diagram, and are viewable through the
tooltips appear when the user hovers over different parts of nodes. Examples of
these tooltips can be seen in Figure 4.9. This means that instead of storing all the
documentation in the diagram manually, some documentation can be stored in the
diagram, and some can be stored in the code, and all can be viewed through GALADE
at runtime.
6.2.6 Extensibility
PR5 involves “The ability to be developed in such a way that facilitates developing and
adding new features to the tool itself”.
XMindParser was not developed with any particular architecture in mind. It is a
relatively straightforward C# GUI application. New features would have to be directly
extended through the source code, and there are no specific design choices that improve
extensibility.
Since GALADE was developed using ALA, its design can largely be seen through ALA
diagrams. GALADE can also be used to develop itself. New features can be added
using the plug-in architecture mentioned in Section 4.4.5. New diagrams can be made
on their own, and added to the Application file.
6.2.7 Performance Overhead
PR6 involves “The ability to not slow down significantly as the diagram size increases”.
Three test cases have been obtained: one small, one medium, and one large. The small

Chapter 6. Evaluation 158
test case has been hand-made for this evaluation, while the medium and large test cases
are ALA diagrams used for real applications. All three test cases have been designed
with XMind. Their code was generated using XMindParser, after which they could be
parsed and displayed by GALADE.
The small test case contains a simple ALA application that shows a window with a
vertically arranged menu bar and text box. This case will act as the base case, and
we expect it to exhibit a near-optimal level of performance for XMind, XMindParser,
and GALADE, for the given system specifications. It contains 4 wires, with 25 nodes
in XMind, and 5 instances in GALADE, as shown in Table 6.2. An overview of the
diagram can be seen in Figure 6.6.
Figure 6.6: A view of the entire small test case diagram in GALADE.
Tool Instances Nodes Wires Nodes per Instance
XMind 5 25 4 5
GALADE 5 5 4 1
Table 6.2: Topological measurements for the small test case.
The medium test case is an ALA diagram for an older pre-release version of GALADE,
back when it was being designed using XMind. It contains 273 wires, with 895 nodes
in XMind, and 211 instances in GALADE, as shown in Table 6.3. An overview of the
diagram can be seen in Figure 6.7.

Chapter 6. Evaluation 159
Figure 6.7: A view of the entire medium test case diagram in GALADE.
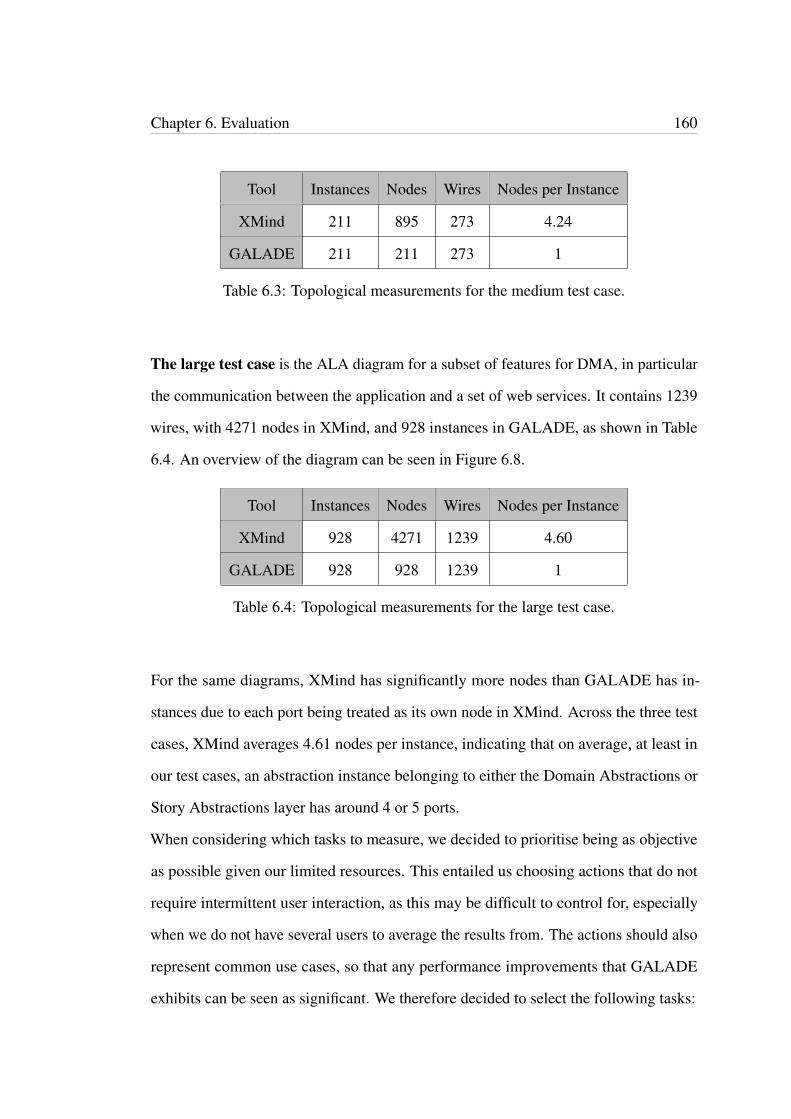
Chapter 6. Evaluation 160
Tool Instances Nodes Wires Nodes per Instance
XMind 211 895 273 4.24
GALADE 211 211 273 1
Table 6.3: Topological measurements for the medium test case.
The large test case is the ALA diagram for a subset of features for DMA, in particular
the communication between the application and a set of web services. It contains 1239
wires, with 4271 nodes in XMind, and 928 instances in GALADE, as shown in Table
6.4. An overview of the diagram can be seen in Figure 6.8.
Tool Instances Nodes Wires Nodes per Instance
XMind 928 4271 1239 4.60
GALADE 928 928 1239 1
Table 6.4: Topological measurements for the large test case.
For the same diagrams, XMind has significantly more nodes than GALADE has in-
stances due to each port being treated as its own node in XMind. Across the three test
cases, XMind averages 4.61 nodes per instance, indicating that on average, at least in
our test cases, an abstraction instance belonging to either the Domain Abstractions or
Story Abstractions layer has around 4 or 5 ports.
When considering which tasks to measure, we decided to prioritise being as objective
as possible given our limited resources. This entailed us choosing actions that do not
require intermittent user interaction, as this may be difficult to control for, especially
when we do not have several users to average the results from. The actions should also
represent common use cases, so that any performance improvements that GALADE
exhibits can be seen as significant. We therefore decided to select the following tasks:

Chapter 6. Evaluation 161
Figure 6.8: A view of the entire large test case diagram in GALADE, which is so largethat it is completely unreadable when fully zoomed out.
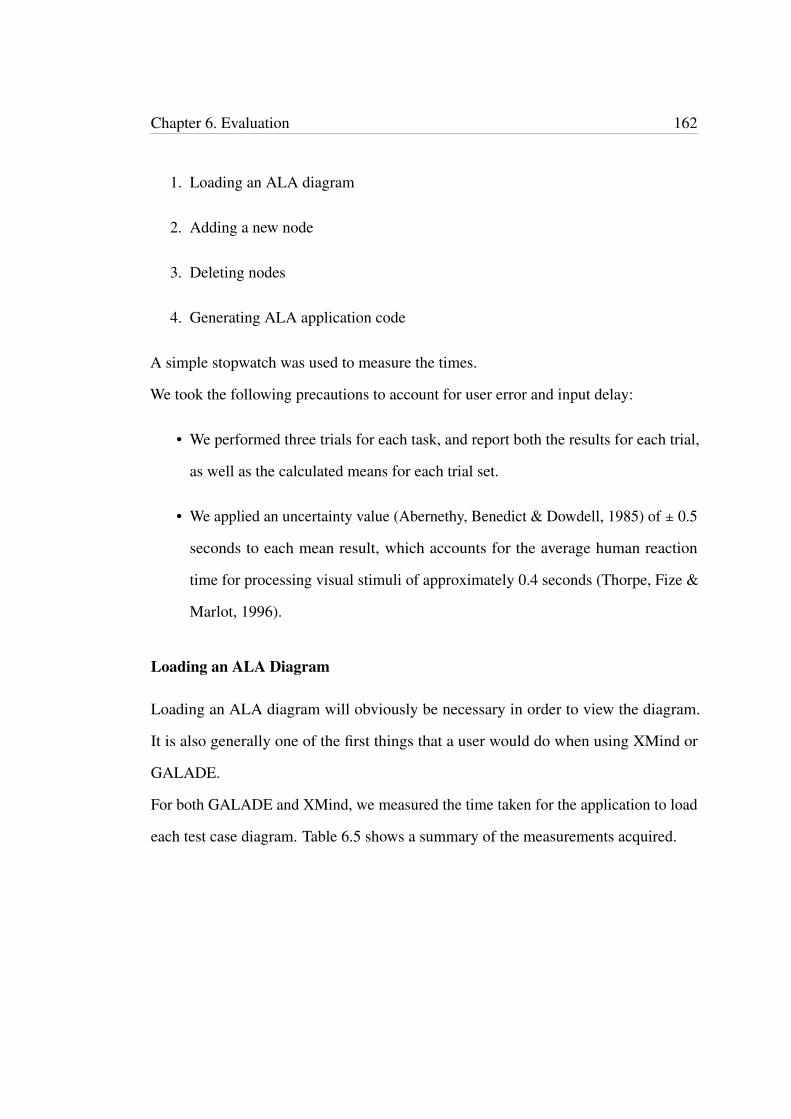
Chapter 6. Evaluation 162
1. Loading an ALA diagram
2. Adding a new node
3. Deleting nodes
4. Generating ALA application code
A simple stopwatch was used to measure the times.
We took the following precautions to account for user error and input delay:
• We performed three trials for each task, and report both the results for each trial,
as well as the calculated means for each trial set.
• We applied an uncertainty value (Abernethy, Benedict & Dowdell, 1985) of ± 0.5
seconds to each mean result, which accounts for the average human reaction
time for processing visual stimuli of approximately 0.4 seconds (Thorpe, Fize &
Marlot, 1996).
Loading an ALA Diagram
Loading an ALA diagram will obviously be necessary in order to view the diagram.
It is also generally one of the first things that a user would do when using XMind or
GALADE.
For both GALADE and XMind, we measured the time taken for the application to load
each test case diagram. Table 6.5 shows a summary of the measurements acquired.
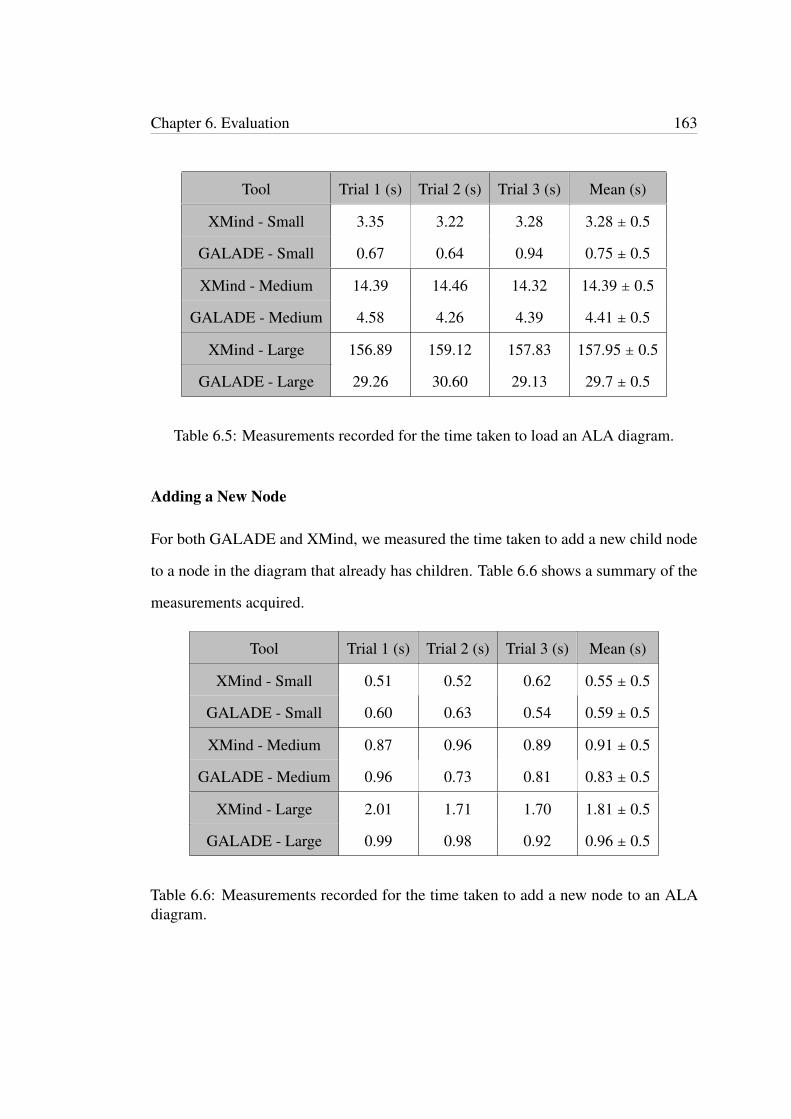
Chapter 6. Evaluation 163
Tool Trial 1 (s) Trial 2 (s) Trial 3 (s) Mean (s)
XMind - Small 3.35 3.22 3.28 3.28 ± 0.5
GALADE - Small 0.67 0.64 0.94 0.75 ± 0.5
XMind - Medium 14.39 14.46 14.32 14.39 ± 0.5
GALADE - Medium 4.58 4.26 4.39 4.41 ± 0.5
XMind - Large 156.89 159.12 157.83 157.95 ± 0.5
GALADE - Large 29.26 30.60 29.13 29.7 ± 0.5
Table 6.5: Measurements recorded for the time taken to load an ALA diagram.
Adding a New Node
For both GALADE and XMind, we measured the time taken to add a new child node
to a node in the diagram that already has children. Table 6.6 shows a summary of the
measurements acquired.
Tool Trial 1 (s) Trial 2 (s) Trial 3 (s) Mean (s)
XMind - Small 0.51 0.52 0.62 0.55 ± 0.5
GALADE - Small 0.60 0.63 0.54 0.59 ± 0.5
XMind - Medium 0.87 0.96 0.89 0.91 ± 0.5
GALADE - Medium 0.96 0.73 0.81 0.83 ± 0.5
XMind - Large 2.01 1.71 1.70 1.81 ± 0.5
GALADE - Large 0.99 0.98 0.92 0.96 ± 0.5
Table 6.6: Measurements recorded for the time taken to add a new node to an ALAdiagram.

Chapter 6. Evaluation 164
Deleting Nodes
For both GALADE and XMind, we measured the time taken to delete subtrees, in
particular, the first subtree found in each diagram. In the small test case, this involves
deleting the entire diagram. In the medium test case, this involves deleting the entire
diagram except for a few individual root nodes at the bottom. In the large test case,
this involves deleting the top third of the diagram. Table 6.7 shows a summary of the
measurements acquired.
Tool Trial 1 (s) Trial 2 (s) Trial 3 (s) Mean (s)
XMind - Small 0.97 0.84 0.93 0.91 ± 0.5
GALADE - Small 0.96 0.65 0.60 0.74 ± 0.5
XMind - Medium 0.80 0.90 0.93 0.88 ± 0.5
GALADE - Medium 0.96 0.69 0.85 0.83 ± 0.5
XMind - Large 8.00 7.40 7.52 7.64 ± 0.5
GALADE - Large 1.68 1.50 1.38 1.52 ± 0.5
Table 6.7: Measurements recorded for the time taken to delete a subtree from an ALAdiagram.
Generating ALA Application Code
For both GALADE and XMindParser, we measured the time taken to generate the wiring
code for each test case diagram. Table 6.8 shows a summary of the measurements
acquired.

Chapter 6. Evaluation 165
Tool Trial 1 (s) Trial 2 (s) Trial 3 (s) Mean (s)
XMindParser - Small 0.74 0.96 0.84 0.85 ± 0.5
GALADE - Small 0.63 0.87 0.72 0.74 ± 0.5
XMindParser - Medium 0.74 0.85 0.91 0.83 ± 0.5
GALADE - Medium 0.88 0.74 0.95 0.86 ± 0.5
XMindParser - Large 0.99 0.86 0.94 0.93 ± 0.5
GALADE - Large 0.99 0.81 0.72 0.84 ± 0.5
Table 6.8: Measurements recorded for the time taken to generate code from an ALAdiagram.
Summary of Results
Figure 6.9: A comparison of the mean results for loading an ALA diagram. The errorbars for each data point are too small to be seen at this chart’s scale.
The results for the diagram loading experiment, as shown in Figure 6.9, show that the
performance overhead for XMind is much more significant for large diagrams than for
GALADE.
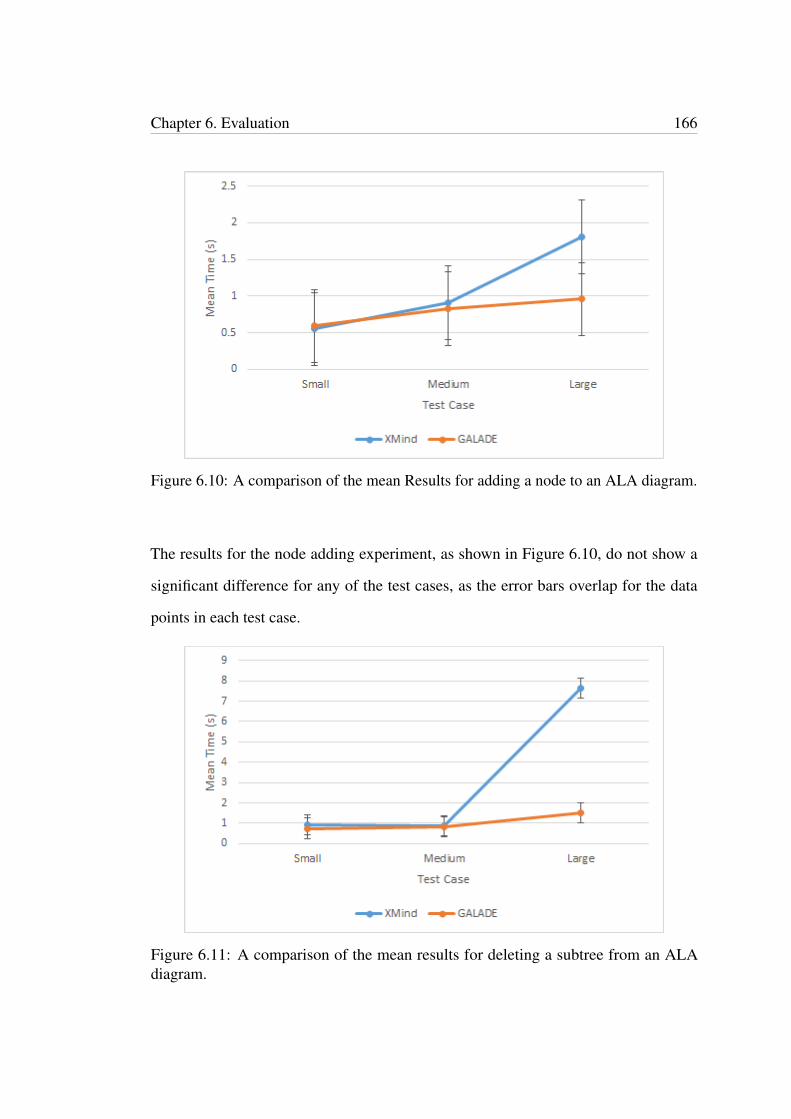
Chapter 6. Evaluation 166
Figure 6.10: A comparison of the mean Results for adding a node to an ALA diagram.
The results for the node adding experiment, as shown in Figure 6.10, do not show a
significant difference for any of the test cases, as the error bars overlap for the data
points in each test case.
Figure 6.11: A comparison of the mean results for deleting a subtree from an ALAdiagram.
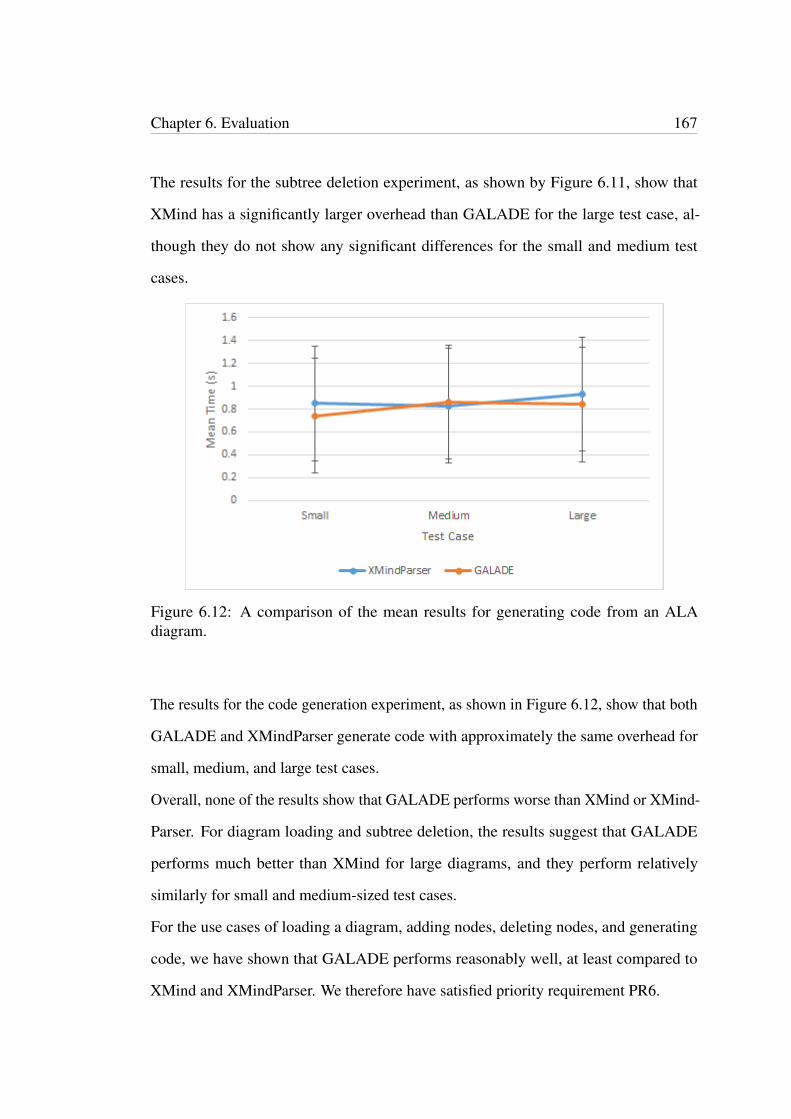
Chapter 6. Evaluation 167
The results for the subtree deletion experiment, as shown by Figure 6.11, show that
XMind has a significantly larger overhead than GALADE for the large test case, al-
though they do not show any significant differences for the small and medium test
cases.
Figure 6.12: A comparison of the mean results for generating code from an ALAdiagram.
The results for the code generation experiment, as shown in Figure 6.12, show that both
GALADE and XMindParser generate code with approximately the same overhead for
small, medium, and large test cases.
Overall, none of the results show that GALADE performs worse than XMind or XMind-
Parser. For diagram loading and subtree deletion, the results suggest that GALADE
performs much better than XMind for large diagrams, and they perform relatively
similarly for small and medium-sized test cases.
For the use cases of loading a diagram, adding nodes, deleting nodes, and generating
code, we have shown that GALADE performs reasonably well, at least compared to
XMind and XMindParser. We therefore have satisfied priority requirement PR6.

Chapter 6. Evaluation 168
6.2.8 Optional Requirements
In addition to a set of priority requirements, we also defined a set of optional require-
ments OR1-OR5 in Section 3.3. We have partially satisfied OR1 through the debugger
plug-in, as described in Section 4.4.5. OR4 has also been satisfied by the fact that
a single application file can store multiple separate diagrams, so the user can easily
create a sandbox diagram to experiment with various wiring compositions before adding
them to one of the actual diagrams. OR5 has been satisfied by the abstraction template
generation feature, as mentioned in Section 6.2.3, and explained in Section 4.3.1.
6.3 GALADE’s Potential Impact on ALA-Based Devel-
opment
As discussed in Section 1.2, a key impetus for the development of GALADE was to
help with ALA-based development at Datamars. As their ALA applications grew, their
productivity decreased, as it became more and more difficult to maintain ALA diagrams
in XMind and keep them aligned with the application code. As we have seen in this
chapter, GALADE provides a wide array of features that can help the development
process.
From a diagram readability perspective, GALADE allows for the entirety of an ALA
diagram to be viewed in a single image. Although the extent of readability depends on
the size of the diagram, as the details in very large diagrams, like the large test case
diagram in Figure 6.8, become too small to read at a fully zoomed out view, GALADE
has made significant improvements in readability at nearly-complete zoomed out views,
such as in the case of diagrams of sizes between those seen in Figures 6.6 and 6.7. The
text within nodes is automatically formatted and indented, and the anatomy of a node is
more tightly compact and encapsulated than in XMind, as can be seen in Figures 6.3

Chapter 6. Evaluation 169
and 6.4. These features all contribute to ALA diagrams in GALADE being significantly
easier to read than they were in XMind.
As discussed in Section 6.2.5, GALADE allows for all relevant documentation to be
viewed in the diagram itself, by pointing to common locations in the code base, as well
as being able to store any instance-specific or wire-specific comments or documentation
in the diagram.
From a code generation perspective, the generation of instantiations and wirings are
relatively similar to how they are in XMindParser, and this is acceptable as the code
generation in XMindParser was already a feature added to improve ALA development.
GALADE also provides a new form of code generation in the form of abstraction
template file generation, as discussed in Section 4.3.1 and shown in Figure 4.5. Since this
automates the setup process of domain and story abstraction files, there is significantly
less overhead in getting a developer started with implementing domain and story
abstractions.
A completely new feature for diagram-code synchronisation has been added to
GALADE in the form of generating ALA diagrams from code, as shown in Section
4.3.1. We expect this to have a significant impact on maintaining ALA diagrams, as
changes can now be freely made to the code base, from changes in the instantiation and
wiring code, to changes within abstractions themselves, and have the relevant diagrams
be able to automatically reconfigure themselves to reflect these changes.
GALADE exhibits performance improvements over XMind, as measured and discussed
in Section 6.2.7.
As can be seen in this chapter, when combined, the aforementioned features and
improvements are comprehensive, and they enable us to conclude that GALADE is
well-positioned to solve the current developmental woes plaguing ALA application
development at Datamars.

Chapter 6. Evaluation 170
6.4 Limitations and Threats to Validity
Because we did not have the resources to conduct thorough user studies to compare
GALADE with XMind and XMindParser, we had to resort to a mostly qualitative
evaluation. While we compared feature sets beween the tools, our evaluation is limited
by ultimately being a subjective one. While we have tried to mitigate this by providing
logical reasons for why we consider certain features important and why their inclusion
suggests that GALADE is an improvement over XMind and XMindParser, we cannot
escape the fact that we do not have the support of controlled user study to demonstrate
the importance of certain features in practice.
We conducted a range of experiments to evaluate the performance overhead of the
three tools in order to see to what extent PR6 has been satisfied. While we benefitted
from the fact that these are quantitative experiments, we were still affected by some
degree of bias, especially as it relates to the user error involved in manually recording
precise timing measurements. We have tried to mitigate this by providing a reasonably
large uncertainty range of ± 0.5 seconds for each calculated mean result, based on
measurements for the average human reaction time found by Thorpe et al. (1996).
For the test cases used for our timing measurements, XMind and GALADE represent
the same application diagram differently in a significant way: XMind treats every port
of every instance as if it were a separate node, whereas GALADE is able to associate
ports with nodes. The performance overhead in XMind therefore may be inflated by
these additional nodes. While we did not control for this, we consider that comparing
diagrams in this way is fairer than instead comparing measurements between GALADE
and XMind where XMind has the same number of nodes as GALADE has instances, as
we are comparing the performance impact of different ALA diagrams in these tools, not
arbitrary graphs. XMind requiring additional nodes is simply an additional drawback of
using XMind to display ALA diagrams.

Chapter 6. Evaluation 171
For our timing experiments, we could have more convincing results with additional data
points, which would require additional test cases. We also could have shown a range of
different ALA diagrams with consistent increases in diagram size. We were unable to
do so due to a limited amount of time. We mitigated the impact of this by evaluating
the general trends across test cases rather than claiming that we have a precise plot of
measurements that can be used for extrapolation.
In terms of coverage, we only evaluated the tools on a relatively small subset of potential
use cases. We tried to minimise the negative impact of this by picking very common use
cases that we believed would represent a significant amount of the user’s time, although
this judgment was based on subjective, albeit expert, opinion.
6.5 Summary
In this chapter, we have shown that GALADE has satisfied all priority requirements
PR1-PR6, as well as optional requirements OR1, OR4, and OR5. We have also shown
that the features added to GALADE suggest that it should allow for a significantly
better experience when developing ALA applications compared to using XMind and
XMindParser. We expect that it will lead to a significant improvement in ALA diagram
visualisation, code-diagram synchronisation, abstraction template code generation, and
performance for large diagrams. The only area that we do not expect a significant
improvement is with application code generation, however we found that the code
generation performance is at least as good as what already exists with XMind and
XMindParser. Altogether, we expect that GALADE is capable of solving the develop-
mental problems experienced by Datamars for ALA-based development, as described
in Section 1.2.1.
Chapter 7
Conclusions
This chapter provides an overall account of our research findings and what may be
explored in the future. Section 7.1 gives a summary of what was explored in each
chapter. Section 7.2 details how each research question defined in Section 1.3 was
answered. Section 7.3 describes the limitations found for our research as a whole.
Finally, Section 7.4 explores what future research directions can be pursued based on
our research findings.
7.1 Summary
In Chapter 1, we provided an overall view of the thesis. We first provided an insight
to the motivation and significance behind our research. We explained that ALA, being
a fledgling software architecture, required a development support tool in order for
it to have a chance at being more widely used, because ALA-based development at
Datamars was being hamstrung by several productivity issues that were unrelated to the
architecture itself. We then presented our set of seven research questions that described
the scope of what we intended to uncover by developing, as well as our proposed
solution, GALADE.
172

Chapter 7. Conclusions 173
In Chapter 2, we conducted a systematic literature review to determine if a sufficiently
comprehensive tool already existed that could help solve the current issues constraining
ALA-based development. We found and examined a set of 38 tools that were capable
of generating code based on visual models. We found that most of them used UML, as
well as the fact that UML component and composite structure diagrams could be used
to represent ALA diagrams, so the potential for relevant tools existed. However, we
found that none of the 38 tools found could sufficiently generate the code necessary for
ALA applications, i.e. abstraction instantiations and wirings. We answered Research
Questions 1 and 2, and also concluded that there existed a gap in the literature that
GALADE could help fill.
In Chapter 3, we discussed a variety of research methodologies and our choice to apply
the design science methodology for our research. We then explored our research plan,
and with the help of expert opinion from the creators of ALA (Spray & Sinha, 2018),
we exposed the root causes of the productivity issues facing ALA-based development.
In general, they related to the readability and understandability of ALA diagrams, and
keeping ALA diagrams and their corresponding code in sync. From these root causes,
we formed a set of functional requirements that we hoped, through the creation of
GALADE, would address and resolve the root causes.
In Chapter 4, we examined the design and development of GALADE through the
lens of an ALA application itself. We discussed some new additions to ALA-based
development that we found were needed to implement GALADE’s various features. We
also then described the various features added to GALADE, most of which provided
new functionality that was previously unavailable for ALA application development.
In Chapter 5, we discussed the results of a case study involving software engineers
at Datamars. We were able to look at ticket completion data covering a 41-week
period for the development of an ALA application, DMA. The software engineers there
used GALADE for the final 10 weeks, so we were able to view the overall trends in
Chapter 7. Conclusions 174
productivity and any impact that GALADE may have had. Our results suggested that
using GALADE led to an increase in productivity at Datamars.
In Chapter 6, we conducted a qualitative and quantitative evaluation of GALADE’s
implemented features and performance overhead, measured through the lenses of the
requirements defined in Section 3.3, and the extent to which GALADE satisfied them.
For the qualitative evaluation, we explored whether Priority Requirements 1-5 were
satisfied, as well as which Optional Requirements were satisfied. For the quantitative
evaluation, we examined whether Priority Requirement 6 was satisfied, by measuring
the performance of GALADE in four key scenarios relating to ALA diagrams: loading
a diagram, adding a new node, deleting nodes, and generating application code from a
diagram. We used three test case diagrams of varying sizes and compared the meas-
urements found by using GALADE to those found by using XMind and XMindParser.
The small test case was hand-made, while the medium and large test cases were real
diagrams used for an old version of GALADE, and DMA, respectively. We found
that for both sets of evaluations, GALADE outperformed XMind and XMindParser in
most scenarios, especially in terms of providing new functionality and the performance
overhead for the large test case, and at worst, performed approximately the same as
them for application code generation and the small and medium test cases.
7.2 Answering the Remaining Research Questions
We outlined a total of seven research questions in Section 1.3. Research Questions 1
and 2 were answered in Chapter 2, therefore we will answer Research Questions 3 to 7
in this chapter.

Chapter 7. Conclusions 175
7.2.1 Answering RQ3
We defined RQ3 as “What are the productivity-related challenges involved with manu-
ally maintaining consistency between ALA diagrams and corresponding code bases?”
In Section 3.2.3, we explained a number of root causes that created issues for the
development of ALA applications. We found these issues both through discussions
with the creators of ALA (Spray & Sinha, 2018), who had supervised numerous ALA
projects, as well as speaking from our own experiences on previous work with ALA.
The primary issues that arose related to the readability of ALA diagrams, especially
in relation to their corresponding code. The diagramming software was unable to
properly lay out ALA diagrams as port graphs, leading to the unconventional tree
layout as shown in Figure 2.2. Since every port would be represented as a node,
rather than being an accessory of their source instance node, ALA diagrams would
require an excessive amount of space, leading to a cumbersome viewing experience.
The diagram would need to constantly pan the diagram, which was made even more
frustrating by the fact that large diagrams would cause the software to slow down
significantly. Another issue with readability made evident was that documentation
for ALA applications would be scattered across the diagram and source code. When
reading the diagram, it is convenient, especially for a new developer, if information
about the different abstractions are presented in the diagram itself. Since documentation
for the abstractions are typically written by the developers and placed in the source files,
this information would either have to be copied into the diagram, or the user would
have to switch between the diagram and source code to to understand the diagram. If
the information is copied, then the maintenance effort for the documentation would
double, as both locations would need to be kept manually in sync. Otherwise, if the user
switches between the diagram and code, then the flow of reading the diagram could be
impacted.
Chapter 7. Conclusions 176
The second set of issues that came up involved problems related to the maintenance
of ALA applications. In particular, the issue of keeping the diagram and code up to
date. When changes were made to the diagram, the corresponding changes would be
made manually to the code, and vice versa. There would be no automatic guarantee that
all changes from one end made it to the other. This would require a consistent manual
effort to check that all instances and wirings in the diagram match those in the code,
which would essentially waste valuable developer time. Additionally, when trying to
make these manual changes on one side, it could prove time-consuming to pinpoint the
corresponding node or wiring that needed to change on the other side. One potentially
very impactful drawback would be that the static details of each component in the
diagram, for example the names and types of ports, would not be directly linked to their
equivalent in the code. If a developer were to change a port name in an abstraction’s
source code, the name would not be automatically updated in the diagram. As port
names are specific abstraction definitions themselves, they are frequently reused in the
diagram, leading to a significant amount of developer time for such a small change in
the code.
7.2.2 Answering RQ4
We defined RQ4 as “What architectural strategies are most useful in designing a
graphical modelling tool to support ALA-based development with the goal of addressing
the challenges identified in RQ3?”
In Chapter 4, we discuss how we designed GALADE using ALA itself. We were
successfully able to design with ALA, although we found it necessary to make certain
additions to ALA-based development.
The main addition involved adding a new layer, the Story Abstractions layer, which
was not done lightly, given that ALA only had four layers before this. We found this
Chapter 7. Conclusions 177
necessary due to the nature of GALADE itself: at runtime, we required the instantiation
of nodes and wires whenever the user wanted. The nodes themselves would have to have
a complex UI structure on their own, which was an issue because this UI structure would
make use of UI components that already existed in domain abstractions, such as text
boxes and buttons. The only place that these domain abstractions could be instantiated
would be in the Application layer, but since we needed to instantiate nodes in the
diagram, these domain abstractions would need to be instantiated in an environment that
itself could be repeatedly instantiated. We therefore introduced the Story Abstractions
layer to solve these problems. Additionally, the subdiagram related to the composition
of domain abstractions in a story abstraction could also be viewed in GALADE as a
separate diagram.
We also moved away from having every domain abstraction participate in wiring. We
node that wiring, although very widely used in ALA, is not one of the core requirements
of ALA, as per Section 2.1. We found that it would be easier to use some domain
abstractions if they were just instantiated and were accessed through their methods,
like our CodeParser domain abstraction. We also note however that these domain
abstractions would no longer be visible as nodes in diagrams due to their lack of wiring.
To deal with diagram scale and readability, we also implemented the idea of splitting
up monolithic diagrams into subdiagrams, connected to one another through reference
nodes. We present its use as being inspired by the plug-in architecture, and show how
it has been used to implement the debugger support functionality. This is similar to
the subdiagrams of story abstractions, however these subdiagrams would reside in the
Application layer.

Chapter 7. Conclusions 178
7.2.3 Answering RQ5
We defined RQ5 as “Can the tool from RQ4 be extended to provide automatic code
generation from ALA diagrams?”
In Section 4.3.1, we describe our implementation of automatic code generation in
GALADE. We have utilised Microsoft’s Roslyn platform (Harrison, 2017) to translate
the models stored in nodes into C# instantiations and WireTo calls. The generated
code can also automatically be placed in the application’s source file, and with the
support of a confirmation message when this occurs, the user does not need to switch
from the diagram to a view of the code after making a change. Each instance node in
the diagram is translated into a C# object instantiation, and is given the user-configured
arguments in its initialiser, as presented on the node in GALADE. Similarly, every wire
in the diagram is translated into a WireTo call, which is given the variable names
of the source and destination node, as well as the exact source port that the wire is
connected to. Any unnamed nodes in the diagram are automatically assigned unique
variable names so that they can be referenced as variables in the code.
We were also able to generate and store all diagram-exclusive information in the code
as well, through the use of JSON objects stored in comments, which we referred to
as metadata. Every node and wire can be given documentation in the diagram view,
which is stored in the metadata for the corresponding instantiations and WireTo lines.
Any other node or wire-specific settings, like whether a node is a reference node, and
therefore have different colouring, could also be stored in the metadata. This process
allowed us to essentially “save” the entire diagram in the code, rather than in a separate
location.

Chapter 7. Conclusions 179
7.2.4 Answering RQ6
We defined RQ6 as “Can the tool from RQ4 be adapted to be resilient to manual
changes to the code base?”
In Sections 4.3.1 and 6.2.4, we described how an ALA diagram can be visualised by
parsing existing code. In Section 3.2.3, we explained how a key concern in ALA-based
development would be the issue of keeping ALA diagrams and their corresponding
code bases in sync, including the case that when manual changes are made to the code
base, the corresponding diagram should be updated to reflect these changes. We have
implemented diagram-code synchronisation to help with this issue. With the use of
Microsoft’s Roslyn platform, the instantiations and WireTo calls in the Application
layer are parsed and visualised in the diagram when an application file is loaded. This
means that manual changes to these instantiations and wirings can easily be kept in
sync with the diagram. Additionally, when an ALA project is loaded into GALADE, all
abstraction source files are parsed using Roslyn as well, and all parameters relevant to
an abstraction’s definition, such as port names, port types, and public properties, are
loaded and stored within the project’s template AbstractionModels in GALADE.
At any point, the project can be easily refreshed and the diagram can easily be reloaded,
meaning that seemingly minor changes to abstractions, such as changing the names of
their ports, can be easily updated in the diagram: the user would just need to reload the
project and diagram. Finally, we have made it so an ALA diagram is not saved in its
own custom file, as would be done with conventional diagramming tools. Instead, an
ALA diagram is completely stored with its corresponding instantiation and wiring code,
so manual changes to the code base are, in essence, treated as manual changes to their
corresponding diagrams.

Chapter 7. Conclusions 180
7.2.5 Answering RQ7
We defined RQ7 as “What are the improvements in productivity offered by the tool from
RQ4, as compared to the current practice of developing ALA-based code?”
In Chapter 5, we examined a case study involving software engineers at Datamars using
GALADE over a 10-week period. They incorporated GALADE into their workflow for
developing the ALA application DMA, which previously required the use of XMind and
XMindParser. We measured the impact that the tool had on their productivity in terms
of ticket completion rates, normalised by hours worked, and the data found suggested
that the use of GALADE led to improvements in productivity over this period, and
compared favourably to the usage of XMind and XMindParser.
In Chapter 6, we performed a qualitative and quantitative evaluation of GALADE,
and found that it satisfied all priority requirements, and some optional requirements,
outlined in Section 3.3. We were able to show that several features were implemented
that allowed for novel functionality in the area of ALA development, in particular
representing ALA diagrams as easily-readable port graphs, having diagram-code syn-
chronisation, and being able to centralise an ALA project’s relevant documentation
in the diagram view, without having to manually store them all in one place. We also
found that GALADE performs much better for large diagrams compared to XMind. We
expect that all of these factors combined contributed to development using GALADE
being a significantly more pleasant and productive experience than the practices used
before with XMind and XMindParser.
7.2.6 Overall Insights
In previous development with ALA, Spray and Sinha (2018) noted that an ALA applic-
ation should have an up-front design drawn as a single diagram. The purpose of this

Chapter 7. Conclusions 181
monolithic approach would be to ensure that there is a central location for an applic-
ation’s design and documentation. However, through the development of GALADE,
and as corroborated by Chen et al. (2020), this monolithic approach scales poorly as an
ALA application grows. It would then be important to separate the application diagram
into subdiagrams of manageable sizes. We found that using separate diagrams was
possible, especially once we added the feature of inter-diagram navigation through
common nodes, as described in Section 5.2.3 and Figure 5.1. We found that typically
when developing any given feature, we would not stray out of a particular subsection of
the main diagram anyway, so it made sense to enable this kind of diagram separation.
Originally, the process of having a diagram be generated directly from the application
code was not planned. Our initial iterations instead stored ALA diagrams as separate
JSON files. Once we eventually discarded that approach and tried to instead dynam-
ically visualise ALA application code in a diagram, we found that our perspective
had completely changed on what made an ALA diagram. The ALA diagram is not a
design specification that should be followed as a blueprint. On the contrary, the ALA
diagram is the application itself, just visualised graphically in 2D space. Our initial
approaches followed the conventional method of designing by a diagram: visualise an
abstract representation first, then implement the details and fill in the gaps. What we
did not expect, however, was how tightly integrated an ALA diagram could be with
its corresponding code, especially when including the functionality of being able to
display documentation within abstractions in the diagram itself. This tight integration
also made it incredibly simple to allow for an existing ALA application, like DMA, to
transition to using GALADE.
When we began developing GALADE, given the relative newness of ALA, we felt
that using ALA to architect GALADE itself may be a bit of a gamble, and that it
may not be sufficiently equipped to develop a diagramming tool. In some ways, we
were right. Being initially constrained to only four layers and using wiring, we were
Chapter 7. Conclusions 182
struggling to implement the visualisation of dynamically-instantiated nodes without a
convoluted application diagram. Once we added the Story Abstractions layer, we were
finally able to comfortably implement the dynamic instantiation of visualised nodes,
and once we eased the wiring constraint and allowed ourselves to use public methods in
domain abstractions, we were able to create flexible yet cohesive domain abstractions
to suit our needs, like the CodeParser domain abstraction described in Section 4.4.2.
However, this led us to question the degree of innovation that future ALA applications
may require. Would our additions to ALA be enough, or would further enhancements
to ALA, or “easing” of constraints, be required to implement even more complicated
behaviours? On the other hand, we did not break any of ALA’s rules when extending it.
Such flexibility can therefore also be seen as a positive, so developers of future ALA
applications should feel comfortable with liberally experimenting with new concepts in
ALA while ensuring that they abide by its core principles.
7.3 Limitations
As with any research endeavour, our main limitation was time and the availability of
resources. Our primary development period was given a timeframe of six months, after
which the team working on DMA would switch to using GALADE, and would expect
to use a fully-functional iteration. Our secondary development period of a further six
months helped to iron issues with GALADE that the DMA team found, as well as
implementing some new features. The DMA team were only able to use GALADE for
10 weeks, so having them use it for longer may have provided us with more concrete
insights on the impacts that GALADE may have on productivity for ALA application
development. Nonetheless, as discussed in Chapter 6, we were able to satisfy all Primary
Requirements, along with most of the Optional Requirements. With more time, we may
have been able to satisfy all of the remaining Optional Requirements as well, which we

Chapter 7. Conclusions 183
now leave for future research.
7.4 Future Work
While we feel that we have made significant progress in the production of a development
support tool for ALA, there is still always room for improvement. First and foremost,
the support for multiple programming languages, as expressed by Optional Requirement
3 in Section 3.3, is a key area that we expect will see work in the future. At the moment,
support for ALA has only been implemented for C# and C++ (Spray & Sinha, 2018),
so we did not consider multi-language support to be a pressing issue for GALADE, at
least yet. In the future, GALADE may have to be extended to support code generation
and parsing for different languages.
In terms of the C# ALA implementation of GALADE, Microsoft’s Roslyn platform
has been used extensively to parse and generate ALA code. When adding support
for another language, if said language does not have a platform like Roslyn, then a
simple code parsing and generating library for that language would need to be built.
Additionally, the wiring mechanism in ALA has been implemented as the WireTo
extension method in C# in order for all domain and story abstractions to contain the
method. Similarly, the PostWiringInitialize method discussed in Section
2.1 is also an extension method. If a candidate language does not support extension
methods, then an alternative would need to be produced. For example, if the language is
object-oriented and supports inheritance (Rentsch, 1982), then a base Abstraction
class could be inherited by all domain and story abstractions, which would contain the
WireTo and PostWiringInitialize methods.
One of the main contributions to ALA itself from this research is the introduction of a
fifth layer: the Story Abstractions layer, nested between the Application and Domain
Abstractions layers. Exploring the impact of this new layer may be of interest, especially

Chapter 7. Conclusions 184
in terms of whether the benefits of this layer could warrant the additions of more layers,
and if so, then what constraints should be considered when this is done. We certainly
do not want to go the route of arbitrarily adding new layers in ALA, but it may be the
case that, for wider adoption, ALA would require the use of more layers, especially for
more complex systems. For example, systems that involve a distributed model, where
multiple ALA applications are running simultaneously, could require a layer above the
Applications layer to encapsulate them.
After we introduced the concept of domain abstraction instances that did not necessitate
composition via wiring, an emerging cause for concern was the fact that these instances
would no longer be visible in ALA diagrams. It may be of interest to explore the impact
of this on the understandability of an ALA application, or indeed whether this is a
relevant issue at all.
7.5 Final Thoughts
To conclude, we are incredibly proud of the work we have done in creating GALADE.
We have produced a novel artefact that is well-positioned to solve the issues related
to ALA-based development at Datamars, and therefore there is already a real-world
commercial environment where GALADE can make a significant impact. Not only that,
but we did so using a relatively untested software architecture that had not yet been
used to create a graphical tool like GALADE. As a result, we were able to make novel
contributions to ALA itself. We were also able to answer each of our seven research
questions comprehensively, and can see a promising future for application development
with ALA. While difficult at times, this journey has ultimately been a worthwhile and
satisfying one.
References
Abernethy, R., Benedict, R. & Dowdell, R. (1985). Asme measurement uncertainty.Asenov, D. (2011). Design and implementation of envision-a visual programming
system (Unpublished master’s thesis). Eidgenössische Technische HochschuleZürich, Department of Computer Science . . . .
Backman, S. (2018). Code generationfor uml composite structure diagrams.Bennett, J., Cooper, K. & Dai, L. (2010). Aspect-oriented model-driven skeleton
code generation: A graph-based transformation approach. Science of ComputerProgramming, 75(8), 689–725.
Bobrow, D. G., DeMichiel, L. G., Gabriel, R. P., Keene, S. E., Kiczales, G. & Moon,D. A. (1988). Common lisp object system specification. ACM Sigplan Notices,23(SI), 1–142.
Boehm, B. (2006). A view of 20th and 21st century software engineering. In Proceed-ings of the 28th international conference on software engineering (pp. 12–29).
Bresson, J., Agon, C. & Assayag, G. (2009). Visual lisp/clos programming in openmusic.Higher-Order and Symbolic Computation, 22(1), 81–111.
Bresson, J. & Giavitto, J.-L. (2014). A reactive extension of the openmusic visualprogramming language. Journal of Visual Languages & Computing, 25(4), 363–375.
BSI ISO. (2011). BS ISO/IEC 25010:2011 Systems and software engineering— Systems and software Quality Requirements and Evaluation (SQuaRE)— System and software quality models. BSI Standards Publication. Re-trieved from https://bsol-bsigroup-com.ezproxy.aut.ac.nz/PdfViewer/Viewer?pid=000000000030215101
BSI ISO. (2016). BS ISO/IEC 25023:2016 Systems and software engineering —Systems and software Quality Requirements and Evaluation (SQuaRE) — Meas-urement of system and software product quality. BSI Standards Publication. Re-trieved from https://bsol-bsigroup-com.ezproxy.aut.ac.nz/PdfViewer/Viewer?pid=000000000030280200
Chen, X., Sinha, R. & Spray, J. (2020). Abstraction layered architecture: Improvementsin maintainability of commercial software code bases (Unpublished master’sthesis). Auckland University of Technology.
Cohen, D., Lindvall, M. & Costa, P. (2004). An introduction to agile methods. Adv.Comput., 62(03), 1–66.
de Souza, S. C. B., Anquetil, N. & de Oliveira, K. M. (2005). A study of the
185

References 186
documentation essential to software maintenance. In Proceedings of the 23rdannual international conference on design of communication: documenting &designing for pervasive information (pp. 68–75).
Easterbrook, S., Singer, J., Storey, M.-A. & Damian, D. (2008). Selecting empiricalmethods for software engineering research. In Guide to advanced empiricalsoftware engineering (pp. 285–311). Springer.
Ebert, J., Süttenbach, R. & Uhe, I. (1997). Meta-case in practice: a case for kogge.In International conference on advanced information systems engineering (pp.203–216).
Fayed, M. S., Al-Qurishi, M., Alamri, A., Hossain, M. A. & Al-Daraiseh, A. A.(2020). Pwct: a novel general-purpose visual programming language in supportof pervasive application development. CCF Transactions on Pervasive Computingand Interaction, 2(3), 164–177.
Gamma, E., Helm, R., Johnson, R. & Vlissides, J. (2009). Design patterns: Elementsof reusable object-oriented software. Addison Wesley.
Grant, C. (2006). The visula programming language and environment. In Visuallanguages and human-centric computing (vl/hcc’06) (pp. 203–206).
Harrison, N. (2017). Code generation with roslyn. Springer.Hevner, A. R., March, S. T., Park, J. & Ram, S. (2004). Design science in information
systems research. MIS quarterly, 75–105.Igaki, H., Fukuyasu, N., Saiki, S., Matsumoto, S. & Kusumoto, S. (2014). Quantitative
assessment with using ticket driven development for teaching scrum framework.In Companion proceedings of the 36th international conference on softwareengineering (pp. 372–381).
Johannesson, P. & Perjons, E. (2014). An introduction to design science. Springer.Karp, R. M. (1978). A characterization of the minimum cycle mean in a digraph.
Discrete mathematics, 23(3), 309–311.Kitchenham, B. (2004). Procedures for performing systematic reviews. Keele, UK,
Keele University, 33(2004), 1–26.Kitchenham, B. A., Budgen, D. & Brereton, P. (2015). Evidence-based software
engineering and systematic reviews (Vol. 4). CRC press.Kose, M. A. & Ozkaya, M. (2020). Towards extending uml’s activity diagram for the
architectural modeling, analysis, and implementation. In 2020 15th conferenceon computer science and information systems (fedcsis) (pp. 639–648).
Kothari, C. R. (2004). Research methodology: Methods and techniques. New AgeInternational.
Kraemer, F. A. & Herrmann, P. (2010). Reactive semantics for distributed uml activities.In Formal techniques for distributed systems (pp. 17–31). Springer.
Krasner, G. E., Pope, S. T. et al. (1988). A description of the model-view-controlleruser interface paradigm in the smalltalk-80 system. Journal of object orientedprogramming, 1(3), 26–49.
Lee, E. A. & Messerschmitt, D. G. (1987). Synchronous data flow. Proceedings of theIEEE, 75(9), 1235–1245.
References 187
Loeliger, J. & McCullough, M. (2012). Version control with git: Powerful tools andtechniques for collaborative software development. " O’Reilly Media, Inc.".
Marcos-Pablos, S. & García-Peñalvo, F. J. (2018). Decision support tools for slrsearch string construction. In Proceedings of the sixth international conferenceon technological ecosystems for enhancing multiculturality (pp. 660–667).
Martin, R. C. (2000). Design principles and design patterns. Object Mentor, 1(34),597.
Mayo, J. (2002). C# unleashed. Sams Publishing.Mukhtar, M. & Galadanci, B. (2016). The design and development of a learning tool for
demonstrating automatic java code generation from uml class diagrams. DutseJournal of Pure and Applied Sciences, 2, 95–103.
Muneton, A. & Zapata, C. (2012). Definition of a semantic plataform for automatedcode generation based on uml class diagrams and dsl semantic annotations. Dyna,79(172), 94–100.
Myers, C. & Baniassad, E. (2009). Silhouette: visual language for meaningful shape.In Proceedings of the 24th acm sigplan conference companion on object orientedprogramming systems languages and applications (pp. 917–924).
Nakagawa, E. Y., Antonino, P. O. & Becker, M. (2011). Reference architecture andproduct line architecture: A subtle but critical difference. In European conferenceon software architecture (pp. 207–211).
Nassar, M., Anwar, A., Ebersold, S., Elasri, B., Coulette, B. & Kriouile, A. (2009).Code generation in vuml profile: A model driven approach. In 2009 ieee/acsinternational conference on computer systems and applications (pp. 412–419).
Nathan, A. (2014). Xaml unleashed. Sams Publishing.Ozkaya, M. (2019). Are the uml modelling tools powerful enough for practitioners? a
literature review. IET Software, 13(5), 338–354.Parada, A. G., Siegert, E. & de Brisolara, L. B. (2011). Gencode: A tool for gener-
ation of java code from uml class models. In Proc. 26th south symposium onmicroelectronics (sim) (pp. 173–176).
Pilone, D. & Pitman, N. (2005). Uml 2.0 in a nutshell. O’Reilly Media, Inc.Rentsch, T. (1982). Object oriented programming. ACM Sigplan Notices, 17(9), 51–57.Resnick, M., Maloney, J., Monroy-Hernández, A., Rusk, N., Eastmond, E., Brennan, K.,
. . . others (2009). Scratch: programming for all. Communications of the ACM,52(11), 60–67.
Rumbaugh, J., Jacobson, I. & Booch, G. (2004). The unified modeling languagereference manual (2nd edition).
Schwaber, K. (1997). Scrum development process. In Business object design andimplementation (pp. 117–134). Springer.
Sendall, S. & Küster, J. (2004). Taming model round-trip engineering. In Proceedingsof workshop on best practices for model-driven software development (Vol. 1).
Severance, C. (2012). Discovering javascript object notation. Computer, 45(4), 6–8.Singh, P. & Singh, K. (2017). Exploring automatic search in digital libraries: a
caution guide for systematic reviewers. In Proceedings of the 21st internationalconference on evaluation and assessment in software engineering (pp. 236–241).
References 188
Spray, J. (2020). Abstraction Layered Architecture. https://abstractionlayeredarchitecture.com/. (Online; accessed: 2020-06-05)
Spray, J. & Sinha, R. (2018). Abstraction layered architecture: Writing maintain-able embedded code. In C. E. Cuesta, D. Garlan & J. Pérez (Eds.), Softwarearchitecture (pp. 131–146). Cham: Springer International Publishing.
Thompson, K. (1968). Programming techniques: Regular expression search algorithm.Communications of the ACM, 11(6), 419–422.
Thorpe, S., Fize, D. & Marlot, C. (1996). Speed of processing in the human visualsystem. nature, 381(6582), 520–522.
Troelsen, A. (2007). C# 3.0 language features. Pro C# with. NET 3.0, 1075–1105.Walker, D. H. (1997). Choosing an appropriate research methodology. Construction
management and economics, 15(2), 149–159.Wang, T.-C., Mei, W.-H., Lin, S.-L., Chiu, S.-K. & Lin, J. M.-C. (2009). Teaching
programming concepts to high school students with alice. In 2009 39th ieeefrontiers in education conference (pp. 1–6).
Wohlin, C. (2014). Guidelines for snowballing in systematic literature studies anda replication in software engineering. In Proceedings of the 18th internationalconference on evaluation and assessment in software engineering (pp. 1–10).
Wolfinger, R., Dhungana, D., Prähofer, H. & Mössenböck, H. (2006). A componentplug-in architecture for the. net platform. In Joint modular languages conference(pp. 287–305).
Zhang, H. & Babar, M. A. (2010). On searching relevant studies in software engineer-ing. In 14th international conference on evaluation and assessment in softwareengineering (ease) (pp. 1–10).
Related Documents


