Gain real-time understanding of your customers and your business across the social web within Dynamics CRM. Version 3.1

Welcome message from author
This document is posted to help you gain knowledge. Please leave a comment to let me know what you think about it! Share it to your friends and learn new things together.
Transcript

Gain real-time understanding of your customers and your business across the social web within Dynamics CRM.
Version 3.1

Why Social Engagement for CRM?Create records in CRM from a post in Social EngagementSet up Social Engagement dashboards and visuals in CRMGallery of Social Engagement visualsNext steps and help resources

eBook: Introducing Microsoft Social Engagement
1 Microsoft Dynamics CRM Online Spring ‘14 and CRM 2013 Service Pack 1 (SP1) or later 2 Microsoft Dynamics CRM Online 2015

Social buying signalsCreate real-time alerts for key purchasing signals and generate leads from the social web.
Competitive intelligenceGain important insights about your competitors’ weaknesses and strengths.
Target account trackingMonitor key developments and decision makers at your top accounts.
51% of salespeople who use social selling techniques outperform their sales peers. (Source
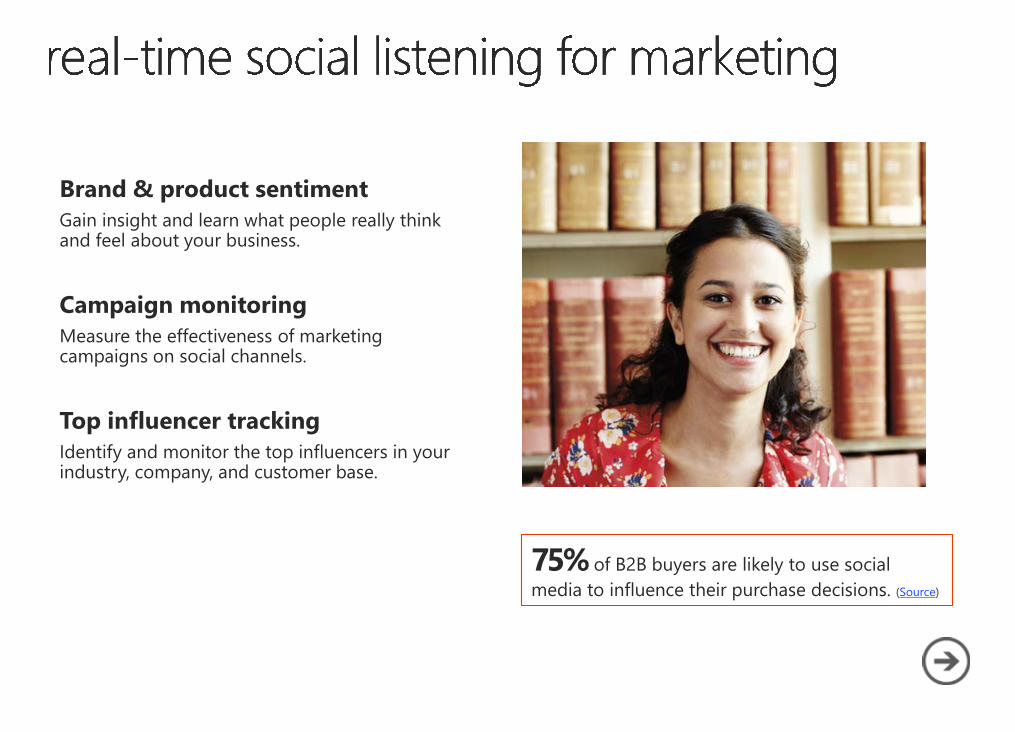
Brand & product sentimentGain insight and learn what people really think and feel about your business.
Campaign monitoringMeasure the effectiveness of marketing campaigns on social channels.
Top influencer trackingIdentify and monitor the top influencers in your industry, company, and customer base.
75% of B2B buyers are likely to use social media to influence their purchase decisions. (Source)
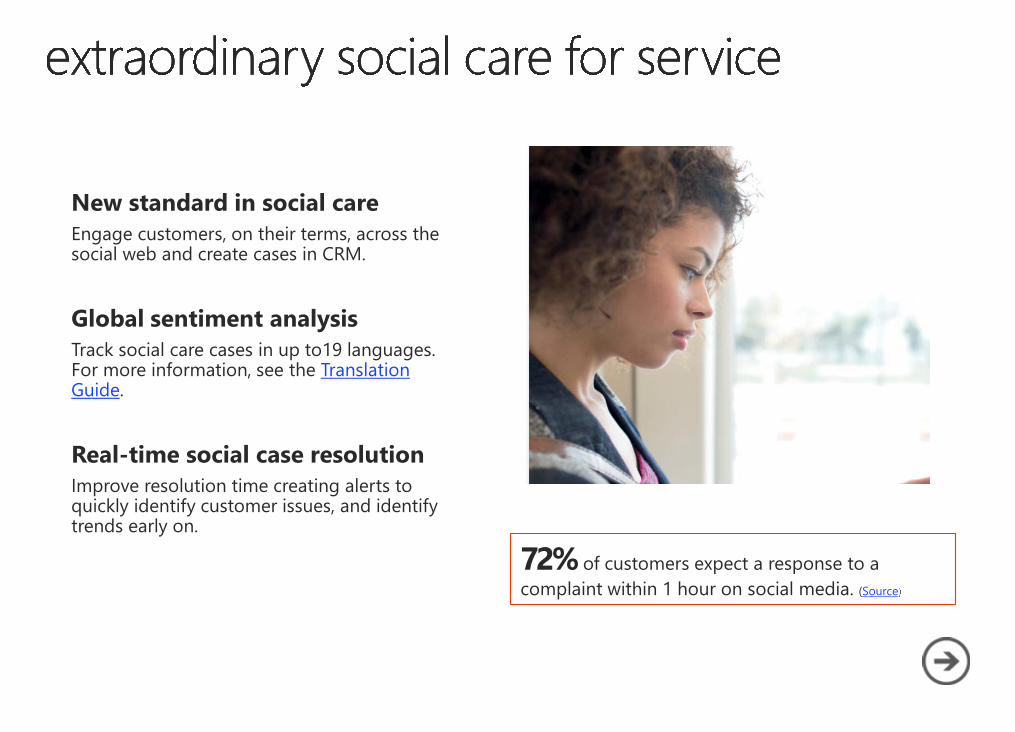
New standard in social careEngage customers, on their terms, across the social web and create cases in CRM.
Global sentiment analysisTrack social care cases in up to19 languages. For more information, see the Translation Guide.
Real-time social case resolutionImprove resolution time creating alerts to quickly identify customer issues, and identify trends early on.
72% of customers expect a response to a complaint within 1 hour on social media. (Source

Microsoft Dynamics CRM pricing and licensing
set up the connection to CRM configure the rules to process social activities
1
23
4
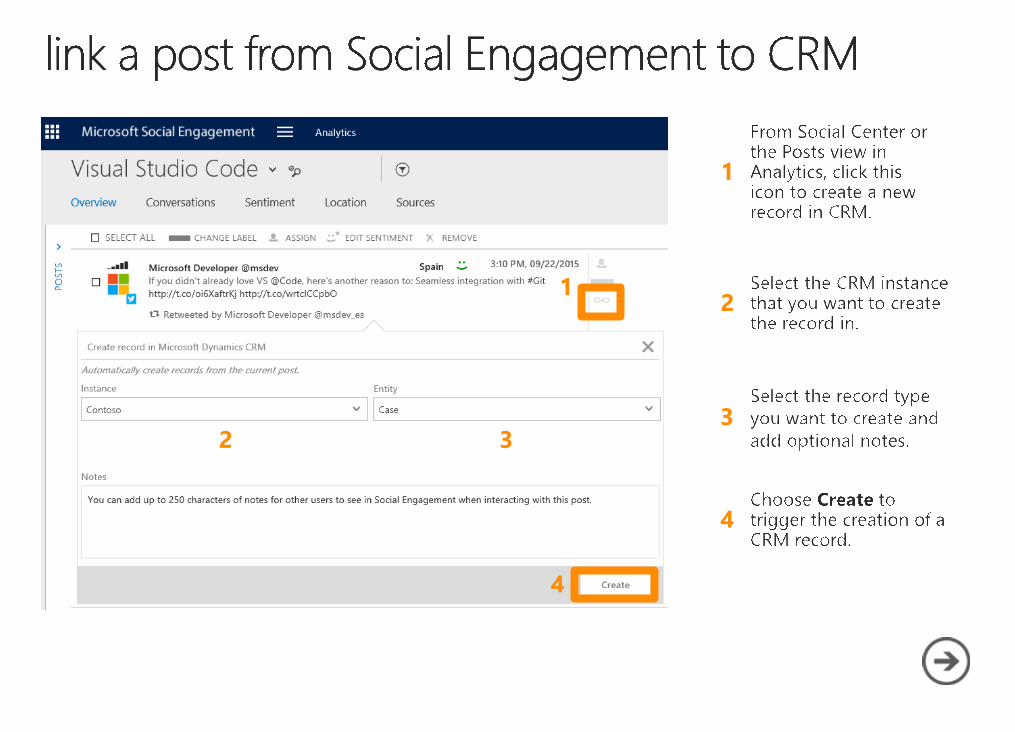
1
2
3
4
2
1
2
3
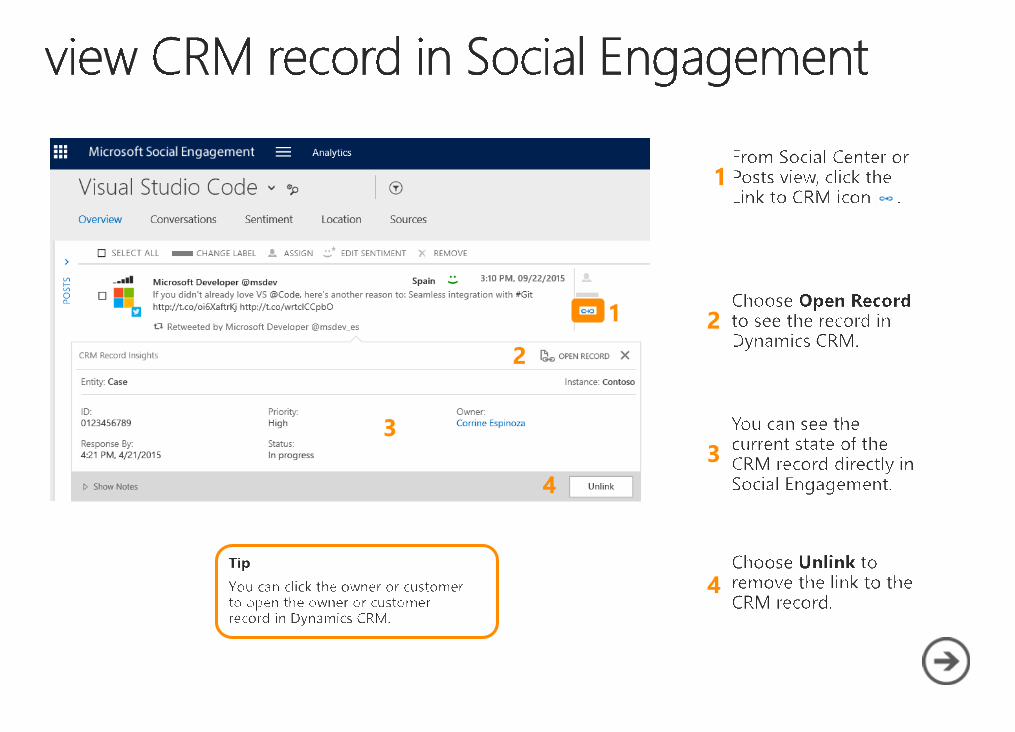
1
2
34
4

Assign a license to a user
Connect to Microsoft Social Engagement
contents

Now that you know a bit more about what Social Engagement can do, you’re probably ready to add your own visuals or set up searches.There are two places where you can see the Social Engagement visuals in CRM:• Dashboards• Forms (account, contact, or
competitor forms or on other types of records, depending on how your system is set up)

section
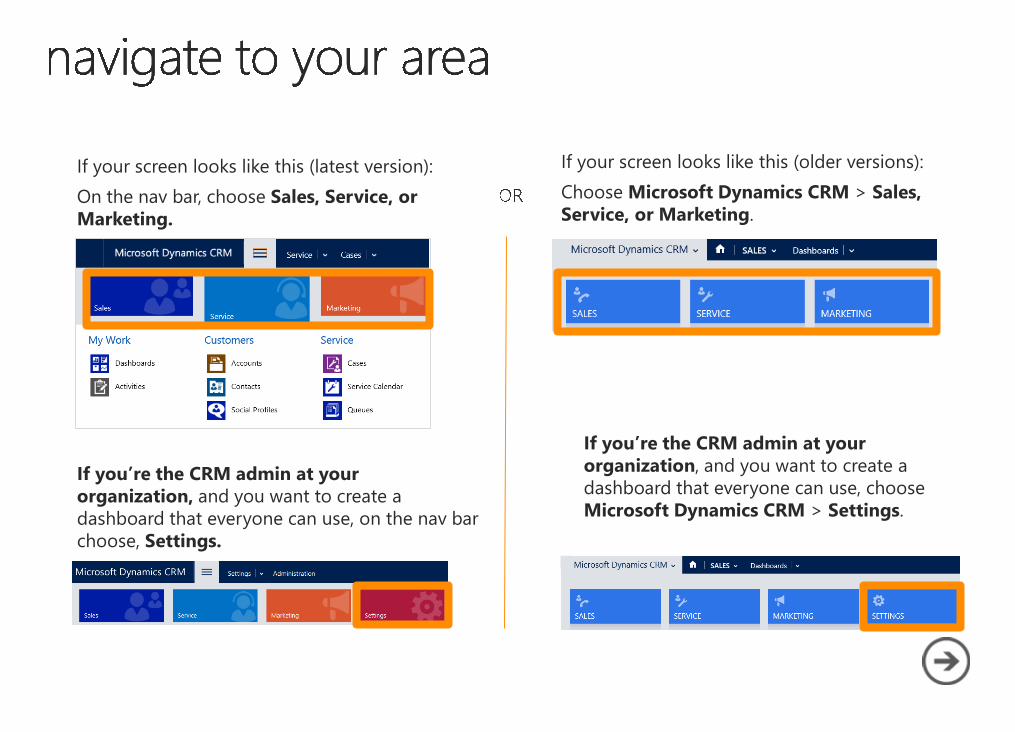
If your screen looks like this (latest version):On the nav bar, choose Sales, Service, or Marketing.
If your screen looks like this (older versions):Choose Microsoft Dynamics CRM > Sales, Service, or Marketing.
If you’re the CRM admin at your organization, and you want to create a dashboard that everyone can use, choose Microsoft Dynamics CRM > Settings.
If you’re the CRM admin at your organization, and you want to create a dashboard that everyone can use, on the nav bar choose, Settings.

If you’re in sales, service, or marketing, and want to create a dashboard for yourself, choose Dashboards.
If you’re the CRM admin and want to create a shared dashboard, choose Customizations > Customize the System> Dashboards.
Admins and end users can set up their own dashboards. Optionally, admins can create new dashboards and share them with other users.

If you’re the CRM admin, choose New on the toolbar.
If you’re in sales, service, or marketing, choose New on the command bar.


Choose
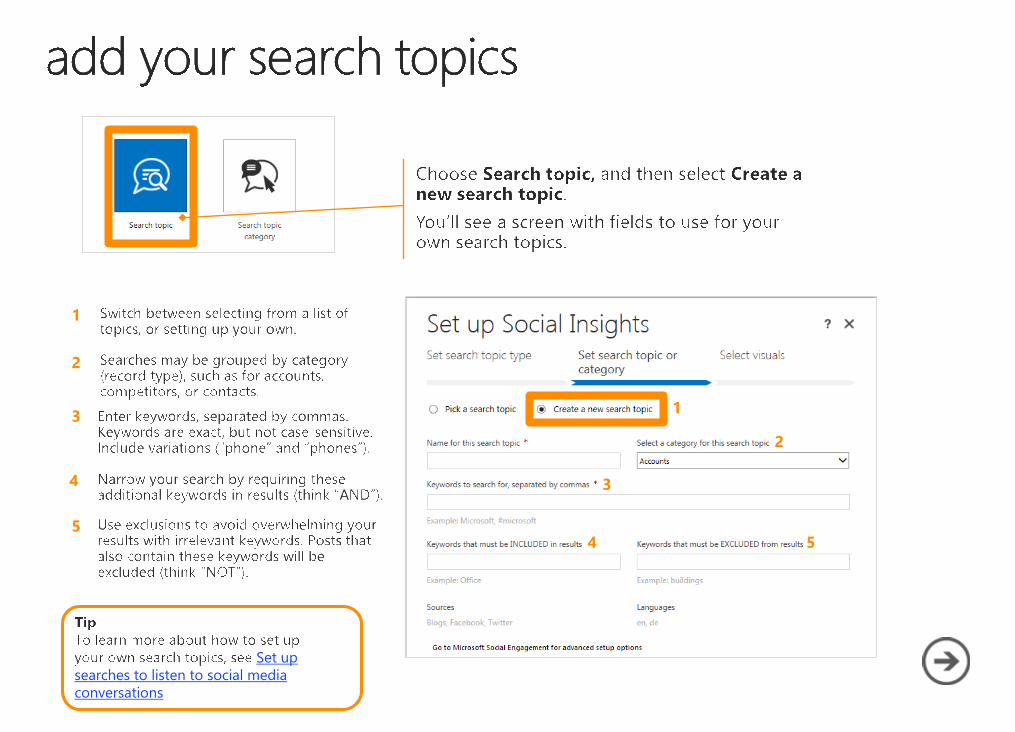
1
2
3
4 5
1
2
3
4
5
Set up searches to listen to social media conversations
Choose choose

choose
Choose choose
choose
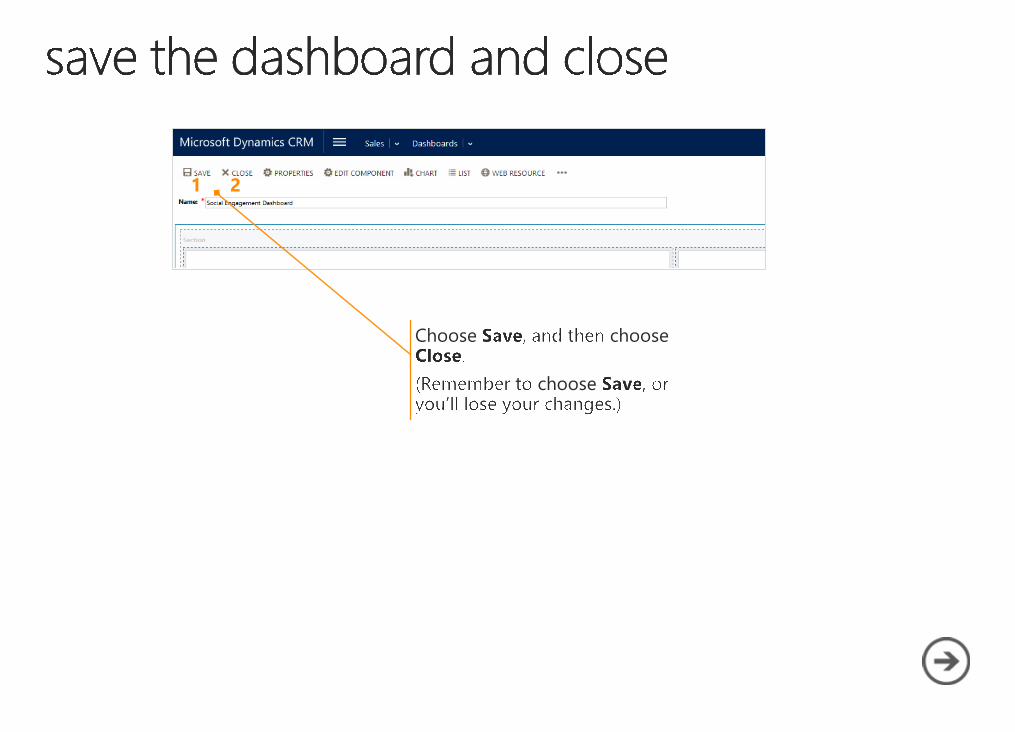
1 2

Tip for CRM admins
Choose Publish so that others can view the dashboard.

Filter options
Depending on how your search topics are set up, you can choose the Filter button and change the time frame, the languages, and the sources. This constructs the data set for the visual you are looking at and lets the visual adapt to your selection.


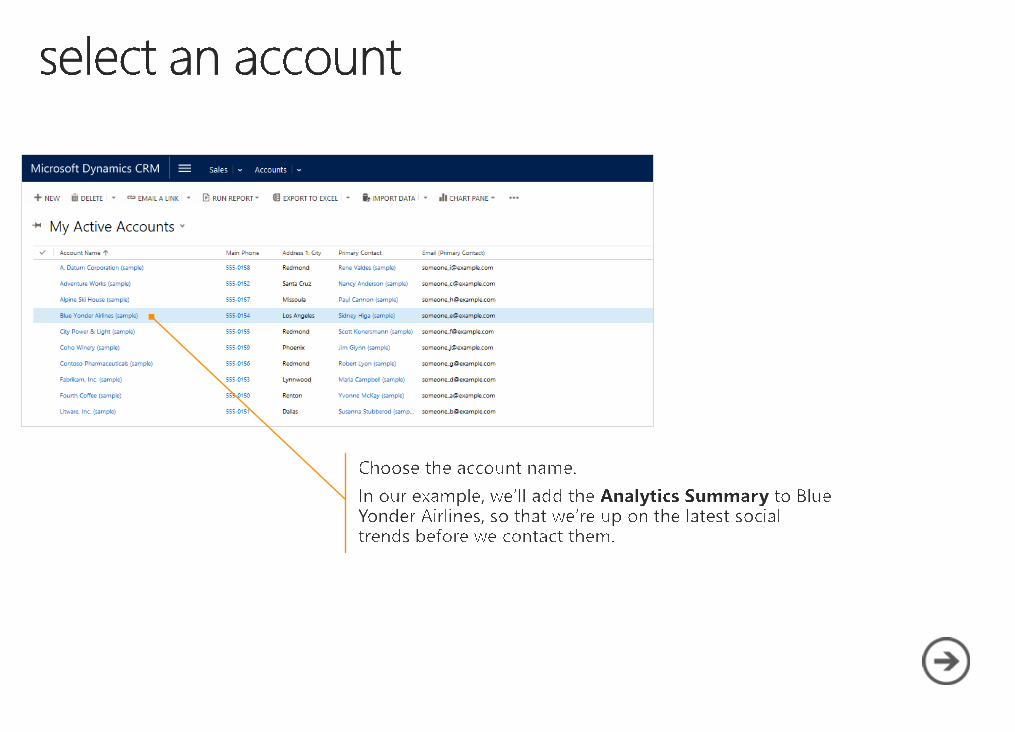
If your screen looks like this (latest version):On the nav bar, choose Sales, Service, or Marketing > Accounts.
If your screen looks like this (older versions):Choose Microsoft Dynamics CRM > Sales, Service, or Marketing > Accounts.

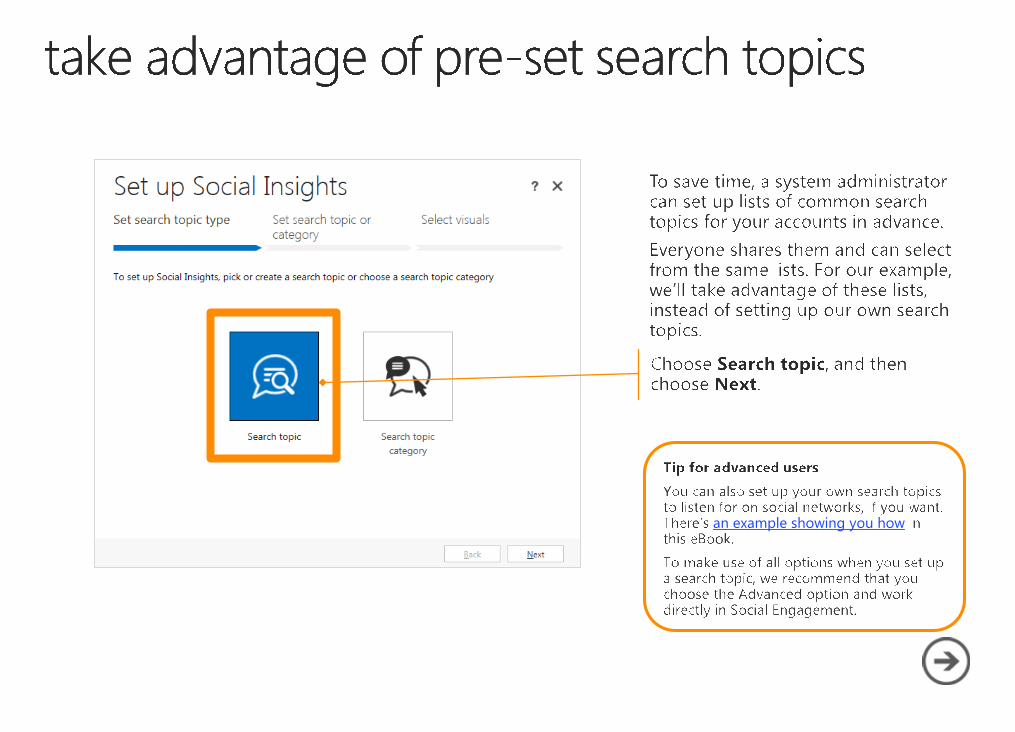
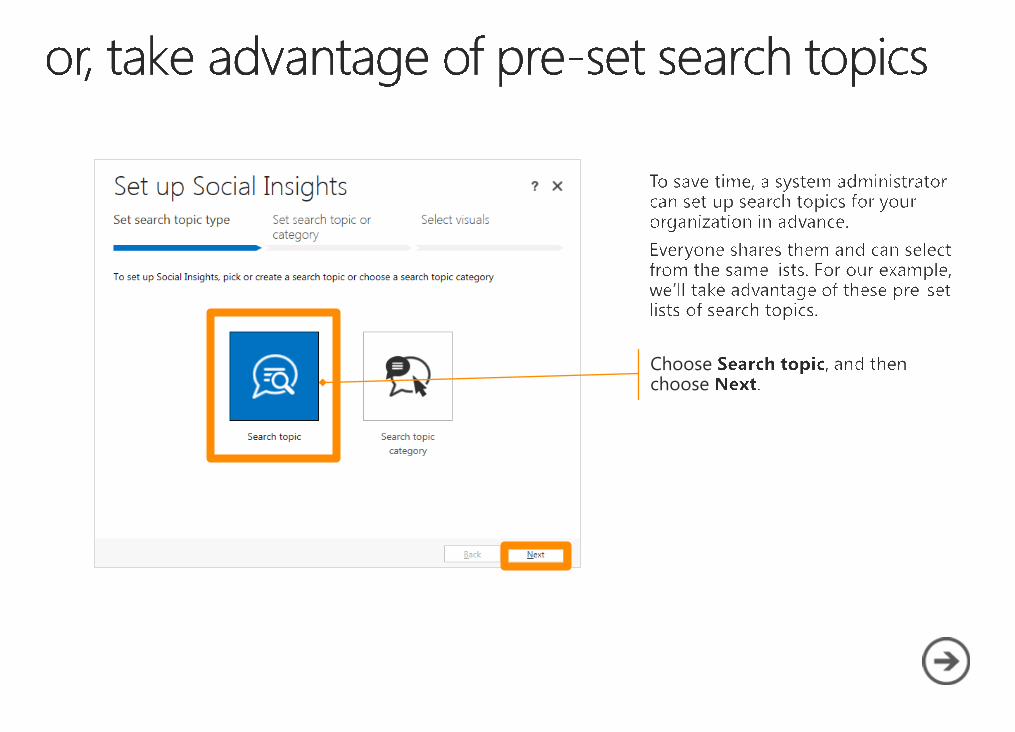
an example showing you how


contentsadding a visual to a dashboard

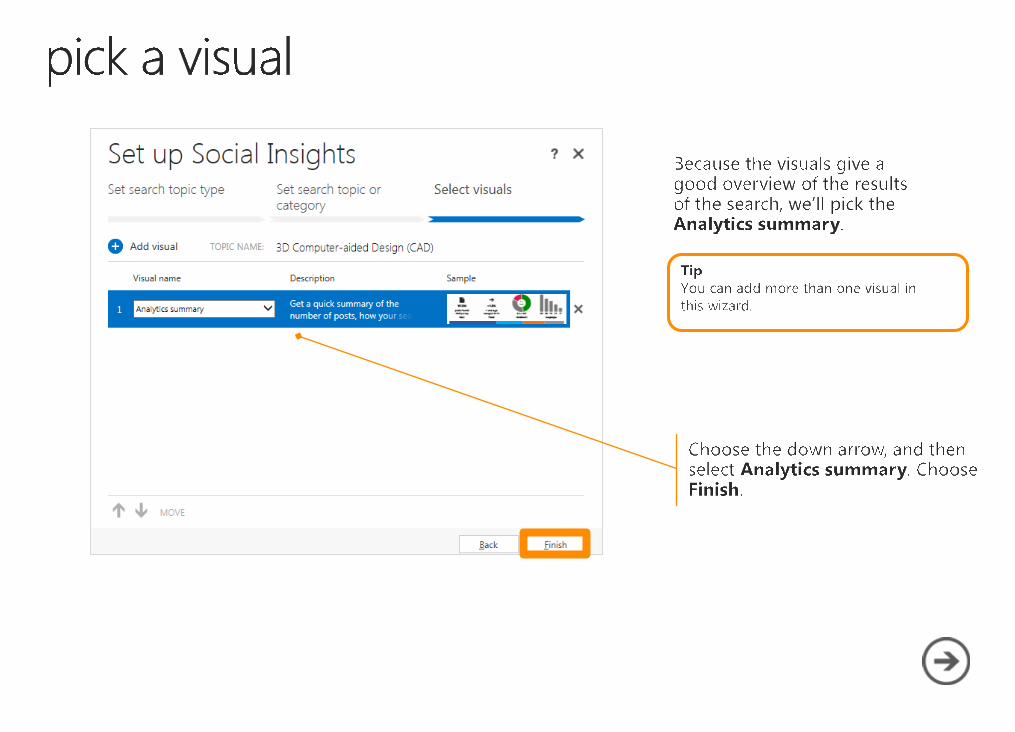
Analytics summary
Get details about how many posts are showing up, and how the search topic or category you're interested in is trending.
You'll also see the sentiment that is being associated with your topic, the languages used to discuss your topic and the countries/regions found most often in this topic or category.

Sources summary
Compare where the posts are coming from. Quickly check sources like blogs, Facebook, Twitter, News, and videos.
Choose an area on the visual to see more details in Social Engagement.

Buzz reportCheck the buzz on your search topic or category. See the total number of posts and the average number of posts per week. (You can also choose a different time frame.)The Buzz report helps you keep track of the volume of posts overall on all active sources for your search topics.
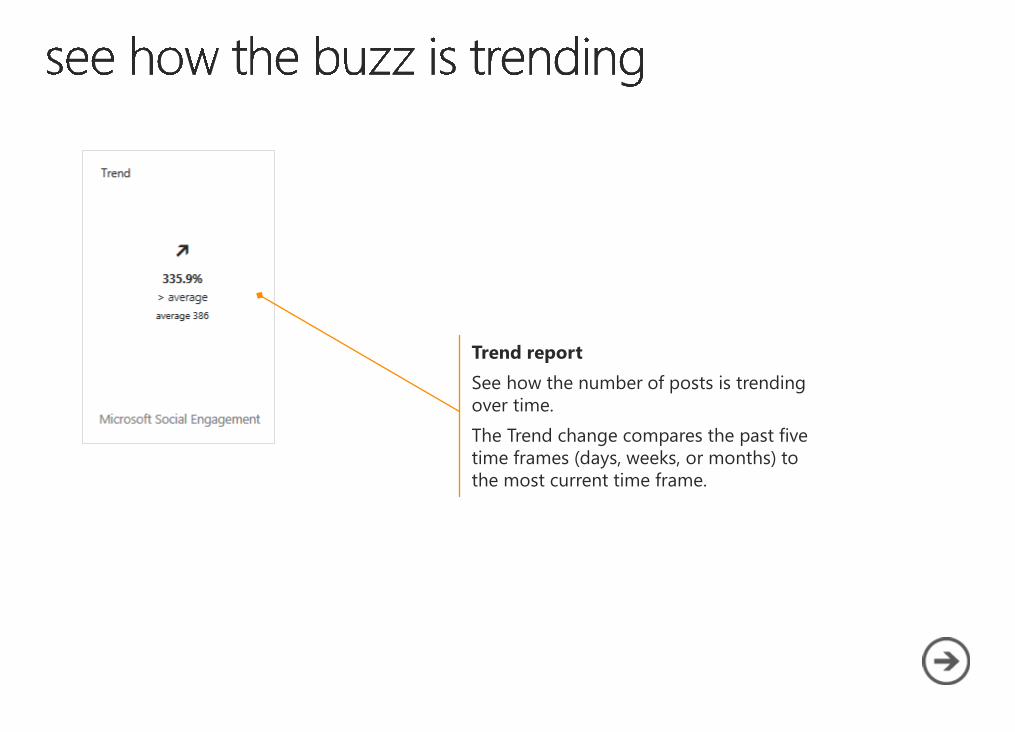
Trend reportSee how the number of posts is trending over time.The Trend change compares the past five time frames (days, weeks, or months) to the most current time frame.

Sources historySee which sources the posts are coming from. Find out quickly if a specific source is creating significantly more buzz than others and requires in-depth investigation.
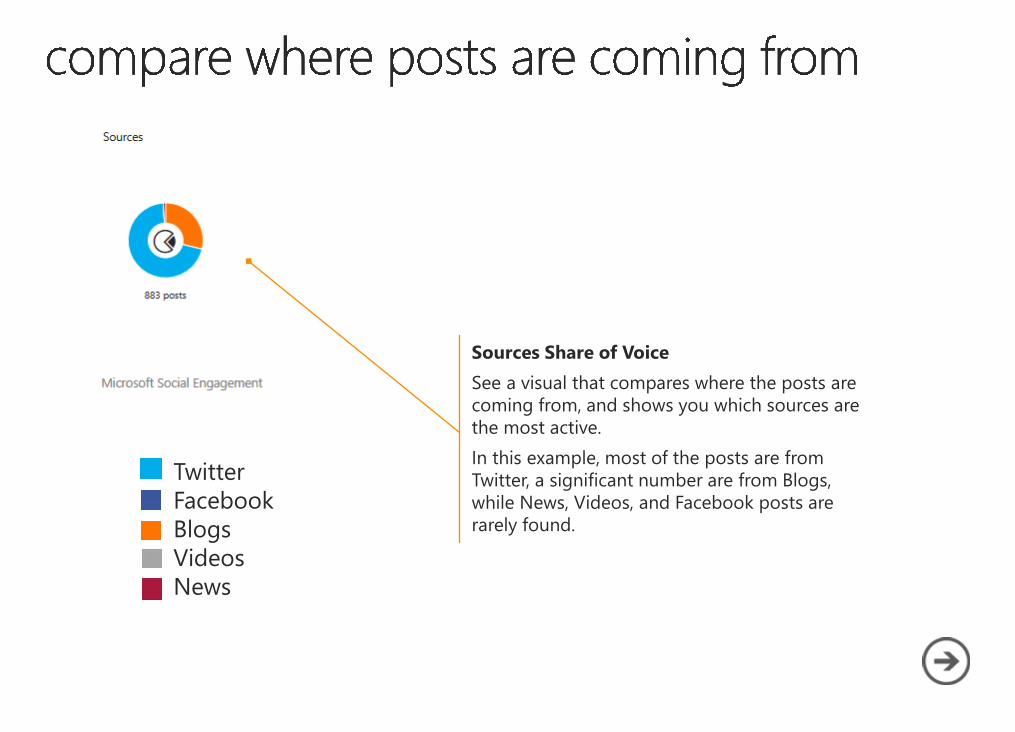
TwitterFacebookBlogsVideosNews
Sources Share of VoiceSee a visual that compares where the posts are coming from, and shows you which sources are the most active.In this example, most of the posts are from Twitter, a significant number are from Blogs, while News, Videos, and Facebook posts are rarely found.

Sentiment Share of VoiceSee a visual that compares the positive, negative, or neutral posts in your search topics.In this example, all posts are either positive or neutral, which results in a sentiment index of 10. This is an increase of +10 since last week.
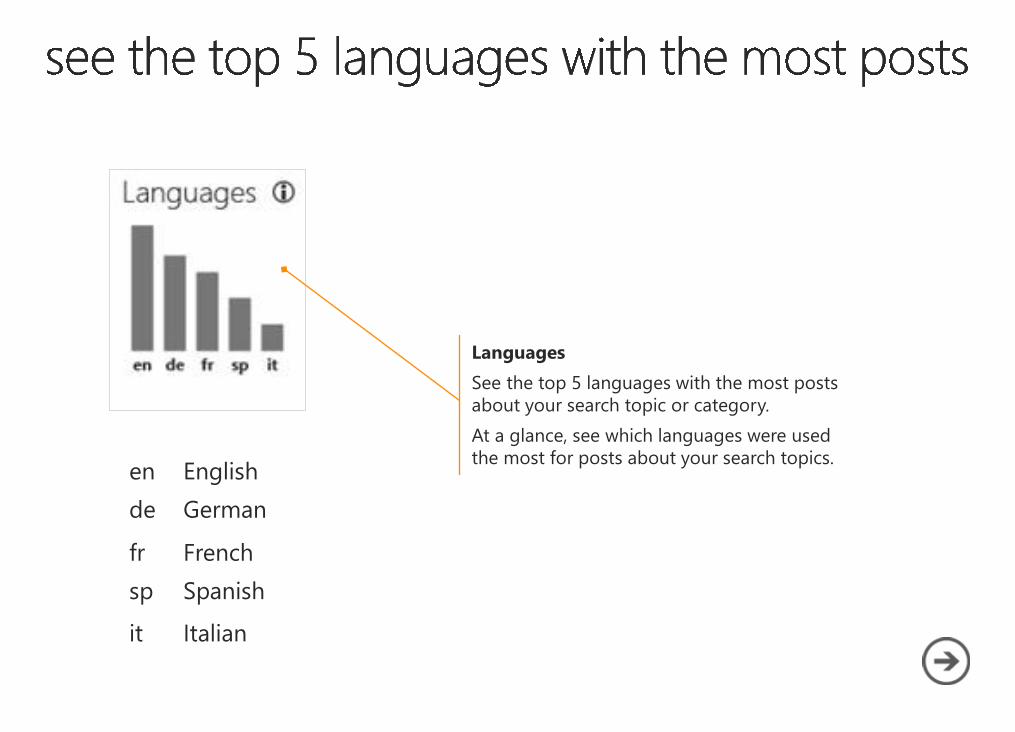
LanguagesSee the top 5 languages with the most posts about your search topic or category.At a glance, see which languages were used the most for posts about your search topics.en English
de German
fr Frenchsp Spanish
it Italian

Volume historySee peaks and valleys in the volume of posts for all sources over time. Identify important events at a glance and drill in to see more details about what happened.

Sentiment historyCorrelate sentiment about the search topic with dates and events. The black line indicates the sentiment index. The green line indicates the average sentiment index in your time frame.

Sentiment summary by sourcesSee how the sentiment varies among sources. Are posts on Facebook trending positive while Twitter is neutral? In this example, most of the posts in the past week are on Twitter, and they’re mostly positive.

Sentiment volumeSee a bar graph comparing the number of positive and negative posts. This example shows the data by day, but you can also see weekly or monthly comparisons. Choose the Filter button at the top of the visual to select a different time frame.

Recent postsSee an excerpt of the 5 most recent posts. Drill in to Social Engagement to take action and respond to these posts.

Key influencers See which people are mentioning your search topics the most. You'll find details about the number of posts, the author's share of voice, and the trend change.

Social Engagement Help Center
• Connect Dynamics CRM with Social Enagement
• eBook: Introducing Microsoft Social Engagement
• eBook: Set Up a Social Engagement Search for Your Product
• Video: Get started with Social Engagement (3:36)Video: Microsoft Social Engagement Overview (3:55)Video: Microsoft Social Engagement Analytics (7:23)
contents

Thanks for reading!
Did this eBook help you? Send us a quick note.
We’d love to know what you think.
Find more eBooks at Microsoft Social Engagement Help Center
Version 3.1
Related Documents