GOLDMAN SACHS ANNUAL GLOBAL AUTOMOTIVE CONFERENCE London – December 5, 2013

Welcome message from author
This document is posted to help you gain knowledge. Please leave a comment to let me know what you think about it! Share it to your friends and learn new things together.
Transcript
GOLDMAN SACHS ANNUAL GLOBAL AUTOMOTIVE CONFERENCE
London – December 5, 2013

December 5, 2013 Goldman Sachs - Annual Global Automotive Conference 2
Safe Harbor Statement
Cer ta i n i n fo rmat i on i nc l uded i n th i s p r esenta t i on ,
i nc l ud i ng , w i thout l im i ta t i on , any f o recas t s i nc l uded
he re i n , i s f o rwa rd l ook i ng and i s sub j ec t t o impo r tan t
r i sks and unce r ta i n t i e s tha t c ou l d cause a c tua l resu l t s
t o d i f f e r mate r i a l l y . The Group ’ s bus i nesses i nc l ude
i t s au t omot i ve , au t omot i ve - re l a ted and o the r sec t ors ,
and i t s ou t l ook i s p r edominant l y ba sed on i t s
i n te rp re ta t i on o f wha t i t cons i der s t o be the key
economi c f ac to r s a f f ec t i ng t hese bus i nesses . Fo rwa rd -
l ook i ng s ta tements w i th r ega rd to the G roup ' s
bus i nesses i nvo l ve a number o f impo r tan t f ac to rs tha t
a r e sub jec t t o change, i nc l ud i ng , bu t no t l im i ted to :
the many i n te r r e l a ted f ac to rs tha t a f fe c t consumer
con f i dence and wo r l dw ide demand fo r au t omot i ve and
au tomot i ve - re l a ted produc t s and changes i n consumer
p re fe rences tha t cou l d reduce re l a t i ve demand fo r the
Group ’ s p roduc t s ; gove rnmenta l p r og rams ; gene ra l
e conomi c cond i t i ons i n each o f the Group ' s ma rket s ;
l eg i s l a t i on , pa r t i cu l a r l y tha t re l a t i ng to automot i ve -
r e l a ted i s sues , the env i r onment , t r ade and commerce
and i n f ras t ruc t u re deve l opment ; a c t i ons o f
c ompet i t o rs i n the va r i ous i ndus t r i es i n wh i ch the
G roup competes ; p roduc t i on d i f f i cu l t i es , i nc l ud i ng
capac i t y and supp ly c ons t ra i n t s , excess i nvento ry
l eve l s , and the impac t o f veh i c l e de fec t s and/o r
p roduc t reca l l s ; l abo r r e l a t i ons ; i n te res t ra tes and
cu r r ency exchange r a tes ; ou r ab i l i ty t o rea l i ze
bene f i t s and syne rg ie s f rom ou r g l oba l a l l i ance among
the Group ’ s members ; subs tan t i a l debt and l im i t s on
l i qu i d i t y tha t may l im i t ou r ab i l i t y t o execute the
Group ’ s combined bus i ness p l ans ; po l i t i c a l and c i v i l
unres t ; ea r thquakes and o the r r i sks and uncer ta i n t i es .
Any o f the assumpt i ons unde r l y i ng th i s p resent a t i on o r
any o f the c i r cumstances o r da ta ment i oned i n th i s
p r esenta t i on may change . Any fo rwa rd - l ook i ng
s ta t ements c onta i ned i n th i s p resent a t i on speak on l y
a s o f the da te o f th i s p r esenta t i on . We exp ress l y
d i s c l a im a duty t o p rov i de upda tes t o any f o rwa rd -
l ook i ng s ta t ements . F i a t does not a ssume and
exp ress l y d i s c l a ims any l i ab i l i t y i n connec t i on w i th
any i nac cu ra c i es i n any o f these f o rwa rd - l ook i ng
s ta t ements o r i n connec t i on w i th any use by any th i rd
pa r ty o f such f o rwa rd - l ook i ng s ta t ements . Th i s
p r esenta t i on does not r ep resent i nves tment adv i ce o r
a recommendat i on f or t he pu rchase o r sa l e o f f i nanc i a l
produc t s and/o r o f any k i nd o f f i nanc i a l se rv i ces .
F i na l l y , th i s p resent a t i on does not r ep resent an
i nves tment so l i c i t a t i on i n I t a l y , pu rsuant t o Sec t i on 1 ,
l e t t e r ( t ) o f Leg i s l a t i ve Dec ree no . 58 o f F eb rua ry 24 ,
1998, as amended, no r does i t r ep resent a s im i l a r
s o l i c i t a t i on as c ontempl a ted by t he l aws i n any o the r
c oun t r y o r s t a te .

December 5, 2013 Goldman Sachs - Annual Global Automotive Conference 3
Nine months to September 2013 Executive summary
• Worldwide shipments for mass-market brands at ~3.2mn units, up 1.4% vs. last year
• Key financial metrics
Revenues at €63bn
Trading profit of €2.5bn
EBIT of €2.5bn
Net profit of €655mn
Net industrial debt at €8.3bn
Available liquidity over €20bn
• Recent investment programs announced
Production of Maserati Quattroporte in “Avv. Giovanni Agnelli” plant (Italy) started in January, then followed by Ghibli with overall investment for plant upgrade and refurbishing exceeding €0.5bn
Plans for future activities at Sevel plant (~€700mn over 5 years), announced in July
Refurbishment of Mirafiori plant for production of two new models, including a Maserati luxury SUV (announced in September)
• Group successfully concluded several transactions in debt capital markets
In March Fiat repaid a €1bn bond at maturity and issued a €1.25bn bond (6.625% fixed coupon, due Mar 2018)
In June Chrysler successfully re-priced its $3.0bn term loan and $1.3bn undrawn credit facility, while amending certain loan covenants to be consistent with Company’s bond agreement
In July, Fiat issued a 6-year €850mn bond (6.75% fixed coupon, due October 2019), subsequently increased by €400mn in Sep
Fiat renewed its 3-year €2.0bn revolving credit facility, subsequently increased to €2.1bn in July
• Partnerships in car financing extended in Europe (with extension of FGA-Credit Agricole JV) and in Brazil (with renewed agreement between Fiat and Itaù Unibanco), while Chrysler Group signed a private-label financing arrangement with Santander Consumer USA Inc. to provide a full range of wholesale and retail financing services to Chrysler Group’s dealers and consumers
• Updated 5-year plan to be presented on occasion of Q1 2014 analyst call
December 5, 2013 Goldman Sachs - Annual Global Automotive Conference 4
62,182
9M ‘13 9M ‘12
Net profit (€mn)
Net industrial debt (€bn)
Liquidity (€bn)
Trading profit (€mn)
2,654 2,463
Cash & Mktable Securities
Undrawn committed credit lines
Net revenues (€mn)
672 655
8.3
Dec 30 ‘12
6.5
2,9
20.8 20.1
3.1
17.9 17.0
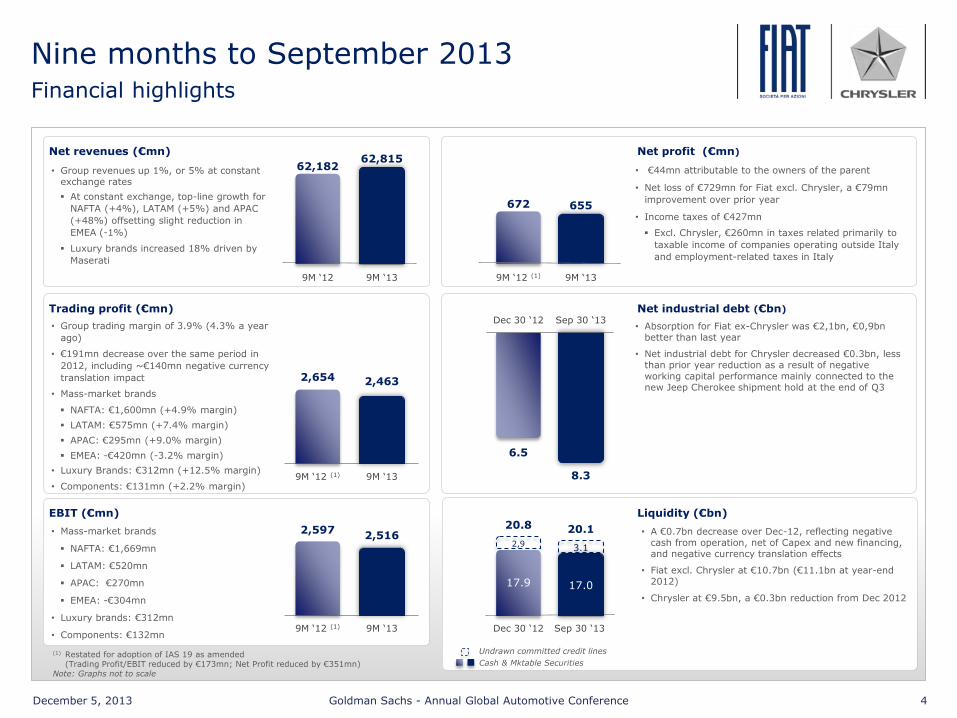
• Group revenues up 1%, or 5% at constant exchange rates
At constant exchange, top-line growth for
NAFTA (+4%), LATAM (+5%) and APAC
(+48%) offsetting slight reduction in
EMEA (-1%)
Luxury brands increased 18% driven by
Maserati
• Group trading margin of 3.9% (4.3% a year
ago)
• €191mn decrease over the same period in
2012, including ~€140mn negative currency
translation impact
• Mass-market brands
NAFTA: €1,600mn (+4.9% margin)
LATAM: €575mn (+7.4% margin)
APAC: €295mn (+9.0% margin)
EMEA: -€420mn (-3.2% margin)
• Luxury Brands: €312mn (+12.5% margin)
• Components: €131mn (+2.2% margin)
• €44mn attributable to the owners of the parent
• Net loss of €729mn for Fiat excl. Chrysler, a €79mn
improvement over prior year
• Income taxes of €427mn
Excl. Chrysler, €260mn in taxes related primarily to
taxable income of companies operating outside Italy
and employment-related taxes in Italy
• Absorption for Fiat ex-Chrysler was €2,1bn, €0,9bn better than last year
• Net industrial debt for Chrysler decreased €0.3bn, less than prior year reduction as a result of negative working capital performance mainly connected to the new Jeep Cherokee shipment hold at the end of Q3
• A €0.7bn decrease over Dec-12, reflecting negative cash from operation, net of Capex and new financing, and negative currency translation effects
• Fiat excl. Chrysler at €10.7bn (€11.1bn at year-end 2012)
• Chrysler at €9.5bn, a €0.3bn reduction from Dec 2012
9M ‘13
9M ‘13
Sep 30 ‘13
62,815
9M ‘12 (1)
9M ‘12 (1)
Dec 30 ‘12 Sep 30 ‘13
EBIT (€mn)
2,597 2,516 • Mass-market brands
NAFTA: €1,669mn
LATAM: €520mn
APAC: €270mn
EMEA: -€304mn
• Luxury brands: €312mn
• Components: €132mn 9M ‘13 9M ‘12 (1)
(1) Restated for adoption of IAS 19 as amended (Trading Profit/EBIT reduced by €173mn; Net Profit reduced by €351mn) Note: Graphs not to scale
Nine months to September 2013 Financial highlights

December 5, 2013 Goldman Sachs - Annual Global Automotive Conference 5
32.1
8.2 2.3
13.2
2.1 6.0
(1.7)
62.2
32.5
7.8 3.3
13.0
2.5 5.9
(2.1)
62.8
NAFTA LATAM APAC EMEA Ferrari &Maserati
Components Other &Eliminations
Fiat Group
MASS-MARKET BRANDS
1,930
783
219
(573)
264 118
(144)
2,597
1,669
520 270
(304)
312 132
(83)
2,516
NAFTA LATAM APAC EMEA Ferrari &Maserati
Components Other &Eliminations
Fiat Group
MASS-MARKET BRANDS
9M 2012 9M 2013
(1) 2012 restated for adoption of IAS 19 as amended (NAFTA: -€159mn; Components: -€3; Eliminations and Adjustments: -€11mn)
Note: Graphs not to scale; Numbers may not add due to rounding
• Group revenues up 1% (+5% at constant exchange rates)
NAFTA +1% (+4% at constant rates)
LATAM -5% (+5% at constant rates)
APAC +43% driven by strong volume performance
EMEA -2% mainly reflecting volume declines in Europe during H1 (Q3 first quarterly increase since Q1 2010)
Luxury brands up 18%, driven by Maserati
• EBIT
NAFTA -14% mainly reflecting lower trading profit and higher positive net unusual items in 2013
LATAM reflecting the trading profit performance and net unusual charges related to devaluation of the Venezuelan bolivar relative to the U.S. dollar
APAC up 23% inclusive of Chinese JV’s industrial costs to support new products
EMEA continues reducing losses
(1) (1) (1)
(1)
Nine months to September 2013 Performance by segment
EBIT before unusuals • 2012: €(459)mn • 2013: €(303)mn
EBIT before unusuals • 2012: €2,729mn • 2013: €2,552mn
EBIT before unusuals • 2012: €814mn • 2013: €575mn
December 5, 2013 Goldman Sachs - Annual Global Automotive Conference 6
Nine months to September 2013 Net Industrial Debt walk
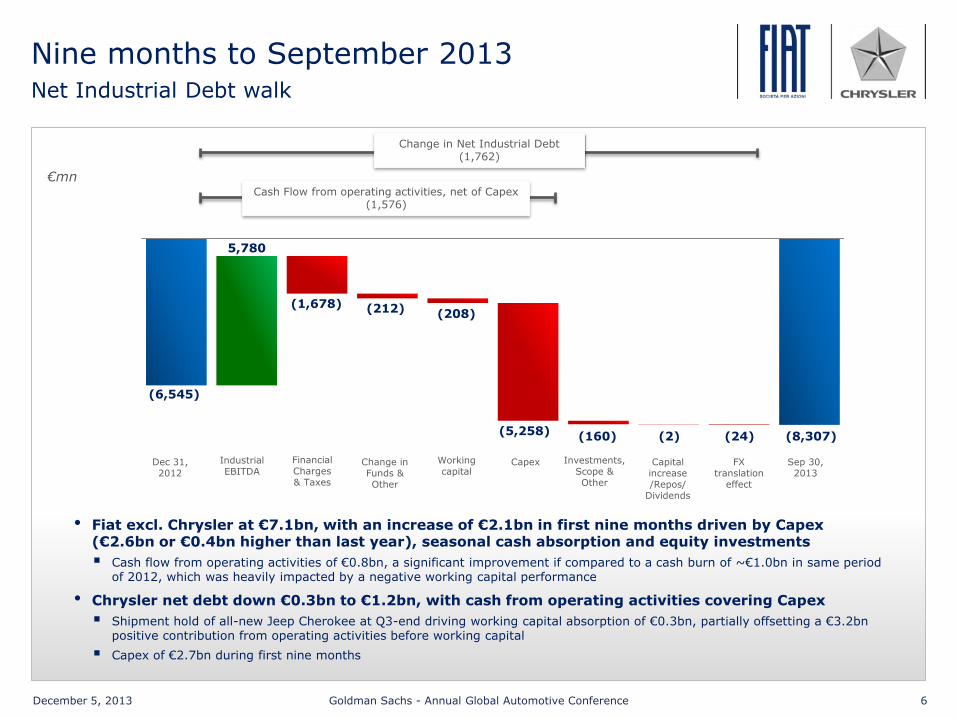
Change in Net Industrial Debt (1,762)
Cash Flow from operating activities, net of Capex (1,576)
€mn
(6,545)
(8,307)
Dec 31, 2012
Sep 30, 2013
Industrial EBITDA
Financial Charges & Taxes
Change in Funds & Other
Working capital
Capex Investments, Scope & Other
Capital increase /Repos/
Dividends
FX translation
effect
5,780
(1,678) (208)
(5,258) (2) (24)
(212)
(160)
• Fiat excl. Chrysler at €7.1bn, with an increase of €2.1bn in first nine months driven by Capex (€2.6bn or €0.4bn higher than last year), seasonal cash absorption and equity investments
Cash flow from operating activities of €0.8bn, a significant improvement if compared to a cash burn of ~€1.0bn in same period of 2012, which was heavily impacted by a negative working capital performance
• Chrysler net debt down €0.3bn to €1.2bn, with cash from operating activities covering Capex
Shipment hold of all-new Jeep Cherokee at Q3-end driving working capital absorption of €0.3bn, partially offsetting a €3.2bn positive contribution from operating activities before working capital
Capex of €2.7bn during first nine months
December 5, 2013 Goldman Sachs - Annual Global Automotive Conference 7
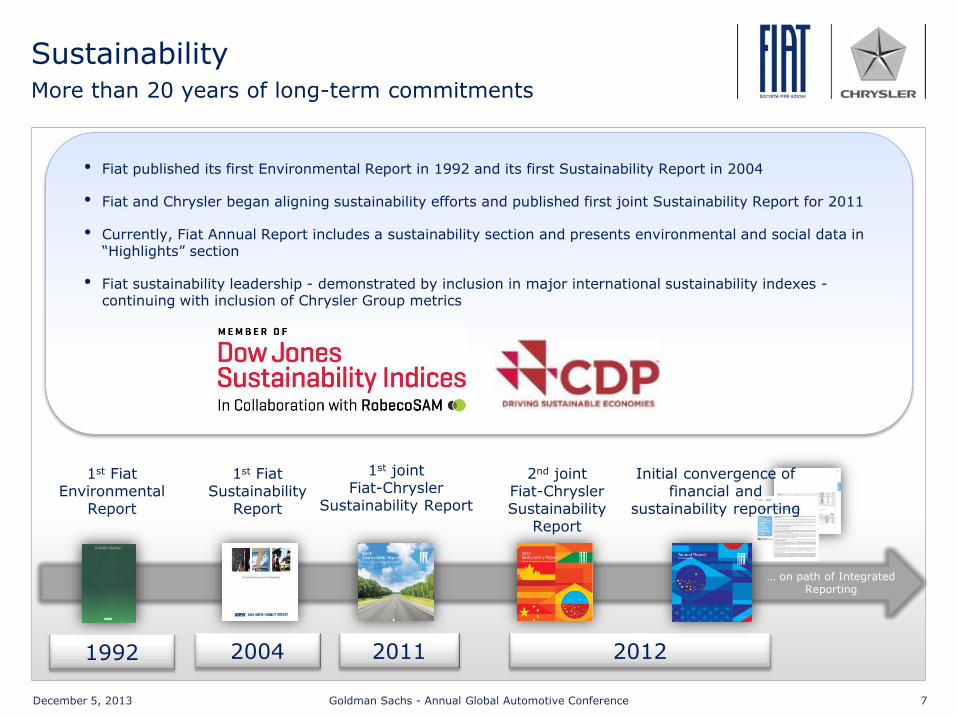
• Fiat published its first Environmental Report in 1992 and its first Sustainability Report in 2004
• Fiat and Chrysler began aligning sustainability efforts and published first joint Sustainability Report for 2011
• Currently, Fiat Annual Report includes a sustainability section and presents environmental and social data in “Highlights” section
• Fiat sustainability leadership - demonstrated by inclusion in major international sustainability indexes - continuing with inclusion of Chrysler Group metrics
1st Fiat Sustainability
Report
1st joint Fiat-Chrysler
Sustainability Report
2nd joint Fiat-Chrysler Sustainability
Report
2004 2011 2012
1st Fiat Environmental
Report
1992
… on path of Integrated Reporting
Initial convergence of financial and
sustainability reporting
Sustainability More than 20 years of long-term commitments

December 5, 2013 Goldman Sachs - Annual Global Automotive Conference 8
Some most common questions in review

December 5, 2013 Goldman Sachs - Annual Global Automotive Conference 9
What is current status of the Fiat–Veba matters?
• JULY 3, 2012: Fiat notified VEBA of exercise of its option to purchase the first tranche of VEBA’s interest in Chrysler (~3.3% of Chrysler’s equity)
Price calculated by Fiat ~$140mn based on contractual formula; VEBA stated its disagreement with such calculation
• SEPTEMBER 26, 2012: Fiat sought a declaratory judgment in the Delaware Chancery Court regarding the provisions of the Call Option agreement relating to price determination
• JANUARY 3, 2013: Fiat exercised its right for a second tranche under the VEBA Call Option calculating the amount to be paid at ~$198mn
• JULY 8, 2013: Fiat exercised its right for a third tranche under the VEBA Call Option calculating the amount to be paid at ~$255mn
Once all three transactions will have been consummated, Fiat will hold 68.5% of Chrysler’s equity
• Delaware Chancery Court issued an opinion on Jul 30, 2013
Granting Fiat judgment on the pleadings on two of most significant issues in dispute
Denying in its entirety VEBA’s cross-motion for judgment on the pleadings in VEBA’s favor
• Court also ordered further discovery on the remaining disputed issues
Discovery in progress
On Oct 14, 2013, Court entered a partial scheduling order setting a hearing on summary judgment motions on May 5, 2014 and reserved Sep 29, 2014 through Oct 3, 2014 for trial of any remaining issues in dispute following summary judgment
STATUS OF FIAT–VEBA CALL OPTION DISPUTE DELAWARE COURT OPINION
On January 9, 2013, Chrysler announced receipt of a "registration demand" from VEBA requesting registration of ~271k Class A Membership Interests in Chrysler owned by VEBA, or ~16.6% of outstanding equity of Chrysler
On Sep 23, 2013, Chrysler filed a registration statement on Form S-1 with the SEC (and amendments thereto on Oct 28 and Nov 25) relating to a proposed IPO of Chrysler common shares to be sold by VEBA
The number of shares to be offered and price range for the offering have not yet been determined
Although a registration statement has been filed, there is no assurance that an offering will take place
REGISTRATION DEMAND
December 5, 2013 Goldman Sachs - Annual Global Automotive Conference 10
Can each partner get access to other party’s liquidity?
FIAT EXCL. CHRYSLER
CHRYSLER
Note: Total cash maturities excluding accruals; numbers may not add due to rounding
3M 2013 2014 2015 2016 2017 Beyond
3M 2013 2014 2015 2016 2017 Beyond
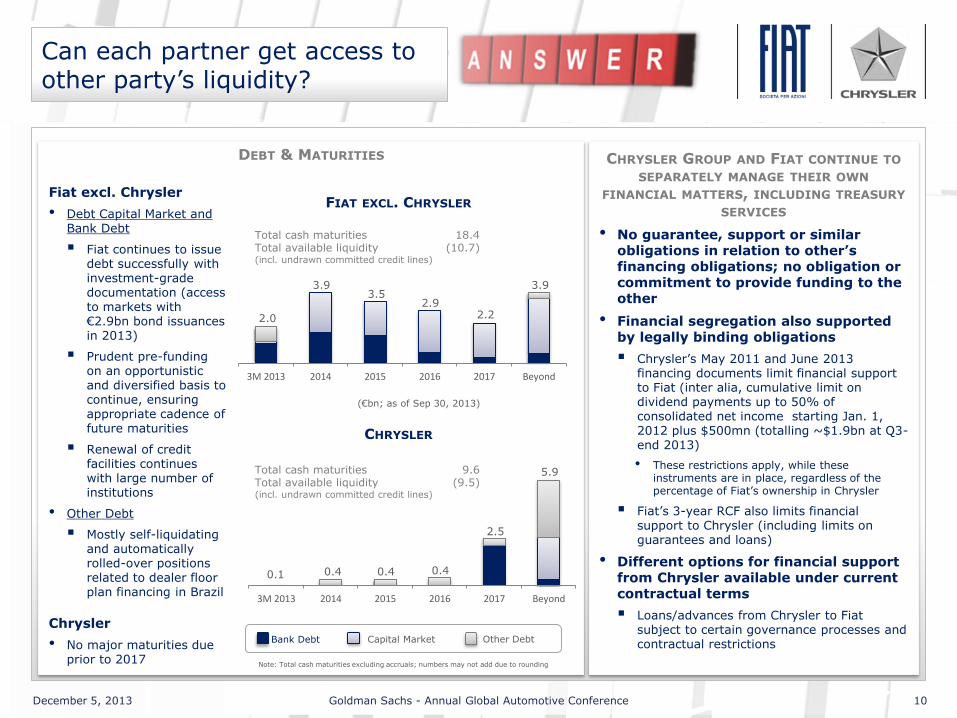
Fiat excl. Chrysler
• Debt Capital Market and Bank Debt
Fiat continues to issue debt successfully with investment-grade documentation (access to markets with €2.9bn bond issuances in 2013)
Prudent pre-funding on an opportunistic and diversified basis to continue, ensuring appropriate cadence of future maturities
Renewal of credit facilities continues with large number of institutions
• Other Debt
Mostly self-liquidating and automatically rolled-over positions related to dealer floor plan financing in Brazil
Chrysler
• No major maturities due prior to 2017
CHRYSLER GROUP AND FIAT CONTINUE TO SEPARATELY MANAGE THEIR OWN
FINANCIAL MATTERS, INCLUDING TREASURY SERVICES
• No guarantee, support or similar obligations in relation to other’s financing obligations; no obligation or commitment to provide funding to the other
• Financial segregation also supported by legally binding obligations
Chrysler’s May 2011 and June 2013 financing documents limit financial support to Fiat (inter alia, cumulative limit on dividend payments up to 50% of consolidated net income starting Jan. 1, 2012 plus $500mn (totalling ~$1.9bn at Q3-end 2013)
• These restrictions apply, while these instruments are in place, regardless of the percentage of Fiat’s ownership in Chrysler
Fiat’s 3-year RCF also limits financial support to Chrysler (including limits on guarantees and loans)
• Different options for financial support from Chrysler available under current contractual terms
Loans/advances from Chrysler to Fiat subject to certain governance processes and contractual restrictions Capital Market Bank Debt Other Debt
2.0
3.9 3.5
2.9 2.2
3.9
0.1 0.4 0.4 0.4
2.5
5.9
Total cash maturities 18.4 Total available liquidity (10.7) (incl. undrawn committed credit lines)
Total cash maturities 9.6 Total available liquidity (9.5) (incl. undrawn committed credit lines)
(€bn; as of Sep 30, 2013)
DEBT & MATURITIES

December 5, 2013 Goldman Sachs - Annual Global Automotive Conference 11
0%
2%
4%
6%
8%
10%
12%
2010 2011 2012 Sep YTD2013
Q3 2013
• Margin gap affected by Chrysler LLC (“Old CarCo”) 2009 bankruptcy
Chrysler Group had an older product lineup after bankruptcy
• Reliance on high levels of fleet sales through 2010
• Increasing R&D costs required and higher marketing costs to rebuild brand equity
• New and significantly refreshed products not in market until late 2010
Margins trending upwards as new and refreshed products gain momentum
• Margin gap vs. NA peers largely as a result of higher volumes and more favorable mix
Ford and GM shipped ~0.7mn and ~1.1mn more units than Chrysler Group, respectively in 2012, with better economies of scale and fixed costs absorption
Higher mix of large pickup trucks, large SUVs and luxury vehicles for Ford and GM
• Costs of launches and inefficiencies in supply chain running beyond 100% capacity continuing to impact margins negatively in 2013
Chrysler Group
Ford N.A.
GM N.A.
EBIT* MARGIN – AUTOMOTIVE ONLY (EBIT % of Net Revenue)
* Internal estimates excl. equity income (GM) and special items
U.S. SALES MIX (2012 CY)
Ford Worldwide
GM Worldwide
Why are Chrysler Group margins lower than its U.S. peers?
SUVs 31%
Minivans & X-Overs
21%
Large & Specialty Cars
13% Small & Mid-Size
Cars 17%
Pickups & Vans 18%
Total Cars = 30%
(1,652k vehicles) (2,250k vehicles) (2,596k vehicles)
SUVs 21%
Minivans & X-Overs
11%
Large & Specialty Cars
8% Small & Mid-Size
Cars 25%
Pickups & Vans 35%
Total Cars = 33% Total Cars = 40%
SUVs 21%
Minivans & X-Overs
10%
Large & Specialty Cars
14% Small & Mid-Size
Cars 26%
Pickups & Vans 29%
Chrysler Sep YTD 2013 profitability mainly impacted by
Lack of Jeep Liberty shipments as production ceased during 2012 in preparation for all-new 2014 Jeep Cherokee
Ongoing launches of new 2014 Jeep Grand Cherokee and 2013 Ram Heavy Duty pickup in H1 2013

December 5, 2013 Goldman Sachs - Annual Global Automotive Conference 12
• Chrysler LLC (“Old CarCo”) underinvested in new products to save cash during financial crisis (particularly 2007 through 2009)
Aged product lineup
Unbalanced portfolio with competing products within a segment as a result of wrongly-focused investments
Inefficient manufacturing infrastructure
• Vehicle rejuvenation started again in late 2009
Product investments back to pre-2007 recessionary levels
Sharing of R&D and architectures with Fiat to reduce overall expenditure requirements, including Mini (Fiat 500), Compact (Dodge Dart, Jeep Cherokee, Fiat Viaggio…) as well as LCV (ProMaster) architectures
Chrysler Group launched over 25 new and significantly refreshed products since late 2009
Initially concentrated on rebuilding Jeep and Ram brand with all-new Grand Cherokee and Cherokee and significantly refreshed Light Duty and Heavy Duty pickups
• Development of new powertrains to replace outdated engines and transmissions
New Pentastar V6 engines
New 4-cylinder TigerShark and FIRE engines equipped with MultiAir2 technology
New 8- and 9-speed transmissions
• Capacity expansions and WCM implementation
Non-product related plant investments of ~$1.0bn since mid-2009 to improve infrastructure and quality of production systems
Added shifts at most plants (shipments increased from 1.6mn vehicles in 2010 to 2.4mn in 2012)
CHRYSLER GROUP CAPEX SPEND
(U.S. GAAP)
8.8% 8.4%
9.3%
8.5%
9.1% ~8.7%
0%
2%
4%
6%
8%
10%
0.0
1.0
2.0
3.0
4.0
5.0
6.0
7.0
8.0
2008 2009 2010 2011 2012 2013E
Why does Chrysler Group have a high Capex spending profile?
REFURBISHING OF MANUFACTURING INFRASTRUCTURE
Jefferson North assembly plant (example)
R&D (left axis) Capex (left axis)
As percent of Revenue (right axis)
($ bn)
December 5, 2013 Goldman Sachs - Annual Global Automotive Conference 13
• Global all-time sales record in 2012 (702k vehicles)
Previous record at 675k vehicles in 1999
Increased sales for Jeep in all major global regions (sales outside NAFTA up 49% over 2011 to 162k units)
• Rejuvenated, competitive product line-up with significant improvement in fuel economy on all key nameplates
Wrangler continuing to play iconic presence in SUVs
Class-leading Grand Cherokee MY14 launched in Q1 2013 maintaining a leading segment position in U.S.
Award-winning Cherokee shipments started in Oct
New upgrades on Compass and Patriot continue to position vehicles successfully in market
Leveraging on extreme off-road potential with “Trail Rated” models
Expanding product offerings into new segments (including B-SUV in 2014) and geographies
• Brand shipments target of 0.8mn units in 2013
Maintaining Jeep status as #1 SUV brand in U.S.
Cleared holds for Jeep Cherokee, shipments fast recovering in Q4 (50+k vehicles shipped through November)
Expanding internationally with enlargement of distribution network in worldwide markets underway
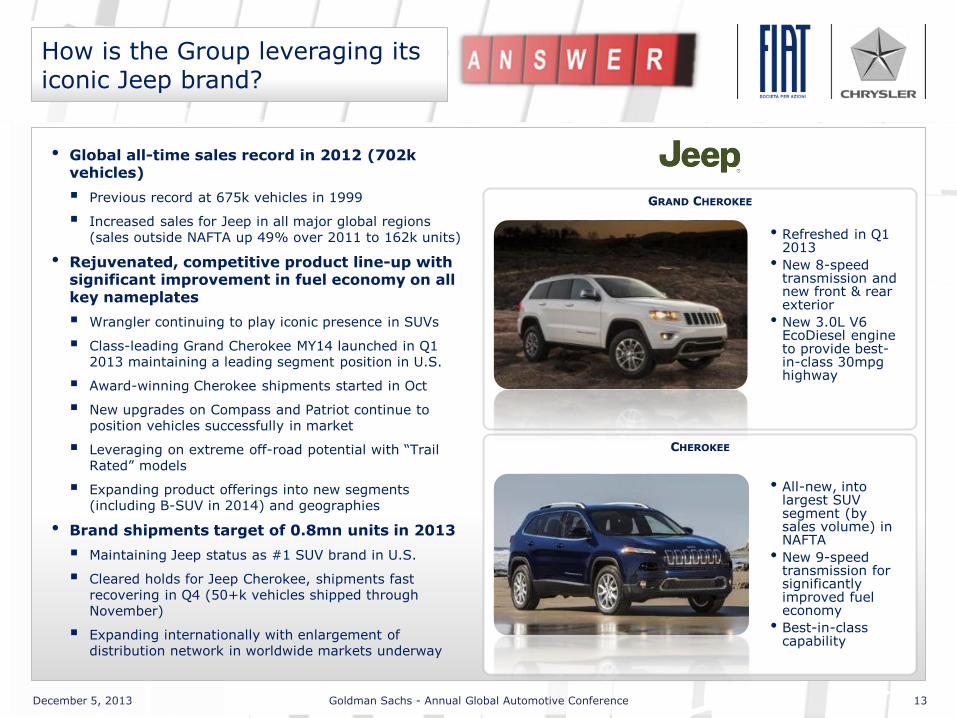
GRAND CHEROKEE
• Refreshed in Q1 2013
• New 8-speed transmission and new front & rear exterior
• New 3.0L V6 EcoDiesel engine to provide best-in-class 30mpg highway
• All-new, into largest SUV segment (by sales volume) in NAFTA
• New 9-speed transmission for significantly improved fuel economy
• Best-in-class capability
How is the Group leveraging its iconic Jeep brand?
CHEROKEE
December 5, 2013 Goldman Sachs - Annual Global Automotive Conference 14
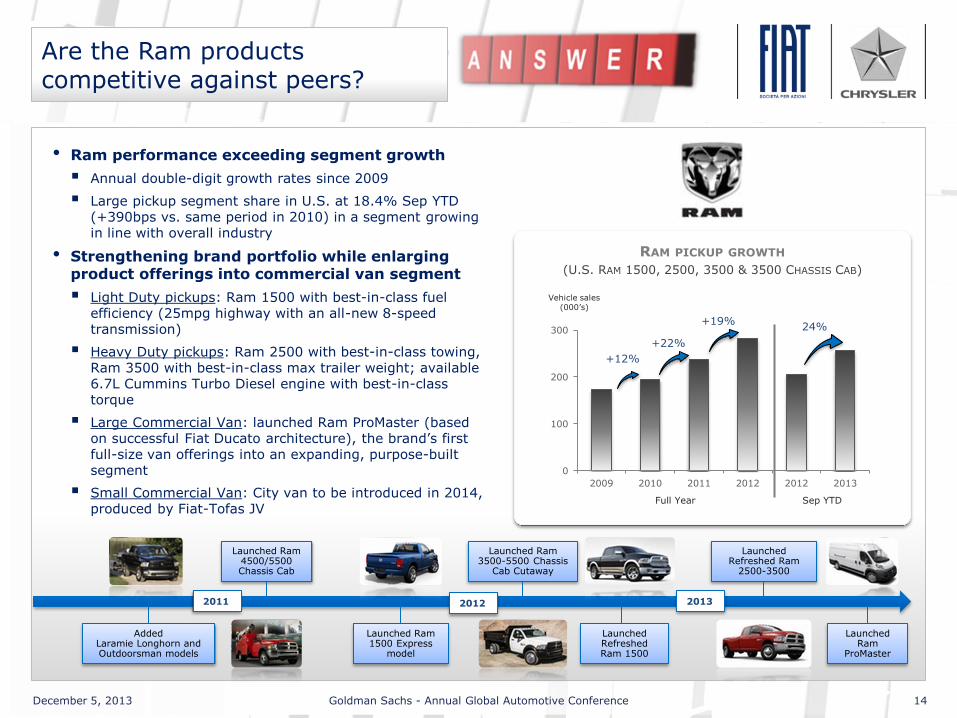
• Ram performance exceeding segment growth
Annual double-digit growth rates since 2009
Large pickup segment share in U.S. at 18.4% Sep YTD (+390bps vs. same period in 2010) in a segment growing in line with overall industry
• Strengthening brand portfolio while enlarging product offerings into commercial van segment
Light Duty pickups: Ram 1500 with best-in-class fuel efficiency (25mpg highway with an all-new 8-speed transmission)
Heavy Duty pickups: Ram 2500 with best-in-class towing, Ram 3500 with best-in-class max trailer weight; available 6.7L Cummins Turbo Diesel engine with best-in-class torque
Large Commercial Van: launched Ram ProMaster (based on successful Fiat Ducato architecture), the brand’s first full-size van offerings into an expanding, purpose-built segment
Small Commercial Van: City van to be introduced in 2014, produced by Fiat-Tofas JV
2011 2012 2013
Launched Ram 4500/5500 Chassis Cab
Launched Ram
ProMaster
Launched Refreshed Ram
2500-3500
Launched Ram 3500-5500 Chassis
Cab Cutaway
Are the Ram products competitive against peers?
Added Laramie Longhorn and Outdoorsman models
Launched Ram 1500 Express
model
Launched Refreshed Ram 1500
Vehicle sales (000’s)
RAM PICKUP GROWTH
(U.S. RAM 1500, 2500, 3500 & 3500 CHASSIS CAB)
0
100
200
300
2009 2010 2011 2012 2012 2013
+12%
+22%
+19% 24%
Full Year Sep YTD
December 5, 2013 Goldman Sachs - Annual Global Automotive Conference 15
What is Maserati’s potential?
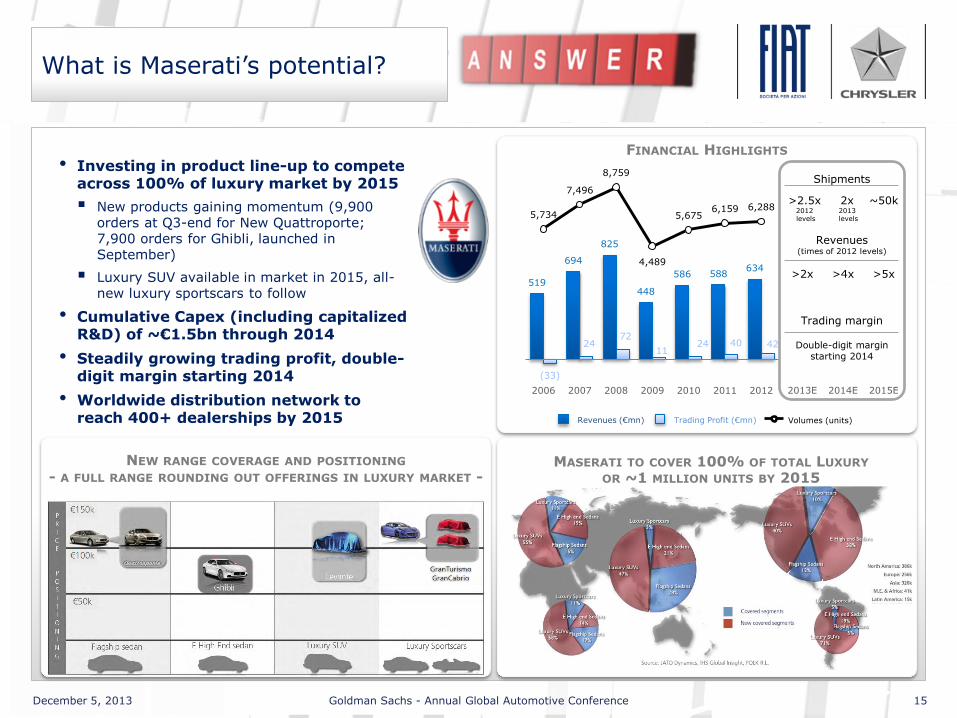
NEW RANGE COVERAGE AND POSITIONING - A FULL RANGE ROUNDING OUT OFFERINGS IN LUXURY MARKET -
• Investing in product line-up to compete across 100% of luxury market by 2015
New products gaining momentum (9,900 orders at Q3-end for New Quattroporte; 7,900 orders for Ghibli, launched in September)
Luxury SUV available in market in 2015, all-new luxury sportscars to follow
• Cumulative Capex (including capitalized R&D) of ~€1.5bn through 2014
• Steadily growing trading profit, double-digit margin starting 2014
• Worldwide distribution network to reach 400+ dealerships by 2015
519
694
825
448
586 588 634
(33)
24 72
11 24 40 42
5,734
7,496
8,759
4,489
5,675 6,159 6,288
2006 2007 2008 2009 2010 2011 2012 2013E 2014E 2015E
Revenues (€mn) Trading Profit (€mn) Volumes (units)
FINANCIAL HIGHLIGHTS
MASERATI TO COVER 100% OF TOTAL LUXURY MARKET OR ~1 MILLION UNITS BY 2015
Shipments
Revenues (times of 2012 levels)
Trading margin
Double-digit margin starting 2014
>2x >4x >5x
>2.5x 2012 levels
~50k
2013E 2014E 2015E
2x 2013 levels

December 5, 2013 Goldman Sachs - Annual Global Automotive Conference 16
Is the pricing environment improving in Europe?
3.1
3.1
3.8
2.9
3.2
3.1
3.0
'07 '08 '09 '10 '11 '12 '13E
CAGR 2007-13 -1%
• List price trend following same pattern of Consumer Price Index, while transaction prices lagging behind (only +2% vs. 2007) in both Italy & Germany
Pricing pressure continuing, in particular for mass-market segments (mainly A- & B-Segment)
• Transaction price in 2009 & 2010 impacted by eco-incentives
PASSENGER CAR MARKET
'07 '08 '09 '10 '11 '12 '13E
103 103 104
107 109
111
101
100
102 105
107 109
100
94
98
101 102 102
2007 2008 2009 2010 2011 2012 Sep YTD
2013
CPI List Price Transaction Price
2007-13 INDUSTRY PRICE TREND (A-, B-, C- & D-Segment)
2007 Index = 100
2.5
2.2
2.2
2.0
1.7
1.4
1.3
'07 '08 '09 '10 '11 '12 '13E
CAGR 2007-13 -10%
PASSENGER CAR MARKET
'07 '08 '09 '10 '11 '12 '13E
INDUSTRY RETAILS SALES - PASSENGER CARS -
(AS PERCENT OF TOTAL MARKET)
104 104 106
109
113 115
102 104
105 106 107 108
102
98 100 101 102 102
2007 2008 2009 2010 2011 2012 Sep YTD
2013
CPI List Price Transaction Price
2007 Index = 100
(mn units) (mn units)
2007-13 INDUSTRY PRICE TREND (A-, B-, C- & D-Segment)
AVERAGE PRICING NOT IMPROVING, BUT SHOWING SOME STABILIZATION AT TROUGH
INDUSTRY RETAILS SALES - PASSENGER CARS -
(AS PERCENT OF TOTAL MARKET)
Retail sales
Retail sales
December 5, 2013 Goldman Sachs - Annual Global Automotive Conference 17
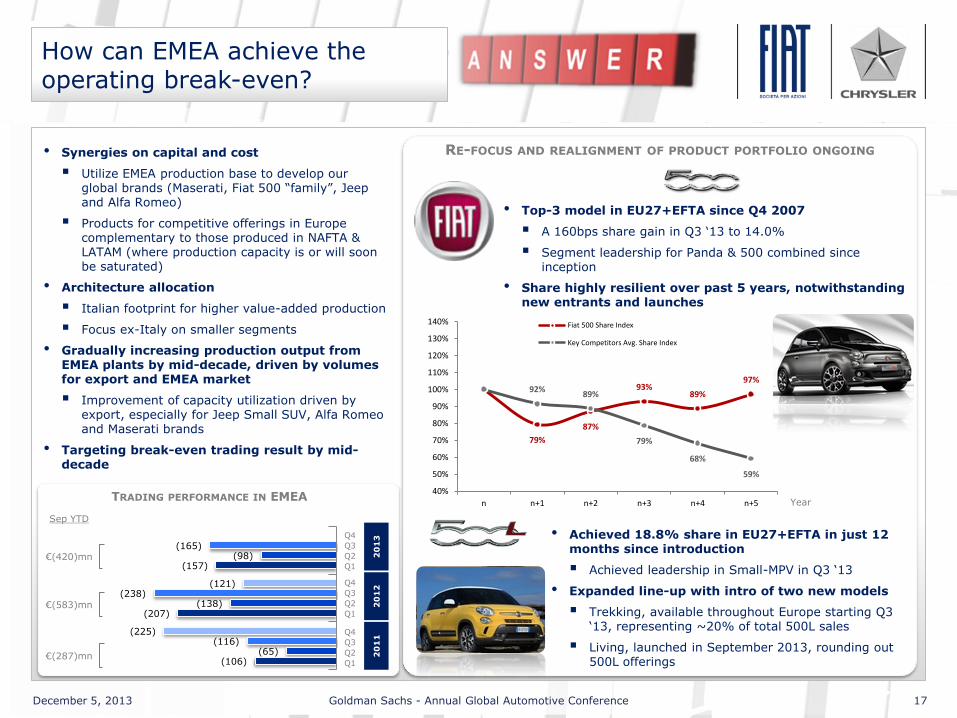
How can EMEA achieve the operating break-even?
79%
87%
93% 89%
97% 92%
89%
79%
68%
59%
40%
50%
60%
70%
80%
90%
100%
110%
120%
130%
140%
n n+1 n+2 n+3 n+4 n+5
Fiat 500 Share Index
Key Competitors Avg. Share Index
Index 100 = 2008
• Top-3 model in EU27+EFTA since Q4 2007
A 160bps share gain in Q3 ‘13 to 14.0%
Segment leadership for Panda & 500 combined since inception
• Share highly resilient over past 5 years, notwithstanding new entrants and launches
• Achieved 18.8% share in EU27+EFTA in just 12 months since introduction
Achieved leadership in Small-MPV in Q3 ‘13
• Expanded line-up with intro of two new models
Trekking, available throughout Europe starting Q3 ‘13, representing ~20% of total 500L sales
Living, launched in September 2013, rounding out 500L offerings
RE-FOCUS AND REALIGNMENT OF PRODUCT PORTFOLIO ONGOING • Synergies on capital and cost
Utilize EMEA production base to develop our global brands (Maserati, Fiat 500 “family”, Jeep and Alfa Romeo)
Products for competitive offerings in Europe complementary to those produced in NAFTA & LATAM (where production capacity is or will soon be saturated)
• Architecture allocation
Italian footprint for higher value-added production
Focus ex-Italy on smaller segments
• Gradually increasing production output from EMEA plants by mid-decade, driven by volumes for export and EMEA market
Improvement of capacity utilization driven by export, especially for Jeep Small SUV, Alfa Romeo and Maserati brands
• Targeting break-even trading result by mid-decade
(106)
(207)
(157)
(65)
(138)
(98)
(116)
(238)
(165)
(225)
(121)
TRADING PERFORMANCE IN EMEA
Q1
Q4
Q2
Q3
Q1
Q4
Q2
Q3
20
11
2
01
2
20
13
Sep YTD
Q1
Q4
Q2
Q3
€(420)mn
€(583)mn
€(287)mn
Year
December 5, 2013 Goldman Sachs - Annual Global Automotive Conference 18
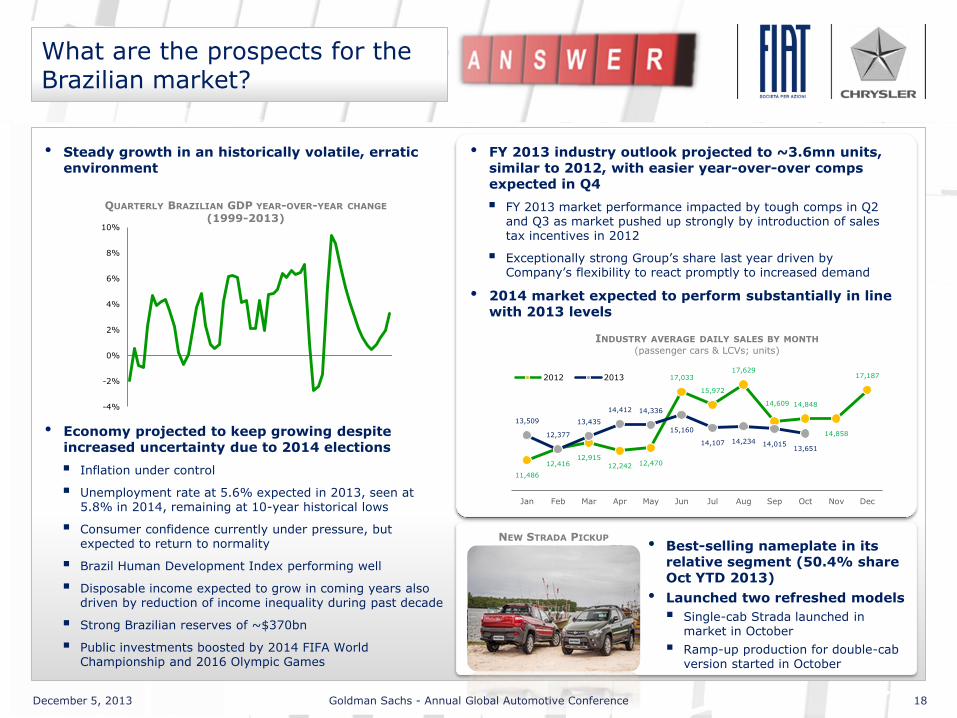
What are the prospects for the Brazilian market?
• Steady growth in an historically volatile, erratic environment
-4%
-2%
0%
2%
4%
6%
8%
10%
Hu
nd
red
s
QUARTERLY BRAZILIAN GDP YEAR-OVER-YEAR CHANGE (1999-2013)
• Economy projected to keep growing despite increased uncertainty due to 2014 elections
Inflation under control
Unemployment rate at 5.6% expected in 2013, seen at 5.8% in 2014, remaining at 10-year historical lows
Consumer confidence currently under pressure, but expected to return to normality
Brazil Human Development Index performing well
Disposable income expected to grow in coming years also driven by reduction of income inequality during past decade
Strong Brazilian reserves of ~$370bn
Public investments boosted by 2014 FIFA World Championship and 2016 Olympic Games
• FY 2013 industry outlook projected to ~3.6mn units, similar to 2012, with easier year-over-over comps expected in Q4
FY 2013 market performance impacted by tough comps in Q2 and Q3 as market pushed up strongly by introduction of sales tax incentives in 2012
Exceptionally strong Group’s share last year driven by Company’s flexibility to react promptly to increased demand
• 2014 market expected to perform substantially in line with 2013 levels
11,486
12,416 12,915
12,242 12,470
17,033
15,972
17,629
14,609 14,848
14,858
17,187
13,509
12,377
13,435
14,412 14,336
15,160
14,107 14,234 14,015 13,651
Jan Feb Mar Apr May Jun Jul Aug Sep Oct Nov Dec
2012 2013
INDUSTRY AVERAGE DAILY SALES BY MONTH (passenger cars & LCVs; units)
• Best-selling nameplate in its relative segment (50.4% share Oct YTD 2013)
• Launched two refreshed models
Single-cab Strada launched in market in October
Ramp-up production for double-cab version started in October
NEW STRADA PICKUP
December 5, 2013 Goldman Sachs - Annual Global Automotive Conference 19
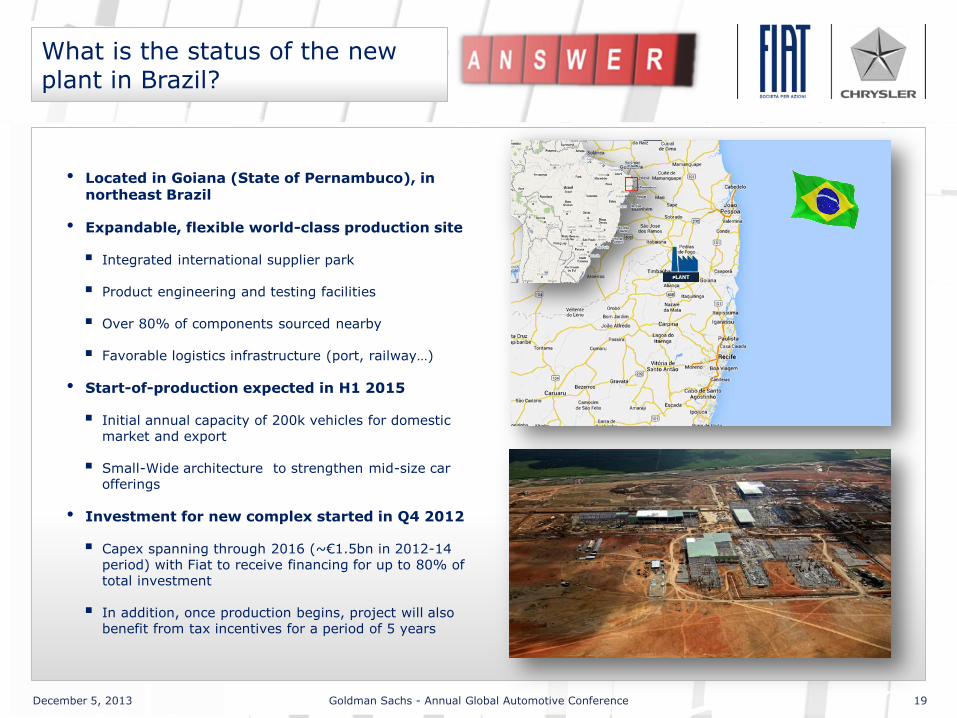
What is the status of the new plant in Brazil?
• Located in Goiana (State of Pernambuco), in northeast Brazil
• Expandable, flexible world-class production site
Integrated international supplier park
Product engineering and testing facilities
Over 80% of components sourced nearby
Favorable logistics infrastructure (port, railway…)
• Start-of-production expected in H1 2015
Initial annual capacity of 200k vehicles for domestic market and export
Small-Wide architecture to strengthen mid-size car offerings
• Investment for new complex started in Q4 2012
Capex spanning through 2016 (~€1.5bn in 2012-14 period) with Fiat to receive financing for up to 80% of total investment
In addition, once production begins, project will also benefit from tax incentives for a period of 5 years

December 5, 2013 Goldman Sachs - Annual Global Automotive Conference 20
MOVING TO THE HEART OF THE PREMIUM MARKET
• Strong brand heritage
• Focus on brand DNA (sportiness, performance, style) for sedans, X-overs and specialties
• Technical product solutions on par with peers, leveraging capital and cost synergies available in Group portfolio
• Improving brand image and awareness, through focus on product excellence as per Maserati experience
• Distribution across all regions
• A 2-seater compact supercar for brand relaunch
~3.5k units per year worldwide
• Produced in Maserati Modena plant
• Well-received by commentators as “true Alfa”
• Launched in Europe in September
• A fascinating and powerful model
Carbon fiber monocoque
Brand-new 1750 turbo GDI all-aluminum engine
NEW ALFA ROMEO 4C
What is the pattern to relaunch the Alfa Romeo brand?
“EVERY TIME I SEE AN ALFA ROMEO GO BY, I
TIP MY HAT”
HENRY FORD

December 5, 2013 Goldman Sachs - Annual Global Automotive Conference 21
Did you lower 2013 guidance?
Updated guidance
Change
Revenues
~€88bn From €88-92bn range
(€84-88bn range at current exchange rates)
Trading profit
€3.5-3.8bn range From €4.0-4.5bn range
(€3.7-4.2bn range at current exchange rates)
Net profit
€0.9-1.2bn range From €1.2-1.5bn range
(€1.0-1.3bn range at current exchange rates)
Net industrial debt
€7.0-7.5bn range
From €7.0bn
(which did not include ~€0.2bn negative impact from Q3 equity
investments, net of exchange rates)
UPDATED NUMBERS, INCORPORATING FOREX MOVEMENT, ARE WITHIN RANGE OF ORIGINAL GUIDANCE FOR THE YEAR

December 5, 2013 Goldman Sachs - Annual Global Automotive Conference 22
GROUP INVESTOR RELATIONS TEAM
Marco Auriemma +39-011-006-3290 Vice President
Maristella Borotto +39-011-006-2709
Francesca Ferragina +39-011-006-2308
Timothy Krause +1-248-512-2923
Paolo Mosole +39-011-006-1064
Sara Nicola +39-011-006-2572
fax: +39-011-006-3796
email: [email protected]
websites: www.fiatspa.com
www.chryslergroupllc.com
Contacts
Related Documents


![PRESENTACION 3T2014 EN [Modo de compatibilidad] 3T2014_EN_tcm30...Resultados 2012 9M 2014 9M 2013 Chg. 14/13 NET PROFIT 83 80 +3% REVENUE 1,979 2,028 -2% (€ million) Operating performance](https://static.cupdf.com/doc/110x72/5f057d2f7e708231d4133709/presentacion-3t2014-en-modo-de-compatibilidad-3t2014entcm30-resultados-2012.jpg)