FY 2008 Results FY 2008 Results

Welcome message from author
This document is posted to help you gain knowledge. Please leave a comment to let me know what you think about it! Share it to your friends and learn new things together.
Transcript
FY 2008 Results FY 2008 Results
2
DisclaimerDisclaimer
This presentation (“Presentation”), is strictly confidential to the recipient, may not be distributed to the press or any other person, and may not be reproduced in any form. Failure to comply with this restriction may constitute a violation of applicable securities laws.
This Presentation does not constitute or form part of and should not be construed as, an offer to sell or issue or the solicitation of an offer to buy or acquire securities of OJSC Magnit (the “Company”) or any of its subsidiaries in any jurisdiction or an inducement to enter into investment activity. No part of this Presentation, nor the fact of its distribution, should form the basis of, or be relied on in connection with, any contract or commitment or investment decision whatsoever.
The materials comprised in this Presentation have been prepared solely for use at the Presentation and have not been independently verified. No representation, warranty or undertaking, express or implied, is made as to, and no reliance should be placed on, the fairness, accuracy, completeness or correctness of the information or the opinions contained herein. None of the Company, nor any shareholder of the Company, nor any of its or their affiliates, advisors or representatives shall have any liability whatsoever (in negligence or otherwise) for any loss howsoever arising from any use of this Presentation or its contents or otherwise arising in connection with the Presentation.
This Presentation is made to and directed only at (i) persons outside the United Kingdom, (ii) persons in the United Kingdom falling within Articles 19, 47 and/or 49 of the Financial Services and Markets Act 2000 (Financial Promotion) Order 2005 and only where the conditions contained in these Articles have been, or will at the relevant time be, satisfied (such persons collectively being referred to as "Relevant Persons").
Neither this Presentation nor any copy of it may be taken or transmitted into the United States of America, its territories or possessions, or distributed, directly or indirectly, in the United States of America, its territories or possessions, except in reliance on an exemption from the registration requirements of the Securities Act of 1933, as amended (the “Securities Act”). Any failure to comply with this restriction may constitute aviolation of United States securities laws. The presentation is not an offer of securities for sale in the United States.
Neither this Presentation nor any copy of it may be taken or transmitted into Canada, Australia or Japan or to Canadian persons or to any securities analyst or other person in any of those jurisdictions. Any failure to comply with this restriction may constitute a violation of Australian, Canadian or Japanese securities law. The distribution of this Presentation in other jurisdictions may be restricted by law and persons into whose possession this document comes should inform themselves about, and observe, any such restrictions. The Company has not registered and does not intend to register any of its securities under the applicable securities laws of Canada, Australia or Japan.
This Presentation is not an offer to the public or an advertisement of any securities in the Russian Federation.
This Presentation is not directed to, or intended for distribution to or use by, any person or entity that is a citizen or resident or located in any locality, state, country or other jurisdiction where such distribution, publication, availability or use would be contrary to law or regulation or which would require any registration or licensing within such jurisdiction.
The information contained in this Presentation does not constitute a public offer under any applicable legislation, or an offer to sell or solicitation of an offer to buy any securities.
Matters discussed in this Presentation may constitute forward-looking statements. Forward-looking statements include statements concerning plans, objectives, goals, strategies, future events or performance, and underlying assumptions and other statements, which are other than statements of historical facts. The words “believe,” “expect,” “anticipate,” “intends,” “estimate,” “forecast,” “project,” “will,” “may,” “should” and similar expressions identify forward-looking statements. Forward-looking statements include statements regarding: strategies, outlook and growth prospects; future plans and potential for future growth; liquidity, capital resources and capital expenditures; growth in demand for products; economic outlook and industry trends; developments of markets; the impact of regulatory initiatives; and the strength of competitors.
The forward-looking statements in this Presentation are based upon various assumptions, many of which are based, in turn, upon further assumptions, including without limitation, management’s examination of historical operating trends, data contained in the Company’s records and other data available from third parties. These assumptions are inherently subject to significant uncertainties and contingencies which are difficult or impossible to predict and are beyond its control and it may not achieve or accomplish these expectations, beliefs or projections. In addition, important factors that, in the view of the Company, could cause actual results to differ materially from those discussed in the forward-looking statements include the achievement of the anticipated levels of profitability, growth, cost and its recent acquisitions, the timely development of new projects, the impact of competitive pricing, the ability to obtain necessary regulatory approvals, and the impact of general business and global economic conditions. Past performance should not be taken as an indication or guarantee of future results, and no representation or warranty, express or implied, is made regarding future performance.
Neither the Company, nor any of its agents, employees or advisors intend or have any duty or obligation to supplement, amend, update or revise any of the forward-looking statements contained in this Presentation or to update or to keep current any other information contained in this Presentation. The information and opinions contained in this document are provided as at the date of this Presentation and are subject to change without notice.
By attending this Presentation and/or accepting a copy of this document, you acknowledge and agree to be bound by the foregoing.
3
Table of ContentsTable of Contents
1.1. IntroductionIntroduction
2.2. Business OverviewBusiness Overview
-- Convenience FormatConvenience Format
-- Hypermarket FormatHypermarket Format-- General OverviewGeneral Overview
3.3. Financial OverviewFinancial Overview
4.4. Summary ConclusionsSummary Conclusions
4
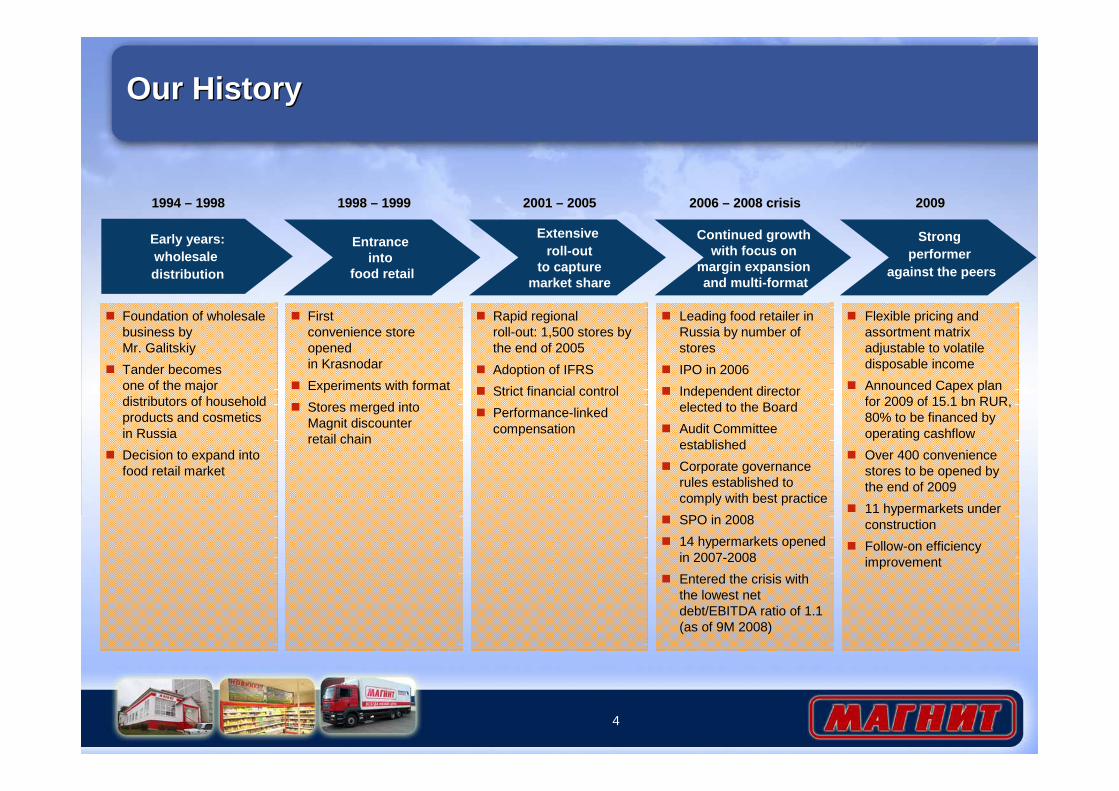
Our HistoryOur History
� Foundation of wholesale business by Mr. Galitskiy
� Tander becomesone of the major distributors of household products and cosmetics in Russia
� Decision to expand into food retail market
1994 1994 –– 19981998
Early years:wholesale distribution
� Firstconvenience store opened in Krasnodar
� Experiments with format
� Stores merged into Magnit discounter retail chain
1998 1998 –– 19991999
Entrance into
food retail
� Rapid regionalroll-out: 1,500 stores by the end of 2005
� Adoption of IFRS
� Strict financial control
� Performance-linked compensation
2001 2001 –– 20052005
Extensive roll-out
to capturemarket share
� Leading food retailer in Russia by number of stores
� IPO in 2006
� Independent director elected to the Board
� Audit Committee established
� Corporate governance rules established to comply with best practice
� SPO in 2008
� 14 hypermarkets openedin 2007-2008
� Entered the crisis with the lowest net debt/EBITDA ratio of 1.1 (as of 9M 2008)
2006 2006 –– 2008 crisis2008 crisis
Continued growth with focus on
margin expansion and multi-format
� Flexible pricing and assortment matrix adjustable to volatile disposable income
� Announced Capex plan for 2009 of 15.1 bn RUR, 80% to be financed by operating cashflow
� Over 400 convenience stores to be opened by the end of 2009
� 11 hypermarkets under construction
� Follow-on efficiency improvement
20092009
Strong performer
against the peers

5
Magnit TodayMagnit Today
� Leading market position with broad geographic coverage
� Focus on cities and towns with population under 500,000 people
� Strong platform for rapid hypermarket operations expansion
� Efficient logistics system
� Sophisticated IT systems
� Experienced management team
� Strong financial performance
Number of Stores, eop
2 1972 568
2 194
2 582
18931500
1014610
368
0
500
1 000
1 500
2 000
2 500
3 000
2002 2003 2004 2005 2006 2007 2008
Convenience Stores Hypermarkets
Financial Performance
5 3483 677
2 505
21,7%19,8%
18,2%
7,5%6,0%4,9%
3,5%2,7%2,3%0
1 000
2 000
3 000
4 000
2006 2007 20080%
5%
10%
15%
20%
25%
Sales Gross Margin EBITDA Margin NI Margin
($MM) (%)
Source: Company Source: Company
Source: Company
02-08 CAGR: 38%
Sales, Lfl Growth
22,3%21,1%18,8%
13,9%10%
15%
20%
25%
30%
FY2007-FY2006 FY2008-FY2007US$ terms RUB terms
6
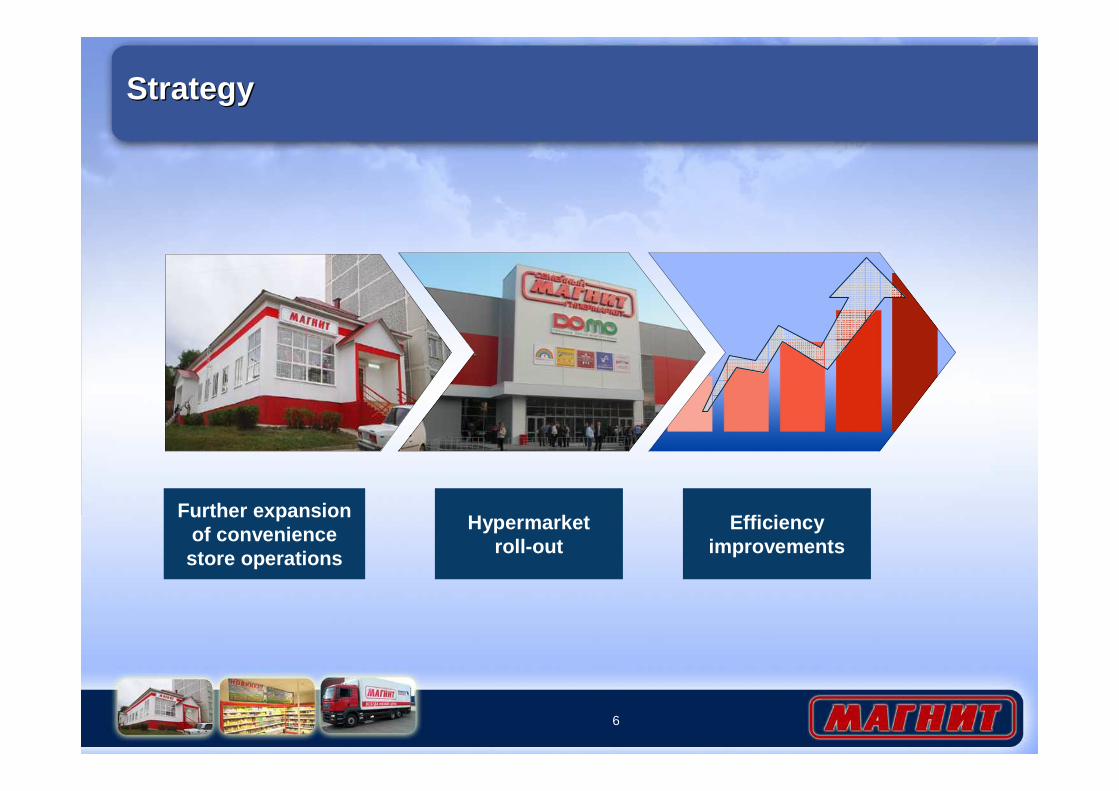
Further expansionof convenience
store operations
StrategyStrategy
Hypermarketroll-out
Efficiency improvements
7
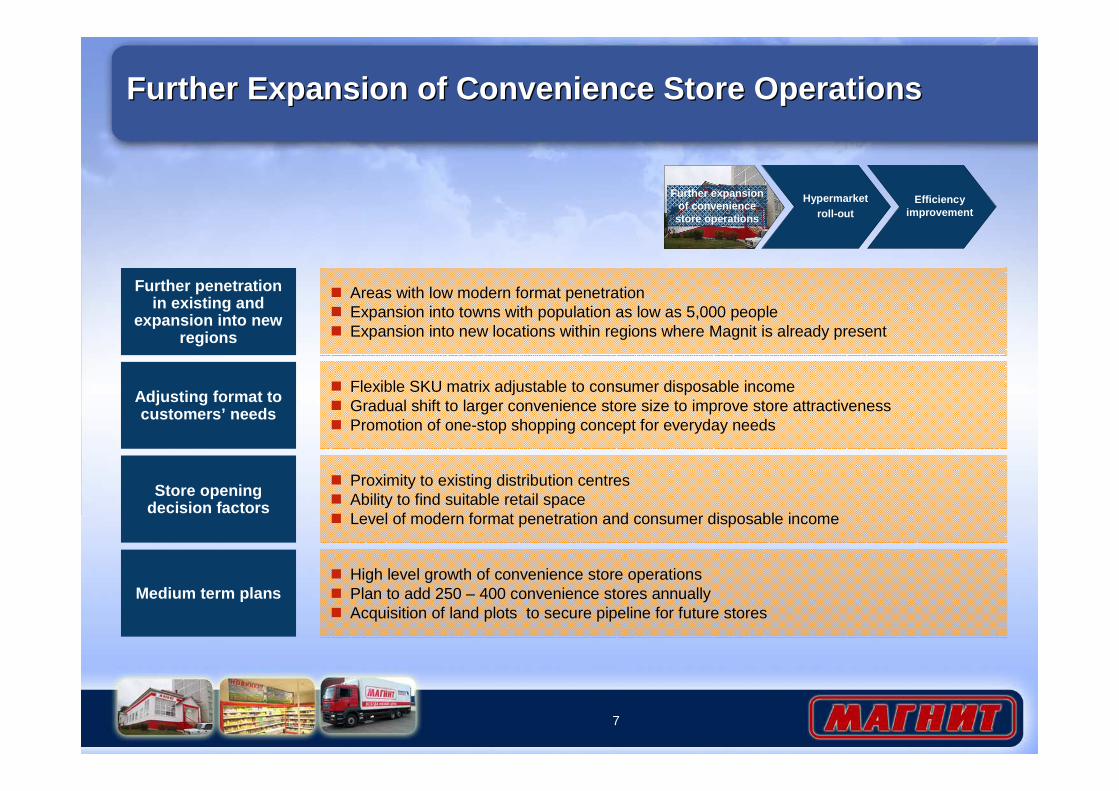
Medium term plans� High level growth of convenience store operations� Plan to add 250 – 400 convenience stores annually� Acquisition of land plots to secure pipeline for future stores
Store opening decision factors
� Proximity to existing distribution centres� Ability to find suitable retail space� Level of modern format penetration and consumer disposable income
Further Expansion of Convenience Store OperationsFurther Expansion of Convenience Store Operations
Further penetration in existing and
expansion into new regions
� Areas with low modern format penetration� Expansion into towns with population as low as 5,000 people� Expansion into new locations within regions where Magnit is already present
Further expansion of convenience
store operations
Hypermarketroll-out
Efficiency improvement
Adjusting format to customers’ needs
� Flexible SKU matrix adjustable to consumer disposable income � Gradual shift to larger convenience store size to improve store attractiveness� Promotion of one-stop shopping concept for everyday needs
8
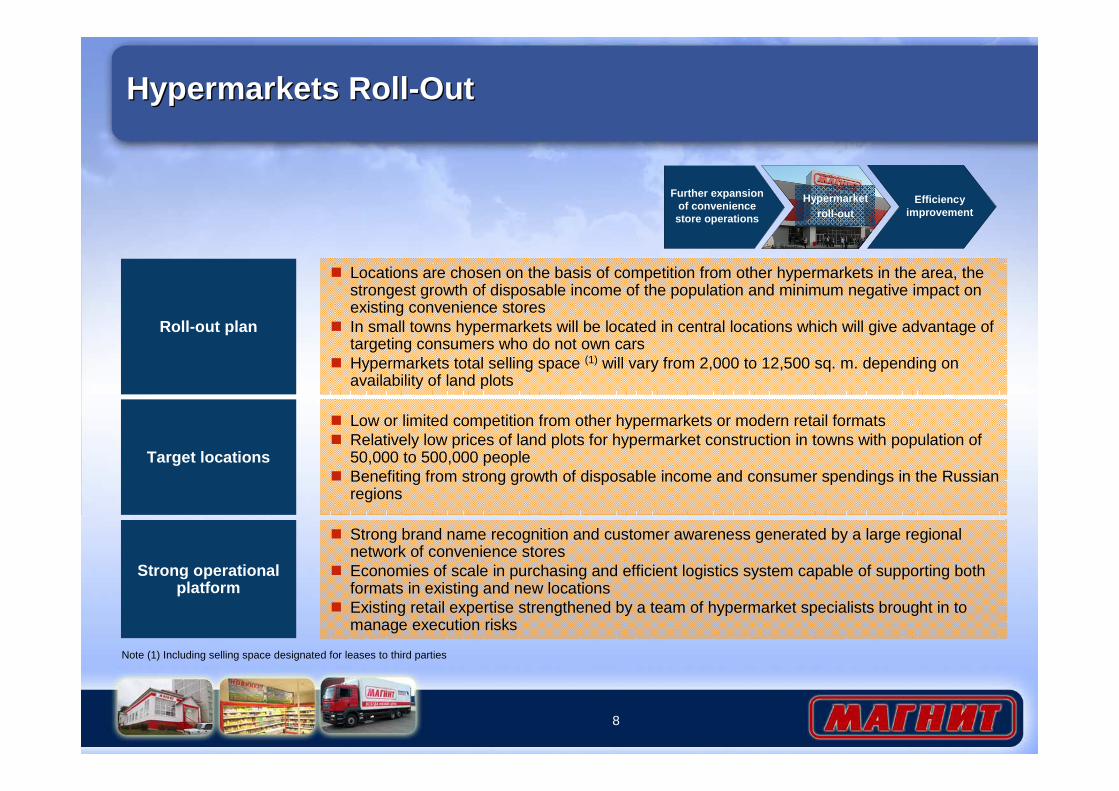
Strong operational platform
� Strong brand name recognition and customer awareness generated by a large regional network of convenience stores
� Economies of scale in purchasing and efficient logistics system capable of supporting both formats in existing and new locations
� Existing retail expertise strengthened by a team of hypermarket specialists brought in to manage execution risks
Target locations
� Low or limited competition from other hypermarkets or modern retail formats� Relatively low prices of land plots for hypermarket construction in towns with population of
50,000 to 500,000 people� Benefiting from strong growth of disposable income and consumer spendings in the Russian
regions
Hypermarkets Roll-OutHypermarkets Roll-Out
Roll-out plan
� Locations are chosen on the basis of competition from other hypermarkets in the area, the strongest growth of disposable income of the population and minimum negative impact on existing convenience stores
� In small towns hypermarkets will be located in central locations which will give advantage of targeting consumers who do not own cars
� Hypermarkets total selling space (1) will vary from 2,000 to 12,500 sq. m. depending on availability of land plots
Further expansion of convenience
store operations
Hypermarketroll-out
Efficiency improvement
Note (1) Including selling space designated for leases to third parties
9
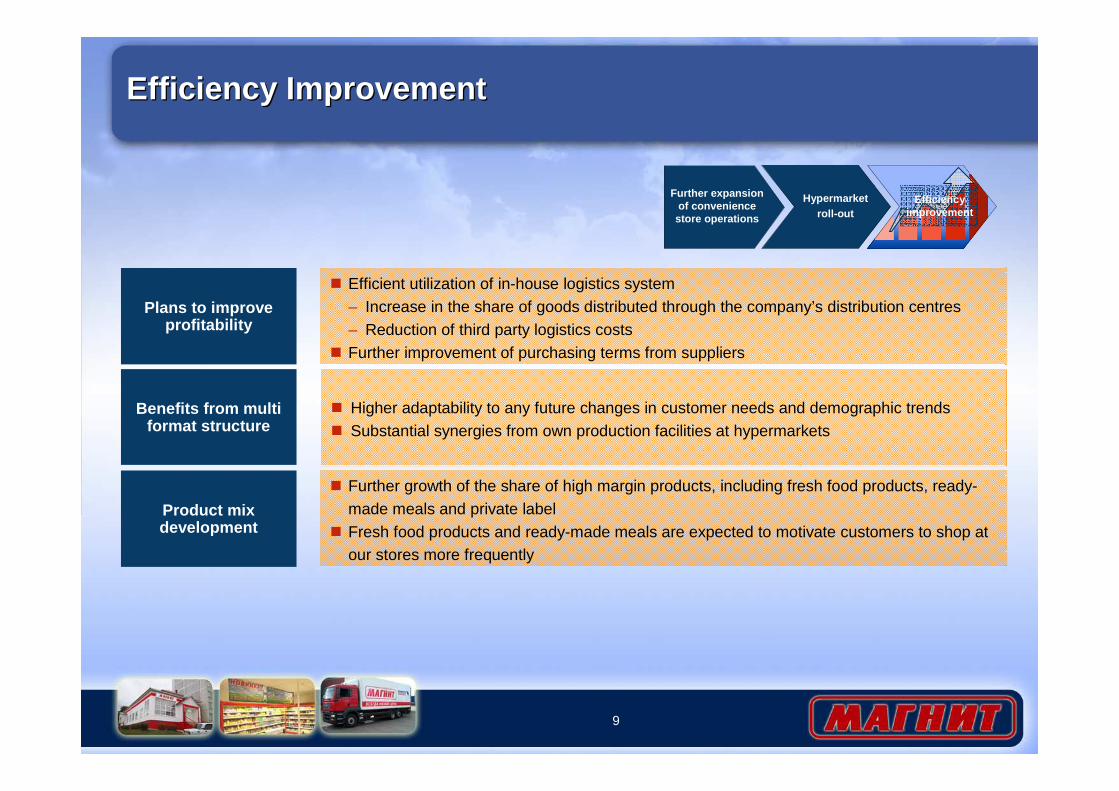
Product mix development
� Further growth of the share of high margin products, including fresh food products, ready-made meals and private label
� Fresh food products and ready-made meals are expected to motivate customers to shop at our stores more frequently
Efficiency ImprovementEfficiency Improvement
Benefits from multi format structure
� Higher adaptability to any future changes in customer needs and demographic trends� Substantial synergies from own production facilities at hypermarkets
Further expansion of convenience
store operations
Hypermarketroll-out
Efficiency improvement
Plans to improve profitability
� Efficient utilization of in-house logistics system– Increase in the share of goods distributed through the company’s distribution centres– Reduction of third party logistics costs
� Further improvement of purchasing terms from suppliers

Business OverviewBusiness Overview
11
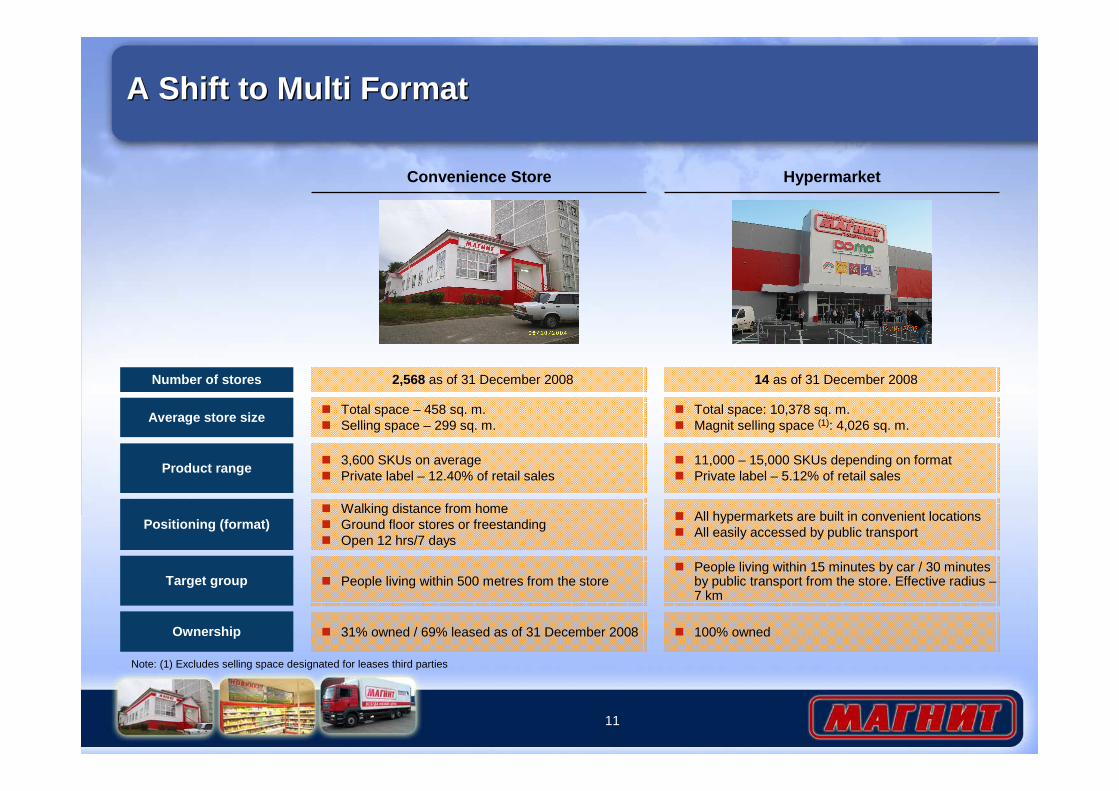
A Shift to Multi FormatA Shift to Multi Format
HypermarketConvenience Store
Number of stores 2,568 as of 31 December 2008 14 as of 31 December 2008
Average store size� Total space – 458 sq. m.� Selling space – 299 sq. m.
� Total space: 10,378 sq. m.� Magnit selling space (1): 4,026 sq. m.
Product range� 3,600 SKUs on average� Private label – 12.40% of retail sales
� 11,000 – 15,000 SKUs depending on format� Private label – 5.12% of retail sales
Positioning (format)� Walking distance from home� Ground floor stores or freestanding� Open 12 hrs/7 days
� All hypermarkets are built in convenient locations� All easily accessed by public transport
Target group � People living within 500 metres from the store� People living within 15 minutes by car / 30 minutes
by public transport from the store. Effective radius –7 km
Ownership � 31% owned / 69% leased as of 31 December 2008 � 100% owned
Note: (1) Excludes selling space designated for leases third parties
Convenience FormatConvenience Format
13
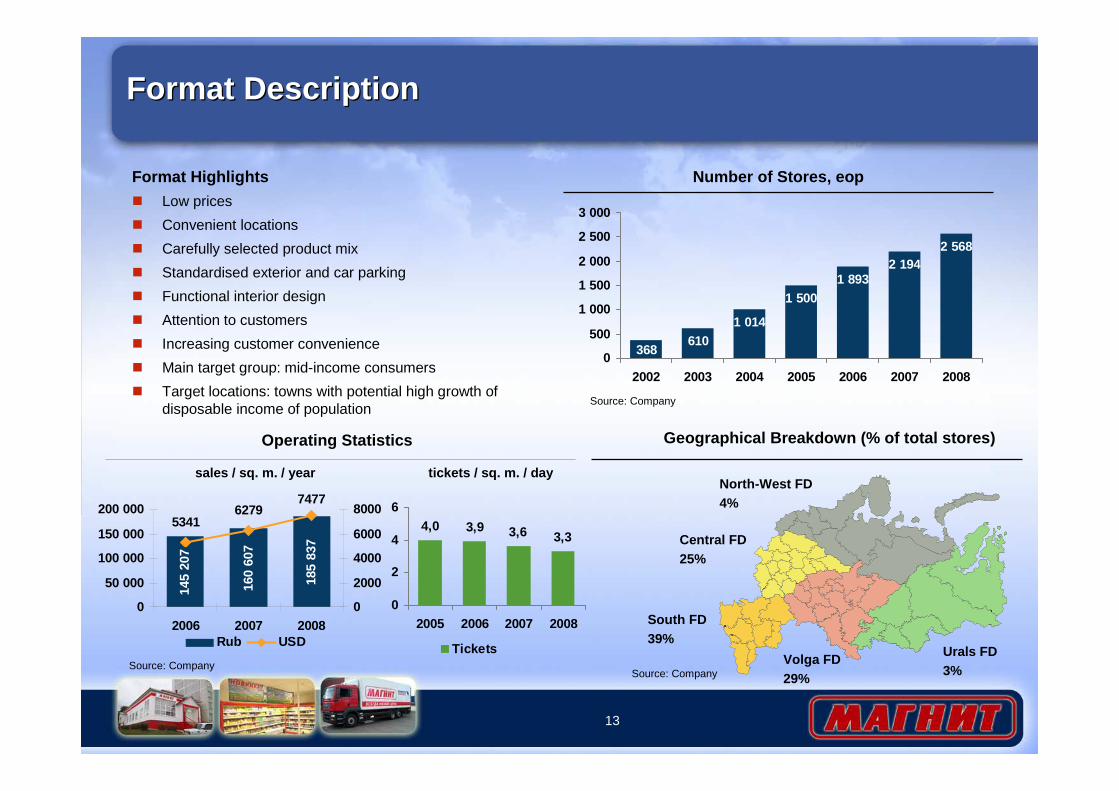
Format DescriptionFormat Description
Format Highlights
� Low prices
� Convenient locations
� Carefully selected product mix
� Standardised exterior and car parking
� Functional interior design
� Attention to customers
� Increasing customer convenience
� Main target group: mid-income consumers
� Target locations: towns with potential high growth of disposable income of population
Geographical Breakdown (% of total stores)
South FD39%
Urals FD3%
Volga FD29%
Central FD25%
North-West FD4%
Number of Stores, eop
6101 014
1 5001 893
2 1942 568
3680
500
1 000
1 500
2 000
2 500
3 000
2002 2003 2004 2005 2006 2007 2008
Operating Statistics
3,33,63,94,0
0
2
4
6
2005 2006 2007 2008
Tickets
sales / sq. m. / year
Source: Company
Source: Company
Source: Company
tickets / sq. m. / day
185
837
160
607
145
207
53416279
7477
0
50 000
100 000
150 000
200 000
2006 2007 20080
2000
4000
6000
8000
Rub USD
14
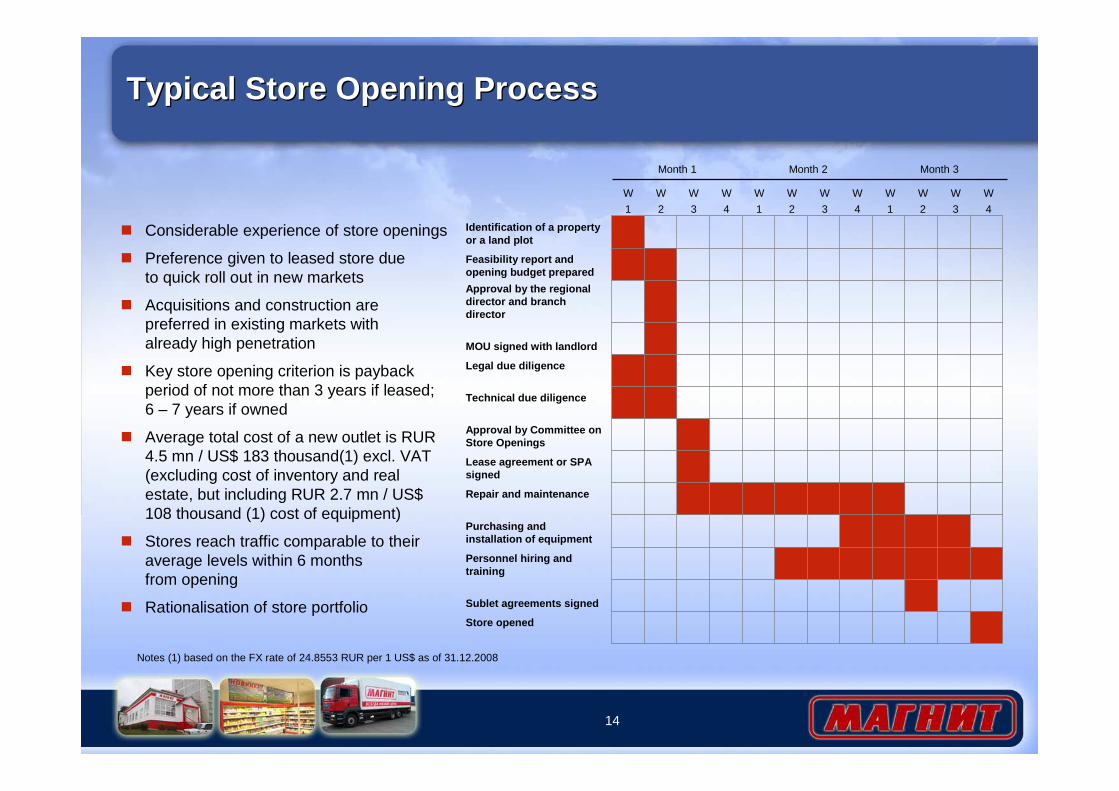
Typical Store Opening ProcessTypical Store Opening Process
� Considerable experience of store openings
� Preference given to leased store due to quick roll out in new markets
� Acquisitions and construction are preferred in existing markets with already high penetration
� Key store opening criterion is payback period of not more than 3 years if leased; 6 – 7 years if owned
� Average total cost of a new outlet is RUR 4.5 mn / US$ 183 thousand(1) excl. VAT (excluding cost of inventory and real estate, but including RUR 2.7 mn / US$ 108 thousand (1) cost of equipment)
� Stores reach traffic comparable to their average levels within 6 months from opening
� Rationalisation of store portfolio
Approval by Committee on Store Openings
MOU signed with landlord
Store opened
Sublet agreements signed
Personnel hiring and training
Purchasing and installation of equipment
Repair and maintenance
Lease agreement or SPA signed
Technical due diligence
Legal due diligence
Approval by the regional director and branch director
Feasibility report and opening budget prepared
Identification of a property or a land plot
W
1
W
2
W
3
W
4
W
1
W
2
W
3
W
4
W
1
W
2
W
3
W
4
Month 1 Month 2 Month 3
Notes (1) based on the FX rate of 24.8553 RUR per 1 US$ as of 31.12.2008

15
Store Opening DynamicsStore Opening Dynamics
385
78
463
2,582
67
116
744
642
1,013
2008
486
64
550
1,500
8
61
368
379
684
2005
393
120
513
1,893
29
84
536
461
783
2006
304
108
412
2,197
45
89
628
546
889
2007
3417Closings
Net openings
New openings
Total
Urals
North West
Volga
Central
Southern
242
259
610
9
114
100
387
2003
404
438
1,014
26
214
224
550
2004
� 78 convenience stores were closed in 2008– 30 due to poor performance– 22 were relocated to better locations– 26 were shut due to disagreements
with landlords
16
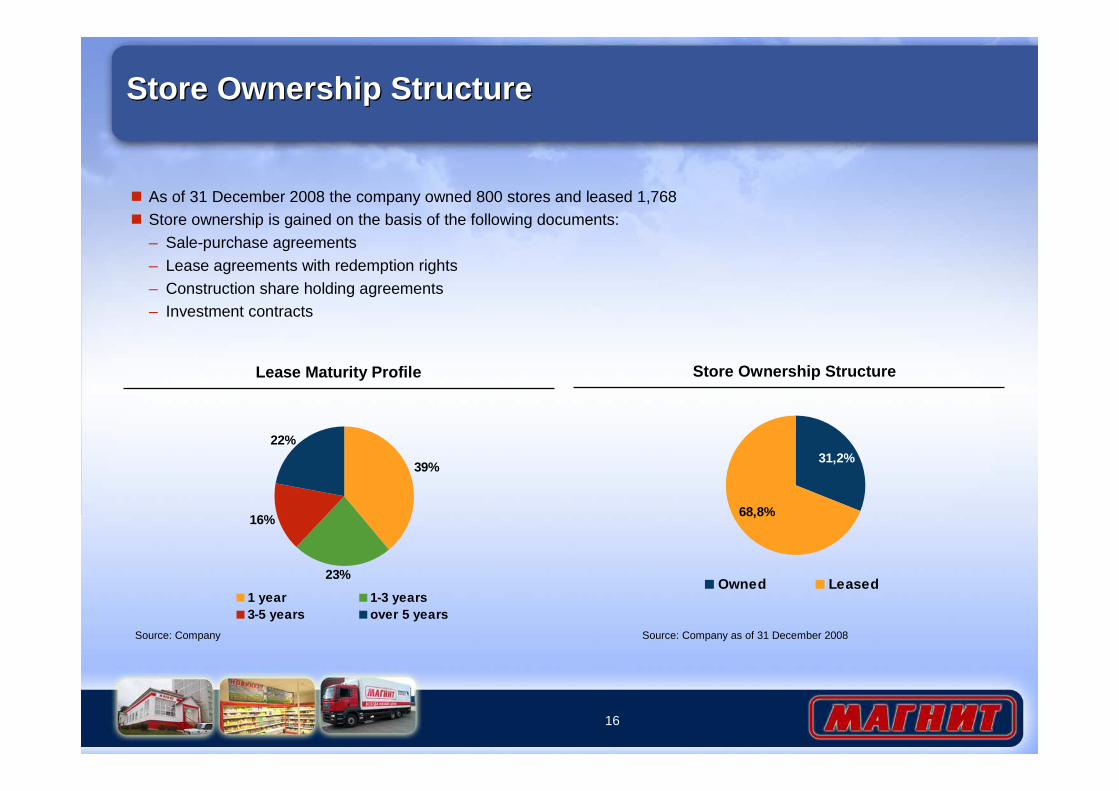
Store Ownership StructureStore Ownership Structure
31,2%
68,8%
Owned Leased
Store Ownership StructureLease Maturity Profile
39%
23%
16%
22%
1 year 1-3 years3-5 years over 5 years
Source: Company Source: Company as of 31 December 2008
� As of 31 December 2008 the company owned 800 stores and leased 1,768� Store ownership is gained on the basis of the following documents:
– Sale-purchase agreements– Lease agreements with redemption rights– Construction share holding agreements– Investment contracts
17
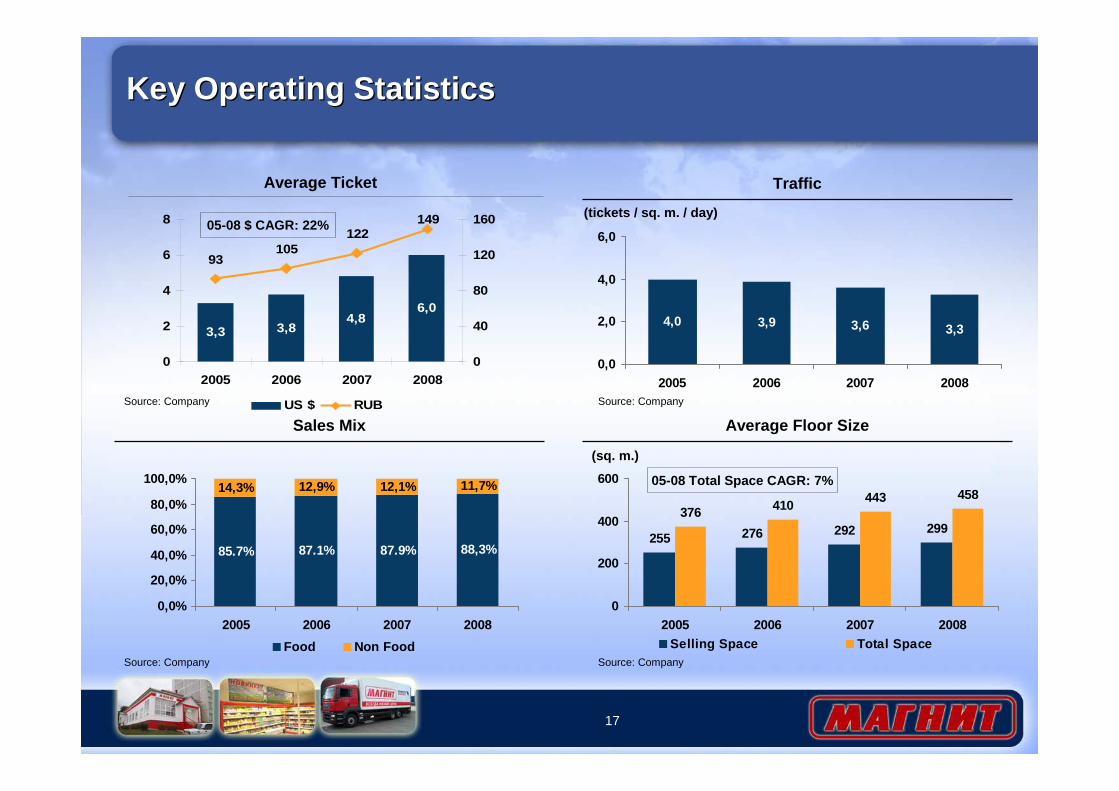
88,3%
14,3% 12,9% 12,1% 11,7%
87.9%87.1%85.7%
0,0%
20,0%
40,0%
60,0%
80,0%
100,0%
2005 2006 2007 2008
Food Non Food
Key Operating StatisticsKey Operating Statistics
Sales Mix
Traffic
4,0 3,9 3,6 3,3
0,0
2,0
4,0
6,0
2005 2006 2007 2008
Average Floor Size
255 276 292 299376 410
443 458
0
200
400
600
2005 2006 2007 2008Selling Space Total Space
Source: Company
Source: Company
Source: Company
Source: Company
(tickets / sq. m. / day)
(sq. m.)
05-08 $ CAGR: 22%
05-08 Total Space CAGR: 7%
3,3 3,84,8
6,0
93105
122149
0
2
4
6
8
2005 2006 2007 20080
40
80
120
160
US $ RUB
Average Ticket
18
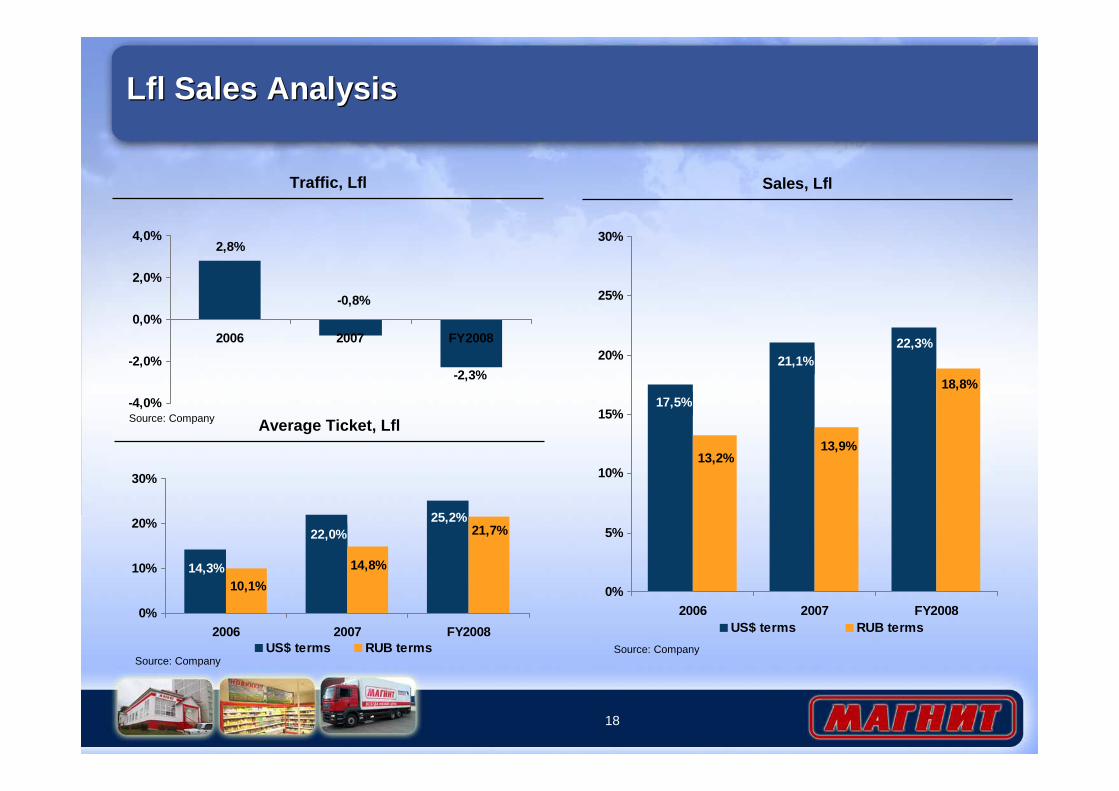
Lfl Sales AnalysisLfl Sales Analysis
Average Ticket, Lfl
25,2%22,0%
14,3%
21,7%
14,8%
10,1%
0%
10%
20%
30%
2006 2007 FY2008US$ terms RUB terms
Traffic, Lfl
-2,3%
-0,8%
2,8%
-4,0%
-2,0%
0,0%
2,0%
4,0%
2006 2007 FY2008
Sales, Lfl
22,3%21,1%
17,5%18,8%
13,9%13,2%
0%
5%
10%
15%
20%
25%
30%
2006 2007 FY2008US$ terms RUB terms
Source: Company
Source: Company
Source: Company
19
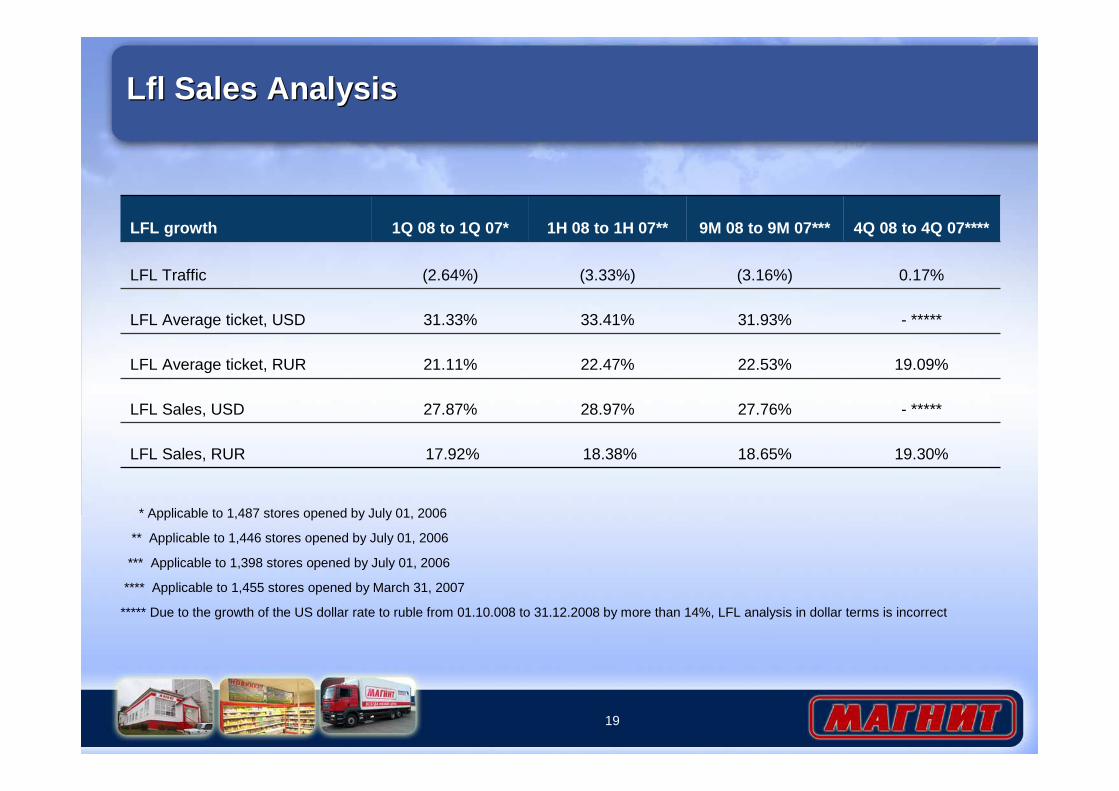
Lfl Sales AnalysisLfl Sales Analysis
18.65%
27.76%
22.53%
31.93%
(3.16%)
9M 08 to 9M 07***
19.30%
- *****
19.09%
- *****
0.17%
4Q 08 to 4Q 07****
LFL Sales, RUR
LFL Sales, USD
LFL Average ticket, RUR
LFL Average ticket, USD
LFL Traffic
LFL growth
17.92%
27.87%
21.11%
31.33%
(2.64%)
1Q 08 to 1Q 07*
18.38%
28.97%
22.47%
33.41%
(3.33%)
1H 08 to 1H 07**
* Applicable to 1,487 stores opened by July 01, 2006
** Applicable to 1,446 stores opened by July 01, 2006
*** Applicable to 1,398 stores opened by July 01, 2006
**** Applicable to 1,455 stores opened by March 31, 2007
***** Due to the growth of the US dollar rate to ruble from 01.10.008 to 31.12.2008 by more than 14%, LFL analysis in dollar terms is incorrect

Hypermarket FormatHypermarket Format
21
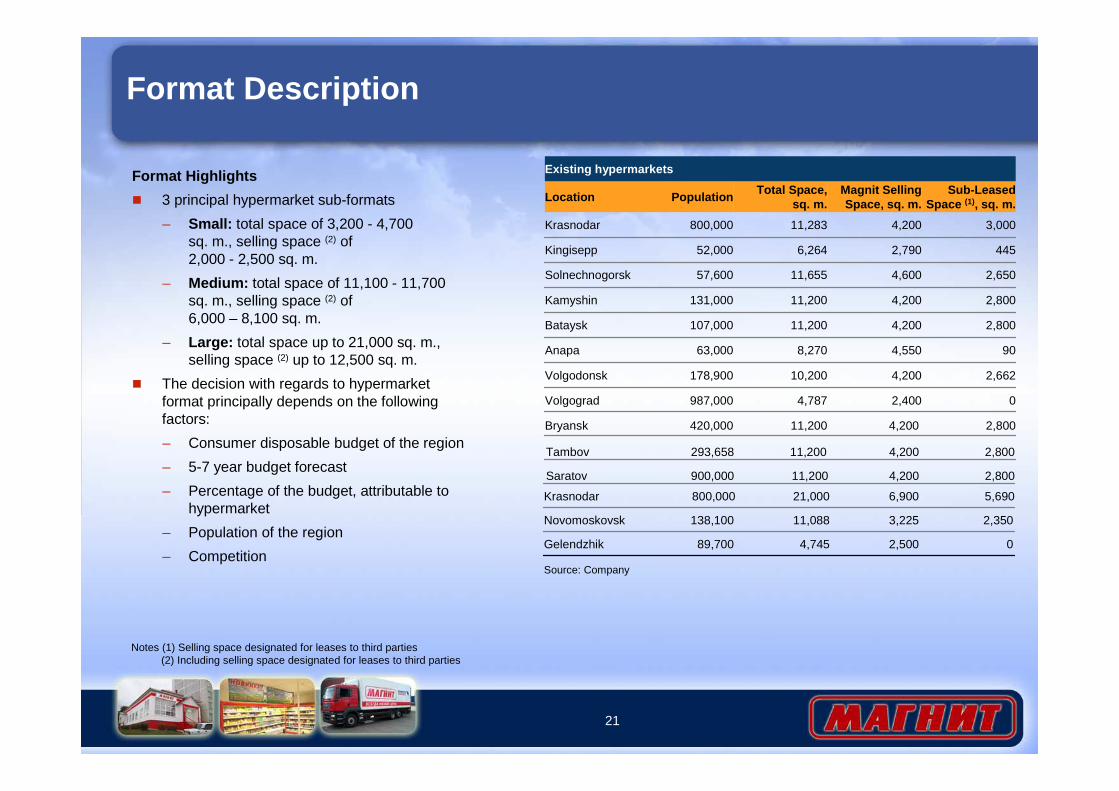
Format Description
Format Highlights
� 3 principal hypermarket sub-formats
– Small: total space of 3,200 - 4,700 sq. m., selling space (2) of 2,000 - 2,500 sq. m.
– Medium: total space of 11,100 - 11,700 sq. m., selling space (2) of6,000 – 8,100 sq. m.
– Large: total space up to 21,000 sq. m., selling space (2) up to 12,500 sq. m.
� The decision with regards to hypermarket format principally depends on the following factors:
– Consumer disposable budget of the region
– 5-7 year budget forecast
– Percentage of the budget, attributable to hypermarket
– Population of the region
– Competition
Notes (1) Selling space designated for leases to third parties(2) Including selling space designated for leases to third parties
Source: Company
2,8004,20011,200420,000Bryansk
02,4004,787987,000Volgograd
2,6624,20010,200178,900Volgodonsk
904,5508,27063,000Anapa
2,8004,20011,200107,000Bataysk
2,8004,20011,200131,000Kamyshin
2,6504,60011,65557,600Solnechnogorsk
4452,7906,26452,000Kingisepp
3,0004,20011,283800,000Krasnodar
Sub-Leased Space (1), sq. m.
Magnit Selling Space, sq. m.
Total Space,sq. m.
PopulationLocation
Existing hypermarkets
Tambov 293,658 11,200 4,200 2,800
Saratov 900,000 11,200 4,200 2,800
Krasnodar 800,000 21,000 6,900 5,690
Novomoskovsk 138,100 11,088 3,225 2,350
Gelendzhik 89,700 4,745 2,500 0
22
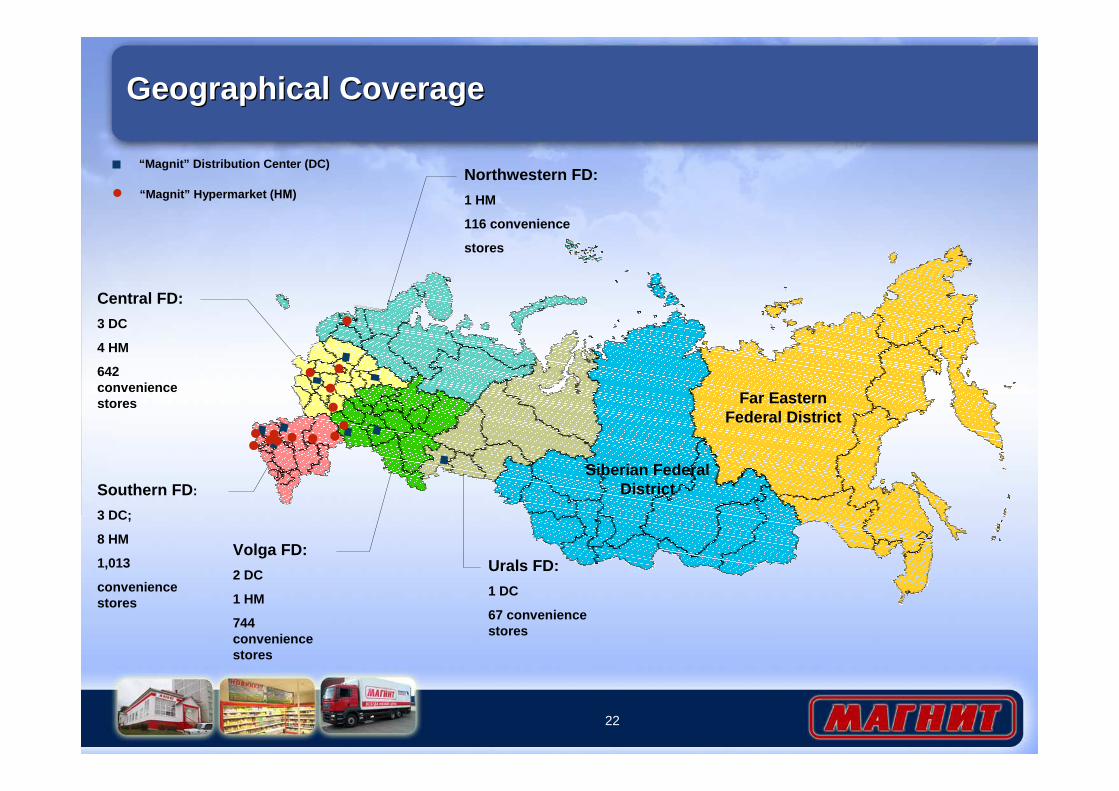
Geographical CoverageGeographical Coverage
● “Magnit” Hypermarket ( НМ)
“Magnit” Distribution Center (DC)
●●
●
●●●
●
●
●
●
●
●●●
Siberian Federal District
Far Eastern Federal District
Central FD:
3 DC
4 HM
642 convenience stores
Northwestern FD:
1 HM
116 convenience
stores
Southern FD :
3 DC;
8 HM
1,013
convenience stores
Volga FD:
2 DC
1 HM
744 convenience stores
Urals FD:
1 DC
67 convenience stores
23
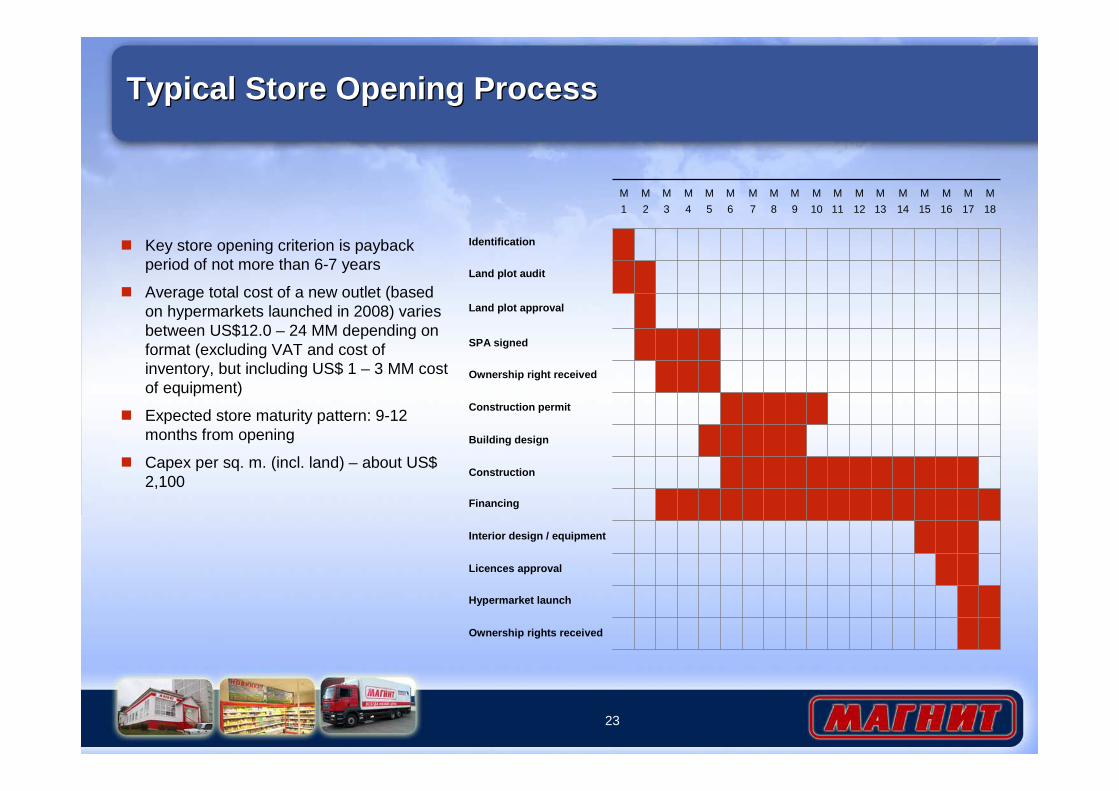
Typical Store Opening ProcessTypical Store Opening Process
M
1
M
2
M
3
M
4
M
5
M
6
M
7
M
8
M
9
M
10
M
11
M
12
M
13
M
14
M
15
M
16
M
17
M
18
Identification
Land plot audit
Land plot approval
SPA signed
Ownership right received
Construction permit
Building design
Construction
Financing
Interior design / equipment
Licences approval
Hypermarket launch
Ownership rights received
� Key store opening criterion is payback period of not more than 6-7 years
� Average total cost of a new outlet (based on hypermarkets launched in 2008) varies between US$12.0 – 24 MM depending on format (excluding VAT and cost of inventory, but including US$ 1 – 3 MM cost of equipment)
� Expected store maturity pattern: 9-12 months from opening
� Capex per sq. m. (incl. land) – about US$ 2,100

General OverviewGeneral Overview
25
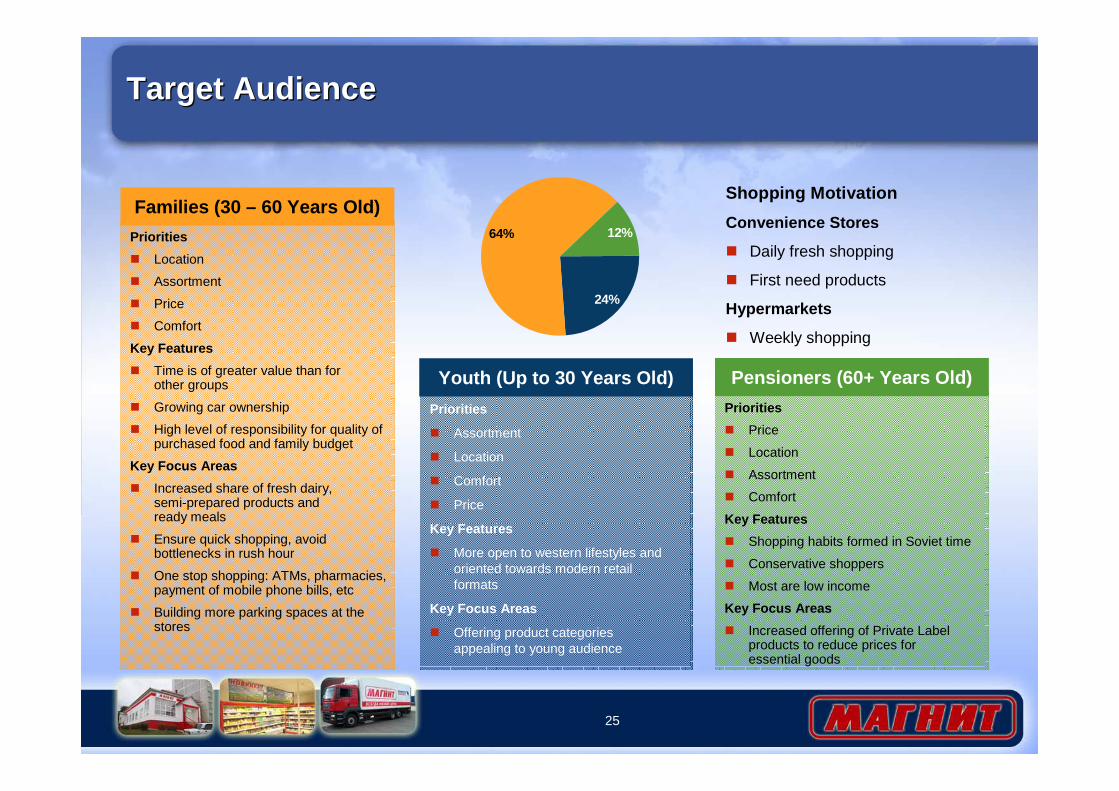
Priorities
� Price
� Location
� Assortment
� Comfort
Key Features
� Shopping habits formed in Soviet time
� Conservative shoppers
� Most are low income
Key Focus Areas
� Increased offering of Private Label products to reduce prices foressential goods
Pensioners (60+ Years Old)
Priorities
� Assortment
� Location
� Comfort
� Price
Key Features
� More open to western lifestyles and oriented towards modern retail formats
Key Focus Areas
� Offering product categories appealing to young audience
Youth (Up to 30 Years Old)
Target AudienceTarget Audience
Priorities
� Location
� Assortment
� Price
� Comfort
Key Features
� Time is of greater value than forother groups
� Growing car ownership
� High level of responsibility for quality of purchased food and family budget
Key Focus Areas
� Increased share of fresh dairy,semi-prepared products andready meals
� Ensure quick shopping, avoid bottlenecks in rush hour
� One stop shopping: ATMs, pharmacies, payment of mobile phone bills, etc
� Building more parking spaces at the stores
Families (30 – 60 Years Old)64% 12%
24%
Shopping Motivation
Convenience Stores
� Daily fresh shopping
� First need products
Hypermarkets
� Weekly shopping
26
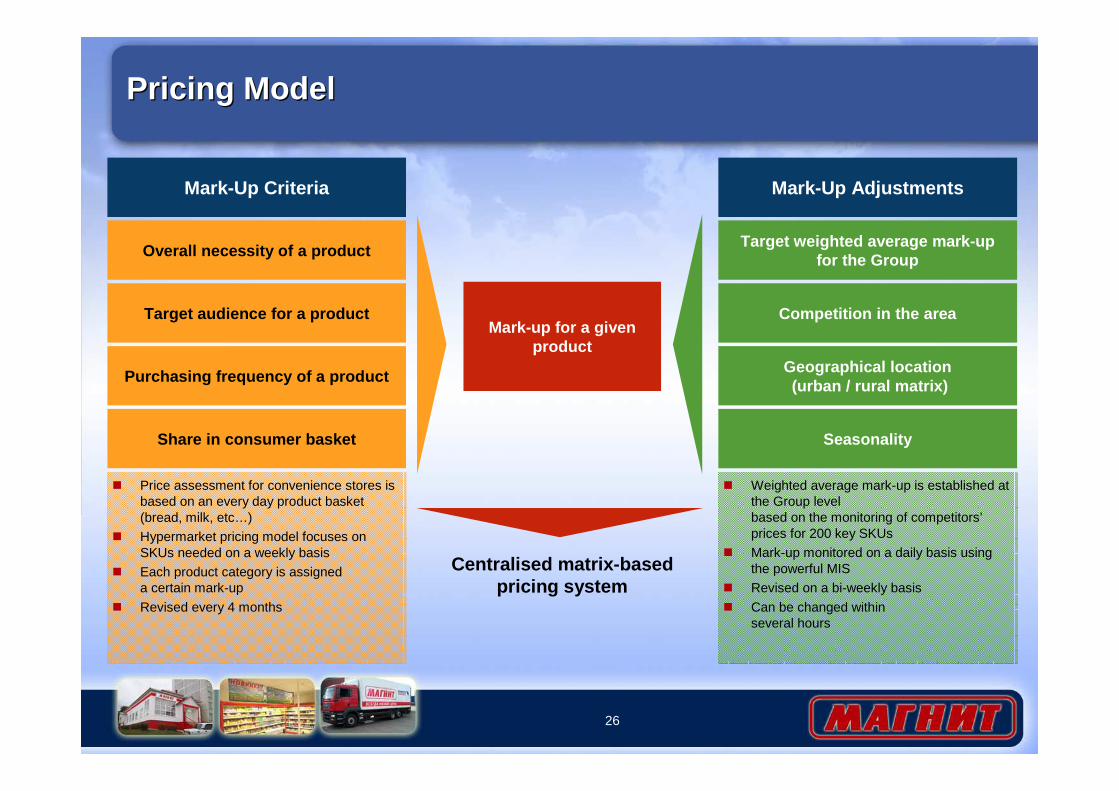
Mark-up for a given product
Overall necessity of a product
Target audience for a product
Purchasing frequency of a product
Share in consumer basket
Target weighted average mark-up for the Group
Competition in the area
Geographical location(urban / rural matrix)
Mark-Up Criteria
� Price assessment for convenience stores is based on an every day product basket (bread, milk, etc…)
� Hypermarket pricing model focuses on SKUs needed on a weekly basis
� Each product category is assigneda certain mark-up
� Revised every 4 months
� Weighted average mark-up is established at the Group levelbased on the monitoring of competitors’prices for 200 key SKUs
� Mark-up monitored on a daily basis using the powerful MIS
� Revised on a bi-weekly basis
� Can be changed within several hours
Mark-Up Adjustments
Seasonality
Centralised matrix-basedpricing system
Pricing ModelPricing Model
27
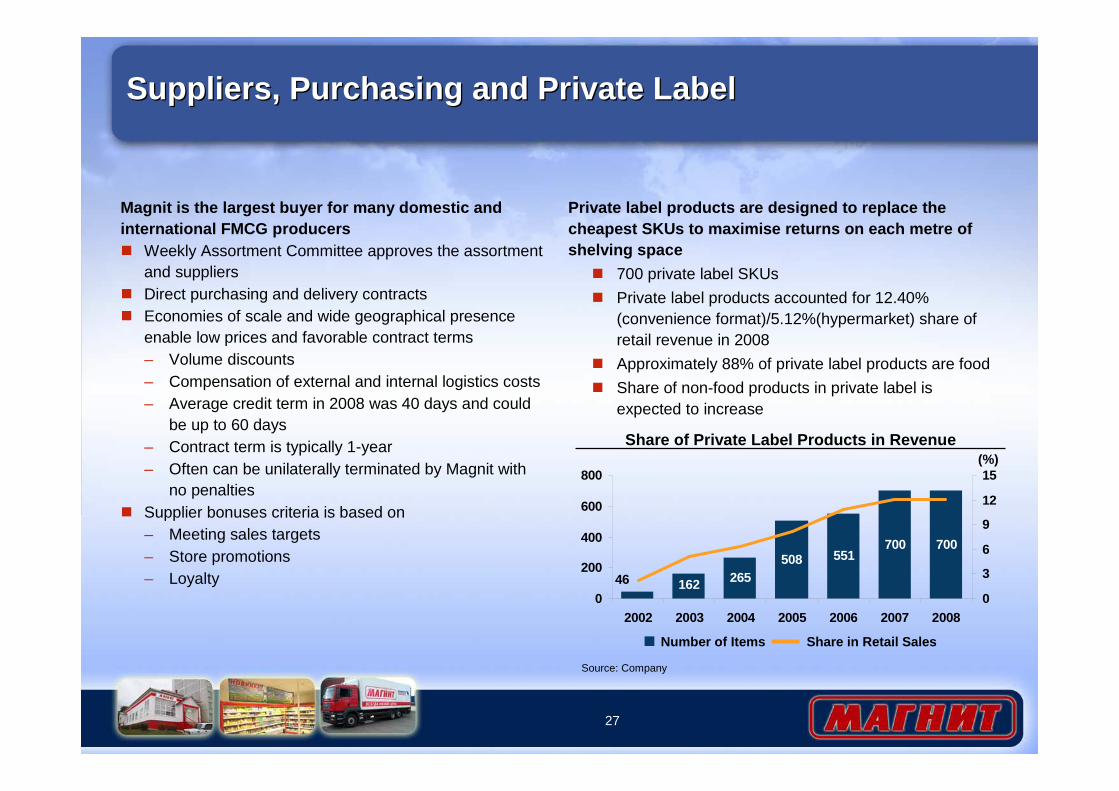
Suppliers, Purchasing and Private LabelSuppliers, Purchasing and Private Label
Share of Private Label Products in Revenue(%)
162 265508 551
700 700
460
200
400
600
800
2002 2003 2004 2005 2006 2007 20080
3
6
9
12
15
Number of Items Share in Retail Sales
Magnit is the largest buyer for many domestic and international FMCG producers� Weekly Assortment Committee approves the assortment
and suppliers� Direct purchasing and delivery contracts� Economies of scale and wide geographical presence
enable low prices and favorable contract terms– Volume discounts– Compensation of external and internal logistics costs– Average credit term in 2008 was 40 days and could
be up to 60 days– Contract term is typically 1-year– Often can be unilaterally terminated by Magnit with
no penalties� Supplier bonuses criteria is based on
– Meeting sales targets– Store promotions– Loyalty
Private label products are designed to replace the cheapest SKUs to maximise returns on each metre of shelving space
� 700 private label SKUs
� Private label products accounted for 12.40% (convenience format)/5.12%(hypermarket) share of retail revenue in 2008
� Approximately 88% of private label products are food
� Share of non-food products in private label is expected to increase
Source: Company
28
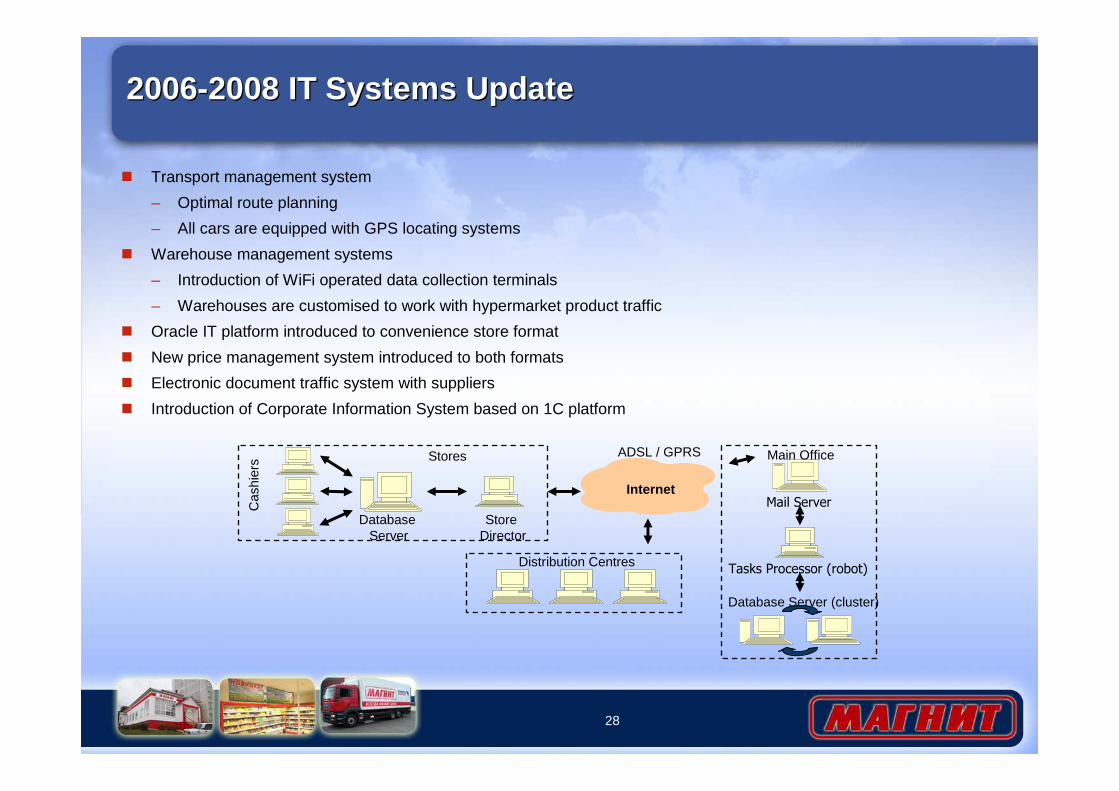
2006-2008 IT Systems Update2006-2008 IT Systems Update
� Transport management system
– Optimal route planning
– All cars are equipped with GPS locating systems
� Warehouse management systems
– Introduction of WiFi operated data collection terminals
– Warehouses are customised to work with hypermarket product traffic
� Oracle IT platform introduced to convenience store format
� New price management system introduced to both formats
� Electronic document traffic system with suppliers
� Introduction of Corporate Information System based on 1C platform
Cas
hier
s
Internet
Database Server
Store Director
Mail Server
ADSL / GPRS
Database Server (cluster)
Distribution CentresTasks Processor (robot)
Main OfficeStores
29
Logistics SystemLogistics System
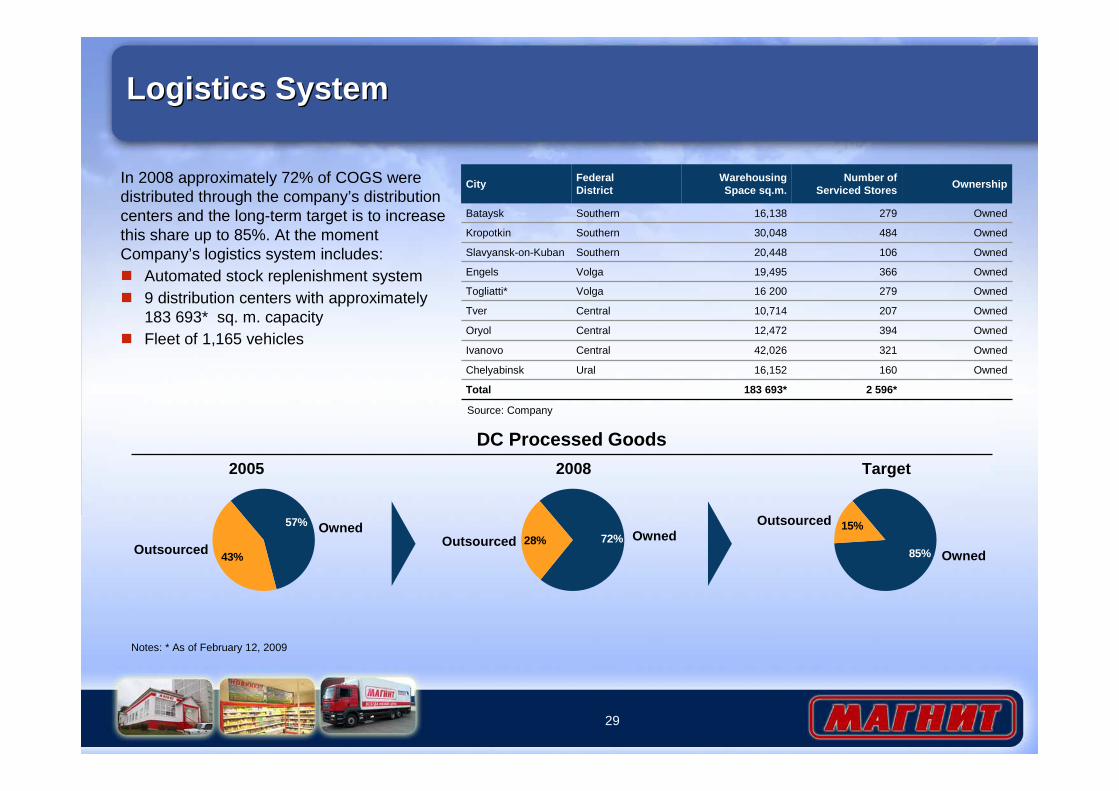
In 2008 approximately 72% of COGS were distributed through the company’s distribution centers and the long-term target is to increase this share up to 85%. At the moment Company’s logistics system includes:� Automated stock replenishment system� 9 distribution centers with approximately
183 693* sq. m. capacity � Fleet of 1,165 vehicles
Owned10620,448SouthernSlavyansk-on-Kuban
Owned36619,495VolgaEngels
Owned27916 200VolgaTogliatti*
Owned20710,714CentralTver
Owned39412,472CentralOryol
Owned32142,026CentralIvanovo
Ural
Southern
Southern
FederalDistrict
183 693*
16,152
30,048
16,138
Warehousing Space sq.m.
2 596*
160
484
279
Number of Serviced Stores Ownership
Owned
Owned
Owned
Total
Chelyabinsk
Kropotkin
Bataysk
City
DC Processed Goods
Target20082005
43%
57%
Outsourced
Owned72%28%Outsourced Owned
85%
15%Outsourced
Owned
Source: Company
Notes: * As of February 12, 2009
30
Well trained dedicated personnelWell trained dedicated personnel
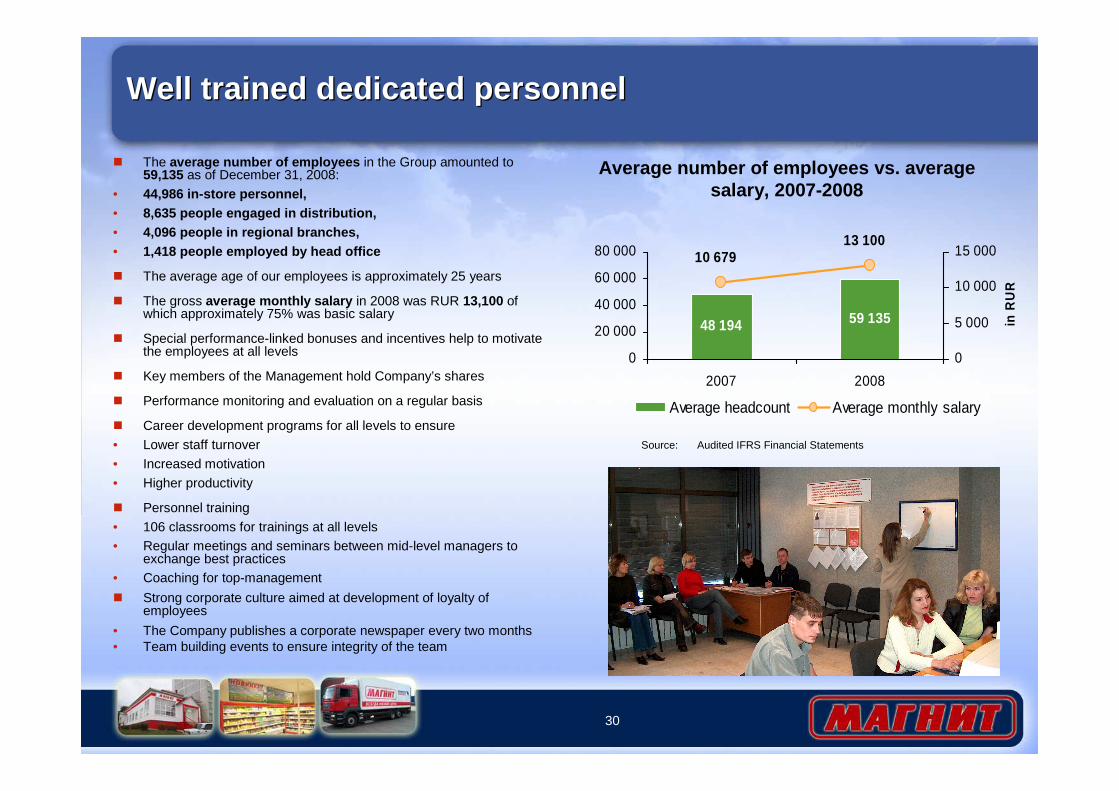
48 194 59 135
10 67913 100
0
20 000
40 000
60 000
80 000
2007 2008
0
5 000
10 000
15 000
in R
UR
Average headcount Average monthly salary
Average number of employees vs. average salary, 2007-2008
� The average number of employees in the Group amounted to 59,135 as of December 31, 2008:
• 44,986 in-store personnel,• 8,635 people engaged in distribution,• 4,096 people in regional branches,• 1,418 people employed by head office
� The average age of our employees is approximately 25 years
� The gross average monthly salary in 2008 was RUR 13,100 of which approximately 75% was basic salary
� Special performance-linked bonuses and incentives help to motivate the employees at all levels
� Key members of the Management hold Company’s shares
� Performance monitoring and evaluation on a regular basis
� Career development programs for all levels to ensure
• Lower staff turnover
• Increased motivation
• Higher productivity
� Personnel training
• 106 classrooms for trainings at all levels• Regular meetings and seminars between mid-level managers to
exchange best practices• Coaching for top-management
� Strong corporate culture aimed at development of loyalty of employees
• The Company publishes a corporate newspaper every two months• Team building events to ensure integrity of the team
Source: Audited IFRS Financial Statements

Financial OverviewFinancial Overview
32
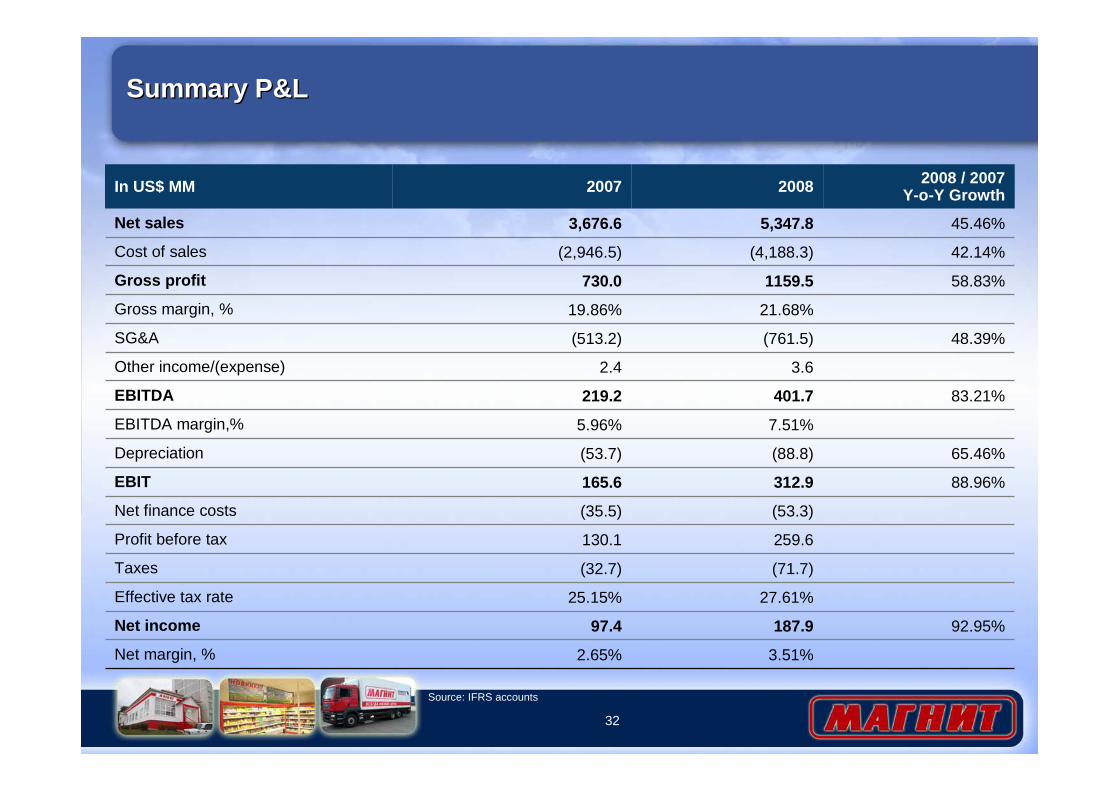
Summary P&LSummary P&L
92.95%
88.96%
65.46%
83.21%
48.39%
58.83%
42.14%
45.46%
2008 / 2007Y-o-Y Growth
3.51%
187.9
27.61%
(71.7)
259.6
(53.3)
312.9
(88.8)
7.51%
401.7
3.6
(761.5)
21.68%
1159.5
(4,188.3)
5,347.8
2008
2.65%Net margin, %
97.4 Net income
25.15%Effective tax rate
(32.7)Taxes
130.1 Profit before tax
(35.5)Net finance costs
165.6 EBIT
(53.7)Depreciation
5.96%EBITDA margin,%
219.2 EBITDA
2.4 Other income/(expense)
(513.2)SG&A
19.86%Gross margin, %
730.0 Gross profit
(2,946.5)Cost of sales
3,676.6 Net sales
2007In US$ MM
Source: IFRS accounts
33
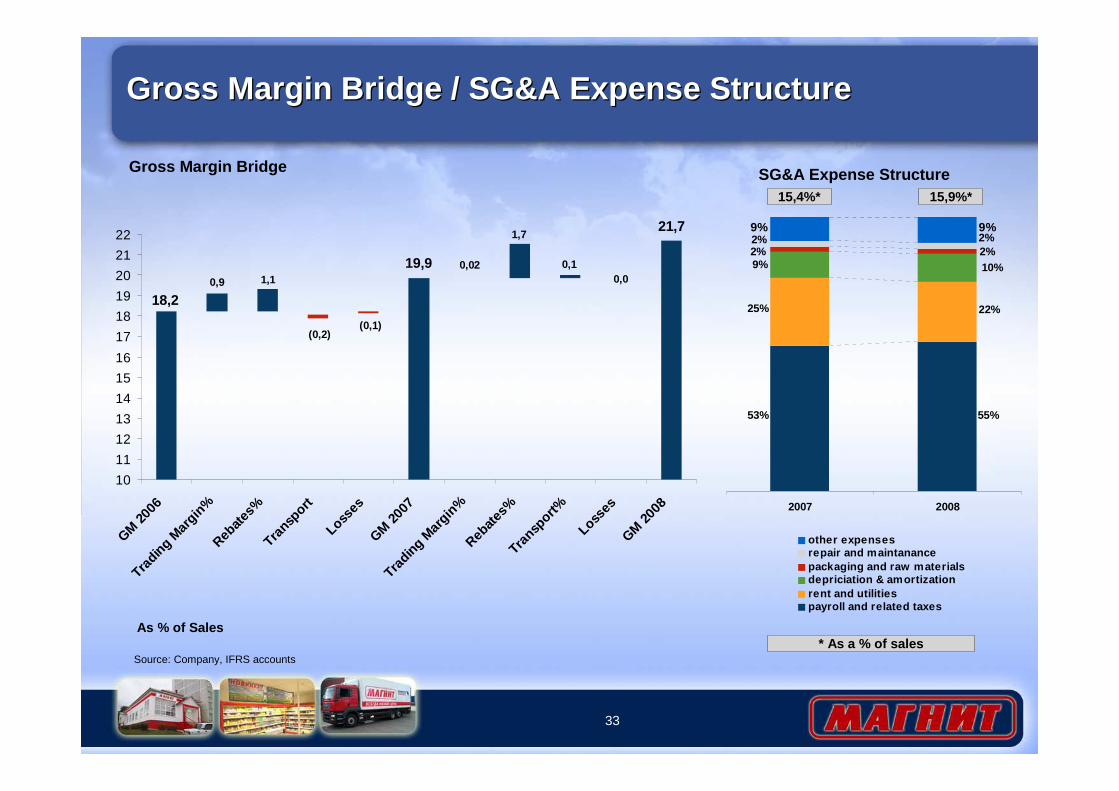
Gross Margin Bridge / SG&A Expense StructureGross Margin Bridge / SG&A Expense Structure
0,0
21,7
18,2
19,9 0,02
0,9 1,1
(0,2)(0,1)
0,1
1,7
10
11
12
13
14
15
16
17
18
19
20
21
22
GM 20
06Tra
ding
Margin
%Reb
ates%
Trans
port
Loss
esGM
2007
Trading
Mar
gin%
Rebate
s%Tra
nspor
t%
Loss es
GM 20
08
Gross Margin Bridge
As % of Sales
Source: Company, IFRS accounts
SG&A Expense Structure15,9%*15,4%*
* As a % of sales
53% 55%
25% 22%
9% 10%2% 2%2% 2%9% 9%
2007 2008
other expensesrepair and maintanancepackaging and raw materialsdepriciation & amortizationrent and utilitiespayroll and related taxes

34
EBITDA BridgeEBITDA Bridge
EBITDA Bridge
As % of Sales
Source: Company, IFRS accounts
6,0
4,9
7,5
(0,5)
1,8
0,4
(0,3)(0,1)
0,03
(0,6)
1,6
(0,1)
0,4
(0,03)
0,04
0,0
1,0
2,0
3,0
4,0
5,0
6,0
7,0
8,0
EBITDA 2
006
GMSala
ries
Pacing
Repair
Rent
Other
EBITDA 2
007
GMSala
ries
Pacing
Repair
Rent
Other
EBITDA 2
008
35
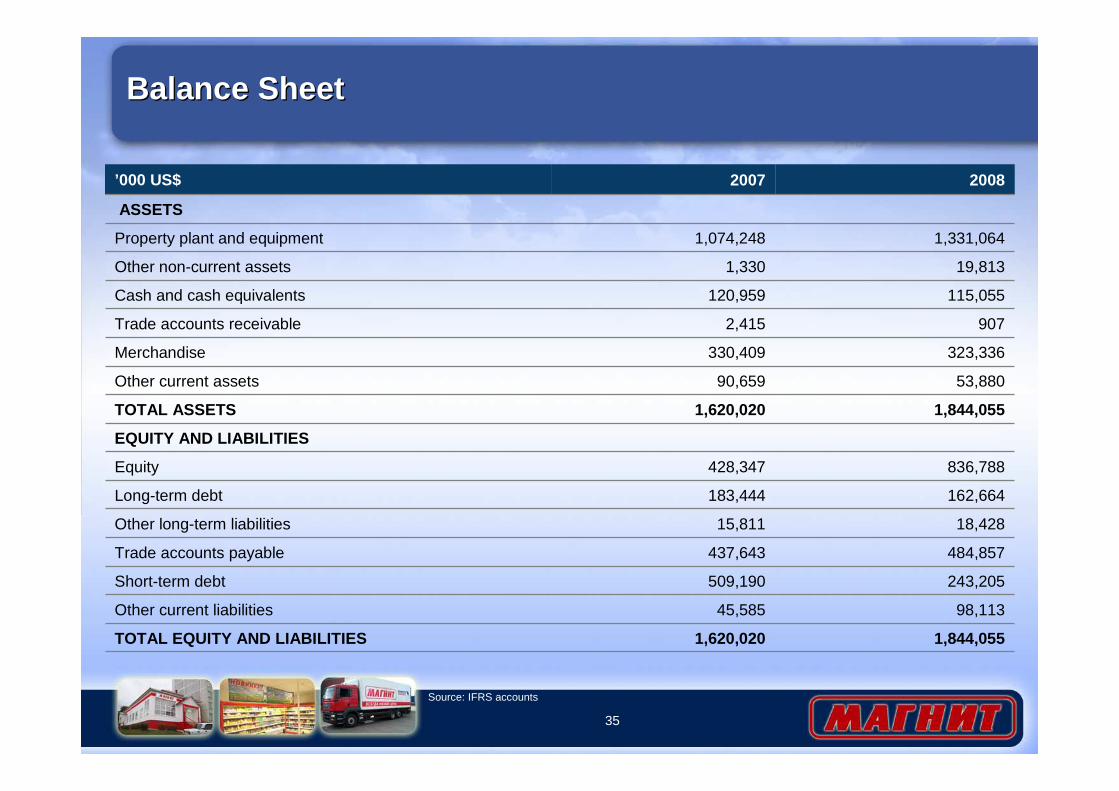
Balance SheetBalance Sheet
1,844,055 1,620,020 TOTAL EQUITY AND LIABILITIES
98,11345,585 Other current liabilities
243,205 509,190 Short-term debt
484,857 437,643 Trade accounts payable
18,428 15,811 Other long-term liabilities
162,664 183,444 Long-term debt
836,788 428,347 Equity
EQUITY AND LIABILITIES
1,844,0551,620,020 TOTAL ASSETS
53,880 90,659 Other current assets
323,336 330,409 Merchandise
9072,415 Trade accounts receivable
115,055 120,959 Cash and cash equivalents
19,813 1,330 Other non-current assets
1,331,0641,074,248 Property plant and equipment
ASSETS
20082007’000 US$
Source: IFRS accounts
36
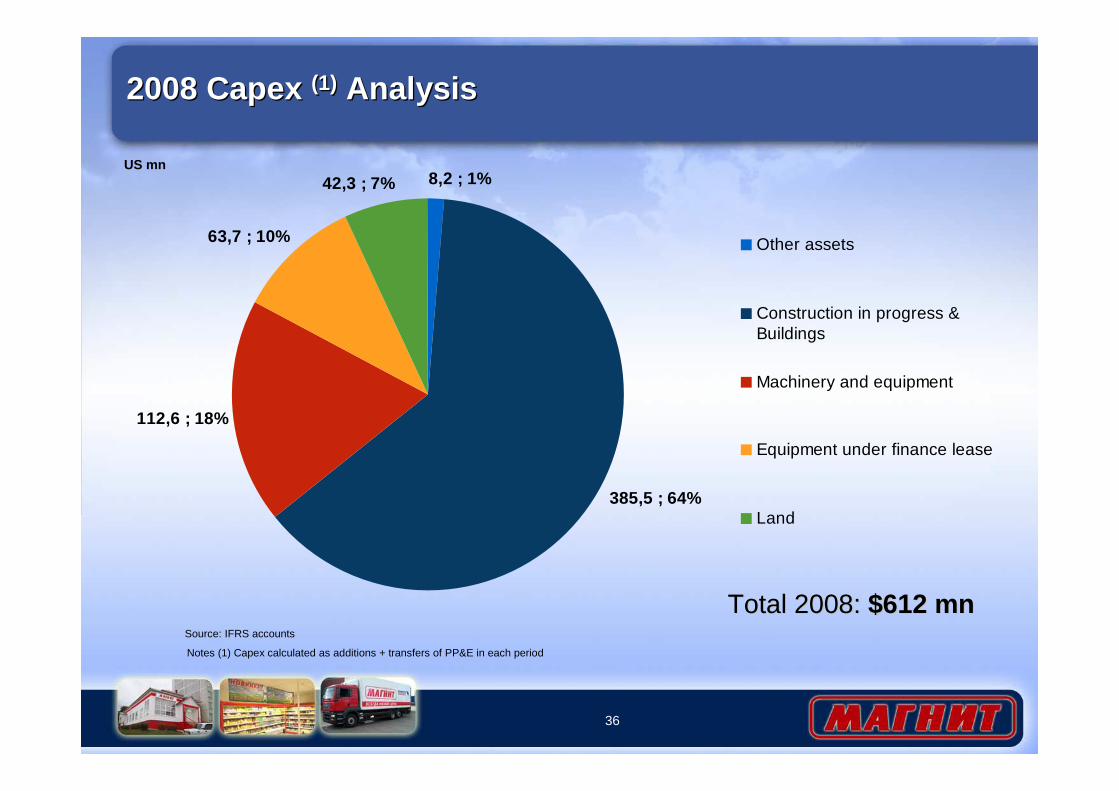
2008 Capex (1) Analysis2008 Capex (1) Analysis
US mn
Notes (1) Capex calculated as additions + transfers of PP&E in each period
Source: IFRS accounts
385,5 ; 64%
112,6 ; 18%
42,3 ; 7%
63,7 ; 10%
8,2 ; 1%
Other assets
Construction in progress &Buildings
Machinery and equipment
Equipment under finance lease
Land
Total 2008: Total 2008: $612 $612 mnmn
37
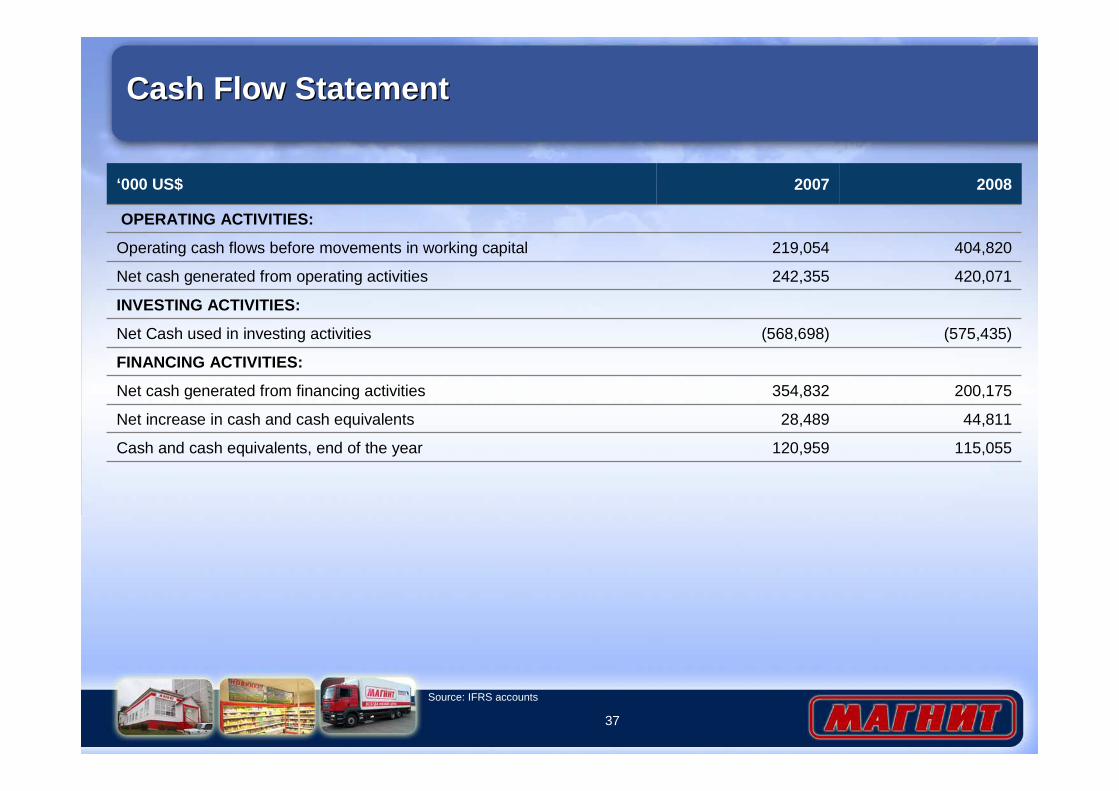
Cash Flow StatementCash Flow Statement
120,959
28,489
354,832
(568,698)
242,355
219,054
2007
115,055
44,811
200,175
(575,435)
420,071
404,820
2008
Cash and cash equivalents, end of the year
Net increase in cash and cash equivalents
Net cash generated from financing activities
FINANCING ACTIVITIES:
Net Cash used in investing activities
INVESTING ACTIVITIES:
Net cash generated from operating activities
Operating cash flows before movements in working capital
OPERATING ACTIVITIES:
‘000 US$
Source: IFRS accounts
38
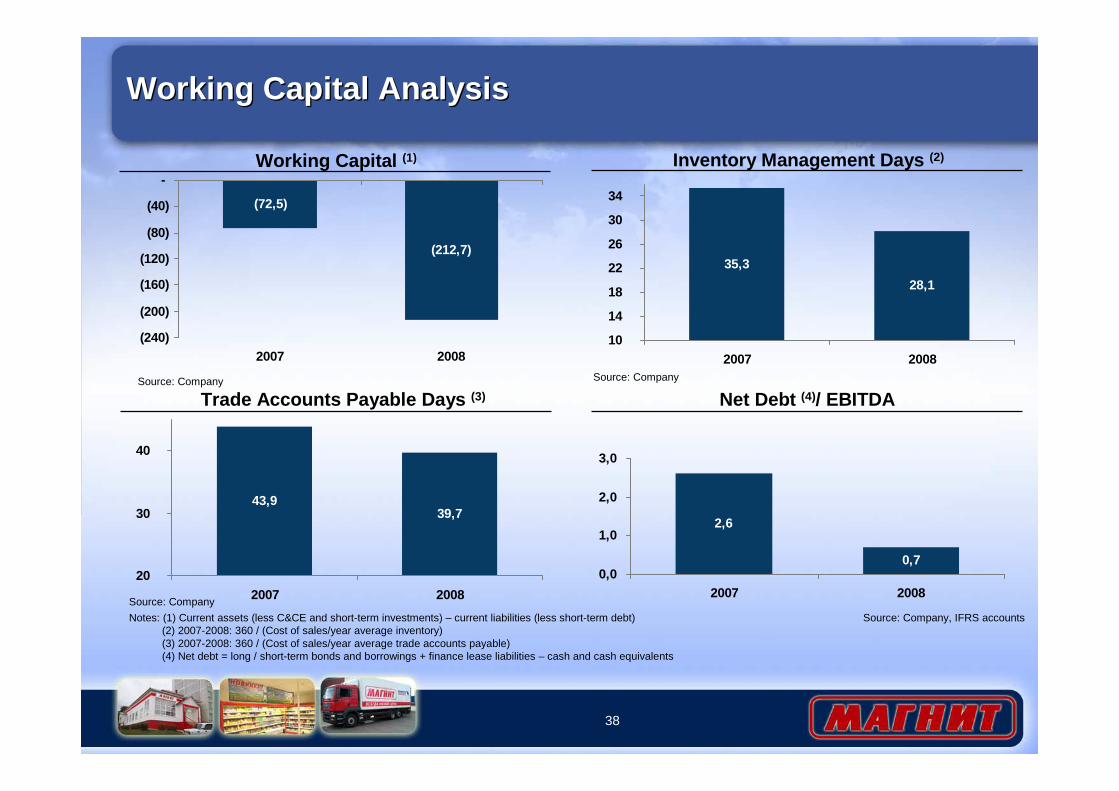
43,939,7
20
30
40
2007 2008
Working Capital AnalysisWorking Capital Analysis
Inventory Management Days (2)
35,3
28,1
10
14
18
22
26
30
34
2007 2008
Trade Accounts Payable Days (3)
Source: Company
Source: Company
Source: Company, IFRS accounts
Working Capital (1)
(72,5)
(212,7)
(240)
(200)
(160)
(120)
(80)
(40)
-
2007 2008
Source: Company
Notes: (1) Current assets (less C&CE and short-term investments) – current liabilities (less short-term debt)(2) 2007-2008: 360 / (Cost of sales/year average inventory)(3) 2007-2008: 360 / (Cost of sales/year average trade accounts payable)(4) Net debt = long / short-term bonds and borrowings + finance lease liabilities – cash and cash equivalents
2,6
0,70,0
1,0
2,0
3,0
2007 2008
Net Debt (4)/ EBITDA
Summary ConclusionsSummary Conclusions
40
Summary ConclusionsSummary Conclusions
Leading Russian retailer: broadest geographic coverage with 2,582 stores (as of 31 December 2008) in more than 856 cities in five out of seven federal districts in Russia
Further organic growth of store operations: continued roll-out of established business model in existing markets and selective expansion into new geographic areas
Expanding hypermarket operations: leveraging strong existing platform (operations, logistics, brand, scale) to develop a leading hypermarket chain in the European part of Russia
Additional measures to improve profitability: enhancing product mix, increasing private label and increasing distribution through own logistics system to achieve margin improvements and cost savings
Strong foothold in Russia’s cities and towns with p opulation under 500,000 people: first mover advantage (first retailer in many locations to establish a modern format); low competition from other chains outside of Russia’s large cities
Financing of expansion program: implementation of the Company’s mid-term strategy will be executed through a mix of debt and equity raisings
Related Documents