2017 Lenovo. All rights reserved. FY 16/17 Earnings Announcement May 25, 2017– Hong Kong

Welcome message from author
This document is posted to help you gain knowledge. Please leave a comment to let me know what you think about it! Share it to your friends and learn new things together.
Transcript

2017 Lenovo. All rights reserved.
FY 16/17 Earnings Announcement
May 25, 2017– Hong Kong
2
Forward Looking Statement
This presentation contains “forward-looking statements” which are statements that refer to expectations and plans for
the future and include, without limitation, statements regarding Lenovo’s future results of operations, financial condition
or business prospects as well as other statements based on projections, estimates and assumptions. In some cases,
these statements can be identified by terms such as "expect," "intend," "plan," "believe," "estimate," "may," "will,"
"should" and comparable words (including the negative of such words). These forward-looking statements, reflect the
current expectations and plans of the directors and management of Lenovo, which may not materialize or may change.
Many risks, uncertainties and other factors, some of which are unpredictable and beyond Lenovo’s control, could affect
the matters discussed in these forward-looking statements. These factors include, without limitation, economic and
business conditions globally and in the countries where we operate, Lenovo’s ability to predict and respond quickly to
market developments, consumer demand, pricing trends and competition; changes in applicable laws and regulations
(including applicable tax and tariff rates). Any variance from the expectations or plans on which these forward-looking
statements are based could cause Lenovo’s actual results or actions to differ materially from those expressed or
implied in these statements. These forward-looking statements are not guarantees of future performance and you are
cautioned not to place undue reliance on these statements. Lenovo undertakes no obligation to update any forward-
looking statements in this presentation, whether as a result of new information or any subsequent change, development
or event. All forward-looking statements in this presentation are qualified by reference to this paragraph.

2017 Lenovo Internal. All rights reserved.
May 25, 2017 – Hong Kong
Yuanqing Yang Chairman & CEO

4 2017 Lenovo. All rights reserved.
Performance of the 4th Quarter
4 Source: Internal Data
• Revenue: $9.6B, resumed year-on-year growth at 4.9% after 5 quarters of decline
• Reported Net Income*: $107M
Quarterly Revenue (US$ Millions)
+4.9%
5000
10000
15000
Q414/15
Q415/16
11334
9133
180 173 157
98
107
0
50
100
150
200
Q4 15/16 Q1 16/17 Q2 16/17 Q3 16/17 Q4 16/17
Quarterly Net Income* (US$ Millions)
Q115/16
Q116/17
Q215/16
Q216/17
Q315/16
Q316/17
Q415/16
Q416/17
10716
12150
11231
10056
12913
9133
12169
9579
* Reported Net Income includes other operational items such as
disposal gain of property or restructuring cost
5 2017 Lenovo. All rights reserved.
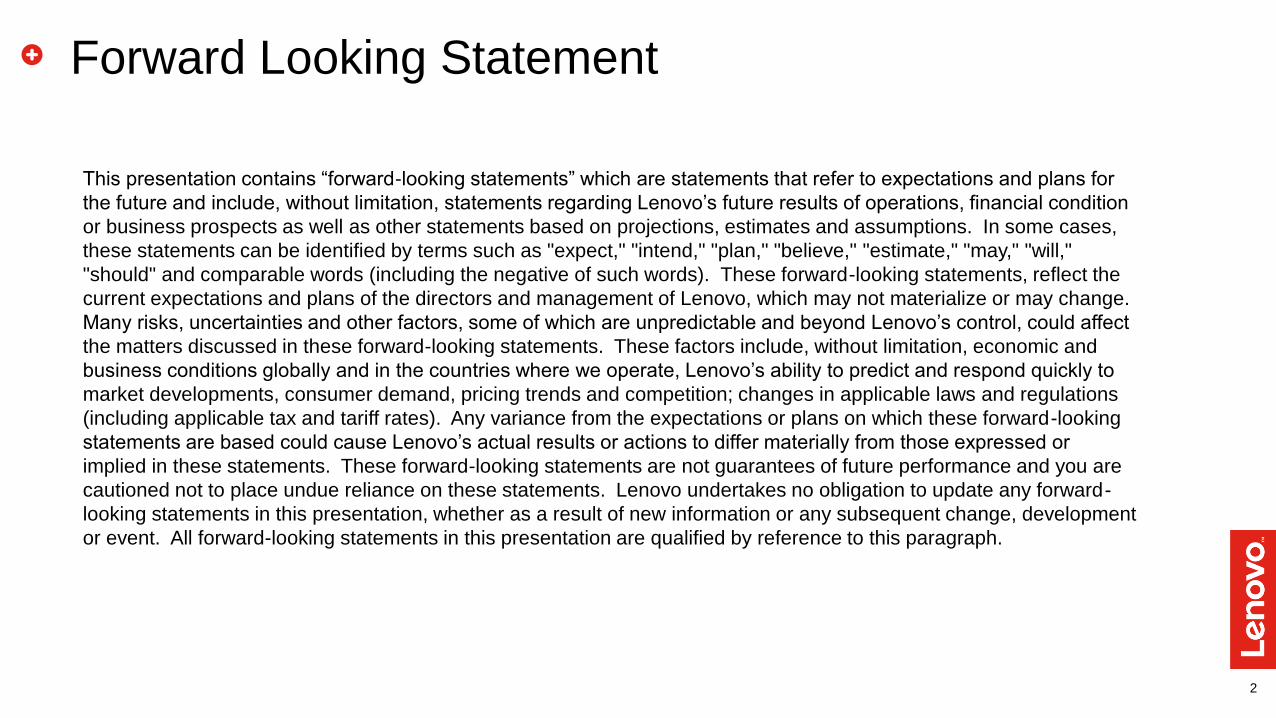
Performance of the 4th Quarter: PCSD
• Revenue and volume grew year-on-year for 2 consecutive quarters
• Improved Average Selling Price
• Delivered Pre-Tax Income of 4.3%
Source: Internal Data
6371
6682
5000
5500
6000
6500
7000
Q4 15/16 Q4 16/17
+4.9%
PCSD Revenue ($M)
Source: IDC
0.7%
-3.3%
-20.0%
-15.0%
-10.0%
-5.0%
0.0%
5.0%
10.0%
15.0%
20.0%
FY14/15Q4
FY15/16Q1
FY15/16Q2
FY15/16Q3
FY15/16Q4
FY16/17Q1
FY16/17Q2
FY16/17Q3
FY16/17Q4
Worldwide PC+Tablet YTY Growth Trends(%)
Lenovo Industry

6 2017 Lenovo. All rights reserved.
Performance of the 4th Quarter • Mobile: Strong year-on-year growth momentum
– Outside China volume up 17.4% year-on-year, outperformed market by 12.8 points
– Brazil volume up 56.3% year-on-year, India volume up 33.7% year-on-year;
• Data Center: Profitability improvement quarter-to-quarter in most Geos
Source: Internal Data
+4.4pts
+30.7pts
+56%
2,669
1,707
Brazil
+34%
2,564
1,918
India
+1.3pts
+18.9pts
22.5% 9.5% Market Share
CA
(K units)
Mkt
Prem.
YTY
Barcelona Supercomputing Center (BSC) project Q4 15/16 Q4 16/17 Q4 15/16Q4 16/17
Smartphone Performance

7 2017 Lenovo. All rights reserved.
Performance of FY16/17
•Revenue: $43B
•Reported Net Income*: $535M,
up $663M year-on-year
7
Revenue ($B) and Reported Net Income* ($M)
Source: Internal Data
33.9
38.7
46.3
44.9
43 635
817 829
-128
535
-200
0
200
400
600
800
1000
30
40
50
FY 12/13 FY 13/14 FY 14/15 FY 15/16 FY 16/17
Revenue Reported Net Income
* Reported Net Income includes other operational items such as disposal gain of property or restructuring cost
8 2017 Lenovo. All rights reserved.
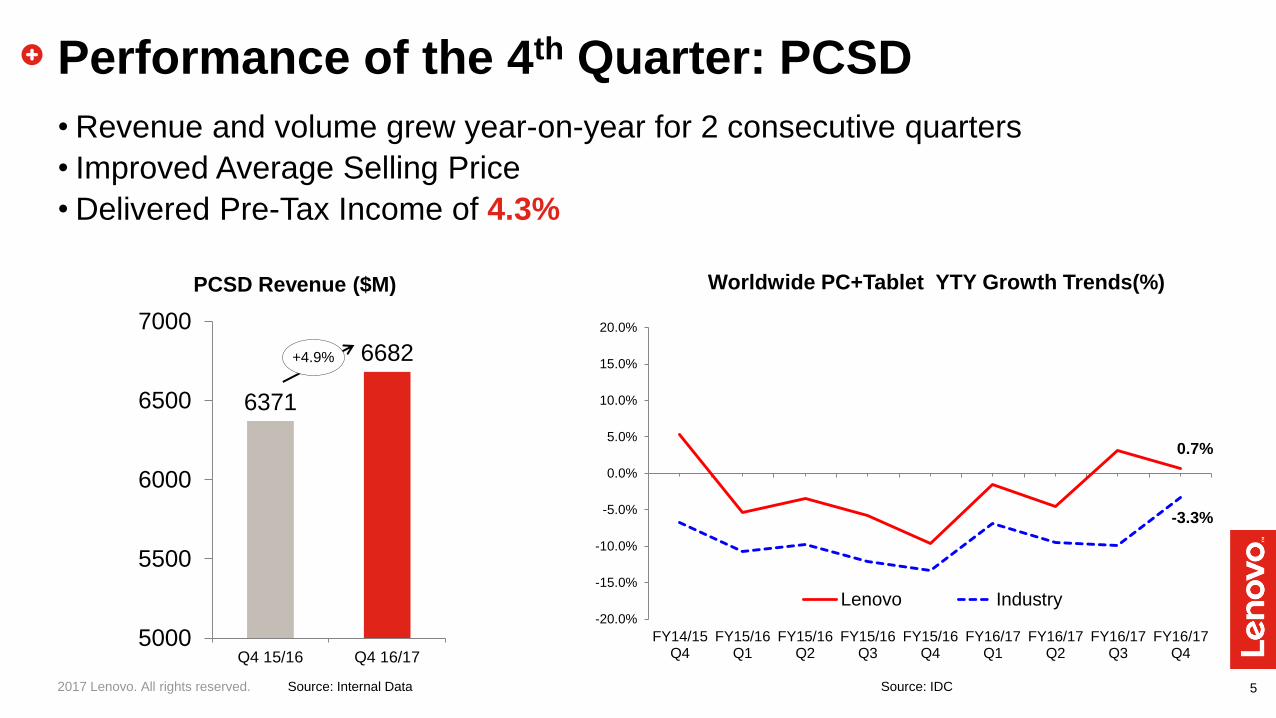
Performance of FY16/17: PCSD
• PC+Tablet, #1 in share, year-on-year growth outperformed market by 7.1 points
• Maintained industry leading profit of 5%
• Laptop Magazine named Lenovo the “Best Laptop Brand”
Source: IDC
5
10
15
20
FY 12/13 FY13/14 FY14/15 FY 15/16 FY 16/17
Lenovo Apple HP Dell Samsung
PC+Tablet Market Share (%)
15.4%

9 2017 Lenovo. All rights reserved.
Performance of FY16/17: Mobile • Transformation continued to deliver results outside of China
– Quarter-to-quarter improvements throughout the year, revenue resumed year-on-year growth in 4th quarter
– Moto Z, premium smartphone, on track to sell 3M units in first 12 months
– Average selling price improved 15.1% YTY
– United teams, formed consistent culture, integrated brand and product portfolio
– On track to breakeven in 2nd half of this fiscal year
10 2017 Lenovo. All rights reserved.
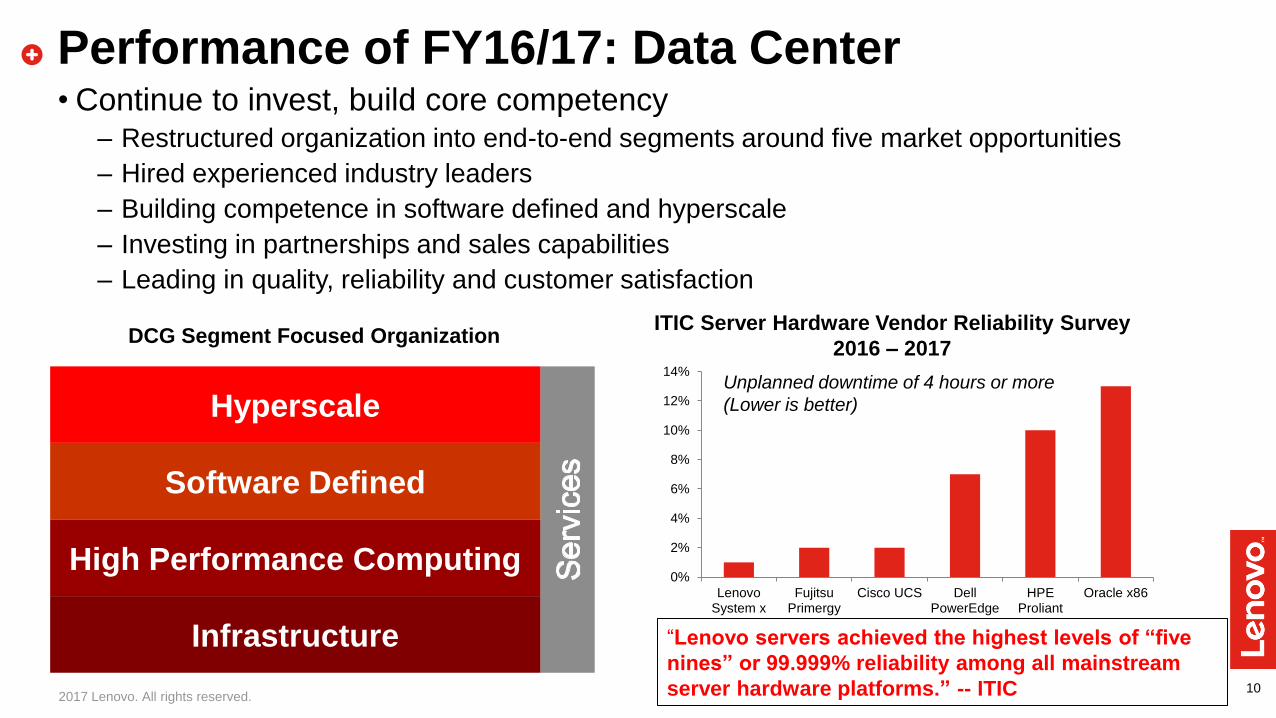
Performance of FY16/17: Data Center • Continue to invest, build core competency
– Restructured organization into end-to-end segments around five market opportunities
– Hired experienced industry leaders
– Building competence in software defined and hyperscale
– Investing in partnerships and sales capabilities
– Leading in quality, reliability and customer satisfaction
Hyperscale
Software Defined
High Performance Computing
Infrastructure “Lenovo servers achieved the highest levels of “five
nines” or 99.999% reliability among all mainstream
server hardware platforms.” -- ITIC
0%
2%
4%
6%
8%
10%
12%
14%
LenovoSystem x
FujitsuPrimergy
Cisco UCS DellPowerEdge
HPEProliant
Oracle x86
ITIC Server Hardware Vendor Reliability Survey
2016 – 2017 DCG Segment Focused Organization
Unplanned downtime of 4 hours or more
(Lower is better)


12
Maintain PC Leadership
in scale, profitability
and innovation
Build MBG & DCG
into New Growth Engines
Invest in
“Device + Cloud” and
“Infrastructure + Cloud”

2017 Lenovo Internal. All rights reserved.
May 25, 2017 – Hong Kong
Wong Wai Ming Chief Financial Officer

14
Financial Summary
US$ MillionFY2016/17 Y/Y% Q4 FY2016/17 Q4 FY2015/16 Y/Y% Q/Q%
Revenue 43,035 -4% 9,579 9,133 5% -21%
Gross Profit 6,106 -8% 1,368 1,518 -10% -14%
Operating Expenses (5,434) -19% (1,294) (1,270) 2% -11%
Operating Profit 672 NA 74 248 -70% -46%
Other Non-Operating Expenses (182) -15% (59) (55) 7% 60%.
Pre-tax Income 490 NA 15 193 -92% -85%
Taxation 40 -69% 89 (17) NA 1445%
Profit for the period 530 NA 104 176 -41% -3%
Non-controlling interests 5 -72% 3 4 21% NA
Profit attributable to Equity Holders 535 NA 107 180 -41% 9%
EPS (US cents)
- Basic 4.86 NA 0.97 1.63 (0.66) 0.07
- Diluted 4.86 NA 0.97 1.62 (0.65) 0.07
Dividend per share (HK cents) 26.50
FY2016/17 FY2015/16 Q4FY2016/17 Q4FY2015/16 Q3FY2016/17
Gross margin 14.2% 14.8% 14.3% 16.6% 13.1%
E/R ratio 12.6% 14.9% 13.5% 13.9% 12.0%
Operating margin 1.6% -0.1% 0.8% 2.7% 1.1%
PTI margin 1.1% -0.6% 0.2% 2.1% 0.8%
Net margin attributable to Equity Holders 1.2% -0.3% 1.1% 2.0% 0.8%
15
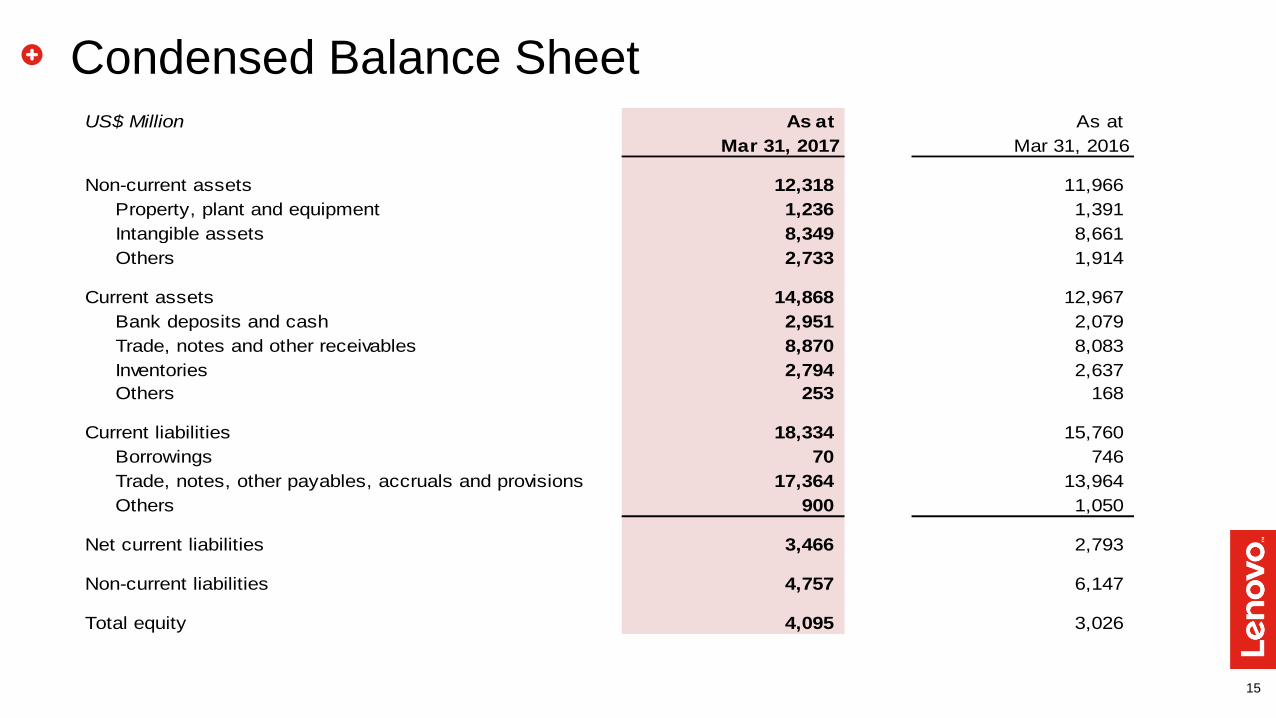
Condensed Balance Sheet US$ Million As at As at
Mar 31, 2017 Mar 31, 2016
Non-current assets 12,318 11,966
Property, plant and equipment 1,236 1,391
Intangible assets 8,349 8,661
Others 2,733 1,914
Current assets 14,868 12,967
Bank deposits and cash 2,951 2,079
Trade, notes and other receivables 8,870 8,083
Inventories 2,794 2,637
Others 253 168
Current liabilities 18,334 15,760
Borrowings 70 746
Trade, notes, other payables, accruals and provisions 17,364 13,964
Others 900 1,050
Net current liabilities 3,466 2,793
Non-current liabilities 4,757 6,147
Total equity 4,095 3,026
16 2017 Lenovo Internal. All rights reserved.
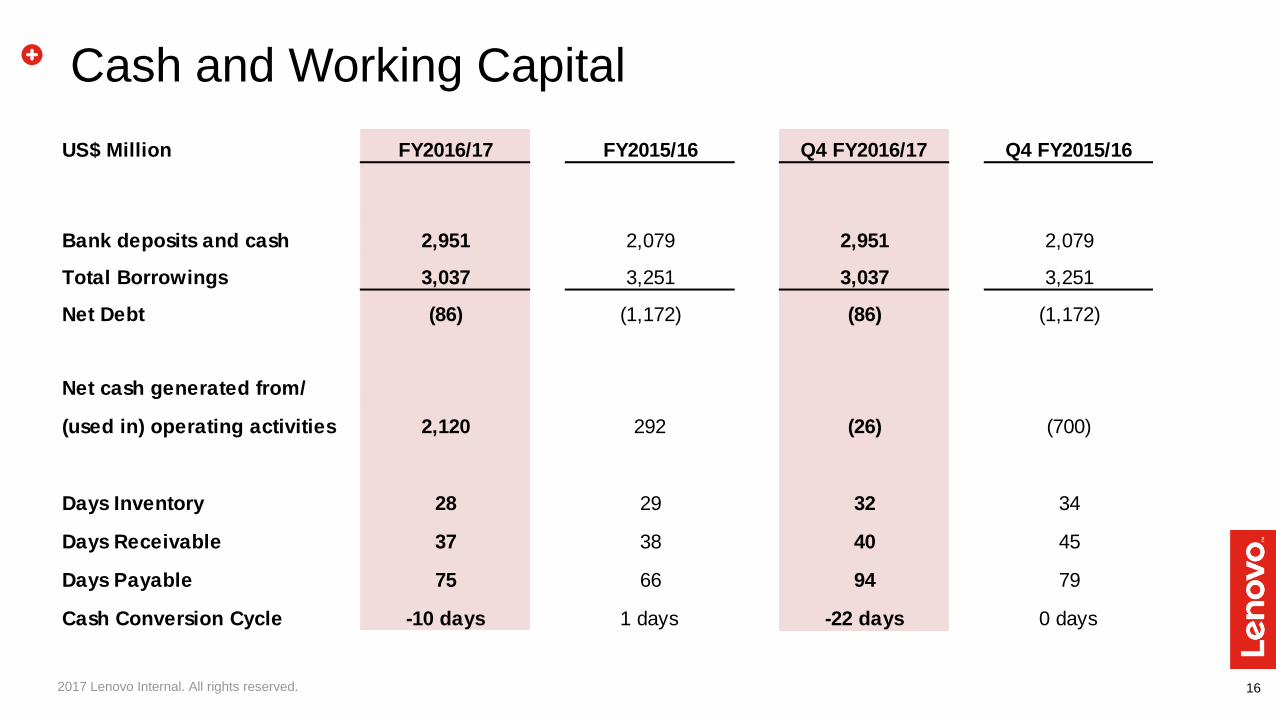
Cash and Working Capital
US$ Million FY2016/17 FY2015/16 Q4 FY2016/17 Q4 FY2015/16
Bank deposits and cash 2,951 2,079 2,951 2,079
Total Borrowings 3,037 3,251 3,037 3,251
Net Debt (86) (1,172) (86) (1,172)
Net cash generated from/
(used in) operating activities 2,120 292 (26) (700)
Days Inventory 28 29 32 34
Days Receivable 37 38 40 45
Days Payable 75 66 94 79
Cash Conversion Cycle -10 days 1 days -22 days 0 days
17
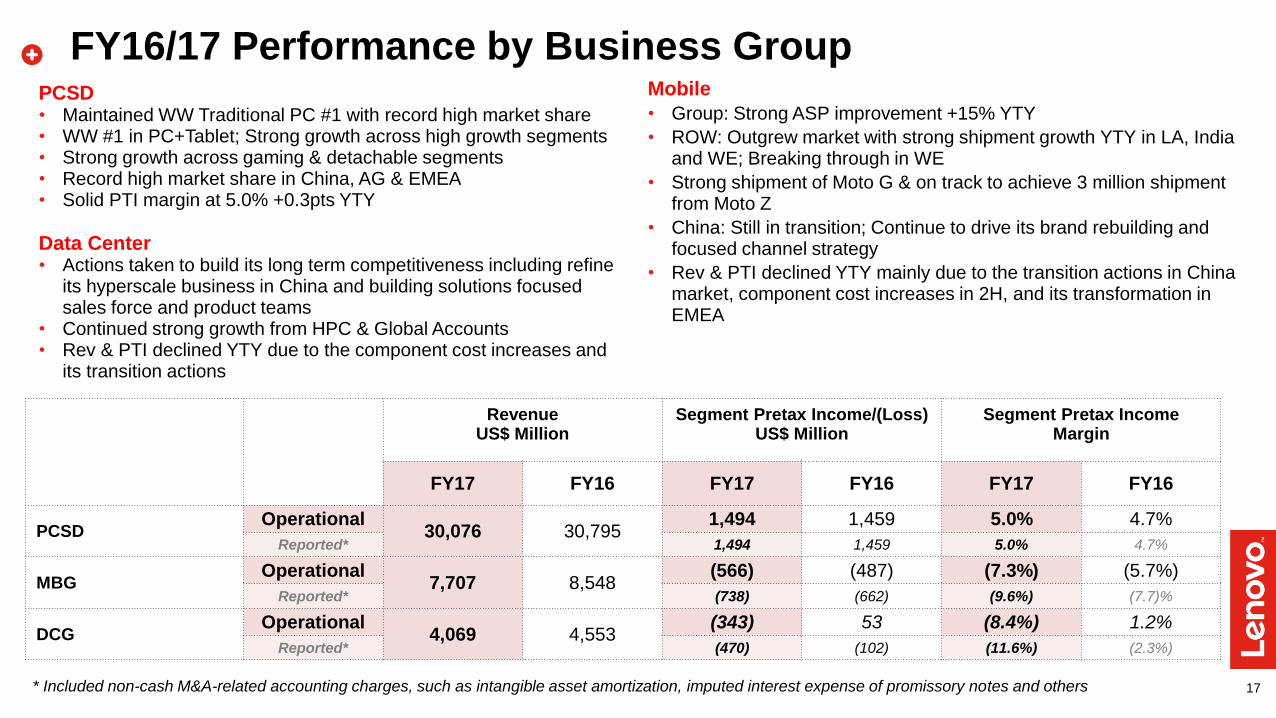
FY16/17 Performance by Business Group PCSD • Maintained WW Traditional PC #1 with record high market share • WW #1 in PC+Tablet; Strong growth across high growth segments • Strong growth across gaming & detachable segments • Record high market share in China, AG & EMEA • Solid PTI margin at 5.0% +0.3pts YTY
Data Center • Actions taken to build its long term competitiveness including refine
its hyperscale business in China and building solutions focused sales force and product teams
• Continued strong growth from HPC & Global Accounts • Rev & PTI declined YTY due to the component cost increases and
its transition actions
Mobile
• Group: Strong ASP improvement +15% YTY
• ROW: Outgrew market with strong shipment growth YTY in LA, India and WE; Breaking through in WE
• Strong shipment of Moto G & on track to achieve 3 million shipment from Moto Z
• China: Still in transition; Continue to drive its brand rebuilding and focused channel strategy
• Rev & PTI declined YTY mainly due to the transition actions in China market, component cost increases in 2H, and its transformation in EMEA
Revenue Segment Pretax Income/(Loss) Segment Pretax Income US$ Million US$ Million Margin
FY17 FY16 FY17 FY16 FY17 FY16
PCSD Operational
30,076 30,795 1,494 1,459 5.0% 4.7%
Reported* 1,494 1,459 5.0% 4.7%
MBG Operational
7,707 8,548 (566) (487) (7.3%) (5.7%)
Reported* (738) (662) (9.6%) (7.7)%
DCG Operational
4,069 4,553 (343) 53 (8.4%) 1.2%
Reported* (470) (102) (11.6%) (2.3%)
* Included non-cash M&A-related accounting charges, such as intangible asset amortization, imputed interest expense of promissory notes and others
18
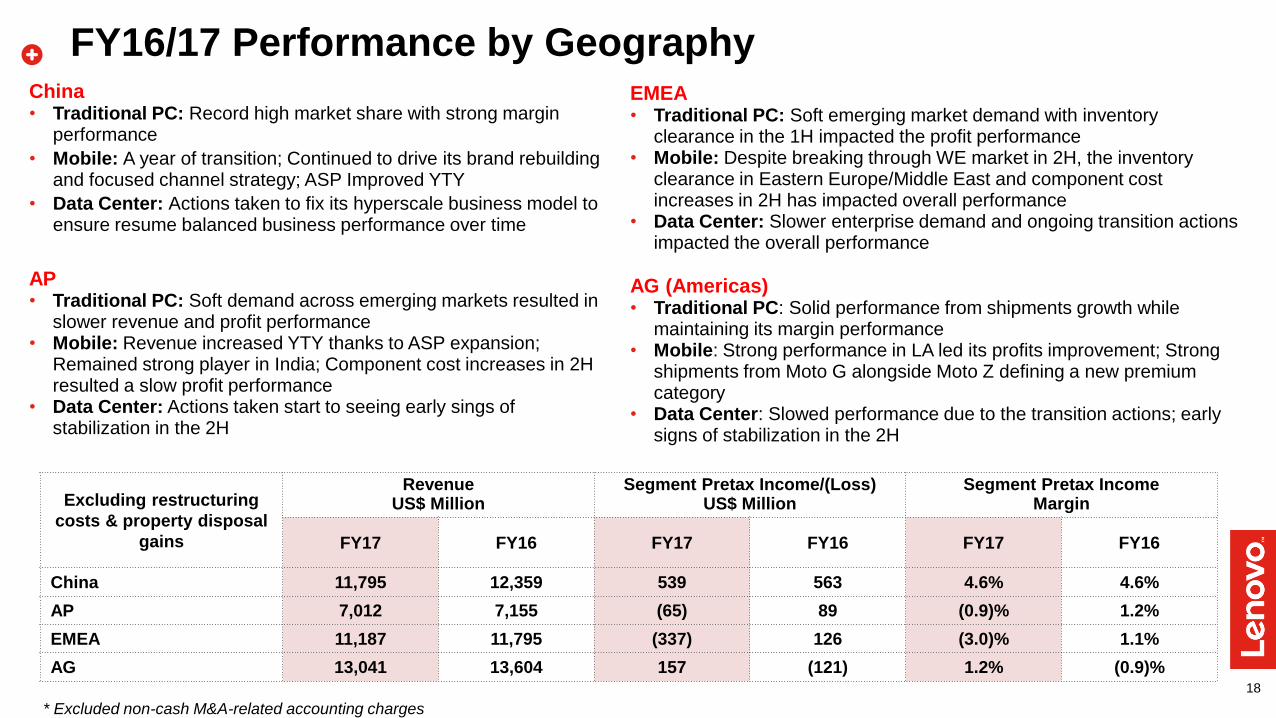
China • Traditional PC: Record high market share with strong margin
performance
• Mobile: A year of transition; Continued to drive its brand rebuilding and focused channel strategy; ASP Improved YTY
• Data Center: Actions taken to fix its hyperscale business model to ensure resume balanced business performance over time
AP • Traditional PC: Soft demand across emerging markets resulted in
slower revenue and profit performance • Mobile: Revenue increased YTY thanks to ASP expansion;
Remained strong player in India; Component cost increases in 2H resulted a slow profit performance
• Data Center: Actions taken start to seeing early sings of stabilization in the 2H
EMEA • Traditional PC: Soft emerging market demand with inventory
clearance in the 1H impacted the profit performance • Mobile: Despite breaking through WE market in 2H, the inventory
clearance in Eastern Europe/Middle East and component cost increases in 2H has impacted overall performance
• Data Center: Slower enterprise demand and ongoing transition actions impacted the overall performance
AG (Americas) • Traditional PC: Solid performance from shipments growth while
maintaining its margin performance • Mobile: Strong performance in LA led its profits improvement; Strong
shipments from Moto G alongside Moto Z defining a new premium category
• Data Center: Slowed performance due to the transition actions; early signs of stabilization in the 2H
FY16/17 Performance by Geography
* Excluded non-cash M&A-related accounting charges
Excluding restructuring
costs & property disposal
gains
Revenue Segment Pretax Income/(Loss) Segment Pretax Income US$ Million US$ Million Margin
FY17 FY16 FY17 FY16 FY17 FY16
China 11,795 12,359 539 563 4.6% 4.6%
AP 7,012 7,155 (65) 89 (0.9)% 1.2%
EMEA 11,187 11,795 (337) 126 (3.0)% 1.1%
AG 13,041 13,604 157 (121) 1.2% (0.9)%
Appendix
- Performance by Business Group – Q4 FY17
- Performance by Geography – Q4 FY17
- Condensed Consolidated Income Statement
- Condensed Consolidated Cash Flow Statement
20
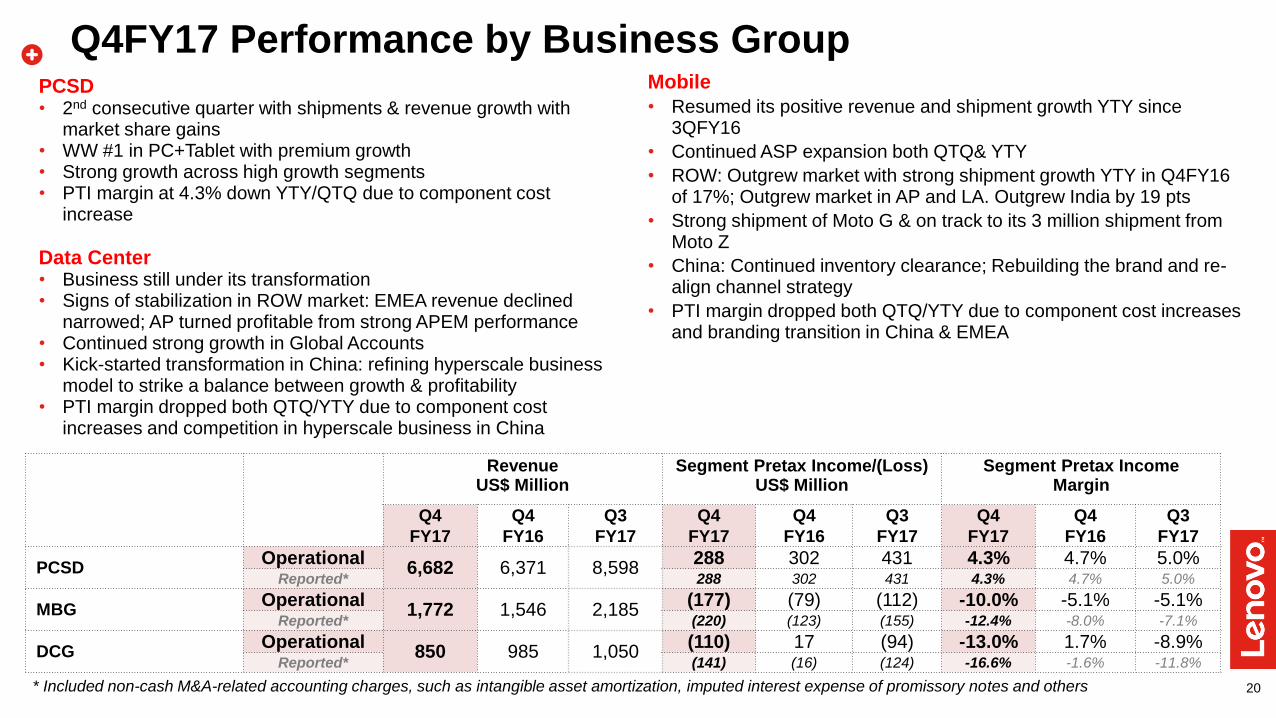
Q4FY17 Performance by Business Group
* Included non-cash M&A-related accounting charges, such as intangible asset amortization, imputed interest expense of promissory notes and others
PCSD • 2nd consecutive quarter with shipments & revenue growth with
market share gains • WW #1 in PC+Tablet with premium growth • Strong growth across high growth segments • PTI margin at 4.3% down YTY/QTQ due to component cost
increase
Data Center • Business still under its transformation • Signs of stabilization in ROW market: EMEA revenue declined
narrowed; AP turned profitable from strong APEM performance • Continued strong growth in Global Accounts • Kick-started transformation in China: refining hyperscale business
model to strike a balance between growth & profitability • PTI margin dropped both QTQ/YTY due to component cost
increases and competition in hyperscale business in China
Mobile
• Resumed its positive revenue and shipment growth YTY since 3QFY16
• Continued ASP expansion both QTQ& YTY
• ROW: Outgrew market with strong shipment growth YTY in Q4FY16 of 17%; Outgrew market in AP and LA. Outgrew India by 19 pts
• Strong shipment of Moto G & on track to its 3 million shipment from Moto Z
• China: Continued inventory clearance; Rebuilding the brand and re-align channel strategy
• PTI margin dropped both QTQ/YTY due to component cost increases and branding transition in China & EMEA
Revenue Segment Pretax Income/(Loss) Segment Pretax Income US$ Million US$ Million Margin
Q4
FY17
Q4
FY16
Q3
FY17
Q4
FY17
Q4
FY16
Q3
FY17
Q4
FY17
Q4
FY16
Q3
FY17
PCSD Operational
6,682 6,371 8,598 288 302 431 4.3% 4.7% 5.0%
Reported* 288 302 431 4.3% 4.7% 5.0%
MBG Operational
1,772 1,546 2,185 (177) (79) (112) -10.0% -5.1% -5.1%
Reported* (220) (123) (155) -12.4% -8.0% -7.1%
DCG Operational
850 985 1,050 (110) 17 (94) -13.0% 1.7% -8.9%
Reported* (141) (16) (124) -16.6% -1.6% -11.8%
21
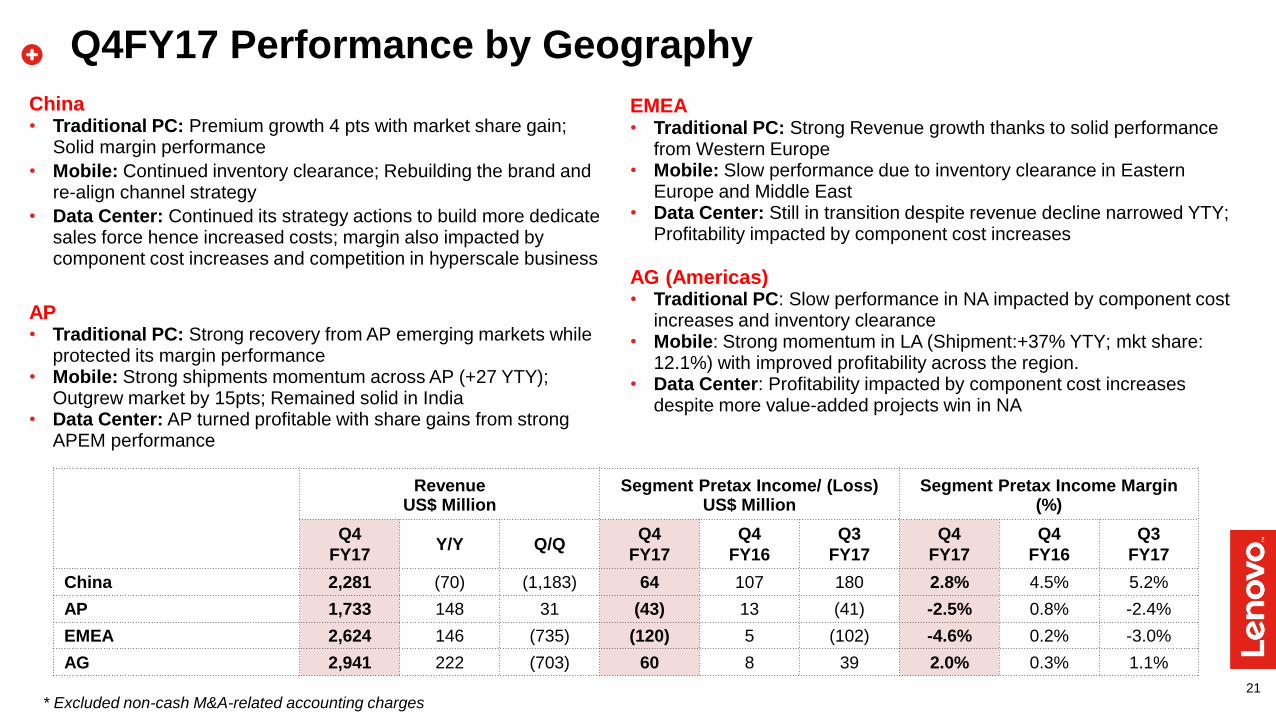
China • Traditional PC: Premium growth 4 pts with market share gain;
Solid margin performance
• Mobile: Continued inventory clearance; Rebuilding the brand and re-align channel strategy
• Data Center: Continued its strategy actions to build more dedicate sales force hence increased costs; margin also impacted by component cost increases and competition in hyperscale business
AP • Traditional PC: Strong recovery from AP emerging markets while
protected its margin performance • Mobile: Strong shipments momentum across AP (+27 YTY);
Outgrew market by 15pts; Remained solid in India • Data Center: AP turned profitable with share gains from strong
APEM performance
EMEA • Traditional PC: Strong Revenue growth thanks to solid performance
from Western Europe • Mobile: Slow performance due to inventory clearance in Eastern
Europe and Middle East • Data Center: Still in transition despite revenue decline narrowed YTY;
Profitability impacted by component cost increases
AG (Americas) • Traditional PC: Slow performance in NA impacted by component cost
increases and inventory clearance • Mobile: Strong momentum in LA (Shipment:+37% YTY; mkt share:
12.1%) with improved profitability across the region. • Data Center: Profitability impacted by component cost increases
despite more value-added projects win in NA
Q4FY17 Performance by Geography
* Excluded non-cash M&A-related accounting charges
Revenue Segment Pretax Income/ (Loss) Segment Pretax Income Margin US$ Million US$ Million (%)
Q4
FY17 Y/Y Q/Q
Q4
FY17
Q4
FY16
Q3
FY17
Q4
FY17
Q4
FY16
Q3
FY17
China 2,281 (70) (1,183) 64 107 180 2.8% 4.5% 5.2%
AP 1,733 148 31 (43) 13 (41) -2.5% 0.8% -2.4%
EMEA 2,624 146 (735) (120) 5 (102) -4.6% 0.2% -3.0%
AG 2,941 222 (703) 60 8 39 2.0% 0.3% 1.1%

22
Condensed Consolidated Income Statement
US$ Million FY2016/17 FY2015/16 Q4 FY2016/17 Q4 FY2015/16
Revenue 43,035 44,912 9,579 9,133
Cost of sales (36,929) (38,288) (8,211) (7,615)
Gross profit 6,106 6,624 1,368 1,518
Other income-net 11 2 - -
Selling and distribution expenses (2,681) (2,373) (658) (536)
Administrative expenses (1,852) (2,109) (509) (476)
Research and development expenses (1,362) (1,491) (338) (352)
Other operating income/ (expense) - net 450 (715) 211 94
Operating profit/(loss) 672 (62) 74 248
Finance income 28 33 10 8
Finance costs (231) (237) (68) (58)
Share of profit/(loss) of associated companies and joint ventures 21 (11) (1) (5)
Profit/(loss) before taxation 490 (277) 15 193
Taxation 40 132 89 (17)
Profit/(loss) for the period 530 (145) 104 176
Profit/(loss) attributable to:
Equity holders of the company 535 (128) 107 180
Perpetual securities holders 2 - 2 -
Other non-controlling intersts (7) (17) (5) (4)
Dividend 378 379 - -
Earnings/(Loss) per share (US cents)
- Basic 4.86 (1.16) 0.97 1.63
- Diluted 4.86 (1.16) 0.97 1.62
23
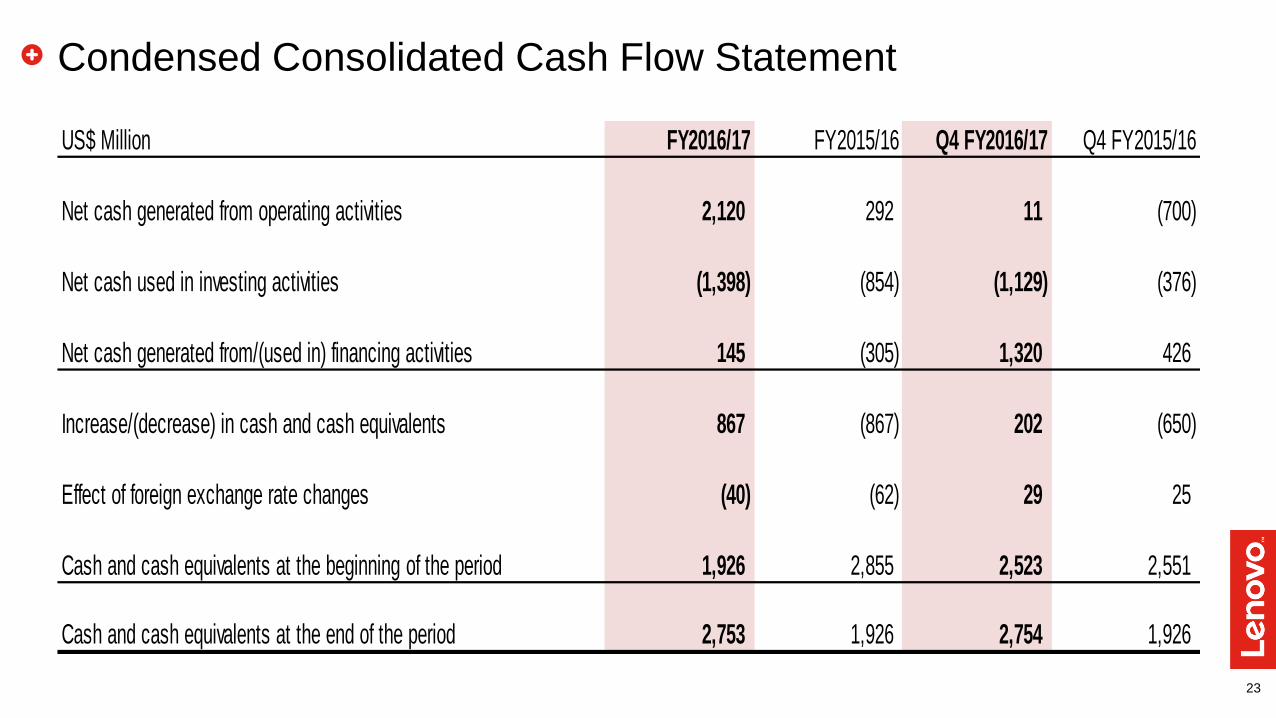
Condensed Consolidated Cash Flow Statement
US$ Million FY2016/17 FY2015/16 Q4 FY2016/17 Q4 FY2015/16
Net cash generated from operating activities 2,120 292 11 (700)
Net cash used in investing activities (1,398) (854) (1,129) (376)
Net cash generated from/(used in) financing activities 145 (305) 1,320 426
Increase/(decrease) in cash and cash equivalents 867 (867) 202 (650)
Effect of foreign exchange rate changes (40) (62) 29 25
Cash and cash equivalents at the beginning of the period 1,926 2,855 2,523 2,551
Cash and cash equivalents at the end of the period 2,753 1,926 2,754 1,926

Related Documents