Market (In)Attention and Earnings Announcement Timing † Ed deHaan Graduate School of Business Stanford University [email protected] Terry Shevlin Merage School of Business University of California at Irvine [email protected] Jacob Thornock Foster School of Business University of Washington [email protected] February 20, 2014 Ed deHaan acknowledges support from the Stanford Graduate School of Business. Jake Thornock acknowledges support from the Foster School of Business. Terry Shevlin acknowledges support from the Merage School of Business. Wall Street Horizon kindly provided data on earnings announcement timing. We thank Malcolm Bain for his generous assistance with the RavenPack data. † Abridged version.

Welcome message from author
This document is posted to help you gain knowledge. Please leave a comment to let me know what you think about it! Share it to your friends and learn new things together.
Transcript
Market (In)Attention and Earnings Announcement Timing�†
Ed deHaan Graduate School of Business
Stanford University [email protected]
Terry Shevlin Merage School of Business
University of California at Irvine [email protected]
Jacob Thornock Foster School of Business University of Washington
February 20, 2014
� Ed deHaan acknowledges support from the Stanford Graduate School of Business. Jake Thornock acknowledges support from the Foster School of Business. Terry Shevlin acknowledges support from the Merage School of Business. Wall Street Horizon kindly provided data on earnings announcement timing. We thank Malcolm Bain for his generous assistance with the RavenPack data. †
Abridged version.

!!
1
Market (In)Attention and Earnings Announcement Timing
Abstract We revisit a long-standing but still unresolved question: do managers attempt to “hide” bad earnings news by announcing earnings during periods of low market attention? Or conversely, do managers “highlight” good news by reporting during periods of higher attention? We posit three conditions that must be met to answer this question in the affirmative: (i) managers must change their earnings announcement timing frequently enough that to do so would not immediately attract unwanted attention to bad news; (ii) there must be variation in market participants’ attention that is predictable to the manager ex-ante; and (iii) we must observe that managers tend to release more negative earnings news during periods of lower expected attention. The first and second conditions have not been directly examined. Prior studies examining the third condition have produced mixed results. We examine three specific times during which prior research has speculated that market attention is lower: after trading hours, on Fridays, and on “busy” days when numerous other firms are reporting earnings. We find that earnings announcement timing are highly variable, which supports the first necessary condition. Using four measures of market attention, we find that attention does appear to be lower after hours and on busy reporting days. However, we find that attention is the same or even higher on Fridays, which is inconsistent with the second condition. Finally, we find that unexpected earnings are lower in all three settings. In sum, the results are consistent with managers strategically reporting bad news during times when they expect that attention is limited, and conversely, reporting good news in periods of higher attention. However, given that attention is the same or higher on Fridays than other days, it is unlikely that managers are able to effectively hide bad news by reporting immediately prior to the weekend. Instead, the preponderance of strategically reporting bad news on Fridays is possibly due to managers incorrectly perceiving attention as lower on Friday. Keywords: Market participant attention, earnings release timing, strategic disclosure.

!!
1
1. Introduction
In this paper, we revisit a long-standing but still unresolved question: do managers
attempt to “hide” bad earnings news by announcing during periods of low market attention? Or,
conversely: do managers attempt to “highlight” good earnings news by announcing earnings
during periods of high market attention? We posit three conditions that must be met to
sufficiently answer these questions. First, to be able to hide bad news, managers must change
their earnings announcement timing frequently enough that to do so would not immediately
attract unwanted attention. A deviation from a long-standing pattern of earnings release timing
could attract attention to the very news the manager is trying to hide. Second, there must be
variation in market participants’ attention that is predictable to the manager ex-ante—random
variation in attention would not allow for strategic timing of bad or good news. Third, we must
observe that managers do tend to release more negative (positive) earnings news during periods
of lower (higher) market attention, after controlling for other correlated factors. The first and
second of these conditions have not been directly examined. Prior studies examining the third
condition have produced mixed results.
Managers have several incentives to alter the timing of their negative (positive) earnings
releases to periods of low (high) perceived attention. First, managers likely prefer to release good
(bad) earnings news during periods where it might have the highest (lowest) price impact. Even
if the initial under- or over-reaction is temporary, managers will likely strategically time their
earnings release such that the news is gradually reflected in prices to reduce the likelihood of
sudden price drops and trading halts that can adversely affect the company. Second, even if there
is no pricing impact, managers may face reputational consequences for negative news that is
publicized more, or may wish to draw attention to good earnings news to improve their

!!
2
managerial reputation. Finally, to the extent that investors more frequently buy firms that catch
their attention, as suggested by Barber and Odean (2008), there may be liquidity implications for
differences in investor attention. Managers could alter their earnings announcement times in
attempt to avoid or attract attention for any of the above reasons, even if the probability of
success is low, because the direct cost of switching earnings announcement timing is likely also
low.1
We construct a novel database of precise earnings announcement dates and times to
investigate the timing of earnings announcements by hour and by weekday.!Specifically, we use
the combination of four databases, Compustat, RavenPack, Wall Street Horizon, and IBES, to
create a dataset of 192,485 confirmed earnings announcement dates and 151,106 confirmed
earnings announcement times. We corroborate the date and time of each earnings announcement
by at least two sources. As a result, our sample is larger and likely more accurate than samples
used in previous studies of strategic earnings release timing.2 We discuss the sample in detail in
Section 3.
We find that firms frequently change the timing of their earnings releases: within any
given year, 81.6% of firms change their quarterly earnings announcement weekday at least once,
and 25.6% change whether they report before, during, or after market hours. Although just 7.6%
of all earnings announcements happen on Fridays, 51.4% of firms have at least one Friday
announcement during our sample period. Managers’ intent is unobservable, but the majority of
these changes in earnings announcement times are likely made for administrative or other benign
!!!!!!!!!!!!!!!!!!!!!!!!!!!!!!!!!!!!!!!!!!!!!!!!!!!!!!!!!!!!!1 For instance, the direct cost of moving a press release from a low to high attention time of day is likely near zero as neither EDGAR nor the major press wires charge different amounts depending on the time of the announcement. If an action is sufficiently cheap, a manager will undertake the action even if the expected benefit is low. 2 Most of the samples in prior research use private or hand-collected databases, so we do not make direct comparisons to particular papers. However, our sample is larger and appears to be more comprehensive than the samples in prior studies. Further, our measurements of earnings release dates and times are likely more accurate than prior research because we use several sources to validate the exact timing.
!!
3
reasons. The high frequency of benign changes is precisely the camouflage needed for managers
to occasionally switch their earnings announcement timing for strategic purposes without raising
alarm. Thus, we interpret this evidence as consistent with the first condition that changes in
earnings release timing are prevalent enough to allow for “hiding” bad news.
We turn next to the second necessary condition, which is that lulls and peaks in market
attention must be ex-ante predictable in order for managers to shift bad (good) news into times
where the market is paying less (more) attention. We examine three specific times during which
prior research has speculated that market attention differs: before versus after the close of regular
trading hours; on Mondays through Thursdays versus Fridays; and on “slow” versus “busy”
news days, based on the total number of firms that are reporting earnings.
Prior research has inferred that attention is lower on Fridays (DellaVigna and Pollet
2009) and on busy reporting days (Hirschleifer et al. 2009), primarily based on evidence that
price responses are muted on Fridays and busy days. We raise several concerns about drawing a
causal link between attention and stock price responses. First, the interpretation of lower
earnings response coefficients (ERCs) as evidence of reduced attention assumes that market
frictions and/or behavioral biases prevent other undistracted arbitrageurs and algorithmic traders
from eliminating under-reactions by distracted investors. Second, to the extent that ERCs do in
fact capture attention, it derives primarily from equity investors; the attention of other important
market participants known to improve market efficiency, such as analysts and the business press,
is ignored using an ERC methodology. Finally, Kothari (2001) explains several shortcomings in
ERC methodologies and discusses the possibility for correlated omitted variables. Given these
concerns, we argue that additional investigation is warranted to further evaluate variation in
attention for earnings announcements.
!!
4
Rather than inferring variation in attention based on price responses, we employ four
empirical proxies to investigate temporal variation in market participants’ attention: (i) the
number of news articles written specifically about the firm’s earnings; (ii) the speed with which
analysts incorporate the earnings news into future earnings forecasts; (iii) investor downloads of
8-Ks likely containing the earnings news; and (iv) abnormal Google search volume. The
advantage of these attention measures is that they are user-oriented, related to information
processing, and measured on a timely basis.
Our findings are consistent with attention being lower (higher) after (before) market close
and on busy (slow) reporting days. Specifically, announcements after trading hours (on the
busiest reporting days) are associated with a 7% (12%) decrease in news articles, a 7% (4%)
decrease in the speed with which analysts update forecasts, a 19% (30%) decrease in EDGAR
downloads, and a 0% (2%) decrease in Google searches, after controlling for firm fixed effects,
non-stationary firm characteristics, and the sign and magnitude of the earnings news. However,
our analyses generally indicate that attention is actually no different on Fridays than other
weekdays, which is inconsistent with prior research that has interpreted lower Friday ERCs as
being indicative of lower attention. We also tie together our first two conditions by showing that
the act of switching earnings release timing (condition 1) does not draw unwanted attention to
bad news (condition 2). Specifically, we find that the aforementioned variation in attention still
holds for those firms that switch their earnings release timing in the current quarter as compared
to firms that maintain their earnings announcement timing from the prior quarter. However, we
again fail to find compelling results for differences in attention for Friday versus non-Friday
announcers. In sum, the data are consistent with the second condition that market attention is
predictably lower after hours and on busy reporting days, but the same does not hold for Fridays.

!!
5
Next, we examine the validity of the third necessary condition: that managers tend to
release worse (better) earnings news after market close, on Fridays, and on busy reporting days
(before market close, on Mondays through Thursdays, and on slow reporting days). Prior
research has examined whether earnings news is worse after hours and on Fridays, but the results
to date have been mixed. Early work by Patell and Wolfson (1982) and Damodaran (1989) find
that earnings news tends to be worse on Fridays and after hours, but Doyle and Magilke (2009)
find that such differences disappear when the empirical methodology is improved to examine
only within-firm variation. Using a larger sample of precise earnings release times, we find
statistically and economically significant declines in unexpected earnings (i.e., IBES earnings
less analyst consensus) for firms that choose to report earnings after hours, on Fridays, and on
the busiest reporting days. In analyses that tie the first condition with the third, we also find
evidence consistent with managers both switching to periods of low expected attention to hide
bad news, as well as with switching to periods of higher expected attention to highlight good
news.
We make several contributions to the academic literature. First, although it can be
inferred from prior research that the existence of earnings announcement timing changes is non-
zero, to date there has been limited evidence on the prevalence, timing, and dimensions of the
changes in earnings release timing. We contribute to the literature by using robust data to
quantify how often changes occur in general (e.g., across all firms, 15% change their
before/during/after hours announcement timing from the previous quarter) as well as how often
changes occur within a given firm (e.g., within each firm, 25.6% change their before/during/after
hours announcement timing at least once within a given year, and 72.6% of firms have at least
one change within our sample period). Further, we characterize changes in quarter-over-quarter

!!
6
earnings announcement timing along several dimensions: by hour, by weekday, and in relation to
the timing choices of other firms. We also provide evidence consistent with changes in earnings
announcement timing not drawing the attention of market participants, an assumed condition that
underlies prior research on strategic earnings timing, but which has not been explicitly tested to
date.
Our second contribution is to provide new and direct evidence on the existence of
predictable variation in attention to earnings announcements. We employ state-of-the-art proxies
for market participants’ attention to investigate how and when attention to earnings releases
appears to decline, and find evidence that both confirms and conflicts with the inferences from
prior research. First, our evidence that market attention is lower after hours is new to the
literature. Second, our evidence that market attention is lower on busy reporting days confirms
Hirshleifer et al.’s (2009) inference based on evidence from stock price responses. Finally, our
evidence that attention to earnings announcements is no different on Fridays as compared to
Monday – Thursdays conflicts with DellaVigna and Pollet (2009).
Finally, we contribute to the literature that investigates the determinants of managers’
earnings release timing choices. Prior studies have produced mixed evidence as to whether
managers strategically time earnings releases based on the sign and magnitude of the earnings
news. Using a dataset that is larger and likely more precise than the data in previous studies, and
using a comprehensive set of empirical tests, we find that earnings news does tend to be worse
when released after hours, on Fridays, and on busy reporting days. We also predict and find
evidence that managers appear to highlight good news during periods of high perceived
attention, a finding that is new to this literature.
!!
7
In sum, we conclude that managers are likely able to limit attention to negative news by
announcing earnings after hours and on busy days. However, since we find that attention is no
different on Friday than other weekdays, we conclude that the preponderance of bad news on
Fridays is driven by either managers having incorrect beliefs about market attention, or by some
other motivation.
Section 2 discusses prior literature and develops our research hypotheses. We discuss our
sample in Section 3 and detail our empirical analysis in Section 4. Section 5 concludes.
2. Prior Research & Hypothesis Development
2.1 Hiding bad news and highlighting good news
In today’s information-rich environment, the idea that public companies can “hide” an
earnings release is potentially difficult to grasp. At the same time, though, limited attention
theory predicts that the enormous amount of information available in recent years likely makes it
easier for managers to hide bad news among the clutter (Hirshleifer et al 2009; Lim and Teoh
2010). Moreover, the cost of changing earnings release timing is likely very low, so a manager
will likely do so even if s/he expects that it has only a small chance of being effective at altering
attention. In this section, we provide several reasons why managers likely would want to limit
(attract) attention to bad (good) earnings news, and why managers might have some expectation
of getting away with it.
One incentive for managers to reduce (attract) attention to bad (good) news is that doing
so might influence market price responses, at least in the short term. Anecdotal evidence
indicates that inattention is associated with prices that do not fully impound all available public
information. For instance, Huberman and Regev (2001) examine the case of the biotechnology
company EntreMed: a May 1998 article in New York Times caused EntreMed’s stock price to
!!
8
rise over 330% in one day and remain high through the rest of the year, despite the fact that this
same good news was reported in Nature, New York Times, and other sources more than five
months earlier. Lim and Teoh (2010) speculate that many so-called market anomalies are
potentially attributable to variation in market participants’ attentiveness. Moreover, even if
managers understand that bad news will soon be fully revealed in prices, they likely prefer
gradual rather than sudden price declines because the latter can lead to negative media attention,
price drops, and trading halts. Further, prior research shows that severe price drops increase the
likelihood of shareholder litigation (Donelson et al. 2012).
Even if there is no pricing benefit of strategic earnings release timing, other potential
benefits are also possible. First, Farrell and Whidbee (2002) find that forced CEO turnover after
poor performance is higher among firms with greater media coverage, consistent with news
dissemination affecting labor outcomes for managers. Thus, managers likely want to limit the
dissemination of bad news so as to protect their reputations and career prospects. Equivalently,
managers likely want to maximize dissemination of good news to boost their reputations.
Second, Barber and Odean (2008) discuss how some investors only consider purchasing stocks
that have first caught their attention. A logical extension of this argument is that investors will be
less (more) likely to purchase stocks about which they have heard negative (good) news. Even if
prices are unaffected by individual traders, there is plausibly a liquidity implication of news
dissemination.
As previously noted, the idea that managers limit exposure to bad news by reporting
during periods of lower market attention involves three conditions: (i) managers must change
their earnings announcement timing frequently enough that to do so does not immediately attract
unwanted attention; (ii) there must be ex ante predictable variation in market participants’

!!
9
attention; and (iii) we must observe that earnings news is more negative during periods of
expected lower market attention, after controlling for other correlated factors. The second and
third of these conditions apply equivalently to managers being able to highlight reporting good
news in periods of high attention. In the following three subsections, we develop hypotheses
regarding each of these conditions.
2.2. Prevalence of Earnings Announcement Timing Changes
Microsoft schedules its earnings release to occur at the same time and weekday each
quarter—Thursday afternoon just after 4pm Eastern Time (all quoted times hereafter are in U.S.
Eastern Time). Costco presents another interesting case in earnings release timing—it releases
earnings consistently at 1:00am. If announcement times are in general as highly persistent as
they are at Microsoft and Costco, a manager’s attempt to limit exposure to negative news by
switching the announcement timing will likely have the opposite result: the act of changing
timing will draw unwanted attention. Thus, we argue that changes in earnings announcement
timing must be sufficiently prevalent that a switch does not immediately stand out as anomalous.
There are a number of reasons to expect that earnings announcement times are sticky.
First, managers have a preference for being consistent with precedent in their voluntary
disclosures (Graham et al. 2005). This preference is most likely driven by an expectation that
changing the announcement timing between periods will be interpreted as signaling something
about the firm’s earnings news. Several research firms make efforts to forecast in advance the
predicted date of earnings release, and there is evidence that markets respond negatively when
firms miss an expected reporting date (Chambers and Penman 1984, Bagnoli et al. 2002, Duarte-
!!
10
Silva et al. 2013).3 This finding suggests that investors form expectations not only for the
earnings news, but also for the timing of the earnings news release. Thus, it is probable that
managers prefer to maintain consistency in their reporting to avoid returns volatility from
varying announcement timing. Indeed, Graham et al. (2005) find that 53% of surveyed
executives “give no preferential treatment to disclosing good or bad news faster” (page 63).
There are also a number of reasons to expect that earnings announcement times are
highly variable. Academic research has also found evidence consistent with managers both
accelerating and delaying earnings announcement timing for strategic purposes (Skinner 1994,
1997; Donelson et al. 2012; Kross 1981, Chambers and Penman 1984; Kross and Schroeder
1984; Begley and Fischer 1998; Bagnoli et al. 2002). However, the most common reasons for
changing the timing of earnings releases are likely benign, simply reflecting calendar conflicts or
administrative conflicts. For example, a firm that regularly releases earnings on a Monday may
have to change the day for common holidays that fall on Monday. Our discussions with investor
relations experts also revealed the administrative conflicts, such as executive and analyst
availability, are common reasons for changing the earnings release timing.
As mentioned above, frequent and benign changes in earnings release timing are
precisely the camouflage needed for managers to change the earnings release timing for strategic
reasons. We can infer from prior research that changes in earnings announcement timing do
indeed occur (e.g., Doyle and Magilke 2009). However, prior research does not quantify the
extent and dimensions of changes in earnings release timing. For most of the past studies,
examining the extent of earnings release timing changes was not the primary goal of the paper,
and as a result, the studies provide very little context surrounding the frequency of switches. We !!!!!!!!!!!!!!!!!!!!!!!!!!!!!!!!!!!!!!!!!!!!!!!!!!!!!!!!!!!!!3 For example, Zacks Investment Research forecasts the “expected report date,” which is released in advance to the public. http://www.nasdaq.com/earnings/earnings-calendar.aspx. Wall Street Horizon sells proprietary data on expected earnings announcement times.
!!
11
put forth three predictions about consistency in earnings announcement timing across periods
where variation in market attention is thought to exist:
H1a: Quarter after quarter, firms release earnings news at the same time of day.
H1b: Quarter after quarter, firms release earnings news on the same weekday.
H1c: Quarter after quarter, firms release earnings news on similarly busy reporting days.
2.3. Variation in Market Participants’ Attention
Prior research has posited that, at some point, the limited capabilities of humans to
acquire and process information prevents them from absorbing the complete set of public
information (Lim and Teoh 2010). A large and expanding literature has begun to explore the
determinants and implications of what is often referred to as market “inattention” or “distraction”
(see Lim and Teoh (2010) for a review).
Patell and Wolfson (1982), among others, speculate that earnings releases that occur in
the evening might receive less attention than similar news that is released earlier in the day. The
premise for this speculation is presumably that market participants are not working once the
market closes, or that they are distracted by other issues. However, Patell and Wolfson (1982)
also note that the opposite could be true: that earnings releases in the evening could receive
greater attention as more time is allowed for dissemination and interpretation before trading
begins the following day. To our knowledge, no previous paper has explicitly examined
differential attention to earnings released after hours versus earlier in the day. We therefore
investigate the following hypothesis (written in the null form):
H2a: Market participant attention to earnings news is the same after market hours as during
or before market hours.

!!
12
DellaVigna and Pollett (2009) and Damodaran (1989), among others, theorize that
market participants are distracted just before the weekend and, as a result, earnings released on a
Friday receive less attention than similar earnings released on Monday through Thursday.
However, because relatively few firms release earnings on Friday (in our sample, just 7.6 percent
occur on a Friday), it is plausible that each individual announcement receives more attention than
announcements on other days of the week. Further, the idea that market participants are
systematically inattentive on Fridays is inconsistent with the work patterns for the typical
investment banker, money manager, or analyst, who often work long hours and weekends.
Consistent with this idea, in untabulated analysis we find no difference in the frequency of
analyst forecast revisions that occur on Fridays versus other weekdays. Thus, there are reasons
both for and against expecting lower market attention immediately prior to the weekend.
DellaVigna and Pollet (2009) find that ERCs are lower, PEAD is higher, and trading
volume is lower on Fridays, which is consistent with lower attention. However, as discussed
above, inferring a causal link between lower attention and muted stock price responses requires
controversial assumptions about the earnings-returns relation and also that the numerous other
known determinants of ERCs are adequately controlled in empirical analysis.4 Further, since the
majority of trading activity is driven by computer algorithms that are likely unaffected by
distraction on Fridays, there are reasons to question whether lower Friday ERCs are driven by
behavioral biases. Thus, it is plausible that the differential market responses for Friday
announcements observed by DellaVigna and Pollet (2009) are caused by other factors, and we
argue that further investigation of attention on Fridays is warranted.5 In our primary tests, we use
!!!!!!!!!!!!!!!!!!!!!!!!!!!!!!!!!!!!!!!!!!!!!!!!!!!!!!!!!!!!!4 The literature on the determinants of ERCs is vast. Kothari (2001) discusses the literature on how expectations about growth, discount rates, earnings persistence, and a number of other firm fundamentals impact ERCs. 5 Melessa (2012) also finds evidence that lower Friday ERCs are likely not driven by lower attention, but rather by macroeconomic uncertainty.

!!
13
alternative, user-based measures of market participant attention to investigate H2b (written in the
null form):
H2b: Market participant attention to earnings news is the same on Friday as it is Monday
through Thursday.
Similar to DellaVigna and Pollett (2009), Hirshleifer et al. (2009) interpret lower stock
market responses and greater PEAD on days with numerous earnings announcements as
indicating that attention to individual firm announcements is lower on days with high
information flow. A plausible alternate is that, since “earnings season” is highly anticipated and
report dates are often known in advance, market participants arrange their schedules such that
they can pay adequate attention to numerous firms’ announcements. It is therefore plausible that
there is equal or even greater attention paid to earnings releases on busy days relative to periods
of low information flow, in which case the differential market responses on busy days are driven
by non-attention causes. As with above, we use alternative measures of market inattention to
investigate H2c (written in the null form):
H2c: Investor attention to earnings news is the same on days with many earnings releases as
it is on days with few earnings releases.
2.4. Strategic Timing of Earnings News
Several studies have examined whether managers choose an earnings release time
depending on the content of the news. Patell and Wolfson (1982) use a small sample of earnings
releases for 96 firms during the late seventies and find that period-over-period earnings changes
as well as stock returns tend to be lower after trading hours. Damodaran (1989) finds similar
results for Fridays—earnings announcements on Fridays are more likely to contain bad news
than for other weekdays. Doyle and Magilke (2009) use a slightly larger sample of earnings

!!
14
announcement changes (ranging from about 1,300 to 2,000 observations in their primary
analyses) in a more recent time period (2000 - 2005) to re-assess the question of whether
managers report bad news after hours and on Fridays. The primary innovation in Doyle and
Magilke (2009) over the previous research is to examine strictly within-firm changes in earnings
release patterns. In contrast to prior papers, the study finds little evidence that unexpected
earnings (as measured relative to analyst consensus) are lower after hours or on Fridays.
There are several potential reasons for the mixed prior results on whether managers
report bad news after hours and on Fridays. First, times have changed—the information
environment is clearly different in the internet age than in prior eras, which implies that the
manner of information dissemination has also changed. Indeed, we find that the timing of
earnings releases has changed dramatically over the past decade—now, almost no firms
announce earnings during market hours (see Figure 1, Panel B). Second, the studies use differing
research designs and sample sizes. Finally, obtaining data on the exact timing of earnings
releases has been difficult—we find that up to 10% of earnings announcement dates and up to
22% of earnings announcement times are mismatched during our sample period.
Earnings release timing is voluntary. Thus, if managers prefer to hide (highlight) bad
(good) earnings news, they likely alter their earnings announcement timing in an attempt to take
advantage of any possible differences in market participants’ attention. Specifically, we predict
that managers will time bad (good) news for release in periods when they expect attention to be
lower (higher). We also note that, if the cost of changing announcement timing is sufficiently
low, managers will likely do so even if the expected probability of receiving different attention is
low. Our hypotheses in the null form are as follows:
H3a: Earnings news is no different after market hours than it is earlier in the day.

!!
15
H3b: Earnings news is no different on Friday than it is on Monday through Thursday.
H3c: Earnings news is no different on days with many earnings releases than it is on days
with few earnings releases.
3. Sample Construction
Because the mixed results in the prior literature could be partially attributed to challenges
in measuring earnings release timing, our objective in creating our sample is to construct a
sample of earnings announcement days and times that is as accurate as possible. To do so, we
obtain earnings announcement dates and times from four independent sources—Compustat,
IBES, RavenPack and Wall Street Horizon—and retain only those observations for which the
earnings announcement days and times can be validated by at least two sources. Information on
the sample selection is shown in Table 1. We create separate samples for earnings announcement
days and for earnings announcement times in order to maximize the sample sizes.
To create our sample of earnings announcement days, we begin by intersecting
Compustat and CRSP to identify all US public company quarterly earnings releases from 2000
through 2011, for a total of 233,827 observations.6 We remove 19,166 observations for which
IBES data are unavailable. To better ensure that the earnings announcement dates are accurate,
we eliminate another 22,106 observations for which the Compustat and IBES earnings
announcement dates differ. We drop 70 observations (less than 0.04% of the sample) that have
an earnings announcement on a Saturday or Sunday. The remaining sample of 192,485 firm-
quarters is used for our descriptive analysis of earnings announcements by day. For our statistical
tests, we drop 47,151 observations that do not have the control variables used in the regression
!!!!!!!!!!!!!!!!!!!!!!!!!!!!!!!!!!!!!!!!!!!!!!!!!!!!!!!!!!!!!6 We limit to our analyses to common stocks (i.e., CRSP ‘shrcd’ 10 and 11), which removes non-typical securities such as REITs, ADRs, and publicly-traded partnerships. We begin our sample period in 2000 as news data from RavenPack are not available prior to 2000.

!!
16
tests below.7 To reduce the effects of anomalous observations, we drop 3,652 observations that
have an absolute earnings surprise that exceeds the stock price, that have a stock price below $1
at period-end, or that announce earnings more than 90 days after the fiscal period-end (which is
the longest SEC reporting deadline during our sample period). Finally, we drop 17,677
observations that do not have news coverage data. The final sample for statistical tests of
earnings announcements by date is 124,005 firm-quarters.
To create our sample for earnings announcement times, we further require accurate data
on the time of day of the earnings release, which leads to a different sample size from the
samples described above. We use three different data sources to validate earnings announcement
times. Our first source of the announcement time stamp is IBES.8 We require that the earnings
release time is validated by at least one of two additional sources, RavenPack and Wall Street
Horizon. RavenPack’s database comprises news articles that appear in Wall Street Journal (all
editions), Dow Jones Newswires, and Barron’s. For each earnings announcement date, we locate
in RavenPack the firm’s press release or the first news article written specifically about the
firm’s earnings.9 The time stamp of the press release or first news article is our second source of
the earnings announcement time. Our third source of earnings announcement times is from Wall
Street Horizon, although these data are only available after 2005.10
For our descriptive analysis of earnings announcement times, we require that the
before/during/after-hours timing classification can be corroborated by at least two data sources.
This criteria eliminates 41,379 of the 192,485 observations with a valid earnings announcement
!!!!!!!!!!!!!!!!!!!!!!!!!!!!!!!!!!!!!!!!!!!!!!!!!!!!!!!!!!!!!7 Specifically, we drop observations with missing data for UE, SIZE, BTM, LEV, NUMEST, CAR, FQ4, and REPLAG, all of which are defined in Appendix A and discussed below. 8 IBES has an usual spike of earnings announcement times of 00:00:00. We set these likely errors to missing. 9 Specifically, we retain only earnings press releases and news articles that RavenPack assigns a relevance score of 100, which indicates that the article is dedicated to only that particular firm. 10 Wall Street Horizon reports an accuracy rate of 99.95%, as per http://www30.wallstreethorizon.com/our-process. Accessed 8/17/2012.

!!
17
date, leaving a sample of 151,106 observations for our descriptive analysis of intraday
announcements. As discussed below, our statistical analysis primarily focuses on a binary
classification of before versus after the close of trading hours (as opposed to a ternary
classification of before/during/after-hours). Thus, for our statistical tests we only require that
before versus after market close timing classification can be corroborated by at least two data
sources. Of the 124,005 observations with sufficient data for the statistical tests, 120,345 have
corroborated timing information. Although we cannot observe the actual error rate among these
dropped observations, a paper by Dong et al. (2011) finds that during 1999-2002, 87% of IBES
time stamps are late compared to the actual press release time, with the average delay being 105
minutes. Given that 34.6% of our sample firms report earnings immediately prior to market
opening, retaining these observations would likely classify many before-hours announcements as
being during-hours announcements.
4. Empirical Design and Results
All of the variables discussed below are defined in Appendix A. All continuous variables
are winsorized at 1% and 99%. Sample sizes vary across tests depending on data availability.
4.1. Analysis of Hypotheses 1 – Changes in Earnings Announcement Timing
The timing of each earnings announcement is identified along three dimensions. The first
is time of day, measured consistently based on U.S. Eastern Time. Regular U.S. trading hours are
identified as 9:30AM to 4:00PM. The second dimension is the day of the week. The third
dimension is how “busy” the earnings announcement day is. Consistent with Hirschleifer et al.
(2009), we proxy for how busy a reporting day is by taking the simple count of all earnings
!!
18
announcement per day on Compustat, sorted into deciles by calendar year. We label this variable
EAFREQ.11
Panel A of Figure 1 presents summary information on the intra-day distribution of
earnings announcements. 34.6% of announcements happen immediately before U.S. market
trading hours, while 45.4% happen immediately after trading hours. Just 7% of announcements
happen during trading hours. Panel B shows that these percentages change over time – the
proportion of firms announcing during trading hours decreases monotonically from 21.2% in
2000 to just 3.2% in 2011. Panel C shows considerable variation in the fraction of earnings
announcements that happen each weekday. The frequency of earnings announcements per day
increases monotonically from 14.4% on Mondays to 30.5% on Thursdays, followed by a sharp
decline to just 7.6% on Fridays.
Hypothesis H1a, H1b, and H1c predict that firms tend to announce their earnings at the
same time of day, same weekday, and similarly “busy” days each period. Panels A, B, and C of
Table 2 present quarter-over-quarter transition matrices of announcement times. Between any
two consecutive quarters: 15% of firms change their before/during/after trading hours timing;
52.8% of firms change their reporting weekday; and 80.5% change their EAFREQ decile. Panel
D of Table 2 presents frequencies of announcement timing changes within each fiscal year.
Within any given year: 25.6% of firms have at least one change in before/during/after market
timing; 81.6% of firms have at least one change in announcement weekday; and 98.8% of firms
have at least one change in EAFREQ decile. Untabulated analysis shows that, over the entire
!!!!!!!!!!!!!!!!!!!!!!!!!!!!!!!!!!!!!!!!!!!!!!!!!!!!!!!!!!!!!11 A concern is that managers are not able to predict busy earnings days ex ante, in which case it would be impossible to strategically time earnings news based on EAFREQ. In untabulated tests, we find that a regression of EAFREQ on binary variables for the weekday, calendar week, and calendar day explains about 90% of the variation in EAFREQ. Further, out-of-sample tests predict EAFREQ to within two deciles of the actual EAFREQ for 98.7% of observations. We interpret these results as being consistent with managers being able to predict busy versus slow earnings reporting days.
!!
19
sample period, 72.6% of our sample firms have at least one change in before/during/after hours
timing and nearly 100% of firms have at least one change in EAFREQ decile. Further, 51.4% of
firms have at least one Friday earnings announcement during our sample period, which is
unexpected given that only 7.6% of all earnings announcements happen on a Friday.
In summary, the results in Table 2 indicate that changes in earnings announcement timing
happen frequently, to the extent that one could conclude that strategic changes in the earnings
release pattern do not draw the attention of market participants (statistical tests linking changes
in announcement timing and attention are provided below). We interpret these data as being
inconsistent with the null in H1a, H1b, and H1c.
4.2. Analysis of Hypotheses 2 – Differences in Market Attention
H2 predicts that market participants exhibit predictable variation in attention. As
discussed in Da et al. (2011), despite significant academic interest in the concept of market
attention, it is a complicated and multifaceted construct that is difficult to empirically measure.
We define attention simply as a user taking notice of a piece of information, and we employ four
measures of market participants’ attention (collectively ATTN) to evaluate this difficult-to-
observe construct, each of which has been vetted in prior research (e.g., Barber and Odean 2008;
Da et al. 2011; Drake et al 2012a,b; Drake et al 2013; Zhang 2008).12 Our ATTN proxies have
several strengths. First, each of the four measures has the advantage of being focused on the user,
in that they measure the actions and/or choices of information users—if a user is taking action
with respect to an earnings release, we assume that he/she is paying attention to it. Second, each
measure is related to either the production of information (as in the case of news articles and
analyst revisions) or the acquisition of information (as in the case of 8-K downloads and Google
!!!!!!!!!!!!!!!!!!!!!!!!!!!!!!!!!!!!!!!!!!!!!!!!!!!!!!!!!!!!!12 We note that our four proxies are not necessarily intended to be independent of one another, but are rather four related proxies for the same underlying construct of market participants’ attention.

!!
20
searches), which allows us to speak to what information market participants pay attention to.
Third, these variables are measured on a timely basis, which makes them superior to other less
timely measures of attention, such as quarterly advertising expense (e.g., Chemmanur and Yan
2009). Fourth and finally, unlike measures such as stock returns or trading volume, our ATTN
variables do not rely assumptions of market equilibrium – an assumption that is debatable in tests
of behavioral biases such as limited attention.
In the following subsections, we first discuss each of our ATTN proxies for market before
discussing our empirical tests of H2a, H2b, and H2c. Sample sizes for each proxy vary based on
data availability.
4.2.1. Attention Proxy: News Articles
The first proxy for attention is the number of news articles written specifically about a
firm’s earnings announcement. Barber and Odean (2008) and Li et al. (2011) both find evidence
consistent with market activity being a function of news coverage. The underlying theory is that,
ceteris paribus, the number of published articles correlates with the breadth of earnings news
dissemination (i.e., fewer articles mean that fewer readers learn about the earnings news) as well
as the depth of news dissemination (i.e., even those market participants who learn about the
earnings news will acquire less information when fewer news articles are available). Our news
count measure, NEWSCOUNT, is the natural log of the number of earnings-specific news articles
that appear in the RavenPack database within the 24-hour period starting with the firm’s earnings
release. NEWSCOUNT is available for years 2000-2011.13,14
4.2.2. Attention Proxy: Analyst Updating Speed
!!!!!!!!!!!!!!!!!!!!!!!!!!!!!!!!!!!!!!!!!!!!!!!!!!!!!!!!!!!!!13 Firm-quarters with zero news coverage are eliminated from all statistical tests because, as discussed in Section 3, we use the publication time of first news story to help identify the time of the earnings release. 14 We also consider subtracting from NEWSCOUNT the average number of earnings-specific articles that appear over the previous 7 weeks, but the average is zero for nearly all firm-quarters. Untabulated analysis using such a measure of “abnormal” NEWSCOUNT produces qualitatively and quantitatively similar results.

!!
21
Our second proxy for market attention is the speed with which equity analysts impound
earnings news into their future forecasts, in the spirit of Zhang (2008). Analysts typically update
their future forecasts immediately after an earnings release to incorporate the most recent
financial results. Our intuition underlying this proxy is that greater analyst attention is associated
with faster forecast updates. During times when analysts are distracted, we assume that it will
take them longer to update their future forecasts.
We use the IBES detail file to collect data on all the analyst forecasts, j, that are updated
within 30 days of the firm’s earnings announcement. These data are available for all years in our
sample. We then calculate the number of weekdays between the earnings announcement and
forecast update. The inverse of the average of these lags measures how quickly analysts update
their forecasts following the earnings announcement, which is our proxy for analyst attention.
Specifically, our measure of analyst speed, ANALYST_SPD, is calculated as follows:15
!"!#$!"_!"# = −1 ∗ log !! 1+ !!""#$%&'!!"#$%!!"#$%&'(!!"#$%&! .!
!!! ! (1)
4.2.3. Attention Proxy: Edgar 8-K Downloads
The third measure of market attention is based on the number of 8-K downloads from
EDGAR. These data represent the activity of EDGAR users to acquire the 8-K, which is the
regulatory filing that accompanies an earnings press release and other significant events.16 We
measure investor EDGAR activity on earnings release days relative to that on other days. Thus,
!!!!!!!!!!!!!!!!!!!!!!!!!!!!!!!!!!!!!!!!!!!!!!!!!!!!!!!!!!!!!15 As ANALYST_SPD is based on daily data, this metric is potentially biased upwards for earnings announcements that occur after market hours relative to those that occur before or during market hours. We adjust for this bias by subtracting 1/3rd of a day (8 hours) from ANALYST_SPD for all after-hours earnings announcements. 8 hours seems to be a reasonable adjustment as the vast majority of earnings announcements happen either just before or just after market hours, or roughly 8 hours apart. Results using no adjustment or a 12-hour adjustment produce similar results. 16 For brevity, we refer the reader to Drake et al. (2013) for a detailed description of the data, including the sample criteria, sample period and analyses on the timing and common determinants of user acquisition of EDGAR data.

!!
22
this measure is a proxy for attention to firm-specific earnings news. We compute abnormal
EDGAR downloads as follows:
!"#$% = log !"#$%!!!!! −! log !
! !"#$%!!!!!!!!!!!
!!!! (2)
The first term is the natural log of the sum of EDGAR 8-K downloads for two days around the
earnings announcement (days 0, 1), while the second term is the natural log of the trailing
average EDGAR 8-K downloads for the same two weekdays over the preceding seven weeks.
EDGAR data are available for the period 2008-2011.
4.2.4. Attention Proxy: Google Search Volume
Our final measure of market attention is Google search volume that occurs around the
earnings announcement for a given firm’s stock ticker, following Da et al. (2011) and Drake et
al. (2012). The intuition underlying this proxy is that as a market participant searches the internet
for firm-specific information, they are paying attention to the stock. Data on weekly Google
search volume for firms’ stock tickers is obtained from Google Trends, following the
methodology in Drake et al. (2012). Google Trends reports a normalized measure of the number
of searches for a given search term in the Google search engine. We calculate abnormal Google
search volume as follows:
!""!#$%& = log !! !"#$!!
!!! − log !! !"#$!!!
!!!! (3)
where w is the week of the earnings announcement.17 We use a two-week event period as data
are on a weekly basis and using a one-week period would not capture any post-announcement
attention from Friday announcers (e.g., if earnings announcement attention to a Friday
!!!!!!!!!!!!!!!!!!!!!!!!!!!!!!!!!!!!!!!!!!!!!!!!!!!!!!!!!!!!!17 For brevity, we refer readers to Drake et al. (2012) for a detailed description the Google Trends index. Note that we follow Da et al. (2011) in using weekly Google search data in order to maximize the sample size.

!!
23
announcement extends through the following Monday, a one-week event window would ignore
the Monday attention). Google search data are available for the years 2004 – 2010.
4.2.5. Tests of H2
Panel A of Table 3 provides summary statistics for our ATTN proxies. Panel B shows
statistically significant but qualitatively low correlations between our ATTN variables. The low
correlations are similar to those found by Da et al. (2011) and are likely due to the proxies
capturing different aspects of market attention. NEWSCOUNT likely most directly correlates
with media attention. ANALYST_SPD is likely a direct measure of analyst attention, and Da et al.
(2011) find that GOOGHITS is likely most directly related to retail investor attention. EDGAR
likely captures earnings-related attention from multiple types of market participants. 18
4.2.5.1 Regression Tests of H2
To empirically test for predictable differences in market participants’ attention, we
employ regression analysis that allows us to simultaneously consider all three earnings
announcement timing choices, AFTER, FRIDAY, and EAFREQ:19
ATTN = β0 + β1AFTER + β2 FRIDAY + β3EAFREQ +ΣβkCONTROLS + ΣβkYEAR +
ΣβkFIRM + ε. (4)
AFTER is a binary variable equal to one for earnings announcements from 4pm to midnight; all
other times are coded as zero. FRIDAY is a binary variable equal to one for earnings
announcements on Friday. As discussed above, EAFREQ is the decile of the number of market-
!!!!!!!!!!!!!!!!!!!!!!!!!!!!!!!!!!!!!!!!!!!!!!!!!!!!!!!!!!!!!18 Our tests are agnostic as to whether variation in attention can alter stock prices responses (i.e., ERCs). Still, untabulated analysis we estimate a standard ERC model of two-day abnormal returns regressed on ranked unexpected earnings and an interaction between unexpected earnings and ATTN, along with typical control variables. We find that all four ATTN interaction variables are significantly positive, which is consistent with higher ATTN leading to larger ERCs. 19 In untabulated analysis we perform separate, univariate tests of within-firm changes in ATTN between quarters when there is a change AFTER, FRIDAY, or EAFREQ. Results are generally consistent with the regression results discussed herein.

!!
24
wide earnings announcements that happen on day t. β1, β2, and β3 < 0 would be consistent with
attention being lower after hours, on Fridays, and on busy reporting days, respectively. These
negative coefficients would be simultaneously consistent with attention being higher before
market close, on Mondays through Thursdays, and on slow reporting days.20
Firm fixed effects (FIRM) control for stationary firm characteristics and restrict the
analysis to within-firm variation in ATTN. Annual fixed effects (YEAR) control for common
macroeconomic trends. Several control variables (CONTROLS) are included to capture non-
stationary firm characteristics that likely correlate with market attention. We include the log of
market value of equity (SIZE), leverage (LEV), market-to-book (BTM), and log of the number of
analyst following the firm (NUMEST). We include an indicator for the fourth fiscal quarter
(FQ4), as it is plausible that attention differs for year-end earnings announcements. Since firms
that report quickly after quarter-end may attract different attention than late reporters, we control
for the log of the number of days between the quarter-end and earnings announcement date
(REPLAG). We also include the REPLAG quadratic, REPLAG_SQ, to be consistent with prior
literature and because the relation between REPLAG and ATTN likely varies depending on the
length of the reporting lag.
We also include several controls for the sign and magnitude of the earnings news.
Unexpected earnings (UE), calculated as actual EPS less analyst forecast, scaled by end-of-
quarter price, and two-day abnormal returns (CAR), calculated as the firm’s cumulative raw
return less the cumulative value-weighted market return from CRSP, are included to capture the
amount of information conveyed in the earnings announcement. As negative news may evoke
different attention than positive news, we also include binary variables for negative unexpected
earnings (UE_NEG) and returns (CAR_NEG), and interactions of these binary variables with UE !!!!!!!!!!!!!!!!!!!!!!!!!!!!!!!!!!!!!!!!!!!!!!!!!!!!!!!!!!!!!20 Untabulated tests using a changes form of equation (4) produces results are consistent with those discussed below.

!!
25
and CAR, respectively (UE_NEG_INT and CAR_NEG_INT). Standard errors are clustered by
earnings announcement date to correct for cross-sectionally correlated residuals.21
We present results for estimating equation (4) in Table 4, with each of the four columns
representing the results using one of the four attention measures as dependent variables. Column
1, in which NEWSCOUNT is the dependent variable, shows that the coefficients on EAFREQ and
AFTER are negative and significant, and that the coefficient on FRIDAY is insignificant. The
coefficient of -0.073 on AFTER indicates that, ceteris paribus, there are 7.3% fewer articles
written about earnings news that are reported after trading hours relative to before or during
trading hours. The coefficient of -0.012 on EAFREQ indicates that a one decile increase in
EAFREQ is associated with 1.2% fewer news articles written about earnings or, equivalently, a
move from the slowest to busiest decile of days is associated with a (1.2% x 10 =) 12% decrease
in news articles. The results for ANALYST_SPD in column 2 are highly consistent with the
NEWSCOUNT results. The results for EDGAR are presented in the third column—the negative
coefficients on AFTER and EAFREQ are again consistent with lower attention after hours and on
busy days, while the positive coefficient on FRIDAY is consistent with relatively higher attention
on Fridays. Finally, for GOOGHITS (column 4), the coefficients on AFTER and FRIDAY are
insignificant, while that on EAFREQ is significantly negative.
In sum, the four ATTN proxies produce similar results. The regressions generally indicate
that market participant attention is lower (higher) after hours and on busy reporting days (before
market close and on slow days), meaning that we can reject the predictions of no differences as
in H2a and H2c. However, the results for H2b show that FRIDAY is either not associated with
attention or is positively associated with attention. !!!!!!!!!!!!!!!!!!!!!!!!!!!!!!!!!!!!!!!!!!!!!!!!!!!!!!!!!!!!!21 Clustering by both date and firm produces substantially unchanged results, which is consistent with our implicit assumption that the residuals in estimating equation (4) are not serially correlated (i.e., any serial correlation is largely unchanging over our sample period and, thus, effectively removed via the firm fixed effects).

!!
26
4.2.5.2 Changes in Earnings Announcement Timing and Changes in Attention
As discussed above, the intuition underlying H1 is that the act of switching earnings
announcement timing must not raise concerns and result in higher attention. In this section, we
augment the previous regression model to examine whether changes in earnings announcement
timing (H1) are associated with differential attention (H2):
ATTN = β0 + β1AFTER + β2ΔAFTER + β3 FRIDAY + β4Δ FRIDAY + β5EAFREQ +
β6ΔEAFREQ +ΣβkCONTROLS + ΣβkYEAR + ΣβkFIRM + ε. (5)
If attention is lower after hours, on Fridays, and on busy days, we still expect the coefficients on
AFTER, FRIDAY, and EAFREQ to be negative. Negative coefficients are also consistent with
attention being higher before market close, on Monday – Thursday, and on slower reporting
days. The bolded coefficients on β2, β4, and β6 are new from equation (4) and capture the
incremental difference in ATTN for firms that switch their timing as opposed to those who keep
their timing the same as in the previous quarter. We focus on the sum of coefficients on the
earnings announcement timing variables (e.g. β1 + β2) in each regression to capture whether
overall attention is lower during the predicted times. For example, (β1 + β2) < 0 indicates that
firms that switch to after hours still obtain less attention than if they reported before hours, even
if β2 > 0 unto itself.
We present results for estimating equation (5) in Table 5. The coefficients on control
variables and fixed effects are untabulated for brevity. Column 1, in which NEWSCOUNT is the
dependent variable, shows that the coefficient on AFTER is still significantly negative, which
(like the results in Table 4) is consistent with reduced attention for after-hours announcements.
More to the point in linking H1 and H2, the coefficient sum of AFTER + ΔAFTER is
significantly negative, which is consistent with the notion that even those firms that switch into

!!
27
after-hours timing receive less attention than if they had reported earlier in the day. Said
differently, the results indicate that the act of switching does not generate excess attention that
offsets the lower attention firms otherwise receive when reporting after hours. Similarly, the
coefficient sum of EAFREQ and ΔEAFREQ is negative and significant, indicating that firms
switching to busier earnings announcement days attract less attention than if they had reported on
a slow day. The coefficients on individual and summed coefficients for FRIDAY and ΔFRIDAY
are insignificant, suggesting that firms switching to Fridays receive no differential attention than
if they had reported other days of the week. The results for ANALYST_SPD, EDGAR, and
GOOGHITS in columns 2 through 4 are largely the same as those for NEWSCOUNT. Again, the
overall results are consistent with attention being lower after hours and on busy days, both for
switching firms and non-switching firms. However, Friday announcers receive no different or
even higher attention, depending on the model specification.
4.3. Analysis of H3 – Strategic Timing of Earnings News
H3 posits that managers will strategically time the release of earnings news in an attempt
to hide bad news or highlight good news. We use unexpected earnings (UE) to proxy for good
versus bad news, as defined above.22 As shown in Panel A of Table 6, average UE is -0.001, or -
0.1% of price. Our theory suggests that earnings announcement TIMING choices (i.e., AFTER,
FRIDAY, and EAFREQ) are a function of UE and, therefore, a logical test would be to regress
each of AFTER, FRIDAY, and EAFREQ on UE, with controls. A concern with such analysis is
that the choices of AFTER, FRIDAY, and EAFREQ are not done in isolation from one another, as
would be implied by estimating separate models. Managers can choose these timing variables
!!!!!!!!!!!!!!!!!!!!!!!!!!!!!!!!!!!!!!!!!!!!!!!!!!!!!!!!!!!!!22 Results are substantially unchanged if an unscaled version of UE is used. Results are also similar if a dichotomous measure of meeting/beating analyst forecast is used. We report only results for scaled UE due to space considerations. We do not use abnormal returns as a measure of good versus bad news because returns are potentially endogenous to earnings announcement timing.

!!
28
simultaneously; for example, by releasing bad news after hours and on a busy day. In order to
consider these timing choices simultaneously, our tests of H3 involve OLS “reverse regressions”
in which UE or ΔUE is the dependent variable and AFTER, FRIDAY, and EAFREQ (or the
change versions thereof) are included as independent variables, as follows:23
UE = β0 + β1AFTER + β2 FRIDAY + β3EAFREQ +ΣβkCONTROLS + ΣβkYEAR +
ΣβkFIRM + ε, (7)
where UE, AFTER, FRIDAY and EAFREQ are as defined above. The regressors are not
demeaned because firm fixed effects (FIRM) are included. Standard errors are again clustered by
date.24
We also estimate a changes version of equation (7) to link H1 and H3, i.e., that changes
in earnings announcement timing, as predicted in H1, are associated with changes in earnings
news, as predicted in H3. The changes specification is the same as the levels specification in
equation (7) except that: (i) firm fixed effects are excluded because stationary firm
characteristics are eliminated in the first-differenced variables; and (ii) standard errors are now
clustered by both date and firm because, if the idiosyncratic errors from a levels model are
serially uncorrelated, then first-differencing will induce serially correlated residuals (see
Wooldridge 2002, page 283).
We report the results of estimating equation (7) in Panel B of Table 6. The first (second)
column reports the results using a levels (changes) form. We find that, across both the levels and
changes specifications, the coefficients on AFTER, FRIDAY and EAFREQ are significantly
negative. As compared to the unconditional average UE of -0.001 (from Panel A), the negative !!!!!!!!!!!!!!!!!!!!!!!!!!!!!!!!!!!!!!!!!!!!!!!!!!!!!!!!!!!!!23 Untabulated logistic regression with TIMING as the dependent variable and UE as the independent variable produce results that are consistent with the “reverse regressions” tabulated and discussed herein. Untabulated univariate tests of within-firm changes in UE between quarters when there is a change AFTER, FRIDAY, or EAFREQ also produce consistent results. 24 A specification of the levels model with standard errors clustered by both date and firm produce similar results.
!!
29
AFTER coefficient of -0.0007 in column 1 of Panel C indicates that UE tend to be (-0.0007/-
0.001 =) 70% worse after hours than earlier in the day. The negative FRIDAY coefficient of -
0.0019 indicates that UE tend to be (-0.0019/-0.001 =) 190% worse on Fridays, and the negative
EAFREQ coefficient of -0.0001 indicates that UE decrease by (-0.0001/-0.001 =) 10% for each
one-decile increase in EAFREQ.
The negative results for AFTER and EAFREQ are consistent with condition 3 – that
earnings news tends to be worse during periods of lower market attention. The negative signs on
FRIDAY, indicating that worse news is reported on Fridays, are somewhat unexpected since we
found the attention to be no different or even higher on Friday than Monday through Thursday.
A likely explanation for this finding is that managers perceive attention to be lower on Fridays,
but in fact, investors exhibit no lower attention on Fridays than other days of the week. In
summary, we believe that our finding that attention is higher on Fridays, even though earnings
news is more negative on Fridays is an important contribution of the study as it suggests that
managers’ ex ante perceptions of when investors pay attention can be different than ex post
realizations.
4.4 Highlighting Good News – Further Analysis
In this section, we more directly test the idea that managers highlight good news. The test
follows the changes form of equation (7), in which ΔUE is regressed on changes in earnings
announcement timing (ΔAFTER, ΔFRIDAY, ΔEAFREQ), except that in this test, we separately
identify the timing changes to hide bad news (i.e., going from periods of perceived high attention
to periods of perceived low attention) from the timing changes to highlight good news (i.e.,
going from periods of perceived low attention to periods of perceived high attention).
Specifically, we create binary variables, ΔTIMING_HIDE, that are equal to one when the firm
!!
30
switches to after hours from before hours, to Friday from Monday – Thursday, or to a busier day
from a slower day. Similar, we create binary variables, ΔTIMING_HIGHLIGHT, that are equal
to one when the firm switches from after to before hours, from Friday to Monday – Thursday, or
from busier to slower days. We expect that the coefficients on ΔTIMING_HIDE to be negative if
managers switch from perceived high to low attention to hide bad news. We expect the
coefficients on ΔTIMING_HIGHLIGHT to be positive if managers switch from perceived low to
high attention to highlight good news.
Evidence in Table 7 is consistent with highlighting good news, as well as with hiding bad
earnings news. Specifically, the coefficients on the earnings announcement timing changes
coefficients that reflect going from periods of low attention to periods of high attention
(ΔAFTER_HIGHLIGHT, ΔFRIDAY_HIGHLIGHT, and ΔEAFREQ_HIGHLIGHT) are positive
and significant, consistent with moving earnings announcement timing in an attempt to highlight
good news. Moreover, the coefficients on the earnings announcement timing change coefficients
that reflect going from periods of high attention to periods of low attention (ΔAFTER_HIDE,
ΔFRIDAY_HIDE, and ΔEAFREQ_HIDE) are negative, consistent with attempting to hide bad
news. This evidence is the first in the literature to separate out the idea that managers highlight
good news.
5. Conclusion
In summary, we posit and test three conditions that are necessary to support the theory
that managers strategically time earnings releases to hide bad news or highlight good news: (i)
managers must change their earnings announcement timing frequently enough that to do so
would not immediately attract unwanted attention; (ii) there must be ex-ante predictable variation

!!
31
in market participants’ attention; and (iii) earnings news must be worse (better) during periods of
expected lower (higher) market attention.
There has been little empirical evidence on the frequency of earnings announcement
timing changes to date, and we find that firms indeed change the timing of their earnings releases
to a degree such that a change itself is likely not anomalous. Firms change their earnings release
patterns in numerous ways: between days of the week, before and after hours, and on busy versus
slow reporting days. We also find evidence of a stark decline in the tendency to release earnings
during trading hours over the last decade—21.2% of earnings announcements happened during
trading hours in 2000 while just 3.3% happened during trading hours in 2011. Overall, these
findings support condition (i).
With regards to condition (ii), prior literature has inferred that market attention is lower
after hours and on busy days based on muted market responses, but no previous literature has
directly tested market attention. Using state-of-the-art measures of market participant attention,
we find evidence to both support and contradict prior research in that we find attention to be
lower on busy days but no different on Fridays. We also provide new evidence that is consistent
with market attention being lower after hours. Linking condition (ii) with condition (i), we find
that the act of switching timing does not materially alter market attention unto itself.
With regards to condition (iii), we provide new evidence that earnings news tends to be
worse (better) during periods of expected low (high) attention. Prior research has produced
mixed results on this question, perhaps because sample sizes were small and earnings
announcement times contained error. We augment this debate with evidence based on a novel
dataset of earnings release timing that is validated using multiple data sources. The evidence
suggests that earnings news is more negative after trading hours, during busy days, and on
!!
32
Fridays. Further, prior research has not explicitly examined the question of whether managers
attempt to highlight good news by releasing it during periods of higher attention. We find novel
evidence to support this notion.
Collectively, our results shine new light on the long-standing question: do managers
“hide” bad earnings news by announcing during periods of low market attention? And similarly,
do managers “highlight” good news by announcing during periods of higher market attention? In
short, our evidence is consistent with managers taking advantage of low (high) attention after
hours and on busy days (before close of trading and on slower days) to release unfavorable
(favorable) earnings news. However, given that attention is the same or higher on Fridays than
other days, it is unlikely that managers are able to effectively hide bad news by reporting
immediately prior to the weekend. Instead, the preponderance of bad news on Fridays is possibly
due to managers incorrectly perceiving attention as lower on Friday.

!!
33
References Bagnoli, M., W. Kross, and S. G. Watts. 2002. The information in management's expected earnings report
date: A day late, a penny short. Journal of Accounting Research 40 (5):1275-1296. Barber, B. M., and T. Odean. 2008. All that glitters: The effect of attention and news on the buying behavior
of individual and institutional investors. Review of Financial Studies 21 (2):785-818. Barclay, M. J., and T. Hendershott. 2003. Price discovery and trading after hours. Review of Financial
Studies 16 (4):1041-1073. Begley, J., and P. E. Fischer. 1998. Is there information in an earnings announcement delay? Review of
Accounting Studies 3 (4):347-363. Chakravarthy, J. S., E. deHaan, and S. Rajgopal. 2013. Reputation repair after a serious restatement. The
Accounting Review, forthcoming. Chambers, A. E., and S. H. Penman. 1984. Timeliness of reporting and the stock price reaction to earnings
announcements. Journal of Accounting Research 22 (1):21-47. Chemmanur, T., and A. Yan. 2009. Advertising, attention, and stock returns. SSRN eLibrary. Da, Z., J. Engelberg, and P. Gao. 2011. In search of attention. The Journal of Finance 66 (5):1461-1499. Damodaran, A. 1989. The weekend effect in information releases: A study of earnings and dividend
announcements. Review of Financial Studies 2 (4):607-623. deHaan, E., F. Hodge, and T. Shevlin. 2013. Does voluntary adoption of a clawback provision improve
financial reporting quality? Contemporary Accounting Research 30(3): 1027-1062. DellaVigna, S., and J. M. Pollet. 2009. Investor inattention and friday earnings announcements. The Journal
of Finance 64 (2):709-749. Donelson, D. C., J. McInnis, R. D. Mergenthaler, and Y. Yu. 2012. The timeliness of bad earnings news and
litigation risk. The Accounting Review. Dong, B., E. Li, K. Ramesh, and M. Shen. 2011. The effects of regulation FD on informal and
institutionalized leakages of information in earnings press releases. SSRN eLibrary. Doyle, J. T., and M. J. Magilke. 2009. The timing of earnings announcements: An examination of the
strategic disclosure hypothesis. The Accounting Review 84 (1):157-182. Drake, M., N. Guest, and B. Twedt. The media and mispricing: the role of the business press in the pricing of
accounting information. Working paper, Brigham Young University. Drake, M., J. Jennings, D. Roulstone, and J. Thornock. 2012a. The mechanisms of information transfer.
Available at SSRN 2157727. Drake, M. , D. Roulstone, and J. Thornock. 2012b. Investor information demand: Evidence from google
searches around earnings announcements. Journal of Accounting Research 50 (4):1001-1040. Drake, M, D. Roulstone, and J. Thornock. 2013. The determinants and consequences of information
acquisition via EDGAR. Working paper, Brigham Young University.
Duarte-Silva, Tiago, Fu, Huijing, Noe, Christopher F, & Ramesh, K. (2013). How Do Investors Interpret Announcements of Earnings Delays? Journal of Applied Corporate Finance, 25(1), 64-71.
Engelberg, Joseph E, & Parsons, Christopher A. (2011). The causal impact of media in financial markets. The Journal of Finance, 66(1), 67-97.
Farrell, K. A., and D. A. Whidbee. 2002. Monitoring by the financial press and forced ceo turnover. Journal of Banking & Finance 26 (12):2249-2276.
Graham, J. R., C. R. Harvey, and S. Rajgopal. 2005. The economic implications of corporate financial reporting. Journal of Accounting and Economics 40 (1-3):3-73.
!!
34
Hirshleifer, D., S. S. Lim, and S. H. Teoh. 2009. Driven to distraction: Extraneous events and underreaction to earnings news. The Journal of Finance 64 (5):2289-2325.
Huberman, G., and T. Regev. 2001. Contagious speculation and a cure for cancer: A nonevent that made stock prices soar. The Journal of Finance 56 (1):387-396.
Kothari, S. 2001. Capital markets research in accounting. Journal of Accounting and Economics 31 (1-3):105-231.
Kross, W. 1981. Earnings and announcement time lags. Journal of Business Research 9 (3):267-281. Kross, W., and D. A. Schroeder. 1984. An empirical investigation of the effect of quarterly earnings
announcement timing on stock returns. Journal of Accounting Research 22 (1):153-176. Li, E. X., K. Ramesh, and M. Shen. 2011. The role of newswires in screening and disseminating value-
relevant information in periodic sec reports. The Accounting Review 86:669. Lipe, R.C., Bryant, L., & Widener, S.K. (1998). Do nonlinearity, firm-specific coefficients, and losses
represent distinct factors in the relation between stock returns and accounting earnings? Journal of Accounting and Economics, 25(2), 195-214.
Lim, S. S., and S. H. Teoh. 2010. Limited attention. In Behavioral finance: Investors, corporations, and markets: John Wiley.
Melessa, S. 2012. Monthly employment reports and the pricing of firm-level news. Working Paper, University of Iowa.
Patell, J. M., and M. A. Wolfson. 1982. Good news, bad news, and the intraday timing of corporate disclosures. The Accounting Review:509-527.
Skinner, D. J. 1994. Why firms voluntarily disclose bad news. Journal of Accounting Research 32 (1):38-60. Skinner, D. J. 1997. Earnings disclosures and stockholder lawsuits. Journal of Accounting and Economics 23
(3):249-282. Wooldridge, J. M. 2002. Econometric analysis of cross section and panel data. Cambridge: The MIT Press Zhang, Y. 2008. Analyst responsiveness and the post-earnings-announcement drift. Journal of Accounting
and Economics 46 (1):201-215.

!!
35
Appendix A: Variable Definitions
Accounting, returns, and analyst data are from Compustat, CRSP, and IBES, respectively. All other data are from the sources identified in the paper. All continuous variables are winsorized at 1% and 99%.
Variable Definition ‘Δ’ prefix Indicates change from the prior quarter. AFTER Indicator for earnings announcements after 4PM. ANALYST_SPD The inverse of the logged average number of days it takes analysts to update their future forecasts
following the earnings announcements. See Section 4.2.2 for further discussion. ATTN The set of proxies for attention: NEWSCOUNT, ANALYST_SPD, EDGAR, GOOGHITS. BTM Book to market, calculated as total common stockholders’ equity divided by market value of equity. CAR Two-day cumulative abnormal returns around the earnings announcement date. Days (0, +1) for
earnings released prior to the ending of regular trading. Days (+1, +2) for earnings released after regular trading hours. The market adjustment is based on the value-weighted return per CRSP.
CAR_NEG Indicator for CAR < 0. CAR_NEG_INT Interaction of CAR * CAR_NEG. CONTROLS Indicates the set of control variables included in the model. EAFREQ The decile rank of the frequency of earnings announcements per day, calculated across all of
Compustat. Deciles are formed by calendar year. EDGAR Abnormal EDGAR 8-K downloads over the two-day period around the earnings announcement
(days 0,1). See Section 4.2.3 for further discussion. FIRM The set of firm fixed effects. FQ4 Indicator variable for firms’ fourth fiscal quarter. FRIDAY Indicator for earnings announcements on Friday. GOOGHITS Abnormal Google search volume in the two weeks surrounding the earnings announcement (weeks
0,1). See Section 4.2.4.for further discussion. LEV Leverage, calculated as total debt over total assets. LOSS Indicator for firms with negative earnings, as reported by IBES. NEWSCOUNT The log of the number of earnings-specific news articles from RavenPack falling within a 24-hour
period starting with the earnings announcement. See Section 4.2.1 for further discussion. NUMEST The natural log of the number of analysts contributing to the most recent analyst forecast consensus
available in IBES prior to the earnings announcement. REPLAG The log of the number of days between fiscal period-end and the earnings announcement date. REPLAG_SQ REPLAG squared. SIZE The natural log of market value of equity at the end of the period. TIMING The set of earnings release time categories: AFTER, FRIDAY, EAFREQ. UE Unexpected earnings, calculated as actual quarterly EPS per IBES less the most recent analyst
forecast consensus per IBES, scaled by period-end stock price per Compustat. Consensus forecasts released more than 100 days before the earnings announcement are eliminated.
UE_DEC Decile rank of UE, calculated by year. UE_NEG Indicator for UE < 0 UE_NEG_INT Interaction of UE * UE_NEG YEAR The set of calendar year fixed effects. ΔAFTER_HIDE Indicator if the earnings release time switches from before to after hours. ΔAFTER_HIGHLIGHT Indicator if the earnings release time switches from after to before hours. ΔEAFREQ_HIDE Indicator if the earnings release time increases by more than two deciles in EAFREQ. ΔEAFREQ_HIGHLIGHT Indicator if the earnings release time decreases by more than two deciles in EAFREQ. ΔFRIDAY_HIDE Indicator if the earnings release time switches from Monday – Thursday to Friday. ΔFRIDAY_HIGHLIGHT Indicator if the earnings release time switches from Friday to Monday – Thursday.

!!
36
Figure 1: Sample Summary Information – Earnings Announcements Times and Days In this figure, we graphically present information on the timing of earnings announcements in our sample. See Table 1 for information on the sample construction. In Panel A, we present the percentage of announcements that occur throughout the day. All times are localized to the US East Coast. Panel B presents the sample period time trend in earnings announcement timing. We classify earnings announcements from midnight to 9:30am as occurring before trading hours, those occurring from 9:30am – 4pm as during trading hours, and those occurring from 4pm – midnight as after trading hours. Panel C presents the percentage of earnings announcements by day of week. Panel A: Earnings Announcements Throughout the Day Because the sample used in Panel A characterizes earnings announcement times along a finer partition than before/during/after-hours, we further require that the observations have a time stamp that is corroborated by at least two sources to within five minutes of one another. This additional requirement reduces the sample to 118,351 observations.
0.0%!
5.0%!
10.0%!
15.0%!
20.0%!
25.0%!
30.0%!
35.0%!
40.0%!
45.0%!
50.0%!
before!5:00am!
5:00am!2!7:00am!
7:00am!2!9:30am!
9:30am!2!11:30am!
11:30am!2!1pm!
1pm!2!2:30pm!
2:30pm!2!4pm!
4pm!2!6:30pm!
6:30pm!2!8:30pm!
8:30pm!2!12am!
Earnings(Releases(

!!
37
Panel B: Before/During/After Hours Announcements by Year
Panel C: Earnings Announcements By Weekday
!
0.0%!
10.0%!
20.0%!
30.0%!
40.0%!
50.0%!
60.0%!
2000!2001!2002!2003!2004!2005!2006!2007!2008!2009!2010!2011!
Before!Hours!
During!Hours!
AAer!Hours!
0.0%!
5.0%!
10.0%!
15.0%!
20.0%!
25.0%!
30.0%!
35.0%!
Monday! Tuesday! Wednesday!! Thursday! Friday!
Earnings(Releases(

!!
38
!
Table 1: Sample Refinement The initial sample consists of all U.S. public companies’ quarterly observations from 2000 – 2011, as available on Compustat and CRSP. U.S. public companies are identified via CRSP variable “shrcd” of 10 or 11.
Complete Sample – for descriptive analysis
Firm-quarters for U.S. public companies with earnings announcement date from 2000 - 2011 233,827
Less: observations with no IBES data (19,166)
Less: observations with different earnings announcement dates in Compustat and IBES (22,106)
Less: observations with a Saturday or Sunday announcement Date (70)
Observations with a corroborated earnings announcement date 192,485
Time of Day Subsample – for descriptive analysis
Less: observations without at least two earnings announcement time data points
(24,945)
Less: observations without a before/during/after timing corroborated by two sources (16,945)
Observations with a corroborated before/during/after timing classification
151,106
Complete Sample – for statistical tests
Less: observations with missing regression control variables (47,151)
Less: observations with abs(UE) > 1; price < $1; or reporting lag > 90 days (3,652)
Less: observations without news coverage data (17,677)
Observations for statistical tests by earnings announcement date 124,005
Time of Day Subsample – for statistical tests
Less: observations without at least two earnings announcement time data points (590)
Less: observations without before vs after market close timing corroborated by two sources (3,070)
Observations with a corroborated before/during/after timing classification
120,345

!!
39
Table 2: Frequency of Changes in Earnings Announcement Timing (H1) This table presents analyses on changes in earnings announcement timing along three dimensions: time of day, weekday, and busy earnings days. In Panel A, we present the quarter-over-quarter transition matrix of earnings announcement times during the day. In Panel B, we present the quarter-over-quarter transition matrix of the earnings announcement dates by weekday. In Panel C, we present the quarter-over-quarter transition matrix of the earnings announcement dates by earnings report day busyness (EAFREQ). In Panel D, we present the frequency of announcement timing changes within each fiscal year. The rightmost column represents the cumulative percentage of firms that change their earnings announcement timing at least once during a given year.
Panel A: Transition Matrix of Before/During/After Trading Hours Announcement Times
Previous Quarter
Current Quarter Percent Before
Hours Percent During
Hours Percent After
Hours Total Percent Before Hours 36.7 1.5 4.0 42.3 Percent During Hours 1.2 5.4 2.1 8.7 Percent After Hours 4.0 2.2 42.9 49.0
Total 42.0 9.1 48.9 100.0
Sum of shaded = percent that change in any given quarter = 15.0%
Panel B: Transition Matrix of Announcement Weekdays
Previous Quarter
Current Quarter Monday Tuesday Wednesday Thursday Friday Total Monday 5.6 2.7 2.3 2.5 1.3 14.3 Tuesday 2.9 10.4 4.1 4.6 1.1 23.1 Wednesday 2.2 4.5 11.8 4.8 1.0 24.4 Thursday 2.4 4.6 5.1 16.9 1.6 30.7 Friday 1.1 1.1 1.1 1.8 2.5 7.6
Total 14.3 23.2 24.4 30.7 7.5 100.0
Sum of shaded = percent that change in any given quarter = 52.8

!!
40
Panel C: Transition Matrix of Announcement Timings by EAFREQ Decile
EAFREQ - Previous Quarter EAFREQ - Current Quarter 1 2 3 4 5 6 7 8 9 10 Total
1 4.36 1.92 0.88 0.60 0.54 0.38 0.33 0.34 0.30 0.43 10.1 2 1.75 2.17 1.41 0.82 0.88 0.77 0.67 0.54 0.55 0.64 10.2 3 0.89 1.22 1.31 1.20 0.89 1.10 0.99 0.79 0.75 0.68 9.8 4 0.56 0.88 0.98 1.22 1.35 1.13 1.15 0.93 0.98 0.70 9.9 5 0.59 0.91 1.01 1.20 1.50 1.49 1.12 0.85 0.87 0.73 10.3 6 0.39 0.66 0.95 0.99 1.28 1.59 1.55 0.97 0.84 0.59 9.8 7 0.38 0.75 1.12 1.28 1.08 1.12 1.69 1.69 0.95 0.62 10.7 8 0.35 0.60 0.96 1.17 0.94 0.83 1.20 1.52 1.55 0.66 9.8 9 0.33 0.62 0.87 0.98 1.03 1.00 1.15 1.15 1.69 1.51 10.3
10 0.47 0.64 0.71 0.65 0.77 0.58 0.80 0.75 1.31 2.47 9.2
Total 10.1 10.4 10.2 10.1 10.3 10.0 10.7 9.5 9.8 9.0 100.0
Sum of shaded = percent that change in any given quarter = 80.5 Panel D: Percentage of Announcement Changes Within each Fiscal Year
Number of Changes
Type of Change 0 1 2 3 4 Sum(1-4) Time of day 74.4 11.7 10.2 3.0 0.8 25.6 Day of week 18.4 14.5 28.4 24.8 13.9 81.6 EAFREQ decile 1.2 2.4 16.1 34.7 45.6 98.8

!!
41
Table 3: Summary Statistics for Attention Proxies (ATTN) NEWSCOUNT is the log of the number of earnings-specific news articles within a 24-hour period starting with the earnings announcement. ANALYST_SPD is the inverse of the logged average number of days it takes analysts to update their future forecasts following the earnings announcements. EDGAR is the abnormal EDGAR 8-K downloads over the two-day period around the earnings announcement (days 0,1). GOOGHITS is abnormal Google search volume in the two weeks surrounding the earnings announcement (weeks 0,1). Higher values of NEWSCOUNT, ANALYST_SPD, EDGAR, and GOOGHITS are consistent with greater attention. *** Indicates significance at 1%; ** at 5%; and * at 10%, two-tailed. Panel A: ATTN Summary Statistics
N Mean P25 Median P75 Std. Dev.
NEWSCOUNT 124,005 1.295 0.693 1.386 1.792 0.653
ANALYST_SPD 118,386 -0.967 -1.3 -0.849 -0.513 0.555
EDGAR 39,257 1.453 0.898 1.431 1.993 0.876
GOOGHITS 40,498 0.012 -0.050 0.005 0.065 0.122 Panel B: ATTN Pearson (Spearman) Correlation Coefficients Above (Below) the diagonal
NEWSCOUNT ANALYST_SPD EDGAR GOOGHITS NEWSCOUNT 0.110*** 0.001 0.068*** ANALYST_SPD 0.069*** 0.074*** 0.013** EDGAR 0.002 0.082*** 0.025*** GOOGHITS 0.061*** 0.008 0.032***
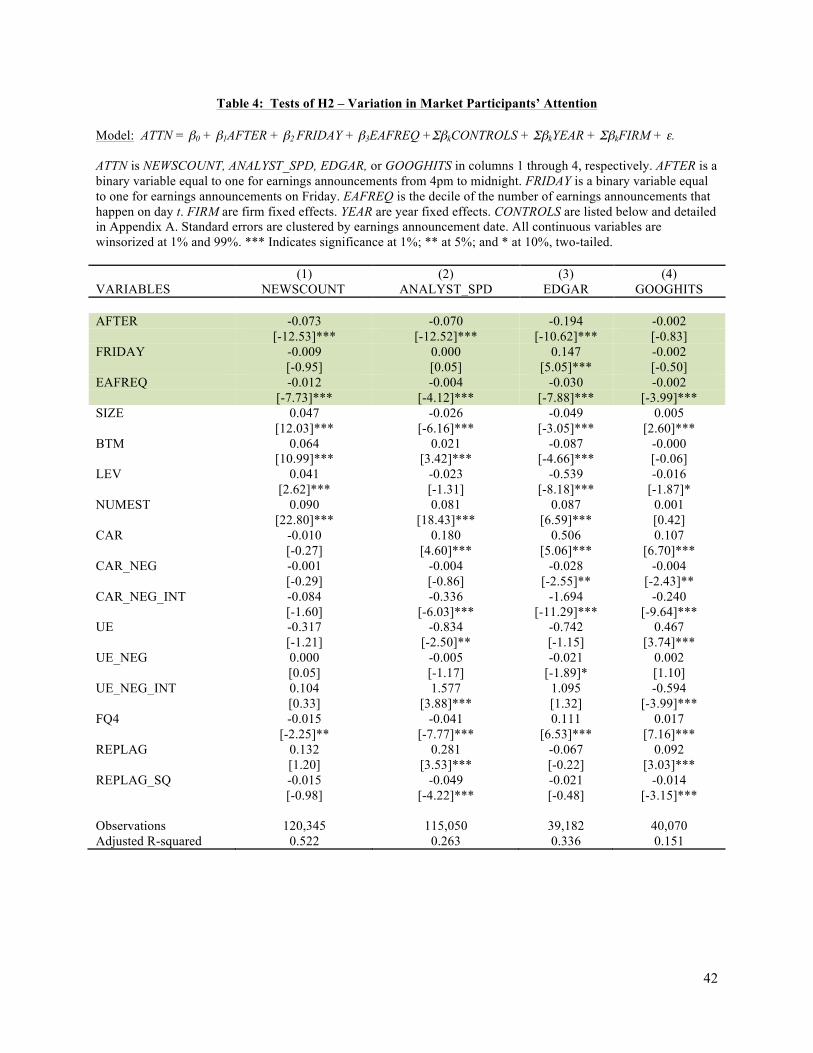
!!
42
Table 4: Tests of H2 – Variation in Market Participants’ Attention Model: ATTN = β0 + β1AFTER + β2 FRIDAY + β3EAFREQ +ΣβkCONTROLS + ΣβkYEAR + ΣβkFIRM + ε. ATTN is NEWSCOUNT, ANALYST_SPD, EDGAR, or GOOGHITS in columns 1 through 4, respectively. AFTER is a binary variable equal to one for earnings announcements from 4pm to midnight. FRIDAY is a binary variable equal to one for earnings announcements on Friday. EAFREQ is the decile of the number of earnings announcements that happen on day t. FIRM are firm fixed effects. YEAR are year fixed effects. CONTROLS are listed below and detailed in Appendix A. Standard errors are clustered by earnings announcement date. All continuous variables are winsorized at 1% and 99%. *** Indicates significance at 1%; ** at 5%; and * at 10%, two-tailed. (1) (2) (3) (4) VARIABLES NEWSCOUNT! ANALYST_SPD EDGAR GOOGHITS AFTER -0.073 -0.070 -0.194 -0.002
![-12.53]*** [-12.52]*** [-10.62]*** [-0.83]
FRIDAY -0.009 0.000 0.147 -0.002
![-0.95] [0.05] [5.05]*** [-0.50]
EAFREQ -0.012 -0.004 -0.030 -0.002
![-7.73]*** [-4.12]*** [-7.88]*** [-3.99]***
SIZE 0.047 -0.026 -0.049 0.005
![12.03]*** [-6.16]*** [-3.05]*** [2.60]***
BTM 0.064 0.021 -0.087 -0.000
![10.99]*** [3.42]*** [-4.66]*** [-0.06]
LEV 0.041 -0.023 -0.539 -0.016
![2.62]*** [-1.31] [-8.18]*** [-1.87]*
NUMEST 0.090 0.081 0.087 0.001
![22.80]*** [18.43]*** [6.59]*** [0.42]
CAR -0.010 0.180 0.506 0.107
![-0.27] [4.60]*** [5.06]*** [6.70]***
CAR_NEG -0.001 -0.004 -0.028 -0.004
![-0.29] [-0.86] [-2.55]** [-2.43]**
CAR_NEG_INT -0.084 -0.336 -1.694 -0.240
![-1.60] [-6.03]*** [-11.29]*** [-9.64]***
UE -0.317 -0.834 -0.742 0.467
![-1.21] [-2.50]** [-1.15] [3.74]***
UE_NEG 0.000 -0.005 -0.021 0.002
![0.05] [-1.17] [-1.89]* [1.10]
UE_NEG_INT 0.104 1.577 1.095 -0.594
![0.33] [3.88]*** [1.32] [-3.99]***
FQ4 -0.015 -0.041 0.111 0.017
![-2.25]** [-7.77]*** [6.53]*** [7.16]***
REPLAG 0.132 0.281 -0.067 0.092
![1.20] [3.53]*** [-0.22] [3.03]***
REPLAG_SQ -0.015 -0.049 -0.021 -0.014
![-0.98] [-4.22]*** [-0.48] [-3.15]***
Observations 120,345 115,050 39,182 40,070 Adjusted R-squared 0.522 0.263 0.336 0.151 ! !
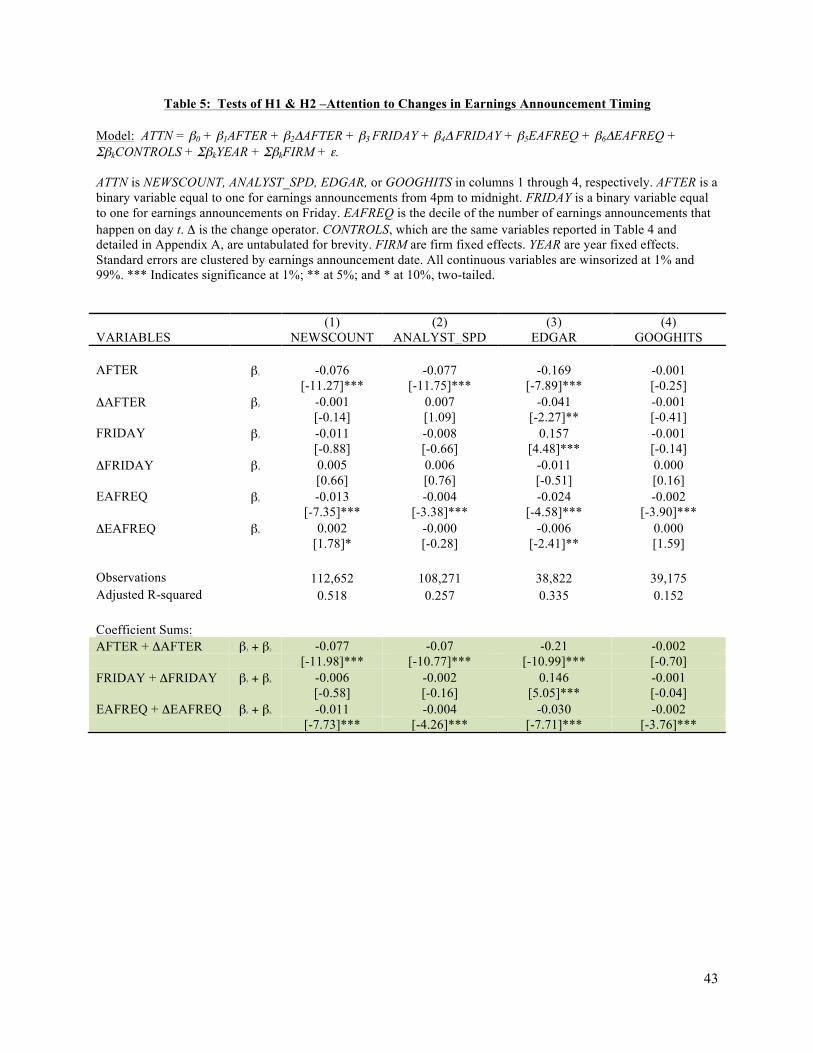
!!
43
Table 5: Tests of H1 & H2 –Attention to Changes in Earnings Announcement Timing Model: ATTN = β0 + β1AFTER + β2ΔAFTER + β3 FRIDAY + β4Δ FRIDAY + β5EAFREQ + β6ΔEAFREQ + ΣβkCONTROLS + ΣβkYEAR + ΣβkFIRM + ε. ATTN is NEWSCOUNT, ANALYST_SPD, EDGAR, or GOOGHITS in columns 1 through 4, respectively. AFTER is a binary variable equal to one for earnings announcements from 4pm to midnight. FRIDAY is a binary variable equal to one for earnings announcements on Friday. EAFREQ is the decile of the number of earnings announcements that happen on day t. Δ is the change operator. CONTROLS, which are the same variables reported in Table 4 and detailed in Appendix A, are untabulated for brevity. FIRM are firm fixed effects. YEAR are year fixed effects. Standard errors are clustered by earnings announcement date. All continuous variables are winsorized at 1% and 99%. *** Indicates significance at 1%; ** at 5%; and * at 10%, two-tailed. (1) (2) (3) (4) VARIABLES NEWSCOUNT ANALYST_SPD EDGAR GOOGHITS AFTER β1 -0.076 -0.077 -0.169 -0.001
! [-11.27]*** [-11.75]*** [-7.89]*** [-0.25]
ΔAFTER β2 -0.001 0.007 -0.041 -0.001
[-0.14] [1.09] [-2.27]** [-0.41] FRIDAY β3 -0.011 -0.008 0.157 -0.001
! [-0.88] [-0.66] [4.48]*** [-0.14]
ΔFRIDAY β4 0.005 0.006 -0.011 0.000
[0.66] [0.76] [-0.51] [0.16] EAFREQ β5 -0.013 -0.004 -0.024 -0.002
! [-7.35]*** [-3.38]*** [-4.58]*** [-3.90]***
ΔEAFREQ β6 0.002 -0.000 -0.006 0.000
[1.78]* [-0.28] [-2.41]** [1.59] Observations 112,652 108,271 38,822 39,175 Adjusted R-squared 0.518 0.257 0.335 0.152
Coefficient Sums: AFTER + ΔAFTER β1 + β2 -0.077 -0.07 -0.21 -0.002
[-11.98]*** [-10.77]*** [-10.99]*** [-0.70] FRIDAY + ΔFRIDAY β3 + β4 -0.006 -0.002 0.146 -0.001
[-0.58] [-0.16] [5.05]*** [-0.04] EAFREQ + ΔEAFREQ β5 + β6 -0.011 -0.004 -0.030 -0.002 [-7.73]*** [-4.26]*** [-7.71]*** [-3.76]*** !

!!
44
Table 6: Analysis of H3 – Differences in Timing and Earnings News
Model: UE = β0 + β1AFTER + β2 FRIDAY + β3EAFREQ +ΣβkCONTROLS + ΣβkYEAR + ΣβkFIRM + ε AFTER is a binary variable equal to one for earnings announcements from 4pm to midnight. FRIDAY is a binary variable equal to one for earnings announcements on Friday. EAFREQ is the decile of the number of earnings announcements that happen on day t. UE is actual EPS less analyst consensus as per IBES, scaled by end of quarter price. FIRM are firm fixed effects. YEAR are year fixed effects. CONTROLS are listed below and detailed in Appendix A. Standard errors are clustered by earnings announcement date. All continuous variables are winsorized at 1% and 99%. *** Indicates significance at 1%; ** at 5%; and * at 10%, two-tailed. Panel A contains summary statistics. Panels B contains regression results. Panel B also contains a changes specification of the OLS model. The OLS changes specification is the same as the levels specification in except that: (i) firm fixed effects are excluded because stationary firm characteristics are eliminated in the first-differenced variables; and (ii) standard errors are now clustered by both date and firm because first-differencing can induce serially correlated residuals. Panel A: Summary Statistics for UE
N Mean P25 Median P75 Std. Dev.
UE 124,005 -0.0010 -0.0010 0.0004 0.0022 0.0151 Panel B: “Reverse Regressions” of UE on Earnings Announcement Timing Levels Specification Changes Specification VARIABLES UE ΔUE AFTER or ΔAFTER -0.0007 -0.0007
[-4.22]*** [-2.61]***
FRIDAY or ΔFRIDAY -0.0019 -0.0015
[-5.91]*** [-4.53]***
EAFREQ or ΔEAFREQ -0.0001 -0.0001
[-5.38]*** [-3.39]***
SIZE or ΔSIZE 0.0008 0.0014
[4.64]*** [2.25]**
BTM or ΔBTM -0.0051 0.0018
[-13.01]*** [1.70]*
LEV or ΔLEV -0.0056 -0.0192
[-9.54]*** [-8.19]***
NUMEST or ΔNUMEST -0.0004 -0.0002
[-3.06]*** [-0.72]
FQ4 or ΔFQ4 0.0007 -0.0001
[4.27]*** [-0.34]
REPLAG or ΔREPLAG 0.0219 0.0161
[7.92]*** [5.76]***
REPLAG_ SQ or ΔREPLAG_SQ -0.0038 -0.0027
[-8.98]*** [-6.46]***
Observations 120,345 112,652 Adjusted R-squared 0.1348 0.0057

!!
45
Table 7: Further Analysis of H3 - Highlighting Good News
The analysis below repeats the changes OLS model from Panel B of Table 6, but separately identifies changes to hide bad news versus changes to highlight good news: ΔUE = β0 + β1ΔAFTER_HIDE + β3ΔAFTER_HIGHLIGHT + β3 ΔFRIDAY_HIDE + β4ΔFRIDAY_HIGHLIGHT + β5ΔEAFREQ_HIDE + β6ΔEAFREQ_HIGHLIGHT +ΣβkΔCONTROLS + ΣβkYEAR + ε ΔAFTER_HIDE is a binary variable equal to one for firms that switch from before hours in the prior quarter to after hours in the current quarter. ΔAFTER_HIGHLIGHT is a binary variable equal to one for firms that switch from after hours to before hours. ΔFRIDAY_HIDE is a binary variable for firms that switch from Monday-Thursday to Friday, and ΔFRIDAY_HIGHLIGHT is a binary for firms that switch from Friday to Monday-Thursday. ΔEAFREQ_HIDE is a binary for firms that increase in EAFREQ by more than two deciles from the prior quarter. ΔEAFREQ_HIGHLIGHT is a binary for firms that decrease in EAFREQ by more than two deciles. CONTROLS are detailed in Appendix A and include SIZE, BTM, LEV, NUMEST, FQ4, REPLAG, and REPLAG_SQ. Control variables and intercepts are untabulated for brevity. Standard errors are clustered by earnings announcement date and by firm. The bottom rows present differences in the absolute value of the ΔTIMING_HIDE and ΔTIMING_HIGHLIGHT coefficient estimates. *** Indicates significance at 1%; ** at 5%; and * at 10%.
(1) VARIABLES ΔUE ΔAFTER_HIDE (binary = 1 if change to after from before close; i.e., high to low attention) -0.0007 [-2.00]** ΔAFTER_HIGHLIGHT (binary = 1 if change from after to before close; i.e., from low to high attention) 0.0007 [2.06]** ΔFRIDAY_HIDE (binary = 1 if change to Friday from Mon-Thur; i.e., from high to low attention) -0.0017 [-4.06]*** ΔFRIDAY_HIGHLIGHT (binary = 1 if change from Friday – Mon-Thur; i.e., from low to high attention) 0.0012 [3.02]*** ΔEAFREQ_HIDE (binary = 1 if change to busy day from slow day; i.e., high to low attention) -0.0004 [-2.37]** ΔEAFREQ_HIGHLIGHT (binary = 1 if change from busy to slow day; i.e., low to high attention) 0.0005 [2.70]*** Observations 112,652 Adjusted R-squared 0.0057 Coefficient Sums Difference in absolute value of AFTER_CHG 0.0000 [0.07] Difference in absolute value of FRIDAY_CHG -0.0005 [-1.21] Difference in absolute value of EAFREQ_CHG 0.0001 [0.33] !
Related Documents