1949-3053 (c) 2015 IEEE. Personal use is permitted, but republication/redistribution requires IEEE permission. See http://www.ieee.org/publications_standards/publications/rights/index.html for more information. This article has been accepted for publication in a future issue of this journal, but has not been fully edited. Content may change prior to final publication. Citation information: DOI 10.1109/TSG.2016.2555245, IEEE Transactions on Smart Grid 1 Abstract--This paper presents the design of a low complexity Fuzzy Logic Controller of only 25-rules to be embedded in an Energy Management System for a residential grid-connected microgrid including Renewable Energy Sources and storage capability. The system assumes that neither the renewable generation nor the load demand is controllable. The main goal of the design is to minimize the grid power profile fluctuations while keeping the Battery State of Charge within secure limits. Instead of using forecasting-based methods, the proposed approach uses both the microgrid energy rate-of-change and the battery SOC to increase, decrease or maintain the power delivered/absorbed by the mains. The controller design parameters (membership functions and rule-base) are adjusted to optimize a pre-defined set of quality criteria of the microgrid behavior. A comparison with other proposals seeking the same goal is presented at simulation level, whereas the features of the proposed design are experimentally tested on a real residential microgrid implemented at the Public University of Navarre. Index Terms-- Distributed power generation, energy management, fuzzy control, microgrid, renewable energy sources, smart grid. I. INTRODUCTION HE ENVIRONMENTAL and economic benefits related to the reduction of both carbon dioxide emission and This work was partially supported by the Secretaría Nacional de Educación Superior, Ciencia, Tecnología e Innovación SENESCYT and the Instituto de Fomento al Talento Humano del Ecuador under the grant No. 2013-AR2Q4081. Government of Navarra and the FEDER funds under project “Microgrids in Navarra: design, development and implementation”. Spanish Ministry of Economy and Competitiveness under grant DPI2013-42853-R; European Union under the project FP7-308468, “PVCROPS-Photovoltaic Cost reduction, reliability, operational performance, prediction and simulation”; grant RUE CSD2009-00046, Consolider-Ingenio 2010 Programme, Spanish Ministry of Science and Innovation, and the grants DPI2013-41224-P, DPI2012-31580 from the Spanish Ministry of Economy and Knowledge. D. Arcos-Aviles is with the Departamento de Ingeniería Eléctrica y Electrónica, Propagation, Electronic Control and Networking (PROCONET) research group, Universidad de las Fuerzas Armadas ESPE, 171-5-231B Sangolquí, Ecuador (e-mail: [email protected]). J. Pascual, L. Marroyo and P. Sanchis are with the Department of Electrical and Electronic Engineering, Public University of Navarre, Pamplona, Spain (e-mail: [email protected]; [email protected]; [email protected].). F. Guinjoan is with the Department of Electronics Engineering, Escuela Técnica Superior de Ingenieros de Telecomunicación de Barcelona, Universitat Politècnica de Catalunya, 08034 Barcelona, Spain (e-mail: [email protected]). transmission losses have made distributed renewable generation systems became a competitive solution for future smart grids [1]. In this context, microgrids are considered as the key building blocks of smart grids [2] and have aroused great attention in the last decade for their potential and the impact they may have in the coming future [3], [4]. The Microgrid (MG) concept has been discussed by several authors [5], [6]. Additionally, in a MG scenario due to the stochastic nature of both the renewable sources and the power consumed by the load, the inclusion of Energy Storage System (ESS) (e.g. batteries, flywheels, ultra-capacitors) and Energy Management Systems (EMS) are highly recommended in order to improve the system stability and its performance [7], [8]. In general, MGs are capable to work in both grid-connected and stand-alone modes [9], [10]. They are defined as low voltage systems comprised of loads, Distributed Generation (DG) units and storage devices, that are connected to the mains at a single Point of Common Coupling (PCC) [11]. The EMS is in charge of controlling the power fluxes among the MG elements to reach a set of predefined objectives such as minimizing the MG operating costs [12], [13] or maximizing the revenues according to DG bids and electricity market price [9]. Additionally, the EMS design should take into account the MG power architecture and, in particular, the power management capability of the MG elements (i.e. which sources, loads and storage elements can be controlled). Once the power architecture and the predefined objectives are known, the EMS design can be undertaken by applying different methods [11], [14], [15]. In this regard, there is a wide variety of works handling different scenarios in terms of power architectures, objectives and methods. For instance in [16] an EMS is designed by using local prediction and local forecasting as well as Stochastic Dynamic Programming (SDP) to control and extend the lifetime of an ESS included in a grid-connected MG with diesel an renewable generation. Moreover, in [17] the design of the EMS focuses on controlling through a predictive control technique the ESS to compensate the hourly deviations of a forecasted energy plan in a grid-connected MG. In addition, Fuzzy Logic Control (FLC) has also been applied to the design of EMS. For instance, besides EMS devoted to stand-alone systems [18]–[20], an EMS with fuzzy control for a DC MG is presented in [21], where the FLC is Fuzzy Logic-Based Energy Management System Design for Residential Grid-Connected Microgrids Diego Arcos-Aviles, Student Member, IEEE, Julio Pascual, Student Member, IEEE, Luis Marroyo, Member, IEEE, Pablo Sanchis, Senior Member, IEEE, and Francesc Guinjoan, Member, IEEE T © 2017 IEEE. Personal use of this material is permitted. Permission from IEEE must be obtained for all other uses, in any current or future media, including reprinting/ republishing this material for advertising or promotional purposes,creating new collective works, for resale or redistribution to servers or lists, or reuse of any copyrighted component of this work in other works

Welcome message from author
This document is posted to help you gain knowledge. Please leave a comment to let me know what you think about it! Share it to your friends and learn new things together.
Transcript

1949-3053 (c) 2015 IEEE. Personal use is permitted, but republication/redistribution requires IEEE permission. See http://www.ieee.org/publications_standards/publications/rights/index.html for more information.
This article has been accepted for publication in a future issue of this journal, but has not been fully edited. Content may change prior to final publication. Citation information: DOI 10.1109/TSG.2016.2555245, IEEETransactions on Smart Grid
1
Abstract--This paper presents the design of a low complexity Fuzzy Logic Controller of only 25-rules to be embedded in an Energy Management System for a residential grid-connected microgrid including Renewable Energy Sources and storage capability. The system assumes that neither the renewable generation nor the load demand is controllable. The main goal of the design is to minimize the grid power profile fluctuations while keeping the Battery State of Charge within secure limits. Instead of using forecasting-based methods, the proposed approach uses both the microgrid energy rate-of-change and the battery SOC to increase, decrease or maintain the power delivered/absorbed by the mains. The controller design parameters (membership functions and rule-base) are adjusted to optimize a pre-defined set of quality criteria of the microgrid behavior. A comparison with other proposals seeking the same goal is presented at simulation level, whereas the features of the proposed design are experimentally tested on a real residential microgrid implemented at the Public University of Navarre.
Index Terms-- Distributed power generation, energy management, fuzzy control, microgrid, renewable energy sources, smart grid.
I. INTRODUCTION HE ENVIRONMENTAL and economic benefits related to the reduction of both carbon dioxide emission and
This work was partially supported by the Secretaría Nacional de Educación Superior, Ciencia, Tecnología e Innovación SENESCYT and the Instituto de Fomento al Talento Humano del Ecuador under the grant No. 2013-AR2Q4081. Government of Navarra and the FEDER funds under project “Microgrids in Navarra: design, development and implementation”. Spanish Ministry of Economy and Competitiveness under grant DPI2013-42853-R; European Union under the project FP7-308468, “PVCROPS-Photovoltaic Cost reduction, reliability, operational performance, prediction and simulation”; grant RUE CSD2009-00046, Consolider-Ingenio 2010 Programme, Spanish Ministry of Science and Innovation, and the grants DPI2013-41224-P, DPI2012-31580 from the Spanish Ministry of Economy and Knowledge.
D. Arcos-Aviles is with the Departamento de Ingeniería Eléctrica y Electrónica, Propagation, Electronic Control and Networking (PROCONET) research group, Universidad de las Fuerzas Armadas ESPE, 171-5-231B Sangolquí, Ecuador (e-mail: [email protected]).
J. Pascual, L. Marroyo and P. Sanchis are with the Department of Electrical and Electronic Engineering, Public University of Navarre, Pamplona, Spain (e-mail: [email protected]; [email protected]; [email protected].).
F. Guinjoan is with the Department of Electronics Engineering, Escuela Técnica Superior de Ingenieros de Telecomunicación de Barcelona, Universitat Politècnica de Catalunya, 08034 Barcelona, Spain (e-mail: [email protected]).
transmission losses have made distributed renewable generation systems became a competitive solution for future smart grids [1]. In this context, microgrids are considered as the key building blocks of smart grids [2] and have aroused great attention in the last decade for their potential and the impact they may have in the coming future [3], [4]. The Microgrid (MG) concept has been discussed by several authors [5], [6]. Additionally, in a MG scenario due to the stochastic nature of both the renewable sources and the power consumed by the load, the inclusion of Energy Storage System (ESS) (e.g. batteries, flywheels, ultra-capacitors) and Energy Management Systems (EMS) are highly recommended in order to improve the system stability and its performance [7], [8]. In general, MGs are capable to work in both grid-connected and stand-alone modes [9], [10]. They are defined as low voltage systems comprised of loads, Distributed Generation (DG) units and storage devices, that are connected to the mains at a single Point of Common Coupling (PCC) [11].
The EMS is in charge of controlling the power fluxes among the MG elements to reach a set of predefined objectives such as minimizing the MG operating costs [12], [13] or maximizing the revenues according to DG bids and electricity market price [9]. Additionally, the EMS design should take into account the MG power architecture and, in particular, the power management capability of the MG elements (i.e. which sources, loads and storage elements can be controlled). Once the power architecture and the predefined objectives are known, the EMS design can be undertaken by applying different methods [11], [14], [15]. In this regard, there is a wide variety of works handling different scenarios in terms of power architectures, objectives and methods. For instance in [16] an EMS is designed by using local prediction and local forecasting as well as Stochastic Dynamic Programming (SDP) to control and extend the lifetime of an ESS included in a grid-connected MG with diesel an renewable generation. Moreover, in [17] the design of the EMS focuses on controlling through a predictive control technique the ESS to compensate the hourly deviations of a forecasted energy plan in a grid-connected MG.
In addition, Fuzzy Logic Control (FLC) has also been applied to the design of EMS. For instance, besides EMS devoted to stand-alone systems [18]–[20], an EMS with fuzzy control for a DC MG is presented in [21], where the FLC is
Fuzzy Logic-Based Energy Management System Design for Residential Grid-Connected
Microgrids Diego Arcos-Aviles, Student Member, IEEE, Julio Pascual, Student Member, IEEE, Luis Marroyo,
Member, IEEE, Pablo Sanchis, Senior Member, IEEE, and Francesc Guinjoan, Member, IEEE
T
© 2017 IEEE. Personal use of this material is permitted. Permission from IEEE must be obtained for all other uses, in any current or future media, including reprinting/republishing this material for advertising or promotional purposes,creating new collective works, for resale or redistribution to servers or lists, or reuse of any copyrighted component of this work in other works

1949-3053 (c) 2015 IEEE. Personal use is permitted, but republication/redistribution requires IEEE permission. See http://www.ieee.org/publications_standards/publications/rights/index.html for more information.
This article has been accepted for publication in a future issue of this journal, but has not been fully edited. Content may change prior to final publication. Citation information: DOI 10.1109/TSG.2016.2555245, IEEETransactions on Smart Grid
2
designed for both prioritizing selling additional electricity generated by Renewable Energy Sources (RES) and maintaining the battery State of Charge (SOC) above 50% to extend its life. Moreover, [22] presents an EMS where the FLC considers the evolution of the prices during one day, the energy demand, the production and the time of the day in order to ensure an affordable grid. In this concern, it can be indicated that smoothing the grid power profile is not addressed in all these previous works as a main objective of the EMS.
Furthermore, other works consider scenarios with more degrees of freedom where the EMS drives different storage elements (batteries, fuel cells…), controllable loads (electrical load management, heat pumps…) or a combination of both as in [23]–[25], to carry out Demand Side Management (DSM) and Demand Response (DR) strategies. The control methods used in this case are usually sophisticated as Model Predictive Control (MPC) and, include both generation and demand forecasting as in [26], [27].
In contrast, the power architecture addressed in this work focuses on a residential grid-connected MG with wind and solar generation as well as a residential load where only the battery can be controlled. Moreover, the data available are historical yearly records of RES power generation and load consumption (i.e. there are no generation and demand forecasting). This scenario is an easy way to incorporate renewable energy in existing conventional installations by simply adding renewable generators (wind and solar) and a set of batteries as ESS, and has paid the attention of power electronics commercial manufacturers which include in their catalogs products as the INGECON® HYBRID MS power stage to integrate all these elements. In this scenario, smoothing the power profile exchanged with the grid becomes the main objective since, among others, it facilitates the grid operator control [28].
In short, for the case under study, the EMS should be designed with the objective of smoothing the power exchanged with the grid, concurrently satisfying at any time the load demand (i.e. there is no demand side management) and the ESS constraints.
In this concern, the first attempt to smooth the grid power profile is based on the Simple Moving Average (SMA) strategy, as mentioned in [29]. This strategy uses a Low-Pass Filter (LPF) to separate the high and low-frequencies components present in the MG net power via a simple moving average filter with a window size of one day [23].
Conversely, based on an heuristic knowledge of the desired MG behavior, Barricarte et al. [30] suggests an EMS design where the amount of power assigned to the grid and to the storage system is computed by means of adjustable analytical expressions involving the power balance between consumption and generation as well as the battery SOC as main variables.
This heuristic knowledge suggest the use of Fuzzy Logic Control to the design of the EMS for the case under study, since this approach easily integrates the experience of the user rather than using a mathematical model of the system
[31]–[33]. Taking the same input variables as in [30], the authors presented in [34] the design of a FLC with only 25-rules which slightly improved the battery SOC and the grid power profile obtained in [30]. This work presented a detailed description of the rule-base and the Membership Functions (MF) design, which parameters (i.e. number and mapping) were adjusted to optimize a set of quality criteria of the MG behavior through an off-line learning-process simulation.
Furthermore, using the same design methodology, an improved EMS design based on FLC was presented in [35]. This new design was considering the MG Net Power Trend (NPT) as an additional input of the FLC, resulting in a 50-rules FLC. Even though the results evidence a low-frequency grid power profile with minimum fluctuations, the controller complexity was increased.
Additionally, a common drawback of all these previous designs [29], [30], [34], [35] is that they do not operate properly when the RES generation exhibits strong differences from one day to the next one. In these cases, the battery SOC can eventually reach the undesired thresholds, thus compromising the battery lifetime.
With the aim of improving the aforementioned designs as well as simplifying the FLC complexity (i.e. to reduce the controller inputs number and its rule-base), this work presents a new FLC-based EMS of only two-inputs, one-output and 25-rules. As it will be seen, the key factor of the new design is to consider the MG Energy Rate-of-Change (ERoC) as an input in order to anticipate the system behavior. The design methodology will follow the procedure and the optimization process developed in [34] (i.e. off-line controller parameter setting process). A comparison of SMA strategy, Fuzzy EMS-NPT, and Fuzzy EMS-ERoC approaches will be presented at simulation level, whereas the features of this last one will be tested on a real residential MG.
The paper is organized as follows. Section II describes the architecture and variables of the MG. Section III presents a set of quality criteria used to evaluate the grid power profile. The analysis of previous EMS strategies is presented in Section IV. Section V describes the design of the proposed fuzzy EMS based on MG energy rate-of-change. Section VI presents the simulation and comparison results of the EMSs according to the grid power profile quality criteria. The experimental validation of the proposed EMS design is presented in Section VII. Finally, Section VIII presents the main conclusions of this paper.
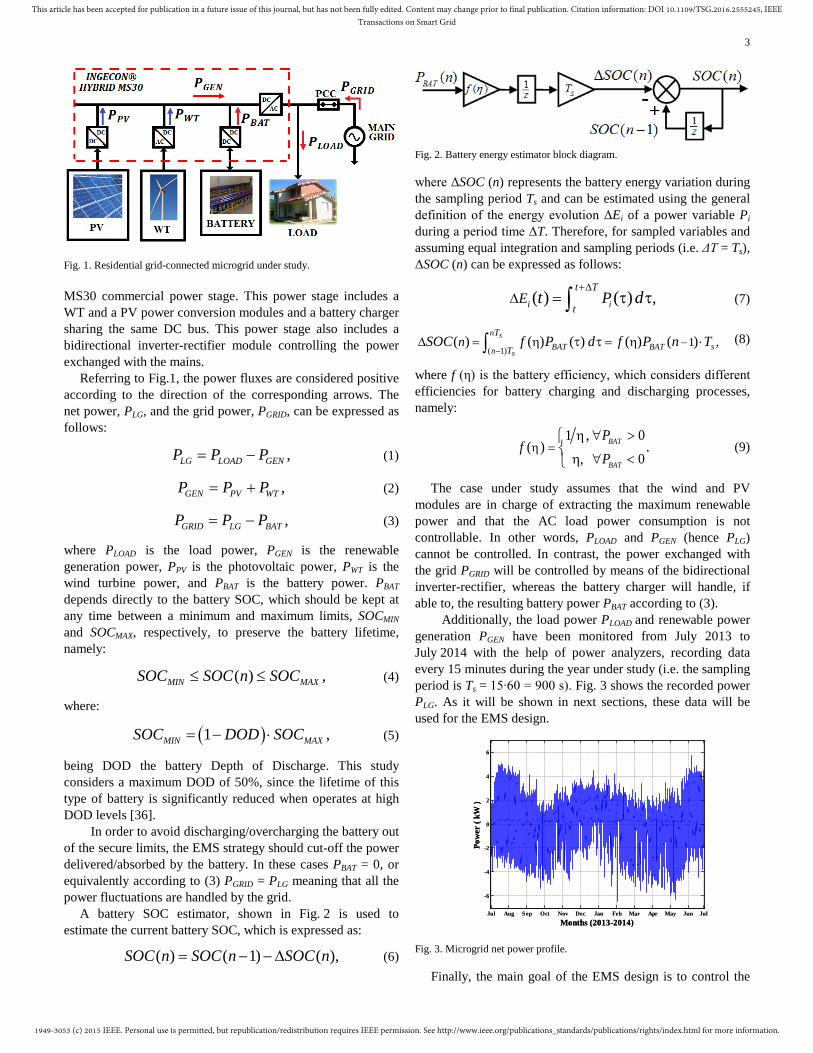
II. MICROGRID DESCRIPTION The study developed in this paper is carried out for a
residential grid-connected MG located at the Public University of Navarre (UPNa) (Pamplona, Spain: 42°49’06”N 1°38’39”O) and is shown in Fig.1. The MG includes a domestic AC load with a rated power of 7 kW, a Photovoltaic (PV) array of 4 kW, a small Wind Turbine (WT) of 6 kW, and an ESS formed by a lead-acid battery bank with a rated capacity of 72 kWh. The power architecture is also shown in Fig.1 and corresponds to a modified INGECON® HYBRID
1949-3053 (c) 2015 IEEE. Personal use is permitted, but republication/redistribution requires IEEE permission. See http://www.ieee.org/publications_standards/publications/rights/index.html for more information.
This article has been accepted for publication in a future issue of this journal, but has not been fully edited. Content may change prior to final publication. Citation information: DOI 10.1109/TSG.2016.2555245, IEEETransactions on Smart Grid
3
MS30 commercial power stage. This power stage includes a WT and a PV power conversion modules and a battery charger sharing the same DC bus. This power stage also includes a bidirectional inverter-rectifier module controlling the power exchanged with the mains.
Referring to Fig.1, the power fluxes are considered positive according to the direction of the corresponding arrows. The net power, PLG, and the grid power, PGRID, can be expressed as follows:
,LG LOAD GENP P P= − (1)
,GEN PV WTP P P= + (2)
,GRID LG BATP P P= − (3)
where PLOAD is the load power, PGEN is the renewable generation power, PPV is the photovoltaic power, PWT is the wind turbine power, and PBAT is the battery power. PBAT depends directly to the battery SOC, which should be kept at any time between a minimum and maximum limits, SOCMIN and SOCMAX, respectively, to preserve the battery lifetime, namely:
( ) ,MIN MAXSOC SOC n SOC≤ ≤ (4)
where:
( )1 ,MIN MAXSOC DOD SOC= − ⋅ (5)
being DOD the battery Depth of Discharge. This study considers a maximum DOD of 50%, since the lifetime of this type of battery is significantly reduced when operates at high DOD levels [36].
In order to avoid discharging/overcharging the battery out of the secure limits, the EMS strategy should cut-off the power delivered/absorbed by the battery. In these cases PBAT = 0, or equivalently according to (3) PGRID = PLG meaning that all the power fluctuations are handled by the grid.
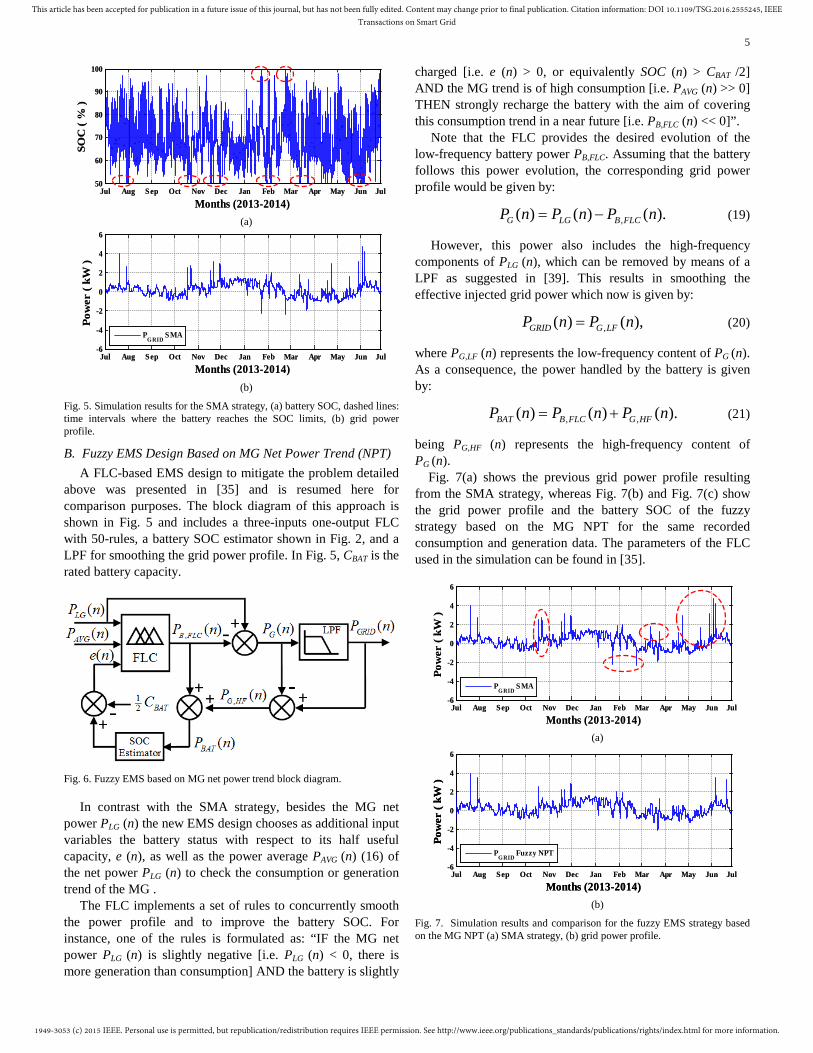
A battery SOC estimator, shown in Fig. 2 is used to estimate the current battery SOC, which is expressed as:
( ) ( 1) ( ),SOC n SOC n SOC n= − − ∆ (6)
Fig. 2. Battery energy estimator block diagram.
where ΔSOC (n) represents the battery energy variation during the sampling period Ts and can be estimated using the general definition of the energy evolution ΔEi of a power variable Pi during a period time ΔT. Therefore, for sampled variables and assuming equal integration and sampling periods (i.e. ΔT = Ts), ΔSOC (n) can be expressed as follows:
,( ) ( )i i
t T
tE Pt d
+∆∆ = t t∫ (7)
( 1)1 ,( ) ( ) ( ) ( ) ( )s
s
nsBAT BATn
T
TnSOC f P d f P n T
−−∆ = η = ηt t ⋅∫ (8)
where f (η) is the battery efficiency, which considers different efficiencies for battery charging and discharging processes, namely:
01
( )0,
,.BAT
BAT
Pf
Pη =
∀ >η
∀ <η
(9)
The case under study assumes that the wind and PV modules are in charge of extracting the maximum renewable power and that the AC load power consumption is not controllable. In other words, PLOAD and PGEN (hence PLG) cannot be controlled. In contrast, the power exchanged with the grid PGRID will be controlled by means of the bidirectional inverter-rectifier, whereas the battery charger will handle, if able to, the resulting battery power PBAT according to (3).
Additionally, the load power PLOAD and renewable power generation PGEN have been monitored from July 2013 to July 2014 with the help of power analyzers, recording data every 15 minutes during the year under study (i.e. the sampling period is Ts = 15∙60 = 900 s). Fig. 3 shows the recorded power PLG. As it will be shown in next sections, these data will be used for the EMS design.
Jul Aug Sep Oct Nov Dec Jan Feb Mar Apr May Jun Jul
-6
-4
-2
0
2
4
6
Months (2013-2014)
Pow
er (
kW )
Jul Aug Sep Oct Nov Dec Jan Feb Mar Apr May Jun Jul
-6
-4
-2
0
2
4
6
Months (2013-2014)
Pow
er (
kW )
Fig. 3. Microgrid net power profile.
Finally, the main goal of the EMS design is to control the
Fig. 1. Residential grid-connected microgrid under study.

1949-3053 (c) 2015 IEEE. Personal use is permitted, but republication/redistribution requires IEEE permission. See http://www.ieee.org/publications_standards/publications/rights/index.html for more information.
This article has been accepted for publication in a future issue of this journal, but has not been fully edited. Content may change prior to final publication. Citation information: DOI 10.1109/TSG.2016.2555245, IEEETransactions on Smart Grid
4
power inverter-rectifier in order to “smooth” the power profile exchanged with the grid (i.e. minimizing the grid power fluctuations and power peaks) while concurrently keeping the battery SOC within secure limits. In order to numerically evaluate the degree of the grid power profile smoothness achieved by an EMS design, a set of grid power profile quality criteria is defined in the next section.
III. GRID POWER PROFILE QUALITY CRITERIA The following set of grid power profile quality criteria is
defined so that the lower the criteria values are the better EMS performance is [23], [37].
A. Positive and Negative Grid Power Peaks The positive and negative grid power peaks, PG,MAX and
PG,MIN, are defined as the maximum value of the power delivered by the grid and the maximum value of the power fed into the grid in one year, respectively, i.e. :
( ), max ,G MAX GRIDP P= (10)
( ), min .G MIN GRIDP P= (11)
B. Maximum and Average Power Derivative The Maximum Power Derivative (MPD) represents the
maximum rate-of-change (i.e. the slope of two consecutive samples, being the sampling period 15 min) of the grid power profile in the year under study. The MPD is defined as the maximum absolute value of the slopes during one year.
The Average Power Derivative (APD) is defined as the absolute value of the annual average value of the slopes of two consecutive samples. Both criteria are expressed in W/h and are calculated as follows:
( )max ,GRIDPMPD = (12)
( ) ,GRID
N
n 1A
1PD nPN =
= ∑ (13)
( )( ) ( ) ( ) ,GRID GRID GRID SP n P n P n 1 T= − − (14)
where ṖGRID is the grid power profile ramp-rate, N is the number of samples in a year, Ts is the sampling period, and n is the sample index.
C. Power Profile Variability (PPV) This criterion, defined in [38], measures the grid power
profile variability calculated as:
, ,f
i
f 2DCGRID ff f
PPV P P=
= ∑ (15)
where PGRID,f is the grid power harmonic at frequency f, fi and ff are the initial and final frequencies, respectively, and PDC is the yearly power average value. Note that this criterion only evaluates frequencies above fi = 1.65×10⁻⁶ Hz (i.e. variation
periods of one week or less), since the energy management strategy seeks to compensate daily variations. Furthermore, computing PPV requires a maximum frequency equal to half of the sampling frequency ff = 5.55×10⁻⁴ Hz (i.e. Nyquist frequency).
IV. PREVIOUS EMS STRATEGIES For comparative purposes, this section describes two
strategies for smoothing the grid power profile, which have been previously reported in the literature [23], [35].
A. Simple Moving Average Strategy In order to smooth the grid power profile, the SMA strategy
uses a simple moving average filter with a window size of one day to separate the high- and low-frequency components of the MG net power. Thus, the high-frequency component is exchanged with the battery (injected into the battery if PBAT < 0, or delivered by the battery if PBAT > 0), whereas the low-frequency component is exchanged with the grid (injected into the grid if PGRID < 0, or delivered by the grid if PGRID > 0), as follows:
11( ) ( ),
n
AVG LGk n M
P n P kM
−
= −
= ∑ (16)
( ) ( ) ( ),BAT LG AVGP n P n P n= − (17)
( ) ( ).GRID AVGP n P n= (18)
where PAVG is the low-frequency component of PLG, and M is the number of samples in one day.
The block diagram of the SMA strategy is shown in Fig. 4 and includes a LPF used to obtain the low-frequency component of PLG and a SOC estimator shown in Fig. 2.
Fig. 4. Simple moving average EMS block diagram.
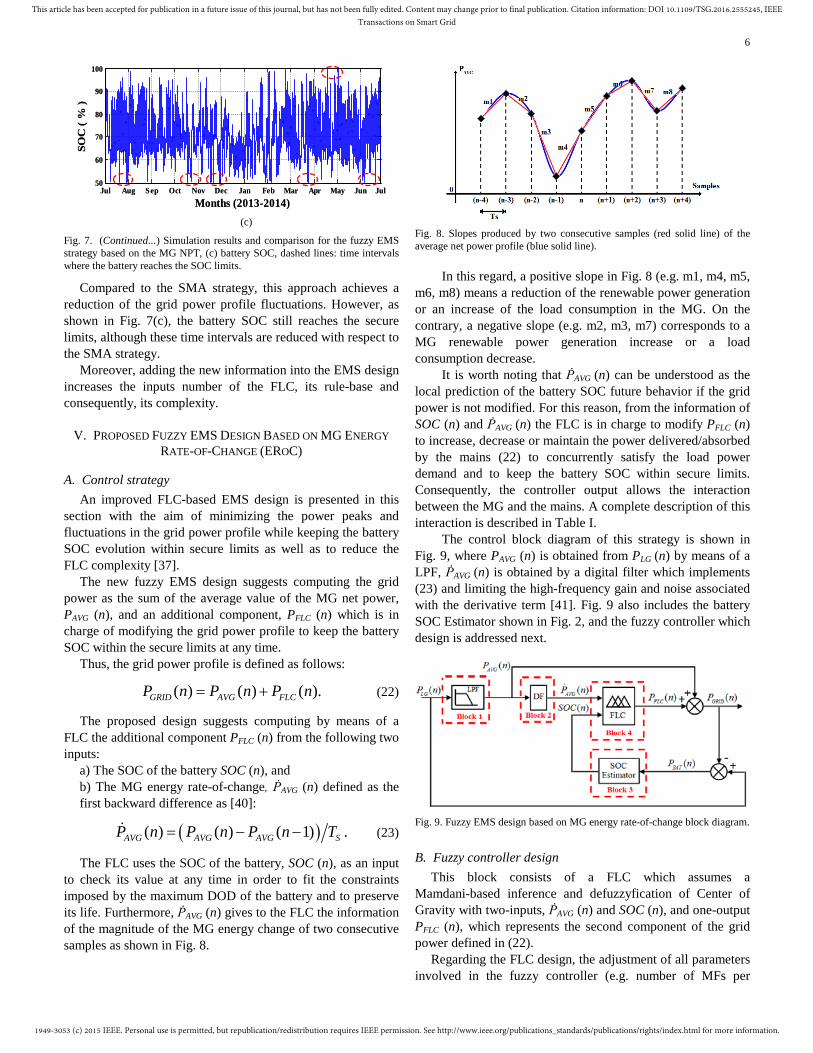
Fig. 5 shows the simulation results in terms of battery SOC and the resulting grid power profile of the SMA strategy using the recorded data of the generation and consumption, and a LPF of 24h. As it can be seen the grid power profile has strong fluctuations since this strategy leads the battery to reach the secure limits during several time intervals. The simulation results of SMA strategy will be further analyzed in Section VI on a daily basis.
1949-3053 (c) 2015 IEEE. Personal use is permitted, but republication/redistribution requires IEEE permission. See http://www.ieee.org/publications_standards/publications/rights/index.html for more information.
This article has been accepted for publication in a future issue of this journal, but has not been fully edited. Content may change prior to final publication. Citation information: DOI 10.1109/TSG.2016.2555245, IEEETransactions on Smart Grid
5
Jul Aug Sep Oct Nov Dec Jan Feb Mar Apr May Jun Jul50
60
70
80
90
100
Months (2013-2014)
SOC
( %
)
Jul Aug Sep Oct Nov Dec Jan Feb Mar Apr May Jun Jul50
60
70
80
90
100
Months (2013-2014)
SOC
( %
)
(a)
Jul Aug Sep Oct Nov Dec Jan Feb Mar Apr May Jun Jul-6
-4
-2
0
2
4
6
Months (2013-2014)
Pow
er (
kW )
PGRID
SMA
Jul Aug Sep Oct Nov Dec Jan Feb Mar Apr May Jun Jul-6
-4
-2
0
2
4
6
Months (2013-2014)
Pow
er (
kW )
(b)
Fig. 5. Simulation results for the SMA strategy, (a) battery SOC, dashed lines: time intervals where the battery reaches the SOC limits, (b) grid power profile.
B. Fuzzy EMS Design Based on MG Net Power Trend (NPT) A FLC-based EMS design to mitigate the problem detailed
above was presented in [35] and is resumed here for comparison purposes. The block diagram of this approach is shown in Fig. 5 and includes a three-inputs one-output FLC with 50-rules, a battery SOC estimator shown in Fig. 2, and a LPF for smoothing the grid power profile. In Fig. 5, CBAT is the rated battery capacity.
Fig. 6. Fuzzy EMS based on MG net power trend block diagram.
In contrast with the SMA strategy, besides the MG net power PLG (n) the new EMS design chooses as additional input variables the battery status with respect to its half useful capacity, e (n), as well as the power average PAVG (n) (16) of the net power PLG (n) to check the consumption or generation trend of the MG .
The FLC implements a set of rules to concurrently smooth the power profile and to improve the battery SOC. For instance, one of the rules is formulated as: “IF the MG net power PLG (n) is slightly negative [i.e. PLG (n) < 0, there is more generation than consumption] AND the battery is slightly
charged [i.e. e (n) > 0, or equivalently SOC (n) > CBAT /2] AND the MG trend is of high consumption [i.e. PAVG (n) >> 0] THEN strongly recharge the battery with the aim of covering this consumption trend in a near future [i.e. PB,FLC (n) << 0]”.
Note that the FLC provides the desired evolution of the low-frequency battery power PB,FLC. Assuming that the battery follows this power evolution, the corresponding grid power profile would be given by:
,( ) ( ) ( ).G LG B FLCP n P n P n= − (19)
However, this power also includes the high-frequency components of PLG (n), which can be removed by means of a LPF as suggested in [39]. This results in smoothing the effective injected grid power which now is given by:
,( ) ( ),GRID G LFP n P n= (20)
where PG,LF (n) represents the low-frequency content of PG (n). As a consequence, the power handled by the battery is given by:
, ,( ) ( ) ( ).BAT B FLC G HFP n P n P n= + (21)
being PG,HF (n) represents the high-frequency content of PG (n).
Fig. 7(a) shows the previous grid power profile resulting from the SMA strategy, whereas Fig. 7(b) and Fig. 7(c) show the grid power profile and the battery SOC of the fuzzy strategy based on the MG NPT for the same recorded consumption and generation data. The parameters of the FLC used in the simulation can be found in [35].
Jul Aug Sep Oct Nov Dec Jan Feb Mar Apr May Jun Jul-6
-4
-2
0
2
4
6
Months (2013-2014)
Pow
er (
kW )
PGRID
SMA
Jul Aug Sep Oct Nov Dec Jan Feb Mar Apr May Jun Jul-6
-4
-2
0
2
4
6
Months (2013-2014)
Pow
er (
kW )
(a)
Jul Aug Sep Oct Nov Dec Jan Feb Mar Apr May Jun Jul-6
-4
-2
0
2
4
6
Months (2013-2014)
Pow
er (
kW )
PGRID
Fuzzy NPT
Jul Aug Sep Oct Nov Dec Jan Feb Mar Apr May Jun Jul-6
-4
-2
0
2
4
6
Months (2013-2014)
Pow
er (
kW )
(b)
Fig. 7. Simulation results and comparison for the fuzzy EMS strategy based on the MG NPT (a) SMA strategy, (b) grid power profile.
1949-3053 (c) 2015 IEEE. Personal use is permitted, but republication/redistribution requires IEEE permission. See http://www.ieee.org/publications_standards/publications/rights/index.html for more information.
This article has been accepted for publication in a future issue of this journal, but has not been fully edited. Content may change prior to final publication. Citation information: DOI 10.1109/TSG.2016.2555245, IEEETransactions on Smart Grid
6
Jul Aug Sep Oct Nov Dec Jan Feb Mar Apr May Jun Jul50
60
70
80
90
100
Months (2013-2014)
SOC
( %
)
Jul Aug Sep Oct Nov Dec Jan Feb Mar Apr May Jun Jul50
60
70
80
90
100
Months (2013-2014)
SOC
( %
)
(c)
Fig. 7. (Continued...) Simulation results and comparison for the fuzzy EMS strategy based on the MG NPT, (c) battery SOC, dashed lines: time intervals where the battery reaches the SOC limits.
Compared to the SMA strategy, this approach achieves a reduction of the grid power profile fluctuations. However, as shown in Fig. 7(c), the battery SOC still reaches the secure limits, although these time intervals are reduced with respect to the SMA strategy.
Moreover, adding the new information into the EMS design increases the inputs number of the FLC, its rule-base and consequently, its complexity.
V. PROPOSED FUZZY EMS DESIGN BASED ON MG ENERGY RATE-OF-CHANGE (EROC)
A. Control strategy An improved FLC-based EMS design is presented in this
section with the aim of minimizing the power peaks and fluctuations in the grid power profile while keeping the battery SOC evolution within secure limits as well as to reduce the FLC complexity [37].
The new fuzzy EMS design suggests computing the grid power as the sum of the average value of the MG net power, PAVG (n), and an additional component, PFLC (n) which is in charge of modifying the grid power profile to keep the battery SOC within the secure limits at any time.
Thus, the grid power profile is defined as follows:
( ) ( ) ( ).GRID AVG FLCP n P n P n= + (22)
The proposed design suggests computing by means of a FLC the additional component PFLC (n) from the following two inputs:
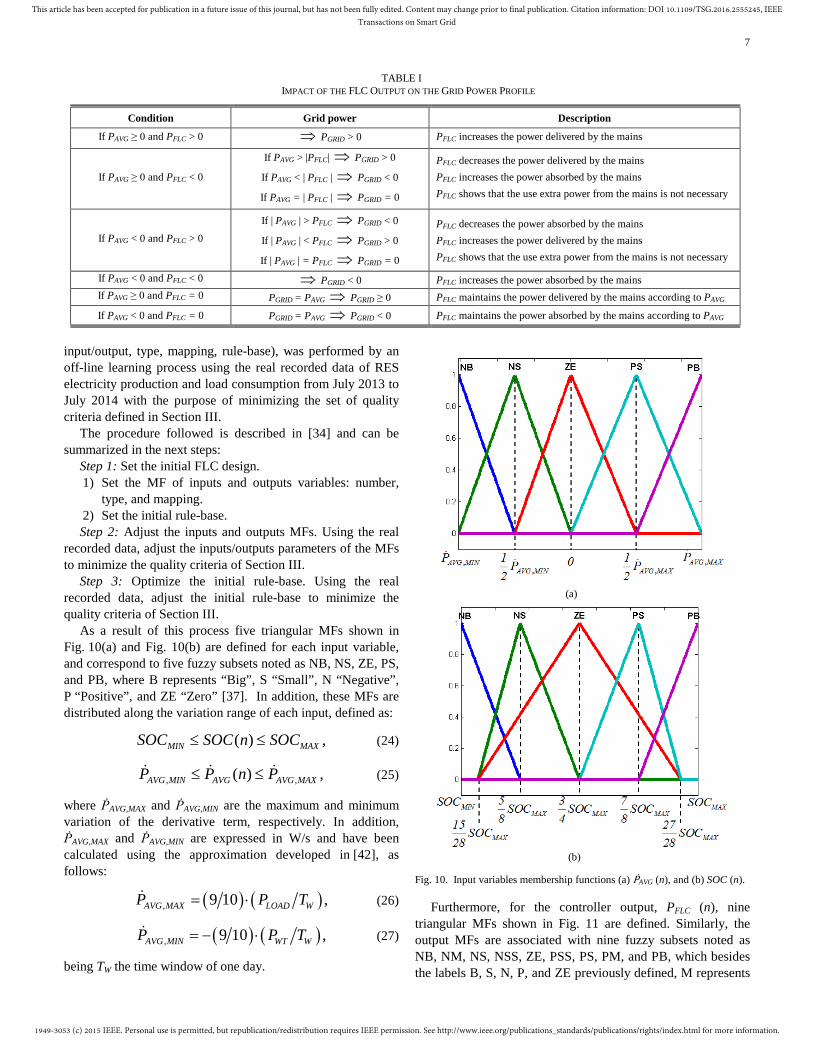
a) The SOC of the battery SOC (n), and b) The MG energy rate-of-change, ṖAVG (n) defined as the first backward difference as [40]:
( )( ) ( ) ( 1) .AVG AVG AVG SP n P n P n T= − − (23)
The FLC uses the SOC of the battery, SOC (n), as an input to check its value at any time in order to fit the constraints imposed by the maximum DOD of the battery and to preserve its life. Furthermore, ṖAVG (n) gives to the FLC the information of the magnitude of the MG energy change of two consecutive samples as shown in Fig. 8.
Fig. 8. Slopes produced by two consecutive samples (red solid line) of the average net power profile (blue solid line).
In this regard, a positive slope in Fig. 8 (e.g. m1, m4, m5, m6, m8) means a reduction of the renewable power generation or an increase of the load consumption in the MG. On the contrary, a negative slope (e.g. m2, m3, m7) corresponds to a MG renewable power generation increase or a load consumption decrease.
It is worth noting that ṖAVG (n) can be understood as the local prediction of the battery SOC future behavior if the grid power is not modified. For this reason, from the information of SOC (n) and ṖAVG (n) the FLC is in charge to modify PFLC (n) to increase, decrease or maintain the power delivered/absorbed by the mains (22) to concurrently satisfy the load power demand and to keep the battery SOC within secure limits. Consequently, the controller output allows the interaction between the MG and the mains. A complete description of this interaction is described in Table I.
The control block diagram of this strategy is shown in Fig. 9, where PAVG (n) is obtained from PLG (n) by means of a LPF, ṖAVG (n) is obtained by a digital filter which implements (23) and limiting the high-frequency gain and noise associated with the derivative term [41]. Fig. 9 also includes the battery SOC Estimator shown in Fig. 2, and the fuzzy controller which design is addressed next.
Fig. 9. Fuzzy EMS design based on MG energy rate-of-change block diagram.
B. Fuzzy controller design This block consists of a FLC which assumes a
Mamdani-based inference and defuzzyfication of Center of Gravity with two-inputs, ṖAVG (n) and SOC (n), and one-output PFLC (n), which represents the second component of the grid power defined in (22).
Regarding the FLC design, the adjustment of all parameters involved in the fuzzy controller (e.g. number of MFs per
1949-3053 (c) 2015 IEEE. Personal use is permitted, but republication/redistribution requires IEEE permission. See http://www.ieee.org/publications_standards/publications/rights/index.html for more information.
This article has been accepted for publication in a future issue of this journal, but has not been fully edited. Content may change prior to final publication. Citation information: DOI 10.1109/TSG.2016.2555245, IEEETransactions on Smart Grid
7
input/output, type, mapping, rule-base), was performed by an off-line learning process using the real recorded data of RES electricity production and load consumption from July 2013 to July 2014 with the purpose of minimizing the set of quality criteria defined in Section III.
The procedure followed is described in [34] and can be summarized in the next steps:
Step 1: Set the initial FLC design. 1) Set the MF of inputs and outputs variables: number,
type, and mapping. 2) Set the initial rule-base. Step 2: Adjust the inputs and outputs MFs. Using the real
recorded data, adjust the inputs/outputs parameters of the MFs to minimize the quality criteria of Section III.
Step 3: Optimize the initial rule-base. Using the real recorded data, adjust the initial rule-base to minimize the quality criteria of Section III.
As a result of this process five triangular MFs shown in Fig. 10(a) and Fig. 10(b) are defined for each input variable, and correspond to five fuzzy subsets noted as NB, NS, ZE, PS, and PB, where B represents “Big”, S “Small”, N “Negative”, P “Positive”, and ZE “Zero” [37]. In addition, these MFs are distributed along the variation range of each input, defined as:
( ) ,MIN MAXSOC SOC n SOC≤ ≤ (24)
, ,( ) ,AVG MIN AVG AVG MAXP P n P≤ ≤ (25)
where ṖAVG,MAX and ṖAVG,MIN are the maximum and minimum variation of the derivative term, respectively. In addition, ṖAVG,MAX and ṖAVG,MIN are expressed in W/s and have been calculated using the approximation developed in [42], as follows:
( ) ( ), 9 10 ,AVG MAX LOAD WP P T= ⋅ (26)
( ) ( ), 9 10 ,AVG MIN WT WP P T= − ⋅ (27)
being TW the time window of one day.
(a)
(b)
Fig. 10. Input variables membership functions (a) ṖAVG (n), and (b) SOC (n).
Furthermore, for the controller output, PFLC (n), nine triangular MFs shown in Fig. 11 are defined. Similarly, the output MFs are associated with nine fuzzy subsets noted as NB, NM, NS, NSS, ZE, PSS, PS, PM, and PB, which besides the labels B, S, N, P, and ZE previously defined, M represents
TABLE I IMPACT OF THE FLC OUTPUT ON THE GRID POWER PROFILE
Condition Grid power Description
If PAVG ≥ 0 and PFLC > 0 ⇒ PGRID > 0 PFLC increases the power delivered by the mains
If PAVG ≥ 0 and PFLC < 0
If PAVG > |PFLC| ⇒ PGRID > 0
If PAVG < | PFLC | ⇒ PGRID < 0
If PAVG = | PFLC | ⇒ PGRID = 0
PFLC decreases the power delivered by the mains PFLC increases the power absorbed by the mains PFLC shows that the use extra power from the mains is not necessary
If PAVG < 0 and PFLC > 0
If | PAVG | > PFLC ⇒ PGRID < 0
If | PAVG | < PFLC ⇒ PGRID > 0
If | PAVG | = PFLC ⇒ PGRID = 0
PFLC decreases the power absorbed by the mains PFLC increases the power delivered by the mains PFLC shows that the use extra power from the mains is not necessary
If PAVG < 0 and PFLC < 0 ⇒ PGRID < 0 PFLC increases the power absorbed by the mains If PAVG ≥ 0 and PFLC = 0 PGRID = PAVG ⇒ PGRID ≥ 0 PFLC maintains the power delivered by the mains according to PAVG
If PAVG < 0 and PFLC = 0 PGRID = PAVG ⇒ PGRID < 0 PFLC maintains the power absorbed by the mains according to PAVG
1949-3053 (c) 2015 IEEE. Personal use is permitted, but republication/redistribution requires IEEE permission. See http://www.ieee.org/publications_standards/publications/rights/index.html for more information.
This article has been accepted for publication in a future issue of this journal, but has not been fully edited. Content may change prior to final publication. Citation information: DOI 10.1109/TSG.2016.2555245, IEEETransactions on Smart Grid
8
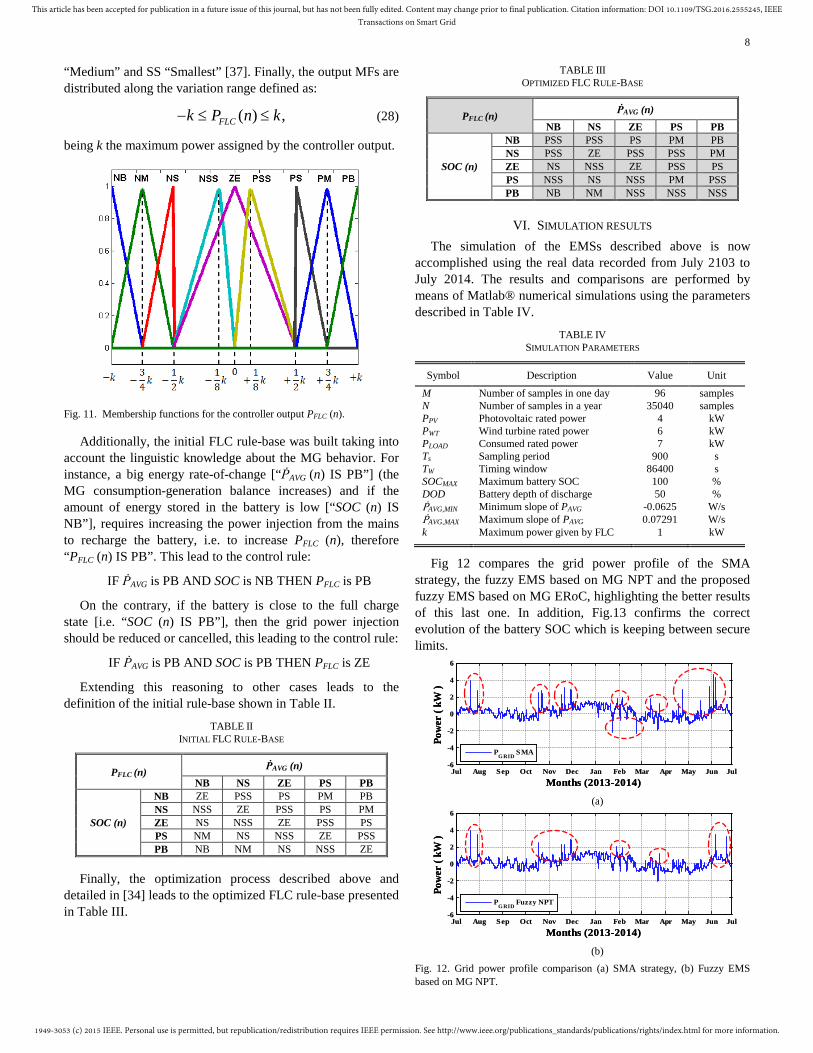
“Medium” and SS “Smallest” [37]. Finally, the output MFs are distributed along the variation range defined as:
( ) ,FLCk P n k− ≤ ≤ (28)
being k the maximum power assigned by the controller output.
Fig. 11. Membership functions for the controller output PFLC (n).
Additionally, the initial FLC rule-base was built taking into account the linguistic knowledge about the MG behavior. For instance, a big energy rate-of-change [“ṖAVG (n) IS PB”] (the MG consumption-generation balance increases) and if the amount of energy stored in the battery is low [“SOC (n) IS NB”], requires increasing the power injection from the mains to recharge the battery, i.e. to increase PFLC (n), therefore “PFLC (n) IS PB”. This lead to the control rule:
IF ṖAVG is PB AND SOC is NB THEN PFLC is PB
On the contrary, if the battery is close to the full charge state [i.e. “SOC (n) IS PB”], then the grid power injection should be reduced or cancelled, this leading to the control rule:
IF ṖAVG is PB AND SOC is PB THEN PFLC is ZE
Extending this reasoning to other cases leads to the definition of the initial rule-base shown in Table II.
TABLE II INITIAL FLC RULE-BASE
PFLC (n) ṖAVG (n) NB NS ZE PS PB
SOC (n)
NB ZE PSS PS PM PB NS NSS ZE PSS PS PM ZE NS NSS ZE PSS PS PS NM NS NSS ZE PSS PB NB NM NS NSS ZE
Finally, the optimization process described above and detailed in [34] leads to the optimized FLC rule-base presented in Table III.
TABLE III OPTIMIZED FLC RULE-BASE
PFLC (n) ṖAVG (n) NB NS ZE PS PB
SOC (n)
NB PSS PSS PS PM PB NS PSS ZE PSS PSS PM ZE NS NSS ZE PSS PS PS NSS NS NSS PM PSS PB NB NM NSS NSS NSS
VI. SIMULATION RESULTS The simulation of the EMSs described above is now
accomplished using the real data recorded from July 2103 to July 2014. The results and comparisons are performed by means of Matlab® numerical simulations using the parameters described in Table IV.
TABLE IV SIMULATION PARAMETERS
Symbol Description Value Unit
M Number of samples in one day 96 samples N Number of samples in a year 35040 samples PPV Photovoltaic rated power 4 kW PWT Wind turbine rated power 6 kW PLOAD Consumed rated power 7 kW Ts Sampling period 900 s TW Timing window 86400 s SOCMAX Maximum battery SOC 100 % DOD Battery depth of discharge 50 % ṖAVG,MIN Minimum slope of PAVG -0.0625 W/s ṖAVG,MAX Maximum slope of PAVG 0.07291 W/s k Maximum power given by FLC 1 kW
Fig 12 compares the grid power profile of the SMA strategy, the fuzzy EMS based on MG NPT and the proposed fuzzy EMS based on MG ERoC, highlighting the better results of this last one. In addition, Fig.13 confirms the correct evolution of the battery SOC which is keeping between secure limits.
Jul Aug Sep Oct Nov Dec Jan Feb Mar Apr May Jun Jul-6
-4
-2
0
2
4
6
Months (2013-2014)
Pow
er (
kW )
PGRID
SMA
Jul Aug Sep Oct Nov Dec Jan Feb Mar Apr May Jun Jul-6
-4
-2
0
2
4
6
Months (2013-2014)
Pow
er (
kW )
(a)
Jul Aug Sep Oct Nov Dec Jan Feb Mar Apr May Jun Jul-6
-4
-2
0
2
4
6
Months (2013-2014)
Pow
er (
kW )
PGRID
Fuzzy NPT
Jul Aug Sep Oct Nov Dec Jan Feb Mar Apr May Jun Jul-6
-4
-2
0
2
4
6
Months (2013-2014)
Pow
er (
kW )
(b)
Fig. 12. Grid power profile comparison (a) SMA strategy, (b) Fuzzy EMS based on MG NPT.
1949-3053 (c) 2015 IEEE. Personal use is permitted, but republication/redistribution requires IEEE permission. See http://www.ieee.org/publications_standards/publications/rights/index.html for more information.
This article has been accepted for publication in a future issue of this journal, but has not been fully edited. Content may change prior to final publication. Citation information: DOI 10.1109/TSG.2016.2555245, IEEETransactions on Smart Grid
9
Jul Aug Sep Oct Nov Dec Jan Feb Mar Apr May Jun Jul-6
-4
-2
0
2
4
6
Months (2013-2014)
Pow
er (
kW )
PGRID
Fuzzy ERoC
Jul Aug Sep Oct Nov Dec Jan Feb Mar Apr May Jun Jul-6
-4
-2
0
2
4
6
Months (2013-2014)
Pow
er (
kW )
(c)
Fig. 12. (Continued...) Grid power profile comparison, (c) proposed fuzzy EMS based on MG ERoC.
Jul Aug Sep Oct Nov Dec Jan Feb Mar Apr May Jun Jul50
55
60
65
70
75
80
85
90
95
100
Months (2013-2014)
SOC
( %
)
Jul Aug Sep Oct Nov Dec Jan Feb Mar Apr May Jun Jul50
55
60
65
70
75
80
85
90
95
100
Months (2013-2014)
SOC
( %
)
SOC Fuzzy ERoC
Fig. 13. Battery SOC evolution for the proposed fuzzy EMS based on MG energy rate-of-change.
In addition, Fig.14 shows the daily average profile of the battery SOC during the year under study obtained with each EMS designs previously described.
Jul Aug Sep Oct Nov Dec Jan Feb Mar Apr May Jun Jul50
75
100
SOC
( %
)
SMA Strategy
Jul Aug Sep Oct Nov Dec Jan Feb Mar Apr May Jun Jul50
75
100
SOC
( %
)
Fuzzy NPT
Jul Aug Sep Oct Nov Dec Jan Feb Mar Apr May Jun Jul50
75
100
Months (2013-2014)
SOC
( %
)
Fuzzy ERoC
Jul Aug Sep Oct Nov Dec Jan Feb Mar Apr May Jun Jul50
75
100
SOC
( %
)
Jul Aug Sep Oct Nov Dec Jan Feb Mar Apr May Jun Jul50
75
100
SOC
( %
)
Jul Aug Sep Oct Nov Dec Jan Feb Mar Apr May Jun Jul50
75
100
Months (2013-2014)
SOC
( %
)
Fig. 14. Daily average profile of the battery SOC during the year under study for the SMA strategy (top), the fuzzy EMS based on MG NPT (middle), and the proposed fuzzy EMS based on MG ERoC (bottom).
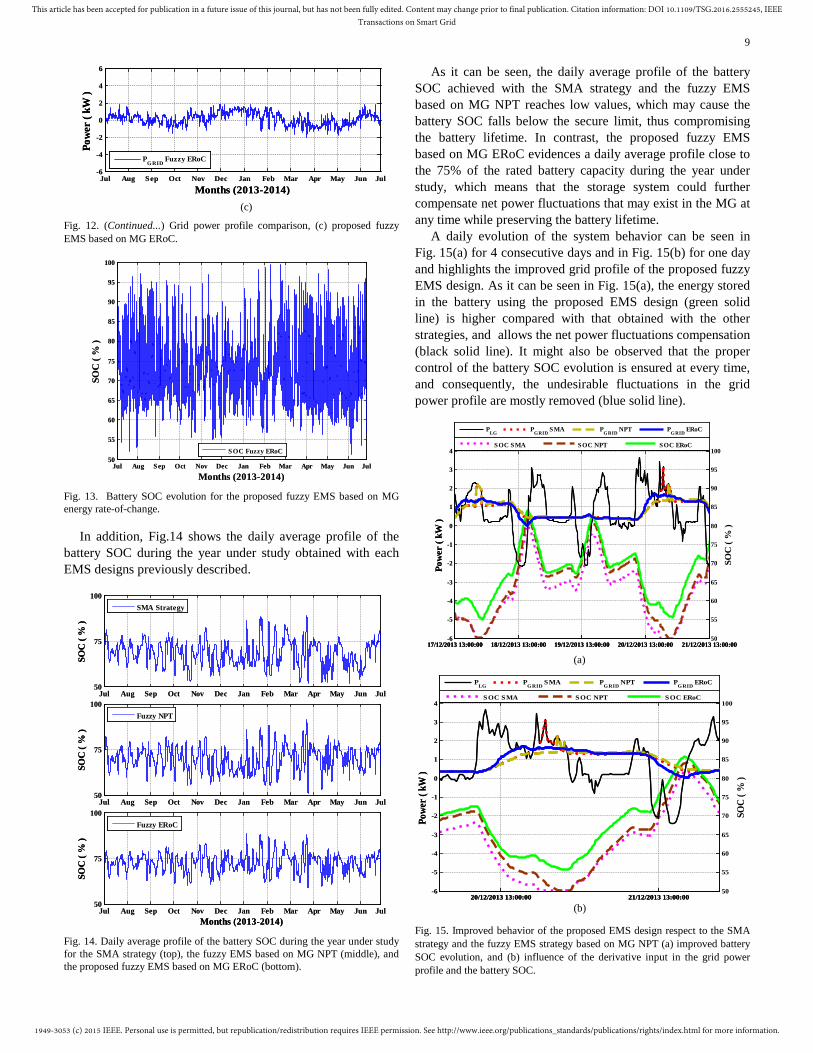
As it can be seen, the daily average profile of the battery SOC achieved with the SMA strategy and the fuzzy EMS based on MG NPT reaches low values, which may cause the battery SOC falls below the secure limit, thus compromising the battery lifetime. In contrast, the proposed fuzzy EMS based on MG ERoC evidences a daily average profile close to the 75% of the rated battery capacity during the year under study, which means that the storage system could further compensate net power fluctuations that may exist in the MG at any time while preserving the battery lifetime.
A daily evolution of the system behavior can be seen in Fig. 15(a) for 4 consecutive days and in Fig. 15(b) for one day and highlights the improved grid profile of the proposed fuzzy EMS design. As it can be seen in Fig. 15(a), the energy stored in the battery using the proposed EMS design (green solid line) is higher compared with that obtained with the other strategies, and allows the net power fluctuations compensation (black solid line). It might also be observed that the proper control of the battery SOC evolution is ensured at every time, and consequently, the undesirable fluctuations in the grid power profile are mostly removed (blue solid line).
17/12/2013 13:00:00 18/12/2013 13:00:00 19/12/2013 13:00:00 20/12/2013 13:00:00 21/12/2013 13:00:00-6
-5
-4
-3
-2
-1
0
1
2
3
4
Pow
er (
kW )
17/12/2013 13:00:00 18/12/2013 13:00:00 19/12/2013 13:00:00 20/12/2013 13:00:00 21/12/2013 13:00:0050
55
60
65
70
75
80
85
90
95
100
SOC
( %
)
PLG
PGRID
SMA PGRID
NPT PGRID
ERoC
SOC SMA SOC NPT SOC ERoC
17/12/2013 13:00:00 18/12/2013 13:00:00 19/12/2013 13:00:00 20/12/2013 13:00:00 21/12/2013 13:00:00-6
-5
-4
-3
-2
-1
0
1
2
3
4
Pow
er (
kW )
(a)
20/12/2013 13:00:00 21/12/2013 13:00:00-6
-5
-4
-3
-2
-1
0
1
2
3
4
Powe
r ( k
W )
20/12/2013 13:00:00 21/12/2013 13:00:0050
55
60
65
70
75
80
85
90
95
100
SOC
( % )
PLG
PGRID
SMA PGRID
NPT PGRID
ERoC
SOC SMA SOC NPT SOC ERoC
20/12/2013 13:00:00 21/12/2013 13:00:00-6
-5
-4
-3
-2
-1
0
1
2
3
4
Powe
r ( k
W )
(b)
Fig. 15. Improved behavior of the proposed EMS design respect to the SMA strategy and the fuzzy EMS strategy based on MG NPT (a) improved battery SOC evolution, and (b) influence of the derivative input in the grid power profile and the battery SOC.

1949-3053 (c) 2015 IEEE. Personal use is permitted, but republication/redistribution requires IEEE permission. See http://www.ieee.org/publications_standards/publications/rights/index.html for more information.
This article has been accepted for publication in a future issue of this journal, but has not been fully edited. Content may change prior to final publication. Citation information: DOI 10.1109/TSG.2016.2555245, IEEETransactions on Smart Grid
10
Furthermore, Fig. 15(b) highlights the advantage of adding the derivative input to the FLC. As it can be seen, in front of an abrupt consumption change in the MG (black solid line), the proposed fuzzy EMS design rapidly increases the power delivered by the grid (blue solid line), thus, preventing the discharge of the battery below the secure limit. On the contrary, the slow evolution of the power delivered by the grid provided by the SMA strategy (red dot line) and the EMS design based on MG NPT (mustard-colored dashed line), leads the battery to reach the secure limits, thus, breaking the battery SOC constraints.
Additionally, the enhanced behavior of the proposed EMS is also verified by computing the grid power profile quality criteria defined in Section III. The results are summarized in Table V.
TABLE V COMPARISON RESULTS OF THE QUALITY CRITERIA
EMS Strategy
Grid Power Profile Quality Criteria PG,MAX (kW)
PG,MIN (kW)
MPD (W/h)
APD (W/h) PPV
Net power profile 5.75 -6.45 18468 1121 13.3
SMA strategy 4.71 -2.40 12839 44.42 2.51
Fuzzy EMS based on MG
NPT 3.93 -2.12 11616 35.01 2.60
Proposed Fuzzy EMS based on
MG ERoC 1.83 -2.04 817 56.15 2.79
As it can be seen, the proposed fuzzy EMS achieves an important reduction in three of the quality criteria. With respect to the SMA strategy PG,MAX and PG,MIN are reduced in 61% and 15%, respectively, and 53% and 4%, respectively, with respect to the fuzzy EMS based on MG NPT. Moreover, the main improvement of the proposed EMS is the high reduction of the MPD criterion, achieving a reduction up to 94% and 93% with respect to the SMA strategy and the fuzzy EMS based on MG NPT, respectively. It can be noted that the improved behavior of the proposed fuzzy EMS based on MG ERoC comes mainly from the strong reduction of the MPD criterion, even though the APD and PPV values are slightly higher than the other strategies.
VII. EXPERIMENTAL VALIDATION
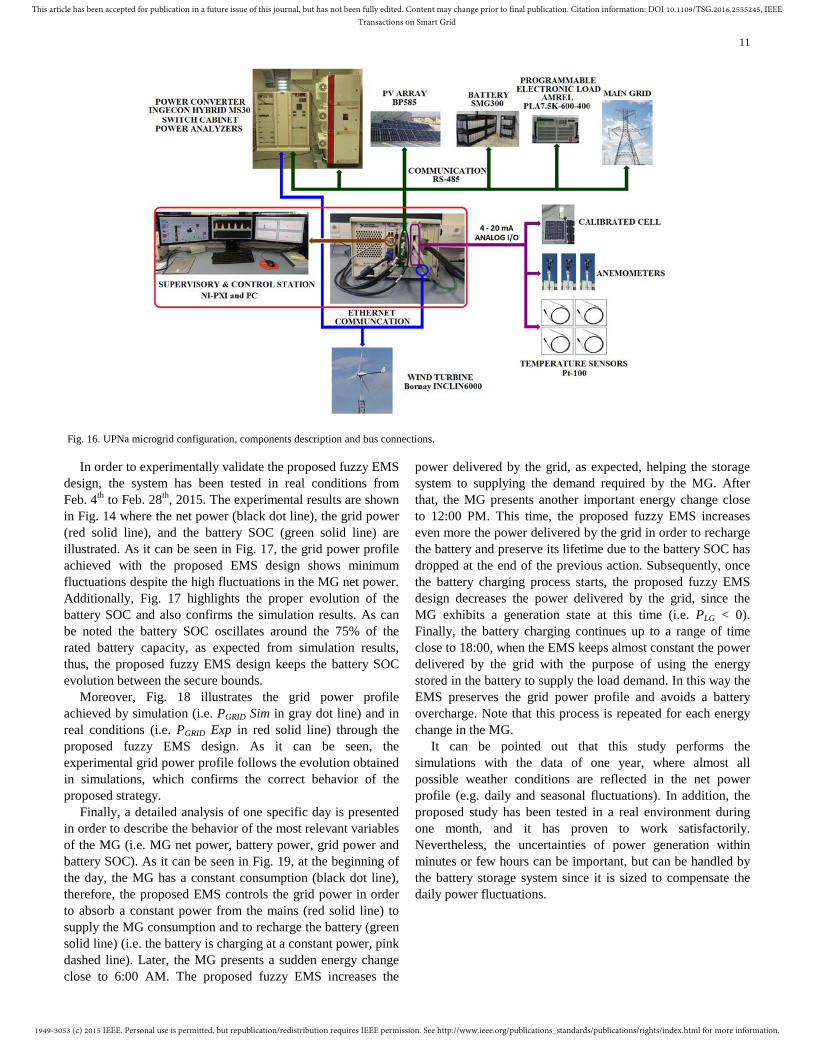
A. UPNa Microgrid Configuration The experimental validation of the proposed fuzzy EMS
design is executed in the MG installed at UPNa. The MG configuration is shown in Fig. 16 and includes a renewable generation system, a programmable load, an energy storage system, a power converter, a weather station, and a supervisory and control station [23], [38].
1) Renewable Generation System: The renewable generation system consists of photovoltaic and wind
generators. The photovoltaic array has a rated power of 4080 W. It is composed by 48 BP585 solar panels connected in four strings of 12 panels each. They are mounted facing south and tilted by 30º on the roof of UPNa Renewable Energy Laboratory.
The wind generator consists of a Bornay INCLIN6000 small wind turbine with a rated power of 6 kW located next to the UPNa Renewable Energy Laboratory.
2) Programmable Load: The load profile is physically emulated by an electronic load AMREL PLA7.5K-600-400. The electronic load is connected to the supervisory and control station through RS-485 communication bus.
3) Energy Storage System: The storage system includes 120 FIAMM SMG300 stationary lead-acid cells connected in series. Each cell has a rated voltage of 2 V and a C10 capacity of 300 Ah.
4) Power Converter: The UPNa MG uses a modified INGECON® HYBRID MS30, which includes a wind turbine power conversion module, a battery charger and photovoltaic power conversion module, and an inverter module.
5) Weather Station: In order to measure the environmental conditions of the different elements of the MG, a weather station is distributed along the MG. It is composed by an irradiance calibrated cell, two anemometers located at the wind turbine, one anemometer located next to the photovoltaic array, an outdoor temperature sensor, a PV panel temperature sensor, a battery temperature sensor, and a battery room temperature sensor.
6) Supervisory and Control Station: The supervisory and control station includes the National Instruments PCI eXtensions for Instrumentation (NI-PXI), power analyzers and a general purpose PC.
The NI-PXI uses four modules to acquire data from the power analyzers of each element and, to control in real time the different components of the MG. The modules used are the next: NI PXI-8102 Embedded Controller, NI PXI-8433/4 Serial Interface (Communication RS-485), NI PXI-8231 Gigabit Ethernet Interface, and NI PXI-6238 Analog I/O data acquisition board.
The power analyzers are located in the switch cabinet and measure the main electrical variables of each component of the MG (e.g. voltage, current, frequency).
The general purpose PC is used as the MG user interface and to display the historic data of the MG variables acquired by the NI-PXI.
B. Experimental Results and Analysis The proposed fuzzy EMS is programmed and compiled
through LabVIEW platform, and subsequently sent to the NI-PXI where the EMS algorithm runs in real-time. Note that the optimization process used in the FLC design sets the maximum and minimum boundaries for each input. Therefore, an additional signal conditioning is required in order to normalize the measured physical values within those bounds; otherwise, the FLC would deliver an unknown value causing an EMS failure.
1949-3053 (c) 2015 IEEE. Personal use is permitted, but republication/redistribution requires IEEE permission. See http://www.ieee.org/publications_standards/publications/rights/index.html for more information.
This article has been accepted for publication in a future issue of this journal, but has not been fully edited. Content may change prior to final publication. Citation information: DOI 10.1109/TSG.2016.2555245, IEEETransactions on Smart Grid
11
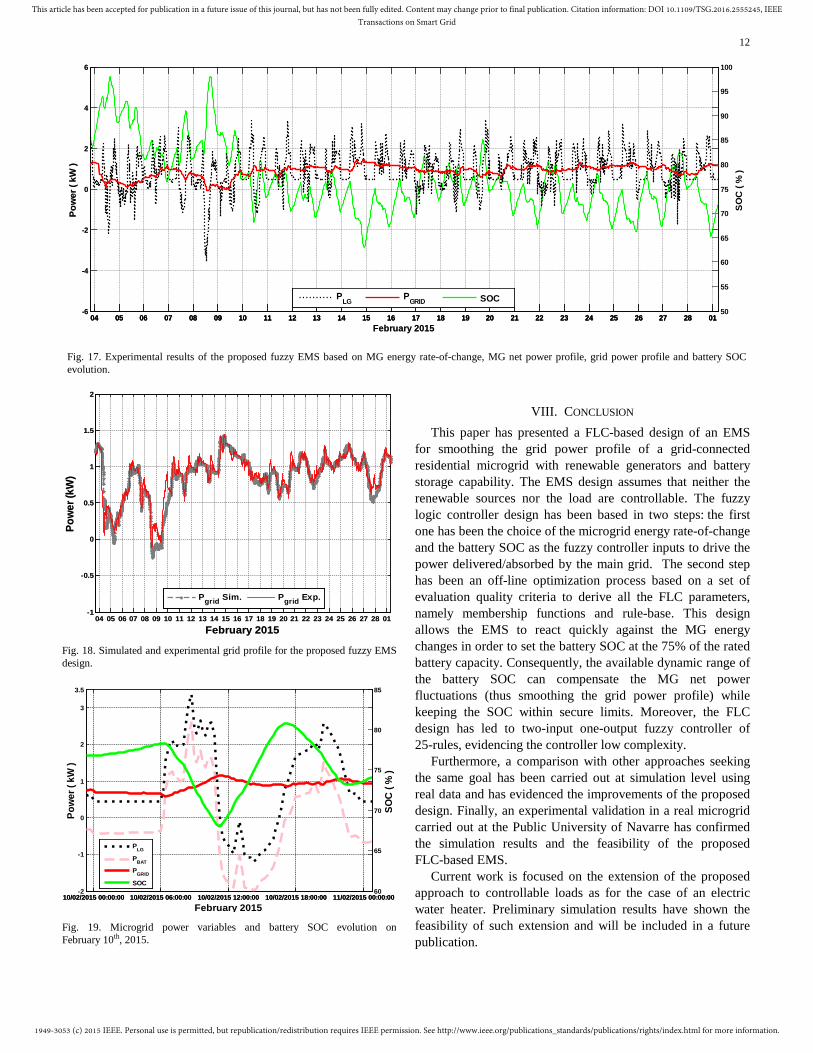
In order to experimentally validate the proposed fuzzy EMS design, the system has been tested in real conditions from Feb. 4th to Feb. 28th, 2015. The experimental results are shown in Fig. 14 where the net power (black dot line), the grid power (red solid line), and the battery SOC (green solid line) are illustrated. As it can be seen in Fig. 17, the grid power profile achieved with the proposed EMS design shows minimum fluctuations despite the high fluctuations in the MG net power. Additionally, Fig. 17 highlights the proper evolution of the battery SOC and also confirms the simulation results. As can be noted the battery SOC oscillates around the 75% of the rated battery capacity, as expected from simulation results, thus, the proposed fuzzy EMS design keeps the battery SOC evolution between the secure bounds.
Moreover, Fig. 18 illustrates the grid power profile achieved by simulation (i.e. PGRID Sim in gray dot line) and in real conditions (i.e. PGRID Exp in red solid line) through the proposed fuzzy EMS design. As it can be seen, the experimental grid power profile follows the evolution obtained in simulations, which confirms the correct behavior of the proposed strategy.
Finally, a detailed analysis of one specific day is presented in order to describe the behavior of the most relevant variables of the MG (i.e. MG net power, battery power, grid power and battery SOC). As it can be seen in Fig. 19, at the beginning of the day, the MG has a constant consumption (black dot line), therefore, the proposed EMS controls the grid power in order to absorb a constant power from the mains (red solid line) to supply the MG consumption and to recharge the battery (green solid line) (i.e. the battery is charging at a constant power, pink dashed line). Later, the MG presents a sudden energy change close to 6:00 AM. The proposed fuzzy EMS increases the
power delivered by the grid, as expected, helping the storage system to supplying the demand required by the MG. After that, the MG presents another important energy change close to 12:00 PM. This time, the proposed fuzzy EMS increases even more the power delivered by the grid in order to recharge the battery and preserve its lifetime due to the battery SOC has dropped at the end of the previous action. Subsequently, once the battery charging process starts, the proposed fuzzy EMS design decreases the power delivered by the grid, since the MG exhibits a generation state at this time (i.e. PLG < 0). Finally, the battery charging continues up to a range of time close to 18:00, when the EMS keeps almost constant the power delivered by the grid with the purpose of using the energy stored in the battery to supply the load demand. In this way the EMS preserves the grid power profile and avoids a battery overcharge. Note that this process is repeated for each energy change in the MG.
It can be pointed out that this study performs the simulations with the data of one year, where almost all possible weather conditions are reflected in the net power profile (e.g. daily and seasonal fluctuations). In addition, the proposed study has been tested in a real environment during one month, and it has proven to work satisfactorily. Nevertheless, the uncertainties of power generation within minutes or few hours can be important, but can be handled by the battery storage system since it is sized to compensate the daily power fluctuations.
Fig. 16. UPNa microgrid configuration, components description and bus connections.
1949-3053 (c) 2015 IEEE. Personal use is permitted, but republication/redistribution requires IEEE permission. See http://www.ieee.org/publications_standards/publications/rights/index.html for more information.
This article has been accepted for publication in a future issue of this journal, but has not been fully edited. Content may change prior to final publication. Citation information: DOI 10.1109/TSG.2016.2555245, IEEETransactions on Smart Grid
12
VIII. CONCLUSION This paper has presented a FLC-based design of an EMS
for smoothing the grid power profile of a grid-connected residential microgrid with renewable generators and battery storage capability. The EMS design assumes that neither the renewable sources nor the load are controllable. The fuzzy logic controller design has been based in two steps: the first one has been the choice of the microgrid energy rate-of-change and the battery SOC as the fuzzy controller inputs to drive the power delivered/absorbed by the main grid. The second step has been an off-line optimization process based on a set of evaluation quality criteria to derive all the FLC parameters, namely membership functions and rule-base. This design allows the EMS to react quickly against the MG energy changes in order to set the battery SOC at the 75% of the rated battery capacity. Consequently, the available dynamic range of the battery SOC can compensate the MG net power fluctuations (thus smoothing the grid power profile) while keeping the SOC within secure limits. Moreover, the FLC design has led to two-input one-output fuzzy controller of 25-rules, evidencing the controller low complexity.
Furthermore, a comparison with other approaches seeking the same goal has been carried out at simulation level using real data and has evidenced the improvements of the proposed design. Finally, an experimental validation in a real microgrid carried out at the Public University of Navarre has confirmed the simulation results and the feasibility of the proposed FLC-based EMS.
Current work is focused on the extension of the proposed approach to controllable loads as for the case of an electric water heater. Preliminary simulation results have shown the feasibility of such extension and will be included in a future publication.
04 05 06 07 08 09 10 11 12 13 14 15 16 17 18 19 20 21 22 23 24 25 26 27 28 01-6
-4
-2
0
2
4
6P
ower
( kW
)
February 2015
04 05 06 07 08 09 10 11 12 13 14 15 16 17 18 19 20 21 22 23 24 25 26 27 28 0150
55
60
65
70
75
80
85
90
95
100
SO
C (
% )
04 05 06 07 08 09 10 11 12 13 14 15 16 17 18 19 20 21 22 23 24 25 26 27 28 01-6
-4
-2
0
2
4
6P
ower
( kW
)
February 2015
PLG PGRID SOC
Fig. 17. Experimental results of the proposed fuzzy EMS based on MG energy rate-of-change, MG net power profile, grid power profile and battery SOC evolution.
04 05 06 07 08 09 10 11 12 13 14 15 16 17 18 19 20 21 22 23 24 25 26 27 28 01-1
-0.5
0
0.5
1
1.5
2
Pow
er (k
W)
February 2015
Pgrid Sim. Pgrid Exp.
04 05 06 07 08 09 10 11 12 13 14 15 16 17 18 19 20 21 22 23 24 25 26 27 28 01-1
-0.5
0
0.5
1
1.5
2
Pow
er (k
W)
February 2015
Fig. 18. Simulated and experimental grid profile for the proposed fuzzy EMS design.
10/02/2015 00:00:00 10/02/2015 06:00:00 10/02/2015 12:00:00 10/02/2015 18:00:00 11/02/2015 00:00:00-2
-1
0
1
2
3
3.5
Pow
er (
kW )
February 2015
10/02/2015 00:00:00 10/02/2015 06:00:00 10/02/2015 12:00:00 10/02/2015 18:00:00 11/02/2015 00:00:0060
65
70
75
80
85
SOC
( %
)
PLG
PBAT
PGRID
SOC
Fig. 19. Microgrid power variables and battery SOC evolution on February 10th, 2015.
1949-3053 (c) 2015 IEEE. Personal use is permitted, but republication/redistribution requires IEEE permission. See http://www.ieee.org/publications_standards/publications/rights/index.html for more information.
This article has been accepted for publication in a future issue of this journal, but has not been fully edited. Content may change prior to final publication. Citation information: DOI 10.1109/TSG.2016.2555245, IEEETransactions on Smart Grid
13
REFERENCES [1] K. Rahbar, J. Xu, and R. Zhang, “Real-Time Energy Storage
Management for Renewable Integration in Microgrid: An Off-Line Optimization Approach,” IEEE Trans. Smart Grid, vol. 6, no. 1, pp. 124–134, Jan. 2015.
[2] S. Bacha, D. Picault, B. Burger, I. Etxeberria-Otadui, and J. Martins, “Photovoltaics in Microgrids: An Overview of Grid Integration and Energy Management Aspects,” IEEE Ind. Electron. Mag., vol. 9, no. 1, pp. 33–46, Mar. 2015.
[3] N. W. A. Lidula and A. D. Rajapakse, “Microgrids research: A review of experimental microgrids and test systems,” Renewable and Sustainable Energy Reviews, vol. 15, no. 1, pp. 186–202, Jan. 2011.
[4] P. Siano, C. Cecati, H. Yu, and J. Kolbusz, “Real time operation of smart grids via FCN networks and optimal power flow,” IEEE Trans. Ind. Inf., vol. 8, no. 4, pp. 944–952, Nov. 2012.
[5] N. Hatziargyriou, H. Asano, R. Iravani, and C. Marnay, “Microgrids,” IEEE Power and Energy Mag., vol. 5, no. 4, pp. 78–94, Jul. 2007.
[6] R. H. Lasseter, “MicroGrids,” in Proc. Power Eng. Soc. Winter Meeting, Jan. 2002, vol. 1, pp. 305–308.
[7] F. Katiraei, R. Iravani, N. Hatziargyriou, and A. Dimeas, “Microgrids management,” IEEE Power and Energy Mag., vol. 6, no. 3, pp. 54–65, May. 2008.
[8] Pan and S. Das, “Kriging Based Surrogate Modeling for Fractional Order Control of Microgrids,” IEEE Trans. Smart Grid, vol. 6, no. 1, pp. 36–44, Jan. 2015.
[9] Q. Jiang, M. Xue, and G. Geng, “Energy management of microgrid in grid-connected and stand-alone modes,” IEEE Trans. Power Syst., vol. 28, no. 3, pp. 3380–3389, Aug. 2013.
[10] D. E. Olivares, C. A. Cañizares, and M. Kazerani, “A centralized energy management system for isolated microgrids,” IEEE Trans. Smart Grid, vol. 5, no. 4, pp. 1864–1875, Jul. 2014.
[11] N. Hatziargyriou, “Microgrids: Architectures and Control,” Chichester, UK: Wiley, 2014, pp. 1–24.
[12] R. Palma-Behnke, C. Benavides, F. Lanas, B. Severino, L. Reyes, J. Llanos, and D. Saez, “A microgrid energy management system based on the rolling horizon strategy,” IEEE Trans. Smart Grid, vol. 4, no. 2, pp. 996–1006, Jun. 2013.
[13] P. Malysz, S. Sirouspour, and A. Emadi, “An optimal energy storage control strategy for grid-connected microgrids,” IEEE Trans. Smart Grid, vol. 5, no. 4, pp. 1785–1796, Jul. 2014.
[14] M. Yazdanian and A. Mehrizi-Sani, “Distributed Control Techniques in Microgrids,” IEEE Trans. Smart Grid, vol. 5, no. 6, pp. 2901–2909, Nov. 2014.
[15] D. E. Olivares, A. Mehrizi-Sani, A. H. Etemadi, C. a. Cañizares, R. Iravani, M. Kazerani, A. H. Hajimiragha, O. Gomis-Bellmunt, M. Saeedifard, R. Palma-Behnke, G. a. Jiménez-Estévez, and N. D. Hatziargyriou, “Trends in microgrid control,” IEEE Trans. Smart Grid, vol. 5, no. 4, pp. 1905–1919, Jul. 2014.
[16] D. Tran and A. M. Khambadkone, “Energy management for lifetime extension of energy storage system in micro-grid applications,” IEEE Trans. Smart Grid, vol. 4, no. 3, pp. 1289–1296, Sep. 2013.
[17] M. Marinelli, F. Sossan, G. T. Costanzo, and H. W. Bindner, “Testing of a Predictive Control Strategy for Balancing Renewable Sources in a Microgrid,” IEEE Trans. Sustain. Energy, vol. 5, no. 4, pp. 1426–1433, Oct. 2014.
[18] P. García, J. P. Torreglosa, L. M. Fernández, and F. Jurado, “Optimal energy management system for stand-alone wind turbine/photovoltaic/hydrogen/battery hybrid system with supervisory control based on fuzzy logic,” International Journal of Hydrogen Energy, vol. 38, no. 33, pp. 14146–14158, Nov. 2013.
[19] J. Lagorse, M. G. Simoes, and A. Miraoui, “A Multiagent Fuzzy-Logic-Based Energy Management of Hybrid Systems,” IEEE Trans. on Ind. Applicat., vol. 45, no. 6, pp. 2123–2129, Nov.-Dec. 2009.
[20] G. Kyriakarakos, A. I. Dounis, K. G. Arvanitis, and G. Papadakis, “A fuzzy logic energy management system for polygeneration microgrids,” Renewable Energy, vol. 41, pp. 315–327, May. 2012.
[21] Y.-K. Chen, Y.-C. Wu, C.-C. Song, and Y.-S. Chen, “Design and Implementation of Energy Management System With Fuzzy Control for DC Microgrid Systems,” IEEE Trans. Power Electron., vol. 28, no. 4, pp. 1563–1570, Apr. 2013.
[22] L. Roine, K. Therani, Y. S. Manjili, and M. Jamshidi, “Microgrid energy management system using fuzzy logic control,” in 2014 World
Automation Congress (WAC), Waikoloa, HI, USA, Aug. 2014, pp. 462–467.
[23] J. Pascual, P. Sanchis, and L. Marroyo, “Implementation and control of a residential electrothermal microgrid based on renewable energies, a hybrid storage system and demand side management,” Energies, vol. 7, no. 1, pp. 210–237, Jan. 2014.
[24] Tascikaraoglu, A. R. Boynuegri, and M. Uzunoglu, “A demand side management strategy based on forecasting of residential renewable sources: A smart home system in Turkey,” Energy and Buildings, vol. 80, pp. 309–320, Sep. 2014.
[25] D. Wang, S. Ge, H. Jia, C. Wang, Y. Zhou, N. Lu, and X. Kong, “A demand response and battery storage coordination algorithm for providing microgrid Tie-Line smoothing services,” IEEE Trans. Sustain. Energy, vol. 5, no. 2, pp. 476–486, Apr. 2014.
[26] Prodan and E. Zio, “A model predictive control framework for reliable microgrid energy management,” International Journal of Electrical Power & Energy Systems, vol. 61, pp. 399–409, Oct. 2014.
[27] G. Bruni, S. Cordiner, V. Mulone, V. Rocco, and F. Spagnolo, “A study on the energy management in domestic micro-grids based on Model Predictive Control strategies,” Energy Conversion and Management, vol. 102, pp. 50–58, Sep. 2015.
[28] W. A. Bisschoff and R. Gouws, “Energy management system for a residential grid-tied micro-grid,” in 2015 International Conference on the Domestic Use of Energy (DUE), Cape Town, South Africa, Mar. 2015, pp. 85–91.
[29] H. Zhou, T. Bhattacharya, D. Tran, T. S. T. Siew, and A. M. Khambadkone, “Composite Energy Storage System Involving Battery and Ultracapacitor With Dynamic Energy Management in Microgrid Applications,” IEEE Trans. Power Electron., vol. 26, no. 3, pp. 923–930, Mar. 2011.
[30] J. J. Barricarte, I. S. Martín, P. Sanchis, and L. Marroyo, “Energy Management Strategies For Grid Integration Of Microgrids Based On Renewable Energy Sources,” in 10th Int. Conf. Sustain. Energy Technol., Istambul, Turkey, Sep. 2011, pp. 4–7.
[31] K. Passino and S. Yurkovich, Fuzzy Control. Menlo Park, CA: Addisson-Wesley, 1998.
[32] Mohamed and O. Mohammed, “Real-time energy management scheme for hybrid renewable energy systems in smart grid applications,” Electric Power Systems Research, vol. 96, pp. 133–143, Mar. 2013.
[33] J. P. Fossati, A. Galarza, A. Martín-Villate, J. M. Echeverría, and L. Fontán, “Optimal scheduling of a microgrid with a fuzzy logic controlled storage system,” International Journal of Electrical Power & Energy Systems, vol. 68, pp. 61–70, Jun. 2015.
[34] D. A. Aviles, F. Guinjoan, J. Barricarte, L. Marroyo, P. Sanchis, and H. Valderrama, “Battery management fuzzy control for a grid- tied microgrid with renewable generation,” in IECON 2012 - 38th Annual Conference on IEEE Industrial Electronics Society, Montreal, QC, Canada, Oct. 2012, pp. 5607–5612.
[35] D. Arcos-Aviles, N. Espinosa, F. Guinjoan, L. Marroyo, and P. Sanchis, “Improved Fuzzy Controller Design for Battery Energy Management in a Grid Connected Microgrid,” in IECON 2014 - 40th Annual Conference on IEEE Industrial Electronics Society, Dallas, TX, USA, Oct. 2014, pp. 2128–2133.
[36] S. Anuphappharadorn, S. Sukchai, C. Sirisamphanwong, and N. Ketjoy, “Comparison the economic analysis of the battery between lithium-ion and lead-acid in PV stand-alone application,” Energy Procedia, vol. 56, pp. 352–358, 2014.
[37] D. Arcos-Aviles, J. Pascual, L. Marroyo, P. Sanchis, F. Guinjoan, and M. P. Marietta, “Optimal Fuzzy Logic EMS design for residential grid-connected microgrid with hybrid renewable generation and storage,” in 2015 IEEE 24th International Symposium on Industrial Electronics (ISIE), Buzios, Brasil, Jun. 2015, pp. 742–747.
[38] J. Pascual, J. Barricarte, P. Sanchis, and L. Marroyo, “Energy management strategy for a renewable-based residential microgrid with generation and demand forecasting,” Appied. Energy, vol. 158, pp. 12–25, Nov. 2015.
[39] J. Pascual, I. S. Martín, A. Ursúa, P. Sanchis, and L. Marroyo, “Implementation and control of a residential microgrid based on renewable energy sources, hybrid storage systems and thermal controllable loads,” in 2013 IEEE Energy Conversion Congress and Exposition (ECCE), Denver, CO, USA, Sep. 2013, pp. 2304–2309.
[40] T. Butz, Fourier Transformation for Pedestrians, Second. Cham, Switzerland: Springer International Publishing, 2015.

1949-3053 (c) 2015 IEEE. Personal use is permitted, but republication/redistribution requires IEEE permission. See http://www.ieee.org/publications_standards/publications/rights/index.html for more information.
This article has been accepted for publication in a future issue of this journal, but has not been fully edited. Content may change prior to final publication. Citation information: DOI 10.1109/TSG.2016.2555245, IEEETransactions on Smart Grid
14
[41] K. H. Ang, G. Chong, and Y. Li, “PID control system analysis, design, and technology,” IEEE Trans. Control Syst. Technol., vol. 13, no. 4, pp. 559–576, Jul. 2005.
[42] J. Marcos, I. de la Parra, M. García, and L. Marroyo, “Control Strategies to Smooth Short-Term Power Fluctuations in Large Photovoltaic Plants Using Battery Storage Systems,” Energies, vol. 7, no. 10, pp. 6593–6619, Oct. 2014.
Diego Arcos-Aviles (S’12) was born in Quito, Ecuador, in 1978. He received the B.Sc. degree in Electronics, Automation and Control Engineering from Universidad de las Fuerzas Armadas ESPE, Sangolquí, Ecuador, in 2002 and the M.Sc. degree in Electronics Engineering from Universitat Politècnica de Catalunya, Barcelona, Spain, in 2012, where he is currently pursuing the Ph.D. degree in the same area. He is Associate Professor at Department of
Electrical and Electronics Engineering of Universidad de las Fuerzas Armadas ESPE since 2002, where he has been involved in many research projects related to automation of industrial processes, control systems applications and control of power electronics. His research interests include energy management of microgrids, control of power electronics, smart grids and renewable generation systems.
Julio Pascual (S’12) was born in Pamplona, Spain, in 1985. He received the B.Sc., M.Sc. and Ph.D. degrees in Electrical Engineering from the Public University of Navarre, Pamplona, Spain, in 2011, 2012 and 2016 respectively. In 2011, he joined the Department of Electrical and Electronic Engineering, Public University of Navarre, first as a Researcher at the Electrical Engineering, Power Electronics and Renewable Energy research group (INGEPER), and since 2015, as an Assistant Professor. His main
research interests include energy management strategies for microgrids focusing on energy storage and load, solar and wind power forecasting.
Luis Marroyo (M’04) received the M.Sc. degree in Electrical Engineering in 1993 from the University of Toulouse, France, and the Ph.D. degree in Electrical Engineering in 1997 from the Public University of Navarre (UPNa), Spain, and in 1999 from the LEEI-ENSEEIHT INP Toulouse, France. From 1993 to 1998, he was Assistant Professor at the Department of Electrical and Electronic Engineering of the UPNa, where he currently works
as Associate Professor, since 1998. He is the head of the Electrical Engineering, Power Electronics and Renewable Energy research group (INGEPER).
Dr. Marroyo has been involved in more than 60 research projects mainly, in co-operation with industry, he is the co-inventor of 11 international patents and co-authored of more than 75 papers in international journals and conferences. His research interests include power electronics, grid quality and renewable energy.
Pablo Sanchis (M’03, SM’12) received the M.Sc. and Ph.D. degrees in Electrical Engineering in 1995 and 2002, respectively, and the M.Sc. degree in Management and Business Administration in 1994, all from the Public University of Navarre (UPNa), Pamplona, Spain.
From 1996 to 1998, he worked as a Guest Researcher at Delft University of Technology, The Netherlands, on the field of control of electric machines. In 1998, he joined the Department of
Electrical and Electronic Engineering at the Public University of Navarre, Spain, where he is currently Associate Professor. He is also Director of the UPNa Chair for Renewable Energies and Vice Dean of the Technical School for Industrial Engineering and Telecommunications.
Dr. Sanchis is member of the IEEE, the IET, the CIGRE and the Spanish Hydrogen Association (AEH2). He has been involved in many research projects mainly in co-operation with industry. His research interests include renewable energies, power electronics, hydrogen technologies, electric grid integration and electric microgrids
Francesc Guinjoan (M’92) received the Ingeniero de Telecomunicación and the Doctor Ingeniero de Telecomunicación degrees from the Universitat Politècnica de Catalunya (UPC), Barcelona, Spain, in 1984 and 1990, respectively, and the Docteur es Sciences degree from Université Paul Sabatier, Toulouse, France, in 1992.
He is currently an Associate Professor with the Departamento de Ingeniería Electrónica, Escuela Técnica Superior de Ingenieros de Telecomunicación de Barcelona, UPC. He has coauthored more than 80 papers in international journals and conference proceedings. His research interests include power electronics modeling and control for renewable energy systems.
Dr. Guinjoan was a Guest Coeditor of the Special Issue on “Smart Devices for Renewable Energy Systems” of the IEEE TRANSACTIONS ON INDUSTRIAL ELECTRONICS in 2011.
Related Documents