Future sight loss UK (2): An epidemiological and economic model for sight loss in the decade 2010-2020 Full report Report prepared for RNIB by Darwin Minassian and Angela Reidy EpiVision July 2009

Welcome message from author
This document is posted to help you gain knowledge. Please leave a comment to let me know what you think about it! Share it to your friends and learn new things together.
Transcript

Future sight loss UK (2): Anepidemiological and economicmodel for sight loss in thedecade 2010-2020
Full report
Report prepared for RNIB
by Darwin Minassian and Angela ReidyEpiVision
July 2009
2
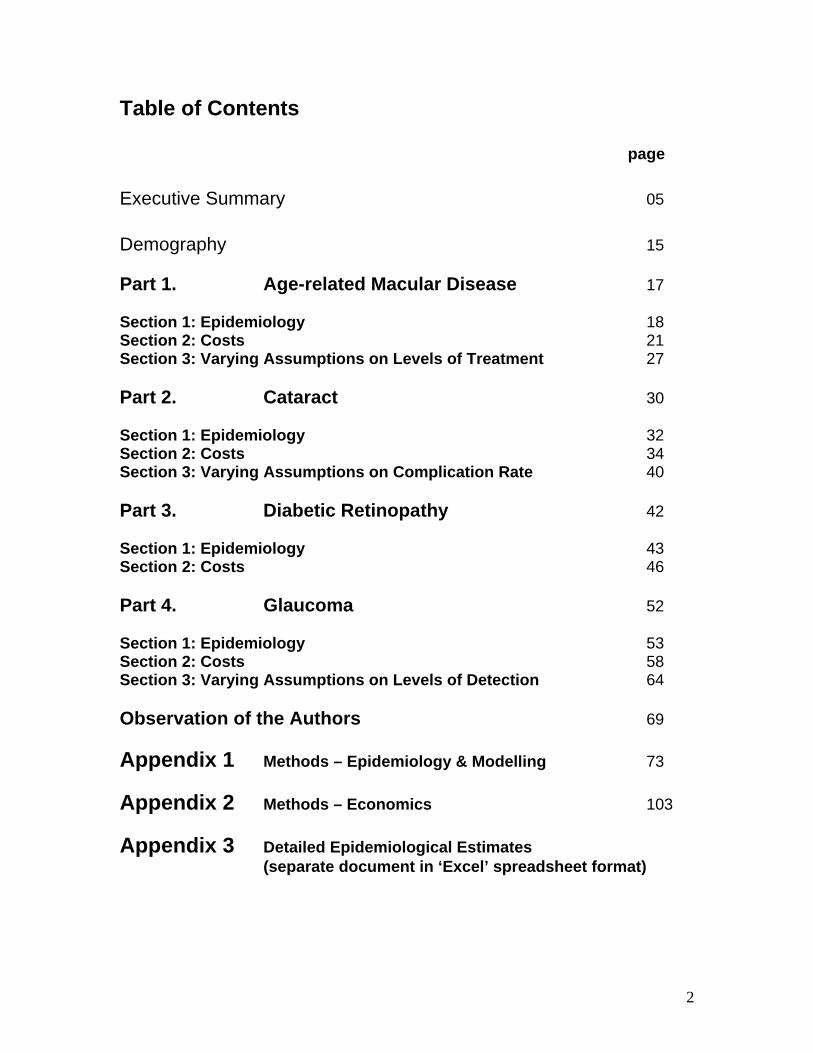
Table of Contents
page Executive Summary 05
Demography 15 Part 1. Age-related Macular Disease 17 Section 1: Epidemiology 18 Section 2: Costs 21 Section 3: Varying Assumptions on Levels of Treatment 27 Part 2. Cataract 30 Section 1: Epidemiology 32 Section 2: Costs 34 Section 3: Varying Assumptions on Complication Rate 40 Part 3. Diabetic Retinopathy 42 Section 1: Epidemiology 43 Section 2: Costs 46 Part 4. Glaucoma 52 Section 1: Epidemiology 53 Section 2: Costs 58 Section 3: Varying Assumptions on Levels of Detection 64 Observation of the Authors 69 Appendix 1 Methods – Epidemiology & Modelling 73 Appendix 2 Methods – Economics 103 Appendix 3 Detailed Epidemiological Estimates (separate document in ‘Excel’ spreadsheet format)
3
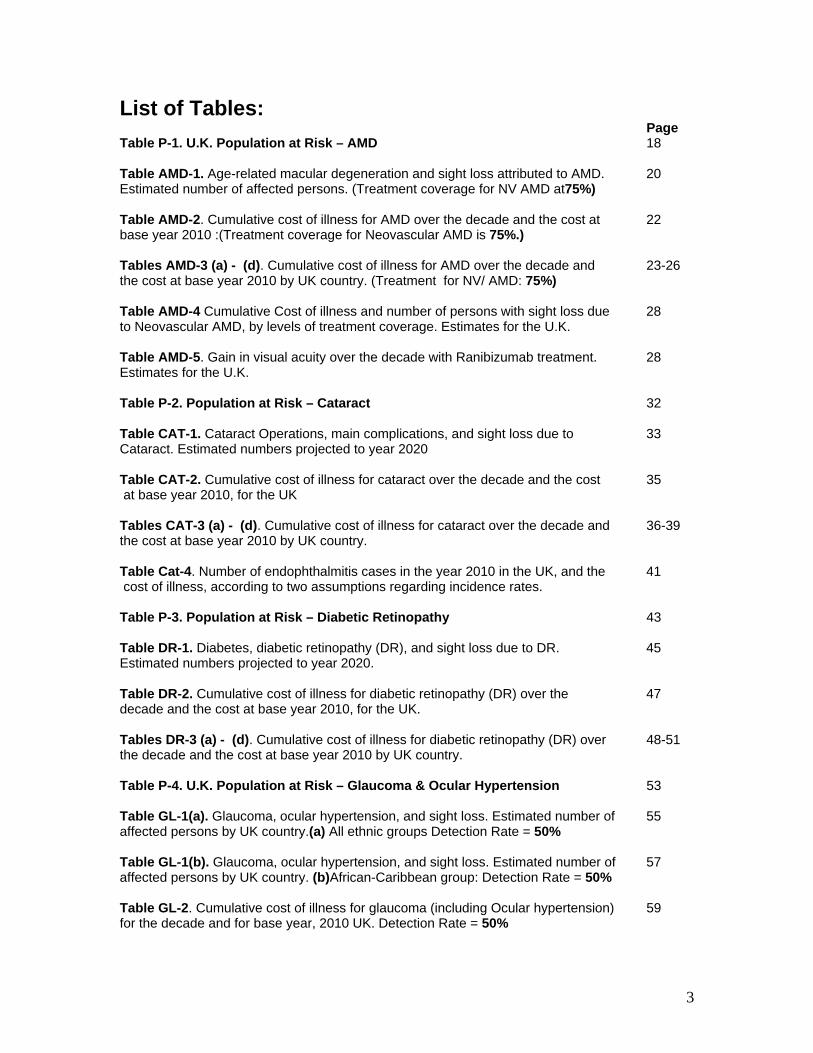
List of Tables: Page Table P-1. U.K. Population at Risk – AMD 18 Table AMD-1. Age-related macular degeneration and sight loss attributed to AMD. 20 Estimated number of affected persons. (Treatment coverage for NV AMD at75%) Table AMD-2. Cumulative cost of illness for AMD over the decade and the cost at 22 base year 2010 :(Treatment coverage for Neovascular AMD is 75%.) Tables AMD-3 (a) - (d). Cumulative cost of illness for AMD over the decade and 23-26 the cost at base year 2010 by UK country. (Treatment for NV/ AMD: 75%) Table AMD-4 Cumulative Cost of illness and number of persons with sight loss due 28 to Neovascular AMD, by levels of treatment coverage. Estimates for the U.K. Table AMD-5. Gain in visual acuity over the decade with Ranibizumab treatment. 28 Estimates for the U.K. Table P-2. Population at Risk – Cataract 32 Table CAT-1. Cataract Operations, main complications, and sight loss due to 33 Cataract. Estimated numbers projected to year 2020 Table CAT-2. Cumulative cost of illness for cataract over the decade and the cost 35 at base year 2010, for the UK Tables CAT-3 (a) - (d). Cumulative cost of illness for cataract over the decade and 36-39 the cost at base year 2010 by UK country. Table Cat-4. Number of endophthalmitis cases in the year 2010 in the UK, and the 41 cost of illness, according to two assumptions regarding incidence rates. Table P-3. Population at Risk – Diabetic Retinopathy 43 Table DR-1. Diabetes, diabetic retinopathy (DR), and sight loss due to DR. 45 Estimated numbers projected to year 2020. Table DR-2. Cumulative cost of illness for diabetic retinopathy (DR) over the 47 decade and the cost at base year 2010, for the UK. Tables DR-3 (a) - (d). Cumulative cost of illness for diabetic retinopathy (DR) over 48-51 the decade and the cost at base year 2010 by UK country. Table P-4. U.K. Population at Risk – Glaucoma & Ocular Hypertension 53 Table GL-1(a). Glaucoma, ocular hypertension, and sight loss. Estimated number of 55 affected persons by UK country.(a) All ethnic groups Detection Rate = 50% Table GL-1(b). Glaucoma, ocular hypertension, and sight loss. Estimated number of 57 affected persons by UK country. (b)African-Caribbean group: Detection Rate = 50% Table GL-2. Cumulative cost of illness for glaucoma (including Ocular hypertension) 59 for the decade and for base year, 2010 UK. Detection Rate = 50%

4
Tables GL-3 (a) - (d). Cumulative cost of illness for glaucoma over the decade 60-63 and the cost at base year 2010 by UK country. Detection Rate = 50%. Table GL-4. Glaucoma, ocular hypertension, and sight loss due to glaucoma. 64 Estimated number of diagnosed cases for the U.K in relation to the assumed Detection Rate. Table GL-5. Cumulative cost of illness for glaucoma and ocular hypertension 65 over the decade and the cost at base year 2010. Assumption-2: Improved detection rate = 75%. Table GL-6. Cumulative cost of illness for glaucoma and ocular hypertension 66 over the decade and the cost at base year 2010. Assumption-3: Improved detection rate = 90%. Table GL-7. Cumulative Cost of illness and number of persons with sight loss 67 due to glaucoma, at 3 levels of detection rate. Estimates for the U.K.
Advisory Committee Jennifer Beecham Henry Cutler Parul Desai Alistair Fielder, Anita Lightstone David Lye Pritti Mehta Lynne Pezzullo, John Ravenscroft Steve Winyard
Executive Summary
5
Executive Summary
Future Sight Loss in the Decade 2010 to 2020
An Epidemiological and Economic Model
This work was commissioned by the Royal National Institute of Blind People.
Commissioned Brief
The brief was that epidemiologists experienced in the area of ophthalmic
research should apply the best methods to derive estimates of the numbers of
persons that were likely to have Age-related macular Disease, Cataract, Diabetic
Retinopathy and Glaucoma at two points in time 2010 and 2020. The baseline
and cumulative costs to society of the prevailing health and social care provision
and support in that time frame were to be estimated by an economist with
experience of Ophthalmic research using a cost of illness approach from the
societal perspective. A committee composed of clinical and academic members
would have an advisory role.
The epidemiological and economic findings would provide estimates available to
inform the UK Vision strategy up to 2020.
Structure of this Report
As this is a working document to inform the strategy, it is structured to allow each
eye disease to stand alone for the estimated numbers and the related costs of
the resources. Apart from notes which explain some basic terms, methods are
presented in Appendices, as are the additional epidemiological tables for the
prevalence of disease by age and sex for the year.

Executive Summary
6
The report has an Executive Summary, four main Parts 1-4, one for each
disease, and Appendices 1-3 which hold prevalence tables by age group and
gender, and sections on methods for epidemiology and costing.
Within the main Parts, the epidemiological estimates of numbers for each
disease and for the categories of that disease are given as Section 1. This
covers a Decade, for the year 2010 (the base year), 2015 and 2020, for the UK
and the “devolved countries “.
Section 2 presents the estimated costs to society of the resources used in health
and social service and in providing informal care. All are directly related to the
provision of care for those with, or at serious risk of, sight loss from the relevant
eye disease.
These estimates and projections are made within the requirements of the initial
brief that the recognised / recommended treatment for those diseases, forms the
clinical basis for disease progression. This requires assumptions to be made at
times about the rate of coverage of treatment and if these are varied in the model
they are found in Section 3 of the relevant part of the report.
In this report, Partial Sight is defined as corrected visual acuity </612-6/60 in the
better seeing eye. Blindness is defined as corrected visual acuity < 6/60 in the
better seeing eye. The term ‘Sight Loss’ is used to indicate partial sight or
blindness. For glaucoma, the definitions also take into account severe restriction
of visual fields.

Executive Summary
7
Key Findings Age-related Macular Degeneration (AMD)
year 2010 year 2020
Population at risk, UK 21,585,853 25,332,332 Persons with this disease are grouped here into early AMD, Neovascular AMD
(wet) and Geographic atrophy (dry), and analysed further by those partially
sighted and those blind from the disease.
Numbers with the disease
• 1,493,963 persons are estimated to have early AMD in 2010. By the end of the
decade this is projected to be 1,821,434.
• Additionally, 414,561 in 2010 are estimated to have Neovascular AMD (wet) in
one or both eyes and this will increase to 515,509 in 2020
• Apart from Neovascular AMD, 193,652 are estimated to have Geographic
Atrophy (dry AMD) only in one or both eyes in 2010, increasing to 240,358 in
2020.
Sight Loss from both types of AMD.
In 2010 caused by both types of AMD, 132,970 will be partially sighted and
90,254 will be blind. This is assuming that the new treatment for Neovascular
AMD covers 75% of those eligible from year 2010.
In 2020 the numbers expected to be partially sighted are 171,530, and 120,452
are expected to be blind. This is under the same assumption of 75% of
Neovascular AMD treated, but allows for the increase in overall numbers of older
persons in the population.

Executive Summary
8
Cost More than £1.6 billion in 2010 is the estimated cost of detection, treatment and
provision of state and family social care for all those with Age-related Macular
Disease. This is under the assumed 75% levels of anti-VEGF treatment for NV
AMD and assuming status quo for “low vision” service for AMD. More than £16.4 billion is the estimated cumulative cost over the decade 2010 to 2020, under the
same conditions but allowing for demographic change (at 2008/9 prices used at the
baseline year of 2010). For the decade, the health care treatment component
amounts to 17.8% of the total, i.e. more than £2.9 billion. The personal and
social costs are 76%, i.e. more than £12.5 billion pounds. These proportions
vary little for the single countries within the UK.
Varying the Assumptions about Treatment Levels
In our model, varying the assumptions about the likely percentage receiving
treatment among suitable cases of Neovascular AMD, would have the following
results:
If only 50% of those with neovascular disease are treated the numbers with sight
loss due to Neovascular AMD will be 149,326 in 2010. If 90% are treated this
number will be less, at 143,519 with sight loss, a difference of 5,807. Sight Restored by Treatment
The gain in visual acuity over the decade due to Ranibizumab treatment was
considered in terms of numbers who convert from being partially sighted to
having adequate vision (6/12 or better), under the 3 assumed levels of treatment
coverage. The expected numbers (to nearest 1000) regaining sight in this way
over the decade are: 67,000 at 50% treatment coverage, 96,000 persons at 75%
coverage, and 112,000 at 90% treatment coverage. Over the decade, number of
people expected to convert from blindness to partially sighted are: 6,000 at 50%

Executive Summary
9
treatment coverage, 8,000 at 75% coverage, and 10,000 at 90% treatment
coverage.
For the year 2010, the AMD overall health care costs will be £256,630,028 at
50% treatment, and £354,290,363 at 90% treatment, an increase of £ 97.66 million. The social and personal costs will be £1,263,008,484 and
£1,237,632,225 at 50% and 90% respectively, showing a difference (decrease)
of £25.376 million
Cataract
year 2010 year 2020
Population at risk, UK 30,784,728 33,462,473
Sight Loss from Cataract
For 2010 our model estimates that prevalence of partial sight due to cataract will
be 206,224 and blindness to be 27,907. In 2020, should this condition remain
visually impairing at this level in the population, it is estimated that 248,504 will
be partially sighted, and 32,750 will be blind.
Number of Cataract Operations
Based upon the surgical workload for 2007/8 the number of cataract operations
in 2010 are likely to be more than 389 thousand and based upon the expected
population structure this will have increased to a yearly surgical load of 473,944
in 2020.

Executive Summary
10
Cost £995,144,453 in 2010 is the estimated cost which includes referral, and surgical
treatment for those with operable cataract, and for ongoing social and personal
care for those who are partially sighted or blind from cataract.
£9,516,840,540 is estimated to be the cumulative cost for the whole decade 2010
to 2020, under the same conditions but allowing for demographic change (at
2008/9 prices used at the baseline year of 2010). Under these conditions, 47.64% of the
decade costs are accounted for through health care treatment. Over 36% of the
decade costs are incurred on social and personal care, the majority of this latter
36% is expected to be spent on those with sight loss due to cataract, either with
aphakia or irremediable lens opacity.
Varying the Assumptions about Endophthalmitis Risk
Though severe surgical complications with cataract are rare one in particular,
endophthalmitis considerably affects quality of life post surgically and may lead to
serious loss of sight even if treated. Prophylactic intervention incurs additional
costs at the point of surgery and is being implemented. Under the Base Case
assumption, 199 cases of endophthalmitis would be expected in 2010, the total
cost of illness for cataract being £995,144,453. Under the assumption-2, the
higher incidence will result in 510 cases, at a total cost of illness of
£996,323,311. The extra cost incurred by the 311 additional cases will be about
£1.2 million.
Diabetic Retinopathy (DR) Diabetic retinopathy is a complication of diabetes, occurring as a result of
damage to the blood vessels of the retina, induced by diabetes

Executive Summary
11
year 2010 year 2020
Population at risk, UK 51,469,409 54,876,508
Diabetes (diagnosed) 2,665,029 3,342,634 Numbers with Diabetic Retinopathy For the coming year of 2010 more than 748 thousand persons are expected to
have background diabetic retinopathy (early signs of DR) and 85,484 will be
classified as falling into non proliferative and proliferative retinopathy combined.
(more advanced stages than background DR). By 2020 this is expected to rise to
more than 938 thousand for background retinopathy and 107,218 for non
proliferative and proliferative retinopathy (combined).
Diabetic Maculopathy, which can occur from the non-proliferative stage onwards
and can lead to sight loss, is expected to be present in 187,842 diabetic persons
in 2010, increasing to 235,602 by the year 2020.
Sight Loss from Diabetic Retinopathy 40,982 persons in 2010 will be partially sighted from diabetic retinopathy and
24,976 will be blind. In 2020, 46,473 persons are expected to be partially sighted
and an additional 29, 957 to be blind.
Cost
For the year 2010, £680,317,387 is the estimated cost of detection, treatment
and provision of state and family social care for all diabetics at risk of diabetic
eye disease.

Executive Summary
12
£6,430,973,067 is estimated to be the cumulative cost over the ten years to 2020.
Of this, 25.5% (more than £1.6 billion) are considered as health care costs, and
53.1% (more than £3.4 billion) as personal and social care costs.
Lost productivity due to unemployment or days lost from work related to diabetic
eye disease is estimated to amount to £1.03 billion over the decade.
Glaucoma
In this report, the term ‘glaucoma’ is used to indicate Primary Open-angle
Glaucoma (POAG). Ocular hypertension (OH) is defined as intraocular pressure
of more than 21 mmHg, without any accompanying signs of POAG. The risk of
developing glaucoma is increased in eyes that have ocular hypertension.
year 2010 year 2020
Population at risk, UK 30,782,718 33,460,453
African-Caribbean sub-group 700,020 904,835
Numbers with the disease (diagnosed) • 308,044 persons in 2010 and 361,183 in 2020 will have ocular hypertension.
• 265,973 persons are estimated to have glaucoma in 2010.
• By the end of the decade this is projected to be 327,440.
Sight Loss from Glaucoma
• 57,646 persons in 2010 will be partially sighted from glaucoma and 17,511 will
be blind (assuming that the level of detection of this disease in the population
is at 50%).

Executive Summary
13
• 71,806 persons are expected to be partially sighted by 2020, and 22,261 to be
blind under the same assumption about detection.
African- Caribbean Ethnic sub-Group
Numbers appear small for African-Caribbean persons with glaucoma, but the
percentage expected to go into partial sight and blindness is higher than that for
the total population, which includes them.
The proportional increase over the decade for this group is 57.37% for partial
sight and 57.31% for blindness in comparison to 24.56% for partial sight and
27.12% for blindness for the population in general.
Cost
For the year 2010, £542,038,234 is the estimated cost of detection, treatment
and provision of state and family social care for all those with ocular hypertension
and glaucoma under the assumed 50% detection level.
£4,889,652,026 is estimated to be the cumulative cost over the ten years to 2020
assuming the same conditions. Of this, 42.33% (more than £2 billion) are
considered as health care costs, and 34.14% (more than £1.6 Billion) as
personal and social care costs.
Varying Assumptions about Detection Levels
Base Case Assumption: Detection rate is 50%. In this situation, the estimated
numbers in the U.K. with sight loss due to glaucoma (nearest 1000) are: 75,000
persons in 2010 and 94,000 people in 2020 The total cumulative cost of illness
for glaucoma (including OH) for the decade is £4.9 billion

Executive Summary
14
Assumption-2: Detection rate is improved to 75%. In this situation, there will be
a modest decrease in prevalence of sight loss from glaucoma over the decade,
the estimated numbers being 71,000 in 2010, and 89,000 people in 2020. The
total cumulative cost of illness for the decade will increase from £4.9 billion at
50% detection), to £5.3 billion at 75% detection
Assumption-3: Detection rate is improved to 90%. Under this assumption, the
estimated numbers with sight loss are lower at: 69,000 people in 2010, rising to
86,000 people in 2020. The cumulative cost of illness for glaucoma and OH over
the decade will increased from £4.9 billion (at 50% detection), to £5.5 billion (at
90% detection)
Observation of the Authors:
The authors observe that a more robust information base is required to feed into
projects such as this one and more importantly to inform policy initiatives of the
UK Vision strategy. The serious deficit in reliable information on levels of
detection and treatment coverage for eye conditions limits the output of this
Decade Model at present. It may also hinder the monitoring of efforts to ensure
that existing and improved entitlements to eye services are fully implemented.

Demography
15
Demography
The population of UK is expected to increase from 61.4 million in 2008, to about
66.8 million by 2020, an increase of around 8.7%. The proportional increase is
expected to be the highest in England at 9.5%, followed by Northern Ireland at
7.7%, Wales at 6.0% and Scotland at 3.1%.
Table D-1. Projected populations (in 1000s) at mid-years. 2006-based Principal projections. Source: Government Actuary’s Department.
Year: 2008 2010 2015 2020 England Wales Scotland N. Ireland UK
51,488 2,9935,157 1,774
61,412
52,297 3,0235,190 1,799
62,309
54,319 3,098 5,258 1,857
64,532
56,354 3,172 5,316 1,911
66,754
This pattern of growth and distribution, however, changes for the more pertinent
older age groups, who carry the main burden of sight loss. Number of persons 60
or older in the UK is expected to increase by about 21% during the same period,
rising from 13.6 million in 2008 to 16.4 million by 2020. Highest proportional
increase in the 60+ age group is expected to occur in Northern Ireland (28.5%),
followed by Scotland (22.7%), Wales (20.8%), and the lowest in England
(20.6%). The details are shown in Table D2.

Demography
16
Table D-2. Projected increase in number of persons (1000s) aged 60 or older, in the period 2008 to 2020. Country
Persons (1000s), age 60 or older
Mid-Year 2008
Persons (1000s),age 60 or older
Mid-Year 2020 % Increase
England 11,317 13,654 20.6%
Wales 737 891 20.8%
Scotland 1,170 1,436 22.7%
N. Ireland 341 438 28.5%
UK 13,566 16,419 21.0% The geographic distribution of the UK population helps to view the devolved
countries in perspective. About 84% of the UK population live in England.
Proportions living in Wales, Scotland, and N. Ireland are approximately 5%, 8%,
and 3% respectively (Fig. D-1)
Figure D-1. Geographic distribution of the UK population, year 2010.
83.9%
4.9%
8.3% 2.9%
EnglandWalesScotlandN. Ireland

Part 1: AMD - Definitions
17
Part 1: Age–related Macular Degeneration Terminology and Definitions Age–related Macular Degeneration (AMD) Age-related macular degeneration. A chronic degenerative disease of the macula
resulting in progressive damage to the light-sensitive cells in the macula. This
leads to loss of central vision, which may be profound, obscuring all details, but
peripheral vision (side vision) is unaffected. The disease affects mainly those 50
years or older.
Early ARM Early age-related Maculopathy, also referred to as ‘Early AMD’. Defined as
presence of indistinct soft drusen (yellowish deposits under the retina) or soft
drusen with pigmentary abnormalities present, but no signs of Neovascular AMD
or of the later-stages of ‘dry’ AMD (Geographic atrophy), in line with the definition
used by the Rotterdam Eye Study.
Neovascular AMD (NV-AMD) Neovascular AMD. This is the ‘wet’ or exudative form of advanced AMD, and
occurs when new abnormal blood vessels grow under the macula. These new
vessels are fragile, and prone to leakage which may displace and damage the
macula, causing rapid loss of central vision. Left untreated, the damage may lead
to scarring of the macula and irreversible loss of central vision. NV-AMD can now
be treated with intraocular injections of a new drug - Ranibizumab (Lucentis) -
which may stop the progression of visual loss (at least in the short term) and
even restore some of the lost sight. The drug blocks the effects of a protein
called ‘Vascular Endothelial Growth Factor’ (VEGF), found in abnormally high
levels in NV-AMD and thought to promote the growth of new vessels.

Part 1: AMD - Epidemiology
18
Geographic Atrophy (GA-AMD) Geographic Atrophy. This is the ‘dry’ form of late-stage AMD, with part or all of
the macular undergoing scarring. The resulting loss of vision is at present
irreversible.
Sight Loss Partial Sight: visual acuity <612 – 6/60. Blind: < 6/60. Sight Loss: < 6/12. These are the levels of vision loss in the better seeing eye, AMD being the
primary cause.
Section 1: Epidemiology Table P1 indicates the numbers at risk of AMD, in the population of the UK.
Table P-1. U.K. Population at Risk – AMD
Age 2010 2015 202050-54 3,978,875 4,485,009 4,531,218 55-59 3,571,598 3,882,157 4,382,168 60-64 3,743,048 3,430,499 3,737,819 65-69 2,926,015 3,543,212 3,261,471 70-74 2,474,738 2,707,771 3,301,487 75-79 2,001,596 2,187,302 2,425,401 80-84 1,492,415 1,606,402 1,819,154 85-89 939,994 1,008,200 1,151,503 90+ 457,574 591,330 722,111 Total 21,585,853 23,441,882 25,332,332
Prevalence
From the RNIB epidemiology model we estimate that 1,493,963 persons will
have early stage of the disease in 2010 in the United Kingdom, and by the end of
the decade this number is projected to rise to 1,821,434 (Table AMD-1).
Additionally for the UK, 414,561 persons in 2010 are estimated to have NV-AMD

Part 1: AMD - Epidemiology
19
(wet) and this will increase to 515,509 in 2020. GA-AMD, which at present is
irremediable, will be present in 193,652 persons in 2010 and will increase to
240,358 in 2020.
Sight Loss
For 2010 considering those numbers in the UK going into sight loss from both
types of AMD, 132,970 are likely to be partially sighted and 90,254 will be blind.
This assumes that the anti-VEGF treatment for Neovascular AMD covers 75% of
those eligible. By 2020, the expected numbers will be 171,530 partially sighted
persons, and 120,452 blind, under the same assumption about treatment (Table
AMD-1).
As well as those affected by irremediable GA-AMD, these numbers with sight
loss also include persons with Neovascular AMD who were blind before the
availability of the new treatment.

Part 1: AMD - Epidemiology
20
Table AMD-1. Age-related macular degeneration (AMD) and sight loss attributed to AMD. Estimated number of affected persons. (Treatment coverage for Neovascular AMD is 75 %.)
AMD year: 2010 2015 2020England Early ARM 1,246,983 1,386,497 1,519,059NV-AMD 347,729 381,400 430,965GA-AMD 162,437 177,961 200,926Partially sighted 111,869 128,966 143,874Blind 76,195 88,465 101,161Wales Early ARM 80,622 89,546 98,100NV-AMD 22,372 24,416 27,652GA-AMD 10,452 11,395 12,900Partially sighted 7,338 8,295 9,190Blind 4,861 5,623 6,416Scotland Early ARM 128,378 142,648 156,310NV-AMD 34,359 38,400 43,645GA-AMD 16,046 17,922 20,351Partially sighted 10,660 12,474 14,155Blind 7,124 8,445 9,879N. Ireland Early ARM 37,979 42,808 47,965NV-AMD 10,102 11,459 13,248GA-AMD 4,717 5,349 6,182Partially sighted 3,103 3,733 4,311Blind 2,075 2,523 2,996U.K. Early ARM 1,493,963 1,661,499 1,821,434NV-AMD 414,561 455,675 515,509GA-AMD 193,652 212,627 240,358Partially sighted 132,970 153,468 171,530Blind 90,254 105,056 120,452
AMD=Age-related Macular Degeneration, Early ARM=Early pre-AMD stage, NV-AMD=Neovascular ‘wet’ AMD in one or both eyes, GA-AMD=geographic atrophy (‘dry’ AMD) in either eye and absence of NV-AMD in both eyes.

Part 1: AMD - Costs
21
Section 2: Costs to Society (Table AMD-2) The cost of inputs into the detection treatment and ongoing support for those
persons with Age-related Macular Degeneration is considered here as far as
possible from the perspective of the resource use in the society of which they are
a part, rather than just the implications for the National Health Service or the
Local Authority Social services. Lost wage earning opportunity due to sight loss
is calculated and costings are estimated for the "paid" and “informal care" given
to those with compromised vision. For the UK, the total costs of the major
itemised inputs for the decade model 2010-2020 are projected to be Sixteen
billion, four hundred and thirty four million, five hundred and ten thousand pounds
(to the nearest thousand) i.e. £16,434,509,576 (using 2008/9 prices).
The health care costs over the decade for AMD amount to Two billion, nine
hundred and twenty seven million, eight hundred and seventy thousand pounds
(to the nearest thousand i.e. £2,927,699, 877,000
The social and personal care costs for the decade may amount to Twelve billion,
five hundred and five million, six hundred and forty four thousand pounds (to the
nearest thousand) i.e. £12,505,643,736. Of this £12.5 billion, more than eight and
a half billion pounds (£8,694,855,367) is costed for the provision of informal care
for those partially sighted or blind over and above that which they might receive if
they had no sight loss. This care is composed of inputs of labour which comes
from within their family or near neighbourhood and is not reimbursed by the state,
nor by the care recipients.
Cost of illness studies report the loss to society of the value of the productivity
that would be produced if those with disease were functioning members of the
labour force or not prone to time lost from work due to the eye condition. For the
UK for those burdened by sight loss from AMD, this amounts to £7,425,063 for
the year 2010, and for the decade, the amount is £50,629,800.

Part 1: AMD - Costs
22
Table AMD-2. Cumulative cost of illness for AMD over the decade and the cost at base year 2010 UK: (Treatment coverage for Neovascular AMD is 75 %.) AMD - U.K. Year 2010 Period 2010 - 2020 % of Total Direct Health Care Cost £319,452,167 £2,927,699,877 17.81%GP Consultations £387,170 £3,772,559 0.02%GOS £17,335,679 £164,267,417 1.00%Hospital Care £279,318,765 £2,538,808,642 15.45%Transport to Hospital £529,645 £5,160,819 0.03%LV Health Service Consultation £9,871,483 £98,671,453 0.60%Non-Ophthalmic related Medical £12,009,426 £117,018,987 0.71%Social and Personal Cost £1,247,141,650 £12,505,643,736 76.09%Low-Vision Devices & Rehabilitation £67,910,441 £678,256,618 4.13%Paid Care (excess) £256,759,256 £2,581,817,315 15.71%Informal Care (excess) £867,277,857 £8,694,855,367 52.91%Residential Care (excess) £54,927,586 £548,590,144 3.34%TV Licence allowance £266,510 £2,124,291 0.01%Other Costs £14,274,059 £142,791,787 0.87%Capital £10,626,332 £105,070,286 0.64%Tax Exemption (Blind persons) £3,647,727 £37,721,500 0.23%Indirect Costs: lost productivity £7,425,063 £50,629,800 0.31%Underemployment (excess) £7,030,917 £47,931,707 0.29%Absence from work (excess) £394,146 £2,698,094 0.02%Deadweight Loss £83,822,377 £807,744,376 4.91%
Total Cost of Illness £1,672,115,316 £16,434,509,576

Part 1: AMD - Costs
23
AMD - Costs Breakdown by Country.
For use within RNIB in England, Wales, Scotland, and Northern Ireland: the costs
are broken down by countries within the UK assuming that treatment coverage
for those with Neovascular AMD who are eligible will be 75%. Tables AMD-3 (a) - (d). Cumulative cost of illness for AMD over the decade and the cost at base year 2010 by UK country. (Treatment coverage for Neovascular AMD: 75 %.) Table AMD-3 (a) AMD - England Year 2010 Period 2010 - 2020 % of Total Direct Health Care Cost £266,989,271 £2,445,126,433 17.72%GP Consultations £324,756 £3,159,345 0.02%GOS £13,484,641 £127,556,629 0.92%Hospital Care £234,344,214 £2,129,109,552 15.43%Transport to Hospital £444,262 £4,321,949 0.03%LV Health Service Consultation £8,317,973 £82,980,926 0.60%Non-Ophthalmic related Medical £10,073,424 £97,998,032 0.71%Social and Personal Cost £1,051,576,013 £10,521,812,023 76.24%Low-Vision Devices & Rehabilitation £57,213,516 £570,336,017 4.13%Paid Care (excess) £216,620,908 £2,173,096,842 15.75%Informal Care (excess) £731,244,450 £7,315,311,299 53.01%Residential Care (excess) £46,275,658 £461,301,386 3.34%TV Licence allowance £221,480 £1,766,479 0.01%Other Costs £11,333,511 £113,937,714 0.83%Capital £8,248,787 £82,117,502 0.60%Tax Exemption (Blind persons) £3,084,724 £31,820,212 0.23%Indirect Costs: lost productivity £6,228,925 £42,373,291 0.31%Underemployment (excess) £5,899,651 £40,121,073 0.29%Absence from work (excess) £329,274 £2,252,218 0.02%Deadweight Loss £70,398,611 £677,464,648 4.91%
Total Cost of Illness £1,406,526,330 £13,800,714,109

Part 1: AMD - Costs
24
Table AMD-3 (b) AMD - Wales Year 2010 Period 2010 - 2020 % of Total Direct Health Care Cost £17,249,837 £157,742,472 17.71%GP Consultations £20,895 £203,022 0.02%GOS £881,527 £8,332,775 0.94%Hospital Care £15,131,865 £137,301,103 15.41%Transport to Hospital £28,584 £277,732 0.03%LV Health Service Consultation £538,851 £5,330,399 0.60%Non-Ophthalmic related Medical £648,116 £6,297,440 0.71%Social and Personal Cost £67,757,319 £673,554,139 75.62%Low-Vision Devices & Rehabilitation £3,711,366 £36,668,187 4.12%Paid Care (excess) £13,893,600 £138,702,485 15.57%Informal Care (excess) £47,136,009 £468,409,685 52.59%Residential Care (excess) £3,001,841 £29,658,105 3.33%TV Licence allowance £14,503 £115,677 0.01%Other Costs £1,424,893 £13,443,069 1.51%Capital £1,228,523 £11,420,921 1.28%Tax Exemption (Blind persons) £196,369 £2,022,148 0.23%Indirect Costs: lost productivity £360,162 £2,483,375 0.28%Underemployment (excess) £339,286 £2,342,227 0.26%Absence from work (excess) £20,875 £141,148 0.02%Deadweight Loss £4,539,367 £43,499,222 4.88%
Total Cost of Illness £91,331,578 £890,722,277

Part 1: AMD - Costs
25
Table AMD-3 (c) AMD - Scotland Year 2010 Period 2010 - 2020 % of Total Direct Health Care Cost £27,479,551 £253,214,330 18.81%GP Consultations £32,086 £315,865 0.02%GOS £2,560,766 £24,408,533 1.81%Hospital Care £23,061,692 £210,275,694 15.62%Transport to Hospital £43,894 £432,100 0.03%LV Health Service Consultation £785,842 £7,984,482 0.59%Non-Ophthalmic related Medical £995,271 £9,797,656 0.73%Social and Personal Cost £98,984,341 £1,009,895,585 75.01%Low-Vision Devices & Rehabilitation £5,410,254 £54,912,765 4.08%Paid Care (excess) £20,325,618 £208,128,919 15.46%Informal Care (excess) £68,848,918 £702,252,173 52.16%Residential Care (excess) £4,375,943 £44,414,755 3.30%TV Licence allowance £23,609 £186,974 0.01%Other Costs £1,135,316 £11,546,641 0.86%Capital £851,707 £8,560,161 0.64%Tax Exemption (Blind persons) £283,610 £2,986,480 0.22%Indirect Costs: lost productivity £645,826 £4,442,621 0.33%Underemployment (excess) £611,851 £4,208,339 0.31%Absence from work (excess) £33,975 £234,282 0.02%Deadweight Loss £6,905,697 £67,228,640 4.99%
Total Cost of Illness £135,150,731 £1,346,327,818

Part 1: AMD - Costs
26
Table AMD-3 (d) AMD - N. Ireland Year 2010 Period 2010 - 2020 % of Total Direct Health Care Cost £7,733,509 £71,616,642 18.05%GP Consultations £9,434 £94,326 0.02%GOS £408,746 £3,969,481 1.00%Hospital Care £6,780,993 £62,122,293 15.66%Transport to Hospital £12,905 £129,037 0.03%LV Health Service Consultation £228,818 £2,375,646 0.60%Non-Ophthalmic related Medical £292,614 £2,925,859 0.74%Social and Personal Cost £28,823,977 £300,381,988 75.71%Low-Vision Devices & Rehabilitation £1,575,304 £16,339,648 4.12%Paid Care (excess) £5,919,130 £61,889,070 15.60%Informal Care (excess) £20,048,480 £208,882,211 52.65%Residential Care (excess) £1,274,144 £13,215,898 3.33%TV Licence allowance £6,919 £55,161 0.01%Other Costs £380,339 £3,864,362 0.97%Capital £297,316 £2,971,702 0.75%Tax Exemption (Blind persons) £83,024 £892,660 0.22%Indirect Costs: lost productivity £190,151 £1,330,513 0.34%Underemployment (excess) £180,128 £1,260,067 0.32%Absence from work (excess) £10,023 £70,446 0.02%Deadweight Loss £1,978,702 £19,551,866 4.93%
Total Cost of Illness £39,106,677 £396,745,372
Part 1: AMD – Varying the Assumptions
27
Section 3: Varying the Assumptions
Assumption-1: Treatment coverage is 75% The model output of AMD 1-3d is based upon assumptions that entitlements
within the NICE guidance will lead to 75% of all suitable cases of neovascular
AMD receiving the new drug treatment, over the decade 2010 to 2020. Taking
the calculations further than those in AMD table 1, and estimating the numbers in
the U.K. with sight loss due specifically to NV-AMD (nearest 1000), these will
amount to 146,000 persons in 2010, rising to 170,000 persons in 2015, and
190,000 people in 2020 (Table AMD-4). The rise in numbers with sight loss can
be explained by the demographic effect (mainly ageing population) overwhelming
the treatment effect (numbers treated and treatment efficacy).
Assumption-1: Treatment coverage is 90%. Varying the assumptions and anticipating in the model that treatment coverage is
improved from 75% to 90%, there will be a modest decrease in prevalence of
sight loss from NV-AMD over the decade, the estimated numbers being 144,000
in 2010, 168,000 in 2015 and 188,000 people in 2020 (Table AMD-4).
A treatment coverage at the lower 50%, for 2010 and onwards might reflect
possible limitations of access to treatment or level of patient presentation at
clinics. Under this assumption, the estimated numbers with sight loss are higher
at: 149,000 in 2010, 174,000 in 2015, and 194,000 people in 2020 (Table AMD-
4). At the reduced coverage of 50%, there will be about 6,000 additional cases of
sight loss from NV-AMD in each year of the decade in the U.K., compared to
90% coverage, and between 3,600-3,900 additional cases in each year of the
decade compared to the base-case 75% coverage.

Part 1: AMD – Varying the Assumptions
28
Table AMD-4 Cumulative Cost of illness and number of persons with sight loss due to Neovascular AMD, by levels of treatment coverage. Estimates for the U.K. Assumed treatment coverage
Cumulative cost of illness over the decade
Sight Loss from NV-AMD in 2010
Sight Loss from NV-AMD in 2015
Sight Loss from NV-AMD in 2020
50% £15,990,508,406 149,326 173,994 193,804
75% £16,434,509,576 145,697 170,272 189,890
90% £16,672,596,715 143,519 167,992 187,523
NV-AMD = Neovascular (wet) AMD, Sight Loss = VA < 6/12 (Partial Sight+Blind) Sight Gained from Treatment The gain in visual acuity over the decade due to Ranibizumab treatment is shown
in table AMD-5. This is in terms of numbers who convert from partial sight to
adequate vision and from blindness to partially sighted, under the 3 assumed
levels of treatment coverage.
Table AMD-5. Gain in visual acuity over the decade with Ranibizumab treatment. Estimates for the U.K. Assumed treatment coverage
Conversion from partial sight to
adequate vision.Persons
Conversion from blindness to
partial sight.Persons
Total
50% 66,954 5,927 72,881
75% 95,814 8,467 104,281
90% 111,597 9,855 121,453
Part 1: AMD – Varying the Assumptions
29
Costs
Change from treatment coverage of 75% to 90%. The total cumulative cost of illness for AMD for the decade is more than £16.4
billion as shown in Table AMD-2, and this includes costs for those with sight loss
from the irremediable Geographic Atrophy form of AMD as well as those who
have the Neovascular form. This sum for AMD for the decade will increase from
£16,434,509,576 at 75% coverage, to £16,672,596,715 at 90% treatment
coverage (Table AMD-4).
Change from treatment coverage of 90% to 50% The costs over the decade under the changed assumptions for AMD is reduced
from £16,672,596,715 (at 90% treated), to £15,990,508,406 (at 50% treated).

Part 2: Cataract – Definitions
30
Part 2: Cataract Terminology and Definitions Cataract Opacity of the normally clear lens of the eye, leading to visual impairment. In the
vast majority of affected persons, it is ‘caused’ by cumulative biochemical insults
to the lens proteins throughout the aging process, eventually overwhelming the
protective mechanisms of the lens, leading to ‘age-related cataract’. In rare
cases, the cataract may be congenital or may have a distinct aetiology, such as
trauma, other eye disorders or treatments, and exposure to toxic chemicals.
Sight can be restored by surgical removal of the damaged lens (usually leaving
the capsular bag of the lens in situ) and implantation of a synthetic intraocular
lens, usually in the capsular bag.
Cataract Operations Finished Consultant Episodes for cataract extraction by all surgical methods. An
‘Episode’ is a continuous period of care administered within a particular
consultant specialty at a hospital provider, as defined in the Hospital Episode
Statistics (HES), a data warehouse managed by The NHS Information Centre for
Health and Social care (The NHS Information Centre). Capsulotomies Procedures to clear the posterior capsule of opacities which have developed
following the cataract operation (mainly within 12 months).
Endophthalmitis Intraocular inflammation (proven or presumed infection) following cataract
surgery. This is a very rare event (5 - 13 cases per 10,000 operated eyes), but is
of concern because in a substantial proportion of cases it lead to serious loss of

Part 2: Cataract – Definitions
31
sight or loss of the eye, in spite of improved modern management strategies. The
condition is often difficult to treat and can be very costly to manage.
Cystoid Macular Oedema (CMO) Leakage and accumulation of fluid in the macula, and macular thickening (as
evidenced by angiography and optical coherence tomography) are observed in a
large proportion of eyes that have had cataract surgery, but most of these are not
associated with any loss of visual acuity (though they may result in some loss of
contrast sensitivity). When the macular oedema is associated with clinically
significant loss of visual acuity, the condition is termed clinical CMO (first
reported by Irvine in 1953). The disorder may occur typically 3-12 weeks after
cataract surgery. This is of concern because it may seriously delay the expected
gain in visual function or negate the earlier gains, causing substantial anxiety and
inconvenience to the patient, and places additional demand on eye services. The
condition is largely self-limiting and may resolve in up to 90% of patients by 3-12
months. Some of the few persistent chronic cases may suffer permanent sight
loss due to irreversible damage to the macula.
Sight Loss Attributable to Cataract Partial Sight: visual acuity <612 – 6/60. Blind: < 6/60. Sight Loss: < 6/12 These are the levels of vision loss in the better seeing eye, and apply only to the
following 3 categories of affected person.
• Persons with ‘irreversible’ sight loss due to complications following cataract
surgery (e.g. endophthalmitis, secondary end-stage glaucoma, retinal
detachment, etc.).
• Those with ‘irreversible’ sight loss having had uneventful cataract surgery, with
no apparent cause for the poor vision.
• Cataract cases with sight loss due to the cataract, deemed to be unsuitable
for surgery or unwilling to have surgery.

Part 2: Cataract – Epidemiology
32
Section 1: Epidemiology Table P-2. Population at Risk - Cataract Age 2010 2015 202040-44 4,642,997 4,222,487 3,945,682 45-49 4,553,868 4,598,468 4,182,439 50-54 3,978,875 4,485,009 4,531,218 55-59 3,571,598 3,882,157 4,382,168 60-64 3,743,048 3,430,499 3,737,819 65-69 2,926,015 3,543,212 3,261,471 70-74 2,474,738 2,707,771 3,301,487 75-79 2,001,596 2,187,302 2,425,401 80-84 1,492,415 1,606,402 1,819,154 85-89 939,994 1,008,200 1,151,503 90+ 457,574 591,330 722,111 Total 30,784,728 32,264,852 33,462,473
Sight Loss
For the UK, the number of people with partial sight due to cataract in the year
2010 is estimated to be 206,224, and numbers with blindness to be 27,907. In
2020, should this condition remain visually impairing at this level in the
population, it is estimated that 248,504 will be partially sighted and 32,750 will be
blind (Table CAT-1).
Number of Cataract Operations Table CAT-1 shows the number of cataract operations in 2010 is likely to be
more than 389 thousand. In view of the expected changes in the population age
structure, this will have increased to a surgical load of 473,944 in 2020. These
estimates assume the same threshold levels for cataract surgery which prevailed
in 2007/08.

Part 2: Cataract – Epidemiology
33
Table CAT-1. Cataract Operations, main complications, and sight loss due to cataract. Estimated numbers projected to year 2020. Cataract year: 2010 2015 2020England Cataract Operations 327,197 357,602 397,892Capsulotomies 13,278 14,362 15,850Endophthalmitis 167 182 203Retinal detachment 539 589 655Cystoid Macular Oedema 9,816 10,728 11,937Partially sighted 172,334 187,352 207,286Blind 23,233 25,230 27,302Wales Cataract Operations 20,272 22,187 24,759Capsulotomies 818 885 982Endophthalmitis 10 11 13Retinal detachment 33 37 41Cystoid Macular Oedema 608 666 743Partially sighted 11,114 12,037 13,278Blind 1,484 1,600 1,709Scotland Cataract Operations 32,250 35,354 39,263Capsulotomies 1,295 1,411 1,555Endophthalmitis 16 18 20Retinal detachment 53 58 65Cystoid Macular Oedema 968 1,061 1,178Partially sighted 17,607 19,303 21,413Blind 2,459 2,666 2,852N. Ireland Cataract Operations 9,506 10,636 12,030Capsulotomies 384 426 484Endophthalmitis 5 5 6Retinal detachment 16 18 20Cystoid Macular Oedema 285 319 361Partially sighted 5,169 5,792 6,528Blind 732 811 888U.K. Cataract Operations 389,225 425,779 473,944Capsulotomies 15,776 17,085 18,871Endophthalmitis 199 217 242Retinal detachment 641 701 781Cystoid Macular Oedema 11,677 12,773 14,218Partially sighted 206,224 224,483 248,504Blind 27,907 30,306 32,750

Part 2: Cataract – Costs
34
Section 2: Costs to Society (Table CAT-2)
For the UK, Nine hundred and ninety five million, one hundred and forty four
thousand pounds (to the nearest 1000), i.e. £995,144,453 in 2010 is the
estimated cost, which includes referral, and surgical treatment for those with
operable cataract , and for ongoing social and personal care for those who are
partially sighted or blind from cataract.
Nine billion five hundred and sixteen million, eight hundred and forty one
thousand pounds (nearest 1000), i.e. £9,516,840,540 is estimated to be the
cumulative cost under the same conditions, but allowing for demographic
change, over the whole decade 2010 to 2020 (at 2008/9 prices used at the baseline
year of 2010).
Under these conditions 47.64% of the decade costs are accounted for through
health care treatment. Over 36% of the decade costs are incurred on social and
personal care. The majority of this latter 36% is expected to be spent on those
with sight loss due to cataract. This group will be visually impaired from cataract
either with aphakia or irremediable lens opacity.
Cost of illness studies report the loss to society of the value of the productivity
that would be produced if those with disease were functioning members of the
labour force or not prone to time lost from work due to the eye condition. For the
UK, for those burdened by sight loss from cataract, this amounts to £65,805,080
for the year 2010, and for the decade, the amount is £610,974,152.

Part 2: Cataract – Costs
35
Table CAT-2. Cumulative cost of illness for cataract over the decade and the cost at base year 2010, for the UK. Cataract - U.K. Year 2010 Period 2010 - 2020 % of Total Direct Health Care Cost £470,996,110 £4,534,096,995 47.64%GP Consultations £5,368,366 £51,805,861 0.54%GOS £29,659,694 £277,252,456 2.91%Hospital Care £405,364,335 £3,911,129,663 41.10%Transport to Hospital £7,343,866 £70,869,851 0.74%LV Health Service Consultation £18,636,830 £178,708,938 1.88%Non-Ophthalmic related Medical £4,623,019 £44,330,225 0.47%Social and Personal Cost £364,330,134 £3,469,110,889 36.45%Low-Vision Devices & Rehabilitation £71,228,452 £683,011,065 7.18%Paid Care (excess) £64,471,955 £611,554,560 6.43%Informal Care (excess) £169,536,016 £1,608,149,207 16.90%Residential Care (excess) £57,611,269 £552,435,625 5.80%TV Licence allowance £1,482,441 £13,960,432 0.15%Other Costs £14,999,566 £143,755,845 1.51%Capital £13,139,278 £126,204,568 1.33%Tax Exemption (Blind persons) £1,860,287 £17,551,277 0.18%Indirect Costs: lost productivity £65,805,080 £610,974,152 6.42%Underemployment (excess) £60,388,625 £560,683,264 5.89%Absence from work (excess) £5,416,455 £50,290,888 0.53%Deadweight Loss £79,013,563 £758,902,659 7.97%
Total Cost of Illness £995,144,453 £9,516,840,540

Part 2: Cataract – Costs
36
Cataract - Costs Breakdown by Country. Tables CAT-3 (a) - (d). Cumulative cost of illness for cataract over the decade and the cost at base year 2010 by UK country. Table CAT-3 (a) Cataract – England Year 2010 Period 2010 - 2020 % of Total Direct Health Care Cost £393,958,069 £3,790,737,466 47.71%GP Consultations £4,512,845 £43,523,003 0.55%GOS £23,069,537 £215,628,302 2.71%Hospital Care £340,773,555 £3,285,871,685 41.35%Transport to Hospital £6,173,522 £59,538,992 0.75%LV Health Service Consultation £15,567,070 £149,172,112 1.88%Non-Ophthalmic related Medical £3,861,540 £37,003,372 0.47%Social and Personal Cost £303,664,722 £2,891,964,674 36.40%Low-Vision Devices & Rehabilitation £59,496,080 £570,123,712 7.18%Paid Care (excess) £53,673,379 £509,444,468 6.41%Informal Care (excess) £141,139,985 £1,339,639,617 16.86%Residential Care (excess) £48,121,847 £461,129,644 5.80%TV Licence allowance £1,233,430 £11,627,233 0.15%Other Costs £12,530,492 £120,071,376 1.51%Capital £10,981,517 £105,437,926 1.33%Tax Exemption (Blind persons) £1,548,975 £14,633,450 0.18%Indirect Costs: lost productivity £54,703,637 £508,908,631 6.40%Underemployment (excess) £50,201,077 £467,021,464 5.88%Absence from work (excess) £4,502,560 £41,887,167 0.53%Deadweight Loss £66,037,114 £634,022,824 7.98%
Total Cost of Illness £830,894,034 £7,945,704,971

Part 2: Cataract – Costs
37
Table CAT-3 (b) Cataract – Wales Year 2010 Period 2010 - 2020 % of Total Direct Health Care Cost £24,494,860 £236,014,469 47.37%GP Consultations £279,604 £2,702,082 0.54%GOS £1,470,479 £13,691,737 2.75%Hospital Care £21,110,746 £203,977,757 40.94%Transport to Hospital £382,495 £3,696,419 0.74%LV Health Service Consultation £1,002,787 £9,572,048 1.92%Non-Ophthalmic related Medical £248,750 £2,374,425 0.48%Social and Personal Cost £19,453,303 £183,901,926 36.91%Low-Vision Devices & Rehabilitation £3,832,572 £36,583,592 7.34%Paid Care (excess) £3,428,103 £32,235,430 6.47%Informal Care (excess) £9,014,569 £84,766,567 17.01%Residential Care (excess) £3,099,875 £29,589,681 5.94%TV Licence allowance £78,184 £726,657 0.15%Other Costs £787,574 £7,527,351 1.51%Capital £689,458 £6,614,535 1.33%Tax Exemption (Blind persons) £98,116 £912,816 0.18%Indirect Costs: lost productivity £3,413,988 £30,970,812 6.22%Underemployment (excess) £3,132,957 £28,421,068 5.70%Absence from work (excess) £281,030 £2,549,745 0.51%Deadweight Loss £4,146,132 £39,774,409 7.98%
Total Cost of Illness £52,295,857 £498,188,968

Part 2: Cataract – Costs
38
Table CAT-3 (c) Cataract - Scotland Year 2010 Period 2010 - 2020 % of Total Direct Health Care Cost £41,032,036 £394,441,018 47.57%GP Consultations £444,807 £4,292,128 0.52%GOS £4,404,661 £41,116,013 4.96%Hospital Care £33,580,611 £323,986,741 39.07%Transport to Hospital £608,491 £5,871,584 0.71%LV Health Service Consultation £1,597,255 £15,363,508 1.85%Non-Ophthalmic related Medical £396,212 £3,811,045 0.46%Social and Personal Cost £31,790,074 £301,944,743 36.42%Low-Vision Devices & Rehabilitation £6,104,580 £58,718,080 7.08%Paid Care (excess) £5,680,049 £53,587,938 6.46%Informal Care (excess) £14,936,306 £140,915,309 16.99%Residential Care (excess) £4,937,530 £47,492,583 5.73%TV Licence allowance £131,609 £1,230,833 0.15%Other Costs £1,306,998 £12,501,514 1.51%Capital £1,142,914 £10,967,361 1.32%Tax Exemption (Blind persons) £164,084 £1,534,153 0.19%Indirect Costs: lost productivity £5,917,012 £54,334,921 6.55%Underemployment (excess) £5,429,874 £49,860,668 6.01%Absence from work (excess) £487,138 £4,474,253 0.54%Deadweight Loss £6,873,278 £65,951,864 7.95%
Total Cost of Illness £86,919,398 £829,174,061
Part 2: Cataract – Costs
39
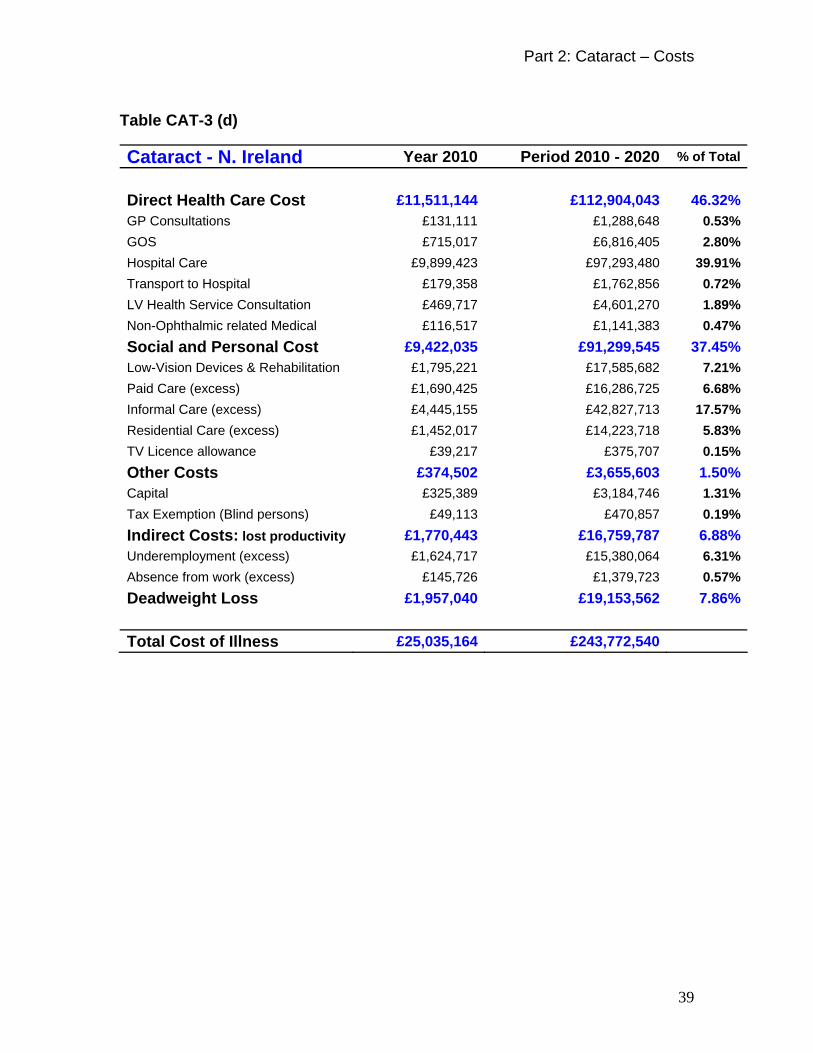
Table CAT-3 (d) Cataract - N. Ireland Year 2010 Period 2010 - 2020 % of Total Direct Health Care Cost £11,511,144 £112,904,043 46.32%GP Consultations £131,111 £1,288,648 0.53%GOS £715,017 £6,816,405 2.80%Hospital Care £9,899,423 £97,293,480 39.91%Transport to Hospital £179,358 £1,762,856 0.72%LV Health Service Consultation £469,717 £4,601,270 1.89%Non-Ophthalmic related Medical £116,517 £1,141,383 0.47%Social and Personal Cost £9,422,035 £91,299,545 37.45%Low-Vision Devices & Rehabilitation £1,795,221 £17,585,682 7.21%Paid Care (excess) £1,690,425 £16,286,725 6.68%Informal Care (excess) £4,445,155 £42,827,713 17.57%Residential Care (excess) £1,452,017 £14,223,718 5.83%TV Licence allowance £39,217 £375,707 0.15%Other Costs £374,502 £3,655,603 1.50%Capital £325,389 £3,184,746 1.31%Tax Exemption (Blind persons) £49,113 £470,857 0.19%Indirect Costs: lost productivity £1,770,443 £16,759,787 6.88%Underemployment (excess) £1,624,717 £15,380,064 6.31%Absence from work (excess) £145,726 £1,379,723 0.57%Deadweight Loss £1,957,040 £19,153,562 7.86%
Total Cost of Illness £25,035,164 £243,772,540

Part 2: Cataract – Varying the Assumptions
40
Section 3: Varying the Assumptions Though severe surgical complications with cataract are rare one in particular,
endophthalmitis considerably affects quality of life post surgically and may lead
severe sight light loss even if treated. Prophylactic intervention incurs additional
costs at the point of surgery and is being implemented.
The assumption which was varied, concerned incidence of endophthalmitis
following cataract surgery.
• The Base Case Assumption: Endophthalmitis incidence in the U.K. is 0.51
per 1000 operated eyes.
• Assumption-2: Endophthalmitis incidence remains at 1.31 per 1000 operated
eyes, for the year 2010.
The 1-year cumulative incidence of endophthalmitis following cataract surgery
was taken from our earlier work – meta-analysis of 13 European studies,
including 6 studies in the UK. Two rates were computed according to the
prophylaxis strategy in widespread use: a) 1.31 per 1000 under conditions of
routine prophylaxis, and b) 0.51 per 1000 with additional intracameral antibiotics
at the time of surgery.
The results given in the tables above were calculated under the Base Case
assumption (incidence rate = 0.51 per 1000 operated eyes). For the year 2010,
however, the model also calculated the results under Assumption-2 (incidence
remains at around 1.3 per 1000 operated eyes).
Under the Base Case assumption, 199 cases of endophthalmitis would be
expected in 2010, the total cost of illness for cataract being £995,144,453. Under
the assumption-2, the higher incidence will result in 510 cases, at a total cost of
Part 2: Cataract – Varying the Assumptions
41
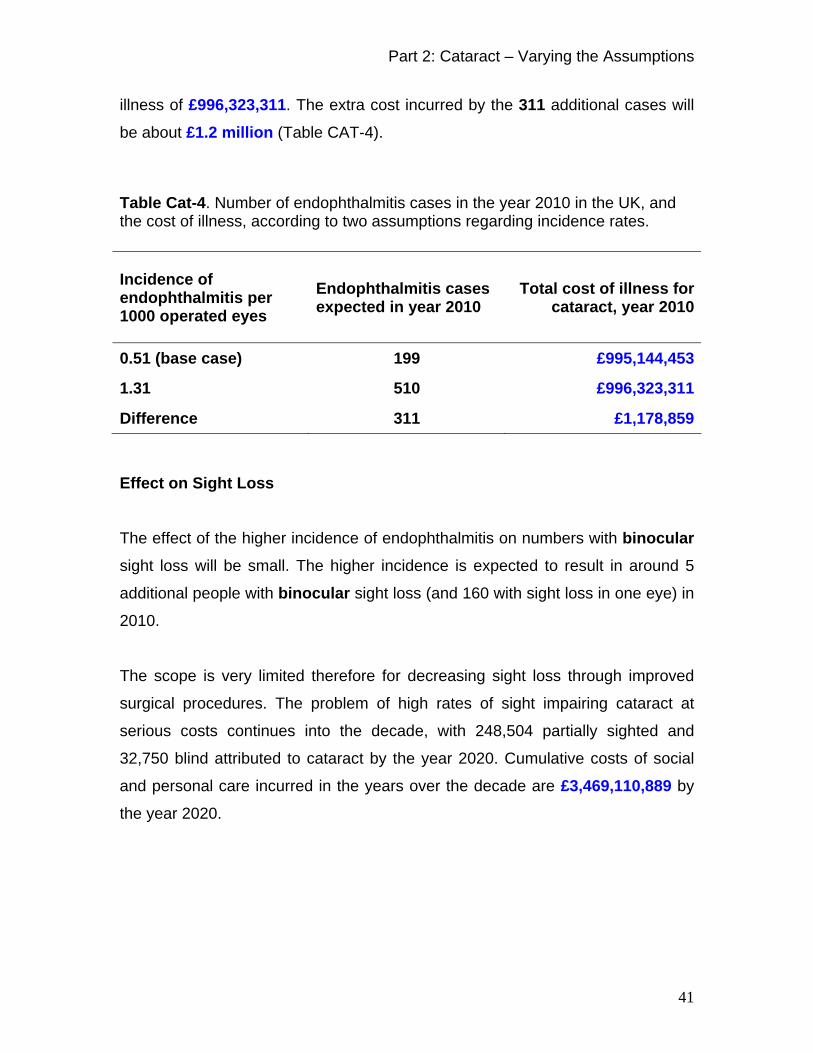
illness of £996,323,311. The extra cost incurred by the 311 additional cases will
be about £1.2 million (Table CAT-4).
Table Cat-4. Number of endophthalmitis cases in the year 2010 in the UK, and the cost of illness, according to two assumptions regarding incidence rates.
Incidence of endophthalmitis per 1000 operated eyes
Endophthalmitis cases expected in year 2010
Total cost of illness for cataract, year 2010
0.51 (base case) 199 £995,144,453
1.31 510 £996,323,311
Difference 311 £1,178,859 Effect on Sight Loss
The effect of the higher incidence of endophthalmitis on numbers with binocular sight loss will be small. The higher incidence is expected to result in around 5
additional people with binocular sight loss (and 160 with sight loss in one eye) in
2010.
The scope is very limited therefore for decreasing sight loss through improved
surgical procedures. The problem of high rates of sight impairing cataract at
serious costs continues into the decade, with 248,504 partially sighted and
32,750 blind attributed to cataract by the year 2020. Cumulative costs of social
and personal care incurred in the years over the decade are £3,469,110,889 by
the year 2020.

Part 3: Diabetic Retinopathy – Definitions
42
Part 3: Diabetic Retinopathy Terminology and Definitions DR Diabetic retinopathy. A complication of diabetes, occurring as a result of damage
to the blood vessels of the retina, induced by diabetes.
Background DR Early signs of DR, include tiny balloon-like swellings (microaneurysms) in the
small vessels of the retina. At this stage, the visual acuity is not affected.
Non-Proliferative DR More advanced stage than background DR. Includes several levels of severity.
As the disease progresses through this stage, increasing number of the small
retinal blood vessels are blocked, cutting off nutrition to larger areas of the retina.
Signals to grow new vessels are generated from the deprived (ischaemic) areas
of the retina. There may be some leakage of fluid or small areas of bleeding from
damaged retinal vessels.
Proliferative DR This next stage of DR is heralded by the response to the signals to grow new
retinal vessels. These grow along the retina and on the surface of the normally
clear ‘jelly’ (vitreous) that fills the inside of the eye. The new blood vessels have
thin fragile walls, and may bleed causing severe loss of vision. Later in this stage,
the areas of haemorrhage may become scarred and contract, causing
detachment of the retina. Treatment by laser surgery (scatter laser treatment), to
shrink the abnormal blood vessels, is more effective before the vessels start to
bleed. Surgical removal of the opaque vitreous (vitrectomy) may be a ‘last resort’
treatment late in this stage.

Part 3: Diabetic Retinopathy – Definitions
43
Diabetic Maculopathy Swelling of the macula (macular oedema) induced by DR. This can occur from
the non-proliferative stage onwards, causing sight loss. Treatment by placing
hundreds of small laser burns in the areas of leakage surrounding the macula
(focal laser treatment) reduces the leakage and the macular swelling. This
stabalises the vision, and in a few cases, sight already lost may be regained.
Sight Loss Attributable to DR Partial Sight: <612 – 6/60. Blind: < 6/60. Sight Loss: < 6/12 These are the levels of vision loss in the better seeing eye, Diabetic Retinopathy
being the primary cause.
Section 1. Epidemiology Table P-3. Population at Risk – Diabetic Retinopathy
Age 2010 2015 2020 15-19 3,897,303 3,631,863 3,522,291 20-24 4,326,076 4,238,617 3,969,895 25-29 4,336,718 4,690,744 4,595,270 30-34 3,904,901 4,473,388 4,820,725 35-39 4,221,693 3,944,384 4,507,874 40-44 4,642,997 4,222,487 3,945,682 45-49 4,553,868 4,598,468 4,182,439 50-54 3,978,875 4,485,009 4,531,218 55-59 3,571,598 3,882,157 4,382,168 60-64 3,743,048 3,430,499 3,737,819 65-69 2,926,015 3,543,212 3,261,471 70-74 2,474,738 2,707,771 3,301,487 75-79 2,001,596 2,187,302 2,425,401 80-84 1,492,415 1,606,402 1,819,154 85-89 939,994 1,008,200 1,151,503 90+ 457,574 591,330 722,111 Total 51,469,409 53,241,833 54,876,508
Part 3: Diabetic Retinopathy – Epidemiology
44
Prevalence
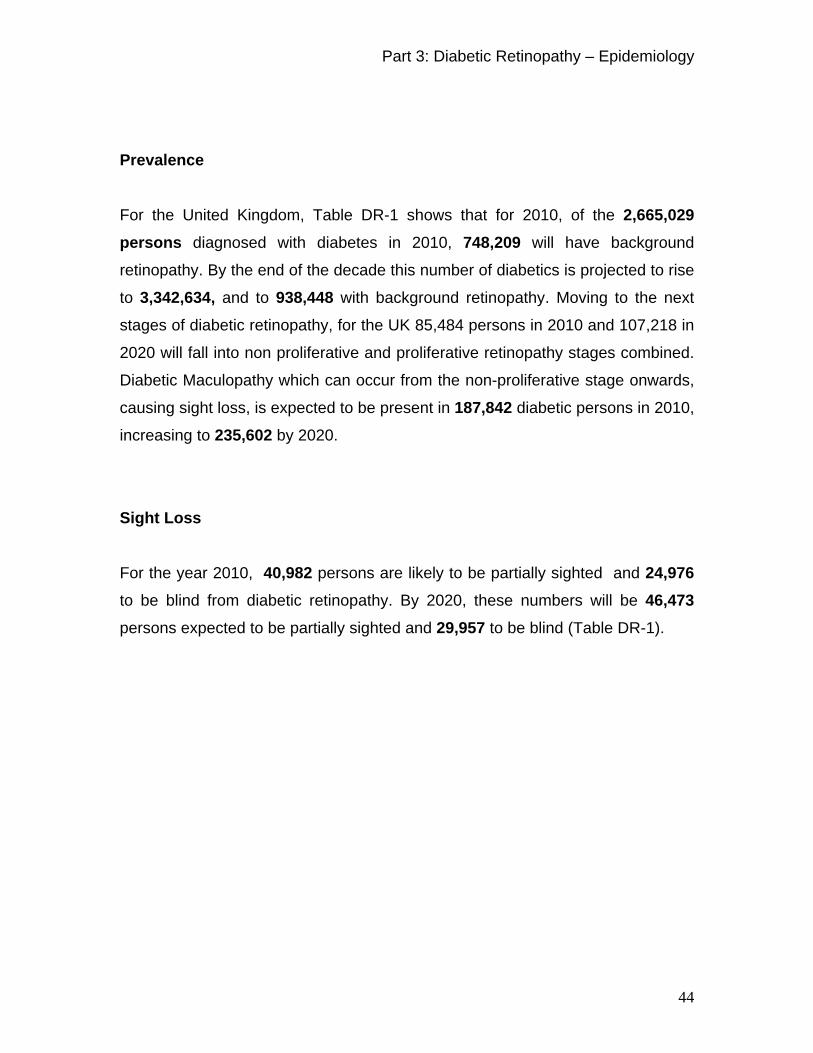
For the United Kingdom, Table DR-1 shows that for 2010, of the 2,665,029 persons diagnosed with diabetes in 2010, 748,209 will have background
retinopathy. By the end of the decade this number of diabetics is projected to rise
to 3,342,634, and to 938,448 with background retinopathy. Moving to the next
stages of diabetic retinopathy, for the UK 85,484 persons in 2010 and 107,218 in
2020 will fall into non proliferative and proliferative retinopathy stages combined.
Diabetic Maculopathy which can occur from the non-proliferative stage onwards,
causing sight loss, is expected to be present in 187,842 diabetic persons in 2010,
increasing to 235,602 by 2020.
Sight Loss
For the year 2010, 40,982 persons are likely to be partially sighted and 24,976
to be blind from diabetic retinopathy. By 2020, these numbers will be 46,473
persons expected to be partially sighted and 29,957 to be blind (Table DR-1).

Part 3: Diabetic Retinopathy – Epidemiology
45
Table DR-1. Diabetes, diabetic retinopathy (DR), and sight loss due to DR. Estimated numbers projected to year 2020. Diabetic Retinopathy year: 2010 2015 2020England Diabetes (diagnosed) 2,225,729 2,512,203 2,796,195Background DR 624,876 705,303 785,034Non-proliferative DR 55,151 62,250 69,287Proliferative DR 16,241 18,332 20,404Diabetic Maculopathy 156,878 177,070 197,087Partially sighted 34,196 36,805 38,847Blind 20,917 22,760 25,070Wales Diabetes (diagnosed) 138,733 155,826 172,310Background DR 38,949 43,748 48,376Non-proliferative DR 3,438 3,861 4,270Proliferative DR 1,012 1,137 1,257Diabetic Maculopathy 9,778 10,983 12,145Partially sighted 2,141 2,294 2,409Blind 1,313 1,426 1,584Scotland Diabetes (diagnosed) 229,903 257,179 283,467Background DR 64,545 72,203 79,584Non-proliferative DR 5,697 6,373 7,024Proliferative DR 1,678 1,877 2,068Diabetic Maculopathy 16,204 18,127 19,980Partially sighted 3,565 3,787 3,962Blind 2,107 2,296 2,508N. Ireland Diabetes (diagnosed) 70,664 80,474 90,663Background DR 19,839 22,593 25,454Non-proliferative DR 1,751 1,994 2,247Proliferative DR 516 587 662Diabetic Maculopathy 4,981 5,672 6,390Partially sighted 1,079 1,171 1,255Blind 638 707 796U.K. Diabetes (diagnosed) 2,665,029 3,005,683 3,342,634Background DR 748,209 843,848 938,448Non-proliferative DR 66,037 74,478 82,827Proliferative DR 19,447 21,932 24,391Diabetic Maculopathy 187,842 211,853 235,602Partially sighted 40,982 44,058 46,473Blind 24,976 27,189 29,957

Part 3: Diabetic Retinopathy – Costs
46
Section 2: Costs to Society The cost of inputs into the detection, treatment, and ongoing support for those
persons with diabetic retinopathy is considered here as far as possible from the
perspective of the resource use in the society of which they are a part, rather
than just the implications for the National Health Service or the Local Authority
Social services. Lost wage earning opportunity due to visual impairment is
calculated and costings are estimated for the "paid" and for the "informal care"
given to those with compromised vision.
The costs of diabetic retinopathy for the year 2010 for the UK are estimated to be
£680,317,387 (Six hundred and eighty million, three hundred and seventeen
thousand pounds, to the nearest 1000). The total cost for the decade 2010-2020
are projected to be Six billion, four hundred and thirty million, nine hundred and
seventy three thousand (to the nearest thousand) i.e. £6,430,973,067 (using 2008/9
prices).
The health care costs for diabetic retinopathy in the decade 2010-2020 are
projected to be One billion, six hundred and thirty eight million, and one hundred
and ninety one thousand pounds, i.e. £1,638,191,105 amounting to 25.47% of
the total costs.
The social and personal care costs over the decade for diabetic retinopathy
amount to Three billion, four hundred and eleven million, four hundred and
seventy seven thousand pounds (to the nearest thousand), i.e. £3,411,477,700. Of this, £2,371,892,361 is costed for the provision of informal care for those
partially sighted and blind over and above that which they might have required if
they had no sight loss. This care is composed of inputs of labour which come
from within their family or near neighbourhood and is not reimbursed by the state,
nor by those who receive the care.

Part 3: Diabetic Retinopathy – Costs
47
The value of lost productivity in the UK for those burdened by sight loss from
diabetic retinopathy is projected to be £116,160,712 for the year 2010, and for the
decade, the amount is £1,033,238,872
Table DR-2. Cumulative cost of illness for diabetic retinopathy (DR) over the decade and the cost at base year 2010, for the UK. DR - U.K. Year 2010 Period 2010 - 2020 % of Total Direct Health Care Cost £168,470,230 £1,638,191,105 25.47%GP Consultations £0 £0 0.00%GOS £1,717,067 £8,765,071 0.14%Hospital Care £132,226,456 £1,294,078,020 20.12%Transport to Hospital £26,650,285 £260,821,846 4.06%LV Health Service Consultation £6,574,068 £62,244,465 0.97%Non-Ophthalmic related Medical £1,302,354 £12,281,703 0.19%Social and Personal Cost £359,506,894 £3,411,477,700 53.05%Low-Vision Devices & Rehabilitation £20,065,848 £189,228,757 2.94%Paid Care (excess) £72,570,675 £691,750,791 10.76%Informal Care (excess) £250,038,321 £2,371,892,361 36.88%Residential Care (excess) £16,229,737 £153,052,736 2.38%TV Licence allowance £602,312 £5,553,055 0.09%Other Costs £6,097,207 £58,697,205 0.91%Capital £5,013,724 £48,228,031 0.75%Tax Exemption (Blind persons) £1,083,483 £10,469,174 0.16%Indirect Costs: lost productivity £116,160,712 £1,033,238,872 16.07%Underemployment (excess) £107,256,358 £953,789,233 14.83%Absence from work (excess) £8,904,354 £79,449,639 1.24%Deadweight Loss £30,082,345 £289,368,185 4.50%
Total Cost of Illness £680,317,387 £6,430,973,067

Part 3: Diabetic Retinopathy – Costs
48
Diabetic Retinopathy - Costs Breakdown by Country. Tables DR-3 (a) - (d). Cumulative cost of illness for diabetic retinopathy (DR) over the decade and the cost at base year 2010 by UK country. Table DR-3 (a) DR - England Year 2010 Period 2010 - 2020 % of Total Direct Health Care Cost £140,607,994 £1,368,741,639 25.44%GP Consultations £0 £0 0.00%GOS £1,335,629 £6,817,952 0.13%Hospital Care £110,430,440 £1,081,607,776 20.11%Transport to Hospital £22,257,291 £217,998,399 4.05%LV Health Service Consultation £5,496,392 £52,051,106 0.97%Non-Ophthalmic related Medical £1,088,242 £10,266,406 0.19%Social and Personal Cost £300,670,849 £2,853,439,506 53.04%Low-Vision Devices & Rehabilitation £16,766,947 £158,178,318 2.94%Paid Care (excess) £60,732,644 £578,844,885 10.76%Informal Care (excess) £209,106,379 £1,983,828,378 36.88%Residential Care (excess) £13,561,507 £127,938,400 2.38%TV Licence allowance £503,371 £4,649,525 0.09%Other Costs £5,094,105 £49,061,340 0.91%Capital £4,188,236 £40,314,097 0.75%Tax Exemption (Blind persons) £905,869 £8,747,243 0.16%Indirect Costs: lost productivity £97,114,852 £866,246,723 16.10%Underemployment (excess) £89,673,568 £799,671,753 14.87%Absence from work (excess) £7,441,284 £66,574,971 1.24%Deadweight Loss £25,129,416 £241,884,581 4.50%
Total Cost of Illness £568,617,216 £5,379,373,789
Part 3: Diabetic Retinopathy – Costs
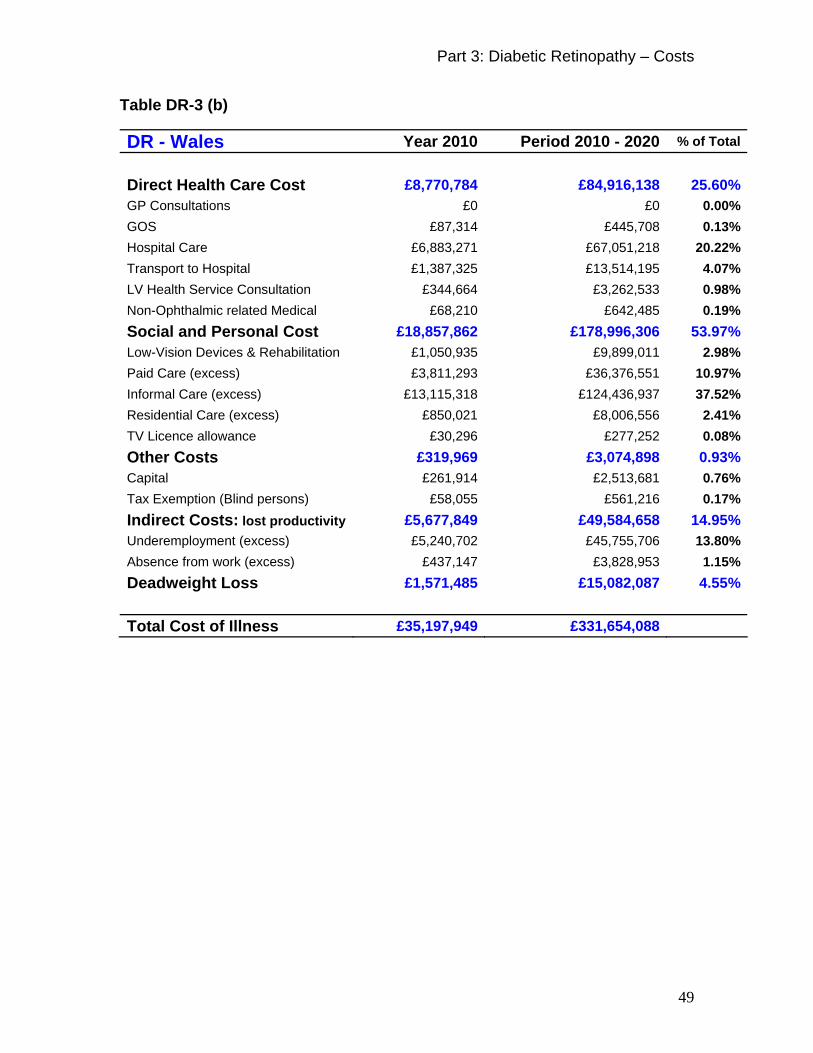
49
Table DR-3 (b) DR - Wales Year 2010 Period 2010 - 2020 % of Total Direct Health Care Cost £8,770,784 £84,916,138 25.60%GP Consultations £0 £0 0.00%GOS £87,314 £445,708 0.13%Hospital Care £6,883,271 £67,051,218 20.22%Transport to Hospital £1,387,325 £13,514,195 4.07%LV Health Service Consultation £344,664 £3,262,533 0.98%Non-Ophthalmic related Medical £68,210 £642,485 0.19%Social and Personal Cost £18,857,862 £178,996,306 53.97%Low-Vision Devices & Rehabilitation £1,050,935 £9,899,011 2.98%Paid Care (excess) £3,811,293 £36,376,551 10.97%Informal Care (excess) £13,115,318 £124,436,937 37.52%Residential Care (excess) £850,021 £8,006,556 2.41%TV Licence allowance £30,296 £277,252 0.08%Other Costs £319,969 £3,074,898 0.93%Capital £261,914 £2,513,681 0.76%Tax Exemption (Blind persons) £58,055 £561,216 0.17%Indirect Costs: lost productivity £5,677,849 £49,584,658 14.95%Underemployment (excess) £5,240,702 £45,755,706 13.80%Absence from work (excess) £437,147 £3,828,953 1.15%Deadweight Loss £1,571,485 £15,082,087 4.55%
Total Cost of Illness £35,197,949 £331,654,088

Part 3: Diabetic Retinopathy – Costs
50
Table DR-3 (c) DR - Scotland Year 2010 Period 2010 - 2020 % of Total Direct Health Care Cost £14,634,006 £140,684,288 25.65%GP Consultations £0 £0 0.00%GOS £253,639 £1,294,745 0.24%Hospital Care £11,406,712 £110,729,823 20.19%Transport to Hospital £2,299,026 £22,317,632 4.07%LV Health Service Consultation £562,632 £5,293,484 0.97%Non-Ophthalmic related Medical £111,996 £1,048,604 0.19%Social and Personal Cost £30,683,703 £289,472,869 52.78%Low-Vision Devices & Rehabilitation £1,725,566 £16,156,230 2.95%Paid Care (excess) £6,160,344 £58,440,076 10.66%Informal Care (excess) £21,350,344 £201,338,044 36.71%Residential Care (excess) £1,395,679 £13,067,544 2.38%TV Licence allowance £51,770 £470,975 0.09%Other Costs £524,760 £5,012,609 0.91%Capital £432,331 £4,120,610 0.75%Tax Exemption (Blind persons) £92,429 £891,999 0.16%Indirect Costs: lost productivity £10,164,550 £88,560,834 16.15%Underemployment (excess) £9,383,766 £81,730,569 14.90%Absence from work (excess) £780,784 £6,830,265 1.25%Deadweight Loss £2,593,988 £24,723,661 4.51%
Total Cost of Illness £58,601,008 £548,454,262

Part 3: Diabetic Retinopathy – Costs
51
Table DR-3 (d) DR - N. Ireland Year 2010 Period 2010 - 2020 % of Total Direct Health Care Cost £4,457,447 £43,849,040 25.57%GP Consultations £0 £0 0.00%GOS £40,486 £206,665 0.12%Hospital Care £3,506,034 £34,689,204 20.23%Transport to Hospital £706,642 £6,991,620 4.08%LV Health Service Consultation £170,379 £1,637,342 0.95%Non-Ophthalmic related Medical £33,906 £324,208 0.19%Social and Personal Cost £9,294,479 £89,569,019 52.23%Low-Vision Devices & Rehabilitation £522,400 £4,995,198 2.91%Paid Care (excess) £1,866,394 £18,089,279 10.55%Informal Care (excess) £6,466,280 £62,289,003 36.32%Residential Care (excess) £422,530 £4,040,236 2.36%TV Licence allowance £16,876 £155,304 0.09%Other Costs £158,372 £1,548,358 0.90%Capital £131,243 £1,279,643 0.75%Tax Exemption (Blind persons) £27,130 £268,715 0.16%Indirect Costs: lost productivity £3,203,460 £28,846,656 16.82%Underemployment (excess) £2,958,321 £26,631,205 15.53%Absence from work (excess) £245,139 £2,215,451 1.29%Deadweight Loss £787,455 £7,677,856 4.48%
Total Cost of Illness £17,901,214 £171,490,929

Part 4: Glaucoma – Definitions
52
Part 4: Glaucoma Terminology and Definitions
Glaucoma (GL) In this report, the term ‘glaucoma’ is used to indicate Primary Open-angle
Glaucoma (POAG), characterised by slow death of ganglion cells in the retina
and degeneration of their axons. The diagnostic features are loss of functional
visual fields (particular patterns of loss), and degeneration of nerve fibres at the
optic disc rim, causing diminution of the rim area relative to the deeper central
area of the disc (‘cupping’ or enlarged cup/disc ratio). In late stages, the whole of
the optic disc may appear atrophic, with less than 10 degrees of functional visual
field remaining (tunnel vision). Raised intraocular pressure is not a necessary
feature for diagnosis, but is a risk factor (is associated with increased risk of
POAG). Secondary glaucoma due to damage from other conditions or surgical
complications is not included in our estimates, nor is angle closure glaucoma
which is very uncommon in European populations. Congenital glaucoma is also
excluded from our estimates.
Ocular Hypertension (OH) Ocular hypertension (OH) is defined as intraocular pressure of more than 21
mmHg, without any of the accompanying signs of POAG. The risk of developing
glaucoma is increased in eyes that have ocular hypertension. There is some
evidence that treatments to reduce the intraocular pressure may reduce the risk
of POAG in patients with ocular hypertension. Generally, once detected, the OH
cases are monitored (about annually), some being treated with hypotensive eye
drops.

Part 4: Glaucoma – Epidemiology
53
Section 1: Epidemiology
Table P-4. U.K. Population at Risk – Glaucoma & Ocular Hypertension
Age 2010 2015 2020European 'white' 40-44 4,464,147 4,081,745 3,805,818
45-49 4,383,876 4,421,333 4,043,032
50-54 3,867,147 4,317,588 4,356,673
55-59 3,509,051 3,773,145 4,218,586
60-64 3,702,226 3,370,423 3,632,860
65-69 2,885,282 3,504,569 3,204,355
70-74 2,431,852 2,670,076 3,265,480
75-79 1,972,587 2,149,397 2,391,637
80-84 1,477,165 1,583,121 1,787,629
85-89 934,085 997,898 1,134,815
90+ 455,280 587,613 714,732
Sub-total 30,082,698 31,456,908 32,555,618African-Caribbean 40-44 178,850 140,742 139,864
45-49 169,992 177,135 139,407
50-54 111,728 167,421 174,545
55-59 62,547 109,012 163,582
60-64 40,822 60,076 104,959
65-69 40,733 38,643 57,116
70-74 42,886 37,695 36,007
75-79 29,009 37,905 33,764
80-84 15,250 23,281 31,525
85-89 5,909 10,302 16,688
90+ 2,294 3,717 7,379
Sub-total 700,020 805,929 904,835
Total 30,782,718 32,262,837 33,460,453

Part 4: Glaucoma – Epidemiology
54
Prevalence
For the United Kingdom Table GL-1(a) shows that 308,044 persons will have
ocular hypertension (diagnosed) in 2010. and by the end of the decade this
number is projected to rise to 361,183. Additionally for the UK, 265,973 persons
in 2010 are estimated to have glaucoma (diagnosed) and this will increase to
327,440 by the year 2020.
Sight Loss
Considering those numbers in the UK with glaucoma who go into sight loss from
the disorder, 57,646 are likely to be partially sighted and an additional 17,511 will
be blind in the year 2010. This assumes a detection rate of 50% for glaucoma.
By 2020, the expected numbers will be 71,806 partially sighted persons and
22,261 blind, under the same assumption about rates of detection and treatment.

Part 4: Glaucoma – Epidemiology
55
Table GL-1(a). Glaucoma, ocular hypertension, and sight loss. Estimated
number of affected persons by UK country : Detection Rate = 50% (a) All ethnic groups Glaucoma year 2010 2015 2020 England OH 512,952 555,148 601,737 OH Detected 256,476 277,574 300,869 GL 381,772 420,852 468,373 GL Detected 222,286 245,339 273,443 Partially sighted 48,169 53,424 59,931 Blind 14,630 16,401 18,581 Wales OH 32,962 35,547 38,112 OH Detected 16,481 17,773 19,056 GL 24,416 26,853 29,814 GL Detected 14,229 15,670 17,422 Partially sighted 3,102 3,435 3,843 Blind 940 1,052 1,188 Scotland OH 54,133 58,543 62,997 OH Detected 27,067 29,271 31,499 GL 39,044 43,075 47,842 GL Detected 22,733 25,120 27,947 Partially sighted 4,924 5,481 6,145 Blind 1,498 1,684 1,906 N. Ireland OH 16,041 17,750 19,520 OH Detected 8,020 8,875 9,760 GL 11,558 13,049 14,784 GL Detected 6,725 7,604 8,628 Partially sighted 1,450 1,651 1,887 Blind 442 508 586 U.K. OH 616,089 666,988 722,366 OH Detected 308,044 333,494 361,183 GL 456,789 503,828 560,813 GL Detected 265,973 293,733 327,440 Partially sighted 57,646 63,991 71,806 Blind 17,511 19,646 22,261
GL=glaucoma, OH=ocular hypertension

Part 4: Glaucoma – Epidemiology
56
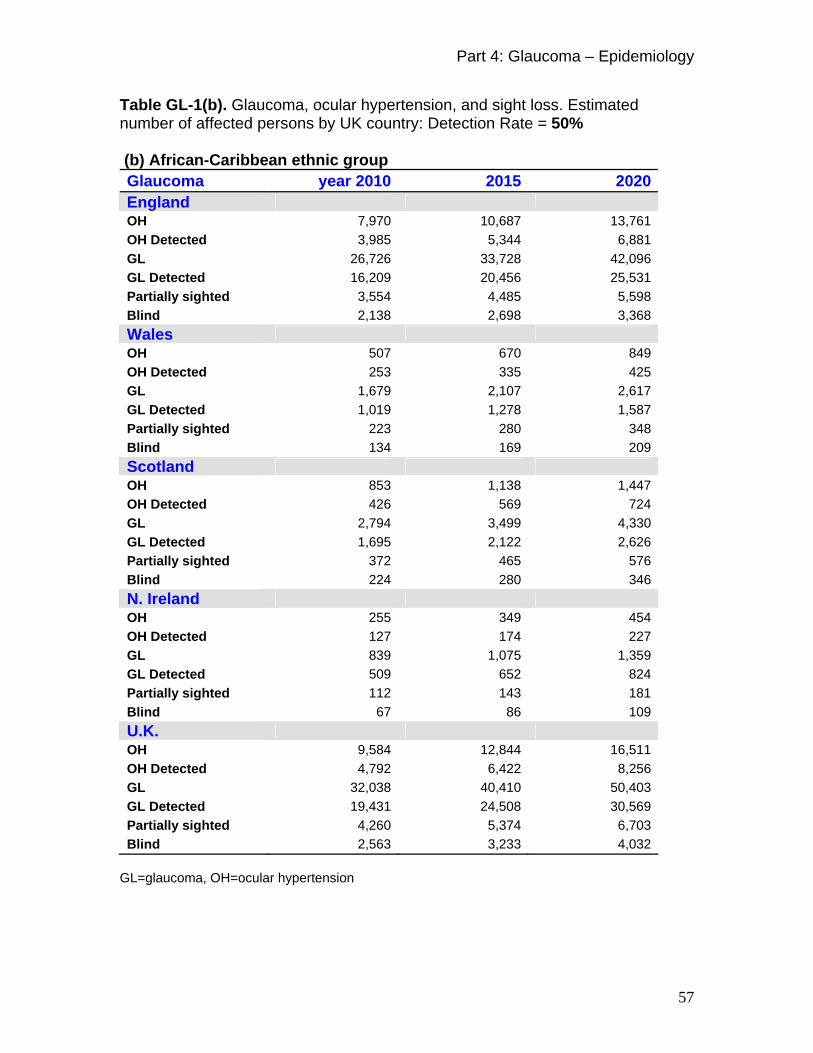
The epidemiology of glaucoma recognises that members of the African –
Caribbean ethnic group are at higher risk of developing glaucoma. Table GL-1(b)
for the UK shows that 4,792 persons of African-Caribbean ethnic group will have
ocular hypertension (diagnosed) in 2010, and by the end of the decade this
number is projected to rise to 8,256. In 2010, some 19,431 persons are
estimated to have glaucoma (diagnosed) and this will increase to 30,569 in 2020.
Numbers likely to be partially sighted by 2010 are 4,260, and an additional 2,563
will be blind. By 2020, these numbers will amount to 6,703 persons expected to
be partially sighted and 4,032 are expected to be blind.
Though the numbers appear small for African-Caribbean persons with glaucoma,
the percentage expected to go into partial sight and blindness is higher than that
for the total population, which includes them. The proportional increase over the
decade for this group is 57.37% for partial sight and 57.31% for blindness, in
comparison to 24.56% for partial sight and 27.12% for blindness for the
population in general.
Part 4: Glaucoma – Epidemiology
57
Table GL-1(b). Glaucoma, ocular hypertension, and sight loss. Estimated number of affected persons by UK country: Detection Rate = 50% (b) African-Caribbean ethnic group Glaucoma year 2010 2015 2020 England OH 7,970 10,687 13,761 OH Detected 3,985 5,344 6,881 GL 26,726 33,728 42,096 GL Detected 16,209 20,456 25,531 Partially sighted 3,554 4,485 5,598 Blind 2,138 2,698 3,368 Wales OH 507 670 849 OH Detected 253 335 425 GL 1,679 2,107 2,617 GL Detected 1,019 1,278 1,587 Partially sighted 223 280 348 Blind 134 169 209 Scotland OH 853 1,138 1,447 OH Detected 426 569 724 GL 2,794 3,499 4,330 GL Detected 1,695 2,122 2,626 Partially sighted 372 465 576 Blind 224 280 346 N. Ireland OH 255 349 454 OH Detected 127 174 227 GL 839 1,075 1,359 GL Detected 509 652 824 Partially sighted 112 143 181 Blind 67 86 109 U.K. OH 9,584 12,844 16,511 OH Detected 4,792 6,422 8,256 GL 32,038 40,410 50,403 GL Detected 19,431 24,508 30,569 Partially sighted 4,260 5,374 6,703 Blind 2,563 3,233 4,032
GL=glaucoma, OH=ocular hypertension

Part 4: Glaucoma – Costs
58
Section 2: Costs to Society
The cost of inputs into the detection treatment and ongoing support for those
persons with glaucoma is considered here as from the perspective of the
resource use in the society, rather than just the implications for the National
Health Service or the Local Authority Social services. Informal care given to
those with compromised vision and days lost from work are included in the
costing system.
The total costs for the year 2010 is projected to be Five hundred and forty two
million, and thirty eight thousand pounds (to the nearest thousand) i.e.
£542,038,234 (using 2008/9 prices). For the decade, the costs amount to Four
billion, eight hundred and eighty nine million, six hundred and fifty two thousand
pounds, i.e. £4,889,652,026 (using 2008/9 prices).
The health care costs over the decade for glaucoma amount to £2,070,001,026
which is 42.33% of the total.
The social and personal care costs for the decade may amount to
£1,669,110,804. Of this, more than £940 million is costed for the provision of
informal care for those partially sighted and blind, over and above that which they
might receive if they had no sight loss. This care is composed of inputs of labour
which comes from within their family or near neighbourhood and is not
reimbursed by the state, nor by those who receive the care.
For the UK, the cost of lost productivity for those burdened by glaucoma is
£79,594,870 for the year 2010, and for the decade, the amount is £754,242,423. Details are shown in Table GL-2.

Part 4: Glaucoma – Costs
59
Table GL-2. Cumulative cost of illness for glaucoma (including Ocular hypertension) for the decade and for base year, 2010 UK. Detection Rate = 50% Glaucoma - U.K. Year 2010 Period 2010 - 2020 % of Total Direct Health Care Cost £229,559,536 £2,070,001,026 42.33%GP Consultations £583,279 £5,154,833 0.11%GOS £76,906,415 £720,901,137 14.74%Hospital Care £136,787,979 £1,208,888,793 24.72%Transport to Hospital £3,245,870 £28,685,973 0.59%LV Health Service Consultation £10,551,995 £93,255,184 1.91%Non-Ophthalmic related Medical £1,483,998 £13,115,106 0.27%Social and Personal Cost £188,805,885 £1,669,110,804 34.14%Low-Vision Devices & Rehabilitation £22,864,511 £202,069,304 4.13%Paid Care (excess) £40,454,886 £357,527,460 7.31%Informal Care (excess) £106,380,522 £940,157,328 19.23%Residential Care (excess) £18,493,363 £163,438,477 3.34%TV Licence allowance £612,603 £5,918,234 0.12%Other Costs £7,102,772 £64,575,737 1.32%Capital £6,162,529 £55,287,006 1.13%Tax Exemption (Blind persons) £940,243 £9,288,732 0.19%Indirect Costs: lost productivity £79,594,870 £754,242,423 15.43%Underemployment (excess) £73,111,519 £692,711,561 14.17%Absence from work (excess) £6,483,352 £61,530,862 1.26%Deadweight Loss £36,975,171 £331,722,035 6.78%
Total Cost of Illness £542,038,234 £4,889,652,026

Part 4: Glaucoma – Costs
60
Glaucoma - Costs Breakdown by Country. Tables GL-3 (a) - (d). Cumulative cost of illness for glaucoma over the decade and the cost at base year 2010 by UK country. Detection Rate = 50%. Table GL-3 (a) Glaucoma - England Year 2010 Period 2010 - 2020 % of Total Direct Health Care Cost £187,297,950 £1,687,106,095 41.81%GP Consultations £487,472 £4,308,126 0.11%GOS £59,819,135 £560,488,739 13.89%Hospital Care £114,226,509 £1,009,497,677 25.02%Transport to Hospital £2,707,806 £23,930,729 0.59%LV Health Service Consultation £8,817,029 £77,922,111 1.93%Non-Ophthalmic related Medical £1,239,998 £10,958,713 0.27%Social and Personal Cost £157,747,099 £1,394,541,164 34.56%Low-Vision Devices & Rehabilitation £19,105,115 £168,844,949 4.18%Paid Care (excess) £33,799,828 £298,712,169 7.40%Informal Care (excess) £88,880,324 £785,496,126 19.47%Residential Care (excess) £15,452,673 £136,565,825 3.38%TV Licence allowance £509,159 £4,922,094 0.12%Other Costs £5,844,715 £53,108,160 1.32%Capital £5,058,955 £45,345,966 1.12%Tax Exemption (Blind persons) £785,760 £7,762,194 0.19%Indirect Costs: lost productivity £66,244,019 £628,362,602 15.57%Underemployment (excess) £60,848,871 £577,110,139 14.30%Absence from work (excess) £5,395,148 £51,252,463 1.27%Deadweight Loss £30,353,731 £272,075,797 6.74%
Total Cost of Illness £447,487,515 £4,035,193,818

Part 4: Glaucoma – Costs
61
Table GL-3 (b) Glaucoma - Wales Year 2010 Period 2010 - 2020 % of Total Direct Health Care Cost £12,006,373 £108,035,293 42.05%GP Consultations £31,205 £275,781 0.11%GOS £3,832,750 £35,799,408 13.93%Hospital Care £7,321,198 £64,702,431 25.18%Transport to Hospital £173,768 £1,535,702 0.60%LV Health Service Consultation £567,623 £5,016,471 1.95%Non-Ophthalmic related Medical £79,829 £705,500 0.27%Social and Personal Cost £10,143,966 £89,673,522 34.90%Low-Vision Devices & Rehabilitation £1,229,949 £10,869,904 4.23%Paid Care (excess) £2,172,796 £19,202,483 7.47%Informal Care (excess) £5,713,604 £50,495,017 19.65%Residential Care (excess) £994,812 £8,791,837 3.42%TV Licence allowance £32,804 £314,281 0.12%Other Costs £374,820 £3,400,149 1.32%Capital £324,603 £2,907,276 1.13%Tax Exemption (Blind persons) £50,217 £492,872 0.19%Indirect Costs: lost productivity £4,145,315 £38,398,591 14.94%Underemployment (excess) £3,807,245 £35,262,441 13.72%Absence from work (excess) £338,071 £3,136,150 1.22%Deadweight Loss £1,947,620 £17,443,658 6.79%
Total Cost of Illness £28,618,093 £256,951,213

Part 4: Glaucoma – Costs
62
Table GL-3 (c) Glaucoma - Scotland Year 2010 Period 2010 - 2020 % of Total Direct Health Care Cost £24,529,075 £222,904,510 47.14%GP Consultations £49,853 £440,589 0.09%GOS £11,408,778 £106,951,478 22.62%Hospital Care £11,760,872 £103,938,862 21.98%Transport to Hospital £281,109 £2,484,348 0.53%LV Health Service Consultation £901,657 £7,968,561 1.69%Non-Ophthalmic related Medical £126,806 £1,120,672 0.24%Social and Personal Cost £16,151,184 £142,781,599 30.19%Low-Vision Devices & Rehabilitation £1,953,749 £17,266,617 3.65%Paid Care (excess) £3,461,201 £30,589,001 6.47%Informal Care (excess) £9,101,606 £80,437,105 17.01%Residential Care (excess) £1,580,239 £13,965,652 2.95%TV Licence allowance £54,389 £523,224 0.11%Other Costs £705,253 £6,437,369 1.36%Capital £624,863 £5,644,829 1.19%Tax Exemption (Blind persons) £80,389 £792,541 0.17%Indirect Costs: lost productivity £7,091,494 £66,878,257 14.14%Underemployment (excess) £6,513,480 £61,416,654 12.99%Absence from work (excess) £578,014 £5,461,603 1.15%Deadweight Loss £3,749,179 £33,868,972 7.16%
Total Cost of Illness £52,226,185 £472,870,707

Part 4: Glaucoma – Costs
63
Table GL-3 (d) Glaucoma - N. Ireland Year 2010 Period 2010 - 2020 % of Total Direct Health Care Cost £5,726,137 £51,955,128 41.69%GP Consultations £14,748 £130,337 0.10%GOS £1,845,752 £17,661,511 14.17%Hospital Care £3,479,399 £30,749,824 24.67%Transport to Hospital £83,189 £735,194 0.59%LV Health Service Consultation £265,685 £2,348,041 1.88%Non-Ophthalmic related Medical £37,365 £330,221 0.26%Social and Personal Cost £4,763,636 £42,114,518 33.79%Low-Vision Devices & Rehabilitation £575,698 £5,087,835 4.08%Paid Care (excess) £1,021,060 £9,023,806 7.24%Informal Care (excess) £2,684,989 £23,729,079 19.04%Residential Care (excess) £465,638 £4,115,163 3.30%TV Licence allowance £16,251 £158,635 0.13%Other Costs £177,984 £1,630,060 1.31%Capital £154,107 £1,388,935 1.11%Tax Exemption (Blind persons) £23,877 £241,125 0.19%Indirect Costs: lost productivity £2,114,041 £20,602,973 16.53%Underemployment (excess) £1,941,922 £18,922,327 15.18%Absence from work (excess) £172,119 £1,680,646 1.35%Deadweight Loss £924,641 £8,333,609 6.69%
Total Cost of Illness £13,706,441 £124,636,288

Part 4: Glaucoma – Varying the Assumptions
64
Section 3: Varying the Assumptions
Sight loss from this condition is insidious, so that many patients present only
when the disease is advanced. According to a substantial section of the
literature, at any one time about half of affected cases remain undetected.
Initiatives to improve this rate are regularly considered and in the present model
three possible levels of detection were assumed: 50% (Base Case), 75%, and
90%.
The number of people with ocular hypertension, glaucoma and sight loss due to
glaucoma in the UK, in relation to the assumed detection rates is shown in Table
GL-4.
Table GL-4. Glaucoma, ocular hypertension, and sight loss due to glaucoma. Estimated number of diagnosed cases for the U.K, in relation to the assumed Detection Rate. Glaucoma: U.K. year: 2010 2015 2020 Detected = 50%
OH Detected 308,044 333,494 361,183GL Detected 265,973 293,733 327,440Partially sighted 57,646 63,991 71,806Blind 17,511 19,646 22,261 Detection = 75% OH Detected 462,067 500,241 541,775GL Detected 360,442 397,625 442,738Partially sighted 54,763 60,774 68,182Blind 16,635 18,658 21,138 Detection = 90% OH Detected 554,480 600,289 650,129GL Detected 418,025 460,937 512,992Partially sighted 53,034 58,845 66,009Blind 16,110 18,066 20,464
GL=glaucoma, OH=ocular hypertension.

Part 4: Glaucoma – Varying the Assumptions
65
The detailed costs for glaucoma and ocular hypertension in the U.K., for each
detection level, are shown in Tables GL-2 (above), and GL-5, and GL-6.
Table GL-5. Cumulative cost of illness for glaucoma and ocular hypertension over the decade, and the cost at base year 2010. Assumption-2: Improved detection rate = 75%. Glaucoma - U.K. Year 2010 Period 2010 - 2020 % of Total Direct Health Care Cost £280,371,611 £2,520,092,700 47.78%GP Consultations £790,449 £6,985,735 0.13%GOS £78,829,076 £738,923,665 14.01%Hospital Care £184,848,357 £1,633,631,185 30.97%Transport to Hospital £4,469,536 £39,500,340 0.75%LV Health Service Consultation £10,024,395 £88,592,425 1.68%Non-Ophthalmic related Medical £1,409,798 £12,459,351 0.24%Social and Personal Cost £179,365,591 £1,585,654,118 30.06%Low-Vision Devices & Rehabilitation £21,721,286 £191,965,839 3.64%Paid Care (excess) £38,432,142 £339,651,087 6.44%Informal Care (excess) £101,061,496 £893,149,462 16.93%Residential Care (excess) £17,568,695 £155,266,553 2.94%TV Licence allowance £581,973 £5,621,177 0.11%Other Costs £7,965,715 £72,171,917 1.37%Capital £7,072,484 £63,349,517 1.20%Tax Exemption (Blind persons) £893,231 £8,822,401 0.17%Indirect Costs: lost productivity £75,615,127 £716,443,303 13.58%Underemployment (excess) £69,455,943 £657,996,146 12.48%Absence from work (excess) £6,159,184 £58,447,157 1.11%Deadweight Loss £42,434,904 £380,097,101 7.21%
Total Cost of Illness £585,752,947 £5,274,459,139

Part 4: Glaucoma – Varying the Assumptions
66
Table GL-6. Cumulative cost of illness for glaucoma and ocular hypertension over the decade and the cost at base year 2010. Assumption-3: Improved detection rate = 90%. Glaucoma - U.K. Year 2010 Period 2010 - 2020 % of Total Direct Health Care Cost £311,191,760 £2,793,089,814 50.70%GP Consultations £916,728 £8,101,755 0.15%GOS £79,982,672 £749,737,182 13.61%Hospital Care £214,011,002 £1,891,361,397 34.33%Transport to Hospital £5,208,244 £46,028,813 0.84%LV Health Service Consultation £9,707,835 £85,794,769 1.56%Non-Ophthalmic related Medical £1,365,278 £12,065,898 0.22%Social and Personal Cost £173,701,414 £1,535,580,164 27.88%Low-Vision Devices & Rehabilitation £21,035,351 £185,903,760 3.37%Paid Care (excess) £37,218,495 £328,925,263 5.97%Informal Care (excess) £97,870,080 £864,944,742 15.70%Residential Care (excess) £17,013,894 £150,363,399 2.73%TV Licence allowance £563,595 £5,443,000 0.10%Other Costs £8,490,049 £76,787,766 1.39%Capital £7,625,025 £68,245,068 1.24%Tax Exemption (Blind persons) £865,024 £8,542,698 0.16%Indirect Costs: lost productivity £73,227,281 £693,768,226 12.59%Underemployment (excess) £67,262,597 £637,170,931 11.57%Absence from work (excess) £5,964,684 £56,597,295 1.03%Deadweight Loss £45,750,151 £409,470,411 7.43%
Total Cost of Illness £612,360,655 £5,508,696,381

Part 4: Glaucoma – Varying the Assumptions
67
Table GL-7. Cumulative Cost of illness and number of persons with sight loss due to glaucoma, at 3 levels of detection rate. Estimates for the U.K. Assumed detection rate
Cumulative cost
of illness over the decade
Sight Lossfrom glaucoma
in 2010
Sight Lossfrom glaucoma
in 2015
Sight Lossfrom glaucoma
in 2020
50% £4,889,652,026 75,157 83,637 94,067
75% £5,274,459,139 71,399 79,432 89,319
90% £5,508,696,381 69,144 76,910 86,473 Sight Loss = VA < 6/12 (VI+BLIND
Table GL-7 shows the total costs of illness over the decade for each assumed
level of detection, in relation to number of people blind and partially sighted due
to glaucoma, for the years 2010, 2015 and 2020.
Base Case Assumption: Detection rate is 50%. In this situation, the estimated
numbers in the U.K. with sight loss due to glaucoma (nearest 1000) are: 75,000
persons in 2010, rising to 84,000 persons in 2015, and 94,000 people in 2020
The total cumulative cost of illness for glaucoma (including OH) for the decade is
£4.9 billion
Assumption-2: Detection rate is improved to 75%. In this situation, there will be
a modest decrease in prevalence of sight loss from glaucoma over the decade,
the estimated numbers being 71,000 in 2010, rising to 79,000 in 2015 and
89,000 people in 2020. The total cumulative cost of illness for the decade will
increase from £4.9 billion (at 50% detection), to £5.3 billion (at 75% detection)
(Table GL-7).
Part 4: Glaucoma – Varying the Assumptions
68
Assumption-3: Detection rate is improved to 90%. Under this assumption, the
estimated numbers with sight loss are lower at: 69,000 people in 2010, rising to
77,000 in 2015, and 86,000 people in 2020 At this improved rate of detection,
there will be between 6,000 & 7,600 fewer cases of sight loss from glaucoma in
each year of the decade in the U.K., compared to 50% coverage. The cumulative
cost of illness for glaucoma and OH over the decade will increased from £4.9
billion (at 50% detection), to £5.5 billion (at 90% detection)

Observation of Authors
69
Observation of the Authors:
We are honoured to have had the opportunity to do professionally what we like
best to do, which is to work on these vision related models. Hopefully they will
contribute to the information base within RNIB and beyond to all agencies
delivering the UK Vision Strategy. As part of our brief we were asked for our
thoughts on the ways forward for this work. We were also asked to identify the
“gaps” in the information base which might be addressed to better inform the use
of the model in the UK Vision Strategy and we happily comply.
Epidemiological models such as those that we have constructed for this report
can estimate how many in the population are at risk of eye disease and how
many have the disease and to some extent, they can tell us how many have
related sight loss. We can also estimate the numbers of persons who (if they are
receiving existing treatments considered to be effective), may have their vision
regained or preserved or unfortunately go into irrevocable sight loss.
For existing treatment however, our models at present cannot estimate how
many of those eligible for treatment present for, receive and take full advantage
of their entitlements to these sight preserving treatments. Therefore our
estimation of the likely pool of those going into sight loss could be at a more
robust and detailed level than it is at present. A major cause of this limitation is
the reliance on large scale but very limited data bases, and the paucity or lack of
access to monitoring systems at the patient or disease level.
The UK recording systems in health and social services beyond the levels of
audit to ensure professional competence, still have their basis in the aspiration of
“money following patients” for the most cost effective returns on expenditures.
Even if they were perfectly structured for their main objective, these recording
systems will not suffice as effective systems to address the information we need
on the match between services which are provided and those in need entitled to
Observation of Authors
70
be the recipients. Most certainly on their own or combined with demography or
epidemiology, these databases have little facility to tell us the numbers of those
in need of treatment or care who get left out from, or short changed by, the
existing services.
As the costing aspects of our model, where “bottom up” methods are used, are
applied to the numbers estimated by the epidemiology, they take the same
limitations about knowledge of treatment levels. Use of “top down methods” (e.g.
for cataract surgery) disaggregates expenditure to some level of budgetary
category. This then can be related to a treatment code for intervention which
cannot necessarily allow differentiation between patients receiving multiple or
single treatment and has no information on those who are excluded. However we
proceed, our work in the economic estimation of resource use reflects the poor
information base on levels of accessibility, availability and outcome related to
sight preservation or loss.
As a half way measure, in the models we make some implicit assumptions about
levels of access, detection and coverage, and we explicitly vary some of the
assumptions. This is more an indication of what knowing more would imply for
estimations of sight loss, than it is about cost changes in expenditure.
Explicit assumptions are:
• The levels of coverage of the new treatment for Neovascular AMD could be at
50%, 75%, or 90%.
• The levels of detection for glaucoma could be 50%, 75%, or 90%, and the
proportion treated among diagnosed ocular hypertension cases could be 30%.

Observation of Authors
71
Some implicit assumptions are:
• Whilst showing that persons from the African - Caribbean ethnic group are at
higher risk of glaucoma than the general population, we assume that they are
receiving and require the same level of treatment and of social care as the rest
of the population.
• That members of this group also have the same benefit from treatment at
different levels of disease as the wider patient group.
• That the lower level of employment opportunity for blind persons is not subject
to a labour market racial discrimination effect which might make this even
lower.
• That the old beyond the age of 85 years, have the same level of access to
cataract operations as those in the younger groups of elderly.
• That persons on low income will purchase spectacles to maximise the
functional outcome of cataract surgery.
• That the ratio of new to old used in the model and set as a government target
for provider treatment, is “value free” without the effect of deferring patients
who should be recalled for low vision or routine follow up appointments.

Observation of Authors
72
We offer the following thoughts for the future:
1. A concerted questioning of the “fit for purpose” of the routine health and social
care recording systems if used as an information base for the Vision strategy or
indeed for monitoring policy initiatives.
2. A strong impression that the assumptions about detection of disease and
levels of treatment which we have had to make in the models suggest the need
for an information base far more robust than we have at present.
3. A view that the necessary information base can be accrued at many levels of
project size and expenditure, but should have criteria for collection which
emphasise objectivity.
4. A conviction that removing this reliance on “not fit for purpose” systems and
requiring collaborative systems of investigation and monitoring, will see positive
returns for the UK Vision strategy. One such return would be that ongoing efforts
in policy and strategy aimed at bettering access to new or improved treatments,
will not fall short of ensuring the entitlements in eye care which the RNIB seeks
to fulfil.
Angela Reidy and Darwin Minassian

Appendix 1: Methods – Epidemiology & Modelling
73
Appendix 1
Methods – Epidemiology and Modelling

Appendix 1: Methods – Epidemiology & Modelling
74
METHODS – Epidemiology & Modelling The Decade Model - Overview The Decade Model comprises a main controlling ECONOMIC Section, which
carries out the following tasks:
• Defines the conditions under which the model is run, according to the key
assumptions.
• Instructs one of its serving sub-sections (the Epidemiology Module) as to
what inputs it requires concerning epidemiological estimates.
• Takes costing and related outputs from other serving sub-sections.
• Formats the economic data so that they can be applied to the
epidemiological estimates.
• Links the formatted economic data with the epidemiological estimates and
computes the cost of illness over the decade.
• Prepares summaries of the cost of illness by country, and outputs the
results together with some additional data of interest.
Figure M-1 shows the Model structure according to the main functions.
A ‘System Dynamics’ approach was used in constructing the decade model to
simulate the dynamics of the eye disorder in large populations. ‘Level’ Variables
representing pools of individuals affected by the eye disorder and by the
consequent sight loss, and the pools of financial costs, are used. These are
interconnected by ‘flow paths’ allowing flow in and out of the pools. ‘Rate’
variables acting as ‘taps’ determine the rates of flow into and out of the pools.
‘Auxiliary’ variables representing influence factors (determinants) open or close
the ‘Rate taps’ (increase or decrease the rates of flow). The levels are influenced
only by rates, and the rates only by auxiliaries and other levels.

Appendix 1: Methods – Epidemiology & Modelling
75
The ‘system’ being modelled comprises the given population, and the health care
and related resources therein. When the model is run for the specified simulation
(projection) period, the pools grow (or shrink) with passing time, according to the
population dynamics of the eye disorder and the care facility in the system.
Snapshots of the main pools are outputs that give summary results of the
simulation at selected (desired) calendar year points in the projection period. The
defaults for the summary outputs are: affected number of individuals in the years
2010, 2015, and 2020, total cumulative cost of illness by year 2020, and the cost
at base year 2010.

Appendix 1: Methods – Epidemiology & Modelling
76
Figure M-1. Summary structure of the Decade Model according to main functions.
ECONOMIC Section
Engine of the Decade Model Main OUTPUTS: Cumulative cost of illness over the decade for the eye disorder, by country, broken down by main costing categories. Prevalence pool in 2010, 2015, 2020 Epidemiology
Module
Key Assumptions
Inputs from External Sources Economic, demographic and other epidemiological data
Stage III
Stage II
Stage I
GOS / Screening Sight-Test Module
GDP Deflators & Discounting
Improvements in prevention/cure currently underway
The Decade Model
Direct Health Care
Social/Personal Care
Capital, Tax exemption
Productivity Loss
Deadweight Loss

Appendix 1: Methods – Epidemiology & Modelling
77
The main functional sub-sections of the Model are described below. The Epidemiology Module The Epidemiology Module requires incidence figures and mortality rates, in
addition to prevalent numbers affected by the condition at issue at the beginning
of the simulation period (year 2010). These are required, in order to compute the
size of the total pool of cases in the population as years progress. The Module
‘monitors’ and records the changing pool, as new cases are allowed to flow in
according to incidence rates, and existing cases flow out through mortality and
other factors, over the 10-year simulation period. The main ECONOMIC Section
of the Model links the dynamics of the prevalence pool with the economic data, to
compute the cumulative cost of illness over the decade.
The processes in the Epidemiology module take place in 3 Stages, as described
below.
Stage I of the Epidemiology Module
Derives prevalence figures (historic prevalence proportions) from best
available prevalence data that have been reported by population-based studies.
The derived proportions are then applied to the population projections provided
by Government Actuary’s Department (GAD), to compute the number of
individuals affected by the disorder at issue. Age-specific prevalence estimates
are split by gender and ethnicity when appropriate. The Stage I outputs are
considered as initial (preliminary) projections, as they are based on the historic
prevalence proportions, and are valid only if the underlying age/sex/ethnic-
specific incidence rates of the disorder are stable and the same as the historic
incidence rates that determined the historic prevalence. The incidence rates are
unknown at this stage.

Appendix 1: Methods – Epidemiology & Modelling
78
Stage II of the Epidemiology Module
Estimates the effective age-specific Cumulative Incidence of the disorder over a
calendar period, for birth cohorts, by gender and ethnicity when necessary. The
method used is based on the procedures described by Elandt-Johnson &
Johnson (1980) for the estimation of incidence onset distribution from prevalence
data, in “Survival Models and Data Analysis” (John Wiley and Sons 1980). The
calculations use the prevalence figures derived in Stage I, mortality rates, and
population projections (which include net migration figures). The mortality rates
are those used by the Government Actuary’s Department (GAD) to make the
population projections. The decade model converts the mortality rates to
conditional survival probabilities over the periods 2010 – 2015, and 2015 – 2020.
Stage III of the Epidemiology Module
Takes the historic Cumulative Incidence (CIhistoric) rate for a birth cohort, prepared
in Stage II, modulates it according to the changes expected under a given key
assumption, or expected because of improvements in preventive/curative
measures currently underway. The resulting incidence (CIfinal) is then applied to
the population at risk (i.e. to the number of individuals free of the disorder in the
birth cohort at the start of a period), to calculate the ‘final’ projected number of
affected individuals in the birth cohort at the end of the period. In this Stage, the
number of new cases that occur and accumulate over the projection period are
stored in ‘temporary’ variables, a permanent count being kept for some disorders
of interest.

Appendix 1: Methods – Epidemiology & Modelling
79
The equations used are:
CIfinal = (1+Y) CIhistoric and n1 = (Psurv n0) + {(N0 - n0) CIfinal } Where: n1 = Number of affected individuals in the birth cohort at the END of the
period.
n0 = Number of affected individuals in the birth cohort at the START of the
period. Figures for the start of the projection period (year 2010) are
obtained from Stage I.
Psurv = The Proportion of n0 (the prevalent cases) surviving to the end of the
period.
N0 = Total number of individuals in the birth cohort at the start of the period.
Y = Proportional change in the historic incidence rate expected under a
given assumption (or scenario), or expected because of improvements
in preventive/curative measures currently underway. The Model
evaluates Y according to the Scenario or the expected improvements.
For example, an expected relative risk of ‘historic CI’ / ‘future CI’ = 1.25,
is translated to Y = (– 0.25), i.e. an expected 25% reduction in risk.
CIfinal = The expected cumulative incidence for the birth cohort over the period.
Note that values of CI for a particular birth cohort change, as the cohort
members advance through calendar time and become older.
The process is repeated for the remaining birth cohorts in the model, and the
resulting values of n1 are summed up to give the total number of individuals with
the disorder at the end of the period, broken down by age, and gender/ethnicity
where appropriate.
The subsequent (next) period is then considered and the whole process
repeated, with numbers at the beginning of the new period assuming the values
computed for the end of the previous period…. and so on.
Appendix 1: Methods – Epidemiology & Modelling
80
For AMD, the model also keeps a count of the number of Ranibizumab injections
and numbers who gain visual acuity, as time progresses over the decade.
The Sight Test Module
The latest report - General Ophthalmic Services (GOS): Activity statistics for
England and Wales, year ending 31 March 2008 - published by the Information Centre, Part of the Government Statistical Service, provided the main
external inputs for this module. According to GOS, for the year ending 31 March
2008 there were 16,106,528 sight tests, of which 5,058,638 were paid for
privately.
The module was constructed to take the GOS data on number of sight tests (by
mainly clinical need category or age), and apportion them to the 4 main eye
disorders being modelled, in a sensible way. In the context of the cost of illness
study, the GOS was considered as a screening service for multiple eye disorders
among the general population (and for special persons such as close relatives of
glaucoma patients), to identify eye disorders that should be referred to the GP or
hospital services, and to provide for those requiring correction for refractive
errors. Consequently, for cost of illness purposes, the time/resource spent by the
optometrist looking for a particular disorder in a member of the public requesting
an eye test, should have little to do with the population prevalence of the
disorder, and much to do with the type of procedure used to detect the condition.
For example, assessing a client for glaucoma takes longer and costs more than
assessing the person for cataract. Time taken for visual acuity (and allied)
measurements and slit-lamp examination are common to both conditions, but
looking for glaucoma may also require measurement of visual fields and of the
intraocular pressure, using up considerably more time/resource. Accordingly, a
tentative schedule was developed to evaluate the proportion of the total
time/resource per sight test that could be attributed to the identification of each of

Appendix 1: Methods – Epidemiology & Modelling
81
the main eye disorders, including refractive error and an open category of
‘others’. A schedule was constructed for each main category of attendee (as
listed in the GOS report), and weighted average attributable proportions derived
(weighted by the number of sight tests falling in each category). The resulting
apportionments are shown below:
Disorder Age 60+ < 60
Glaucoma 0.3702 0.1372
AMD 0.1009 0.0000
Cataract 0.1352 0.0664
DR * 0.0100 0.0000
Ref. Err. 0.1938 0.4425
Other 0.1900 0.3540
All 1.0000 1.0000 * Cost of formal screening for DR was included in the ‘Hospital Care’ cost of illness category.
For future use, the schedule should be validated through a study based in
optometrist practices.
The module derived the sight tests per head of population <60 and 60+ from the
GOS and GAD data, and allocated the fractions to the 4 main eye disorders
according to the schedule. These were subsequently used to derive number of
sight tests to which the unit costs would be applied.

Appendix 1: Methods – Epidemiology & Modelling
82
DEMOGRAPHY The latest projections of population estimates for the years 2010 to 2020 were
obtained from the Government Actuary’s Department (GAD). These give
estimated numbers by 1-year and 5-year age classes, for males, for females, and
for all persons, and cover the UK, and the devolved countries (constrained to the
national projections). A summary of population projections is shown below.
Projected populations (in 1000s) at mid-years. 2006-based Principal projections. Source: Government Actuary’s Department. Year: 2008 2010 2015 2020 2025 2030 2036 England Wales Scotland N. Ireland UK
51,488 2,993 5,157 1,774
61,412
52,297 3,0235,190 1,799
62,309
54,319 3,098 5,258 1,857
64,532
56,354 3,172 5,316 1,911
66,754
58,311 3,237 5,357 1,958
68,863
60,096 3,288 5,373 1,993
70,750
62,033 3,330 5,361 2,023
72,747
Population Projections by Ethnic Groups
Some estimates (with limitations) were available from the Office for National
Statistics (ONS), and from other groups who have developed their own
simulation models to expand on the ONS estimates. There are serious problems
in projecting population estimates split by ethnic group. The difficulties include
lack of an ethnic dimension in the past trends of migration, fertility, and mortality.
The first stage of a project initiated by the ONS involved a feasibility study for
making such projections. The study, started in 1999, was undertaken by a group
of experts made up of academic demographers, geographers, and other
specialists in the field of quantitative ethnic demography. The findings [Haskey
2002] led to the conclusion that “projections can usefully be undertaken – albeit

Appendix 1: Methods – Epidemiology & Modelling
83
with larger uncertainty than with traditional projections – when prepared for
individual ethnic communities …”
For the decade model concerning glaucoma and ocular hypertension, we have
derived ethnic split projections, taking the latest ONS population estimates by
ethnic group for England for the year 2005 (published in October 2007), as the
base year. The ONS estimates are said to be ‘experimental’. The methodology is
described by Large & Ghosh [Large P 2006].

Appendix 1: Methods – Epidemiology & Modelling
84
AMD – Methods for Epidemiological Estimates
AMD - Prevalence The following sources were considered for selection of the most appropriate
prevalence data to be used as inputs for the Decade Model:
• The European Eye Study (EUREYE) [Augood CA 2006]. Multicentre study in
7 European countries (Norway, Estonia, UK, France, Italy, Greece, and
Spain).
• The Eye Disease Prevalence Research Group 2004 [EDPRG 2004]. Meta-
analysis of large population-based studies in: Europe (Rotterdam); USA
(Beaver Dam, Baltimore, Salisbury); Australia (Blue Mountains-Sydney,
Melbourne-Victoria); and Barbados.
• Evans J.R. et al 2004. “Age-related macular degeneration causing visual
impairment in people 75 years or older in Britain”. A population-based cross-
sectional study [Evans JR 2004].
• Owen C.G. et al 2003. Meta-analysis of data requested and obtained from:
Beaver Dam Eye Study, Melbourne VI Project, Blue Mountains Eye Study,
Copenhagen City Eye Study, Rotterdam Study, and the North London Eye
Study [Owen CG 2003].
• Rotterdam Study 1995. Reporting the prevalence of age-related macular
degeneration, including estimates for early ARM [Vingerling JR 1995].
For early ARM estimates, the Rotterdam Study data were used, as this gave a
mutually exclusive categories of Early ARM and AMD.

Appendix 1: Methods – Epidemiology & Modelling
85
For AMD prevalence, the estimates from the Eye Disease Prevalence Research Group were used. These were similar to the estimates from the
European Eye Study, but included younger age groups, was focused on
obtaining robust estimates for Neovascular AMD and the ‘dry’ form of AMD
(Geographic Atrophy), and on balance, was considered more suitable for our
purpose. In both studies (and in others e.g. Owen), the Neovascular AMD and
Geographic Atrophy were not mutually exclusive categories, in so far as the
Geographic Atrophy group included some persons with Neovascular AMD in the
fellow eye. All persons classified as Neovascular AMD had the disorder in at
least one eye, some having the ‘dry’ form in the fellow eye. Since estimates were
also given for ‘Any AMD’, i.e. the ‘dry’ and/or ‘wet’ forms, we were able to obtain
the prevalence for 2 mutually exclusive categories: i.e. a) Neovascular AMD in
one or both eyes, and b) Only ‘dry’ AMD in one or both eyes. The data are
shown below:
% Prevalence
Age Any AMD * NV-AMD * GA-AMD *Exclusive GA-AMD
Males 50-54 0.34 0.23 0.15 0.11 55-59 0.41 0.28 0.22 0.13 60-64 0.63 0.42 0.37 0.21 65-69 1.08 0.73 0.66 0.35 70-74 1.98 1.33 1.19 0.65 75-79 3.97 2.49 2.16 1.48 80+ 11.9 8.28 6.6 3.62 Females 50-54 0.2 0.14 0.11 0.06 55-59 0.22 0.16 0.12 0.06 60-64 0.35 0.26 0.19 0.09 65-69 0.7 0.51 0.37 0.19 70-74 1.52 1.09 0.81 0.43 75-79 3.44 2.4 1.85 1.04 80+ 16.39 11.07 9.37 5.32
* Original data, Source: Eye Disease Prevalence Research Group

Appendix 1: Methods – Epidemiology & Modelling
86
AMD – Proportions with Sight Loss
For proportions with sight loss due to AMD, we used the Owen and the Evans
estimates. The Owen estimates covered all the desired age groups, but did not
give estimates for the required levels of sight loss. The estimates were for visual
acuities of 6/18 to >6/60, 6/60 to 3/60, and poorer than 3/60. The Evans
estimates did give the proportions for the required levels of sight loss (<6/12-6/60
and poorer than 6/60), but did not cover the younger age groups. The relative
proportions Owen/Evans for the common age groups were used to derive
proportions for the required levels of sight loss for the younger age groups. This
adjustment did not affect the estimates for ‘any sight loss’ (<6/12).
AMD – Ranibizumab (Lucentis) Treatment
The assumptions for the model concerning eligibility and indications for
Ranibizumab treatment in Neovascular AMD were based on the guide in the
report by National Institute for Health and Clinical Excellence [NICE 2008], and
The Royal College of Ophthalmologists clinician’s guide [RCOphth 2008]. The
model assumptions were:
• 75% of cases of Neovascular AMD with corrected visual acuity of < 6/12-6/60
in the better seeing eye would be eligible (clinically suitable) for treatment.
• 10% of cases of Neovascular AMD with corrected visual acuity of < 6/60 in the
better seeing eye would be eligible (clinically suitable) for treatment.
• Treatment coverage: 75% of the eligible will be treated. The model also used 2
variations of this assumption: 90% treated to reflect improvements in treatment
coverage, and 50% treated to reflect possible limitations in access to
treatment or patient concerns.
• Ranibizumab treatment: on average, 8 injections would be given in the first
year, followed by 6 injections in the second year of treatment.
Appendix 1: Methods – Epidemiology & Modelling
87
Published data from the ANCHOR [Brown DM 2006] and MARINA [Rosenfeld PJ
2006] studies were used to derive values for the treatment effect: relative risk of
progression to blindness, and of the proportion among the treated who gain
visual acuity of 15 or more letters (3+ Snellen lines). The derived values were:
0.17 and 0.25 respectively. In the model, the reduced risk of progression was
allowed to persist for 2 years from start of treatment, and gradually return to
baseline in 5 years.
CATARACT – Methods for Epidemiological Estimates A substantial portion of cost of illness for cataract relates to treatment and clinical
management, i.e. cost of cataract surgery (and management of adverse post-
operative events). Accordingly, we have used number of cataract extractions
rather than number of persons with cataract, for estimation of treatment costs.
For calculation of costs relating to partial sight or blindness attributable to
cataract, and for other cost components, we have estimated the number of
affected persons.
Number of Cataract Extractions
Number of Finished Consultant Episodes were obtained from the NHS - The
Information Centre (England), Hospital Episode Statistics - 2006-07 (HES).
These also provided number of capsulotomies performed following cataract
surgery. The original data were by very broad age classes, unsuitable for our
purpose. In order to refine these to 5-year age classes, proportions falling in each
age-class, by gender, were derived from a large study of cataract surgery in the
UK, involving more than 100 hospitals and 19000 patients [Desai P 1999]. These
proportions were applied to the HES data to obtain numbers by age and gender.
Population ‘rates’ were then computed by using the age/sex-specific population
Appendix 1: Methods – Epidemiology & Modelling
88
of England (2006). These ‘rates’ were then applied in our model to the
populations in year 2010 onwards, to obtain the expected number of cataract
extractions and capsulotomies.
Sight Loss Attributed to Cataract
Our estimates for bilateral sight loss are based on an extended analysis of the
North London Eye Study [Reidy A. 1998], where individuals were classified
according to the principal cause(s) of the visual impairment, by ophthalmologists,
at the time of the clinical examination, rather than being derived entirely from
recorded disease status and visual acuity data. Individuals who had bilateral
cataract / pseudophakia and had poor vision were not classified as ‘sight loss
attributed to cataract’ if the principal cause of the sight loss was judged to be
macular degeneration or end-stage primary open angle glaucoma or central
corneal opacity etc. Those with poor vision but awaiting surgery or waiting to be
listed for surgery were also excluded, since their sight loss was deemed
temporary and short-lived. Thus, the main bulk of the ‘VI attributed to cataract’
comprised:
• Cataract cases deemed to be unsuitable for surgery or unwilling to have
surgery in the foreseeable future (as indicated by the “No Action Needed”
recording);
• Those with bilateral pseudophakia with no other apparent cause for the poor
vision (apart from possible cognitive deficit, or the retina being ‘old and tired’);
and
• Persons with ‘irreversible’ sight loss due to complications following cataract
surgery (e.g. endophthalmitis, secondary end-stage glaucoma, retinal
detachment, etc.).
As always, there were some borderline cases (with a mix of co-existing
disorders) that were hard to classify.

Appendix 1: Methods – Epidemiology & Modelling
89
The population prevalence of partial sight (corrected visual acuity <6/12-6/60 in
the better eye) attributable to cataract, by age and gender, were taken from the
North London Eye Study data. These age/sex-specific prevalence figures were
smoothed by a best-fit curve (exponential) applied to males and females
separately. The curve equations were used to estimate the number of affected
persons in the population. The smoothed prevalence figures are shown below:
Prevalence of partial sight attributable to cataract. Estimated from the North London Eye Study (NLES). NLES
Age SmoothedMALES 50-54 0.002764 55-59 0.003558 60-64 0.004579 65-69 0.005895 70-74 0.007588 75-79 0.009768 80-84 0.012573 85+ 0.017023 FEMALES 50-54 0.000851 55-59 0.001330 60-64 0.002078 65-69 0.003248 70-74 0.005076 75-79 0.007933 80-84 0.012399 85+ 0.019377
The overall prevalence of bilateral blindness (VA<6/60) attributable to cataract,
from the North London Eye Study analysis was estimated at approximately
0.129%.
Appendix 1: Methods – Epidemiology & Modelling
90
Endophthalmitis Infectious (proven or presumed) endophthalmitis following cataract surgery is a
very rare event but is of major concern because in a substantial proportion of
cases it lead to serious visual impairment or loss of the eye, in spite of improved
modern management strategies. From a public health perspective, the condition
is also of concern because substantial number of cases are accrued annually
from the huge volume of cataract surgery in large populations. The condition is
often difficult to treat and can be very costly to manage.
The 1-year cumulative incidence of endophthalmitis following cataract surgery
was taken from our earlier work – meta-analysis of 13 European studies,
including 6 studies in the UK. Two rates were computed according to the
prophylaxis strategy in widespread use: a) 1.31 per 1000 under conditions of
routine prophylaxis, and b) 0.51 per 1000 with additional intracameral antibiotics
at the time of surgery. The former rate was used in our model for 2008, but the
lower rate was considered more appropriate for future projections. The lower
incidence reflects the expected widespread use of intracameral antibiotics (e.g.
second-generation cephalosporins, such as cefuroxime) in addition to the routine
prophylaxis with povidone-iodine eye preparation and topical antibiotics. The
additional prophylaxis was suggested by the ESCRS (European Society of
Cataract & Refractive Surgeons) revised guidelines. The guidelines were
informed by the ESCRS randomised controlled trial, on prophylaxis to prevent
endophthalmitis following cataract surgery [ESCRS 2007].
Cystoid macular oedema
Cystoid macular oedema, first reported by Irvine in 1953, may occur typically 3-
12 weeks after cataract surgery. Angiographic evidence of leakage and
accumulation of fluid in the macula, and macular thickening as evidenced by
optical coherence tomography are observed in a large proportion of

Appendix 1: Methods – Epidemiology & Modelling
91
pseudophakic eyes, but most of these are not associated with any loss of visual
acuity (though they may result in some loss of contrast sensitivity). When the
macular oedema is associated with clinically significant loss of visual acuity, the
condition is termed clinical CMO, and this is an area of major concern, because
it may seriously delay the expected gain in visual function or negate the earlier
gains, causing substantial anxiety and inconvenience to the patient and places
additional demand on eye services. The condition is largely self-limiting and may
resolve in up to 90% of patients by 3-12 months. Some of the few persistent
chronic cases may suffer permanent sight loss due to irreversible damage to the
macula.
In our previous extensive work on published data, the cumulative incidence of
CMO within 4 months of cataract surgery was estimated at 3.0%. This estimate,
however, is subject to considerable uncertainty, as indicated in the summary
quoted from our previous work:
“In Summary: No epidemiologically sound estimate of incidence is available for
clinical CMO following cataract surgery in the UK, and no reliable estimate could
be derived from reported data. The findings and arguments presented above
suggest a likely incidence of around 3% within 4 months of cataract surgery in
the UK, with a minimum expected incidence of around 2% and a maximum of
about 4%. These figures are higher than the often quoted minimum of 1%, which
was based on earlier studies and related only to uncomplicated cataract
surgery…”
Retinal detachment
Detachment of the retina is uncommon in the general population, the incidence
being around 0.02% per year in mid-late life. The risk is increased after cataract
surgery, partly due to some complications at surgery, such as posterior capsule

Appendix 1: Methods – Epidemiology & Modelling
92
tear, and also because of the patient’s characteristics, such as high myopia (axial
length of the eye > 23mm), male gender, and younger age [Tuft SJ 2006].
The most reliable cumulative incidence rate (0.16%) for retinal detachment within
3 months of cataract surgery was given by the National Cataract Surgery Survey
[Desai P 1999]. This was applied in our Model.
DR - Methods for Epidemiological Estimates Prevalence of Diabetes (Diagnosed) Prevalence estimates for diagnosed diabetes by age and gender were obtained
from the Joint Health Surveys Unit (2008) Health Survey for England 2006.
Extracts are shown in the table below.
Prevalence of diagnosed diabetes by sex and age, 2006 England
All
ages 16–24 25–34 35–44 45–54 55–64 65–74 75+ % % % % % % % %
Men 5.6 0.8 1.2 2.4 6.0 8.5 15.7 13.5Women 4.2 0.9 1.2 1.2 3.6 6.0 10.4 10.6
The model allowed an average 1% annual increase in the underlying
age/gender-specific risk of diabetes over the projection period. This was in
addition to increasing numbers expected because of demographic changes over
the projection period.
Prevalence of Diabetic Retinopathy Estimates were based on the data from 27,178 individuals attending for first
screening at the Wales Diabetic Retinopathy Screening Service (EASDEC

Appendix 1: Methods – Epidemiology & Modelling
93
Rome 2007). The summary prevalence figures for each of the main stages of DR
among the diabetic population were: Background DR 28%, Non-proliferative DR
2.5%, Proliferative DR 0.7%, and Diabetic Maculopathy 7.0%.
Partial Sight Attributed to DR The Wales data did not give estimates for sight loss specifically attributable to
DR, since the focus of analysis was all vision loss in diabetic persons attending
the screening programme. Population-based figures on cause-specific
prevalence of visual impairment were taken from the findings of ‘The Visual
Impairment Project’, Australia [VanNewkirk MR 2001]. The summary prevalence
figures of partial sight attributable to DR were: 9 per 10,000 people for age <65,
and around 22 per 10,000 people for age 65 or older.
Blindness Attributed to DR
A different approach had to be used here, since the Australian study had found
no blindness attributable to DR among the random sample of 4,744 participants.
Blind and partial sight registration data for 2008 [Source: NHS - The Information
Centre – National Statistics] were used to estimate age-specific rates of
blindness (all causes) per head of population, as shown in the table below:
NHS-Information Centre ENGLAND-2008 England Popul. 2008 RATE per head of population Age PS Blind PS Blind 0-4 700 805 0-4 3,125,989 0.000224 0.000258 5-17 5140 3975 5-19 9,227,944 0.000557 0.000431 18-49 16845 19330 20-49 21,634,211 0.000779 0.000893 50-64 14105 15655 50-64 9,219,590 0.001530 0.001698 65-74 16055 14805 65-74 4,277,673 0.003753 0.003461 75+ 103345 98270 75+ 4,002,159 0.025822 0.024554 age ? 100 145 Totals 156190 152840
PS = partial sight

Appendix 1: Methods – Epidemiology & Modelling
94
Proportions attributable to DR were taken from an analysis of registration
certificates [Bunce C 2006]. Prevalence figures for sight loss attributable to DR
were then derived.
GLAUCOMA & Ocular Hypertension (OH)
In this report, the term ‘glaucoma’ is used to indicates Primary Open-angle
Glaucoma (POAG), characterised by slow death of ganglion cells in the retina
and degeneration of their axons. The diagnostic features are loss of functional
visual fields (particular patterns of loss), and degeneration of nerve fibres at the
optic disc rim, causing diminution of the rim area relative to the deeper central
area of the disc (‘cupping’ or enlarged cup/disc ratio). In late stages, the whole of
the optic disc may appear atrophic, with less than 10 degrees of functional visual
field remaining (tunnel vision). Raised intraocular pressure is not a necessary
feature for diagnosis, but is a risk factor (is associated with increased risk of
POAG). Sight loss from this condition is insidious, so that many patients present
only when the disease is advanced. At any one time, about half of affected cases
remain undetected.
Secondary glaucoma due to damage from other conditions or surgical
complications is not included in our estimates, nor is angle closure glaucoma
which is very uncommon in European populations. Congenital glaucoma is also
excluded from our estimates for adults.
Ocular hypertension (OH) is defined as intraocular pressure of more than 21
mmHg, without any accompanying signs of POAG. The risk of developing
glaucoma is increased in eyes that have ocular hypertension. There is some
evidence that treatments to reduce the intraocular pressure may reduce the risk
of POAG in patients with ocular hypertension. Generally, once detected, the OH

Appendix 1: Methods – Epidemiology & Modelling
95
cases are monitored (about annually), some being treated with hypotensive eye
drops.
GLAUCOMA – Prevalence Estimates
The following sources were considered for selection of the most appropriate
prevalence data to be used as inputs for the Model.
• The North London Eye Study [Reidy A 1998] and our meta-analysis
using few but most relevant epidemiological studies. These were based on
relatively small numbers and were not as robust as the estimates from
some of the larger meta-analyses listed below, but were considered more
relevant for the UK.
• Tuck & Crick: Meta-analysis and predictive equations, based on the
European studies and others of predominantly ‘white’ populations [Tuck
MW 1998 & 2003].
• Quigley & Vitale: Meta-analysis and predictive equations based on large
number of studies in diverse populations, giving a separate predictive
equation for ‘black’ populations [Quigley HA 1997].
• Rudnicka et al: A very extensive and detailed meta-analysis covering 46
published observational studies, largely non-European. This gave age-
specific prevalence of glaucoma for white, black, and Asian ethnic groups
[Rudnicka AR 2006].
• The Barbados Eye Study. Predictive equation developed by fitting best
curve (power function) to the survey data, to give age-specific prevalence
for Black persons [Wu S-Y 2001].

Appendix 1: Methods – Epidemiology & Modelling
96
For estimation in the non-black population (mainly white Caucasians + Asians),
we selected the updated predictive equation developed by Tuck and Crick [Tuck
MW 2003] to apply to our model. The equation was based on a logistic curve
fitted to age-specific prevalence data from a balanced mix of European and other
well-conducted epidemiological studies. The studies used by Tuck and Crick are
listed below:
UK: North London Eye Study – [Reidy A 1998]
Roscommon glaucoma survey, Ireland – [Coffey M 1993]
Ferndale glaucoma survey, UK – [Hollows FC 1966]
Europe: Casteldaccia eye study, Italy – [Giuffre G 1995]
Egna-Neumarkt study in Northern Italy – [Bonomi L 1998]
Rotterdam Eye Study – [Dielmans I 1994]
Australia: Victoria survey – [Weih LM 2001]
Blue Mountains Eye Study – [Mitchell P 1996]
USA: Beaver Dam eye study – [Klein BEK 1992]
Baltimore eye study – [Tielsch JM 1991]
Framingham Eye Study – [Leske MC 1981]
The updated Tuck-Crick predictive equation used in our model was:
Prevalence = 0.1160/(1+(2139 x EXP(-0.0873 x age))).
For the black (African-Caribbean) population estimates, we selected the
predictive equation based on the Barbados Eye Study data [Wu S-Y 2001]. The
equation was:
Prevalence = 1.0E-07 x age4.3440
Appendix 1: Methods – Epidemiology & Modelling
97
In our Model, these predictive equations were applied to the adult population in
the UK and in devolved countries, to obtain the number of glaucoma cases for
each of the 5-year age classes, in non-black (predominantly white) and in
African-Caribbean ethnic groups. The prevalence of POAG in adults younger
than 40 years was considered to be negligible.
GLAUCOMA – Proportions with Visual Impairment
The partial sight prevalence proportions used in the model were derived from the
North London Eye Study database, the overall figure being around 13% among
glaucoma cases. Estimates for proportion blind due to glaucoma among
glaucoma cases had to be derived from larger datasets. These included the
Melbourne and Victoria studies in Australia [Wensor MD 1998] [VanNewkirk MR
2001], the Rotterdam Study [Dielmans I 1994], and the Copenhagen City Eye
Study [Buch H 2004]. We used the pooled data from these studies to derive
weighted average estimates (using the sample sizes as weights). Proportion
blind among the African-Caribbean cases was estimated at 8%, based on the
Baltimore Eye Survey [Sommer A 1991].
The Roscommon study in Ireland also reported the proportion blind among
glaucoma patients, but this was not useful for our purpose because the blindness
was due to any cause.
GLAUCOMA – Disease Stages
For cost of treatment and clinical management, we have used a European multi-
centre study which gives costs in relation to the disease stage [Traverso CE
2005]. Accordingly, we had to classify our estimated number of affected persons
(glaucoma and OH cases), by disease stage. Proportions falling in each of the

Appendix 1: Methods – Epidemiology & Modelling
98
main stages were derived from the North London Eye Study data, the stage
definitions being loosely in line with those proposed by the European cost study.
GLAUCOMA – Proportion Detected
Several cross-sectional studies have consistently estimated that only about 50%
of the glaucoma cases in a population may be known, leaving half the cases
undetected. These include studies in Ireland (Roscommon), Netherlands
(Rotterdam), Australia (Melbourne & Blue Mountains), USA (Baltimore), and
Barbados. Lower estimates of previously detected cases, however, come from
The North London Eye Study [Reidy A 1998] (26%), the older study by Hollows
and Graham [Hollows FC 1966] in Wales (30%), and the Egna-Neumarkt study in
Italy [Bonomi L 1998] (22%).
On balance, and in view of the expected improvements in detection rates that
might have come about due to ‘case finding’ by optometrists in the UK, the
following assumptions were made:
• In glaucoma cases with no sight loss, 50% are expected to be known. This
assumption was varied in the model (increased to 75% and also 90%) to
reflect possible improvements in detection over the projection period.
• All persons with partial sight or blindness from glaucoma are expected to be
known to the hospital services.

Appendix 1: Methods – Epidemiology & Modelling
99
REFERENCES - Epidemiology
Augood C.A. et al. Prevalence of age-related maculopathy in Older Europeans. The European Eye Study (EUREYE). Arch Ophthalmol. 2006;124:529-535. Bonomi L, Marchini G, Marraffa M, Bernardi P, De Franco I, Perfetti S, Varotto A, Tenna V. Prevalence of glaucoma and intraocular pressure distribution in a defined population. The Egna-Neumarkt Study. Ophthalmology 1998;105, 209–215. Brown DM, Kaiser PK, Michels M, et al, for the ANCHOR Study Group. Ranibizumab versus Verteporfin for Neovascular Age-Related Macular Degeneration. N Engl J Med 2006;355:1432-44. Buch H, Vinding T, la Cour M, Appleyard M, Jensen GB, Nielsen NV. Prevalence and Causes of Visual Impairment and Blindness among 9980 Scandinavian Adults. The Copenhagen City Eye Study. Ophthalmology 2004;111(1):53-61. Bunce C, and Wormald R. Leading causes of certification for blindness and partial sight in England & Wales, BMC Public Health. 2006; 6:58. Coffey M, Reidy A, Wormald R, Xing Xian W, Wright L, Courtney P. Prevalence of glaucoma in the West of Ireland. Br. J. Ophthalmol. 1993;77:17–21. Desai P, Minassian DC, Reidy A: National cataract surgery survey 1997–98: a report of the results of the clinical outcomes. Br J Ophthalmol 1999, 83:1336-40. Dielmans I, Vingerling JR, Wolfs RCW, Hofman A, Grobbee DE, de Jong PTVM. The prevalence of of primary open angle glaucoma in a population based study in the Netherlands. Ophthalmology 1994;101:1851– 855. EASDEC Rome 2007: Visual acuity in Diabetics at first screening for eye disease - Diabetic Retinopathy Screening Service for Wales (DRSSW). EDPRG: The Eye Disease Prevalence Research Group. Prevalence of age-related macular degeneration in the United States. Arch Ophthalmol. 2004;122:564-572. Elandt-Johnson RC, Johnson NL. Ed. Survival Models and Data Analysis. John Wiley & Sons 1980.

Appendix 1: Methods – Epidemiology & Modelling
100
ESCRS: Endophthalmitis Study Group. Prophylaxis of post-operative endophthalmitis following cataract surgery: results of the ESCRS multicentre study and identification of risk factors. J Cataract Refract Surg. 2007; 33:978–988 Evans JR, Fletcher AE, Wormald RP. Age-related macular degeneration causing visual impairment in people 75 years or older in Britain: an add-on study to the Medical Research Council Trial of Assessment and Management of Older People in the Community. Ophthalmology. 2004;111:513-517. Giuffre G, Giammanco R, Dardanoni G, Ponte F. Prevalence of glaucoma and distribution of intraocular pressure in a population. The Casteldaccia Eye Study. Acta. Ophthalmol. Scand 1995;73: 222–225. Haskey J and Huxstep S. eds. (2002) Population projections by ethnicgroup: A feasibility study. ONS Studies in Medical and Population Topics, SMPS No.67. London: The Stationery Office. Hollows FC, Graham PA. Intra-ocular pressure, glaucoma, and glaucoma suspects in a defined population. Br J Ophthalmol 1966;50:570-86. Klein BEK, Klein R, Sponsel WE, Franke T, Cantor LB, Martone J, Menage MJ. Prevalence of glaucoma. The Beaver Dam Eye Study. Ophthalmology 1992;99:1499–1504. Large P, Ghosh K. A methodology for estimating the population by ethnic group for areas within England. Population Trends, no 123 - Spring 2006, pp 21 – 31. Leske MC, Ederer F, Podgor M. Estimating incidence from age-specific prevalence in glaucoma. Am. J. Epidemiol. 1981;113: 606–613. Minassian DC, Reidy A, Coffey M, Minassian A. Utility of predictive equations for estimating the prevalence and incidence of primary open-angle glaucoma in the UK. Br. J. Ophthalmol. 2000;84(10):1159–1161. Mitchell P, Smith W, Attebo K, Healey PR. Prevalence of open-angle glaucoma in Australia - The Blue Mountains Eye Study. Ophthalmology 1996;103:1661–1669. NICE: Ranibizumab and pegaptanib for the treatment of age-related macular degeneration. National Institute for Health and Clinical Excellence 2008, NICE technology appraisal guidance 155. Owen CG, Fletcher AE, Donoghue M, Rudnicka AR. How big is the burden of visual loss caused by age-related macular degeneration in the UK? Br J Ophthalmol. 2003;87:312-317.

Appendix 1: Methods – Epidemiology & Modelling
101
Quigley HA, Vitale S. Models of open-angle glaucoma prevalence and incidence in the United States. Invest Ophthalmol Vis Sci. 1997;38:83-91. RCOphth Ranibizumab: The clinician’s guide to commencing, continuing and discontinuing treatment. Scientific Department - June 2008 Reidy A, Minassian DC, Vafidis G, Joseph J, Farrow S, Wu J, Desai P, Connolly A. Prevalence of serious eye disease and visual impairment in a north London population: population based, cross sectional study. BMJ 1998;316:1643-46. Rosenfeld PJ, Brown DM, Heier JS. et al for the MARINA Study Group. Ranibizumab for Neovascular Age-Related Macular Degeneration. N Engl J Med 2006;355:1419-31. Rudnicka AR et al. Variations in Primary Open-Angle Glaucoma Prevalence by Age, Gender, and Race: A Bayesian Meta-Analysis. Investigative Ophthalmology & Visual Science, October 2006, Vol. 47, No. 10. Sommer A, Tielsch JM, Katz J, et al. Racial differences in the cause-specific prevalence of blindness in East Baltimore. N Engl J Med. 1991;325:1412-1417. Tielsch JM, Sommer A, Katz J, Royall RM, Quigley HA, Javitt J. Racial variations in the prevalence of primary open angle glaucoma. JAMA 1991; 266, 369–374. Traverso CE, Walt JG, Kelly SP. Direct costs of glaucoma and severity of the disease: a multinational long term study of resource utilisation in Europe. Br J Ophthalmol. 2005 Oct;89(10):1245-9. Tuck MW, Crick RP. The age distribution of primary open angle glaucoma. Ophthalmic Epidemiology 1998;5:173-183. Tuck MW, Crick RP The projected increase in glaucoma due to an ageing population. Ophthal. Physiol. Opt. 2003;23:175–179 Tuft SJ, Minassian D, Sullivan P. Risk factors for retinal detachment after cataract surgery: a case-control study. Ophthalmology. 2006 Apr;113(4):650-6. VanNewkirk MR, Weih L, McCarty CA, Taylor HR. Cause-specific prevalence of bilateral visual impairment in Victoria, Australia. The Visual Impairment Project. Ophthalmilogy 2001;108:960-967. Vingerling JR, Dielemans I, Hofman A, et al. The prevalence of age-related maculopathy in the Rotterdam Study. Ophthalmology. 1995;102:205-210.

Appendix 1: Methods – Epidemiology & Modelling
102
Weih LM, Nanjan M, McCarty CA, Taylor HR. Prevalence and predictors of open-angle glaucoma. Ophthalmology 2001;108:1966–1972. Wensor MD, McCarty CA, Stanislavsky YL, et al. The prevalence of glaucoma in the Melbourne Visual Impairment Project. Ophthalmology 1998;105:733–9. Wu S-Y, Nemesure B, Leske MC. Observed versus Indirect Estimates of Incidence of Open-Angle Glaucoma. Am J Epidemiol 2001;153(2):184-187

Appendix 2: Methods - Economics
103
Appendix 2
Methods – Economics

Appendix 2: Methods - Economics
104
Methods - Economics The brief for this project was that
• four eye diseases singly, should be covered
• there should be epidemiological estimates of the amount of each condition
and related sight loss
• these estimates should be for the population of the UK and the devolved
countries over a decade to the Year 2020
• and the cost of each disease to society should be estimated for the
countries and for the Decade.
The four specified diseases were: Age related macular degeneration, glaucoma,
diabetic retinopathy and sight impairing cataract. Conditions of accepted best
routine clinical practice along agreed pathways to treatment and social care were
to be followed within professional guidelines, where available.
This project was to be disease specific and forward looking for the Decade to
inform the UK Vision Strategy to the year 2020. It was commissioned alongside a
report from the Australian Access Economics which could be seen as
considering the “burden of sight loss” using costs and quality of life measured
for 2008 but without final differentiation by each eye disease.
The disease specific requirement led to the decision to use a system dynamics
approach which would identify and then incorporate the secondary sources from
demography, epidemiology, clinical staging and economics.
Type and amount of resources used and costing
Based upon the observations in the literature [ Maynard A 2003] [Williams J
2002] [RCP:HIU] and the team’s knowledge it was agreed with the advisory

Appendix 2: Methods - Economics
105
committee that government provided aggregate data at the most reliable coding
level was not suitable for single disease resource use estimation. Furthermore
these data were even less suitable for “stage of disease” costing necessary in
the case of age related macular disease, glaucoma and diabetic eye disease.
Agreement was reached that while a mixed method approach to costing would
be suitable, the main one would be “bottom up costing”. This would be
particularly relevant for the stages of disease and also for the estimation of social
care use where costs were incurred specifically related to sight loss.
In pharmaco- economics and in NHS funded Health technology research
numerous cost effectiveness studies present costs for such inputs as drugs and
diagnostic testing for glaucoma. In the main the focus has to be the measuring of
the comparative level of outcome of the use of the drug or technology rather than
linking treatment costs to severity of sight loss e.g. in DR [James M 2000]
glaucoma [Poulsen P 2005], [BurrJ 2007] and AMD [Smith D 2004] [Raftery J
2007]. More recently these researchers, and others with access to clinical
settings [Peeters A 2008] have co-ordinated multi country resource data
collection for a specific eye disease. Published resource use studies that
specifically provide “stage based costing” for vision related use of health and
social care amount to five articles including those for the UK alone, and for the
UK in Europe [Traverso C 2005] [Soubrane G ] [Bonastre J 2002], [Lotery A
2007], [Lafuma A 2006]. Given this scarcity and the very limited application of
these costs in UK research at eye disease level, validation of our inputs is not
possible at present.
The nature of the differentiation by stage of disease makes it inappropriate to try
to validate these costs from aggregate data split for broad ophthalmic categories.
These latter sources are broad category returns of inpatient and day case
procedures and as yet, very unreliable for identification of outpatient diagnostic
type by specific clinical attendance [ HES 2007. 2008]. The Access Economics

Appendix 2: Methods - Economics
106
Cost of Visual Impairment Study for the UK has a prime focus on sight loss in
total within the countries of the UK, with disease process quantification and
costing as secondary. That allows more reliability in the use of aggregate data
with less disadvantages from its limitations for differentiation. Because of the
scope of the commissioning briefs and the necessary choice of methods, our two
reports cannot validate each other in terms of costs or utilization data inputs to
the models. They are however co-operative in aspects of methods in broader
epidemiology and economics, e.g. the calculations on “dead weight” loss and the
common use of vision related unemployment statistics adapted from the
calculations of Access Economics.
Our method for the overall project was that of constructing system dynamics
models covering the coming decade for each of the four visually impairing
diseases. To ensure basic comparability of economic method with other general
UK cost of illness studies, consulting the work of the PSSRU and the Oxford
University group was of particular relevance [Bower P 2003] [Allen C] [Costa-i-
Font J 2008]. “Paying the Price” [McCrone P 2008 ] which has an overall
framework of Mental Health and is focused on individual disease, deals with
adjustment of price and cost within a changing demographic time frame. Access
Economics publication site, which has Cost of Visual Impairment reports for
several countries, was consulted for examples of Vision specific Cost of illness
studies [www. Accesseconomics 2008]. The four existing “cost of blindness”
studies in the UK were consulted to ensure comprehensive coverage of items. [
Meads C] [Meads C 2003] [Winyard S. 2005] [GDBA2003]. Their methods while
valid, have alternative basis of calculation for disease prevalence to the one used
in the modelling of eye disease for this report.
The perspective on the cost of the disease within the Future Sight Loss Model is
that of a societal one. The approach is mainly that which is known as “bottom up”
with some aspects of costing from the aggregate level of Hospital Episode data,
and some substantial use of tariff or unit costs for health and for social care. The

Appendix 2: Methods - Economics
107
pathways to treatment are followed within guidelines where available, while at the
same time note is taken of new developments in the location of clinical care in
community settings as proposed and piloted through the National Eye Care
Services Steering Group (ECSSG) [Ricketts, B.2004 ] [DOAS Glaucoma]
[Scotland 2005] [ECSSG internet].
Key points on Costing The cost schedules in the next section of this appendix are included to
indicate the thinking in the use of costed items and the proportions of use.
Following the pathways:
Primary care
At primary care level for optometry, a time allocation schedule was developed
based, upon a clinician’s assessment of the contribution of the diagnostic tasks
within the sight test for the detection of each disease, as outlined in Appendix 2.
This was one way in which the sight test charge could be allocated “pro rata “ as
a cost attributable to opportunistic screening for previously undetected
conditions.
At general practice level the time component allocated for referral onwards from
primary care to ophthalmology was based mainly on some individual community
or hospital practice reports [Mac Kenzie G 2009 ].
Referral onwards which does not result in treatment was costed based upon
levels of premature or unsuitable referrals reported in the literature [Azuara B
2007 ] [Bowling B 2005] [Salmon N 2007] [Ang G 2007][ Banes M 2006].
Appendix 2: Methods - Economics
108
Outpatient care
All patients who in the model appeared as diagnosed in one year, were costed as
outpatients either as first or follow-up. In the case of cataract, all patients were
given an outpatient appointment. Those operated on had their related
appointment included in the tariff FCE (Finished Consultant Episode).
The NHS “targets for old and new” formed the basis of the yearly percentage of
ongoing patients followed up where they were not in an identifiable costed stage
of treatment category e.g. partially sighted or blind from geographic atrophy AMD
[Leeds 2008].
Treatment
Glaucoma: For glaucoma, European study costs are used, since the samples in
the studies have some recruits from the United Kingdom [Traverso 2005 ]. These
samples of recruits are small overall and even more limited when single country
sections are used. They are, however, based upon strict protocols, disease
definition, and item coverage for cost collection on each patient. More work of
this type is expected and this will allow cost inputs here to be firmed up over
time. While there are clinical variations in treatment across Europe, there are
also considerable similarities in the clinical pathways for glaucoma treatment. In
the main, the variation in reported costs can reflect the differences not only in
pricing of drugs and labour costs across Europe but also the filtering through of
the changes that have come about in drug and surgical therapy within countries.
Attempts to validate the bottom up costs taken from these studies by
disaggregating the HES Statistics for treatments were not fruitful. Owen et al
[2006] point to some of the difficulties of costing surgical procedures in a time of
substitution of drugs for surgical interventions. Reporting of the UK country
specific innovations that increase the substitution of community based staff for
hospital based ophthalmologists are particularly useful in bottom up costing by

Appendix 2: Methods - Economics
109
disease. Validation of these against wider data, however, was not possible
beyond comparative broad categories. While these schemes produce useful
individual patient based costs [Sheen N 2009], it is not possible as yet to
disaggregate them for “ophthalmology by specialty” for their budget share of the
top down "community services" category.
Diabetic Retinopathy: As the formal screening programme for diabetic
retinopathy is more established the initial variations in service and costs are
being addressed. Apart from the costing of primary care and General Practice
allocations, the resource inputs for ongoing detection and treatment of diabetic
eye disease follow the Garvican costing guidelines and resource use calculations
[ Garvican L 2004] (updated for inflation) and supplemented by Scanlon [2005].
Age- related Macular Disease: The basis of the treatment costing method was
decided upon for the quantity of drugs and the numbers of treatment from the
final NICE guidelines and Lotery et al.[NICE 155. 2008 ],[Lotery A 2007]. Before
the final NICE guidance was issued the model used initial costs from the
commissioning documents of the Scottish PCTs that had estimated likely uptake
and costs per commissioned treatment [Highlands Health Authority 2008]. More
recently PCT contracts with eye hospitals were searched for the best "all in" FCE
price. Moorfields Eye Hospital with Haringey PCT was chosen as the most
inclusive for a course of treatment [Haringey PCT 2008]. Unit costs for diagnostic
procedures were applied separately and obtained from the NICE report
(adjusted) [NICE 155 2008].
For the Blind and Partially Sighted: Those whose condition required ongoing
monitoring to prevent further deterioration, are included in the related disease
costing. Those who are newly registered blind are allocated an entitlement to an
ophthalmologist consultation for registration, the option of a social work interview
for referral to social services and a low vision assessment clinic appointment.
Literature points to the use of hospital eye services by those irremediably blind
Appendix 2: Methods - Economics
110
for eye care as well as for low vision [ Responses to NICE 2006-8]. For newly
blind persons, some reports [Burr J 2007] and [Smith D 2004] consider the
costing of registration and hospital consultation around that process and
suggested a combined cost which was updated for use here.
Vision related excess costs in health and social care
At this point the issue arises of excess of routine service use where this use is
attributable to an eye disease and/or sight loss in general. Costing here requires
extrapolation from "bottom up" patient based costing mainly from Age-related
Macular Degeneration [Ke K 2007] [Douglas G 2006]. As indicated in the cost
schedules, the key service areas are non ophthalmic medical care, social care,
paid and informal, and residential care.
Cost of illness studies consider broad categories of sight loss, attributing excess
rate of falls and depression as well as mortality to groups with poor visual acuity
[GDBA Grainger; 2003] [www.accesseconomics.com]. An issue here is the
degree to which the epidemiological literature holds up for excess mortality
related directly to an eye disease and blindness. Similarly for excess non
ophthalmic hospital treatment related to an eye morbidity. Though the study was
for a very limited time period, Sach et al found no less and even greater usage of
non vision related eye services amongst those who had undergone cataract
surgery than amongst those with the same level of vision, not operated on within
that year [Sach T 2007]. Excess non-medical costs used here for the visually
impaired and blind are per patient and come from Lotery et al from their study of
Neovascular AMD [Lotery A 2007].
Vision-related residential care use and cost is also taken from an European study
which included the UK [Lafuma 2006]. Evans recently suggests that the evidence
is not strong for excess residential care due to visual impairment [Evans J 2008].

Appendix 2: Methods - Economics
111
Excess Mortality: The epidemiologists on the team and the ophthalmic
epidemiologist on the advisory committee were not convinced of the amount of
mortality, if any, that could be attributable to visual impairment. A value for lost
resources due to possible excess mortality therefore was not included in the
model.
Excess Paid Care and Excess Informal Care: The “bottom up” costing
studies which consider this [Ke K 2007] [Lafuma A 2006] compare visually
impaired with non visually impaired, though in the case of Ke's report the
comparison group is those with AMD who have good vision. A combination of
sources and insights from the summary of Bosanquet and Mehta [2008] are used
in the model. Ke in particular is used, supplemented by work of researchers with
direct access to blind persons from a broader population sample [Douglas G
2006] [Pey T 2005]. The rate per hour applied for the costs of paid care is from
the Unit costs of Health and Social Care [Curtis L 2008]. The informal care
sources estimate hours of inputs of care in general and do not specify the type or
level of care. Should outputs of the care have been specified, these could have
been costed at market value per type and unit of output. An opportunity cost
approach is taken to allocating a value to these hours (earnings foregone)
[Carers UK 2007].
Productivity loss: The value of resources lost due to unemployment related to
sight loss are considered and costed, as are days absent from work due to vision
problems. Work here follows the standard method of costing by weekly wage
rates, gender, and age. The sources for levels of unemployment amongst the
visually impaired are from an RNIB commissioned report [Meager N 2008].
Results were derived using similar sources and methods as those used by
Access Economics who gave us sight of their calculations for RNIB in 2008 [LFS
ONS 2008] [ ASHE]. A preliminary consideration of the use of the effect of using
the "friction period" approach [Koopmanschap MA 2007] rather than the human

Appendix 2: Methods - Economics
112
capital approach is modelled. The overall cost of illness tables present lost
productivity costed from the orthodox economics human capital perspective. This
allows comparison, however limited, with other cost of illness studies in sight loss
and other areas of disability. The friction method was calculated for a friction
period of 13 weeks, and the difference in the value of lost resources for the two
methods is indicated for diabetic retinopathy at the end of DR cost schedule in
this methods section.
Taxation: Exemptions for blind persons are costed as indicated and referenced
on the cost schedule charts. Eligibility is based upon the expected low levels of
earnings and pensions of blind persons and especially older women. The amount
declared by the Government is approx £10 million in total, undifferentiated by
cause of blindness.
Capital costs: This component is applied to all direct health and social care
costs. Those areas where Health Resource Groupings are used may have
initially included a capital cost element. Changes in the location and form of
delivery of services, e.g. for diabetic eye disease and glaucoma follow-up in the
community, may require technology substitution. The choice of 2%, though
informed by UK literature (PSSRU), is mainly arbitrary.
Deadweight loss: This is based upon an innovative approach to government
borrowing and taxation primarily reported in cost of illness by Access Economics,
and is included here to provide a comprehensive coverage of the call on
resources used for health and social care [www.accesseconomics 2008Access].

Appendix 2: Methods - Economics
113
Discounting and Inflation
The Base level prices at 2008/9 are used for the Decade model and discounted
at 3.5.% per annum which is considered normal practice in UK cost of illness
projection to future years.
Where costs were transferred from pounds sterling to Euros by authors, we
returned them to their initial pound value by the method originally used in the
transfer .i.e. purchasing power parity was used or country currency rate of
exchange. [Wordsworth S.2005] [www.oecd.org/document]
All prices from previous years were updated to 2008/9 using the GDP deflator.
The NHS GDP and Social Care Deflators recommended by the PSSRU are not
used. One reason for this was that the stage based costing sources did not
differentiate between labour and drugs and technology inputs for the NHS.
Within the UK with the exception of the General Ophthalmic Services, no single
country cost changes were made.

Appendix 2: Methods - Economics
114
REFERENCES Allen, C. & Beecham, J. (1993) Costing services: ideals and reality, in A. Netten and J. Beecham (eds) Costing Community Care: Theory and Practice, Ashgate, Aldershot Ang GS, Ng WS, Azuara BA. The influence of the new general ophthalmic services (GOS) contract in optometrist referrals for glaucoma in Scotland. Eye 2009;23(2):351-5. ASHE: Annual survey of hours and earnings, National Statistics, 2008. Azuara BA, Burr JM, Thomas R, Maclennan G, McPherson S. The accuracy of accredited glaucoma optometrists in the diagnosis and treatment recommendation for glaucoma. Br J Ophthalmol. 2007 May 30. Banes MJ, Culham LE, Bunce C, Xing W, Viswanathan A, Garway- Heath DF. Agreement between optometrists and ophthalmologists on clinical management decisions for patients with glaucoma. Br J Ophthalmol 2006; 90: 579-85.
Bonastre J, Le Pen C, Anderson P, et al. The epidemiology, economics and quality of life burden of age-related macular degeneration in France, Germany, Italy and the United Kingdom. Eur J Health Econ 2002; 3:94-102. Bosanquet N, Mehta P. Evidence base to support the UK Vision Strategy, RNIB 2008
Bower P, Byford S, Barber J, Beecham J, Simpson S, Friedli K, Corney R, King Harvey I (2003) Meta-analysis of data on costs from trials of counselling in primary care: using individual patient data to overcome sample size limitations in economic analyses, British Medical Journal, 326, 1247-1250 Bowling B, Chen SD, Salmon JF. Outcomes of referrals by community optometrists to a hospital glaucoma service. Br J Ophthalmol. 2005 Sep; 89(9):1102-4. .BurrJ.M., Mowatt, G., Hernández, R., Siddiqui, M.A.,Cook, J., Lourenco, T., Ramsay, C., Vale, L., Fraser, C.,Azuara-Blanco, A., Deeks, J., Cairns, J., Wormald, R.,McPherson, S., Rabindranath, K., Grant, A., (2007), The clinical effectiveness and cost-effectiveness of screening for open angle glaucoma: a systematic review and economic evaluation, Health Technology Assessment, October 2007; 11(41):iii-iv, ix-x, 1-190.

Appendix 2: Methods - Economics
115
Carers UK Valuing carers - calculating the value of unpaid care, 2007 http://www.carersuk.org/ Costa-i-Font J, Wittenberg R, Patxot C, Comas-Herrera A, Gori C, di Maio A, Pickard L, Pozzi A, Rothgang H (2008) Projecting long-term care expenditure in four European Union member states: the influence of demographic scenarios, Social Indicators Research, 86, 2, 303-321 Curran C, Knapp M, Beecham J (2004) Mental health and employment: some economic evidence, Journal of Mental Health Promotion, 3, 1, 13-24 Curtis L. Unit Costs of Health and Social Care 2008. Personal Social Services Research Unit. University of Kent, 2008. http://www.pssru.ac.uk/pdf/uc/uc2008/uc2008.pdf DOAS glaucoma clinical pathway and dataset. Do Once & Share Programme(DOAS). URL: http://www.doasglaucoma.org.. Douglas, G., Corcoran, C., and Pavey, S., (2006) Network 1000. Opinions and circumstances of visually impaired people in Great Britain: report based on over 1000 interviews, Visual Impairment Centre for Teaching and Research (VICTAR), School of Education, University of Birmingham Evans JR, Smeeth L, Fletcher AE. Risk of Admission to a Nursing Home Among Older People With Visual Impairment in Great Britain. Arch Ophthalmol. 2008;126(10):1428-1433.
[ongoing] Eye Care Services Steering Group internet site Garvican L. Resources required for a local service in the National Diabetic Retinopathy Screening Programme 2004 [GDBA Grainger]: The Cost of Blindness. An analysis of the costs of visual impairment and blindness in the United Kingdom, Prepared for The Guide Dogs for the Blind Association,Ethical Strategies (2003), Haringey PCT report of meeting of the Trust Board; Paper on AMD commissioning with Moorfields Eye Hospital. September 2008 HES online 2007. 2008. Highlands Health Authority 2008 James M, Turner DA, Broadbent DM, Vora J, Harding S. Cost effectiveness analysis of screening for sight threatening diabetic eye disease. BMJ 2000; 320: 1627–1631

Appendix 2: Methods - Economics
116
Ke, K.M., Montgomery, A.M., Stevenson, M., O’Neill, C., Chakravarthy, U., (2007) Formal and informal care utilization amongst elderly persons with visual impairment, British Journal of Ophthalmology 91:1279-1281. Koopmanschap M A, Hakkaart, L&Tan, Siok S ,More or Less Compensation While Absent from Work?. iHEA 2007 6th World Congress: Explorations in Health Economics Paper. Available at SSRN: http://ssrn.com/abstract=993349
Labour Force Survey [LFS ONS] ONS (Office of National Statistics), 2008 Lotery, A., Xu, X., Zlatava, G., Loftus, J., (2007) Burden of illness, visual impairment and health resource utilization of patients with neovascular age-related macular degeneration: results from the UK cohort of a five-country cross-sectional study, British Journal of Ophthalmology 91:1303-1307 Lafuma A, Brezin A, Lopatriello S, Hieke K, Hutchinson J, Mimaud V, and Berdeaux G (2006), ‘Evaluation of non-medical costs associated with visual impairment in four European countries – France, Italy, Germany, and the UK’, Pharmacoeconomics,Vol. 24, No. 2, 2006, pp. 193-205 Leeds University teaching Hospital Trust Document 2008. National Institute for Health and Clinical Excellence: Pegaptanib and ranibizumab for the treatment of age-related macular degeneration Guidance type: Technology appraisal 155 Date issued: August 2008 Mac Kenzie G D. Out of date costs in health economics analysis; bmj.com, 2 Mar 2009 Maynard A, Bloor K. Trust and performance management in the medical marketplace. J R Soc Med 2003; 96(11): 532-539 Meads C and Hyde C What is the cost of blindness? Br. J. Ophthalmol., Oct 2003; 87: 1201 - 1204 Meager N Carta E Labour market experiences of people with seeing difficulties Secondary analysis of LFS data. Institute for Employment Studies September 2008 Prepared for RNIB:
Owen CG, Carey IM, De Wilde S, Whincup PH, Wormald R, Cook DG (2006), “The epidemiology of medical treatment for glaucoma and ocular hypertension in the United Kingdom: 1994 to 2003”, British Journal of Ophthalmology, 90: 861-868 2006

Appendix 2: Methods - Economics
117
[Responses] Responses to the Appraisal Consultation Document Pegaptanib and ranibizumab for treatment of age-related macular degeneration. RNIB and Macular Disease Society 2007 Peeters A, Schouten JS, Webers CA, Prins MH, Hendrikse F, Severens JL. Cost-effectiveness of early detection and treatment of ocular hypertension and primary open-angle glaucoma by the ophthalmologist. Eye. 2008;22:354-362 Pey T, Nzegwu F, Dooley G. Functionality and the Needs of Blind and Partially Sighted Adults in the UK. Guide Dogs for the Blind Association Rehabilitation Group 2007 Poulsen P.B., Buchholz P., Walt J.G., Christensen T.L., Thygesen J. Cost analysis of glaucoma-related-blindness in Europe 2005) International Congress Series, 1282, pp. 262-266 Raftery J, Clegg A, Jones J, Tan SC, Lotery A: Ranibizumab (Lucentis) versus bevacizumab (Avastin): modelling cost effectiveness. Br J Ophthalmol 2007, 91:1244-1246
Ricketts, B. First report of the National Eye Care ervices Steering Group, 2004
[Royal College of Physicians’ HIU] Engaging clinicians in improving data quality in the NHS September 2006. Key findings and recommendations from research RNIB. The Costs of Blindness. Campaign report number 12, 2003. Sach, T. H, Foss, A. J E, Gregson, R. M, Zaman, A., Osborn, F., Masud, T., Harwood, R. H (2007). Falls and health status in elderly women following first eye cataract surgery: an economic evaluation conducted alongside a randomised controlled trial. Br. J. Ophthalmol. 91: 1675-1679 Salmon NJ, Terry HP, Farmery AD, Salmon JF. An analysis of patients discharged from a hospital-based glaucoma case-finding clinic over a 3-year period. Ophthalmic Physiol Opt. 2007 Jul;27(4):399-403. Scotland 2005 Review of eye care services in Scotland. Scottish Executive; 2005. URL: http://www.scotland.gov.uk/ Scanlon PH, Carter S, Foy C, Ratiram D, Harney B. An evaluation of the change in activity and workload arising from diabetic ophthalmology referrals following the introduction of a community based digital retinal photographic screening programme. Br J Ophthalmol 2005;89:971–975. doi: 10.1136/bjo.2004.060723

Appendix 2: Methods - Economics
118
Sharma, T., Wormald, R., Franks, W. (2008). Provision of eye care: commissioning change. JRSM 101: 4-5 Sheen NJL, Fone D, Phillips CJ, Sparrow JM, Pointer JS, and Wild JM Novel optometrist-led all Wales primary eye-care services: evaluation of a prospective case series Br. J. Ophthalmol., Apr 2009; 93: 435 - 438 Smith DH, Fenn P, Drummond M. Cost effectiveness of photodynamic therapy with verteporfin for age related macular degeneration: the UK case. Br J Ophthalmol 2004; 88 (9): 1107–12. Soubrane G, Cruess A, Lotery A, Pauleikoff D, Monès J, Xu X, Zlateva G, Buggage R, Conlon J, Goss T. Burden of illness, visual impairment, and health resource utilization of neovascular age-related macular degeneration patients: results from a five-country cross-sectional study. Pharmacoeconomics 2008: 26 (1)57-73. Tariff information: confirmation of Payment by Results (PbR) arrangements for 2008/09 DH Gateway ref 9181 Traverso C E, Walt J G, Kelly S P et al (2005), ‘Direct costs of glaucoma and severity of the disease: a multinational long term study of resource utilisation in Europe’, British Journal of Ophthalmology, Vol. 89, pp. 1245-1249
Williams JG, Mann RY. Hospital episode statistics: time for clinicians to get involved? Clin Med 2002;2: 34-7 Winyard S. The Costs of Sight Loss in the UK. RNIB 2005. Wordsworth, S, Ludbrook, A, Caskey, F, and Macleod, A (2005). Collecting unit cost data in multicentre studies. Creating comparable methods. Eur J Health Econ 6(1):38-44.
http://www.accesseconomics.com.au/services/health.php [http://www.nice.org.uk/guidance/index.jsp?action=download&o=40254] Final appraisal determination. Ranibizumab and pegaptanib for age-related macular degeneration 2008 http://www.oecd.org/document GDP PPPs and Derived Indices for all OECD countries 2008.

Appendix 2: Methods - Economics
119
Cost Schedule: Adjusted cost inputs to Decade Model 2010-2020 Age- related Macular Disease ( with References) All Unit Costs are Current Prices (available at 2008 for 2008/9)
General Ophthalmic Services Costs (1,2) Payment to Optometrist per Eye-Test - England & Wales and N.Ireland £20.70Payment to Optometrist per Eye-Test - Scotland £38.00Pears & Weci Cost (WALES ONLY) - additional to above for Wales (3) General Practice Consultation Costs Cost per consultation (4)(20) £21.93Proportion of all new AMD having GP consultation in the Year 0.333Treatment Costs (Current Prices) (8, 25,26, 27,28) All in Cost per Injection (PCTwith Moorfields)–includes Admin & 1 Angio £1,275.00Cost of ONE Ranibizumab Injection £761.20Possible negotiated procurement discounts (Overall mean Rate of drug price Discount) 15.00%
PDT & Laser: Largely being phased out Cost of Administering IV Injections - Day Case £395.00Cost of Administering IV Injections - Out-Patient £90.20Proportion having IV Injection as Day-Case 1.00Monitoring of Cases under Treatment Included in ALL-in cost of treatment above (24) Other Hospital Activities Fundus Fleuorescene Angiography (FFA) Unit Cost £520.74Proportion Having Angiography in the Year (1st assess): apply to new Sight loss Neovascular 1.0000
Proportion Having Angiography in the Year: GA 0.0000Proportion Having Angiography in the Year: apply to old SLNV 0.2000Early ARM: Proportion having First Assessment 0.3000First Appointment Unit Cost (Medical Ophthalmology) (5) £119.00Follow-up Appointment Unit Cost (Medical Ophthal) £68.00Follow-Up Appointment (General Ophthalmology) £48.00Trip to Hospital Trip Cost per Visit £10.00Trip Cost per Visit - NV having treatment £30.00Number of Visits by New Cases, in Year (additional to those under Ranibizumab treatment) 2.00
Number of Visits by Old Cases, in Year 1.00 Of the AMD attending Hospital, Proportion that are New Cases (6) 0.697

Appendix 2: Methods - Economics
120
Cost Schedule Continued: Age- related Macular Disease
LV Health Service Consultation Cost per head for New (applies to all Blind & 1/2 partially sighted) (includes Registration for BL/PS + LV Consultation)(7) £190
Cost per head for Old £30Direct Non-ophthalmic related medical cost – (includes falls and depression) (8,23)
Mean health resource utilisation Cost per head (excess attributed to Sight Loss) £19.75
Low-Vision Devices & Rehabilitation (9) Cost per head of VI & BL Cases £304.22Excess Paid Care (4,10,11, 21,22) Proportion among partially sighted 0.167Proportion among Blind 0.217Extra Hours per day for partially sighted 0.3Extra Hours per day for Blind 1.47Cost per hour for partially sighted £19.84Cost per hour for Blind £19.84Excess Informal Care (4, 10,11,12, 21,22) Proportion among partially sighted 0.326Proportion among Blind 0.516Extra Hours per day for partially sighted 2Extra Hours per day for Blind 3.2Cost per hour for partially sighted £10.08Cost per hour for Blind £10.08Excess Res Care: (13,21,22,33) Cost per head for partially sighted & Blind persons £246.06 Capital Costs A % of Direct Health care and social care costs (- informal care) 2.00%
Deadweight Loss (14,15) A % of Direct Health care and social care costs (- informal care) £0.12
TV Licence Exemption (Blind up to Age 74 inclusive) (16) Allowance per year: apply to age <75 (16) £69.75Tax Exemption (Blind persons) (17, 18. 19) Total tentative amount £10,000,000 Blind person potential amount (A) £360.00Age < 65 MEN: proportion getting (A) 0.3400Age < 65 WOMEN: proportion getting (A) 0.1500Age 65+ MEN: proportion getting (A) 0.1800Age 65+ WOMEN: proportion getting (A) 0.0750

Appendix 2: Methods - Economics
121
Cost Schedule: Adjusted cost inputs to Decade Model 2010-2020 Cataract (with References) All Unit Costs are Current Prices (available at 2008 for 2008/9)
General Ophthalmic Services Costs (1,2) Payment to Optometrist per Eye-Test - England, Wales and N. Ireland £20.70Payment to Optometrist per Eye-Test - Scotland £38.00Pears & Weci Cost (WALES ONLY) - additional to above for Wales (3) General Practice Consultation Costs Cost per consultation (4)(20) £21.93Proportion of all new cataract patients having GP consultation in Year 0.333Treatment Costs (Current Prices) (26, 27,29,30,31) Planned Elective Day Case £750.00Spectacle Unit cost £170.00Capsulotomy Unit cost £570.21Endophthalmitis £3,320.98First Appointment Unit Cost (Medical Ophthalmology) (5) £119.00Follow-up Appointment Unit Cost (Medical Ophthalmology) £68.00First Appointment (General Ophthalmology) £109.00Follow-Up Appointment (General Ophthalmology) £48.00Trip to Hospital Trip Cost per Visit £10.00Trip Cost per Visit - NV having treatment £30.00Number of Visits by New Cases, in Year 2.00Number of Visits by Old Cases, in Year 1.00LV Health Service Consultation (7) Cost per head for New (applies to all Blind & 1/2 partially sighted) (includes Registration for BL/PS + LV Consultation) £190
Cost per head for Old £30Direct Non-ophthalmic related medical cost - (8,23) Mean health resource utilisation Cost per head (excess attributed to Sight Loss) £19.75
Low-Vision Devices & Rehabilitation (9) Cost per head of partially sighted & Blind Cases £304.22Excess Paid Care (4,10,11, 21,22 ) (31,32) Proportion among Blind 0.217Extra Hours per day for partially sighted 0.3Extra Hours per day for Blind 1.47Cost per hour for partially sighted £19.84Cost per hour for Blind £19.84Excess Informal Care (4, 10, 11, 12, 21, 22) Proportion among Blind 0.516Extra Hours per day for partially sighted 2Extra Hours per day for Blind 3.2Cost per hour for partially sighted £10.08Cost per hour for Blind £10.08

Appendix 2: Methods - Economics
122
Cost Schedule Continued: Cataract
Excess Residential Care: (13,21,22,32, 33) Cost per head for partially sighted & Blind persons £246.06Capital Costs A % of Direct Health care cost 2.00%Deadweight Loss (14,15) Marginal cost of raising additional funds (multiply by total Direct Health care and social care costs, excluding informal care costs) £0.12
TV Licence Exemption (Blind up to Age 74 inclusive) (16) Allowance per year: apply to age <75 £69.75Tax Exemption (Blind persons) (17, 18. 19) Total tentative amount £10,000,000 Blind person potential amount (A) £360.00Age < 65 MEN: proportion getting (A) 0.3400Age < 65 WOMEN: proportion getting (A) 0.1500Age 65+ MEN: proportion getting (A) 0.1800Age 65+ WOMEN: proportion getting (A) 0.0750
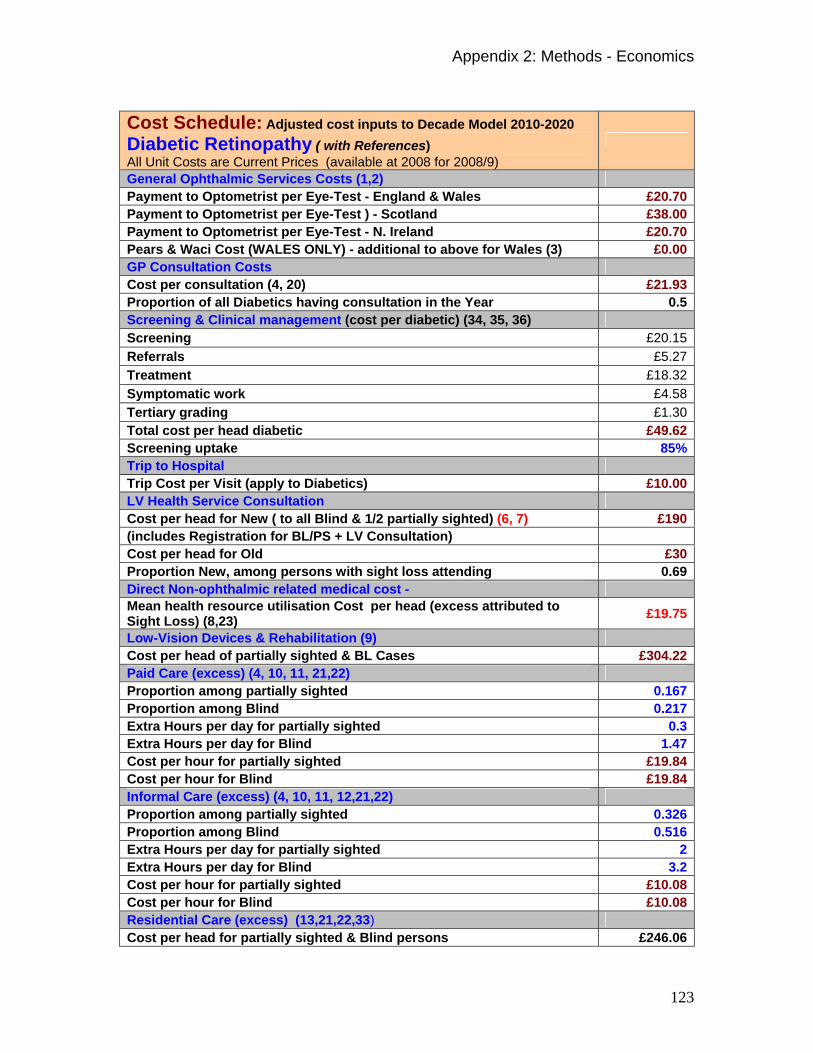
Appendix 2: Methods - Economics
123
Cost Schedule: Adjusted cost inputs to Decade Model 2010-2020 Diabetic Retinopathy ( with References) All Unit Costs are Current Prices (available at 2008 for 2008/9) General Ophthalmic Services Costs (1,2) Payment to Optometrist per Eye-Test - England & Wales £20.70Payment to Optometrist per Eye-Test ) - Scotland £38.00Payment to Optometrist per Eye-Test - N. Ireland £20.70Pears & Waci Cost (WALES ONLY) - additional to above for Wales (3) £0.00GP Consultation Costs Cost per consultation (4, 20) £21.93Proportion of all Diabetics having consultation in the Year 0.5Screening & Clinical management (cost per diabetic) (34, 35, 36) Screening £20.15Referrals £5.27Treatment £18.32Symptomatic work £4.58Tertiary grading £1.30Total cost per head diabetic £49.62Screening uptake 85%Trip to Hospital Trip Cost per Visit (apply to Diabetics) £10.00LV Health Service Consultation Cost per head for New ( to all Blind & 1/2 partially sighted) (6, 7) £190(includes Registration for BL/PS + LV Consultation) Cost per head for Old £30Proportion New, among persons with sight loss attending 0.69Direct Non-ophthalmic related medical cost - Mean health resource utilisation Cost per head (excess attributed to Sight Loss) (8,23) £19.75
Low-Vision Devices & Rehabilitation (9) Cost per head of partially sighted & BL Cases £304.22Paid Care (excess) (4, 10, 11, 21,22) Proportion among partially sighted 0.167Proportion among Blind 0.217Extra Hours per day for partially sighted 0.3Extra Hours per day for Blind 1.47Cost per hour for partially sighted £19.84Cost per hour for Blind £19.84Informal Care (excess) (4, 10, 11, 12,21,22) Proportion among partially sighted 0.326Proportion among Blind 0.516Extra Hours per day for partially sighted 2Extra Hours per day for Blind 3.2Cost per hour for partially sighted £10.08Cost per hour for Blind £10.08Residential Care (excess) (13,21,22,33) Cost per head for partially sighted & Blind persons £246.06

Appendix 2: Methods - Economics
124
Cost Schedule Continued: Diabetic Retinopathy Capital Costs A % of Direct Health care cost 0.020000Deadweight Loss(14, 15) Marginal cost of raising additional funds (multiply by total Direct Health care and social care costs, excluding informal care costs) £0.12TV Licence Exemption (Blind up to Age 74 inclusive)(16) Allowance per year: apply to age <75 £69.75Tax Exemption (Blind persons) (17,18,19) Total tentative amount £10,000,000 Blind person potential amount (A) £360.00Age < 65 MEN: proportion getting (A) 0.3400Age < 65 WOMEN: proportion getting (A) 0.1500Age 65+ MEN: proportion getting (A) 0.1800Age 65+ WOMEN: proportion getting (A) 0.0750
Cost of productivity loss in the UK in 2010. Comparing the ‘Human Capital’ and ‘Friction’ methods.
Diabetic Retinopathy Human Capital Friction Difference
Underemployment (excess) * 107,256,358 26,814,089 107,256,358
Absence from work (excess) 8,904,354 7,123,483 8,904,354
Total 116,160,712 33,937,573 116,160,712
* excess due to sight loss

Appendix 2: Methods - Economics
125
Cost Schedule: Adjusted cost inputs to Decade Model 2010-2020 Glaucoma ( with References) All Unit Costs are Current Prices (available at 2008 for 2008/9) GOS Costs (1,2) Payment to Optometrist per Eye-Test (upgraded 2009 ) – England & Wales and N. Ireland
£20.70
Payment to Optometrist per Eye-Test (assumed primary eye exam &age adjustment – Scotland £38.00
Pears & Weci Cost (WALES ONLY) - additional to above for Wales (3) GP Consultation Costs Cost per consultation % of GP contact rate per hour. (Apply to all new GL cases) or (1/3 of all GL cases) (4) (20)
£21.93
Treatment & Clinical management: Direct Cost of treatment, for UK, Per person year: 2008 (37,38, 39). Recalculated using GDP Deflator
OH £313Early £362
Mid £455Late £720
Untimely Referrals Proportion of Tested Referred to Hospital 0.04Of the Referred, Proportion referred for Glaucoma 0.18Proportion of Glaucoma Referrals sent home (False +Vs) 0.33First Appointment Unit Cost (Medical Ophthalmology) (5) £119.00Follow-Up Appointment Unit Cost (Medical Ophtha)) £68.00Number of Follow-up Appointments per Case 1.3Transport to Visit Hospital Cost per Trip for Mid & Late (accompanied by 1 person) £10.00Cost per Trip for Early £5.00LV Health Service Consultation Proportion New among partially sighted & Blind (6) 0.69Cost per head for New (7) £190Cost per head for Old £30Direct Non-vision related medical cost – (includes falls and depression) (8) ( 23) Mean health resource utilisation Cost per head (excess attributed to Sight Loss) £19.75
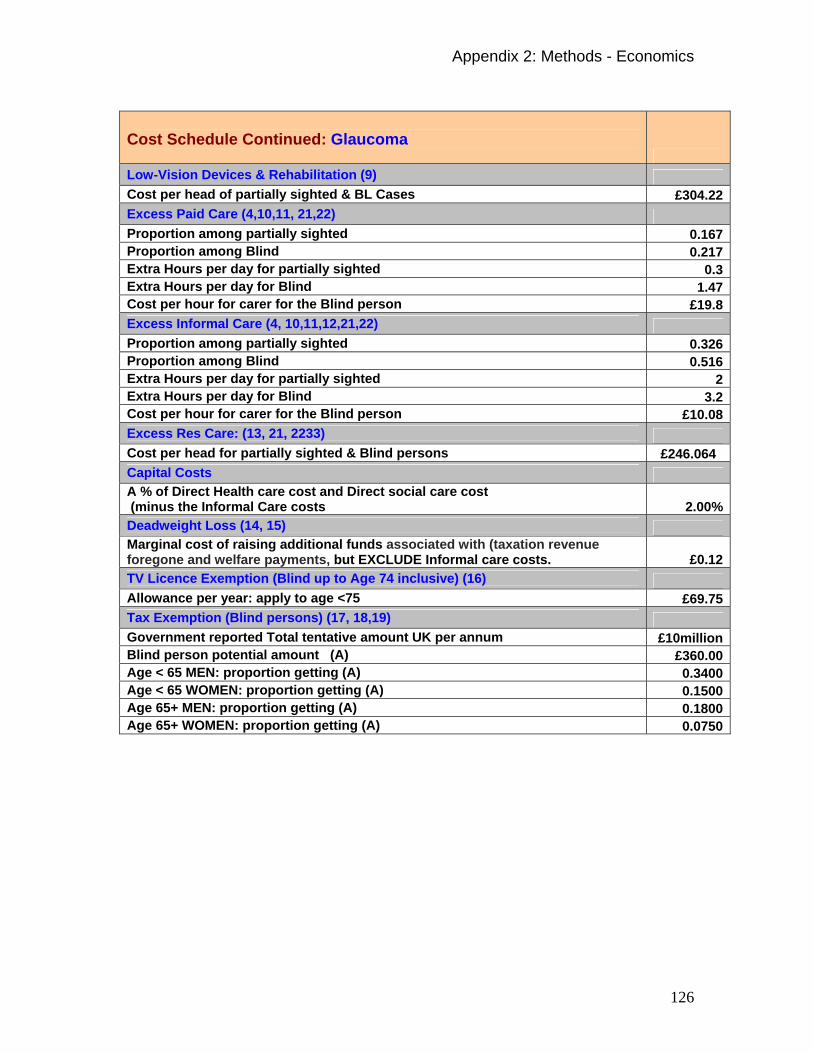
Appendix 2: Methods - Economics
126
Cost Schedule Continued: Glaucoma Low-Vision Devices & Rehabilitation (9) Cost per head of partially sighted & BL Cases £304.22Excess Paid Care (4,10,11, 21,22) Proportion among partially sighted 0.167Proportion among Blind 0.217Extra Hours per day for partially sighted 0.3Extra Hours per day for Blind 1.47Cost per hour for carer for the Blind person £19.8Excess Informal Care (4, 10,11,12,21,22) Proportion among partially sighted 0.326Proportion among Blind 0.516Extra Hours per day for partially sighted 2Extra Hours per day for Blind 3.2Cost per hour for carer for the Blind person £10.08Excess Res Care: (13, 21, 2233) Cost per head for partially sighted & Blind persons £246.064 Capital Costs A % of Direct Health care cost and Direct social care cost (minus the Informal Care costs 2.00%Deadweight Loss (14, 15) Marginal cost of raising additional funds associated with (taxation revenue foregone and welfare payments, but EXCLUDE Informal care costs. £0.12TV Licence Exemption (Blind up to Age 74 inclusive) (16) Allowance per year: apply to age <75 £69.75Tax Exemption (Blind persons) (17, 18,19) Government reported Total tentative amount UK per annum £10million Blind person potential amount (A) £360.00Age < 65 MEN: proportion getting (A) 0.3400Age < 65 WOMEN: proportion getting (A) 0.1500Age 65+ MEN: proportion getting (A) 0.1800Age 65+ WOMEN: proportion getting (A) 0.0750

Appendix 2: Methods - Economics
127
Sources and Notes. All Unit Costs are Current Prices (available at 2008 for 2008/9) (1) Used for rates and costs: Association of Optometrists website Notice with reference General Ophthalmic Services: Increases to NHS Sight Test Fee for the period 1 April 2008 and 31 July 2008 DH letter January 2009 validated by access to DH Gateway Reference: 11184 (2) Used for rates and costs:FODO Optics at a glance (3) Consulted :Wales Eye Care Initiative. National Assembly for Wales. URL: http://new.wales.gov.uk/topics/health/healthservice/nhs/eye_care/?lang=en. Accessed April 2006. (4) Used for costing; Curtis L. Unit Costs of Health and Social Care 2008. Personal Social Services Research Unit. University of Kent, 2008. http://www.pssru.ac.uk/pdf/uc/uc2008/uc2008.pdf (5) Tariff information: confirmation of Payment by Results (PbR) arrangements for 2008/09 DH Gateway ref 9181 (6) Adopted the targets of “new /old” for out-patients in Trusts.(Leeds University teaching Hospital Trust Document 2008. (7)Assumption of registration fee at face to face consultant tariff (5) plus one optometric low vision entitlement for new cases and the latter pr year for already registered (8) Used for costing: Lotery, A., Xu, X., Zlatava, G., Loftus, J., (2007) Burden of illness, visual impairment and health resource utilization of patients with neovascular age-related macular degeneration: results from the UK cohort of a five-country cross-sectional study, British Journal of Ophthalmology 91:1303-1307 (9) Costing approach and updated rates: Smith DH, Fenn P, and Drummond M (2004), ‘Cost effectiveness of photodynamic therapy with verteporfin for age related macular degeneration: the UK case’, British Journal of Ophthalmology, Vol. 88, pp. 1107-1112 (10) Used for Costing: Ke, K.M., Montgomery, A.M., Stevenson, M., O’Neill, C.,Chakravarthy, U., (2007) Formal and informal care utilization amongst elderly persons with visual impairment, British Journal of Ophthalmology 91:1279-1281 (11) Used for rates: Douglas, G., Corcoran, C., and Pavey, S., (2006) Network 1000. Opinions and circumstances of visually impaired people in Great Britain:

Appendix 2: Methods - Economics
128
report based on over 1000 interviews, Visual Impairment Centre for Teaching and Research (VICTAR), School of Education, University of Birmingham (12) Consulted: Raftery J, Clegg A, Jones J, Tan SC, Lotery A: Ranibizumab (Lucentis) versus bevacizumab (Avastin): modelling cost effectiveness. Br J Ophthalmol 2007, 91:1244-1246 (13) Used for Costing: Lafuma A, Brezin A, Lopatriello S, Hieke K, Hutchinson J, Mimaud V, and Berdeaux G (2006), ‘Evaluation of non-medical costs associated with visual impairment in four European countries – France, Italy, Germany, and the UK’, Pharmacoeconomics,Vol. 24, No. 2, 2006, pp. 193-205 (14) Consulted: Access Economics the Economic Impact of Visual Impairment in the UK (15) Consulted: Taylor HR, Pezzullo ML, Keeffe JE. The calculation and use of economic burden data Br J Ophthalmol. 2006 Mar;90(3):272-5. (16) Used: http://www.direct.gov.uk/en/DisabledPeopleEverydaylifeandaccess/for (TV licence ) (17) Consulted: Family Resources Survey, Great Britain, 1999-2000 to 2005-06 (18) Consulted :Cost of Minor Tax Allowances and Reliefs hmrc.gov.uk.stats/tax expenditures/tableb1-pdf. (19) Used: RNIB and Guide Dogs, and Action for Blind People internet sites on report on unemployment of the Blind (20) Used: General Practice Consultation Costs Mac Kenzie Graham D Out of date costs in health economics analysis; bmj.com, 2 Mar 2009 (21) Used for costing: Excess Res Care: (from Lafuma 13 ) (22) Consulted; Sach, T. H, Foss, A. J E, Gregson, R. M, Zaman, A., Osborn, F., Masud, T., Harwood, R. H (2007). Falls and health status in elderly women following first eye cataract surgery: an economic evaluation conducted alongside a randomised controlled trial. Br. J. Ophthalmol. 91: 1675-1679 (23) Used for itemisation: Pey T, Nzegwu F, Dooley G. Functionality and the Needs of Blind and Partially Sighted Adults in the UK. Guide Dogs for the Blind Association Rehabilitation Group 2007 (24) Used for Costing: Haringey PCT report of meeting of the Trust Board; Paper on AMD commissioning with Moorfields Eye Hospital. September 2008
Appendix 2: Methods - Economics
129
(25) Used for costing: National Institute for Health and Clinical Excellence: Pegaptanib and ranibizumab for the treatment of age-related macular degeneration Guidance type: Technology appraisal 155 Date issued: August 2008 (26) Used for cataract: HES online 2007. 2008. (27) Used: NHS reference Costs and Reference Cost Guidance 2007 and 2008 (28) Used for costing: Ke K, Chakravarthy U, O Neill C. Economic cost of age-related macular degeneration : a review of recent research. Drugs Aging. 2006;23(3):217-25 Highlands Health Authority 2008 (29) Tariff information: confirmation of Payment by Results (PbR) arrangements for 2008/09 DH Gateway ref 9181 (30) Consulted: Minassian DC, Rosen P, Dart JKG, Reidy A, Desai P, Sidhu M Extracapsular cataract extraction compared with small incision surgery by phacoemulsification: a randomised trial Br J Ophthalmol 2001, Vol85, No7, p822 829 (31) Consulted: Barry P, Seal DV, Gettinby G, et al. ESCRS study of prophylaxis of postoperative endophthalmitis after cataract surgery; preliminary report of principal results from a European multicenter study; the ESCRS Endophthalmitis Study Group. J Cataract Refract Surg 2006; 32:407–410 (32) Consulted :Desai P, Reidy A, Minassian DC, Vafidis G. et al Gains from Cataract Surgery: Visual Function and Quality of Life. Br.J Ophthalmol; 1996, 80, 863-873 (33 ) Consulted: Evans JR, Smeeth L, Fletcher AE. Risk of Admission to a Nursing Home Among Older People With Visual Impairment in Great Britain. Arch Ophthalmol. 2008;126(10):1428-1433 (34) Used for costing: Garvican L . Resources required for a local service in the National Diabetic Retinopathy Screening Programme 2004 (35) Consulted: Scanlon PH, Carter S, Foy C, Ratiram D, Harney B.An evaluation of the change in activity and workload arising from diabetic ophthalmology referrals following the introduction of a community based digital retinal photographic screening programme Br J Ophthalmol 2005;89:971–975. doi: 10.1136/bjo.2004.060723 (36) Consulted : James M, Turner DA, Broadbent DM, Vora J, Harding S. Cost effectiveness analysis of screening for sight threatening diabetic eye disease. BMJ 2000; 320: 1627–1631

Appendix 2: Methods - Economics
130
(37) Used for costing: Traverso C E, Walt J G, Kelly S P et al (2005), ‘Direct costs of glaucoma and severity of the disease: a multinational long term study of resource utilisation in Europe’, British Journal of Ophthalmology, Vol. 89, pp. 1245-1249 (38) Consulted: Poulsen P.B., Buchholz P., Walt J.G., Christensen T.L., Thygesen J..Cost analysis of glaucoma-related-blindness in Europe 2005) International Congress Series, 1282, pp. 262-266 (39) Consulted: Peeters A, Schouten JS, Webers CA, Prins MH, Hendrikse F, Severens JL. Cost-effectiveness of early detection and treatment of ocular hypertension and primary open-angle glaucoma by the ophthalmologist. Eye. 2008;22:354-362
Related Documents