1 PART 1 FUNDAMENTALS OF RESEARCH ONE Explanation in Scientific Psychology TWO Research Techniques: Observation and Correlation THREE Research Techniques: Experiments FOUR Ethics in Psychological Research FIVE How to Read and Write Research Reports 1

Welcome message from author
This document is posted to help you gain knowledge. Please leave a comment to let me know what you think about it! Share it to your friends and learn new things together.
Transcript

1
PA R T 1FUNDAMENTALS OF RESEARCH
O N E
Explanation in Scientifi c Psychology
T W O
Research Techniques: Observation and Correlation
T H R E E
Research Techniques: Experiments
F O U R
Ethics in Psychological Research
F I V E
How to Read and Write Research Reports
1

This page intentionally left blank

3
C H A P T E R 1
EXPLANATION IN SCIENTIFIC PSYCHOLOGY
MAKING SENSE OF THE WORLD
Social Loafi ng
Curiosity: The Wellspring of Science
SOURCES OF KNOWLEDGE
Fixation of Belief
THE NATURE OF THE SCIENTIF IC EXPLANATION
What Is a Theory?
Induction and Deduction
From Theory to Hypothesis
Evaluating Theories
Intervening Variables
Foxes and Hedgehogs Roaming through Psychological Theory
THE SCIENCE OF PSYCHOLOGY
Psychology and the Real World
SUMMARY
KEY TERMS
DISCUSSION QUESTIONS
WEB CONNECTIONS

The goal of scientifi c psychology is to understand why people think and act as they
do. In contrast to nonscientists, who rely on informal and secondary sources of knowl-
edge, psychologists use a variety of well-developed techniques to gather information
and develop theoretical explanations. As one example of this scientifi c approach to
understanding, consider the following case study of the research process.
▼ MAKING SENSE OF THE WORLD
Social Loafi ng
A common observation—one you probably have made yourself on many occasions—
is that people working in a group often seem to “slack off” in their effort. Many people
in groups seem willing to let a few do the work. Bibb Latané, a social psychologist,
noticed this tendency and decided to study it experimentally. Initially, Latané exam-
ined the research literature for evidence of this phenomenon of people working less
hard in groups, which he named social loafi ng. One of the earliest studies of social
loafi ng was conducted by a French agricultural engineer (Ringelmann, 1913; Kravitz &
Martin, 1986) who asked people to pull on a rope as hard as they could. The subjects
pulled by themselves or with one, two, or seven others. A sensitive gauge was used to
measure how hard they pulled the rope. If people exert the same amount of effort in
groups as when alone, then the group performance should be the sum of the efforts
of all individuals. Ringelmann discovered that groups of two pulled at only 95 percent
of their capacity, and groups of three and eight sank to 85 percent and 49 percent,
respectively. So, it is probably not just our imaginations when we notice others (and
ourselves?) seeming to put forth less effort when working in groups: Ringelmann’s
research provides us with a good example of social loafi ng.
Latané and his colleagues went on to perform a systematic series of experiments on the
phenomenon of social loafi ng (Latané, 1981; Latané, Williams, & Harkins, 1979). They fi rst
showed that the phenomenon could be obtained in other experimental situations besides
that of rope pulling. They also demonstrated that social loafi ng occurs in several different
cultures (Gabrenya, Latané, & Wang, 1983) and even holds for young children. Thus, social
loafi ng seems to be a pervasive characteristic of working in groups.
Ask any scientist what he conceives the scientifi c method to be, and he will
adopt an expression that is at once solemn and shifty-eyed; solemn, because
he feels he ought to declare an opinion, shifty-eyed because he is wondering
how to conceal the fact that he has no opinion to declare. If taunted he would
probably mumble something about “Induction” and “Establishing the Laws of
Nature,” but if anyone working in a laboratory professed to be trying to estab-
lish Laws of Nature by induction, we should begin to think he was overdue for
leave. (P. B. MEDAWAR)

C H A P T E R 1 EXPLANATION IN SCIENTIFIC PSYCHOLOGY 5
Latané has related this work to a more general theory of human social behavior
(Latané, 1981). The evidence from the experimental studies points to diffusion of
responsibility as a possible reason for social loafi ng. People working by themselves
think they are responsible for completing the task; when they work in groups, how-
ever, this feeling of responsibility diffuses to others. The same idea accounts for be-
havior in other group situations: If one of your professors asks a question in a class
containing only two other people, you would probably feel responsible for trying to
answer. However, if there were two hundred other people in the class, you would likely
feel much less responsible for answering. Similarly, people are more likely to help in
an emergency when they feel the burden of responsibility than when there are several
others about who could help.
One possible benefi t of such basic research into a phenomenon is that the fi ndings
may be applied later to solve some practical problem. A great problem in American so-
ciety is the diffi culty of keeping worker productivity high. Although social loafi ng is, at
best, only one factor involved in this complicated issue, Marriott (1949) showed that fac-
tory workers working in large groups produce less per individual than do those working
in small groups. Thus, basic research that would show a way to overcome the problem
of social loafi ng may be of great practical import. In fact, Williams, Harkins, and Latané
(1981) found conditions that eliminated the effect of social loafi ng. When individual per-
formance (rather than just performance of the entire group) could be monitored within
the group situation, the individuals worked just as hard as they did when they worked
alone. Certainly more research must be done, but it may be that simply measuring indi-
vidual performance in group situations could help eliminate social loafi ng and increase
productivity. The proposed solution may seem simple, but in many jobs only group per-
formance is measured and individual performance is ignored.
We have discussed Latané’s studies of social loafi ng as an example of psychological
research to illustrate how an interesting problem can be brought into a laboratory set-
ting and studied in a controlled manner. The experiments performed will, when care-
fully conducted, promote a better understanding of the phenomenon of interest than
will simple observation of events and refl ection about them. This book is largely about
the proper conduct of such experimental studies—how to develop hypothe ses, arrange
experimental conditions to test the hypotheses, collect observations (data) within an
experiment, and then analyze and interpret the data collected. In short, in this book we
try to cover the fundamentals of scientifi c inquiry as applied to psychology.
Before examining the specifi cs of research, we discuss some general issues in the
remainder of this chapter. The research on social loafi ng is used to illustrate several
aspects of psychological science—its purposes, its sources, and its nature.
Curiosity: The Wellspring of Science
A scientist wants to discover how and why things work. In this desire, he or she is not
different from a child or anyone else who is curious about the world we inhabit. The
casual observer may not feel terribly frustrated if some observation (for example, that
water always goes down a sink drain counterclockwise or that individual effort in a
group is low) cannot be explained. However, the professional scientist has a strong
desire to pursue an observation until an explanation is at hand or a problem is solved.
It is not so much that scientists are more curious than other people as it is that they

6 P A R T 1 FUNDAMENTALS OF RESEARCH
are willing to go to much greater lengths to satisfy their curiosity than are nonscien-
tists. This unwillingness to tolerate unanswered questions and unsolved problems
has led science to develop several techniques for obtaining relief from curiosity. It is
the careful application of these techniques that distinguishes scientifi c curiosity from
everyday curiosity.
The common denominator for many of these scientifi c techniques is skepticism.
Skepticism is the philosophical belief that the truth of all knowledge is questionable.
Therefore, all inquiry must be accompanied by reasonable doubt. No scientifi c fact can
be known with 100 percent certainty. For example, bridge engineering is a practical
discipline derived from a scientifi c foundation in such fi elds as physics and metallurgy.
Most people, when they drive a car across a bridge, do not actively consider that the
bridge might collapse. It is a known fact that well-maintained bridges are safe. Yet in
the summer of 2007, a bridge in Minneapolis–St. Paul, Minnesota, collapsed. This event
will lead to further research, to result in safer bridges being built. Many of the tools,
such as statistics, discussed in this text allow the skeptical scientist to measure reason-
able doubt.
Of what use is scientifi c curiosity? What purpose does it serve? We have stated that
psychologists try to determine why people think and act as they do. Let us explore
what this means in more detail.
▼ SOURCES OF KNOWLEDGE
Fixation of Belief
The scientifi c method is a valid way to acquire knowledge about the world around us.
What characteristics of the scientifi c approach make it a desirable way to learn about
and arrive at beliefs about the nature of things? Perhaps the best way to answer this
question is to contrast science with other modes of fi xing belief, since science is only
one way in which beliefs are formed.
More than one hundred years ago, the American philosopher Charles Sanders
Peirce (1877) compared the scientifi c way of knowing with three other methods of
developing beliefs. He called these the authority, tenacity, and a priori methods.
According to Peirce, the simplest way of fi xing belief is to take someone else’s word
on faith. A trusted authority tells you what is true and what is false. Young children
believe what their parents tell them simply because Mommy and Daddy are always
right. As children get older, they may discover, unhappily, that Mom and Dad are not
always correct when it comes to astrophysics, macroeconomics, computer technology,
and other specialized fi elds of knowledge. Although this may cause children to doubt
some of their parents’ earlier proclamations, it may not result in utter rejection of this
method of fi xing belief. Instead, some other authority may be sought.
Religious beliefs are formed by the method of authority. Long after Catholic children
have rejected their parents as the source of all knowledge, particularly about religious
doctrine, they may still believe that the pope is infallible. Believing the news you see
on television means that you accept CNN or some other news network as an authority.
You may believe your professors because they are authorities. Since people lack the
resources to investigate everything they learn, much knowledge and many beliefs are
fi xed by the method of authority. Provided nothing happens to raise doubts about the

C H A P T E R 1 EXPLANATION IN SCIENTIFIC PSYCHOLOGY 7
competence of the authority setting the beliefs, this method offers the great advantages
of minimum effort and substantial security. It is most pleasant in a troubled world to
have complete faith in beliefs handed down to you.
Another method of fi xing belief is one in which a person steadfastly refuses to alter
acquired knowledge, regardless of evidence to the contrary. The method of tenacity,
as it was termed by Peirce, is commonly seen in racial bigots who rigidly cling to a
stereotype even in the presence of a good counterexample. Although this method of
maintaining a belief may not be entirely rational, we cannot say it is completely with-
out value. The method of tenacity allows people to maintain a uniform and constant
outlook on things, so it may relieve them from a certain amount of stress and psycho-
logical discomfort.
The third nonscientifi c method discussed by Peirce fi xes belief a priori. In this
context, the term a priori refers to something that is believed without prior study or
examination. Propositions that seem reasonable are believed. This is an extension of
the method of authority. However, there is no one particular authority being followed
blindly in this method. The general cultural outlook is what seems to fi x belief a priori.
People once believed the world was fl at, and it did seem reasonable to suppose that
the sun revolved around the earth as does the moon. Indeed, the world does look fl at
if you are not in a spacecraft.
The tenacity and a priori methods are similar in that they minimize the possibility
of being infl uenced by confl icting opinion. In the method of tenacity, other points of
view, although noticed, are completely discounted. Thus, a racial stereotype is pre-
served despite other evidence, such as the good qualities of a person of a different race
who lives next door. In the a priori method, other points of view go unnoticed. For
example, the sight of a ship disappearing from bottom to top, instead of all at once, as
it leaves port may seem irrelevant if you already know the world is fl at.
The last of Peirce’s methods, the scientifi c method, fi xes belief on the basis of
experience. Science is based on the assumption that events have causes and that we
can discover those causes through controlled observation. This belief, that observable
causes determine events, is known as determinism. If we defi ne scientifi c psychology
(as well as science in general) as a repeatable, self-correcting undertaking that seeks to
understand phenomena on the basis of empirical observation, then we can see several
advantages to the scientifi c method over the methods just outlined. Let us see what we
mean by empirical and self-correcting and examine the advantages associated with
those aspects of science.
The fi rst advantage of the scientifi c method is its emphasis on empirical observation.
None of those other methods relies on data (observations of the world) obtained by sys-
tematic observation. In other words, there is no empirical basis for fi xing belief. The word
empirical is derived from an old Greek word meaning “experience.” Having an empirical
basis for beliefs means that experience rather than faith is the source of knowledge. Hav-
ing one’s beliefs fi xed by authority carries no guarantee that the authority obtained data
before forming an opinion. By defi nition, the method of tenacity refuses to consider data,
as does the a priori method. Facts that are considered in these other modes of fi xing be-
lief are not ordinarily obtained by systematic procedures. For example, casual observation
was the “method” that led to the ideas that the world was fl at and that frogs spontaneously
generated from the mud each spring, as Aristotle believed.
The second advantage of science is that it offers procedures for establishing the
superiority of one belief over another. Persons holding different beliefs will fi nd it diffi cult

8 P A R T 1 FUNDAMENTALS OF RESEARCH
to reconcile their opinions. Science overcomes this problem. In principle, anyone can
make an empirical observation, which means that scientifi c data can be public and can
be repeatedly obtained. Through public observations, new beliefs are compared with old
beliefs, and old beliefs are discarded if they do not fi t the empirical facts. This does not
imply that each and every scientist instantaneously drops outmoded beliefs in favor
of new opinions. Changing scientifi c beliefs is usually a slow process, but eventually in-
correct ideas are weeded out. Empirical, public observations are the cornerstone of the
scientifi c method, because they make science a self-correcting endeavor.
▼ THE NATURE OF THE SCIENTIFIC EXPLANATION
What Is a Theory?
A theory can be crudely defi ned as a set of related statements that explains a variety
of occurrences. The more the occurrences and the fewer the statements, the better the
theory. The law of gravity explains falling apples, the behavior of roller coasters, and
the position of bodies within the solar system. With a small number of statements about
the mutual attraction of bodies, it explains a large number of events. It is therefore a
powerful theory. (This does not necessarily mean it is a correct theory, since there are
some events it cannot explain.)
Theory in psychology performs two major functions. First, it provides a framework
for the systematic and orderly display of data—that is, it serves as a convenient way for
the scientist to organize data. Even the most dedicated inductive scientist will eventu-
ally have diffi culty remembering the outcomes of dozens of experiments. Theory can
be used as a kind of fi ling system to help experimenters organize results. Second, it
allows the scientist to generate predictions for situations in which no data have been
obtained. The greater the degree of precision of these predictions, the better the theory.
With the best of intentions, scientists who claim to be testing the same theory often
derive from the theory different predictions about the same situation. This unfortunate
circumstance is relatively more common in psychology, where many theories are stated
in a loose verbal fashion, than in physics, where theories are more formal and better
quantifi ed through the use of mathematics. Although psychologists are rapidly becom-
ing equipped to state their theories more precisely through such formal mechanisms as
mathematics and computer simulations, the typical psychological theory is still not as
precise as theories in more established, older sciences.
Let us see how the theory devised by Latané to account for social loafi ng stacks
up with regard to organization and prediction. The theory of diffusion of responsibil-
ity organizes a substantial amount of data about social loafi ng. More important, the
theory seems to account for a remarkable variety of other observations. For example,
Latané (1981) notes that the size of a tip left at a restaurant table is inversely related
to the number of people in the dinner party. Likewise, proportionately more people
committed themselves to Christ at smaller Billy Graham crusades than at larger ones.
Finally, work by Latané and Darley (1970), which is discussed in detail later in this
book, shows that the willingness of people to help in a crisis is inversely related to the
number of other bystanders present. The entire pattern of results can be subsumed un-
der the notion of diffusion of responsibility, which asserts that people feel less respon-
sibility for their own actions when they are in a group than when they are alone—so
C H A P T E R 1 EXPLANATION IN SCIENTIFIC PSYCHOLOGY 9
they are less likely to help in an emergency, they are less likely to leave a large tip,
and so on. Latané’s theory also makes rather precise predictions about the impact of
the presence of other people on a person’s actions. In fact, one version of the theory
(Latané, 1981) presents its major assumptions in terms of mathematical equations.
Theories are devised to organize concepts and facts into a coherent pattern and to
predict additional observations. Sometimes the two functions of theory—organization and
prediction—are called description and explanation, respectively. Unfortunately, for-
mulating the roles of theory in this manner often leads to an argument about the relative
superiority of deductive or inductive approaches to science—a discussion the following
section concludes is fruitless. According to the deductive scientist, the inductive scientist
is concerned only with description. The inductive scientist defends against this charge by
retorting that description is explanation—if a psychologist could correctly predict and con-
trol all behavior by referring to properly organized sets of results, then that psychologist
would also be explaining behavior. The argument is futile because both views are correct.
If all the necessary data were properly organized, predictions could be made without
recourse to a formal body of theoretical statements. Since all the data are not properly or-
ganized as yet, and perhaps never will be, theories are required to bridge the gap between
knowledge and ignorance. Remember, however, that theories will never be complete,
because all the data will never be available. So, we have merely recast the argument be-
tween inductive and deductive views about which approach will more quickly and surely
lead to truth. Ultimately, description and explanation may be equivalent. The two terms
describe the path taken more than they describe the eventual theoretical outcome. To
avoid this pitfall, we shall refer to the two major functions of theory as organization and
prediction rather than as description and explanation.
Induction and Deduction
Certain basic elements are shared by all approaches to science. The most important of
these are data (empirical observations) and theory (organization of concepts that permit
prediction of data). Science needs and uses both data and theory, and our outline of re-
search on social loafi ng indicates that they can be interlinked in a complex way. However,
in the history of science, individual scientists have differed about which is more important
and which comes fi rst. Trying to decide this is a little like trying to decide whether the
chicken or the egg comes fi rst. Science attempts to understand why things work the way
they do, and, as we will argue, understanding involves both data and theory.
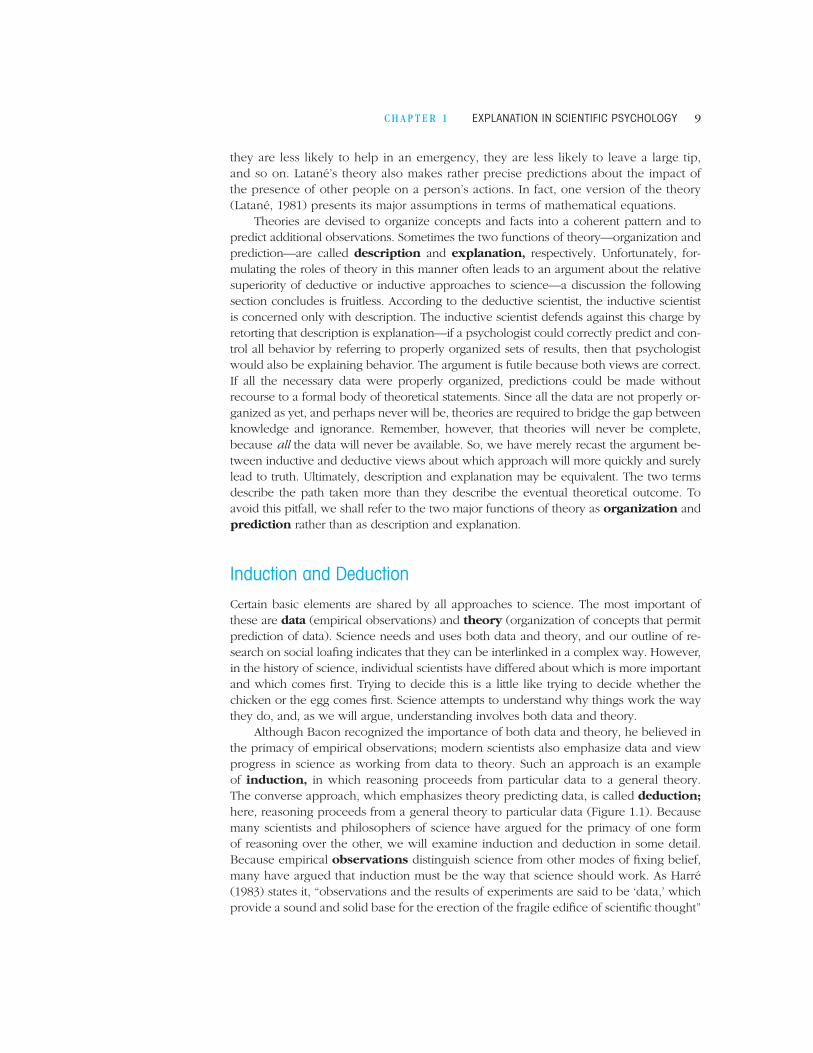
Although Bacon recognized the importance of both data and theory, he believed in
the primacy of empirical observations; modern scientists also emphasize data and view
progress in science as working from data to theory. Such an approach is an example
of induction, in which reasoning proceeds from particular data to a general theory.
The converse approach, which emphasizes theory predicting data, is called deduction;
here, reasoning proceeds from a general theory to particular data (Figure 1.1). Because
many scientists and philosophers of science have argued for the primacy of one form
of reasoning over the other, we will examine induction and deduction in some detail.
Because empirical observations distinguish science from other modes of fi xing belief,
many have argued that induction must be the way that science should work. As Harré
(1983) states it, “observations and the results of experiments are said to be ‘data,’ which
provide a sound and solid base for the erection of the fragile edifi ce of scientifi c thought”
10 P A R T 1 FUNDAMENTALS OF RESEARCH
(p. 6). In the case of social loafi ng, the argument would be that the facts of social loafi ng
derived from experimentation produced the theory of diffusion of responsibility.
One problem with a purely inductive approach has to do with the fi nality of
empirical observations. Scientifi c observations are tied to the circumstances under
which they are made, which means that the laws or theories that are induced from
them must also be limited in scope. Subsequent experiments in different contexts
may suggest another theory or modifi cations to an existing one, so our theories that
are induced on the basis of particular observations can (and usually do) change
when other observations are made. This, of course, is a problem only if one takes an
authoritarian view of ideas and believes in clinging tenaciously to a particular theory.
Thus, theories induced from observations are tentative ideas, not fi nal truths, and the
theoretical changes that occur as a result of continued empirical work exemplify the
self-correcting nature of science.
According to the deductive view, which emphasizes the primacy of theory, the
important scientifi c aspect of the social loafi ng research is the empirical guidance pro-
vided by the formal theory of social loafi ng. Furthermore, the more general theory,
diffusion of responsibility, provides an understanding of social loafi ng. The deductive
approach holds well-developed theories in high regard. Casual observations, informal
theories, and data take second place to broad theories that describe and predict a
substantial number of observations.
From the standpoint of the deductive approach, scientifi c understanding means, in
part, that a theory will predict that certain kinds of empirical observations should oc-
cur. In the case of social loafi ng, the theory of diffusion of responsibility suggests that
monitoring individual performance in a group should reduce the diffusion of respon-
sibility, which in turn will reduce the amount of social loafi ng that is observed. This
prediction, as we have seen, proves to be correct.
But what do correct predictions reveal? If a theory is verifi ed by the results of
experiments, a deductive scientist might have increased confi dence in the veracity of the
theory. However, since empirical observations are not fi nal and can change, something
other than verifi cation may be essential for acceptance or rejection of a theory. Popper
THEORY
Deduction
DATA
Induction
▼ FIGURE 1.1
A Theory Organizes and Predicts Data. By means of deduction, particular observations (data) may be predicted. By means of induction, the data suggest organizing principles (theo-ries). This circular relationship indicates that theories are tentative pictures of how data are organized.
C H A P T E R 1 EXPLANATION IN SCIENTIFIC PSYCHOLOGY 11
(1961), a philosopher of science, has suggested that good theories must be fallible; that
is, the empirical predictions must be capable of tests that could show them to be false.
This suggestion of Popper’s has been called the falsifi ability view. According to the
falsifi ability view, the temporary nature of induction makes negative evidence more im-
portant than positive support. If a prediction is supported by data, one cannot say that
the theory is true. However, if a theory leads to a prediction that is not supported by the
data, then Popper would argue that the theory must be false, and it should be rejected.
According to Popper, a theory can never be proven; it can only be disproven.
Popper’s view about the diffi culty of proving a theory can be illustrated by think-
ing about a specifi c theory; for example, does a bag of marbles contain only black
marbles? One good way to test this theory would be to reach into the bag and draw
out a marble. The marble is black. What can you conclude about the theory that all the
marbles are black? While the datum (one black marble) is consistent with the theory,
it does not prove it. There might still be a white marble inside the bag. So pull out
another marble; indeed, pull out ten more marbles. All ten are black. Is the theory now
proved? No, there still might be a single white marble lurking in the bag. You would
have to remove every marble to ensure that there were no white marbles. It is easy to
prove the theory wrong if a white marble gets drawn. Proving the theory to be correct
depends on the size of the bag. If the bag is infi nitely large, the theory can never be
proven because the next marble you examine might be white.
Proctor and Capaldi (2001) have noted two kinds of objections to Popper’s ap-
proach. First, there is a logical problem (Salmon, 1988). Since a theory potentially can
always be disconfi rmed by the next experiment, the number of accomplished experi-
ments consistent with the theory is irrelevant. So logically a well-collaborated theory is
not more valuable and does not necessarily make better predictions than a theory that
has never been tested. This logical view confl icts with the practical view that scientists
tend to be more comfortable with theories that have passed several experimental tests.
This practical view (Kuhn, 1970) is what Proctor and Capaldi (2001) offer as the sec-
ond, empirical, objection to falsifi cation: Theories tend to be accepted, at least initially,
on the basis of their ability to explain (organize) existing phenomena more than on
their ability to predict new results.
One problem with the deductive approach has to do with the theories themselves.
Most theories include many assumptions about the world that are diffi cult to test and that
may be wrong. In Latané’s work, one assumption underlying the general theory is that
measuring a person’s behavior in an experimental context does not change the behav-
ior in question. Although this often is a reasonable assumption, we will show later that
people can react to being observed in unusual ways, which means that this assumption
is sometimes wrong. If the untested assumptions are wrong, then a particular experiment
that falsifi es a theory may have falsifi ed it for the wrong reasons. That is, the test of the
theory may not have been fair or appropriate. It can be concluded, therefore, that the
deductive approach by itself cannot lead to scientifi c understanding.
At this point, you may be wondering whether scientifi c understanding is possible if
both induction and deduction are not infallible. Do not despair. Science is self- correcting,
and it can provide answers to problems, however temporary those answers may be. Sci-
entifi c understanding changes as scientists ply their trade. We have a better understand-
ing of social loafi ng now than we did before Latané and his coworkers undertook their
research. Through a combination of induction and deduction (see Figure 1.1), science
progresses toward a more thorough understanding of its problems.

12 P A R T 1 FUNDAMENTALS OF RESEARCH
By way of concluding this section, we reexamine social loafi ng. Initially, positive
experimental results bolstered our confi dence in the general notion of social loafi ng.
These results, in turn, suggested hypotheses about the nature of social loafi ng. Is it a
general phenomenon that would infl uence even group-oriented individuals? Does it
occur in the workplace as well as the laboratory? Positive answers to these questions
are consistent with a diffusion-of-responsibility interpretation of social loafi ng.
In the next phase of the research, Latané and his colleagues attempted to eliminate
other explanations of social loafi ng by falsifying predictions made by these alternative
theories. In their earlier work, Latané and his colleagues tested a particular person’s effort
both when alone and when in a group. They subsequently reasoned that under these con-
ditions, a person might rest during the group test so that greater effort could be allocated
to the task when he or she was tested alone. To eliminate the possibility that allocation of
effort rather than diffusion of responsibility accounted for social loafi ng, they conducted
additional experiments in which a person was tested either alone or in a group—but not
in both situations. Contrary to the allocation-of-effort hypothesis, the results indicated that
social loafi ng occurred when a person was tested in just that one condition of being in a
group (Harkins, Latané, & Williams, 1980). Therefore, it was concluded that diffusion of re-
sponsibility was a more appropriate account of social loafi ng than was allocation of effort.
Note the course of events here. Successive experiments pitted two possible out-
comes against each other with the hope that one possibility would be eliminated and
one supported by the outcome of the research. Of course, subsequent tests of the
diffusion-of-responsibility theory probably will contradict it or add to it in some way.
Thus, the theory might be revised or, with enough contradictions, rejected for an al-
ternative explanation, itself supported by empirical observations. In any event, where
we stand now is that we have constructed a reasonable view of what social loafi ng
entails and what seems to cause it. It is the mixture of hypotheses induced from data
and experimental tests deduced from theory that resulted in the theory that diffusion of
responsibility leads to social loafi ng.
From Theory to Hypothesis
Theories cannot be tested directly. There is no single magical experiment that will
prove a theory to be correct or incorrect. Instead, scientists perform experiments to test
hypotheses that are derived from a theory. But exactly what are scientifi c hypotheses
and where do they come from?
It is important to distinguish between hypotheses and generalizations (Kluger &
Tikochinsky, 2001). A hypothesis is a very specifi c testable statement that can be
evaluated from observable data. For example, we might hypothesize that drivers older
than sixty-fi ve years would have a higher frequency of accidents involving left turns
across oncoming traffi c when driving at night than do younger drivers. By looking at
police records of accident data, we could determine, with the help of some statistics
(see Appendix B), if this hypothesis is incorrect. A generalization is a broader state-
ment that cannot be tested directly. For example, we might generalize that older drivers
are unsafe at any speed and should have restrictions, such as not being able to drive at
night, on their driver’s license. Since “unsafe at any speed” is not clearly defi ned, this is
not a testable statement. Similarly, the generalization does not defi ne an age range for
older drivers. However, it can be used to derive several testable hypotheses.

C H A P T E R 1 EXPLANATION IN SCIENTIFIC PSYCHOLOGY 13
Figure 1.2 illustrates this process. Each generalization can produce more than one
hypothesis. Only two are illustrated in the fi gure to keep it simple, but a good generali-
zation can produce a horde of hypotheses. For example, the older-driver generalization
could produce many hypotheses about different kinds of accidents and behaviors that
befall aging drivers: crashing into stopped vehicles, failing to signal for turns, driving
on the sidewalk, backing up into objects, not keeping within their lane, and so on.
These hypotheses could be tested by making observations in traffi c, on closed test
tracks (safer for the driving public if the generalization is true), or in driving simulators
(safest for the driving public).
Now that we have explained that hypotheses come from generalizations, we can go
on to the next question: Where do generalizations come from? Figure 1.2 shows there
are two sources for generalizations. They can come from theory or from experience.
While only three generalizations are shown in Figure 1.2, a good theory will produce
a gaggle of generalizations. You may think that the aging-driver generalization comes
from experience rather than from theory. You may have fi rsthand experience being a
passenger in a car driven by a grandparent, and that experience may have caused you to
agree with the generalization. This is an inductive process (see Figure 1.1) based upon
data, namely casual observation of the driving behavior of elderly citizens. Hypotheses
derived from this inductive process are called common-sense hypotheses. While testing
common-sense hypotheses was once frowned upon in experimental psychology as be-
ing inferior to testing hypotheses derived from theory, there is currently a new apprecia-
tion of the value of common-sense hypotheses (Kluger & Tikochinsky, 2001).
Nevertheless, most psychologists prefer testing hypotheses based upon theory. In
this case, the generalization is formed deductively (see Figure 1.1) from the theory. The
aging-driver generalization could also be derived from theories of attention, perception,
and decision making (Kantowitz, 2001). As we age, our ability to attend to multiple tasks
decreases and our decision making becomes more conservative, often requiring more
time to accomplish. So an elderly driver might (a) have trouble seeing oncoming traffi c at
night, (b) have trouble attending to oncoming traffi c while paying attention to a radio or
a passenger, and (c) take a long time to decide if a left-hand turn across traffi c is safe, so
Generalization
Hypothesis Hypothesis Hypothesis
Hypothesis Hypothesis Hypothesis
Generalization Generalization
Theory
E v e r y d a y E x p e r i e n c e
▼ FIGURE 1.2
Gaggles of Generalizations Produce Hordes of Hypotheses.

14 P A R T 1 FUNDAMENTALS OF RESEARCH
that when he or she fi nally makes the turn it is too late and oncoming traffi c cannot avoid
an accident. The advantage of a good theory is that it produces many generalizations.
Theories of attention not only deal with aging drivers but make generalizations about
many other practical situations such as operating airplanes and nuclear power plants, to
say nothing of more abstract predictions to be tested in laboratories. For example, many
theories of attention would predict that talking on your cell phone while you are driving
would be dangerous, and indeed laboratory research suggests that it is (Steayer & Drew,
2007). However, common-sense generalizations are not productive because, even if they
are correct, they do not create new generalizations. So theories are more effi cient in
advancing scientifi c inquiry.
While hypothesis testing is the dominant methodology used in experimental
psychology, there are other points of view. Most theories in psychology are verbal
and qualitative so that mathematical predictions are hard to come by. However, if
a formal model can be generated either mathematically or by computer simulation,
then it becomes possible to estimate parameters of the model. Parameter estimation
is superior to hypothesis testing and curve fi tting (Kantowitz & Fujita, 1990), and as
psychology evolves as a science, estimation will supplement, and perhaps eventually
replace, hypothesis testing. Indeed, there is a new movement in the philosophy of
science, called naturalism, that criticizes current methodologies such as hypothesis
testing, and its tentacles have reached the shores of psychological science (Proctor
& Capaldi, 2001). Naturalism suggests that methodological criteria are not fi xed for
eternity based on logical premises, but can change and evolve (just like theories) on
pragmatic grounds.
Evaluating Theories
The sophisticated scientist does not try to determine if a particular theory is true or false
in an absolute sense. There is no black-and-white approach to theory evaluation. A
theory may be known to be incorrect in some portion and yet continue to be used. In
modern physics, light is represented, according to the theory chosen, either as discrete
particles called quanta or as continuous waves. Logically, light cannot be both at the
same time. Thus, you might think that at least one of these two theoretical views must
necessarily be false. The physicist tolerates this ambiguity (although perhaps not cheer-
fully) and uses whichever representation—quantum or wave—is more appropriate.
Instead of fl atly stating that a theory is true, the scientist is much more likely to state
that it is supported substantially by data, thereby leaving open the possibility that new
data may not support the theory. Although scientists do not state that a theory is true,
they must often decide which of several theories is best. As noted earlier, explanations
are tentative; nevertheless, the scientist still needs to decide which theory is best for
now. To do so, explicit criteria are needed for evaluating a theory. Four such criteria
are parsimony, precision, testability, and ability to fi t data.
One important criterion was hinted at earlier when we stated that the fewer the
statements in a theory, the better the theory. This criterion is called parsimony, or
sometimes Occam’s razor, after William of Occam. If a theory needs a separate state-
ment for every result it must explain, clearly no economy has been gained by the
theory. Theories gain power when they can explain many results with few explanatory
concepts. Thus, if two theories have the same number of concepts, the one that can

C H A P T E R 1 EXPLANATION IN SCIENTIFIC PSYCHOLOGY 15
explain more results is a better theory. If two theories can explain the same number of
results, the one with fewer explanatory concepts is preferred.
Precision is another important criterion, especially in psychology (where it is often
lacking). Theories that involve mathematical equations or computer problems are gen-
erally more precise, and hence better, than those that use loose verbal statements (all
other things being equal, of course). Unless a theory is so precise that different investi-
gators can agree about its predictions, it is for all intents and purposes useless.
Testability goes beyond precision. A theory can be very precise and yet not able
to be tested. For example, when Einstein proposed the equivalence of matter and
energy (E 5 mc2), nuclear technology was not able to test this relationship directly.
The scientist places a very high value on the criterion of testability, because a theory
that cannot be tested can never be disproved. At fi rst you might think this would be a
good quality since it would be impossible to demonstrate that such a theory was incor-
rect. The scientist takes the opposite view. For example, consider ESP (extrasensory
perception). Some believers in ESP claim that the presence of a disbeliever is suffi cient
to prevent a person gifted with ESP from performing, because the disbeliever puts out
“bad vibes” that disrupt ESP. This means that ESP cannot be evaluated, because only
believers can be present when it is demonstrated. The scientist takes a dim view of this
logic, and most scientists, especially psychologists, are skeptical about ESP. Belief in a
theory increases as it survives tests that could reject it. Since it is logically possible that
some future test may fi nd a fl aw, belief in a theory is never absolute. If it is not logically
possible to test a theory, it cannot be evaluated; hence, it is useless to the scientist. If it
is logically possible but not yet technically feasible, as was once the case with Einstein’s
theory, then evaluation of a theory is deferred.
Finally, a theory must fi t the data it explains. While goodness of fi t is not a suf-
fi cient criterion for accepting a theory (Roberts & Pashler, 2000), there is little point in
pursuing a theory that fails to fi t the data (Rodgers & Rowe, 2002).
Intervening Variables
Theories often use constructs that summarize the effects of several variables. Variables are
discussed at greater length in Chapter 3. For now, we briefl y describe two different kinds
of variables. Independent variables are those manipulated by the experimenter. For ex-
ample, not allowing rats to have any water for several hours would create an independent
variable called hours of deprivation. Dependent variables are those observed by the ex-
perimenter. For example, one could observe how much water a rat drinks.
Science tries to explain the world by relating independent and dependent vari-
ables. Intervening variables are abstract concepts that link independent variables to
dependent variables. Gravity is a familiar construct that accomplishes this goal. It can
relate an independent variable, the feet of height from which an object is dropped,
to a dependent variable, the speed of the object when it hits the ground. Gravity also
summarizes the effects of height on speed for all manner of objects. Gravity explains
falling apples as well as falling baseballs. Science progresses when a single construct,
such as gravity, explains outcomes in many different environments.
Miller (1959) has explained how a single intervening variable, thirst, organizes
experimental results effi ciently. Figure 1.3 shows a direct and an indirect way to relate
an independent variable, hours of deprivation, to a dependent variable, rate of bar

16 P A R T 1 FUNDAMENTALS OF RESEARCH
pressing. The dependent variable is obtained by placing a rat into a small chamber
where it can press a bar to obtain drinking water. The experimenter observes the rate
(how many presses per minute) at which the rat presses the bar to get water. The direct
relationship uses only one arrow to link hours of deprivation to rate of bar pressing.
After doing the experiment, we could build a mathematical formula that directly relates
hours of deprivation to rate of bar pressing. The indirect method in Figure 1.3 uses two
arrows. The fi rst arrow relates hours of deprivation to thirst, an intervening variable.
The second arrow relates the intervening variable, thirst, to the rate of bar pressing.
Since the indirect method is more complicated, requiring an extra arrow, you might
expect the scientist to prefer the direct method of explanation. Indeed, if the only
scientifi c goal were to relate hours of deprivation to rate of bar pressing, you would
be correct because science prefers simple explanations to complex explanations. How-
ever, as we shall explain, the scientifi c goal is more general.
Figure 1.4 relates two independent variables, hours of deprivation and feeding
dry food, to two dependent variables, rate of bar pressing and volume of water drunk.
Again, both direct and indirect explanations are shown. In Figure 1.4, direct and in direct
explanations are equally complex. Each requires four distinct arrows.
Hours of deprivation
Hours of deprivation Thirst
Rate of bar pressing
Rate of bar pressing
Independent Variable Intervening Variable Dependent Variable
▼ FIGURE 1.3
One Set of Variables.
Hours of deprivation
Feeding dry food Volume of water drunk
Rate of bar pressing
Hours of deprivation
Feeding dry food Volume of water drunk
Rate of bar pressing
Thirst
Independent Variables Dependent VariablesIntervening Variable
▼ FIGURE 1.4
Two Sets of Variables.

C H A P T E R 1 EXPLANATION IN SCIENTIFIC PSYCHOLOGY 17
Figure 1.5 relates three independent variables, hours of deprivation, feeding dry
food, and saline injection (giving a rat saltwater through a tube inserted in its stomach),
to three dependent variables, rate of bar pressing, volume of water drunk, and amount
of quinine required to stop the rat from drinking. Again, both direct and indirect ex-
planations are shown. Now, it is obvious that the indirect method is less complicated.
It requires six distinct arrows, whereas the direct method requires nine arrows. So as
science tries to relate more independent and dependent variables, intervening variables
become more effi cient.
There is yet another advantage of intervening variables. Thirst, regardless of how it
is produced, should have the same effect on all dependent variables. This can be tested
in experiments. If it is not true, we can reject the idea of a single intervening variable.
Later chapters discuss this issue under the topic of converging operations.
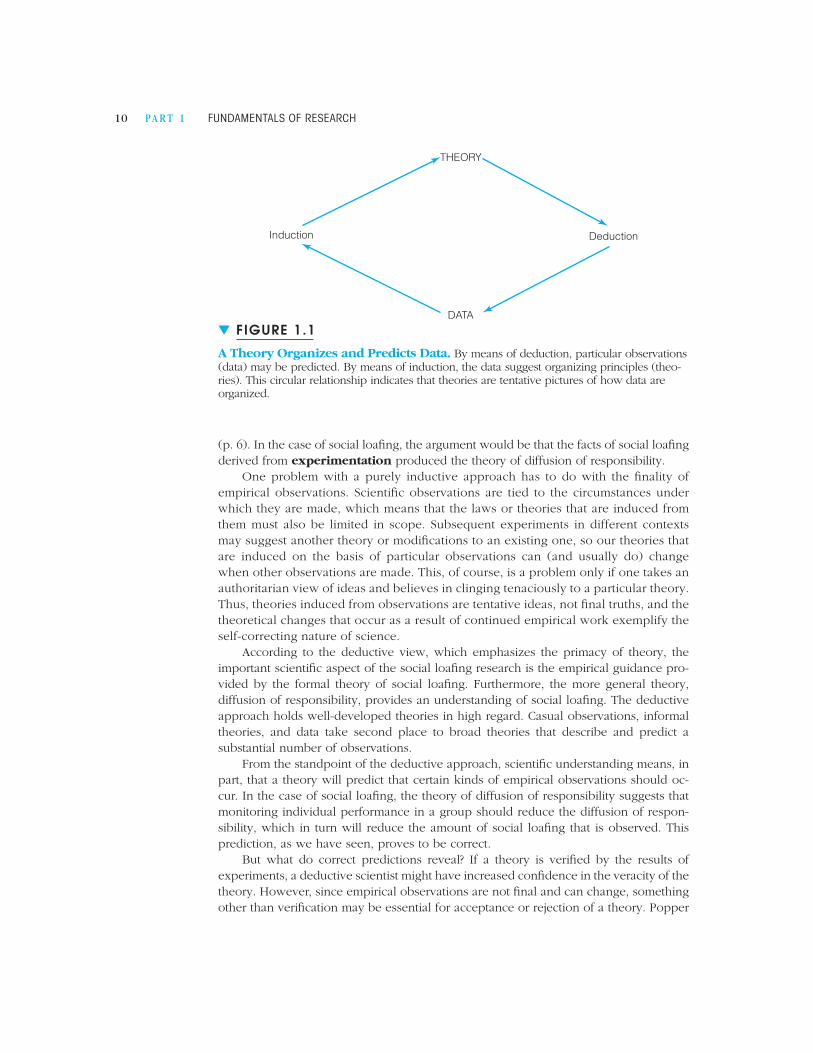
Foxes and Hedgehogs Roaming through Psychological Theory
Research in experimental psychology tends to be organized by sub-fi elds; indeed, Part Two
of this textbook presents chapters for such sub-fi elds as perception, memory, and social
infl uence. This approach is the way of the fox who knows many paths (Figure 1.6). Such
was not always the case in the history of psychology. There were psychologists (e.g., James,
▼ FIGURE 1.5
Three Sets of Variables.
Hours of deprivation
Feeding dry food Volume of water drunk
Rate of bar pressing
Hours of deprivation
Feeding dry food Volume of water drunk
Rate of bar pressing
Thirst
Saline injection Quinine to stop drinking
Saline injection Quinine to stop drinking
Independent Variables Dependent VariablesIntervening Variable
18 P A R T 1 FUNDAMENTALS OF RESEARCH
1890) who tried for a unifi ed explanation of psychological phenomena. This is the way of
the hedgehog who knows one big thing (see Figure 1.6).
Both approaches face signifi cant challenges. The dominant approach builds strong
barriers between fi elds. Professors are hired within a fi eld and tend to have offi ces
located by fi eld of specialization, the better to fend off territorial thrusts from other
sub-fi elds. Graduate students get trained by fi eld, with appropriate course require-
ments, and this perpetuates the division. Even panels that evaluate grant proposals are
organized by specialties. The new Ph.D. who takes a job in industry is ill prepared for
the cooperation across fi elds necessary to solve any important practical problem.
Recently, sympathy has been growing for a more unifi ed (hedgehog) approach to
psychology (Sternberg, Grigorenko, & Kalmar, 2001). These theorists try to knit com-
peting theories together, stressing that the explanation role of theory is more crucial
than the predictive role. Theory knitting is a worthy goal if it can be accomplished.
However, the present divided system arose because earlier integrated theories were
unable to span all the sub-fi elds of psychology. Will the new hedgehogs knit better
than the old hedgehogs?
▼ THE SCIENCE OF PSYCHOLOGY
Some students fi nd it diffi cult to think of psychology as a science in the same sense that
physics and chemistry are sciences. They believe that there are aspects of human experi-
ence, such as the arts, literature, and religion, that defy scientifi c analysis. How can the
beauty of a Klee lithograph, a Beethoven sonata, or a Cartier-Bresson photograph be
reduced to cold scientifi c equations? How can the tender feelings of a fi rst romance, the
thrill of driving a sports car at 100 miles per hour, or the agony of a defeated football
team be captured in the objective, disinterested fashion required by science?
Some psychologists, known as humanists, would answer these questions in the
negative. These humanists, most often clinical and counseling psychologists, claim that it
is impossible to evaluate and test objectively much of human feelings and experience by
traditional scientifi c methods. Even tough, “brass-instrument” experimental psychologists
"The fox knows many things,but the hedgehog knows one big thing."
–Archilocus
▼ FIGURE 1.6
Segmented (fox) and unifi ed (hedgehog) approaches to psychological theory.

C H A P T E R 1 EXPLANATION IN SCIENTIFIC PSYCHOLOGY 19
concur that the domain of science is limited. We cannot establish or refute the existence
of God by scientifi c means any more than we could test gravity by theological methods.
Science operates where its tools are appropriate (see Chapter 14). This does not imply
that knowledge cannot be gained wherever science fears to tread—that is, by nonscien-
tifi c means. Many important fi elds of human endeavor have yet to benefi t from extensive
scientifi c analysis—ethics, morals, and law, to name but a few.
However, most scientists would hold out the hope that scientifi c analysis eventu-
ally might be usefully applied to many such areas. Much of contemporary psychol-
ogy was regarded as the sole property of philosophy at one time. As psychological
techniques improved, these aspects of human expertise and behavior moved into the
realm of science. And now most psychologists believe that virtually all facets of human
experience are fair game for the science of psychology. Deriding scientifi c progress in
psychology, as did one U.S. senator who criticized the National Science Foundation
for supporting research on romantic love, will not halt efforts to expand psychologi-
cal knowledge. Although concern for the proper and ethical use of such knowledge is
valid and important, ignorance is no solution.
Psychology and the Real World
Scientists, in general, and psychologists, in particular, have many reasons for pursuing
their profession. Although we think it rather easy to prove that psychological research
does serve humanity, we would like to stress that we do not fi nd this the only, or
necessarily the major, justifi cation for a career as a research psychologist. Many scien-
tists investigate certain problems simply because they fi nd them interesting. We have
complete sympathy with a colleague who might state that he or she studies gerbils just
because gerbils provoke his or her curiosity. It is true that certain studies are performed
on animals because they are unethical or impractical to perform on humans—for ex-
ample, studies of long-term crowding, punishment, drugs, and so on—but it is equally
true that the behavior of animals is interesting in its own right.
Scientifi c research is often divided into two categories: basic and applied. Applied
research aims at solving a specifi c problem—such as how to cure bedwetting—whereas
basic research has no immediate practical goal. Basic research establishes a reservoir of
data, theoretical explanations, and concepts that can be tapped by the applied researcher.
Without this source, applied research would soon dry up and sputter to a halt, unless ap-
plied researchers became of necessity basic researchers. It takes quite a while for a con-
cept developed by basic research to fi nd some useful application in society. Adams (1972)
traced fi ve socially important products to discover the impact, if any, of basic research.
Although basic research accounted for 70 percent of the signifi cant events, the research
occurred twenty to thirty years before the ultimate use of the product. This long time lag
obscures the crucial role of basic research so that many persons incorrectly believe that
basic research is not very useful to society. It is quite diffi cult to tell what basic research
being done today will have an impact thirty years from now. But this inability to predict
hardly means that we should stop doing basic research.
Although most experimental psychologists are content with a scientist–practitioner
model where applied research is based on the fruits of basic research, more recently there
has been a push for a two-track system (Fishman & Neigher, 1982; Howell, 1994) where
basic and applied research diverge. From a historical perspective (Bevan, 1980) these two
20 P A R T 1 FUNDAMENTALS OF RESEARCH
approaches to science can be traced to René Descartes and Francis Bacon. In the Cartesian
model, science is a basic good whose aim is to understand nature. The Baconian model
promotes the goal of science as improving human welfare, which places useful results
ahead of increasing knowledge. However, a number of researchers argue that the basic/
applied research dichotomy either has been oversimplifi ed or represents a false distinction
(Pedhazur & Pedhazur Schmelkin, 1991). For example, defi nitions of basic and applied
research differ considerably among researchers. Furthermore, all scientifi c research is con-
ducted with the goal of obtaining knowledge. In this sense, all research can be considered
basic to some extent. Likewise, most research has some practical value. For example, the
European Journal of Cognitive Psychology (2007) recently dedicated an entire special issue
to research on memory (see Chapter 10) in educationally relevant settings. Some of this
research may be viewed as basic, in that it tests whether principles of memory discovered
using relatively simple laboratory materials (e.g., word lists) hold true for more complex
classroom-type materials, but it may also be seen as applied, in that the results suggest
ways to maximize student learning. Thus, the basic/applied distinction may be better
thought of in less discrete terms, or as forming a continuum.
The decrease in government funding for research that started during the admin-
istration of President Reagan (Fishman & Neigher, 1982) and the more recent cutback
of industrial research funds (Yeager, 1996) suggest that American society has turned
toward the Baconian model. Scientists, who of course benefi t from research funding,
have tried to explain the advantages of research in both governmental and private
sectors. Of necessity, behavioral scientists have become more active in promoting
government research (National Advisory Mental Health Council Behavioral Science
Task Force, 1995). Yeager (1996) has argued that, in the private sector, while industry
can easily calculate the short-term costs of research, it has not fully appreciated the
long-term benefi ts. Failure to perform industrial research can cripple major industries.
Well-known examples are the decline of the U.S. automobile and steel industries due
to their inability to compete with Japanese advanced technology in the 1980s.
Human factors (see Chapter 15) is an applied area that has been growing rapidly.
The majority of members of the Human Factors and Ergonomics Society have been
trained as psychologists. Yet a past editor of their journal, Human Factors, himself a
psychologist, believes that the discipline of human factors in 10 years will be “more
a profession and less a science, particularly a psychological science. It will continue
to produce research, but of an increasingly problem-specifi c nature. . . . What con-
tinues to worry me, however, is how an increasingly professional discipline is going
to bridge the gap between science and practice as the scope of the science becomes
wider and the number of true scientists in that discipline becomes smaller” (Howell,
1994, p. 5). In the domain of medical research, there is similar concern about bridging
the gap between basic and applied research. Therefore, in 2006 the National Institutes
of Health launched a new program to promote research aimed at translating basic
laboratory discoveries into practical applications.
The choice between Cartesian and Baconian approaches to science is one that ul-
timately will not be decided by scientists. It will be decided by funding decisions made
in the private and public sectors as to what criteria are most appropriate for evaluat-
ing scientifi c work. But all of us, scientists and nonscientists alike, will be profoundly
affected by this choice.
Although the division of research into basic and applied categories is common, a far
more important distinction is between good and bad research. The principles and practices

C H A P T E R 1 EXPLANATION IN SCIENTIFIC PSYCHOLOGY 21
covered in this text apply with equal force to basic and applied research. You can and
should use them to evaluate all the psychological research you encounter, whether as a
student, a professional psychologist, or an educated person reading the daily newspaper.
Are Experiments Too Far from Real Life? Students of psychology typically de-
mand a higher level of relevance in their psychology courses than they expect from
other sciences. Students who are not at all dismayed that their course in introductory
physics did not enable them to repair their automobile are often disturbed that their
course in introductory psychology did not give them a better insight into their own
motivations, did not cure their neuroses, and failed to show them how to gain eternal
happiness. If you did not fi nd such information in introductory psychology, we doubt
that you will fi nd it in this text either. If this seems unfair, read on.
The data that psychologists gather may at fi rst seem unimportant, because an im-
mediate relationship between basic psychological research and pressing social or per-
sonal problems may be diffi cult to establish. It is natural then to doubt the importance
of certain types of research and to wonder why the federal government, through vari-
ous agencies, is funding researchers to watch rats press bars or run through mazes.
The diffi culty, however, is not with the research but with the expectations as to
how “useful” research should be conducted. As noted by Sidman (1960), people ex-
pect progress to occur by the establishment of laboratory situations that are analogous
to real-life situations: “In order to study psychosis in animals we must learn how to
make animals psychotic.” This is off the mark. The psychologist tries to understand the
underlying processes rather than the physical situations that produce these processes.
The physical situations in the real world and the laboratory need not be at all similar,
provided that the same processes are occurring.
Suppose we would like to know why airplane accidents occur or, more specifi -
cally, what the relationship is between airplane accidents and failure of attention on the
part of the pilot and/or the air traffi c controller. A basic researcher might approach this
problem by having college sophomores sit in front of several lights that turn on in rapid
succession. The sophomore has to press a key as each light is illuminated. This proba-
bly seems somewhat removed from midair collisions of aircraft. Yet although the physi-
cal situations are quite different, the processes are similar. Pressing a key is an index of
attention (see Chapter 8). Psychologists can overload the human operator by presenting
lights that blink faster than he or she can respond. Thus, this simple physical situa-
tion in a laboratory allows the psychologist to study failure of attention in a carefully
controlled environment. In addition to the obvious safety benefi ts of studying attention
without having to crash airplanes, there are many scientifi c advantages to the laboratory
environment (see Chapter 3). Because failures of attention are responsible for many
kinds of industrial accidents (DeGreene, 1970, Chapters 7 and 15), studies of attention
by use of lights and buttons can lead to improvements outside the laboratory.
By the same token, establishing similar physical situations does not guarantee
similarity of processes. One can easily train a rat to pick up coins in its mouth and
bury them in its cage. But this does not necessarily mean that the “miserly” rat and the
miserly human who keeps coins under his or her mattress do so because the same
psychological processes are controlling their behaviors.
We should not only be concerned with the psychological processes that may
generalize from the laboratory to an application but also be aware of two important
reasons for doing research, the purpose of which (at least initially) may not be directly
22 P A R T 1 FUNDAMENTALS OF RESEARCH
related to practical affairs (Mook, 1983). One reason that basic research aids understand-
ing is that it often demonstrates what can happen. Thus, under controlled conditions,
scientists can determine whether social loafi ng does occur. Furthermore, the laboratory
affords an opportunity to determine the characteristics of social loafi ng more clearly
than does the workplace, where a number of uncontrolled factors, such as salary and
job security, could mask or alter the effects of social loafi ng (see Chapter 3).
A second reason for the value of basic research is that the fi ndings from a control-
led, laboratory setting may have more force than similar fi ndings obtained in a real-life
setting. Showing that the human operator can be overloaded in a relatively nonstressful
laboratory task suggests that attentional factors are crucial for performance; individuals
could be even more likely to be overloaded under the stressful conditions of piloting
large passenger planes in crowded airspaces.
Of course, if a researcher wants to test a theoretical prediction or apply a laboratory
result in an applied setting, then real-life tests will be necessary. Installing a way of assess-
ing individual performance to reduce social loafi ng in a group manufacturing situation
without fi rst testing its applicability in that setting would be foolhardy. The moral, then,
is that the researcher needs to be concerned with the goal of the experiments. The re-
searcher or the evaluator of a piece of research should consider well that goal.
Neither the practice nor the use of science is easy. The benefi ts that can be derived
from scientifi c knowledge and understanding depend on critical and well-informed
citizens and scientists. Your involvement with a career, a family, and social affairs will
be determined partially by scientifi c fi ndings. You must be in a position to evaluate
those fi ndings accurately and accept those that seem most reliable and valid. Unless
you plan to hibernate or drop out of society in some other way, you are going to be
affected by psychological research. As a citizen, you will be a consumer of the results
of psychological research, and we hope that the material discussed in this book will
help to make you an intelligent consumer.
Some of you, we hope, will become scientists. We also hope that some of you
budding scientists will focus on why people think and act as they do. We wish you
future scientists good fortune. Your scientifi c career will be exciting, and we hope
that your endeavors will be positively infl uenced by the principles of psychological
research presented herein.
▼ Summary
1. Scientifi c psychology is concerned with the meth-
ods and techniques used to understand why
people think and act as they do. This curiosity
may be satisfi ed by basic or applied research,
which usually go hand in hand to provide
understanding.
2. Our beliefs are often established by the method
of authority, the method of tenacity, or the a
priori method. The scientifi c method offers
advantages over these other methods because
it relies on systematic observation and is self-
correcting.
3. Scientists use both inductive and deductive rea son ing
to arrive at explanations of thought and action.
4. Gaggles of generalizations produce hordes of
hypotheses.
5. A theory organizes sets of data and generates pre-
dictions for new situations in which data have not
been obtained. A good theory is parsimonious,
precise, testable, and fi ts the data it explains.
6. Laboratory research is concerned with the pro cesses
that govern behavior and with show ing the condi-
tions under which certain psychological processes
can be observed.

C H A P T E R 1 EXPLANATION IN SCIENTIFIC PSYCHOLOGY 23
▼ DISCUSSION QUESTIONS
1. Make a list of fi ve statements that might be con-
sidered true. Include some controversial statements
(for example, men have lower IQs than women), as
well as some you are sure are correct. Survey some
of your friends by asking if they agree with these
statements. Then, ask their justifi cations for their
opinions. Classify their justifi cations into one of the
methods of fi xing beliefs discussed in this chapter.
2. Compare and contrast inductive and deductive ap-
proaches to science. Clarify your answers by refer-
ring to at least one branch of science outside of
experimental psychology.
3. Discuss social loafi ng research from the standpoint
of falsifi ability of theory.
4. Is it necessary (or even desirable) for experimental
psychologists to justify their research in terms of
applied benefi ts to society?
5. Read this article: Skinner, B. F. (1956). A case
his tory in scientifi c method. American Psycholo-
gist, 11, 221–233. Analyze Skinner’s views from the
standpoint of the issues discussed in this chapter.
WEB CONNECTIONS
Explore the step-by-step presentation of “What is Science? Ways of Thinking about
the World” on The Wadsworth Psychology Resource Center, Statistics and Research
Methods activities at:
http://academic.cengage.com/psychology/workshops
Two excellent general purpose websites are:
http://www.apa.org
http://www.psychologicalscience.org
▼ KEY TERMS
a priori method
applied research
authority
basic research
data
deduction
description
determinism
diffusion of responsibility
empirical approach
experimentation
explanation
falsifi ability view
generalization
hypothesis
induction
intervening variables
method of authority
method of tenacity
observation
organization
parsimony
precision
prediction
scientifi c method
self-correcting
social loafi ng
tenacity
testability
theory

NATURALIST IC OBSERVATION
What Do We Observe?
Reactivity
The Case Study
Survey Research
Advantages and Disadvantages of Naturalistic Observations
THE RELATIONAL APPROACH
Contingency Research
Correlational Research
The Correlation Coeffi cient
Complex Correlational Procedures
Cause: A Note
SUMMARY
KEY TERMS
DISCUSSION QUESTIONS
WEB CONNECTIONS
C H A P T E R 2
RESEARCH TECHNIQUES: OBSERVATION AND CORRELATION

Science is perhaps the only intellectual enterprise that builds cumulatively. From a
scientifi c perspective, we know more about the world today than people have known
at any other time in history. On the other hand, literature, art, and philosophy may
be different today than they were in ancient Greece, but we probably cannot say that
these disciplines are in a better state or more accurately represent the world.
One primary reason that science cumulates is the fact that scientists strive for
the most accurate observation possible of the world. Science is self-correcting in that
theories and hypotheses are put forward that allow prediction about what should hap-
pen under specifi ed conditions, and then these ideas are tested` by comparing the
predictions to carefully collected observations. When the facts differ consistently and
drastically from the predictions, it is necessary to modify or abandon our theoretical
conceptions. Much of the scientifi c enterprise is concerned with observation: the col-
lection of data on some particular aspect of the world.
In this chapter, we discuss several nonexperimental methods of gathering psy-
chological data. One such method is naturalistic observation, which is the most
obvious and perhaps the most venerable way of gathering data. Many people, such as
birdwatchers, are amateur naturalists, but scientifi c naturalists, as we will see, are more
systematic in their observations. For example, male blue-throated hummingbirds have
songs that consist of notes organized into fi ve song units; males in a particular area
tend to sing the same song units (Ficken et al., 2000).
Another way of gathering information is a case study, which usually involves the
detailed examination of one individual, but it may also involve a comparison of a small
number of individuals. One recent case revealed that when K. R., a thirty-year-old
mother of four, came to therapy, she had various counting rituals that severely ham-
pered daily activities (Oltmanns et al., 2006). During grocery shopping, for example,
K. R. believed that if she selected one of the initial four items on a shelf, then one of her
children would suffer dire consequences. She believed that selecting the second box of
cereal would result in a disaster happening to her second child, selecting the third box
would hurt her third child, and so on.
Similar to the case study is the survey. Instead of small numbers of people, sur-
veys gather detailed, self-reported information from a large number of individuals. An
interesting example of a large-scale sample is the 2000 National Annenberg Election
Survey (Waldman, 2004), which is based on detailed telephone interviews of a random
sample of 58,373 people. In an analysis of a portion of the survey data, Moy, Xenos, and
Hess (2005) found that the appearance of political candidates on late-night television
Scientifi c observation does not differ from everyday observation by being infal-
lible although it is quantitatively less fallible than ordinary observation. Rather,
it differs from everyday observation in that the scientist gradually uncovers
his previous errors and corrects them. . . . Indeed, the history of psychol-
ogy as a science has been the development of procedural and instrumental
aids that gradually eliminate or correct for biases and distortions in making
observations. (RAY HYMAN)

26 P A R T 1 FUNDAMENTALS OF RESEARCH
affected the attitudes of the viewers toward the candidates. Following George W. Bush’s
appearance on the Late Show with David Letterman, for example, Moy and her associ-
ates found that viewers of Letterman had higher ratings of how much Bush cares for
“people just like me” than did nonviewers of late-night television.
The descriptive information gathered by the procedures just outlined are often
combined in various ways so that predictions about a person’s activities are possible.
This attempt at prediction is a correlational technique. One example of that proce-
dure reveals that a person’s confi dence in his or her ability to identify a criminal cor-
rectly does not predict how well she or he can pick the criminal out of a police lineup
(Cutler & Penrod, 1989).
As the preceding results indicate, the observational and correlational methods can
yield interesting data about interesting phenomena. We examine these methods in
some detail, showing both their strengths and weaknesses as ways of determining why
people and animals think and act as they do.
▼ NATURALISTIC OBSERVATION
As we all know, observers are fallible. Seeing should not be believing—at least not
always. Often our perceptions fool us, as seen by the way we perceive the optical
illusion in Figure 2.1. We have all seen magicians perform seemingly impossible feats
before our eyes that we knew were being accomplished by natural means. Such tricks
21 3 4 5 6 7 8 9 10
(a)
(b)
▼ FIGURE 2.1
A Visual Illusion. (a) The Müller-Lyer illusion. The vertical lines are the same length but appear unequal due to the different directions of the fi ns in the two cases. (b) The illusion apparently distorts even an objective measuring device, the ruler. But close exami-nation indicates that the ruler is not really distorted and that the lines are of equal length. (Taken from R. L. Gregory, 1970, pp. 80–81.)

C H A P T E R 2 RESEARCH TECHNIQUES: OBSERVATION AND CORRELATION 27
demonstrate that direct perceptions can be inaccurate if we are not careful, and some-
times even if we are.
Scientists, being human, also commit errors of observation. Essentially, the research
techniques employed by scientists—including logic, use of complicated apparatus, con-
trolled conditions, and so on—attempt to guard against errors of perception and to
ensure that observations refl ect the state of nature as accurately as possible. Even with
our best methods and most careful techniques of observation, however, we can only ap-
proximate this ideal. Nevertheless, naturalistic observation as a research method differs
from casual observation of the world. The work of Ginsburg and Miller (1982) on risk
taking in boys and girls shows how prolonged careful unobtrusive observations can pay
off. Most people would agree that young boys seem to be more daring than girls.
Is this an accurate observation, or are casual observers merely confi rming general
stereotypes? Ginsburg and Miller naturally observed nearly fi ve hundred children up
to eleven years old in a zoo as they fed animals, petted them, had an opportunity to
ride an elephant, and so on. Two independent observers noted the frequency with
which boys and girls engaged in these challenging (“risky”) activities. Boys, especially
the older ones, were more likely to engage in the risky activities than girls. Getting fre-
quency counts of specifi c behaviors in specifi c situations by two observers bolsters the
conclusion from casual observation that boys are more daring than girls. This research,
however, does not provide information as to why this is the case.
Miller (1977) enumerated several important roles that naturalistic observation can
play in psychology. Miller suggests that observation provides a major part of the
database that can lead to subsequent, more highly controlled research. Naturalistic
observation describes the thoughts and behaviors of organisms, which is a necessary
fi rst step in understanding. A familiar example is Harlow’s (1958) work on mother love
in infants, which Blum (2002) describes in detail. Prior to his experiments, Harlow
needed to know what behaviors infant monkeys exhibited; he also needed to know
some of the things infant monkeys seemed to like (their soft blankets) and dislike
(the wire fl oor of the cage). With this background information, Harlow could attempt
to explain the behavior through experimentation. Likewise, Pytte, Rusch, and Ficken
(2003) followed up their earlier observations of hummingbird songs. They varied the
background noise present in the environment of blue-throated hummingbirds, and
the experiments showed that the loudness of the birds’ songs increases with the loud-
ness of the background. Since such experiments would have been unlikely without
the prior observational work of Ficken and her associates, we should not view ob-
servation as somehow secondary or subordinate to experimentation because it lacks
control. As the previous examples illustrate, observation can provide the basis for
experimentation.
In making scientifi c observations, we confront two basic problems that threaten the
validity or soundness of the observations. (These problems can plague experimentation
as well, which we examine later.) One problem has to do with delimiting the choice
of behaviors to observe. Human observers have a fi nite capacity to perceive and think
about events. Although most of us can walk and chew gum at the same time, most of us
cannot attend to and remember twenty different behaviors occurring over short periods.
Thus, some boundary on the range of behaviors must determine what we plan to observe.
We must choose the behaviors critical to the problem we study. The second problem
concerns the participant’s reaction to being observed. This problem, called reactivity,
presents problems in conducting any sort of psychological research.

28 P A R T 1 FUNDAMENTALS OF RESEARCH
What Do We Observe?
How do we delimit the range of behaviors to be studied? Part of this answer seems
straightforward. If we are interested in human nonverbal communication, we observe
human nonverbal communication. However, this is not necessarily easy to do. In the
fi rst place, nonverbal communication is highly complex, which means that we observ-
ers are faced with the same problem we started out trying to avoid: Which nonverbal
behaviors do we observe? In the second place, examining nonverbal behaviors presup-
poses that we already know some of the behaviors to observe. Obviously, we do not
enter a research project devoid of all knowledge, but neither do we start out with all
the answers. We usually begin a series of observational studies with some behaviors in
mind, and then successive projects rely on previous data to refi ne and delimit the fi eld
of inquiry. Some examples will illustrate the refi nement procedure.
An Ethogram Naturalistic research of interest to psychologists seems most prevalent
in the area of ethology, the study of naturally occurring behavior (often in the wild).
Simply observing the behavior of animals or humans permits a global impression of the
characteristics and range of behavior. However, one may soon desire more systematic
observation. One way ethologists make more systematic observations is by identifying
different categories of experience for the organism under study and then recording the
number of times the organism engages in each behavior. These behaviors can be di-
vided into large units, such as mating, grooming, sleeping, fi ghting, eating, and so on, or
into much smaller units. For example, an ethogram of the various behaviors involved
in the courtship pattern of a fi sh, the orange chromide, is shown in Figure 2.2. (An
ethogram is a relatively complete inventory of the specifi c behaviors performed by one
species of animal.) By counting the number of times that any specifi c behavior occurs,
ethologists can begin to get some idea of the signifi cance of the behavior.
Ficken and associates (2000) characterized the songs of blue-throated humming-
birds. They also developed an ethogram of when hummingbirds would sing. Clearly,
the researchers had to be able to record and analyze the songs. This is not a trivial
undertaking.
Obtaining accurate records in a natural habitat is diffi cult. For example, continuous
vigilance usually is impossible, even with automatic recording apparatus. Additionally,
both the apparatus and the observers may result in reactivity, which would spoil the
measures. These are just a few of the challenges associated with naturalistic observa-
tion of animals.
Applying similar techniques to human behavior can be even more diffi cult, be-
cause people do not usually appreciate having their every action noted by a curious
scientist. Barker and his associates (for example, Barker & Wright, 1951; Barker, 1968)
pioneered the application of naturalistic observation to humans in a number of set-
tings, and the work by Ginsburg and Miller (1982) on risk taking can be considered
an example of human ethology. Additional examples of naturalistic observations of
humans follow.
Flashing Eyebrows The famous ethologist of human behavior Eibl-Eibesfeldt (for
example, 1970, 1972) has done a substantial amount of fi eld research on human facial
expressions. He and his colleagues traveled around the world taking pictures of facial

C H A P T E R 2 RESEARCH TECHNIQUES: OBSERVATION AND CORRELATION 29
expressions in a variety of contexts. Careful examination of the expressions indicated
that many are similar across cultures and some are not. In the process of examining fa-
cial expressions associated with people greeting each other, Eibl-Eibesfeldt discovered
that most humans give a brief eyebrow fl ash. He went on to examine this phenomenon
in detail.
The eyebrow fl ash is a brief (one-sixth of a second) raising of the eyebrows, ac-
companied by a slight smile and a quick nod of the head. The fl ash has been observed
in people of many cultures, including Bushmen, Balinese, and Europeans, but some
cultures differ in how they use it. The Japanese do not use the fl ash, because in Japan
it is considered suggestive or indecent. Furthermore, Eibl-Eibesfeldt found that the fl ash
occurred in other circumstances, such as in fl irting and acknowledging a gift or service
(that is, as a kind of thank you), in addition to greeting.
We can see from his work that previous observations suggested additional ones for
Eibl-Eibesfeldt, and by delimiting his range of inquiry to fl ashing eyebrows, he could
gather substantial information about a common human behavior.
Text not available due to copyright restrictions

30 P A R T 1 FUNDAMENTALS OF RESEARCH
Reactivity
Two general methods are available to try to guard against the participants’ reactions
ruining observations: (1) unobtrusive observations and (2) unobstrusive measures
(Webb et al., 1966). We consider these in turn.
Unobtrusive Observations Imagine you are walking down a street in your
hometown.
Occasionally you greet a friend (perhaps with a handshake, perhaps with an eye-
brow fl ash). As your walk continues, a man with a large camera approaches and pro-
ceeds to take a moving picture of you every time you greet one of your friends. How
are you likely to react to this attention? Quite likely, your mode of greeting people will
change dramatically. (Have you ever noticed how spectators behave at sporting events
when they know the television camera is on them?) Eibl-Eibesfeldt guarded against par-
ticipant reactivity in his research by using a camera with a special sideways lens. This
lens permitted him to aim the camera away from the subject 90 degrees; presumably,
the subject would think that Eibl-Eibesfeldt was photographing something else. Thus,
the subject would not react abnormally to the presence of the observer and his camera;
instead, the subject would act naturally, which is what Eibl-Eibesfeldt intended. The
special camera lens allowed the researcher to observe without intruding on the subject.
We say that Eibl-Eibesfeldt used an unobtrusive observation technique.
In general, unobtrusive observations of subjects are likely to reveal more natural be-
havior than those in which the subjects are aware of being observed. In studying animals,
researchers use unobtrusive observations whenever possible. Sometimes, however, either
the subjects themselves, the terrain, or some other aspect of the project demands close
contact. In these situations, participant observation often provides a solution. As the
phrase suggests, the observer becomes an active (and intrusive) participant in the lives of
the subjects being observed. For example, Fossey (1972) spent a great amount of time ob-
serving the mountain gorilla. The mountain gorilla lives in central Africa, and its habitat is
threatened by human beings who are moving into that area. The mountain gorilla’s natu-
ral habitat is the mountainous rainforest; this makes long-range, unobtrusive spying out
of the question. Fossey was particularly concerned with the free-ranging behavior of the
gorillas, so she decided to become a participant observer. This was diffi cult, because the
gorillas are not tame. She had to act like a gorilla in front of the gorillas so that they would
become accustomed to her presence. She mimicked aspects of the animal’s behavior, such
as eating, grooming, and making weird gorilla-like vocalizations. As she said, “One feels
like a fool thumping one’s chest rhythmically or sitting about pretending to munch on a
stalk of wild celery as though it were the most delectable morsel in the world. But the
gorillas have responded favorably” (p. 211). It took several months for Fossey to gain the
confi dence of the gorillas, and she continued to live with and study the gorillas until her
death in 1986. How would you like to act like a gorilla for ten or fi fteen years?
Reactivity does not always result from observation, because not all forms of obser-
vation seem to result in reactivity. Substantial observations of daily family interaction
by means of audiotape recorders indicates that the families respond the same whether
or not they know the audio recorder has been activated (Jacob et al., 1994). One could
imagine, however, that a more intrusive observational procedure that combined both
audio and video recording would likely cause the families to react unnaturally.

C H A P T E R 2 RESEARCH TECHNIQUES: OBSERVATION AND CORRELATION 31
Unobtrusive Measures Unobtrusive measures, in contrast to unobtrusive observa-
tions, consist of indirect “observations” of behavior. Unobtrusive measures are indirect
because it is the result of behavior, not the behavior itself, that is being studied. Thus,
instead of observing behavior directly, we examine it after the fact by looking at what
the behavior has accomplished. Instead of observing a student’s studying activities, we
examine his or her transcript. Instead of living with the gorillas, we look at their effect
on the environment. The critical difference, then, between unobtrusive observation and
unobtrusive measures rests on whether the subject and the observer are in the same
place at the same time. When the researcher is present, he or she attempts to observe
unobtrusively the subject’s behavior. When absent, he or she studies the product or
result of the behavior.
Obviously, unobtrusive measures are not suitable for all questions being investi-
gated (an unobtrusive measure of an eyebrow fl ash might be diffi cult), but for some
research problems, these measures are not merely good—they are the only ones
that are feasible. Consider the question of graffi ti in public restrooms. Who does
it? What is the usual subject area? A number of serious ethical questions (ethics are
discussed in Chapter 4) would be raised if a researcher stood around in restrooms
observing the patrons.
However, the graffi ti itself can be examined and can provide substantial informa-
tion. Kinsey, Pomeroy, and Martin (1953) discovered that graffi ti in men’s restrooms
was more erotic than graffi ti in women’s restrooms. Furthermore, they found more
graffi ti in men’s rooms than in women’s rooms.
The Case Study
One of the most venerable forms of inquiry in psychology is the case study. Freud’s
psychoanalytic theory arose from his observations and refl ections on individual cases. In
general, a case study is the intensive investigation of a single case of some sort, whether
of a neurotic patient, a spiritual medium, or a group awaiting the end of the world.
An interesting case study of this last instance was provided by Festinger, Riecken, and
Schachter (1956), who infi ltrated a small group of persons who were indeed awaiting
the end of the world. The members thought themselves to be in contact with beings
from another planet, who had communicated to one member that the destruction of the
earth was near. The group was expecting to be rescued by spacecraft before the catas-
trophe. Festinger and his colleagues were especially interested in the reactions of the
group when the calamity did not occur. They observed that for many of the members of
the group, belief in its delusional system actually increased rather than decreased after
the predicted date of catastrophe had passed.
The case study is a type of naturalistic observation and is subject to the advantages
and disadvantages of that method. One chief disadvantage is that case studies usually
do not allow fi rm inferences to be made about what causes what. Typically, all one can
do is describe the course of events. Often, however, case studies provide implicit com-
parisons that allow the researcher to make some reasonable guesses as to what causes
what. The case study of K. R., the compulsive counter who was described earlier,
revealed an exceptionally stern upbringing that involved rigid orderliness and severe
punishments for supposed sins and misdeeds. K. R.’s current family life seemed beyond

32 P A R T 1 FUNDAMENTALS OF RESEARCH
her control—her children were unruly, and her husband suffered from a disabling ill-
ness. The therapist concluded that her rituals were an attempt to gain control and to be
orderly (Oltmanns et al., 2006). We should be cautious about the therapist’s assertion,
however, because we do not know what kind of person K. R. would have become had
she had a more permissive childhood and a less stressful family situation.
A type of case study that best attempts to minimize the diffi culties of making infer-
ences is the deviant-case analysis. Here, the researcher considers two cases that bear
a number of similarities and yet differ in outcome. For example, one twin brother might
become schizophrenic and the other not. The researcher attempts to pinpoint, through
a careful comparison of the two cases, the factors that are responsible for the difference
in outcome. Such comparisons usually cannot be made because comparable cases that
differ in only one factor are rare. Furthermore, any conclusions, even from this method,
cannot really be considered fi rm or well established because the researcher can never
be certain that he or she has identifi ed the critical causes in the differing outcomes.
These cautions notwithstanding, let us consider a case study reported by Butters
and Cermak (1986) that illustrates how judicious use of the procedure can provide
valuable information. The study is about P. Z., a world-famous scientist who suffered
from severe memory loss (amnesia) in 1981 after long-term alcohol abuse resulted in
a disease called Korsakoff’s syndrome. He had extreme diffi culty both in remembering
new information and in recollecting past events and people. The latter memory defi cit
was easy to determine, because two years prior to the onset of amnesia, P. Z. had writ-
ten his autobiography. When he was queried about the names and events mentioned
in his autobiography, he showed a drastic memory defi cit. P. Z.’s memory for these
events was compared with the retention of a colleague of similar age (the comparison
person for deviant-case analysis) who did not have a history of alcohol abuse. Since
the comparison case did not show a memory defi cit as serious as P. Z.’s, Butters and
Cermak reasoned that the long-term alcohol abuse was an important causal factor in
P. Z.’s amnesia. Furthermore, P. Z.’s memory defi cit for new information was very simi-
lar to that shown by other people with Korsakoff’s syndrome. This latter technique of
comparing the case’s behavior with that of others is essentially an experimental one,
and it will be illustrated again in Chapter 6.
Survey Research
Case studies usually involve only a few subjects, and often these individuals are not
at all representative of the population at large. P. Z., for example, was both a brilliant
scientist and an amnesiac. Often researchers want to obtain information on a large ran-
dom sample of people in a large geographic area (such as the survey about late-night
TV viewing at the beginning of the chapter), even though the amount of information
obtained from any one person is necessarily limited. Survey research is much more
common in some areas of psychology than in others. For example, this technique is
used quite frequently in industrial/organizational, clinical, and social psychology but
almost never in cognitive psychology. One advantage of survey research is that, given
the precise sampling procedures now available, a researcher can survey a relatively
small number of people to generalize well to the population at large.
Because the survey leads to results that are generally descriptive in nature,
this technique is not particularly popular with psychologists in areas with a strong

C H A P T E R 2 RESEARCH TECHNIQUES: OBSERVATION AND CORRELATION 33
experimental orientation, such as cognitive psychology or psychophysics. Neverthe-
less, clever use of the method may allow contributions to almost all areas of psychol-
ogy. For example, Lovelace and Twohig (1990) surveyed healthy elderly Americans
and found that 68 percent claimed that an inability to remember names was a vexing
memory problem. However, the majority reported that memory problems have little ef-
fect on their daily functioning. The respondents reported that they relied very strongly
on notes, lists, and other external memory aids to help them remember to do things.
Further, the elderly respondents claimed not to rely on various memory “tricks,” such
as mnemonic devices. The results reported by Lovelace and Twohig agree with other
survey data (Moscovitch, 1982) that show that compared with younger people, the
elderly are much more likely to make lists and use date books and are less likely to
resort to internal memory procedures, such as mnemonic devices. These results are
provocative, because they suggest that the elderly are aware that they may have some
memory limitations, which they try to minimize by relying on external memory aids.
Given the converging evidence from Lovelace and Twohig (1990) and Moscovitch
(1982), this seems like a plausible hypothesis. Information gained from these surveys
can provide the framework for more controlled research to test this hypothesis.
Because a researcher has to intrude on a person to obtain survey data, the possi-
bility of reactivity by the respondents is always present. Sussman and associates (1993)
used naturalistic observation to study adolescent tobacco use. Their observations led
them to conclusions different from those they derived from results of an earlier survey.
The survey indicated that tobacco use takes place in small groups, and nearly half of
those surveyed reported that group members offered them tobacco (Hahn et al., 1990).
These sorts of fi ndings led to educational programs that encourage teens to “Just Say
‘No.’” In the naturalistic observation research, which was conducted unobtrusively,
Sussman and associates noted that the adolescents frequently requested cigarettes, but
they were rarely offered. Furthermore, cigarettes were rarely offered to nonusers who
were in the groups. Thus, the possibility that tobacco use results from peer pressure, as
indicated by survey results, is contradicted in this unobtrusive observation study. From
these results Sussman and his colleagues suggested that alternatives to the “Just Say
‘No’” program ought to be explored.
Finally, recall that the survey work by Moy and her associates (2005) following
George W. Bush’s appearance on the Late Show with David Letterman found that view-
ers of Letterman had higher ratings of how much Bush cares for “people just like me”
than did nonviewers. This comparison technique is very similar to the case study work
on P. Z.’s memory, and this survey technique also provides a comparison similar to an
experiment. However, people were not assigned to be viewers or nonviewers, which
means that, as was true of the case of P. Z., the comparison is not as solid as that used
in experimentation (see below).
Advantages and Disadvantages of Naturalistic Observations
As noted earlier, naturalistic observation is extremely useful in the early stages of re-
search, when one desires simply to gain some idea of the breadth and range of the
problem of interest (Miller, 1977). It is primarily descriptive, however, and does not allow
one to infer how factors may be related. In some cases, there is no way to employ more
controlled methods of observation; therefore, only naturalistic ones are available. If you

34 P A R T 1 FUNDAMENTALS OF RESEARCH
want to know how penguins behave in their natural habitat, you simply have to observe
them there. Still, for most psychological problems, naturalistic observation is useful pri-
marily in defi ning the problem area and raising interesting questions for more controlled
study by other means, especially experimental ones. For example, the work described
earlier of Lovelace and Twohig (1990) and Moscovitch (1982) could be followed up by
more controlled methods of investigation comparing different methods of using external
memory aids in elderly subjects. Which aids work best? Another example is the case
study by Festinger and his colleagues of the group that predicted the end of the earth.
This case study helped lead to Festinger’s (1957) cognitive dissonance theory of attitude
change, which has been quite important in guiding social psychological research.
The primary problem unique to naturalistic observation is that it is simply descrip-
tive in nature and does not allow us to assess relationships among events. An investiga-
tor might note that grooming behavior in free-ranging monkeys occurs at certain times,
following fi ve different conditions (such as eating). If one is interested in fi nding out
which antecedent conditions are necessary to produce grooming, naturalistic observa-
tion cannot provide an answer, since it is not possible to manipulate these antecedent
conditions. For this, one needs an experiment.
Naturalistic observation sometimes produces data that are defi cient in other ways,
too. Scientifi c data should be easy to reproduce by other people using standardized
procedures if these people doubt the observations or are interested in repeating them.
Many naturalistic methods, such as the case study, do not allow reproducibility; they
are thus open to question by other investigators.
Another problem in naturalistic approaches is that of maintaining as strictly as pos-
sible a descriptive rather than an interpretive level of observation. In the study of animals,
the problem is often one of anthropomorphizing, or attributing human characteristics
to animals. When you come home and your dog wags its tail and moves about excitedly,
it seems perfectly natural to say that it is happy to see you. But this is anthropomor-
phizing, and if one were engaged in naturalistic observation of the scene, it would be
inappropriate. Instead, one should record the overt behaviors of the dog with the least
possible attribution of underlying motives, such as happiness, sadness, or hunger.
Of course, the case studies of Freud are based entirely on just such interpreta-
tions of the facts. Besides being nonreproducible, critics charge that such cases suffer
from the possibility that if we are allowed to (1) select our data from case studies and
answers people give to the questions we ask and then (2) weave these “facts” into a
previous conceptual system of our own devising, case studies could probably be used
to “prove” any theory. (This is not to detract from the creative fl air and genius evident
in Freud’s system; he is, however, certainly open to criticism in terms of the evidence
he used as a basis of his theory.)
Pavlov reports another instance of this interpretive problem that is closer to scien-
tifi c psychology in his early research on the conditioned refl ex (see Chapter 9). When
they began to study the dog’s psychological processes, he and his coworkers discov-
ered they had a problem that had not been apparent when they had previously been
concerned only with the digestive system. The problem was severe, for they could not
agree on the observations they were making. Pavlov describes the problem of studying
conditioned refl exes:
But how is this to be studied? Taking the dog when he eats rapidly, snatches
something in his mouth, chews for a long time, it seems clear that at such a time the
C H A P T E R 2 RESEARCH TECHNIQUES: OBSERVATION AND CORRELATION 35
animal strongly desires to eat, and so rushes to the food, seizes it, and falls to eating.
He longs to eat. . . . When he eats, you see the work of the muscles alone, striving
in every way to seize the food in the mouth, to chew and to swallow it. From all this
we can say that he derives pleasure from it. . . . Now when we proceeded to explain
and analyze this, we readily adopted this trite point of view. We had to deal with
the feelings, wishes, conceptions, etc., of our animal. The results were astounding,
extraordinary; I and one of my colleagues came to irreconcilable opinions. We could
not agree, could not prove to one another which was right. . . . After this we had to
deliberate carefully. It seemed probable we were not on the right track. The more
we thought about the matter, the greater grew our conviction that it was necessary to
choose another exit. The fi rst steps were very diffi cult, but along the way of persistent,
intense, concentrated thinking I fi nally reached the fi rm ground of pure objectivity. We
absolutely prohibited ourselves (in the laboratory there was an actual fi ne imposed)
the use of such psychological expressions as the dog guessed, wanted, wished, etc.
(Pavlov, reprinted 1963, pp. 263–264)
One further problem is discussed here, although it is relevant to all types
of observation in all types of research. This is the issue of how much our concep-
tual schemes determine and bias what we “see” as the facts. Pavlov’s statement
is eloquent testimony of how diffi cult it is to establish objective methods so that
we can all see the facts in the same way. He had found it initially “astounding”
and “extraordinary” that this was so and was surprised at the elaborate precautions
needed to ensure objectivity. Philosophers of science have pointed out that our
observations are always infl uenced by our conceptions of the world—if in no other
way, at least by the particular observations we make (see, for example, Hanson,
1958, Chapter 2). “Pure objectivity,” to use Pavlov’s phrase, is quite elusive, if not
impossible. One illustration Hanson uses is that of two trained microbiologists view-
ing a stained and prepared slide through a microscope and “seeing” different things.
(As is well known, the primary thing a novice typically reports seeing in a micro-
scope is his or her own eyeball.) Objective and repeatable observation in science
is an ideal to be approximated, but we may never be completely confi dent that
we have achieved it. Certainly, however, we must make every possible step
toward this ideal, which is what much of the technical paraphernalia of science is
concerned with.
The problem of observations being unduly infl uenced by expectations is not auto-
matically overcome by the use of the technical equipment of hard science, however, as
is evident in an illustration cited by Hyman (1964, p. 38). In 1902, shortly after X rays
were discovered, the eminent French physicist R. P. Blondlot reported the discovery of
“N rays.” Other French scientists quickly repeated and confi rmed Blondlot’s discovery;
in 1904, no fewer than seventy-seven publications appeared on the topic. However, the
discovery became controversial when American, German, and Italian scientists failed to
replicate Blondlot’s fi ndings.
The American physicist R. W. Wood, failing to fi nd N rays in his own lab at Johns
Hopkins University, visited Blondlot. Blondlot displayed a card to Wood with luminous
circles painted on it. Then he turned down the room light, fi xed N rays on the card,
and pointed out to Wood that the circles increased in luminosity. When Wood said he
could see no change, Blondlot argued that this must be because Wood’s eyes were too
insensitive. Next, Wood asked if he could perform some simple tests, to which Blondlot

36 P A R T 1 FUNDAMENTALS OF RESEARCH
consented. In one case, Wood moved a lead screen repeatedly between the N rays and
the cards, while Blondlot reported the corresponding changes in luminosity of the cir-
cles on the card. (The lead shield was to prevent passage of the N rays.) Blondlot was
consistently in error, and often reported a change in luminosity when the screen had
not been moved! This and other tests clearly indicated that there was no evidence for
the existence of N rays, despite their “confi rmation” by other French scientists.
After 1909 there were no further publications on N rays. The mistake was too much
for Blondlot. He never recovered and died in disgrace some years later. We can see
from this dramatic example that even with the sophisticated apparatus of physicists,
errors of observation are possible and must be guarded against.
▼ THE RELATIONAL APPROACH
Scientists describe, relate, and experiment. Relational research attempts to determine
how two (usually) or more variables are related to each other. A variable is something
that can be measured or manipulated. Typically, relational research does not involve
manipulation of variables, so the data that are related are called ex post facto data,
which means “after the fact.” The data that are related come from naturally occurring
events and do not result from direct manipulation by the researcher. The researcher
categorizes or assess the data and probes for relationships.
Contingency Research
Contingency research is one sort of relational research in which data on two variables
are compared to see whether the values of one variable depend on the values of the
other. Suppose that you want to determine the distribution of men and women in vari-
ous major programs at your college. To examine this, you assess the frequencies with
which women and men declare major programs and enter the outcome of your results
in a contingency table. A contingency table is a tabular presentation of all combinations
of categories of two variables, which allows the relationships between the two to be ex-
amined. An example of the development of a contingency table appears in Table 2.1.
Panel A of Table 2.1 shows the number of women majoring in various departments.
More women are majoring in journalism than in any of the other departments listed. His-
tory has the fewest women majors. The number of men majors in the fi ve departments
appears in panel B. Note that more men major in history than in any other department.
Psychology has the fewest men. Panel C illustrates the entire contingency table and
adds some important information—the relative frequency of men and women majors.
The relative frequencies for each cell in the table show the percentage of men and
women in each major program. The contingency table illustrated in panel C is referred
to as a 2 3 5 contingency table, because it has two rows and fi ve columns (not including
the totals). Contingency tables require at least two rows and at least two columns. The
convention is to present the number of rows and then the number of columns in the
description. A particular row–column combination is called a cell; for example, the cell
entry indicating the percentage of women psychology majors is 74.2 percent.
The percentages in the table clearly indicate that there is a relationship between
a person’s gender and his or her choice of major at this particular college: History has

C H A P T E R 2 RESEARCH TECHNIQUES: OBSERVATION AND CORRELATION 37
proportionately more men than women majors, and the reverse is true for the other
major programs. This kind of relationship indicates a lack of independence between
gender and choice of major. If you wanted to statistically analyze the data in the table,
you would probably use a x2 test for independence, which is a statistical test often
used to determine whether the data in a contingency table are statistically signifi cant.
Calculation of this statistic is illustrated in Appendix B.
Participant reactivity can be a problem in contingency research, especially when
the participants have been interviewed or surveyed. However, not all contingency re-
search is subject to reactivity. The data presented in Table 2.1 are completely ex post
facto, so that the people who declared a particular major do not know that they have
appeared in a particular cell of a contingency table. This at fi rst may seem to be a big
factor in favor of such research. However, you should be aware that the participants’
reactivity is unknown in this particular example. The real problem is that they could
have chosen a particular major for reactive reasons (“Mom wants me to be an English
major”). There is no simple way to determine that sort of reactivity if you collate the
▼ TABLE 2.1
Development of a Contingency Table Indicating Some of the Major Programs Chosen by Men and Women at a Small Liberal Arts College
Panel A: Number of Women Majoring in Five Departments
Major Program
Biology English History Journalism Psychology
36 50 22 57 49
Panel B: Number of Men Majoring in Five Departments
Major Program
Biology English History Journalism Psychology
29 18 66 23 17
Panel C: Contingency Table of Frequency and Relative Frequency in Percentage of Women and Men Majoring in the Five Departments
Major Program
Gender Biology English History Journalism Psychology Total
Women 36 50 22 57 49 214
55.4% 73.5% 25.0% 71.3% 74.2% 58.3%
Men 29 18 66 23 17 153
44.6% 26.5% 75.0% 28.7% 25.8% 41.7%
Total 65 68 88 80 66 367
100.0% 100.0% 100.0% 100.0% 100.0% 100.0%

38 P A R T 1 FUNDAMENTALS OF RESEARCH
data from statistics prepared by someone who simply notes who majors in a particular
program. So, what often occurs in ex post facto research is that there is participant
reactivity of an unknown magnitude and an unknown source. When researchers as-
sess rather than manipulate, they often remain in the dark with regard to such possible
confounding as participant reactivity.
Correlational Research
The second sort of relational research we consider is called correlational research,
which allows the researcher to determine simultaneously the degree and direction of a
relationship with a single statistic. As is true of most contingency research, correlational
research examines variables ex post facto.
One typical example of the correlational approach is the exploration of the rela-
tionship between cigarette smoking and lung cancer. Studies in the 1950s and early
1960s consistently found a moderately high positive correlation between cigarette
smoking and lung cancer: The greater the number of cigarettes a person smoked,
the more likely that person was to have lung cancer. Knowledge of this relationship
allows predictions to be made. From the knowledge of how much someone smokes,
we can predict (though not perfectly) how likely that person is to contract cancer and
vice versa. The U.S. Surgeon General’s report in 1964, which concluded that smoking
was dangerous to health, was based almost entirely on correlational evidence. We ex-
amine some problems in interpreting correlational evidence; but fi rst, let us consider
the properties of the correlation coeffi cient itself.
The Correlation Coeffi cient
A correlation coeffi cient measures the degree and direction of the relationship
between two variables. There are several different types of correlation coeffi cients,
but almost all have in common the property that they can vary from 21.00 through
0.00 to 11.00. Commonly, they will not be one of these three fi gures, but something in
between, such as 1.72 or 2.39. The magnitude of the correlation coeffi cient indicates
the degree of relationship (larger numbers refl ecting greater relationships), and the
sign indicates the direction of the relationship, positive or negative. It is important to
put the appropriate sign in front of the correlation coeffi cient, otherwise one cannot
know which way the two variables are related, positively or negatively. It is common
practice, though, to omit the plus sign before positive correlations so that a correla-
tion of .55 would be interpreted as 1.55. It is a better practice always to include the
sign. An example of a positive correlation is the relationship between lung cancer
and smoking. As one variable increases, so does the other (though not perfectly—that
is, the correlation coeffi cient is less than 11.00). There is also a documented nega-
tive correlation between smoking and another variable, namely, grades in college.
People who smoke a lot have tended to have lower grades than those who smoke
less (Huff, 1954, p. 87).
As mentioned, several different types of correlation coeffi cients exist, and which
type is used depends on the characteristics of the variables being correlated. We con-
sider one commonly used by psychologists: Pearson’s product-moment correlation

C H A P T E R 2 RESEARCH TECHNIQUES: OBSERVATION AND CORRELATION 39
coeffi cient, or Pearson r. The calculation formula for Pearson r is presented in Ap-
pendix B. Remember that this is only one of several methods; if you actually need to
compute a correlation on some data, consult a statistics text (such as Howell, 2008) to
determine which method is appropriate for your particular case.
Imagine that we are among the bevy of psychologists who devote their careers to
the study of human memory. One of these psychologists hits on a simple, intuitive idea
concerning head size and memory, which goes like this. Information from the outside
world enters the head through the senses and is stored there. An analogy can be made
between the head (where information is stored) and other physical vessels, such as
boxes, where all kinds of things can be stored. On the basis of such analogical reason-
ing, which is common in science, the psychologist makes the following prediction from
his or her knowledge of the properties of physical containers: As the head size of a
person increases, so should the person’s memory. More things can be stored in bigger
boxes than in smaller, and similarly more information should be stored in larger heads
than in smaller ones.
This “theory” proposes a simple relationship: that as head size increases, so should
memory. A positive correlation between these two variables is predicted. A random
sample of the local population could be taken. The persons chosen could be measured
on two dimensions: head size and the number of words they can recall from a list of
thirty, presented to them once, at the rate of one word every three seconds. Three
hypothetical sets of results from ten subjects are presented in Table 2.2. For each in-
dividual, there are two measures, one of head size and the other of number of words
recalled. Also, the two types of measures need not be similar in any way to be cor-
related. They do not have to be on the same scale. Just as one can correlate head size
with number of words recalled, one could also correlate IQ with street-address number
or any two sets of numbers.
The graphical representations of the data in the three panels of Table 2.2 are pre-
sented in the three panels of Figure 2.3; head size is plotted along the horizontal X-axis
(the abscissa), and number of words recalled is plotted along the vertical Y-axis (the
▼ TABLE 2.2
Three Hypothetical Examples of Data Taken on Head Size and Recall. The examples represent (a) a positive correlation, (b) a low (near-zero) correlation, and (c) a negative correlation.
Subject(a) Head Size (cm)
Recall (words) Subject
(b) Head Size (cm)
Recall (words) Subject
(c) Head Size (cm)
Recall (words)
1 50.8 17 1 50.8 23 1 50.8 12
2 63.5 21 2 63.5 12 2 63.5 9
3 45.7 16 3 45.7 13 3 45.7 13
4 25.4 11 4 25.4 21 4 25.4 23
5 29.2 9 5 29.2 9 5 29.2 21
6 49.5 15 6 49.5 14 6 49.5 16
7 38.1 13 7 38.1 16 7 38.1 14
8 30.5 12 8 30.5 15 8 30.5 17
9 35.6 14 9 35.6 11 9 35.6 15
10 58.4 23 10 58.4 16 10 58.4 11
r 5 1.93 r 5 2.07 r 5 2.89

40 P A R T 1 FUNDAMENTALS OF RESEARCH
ordinate). The high positive correlation between head size and number of words re-
called in the (a) panel in Table 2.2 is translated into a visual representation that tilts
upward to the right, whereas the negative correlation in (c) is depicted as sloping
downward to the right. Thus, you can see how knowing a person’s score on one
variable helps predict (though not perfectly in these cases) the level of performance
on the other. So, knowing a person’s head size in the hypothetical data in (a) and
(c) helps predict recall and vice versa. This is the primary reason correlations are use-
ful: They specify the amount of relationship and allow predictions to be made. This last
statement cannot be made about the data in (b), where there is essentially a zero cor-
relation. The points are scattered about, and there is no consistent relationship, which is
just what a low Pearson r refl ects. Even in the cases where the size of the correlation is
rather large, it will not be possible to predict perfectly an individual’s score on one vari-
able given his or her position on the other. Even with a high correlation (1.93) between
head size and number of words recalled, it is still quite possible for a person with a large
head size to recall few words and vice versa. Unless the correlation is perfect (11.00 or
21.00), prediction of one score when given the other will not be perfect either.
What do you think the real correlation would be between head size and recall for a
random sample of the population at large? Although we have not actually done such a
study, we think it quite likely that it would be positive. Willerman and associates (1991)
conducted research on a related topic, the relation between brain size and intelligence,
or IQ. They found a correlation of 1.51 between brain size and IQ in a sample of forty
right-handed, Caucasian introductory psychology students. The results of recent brain
volume studies by Haier and associates (Haier, Jung, Yeo, Head & Alkire, 2004; Colom,
Jung, & Haier, 2006) demonstrate that larger volumes of brain areas are positively cor-
related with IQ, and these areas are distributed throughout the brain. Do the brain size
data mean that brain size causes differences in cognitive ability? In the next section, we
address the issue of correlation and causation.
Interpreting Correlation Coeffi cients An important warning is always given in
any discussion of correlation: The existence of even a sizable correlation implies
nothing about the existence of a causal relationship between the two variables under
▼ FIGURE 2.3
Graphical Representation of the Data in Table 2.2. These graphs show the charac-teristic pattern of (a) a high positive correlation, (b) an essentially zero correlation, and (c) a strong negative correlation.
Head Size (cm) Head Size (cm) Head Size (cm)
(a) (b) (c)
Recall (
wo
rds)
30 40 50 60 30 40 50 60 30 40 50 60
20
15
10
r = + .93 r = – .07 r = – .89

C H A P T E R 2 RESEARCH TECHNIQUES: OBSERVATION AND CORRELATION 41
consideration. Correlation does not prove causation. On the basis of a correlation
alone, one cannot say whether factor X causes factor Y, factor Y causes factor X,
or some underlying third factor causes both. Let us consider some examples. Sup-
pose we have found a correlation of 1.70 between head size and recall of words in
children. This is in general agreement with our theory that larger heads hold more in-
formation, but certainly there are other interpretations of this relationship. It could be
argued that the high positive correlation between head size and recall is mediated or
produced by some third factor underlying both, such as age. We know that children’s
heads grow as they age and that recall also improves with age. Therefore, age (or
one of its correlates) might actually be responsible for the large positive correlation
we have found between head size and number of words recalled.
In correlational studies, we cannot conclude that any one factor produces or causes
another, because there are likely to be a number of factors that vary simultaneously with
the one of interest. In an experiment, we attempt to avoid this problem by directly ma-
nipulating one factor while holding all the others constant. If we are successful in holding
other factors constant, which is very diffi cult to do, then the infl uence of the manipulated
factor on whatever we are measuring can be directly attributed to the factor of interest.
Confounding occurs when two (or more) factors are varied at the same time, so we can-
not know whether one factor, the other factor, or both operating together produce some
effect. Confounding is inherent in correlational research and leads to the interpretational
diffi culties with such research. In the example of the correlation between head size and
recall, we cannot say that variations in head size produced or caused differences in recall,
since head size was confounded with at least one other factor: age.
In other cases, the relationship between two factors may seem to allow a causal
interpretation, but again this is not strictly permitted. Some studies have shown a
positive correlation between the number of handguns in a geographic area and the
number of murders in that area. Proponents of gun control might use this evidence to
support the contention that an increased number of guns leads to (causes, produces)
more murders, but this is not the only plausible interpretation. People in high-crime
neighborhoods might be buying handguns to protect themselves. Finally, a third factor,
such as socioeconomic class, could mediate both. We can see, therefore, that no causal
conclusion is justifi ed simply on the basis of a moderate or even a high correlation.
Because correlations can be calculated between any two sets of scores, even very
high correlations can be accidental and not linked to one another at all. There may
be a very high correlation between the number of preachers and the number of por-
nographic movies produced each year since 1950, with both being on the increase. It
would take an unusual theory to relate these two in a causal manner.
A high degree of correlation is given greater weight in cases in which obvious
competing explanations (from confounding factors) seem less plausible. Also, more
weight is given to a high correlation when there is converging evidence from a number
of independent studies, an underlying mechanism is identifi ed, and the consequences
of the decision are great. The interpretation of the evidence linking cigarette smoking
to lung cancer provides a good example of these points. The early evidence regarding
this link was correlational; yet the conclusion was drawn (over the protests of cigarette
manufacturers) in the 1964 U.S. Surgeon General’s report that cigarettes were likely to
lead to or cause cancer. This eventually led to warnings on cigarette packages and a
ban on advertising cigarettes on television, among other things. The correlation was
taken as indicative of a causal relationship, probably because competing hypotheses

42 P A R T 1 FUNDAMENTALS OF RESEARCH
seemed implausible. It seems unlikely, for example, that having lung cancer causes one
to smoke more cigarettes (to soothe the lungs?). Furthermore, the smoking–cancer cor-
relation was demonstrated in a number of independent studies (converging evidence),
and the consequences of declaring a causal relationship between the two were great
(prevention of additional deaths due to lung cancer). Finally, the mechanism underly-
ing the smoking–cancer correlation was fairly obvious and straightforward (malignant
cell production from long-term inhalation of a noxious substance).
All these arguments notwithstanding, the possibility remains that some underlying
third factor (such as anxiety) produces the relationship. In fact, Eysenck and Eaves
(1981) have argued that the correlation between lung cancer and smoking in humans
is produced by personality differences. Certain personality types, according to Eysenck
and Eaves, are more likely to smoke and also to get lung cancer. Thus, they argue that
the smoking–cancer correlation does not imply causation. Because the link between
cigarette smoking and lung cancer has now been established by experimental studies
with nonhuman animals, most scientists disagree with the view of Eysenck and Eaves.
As a fi nal example of the pitfalls of the correlational approach, consider the nega-
tive relationship mentioned previously between cigarette smoking and grades. More
smoking has been related to poorer grades. Does smoking cause poorer grades? This
seems unlikely, and certainly there are ready alternative interpretations. Students with
poor grades may be more anxious and thus smoke more, or more sociable students
may smoke more and study less, and so on. As is true for the observational method, the
correlational method is very useful for suggesting possible relationships and directing
further inquiry, but it is not useful for establishing direct causal relationships.
The correlational method is superior to the observational method, because the degree
of relation between two variables can be precisely stated and thus predictions can be
made about the (approximate) value of one variable if the value of the other is known.
Low Correlations: A Caution If high correlations cannot be interpreted as evidence
for some sort of causal relationship, one might think it should at least be possible to
rule out a causative relationship between two variables if their correlation is very low,
approaching zero. If the correlation between head size and recall had been 2.02,
would this have ruled out our theory that greater head size leads to better recall? Or
if the correlation between smoking and lung cancer had been 1.08, should we have
abandoned the idea that they are causally related? The answer is sometimes, under
certain conditions. Other factors can cause low or zero correlations and may mask an
actual relationship.
One common problem is that of restriction of range. For a meaningful correlation
coeffi cient to be calculated, there must be rather great differences among the scores in
each of the variables of interest; there must be a certain amount of spread or variability
in the numbers. If all the head sizes were the same in the panels of Table 2.2 and the
recall scores varied, the correlation between the two would be zero. (You can work it
out yourself using Equation B.5 in Appendix B.) If we looked only at the correlation
between head size and recall in college students, it might be quite low, because the
differences in head size and recall among college students might not be very great,
compared with the population at large. This could happen even though there might be
a positive (or negative) correlation between the two variables if head size were sampled
over a wider range. The problem of restricted range can produce a low correlation, even
when there is an actual correlation present between two variables.

C H A P T E R 2 RESEARCH TECHNIQUES: OBSERVATION AND CORRELATION 43
The problem of restricted range can arise in unexpected places. Consider the prob-
lem of predicting success in college from SAT I scores at a college with strict admission
standards. Subtest scores can range from 200 to 800, with a mean (average) performance
slightly below 500. Imagine the mean scores at our hypothetical college are 800 on each
subtest. The admissions offi cer computes a correlation between combined SAT scores and
freshman grades and fi nds one of 1.00. Her conclusion is that SAT scores should not be
used to predict grades in college. The problem, however, is that the SAT scores are from
a very restricted range, specifi cally all the same. Since people with low scores are not
admitted to the college, the restricted range problem is probably a factor here, or in any
situation involving a limited sample of participants with homogeneous characteristics.
This example, in which all the scores on one variable are the same, is obviously
fi ctional. Let us look at a real example. Bridgeman, McCamley-Jenkins, and Ervin (2000)
looked at the correlation between SAT I scores and freshman grades both collectively and
individually at twenty-three colleges. When they adjusted scores for restrictions in range,
they found higher average SAT I scores predicted freshman grades somewhat better than
lower average SAT I scores. The reason for this result is diffi cult to determine, but it might
arise from the fact that grades receive higher emphasis at the more selective schools.
Because psychologists often use homogeneous populations such as college students, the
restricted-range problems must be carefully considered in interpreting correlations.
A fi nal problem in interpreting low correlations is that one must be certain that the
assumptions underlying the use of a particular correlation coeffi cient have been met.
Otherwise, its use may well be inappropriate and lead to spuriously low estimates of
relationship. These have not been discussed here, but it is imperative to check on these
assumptions in a statistics book before employing Pearson r or any other correlation
coeffi cient. For example, one assumption underlying Pearson r is that the relationship
between the two variables is linear (can be described by a straight line) rather than
curvilinear, as in the hypothetical (but plausible) relationship in Figure 2.4 between age
and long-term memory. At very young ages, the line is fl at; then it increases between
▼ FIGURE 2.4
A Hypothetical Figure Depict-ing a Curvilinear Relationship Between Long-Term Memory and Age. Although memory is relat-ed to age in a systematic fashion and one could predict recall by knowing age, Pearson r would be quite low, since the relationship is not linear.
Age (years)
Mem
ory
(re
call o
f w
ord
s)
10 20 30 40 50 60 70 80
18
16
14
12
10
8
6
4
2
44 P A R T 1 FUNDAMENTALS OF RESEARCH
ages three and sixteen, where it again levels off until late middle age, where it drops
slightly, until very old age, where it decreases at a greater rate (Howard & Wiggs, 1993).
Thus, one can predict recall of words from a person’s age fairly well, but Pearson r will
be rather low, since the relationship between the two variables is not linear. This could,
of course, always be checked by plotting a scatter diagram, as in Figure 2.4. Low corre-
lations, then, may not refl ect that a relationship is absent but only that the assumptions
of the particular coeffi cient employed have not been met.
Complex Correlational Procedures
“Media violence poses a threat to public health inasmuch as it leads to an increase in
real-world violence and aggression” (Huesmann & Taylor, 2006, p. 393). How do we
determine whether viewing violent media causes aggressive behavior? Eron and associ-
ates (1972) measured children’s preferences for violent TV programs and the children’s
aggressiveness as rated by their peers. For these third-graders, Eron and coworkers found
a moderate positive correlation, r 5 1.21, indicating that children who were more ag-
gressive tended to watch more violent TV (and less aggressive children tended to watch
less violent programs). How are we to interpret this positive correlation? Can we say that
watching violent programs causes aggressiveness? The answer is no. To see why this is
the case, all we have to do is to turn our causal statement around and assert that being
aggressive causes a preference for violent TV. We have no reasonable way to decide on
the direction of causality, based on this one correlation coeffi cient. Causal statements are
diffi cult, if not impossible, to make on the basis of a single correlational study. Instead,
researchers typically view correlational evidence as tentative until there is converging evi-
dence from independent studies and a compelling underlying mechanism is identifi ed.
The explanatory power of correlational research may be enhanced by examining
patterns of correlations. One technique is call the cross-lagged panel correlation
procedure, and Eron and coworkers used it in a ten-year follow-up study of the same
children in the “thirteenth” grade, as well as in a recent project that examined aggres-
sion in adults who were initially interviewed in the mid-1970s (Huesmann et al., 2003).
The designs of the two studies are summarized in the two panels of Figure 2.5.
The logic of the cross-lagged procedure is that the correlations along the diagonals
will help us understand the direction of causation between the variables. Do aggressive
people watch violent TV, or does watching violent TV produce aggression? If watching
violent TV produces aggressive behavior, we would expect a small or null relationship
between early aggression and later preference for violent TV (the dashed diagonals)
and a positive correlation between an early preference for violent TV and later aggres-
sion (the thick, solid diagonal). The underlying assumption is that if one variable causes
the other, the fi rst (watching violent TV programs) should be more strongly related to
the second (aggressiveness) later in time than when the second (effect) variable is meas-
ured at the same time as the fi rst cause. The remaining correlations are of interest and
may permit predictions, but they suffer from the inability to determine causation. In the
1972 project, 211 males were studied. Both males (152) and females (176) provided data
for the 2003 report. For the 1972 study, the correlation between a preference for violent
TV and aggression was essentially zero (r 5 -.05) in the thirteenth grade. Similarly, they
found a negligible relation between preference for violent TV in the third and thirteenth
grade (r 5 1.05). They did obtain a relation between aggressiveness in the two grades

C H A P T E R 2 RESEARCH TECHNIQUES: OBSERVATION AND CORRELATION 45
(r 5 1.38), indicating that it is a somewhat stable trait. The cross-lagged correlation be-
tween aggressiveness in the third grade and preference for violent TV in the thirteenth
was very small (r 5 1.01). On the other hand, the crucial cross-lagged correlation
between early watching of violent TV and aggression in the thirteenth grade was posi-
tive and statistically signifi cant, r 5 1.31. Similar results appeared in the 2003 report.
The important cross-lagged correlation between watching violent TV in childhood and
adult aggression was positive and signifi cant for both males (r 5 1.21) and females
▼ FIGURE 2.5
(a) The cross-lagged panel correlation design used by Eron et al. (1972), who examined the correlations between a preference for violent TV programs and aggression as rated by peers. The diagonals indicate important cross-lagged correlations. The dashed correla-tion should be small, the solid one is expected to be positive and large. (b) The design used by Huesmann et al. (2003). Preference for violent TV programs was correlated with aggression. Participants were fi rst examined at ages six to ten and then about fi fteen years later. Adult aggression was measured by self-reported incidents, ratings by another person (including spouses), and arrest records. The aggression measure is a composite one that includes physical violence as well as verbal aggression.
r = +.21
Preference for
Violent TV in
the Third Grade
Preference for
Violent TV in the
Thirteenth Grade
Aggression in
the Third Grade
Aggression in the
Thirteenth Grade
(a)
r = +.18 for males
r = +.28 for females
Preference for
Violent TV in
Childhood
Preference for
Violent TV in
Adulthood
Aggression in
Childhood
Aggression in
Adulthood
(b)

46 P A R T 1 FUNDAMENTALS OF RESEARCH
(r 5 1.19). The cross-lagged correlation between childhood aggression and adult TV
violence viewing was small for both males (r 5 1.08) and females (r 5 1.10).
The cross-lagged panel correlations in these studies, along with other complex
analyses, led Eron and colleagues to conclude that childhood exposure to violent
TV increases later aggression (also see Eron, 1982; and Huesmann et al., 1973). Of
course, many other factors contribute to aggressiveness; this is just one example
of how cross-lagged panel correlations can aid in arriving at an explanation from
correlational research. However, causal statements cannot be as strong as those
that come from experiments, because the variables have not been manipulated by
the researcher. Nevertheless, short-term increases in aggressive behavior can be pro-
duced by watching violent videos and playing violent video games (for a review, see
Bushman & Huesmann, 2006).
The general strategy of the cross-lagged procedure, then, is to obtain several cor-
relations over time and, on the basis of the size and direction of the rs, determine what
leads to what. The cross-lagged technique has the obvious drawback that the research
project may be very time consuming. Nevertheless, this method for trying to determine
causation has been used with some success in several problem areas.
Consider the work of Corrigan and associates (1994) on burnout of staff members
in a psychiatric hospital. In earlier work they had shown a signifi cant positive correla-
tion between anxiety and burnout, but they correctly noted that this correlation did
not indicate the direction of the relationship: Are anxious workers more likely to burn
out, or does worker burnout lead to anxiety? To try to answer this, they used the cross-
lagged procedure, getting measurements of anxiety and several components of burnout
eight months apart. The cross-lagged correlations indicated that burnout resulted in the
workers being more anxious, rather than the other way around. For these same work-
ers, other measures submitted to the cross-lagged procedure indicated that some of the
effects of burnout could be attributed to lack of collegial support.
In addition to cross-lagged panel correlations, several other statistical procedures
are used to try to gain a better understanding of causation in correlational research.
Some of these include partial correlation, multiple-regression analysis, and path analy-
sis. These other techniques also involve an examination of several relationships, not
just a single correlation, and are described in numerous texts (see especially Cook &
Campbell, 1979).
Cause: A Note
We have repeatedly cautioned you about incorrectly concluding that a correlation means
causation. Causation is a controversial subject in science and philosophy, and we now
consider some of the issues. Owing to the infl uence of some philosophers of science, it
has become unpopular among contemporary scientists to use the term cause, because
the philosophical implications become frightfully complicated. Thinking too long about
the cause of even a very simple event leads to an infi nite regress of causes for that event.
For this and other reasons, the term cause has dropped out of use in some circles. In
this book we muddle through using the term cause, since its meaning is always limited;
experiments lead to causal inferences because one factor is varied while all others are,
in the ideal case, held constant. Thus, we can say that whatever effect occurs in such
cases has been caused by the factor that varied.

C H A P T E R 2 RESEARCH TECHNIQUES: OBSERVATION AND CORRELATION 47
A more interesting point is that many factors that are experimentally varied are
themselves quite complicated sets of independent events, any one of which could be
the cause of an experimental effect. Time is a good example of such a variable. If we
are interested in the effects of the length of time a person studies a persuasive com-
munication on the amount the person’s attitude changes toward the communication,
we vary the amount of time people spend studying the message. Suppose we fi nd an
increase in attitude change with increases in study time when other factors are held
constant. Can we say that time has caused an increase in attitude change? In a sense,
this is true, but in a more fundamental sense, it is not. Presumably, it is some psycho-
logical process, acting over time, that causes the attitude change. It is something cor-
related with time but not time itself, because time is not a causative agent. If we leave
a bicycle out in the rain and it rusts, we do not say that time caused the rust; chemical
processes acting over time caused it.
A manipulated variable is usually composed of a number of complex and interact-
ing parts, any one or set of which may actually cause some effect. For this reason, it
is sometimes said that experiments are only controlled correlations, since the variable
manipulated is actually composed of a number of confounded parts. This is certainly
an accurate characterization in at least some cases; even so, we are far ahead of hav-
ing a simple correlation, because we know the direction of effect. Take the example
of how the amount of time spent studying a persuasive communication affects attitude
change. We could simply give the message to a number of people and let them read
it for as long as they desired. We could time this for each person and then see how
much the person’s attitude changed. If we found a positive correlation, we would
not know whether the time people spent studying the passage caused more attitude
change or whether the more that people decided to change their attitudes, the more
they studied the passage to make sure they knew the facts. There are other possible
reasons for the relationship, too. At least in the experiment on study time, we, as
researchers, can manipulate the variable of study time (rather than leaving it to the
discretion of our subjects) and hold other factors constant; therefore, we can say that
more study time leads to (determines, produces, causes) more attitude change. Be-
cause of the complex nature of a variable such as study time, we cannot be absolutely
certain that study time per se is the causal factor. For example, it may be that indi-
viduals who were allowed more time to study the persuasive communication became
more involved in the experiment, and it is this difference in personal involvement that
produces the attitude change.
Since the true causal factor (personal involvement) may be embedded within the
manipulated variable (study time), we must consider that possibility carefully in con-
ducting experiments. Nonetheless, the advantage of experiments over correlational
studies resides in the fact that we know the direction of the relationship between two
variables. Experiments also inform us (which a correlation does not) that the causal fac-
tor is at least embedded in the independent variable and not in some third, extraneous
factor. It is in this sense that experiments tell us about causes.
Before turning to the next chapter, let us conclude this discussion by pointing out
that there is no single research technique that is generally superior to all others. The
key to conducting good research is to choose the technique that is best suited to the
hypothesis being tested. If the hypothesis centers around behavior as it occurs natu-
rally (whether it is the grooming activity of primates in the jungle or graffi ti penned by
humans in public restrooms), then naturalistic observation would be more appropriate
48 P A R T 1 FUNDAMENTALS OF RESEARCH
than would a highly controlled experiment. In contrast, if the hypothesis is one that
can be reasonably investigated by conducting either a correlational study or an experi-
ment, an experiment would provide a more conclusive test of the hypothesis for all
the reasons that we have discussed in this chapter. We turn to this important scientifi c
tool—the experiment—in the next chapter.
correlated with distance of location from the equa-
tor. There are several measures of correlation, but
the one most commonly used by psychologists is
the Pearson product-moment correlation coeffi -
cient, or Pearson r.
6. The correlational approach allows one to estab-
lish the amount of relation between two variables,
which is useful for prediction. However, its primary
drawback is that it cannot establish the direction
of relationship. Even if two variables, X and Y, are
strongly related, we cannot say whether the rela-
tion is accidental, X caused Y, Y caused X, or some
third factor caused both.
7. In correlational studies, a number of factors usually
vary together, so that the results are confounded.
But correlational research is quite appropriate
in situations where it is impossible to perform
experiments—for example, in studying conditions
related to race riots.
8. When researchers discover that the correlation
between two measures is near zero, they will of-
ten conclude that there is no relation between the
measures. Before drawing such a conclusion, even
though it often is correct, researchers must deter-
mine if assumptions underlying the use of the cor-
relational measure have been met. One common
problem is restriction of range, or a lack of varia-
tion in the distribution of one set of scores. If all the
measures on one variable are about the same, the
correlation coeffi cient will approach zero, even if
there is a true relation between the measures when
a wider sampling of scores is taken.
9. Much research attempts to introduce a measure of
control into correlational studies to better determine
cause-and-effect relations. In some cases, statistical
techniques, such as the cross-lagged correlational
procedure, can be used to try to determine causes
in correlational studies.
▼ SUMMARY
1. Much of science is concerned with careful obser-
vation and study of the natural world. Two basic
techniques discussed in this chapter are naturalistic
observation and the correlational approach. Both
of these are useful scientifi c methods, but they do
not allow statements about what factors cause what
effects. They are very useful in the early stages of
exploration of a topic and in studying topics that
cannot practically or ethically be studied by experi-
mental means.
2. After delimiting the range of events to be studied,
naturalistic observation typically involves the un-
obtrusive (nonreactive) observation or unobtrusive
measurement of events naturally occurring in the
environment. Of more use to psychologists are two
reactive variants of naturalistic observation: case
studies and surveys. However, these methods of
observation have the disadvantage of not allowing
statements about how factors are related to one
another.
3. Relational research attempts to show how variables
are related to one another. Relational research is
typically ex post facto in that variables are not ma-
nipulated, but measured.
4. Contingency research tries to determine whether
the value of one variable depends on the value of
another. A typical question might be to try to de-
termine whether the choice of a major program is
related to a person’s gender. A statistical test used
to determine whether two variables are indepen-
dent is the test of independence.
5. The correlational approach allows statements of
relationship, of what goes with what. Correlations
can vary from 21.00 to 11.00, with the magni-
tude of the number refl ecting the strength of the
relationship and the sign indicating the direction.
For example, height is positively correlated with
weight, and mean yearly temperature is negatively

C H A P T E R 2 RESEARCH TECHNIQUES: OBSERVATION AND CORRELATION 49
naturalistic observation
negative correlation
participant observation
Pearson’s product-moment correlation coeffi cient,
or Pearson r
positive correlation
reactivity
relational research
restriction of range
survey
unobtrusive measures
unobtrusive observations
variable
x2 test for independence
▼ KEY TERMS
anthropomorphizing
case study
cause
confounding
contingency research
correlation coeffi cient
correlational research
correlational technique
cross-lagged panel correlation procedure
delimiting observations
deviant-case analysis
ethogram
ethology
ex post facto research
be seen if one were there. Since very few women
smoked in 1930, it also seemed best to relate the
smoking rates to male deaths. The table is an adap-
tation of Doll’s important results.
(a) Examine the results. What do the two columns
of numbers seem to show?
(b) Plot a graph relating the two measures, such
as the one shown in Figure 2.3. What does it
show?
▼ DISCUSSION QUESTIONS
1. Imagine you are a researcher just beginning a
study of how mothers interact with their babies.
You want to gain some idea as to the frequency
(1) of the mother’s performance of some act re-
garding the baby that is relatively independent
of the baby’s immediate needs, (2) of the baby’s
acting in various ways when the mother is not at-
tending to it, and (3) of the mother’s and child’s
actions when they are interacting. Make a list
of all the behaviors that you think might occur
with relatively great frequency in the three cat-
egories. This would be a type of ethogram, as
discussed in this chapter. If you observed moth-
ers and babies for fi ve hours a day over a period
of weeks, what kinds of conclusions could you
draw? What kinds of information would you want
to know but not be able to obtain from this sort
of naturalistic observation?
2. One of the fi rst pieces of evidence that linked lung
cancer with cigarette smoking was published by
Doll (1955). He tabulated the average number
of cigarettes consumed by the people of eleven
countries in 1930 and the number of deaths from
lung cancer among men in 1950. The measure of
deaths was taken twenty years after the measure of
cigarette consumption, since it seems natural that it
would take years for a cause-and-effect relation to
Doll’s Results
Country1930 Cigarette Consumption
1950 Deaths per million*
Australia 480 180
Canada 500 150
Denmark 380 170
Finland 1,100 350
Great Britain 1,100 460
Holland 490 240
Iceland 230 60
Norway 250 90
Sweden 300 110
Switzerland 510 250
United
States
1,300 200
*From lung cancer.

50 P A R T 1 FUNDAMENTALS OF RESEARCH
WEB CONNECTIONS
Explore the step-by-step presentation of “Nonexperimental approaches to
research—The Survey Method” on the Wadsworth Psychology Resource Center,
Statistics and Research Methods activities at:
http://academic.cengage.com/psychology/workshops
▼ LABORATORY RESOURCE
Chapters 1 and 2 in Langston’s manual discuss naturalistic observation and survey
research, respectively. The naturalistic observation research concerns humans defend-
ing parking spaces, and the survey research focuses on grade infl ation in college.
Langston’s manual (2002) discusses relational research in Chapter 3. The major
issue examined by Langston is the relationship between pet ownership and health.
Langston, W. (2002). Research methods laboratory manual for psychology. Pacifi c
Grove, CA: Wadsworth Group.
(c) Now calculate the exact relation between the
two variables by using the formula for Pearson
r given in Appendix B. What is the exact magni-
tude and sign of the correlation coeffi cient you
have obtained?
3. Do the analyses you performed in Question 2(c)
permit the conclusion that smoking causes lung
cancer? If the correlation coeffi cient were higher,
say, 1.95, would you be more certain of the cause-
and-effect relation? If you think these data do not
argue that smoking causes lung cancer, how else
might you explain the results?
4. Make a list of pairs of variables that you believe are
highly correlated (either positively or negatively)
but between which you think there is little chance
of a causal connection. How could you determine
whether the correlation does indicate a cause-and-
effect relation?

51
WHAT IS AN EXPERIMENT?
Advantages of Experiments
Why Experiments Are Conducted
VARIABLES
Independent Variables
Dependent Variables
Control Variables
Name the Variables
More Than One Independent Variable
More Than One Dependent Variable
EXPERIMENTAL DESIGNS
Between-Subjects Designs
Within-Subjects Designs
Small-n Designs
Mixed Designs
Control Conditions
Pitfalls
Quasi-Experiments
FROM PROBLEM TO EXPERIMENT: THE NUTS AND BOLTS
Conducting an Experiment
DATA
Obtaining Data
Analyzing Data
Reporting Data
SUMMARY
KEY TERMS
DISCUSSION QUESTIONS
WEB CONNECTIONS
C H A P T E R 3
RESEARCH TECHNIQUES: EXPERIMENTS

Imagine you are a student in a class in environmental psychology and have received
the following assignment: Go to the library and “defend” a table by preventing anyone
else from sitting down for as long as you can. You must use only nonverbal and non-
violent means to accomplish this. To carry out this task, you might wait in the crowded
library until a table is vacant, quickly sit down, and proceed to strew your books,
clothing, and other belongings all over the table in hopes that this disarray might keep
others away. After some time, say, fi fteen minutes or so, someone fi nally does sit down
at your table, ending your assignment. Have you performed an experiment?
Before answering this question, let us sketch out the major criteria for an experi-
ment, which were briefl y discussed in the preceding chapters. An experiment occurs
when the environment is systematically manipulated so that the causal effect of this
manipulation on some behavior can be observed. Aspects of the environment that are
not of interest, and hence not manipulated, are held constant, so as not to infl uence
the outcome of the experiment. We can then conclude that the behavior resulted
from the manipulation. We must explain two special terms briefl y introduced in
Chapter 1— independent and dependent variables—to describe how the environment
is manipulated and how behavior is observed.
▼ WHAT IS AN EXPERIMENT?
Many students are surprised to discover that the actions described in our library table
exercise do not constitute an experiment. All experiments require at least these two
special features, the independent and dependent variables just mentioned. The depen-
dent variable is the response measure of an experiment that is dependent on the
subject. In this case, the time that elapsed until someone else sits down at the table is
the dependent variable or response measure. The independent variable is a manipu-
lation of the environment controlled by the experimenter: In this case, it is the strewing
of articles on the table.
But an experiment must have at least two values, or levels, of the environment.
These levels may differ in a quantitative sense (items strewn across only a portion of
the table versus items strewn across the entire table), or the levels may refl ect a qualita-
tive difference (the person defending the table assumes a friendly, inviting expression
as opposed to a stern, forbidding expression). The point is that at least two conditions
must be compared with each other to determine if the independent variable (portion
of table covered or facial expression) produces a change in a behavior or outcome.
Sometimes, these two levels might simply be the presence or absence of a manipula-
tion. The library example fails to meet this criterion, since it involves only one level of
the independent variable.
How might we change the procedure to obtain an experiment? The simplest way
would be to sit down again, this time without scattering anything. Then our independent
No one believes an hypothesis except its originator, but everyone believes an
experiment except the experimenter. (W. I . B. BEVERIDGE)

C H A P T E R 3 RESEARCH TECHNIQUES: EXPERIMENTS 53
variable would have the necessary two levels: the table with items strewn about and the
bare table with no items strewn about. Now we have something to compare with the
fi rst condition.
This experiment has three possible outcomes: (1) Strewing articles on the table
results in a longer time before the table is invaded by another person; (2) the time until
invasion is the same, whether or not articles are strewn about; and (3) scattering articles
results in a shorter time until invasion. Without the second level of the independent vari-
able (the table with no articles strewn about), these three outcomes cannot be formu-
lated. Indeed, it is impossible to say anything about how effective articles strewn about
are in defending library tables until two levels of the independent variable are tested.
When this library experiment is performed properly, the fi rst possible outcome is
obtained. A table can be better protected by a person plus assorted articles than by a
person alone.
We can see, then, that experiments must have at least independent and dependent
variables. The research techniques discussed in the preceding chapter do not allow or
require manipulation of the environment; but before an experiment can be estab-
lished, independent variables with at least two levels are necessary.
Advantages of Experiments
The main advantage of experiments over the techniques discussed in Chapter 2 is better
control of extraneous variation. In the ideal experiment, no factors (variables) except
the one being studied are permitted to infl uence the outcome; in the jargon of experi-
mental psychology, we say that these other factors are controlled. If, as in the ideal
experiment, all factors but one (that under investigation) are held constant, we can
logically conclude that any differences in outcome must be caused by manipulation of
that one independent variable. As the levels of the independent variable are changed,
the resulting differences in the dependent variable can occur only because the indepen-
dent variable has changed. In other words, changes in the independent variable cause
the observed changes in the dependent variable. In the library example, we might want
to manipulate the facial expression of the person “defending” the table. To control for
extraneous variation, we would need to give careful consideration to other factors that
might compromise our ability to make statements about causation. In this case, we
might want to hire only one assistant to defend the table during the duration of the
experiment or else establish objectively that our assistants are, for example, equally
attractive. We might also decide to control for gender by either incorporating it as an
additional independent variable or by using only female (or male) research assistants.
Designing experiments so that there can be only one explanation of the results is at the
heart of the experimental method. Whereas nonexperimental research techniques are
limited to statements about description and correlation, experiments permit statements
about causation—that is, independent variable A (facial expression) causes variable B
(time elapsed until someone else sits down) to change. In this experiment, we would
expect the time elapsed to be shorter when the assistant assumes a friendly and inviting
expression than when the assistant’s expression is stern and forbidding.
Thus, in principle, experiments lead to statements about causation. In practice,
these statements are not always true. No experiment is 100 percent successful in elimi-
nating or holding constant all other sources of variation but the one being studied.

54 P A R T 1 FUNDAMENTALS OF RESEARCH
However, experiments eliminate more extraneous variation than do other research
techniques. Later in this chapter, we discuss specifi c ways in which experiments limit
extraneous variation.
Another advantage of experiments is economy. Using the technique of naturalistic
observation requires that the scientist wait patiently until the conditions of interest oc-
cur. If you lived in Trondheim, Norway—near the Arctic Circle—and wanted to study
how heat affects aggression, relying on the sun to produce high temperatures would
require great patience and lots of time. The experimenter controls the situation by
creating the conditions of interest (various levels of heat in a laboratory setting), thus
obtaining data quickly and effi ciently.
Why Experiments Are Conducted
The same general reasons that apply to the conduct of any research also explain why
psychologists perform experiments. In basic research, experiments are performed to
test theories and to provide a database for explanations of behavior. These kinds of
experiments are typically well planned, with the investigator having a clear idea of
the anticipated outcome. So-called critical experiments try to pit against each other
two theories that make different predictions. One outcome favors theory A; the other,
theory B. Thus, in principle, the experiment will determine which theory to reject and
which to keep. In practice, these critical experiments do not work out so well, because
supporters of the rejected theory are ingenious in thinking up explanations to discredit
the unfavorable interpretation of the experiment. One example of such an explanation
is found in a study of how people forget. Two major explanations of forgetting are that
(1) items decay or fade out over time, just the way an incandescent light bulb fades when
the electricity is turned off (this explanation is called “trace decay”) or that (2) items never
fade, but because of this, they interfere with each other, causing confusion. A simple
critical experiment would vary the time between introduction into memory of successive
items, holding the number of items constant (Waugh & Norman, 1965). Memory should
be worse with longer times, according to trace-decay theorists, because there is more
time for items to fade out. But because the number of items remains the same regardless
of the time at which they are introduced, interference theory predicts no differences in
forgetting. When this experiment is performed, there is no difference in memory; this
would seem to nullify the trace-decay explanation. The rejoinder by trace-decay theo-
rists, however, is that the extra time given between items allows people to rehearse—that
is, repeat the item to themselves—which prevents forgetting.
Less often, researchers perform an experiment in the absence of a compelling
theory just to see what happens; we can call this a what-if experiment. Students
often come up with what-if experiments, since these experiments require no knowl-
edge of theory or the existing database and can be formulated on the basis of personal
experience and observations. Some scientists frown on what-if experiments; the main
objection to them is their ineffi ciency. If, as is often the case, nothing much happens in
a what-if experiment—say, the independent variable has no effect—nothing is gained
from the experiment. By contrast, if nothing much happens in a careful experiment for
which a theory predicts something will happen, the fi nding of no difference can be
useful. We must admit to having tried what-if experiments. Most of them did not work,
but they were fun. Our advice is to check with your instructor before trying a what-if

C H A P T E R 3 RESEARCH TECHNIQUES: EXPERIMENTS 55
experiment. He or she probably can give you an estimate of the odds of your coming
up with anything or may even know the results of a similar experiment that has already
been performed.
This brings us to the last major reason for doing experiments in basic research,
which is to repeat or replicate a previous fi nding. A single experiment by itself is far
less convincing than a series of related experiments. The simplest replication is the
direct repetition of an existing experiment, with no change in procedures. Direct rep-
lications are especially useful when the original experiment was quite novel. Gener-
ally, however, a better way to replicate is to extend the previous procedure by adding
something new while retaining something old. Thus, part of the replication is a literal
repetition, but the novel part adds to scientifi c knowledge. This kind of repetition
demonstrates the generality of a result by showing how it is (or is not) maintained over
different independent variables. The concept of replication and its various forms are
discussed at greater length in Chapter 11.
▼ VARIABLES
Variables are the gears and cogs that make experiments run. Effective selection and ma-
nipulation of variables make the difference between a good experiment and a poor one.
This section covers the three kinds of variables that must be carefully considered before
starting an experiment: independent, dependent, and control variables. We conclude by
discussing experiments that have more than one independent or dependent variable.
Independent Variables
In true experiments, independent variables are those manipulated by the experimenter.
The brightness of a light, the loudness of a tone, the temperature of a room, the num-
ber of food pellets given to a rat—all are independent variables, since the experimenter
determines their quality and quantity. Independent variables are selected because an
experimenter believes they will cause changes in behavior. Increasing the intensity of
a tone should increase the speed with which people respond to the tone. Increasing
the number of pellets given to a rat for pressing a bar should increase the number
of times the bar is pressed. When a change in the level (amount) of an independent
variable causes a change in behavior, we say that the behavior is under control of the
independent variable.
Failure of an independent variable to control behavior, often called null results,
can have more than one interpretation. First, the experimenter may have guessed in-
correctly that the independent variable was important: The null results may be correct.
Most scientists will accept this interpretation only reluctantly, and so the following
alternate explanations of null results are common. The experimenter may not have
created a valid manipulation of the independent variable. Let us say you are conduct-
ing an experiment on second-grade children and your independent variable is the
number of small candies (M&Ms, jelly beans) they get after each correct response.
Some children get only one, whereas others get two. You fi nd no difference in be-
havior. However, if your independent variable had involved a greater range—that is,
from one piece of candy to ten pieces of candy—perhaps you would have obtained a

56 P A R T 1 FUNDAMENTALS OF RESEARCH
difference. Your manipulation might not have been suffi cient to reveal an effect of the
independent variable. Or perhaps, unknown to you, the children had a birthday party
just before the experiment started and their little tummies were fi lled with ice cream
and cake. In this case, maybe even ten pieces of candy would not show any effect. This
is why, in studies of animal learning with food as a reward, the animals are deprived
of food before the experiment starts.
We can see that experimenters must be careful to produce a strong manipulation of
the independent variable. Failure to do so is a common cause of null results. Because
there is no way to determine if the manipulation failed or the null results are correct,
experimenters cannot reach any conclusions regarding the effect of the independent
variable on the dependent variable. Other common causes of null results are related to
dependent and control variables, to which we now turn.
Dependent Variables
The dependent variable is the response measure of an experiment that is dependent
on the subject’s response to our manipulation of the environment. In other words, the
subject’s behavior is observed and recorded by the experimenter and is dependent on
the independent variable. Time elapsed before a subject sits down at a table defended
by a research assistant, the speed of a worm crawling through a maze, the number
of times a rat presses a bar—all are dependent variables, because they are dependent
on the way in which the experimenter manipulates the environment. In the library
example, we might predict that a subject would be more reluctant to sit down at a
table that is defended by an assistant who displays a forbidding expression than if
the assis tant assumes a congenial expression. In this instance, the subject’s behavior
is dependent on the expression that we instruct the assistant to adopt. The time that
elapses until the subject sits down at the table is the dependent variable of interest.
One criterion for a good dependent variable is stability. When an experiment is
repeated exactly—same subject, same levels of independent variable, and so on—the
dependent variable should yield the same score as it did previously. Instability can
occur because of some defi cit in the way we measure some dependent variable. As-
sume that we wish to measure the weight in grams of an object—say, a candle—before
and after it is lit for 15 minutes. We use a scale that works by having a spring move a
pointer. The spring contracts when it is cold and expands when it is hot. As long as our
weight measurements are taken at constant temperatures, they will be reliable. But if
temperature varies while objects are being weighed, the same object will yield different
readings. Our dependent variable lacks stability.
Null results can often be caused by inadequacies in the dependent variable, even
if it is stable. The most common cause is a restricted or limited range of the dependent
variable, so that it gets “stuck” at the top or bottom of its scale. Imagine that you are
teaching a rather uncoordinated friend how to bowl for the fi rst time. Since you know
from introductory psychology that reward improves performance, you offer to buy your
friend a beer every time he or she gets a strike. Your friend gets all gutter balls, so you
drink the beer yourself. Thus, you can no longer offer a reward; you therefore expect
a decrement in performance. But since it is impossible to do any worse than all gutter
balls, you cannot observe any decrement. Your friend is already at the bottom of the
scale. This is called a fl oor effect. The opposite problem, getting 100 percent correct, is
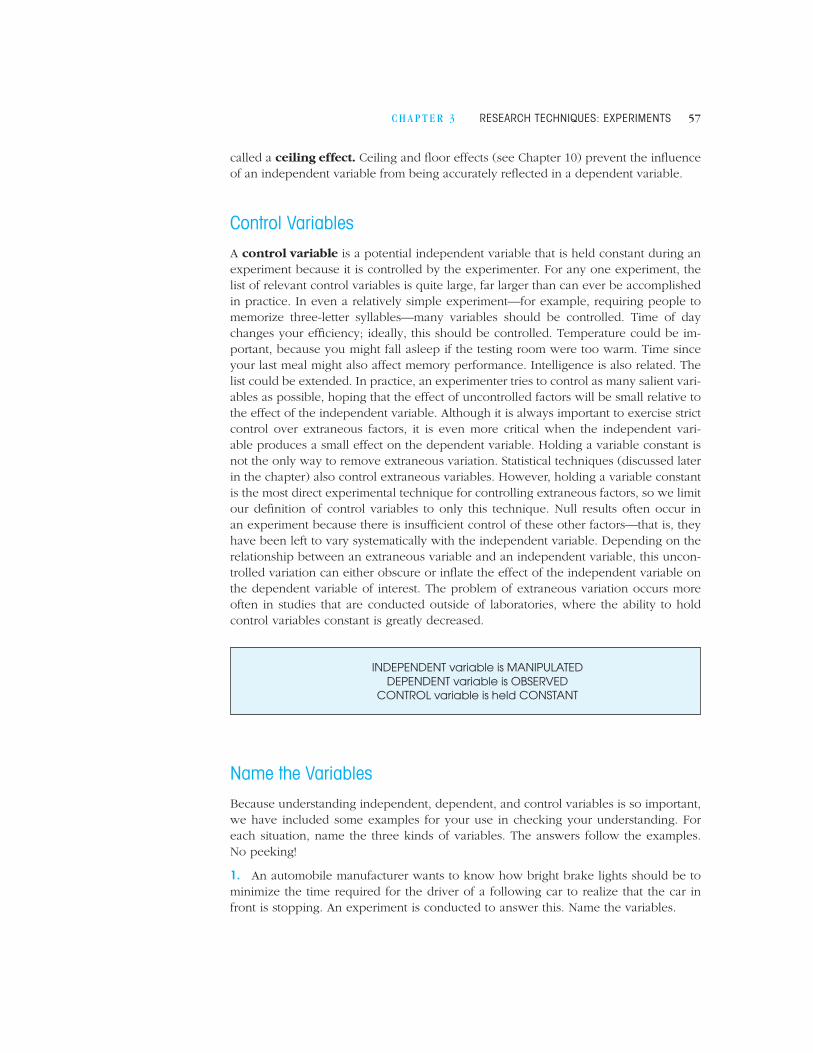
C H A P T E R 3 RESEARCH TECHNIQUES: EXPERIMENTS 57
called a ceiling effect. Ceiling and fl oor effects (see Chapter 10) prevent the infl uence
of an independent variable from being accurately refl ected in a dependent variable.
Control Variables
A control variable is a potential independent variable that is held constant during an
experiment because it is controlled by the experimenter. For any one experiment, the
list of relevant control variables is quite large, far larger than can ever be accomplished
in practice. In even a relatively simple experiment—for example, requiring people to
memorize three-letter syllables—many variables should be controlled. Time of day
changes your effi ciency; ideally, this should be controlled. Temperature could be im-
portant, because you might fall asleep if the testing room were too warm. Time since
your last meal might also affect memory performance. Intelligence is also related. The
list could be extended. In practice, an experimenter tries to control as many salient vari-
ables as possible, hoping that the effect of uncontrolled factors will be small relative to
the effect of the independent variable. Although it is always important to exercise strict
control over extraneous factors, it is even more critical when the independent vari-
able produces a small effect on the dependent variable. Holding a variable constant is
not the only way to remove extraneous variation. Statistical techniques (discussed later
in the chapter) also control extraneous variables. However, holding a variable constant
is the most direct experimental technique for controlling extraneous factors, so we limit
our defi nition of control variables to only this technique. Null results often occur in
an experiment because there is insuffi cient control of these other factors—that is, they
have been left to vary systematically with the independent variable. Depending on the
relationship between an extraneous variable and an independent variable, this uncon-
trolled variation can either obscure or infl ate the effect of the independent variable on
the dependent variable of interest. The problem of extraneous variation occurs more
often in studies that are conducted outside of laboratories, where the ability to hold
control variables constant is greatly decreased.
INDEPENDENT variable is MANIPULATED
DEPENDENT variable is OBSERVED
CONTROL variable is held CONSTANT
Name the Variables
Because understanding independent, dependent, and control variables is so important,
we have included some examples for your use in checking your understanding. For
each situation, name the three kinds of variables. The answers follow the examples.
No peeking!
1. An automobile manufacturer wants to know how bright brake lights should be to
minimize the time required for the driver of a following car to realize that the car in
front is stopping. An experiment is conducted to answer this. Name the variables.
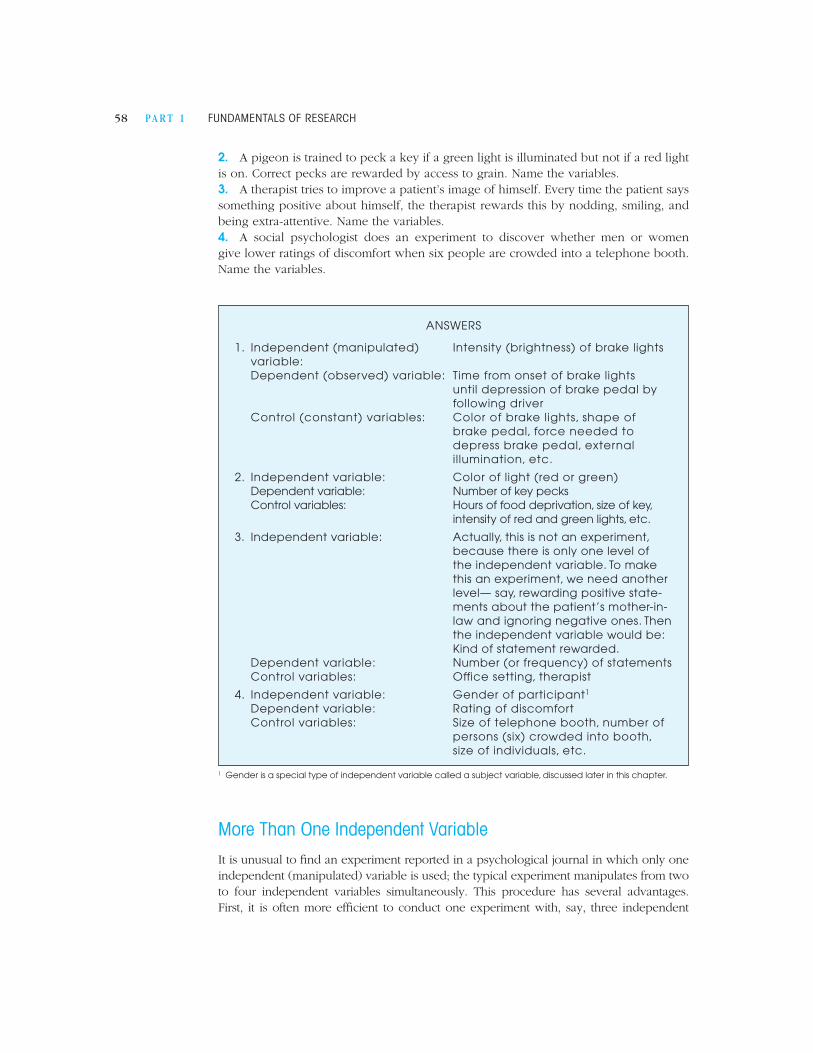
58 P A R T 1 FUNDAMENTALS OF RESEARCH
2. A pigeon is trained to peck a key if a green light is illuminated but not if a red light
is on. Correct pecks are rewarded by access to grain. Name the variables.
3. A therapist tries to improve a patient’s image of himself. Every time the patient says
something positive about himself, the therapist rewards this by nodding, smiling, and
being extra-attentive. Name the variables.
4. A social psychologist does an experiment to discover whether men or women
give lower ratings of discomfort when six people are crowded into a telephone booth.
Name the variables.
ANSWERS
1. Independent (manipulated) Intensity (brightness) of brake lights
variable:
Dependent (observed) variable: Time from onset of brake lights
until depression of brake pedal by
following driver
Control (constant) variables: Color of brake lights, shape of
brake pedal, force needed to
depress brake pedal, external
illumination, etc.
2. Independent variable: Color of light (red or green)
Dependent variable: Number of key pecks
Control variables: Hours of food deprivation, size of key,
intensity of red and green lights, etc.
3. Independent variable: Actually, this is not an experiment,
because there is only one level of
the independent variable. To make
this an experiment, we need another
level— say, rewarding positive state-
ments about the patient’s mother-in-
law and ignoring negative ones. Then
the independent variable would be:
Kind of statement rewarded.
Dependent variable: Number (or frequency) of statements
Control variables: Office setting, therapist
4. Independent variable: Gender of participant1
Dependent variable: Rating of discomfort
Control variables: Size of telephone booth, number of
persons (six) crowded into booth,
size of individuals, etc.
1 Gender is a special type of independent variable called a subject variable, discussed later in this chapter.
More Than One Independent Variable
It is unusual to fi nd an experiment reported in a psychological journal in which only one
independent (manipulated) variable is used; the typical experiment manipulates from two
to four independent variables simultaneously. This procedure has several advantages.
First, it is often more effi cient to conduct one experiment with, say, three independent

C H A P T E R 3 RESEARCH TECHNIQUES: EXPERIMENTS 59
variables than to conduct three separate experiments. Second, experimental control is
often better, since with a single experiment, some control variables—time of day, tempera-
ture, humidity, and so on—are more likely to be held constant than with three separate
experiments. Third, and most important, is that results generalized—that is, shown to be
valid in several situations—across several independent variables are more valuable than
data that have yet to be generalized. Just as it is important to establish generality of results
across different types of experimental subjects (see Chapter 12), experimenters also need
to discover if some result is valid across levels of independent variables. Fourth, this allows
us to study interactions, the relationships among independent variables. We illustrate these
advantages with some examples.
Let us say we wish to fi nd out which of two kinds of rewards facilitates the learning of
geometry by high school students. The fi rst reward is an outright cash payment for prob-
lems correctly solved; the second reward is early dismissal from class—that is, each correct
solution entitles the student to leave class fi ve minutes early. Assume that the results of this
(hypothetical) experiment show early dismissal to be the better reward. Before we make
early dismissal a universal rule in high school, we should fi rst establish its generality by
comparing the two kinds of reward in other classes, such as history or biology. Here, sub-
ject matter of the class would be a second independent variable. It would be better to put
these two variables into a single experiment than to conduct two successive experiments.
This would avoid problems of control, such as one class being tested the week of the big
football game (when no reward would improve learning) and the other class being tested
the week after the game is won (when students felt better about learning).
When the effects produced by one independent variable are different at each level
of a second independent variable, we have an interaction. The search for interactions
is a major reason for using more than one independent variable per experiment. This
can best be demonstrated by example.
In a research report titled “When God Sanctions Killing,” Bushman, Ridge, Da, Key,
and Busath (2007) described a laboratory study of aggression. Participants read a vio-
lent passage that purportedly came from either the Bible or an ancient scroll. Follow-
ing that, they performed an additional task that allowed them to present loud sounds
to another subject in the experiment. They controlled the intensity of this sound, and
higher intensities were interpreted as revealing greater aggression. The dependent vari-
able was the number of times participants selected the highest noise levels in a set of
25 trials. Therefore, aggression scores could range from a low of 0 to a high of 25.
There were two independent variables. The fi rst was the source of the violent
passage: either the Bible or an ancient scroll. The second independent variable was
whether or not the subject believed in God; this is a special type of independent vari-
able, called a subject variable, which is discussed later in this chapter.
Results from this experiment are shown in Figure 3.1, with each independent vari-
able plotted by itself. Reading a passage from the Bible produced greater aggression.
Subjects who believed in God also acted more aggressively.
Figure 3.2 shows that this simple interpretation of the results, while correct, is
incomplete. Here both independent variables are plotted on the same graph, making
some relationships easier to see. If there was no mention of God because the passage
came from an ancient scroll, subjects who believe in God and subjects who do not be-
lieve in God exhibited similar levels of aggression. But when God sanctioned violence
because the passage came from the Bible, greater levels of aggression were exhibited
by those subjects who believe in God.

60 P A R T 1 FUNDAMENTALS OF RESEARCH
Source
Bible
Ag
gre
ssio
n
Scroll
10
5
0
Belief in God and Bible
Yes No
10
5
0
▼ FIGURE 3.1
Effects of Two Independent Variables on Aggression. (Data from Bushman et al., 2007. Reprinted by permission of Blackwell Publishing.)
Text not available due to copyright restrictions

C H A P T E R 3 RESEARCH TECHNIQUES: EXPERIMENTS 61
Remember, an interaction between two independent variables indicates that effects
produced by one independent variable (belief in God) are not the same at each level
of a second independent variable (source of the passage). When the passage contains
no mention of God, belief in God has no effect upon aggression. But when the passage
comes from the Bible, the increase in aggression is greater for subjects who believe in
God than for subjects who do not believe in God. This is an interaction.
Figure 3.3 shows hypothetical data we invented to illustrate how these results
might look if there were no interaction. The effect of one independent variable is the
same at each level of the other independent variable. The dotted lines in Figure 3.3 are
parallel, which is an easy way to detect the lack of an interaction. If similar lines were
drawn in Figure 3.2., they would not be parallel because that fi gure shows an interac-
tion of two independent variables.
Many experiments include two or more independent variables; this means that the
results may contain an interaction. Because of the frequency with which you are likely
to encounter interactions, we present another example of a two-variable experiment to
help you practice interpreting the results of complex experiments.
In the experiment on social loafi ng (see Chapter 1) by Brickner, Harkins, and
Ostrom (1986), the authors wanted to determine the effect of personal involvement in
a task on the amount of social loafi ng shown on that task. Brickner and her associates
noted that low-involvement tasks, such as clapping and generating uses for a knife,
had been used in earlier research on social loafi ng. The authors reasoned that the effort
devoted to a task should be related to the intrinsic importance or personal signifi cance
that the task has for the individual. High personal involvement in a task should reduce
social loafi ng, because individuals should put forth a substantial amount of effort on
such tasks, regardless of whether their individual performance is monitored. So, the
researchers varied the subjects’ involvement in the task and also varied the amount
that individual effort could be assessed. If their reasoning was correct, there should be
an interaction: Low involvement should lead to social loafi ng (reduced effort when the
individual’s effort cannot be assessed), but high involvement should lead to about the
same amount of effort, whether or not individual effort could be identifi ed.
God sanctioned violence
Belief in God
Yes
Ag
gre
ssio
n
No
No mention of God10
5
0
▼ FIGURE 3.3
Hypothetical Data with No Interaction. Note Parallel Lines.

62 P A R T 1 FUNDAMENTALS OF RESEARCH
Brickner and associates had college students generate as many thoughts as they
could in a 12-minute period about a proposal to implement senior comprehensive ex-
ams, which a student would have to pass in order to graduate. In the high-involvement
condition, the students were led to believe that the proposal would be instituted at their
college prior to their graduation.
Thus, the addition of comprehensive exams as one prerequisite to graduation
should have high personal relevance. In the low personal-involvement condition, the
students were led to believe that the exams would be instituted later, at another college.
The possible identifi ability of individual effort was also manipulated by instructions.
Subjects wrote each of their thoughts about comprehensives on an individual slip of
paper. In the low-identifi ability condition, the subjects were told that their thoughts
would be collected together with those of other subjects, because the committee evalu-
ating the thoughts wanted to assess the range of opinions for the group as a whole. In
the high-identifi ability condition, the subjects were told that their opinions would be
considered separately from those of others, because the committee in charge wanted
to assess individual responses.
To summarize, the dependent variable was the number of thoughts generated in
the four conditions: low identifi ability and low involvement; low identifi ability and high
involvement; high identifi ability and low involvement; and high identifi ability and high
involvement.
The results are shown in Figure 3.4, which plots the number of thoughts generated
against identifi ability for the two involvement conditions. Earlier social loafi ng research
is replicated in the low-involvement condition: Fewer thoughts were generated when
▼ FIGURE 3.4
Results of the Experiment by Brickner, Harkins, and Ostrom (1986), Showing an Interaction. Social loafi ng (low numbers of thoughts generated with low as opposed to high identifi ability) occurs with a low-involvement task but not with a high-involvement one.
Mean
Nu
mb
er
of T
ho
ug
hts
10
9
8
7
6
5
Low
Identifiability
High
High Involvement
Low Involvement

C H A P T E R 3 RESEARCH TECHNIQUES: EXPERIMENTS 63
the subjects believed that their individual performance was not being assessed. Now
examine the results when there was high involvement: The number of thoughts was
about the same, regardless of identifi ability. Thus, the variables interact: The effects of
identifi ability depend on the level of task involvement. Put another way, social loaf-
ing, and therefore diffusion of responsibility, is less likely to occur when a person is
confronted with a personally involving task than when the task does not have much
intrinsic interest.
In summary, an interaction occurs when the levels of one independent variable are
differentially affected by the levels of other independent variables. When interactions
are present, it does not make sense to discuss the effects of each independent variable
separately. Because the effects of one variable also depend on the levels of the other
variables, we are forced to discuss interacting variables together.
More Than One Dependent Variable
The dependent (observed) variable is used as an index of behavior. It indicates
how well or poorly the subject is performing. It permits the experimenter to
score behavior. The experimenter must decide which aspects of behavior are rel-
evant to the exper iment at hand. Although some variables traditionally have been
used, this does not mean that they are the only, or even the best, indexes of be-
havior. Take, for example, the behavior of a rat pressing a bar or a pigeon pecking
a key, responses that are used in studies of animal learning. The most common
dependent variable is the number of presses or pecks observed. But the force
with which a key is pecked can also lead to interesting fi ndings (see Neuringer 2002,
p. 680; Notterman & Mintz, 1965), as can the latency (the time taken to respond).
Researchers can usually come up with several dependent variables that may be
appropriate. Let us say we wish to study the legibility of the typeface that you are
now reading. We cannot observe “legibility,” of course. What dependent variables
might we observe? Here are some that have been used in the past: retention of
meaningful information after reading text, time needed to read a fi xed number of
words, number of errors in recognizing single letters, speed in transcribing or retyp-
ing text, heart rate during reading, and muscular tension during reading—and this
list is far from exhaustive.
Reasons of economy argue for obtaining as many dependent measures at the
same time as is feasible. Despite this, the typical experiment uses only one, or at
the most, two dependent variables simultaneously. This is unfortunate: Just as the
generality of an experiment is expanded by having more than one independent vari-
able, it is also expanded with several dependent variables. The reason why more
dependent variables are not used is probably because it is statistically diffi cult to
analyze several dependent variables at once. Although modern computer techniques
make the calculations quite feasible, many experimental psychologists have not been
well trained in these multivariate statistical procedures and thus hesitate to use them.
Separate analyses could be conducted for each dependent variable by itself, but this
loses information in much the same way that a separate analysis of independent vari-
ables ignores interactions. Multivariate analysis is complex; nevertheless, you should
be aware that it is often advantageous to use more than one dependent variable in
an experiment.

64 P A R T 1 FUNDAMENTALS OF RESEARCH
▼ EXPERIMENTAL DESIGNS
The purpose of experimental design is to minimize extraneous or uncontrolled varia-
tion, thereby increasing the likelihood that an experiment will produce valid, consistent
results. Entire books have been written about experimental design. Here, we cover a
sample of some common techniques used to improve the design of experiments.
One of the fi rst design decisions an experimenter must make is how to assign
subjects to the various levels of independent variables. The two main possibilities are
to assign only some subjects to each level or to assign each subject to every level. The
fi rst possibility is called a between-subjects design and the second, a within-subjects
design. The difference can be shown with a simple example. Thirty students in introduc-
tory psychology have signed up for an experiment that you are conducting to test ability
to remember nonsense words. Your independent variable is the number of times you
will say each item: one time or fi ve times. You expect that an item presented fi ve times
will be learned better than an item presented only once. The between-subjects design
calls for you to divide your subjects by halves—that is, into two groups of 15 students
each—with one group receiving fi ve repetitions and the other, one repetition. (How
to select which subjects to put in each group is discussed shortly.) The within-subjects
design has all 30 subjects learning with both levels of the independent variable—that
is, each is tested with one repetition and again with fi ve repetitions. (How to determine
the order in which each subject gets these two treatments is also discussed later.) Which
design should you use?
Between-Subjects Designs
The between-subjects (two groups) design is conservative. There is no chance that one
treatment will continue to contaminate the other, because each person receives only
one treatment (one repetition or fi ve repetitions, but not both). One drawback, how-
ever, is that the between-subjects design must deal with differences among people, and
this decreases its effi ciency—that is, its ability to detect real differences between one
and fi ve repetitions of the memory items.
In any between-subjects design, the experimenter must try to minimize differences
among the subjects in the two or more treatment groups. Clearly, if we took the fi ve best
memorizers and deliberately placed them in the one-repetition group, and put the fi ve
worst in the fi ve-repetition group, we might wind up with no difference in results—even,
perhaps, with the one-repetition group doing better. To prevent this outcome, the experi-
menter must ensure that both groups are equivalent at the start of the experiment.
Equivalent Groups One way to ensure equivalence would be to administer a
memory test to all 30 subjects before the regular experiment started, to obtain a base-
line measure of the subjects’ ability to memorize nonsense words. Subjects’ baseline
scores could then be used to form pairs of subjects that had equal or very similar
scores. One member of each pair would be randomly assigned to one group and the
other member to the second group. This technique is called matching. One diffi culty
with matching is that an experimenter cannot match subjects on every possible charac-
teristic. Thus, there is always the possibility that the groups, even though matched on

C H A P T E R 3 RESEARCH TECHNIQUES: EXPERIMENTS 65
some characteristic(s), differ on some other characteristic that may be relevant (match-
ing is discussed in greater detail later in this chapter).
A more common technique used to ensure that equivalent groups are formed is
randomization. Randomization means that each person participating in an experiment
has an equal chance of being assigned to any particular group. In our repetition experi-
ment, one way to form two groups by randomization would be to draw names out of
a hat. Or we could ask each person to step forward and then throw a die. Even throws
would be assigned to one group and odd throws to the other. If we did not have any
dice, a table of random numbers could be used to generate even and odd digits. This
method of assigning subjects to experimental conditions has no bias, since it ignores all
characteristics of the subjects; we expect that the groups so created would be equiva-
lent on any and all relevant dimensions. However, randomization does not guarantee
that groups will always be equal. By chance, a greater number of better memorizers
might be assigned to one of the groups. The odds of this occurring can be calculated
by the methods of probability theory as applied to statistics (see Appendix B). This is
one reason why experimental designs and statistics are often treated as the same topic.
However, design is concerned with the logic of arranging experiments, whereas statis-
tics deals with calculating odds, probabilities, and other mathematical quantities.
If we are sure that all relevant dimensions have been dealt with, matching is
preferable to randomization. But because we seldom are sure, randomization is used
more often.
Within-Subjects Designs
Many experimental psychologists would prefer the within-subjects (one group) design
in which all 30 subjects were tested with one repetition and again with fi ve repetitions
(or vice versa). It is more effi cient, since each subject is compared with himself or
herself. Any differences resulting from one versus fi ve repetitions cannot be the result
of differences between the people in the two groups, as might be the case for the
between-subjects design.
General Practice Effects There is a risk, however, in the more-effi cient within-
subjects design. Imagine that all 30 subjects fi rst learn a large number of items with
fi ve repetitions and then learn with one repetition. By the time subjects begin the one-
repetition treatment, they might have become more profi cient in learning nonsense
words, or they might be experiencing some boredom or fatigue with the task. Both
these possibilities are termed general practice effects. These effects are usually as-
sumed to be the same for all treatment conditions so that it does not matter whether
subjects learned with one repetition followed by fi ve repetitions or fi ve followed by one
repetition. Because general practice effects are the same for all treatment conditions,
they can be controlled largely through counterbalancing. With counterbalancing, the
experimenter faces the diffi culty of determining the order in which treatments should be
given to subjects. Again, one solution is to use randomization by drawing the treatment
titles out of a hat, using a random-number table, or using a computer to order conditions
randomly. The logic behind this was discussed earlier. However, although counterbal-
ancing treatments through randomization produces equivalent orders in the long run, it
is less likely to be suitable when there are only a small number of treatments. In most

66 P A R T 1 FUNDAMENTALS OF RESEARCH
experiments, the number of subjects exceeds the number of treatments, so randomiza-
tion is a good technique for assigning subjects to treatments.
Complete counterbalancing makes sure that all possible treatment orders are used.
In the repetition experiment, this is easy because there are only two orders: one and
fi ve repetitions, fi ve and one repetitions. Half the subjects would receive one repetition
followed by fi ve repetitions, and the other half would get the opposite order. As the
number of treatments increases, the number of orders becomes large indeed. Three
treatments have 6 different orders; four treatments have 24 different orders; fi ve treat-
ments have 120 different orders; and so on. As the levels of an independent variable
increase, complete counterbalancing soon becomes impractical.
Counterbalancing does not eliminate the effects of order. It does allow experiment-
ers to evaluate possible order effects. If such effects are present, and especially if they
form interactions with other, more important independent variables, steps need to be
taken to correct the design. The experimenter might decide to repeat the experiment,
using a between-subjects design to avoid order effects. Alternatively, the original ex-
periment could be reanalyzed as a between-subjects one, by examining behavior in just
the initial condition experienced by each subject.
Differential Carryover Effects Differential carryover effects pose a more serious
problem than do general practice effects. In the case of differential carryover effects,
the effect of the early part of the experiment on the later part of the experiment varies de-
pending on which treatment comes fi rst. Imagine that all 30 subjects fi rst learn items with
fi ve repetitions and then learn with one repetition. As a result of their earlier experience
with fi ve repetitions, they might decide to repeat to themselves four more times the item
that was only presented once. This would destroy any differences between the two levels
of the independent variable. This is an example of a differential carryover effect given
that the effect of the fi rst treatment on the second treatment differs depending on which
treatment came fi rst. This was not the case with general practice effects in which subjects
approached the second treatment in the same way (i.e., with greater skill, boredom, or
fatigue), regardless of the treatment they received in the fi rst phase of the experiment.
Differential carryover effects can be diminished somewhat through counterbalancing, but
counterbalancing cannot eliminate these effects entirely. If there is reason to expect dif-
ferential carryover effects, we can do one of two things in addition to counterbalancing:
use the between-subjects design or build in a suffi cient time delay between the two treat-
ments. Because the between-subjects design is less effi cient, it will require that many more
subjects be tested; but this is preferable to conducting a seriously fl awed experiment. If we
decide to insert a time delay between the two treatments, we must identify a duration of
time that is suffi cient to eliminate the possibility of differential carryover effects.
Small-n Designs
Before turning to a discussion of mixed designs, we would like to mention a variant on
the traditional within-subjects design—the small-n design. Small-n designs present the
levels of the independent variable or treatments to a small number of subjects or a single
subject. Because few subjects are tested, a substantial number of observations are re-
corded for each subject, resulting in a very economical and highly controlled experiment.
Small-n experiments are common in psychophysical, clinical, and operant-conditioning

C H A P T E R 3 RESEARCH TECHNIQUES: EXPERIMENTS 67
research. Just as with the within-subjects design, the experimenter must be careful to
counterbalance treatments and anticipate any problems associated with admin istering
multiple treatments to individual subjects. Small-n designs are discussed at length in
Chapter 9 of this text and in Chapter 9 of Elmes, Kantowitz, and Roediger (2003).
Mixed Designs
Experiments need not be exclusively of within-subjects or between-subjects design.
It is often convenient and prudent to have some independent variables treated as
between-subjects and others as within-subjects in the same experiment (assuming the
experiment has more than one independent variable, of course). If one variable—for
example, the administration of a drug—seems likely to affect others, it can be made
a between-subjects variable, while the rest of the variables are varied within subjects.
When trials or repeated practice on a task are of interest, it is of necessity a within-
subjects variable. Frequently, a mixed design is used, in which some variable is im-
posed between subjects to see its effect across a second, within-subjects variable. This
type of compromise design (mixed design) is not as effi cient or economical as a pure
within- subjects design, but it is often safer.
Control Conditions
Independent variables must be varied (or manipulated) by the experimenter. This im-
plies that each and every independent variable must vary either in amount (quantitative
variation) or in kind (qualitative variation) within the experiment. For example, if the
amount of reward given to a rat is an independent variable, the amounts chosen by
the experimenter might be one and four pellets of food. Alternatively, we could offer
different kinds of rewards, such as food and water. The technical term for a single treat-
ment or condition of an independent variable is level. We would state that the levels of
the independent variable are one and four food pellets in the fi rst example and food
and water in the second example.
Many experiments contain, in addition to independent variables, some control
group (between-subjects design) or control condition (within-subjects design). In
its simplest form, the control group does not receive the levels of interest of the inde-
pendent variable. In the reward example just described, a control group of rats would
receive no reward. Or say an experimenter is interested in the effect of noise on study-
ing. Using a between-subjects design, the experimenter would expose one group of
subjects to loud noise for half an hour while they were studying; this is the level of
interest of the independent variable. A control group would study the same material
for half an hour in a quiet setting (a very low level of noise). Then both groups would
be tested on the material. Any obtained difference on the test between the two groups
would be attributed to the effect of noise.
The important characteristic of a control condition is the fact that it provides a base-
line against which some variable of interest can be compared. Sometimes the best baseline
is no treatment, but often the best baseline requires some activity. A frequent example
occurs in memory research, where a group of subjects is required to learn two different
lists of words. The experimenter is interested in how learning one list interferes with

68 P A R T 1 FUNDAMENTALS OF RESEARCH
learning the other. The experimental group (receiving the level of interest of the inde-
pendent variable) fi rst learns list A, then learns list B, and then is tested again on list A.
The experimenter would like to show that learning list B interferes with retaining list A.
But before any conclusion of this sort can be reached, a comparison control condition is
required. Merely comparing the fi nal test of list A with the fi rst test is insuffi cient, because
subjects might do worse on the last list A test simply because they are tired, or they might
do better because they have had extra practice. A control condition with no treatment
would have a control group learn list A, then sit around for the time it took the experi-
mental group to learn list B, and then be tested again on list A. But this would be a poor
control condition, because subjects might practice or rehearse list A while they were sitting
around. This would improve their fi nal performance on the last list A test and incorrectly
make it appear that in the experimental group, list B interfered more than it really did with
list A. A proper baseline condition would occupy the control group during the time the
experimental group was learning list B; perhaps the experimenter would have them do
arithmetic or some other “busy work” that would prevent rehearsal (Figure 3.5).
Sometimes the control condition is contained implicitly within the experiment.
Recall the memory experiment discussed earlier, in which the independent variable
was the number of repetitions of an item: one or fi ve. No experimenter would bother
to include a control group or condition with zero repetitions, since no learning could
occur under this odd circumstance. The control condition is implicit, in that fi ve repeti-
tions can be compared with one, and vice versa. Since the experimenter might well
be as interested in the effects of a single repetition as in fi ve repetitions, we probably
would not explicitly call the one-repetition level a control condition. But it does pro-
vide a baseline for comparison—and so, for that matter, does the fi ve-repetition condi-
tion, since the one-repetition results can be compared with it.
Many types of experiments require more than one baseline. In physiological and drug
research, for example, a control for surgical or injection trauma is needed. So, a subject
might receive a sham operation or the injection of an inert substance (a placebo) in the
control condition; those would also be compared with other controls that received no
operation or no injection.
Pitfalls
Unfortunately, it is quite easy to formulate an inadequate experimental design; most
experimental psychologists have hidden away mistakes of this kind in a dusty fi le cabi-
net. In this section, we discuss only a small sample of errors in design, those that are
so common you should be aware of them.
▼ FIGURE 3.5
Examples of Experimental and Control Groups for List Learning.
Learn List A Test List AExperimental Group
Control Group Do ArithmeticLearn List A
Learn List B
Test List A

C H A P T E R 3 RESEARCH TECHNIQUES: EXPERIMENTS 69
Demand Characteristics Laboratory experiments attempt to capture behavior as it
really is infl uenced by the independent variable. Sometimes the laboratory setting itself
or the knowledge that an experiment is under way may alter patterns of behavior. Many
times, research participants spontaneously form hypotheses or assumptions about the
experimenter’s purpose in conducting the experiment and then behave or respond
in a way that will satisfy this “purpose.” Try this simple demonstration to convince
yourself that such effects occur. Tell fi ve of your friends that you are conducting an
experiment for your psychology class and would like their cooperation as subjects. If
they agree, ask them to hold three ice cubes in their bare hands. Note how many hold
the ice cubes until they melt. Now ask fi ve other friends to hold the ice cubes, without
mentioning anything about an experiment. Instead of holding the ice cubes until they
melt, they will consider your request somewhat strange and soon so inform you. There
is something unusual about the ready compliance of those friends who knew they
were participating in an experiment: More of them were willing to hold the ice cubes
for a longer period. Psychologists call the cues available to subjects that allow them to
determine the purpose of the experiment, or what is expected by the experimenter,
demand characteristics. To the extent that the behavior of research participants is
controlled by demand characteristics instead of by independent variables, experiments
are invalid and cannot be generalized beyond the test situation.
A well-known example of a demand characteristic is the Hawthorne effect, named
after the Western Electric Company plant where it was fi rst observed. The company was
interested in improving worker morale and productivity and conducted several experi-
ments (such as improving lighting) to better the workers’ environment. No matter what
experimental manipulation was tried, worker productivity improved. The workers knew
they were in a “special” group, and therefore tried to do their best at all times. (See Bramel
& Friend, 1981, and Parsons, 1974, for alternate interpretations of these results.) The de-
mand characteristics were more important in determining the workers’ productivity than
were the experimental manipulations. Although the term Hawthorne effect is widely used
to describe fi eld experiments where productivity increased due to participation in the
study, there have been several detailed reviews of the original Hawthorne experiment that
suggest the original conclusion was based upon weak evidence (Brannigan & Zwerman,
2001; Wickström & Bendix, 2000). Nevertheless, the term remains in wide use.
Demand characteristics, and the Hawthorne effect, must be carefully evaluated. A
recent study (Fostervold, Buckmann, & Lie, 2001) contained special control conditions
for evaluating the effects of visual display unit (VDU) fi lters on computer screens. In
the fi rst part of the study one group of participants had fi lters (fi lter group) and another
control group did not. Comparing the two groups’ results showed various benefi ts for
the fi lter group. However, the researchers also included a second phase where the con-
trol group was given a fi lter while the fi lter group continued with the same fi lter. Only
minor changes were observed for the initial control group. Furthermore, initial benefi ts
for the fi lter group declined during the second phase. Thus, results in the fi rst phase
were due to demand characteristics and not to benefi ts associated with VDU fi lters. Had
the experimenters conducted only the fi rst phase of their study, a false benefi t of fi lters,
actually due to demand characteristics, might have been claimed incorrectly.
Experimenter Effects A pitfall closely related to demand characteristics is the
experimenter effect, which infl uences the outcome accidentally by providing participants
with slight cues as to the experimenter’s expectations. For example, an experimenter
70 P A R T 1 FUNDAMENTALS OF RESEARCH
might not be aware that he or she nods approvingly when a correct response is given and
frowns after errors. The gender, race, and ethnicity of the experimenter are also poten-
tial experimenter effects. Experimenter characteristics are more likely to bias the results
of an experiment in research that focuses on issues related to these characteristics—for
example, the race of an experimenter who is conducting an experiment concerning the
effect of skin color on work performance ratings.
These effects are not limited to experiments with humans. The experimenter ef-
fect can also occur in seemingly objective experiments with animal subjects. Rosenthal
and Fode (1963) told student experimenters that the rats they were to test in a maze
were from special strains: either maze-bright or maze-dull. Actually, the rats came from
the same population. Nevertheless, the rats that were labeled maze-bright had fewer
errors than those labeled maze-dull, and this difference was statistically reliable. The
student experimenters were observed while they tested the rats: They did not cheat or
do anything overt to bias the results. It seems reasonable that the lucky students who
got supposedly bright rats were more motivated to perform the experiment than those
unfortunates who had to teach stupid rats to go through the maze. Somehow, this
affected the results of the experiment—perhaps because experimenters handled the
two groups of rats differently.
The best way to eliminate this kind of experimenter effect is to hide the experimen-
tal condition from the experimenter on the premise that experimenters cannot commu-
nicate what they do not know. This procedure is termed a double-blind experiment
because neither the experimenter nor the research participant knows which subjects
are in which treatment conditions. Such a procedure was, for instance, used in a study
of behavioral effects of air pollution. Subjects breathed either pure air or air taken from
a busy roadway. The air was contained in tanks; the experimenter did not know which
tank held pure air and which tank held polluted air. The subjects’ poorer performance
in polluted air cannot, then, be attributed to the experimenter inadvertently disclosing
the air quality to subjects or treating them differently.
Experimenter effects are not always this subtle. One of the authors was once in-
volved in an experiment concerning the human eye-blink response. Several experiment-
ers helped conduct the same experiment, and it was soon noticed that one of them
obtained results that were quite different from those of the rest of us. His subjects started
out experimental sessions with massive fl urries of frenzied blinking. The cause of this
odd behavior was easily discovered. To record eye blinks, the experimenter must attach
a tiny metal rod to the subject’s eyelid with special tape—ordinarily a painless procedure.
However, the experimenter in question had a very heavy thumb and was unable to attach
the rod without irritating the eye, causing the strange fl urries of blinking.
When an experimenter suspects that some aspect of his or her appearance or
manner (e.g., gender, race, ethnicity) may alter the pattern of subjects’ behavior, then a
possible solution is to incorporate this as an additional independent variable or control
variable in the experimental design. If an African-American experimenter is conduct-
ing research on skin color and work performance ratings, he or she could ask a white
colleague or research assistant to test half the subjects and then compare the effects of
skin color in the two experimenter race conditions.
Automation of Experiments Experimenter effects can be eliminated or greatly re-
duced by having computers or other equipment conduct the experiment so that the
subject is untouched by human hands. In many laboratories, a subject enters a testing

C H A P T E R 3 RESEARCH TECHNIQUES: EXPERIMENTS 71
booth and sees a message on a screen that tells her or him to push a button to begin.
Pushing the button causes instructions for the experiment to appear on the screen. The
entire experiment is then conducted by a computer. The experimenter appears at the
end of the data collection to debrief the participant, giving the aims of the study and
explaining how the subject has helped advance science. Until then, the experimenter
simply monitors the equipment and the subject to ensure that the subject is following
instructions and that nothing untoward happens. Such automation obviously reduces
the dangers of experimenter bias.
Quasi-Experiments
For one reason or another, many variables cannot be manipulated directly. One de-
terrent to manipulation of variables in experiments is the ethical considerations all
scientists must have (see Chapter 4). It is ethical to survey or otherwise observe the
use of drugs by college students as long as permission is obtained. By no stretch of the
imagination, however, would it be ethical to create a group of drug abusers and com-
pare their activities with a nonabusing group that we also created. A second barrier to
manipulation is Mother Nature. Some variables, such as the sex of our subjects, cannot
be varied by the experimenter (except in very rare and controversial circumstances);
other variables, such as natural disasters (tornadoes, hurricanes) or unnatural disasters
(wars, airplane crashes), are both physically and morally diffi cult to implement. Can we
do experiments that concern these phenomena? After all, such variables and others like
them are fascinating and may play an important part in human experience.
The answer to the question (assuming you are an ethical scientist) is this: You can
and you cannot. We are not being silly here; rather, we are emphasizing the fact that
you cannot do real experiments on phenomena such as the ones just listed. You can,
however, conduct quasi-experiments. The technique here is similar to the ex post
facto examination in correlational research, except that two or more levels of the vari-
able of interest are examined rather than correlated. We wait for Mother Nature to do
her work, and then we compare the effects of that “independent variable” with the ef-
fects that occur when that variable is not present or differs in some way. If we compare
the reading ability of men with that of women, or that of speed readers with that of
average adults, we have conducted a quasi-experiment.
The advantages of quasi-experiments are obvious: They use naturally occurring
independent variables, most of which have a high degree of intrinsic interest and
important practical implications. In a quasi-experiment, we take advantage of obser-
vational and correlational procedures and combine them with the power of experi-
mentation. The typical quasi-experiment has a subject variable as an independent
variable. If we want to fi nd out about almost any inherent subject variable (age, sex,
race, ethnic group), socially caused subject attribute (social class, region of residence),
or disease- and illness-related subject attribute (limb loss, mental illness, brain damage,
effects of disasters), we are going to have to select rather than vary our independent
variables, unless it is possible to do the experiment directly on infrahuman organisms.
Although quasi-experiments are interesting and can contribute very important research,
we should caution you here that the advantages of quasi-experiments are gained at the
expense of control. When the researcher has to take what is given, what is given may
include several important confounding variables.

72 P A R T 1 FUNDAMENTALS OF RESEARCH
Because much research in psychology is concerned with subject variables and be-
cause quasi-experiments using subject variables are likely to be confounded, we now
examine the problems and possible solutions.
An experimenter cannot manipulate a subject variable while holding other fac-
tors constant; she or he can only select subjects who already have the characteristic in
some varying degree and then compare them based on the behavior of interest. If the
subjects in the different groups (say, high, medium, and low IQ) differ on the behavior,
we cannot conclude that the subject-variable difference has produced or is responsible
for the difference in behavior. The reason is that other factors may be covariant and
confounded with the subject variable. If high-IQ subjects perform some task better than
low-IQ subjects, we cannot say that IQ produced or caused the difference, because
the different groups of subjects are likely to vary on other relevant dimensions, such as
motivation, education, and so forth. When subject variables are investigated, we cannot
safely attribute differences in behavior to this variable, as we can with true experimen-
tal variables. Such designs, then, essentially produce correlations between variables.
We can say that the variables are related, but we cannot say that one variable produces
or causes the effect in the other variable.
This is a very important point; let us consider an example. Suppose an investigator
is interested in the intellectual functioning (or lack thereof) of people suffering from
schizophrenia. People diagnosed as belonging to this group are given numerous tests
that are meant to measure various mental abilities. The researcher also gives these tests
to another group of people, so-called normals. He or she discovers that schizophrenics
do especially poorly relative to normals in tests involving semantic aspects of language,
such as those that involve understanding the meanings of words or comprehending
prose passages. The investigator concludes that the schizophrenics perform these tests
more poorly because they are schizophrenics and that their inability to use language
well in communication is a likely contributing cause of schizophrenia.
Studies such as this are common in some areas of psychology. Despite the fact
that conclusions similar to this are often drawn from such studies, they are completely
unwarranted. Both conclusions are based on correlations, and other factors could well
be the critical ones. Schizophrenics may do more poorly than normals for any number
of reasons. They may not be as intelligent, as motivated, as educated, or as wise at
taking tests. It may simply be that they have been institutionalized for a long time, with
a resulting poverty of social and intellectual intercourse. So we cannot conclude that
the reason that the two groups differ on verbal tests is schizophrenia or its absence in
the two groups. Even if we could conclude this, it would certainly not imply the other
conclusion, that language problems are involved in causing schizophrenia. Again, all
we would have is a correlation between these two variables, with no idea of whether
or how the two are causally related.
Use of subject variables is very common in all psychological research, but it is
absolutely crucial in such areas as clinical and developmental psychology. Therefore, the
problems with making inferences from such research should be carefully considered. A
primary variable in developmental psychology is age, a subject variable; this means that
much research in this fi eld is correlational in nature. In general, the problem of individual
differences among subjects in psychology is one that is often ignored, though there are
often appeals to consider this problem as crucial (see Underwood, 1975). We devote a
chapter later in the book to individual differences (Chapter 12). Let us consider here one
way of attempting more sound inferences from experiments employing subject variables.

C H A P T E R 3 RESEARCH TECHNIQUES: EXPERIMENTS 73
Matching Again The basic problem in the investigation of subject variables and in
other ex post facto research is the fact that whatever differences are observed in behavior
may be caused by their confounded variables. One way to try to avoid this problem is by
matching subjects on the other relevant variables. In the comparison of schizophrenic and
normal subjects, we noted that the two groups were also likely to differ on other char-
acteristics, such as IQ, education, motivation, institutionalization, and perhaps even age.
Rather than simply comparing the schizophrenic subjects with normal subjects, we might
try to compare them with another group more closely matched on these other dimen-
sions, so that, we hope, the main difference between the groups would be the presence
or absence of schizophrenia. For example, we might use a group of patients who, on
the average, are similar to the schizophrenics in terms of age, IQ, length of time institu-
tionalized, gender, and some measure of motivation. When the two groups have been
matched on all these characteristics, then we can more confi dently attribute any difference
in performance between them to the factor of interest, namely, schizophrenia. By match-
ing, investigators attempt to introduce the crucial characteristic of experimentation—being
able to hold constant extraneous factors to avoid confoundings—into what is essentially
a correlational observation. The desire is to allow one to infer that the variable of interest
(schizophrenia) produces the observed effect.
Several rather severe problems are associated with matching. For one thing, it often
requires a great deal of effort, because some of the relevant variables may be quite diffi cult
to measure. Even when one goes to the trouble of taking the needed additional measures,
it may still be impossible to match the groups, especially if few subjects are involved be-
fore matching is attempted. Even when matching is successful, it often greatly reduces the
size of the sample on which the observations are made. We then have less confi dence in
our observations, because they may not be stable and repeatable.
Matching is often diffi cult because crucial differences among subjects may have
subtle effects. In addition, the effects of one difference may interact with another. Thus,
subtle interactions among matched variables may confound the results. To illustrate
these diffi culties, let us consider some of the work done by Lester and Brazelton (1982)
on neonatal behavior.
Brazelton’s primary interest is in cultural differences in neonatal behavior, as meas-
ured by the Brazelton Neonatal Behavioral Assessment Scale. The general strategy is
to compare neonates from various cultures and ethnic groups with neonates from the
United States. In these quasi-experiments, culture or ethnic group, which is a subject vari-
able, is the quasi-independent variable. Attempts are usually made to match the babies
from different cultures along various dimensions, such as birth weight, birth length, and
obstetrical risk (including whether the mother received medication during birth, whether
the baby was premature, and so on). Lester and Brazelton show that there is a synergistic
relationship among these factors. Synergism in a medical context means that the com-
bined effects of two or more variables are not additive: The combined effect is greater
than the sum of the individual components. This means that the variables interact.
The way in which neonatal characteristics and obstetrical risk interact is as fol-
lows. Studies have shown that the behavior (as measured by the Brazelton scale) of
slightly underweight infants is more strongly infl uenced (negatively) by small amounts
of medication taken by the mother than is the behavior of neonates who are closer to
the average in weight. Even though the neonates are carefully selected, subtle and in-
teractive effects of the matched variables can infl uence the results. This is an especially
diffi cult problem in Brazelton’s work, because much of his research has examined
74 P A R T 1 FUNDAMENTALS OF RESEARCH
neonates from impoverished cultures, where birth weight is low and obstetrical risk
is very high. Generally, you should remember that matched variables are rarely under
direct control, which means that the possibility of confounding is always present.
Another problem with matching involves the introduction of the dreaded regres-
sion artifact. This is discussed in Chapter 12, but we explain it briefl y here. Under
certain conditions in many types of measurements, a statistical phenomenon occurs
known as regression to the mean. The mean of a group of scores is what most
people think of as the average: the total of all observations divided by the number of
observations. For example, mean height in a sample of 60 people is the sum of all their
heights divided by 60. Typically, if people who received extreme scores (i.e., very high
or very low) on some characteristic are retested, their second scores will be closer to
the mean of the entire group than were their original scores. Consider an example.
We give 200 people a standard test of mathematical reasoning for which there are two
equivalent forms, or two versions of the test that we know to be equivalent. The aver-
age (mean) score on the test is 60 of 100 possible points. We take the 15 people who
score highest and the 15 who score lowest. The mean of these groups is, say 95 and 30,
respectively. Then we test them again on the other version of the test. Now we might
fi nd that the means of the two groups are 87 and 35. On the second test, the scores
of these two extreme groups regress toward the mean; the high-scoring group scores
more poorly, and the low-scoring group does somewhat better. Basically, this happens
for the high-scoring group because some people whose “true scores” are somewhat
lower than actually tested lucked out and scored higher than they should have on the
test. When retested, people with extremely high scores tend to score lower, near their
true score. The situation is reversed for the low-scoring group. That is, some of them
scored below their “true scores” on the fi rst test; retesting leads to their scoring higher
or nearer the true score.
This regression toward the mean is always observed under conditions when there
is a less-than-perfect correlation between the two measures. The more extreme the
selection of scores, the greater the regression toward the mean. It also occurs in all
types of measurement situations. If abnormally tall or short parents have a child, it will
likely be closer to the population mean than the height of the parents. As with most
statistical phenomena, regression to the mean is true of groups of observations and is
probabilistic (i.e., it may not occur every time). For example, a few individual subjects
may move away from the mean in the second test of mathematical reasoning, but the
group tendency will be toward the mean.
How does regression toward the mean affect quasi-experiments, in which sub-
jects have been matched on some variable? Again, consider an example. This one,
like much ex post facto research done on applied societal problems, has important
implications. Let us assume that we have an educational program that we believe
will be especially advantageous for increasing the reading scores of African-American
children. This is especially important because African-American children’s scores are
typically lower than those of whites, presumably because of different cultural environ-
ments. We take two groups of children, one African-American and one white, and
match them on several criteria, including age, sex, and, most important, initial reading
performance. We give both groups of children the reading improvement program and
then test their reading scores after the program. We fi nd, much to our surprise, that the
African- American children actually perform worse after the reading program than be-
fore it, and the white children improve. We conclude, of course, that the program

C H A P T E R 3 RESEARCH TECHNIQUES: EXPERIMENTS 75
helped white children but actually hurt African-American children, despite the fact that
it was especially designed for the latter.
This conclusion, even though it may seem reasonable to you, is almost surely
erroneous in this case, because of regression artifacts. Consider what happened when
the African-American and white children were matched on initial reading scores. Since
the populations differed initially, with African-Americans scoring lower than whites, in
order to match two samples it was necessary to select the African-American students
having higher scores than the mean for their group and the white students having
lower scores than their group mean. Having picked these extreme groups, we would
predict (because of regression to the mean) that when retested, the African-American
children would have poorer scores and the white children would have better ones, on
the average, even if the reading improvement program had no effect at all! The excep-
tionally high-scoring African-American children would tend to regress toward the mean
of their group, and the low-scoring whites would regress toward the mean for their
group. The same thing would have happened even if there had been no program and
the children had been simply retested.
The same outcome would likely have been obtained if children had been matched
on IQs instead of reading scores, since the two are probably positively correlated. So
simply fi nding another matching variable may not be a solution. One solution would
be to match very large samples of African-American and white children and then split
each group, giving the reading program to one subgroup but not the other. All would
be retested at the end of the one subgroup’s participation in the program. (Assignment
of subjects to the subgroups of African-American and white children should, of course,
be random.) Regression to the mean would be expected in both subgroups, but the ef-
fect of the reading program could be evaluated against the group that had no program.
Perhaps African-American children with the reading program would show much less
drop (regression to the mean) than those without, indicating that the program really
did have a positive effect.
Because quasi-experimental research with subject variables is conducted quite of-
ten to evaluate educational programs, its practitioners need to be aware of the many
thorny problems associated with its use. One may not be able to say much with regard
to the results or draw important conclusions because of confoundings. Matching helps
alleviate this problem in some cases where its use is possible, but then one introduces
the possibility of regression artifacts. And many researchers seem unaware of this prob-
lem. One famous blooper in such evaluational research, very similar to the hypothetical
study outlined here, is discussed in Chapter 12.
When matching is a practical possibility and when regression artifacts are evalu-
ated, we can feel somewhat more confi dent of conclusions from our results. But we
should remember that what we have is still only a correlation, albeit a very carefully
controlled one. Matching is sometimes useful, but it is not a cure-all. In our earlier
example comparing schizophrenic subjects with others on mental test performance, if
the schizophrenics still performed worse than the new matched control group, could
we then conclude that schizophrenia produced inferiority in language usage? No, we
could not. It could still be something else, some other difference between the two
groups. We can never be absolutely sure we have matched on the relevant variables.
The study of experimental design is complex. In most chapters, we include a fea-
ture, From Problem to Experiment, that tells how to turn some issue or question into
an actual experiment. We describe this feature next.

76 P A R T 1 FUNDAMENTALS OF RESEARCH
FROM PROBLEM TO EXPERIMENT
THE NUTS AND BOLTS
Problem Conducting an Experiment
Many of the decisions that go into creating an experiment are not clearly
explained in journal reports of research. Although some of this brevity can be
attributed to the economy imposed by journal editors who like short articles, a
larger part is based on the assumption that experimental psychologists, or in-
deed psychologists researching any specialty, share a common background
knowledge. This is true in all branches of science. For example, a physicist writ-
ing in a journal assumes that the readers already know that a dyne is a unit of
force and will not bother to explain that term. Similarly, psychologists usually as-
sume the reader knows what the terms stimulus and response mean, although
these may be defi ned anyway. One purpose of this text is to give you some
of the vocabulary necessary if you wish to read or write about psychological
research.
Another problem for the new researcher is related to the “lore of the labora-
tory.” “Everybody” knows there are certain “obvious” ways to perform certain
kinds of research. These ways differ from area to area but are well known within
each category. They are so well known that researchers seldom bother to ex-
plain them and indeed are quite surprised when new researchers are ignorant
of these “obvious” tricks and techniques. Animal researchers often deprive
animals of food for several hours before the experiment or keep their pigeons
at a certain percentage of the weight the pigeons would attain if they had
food continuously available. Although the reasons for this are obvious to the
researcher, they may not be obvious to you. How does an experimenter know
how many items to use in a memory experiment? How long should an ex-
periment take? Why is one dependent variable selected from a set of what
appear to be equally valid dependent variables? How many subjects should
be used in an experiment? The From Problem to Experiment sections in the
chapters of Part Two will answer such “obvious” questions as these.
From Problem to Experiment
All research aims at solving a problem. This problem can be abstract and theoretical or
concrete and applied. The problem may arise from an observation made more or less
casually, such as that people seem to be more aggressive during the summer. Here, the
problem can be stated as “Why does summer heat cause aggression?” or even more
skeptically as “Does high temperature cause aggression?” A problem may arise from an
accidental discovery in a laboratory, such as the fi nding of mold on a piece of bread.
Solving this problem—why is the mold growing here?—led to the discovery of penicil-
lin. Finally, a problem may arise directly from a theoretical model, for instance, when
we ask, “Why does reinforcement increase the probability of the occurrence of the
behavior that preceded it?”

C H A P T E R 3 RESEARCH TECHNIQUES: EXPERIMENTS 77
The fi rst step the experimenter must take is to translate the problem into a testable
hypothesis. The hypothesis then must be transformed into an experiment with inde-
pendent, dependent, and control variables.
From Problem to Hypothesis A problem is, more or less, a vague statement that
must be verifi ed or a question that must be answered. Unless either is made specifi c and
precise, it cannot be experimentally tested. Any hypothesis is a particular prediction,
derived from a problem, often stated in this form: If A, then B. The crucial distinction
between a problem and a hypothesis is that a hypothesis is directly testable, whereas a
problem is not. An experimental test must be capable of disproving a hypothesis.
The purpose of any experiment is to test hypotheses about the effects of an inde-
pendent variable(s) on the dependent variable. To do this, we must collect data. Once
obtained, these data must be analyzed. Once analyzed, data must be reported. We
briefl y discuss these aspects in turn.
▼ DATA
Obtaining Data
Outlining an experimental design does not establish all the conditions needed for data
acquisition. Although the design tells you how to assign subjects to experiments, it
does not tell you how to get the subjects. Without subjects, there are no data.
Psychologists who investigate animal behavior have much more control over
subject selection than those who study humans. Although animal psychologists must
bear the additional expense of obtaining housing and feeding their subjects, they can
select the strain they wish to purchase and always have subjects available, barring
some catastrophe.
Research with humans most often uses as subjects college students enrolled in in-
troductory psychology. Provided that this participation is used as a learning experience
for the student, it is considered ethical and proper (American Psychological Association
[APA], 1987). If the experiment is not used as a learning experience, the experimenter
should pay subjects. Since college students are a select population, experimenters need
to be careful about generalizing results to other subject populations. For example,
techniques from a programmed learning system designed to teach inorganic chemistry
might not prove successful in the teaching of plumbing.
Random selection means that any member of a population has an equal chance
of being selected as a participant. Furthermore, each selection is independent of other
selections, so choosing one person does not affect the chances of selecting anyone
else. Sometimes in a typical psychology experiment it can be diffi cult to specify the
population being sampled (Gigerenzer, 1993). Even if subjects can be drawn randomly,
exactly what population does a university subject pool represent? It is not even clear
if the population of students taking required psychology courses are representative of
all university students. Since the student population is now so diverse, representing
people with many different ages and backgrounds, researchers need be careful about
extrapolating results from the test sample to other populations.
Random assignment means that each participant in the experiment is randomly
assigned to experimental treatments (Holland, 1993). This is a prudent technique
78 P A R T 1 FUNDAMENTALS OF RESEARCH
because it increases our ability to make causal inferences from the experimental re-
sults. Statistical implications of sampling are discussed in Appendix B.
After your sample has been selected and your design is fi xed, one major decision
remains. Should you test your participants one at a time or in a group? Both proce-
dures have advantages and disadvantages. The biggest advantage of group testing is
economy. It takes only 1 hour to test 30 participants for an hour as a group, whereas
it takes 30 hours to test them singly. So, all other things being equal, it is faster, and
therefore better, to test participants in groups. But there are many instances where
all other things are far from equal. For example, take a listening experiment in which
separate words are presented to left and right ears. One hurried doctoral student
decided to save time and test her participants in a group. She forgot that unless par-
ticipants were positioned exactly between the two loudspeakers, one message would
reach one ear before the other message reached the other ear. This invalidated the
independent variable. Of course, it would have been fi ne to test participants in a
group if each person wore earphones, thus avoiding this diffi culty. The other problem
in group testing is the possibility that participants will infl uence one another, thus
infl uencing the data. Perhaps a participant may cheat and copy answers from an-
other, or the sexual composition of the group may alter motivation. Sometimes these
problems can be prevented by placing participants in individual booths that prohibit
social interaction.
Analyzing Data
The immediate result of an experiment is a large series of numbers that represent behavior
under different conditions. As Sidman (1960) humorously describes it, scientists believe
that all data are tainted at birth. Data belong to Chance or to Science—but never to both.
Before the psychologist can be sure that data belong to Science, the demon Chance must
be exorcised. This is done by a ritual called inferential statistical analysis.
Once statistical analysis tells you which data are reliable (did not occur by chance),
you still have to decide which data are important. No mathematical calculation can
tell what hypotheses are being tested, what is predicted by the theories, and so on.
Statistics are never a substitute for thought. Statistical analysis is a theoretically neutral
procedure that serves theory and hypothesis testing. Except in the case of a what-if
experiment, the theories and hypotheses precede the statistics.
Because it is virtually impossible to grasp the meaning of the large set of numbers
an experiment produces, data are usually condensed by descriptive statistics. The most
common are the mean and the standard deviation. As part of the data analysis, means
are calculated for each level of each independent variable, as well as for combinations
of independent variables to show interactions.
Reporting Data
Data are presented in tables or fi gures. Figures are usually easier to understand.
Figure 3.2 is a typical example of how results of an experiment are reported. The
dependent variable is plotted on the ordinate—the vertical scale. The independent
variable is graphed on the abscissa—the horizontal scale. More than one independent

C H A P T E R 3 RESEARCH TECHNIQUES: EXPERIMENTS 79
variable can be shown in the same graph by using solid and dotted lines and/or dif-
ferently shaped symbols for each independent variable.
Raw (unanalyzed) data are hardly ever reported. Instead, some descriptive statistic,
such as the mean, is used to summarize data. Other statistics often accompany data to
tell the reader about the reliability of these data.
Many different styles and formats can be used to report data. We recommend the
format given in the Publication Manual of the American Psychological Association,
which has become the standard reference in psychology and many other fi elds in social
science. This book will tell you more than you would like to know about every aspect
of preparing the report of an experiment. If it is not in the library or bookstore, you can
purchase it through the Order Department, American Psychological Association, P.O.
Box 2710, Hyattsville, Maryland 20784.
▼ SUMMARY
1. An experiment is a controlled procedure for
investigating the effects of one or more independent
variables on one or more dependent variables. The
independent variable is manipulated by the experi-
menter, whereas the dependent variable is observed
and recorded. Experiments offer the investigator the
best chance of eliminating or minimizing extrane-
ous variation. Experiments are performed to test
theories, to replicate and expand previous fi ndings,
or to show that prior research cannot be confi rmed.
Only rarely are experiments performed just to see
what might happen.
2. Independent variables are chosen because an experi-
menter thinks they will control behavior. If they do
not, this may mean that the manipulation was inad-
equate or that the experimenter was wrong. Depen-
dent variables must be stable—that is, they must con-
sistently produce the same results under the same
conditions. Ceiling and fl oor effects result from an in-
adequate range for the dependent variable. Control
variables are potential independent variables that are
not manipulated during an experiment.
3. Most experiments test more than one independent
variable at a time. In addition to providing econo-
my, this allows the experimenter to gain important
information about interactions. Interactions occur
when the effects of one independent variable are
not the same for different levels of another inde-
pendent variable. Occasionally, experiments use
more than one dependent variable.
4. Experimental design assigns subjects to different
conditions in ways that are expected to minimize
extraneous variation. In a between-subjects design,
different groups of subjects experience different
treatments. In a within-subjects design, the same
subjects go through all treatments. The between-
subjects design is safer, but the within-subjects de-
sign is more effi cient. Mixed designs have some in-
dependent variables that are between-subjects and
others that are within- subjects. In between-subjects
designs, equivalent groups are formed by match-
ing and by randomization. General practice effects
and differential carryover effects in within-subjects
designs are evaluated but not eliminated by coun-
terbalancing. Control conditions provide a clear
baseline against which the condition(s) of interest
can be compared.
5. There are many pitfalls in experimental design.
Demand characteristics result from the subject’s
knowledge that he or she is participating in an
experiment. Experimenter effects are artifacts in-
troduced accidentally, when the experimenter
(through behavior or individual characteristics)
provides clues regarding the purpose of the ex-
periment or infl uences the subject systematically.
Experimenter effects can be minimized by the use
of machinery to preclude subtle differences in the
experimenter’s behavior.
6. Selecting participants from some population is
called sampling. Random sampling means that
each member of the population has an equal
chance of being selected. It is more effi cient to test
subjects in groups, but care must be taken to avoid
contaminating the experiment.

80 P A R T 1 FUNDAMENTALS OF RESEARCH
7. Quasi-experiments in psychology often employ
subject variables. These variables are measures
such as age, IQ, mental health, height, hair color,
sex, and the myriad other characteristics that dif-
fer from one person to the next. Such variables
are determined after the fact, since they are often
inherited dispositions (or at least, people come to
the psychological study with the variable already
determined). Because it is not possible to assign
people randomly to the conditions of interest,
studies that use subject variables are inherently
correlational in nature.
8. To attempt cause-and-effect statements from ma-
nipulation of subject variables, researchers of-
ten match subjects on other variables. Thus, if a
researcher were interested in the effects of hair
color on performance in some task or on the re-
action from others in some situation, he or she
would attempt to control as many other variables
as possible to ensure that hair color was the only
aspect on which people in the various conditions
differed. Matching is often a useful tool for these
purposes, but one must be certain that the pos-
sibility of regression artifacts does not cloud the
conclusions.
9. Regression to the mean refers to the fact that when
a subgroup with extreme scores is taken from a
larger group and retested, members will tend to
score nearer the mean of the whole group on the
second test. If, in matching two groups on the basis
of a fi rst test, the researcher is taking high scorers
from a group that generally does poorly and low
scorers from a group that generally does well, then
even if the groups are not treated differently in
an experiment, the researcher can expect them to
score differently on a second test—simply because
of regression to the mean. This problem is referred
to as a regression artifact.
▼ KEY TERMS
abscissa
baseline
between-subjects design
ceiling effect
control condition
control group
control variable
counterbalancing
critical experiment
data
demand characteristics
dependent variable
differential carryover effects
double-blind experiment
experiment
experimenter effects
fl oor effect
general practice effects
Hawthorne effect
independent variable
interaction
level
matching
mixed design
null results
ordinate
quasi-experiments
random assignment
random selection
randomization
regression artifact
regression to the mean
sampling
small-n design
stability
subject variable
synergism
what-if experiment
within-subjects design
C H A P T E R 3 RESEARCH TECHNIQUES: EXPERIMENTS 81
▼ DISCUSSION QUESTIONS
1. Design an experiment to discover why plumbers get
paid more than college professors. Take a random
sample of plumbers and professors. Have half of
each group perform the job of the other occupa-
tion, while the other occupation either (a) observes
quietly or (b) offers advice. Name the dependent,
independent, and control variables you would select
for this experiment. What are some of the design
problems associated with such an experiment?
2. Transform each of the following problems or state-
ments into at least two testable hypotheses:
(a) You can’t teach an old dog new tricks.
(b) Eating junk food lowers your grade point
average.
(c) A penny saved is a penny earned.
(d) The best way to study is to cram the night be-
fore an exam.
3. Create a fi ctitious experiment with two indepen-
dent variables. Draw hypothetical results that
illustrate interaction and lack of interaction. Label
your graphs carefully.
4. Explain the quotation by Beveridge at the begin-
ning of this chapter.
5. Suppose you wanted to determine whether peo-
ple with long noses have a better sense of humor
than people with shorter noses. Nose length is, of
course, a subject variable. You decide to give two
groups of people with different-sized noses a series
of 20 jokes (which experts have rated as excellent)
to see if the people with long noses like them bet-
ter than those with short noses. What steps would
you take to ensure that some other variable was not
confounded with nose length in your two groups of
people? How would you go about selecting people
for the study, assuming that you had 200 people for
whom you had measures of nose length and many
other characteristics?
WEB CONNECTIONS
Explore the step-by-step presentation of “True Experiments” on the Wadsworth
Psychology Resource Center, Statistics and Research Methods activities at:
http://academic.cengage.com/psychology/workshops
A complete research methods course with numerous links to a variety of important
topics in experimental psychology can be found at:
http://trochim.human.cornell.edu
An award-winning set of online experiments can be found at:
www.psychologie.unizh.ch/somi/ulf/lab/webexppsylab.html

RESEARCH WITH HUMAN PARTICIPANTS
Informed Consent and Deception
Freedom to Withdraw
Protection from Harm and Debriefi ng
Removing Harmful Consequences
Confi dentiality
ETHICS IN RESEARCH WITH ANIMALS
Arguments against Research with Animals
Arguments for Research with Animals
Guidelines for the Use of Animals in Research
SCIENTIF IC FRAUD
MONITORING ETHICAL PRACTICES
SUMMARY
KEY TERMS
DISCUSSION QUESTIONS
WEB CONNECTIONS
SUGGESTED READINGS
PSYCHOLOGY IN ACTION: UNDERSTANDING
AND REMEMBERING CONSENT FORMS
C H A P T E R 4
ETHICS IN PSYCHOLOGICAL RESEARCH
▼ RESEARCH WITH HUMAN PARTICIPANTS
The quotation introducing this chapter is taken from a publication of the American Psy-
chological Association (APA). It comes from a preamble to a lengthy discussion of ethi-
cal principles covering all aspects of psychology and is presented in abbreviated form
here to emphasize the ethical obligations of researchers in all areas of science. These
obligations are straightforward in principle but diffi cult to implement. We examine both
the ethical principles and the problems associated with putting them into practice in
psychology. Psychologists are concerned with the ethics of research involving both hu-
man participants and animals. Although some of this concern is selfi sh, owing to fear of
restriction of research funds and loss of access to subject populations, most psycholo-
gists are ethical persons who have no desire to infl ict harm on anyone.
An experimenter cannot be completely impartial and objective in judging the ethi-
cal issues concerning his or her own research, so most universities and research institu-
tions have peer committees that judge the ethicality of proposed research. Indeed, such
a committee must approve any federally funded research before funding is granted.
Various ethical issues become obvious in the context of an actual research project.
Imagine you are a psychologist interested in determining to what extent depressive
feelings infl uence how well people remember. One very important reason why you
want to study this topic is that depression is a fairly common emotional problem
among college students, and you would like to determine how this problem could
affect academic performance. You decide to do a tightly controlled laboratory experi-
ment to determine the effects of depression on memory. You want to induce depres-
sion in some of your participants, and then compare their memory to that of others
who were not induced to be depressed. You induce depression in your participants
by a procedure devised by Velten (1968). In this procedure people read aloud 60 self-
referent statements associated with the mood in question. In this case, the participant
reads statements that are supposed to induce depression, beginning with relatively
mild ones, such as “Today is neither better nor worse than any other day,” and pro-
gressing to more extreme ones, such as “I feel so bad that I would like to go to sleep
and never wake up.” Velten’s procedure induces a mild, temporary depression; partici-
pants report feeling depressed, and their behavior suffers on a variety of tasks.
Many details of this experiment have not been specifi ed, but it should be obvious
that the welfare of the research participants in this study could be jeopardized (for com-
plete details of this experiment, see Elmes, Chapman, & Selig, 1984). Inducing a nega-
tive mood (such as depression) in college students could have disastrous effects on their
social and intellectual functioning. How can you as an ethical researcher try to preserve
and protect the fundamental human rights of your participants? What would you do to
protect their welfare and at the same time conduct an internally valid experiment?
The double-edged potentiality of scientifi c knowledge poses ethical problems
for all scientists. To the extent that psychological research deals with important
problems and potent methods, psychologists must recognize and alert others
to the fact that the potential for misuse of research increases its potential for
constructive application. (AMERICAN PSYCHOLOGICAL ASSOCIATION, 1982, P. 16)

84 P A R T 1 FUNDAMENTALS OF RESEARCH
In a review of research on mood and memory, Blaney (1986) listed a number of
studies in which depression was induced in college students. In some experiments,
a happy mood was induced in subjects. Do the ethical considerations depend on the
kind of mood—happy or sad—that is induced in a person? Also, researchers have used
several different mood-induction procedures in their experiments. Besides the Velten
(1968) procedure previously described, hypnosis and music have been used to induce
a depressed or happy mood. Do ethical considerations depend on the mood-induction
technique? These questions concerning mood-induction research illustrate how ethical
issues associated with psychological research may vary from study to study.
The APA (2002) provides ethical guidelines for researchers. The association out-
lined the general principles governing the conduct of research and publication prac-
tices. Later in this chapter we consider ethics in animal research and scientifi c fraud.
Now we examine the principles relating primarily to human participants. To consider
how the welfare of the students was protected in the mood-induction studies, the eight
principles that guide research involving human participants are outlined. Read and un-
derstand these ethical principles before you conduct a research project.
8.01 Institutional Approval
When institutional approval is required, psychologists provide
accurate information about their research proposals and
obtain approval prior to conducting the research. They
conduct the research in accordance with the approved
research protocol.
8.02 Informed Consent to Research
(a) When obtaining informed consent as required in Standard
3.10, Informed Consent, psychologists inform participants about
(1) the purpose of the research, expected duration, and proce-
dures; (2) their right to decline to participate and to withdraw
from the research once participation has begun; (3) the foresee-
able consequences of declining or withdrawing; (4) reasonably
foreseeable factors that may be expected to infl uence their
willingness to participate such as potential risks, discomfort, or
adverse effects; (5) any prospective research benefi ts;
(6) limits of confi dentiality; (7) incentives for participation; and
(8) whom to contact for questions about the research
and research participants’ rights. They provide opportunity
for the prospective participants to ask questions and receive
answers. (See also Standards 8.03, Informed Consent for
Recording Voices and Images in Research; 8.05, Dispensing
With Informed Consent for Research; and 8.07, Deception in
Research.)
(b) Psychologists conducting intervention research involving the
use of experimental treatments clarify to participants at the out-
set of the research (1) the experimental nature of the treatment;
(2) the services that will or will not be available to the control
group(s) if appropriate; (3) the means by which assignment to
treatment and control groups will be made; (4) available treat-
ment alternatives if an individual does not wish to participate in
the research or wishes to withdraw once a study has begun; and
(5) compensation for or monetary costs of participating includ-
ing, if appropriate, whether reimbursement from the participant
or a third-party payor will be sought. (See also Standard 8.02a,
Informed Consent to Research.)
8.03 Informed Consent for Recording Voices
and Images in Research
Psychologists obtain informed consent from research participants
prior to recording their voices or images for data collection un-
less (1) the research consists solely of naturalistic observations
in public places, and it is not anticipated that the recording will
be used in a manner that could cause personal identifi cation or
harm, or (2) the research design includes deception, and consent
for the use of the recording is obtained during debriefi ng. (See
also Standard 8.07, Deception in Research.)
8.04 Client/Patient, Student, and Subordinate Research
Participants
(a) When psychologists conduct research with clients/patients,
students, or subordinates as participants, psychologists take
steps to protect the prospective participants from adverse conse-
quences of declining or withdrawing from participation.
(b) When research participation is a course requirement or an
opportunity for extra credit, the prospective participant is given
the choice of equitable alternative activities.
8.05 Dispensing With Informed Consent
for Research
Psychologists may dispense with informed consent only
(1) where research would not reasonably be assumed to
create distress or harm and involves (a) the study of normal
educational practices, curricula, or classroom management
methods conducted in educational settings; (b) only anony-
mous questionnaires, naturalistic observations, or archival
research for which disclosure of responses would not place
participants at risk of criminal or civil liability or damage
their fi nancial standing, employability, or reputation, and
confi dentiality is protected; or (c) the study of factors
related to job or organization effectiveness conducted in
organizational settings for which there is no risk to
participants’ employability, and confi dentiality is protected
or (2) where otherwise permitted by law or federal or
institutional regulations.

C H A P T E R 4 ETHICS IN PSYCHOLOGICAL RESEARCH 85
Informed Consent and Deception
The ethical researcher informs participants, prior to participation, of all aspects of the
research that might reasonably be expected to infl uence willingness to participate and
explains all other aspects of the research about which participants inquire. This means
that the participants must be forewarned about those aspects of the research that may
have detrimental effects. In most psychological research, participants receive complete
information about what they will be asked to do during the research project so that
they can give informed consent about their understanding of the possible problems
associated with participation. Participants are rarely misled as to the nature of the ex-
periences they will have during the experiment. Furthermore, an experimenter usually
states the purpose of the experimental procedure truthfully. Nonetheless, experiment-
ers sometimes mislead participants about the true purpose of an experiment. This false
description is often referred to as a “cover story.” This kind of deception is usually
done to control subject reactivity. For instance, a researcher interested in whether peo-
ple behave more assertively in same-gender groups than in mixed-gender groups tells
people that they will be working on problems that require group cooperation. They are
also told that the purpose of the experiment is to evaluate the diffi culty of these tasks.
The researcher was concerned that participants’ behavior might change if they
knew the real purpose of the experiment. In this case, information regarding the hy-
pothesis under test probably will not change anyone’s decision to participate, but this
information might change performance on the task. Deception of this sort, although
usually harmless, must be considered carefully because the participant’s consent is not
fully informed. A person might choose not to participate in a particular experiment
because he or she does not approve of the purpose of the experiment.
Even more rare than deception concerning the purpose of an experiment is decep-
tion concerning the experiences that the participant will have during the experiment.
8.06 Offering Inducements for Research Participation
(a) Psychologists make reasonable efforts to avoid offering
excessive or inappropriate fi nancial or other inducements for
research participation when such inducements are likely to
coerce participation.
(b) When offering professional services as an inducement for
research participation, psychologists clarify the nature of the
services, as well as the risks, obligations, and limitations. (See
also Standard 6.05, Barter With Clients/Patients.)
8.07 Deception in Research
(a) Psychologists do not conduct a study involving deception
unless they have determined that the use of deceptive tech-
niques is justifi ed by the study’s signifi cant prospective scientifi c,
educational, or applied value and that effective nondeceptive
alternative procedures are not feasible.
(b) Psychologists do not deceive prospective participants about
research that is reasonably expected to cause physical pain or
severe emotional distress. APA Ethics Code 2002 Page 12
c) Psychologists explain any deception that is an integral fea-
ture of the design and conduct of an experiment to participants
as early as is feasible, preferably at the conclusion of their
participation, but no later than at the conclusion of the data
collection, and permit participants to withdraw their data.
(See also Standard 8.08, Debriefi ng.)
8.08 Debriefi ng
(a) Psychologists provide a prompt opportunity for participants
to obtain appropriate information about the nature, results, and
conclusions of the research, and they take reasonable steps to
correct any misconceptions that participants may have of which
the psychologists are aware.
(b) If scientifi c or humane values justify delaying or withhold-
ing this information, psychologists take reasonable measures to
reduce the risk of harm.
(c) When psychologists become aware that research procedures
have harmed a participant, they take reasonable steps to mini-
mize the harm.1
1 Source: From “Ethical principles of psychologists and code of con-
duct,” (2002). American Psychologist, 57, 1060–1073 (also online at
www.apa.org/ethics/code2002.html); Small excerpt from “Guidelines
for ethical conduct in the care and use of animals,” (1996) (from
www.apa.org/science/aguide.html). Copyright © 2002, 1996 by the
American Psychological Association. Reproduced with permission.

86 P A R T 1 FUNDAMENTALS OF RESEARCH
Such deception is, unfortunately, necessary to answer some research questions. For
example, if an investigator wants to see how well people recall information that they
are not actively trying to remember, he or she might not inform participants that the
experiment requires a memory test. Obviously, the omission of information prevents
participants from giving fully informed consent.
Thus, whenever a research question requires deception, the ethical researcher faces
a dilemma. People must be warned if the procedure will place them in serious danger
of physical or psychological harm. Deception in such cases is clearly unethical. When a
procedure involves only minor risks, on the other hand, the decision regarding full dis-
closure to participants is more diffi cult. In all cases, the potential benefi ts of the research
must be weighed against the actual and potential costs to the participant. However, par-
ticipants should always receive as much information as possible, and they should know
that they can end their participation at any time without negative consequences.
Let us reexamine the depression and memory experiment we discussed earlier,
focusing on the question of informed consent. The people who signed up to participate
were told that some of the things they were going to do in the experiment might make
them feel unhappy, and they were given the opportunity to refuse to participate. The
specifi c nature of the manipulation, such as the Velten technique and who was going
to serve in the experimental group, was not disclosed ahead of time. People may have
reacted unusually if they knew all the details. Because the effects of the mood induc-
tion were known to be temporary, the researchers believed that partial information was
enough to permit informed consent. Here, although some information was omitted,
participants were not misled about what to expect in the experiment.
The issues surrounding informed consent and deception often require consider-
able thought and deliberation to arrive at ethical solutions. Every research institution
in this country should have a standing committee that must approve any experimental
procedure involving human subjects. These committees try to ensure the ethical treat-
ment of experimental participants. We discuss these committees in more detail later.
In sum, fully informed consent is the norm in most areas of psychology. Occasion-
ally, some information is withheld or participants are misled so as to prevent subject
reactivity. In such cases, experimenters, as well as members of institutional review
boards, take great care in deciding whether the benefi ts of the procedure outweigh the
risks to the participants.
Freedom to Withdraw
As mentioned briefl y in the previous section, participants should be allowed to de-
cline to participate or to withdraw at any time. Moreover, few people would deny that
people who are unhappy about participating should have the freedom to withdraw.
Where, then, is the ethical dilemma? The major problem revolves around the defi ni-
tion of a willing volunteer participant. Consider the subject pool for the depression
and memory experiment: undergraduate students (mostly freshmen and sophomores)
taking introductory psychology. They sign up to participate in experiments, and they
usually receive some sort of course credit for their service. Are they volunteering when
they sign up, or are they under some sort of coercion that they have inferred from the
situation? If the students actually receive extra credit, they are likely to be acting on
their own volition. If they must participate as part of a course requirement, then the

C H A P T E R 4 ETHICS IN PSYCHOLOGICAL RESEARCH 87
freedom to participate or not is less obvious. When students are required to participate,
they should have some optional way of fulfi lling the requirement, such as writing a
paper or attending a special lecture.
Generally, when the pool of potential participants is a captive audience, such as
students, prisoners, military recruits, and employees of the experimenter, the ethical re-
searcher considers the individual’s freedom to withdraw or to participate. In the depres-
sion and memory experiment, volunteer students were recruited with the lure of extra
credit (participation was not mandatory). When they signed up, they were forewarned
about the possibility of unhappiness (they could agree to participate or not). The instruc-
tions at the beginning of the experiment informed them that they had the option of quit-
ting at any time and would still receive full extra credit (they were free to withdraw).
Protection from Harm and Debriefi ng
The APA suggests an additional safeguard to provide research participants with protec-
tion from harm. The subjects should have a way to contact the investigator following
participation in the research. Even the most scrupulously ethical project of the mini-
mal-risk sort may have unintended aftereffects. Thus, the participant should be able to
receive help or advice from the researcher if problems should arise. We have had par-
ticipants cry (out of frustration and embarrassment) during what was supposed to be
a standard, innocuous memory experiment. Those participants may have carried away
from the experiment a negative self-image or strong feelings of resentment toward the
experimenter in particular or research in general.
Because of such unintended effects, the prudent researcher provides a detailed
debriefi ng, which means that the investigator explains the general purposes of
the research.
Furthermore, the researcher completely describes the manipulations so that any
questions or misunderstandings may be removed.
Let us apply the principles of debriefi ng and protection from harm to the depres-
sion and memory experiment. At the end of that project, the participants were given
a list of phone numbers of people who could be contacted in the unlikely event that
the subjects felt depressed following the experiment. The list of contacts included the
principal investigator, a counselor, and the dean of student affairs and his assistant.
Also, the day after participation, one of the experimenters, who tried to determine
whether the participant was having any negative aftereffects, phoned each subject
who had read the depression-inducing statements.
The participants received thorough debriefi ng. They were told about the mood-
induction procedure and how its effects were temporary. The experimenter answered
any questions asked by the participants.
Removing Harmful Consequences
Debriefi ng participants and giving them phone numbers may not be suffi cient in
a risky project. If a participant could suffer long-term consequences as a result of
serving in a research project, the investigator has the responsibility for removing
harmful consequences.

88 P A R T 1 FUNDAMENTALS OF RESEARCH
The feelings of resentful people may be diffi cult to reverse, because the resent-
ment may be unintended and undetected. However, the ethical investigator must take
steps to minimize known risks.
Prior to the debriefi ng in the depression and memory experiment, the participants
read a series of self-referent statements designed to induce elation. This exercise was
supposed to counteract the effects of the negative mood induced earlier. The partici-
pants were then questioned about their current feelings, and they were also asked to
sign a statement that said they left the experiment feeling no worse than when they
began it. All participants signed the statement, but had they not, a contingent plan was
to keep them in the laboratory under the supervision of one of the experimenters until
they felt better.
Confi dentiality
What a person does in an experiment should be confi dential unless otherwise agreed.
An ethical researcher does not run around saying things like “Bobby Freshman is
stupid; he did more poorly than anyone else in my experiment.” Also, personal infor-
mation about particular participants, such as their attitudes toward premarital sex or
their family income, should not be revealed without their permission. The principle of
confi dentiality seems straightforward, but a researcher can be faced with an ethical
dilemma when trying to uphold confi dentiality.
This dilemma arose in the depression and memory experiment. The experi-
menter was confronted with an ethical problem because he believed it was neces-
sary to violate the principle of confi dentiality in order to uphold the principle of
protection from harm. How did this dilemma develop? One of the fi rst tasks of the
participants was to answer some questions concerning their mental health. They
indicated whether they were currently seeking professional help for a personal prob-
lem. If they were, they provided some details about the problem and the therapeutic
procedure. The participants were assured that their answers were confi dential. They
then completed a clinical test that assessed their current level of depression. If a
participant indicated that he or she was being treated for depression and scored high
on the test, the experiment was discontinued at that point. The researchers wanted
to minimize harm and maximize frank, open responses by assuring the students of
the confi dential nature of their responses and by using the depression test to prevent
a depressed person from becoming even more depressed by the mood-induction
procedure. Nevertheless, an ethical dilemma arose. In the course of the experiment,
two students scored very high on the depression test, and one of them was not un-
dergoing therapy. Because the test was known to be a reliable and valid predictor of
clinically serious depression, the principal investigator believed that it was necessary
to warn one of the college’s counselors about the two students who appeared to
have very high levels of depression. Then, under the guise of a routine interview, the
counselor talked to these students.
This type of dilemma occurs frequently in research. To adhere to one ethical
principle may necessitate violating another. Easy choices vanish when this happens.
In the case we mentioned, if the highly depressed students had suspected that the
investigator had betrayed their confi dence, permanent resentment and mistrust could
have resulted.

C H A P T E R 4 ETHICS IN PSYCHOLOGICAL RESEARCH 89
On the other hand, the investigator could not ignore the fact that these students,
particularly the one not undergoing therapy, were in severe distress. At the time, ensur-
ing that the students received help seemed much more important than upholding their
right to confi dentiality.
As our example illustrates, ethical decisions must sometimes be made on the basis
of pragmatic concerns. In other words, people involved in making decisions about a
research project must focus on how best to protect the participants and at the same
time conduct a meaningful, valid project. The responsibility for ethical practice rests on
the researcher, review boards, and journal editors who review research for publication.
In limited instances a researcher might justify deception, concealment, and breaches
of confi dentiality. However, such questionable ethical practices must be avoided if
possible. Ethical violations are not prerequisites of good research.
▼ ETHICS IN RESEARCH WITH ANIMALS
Although the majority of research in contemporary psychology focuses on humans,
an appreciable number of studies focus on animals (Miller, 1985). Animals are often
used to answer questions that would be impossible or impractical to answer by using
human beings. Some people believe, however, that animals should not be used in vari-
ous kinds of research (Bowd, 1980). For example, Rollin (1985) has argued that if the
concept of legal and moral rights can be applied to human research, it can also be ap-
plied in the same way to animal research. He suggested that the status of research with
animals needs to be elevated to that of human subjects, with many of the same rules
that govern human research applied to animals. Reports in the media have discussed
the purported mistreatment of laboratory animals and the attempts of animal-rights
advocates to limit the use of animals in research. Therefore, a consideration of why ani-
mals are used in research is important, and an understanding of the ethical safeguards
for animals is necessary.
Animals are also the subjects of research because they are interesting and be-
cause they form an important part of the natural world. The numbers of bird-watchers
and other amateur naturalists, as well as the numerous comparative psychologists and
ethologists, readily attest to the interest. More important in terms of ethical concerns,
however, is that animals serve as convenient, highly controlled models for humans and
other animals. The APA (2003b) provides additional information regarding the use of
animals in psychological research.
Arguments Against Research with Animals
Ethics prohibit experimentally induced brain damage in human beings, preclude delib-
erate separation of a human infant from its parents, forbid testing of unknown drugs on
human beings, and generally exclude dangerous and irreversible manipulations on hu-
man beings. Animal-rights advocates believe that research on animals should have the
same prohibitions. According to the animal-rights advocates, researchers need to up-
hold the rights of both human beings and animals because, for example, they believe
that experimental destruction of a monkey’s brain is as ethically reprehensible as the
destruction of the brain of a human being. Three points summarize the animal-rights

90 P A R T 1 FUNDAMENTALS OF RESEARCH
advocates’ position: (1) Animals feel pain and their lives can be destroyed, as is true
of humans (Roberts, 1971); (2) destroying or harming any living thing is dehumanizing
to the human scientist (Roberts, 1971); and (3) claims about scientifi c progress being
helped by animal research are a form of racism and, like interracial bigotry, are com-
pletely unwarranted and unethical. Neglecting the rights and interests of other species
has been called speciesism by Singer (1995). Most psychologists have reservations
about these points, which we consider next.
Arguments for Research with Animals
The fi rst point is that animals feel pain and suffering. Certainly, this is true, but ethical
standards exist in all scientifi c disciplines that use animals as research subjects. A major
portion of these principles concerns the proscription of undue pain and inhumane
treatment. No ethical psychologist would deliberately infl ict undue harm on an animal.
When pain and suffering are infl icted on an animal, it is only after considerable delib-
eration by the scientist and the appropriate ethics review boards. Such deliberations
weigh the suffering of the animal against the potential benefi ts of the experiment. Only
when the benefi ts far exceed the harm is the experiment approved and conducted.
Finally, an important point to make about behavioral research on animals is that much
of it does not involve pain or physical harm to them.
The second plank of the animals-rights platform is that the destruction of any liv-
ing thing is dehumanizing to the human scientist. Presumably, plants are not meant
to be included here, for as human beings, we must destroy plants, if not animals, to
survive. Even if this proscription against killing living things is limited to animals, it has
a number of serious implications beyond eliminating animal research. If one uses this
argument against animal research, then one should not eat meat of any kind. Likewise,
one should not use any products derived from the destruction of animals (e.g., leather).
Finally, if the destruction of animals is dehumanizing, then is it not also dehumanizing
to benefi t from the destruction of animals? If so, then a true believer in animal rights
should forsake most of the wonders of modern medicine because virtually all of it
benefi ted from animal research. However, consistent adherence to a belief in animal
rights is often diffi cult. The diffi culty was illustrated in the results of a survey of activists
who attended a large rally in support of animal rights (Plous, 1991). Plous reports that
a substantially higher percentage of activists claim to be vegetarians or vegans (people
who eat no animal products, including milk and eggs) than do people in general. Many
activists say they do not use leather goods. Nevertheless, a majority of animal-rights
activists (53 percent) report they buy leather goods, ingest animal fl esh, or both.
Finally, there is the charge that scientifi c progress at the expense of animals is
simply speciesism, the belief that the sacrifi ce of members of other species is justifi ed
if our species is benefi ted. As a criticism against animal research, this argument ignores
the fact that a signifi cant amount of animal research benefi ts the welfare of animals. For
example, Miller (1985) points out that research on learned taste aversion in rats has led
to new, nonlethal means of keeping coyotes away from sheep and crows away from
crops. Similarly, research on the imprinting of hatchling ducks to human caretakers led
to better preparation of artifi cially incubated condor chicks for the wild.
In any case, even if using animals for the benefi t of human beings is a form of spe-
ciesism, it is doubtful that many people would give up the benefi ts already achieved or
C H A P T E R 4 ETHICS IN PSYCHOLOGICAL RESEARCH 91
even give up the possible future benefi ts to be derived from animal research. Consider
this quote from Robert J. White, an eminent neuroscientist and neurosurgeon, who
conducted research on monkeys that involved removing the brain of the animal:
As I write this article, I relive my vivid experiences yesterday when I removed at op-
eration a large tumor from the cerebellum and brain stem of a small child. This was a
surgical undertaking that would have been impossible a few decades ago, highly dan-
gerous a few years ago, but is today, thanks to extensive experimentation on the brains
of lower animals, routinely accomplished with a high degree of safety. (1971, p. 504)
In addition to the benefi ts of experimental neurosurgery, numerous benefi ts are
derived from behavioral research with animals. Miller (1985) notes that psychologi-
cal experiments with animals have led directly to benefi ts in the treatment of such
diverse psychological problems as bedwetting, phobias, compulsive disorders such as
anorexia nervosa, and depression. Moreover, animal experiments have given rise to
behavioral technologies such as biofeedback that have been used to help individuals
with neuromuscular disorders regain control over their bodies. Psychological research
with animals has also demonstrated experimentally the link between psychological
stress and physical health. Other studies have demonstrated that the detrimental effects
of physically separating an infant from its parents—as is necessary when a newborn
must be placed in an incubator to sustain its life—can be largely reversed simply by
stroking the infant during three 15-minute periods during the day. Miller points to the
substantial benefi ts of psychological research on animals, contrary to the claims made
by some animal-rights activists (Plous, 1991).
Gallup and Suarez (1985) reviewed the rationale, extent, and use of animals in
psychological research. They considered the possible alternatives and concluded that
in many cases there is no viable alternative to the use of animals in psychological re-
search. Professional support for the use of animals in both research and teaching has
remained high even as the use of animals in research has declined over time (Rowan
& Lowe, 1995). Eighty percent of respondents in a survey of APA members indicated
general support for animal research (Plous, 1996a). Similar results were obtained from a
sample of undergraduate psychology majors (Plous, 1996b). The psychologists did not
uniformly support all animal research. Many disapproved of studies involving pain or
death, and the majority supported federal protection of rats, mice, and birds equivalent
to that provided for primates (Plous, 1996a).
Guidelines for Use of Animals in Research
Psychologists have focused on the humane and ethical treatment of animals used in re-
search for a long time (Greenough, 1992). For example, one early statement of humane
treatment (Young, 1928) asserted that animals used as research subjects “. . . shall be
kindly treated, properly fed, and their surroundings kept in the best possible sanitary
condition” (p. 487). This concern is echoed in the modern guidelines of the APA (2003a)
governing research with animals, which state as a general principle the following:
Psychology encompasses a broad range of areas of research and applied endeavors.
Important parts of these endeavors are teaching and research on the behavior of non-
human animals, which contribute to the understanding of basic principles underlying

92 P A R T 1 FUNDAMENTALS OF RESEARCH
behavior and to advancing the welfare of both human and nonhuman animals. Clearly,
psychologists should conduct their teaching and research in a manner consonant with
relevant laws and regulations. In addition, ethical concerns mandate that psychologists
should consider the costs and benefi ts of procedures involving animals before proceed-
ing with the research. (p. 1)
As in virtually any human enterprise, abuses of humane treatment sometimes occur
in the use of animals in research. However, these abuses go against the standard prac-
tice of animal researchers. Ethical researchers treat animals humanely. When unethical
treatment of animals is uncovered, the researchers in question should be punished. One
should not conclude that because abuses occur, animal research should be prohibited.
The typical view of animal-rights activists (Plous, 1991) is based on a philosophical posi-
tion, and this position prohibits the use of animals for human benefi t as a general rule,
not just for research. You must decide for yourself what attitude to take toward animal
research, but the importance of the issue necessitates that you critically consider each
side of the debate and its implications.
The following principle outlines the primary considerations for researchers using
animal subjects as specifi ed in the APA (2002) ethics code. A more-detailed specifi ca-
tion of these principles is in APA’s (2003a) Guidelines for Ethical Conduct in the Care
and Use of Animals.
8.09 Humane Care and Use of Animals in Research
(a) Psychologists acquire, care for, use, and dispose of animals
in compliance with current federal, state, and local laws and
regulations, and with professional standards.
(b) Psychologists trained in research methods and experienced
in the care of laboratory animals supervise all procedures
involving animals and are responsible for ensuring appropriate
consideration of their comfort, health, and humane treatment.
(c) Psychologists ensure that all individuals under their supervi-
sion who are using animals have received instruction in research
methods and in the care, maintenance, and handling of the spe-
cies being used, to the extent appropriate to their role. (See also
Standard 2.05, Delegation of Work to Others.)
(d) Psychologists make reasonable efforts to minimize the dis-
comfort, infection, illness, and pain of animal subjects.
(e) Psychologists use a procedure subjecting animals to pain,
stress, or privation only when an alternative procedure is
unavailable and the goal is justifi ed by its prospective scientifi c,
educational, or applied value.
(f) Psychologists perform surgical procedures under appropriate
anesthesia and follow techniques to avoid infection and mini-
mize pain during and after surgery.
(g) When it is appropriate that an animal’s life be terminated,
psychologists proceed rapidly, with an effort to minimize pain
and in accordance with accepted procedures.1
1 Source: American Psychological Association. (2002). Ethical principles
of psychologists and code of conduct, 2002. Copyright © 2002 by the
American Psychological Association. Reprinted with permission.
▼ SCIENTIFIC FRAUD
In Chapter 13 we discuss inadvertent researcher bias, in which the behavior of the sci-
entist accidentally contaminates the results of a research project. Here, in the context
of ethics, we consider deliberate bias by scientists—fraud. When scientists engage in
research, they expend substantial time and effort, and their prestige and career ad-
vancement often depend on the success of their work. Under these pressures, some
scientists are not completely honest in the treatment of their experiments and data. In-
stances of deliberate falsifi cation can range from “fudging” or “cooking” data—in which
results are manipulated so as to make them look better—to “forging” data—in which

C H A P T E R 4 ETHICS IN PSYCHOLOGICAL RESEARCH 93
observations are reported that were never in fact made (Kohn, 1986). A survey of doc-
toral candidates and science faculty indicates that these kinds of fraudulent practices
occur with enough frequency to merit some concern about the ethical status of science
(Swazey, Anderson, & Lewis, 1993).
A frequently cited example of fudging is the case of Sir Cyril Burt. He was a well-
respected psychologist who studied the role of heredity in intelligence. He published
several papers reporting data collected on identical twins, some reared together, others
reared apart. The data were collected in the period 1913 to 1932. In three papers, he
reported a correlation in IQ scores of 0.944 for twins reared together and of 0.771 for
twins reared apart. Although the correlations were identical for the three papers, each
reported an appreciably different number of subjects. That the correlations remained
unchanged despite the addition of new subjects is extremely improbable. This evi-
dence, along with other suspicious facts, led some scientists and historians to conclude
that Burt’s data were not completely honest (Broad & Wade, 1982; Kohn, 1986).
There are a number of examples of forging data. A famous case is that of the
Piltdown man discovered in England in 1912. The Piltdown man consisted of a skull of
humanoid appearance and an apelike jawbone. The bones supposedly represented the
“missing link” between apes and humans. The fi nding was widely, although not univer-
sally, accepted for 57 years until suspicious scientists used a variety of dating methods
to show that the jaw was of modern origin whereas the skull was substantially older.
The scientists discovered that the jaw was identical to that of an orangutan. Piltdown
Man was a hoax, but who contrived the hoax is not known.
Deliberate researcher bias can be more subtle than forging or even fudging data. A
researcher can choose not to report results that are incompatible with a personal theory
or even with his or her political or social beliefs. Similarly, a biased scientist may design
projects such that negative or ideologically bad results are unlikely.
How do we detect fraud? Science is self-correcting. The truth will win out. When an
important fi nding is published, the scientifi c community takes it seriously and pursues
the implications of the reported data. When other scientists try to repeat the fraudulent
experiment, they will fail to get the reported results, and such failures will eventu-
ally lead scientists to conclude that the fi ndings were not real. Thus, the repetition of
experiments is important to detecting scientifi c fraud (Barber, 1976). Direct, specifi c
repetitions are called replications. It may take many failed replications and years of
effort, however, before the entire scientifi c community agrees that the fraudulent results
should be discarded, a fact that illustrates the serious consequences of scientifi c fraud.
A related problem is plagiarism, or taking credit for someone else’s ideas, data,
or words. Although it may be obvious to you that you should not use someone else’s
data as your own, plagiarism may be much less obvious in other cases. If you are us-
ing someone else’s words, you are obliged to use quotation marks with an appropriate
citation. Slightly rewording someone else’s writing is also inappropriate, especially
without proper citation. To avoid plagiarism in this instance, you might write without
looking directly at the source you are describing. The trickiest case may be that of idea
plagiarism. If the idea came from someone else, you should give that person credit
even if you are not quoting him or her directly. One potential problem is that people
may accidentally lose track of who generated which ideas, especially since ideas are
often generated in on-the-fl y verbal discussions among colleagues. A way to avoid this
problem is to agree on authorship at the beginning of a project, contingent on work
progressing as allocated.
94 P A R T 1 FUNDAMENTALS OF RESEARCH
We summarize here the remainder of the ethical principles (8.10–8.15) of the APA
(2002). These have to do with honesty in reporting data and in publication practices.
Psychologists neither plagiarize nor fabricate data. Authorship credit is taken only for
substantial contributions to work actually done. Status does not automatically confer
authorship credit, and dissertation work ordinarily has the student as principal author.
Researchers appropriately divulge republication of data, and they should share re-
search data with other professionals. Finally, reviewers of papers, grants, and proposals
maintain the confi dentiality of the information they have reviewed.
Most ethical review boards, which are discussed in the next section, monitor the
scientifi c practices that could lead to scientifi c fraud. Moreover, individuals guarantee
federal granting agencies that they have not engaged in fraudulent practices. Upon
discovering fraud, the granting agencies suspend the grant and may attempt to re-
cover funds that have been expended. Researchers who are guilty of fraud will not
receive additional grants. Thus, institutions and granting agencies also play a role in
containing fraud.
▼ MONITORING ETHICAL PRACTICES
As you are well aware by now, the APA provides ethical guidelines for psychological
research. Acceptance of membership in the association commits the member to adher-
ence to these principles. The principles are also intended for nonmembers, including
students of psychology and others working for a psychologist.
The APA established an Ethics Committee that fulfi lls a number of purposes.
Through publications, educational meetings, and convention activities, the Ethics Com-
mittee educates psychologists and the public about ethical issues related to psychologi-
cal research. The committee also investigates and adjudicates complaints concerning
unethical research practices. Examples of these cases can be found in an APA (1987)
publication titled Casebook on Ethical Issues. The Ethics Committee also publishes an
annual report in American Psychologist. The APA Ethical Principles we describe in this
chapter were approved in 2002 and went into effect in June 2003.
A substantial amount of psychological research is funded by one of the arms of
the Public Health Service (PHS), which is a part of the United States Department of
Health and Human Services. The PHS has a division called the Offi ce of Research In-
tegrity, which has as its duty protecting the integrity of PHS research programs. This is
a major effort. Each year the PHS provides several billion dollars to support more than
30,000 research grants in a number of disciplines, including psychology. The Offi ce of
Research Integrity and the APA combine to consider the prevention fraud and protec-
tion of participants. Furthermore, any institution that receives money from the federal
government—which means virtually every U.S. institution that engages in research—
must have an institutional review board (IRB) that oversees the protection of hu-
man participants and an institutional animal care and use committee (IACUC)
that oversees the protection of animal subjects. A researcher sends a detailed protocol
to the IRB (or IACUC). Presumably, the protocol tries to take account of the pertinent
ethical principles, and the committee members then judge the ethicality of the project.
All experiments must be approved by the members of these committees. Federal regu-
lations require that each IRB have at least fi ve members who are qualifi ed to review
the kind of research typically conducted within the institution. Furthermore, if an IRB

C H A P T E R 4 ETHICS IN PSYCHOLOGICAL RESEARCH 95
regularly reviews research involving vulnerable individuals (e.g., children, prisoners,
the mentally disabled), the committee should include at least one member whose area
of expertise deals with such individuals. There must be at least one member whose
primary concern is in a scientifi c area and one member whose primary concern is in a
nonscientifi c area. There must also be someone on the committee, usually an attorney,
who can ascertain whether proposed research violates any laws or federal regulations.
Finally, regulations require that at least one member of the committee be otherwise free
from affi liation with the institution. This diversity in membership helps to ensure that
the rights of individuals participating in research are protected.
How does an IRB make its decision regarding the ethicality of a particular research
project? First, it assesses the level of risk involved in the procedure. Many psychologi-
cal experiments are classifi ed as involving only minimal risk. Minimal risk means that
the experimental procedures involve no greater risk than is associated with daily activi-
ties. If the chairperson of the IRB believes that the research is of minimal risk, then the
entire membership of the IRB need not review the research.
If greater than minimal risk is deemed necessary for research purposes, then this
usually requires the full attention of the entire membership of the IRB. The IRB must
decide if these risks are reasonable in relation to the benefi ts that would be gained
from the research. The IRB also ensures that participants receive full information prior
to the experiment, and it ensures that the research procedures provide safety and con-
fi dentiality. The deliberations of the IRB can be extensive, and their recommendations
may seem onerous to some researchers, even though the intent of the IRB is clearly
to ensure the ethical treatment of the participants. A recent report (Keith-Spiegel &
Koocher, 2005) argues that some ethical short cuts arise from the perception of some
researchers that the IRB is unfair. Keith-Spiegel and Koocher suggest that “Applied
to IRBs and research scientists, striving for fairness on the part of the IRBs should
enhance perceptions of fairness. The result should encourage responsible behavior
by the researchers that, in turn, would serve as a preventative protection of human
research participants” (p. 347).
An acquaintance with the institutional review process should help to reassure you
that ethical research in psychology, and in other sciences, is the rule, not the exception.
Because of safeguards built in to the structure of IRB and IACUC committees, scientists
cannot simply rely solely on their own judgment to protect the humans and animals
participating in their experiments. Furthermore, the boards help to emphasize honesty
in research, which aids in reducing fraudulent practices.
▼ SUMMARY
1. An ethical investigator protects the welfare of re-
search participants by following the ethical stan-
dards of the APA.
2. Informing the participant about the experiment
prior to participation and minimal use of deception
on the part of the investigator allow the participant
to make a reasoned judgment about whether to
participate.
3. The participant has the right to decline to serve in
an experiment or to withdraw from an experiment
at any time.
4. In an ethical investigation, the participant is pro-
tected from physical and mental harm.
5. After the data have been collected, participants
should be carefully debriefed to remove any mis-
conceptions that may have arisen.
96 P A R T 1 FUNDAMENTALS OF RESEARCH
▼ KEY TERMS
confi dentiality
debriefi ng
deception
fraud
freedom to withdraw
informed consent
institutional animal care and use committee (IACUC)
institutional review board (IRB)
plagiarism
protection from harm
removing harmful consequences
replication
speciesism
▼ DISCUSSION QUESTIONS
1. Reconsider the ethical principles presented in this
chapter and read the list of ethical principles pre-
sented by the APA (1987, 2002).
2. Read selections from the Casebook on Ethical
Issues published by the APA (1987), which is
probably available in your library. This book
describes the background of different ethical com-
plaints, how the complaints came to be sent to
the Ethics Committee, and how the cases were
adjudicated. Select two cases and consider the
ethical principles involved in the case. Describe
why you agree or disagree with the adjudication
of the Ethics Committee.
3. Read two of the articles listed in the following Sug-
gested Readings section. These articles describe
the ethical issues associated with different types of
psychological research. Consider the general ethi-
cal principles that apply in both cases. Describe
how the ethical issues differ between the two types
of research discussed in the articles.
WEB CONNECTIONS
In addition to the treatment of ethics by the APA at http://www.apa.org, there is a
good site containing ethical dilemmas and exercises related to those dilemmas:
http://onlineethics.org/reseth/psychindex.html
Another good site concerned with fraud, values, and other ethical issues, including
responsible research, can be found at:
http://www.nap.edu/readingroom/books/obas/
6. Any harmful consequences resulting from an ex-
periment should be removed by the investigator.
7. Unless the participant otherwise agrees, informa-
tion relating to his or her participation is confi -
dential.
8. Attempts to uphold ethical principles sometimes
lead to a dilemma in that adherence to one prin-
ciple may violate another.
9. When animal subjects are used, care should be
taken to minimize their pain and discomfort.
10. Ethical scientists are honest. They do not engage
in activities that misrepresent the conduct and
outcome of research.
11. Scientifi c fraud can be detected by replications
of research, and institutional boards and granting
agencies (such as the Offi ce of Research Integrity)
monitor research to prevent or stop fraud.
12. IRBs and IACUCs help monitor ethical practices in
research and ensure the ethical treatment of hu-
man participants and animal subjects.

C H A P T E R 4 ETHICS IN PSYCHOLOGICAL RESEARCH 97
▼ SUGGESTED READINGS
Bowd, A. D. (1980). Ethical reservations about psychological research with animals.
Psychological Record, 30, 201–210.
Devenport, L. D., & Devenport, J. A. (1990). The laboratory animal dilemma: A solution
in our backyards. Psychological Science, 1, 215–216.
Goodyear, R. K., Crego, C. A., & Johnston, M. W. (2003). Ethical issues in the supervi-
sion of student research: A study of critical incidents. In D. N. Bersoff (Ed.), Ethical
confl icts in psychology (3rd ed., pp. 429–435). Washington, DC: American Psychologi-
cal Association. (Reprinted from Professional Psychology: Research and Practice, 23,
203–210.)
Hoff, C. (1980). Immoral and moral uses of animals. New England Journal of Medicine,
302, 115–118.
Imber, S. D., Glanz, L. M., Elkin, I., Sotsky, S. M., Boyer, J. L., & Leber, W. R. (1986).
Ethical issues in psychotherapy research: Problems in a collaborative clinical study.
American Psychologist, 41, 137–146.
Melton, G., & Gray, J. (1988). Ethical dilemmas in AIDS research: Individual privacy and
public health. American Psychologist, 43, 60–64.
Milgram, S. (1977). Ethical issues in the study of obedience. In S. Milgram (Ed.), The
individual in a social world (pp. 188–199). Reading, MA: Addison-Wesley.
Miller, N. E. (1985). The value of behavioral research on animals. American Psychologist,
40, 423–440.
Scarr, S. (1988). Race and gender as psychological variables: Social and ethical issues.
American Psychologist, 43, 56–59.
Sieber, J. E., & Stanley, B. (1988). Ethical and professional dimensions of socially sensitive
research. American Psychologist, 43, 49–55.
Smith, C. P. (1983). Ethical issues: Research on deception, informed consent, and de-
briefi ng. In L. Wheeler & P. Shaver (Eds.), Review of personality and social psychology
(Vol. 4, pp. 297–328). Beverly Hills, CA: Sage.
PSYCHOLOGY IN ACTION
Understanding and Remembering Consent Forms
According to the APA (2002), psychological experiments require a subject’s informed
consent before his or her participation. How meaningful is a subject’s signature on a
consent form, however, if he or she did not understand and does not remember the
information from the consent form?
Mann (1994) had people read either a consent form or an information sheet about
a hypothetical functional magnetic resonance imaging (fMRI) brain-scanning experi-
ment. The information sheet was the same as the consent form, except that it did not
require a signature. Subjects then answered questions about the alleged upcoming

98 P A R T 1 FUNDAMENTALS OF RESEARCH
procedure. Even though they had just read the consent form/information sheet, only a
minority of Mann’s subjects were able to answer the following questions correctly:
▼ What type of device will we use to study your brain? (38 percent correct)
▼ How does this device work? (47 percent)
▼ Are there risks to this procedure? (48 percent)
▼ What can you do if the sound of the machine bothers you? (45 percent)
▼ What can you do if you have a complaint about the study? (39 percent)
▼ What will the researchers do for you if you get hurt? (47 percent)
▼ Name two of the four things your signature on the consent form means. (20 percent)
In addition, 62 percent of the subjects who had signed the consent form thought they
had lost their right to sue the experimenter, compared with only 16 percent of those
who had merely read the information sheet.
If you are planning a study of your own, you will have created a consent form
that you can use in this demonstration. If not, ask your teacher for one. Design a series
of questions that will test people’s comprehension and memory for the consent form.
Have your friends read the consent form, and then ask them to answer (from memory)
your questions. How much do your friends remember about what they have just read?
Do they know the risks and benefi ts associated with the study? If not, have they really
given their informed consent even though they signed the forms? ■

99
HOW TO DO A L ITERATURE SEARCH
THE PARTS OF AN ARTICLE
Title and Author(s)
Abstract
Introduction
Method
Results
Discussion
References
CHECKLIST FOR THE CRIT ICAL READER
Introduction
Method
Results
Discussion
Checklist Summary
A SAMPLE JOURNAL ARTICLE
WRIT ING A RESEARCH REPORT
Format
Sample Manuscript
Style
Publishing an Article
SUMMARY
KEY TERMS
WEB CONNECTIONS
LABORATORY RESOURCE
PSYCHOLOGY IN ACTION: A L ITERATURE SEARCH
C H A P T E R 5
HOW TO READ AND WRITE RESEARCH REPORTS
Trying to read a psychology journal article for the fi rst time can be a challenging
experience. Researchers write articles for other researchers, so they use jargon and a
terse writing style. These features aid communication among scholars in a particular
fi eld, who can read short reports and understand them. But such writing can be diffi cult
to comprehend for students beginning their study of a fi eld. This chapter is designed
to prepare you for your fi rst encounter with the literature of experimental psychology.
Because psychology is a science, progress is measured by the accumulation of knowl-
edge in the various fi elds. Researchers spend a great deal of their time reading and
writing journal articles in an effort to contribute to this body of knowledge. Even if your
career in psychology extends no further than this course, you will discover that critical
thinking and writing skills are invaluable for living in a world that revolves around infor-
mation. To help you become fl uent in the art of reading and writing research reports, in
this chapter we describe the format and style most often used in journal articles. Hints
are provided to help you become a critical reader, skilled at objectively evaluating an
article. With some practice, you will far surpass the Mock Turtle and not have to “reel
and writhe” your way through every psychology article you read. The chapter ends
with some recommendations for writing a research report.
▼ HOW TO DO A LITERATURE SEARCH
Once you have come up with a research idea, the next step is usually to conduct a
literature search. The purpose of a literature search is to fi nd out what other research-
ers have previously discovered about a particular topic. This is done by tracking down
published articles in which researchers have reported their scientifi c fi ndings.
The easiest way to conduct a literature search is by computer. Many libraries
allow you to access electronic databases that contain abstracts of articles from jour-
nals that publish psychological research. More will be said about abstracts later in this
chapter, but typically they are short summaries (180 words or less) of the experiments
in the article. One of the most important electronic databases is PsycINFO, which cur-
rently contains more than 2 million records. With an electronic database, you provide
a topic and the computer scans for abstracts related to that topic. Some databases
also allow you to scan for government documents and technical reports that often do
not have abstracts. Another popular way to conduct a computerized literature search
is to use the Internet search engine Google Scholar (http://scholar.google.com/),
which scans scholarly literature in many disciplines, including psychology. (See the
Psychology in Action section at the end of this chapter for an example of how to do
an electronic search.)
An excellent electronic resource for learning about the latest research fi ndings is
the Social Science Citation Index. By entering information about a key article that you
“I couldn’t afford to learn it,” said the Mock Turtle with a sigh. “I only took the
regular course.” “What was that?” inquired Alice. “Reeling and Writhing, of
course.” (LEWIS CARROLL)

C H A P T E R 5 HOW TO READ AND WRITE RESEARCH REPORTS 101
have already found, you can obtain a list of more recent articles that have cited your
article and view their abstracts. Because these articles contain a discussion of your key
article, it is very likely that they are directly related to your topic of interest. This is an
extremely effi cient way to bring yourself up to date in some specifi c content area.
After you have found an abstract of interest to you, you can then fi nd the entire
article in your library or send a note to the author requesting a reprint of the article or
additional information. Many libraries now provide access to electronic versions of re-
search journals, so you may be able to download the article directly from a computer.
Once you have done your literature search and obtained the articles relevant to
your research interest, the next step is to read the articles.
▼ THE PARTS OF AN ARTICLE
The basic psychology article consists of seven parts: title and author(s), abstract, intro-
duction, method, results, discussion, and references. Each part has an important func-
tion and is a necessary component of the article.
Title and Author(s)
The title gives you an idea of the contents of an article. Because titles must be short
(10 to 12 words), the most common type of title states only the dependent and indepen-
dent variables—for example, “Rate of bar pressing as a function of quality and quantity
of food reward.” Although this title is not particularly appealing, it conveys important
information. The title and author(s) of each article typically occupy a prominent place
in a given journal issue, such as the inside front cover, back cover, or fi rst page.
As you continue to gain knowledge in a particular content area, you will become
familiar with many researchers. You may start to pay attention to the authors fi rst and
then look at the titles. After you have read several articles published by the same
author, you will grow to understand that writer’s viewpoints and how they differ from
those of other researchers.
So many psychology articles are published each month that no one has the time
to read all of them. The table of contents is a fi rst step to selecting those articles rel-
evant to your own interests. But an even better decision can be made by consulting the
abstract and the references of an article.
Abstract
The abstract is a short paragraph (not to exceed 180 words) that summarizes the key
points of an article. According to the Publication Manual of the American Psychologi-
cal Association (APA, 2001), it should be “. . . a brief, comprehensive summary of the
contents of the article; it allows readers to survey the contents of an article quickly”
(p. 12). The abstract is the best way to discover quickly what an article is about. A
well-written journal abstract will convey the problem under investigation, the proce-
dure used to explore the problem, the results, the conclusions, and the implications or
applications of the research fi ndings. This information provided in brief allows you to
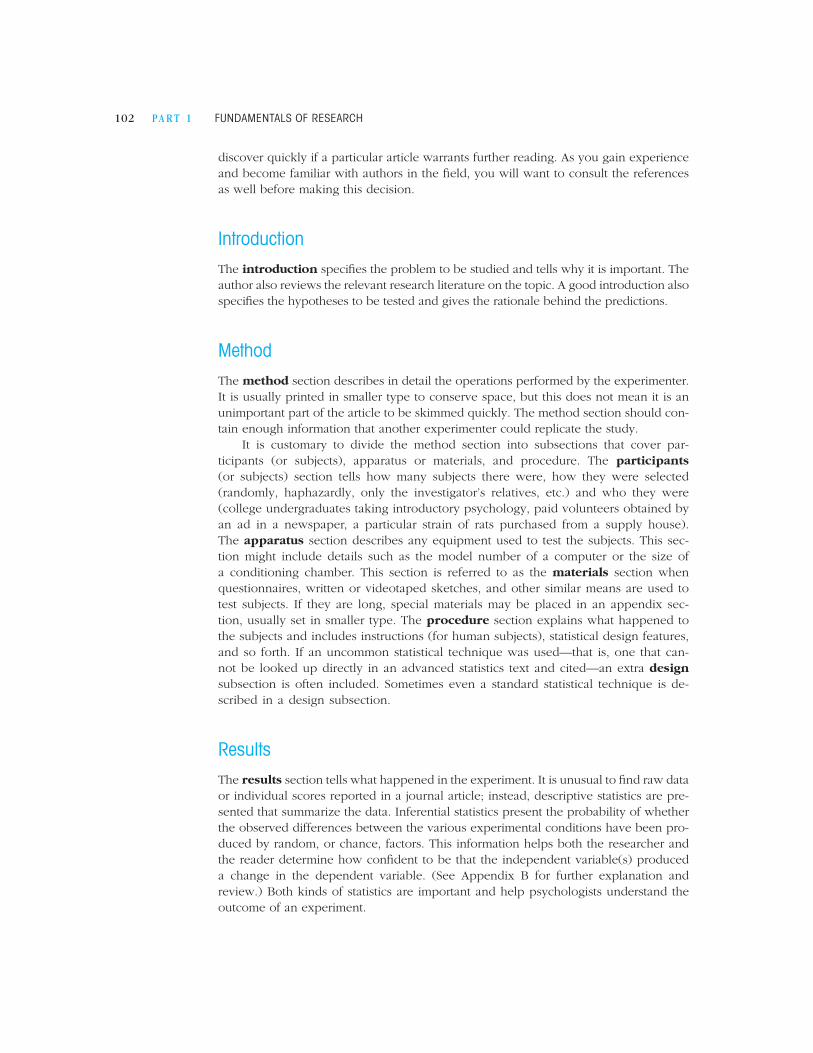
102 P A R T 1 FUNDAMENTALS OF RESEARCH
discover quickly if a particular article warrants further reading. As you gain experience
and become familiar with authors in the fi eld, you will want to consult the references
as well before making this decision.
Introduction
The introduction specifi es the problem to be studied and tells why it is important. The
author also reviews the relevant research literature on the topic. A good introduction also
specifi es the hypotheses to be tested and gives the rationale behind the predictions.
Method
The method section describes in detail the operations performed by the experimenter.
It is usually printed in smaller type to conserve space, but this does not mean it is an
unimportant part of the article to be skimmed quickly. The method section should con-
tain enough information that another experimenter could replicate the study.
It is customary to divide the method section into subsections that cover par-
ticipants (or subjects), apparatus or materials, and procedure. The participants
(or subjects) section tells how many subjects there were, how they were selected
(randomly, haphazardly, only the investigator’s relatives, etc.) and who they were
(college undergraduates taking introductory psychology, paid volunteers obtained by
an ad in a newspaper, a particular strain of rats purchased from a supply house).
The apparatus section describes any equipment used to test the subjects. This sec-
tion might include details such as the model number of a computer or the size of
a conditioning chamber. This section is referred to as the materials section when
questionnaires, written or videotaped sketches, and other similar means are used to
test subjects. If they are long, special materials may be placed in an appendix sec-
tion, usually set in smaller type. The procedure section explains what happened to
the subjects and includes instructions (for human subjects), statistical design features,
and so forth. If an uncommon statistical technique was used—that is, one that can-
not be looked up directly in an advanced statistics text and cited—an extra design
subsection is often included. Sometimes even a standard statistical technique is de-
scribed in a design subsection.
Results
The results section tells what happened in the experiment. It is unusual to fi nd raw data
or individual scores reported in a journal article; instead, descriptive statistics are pre-
sented that summarize the data. Inferential statistics present the probability of whether
the observed differences between the various experimental conditions have been pro-
duced by random, or chance, factors. This information helps both the researcher and
the reader determine how confi dent to be that the independent variable(s) produced
a change in the dependent variable. (See Appendix B for further explanation and
review.) Both kinds of statistics are important and help psychologists understand the
outcome of an experiment.

C H A P T E R 5 HOW TO READ AND WRITE RESEARCH REPORTS 103
Either tables or graphs may be used to describe and summarize data. It is often
helpful to draw a graph for yourself from the tabular data. If an article contains several
fi gures, check that the scales are comparable, so that effects can be easily compared
across different fi gures. The way a graph is drawn can be misleading, as the following
example illustrates.
Imagine that a psychologist is interested in how people perceive written English
words. Either a word or a nonword—letters that follow the pattern of written English but
do not spell a real word (e.g., nale)—is presented visually. The participants must press
one button if it is a word or press a different button if it is a nonword. This is called a lexi-
cal decision. In another condition, the participant must pronounce the word or nonword
when it is presented. This is called naming. An experiment to compare naming and lexi-
cal decisions was performed by Frost, Katz, and Bentin (1987). Their results showed how
long it took people to respond to high-frequency English words and to nonwords.
We have replotted their data in Figure 5.1. At fi rst glance, the two panels look quite
different. Examining panel (a), we might conclude that naming and lexical decisions
are quite similar. But from panel (b) we might conclude not only that naming is faster
but also that the difference between words and nonwords is greater for lexical deci-
sions than for naming. Which fi gure is correct?
Actually, the same data are presented in both panels. The trick is that the vertical
scales are plotted differently. One panel has reaction time (the time between the visual
presentation and responding) measured in seconds, whereas the other plots reaction
time in milliseconds. Since a millisecond is one one-thousandth of a second, the two
graphs appear to be different. Also, the scale is “broken” in panel (b), so that measures
begin at 520 milliseconds, which further dramatizes the difference. Clearly, the way a
graph is drawn can emphasize or conceal results. (See Appendix B for a further example
of this point.)
But which way of graphing the results is right? In a sense, both are, because both
can be argued to portray matters accurately. However, if statistical tests have shown a
difference to exist between the two measures, then the graph in panel (b) more accu-
rately captures the relation between measures. This was the scale used by Frost, Katz,
and Bentin (1987) to portray their results.
Inferential statistics permit the assessment of whether differences that appear in the
results, as in panel (b), are real and not due to chance factors. Inferential statistics about
the data appear in statements such as “F (4, 60) 5 2.03, p , .05.” All this means is that
the odds for obtaining by chance an F statistic at least as large as 2.03 would be less than
5 percent if the experiment were repeated. That is, if the experiment were conducted
100 times, the results would be similar in at least 95 out of the 100 repetitions.
There is no fi xed rule for setting an appropriate level of signifi cance—.05, or 5 in
100, as opposed to .001, or 1 in 1,000, for instance. It is up to the researcher to decide
if the odds are just right, too high, or too low. Depending on the import of your con-
clusions, you may require more (e.g., .001, or 1 in 1,000) or less certainty (e.g., .10, or
10 in 100) that what happened has not happened by chance.
Imagine the problem of a graduate student admissions offi cer who has been told
that resources at the university are extremely limited. It has been suggested that she
discriminate against women in accepting students into the program, since they are
believed to be less likely to fi nish. She would like to put such unsubstantiated notions
to rest and so commissions a statistical analysis to test this hypothesis. Here, odds of
5 in 100 to reject the null hypothesis that women are less likely than men to fi nish are

104 P A R T 1 FUNDAMENTALS OF RESEARCH
7
6
5
4
3
2
1
0R
eacti
on
Tim
e (
seco
nd
s)
Words
Lexical Decision(a)
(b)
Nonwords
Naming
760
720
680
640
600
560
520
Reacti
on
Tim
e (
milliseco
nd
s)
Words Nonwords
▼ FIGURE 5.1
Exaggerated Scales. Exactly the same data are presented in the two panels of Figure 5.1, but the scale in panel (a) is in seconds and that in panel (b) is in milliseconds (with a scale break indicated, too). Thus, the differences appear very small in (a) and very large in (b).
too high, because the import is so great. A level of signifi cance of 1 in 1,000 would be
more appropriate.
Or take the case of a breakfast cereal company that wishes to include a “prize” inside
the box. It performs a statistical analysis to decide which of fi ve potential prizes, all of
which cost the same, is preferred by consumers. If there is any difference among prizes,
the company wants to be sure to fi nd the best one. If the fi rm is wrong and incorrectly
selects one, when in fact all are equally attractive, no great harm is done, since each
prize costs the same. Here, odds of 5 in 100 are too low. A level of signifi cance of 50 in

C H A P T E R 5 HOW TO READ AND WRITE RESEARCH REPORTS 105
100 might be more appropriate. The situation determines what the level of signifi cance
should be. Additional discussion of inferential statistics and the level of signifi cance can
be found in Appendix B.
In the results section, the author’s specifi c choice of words is important. Be-
ware of such statements as this: “Although the data just barely missed reaching the
proposed level of signifi cance, it appears that a trend in the predicted direction did
occur.” This kind of statement should be approached with caution for several rea-
sons. First, the word trend is a technical term: Existence of a trend can be determined
only by an appropriate statistical test. Second, it implies that results that are signifi -
cant go beyond a trend—that is, they are true and utterly reliable—and that failure
to reach a prescribed level means only that “truth” is latent rather than explicit.
This implication is false: Even signifi cant results are reliable only in a probabilistic
sense—for example, 95 times in 100.
Discussion
The discussion is the most creative part of an article. Here, an author is permitted to
restate what the data show (if he or she so desires) and to draw theoretical conclusions.
Most editors have fi rm standards for both method and results sections, but the author
is given greater latitude in the discussion. In the words of the Publication Manual of
the American Psychological Association (APA, 2001): “You are free to examine, inter-
pret, and qualify the results, as well as to draw inferences from them” (p. 26). Keep in
mind that research results are not incontestable truths and that experimental fi ndings
are relative to the context in which they are found. Freedom for the author requires
caution from the readers.
References
References are found at the end of the article. In contrast to journals in other
disciplines, psychology journals list full titles of referenced articles. This prac-
tice helps to tell the reader what the article is about. Furthermore, the references
are valuable as a guide for related information. They can also be used as an
index of the merit of the article. Articles should refer to the most recently pub-
lished works in the area, as well as to the most important previous publications.
Furthermore, only articles cited in text should be included in the reference section.
This is different from a bibliography, which includes as many relevant citations as
is feasible.
▼ CHECKLIST FOR THE CRITICAL READER
In this section, we offer some hints that have helped us to become better consumers of
the information presented in psychological journals. Our major suggestion is to avoid
rushing through an article. Instead, you might deliberately stop after each section and
write down the answers to the questions we shall list here. This can be diffi cult at fi rst,
but with practice, this process becomes automatic and requires little extra time.

106 P A R T 1 FUNDAMENTALS OF RESEARCH
Introduction
1. What is the author’s goal? The introduction explains the reasons behind the
research and reviews the previous literature on the phenomena of interest. If one or
more theories are related to the research, the introduction gives the predictions the
theories make. As with scientists in other areas, psychologists do not necessarily agree
as to the underlying mechanisms and theoretical interpretations of behavior. The au-
thor may present a particular theory that he or she thinks provides a useful explanation
of behavior. Although the author may present more than one theory in the introduc-
tion, he or she will proceed later on to demonstrate that they do not all help equally to
predict and explain the obtained results. Try to fi gure out which of the several theories
the author believes and which are slated for subsequent rejection.
2. What hypotheses will be tested in the experiment? The answer to this should
be obvious and stated directly within the introduction section.
3. If I had to design an experiment to test this hypothesis, what would I do? This
is the key question for the introduction. You must try to answer this before continuing
on to the method section of the article. Many experiments are done within the context
of a systematic investigation of behavior to test and support a particular theoretical
framework developed by the author. If the author has any skill as a wordsmith, once
you have fi nished the next section, you are likely to agree with the method that the
author has advocated in the article. A clever author will plant the seeds to this answer
in the introduction itself; this practice makes it harder for you to state a method inde-
pendently. Write down the major ideas for your method of testing the hypothesis.
Method
Compare your answer to Question 3 with that of the author of the article. They prob-
ably will differ, if you have not peeked. Now answer Questions 4(a–c).
4(a). Is my proposed method better than the author’s? Regardless of who has the
better method, you or the author, this forced comparison will make you think about
the method section critically, instead of passively accepting it.
4(b). Does the author’s method actually test the hypothesis? The hypothesis is
sometimes the fi rst casualty, disappearing between the introduction and method sec-
tions. Always check that the method used is adequate and relevant to the hypothesis at
hand.
4(c). What are the independent, dependent, and control variables? This is an
obvious question and can be answered quickly. Listing the variables helps you avoid
passive reading of the method section. After you have resolved differences between
your proposed method and the author’s, answer the next question.
5. Using the subjects, apparatus or materials, and procedures described by the
author, what results would I predict for this experiment? You must answer this on
your own before reading the results section. To help yourself, review the hypotheses
and the independent and dependent variables. You may fi nd it impossible to predict a
single outcome. This is not really a problem, since the author probably also had more
than one prediction originally. He or she may have done some preliminary investi-
gations to narrow down possible outcomes; alternatively, he or she may have been

C H A P T E R 5 HOW TO READ AND WRITE RESEARCH REPORTS 107
surprised by the results and had to rethink the introduction once the results were in.
Draw a rough sketch illustrating the most likely outcomes you have predicted.
Results
Compare the results with your predictions. If they are the same, go on to Questions
7(a), 7(b), and 7(c). If not, answer Question 6.
6. Did the author get unexpected results? After some thought, you will reach one of
two conclusions: Either your prediction was wrong, or the results are hard to believe.
Perhaps the method the author selected was inappropriate and did not adequately test
the stated hypotheses or introduced sources of uncontrolled variance. Or perhaps these
results would not be obtained again if the experiment were repeated. You might even
try your own experiment. See if you can replicate the reported results.
7(a). How would I interpret these results?
7(b). What applications and implications would I draw from my interpretation of
the results? Try to answer this question and Question 7(a) on your own, before read-
ing the discussion.
7(c). Can I think of another explanation for these results? Even when the data are
as predicted, there may be more than one reason why the results occurred as they did.
You will often encounter multiexperiment papers in which the authors follow up their
fi rst experiment by doing additional experiments to eliminate alternate explanations.
You might want to try thinking of a new experiment to test an alternate hypothesis.
Discussion
As mentioned earlier, the discussion section includes the author’s interpretation of the
data in the form of conclusions. A good discussion section brings the reader full circle
in that it provides a narrative response to the question posed in the introduction. In
addition, the author expands on his or her conclusions by offering insight regarding the
applications and implications of the experimental results.
As a critical reader, you have constructed your own interpretation of the results.
Compare the merits of your interpretation with the merits of the author’s. Which one
do you prefer? Answer Questions 8(a) and 8(b) to help you critically assess your and
the author’s interpretation of the results. Answer Questions 8(c) and 8(d) to help you
think critically about possible future directions.
8(a). Does my interpretation or the author’s better represent the data? Because
authors are allowed more latitude in the discussion section than in other sections of a
report, it is possible to fi nd that an author has drawn conclusions that may not be war-
ranted by the data. In other cases, authors draw conclusions that are largely appropriate
and then proceed to extend these conclusions beyond what the data can support. The
latter situation typically occurs when a researcher fails to recognize the limitations of
the dependent variable.
8(b). Do I or does the author offer the more cogent discussion of the applications
and implications of the results? This question is secondary to the question posed in 8(a).
Nonetheless, you can gain valuable insight regarding the overall integrity of the research
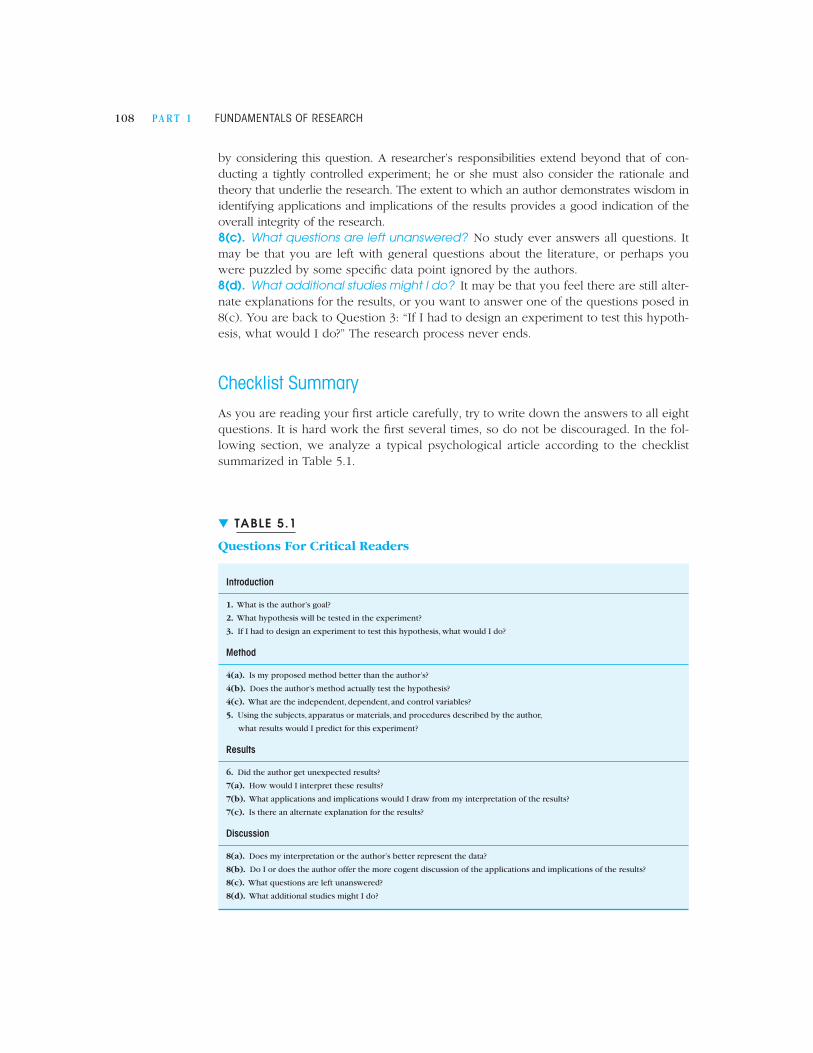
108 P A R T 1 FUNDAMENTALS OF RESEARCH
by considering this question. A researcher’s responsibilities extend beyond that of con-
ducting a tightly controlled experiment; he or she must also consider the rationale and
theory that underlie the research. The extent to which an author demonstrates wisdom in
identifying applications and implications of the results provides a good indication of the
overall integrity of the research.
8(c). What questions are left unanswered? No study ever answers all questions. It
may be that you are left with general questions about the literature, or perhaps you
were puzzled by some specifi c data point ignored by the authors.
8(d). What additional studies might I do? It may be that you feel there are still alter-
nate explanations for the results, or you want to answer one of the questions posed in
8(c). You are back to Question 3: “If I had to design an experiment to test this hypoth-
esis, what would I do?” The research process never ends.
Checklist Summary
As you are reading your fi rst article carefully, try to write down the answers to all eight
questions. It is hard work the fi rst several times, so do not be discouraged. In the fol-
lowing section, we analyze a typical psychological article according to the checklist
summarized in Table 5.1.
▼ TABLE 5.1
Questions For Critical Readers
Introduction
1. What is the author’s goal?
2. What hypothesis will be tested in the experiment?
3. If I had to design an experiment to test this hypothesis, what would I do?
Method
4(a). Is my proposed method better than the author’s?
4(b). Does the author’s method actually test the hypothesis?
4(c). What are the independent, dependent, and control variables?
5. Using the subjects, apparatus or materials, and procedures described by the author,
what results would I predict for this experiment?
Results
6. Did the author get unexpected results?
7(a). How would I interpret these results?
7(b). What applications and implications would I draw from my interpretation of the results?
7(c). Is there an alternate explanation for the results?
Discussion
8(a). Does my interpretation or the author’s better represent the data?
8(b). Do I or does the author offer the more cogent discussion of the applications and implications of the results?
8(c). What questions are left unanswered?
8(d). What additional studies might I do?

C H A P T E R 5 HOW TO READ AND WRITE RESEARCH REPORTS 109
▼ A SAMPLE JOURNAL ARTICLE
In this section, we have reprinted a short article from Psychological Science, with sam-
ple answers to the checklist questions.1 The article is about the effect of imagining
oneself voting on actual subsequent voting behavior.
Most articles are written for experts in a particular area, so the authors of a report
assume that their readers have some knowledge of the topic under investigation. In
addition, most journals set page limits on articles, which means that some information
may be missing or presented very tersely. The assumptions made by the authors and
brevity of many articles pose a problem for the novice reader. The novice may have to
read other articles or textbooks in order to understand a particular report. The follow-
ing report was chosen to be fairly easy to understand; nevertheless, you may fi nd parts
of it confusing. Do not be discouraged. To help you, we have placed checklist items at
various strategic locations throughout the article.
Text not available due to copyright restrictions

110 P A R T 1 FUNDAMENTALS OF RESEARCH
Text not available due to copyright restrictions

C H A P T E R 5 HOW TO READ AND WRITE RESEARCH REPORTS 111
1. What are the authors’ goals? The authors seek to test whether the likelihood of
voting in a presidential election depends on the visual perspective—fi rst person or
third person—from which people imagine themselves voting. Prior research has exam-
ined how visual perspective affects a variety of other psychological phenomena (e.g.,
how people explain their own past behavior), but the authors wanted to be the fi rst to
study whether it affects the likelihood of following through on future behavior.
2. What hypotheses will be tested in the experiment? The authors intend to test
two related hypotheses, both of which are clearly stated in the fi nal paragraph of the
introduction. One hypothesis is that picturing oneself voting from the third-person
perspective causes people to attribute more pro-voting sentiments to themselves. That
is, if people “see” themselves voting in their mental imagery, they come to believe that
they personally have more positive thoughts and feelings about voting. The second
hypothesis is that picturing oneself voting from the third-person perspective causes
people to be more likely to actually vote.
3. If I had to design an experiment to test these hypotheses, what would I
do? Ideally, you should try to answer this question before reading about the authors’
method of testing the hypotheses. However, in this paper, the authors have briefl y sum-
marized their method in the fi nal three sentences of the introduction. In fact, it is not
unusual for authors to provide a general overview of their method in the introduction
before presenting the details in the method section itself. This practice helps the reader
to get the “big picture” before getting all the details. Nevertheless, it is worth thinking
about how you would design an experiment of your own to test the hypotheses before
diving into the method section. In this case, it is obvious that, in any experiment you
might design, you would need to assign some subjects to a condition in which they
pictured themselves voting from the fi rst-person perspective and other subjects to a
condition in which they did the same from the third-person perspective. One possibil-
ity would be to bring undergraduates into a psychology laboratory in advance of a
student government election and assign half of them to picture themselves voting in the
election from the fi rst-person perspective and half from the third-person perspective.
You could then email students after the election and determine how many of them in
the third-person condition voted versus how many in the fi rst-person condition.
A tougher question is how to determine whether students in the third-person
condition attributed more pro-voting sentiments to themselves than did students in the
fi rst-person condition. How would you measure students’ thoughts and feelings about
voting? One possibility would be to ask students to rate their attitude toward voting on
a scale ranging from “very negative” to “very positive.”
Method
Subjects Two hundred fi fty-six undergraduates (163 female) at The Ohio State Uni-
versity completed the preelection questionnaire online for course credit. Subjects who had
already voted (n = 95), who were not registered to vote (n = 1), who did not indicate if
they were registered (n = 1), or who did not indicate if they had already voted (n = 6) were
excluded from analyses. Seven subjects (4 in the third-person condition) were excluded for
failing the manipulation check (described later).
Text not available due to copyright restrictions
112 P A R T 1 FUNDAMENTALS OF RESEARCH
The fi nal preelection sample consisted of 146 subjects (94 female), 69 in the fi rst-person
condition and 77 in the third-person condition. Their mean age was 19.3 years (SD = 3.02
years). Of this sample, 53.4% indicated that they would vote for George W. Bush, 45.2%
indicated that they would vote for John Kerry, and 1.4% indicated that they were undecided.
Condition assignment was independent of candidate preference, and exclusion from analy-
sis was independent of condition and candidate preference (x2s < 2.90, ps > .30).
Ninety-fi ve subjects from the preelection sample (65%) responded to the postelection
follow-up questionnaire in exchange for course credit or the chance to win a $50 Amazon.
com gift certifi cate. There were no signifi cant differences in response rate according to
condition or candidate preference (x2s < .74, ps > .50).
Materials and Procedure
Preelection Subjects were recruited for an on-line study of imagination. Although it
was specifi ed that subjects must be registered voters to take part, no other connection to
voting or the election was mentioned in recruitment. At 6:30 p.m. on November 1, 2004,
subjects received an e-mail with a link to one of two versions of the questionnaire. Sub-
jects were randomly assigned to these versions, which differed only in the instructions
for the imagery perspective to be taken. Subjects completed the questionnaire on their
own computers any time up until the polls opened on November 2, 2004, at 6:30 a.m.
After providing demographic information, subjects read that they would be asked
to imagine themselves engaging in a particular action in the future and should follow in-
structions for how to picture the image. They received either fi rst-person or third-person
visualization instructions (third-person wording in brackets):
You should picture doing the action from a fi rst-person [third-person] visual perspec-
tive. With the fi rst-person [third-person] visual perspective you see the event from
the visual perspective you [an observer] would have if the event were actually taking
place. That is, you are looking out at your surroundings through your own eyes [you
see yourself in the image, as well as your surroundings].
Subjects were then instructed to close their eyes and use the specifi ed perspective to
picture themselves “voting in the upcoming presidential election.” When they had the
image in mind, they were to hold it there and respond “yes” or “no” to the following
question, which varied by condition and served as the manipulation check (third-person
wording in brackets):
As you’re picturing it right now, do you see [yourself in] the scene from the visual
perspective you [an observer] would have if the event were actually taking place?
A response of “no” constituted failure of the manipulation check.
Next, subjects used scales ranging from not at all (1) to completely (7) to rate how well
fi ve phrases described their image: “infl uencing the election,” “marking a ballot,” “fulfi lling
my duty as a citizen,” “making my opinions heard,” and “selecting my candidate’s name.”
Subjects went on to complete the main preelection dependent measures, which were
designed to assess their self-perceptions as voters. While continuing to use the specifi ed
perspective to picture themselves voting, subjects used a 7-point scale, ranging from ex-
tremely good (+3) to extremely bad (−3) to indicate how good or bad it was to vote in the
upcoming election. Then they used 5-point scales ranging from not at all (1) to extremely
or a great deal (5) to indicate how personally important it was to vote in the election, how
likely it was that they would vote, how much their vote would make a difference, how
C H A P T E R 5 HOW TO READ AND WRITE RESEARCH REPORTS 113
much regret they would experience if they did not vote and their candidate lost, and how
satisfi ed they would be if they voted and their candidate won. Next, it was explained that
sometimes people plan to vote but encounter problems. Subjects considered three poten-
tial deterrents they might face on Election Day: (a) “There is a 20-min wait in line in order
to vote,” (b) “The candidate you support is defi nitely going to win in your state,” and
(c) “You can’t fi nd anyone to go to the polling place with you.” Subjects used a 5-point
scale ranging from not at all (1) to extremely (5) to indicate how likely they would be to
vote if they encountered each deterrent.
Finally, subjects used 7-point scales ranging from not at all (1) to extremely (7) to
indicate the extent to which they were feeling excited, scared, bored, happy, nervous,
determined, inspired, sad, unmotivated, and hopeful.
The fi nal page of the questionnaire thanked subjects for their time and presented
links to information on voters’ rights, voter registration, and polling locations.
Postelection On November 22, 2004, all subjects received an e-mail inviting them to
respond to an on-line survey within the following 4 days. The questionnaire began with
the following item, modeled on those used to assess voting behavior in the U.S. Census
Bureau’s Current Population Survey and the American National Election Studies:
In talking to people about elections, we often fi nd that a lot of people were not able
to vote because they weren’t registered, they were sick, or they just didn’t have time.
How about you—did you vote in the most recent presidential election?
Subjects responded by choosing “No, I didn’t vote” or “Yes, I voted.”1
4a. Is my proposed method better than the authors’? The authors’ method has
three primary advantages over the one we proposed. First, by having students com-
plete the preelection questionnaire (including the visualization task) online, the authors
saved themselves the trouble of having to bring students into the laboratory as we sug-
gested doing. We cannot say for sure, but by conducting the experiment online, the
authors may have been able to collect data from more subjects than if they had run
subjects in the lab, because they did not have to fi nd the time to meet with subjects
in person and because students who wished to participate could do so at their own
convenience.
Second, the authors studied voting in a presidential election, as opposed to a stu-
dent government election, and this naturally seems more important. If visual perspective
affects voting in a presidential election, the fi nding will probably be more interesting to
people than if it affects voting in a student government election.
Third, the authors asked a variety of questions to measure subjects’ attitude about
voting, instead of only one as we proposed. They asked subjects to rate generally how
good or bad it was to vote in the election, which is similar to our proposed rating, but
they also asked for several other ratings, such as how personally important it was to
vote, how satisfi ed they would feel if they voted and their candidate won, and how
likely they would be to vote even if they encountered problems on Election Day. As we
shall see, the authors combined subjects’ responses to all these questions into a single
measure of pro-voting sentiments. Because this measure assesses subjects’ thoughts
1Using self-administered surveys (e.g., Internet questionnaires) rather than human interviewers signifi -
cantly reduces social-desirability pressures on behavioral self-reports (voting: Holbrook & Krosnick,
2006; other behaviors: Tourangeau & Smith, 1996).

114 P A R T 1 FUNDAMENTALS OF RESEARCH
and feelings about voting from a variety of angles, it should capture subjects’ true
attitude better than would any single question alone.
4b. Does the authors’ method actually test the hypotheses? In this study, the au-
thors’ method is well suited to test the two main hypotheses. The method includes a
manipulation of visual perspective, a measure of pro-voting sentiments, and a measure
of actual voting behavior. Therefore, the authors can test whether subjects who picture
themselves voting from the third-person perspective versus the fi rst-person one attri-
bute more pro-voting sentiments to themselves and are more likely to actually vote.
4c. What are the independent, dependent, and control variables? The indepen-
dent variable is visual perspective (fi rst-person or third-person). The dependent vari-
ables are pro-voting sentiments as measured by the various ratings subjects made and
actual voting behavior (voted or did not vote). There are no control variables to speak
of in this experiment.
5. Using the subjects, apparatus or materials, and procedures described by the
authors, what results would I predict for this experiment? Before reading this article,
you probably never considered whether visual perspective in mental imagery affects
people’s attitudes about the imagined activity or whether it affects people’s likelihood
to actually engage in the activity. You may not have ever thought about the difference
between third-person and fi rst-person perspective at all! Despite what the authors have
argued, you may not believe that something as seemingly trivial as visual perspective
could affect something as important as voting, so you may fi nd it hard to predict that
the third-person perspective will actually cause more people to vote than does the fi rst-
person perspective. If you continue to read articles in the fi eld of psychology, this will
probably not be the last time you encounter a prediction that is diffi cult to believe. Psy-
chological research often produces results that few people would predict in advance.
Results
Building on the fi nding that picturing one’s own actions from the third-person perspec-
tive leads to a more dispositional interpretation of the visualized behavior than does
picturing one’s actions from the fi rst-person perspective, we predicted that subjects who
pictured voting from the third-person perspective would adopt a stronger mind-set cor-
respondent with voting behavior and thus would be more likely to vote in the election
than would subjects who pictured voting from the fi rst-person perspective.
Pro-Voting Mind-Set To assess the effect of perspective on subjects’ self-perceptions
as voters, we created a composite pro-voting index by standardizing and averaging re-
sponses on the main preelection dependent measures (attitude, importance, likelihood,
vote impact, regret, satisfaction, and responses to the three problem scenarios; a = .82).
As predicted, picturing voting from the third-person perspective caused subjects to adopt
a stronger pro-voting mind-set (M = .10, SD = .58) than did picturing voting from the fi rst-
person perspective (M = −.11, SD = .69), t(144) = 2.07, p < .05, p rep = .93, d = 0.33.
Voting Behavior The next question was whether the effect of perspective on pro-
voting mind-set on Election Eve would carry over to behavior on Election Day. Indeed, it
did. Picturing voting from the third-person perspective caused subjects to be more likely
to vote, as indicated by their responses to the postelection questionnaire. A full 90% of
respondents in the third-person condition voted, compared with 72% of those in the fi rst-
person condition, x2 (1, N = 95) = 5.04, p < .03, p rep = .94. Further analysis (MacKinnon
& Dwyer, 1993) suggested that pro-voting mind-set mediated the effect of perspective on
voting behavior (see Fig. 1).

6. Did the authors get unexpected results? The authors found, as they predicted,
that the third-person perspective caused subjects to have a stronger pro-voting mindset
and to be more likely to vote. These results were not unexpected by the authors, but
they may be surprising to you.
Another important result is mentioned in only a single sentence under the
heading Voting Behavior but is illustrated in Figure 1. A statistical procedure known
as a mediational analysis showed that pro-voting mindset “mediated” the effect of per-
spective on voting behavior. What this means is that the third-person perspective did
not directly cause subjects to be more likely to vote. Rather, the perspective caused
people to have a stronger pro-voting mindset, and this mindset caused people to be
more likely to vote. In other words, the analysis established a causal chain linking the
third-person perspective to pro-voting mindset and pro-voting mindset to voting.
7a. How would I interpret these results? The results are straightforward and the in-
terpretation is clear: Picturing oneself voting from the third-person perspective versus
the fi rst-person perspective can cause people to feel that voting is more personally
important to them and this feeling can lead people to vote.
7b. What applications and implications would I draw from my interpretation of the
results? An important implication of these results is that it may be possible to increase
voter turnout by encouraging potential voters to picture themselves voting from the
third-person perspective. For example, perhaps organizers at political rallies should
lead the crowd in a brief third-person visualization task like that performed by subjects
in this experiment.
7c. Can I think of another explanation for these results? Given the simplicity of the
authors’ method and the clarity of their results, it is diffi cult to think of an alternative
explanation other than that the third-person perspective increased pro-voting senti-
ments and these sentiments led people to vote. However, if you can think of another
explanation, you should also think about how you would design an experiment to test
your explanation.
Discussion
Simply varying the visual perspective that individuals used to picture themselves engag-
ing in a desirable future behavior affected their self-perceptions and their likelihood of
Fig. 1 Mediational analysis relating imagery perspective and pro-voting mind-set to vot-ing behavior, Sobel z = 1.85, p < .07, p rep = .90. Numbers on the paths are standardized regression coeffi cients. Imagery perspective was coded −1 for fi rst-person and +1 for third-person. Voting behavior was coded 0 for nonvoting and 1 for voting. Asterisks indicate coeffi cients signifi cantly different from zero, *p < .05, Prep > .93. The number in parentheses is the standardized regression coeffi cient for imagery perspective when pro-voting mind-set was included in the equation.
Pro-VotingMindset
VotingBehavior
ImageryPerspective
.25*
.33*
(.13ns)
.67*
C H A P T E R 5 HOW TO READ AND WRITE RESEARCH REPORTS 115

116 P A R T 1 FUNDAMENTALS OF RESEARCH
following through with that behavior: Registered voters who were instructed to picture
themselves voting from the third-person perspective subsequently adopted a stronger
pro-voting mindset than those instructed to picture themselves voting from the fi rst-
person perspective, and were consequently more likely to vote. These results suggest an
important implication of the fact that actions are perceived to be more a function of the
actor’s character when viewed from an observer’s perspective than when viewed from
the actor’s perspective (Storms, 1973). Seeing oneself as the type of person who would
engage in a desired behavior increases the likelihood of engaging in that behavior.
The present fi ndings are particularly noteworthy given that the experiment was con-
ducted in Ohio during the 2004 presidential election. That campaign focused on volatile
issues of war, terrorism, and same-sex marriage and involved unprecedented efforts to mo-
bilize voter turnout in Ohio, a crucial swing state (Dao, 2004). The fact that our manipula-
tion affected voter turnout even in this complex fi eld of motivational forces demonstrates
the potential power of self-focused imagery. The success of this manipulation was likely
due to its giving direction to a process—visual imagination—that people use naturally to
plan future actions. Indeed, visual imagery of upcoming situations is quite common in
everyday life (Singer & McCraven, 1961). The present fi ndings demonstrate that with some
guidance, this imagery can be harnessed to alter self-perceptions and behavior.
Specifi cally, we found that people are more likely to adjust their self-concepts to
match a desired behavior if that behavior is imagined from a third-person, observer’s
perspective rather than a fi rst-person, experiencer’s perspective. Subjects who imagined
voting from the third-person perspective saw themselves as more likely to vote and
more motivated to overcome obstacles to voting compared with those using fi rst-person
imagery. Third-person imagery also led subjects to anticipate feelings of regret and sat-
isfaction consistent with internalizing voting as a personal norm (Kahneman & Miller,
1986). And subjects who imagined from the third-person perspective reported beliefs
about the importance and impact of voting that were consistent with stronger self-
identifi cation as voters. Cumulatively, these effects on self-perceptions compelled
persons in the third-person visualization condition to turn out in greater numbers on
Election Day than did persons in the fi rst-person condition. These fi ndings suggest that
self-focused imagery can affect meaningful behaviors by altering self-perceptions. There-
fore, the injunction to “picture yourself” performing a desired behavior may, in fact, be
an effective strategy for translating good intentions into practical actions.
Acknowledgments
This article is dedicated to the memory of Jon Slemmer, whose expertise was integral in
carrying out this research.
References
Baldwin, M.W., & Holmes, J.G. (1987). Salient private audiences and awareness of the self.
Journal of Personality and Social Psychology, 52, 1087–1098.
Barresi, J., & Moore, C. (1996). Intentional relations and social understanding. Behavioral and
Brain Science, 19, 107–154.
Bartlett, F.C. (1932). Remembering: A study in experimental and social psychology. New York:
Cambridge University Press.
Batson, C.D., Early, S., & Salvarani, G. (1997). Perspective taking: Imagining how another
feels versus imagining how you would feel. Personality and Social Psychology Bulletin,
23, 751–758.

Bem, D.J. (1972). Self-perception theory. In L. Berkowitz (Ed.), Advances in experimental
social psychology (Vol. 6, pp. 1–62). New York: Academic Press.
Clark, D.M., & Wells, A. (1995). A cognitive model of social phobia. In R.G. Heimberg,
M.R. Liebowitz, D.A. Hope, & F.R. Schneier (Eds.), Social phobia: Diagnosis, assessment
and treatment (pp. 69–93). New York: Guilford Press.
Conway, M.A., Meares, K., & Standart, S. (2004). Images and goals. Memory, 12, 525–531.
Dao, J. (2004, November 1). To get Ohio voters to the polls, volunteers knock, talk, and cajole.
The New York Times, p. 17A.
D’Argembeau, A., & Van der Linden, M. (2004). Phenomenal characteristics associated with
projecting oneself back into the past and forward into the future: Infl uence of valence and
temporal distance. Consciousness and Cognition: An International Journal, 13, 844–858.
Decety, J., & Grezes, J. (2006). The power of simulation: Imagining one’s own and other’s
behavior. Brain Research, 1079, 4–14.
Frank, M.G., & Gilovich, T. (1989). Effect of memory perspective on retrospective causal at-
tributions. Journal of Personality and Social Psychology, 57, 399–403.
Gregory, W.L., Cialdini, R.B., & Carpenter, K.M. (1982). Self-relevant scenarios as mediators of
likelihood estimates and compliance: Does imagining make it so? Journal of Personality
and Social Psychology, 43, 89–99.
Holbrook, A.L., & Krosnick. J.A. (2006). Social desirability bias in voter turnout reports: Tests using
the item count and randomized response techniques. Manuscript submitted for publication.
Jones, E.E., & Nisbett, R.E. (1971). The actor and the observer: Divergent perceptions of the
causes of behavior. In E.E. Jones, D.E. Kanouse, H.H. Kelley, R.E. Nishett, S. Valins, &
B. Weiner (Eds.), Attribution: Perceiving the causes of behavior (pp. 79–94). New York:
General Learning Press.
Kahneman, D., & Miller, D.T. (1986). Norm theory: Comparing reality to its alternatives. Psy-
chological Review, 93, 136–153.
Levine, B., Black, S.E., Cabeza, R., Sinden, M., Mcintosh, A.R., Toth, J.P., Tulving, E., & Struss,
D.T. (1998). Episodic memory and the self in a case of isolated retrograde amnesia.
Brain, 121, 1951–1973.
Libby, L.K., Eibach, R.P., & Gilovich, T. (2005). Here’s looking at me: The effect of memory per-
spective on assessments of personal change. Journal of Personality and Social Psychology,
88, 50–62.
MacKinnon, D.P., & Dwyer, J.H. (1993). Estimating mediated effects in prevention studies.
Evaluation Review, 17, 144–158.
McIsaac, H.K., & Eich, E. (2002). Vantage point in episodic memory. Psychonomic Bulletin &
Review, 9, 146–150.
Moore, B.S., Sherrod, D.R., Liu, T.J., & Underwood, B. (1979). The dispositional shift in attribu-
tion over time. Journal of Experimental Social Psychology, 15, 553–569.
Nigro, G., & Neisser, U. (1983). Point of view in personal memories. Cognitive Psychology, 15,
467–482.
Piaget, J. (1932). The moral judgment of the child. London: Kegan Paul, Trench, & Trubner.
Prencipe, A., & Zelazo, P.D. (2005). Development of affective decision making for self and
other. Psychological Science, 16, 501–505.
Pronin, E., & Ross, L. (2006). Temporal differences in trait self-ascription: When the self is seen
as an other. Journal of Personality and Social Psychology, 90, 197–209.
Robinson, J.A., & Swanson, K.L. (1993). Field and observer modes of remembering. Memory, 1,
169–184.
Shaw, G.B. (1921). Back to Methuselah: A metabiological pentateuch. New York: Brentano’s.
C H A P T E R 5 HOW TO READ AND WRITE RESEARCH REPORTS 117
118 P A R T 1 FUNDAMENTALS OF RESEARCH
(RECEIVED 5/17/06; REVISION ACCEPTED 7/31/06;
FINAL MATERIALS RECEIVED 9/14/06)
8a. Does my interpretation or the authors’ better represent the data? In this case,
our interpretation is the same as the authors’. That will certainly not always be the case,
especially when reading longer, more complex studies.
8b. Do I or do the authors offer the more cogent discussion of the applications and
implications of the results? The authors have a fi ne discussion, which includes the in-
teresting point that the visual perspective manipulation affected voter turnout even in
the context of a hotly contested presidential campaign in which there were many factors
potentially affecting voting behavior. Thus, the authors conclude that visual imagery must
have a relatively strong infl uence on behavior. They also note, as we did, that the power
of visual imagery could be used purposefully to infl uence behavior. However, while we
focused on the idea that political organizers could use visual imagery to affect the behavior
of other people, the authors furthermore suggest that people could use it for themselves
to increase the chances that they will carry through on their own good intentions.
8c. What questions are left unanswered? To better understand the power of visual
perspective to infl uence behavior, we think it is important to compare voting given the
third-person perspective to voting given no visual imagery at all. The authors found
that the third-person perspective increased voting relative to the fi rst-person perspec-
tive, but how likely would people have been to vote had they not gone through a visu-
alization task at all but rather had simply completed an online questionnaire in which
they were asked questions about their attitude toward voting? Presumably the authors
would predict that third-person visualization would cause a big increase in voting rela-
tive to no visualization at all, but this study does not directly speak to that possibility
because it does not include a novisualization condition.
8d. What additional studies might I do? It would be a straightforward matter to rep-
licate the conditions of the current study and add a no-visualization condition in which
subjects are treated exactly the same as in the conditions described here except that
they do not receive the visualization instructions and do not answer any questions
about their image. Of course, one problem is that, if you wanted to study voting in a
presidential election again, you might have to wait as long as 4 years to do it!
Sheeran, P. (2002). Intention-behavior relations: A conceptual and empirical review. In
W. Stroebe & M. Hewstone (Eds.), European review of social psychology (Vol. 12,
pp, 1–36). Chichester, England: Wiley.
Singer, J.L., & McCraven, V.G. (1961). Some characteristics of adult daydreaming. Journal of
Psychology, 51, 151–164.
Storms, M.D. (1973). Videotape and the attribution process: Reversing actors’ and observers’
points of view. Journal of Personality and Social Psychology, 27, 65–175.
Tourangeau, R., & Smith, T.W. (1996). Asking sensitive questions: The impact of data collection
mode, question format, and question context. Public Opinion Quarterly, 60, 275–304.
▼ WRITING A RESEARCH REPORT
You have gotten an idea, reviewed the pertinent literature, designed a procedure, col-
lected your data, and analyzed the results. Your course may require a written record of
your research. Even if it does not, you are obligated to publicize the results of a carefully

C H A P T E R 5 HOW TO READ AND WRITE RESEARCH REPORTS 119
done project. We believe that to maintain the self-correcting nature of science, it is impor-
tant to publish good data. However, this does not mean that journals should be cluttered
with information derived from every undergraduate project. If your research is promising,
you will receive encouragement from your instructor.
In this section, we will review the format of a typical report and discuss some of the
stylistic considerations that make up a comprehensible paper. If you follow our sugges-
tions for reading articles, you will have a pretty good idea about the format of a research
report, and you will probably have a good feel for technical writing style. Some aspects
of technical writing are not obvious, so we will discuss them here. What we present are
general guidelines. If you need additional information, examine R. J. Sternberg’s 1993
book, The Psychologist’s Companion, and 1992 article, “How to Win Acceptances by
Psychology Journals: 21 Tips for Better Writing”; D. J. Bem’s 2004 chapter, “Writing the
Empirical Journal Article,” which is published in The Compleat Academic, a guide to a
career in psychology; and H. L. Roediger’s 2007 article, “Twelve Tips for Authors.” The
2001 version of the Publication Manual of the American Psychological Association (fi fth
edition) will also help, because it is the offi cial arbiter of style for almost all the journals
in psychology and education.
Format
The outline of a typical report in Figure 5.2 emphasizes the sequence of pages you will
have to put together in your APA-style manuscript. This version of the article is known
as the copy manuscript and is assembled in a particular manner to facilitate the editorial
and publication processes. A run through that sequence will give you an idea of what
you are supposed to include.
Your cover page contains the title of your project, your name, your affi lia-
tion (your institution or place of business), and your running head. The short
title that appears at the top of each page of the copy manuscript consists of the fi rst
few words of the title and is used to identify the manuscript during the editorial
process only. The heading that will appear at the top of each page of the published
article is called the running head, and this is typed in capital letters on the cover
page of the copy manuscript. The short title and running head should not be con-
fused. You should double space the lines on the cover page and every other page
of the copy manuscript.
The next page, page two, contains the heading “Abstract” and the abstract itself.
On this page, and on all subsequent ones (except the fi gures), the short title and the
page number should be placed in the top right-hand corner of the page.
At the top of page three is the full title, followed by the introduction. Ordinarily,
you will not have a heading for the introduction. After your introduction is fi nished, the
method section begins. Generally, for a write-up of one experiment, you will type the
title “Method” in the center of a line to begin the section. You should begin the method
section immediately after the introduction; a page break is not used here. Note the
format shown for the headings on page four in Figure 5.2. The side headings, such as
“Subjects” and “Apparatus” (or “Materials”) help guide the reader to pertinent informa-
tion. The results section immediately follows the method. Do not include fi gures and
tables in the body of this section; they come at the end of the report. Next comes the
discussion, which ends the major textual portion of your report.

120 P A R T 1 FUNDAMENTALS OF RESEARCH
The references begin on a separate page. The format for presenting references
is complex, and you should use care in preparing them. See Table 5.2 for guide-
lines for commonly cited sources. You should also consult the article reprinted in
this chapter, which contains most of the different styles of references that you
will have to document. Look them over carefully; if you have any questions, ask
your instructor. You might also study the APA Publication Manual and recent
journal articles. Any author notes and footnotes appear on separate pages after
the references. For most college laboratory reports, footnotes are not necessary.
When you prepare something for publication, you may acknowledge fi nancial and
intellectual support, which should appear on the author-note page. General ac-
knowledgments are not numbered. Other, perhaps peripheral, information should
appear as numbered footnotes on a separate footnote page, but such footnotes are
generally discouraged.
Following the footnotes are your data tables that are mentioned in the results section.
Each table should be on a separate page and numbered consecutively, according to its
appearance in the results section. Make the titles of your tables short but communicative.
Captions for your fi gures are numbered consecutively and appear on a separate page
Short Title 1 Short Title 2 Short Title 3 Short Title 4
Short Title 5 Short Title 6 Short Title 7 Short Title 8
Short Title 9 Short Title 10 Short Title 11
RUNNING HEAD:
Abstract Title(Introduction, no heading)
Method
Results Discussion References Author Notes
Subjects
Apparatus
Procedure
Footnotes Figure CaptionsTable 1Title of Table
(Successive tables
are on separate
pages.)
1.
2.
Figure 1.
Figure 2.
Title
Name(s)
Affiliation(s)
(Figures are on final
pages with one per
page.)
▼ FIGURE 5.2
Page Sequence for a Report in APA Format.
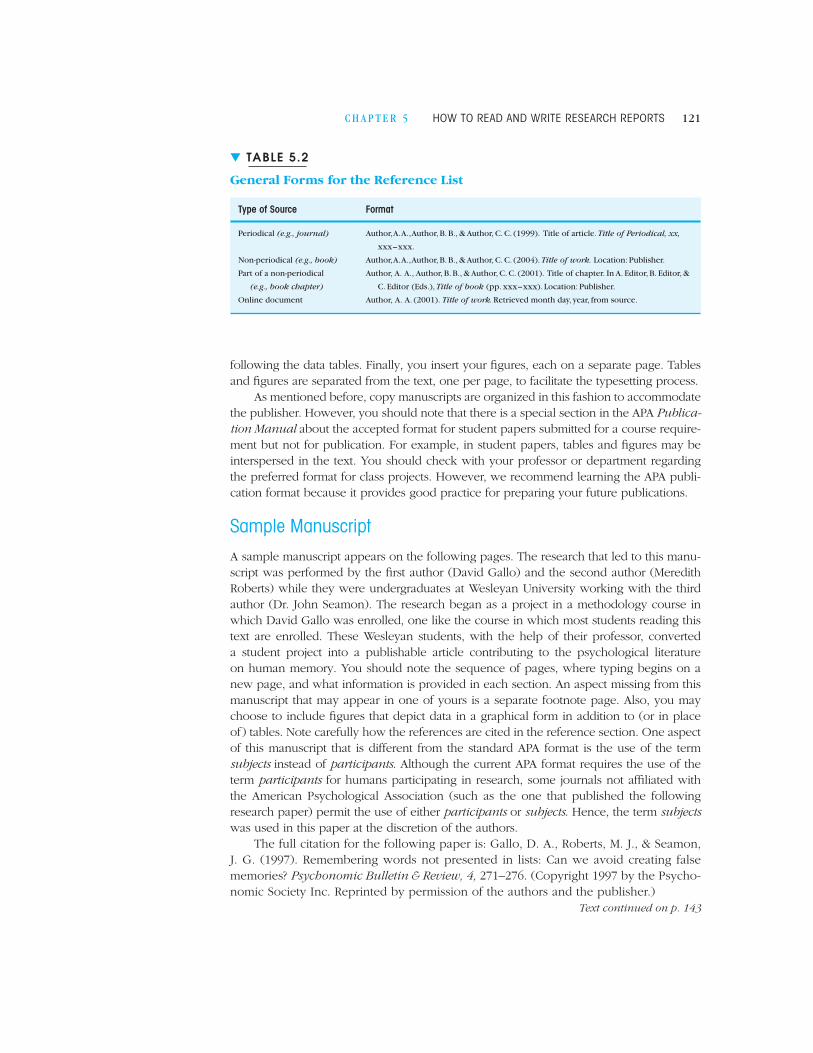
C H A P T E R 5 HOW TO READ AND WRITE RESEARCH REPORTS 121
following the data tables. Finally, you insert your fi gures, each on a separate page. Tables
and fi gures are separated from the text, one per page, to facilitate the typesetting process.
As mentioned before, copy manuscripts are organized in this fashion to accommodate
the publisher. However, you should note that there is a special section in the APA Publica-
tion Manual about the accepted format for student papers submitted for a course require-
ment but not for publication. For example, in student papers, tables and fi gures may be
interspersed in the text. You should check with your professor or department regarding
the preferred format for class projects. However, we recommend learning the APA publi-
cation format because it provides good practice for preparing your future publications.
Sample Manuscript
A sample manuscript appears on the following pages. The research that led to this manu-
script was performed by the fi rst author (David Gallo) and the second author (Meredith
Roberts) while they were undergraduates at Wesleyan University working with the third
author (Dr. John Seamon). The research began as a project in a methodology course in
which David Gallo was enrolled, one like the course in which most students reading this
text are enrolled. These Wesleyan students, with the help of their professor, converted
a student project into a publishable article contributing to the psychological literature
on human memory. You should note the sequence of pages, where typing begins on a
new page, and what information is provided in each section. An aspect missing from this
manuscript that may appear in one of yours is a separate footnote page. Also, you may
choose to include fi gures that depict data in a graphical form in addition to (or in place
of) tables. Note carefully how the references are cited in the reference section. One aspect
of this manuscript that is different from the standard APA format is the use of the term
subjects instead of participants. Although the current APA format requires the use of the
term participants for humans participating in research, some journals not affi liated with
the American Psychological Association (such as the one that published the following
research paper) permit the use of either participants or subjects. Hence, the term subjects
was used in this paper at the discretion of the authors.
The full citation for the following paper is: Gallo, D. A., Roberts, M. J., & Seamon,
J. G. (1997). Remembering words not presented in lists: Can we avoid creating false
memories? Psychonomic Bulletin & Review, 4, 271–276. (Copyright 1997 by the Psycho-
nomic Society Inc. Reprinted by permission of the authors and the publisher.)
Text continued on p. 143
▼ TABLE 5.2
General Forms for the Reference List
Type of Source Format
Periodical (e.g., journal) Author, A. A., Author, B. B., & Author, C. C. (1999). Title of article. Title of Periodical, xx,
xxx–xxx.
Non-periodical (e.g., book) Author, A. A., Author, B. B., & Author, C. C. (2004). Title of work. Location: Publisher.
Part of a non-periodical
(e.g., book chapter)
Author, A. A., Author, B. B., & Author, C. C. (2001). Title of chapter. In A. Editor, B. Editor, &
C. Editor (Eds.), Title of book (pp. xxx–xxx). Location: Publisher.
Online document Author, A. A. (2001). Title of work. Retrieved month day, year, from source.

122 P A R T 1 FUNDAMENTALS OF RESEARCH
Remembering Words 1
Running head: FALSE RECOGNITION
Remembering Words Not Presented in Lists: Can We Avoid Creating False Memories?
David A. Gallo, Meredith J. Roberts, and John G. Seamon
Wesleyan University

C H A P T E R 5 HOW TO READ AND WRITE RESEARCH REPORTS 123
Remembering Words 2
Abstract
Can subjects avoid creating false memories in Roediger and McDermott’s (1995) false
recognition paradigm if they are forewarned about this memory illusion? We pre-
sented subjects with semantically related word lists, followed by a recognition test.
The test was composed of studied words, semantically related nonstudied words (crit-
ical lures), and unrelated nonstudied words. One group of subjects was uninformed
about the false recognition effect, a second group was urged to minimize all false
alarms, and a third group was forewarned about falsely recognizing critical lures.
Compared to the uninformed and cautious subjects, the forewarned subjects reduced
their false alarm rate for critical lures, and they made remember and know judgments
equally often for recognized studied words and critical lures. But forewarning did not
eliminate the false recognition effect, as these subjects and those in the other groups
made numerous false recognitions in this task.
124 P A R T 1 FUNDAMENTALS OF RESEARCH
Remembering Words 3
Remembering Words Not Presented in Lists:
Can We Avoid Creating False Memories?
In a special issue of the Journal of Memory and Language devoted to research
on memory illusions, Roediger (1996) provided an historical overview of errors in
perception and memory. He defi ned a memory illusion as an instance in which a
person’s report of a past event seriously deviates from the actual event. One striking
example offered as evidence of a memory illusion was Deese’s (1959) fi nding of false
recall in a list learning paradigm. Deese presented subjects with lists of semantic as-
sociates to nonpresented critical words. For example, for the critical word “needle,”
the presented list consisted of thread, pin, eye, sewing, sharp, point, pricked, thimble,
haystack, pain, hurt, and injection. When the subjects were given a free recall test
after each list’s presentation, the nonpresented critical word was often erroneously
recalled more frequently than nonpresented but unrelated words. This procedure
induced subjects to recall specifi c words that were never presented in the lists. Begin-
ning with Roediger and McDermott (1995), there has been a revival of interest in this
paradigm for studying this false memory effect (e.g., McDermott, 1996; Payne, Elie,
Blackwell, & Neuschatz, 1996; Read, 1996; Schacter, Verfaille, & Pradere, 1996).
Roediger and McDermott (1995) reported two experiments that replicated and
extended Deese’s result. In their fi rst experiment, the subjects were read six of
Deese’s lists that elicited the highest frequency of false recall. After each list was pre-
sented, the subjects were given a free recall test, followed by a recognition test after
all of the lists were recalled. The recognition test was composed of studied words,
nonstudied critical words (hereafter referred to as critical lures), and nonstudied
unrelated words. Roediger and McDermott found that the critical lures were falsely
recalled and recognized more frequently than other nonstudied words.
In their second experiment, Roediger and McDermott modifi ed their procedure.
Half of the subjects received a free recall test after each study list presentation, and
half performed unrelated math problems instead. On the subsequent recognition test,

C H A P T E R 5 HOW TO READ AND WRITE RESEARCH REPORTS 125
Remembering Words 4
the researchers made use of Tulving’s (1985) remember vs. know judgment task. For
any recognized word, the subjects had to indicate whether they specifi cally remem-
bered the word’s occurrence at study (a remember judgment) or they merely knew
the word that had been presented in the absence of any specifi c recollection (a know
judgment). Roediger and McDermott found that the study and recall condition led to
more false recognitions of critical lures than did the study and math condition. How-
ever, the subjects in both conditions produced false alarms to the critical lures at rates
that were comparable to the corresponding hit rates for studied words. Moreover, the
results showed that recognized critical lures were often characterized as remembered
in the remember vs. know judgment task, especially in the study and recall condi-
tion. These observations led Roediger and McDermott to describe the false recogni-
tion effect as a “powerful illusion of memory” (p. 803). An illusion that is all the more
surprising, they said, because it was observed under intentional learning conditions,
with short retention intervals, in a list-learning laboratory procedure that normally
produces few errors, and with professional memorizers (college students) as subjects.
The primary purpose of the present research was to determine whether subjects
could avoid creating false memories in Roediger and McDermott’s false recognition
paradigm if they were forewarned about this memory illusion. To our knowledge, no
one has specifi cally determined if this false memory effect could be diminished or
eliminated by the subjects’ knowledge, but prior research has asked whether different
experimental conditions could infl uence this effect. For example, McDermott (1996,
Experiment 2) gave subjects multiple study and recall tests with the same word lists
presented in either a blocked or random manner. She found that random presentation
produced less false recall than blocked presentation, but both forms of presentation
still yielded false recalls after multiple study-test trials or a fi nal recall test given 24 h
later. Payne et al. (1996) observed a similar effect in showing that recognition of
critical lures did not decrease over a 24 h retention interval. Finally, Read (1996) ma-
nipulated encoding instructions by having subjects memorize word order or engage

126 P A R T 1 FUNDAMENTALS OF RESEARCH
Remembering Words 5
in elaborative or maintenance rehearsal during list presentation. He found that all
three encoding conditions yielded high levels of false recall for critical words, but the
false recalls were lowest for the subjects who focused on word order. These studies
indicate that this false memory effect persists through multiple study and test trials
(McDermott, 1996), a 24 h delay between study and test (McDermott, 1966; Payne
et al., 1996), and elaborative or maintenance rehearsal during encoding (Read, 1996).
But false memory for critical words is diminished when the words are randomized
over lists (McDermott, 1996) or the subjects attempt to memorize word order at study
(Read, 1996).
Following those studies, the present research sought to determine if the false rec-
ognition of critical lures could be attenuated or eliminated by the use of forewarning
instructions. Curiously, we found no published research on the effects of foreknowl-
edge on perceptual or memory illusions. For perceptual illusions, such research may
have been unnecessary as Gregory (1987) notes that these illusions occur even when
people know that they are perceiving an illusion. For example, we may know that
the lines in the Muller-Lyer illusion are equal in length, yet one line still appears to be
longer than the other. Perceptual illusions fool us because perceptual processes work
extremely rapidly and do not take everything that we know into account in the pro-
cess of forming a precept (Gregory, 1987). Memory illusions also fool us, but they do
so over a more extended time frame that includes study and test conditions. Memory
illusions may thus provide greater opportunity than perceptual illusions to be infl u-
enced by the subject’s knowledge. To the extent that foreknowledge can be used
during encoding or retrieval to devise compensatory cognitive strategies, an illusion
may be diminished or eliminated.
The only statements we found about the effects of foreknowledge on false
memory are located in two places in Roediger and McDermott’s (1995) research. One
statement suggests that forewarning might be effective in minimizing the false recogni-
tion of critical lures, whereas the other statement suggests little effect of forewarning.

C H A P T E R 5 HOW TO READ AND WRITE RESEARCH REPORTS 127
Remembering Words 6
For example, the authors noted that they dropped the only subject from their analy-
sis who had no false recalls of the critical words because at the end of Experiment
2 when the subjects were asked if they “knew what the experiment was about,” this
subject reported that “she noticed that the lists seemed designed to make her think
of a nonpresented word” (p. 808) This subject may have adopted a strategy that
permitted her to overcome the memory illusion. However, Roediger and McDermott
also reported that “informal demonstration experiments with groups of sophisti-
cated subjects, such as wily graduate students who knew we were trying to induce
false memories” still produced a strong false memory effect (p. 812). To the extent
that these subjects were fully informed about the memory illusion before study, this
observation suggests that forewarning will have a minimal effect on the false recogni-
tion of critical words.
The present research tested these foreknowledge alternatives systematically by
comparing groups of subjects with different instructional sets in a modifi ed version
of the Roediger and McDermott (1996, Experiment 2) paradigm. To the extent that
this false memory effect is a memory illusion that functions like a perceptual illusion,
foreknowledge of the effect may have little or no effect on the recognition of criti-
cal lures. But if this memory illusion differs from perceptual illusions in that it allows
greater opportunity for performance to be infl uenced by encoding or retrieval strate-
gies, foreknowledge of the illusion should attenuate the effect to the extent that peo-
ple can devise effective compensatory strategies. We presented subjects with blocked
lists of semantically related words for study, followed by a recognition test after all
lists were presented. One group of subjects was uninformed about the false recogni-
tion effect, a second group was urged to be cautious at the time of the recognition
test to minimize all false alarms, and a third group was forewarned of the specifi c
illusion by a demonstration and instructions before study. Based on Roediger
and McDermott’s fi ndings, we hypothesized that the subjects in the uninformed con-
dition would produce a strong false recognition effect. Subjects in the cautious and

128 P A R T 1 FUNDAMENTALS OF RESEARCH
Remembering Words 7
forewarned groups provide novel test conditions and, compared to the uninformed
condition, they should produce either a comparable or diminished effect.
Method
Subjects
The subjects were 48 Wesleyan University undergraduates who served as paid
volunteers. None had participated in any related memory research.
Materials
We used 16 of Roediger and McDermott’s 24 word lists for study and test words
(see their appendix). Each list was composed of 15 associates to a nonpresented criti-
cal word (i.e., a critical lure). Within a list, the order of the words was constant and
the strongest associates to the critical lure normally occurred fi rst. For example, the
list associated with the critical lure sleep consisted of the following words: bed, rest,
awake, tired, dream, wake, snooze, blanket, doze, slumber, snore, nap, peace, yawn,
and drowsy. For counterbalancing purposes, the 16 lists were divided into two sets
of 8 lists, labeled A and B. Half of the subjects in each condition received Set A for
study and half received Set B. The set not used during study provided distracters for
the recognition test.
Procedure
During study, the subjects were presented with an auditory tape containing eight
lists of 15 words presented in blocked fashion. The words were spoken by a male
voice at a rate of 1.5 s per word, and a tone separated each list. The subjects, who
were tested in groups of up to 6, were told to remember the words for a recognition
memory test that would follow.
After all 120 study words were heard, the subjects were given a visual recognition
memory test consisting of 64 words. Following Roediger and McDermott’s test pro-
cedure, this test contained three items from each studied list (serial positions 1, 8,
and 10), the nonpresented critical lure from each studied list, three items from each

C H A P T E R 5 HOW TO READ AND WRITE RESEARCH REPORTS 129
Remembering Words 8
nonstudied list (serial positions 1, 8, and 10), and the critical lure from each nonstud-
ied list, all listed in a random order. Each word was accompanied by a plus (1) and
minus (2) sign and the letters R and K (for Remember and Know).
The subjects were instructed to examine the words in sequential order at a self-
paced rate and make a decision for each word on the list. They were told to circle
the plus sign for any word that they recognized from the study tape or the minus
sign for any word they failed to recognize. In addition, following Tulving (1985), the
subjects were instructed to make a remember or know judgment for each recognized
word by circling R or K on their answer sheets. The subjects were told to circle R if
they had a conscious recollection of the word from the study lists, such as the way
the word was presented or what they were thinking about at the time, or K if they
were sure the word was presented, but they could not recollect its actual occurrence
or any related details. These instructions for remember and know judgments were
similar to those used by Rajaram (1993) and Roediger and McDermott (1995). After
the recognition test, the subjects completed a questionnaire that assessed their aware-
ness of the organization of the word lists at study and asked for a description of any
strategies that were used to reduce false recognitions.
The variable of primary interest in this experiment was the effect of foreknowledge
on the false memory effect. Accordingly, three groups of 16 subjects received differ-
ent instructions at study or test. In the uninformed condition, the subjects were not
told about the false recognition effect. Instead, they were given standard instructions
to try to remember as many words as possible for a subsequent recognition test. This
condition is similar to the general procedure used by Roediger and McDermott (1995,
Experiment 2).
In the cautious condition, the subjects were also uninformed about the false rec-
ognition effect during study, but they were asked to be careful on the recognition
test in order to minimize their false recognitions to all words. This condition was
designed to determine if merely asking subjects to be cautious was suffi cient to

130 P A R T 1 FUNDAMENTALS OF RESEARCH
Remembering Words 9
minimize the false recognition effect for critical lures. Unlike the subjects in the unin-
formed condition who received no information about the words used in the recogni-
tion test, these subjects were told that some words on the test were similar to words
heard at study but were not actually presented. No other information was provided.
In the forewarned condition, the subjects were provided with detailed information
and examples of the false recognition effect prior to the presentation of the study
lists. Because the subjects were specifi cally told that the study lists were designed to
try to make them falsely recognize related but nonpresented words, this condition al-
lowed subjects the chance to devise strategies to reduce or eliminate the false recog-
nition effect. As part of the forewarning procedure, the subjects participated in a false
recognition demonstration before instructions for the actual experiment were given.
The subjects were read a sample list of words and told that they would be given a
practice recognition test to familiarize themselves with the procedure. The list was
obtained from Roediger and McDermott and not used elsewhere in this experiment.
Following the presentation of the sample list, subjects were given an eight word rec-
ognition test, constructed in the same manner as our actual test. Three of the words
were from the sample list (serial positions 1, 8, and 10), one word was the nonpre-
sented critical lure, and four words were unrelated distracters taken from another
Roediger and McDermott list not used again in this experiment. After the subjects
completed the sample recognition test, the critical lure was identifi ed, and the false
recognition effect was described.
These subjects were further informed that prior research has demonstrated that
presenting lists of words that were semantically associated to nonpresented words
led to high levels of false recognition of the critical lures. This discussion was fol-
lowed by a reading of another sample list of 15 related words, along with its critical
lure from another Roediger and McDermott list that was not used again in this experi-
ment. The subjects were told that the lists that they would hear at study were con-
structed in the same fashion as the sample lists. Their task was to minimize the false

C H A P T E R 5 HOW TO READ AND WRITE RESEARCH REPORTS 131
Remembering Words 10
recognition of critical lures without sacrifi cing their recognition of words presented at
study. Care was taken to ensure that the subjects understood the manner in which the
study lists were constructed, the nature of the false recognition effect, and the goal of
minimizing the false recognition of critical lures. Prior to the recognition test, the sub-
jects were reminded of their task. Together, these procedures provide a strong test of
any possible effect of forewarning.
Results
The primary data consisted of the responses to the recognition test for subjects in
the uninformed, cautious, and forewarned conditions and the remember vs. know
judgments for all of the words that were recognized. These results are shown in
Table 1 for each condition and response measure.
Table 1 indicates that the hit rate for studied words varied across groups, and this
observation was supported by the results of an analysis of variance, F (2, 42) = 4.62,
M Se = .02, p < .02. The hit rate for the uninformed group (.76) was greater than that
for the cautious group (.65), t (30) = 2.33, SEM = .05, p < .05, and the forewarned
group (.63), t (30) = 3.01, SEM = 04, p < .01, whereas the hit rates for the cautious and
forewarned groups did not vary, t < 1. There was also an effect of groups on the false
recognition rate for critical lures, F(2, 42) = 11.05, MSe = .05, p < .001, as the rate for
the forewarned group (.46) was less than that for the uninformed group (.81),
t (30) = 4.84, SEM = .07, p < .001, and the cautious group (.74), t (30) = 3.36,
SEM = .08, p < .01. The false alarm rates for critical lures for the uninformed and cau-
tious groups did not vary, t < 1, and there was no overall effect of groups on the false
alarm rates for nonstudied words or unrelated critical lures, both F ’s < 1.
In addition to producing the highest hit rate, the uninformed group also produced
a strong false memory effect by falsely recognizing the nonpresented critical lures
(.81) at least as frequently as the studied words (.76), t(15) = 1.25, SEM < .04,
p > .10. On the remember vs. know judgment task, these subjects selected
remember responses more frequently than know responses for recognized studied

132 P A R T 1 FUNDAMENTALS OF RESEARCH
Remembering Words 11
words, t (15) = 4.43, SEM = .06, p < .001, and falsely recognized critical lures,
t (15) = 2.40, SEM < .11, p < .05. Their false alarm rates for nonstudied words and
unrelated critical lures were the same (.15), and most of these false alarms were
judged as know responses. These results closely replicate Roediger and McDermott’s
(Experiment 2, Table 2) results and indicate that when subjects are uninformed about
this memory illusion, they cannot differentiate list items from semantically related but
nonpresented items.
The fi nding that subjects in the cautious group had a signifi cantly lower overall
hit rate and nonsignifi cantly lower false alarm rates than subjects in the uninformed
group suggests that the instructions to be cautious infl uenced recognition perfor-
mance. But even though these subjects exercised caution, they still demonstrated
a false memory effect by recognizing critical lures (.74) at least as often as studied
words (.65), t(15) = 1.8, SEM < .05, p > .05. However, these subjects, who selected re-
member responses over know responses for recognized studied words, t (15) = 2.67,
SEM < .06, p < .05, did not differentiate these responses for falsely recognized critical
lures, t < 1. Their false alarm rates were the same for nonstudied words and unrelated
critical lures (.12), and most of these false alarms were judged as know responses.
These results indicate that instructing subjects to be cautious can lower the hit rate for
studied words and reduce the likelihood that falsely recognized critical lures will be
judged as remembered from the prior lists. But such instructions do not diminish the
false recognition effect. Merely asking people to be cautious about their false alarms
has little effect on this memory illusion.
Most important, the subjects in the forewarned group had a lower overall hit rate
and a lower false alarm rate for critical lures than subjects in the uninformed group.
At the same time, they had a comparable hit rate and a lower critical lure false
alarm rate than subjects in the cautious group. These subjects still made more false
recognitions of critical lures (.46) than unrelated critical lures (.14), t(15) = 5.39,
SEM = .06, p < .001, demonstrating the persistence of the false memory effect.

C H A P T E R 5 HOW TO READ AND WRITE RESEARCH REPORTS 133
Remembering Words 12
But their lower rate of false recognition of critical lures, relative to that rate for either
the uninformed (.81) or cautious (.74) groups, and their lower rate of false recogni-
tion of critical lures relative to their hit rate, t (15) = 3.2, SEM = .05, p < .01, indicates
that forewarning instructions diminished the false recognition effect. Moreover, unlike
the uninformed subjects, these subjects did not differentiate between remember and
know judgments for either recognized studied words, t (15) = 1.0, SEM = .05,
p > .10, or critical lures, t (15) = 1.3, SEM = .08, p > .10. As in the previous conditions,
the false alarm rates for nonstudied words and unrelated critical lures were the same
(.14), with the majority of these false alarms judged as know responses. These results
demonstrate that forewarning instructions can reduce the magnitude of the false rec-
ognition effect by reducing the proportion of falsely recognized critical lures and the
proportion of those false recognitions judged to be remembered from study.
The Post-Experiment Questionnaire
An open-ended questionnaire was given to all subjects at the end of the experi-
ment. It was designed to provide information about subject awareness of study list
organization and the types of strategies that were used to maximize performance on
the recognition test. For subjects in the cautious group, we were interested in deter-
mining how they might reduce their false alarms to all nonstudied words, whereas for
subjects in the forewarned group, we wanted to know how they attempted to mini-
mize their susceptibility to recognizing critical lures. Each subject’s written statement
was sorted into one of four categories based on the specifi c strategy that was de-
scribed. Those categories consisted of the following: no strategy indicated (these sub-
jects made no report of any strategy), maintenance rehearsal (these subjects focused
on the sound of each list word or repeated them silently during study), elaborative
rehearsal (these subjects focused on list themes by linking study words by semantic
associations or forming visual images of the words), and determine critical lures
134 P A R T 1 FUNDAMENTALS OF RESEARCH
Remembering Words 13
(in addition to focusing on each list’s theme, these subjects tried to determine and
remember each list’s critical lure). Table 2 shows the number of subjects in each
category from each group, along with the corresponding average hit rate for studied
words and false alarm rate for critical lures. False alarm rates for nonstudied words
and unrelated critical lures were not included because these rates were low in each
condition and did not differ across groups.
The results shown in Table 2 indicate that subjects in the uninformed and cau-
tious groups produced a similar pattern of Results. These subjects were more apt to
Report that they used elaborative Rehearsal as their primary means of remembering
list words (17 of 32 or .53) than either maintenance rehearsal (3 of 32 or .09) or a
strategy aimed at determining the critical lures (5 of 32 or .16). Although these sub-
jects spontaneously used elaborative processes which are typically more effective
than maintenance processes to remember the study words (e.g., Craik & Watkins,
1973), most of them were not aware of the nature of this experiment and they did
not try to determine the critical lures on their own. This was true even after subjects
in the cautious group were told that some nonpresented test words would be similar
to study words. A far different pattern of results is seen in Table 2 for the subjects in
the forewarned group. The most commonly reported strategy for these subjects was
to determine the critical lures. Elaborative or maintenance rehearsal was infrequently
reported, and the number of subjects who reported no strategy was comparable to
the other groups.
The results in Table 2 make two important points. The fi rst point is that the in-
structions given to the subjects in this task infl uenced the type of strategy that was
used. When subjects were merely told that they would be tested on lists of words
(uninformed group) or urged to be cautious for a test (cautious group), the majority
of them wisely adopted elaborative rehearsal processes to maximize their memory
performance. However, when they were told in advance about the memory illusion
(forewarned group), many of these subjects tried to determine the specifi c critical
lures that might appear on the recognition test. The second and more important point

C H A P T E R 5 HOW TO READ AND WRITE RESEARCH REPORTS 135
Remembering Words 14
is that subjects in all conditions were susceptible to the false recognition effect, re-
gardless of self-reported strategy. If we examine only those categories in Table 2 with
the most subjects, the false recognition of critical lures was greater for subjects in the
uninformed (.89) and cautious (.82) groups who used elaborative rehearsal than sub-
jects in the forewarned (.45) group who tried to determine critical lures. But note that
even those subjects in the forewarned group who tried to fi nd critical lures falsely
recognized nearly half of them. Those subjects understood the forewarning instruc-
tions and tried to minimize the false recognition effect, yet they were still infl uenced
by the memory illusion they were actively trying to resist. Clearly, forewarning in-
structions diminished but did not eliminate the false recognition effect.
An In-Class Demonstration
As part of a regular meeting of the third author’s class (Psychology 221, Human
Memory), 25 Wesleyan University students participated in an in-class demonstration
on the effect of forewarning. Prior to the demonstration, the students were given a
detailed description of Roediger and McDermott’s experiment, along with a sample list
and critical lure. The instructor then informed them that they would be read 8 lists of
words, and their job was to devise a strategy to minimize the false recognition of criti-
cal lures. The study lists and recognition test were constructed in the same fashion as
the present experiment. The lists were read at a rate of approximately 1.5 s per word,
and remember and know judgments were not made at test. The results closely paral-
leled those from the forewarned group in the present experiment for hit rate (.67),
false alarms for critical lures (.49), and false alarms for nonstudied words (.19) and
unrelated critical lures (.22). Even though the memory students still falsely recognized
critical lures greater than unrelated critical lures, t(24) = 7.57, SEM = .04, p < .001,
their level of false recognition for critical lures was lower than their hit rate for studied
words, t(24) = 3.40, SEM = .05, p < .01. These fi ndings indicate that the memory
students were susceptible to this memory illusion, albeit at an attenuated level.
136 P A R T 1 FUNDAMENTALS OF RESEARCH
Remembering Words 15
Thus, in both a formal laboratory setting and a less formal classroom setting,
forewarning instructions served to diminish but not eliminate the effect of this
memory illusion.
Discussion
The study demonstrated several important points. First, when subjects were un-
informed about the memory illusion, they demonstrated a strong false recognition
effect. These subjects falsely recognized critical lures at a rate that was comparable
to their hit rate for studied words, and they were more likely to indicate that they
specifi cally remembered those words from study than simply knew that they were
presented. Second, when subjects were urged to be cautious about false alarms to
all words, they still demonstrated a strong false recognition effect as their false alarm
rate for critical lures was comparable to their hit rate for studied words. However,
instructions to be cautious decreased the likelihood that falsely recognized critical
lures would be remembered from study. Third, when subjects were forewarned about
the memory illusion, they demonstrated a diminished false recognition effect. These
subjects reduced their false alarm rate for critical lures, and they made remember and
know judgments equally often for recognized studied words and critical lures. Fourth,
a post-experiment questionnaire indicated that the majority of the subjects in the
uninformed and cautious groups used elaborative rehearsal to try to remember the
study words, whereas many subjects in the forewarned group tried to determine the
critical lures. The subjects in the forewarned group who sought the critical lures were
still susceptible to the memory illusion. Finally, the effects of forewarning on false
recognition were shown to be reliable by the results of an in-class demonstration.
Our fi nding that forewarning instructions diminished but did not eliminate the false
recognition effect provides an empirical link between perceptual and memory illu-
sions. Earlier, Roediger and McDermott (1995) suggested that the false memory effect
functions as a perceptual illusion when they stated that “Just as perceptual illusions
can be compelling even when people are aware of the factors giving rise to the

C H A P T E R 5 HOW TO READ AND WRITE RESEARCH REPORTS 137
Remembering Words 16
illusion, we suspect that the same is true in our case of remembering events that never
happened.” (p. 812). Our results do not disagree; both knowledgeable and uninformed
subjects falsely recognized critical lures. The present procedures allowed forewarned
subjects the opportunity to devise strategies to reduce their susceptibility to critical lures.
Yet even though many subjects in this group sought to determine those critical lures, they
still falsely recognized almost half of them. This memory illusion, can be infl uenced by a
subject’s knowledge because the procedures used in this task allow time for that knowl-
edge to be used. But even when the subjects were armed with this knowledge, false rec-
ognitions still occurred. Given the extensive training procedures used in the forewarned
condition, it is not obvious how we might have better informed our subjects about this
illusion, nor is it clear that a better strategy exists to ward off its effect than trying to deter-
mine the critical lures. This strategy was not wholly effective, and its effectiveness would
be expected to diminish as the number of study lists grows larger than the memory span.
Clearly, even knowledgeable subjects make memory errors in this task.
To explain this memory illusion, some researchers have adopted Underwood’s
(1965) implicit activation response hypothesis that suggests that when subjects encode
words, they think of semantic associates to those words at study (e.g., Roediger &
McDermott, 1995; Schacter et al., 1996). In the present experiment, listening to lists
of semantically related words may activate representations for critical lures because
they are the highest semantic associates of the list items. On the subsequent recogni-
tion test, subjects may falsely recognize those words on the basis of implicit stimulus
familiarity or explicit retrieval of the study context. If the representations for the criti-
cal lures are not consciously activated at study, subjects may falsely recognize those
words at test, but they may be more apt to say that they know that those items were
presented than to say that they specifi cally remember their presentation. If those
representations were consciously activated at study, subjects may not only falsely rec-
ognize those items, they may also say that they remember their presentation. In both
instances, subjects would be making a source monitoring error about the critical lures.
Forewarned subjects in the present experiment may have reduced both their false
alarm rate and their frequency of remember judgments to critical lures by rejecting

138 P A R T 1 FUNDAMENTALS OF RESEARCH
Remembering Words 17
any lures at test that were consciously activated at study and identifi ed as related, but
nonstudied words. However, these subjects would still be prone to false recognitions,
albeit at a lower rate and with a lower frequency of remember judgments than the other
conditions, because they could still be fooled by critical lures that were nonconsciously
activated at study or were consciously activated, but not identifi ed as nonstudied words.
Finally, psychologists have long known that memory errors occur in nonlaboratory
settings (e.g., Bartlett, 1932; Munsterberg, 1908) and there is currently great contro-
versy over the possibility of recovered/false memories of childhood abuse (Loftus,
1993). We do not claim that the present paradigm offers a general method for study-
ing false memory or that the present fi ndings can generalize to memories of child
abuse (see Freyd & Gleaves, 1996, and Roediger & McDermott, 1996, for comments
on these issues). Rather, we think that the present false recognition research has prac-
tical value in understanding the degree to which knowledge can be used to inoculate
a person against a false memory effect. Are memory errors always likely to plague
us because remembering is fundamentally constructive in nature, as Roediger and
McDermott (1995) assert, or might we overcome these errors by understanding the
conditions under which they are likely to occur? Our fi ndings suggest that inoculation
by knowledge may achieve only limited success as knowledgeable people could only
partially control their susceptibility to remembering events that never occurred.
References
Bartlett, F. C. (1932). Remembering: A study in experimental and social psychology.
Cambridge: Cambridge University Press.
Craik, F. I. M., & Watkins, M. J. (1973). The role of rehearsal in short-term memory.
Journal of Verbal Learning and Verbal Behavior, 12, 599–607.
Deese, J. (1959). On the prediction of occurrence of particular verbal intrusions in im-
mediate recall. Journal of Experimental Psychology, 58, 17–22.
Freyd, J. J., & Gleaves, D. H. (1996). “Remembering” words not presented in lists:
Relevance to the current recovered/false memory controversy. Journal of Experi-
mental Psychology: Learning, Memory, and Cognition, 22, 811–813.
C H A P T E R 5 HOW TO READ AND WRITE RESEARCH REPORTS 139
Remembering Words 18
Gregory, R. L. (1987). Illusions. In R. L. Gregory (Ed.), The Oxford companion to the
mind. New York: Oxford University Press.
Loftus, E. F. (1993). The reality of repressed memories. American Psychologist, 48,
518–537.
McDermott, K. B. (1996). The persistence of false memories in list recall. Journal of
Memory and Language, 35, 212–230.
Munsterberg, H. (1908). On the witness stand: Essays on psychology and crime. New
York: Clark, Boardman, Doubleday.
Payne, D. G., Elie, C. J., Blackwell, J. M., & Neuschatz, J. S. (1996). Memory illusions:
Recalling, recognizing, and recollecting events that never occurred. Journal of
Memory and Language, 35, 261–285.
Rajaram, S. (1993). Remembering and knowing: Two means of access to the personal
past. Memory & Cognition, 21, 89–102.
Read, J. D. (1996). From a passing thought to a false memory in 2 minutes: Confusing
real and illusory events. Psychonomic Bulletin & Review, 3, 105–111.
Roediger, H. L. III (1996). Memory illusions. Journal of Memory and Language, 35,
76–100.
Roediger, H. L. III, & McDermott, K. B. (1995). Creating false memories: Remember-
ing words not presented in lists. Journal of Experimental Psychology: Learning,
Memory, and Cognition, 21, 803–814.
Roediger, H. L. III, & McDermott, K. B. (1996). False perceptions of false memories.
Journal of Experimental Psychology: Learning, Memory, and Cognition, 22,
814–816.
Schacter, D. L., Verfaellie, M., & Pradere, D. (1996). The neuropsychology of memory
illusions: False recall and recognition in amnesic patients. Journal of Memory and
Language, 35, 319–334.
Tulving, E. (1985). Memory and consciousness. Canadian Psychologist, 26, 1–12.
Underwood, B. J. (1965). False recognition produced by implicit verbal responses.
Journal of Experimental Psychology, 70, 122–129.

140 P A R T 1 FUNDAMENTALS OF RESEARCH
Remembering Words 19
Authors’ Note
Appreciation is expressed to Chun Luo for helpful comments on an earlier draft of
this paper. This research was supported by a Wesleyan Grant in Support of Scholar-
ship made to J. G. S. Correspondence should be addressed to him at the Department
of Psychology, Wesleyan University, Middletown, CT 06459-0408 (e-mail: jseamon@
wesleyan.edu).

C H A P T E R 5 HOW TO READ AND WRITE RESEARCH REPORTS 141
Remembering Words 20
Table 1
Mean Recognition for Studied and Nonstudied Words and Related and Unrelated Critical Lures
Proportion of Recognized Words
Item Type Overall R K
Uninformed Condition
List Words
Studied .76 .52 .24
Nonstudied .15 .03 .12
Critical Lures
Related .81 .55 .27
Unrelated .15 .06 .10
Cautious Condition
List Words
Studied .65 .41 .24
Nonstudied .12 .03 .09
Critical Lures
Related .74 .37 .38
Unrelated .12 .01 .11
Forewarned Group
List Words
Studied .63 .34 .28
Nonstudied .14 .02 .12
Critical Lures
Related .46 .19 .28
Unrelated .14 .03 .11
Note: R = Remember Judgment; K = Know Judgment. Instances where remember and know
proportions do not sum to the overall proportion refl ect rounding to two decimal places.
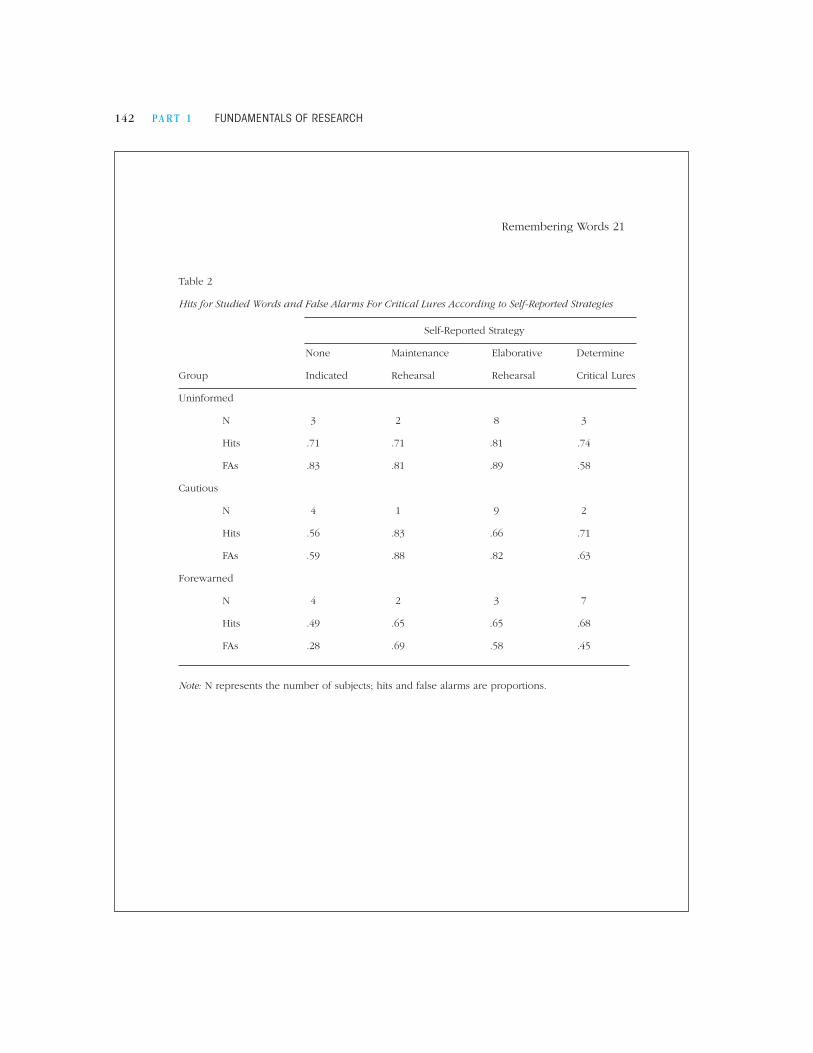
142 P A R T 1 FUNDAMENTALS OF RESEARCH
Remembering Words 21
Table 2
Hits for Studied Words and False Alarms For Critical Lures According to Self-Reported Strategies
Self-Reported Strategy
None Maintenance Elaborative Determine
Group Indicated Rehearsal Rehearsal Critical Lures
Uninformed
N 3 2 8 3
Hits .71 .71 .81 .74
FAs .83 .81 .89 .58
Cautious
N 4 1 9 2
Hits .56 .83 .66 .71
FAs .59 .88 .82 .63
Forewarned
N 4 2 3 7
Hits .49 .65 .65 .68
FAs .28 .69 .58 .45
Note: N represents the number of subjects; hits and false alarms are proportions.

C H A P T E R 5 HOW TO READ AND WRITE RESEARCH REPORTS 143
Style
Now that you have some idea of format, let us consider style. After suffering through
some obscurely written article, you will no doubt recognize the advantage of clear,
unambiguous writing. The APA format helps standardize the order and general con-
tent. However, making sure that the reader understands what you are saying is up to
you. We have read many research reports prepared for our classes and we have found
the biggest problem is transition, or fl ow, from one section to the next. Many students
write as if they were composing a surprise-ending short story, even though their report
should be as straightforward as possible. The information for each section described
here is summarized in Table 5.3.
Your title should be short (10 to 12 words) and concise. Usually the title states the
independent variables and dependent variables.
Your abstract should include your variables (independent, dependent, and im-
portant control variables), number and type of subjects, major results, and important
conclusions. Because the abstract should not exceed 180 words, state only the most
essential aspect of the paper. The body of your report should expand on the abstract.
(This is why most abstracts are written last, even though the report might be clearer if
the abstract were written fi rst, as an outline for the main part of the work.)
In the introduction, you should state why you are interested in a particular issue, what
other investigators have found, and what variables you will be examining. You should
begin by stating a broad perspective on the issue, then quickly narrow down to the spe-
cifi c question that interests you. You should lead the reader through the relevant research,
always keeping in mind that you are setting up your own research question. Thus, avoid
discussion of tangential issues. Toward the end of the introduction, give the reader an
overview of your experiment, specifying your hypotheses explicitly and outlining any
predictions derived from theories you have discussed. By the end of the introduction, the
reader should see your experiment as fi lling an important gap in our knowledge.
In the method section, state how you examined the variables you described
at the end of the introduction. Here, it is important to be clear and complete. By
▼ TABLE 5.3
A Summary of the Information in each Section of a Research Report
Section Information
Title Experiments: State independent and dependent variables—“The effects of X on Y.”
Other studies: State the relationships examined—“The relation between X and Y.”
Abstract In 180 words or less, state what was done to whom and summarize the most important results.
Introduction State what you plan to do and why (you may have to review results from related research).
Predicted results may be appropriate.
Method Present enough information to allow someone else to repeat your study exactly the way you did it. For
clarity use subheadings (Participants, Apparatus, etc.) and make sure that dependent, independent,
subject, and control variables are specifi ed.
Results Summarize important results in tables or fi gures. Direct the reader to data that seem most relevant to
the purpose of the research.
Discussion State how the results relate to the hypotheses or predictions stated in the introduction. Inferences and
theoretical statements are appropriate.
References In APA format, list only those references that were cited in your report.

144 P A R T 1 FUNDAMENTALS OF RESEARCH
the time you write the method section, you are quite familiar with the details and
complexities of your experiment. This familiarity makes it diffi cult to realize that the
reader of your report is learning of these details for the fi rst time. As you write, try to
tell the reader everything he or she would need to know in order to be able to repeat
your experiment, but do not include any extraneous variables. Often people divide
their method section into three subsections: subjects (or participants), materials (or
apparatus), and procedure. The subjects section specifi es the number of subjects
participating in the study, the population from which they were drawn (e.g., the
introductory psychology class at your university), and their incentive for participat-
ing (e.g., course credit). If any subjects were discarded for any reason, that should
be mentioned in this section. The materials (or apparatus) section should describe
all relevant aspects of the materials used in the experiment. The next section, the
procedure section, often begins with a description of the experimental design, states
the instructions given to subjects (if they are human), and generally leads the reader
through the various phases of the experiment.
In the results section, state what happened when you examined the variables.
Clarity is important here. Avoid simply listing your statistical analyses with minimal
comment. Instead, state each fi nding in plain English fi rst, then support it with statistics.
Your results section should end with a summary of the purpose and results of your
experiment. In your discussion, state what the effects of the variables mean for the
issue at hand. The biggest danger in this section of the paper is lack of organization.
Before you begin writing, you should know the points you want to make. Make them
concise and easy to understand. The discussion should follow up the issues pointed
out in the introduction. Also, as in the introduction, avoid straying onto tangents. When
the reader has completed your report, he or she should be able to state the main con-
clusions in a sentence or two. Be careful, however, in the conclusions you draw; avoid
grandiose statements. Science advances in small steps; your experiment need not be
earthshaking to be scientifi cally important.
Often a research paper is not written in the order that it appears in the journal.
You may consider writing the method and results sections fi rst and the introduction
and discussion sections later (the abstract last). Although it may not seem so initially,
the method and results sections are less diffi cult to generate because they are written
in a conventional manner. In other words, there are only so many ways to describe the
number of participants in a study or the results of a particular statistical analysis. On
the other hand, the introduction and discussion sections are often the most diffi cult to
write and, thus, are saved for last. Usually these sections are longer and require writ-
ing skill, organization, and insight. For example, the discussion section can be diffi cult
because an explanation of the data is required, and often the data can be interpreted in
more than one way. Note that not all writers use this strategy, and you should choose
an approach that suits you best.
The APA Publication Manual outlines writing style considerations as follows: Or-
derly expression of ideas, smoothness of expression, economy of expression, preci-
sion, and clarity. It also offers strategies to improve one’s writing style. These guidelines
warrant some discussion, so we now consider aspects of writing style.
Scientifi c writing demands clarity, so each word has to be chosen carefully. Con-
sider these sentences that regularly appear in undergraduate research reports: “I ran the
subjects individually.” “The white albino rat was introduced to the Skinner box.” Actu-
ally, none of the subjects in the study from which the fi rst sentence was pulled did any

C H A P T E R 5 HOW TO READ AND WRITE RESEARCH REPORTS 145
running during the course of the project. What the author meant to say was, “I tested
the subjects individually.” From reading about rats introduced to Skinner boxes, you
might conclude that the researcher had very clever rats. The rat did not shake hands
with a box; all that happened was that the rat was put into the operant-conditioning
chambers. Furthermore, “white albino” is redundant. All albino rats are white. The les-
son here is that in scientifi c writing, you must be careful to choose the correct word or
phrase and avoid ambiguity. Also, be cautious when using pronouns such as which,
this, that, these, and those. Many students fi nd it irresistible to begin a paragraph with
one of these pronouns, and more often than not the referent for the pronoun is not
easy to determine. You can usually avoid any ambiguity by including the referent of
the pronoun each time it is used.
After you have decided on your words and phrases, put them together carefully. A
common problem among some writers is to shift verb tenses abruptly. In general, use
the past tense in the review of other studies in your introduction (Smith found) and in
your method (the subjects were). When you are describing and discussing your data, the
present tense is usually appropriate (The data show that . . . , which means that).
Make sure that collective and plural nouns agree with their verbs and pronouns.
Plural words that end in a are troublesome, such as data, criteria, and phenomena.
Each of these nouns is plural, so they require plural verbs and pronouns. “These data
are” is correct, but “this phenomena is” is incorrect. The singular forms for these nouns
are: datum, criterion, and phenomenon (this phenomenon is).
Many scientifi c writers overuse the passive voice in their reports. Consider this
statement: “It is thought that forgetting is caused by interference.” Although this
sentence is fairly concise (and it is precise), it is also stuffy and less direct than “We
think that interference causes forgetting,” which is really what the writer meant. Be
careful about using either the active or the passive voice too much. If you overuse
the passive voice, your report sounds stuffy. If you overuse the active voice, you
may take interest away from what you did and place too much emphasis on yourself
(I think, I did, and so on). If you want to emphasize what was done and not who
did it and why, use the passive construction. On the other hand, if you think that
the agent of the activity is also important, or if the reason for the action is important,
use the active voice.
The careful writer avoids language that is sexist. The APA recommends that the
use of he (and his and him) as a generic pronoun be avoided by changing to a plural
construction or by using he and she. Generally, the writer should strive for accurate,
unbiased communication. The APA Publication Manual contains a section devoted to
the reduction of language bias.
Scientifi c writing requires the use of consistent terminology; if you assign labels to
things (e.g., labeling subject groups: informed and uninformed), use these labels through-
out the paper. You may have been taught in English classes to try to vary descriptions
of repetitive things to avoid boring the reader. However, in scientifi c writing, changing
terminology only adds confusion. It is important for the reader to know that when you
introduce a new term, it refers to a concept different from ones previously discussed.
Writing a cogent, well-organized research article is a skill that requires consider-
able effort and practice. More is involved than simply allocating information to the cor-
rect sections. There are many fi ne points of style, usage, and exposition that distinguish
lucid, well-written articles from obscure and tortuous ones. While writing your report,
you should make frequent use of standard references for points of style and grammar.

146 P A R T 1 FUNDAMENTALS OF RESEARCH
In addition, consult the APA Publication Manual regarding aspects of technical writing
that are particularly relevant to psychology journal articles, including the organization
and content of each section, the economy and precision in the expression of ideas, the
presentation of data and statistics, and so forth. We highly recommend the aforemen-
tioned book by Sternberg (1993), the articles by Sternberg (1992) and Roediger (2007),
and the chapter by Bem (2004) for excellent advice and specifi c examples of good and
poor style, phrasing, and organization in psychology articles. Finally, and perhaps most
importantly, you should allocate time for revising and rewriting your manuscript, with
the aforementioned stylistic comments in mind. No one can write a publishable manu-
script on the fi rst try; revision is a crucial part of the writing process.
Publishing an Article
Assume that your article has been written, proofread, and corrected, and the last page
has just emerged from your printer. Now what? Although it is unlikely that your fi rst
student effort will produce an article of professional quality, you may nevertheless fi nd
it interesting to discover what happens when a professional psychologist submits an
article to a journal.
The fi rst step is to send copies of the manuscript (the technical term for an unpub-
lished work) to a small number of trusted associates who can check it over to make
sure that it has no obvious or elementary fl aws and that it is written clearly. Once the
comments come back, the indicated corrections are made and, with some trepidation,
the author commits the manuscript to the mail, addressed to the editor of the most ap-
propriate journal. After this step, it is necessary to exhibit great patience for the next few
months. The review process is slow. (The editor who receives the manuscript typically
is extremely busy juggling many responsibilities—teaching, conducting his or her own
research, supervising undergraduate and graduate students, and so on.) Two or three
weeks after submitting the article, the author receives a form letter thanking him or her
for interest in the journal and acknowledging receipt of the manuscript. The manuscript
gets a number (such as 04-145), and if an associate editor has been assigned to handle
it, the author is instructed to direct all future correspondence to that editor.
The editor sends copies of the manuscript to two or three reviewers. Some
journals allow the author to have anonymous (or blind) reviewing, where the au-
thor’s identity is concealed. This is for those who do not believe in the impartiality
of reviewers. The reviewer, who may also review for several other journals, puts the
manuscript in the pile on his or her desk. A conscientious reviewer may take a day
or two to carefully read and evaluate a manuscript. The reviewer then sends a sum-
mary statement to the editor. When the reviewers are in agreement, the editor’s deci-
sion is easy. If the reviewers disagree, the editor must carefully read the manuscript
and sometimes may request another opinion. Finally, an editorial decision is reached
and the author receives a letter stating (1) why the manuscript cannot be published,
(2) what kind of revisions are needed to make the manuscript acceptable, or (3) that
the journal will publish the article. Because rejection rates for manuscripts are quite
high in most journals (above 70 percent), editors spend a great deal of time devising
tactful letters of rejection.
Whether or not the article was accepted, the comments of the reviewers are most
valuable. The best psychologists in the area have provided, free of charge, their careful
C H A P T E R 5 HOW TO READ AND WRITE RESEARCH REPORTS 147
opinions about the research. Of course, reviewers can also make mistakes. Any author
who disagrees with a review has the privilege of writing to the editor. Although this
action will usually not result in the article being accepted, it is important that rejected
authors have the right to appeal or protest. Anyway, there are always other journals.
If the article was accepted for publication, the author is still not fi nished. Some
revision of the manuscript may be required. The copyright for the article is signed
over to the publisher. Some months later, the author receives galley or page proofs
from the publisher. These must be carefully checked to ensure that the words and
tables set in type by the printer match those in the original manuscript. After mak-
ing corrections, the author returns the article to the publisher. Several months later,
the article fi nally appears in the journal. The entire process, from submission of the
manuscript until fi nal publication, takes a year or more. Authors do not get paid for
articles in journals, but on the other hand, neither do they get charged for the privi-
lege of appearing in print.
As you might expect, it is a great thrill to see your name in print, especially the
fi rst time. An even greater thrill, however, is the knowledge that you may have added
some small amount to our understanding of why people and animals think and act
as they do.
▼ SUMMARY
1. When you read a research report, you should read
actively and critically, so that you can derive maxi-
mum benefi t from other people’s research.
2. The checklist for critical readers is designed to
get you into the habit of actively asking questions
about the reports you read: What hypotheses are
being tested? How are they being tested? Does the
method test the hypotheses? Do the results apply
to the hypotheses? How does the author relate the
results to the purposes of the research? What inter-
pretations and inferences are made by the author?
3. You should also consider these questions when
you write your own report. The APA format pro-
vides a framework for your report, but it is up to
you to write clearly. Several suggestions that help
produce a clear, unambiguous style of report writ-
ing are provided.
4. The chapter concludes with a brief description of
the publication process. For psychological science
to progress, reports must be published, and knowl-
edgeable consumers must read them critically.
▼ KEY TERMS
abstract
APA format
apparatus
author
design
discussion
fi gures
introduction
literature search
materials
method
participants
procedure
references
results
running head
subject (participant)
tables
title

148 P A R T 1 FUNDAMENTALS OF RESEARCH
WEB CONNECTIONS
The following site has links to step-by-step presentations on “APA Style” and “Getting
Ideas for a Study”:
http://academic.cengage.com/psychology/workshops.html
For a great guide to APA style, check out this newly updated page:
http://www.docstyles.com/apacrib.htm
How to do a literature search can be found at:
http://apa.org/science/lib.html
An interesting online journal, Psycoloquy, which is sponsored by the American Psycho-
logical Association, can be found at:
http://www.cogsci.ecs.soton.ac.uk/psycoloquy/
▼ LABORATORY RESOURCE
While Langston’s (2002) Chapter 10 of Research Methods Laboratory Manual for Psy-
chology is on a different topic (obstacle detection by the blind) than the ones covered
in depth in this chapter (factors that infl uence voting and false memory for words), the
goals are the same: (a) to develop hypotheses, (b) to test between hypotheses, (c) and
to repeat the process until you’ve pinned down the answer.
PSYCHOLOGY IN ACTION
A Literature Search
Suppose you became interested in the effects of hypnosis on memory. Many people
believe that hypnosis is a viable way to remember events that might otherwise not be
retrieved, yet many courts will not let people who have been hypnotized testify as
witnesses. Why is this? Are our memories susceptible to change when we are under
hypnosis? Or does hypnosis help memory? These are the types of questions in which
you are interested.
To obtain answers to these questions, you will do a literature search. Because you
are not particularly knowledgeable in this area, you do not know the names of any
researchers who have done work on the effects of hypnosis on memory. Therefore, the
best place to start is probably PsycINFO. You do not have to be a librarian or computer
expert to use electronic databases such as PsycINFO. Help screens are available as well
as printed instructions; additionally, the reference staff at your library can answer ques-
tions and help you plan your search strategy.
To fi nd out about the effects of hypnosis on memory, you might begin by looking
up a “keyword”; to do this, you simply type in a word that captures the topic in which
you are interested (for instance, hypnosis). However, a recent search turned up 10,261
journal articles written about the subject of hypnosis; clearly, this is too many to work
with. A search of memory turns up even more articles: 84,630! In this situation, you
will want to combine keywords to pare down the numbers. Because you are interested
C H A P T E R 5 HOW TO READ AND WRITE RESEARCH REPORTS 149
in the susceptibility of memory to hypnosis, you can combine separate searches for
susceptibility, memory, and hypnosis; the result is a list of all the articles that contain
information about all three concepts. You have now narrowed the fi eld down to a more
workable list of 113 references, each accompanied by a brief abstract. You skim the
titles and abstracts and determine which articles look especially interesting; you will
probably want to go to the journals after this step and read the articles that look most
relevant to your interests. Review articles are especially helpful at this stage because
they summarize and evaluate many empirical articles.
Now suppose you have found an article that contains a theory about hypnosis
and memory that is particularly interesting to you; you would like to know about the
implications of this theory and whether it has generally held up under experimental
scrutiny. One way to do this would be to fi nd out what more recent articles have cited
this article. To do this, you would use the Social Science Citation Index (SSCI). SSCI
allows you to enter an article’s reference and fi nd out who has cited the article. That
way, you can fi nd out the recent developments in that area.
Most libraries have printers that allow you to print out any interesting reference
you might discover when using electronic searches. Additionally, you can sometimes
download the references onto your own storage device. Ask your reference librarian
what types of options have you at your library. ■

This page intentionally left blank
Related Documents