Institutionen för Systemteknik Department of Electrical Engineering Examensarbete Upgrading and Performance Analysis of Thin Clients in Server Based Scientific Computing Master Thesis in ISY Communication System By Rizwan Azhar LiTH-ISY-EX - - 11/4388 - - SE Linköping 2011 Department of Electrical Engineering Linköpings Tekniska Högskola Linköpings universitet Linköpings universitet SE-581 83 Linköping, Sweden 581 83 Linköping, Sweden

Welcome message from author
This document is posted to help you gain knowledge. Please leave a comment to let me know what you think about it! Share it to your friends and learn new things together.
Transcript
Institutionen för Systemteknik
Department of Electrical Engineering
Examensarbete
Upgrading and Performance Analysis of
Thin Clients
in Server Based Scientific Computing
Master Thesis in ISY Communication System
By
Rizwan Azhar
LiTH-ISY-EX - - 11/4388 - - SE
Linköping 2011
Department of Electrical Engineering Linköpings Tekniska Högskola
Linköpings universitet Linköpings universitet
SE-581 83 Linköping, Sweden 581 83 Linköping, Sweden
Upgrading and Performance Analysis of
Thin Clients
in Server Based Scientific Computing
Master Thesis in ISY Communication System
at Linköping Institute of Technology
By
Rizwan Azhar
LiTH-ISY-EX - - 11/4388 - - SE
Examiner: Dr. Lasse Alfredsson
Advisor: Dr. Alexandr Malusek
Supervisor: Dr. Peter Lundberg
Presentation Date 04-02-2011
Publishing Date (Electronic version)
Department and Division
Department of Electrical Engineering
URL, Electronic Version http://www.ep.liu.se
Publication Title Upgrading and Performance Analysis of Thin Clients in Server Based Scientific Computing
Author Rizwan Azhar
Abstract Server Based Computing (SBC) technology allows applications to be deployed, managed, supported and executed on the server and not on the client; only the screen information is transmitted between the server and client. This architecture solves many fundamental problems with application deployment, technical support, data storage, hardware and software upgrades. This thesis is targeted at upgrading and evaluating performance of thin clients in scientific Server Based Computing (SBC). Performance of Linux based SBC was assessed via methods of both quantitative and qualitative research. Quantitative method used benchmarks that measured typical-load performance with SAR and graphics performance with X11perf, Xbench and SPECviewperf. Structured interview, a qualitative research method, was adopted in which the number of open-ended questions in specific order was presented to users in order to estimate user-perceived performance. The first performance bottleneck identified was the CPU speed. The second performance bottleneck, with respect to graphics intensive applications, includes the network latency of the X11 protocol and the subsequent performance of old thin clients. An upgrade of both the computational server and thin clients was suggested. The evaluation after the upgrade involved performance analysis via quantitative and qualitative methods. The results showed that the new configuration had improved the performance.
Keywords SBC, Performance analysis, Xbench, X11perf, SPECviewperf,
Language
X English Other (specify below) 55
Number of Pages
Type of Publication
Licentiate thesis X Degree thesis Thesis C-level Thesis D-level Report Other (specify below)
ISBN (Licentiate thesis)
ISRN: LiTH-ISY-EX - - 11/4388 - - SE
Title of series (Licentiate thesis)
Series number/ISSN (Licentiate thesis)
Upphovsrätt
Detta dokument hålls tillgängligt på Internet – eller dess framtida ersättare – under 25 år från
publiceringsdatum under förutsättning att inga extraordinära omständigheter uppstår.
Tillgång till dokumentet innebär tillstånd för var och en att läsa, ladda ner, skriva ut enstaka
kopior för enskilt bruk och att använda det oförändrat för ickekommersiell forskning och för
undervisning. Överföring av upphovsrätten vid en senare tidpunkt kan inte upphäva detta
tillstånd. All annan användning av dokumentet kräver upphovsmannens medgivande. För att
garantera äktheten, säkerheten och tillgängligheten finns lösningar av teknisk och
administrativ art.
Upphovsmannens ideella rätt innefattar rätt att bli nämnd som upphovsman i den omfattning
som god sed kräver vid användning av dokumentet på ovan beskrivna sätt samt skydd mot att
dokumentet ändras eller presenteras i sådan form eller i sådant sammanhang som är
kränkande för upphovsmannens litterära eller konstnärliga anseende eller egenart.
För ytterligare information om Linköping University Electronic Press se förlagets hemsida
http://www.ep.liu.se/.
Copyright
The publishers will keep this document online on the Internet – or its possible replacement –
for a period of 25 years starting from the date of publication barring exceptional
circumstances.
The online availability of the document implies permanent permission for anyone to read, to
download, or to print out single copies for his/her own use and to use it unchanged for non-
commercial research and educational purposes. Subsequent transfers of copyright cannot
revoke this permission. All other uses of the document are conditional upon the consent of the
copyright owner. The publisher has taken technical and administrative measures to assure
authenticity, security and accessibility.
According to intellectual property law the author has the right to be mentioned when his/her
work is accessed as described above and to be protected against infringement.
For additional information about Linköping University Electronic Press and its procedures for
publication and for assurance of document integrity, please refer to its www home page:
http://www.ep.liu.se/.
© Rizwan Azhar
Abstract
Server Based Computing (SBC) technology allows applications to be deployed, managed,
supported and executed on the server and not on the client; only the screen information is
transmitted between the server and client. This architecture solves many fundamental
problems with application deployment, technical support, data storage, hardware and software
upgrades.
This thesis is targeted at upgrading and evaluating performance of thin clients in scientific
Server Based Computing (SBC). Performance of Linux based SBC was assessed via methods
of both quantitative and qualitative research. Quantitative method used benchmarks that
measured typical-load performance with SAR and graphics performance with X11perf,
Xbench and SPECviewperf. Structured interview, a qualitative research method, was adopted
in which the number of open-ended questions in specific order was presented to users in order
to estimate user-perceived performance.
The first performance bottleneck identified was the CPU speed. The second performance
bottleneck, with respect to graphics intensive applications, includes the network latency of the
X11 protocol and the subsequent performance of old thin clients. An upgrade of both the
computational server and thin clients was suggested.
The evaluation after the upgrade involved performance analysis via quantitative and
qualitative methods. The results showed that the new configuration had improved the
performance.

Acknowledgement
In the beginning, unlimited thank to Almighty ALLAH, THE most Merciful and Beneficent,
without Whom I would not be able to complete this thesis.
I would like to thank my advisor Dr. Alexandr Malusek, for his guidance and magnificent
technical support. Many thanks for his availability even on weekends and for his effort to
make this thesis more interesting.
In addition, I also want to thank Dr. Peter Lundberg for providing this opportunity in a very
professional and competitive environment.
Also, I would like to thank my examiner Dr. Lasse Alfredsson, who explained to me the skills
of technical writing. I also like to thank Mr. Shehryar Khan for proof reading of the thesis
report.
Last but not the least, tremendous gratitude to my parents for the support, love and prayers. I
dedicate this thesis to my parents, especially the daily motivation that I have received via
Skype, without which I would not be able to complete this thesis.
Acronyms
API Application Programmable Interface
DDI Device Driver Interface
DNS Domain Name System
DRI Direct Rendering Infrastructure
DXPC Differential X Protocol Compressor
GDI Graphics Device Interface
GUI Graphical User Interface
GNOME GNU Network Object Model Environment
ICA Independent Computing Architecture
IceWM Ice Window Manager
IOSTAT Input Output Statistics
IPC Inter Process Communication
ISAG Interactive System Activity Grapher
KDE K Desktop Environment
NFS Network File System
NIS Network Information Service
NTC-O New Thin Client with original software
NTC-T New Thin Client with ThinLinc Software
OpenGL Open Graphics Library
OTC-O Old Thin Client with original software
RDP Remote Desktop Protocol
RFB Request Frame Buffer
SAR System Activity Report
SBC Server based Computing
SPEC Standard Performance Evaluation Corporation
SSH Secure Shell
TCC Thin Client Computing
TCP Transport Communication Protocol
TLCOS ThinLinc Client Operating System
VNC Virtual Network Computing
VMSTAT Virtual Memory Statistics
XCB X Protocol C Language Binding
XDMCP X Display Manager Control Protocol
Table of contents
Chapter1: Introduction
1.1 Introduction…….…………………………………………………………………………..1
1.2 Aims………………………………………………………………………………………..2
1.3 Layout……………………………………………………………………………………...3
Chapter2: Background
2.1 Introduction..…………………………………………………………………………….....5
2.2 Advantages of SCB…………………………………………………………………...........6
Manageability……………………………………………………………......................6
Security………………………………………………………………………...............7
Scalability……………………………………………………………………...............7
Availability……………………………………………………….................................7
Cost reduction.................................…………...............................................................7
2.3 SBC Implementation……………………………………………………………………….7
2.3.1 Hardware Implementation………………………………………………………..7
Thin client..………………………………………………………………………7
Workstation ………………………………………………..................................7
2.3.2 Software Implementation………………………………………………………...8
RDP……………………………………………………………………...............8
ICA………………………………………………………………………………9
NX…………………………………………………………………….................9
VNC…………………………………………………………………………….10
X Window system……………………………………………………...............11
X client libraries and extensions……………………...................12
Mesa3D………….……...........................................12
DRI…………………...............................................12
XSync………………...............................................12
XFT2……………………………............................12
XCB………………………………….....................12
ThinLinc……………………………………………………………..................13
Chapter3: Performance analysis tools and benchmarks
3.1 Introduction…………………………………………………………………………….....15
3.2 Performance analysis tools…………………………………………………………….....15
IOSTAT………………………………………………………………………............15
VMSTAT……………………………………………………………………..............16
SAR…………………………………………………………………………………...17
ISAG………………………………………………………………………………….18
SPEC CPU……………………………………………………………………............18
3.3 Graphics Benchmarks………………………………………………………………….....18
X11perf…………………………………………………………………............18
Xbench………………………………………………………………………….18
SPECviewperf…………………………………………………….....................19
Chapter4: Typical-load performance analysis
4.1Introduction………………………………………………………..………………………21
Old computing environment……………………….…………………………...22
New computing environment………………….…….…………………............24
4.2 Methods…………………………………………………………………………………...24
4.3 Results………………………………………………………………………………….....24
CPU Utilization………………………………………………………………...25
Paging statistics………………………………………………………………...26
IO transfer rate………………..………………………………………………...27
4.4 Discussion…………………………………………………………………………….......28
4.5 Conclusion………………………………………………………………………………..29
Chapter5: Graphics performance analysis
5.1 Introduction……………………………………………………………………………….31
5.2 Methods…………………………………………………………………………………...32
5.3 Results……………………………………………………………………………….........34
5.3.1Xbench…………………………………………….………………………34
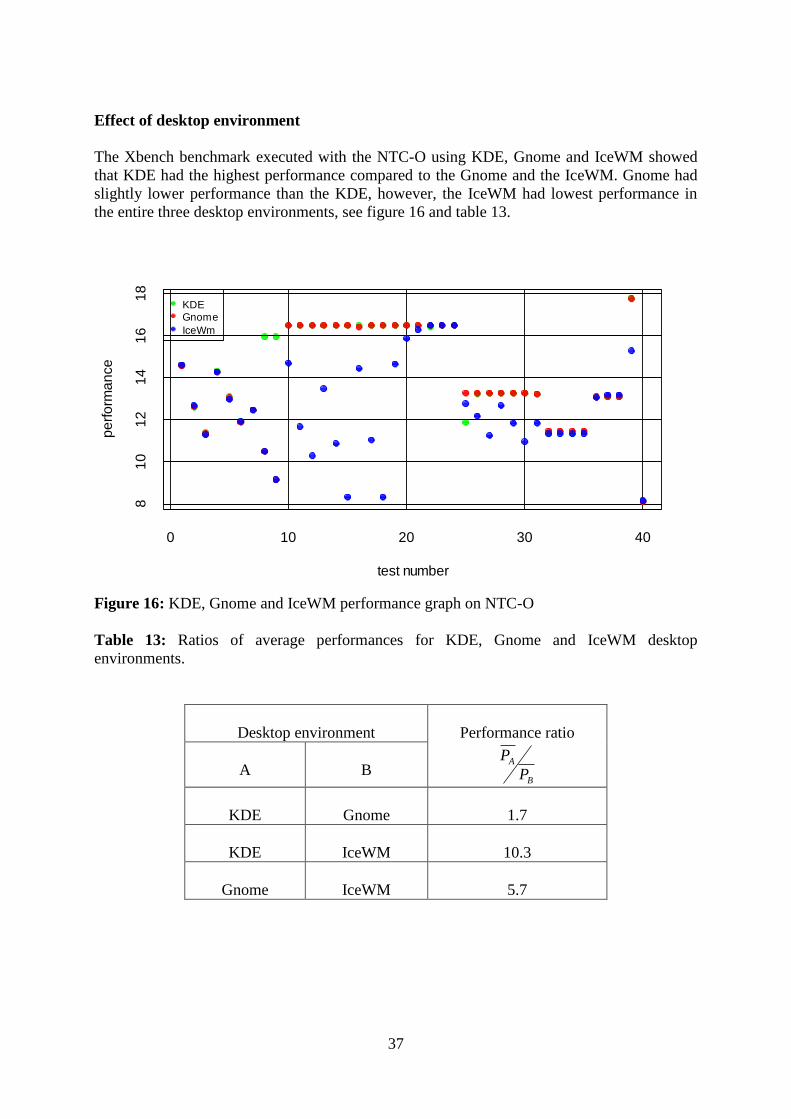
Effect of desktop environment……....…..……………................37
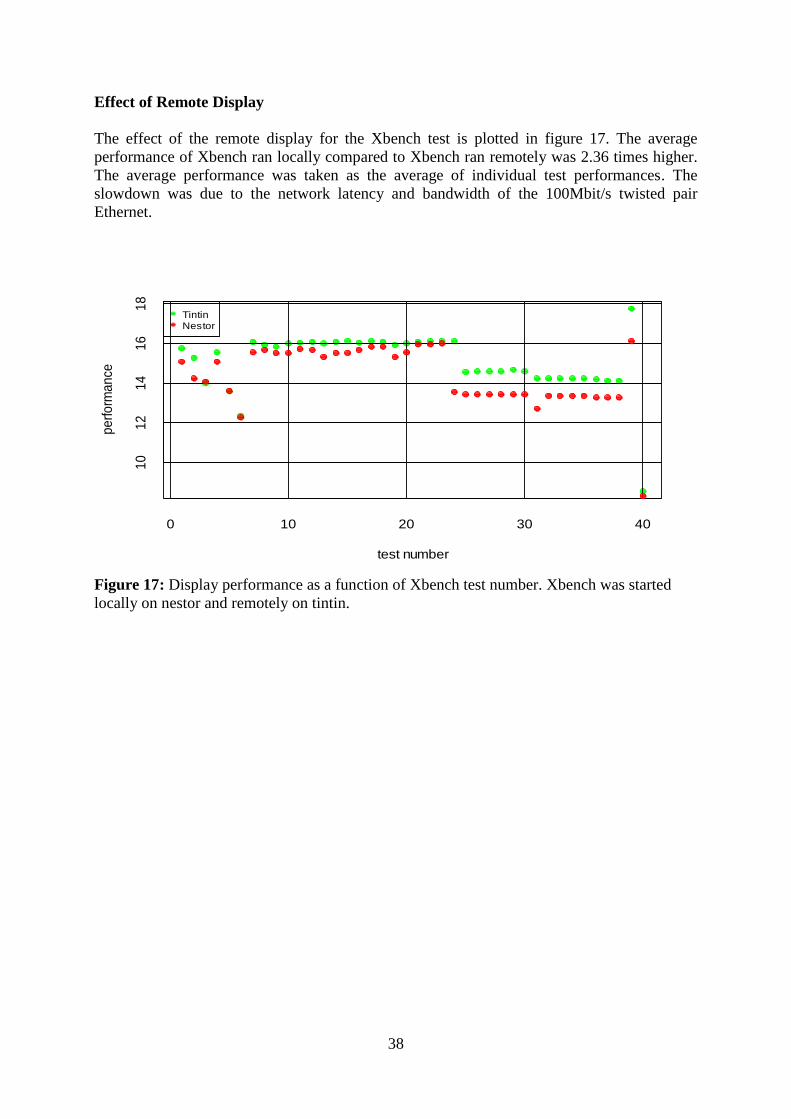
Effect of remote display………………………………................38
5.3.2 X11perf…………………………………………………………………...39
5.3.3 SPECviewperf…………………………………………………………....42
5.4 Discussion…………………………………………………………………………...........43
5.5 Conclusion………………………………………………………………………………..43
Chapter6: User perceived performance analysis
6.1 Introduction……………………………………………………………………………….45
6.2 Methods...………………………………………………………………………………....45
6.3 Results…………………………………………………………………………………….46
User interviewing before upgrade.…...………………………………………...46
User interviewing after upgrade..……..…………………………..……............47
6.4 Discussion………………………………………………………………………………...47
6.5 Conclusion ……………………………………………………………………………….47
Chapter7: Conclusion
7.1 Conclusion………………………………………………………………………………..49
Appendix A…………………………………………………………………………………...50
Appendix B…………………………………………………………………………………...52
Appendix C…………………………………………………………………………………...53
Bibliography…………………………………………………………………………………..55
List of Figures
Figure1: Thin client computing model………………………………………………………....2
Figure2: SBC Environment……………………………………………………………….........6
Figure3: RDP Architecture…………………………………………………………….............8
Figure4: NX Architecture……………………………………………………………….........10
Figure5: VNC…………………………………………………………...……………….........10
Figure6: X Architecture………………………………………………………………............11
Figure7: IOSTAT command output……………………………………………………..........16
Figure8: VMSTAT command output…………………………………………………………16
Figure9: SAR command output……………………………………………………………....17
Figure10: Schematic view of network configuration…………………………………………23
Figure11: CPU utilization graph on a) nestor and b) tintin…………………………………...25
Figure12: Paging statistics graph on a) nestor and b) tintin…………………………………..26
Figure13: IO transfer rate graph on a) nestor and b) tintin…………………………………...27
Figure14: Xbench performance on a) KDE b) Gnome and c) IceWM………………….........35
Figure15: Xbench performance ratio on a) KDE b) Gnome and c) IceWM………………….36
Figure16: Desktop environment performance on NTC-O……………………………………37
Figure17: Remote display performance………………………………………………………38
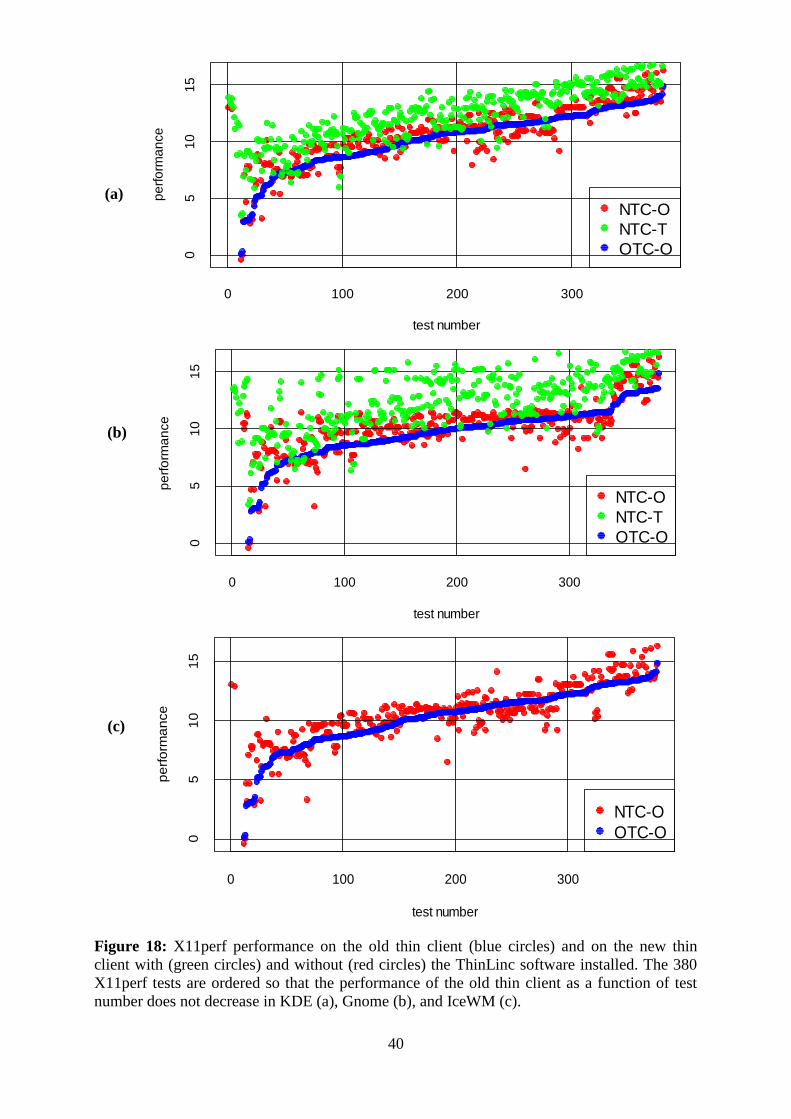
Figure18: X11perf performance on a) KDE b) Gnome and c) IceWM……………………....40
Figure19: X11perf performance ratio on a) KDE b) Gnome and c) IceWM…………………41
Figure20: SPECviewperf performance on nestor ,tintin and NTC-T.………………………..42
List of Tables
Table1: IOSTAT parameters………………………………………………………………….16
Table2: VMSTAT parameters………………………………………………………………..16
Table3: Old Server and workstations configuration…………….…………………………....22
Table4: Old Thin clients configuration……………………………………………………….22
Table5: New server configuration…………………………………………………………….24
Table6: New thin client configuration…………………………………………………..........24
Table7: SPECint results…….………………………………………………………………...28
Table8: SPECfp results......…………………………………………………………………...28
Table9: Experimental design for X11 and Xbench…………………………………………...32
Table10: Experimental design for remote display……………………………………………32
Table11: Desktop environment versions……………………………………………………...33
Table12: Experimental design for SPECviewperf……………………………………………33
Table13: Ratio of average performance of Desktop environment……………………………37
Table14: SPECviewperf results on Desktop environment……………………………………42
Table15: Performance evaluation based on user experience before upgrade…...……………46
Table16: Performance evaluation based on user experience after upgrade…...……………...47
Table17: Xbench tests………………………………………………………………………...51
Table18: Thin client technical specification comparison……………………………………..53
Table19: Considered alternatives for computational server...………………………………...53
Table20: Configuration alternatives for thin clients……………………………………..…...54
1
1
Introduction
Concepts presented in this section come from an article by Yu et al [1]. Computing
technology can be divided in to the three distinct phases of evolution:
1. Mainframe Computing: Mainframe computing involves processing power to be
condensed in a centralized system with all functionalities and resources. This type of
architecture was popular during the 1960s up to the 1970s. Drawbacks: Slow link
speed, simple terminal and high cost-performance ratio.
2. Standalone Computing: Standalone computing consisted of PCs and workstations in
a client-server configuration through a PC LAN interface. These systems were
equipped to handle a wide range of applications as more processing power and
independent storage units were invested in the client. This reduced the load on the
server which was used for additional file and print services. This type of architecture
was popular during the 1980s. Drawbacks: Maintenance cost has increased, as
applications were installed and executed on the client.
3. Network-centric Computing: Network centric computing is a decoupled client-
server configuration that enabled machines to access applications and data on the
servers. This type of architecture was developed in the 1990s. Dominant form of a
network centric computing is an Internet computing, which has changed the way
applications were developed. Advantage: No applications have to be installed on the
client. Disadvantages: Applications have to be reconfigured or redeveloped for the
network architecture.
2
As applications have to be reconfigured for an Internet computing, the thin client computing
models were developed to resolve the compatibility issues of data intensive applications with
the widely popular internet computing architecture.
Client/Server Model Web-based Model SBC Model
Figure 1: Thin client computing models
Figure 1 illustrates the Client server model, the Internet computing model and the Server
Based Computing (SBC) model. The overall architecture of the three models is similar as all
the application code is executed on the server side and the client devices are used to display
screen updates. However the models use different protocols and data compression techniques
for the communication between the client and the server. The models differ with respect to the
functionality partitioning where the effort has been made to make the client layer thin. This
impacts the networking protocol and data compression demands to reduce the network traffic
and the client side processing. The SBC model is the thinnest model as it is only used to
display screen updates.
1.2 Aims of this thesis
Scientific calculations at the MR-unit were CPU intensive and required large amount of
computer memory. Powerful computational servers were used for scientific calculations and
Unix workstations were used for data processing. Up to three students worked in a small
computer room at the MR-unit. Heat and noise produced by the workstations would have
made working conditions in this room difficult. Therefore only monitors, keyboards and mice
were placed in the computer room; the workstations were placed in a separate "machine"
room and connected via long (about 18 m long) cables. This configuration worked well for
Sun workstations with display resolutions up to 1280 x 1024 pixels. For higher resolutions,
however, either very expensive DVI extenders or a solution based on thin clients were
needed. The latter was implemented in 2007 using thin clients in an SBC configuration. This
infrastructure worked well for several years. It became obsolete in 2010 as the server
operating system was no longer supported by the manufacturer and the speed of the thin
clients was not sufficient for new, graphics intensive applications. An update of the IT
infrastructure was needed.

3
The purpose and scope of this thesis is to (i) analyze the current computer configuration at the
MR-unit of the Department of Radiological Science (ii) propose an upgrade (iii) implement
the proposed changes and (iv) analyze the new computer configuration at the MR-unit.
1.3 Layout
This section defines the layout and a brief introduction of the thesis.
Chapter1: Introduction
This chapter describes the evolution phases of computing technology, the thin client
computing models, and aims of the thesis.
Chapter 2: Background
This chapter introduces the SBC, its advantages, components and various protocols based on
SBC.
Chapter 3: Performance analysis tools and benchmarks
This chapter defines the performance analysis in general, tools and benchmarks used for the
performance analysis of the SBC environment.
Chapter 4: Typical-load performance analysis
This chapter briefly presents the load performance analysis, the methods and the results,
discussion and conclusion.
Chapter 5: Graphics performance analysis
This chapter describes the graphics performance analysis of the implemented SBC, the
methods and the results, discussion and conclusion.
Chapter 6: User perceived performance analysis
This chapter presents the results and discussion on the performance analysis based on user
experience via qualitative research method.
Chapter 7: Conclusion
This chapter describes the summary of the thesis work.

4
5
2
Background
2.1 Introduction
Concepts described in sections 2.1 and 2.2 are based on information provided in [2]. Server-
based computing (SBC) is a technology whereby applications are deployed, managed,
supported and executed on the server and not on the client. Only the screen information is
transmitted between the server and the client.
SBC is also known as Thin Client Computing (TCC) and typically consist of the three
components: a terminal server, one or more thin clients, and a communication protocol. The
terminal server runs an operating system that supports a multi user environment. The thin
client runs a stripped-down version of an operating system that is capable of running a
program that connects the thin client to the server. The last component is the protocol which
allows the communication between thin clients and the terminal server by sending keystrokes,
mouse clicks and screen updates via network. In larger deployments, more than one terminal
server may be used; load balancing software then distributes workload across the servers.
6
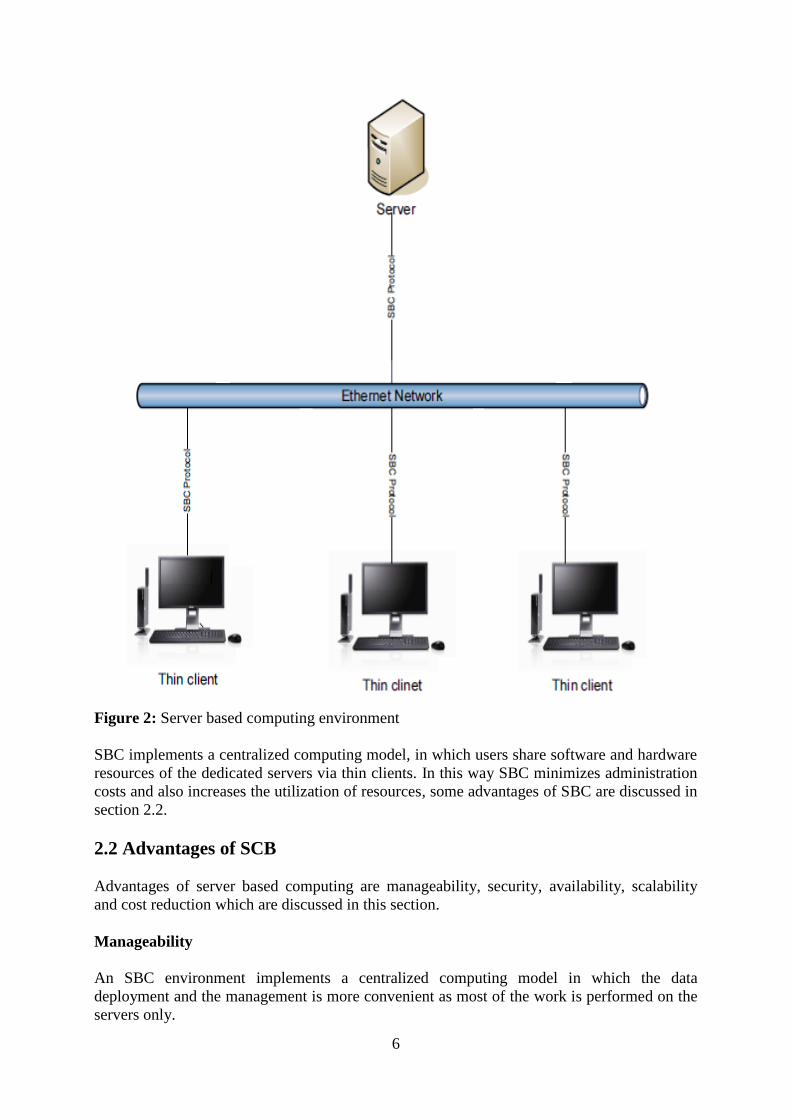
Figure 2: Server based computing environment
SBC implements a centralized computing model, in which users share software and hardware
resources of the dedicated servers via thin clients. In this way SBC minimizes administration
costs and also increases the utilization of resources, some advantages of SBC are discussed in
section 2.2.
2.2 Advantages of SCB
Advantages of server based computing are manageability, security, availability, scalability
and cost reduction which are discussed in this section.
Manageability
An SBC environment implements a centralized computing model in which the data
deployment and the management is more convenient as most of the work is performed on the
servers only.
7
Security
In SBC, all the data is kept on secure servers. Data security is covered from the perspectives
of both the physical security and the technical security. The physical security in the sense that
server normally resides in a server room, in which only authorized persons are allowed to
enter. The technical security is provided by the use of protocols to keep the data integrity and
confidentiality.
Scalability
In an SBC environment, new thin clients can be added to the system to support more users
without changing the architectural design of the system. Similarly new servers can be added
to balance the load of the system without changing the architecture of the system.
Availability
Servers can support fault tolerance. For instance features like redundant disk drives,
redundant power supplies etc. Moreover they can run special applications to manage the load
and monitor the performance. In case of a server failure, the user is redirected to a different
server.
Cost Reduction
Server based computing reduces costs on account of hardware, software, maintenance,
administrator staffing and training etc.
2.3 SBC Implementation
There are two aspects of an SBC implementation: SBC Hardware implementation and SBC
Software implementation.
2.3.1 SBC Hardware Implementation
There are two ways of SBC hardware implementation namely (i) thin client and (ii)
workstation or personal computer (PC).
Thin Client
A thin client is a computing device which totally relies on a server for computing. All
application logic is executed on the server. A thin client comprises of a display screen, a
mouse and a keyboard combine with the adequate processing capabilities and memory for the
graphical rendering and the network communication with a server. It has no long-term user
state and requires no disk.
Workstation
An ordinary workstation or Personal Computer (PC) can also be used for an SBC. The
workstation has to be installed with an SBC supportive operating system like the TLCOS
[27]. Alternatively, if a full OS is not feasible at the workstation then a client side application
8
of the SBC supporting software being used at the server, has to be installed on the
workstation.
2.3.2 SBC Software Implementation
The most important component of the SBC is a software protocol which is used to facilitate
the communication between a thin client and a server. There are several protocols for SBC
some of them are discussed in this section.
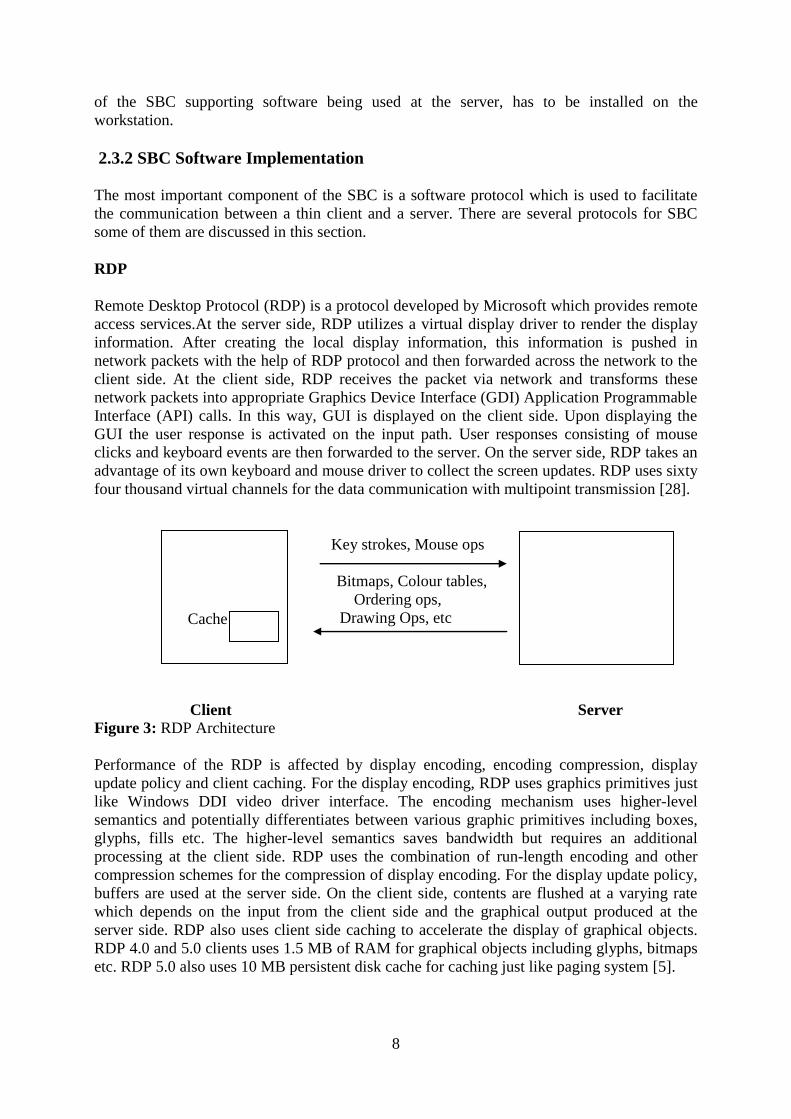
RDP
Remote Desktop Protocol (RDP) is a protocol developed by Microsoft which provides remote
access services.At the server side, RDP utilizes a virtual display driver to render the display
information. After creating the local display information, this information is pushed in
network packets with the help of RDP protocol and then forwarded across the network to the
client side. At the client side, RDP receives the packet via network and transforms these
network packets into appropriate Graphics Device Interface (GDI) Application Programmable
Interface (API) calls. In this way, GUI is displayed on the client side. Upon displaying the
GUI the user response is activated on the input path. User responses consisting of mouse
clicks and keyboard events are then forwarded to the server. On the server side, RDP takes an
advantage of its own keyboard and mouse driver to collect the screen updates. RDP uses sixty
four thousand virtual channels for the data communication with multipoint transmission [28].
Key strokes, Mouse ops
Bitmaps, Colour tables,
Ordering ops,
Drawing Ops, etc
Client Server Figure 3: RDP Architecture
Performance of the RDP is affected by display encoding, encoding compression, display
update policy and client caching. For the display encoding, RDP uses graphics primitives just
like Windows DDI video driver interface. The encoding mechanism uses higher-level
semantics and potentially differentiates between various graphic primitives including boxes,
glyphs, fills etc. The higher-level semantics saves bandwidth but requires an additional
processing at the client side. RDP uses the combination of run-length encoding and other
compression schemes for the compression of display encoding. For the display update policy,
buffers are used at the server side. On the client side, contents are flushed at a varying rate
which depends on the input from the client side and the graphical output produced at the
server side. RDP also uses client side caching to accelerate the display of graphical objects.
RDP 4.0 and 5.0 clients uses 1.5 MB of RAM for graphical objects including glyphs, bitmaps
etc. RDP 5.0 also uses 10 MB persistent disk cache for caching just like paging system [5].
Cache
9
The RDP uses RC4 encryption algorithm to secure the data communication which provides
three different levels of security namely low, medium and high. The RC4 low level security
provides unidirectional encryption with the help of a 56 or 40 bit key encryption. RC4
medium level security uses bidirectional encryption with the same key length used in low
level security. RC4 uses high level security and provides bidirectional encryption with 128 bit
key encryption [6].
ICA
Independent Computing Architecture (ICA) is a protocol developed by Citrix to provide
remote access service. On the server side, ICA uses a local device driver to render graphics.
For encoding the graphical information, it uses a graphic primitive which is similar to a
Windows video driver interface and RDP. The encoded ICA packet is then compressed with a
combination of run length coding and other compression techniques. The TCP protocol
encapsulates the compressed ICA packet and forwards it to the network layer, for creating the
session between the client and the server side. On the client side, the ICA client software
intercepts the server message via the TCP protocol and fetches the screen from the server. As
a result, the session is created and the ICA client software in return sends the screen updates
to the server. On the server side, ICA uses a screen update policy with the help of buffers. The
contents of the buffer flushed with changing rate according to the user input in the form of
key strokes, mouse events and the amount of display output being generated. To observe
buffered display an evaluator named Speed-screen is used. On the client side, it uses a
queuing mechanism for sending and receiving updates form the server. The data transmission
rate can be changed in the client software. The ICA client uses a caching mechanism before
downloading updates from the server, which increases the transport performance. The cache
is first checked for updated information and if the update is true it downloads from cache
instead of downloading from server, across the network [5].
Just like RDP, the ICA performance also depends on display encoding, encoding
compression, display update policy and client caching. The display encoding, encoding
compression and display update policy characteristics are similar to RDP. However, for client
caching, ICA uses 3.0 MB of RAM for graphical objects and it also uses a disk for persistent
caching [5].
NX
G.F Pinzari of NoMachine originally developed an NX which uses the SSH protocol to
securely connect and display the remote access services. The NX was derived from the
Differential X Protocol Compressor (DXPC). It uses a two way proxy system to provide the
data communication between the local system and the remote system with the help of the NX
protocol based on the X window system. The remote proxy communicates with the remote
X11 applications and uses the X11 protocol. The remote proxy incorporates a kind of X
server, named nxagent, that becomes the X server of all the remote X clients. The nxagent
translates the X11 protocol into the NX protocol, receiving X11 requests as drawing
commands and sending them to the local proxy. Thus the remote NX proxy poses itself to the
X clients as if it is the X server. All the roundtrips take place at this point and since they
happen on the same host machine, they are quickly resolved through the UNIX domain
sockets. The local NX proxy communicates with the local X server and interprets the NX
protocol back to X11. Both the local and the remote proxy keep their own cache of
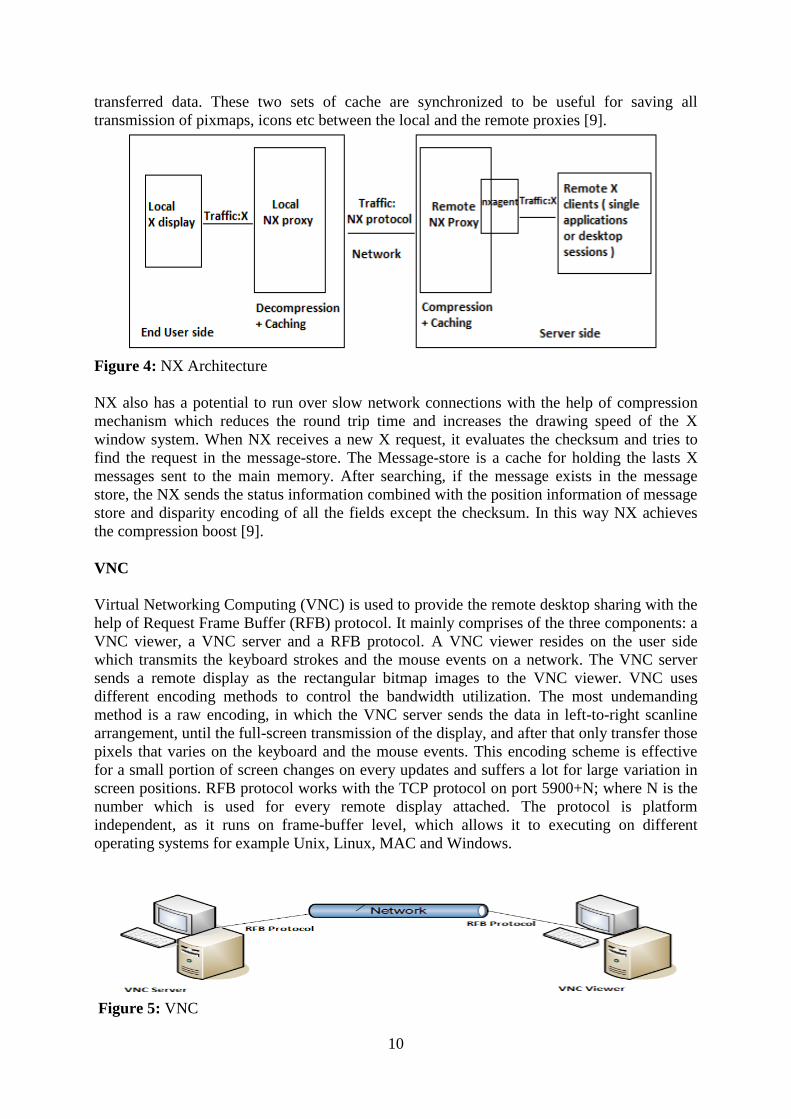
10
transferred data. These two sets of cache are synchronized to be useful for saving all
transmission of pixmaps, icons etc between the local and the remote proxies [9].
Figure 4: NX Architecture
NX also has a potential to run over slow network connections with the help of compression
mechanism which reduces the round trip time and increases the drawing speed of the X
window system. When NX receives a new X request, it evaluates the checksum and tries to
find the request in the message-store. The Message-store is a cache for holding the lasts X
messages sent to the main memory. After searching, if the message exists in the message
store, the NX sends the status information combined with the position information of message
store and disparity encoding of all the fields except the checksum. In this way NX achieves
the compression boost [9].
VNC
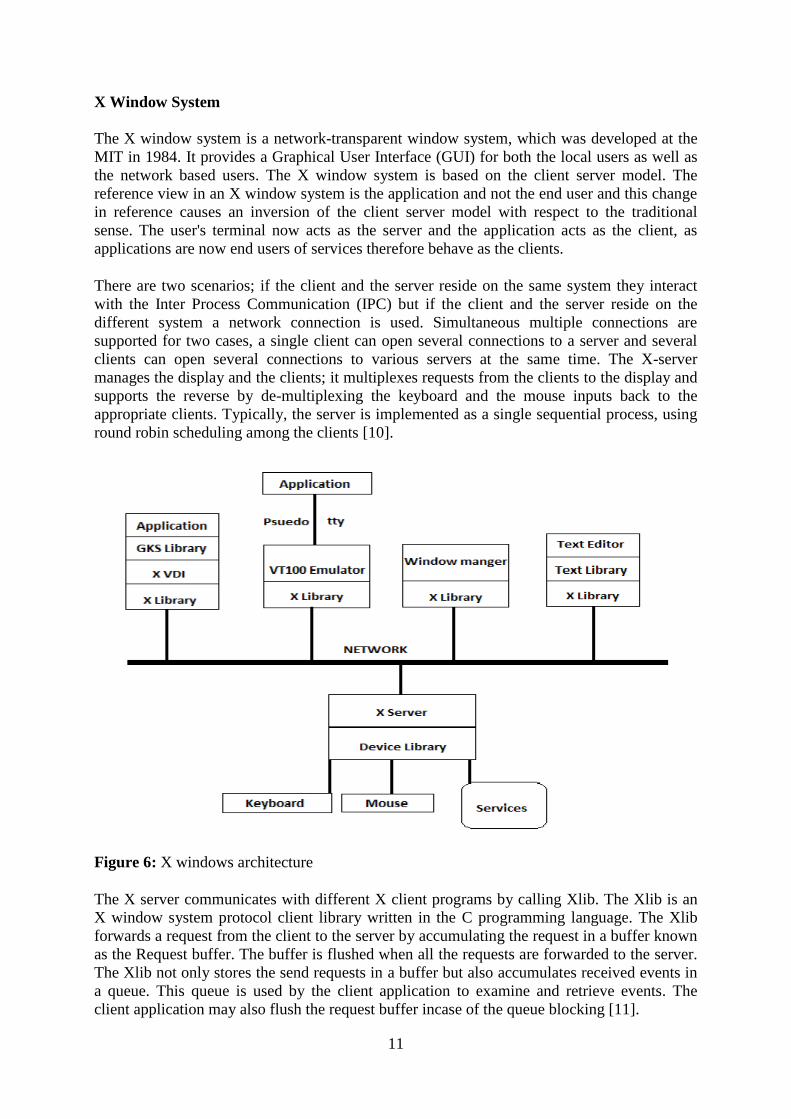
Virtual Networking Computing (VNC) is used to provide the remote desktop sharing with the
help of Request Frame Buffer (RFB) protocol. It mainly comprises of the three components: a
VNC viewer, a VNC server and a RFB protocol. A VNC viewer resides on the user side
which transmits the keyboard strokes and the mouse events on a network. The VNC server
sends a remote display as the rectangular bitmap images to the VNC viewer. VNC uses
different encoding methods to control the bandwidth utilization. The most undemanding
method is a raw encoding, in which the VNC server sends the data in left-to-right scanline
arrangement, until the full-screen transmission of the display, and after that only transfer those
pixels that varies on the keyboard and the mouse events. This encoding scheme is effective
for a small portion of screen changes on every updates and suffers a lot for large variation in
screen positions. RFB protocol works with the TCP protocol on port 5900+N; where N is the
number which is used for every remote display attached. The protocol is platform
independent, as it runs on frame-buffer level, which allows it to executing on different
operating systems for example Unix, Linux, MAC and Windows.
Figure 5: VNC
11
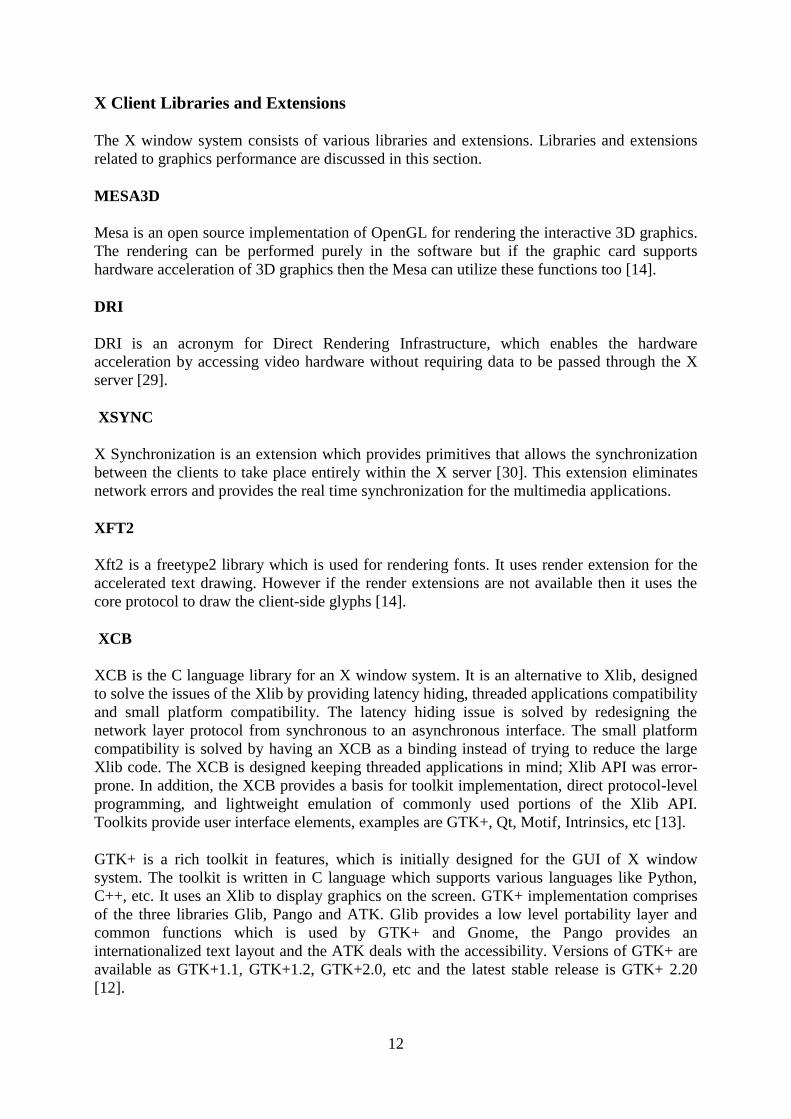
X Window System
The X window system is a network-transparent window system, which was developed at the
MIT in 1984. It provides a Graphical User Interface (GUI) for both the local users as well as
the network based users. The X window system is based on the client server model. The
reference view in an X window system is the application and not the end user and this change
in reference causes an inversion of the client server model with respect to the traditional
sense. The user's terminal now acts as the server and the application acts as the client, as
applications are now end users of services therefore behave as the clients.
There are two scenarios; if the client and the server reside on the same system they interact
with the Inter Process Communication (IPC) but if the client and the server reside on the
different system a network connection is used. Simultaneous multiple connections are
supported for two cases, a single client can open several connections to a server and several
clients can open several connections to various servers at the same time. The X-server
manages the display and the clients; it multiplexes requests from the clients to the display and
supports the reverse by de-multiplexing the keyboard and the mouse inputs back to the
appropriate clients. Typically, the server is implemented as a single sequential process, using
round robin scheduling among the clients [10].
Figure 6: X windows architecture
The X server communicates with different X client programs by calling Xlib. The Xlib is an
X window system protocol client library written in the C programming language. The Xlib
forwards a request from the client to the server by accumulating the request in a buffer known
as the Request buffer. The buffer is flushed when all the requests are forwarded to the server.
The Xlib not only stores the send requests in a buffer but also accumulates received events in
a queue. This queue is used by the client application to examine and retrieve events. The
client application may also flush the request buffer incase of the queue blocking [11].
12
X Client Libraries and Extensions
The X window system consists of various libraries and extensions. Libraries and extensions
related to graphics performance are discussed in this section.
MESA3D
Mesa is an open source implementation of OpenGL for rendering the interactive 3D graphics.
The rendering can be performed purely in the software but if the graphic card supports
hardware acceleration of 3D graphics then the Mesa can utilize these functions too [14].
DRI
DRI is an acronym for Direct Rendering Infrastructure, which enables the hardware
acceleration by accessing video hardware without requiring data to be passed through the X
server [29].
XSYNC
X Synchronization is an extension which provides primitives that allows the synchronization
between the clients to take place entirely within the X server [30]. This extension eliminates
network errors and provides the real time synchronization for the multimedia applications.
XFT2
Xft2 is a freetype2 library which is used for rendering fonts. It uses render extension for the
accelerated text drawing. However if the render extensions are not available then it uses the
core protocol to draw the client-side glyphs [14].
XCB
XCB is the C language library for an X window system. It is an alternative to Xlib, designed
to solve the issues of the Xlib by providing latency hiding, threaded applications compatibility
and small platform compatibility. The latency hiding issue is solved by redesigning the
network layer protocol from synchronous to an asynchronous interface. The small platform
compatibility is solved by having an XCB as a binding instead of trying to reduce the large
Xlib code. The XCB is designed keeping threaded applications in mind; Xlib API was error-
prone. In addition, the XCB provides a basis for toolkit implementation, direct protocol-level
programming, and lightweight emulation of commonly used portions of the Xlib API.
Toolkits provide user interface elements, examples are GTK+, Qt, Motif, Intrinsics, etc [13].
GTK+ is a rich toolkit in features, which is initially designed for the GUI of X window
system. The toolkit is written in C language which supports various languages like Python,
C++, etc. It uses an Xlib to display graphics on the screen. GTK+ implementation comprises
of the three libraries Glib, Pango and ATK. Glib provides a low level portability layer and
common functions which is used by GTK+ and Gnome, the Pango provides an
internationalized text layout and the ATK deals with the accessibility. Versions of GTK+ are
available as GTK+1.1, GTK+1.2, GTK+2.0, etc and the latest stable release is GTK+ 2.20
[12].
13
Qt is a toolkit for creating the GUI and the Non-GUI programs. The toolkit is widely used
because it supports many platforms (X11, Windows, Mac OS X etc) and has APIs that are
tailored for tasks such as file handling, process handling threading etc. The toolkit is written
in C++ and also supports many different languages with the help of language bindings. Qt
also provides an internationalized text and the unicode support. Versions of Qt are available
as Qt1, Qt2 etc and the latest Qt4 has most accessibility support [12].
The X protocol does not use any compression mechanism for the transport of the graphical
objects on the remote display. The important factor in the performance of X protocol is a
transport latency which depends on the round trip time; from the X-server to the X-client and
back to the X-server. The Xlib increases the transport latency as it mostly uses the
synchronous operation; however, the design of XCB reduces the latency by introducing the
asynchronous interface in the X protocol 14].
ThinLinc
ThinLinc is a software based implementation of an SBC, developed by Cendio AB. Thinlinc
not only enhances the mechanism of an SBC but also provide various add-ons which include
encryption, single sign-on, clustering, smartcard support, and integrates different systems and
services [26].
On the server side graphic is generated with the local video device driver which transfers it on
the network to the ThinLinc client by the graphical desktop sharing system known as Virtual
Network Computing (VNC). VNC uses the Request Frame Buffer (RFB) protocol which
transmits mouse clicks, keyboard events and graphics updates from the VNC server to the
VNC viewer. Thinlinc provides both the software and the hardware acceleration for 3D
graphics. Software based acceleration is provided by the rapid integration of the OpenGL with
the 3D graphic library Mesa. Hardware based acceleration is provided with the combination
of TightVNC and the virtualGL. TightVNC is a slightly modified version of VNC which uses
Junior Picture Expert Group (JPEG) codec for the tight encoding; which gives intense
graphics performance and extends streaming video encoding in the real time. VirtualGL
allows remote access applications like tightVNC to execute the OpenGL commands with the
full 3D hardware acceleration. Rendering of 3D data is performed on the application server
with the 3D graphics accelerator. The rendered 3D images are sent on the network to the user
side with the help of the TightVNC.
A user use thinlinc-client to log on to the thinlinc server; in this process the thinlinc-client
creates a secure shell (SSH) tunnel to the thinlinc-server. The client then attempts to
authenticate with the VNC session manager known as VSM server. If the authentication
succeeds, the client then again creates a SSH tunnel to the VSM agent. After the connection
establishment with the VSM agent the tunnel for VNC viewer is then created to start the VNC
viewer [26].

14
15
3
Performance analysis tools and
benchmarks
3.1 Introduction
Performance analysis is the process of evaluating and measuring the software/hardware
behaviour, with the help of information gathered, when the specific program/hardware
operates. Performance analysis not only evaluates the performance metric, but also indicates
and predicts the future requirements of the system.
3.2 Performance analysis tool
There are various tools and techniques to analyze the performance of Linux based SBC. Some
of the tools are discussed in this section.
IOSTAT
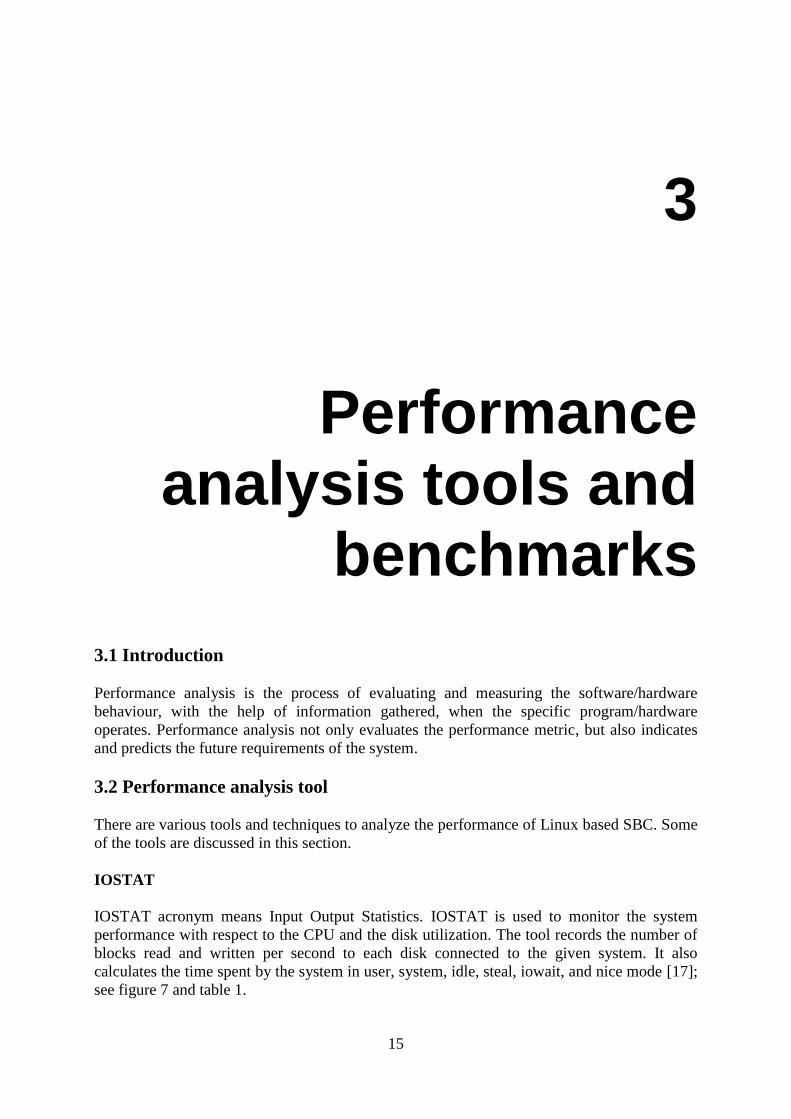
IOSTAT acronym means Input Output Statistics. IOSTAT is used to monitor the system
performance with respect to the CPU and the disk utilization. The tool records the number of
blocks read and written per second to each disk connected to the given system. It also
calculates the time spent by the system in user, system, idle, steal, iowait, and nice mode [17];
see figure 7 and table 1.
16
rizwan.azhar@tintin:/> iostat
Linux 2.6.31.5-0.1-default (tintin) 09/13/10 _x86_64_ (8 CPU)
avg-cpu: %user %nice %system %iowait %steal %idle
3.40 0.19 0.91 0.16 0.00 95.34
Device: tps Blk_read/s Blk_wrtn/s Blk_read Blk_wrtn
sda 1.00 7.03 21.52 25166094 77090737
sdb 0.23 4.35 78.12 15588060 279827257
scd0 0.00 0.26 0.00 936216 0
Figure 7: IOSTAT command output
Table 1: Quantities reported by IOSTAT.
CPU
%user Percentage of CPU utilization that occurred while executing at the user
level.
%nice Percentage of CPU utilization that occurred while executing at the user
level with nice priorities.
%system Percentage of CPU utilization that occurred while executing at the
kernel level.
%iowait Percentage of time that CPU was idle during which the system had an
outstanding disk I/O request.
%steal Percentage of time spent in involuntary wait by the virtual CPU while
the hypervisor serves another virtual processor
%idle Percentage of time spent by CPU in which do not have any process to
execute
Disk I/O
Tps Input/Output transfers per second to the device
blk_read/s Number of blocks read from the device per second
blk_wrtn/s Number of blocks written to the device per second
blk_read total number of blocks read from the device
blk_wrtn total number of blocks written to the device
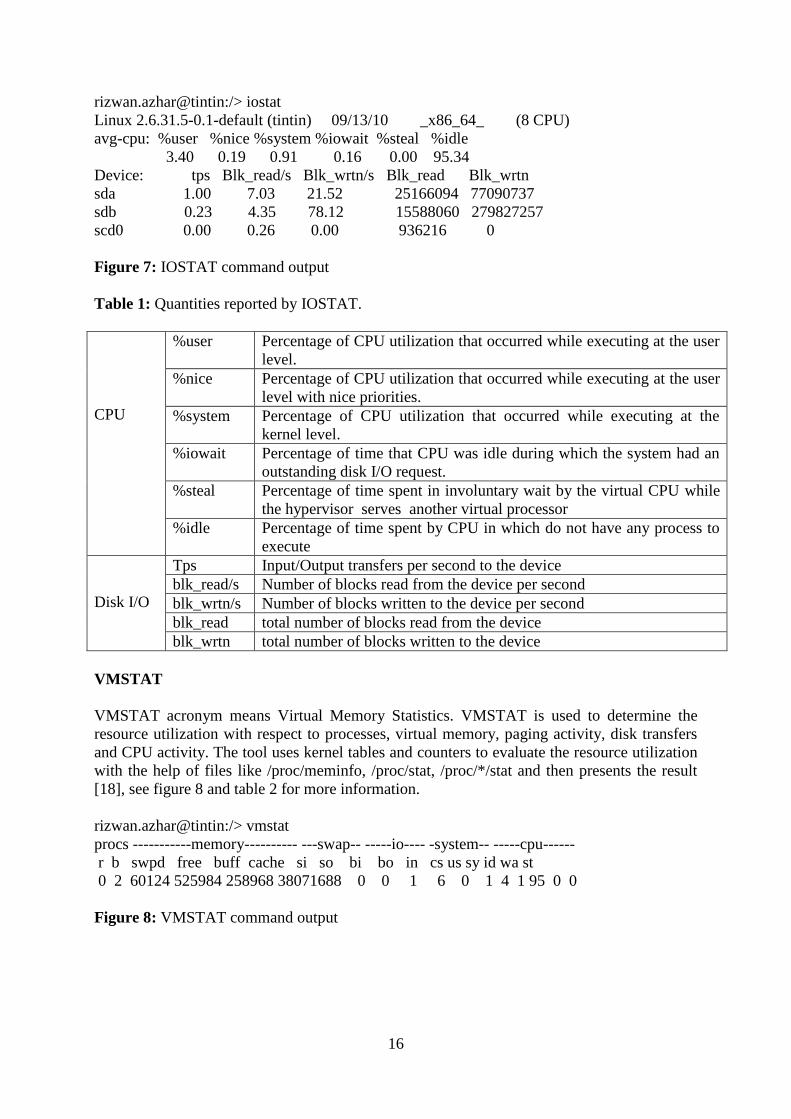
VMSTAT
VMSTAT acronym means Virtual Memory Statistics. VMSTAT is used to determine the
resource utilization with respect to processes, virtual memory, paging activity, disk transfers
and CPU activity. The tool uses kernel tables and counters to evaluate the resource utilization
with the help of files like /proc/meminfo, /proc/stat, /proc/*/stat and then presents the result
[18], see figure 8 and table 2 for more information.
rizwan.azhar@tintin:/> vmstat
procs -----------memory---------- ---swap-- -----io---- -system-- -----cpu------
r b swpd free buff cache si so bi bo in cs us sy id wa st
0 2 60124 525984 258968 38071688 0 0 1 6 0 1 4 1 95 0 0
Figure 8: VMSTAT command output
17
Table 2: Quantities reported by VMSTAT
Process
R Number of processes waiting for run time
B Number of processes in uninterruptable sleep
Memory
Swpd Virtual memory used (in kibibytes)
Free Virtual memory idle (in kibibytes)
Buff Memory (in kibibytes) used for buffering
Cache Memory (in kibibytes) used for caching
Paging
Si Amount of memory swapped in from disk (per second)
So Amount of memory swapped to disk (per second)
IO
Bi Blocks (per second) receive from block device
Bo Blocks (per second) send to block device
System
In Total number of interrupts (per seconds) including clock
Cs Total number of context switches (per second)
CPU
Us Percentage of CPU utilization that occurred while executing at the user
level
Sy Percentage of CPU utilization that occurred while executing at the
kernel level.
Id Percentage of time spent by CPU in which do not have any process to
execute
Wa Percentage of time that CPU was idle during which the system had an
outstanding disk I/O request.
St Percentage of time spent in involuntary wait by the virtual CPU while
the hypervisor serves another virtual processor
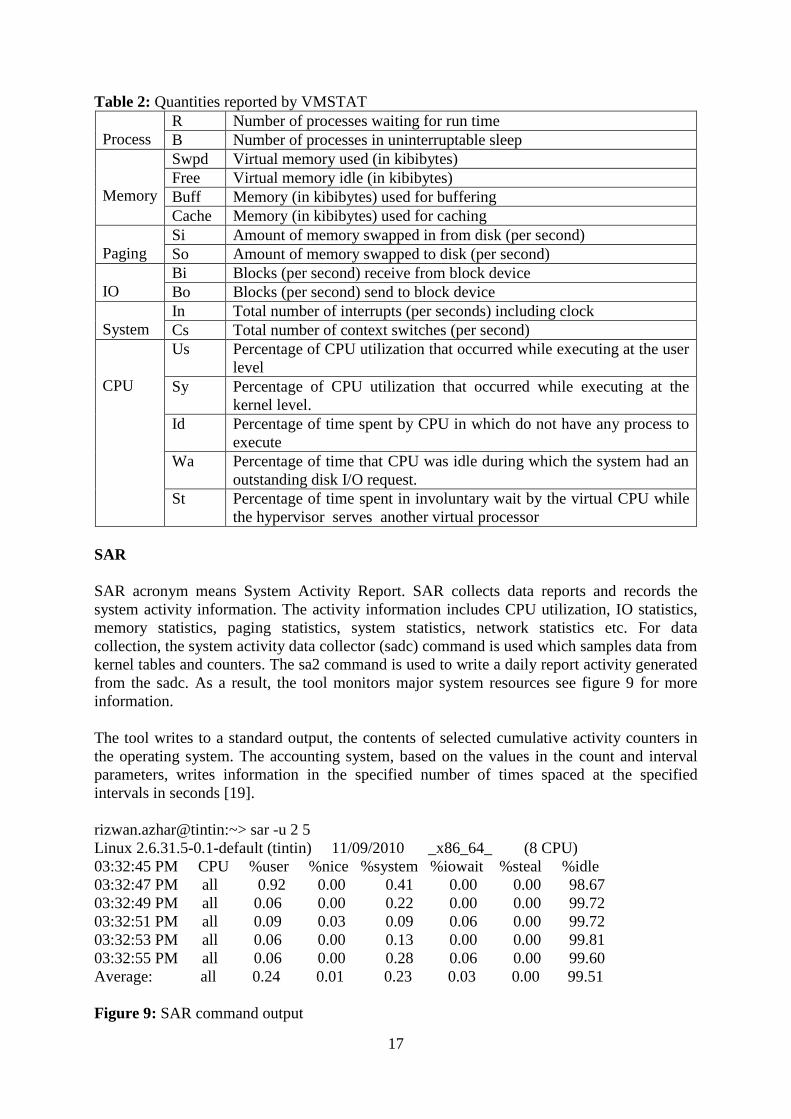
SAR
SAR acronym means System Activity Report. SAR collects data reports and records the
system activity information. The activity information includes CPU utilization, IO statistics,
memory statistics, paging statistics, system statistics, network statistics etc. For data
collection, the system activity data collector (sadc) command is used which samples data from
kernel tables and counters. The sa2 command is used to write a daily report activity generated
from the sadc. As a result, the tool monitors major system resources see figure 9 for more
information.
The tool writes to a standard output, the contents of selected cumulative activity counters in
the operating system. The accounting system, based on the values in the count and interval
parameters, writes information in the specified number of times spaced at the specified
intervals in seconds [19].
rizwan.azhar@tintin:~> sar -u 2 5
Linux 2.6.31.5-0.1-default (tintin) 11/09/2010 _x86_64_ (8 CPU)
03:32:45 PM CPU %user %nice %system %iowait %steal %idle
03:32:47 PM all 0.92 0.00 0.41 0.00 0.00 98.67
03:32:49 PM all 0.06 0.00 0.22 0.00 0.00 99.72
03:32:51 PM all 0.09 0.03 0.09 0.06 0.00 99.72
03:32:53 PM all 0.06 0.00 0.13 0.00 0.00 99.81
03:32:55 PM all 0.06 0.00 0.28 0.06 0.00 99.60
Average: all 0.24 0.01 0.23 0.03 0.00 99.51
Figure 9: SAR command output
18
ISAG
ISAG acronym means Interactive System Grapher. ISAG does not evaluate the performance,
however, it helps in the performance analysis, because ISAG displays the system activity
information graphically. The data being generated from SAR are transformed in to tabular
form and the tabular form is then plotted with the gnuplot [20].
SPEC CPU
The SPEC CPU is designed to provide performance measurements that can be used to
compare the computing intensive workloads on different servers [25]. It includes two
benchmark sets namely CINT and CFP. The CINT benchmark is used for measuring and
comparing computing intensive integer performance, The CFP measures floating point
performance.
3.3 Graphic benchmarks
There are various graphic benchmarks for the Linux based SBC. Some of the graphic
benchmarks are discussed in this section.
X11perf
The X11perf is a graphic benchmark, which is used to analyze the performance of the X
server. The benchmark executes various performance tests on the X server and reports the
performance for executed tests. X11perf is a comprehensive benchmark which performs 384
tests to calculate the performance, for instance drawing of lines, circles, rectangles, copy-
plane, scrolling, stipples, tiles etc. The benchmark not only measures the traditional graphic
performance, but also measures the window management performance. X11perf tests
measures the time to initialize an application, mapping of windows from already existence
window to new windows, reorganizing the windows in different positions, mapping of
bitmaps in to pixels etc. In addition, it also explores the particular strengths and weaknesses of
servers, to analyze and improve a server performance. X11perf benchmark when executed, it
firstly calculates the round trip time to the server, and parts this out of the final timing
reported. It makes sure that the server has really executed the task requested by fetching a
pixel back from the test window [21].
X11perfcomp is a utility of X11perf which helps in the graphics performance analysis, as it
compares the different X11perf result files and represents the result in a tabular form. As a
result, the X11perfcomp is used to compare the performance of different platforms.
X-bench
X-bench is a graphical benchmark which is used to analyze the performance of the X server.
To analyze the performance it executes 40 tests which include drawing of lines, circles,
windows etc on the X server. The X-benchmark measures the performance by calculating the
time it takes to complete each and every individual test on the X server. Each test sends the
instructions with awaiting known time interval normally ten seconds. Xbench remain silent
till the server executed the given instruction with the help of XSync, then the server interacts
with a graphic-controller using another instruction via fifo/pipe/buffer. In the end, Xbench
examines back part of the screen. Examining back part of the screen assures that each pixel is
19
displayed on the X server and does not reside in the instruction queue of server. The Xbench
execute tests in three levels which can be set via command line interface, however, if no level
is defined the default level is used. Each test executes three times and the best evaluation is
taken. As a result, it removes or reduces the effects of daemons or other background
processes [22].
SPECviewperf
The SPECviewperf is a benchmark developed by the Standard Performance Evaluation
Corporation (SPEC) that evaluates an OpenGL graphic performance. It is a software program
written in C language which is used to evaluate system performance in higher-quality
graphics modes and also measure the scalability of graphics subsystems while running
multithreaded graphics content. SPECviewperf performs various tests and measures the
performance in frames per second. It renders the data set in the predefined frame numbers,
with animation between the frames displayed on the output screen. The benchmark use
viewset to characterize the graphics representation of an application. Viewset comprises of
tests, data sets and weights which are grouped with independent software vendors (ISV) that
provide weight-age for each test through which performance is reported in the output.
Viewset include cataia, ensight, maya, pro, maya, solid works, ugx-nx, 3ds-max. For Detailed
viewset description see [23]; however we have only discussed Ensight, Maya and Proe
viewset. Ensight is a viewset which is used to evaluate display list and immediate mode paths
with the help of OpenGL API. Maya viewset uses a blend of the immediate mode and the
OpenGL to transfer the data through an OpenGL API. Proe viewset uses two models and
three rendering modes for evaluating the graphics. It also uses gradient background for the
efficient modeling of workload [23].
SPECviewperf measures the performance for the following entities:
3D primitives, including points, lines, line_strip, line_loop, triangles,
triangle_strip, triangle_fan, quads and polygons
Attributes per vertex, per primitive and per frame
Lighting
Texture mapping
Alpha blending
Fogging
Anti-aliasing
Depth buffering
Alpha blending is used for combining a transparent foreground color with a background color,
as a result creates a new blended color. Fogging is a process which is used to improve the
acuity of distance. Anti-aliasing refers to a process that reduces the appearance of aliased or
jagged edges, produced due to fixed resolution of the computer display.

20
21
4
Typical-load performance
analysis
4.1 Introduction
Performance analysis of a load is described in chapter 3; the main ideas can be summarized as
follows: Load measurement refers to the practice of assessing a system’s behavior under the
load. The Load measurement may be performed during design, development, integration, and
quality assurance phase. Performance analysis of a load evaluates the functional and
performance problems of a system under the load. Performance problems include those
scenarios in which the system experience low throughput or long response time. Functional
problems include bugs in the system and deadlocks situations. Load is applied on the system
with the help of the programs or the applications which utilizes system resources. The load of
the system is measured by means of logs and reports generated by the monitoring application,
which is already installed in the system. The monitoring application uses operating system
kernel tables and counters to calculate the system resource usage information which includes
CPU utilization, memory consumption, Disk I/O requests, paging activity etc.
This chapter describes the old and new computer system configurations at MR unit and
performance analysis of typical load in these two configurations.
22
Old computer environment at the MR-unit
The computer environment at the MR-unit consisted of servers, workstations and thin clients,
see tables 3 and 4 and figure 10. Nestor and milou were computational servers, anka was a file
server, abdallah and tchang were workstations. Three thin clients were connected to nestor via
a private network; they were not assigned any DNS names.
Table 3: Servers and workstations at the MR-unit (old computer environment)
Host name
Architecture
CPU
RAM
Operating
System
milou
64 bit
2 x Opteron 1.8
GHz
4 GiB
openSUSE 10.3
abdallah
64 bit
Pentium D 2.8
GHz
1 GiB
openSUSE 10.3
tchang
32 bit
Intel Pentium 4
2 GHz
1 GiB
openSUSE 10.3
nestor
64 bit
Quad core Xeon
5150 2.66 GHz
32 GiB
openSUSE 10.3
Table 4: Old thin clients at the MR-unit
Machine
CPU
RAM
CPU cache
Network
IGEL-2110
LX Smart
Via Eden 400
MHz
236 MiB
128 KiB
Ethernet,
100 Mbps
23
Figure 10: Schematic view of the network configuration at the MR-unit
Nestor was the main computational server at the MR-unit. It was used to run applications like
jMRUI, Spm8, Idl, Analyze, Lcmodel, Sage, and Matlab. Thin client users used the XDMCP
protocol to connect to the nestor. Workstation users used SSH to run commands remotely on
nestor.
Milou had been the main computational server at the MR-unit before 2007. In the beginning
of 2007, it was replaced in this role by the nestor. Since then it was used as a secondary
computational server.
Thin clients were connected to the Gigabit Ethernet switch, see figure 10. A remote session
via the XDMCP protocol was automatically opened on the nestor when the thin client was
turned on.
Anka provided file services at CMIV and the MR-unit; nestor, milou, tchang and abdallah
mounted user home directories via NFS version 3. It also provided the database of unix users
via the NIS service. Hostnames were resolved via DNS; the master and slave servers at the
MR-unit were nestor and milou, respectively.
24
New computer environment at MR unit
In the new computer environment the computational server nestor was replaced with tintin,
see table 5. The new server was selected as the fastest server-class machine that fitted in to
the limited budget see table 19 in Appendix C for considered alternatives.
Table 5: New server configuration at the MR-unit
Host name
Architecture
CPU
RAM
Operating
System
tintin
64 bit
2 x Intel Xeon
Quad core
E5560 2.8 GHz
48 GiB
openSUSE 11.2
The new thin clients were selected according to a recommendation by Peter Ästrand from
Cendio AB, for having good price-performance ratio and software support from the
manufacturer; see table 20 in Appendix C for available models and table 6 for the parameters
of the chosen system.
Table 6: New thin client at the MR-unit
Machine
CPU
RAM
CPU cache
Network
Fujitsu S550
AMD Sempron
200U, 1 GHz
1 GiB
256 KiB
Ethernet,
1 Gbps
4.2 Methods
To evaluate the performance of a typical load, SAR was used. The ISAG utility was used to
display the data graphically. To create a typical load on both the servers, a MATLAB script
was used. The script comprised of numerous calculations based on Magnetic Resonance
Imaging (MRI) of brain and different parts of the human body. The load tests were executed
on the nestor and the tintin during a weekend to eliminate the users’ influence on the system
load.
4.3 Results
Results generated by SAR and visualized by ISAG are presented in this section.
25
CPU Utilization
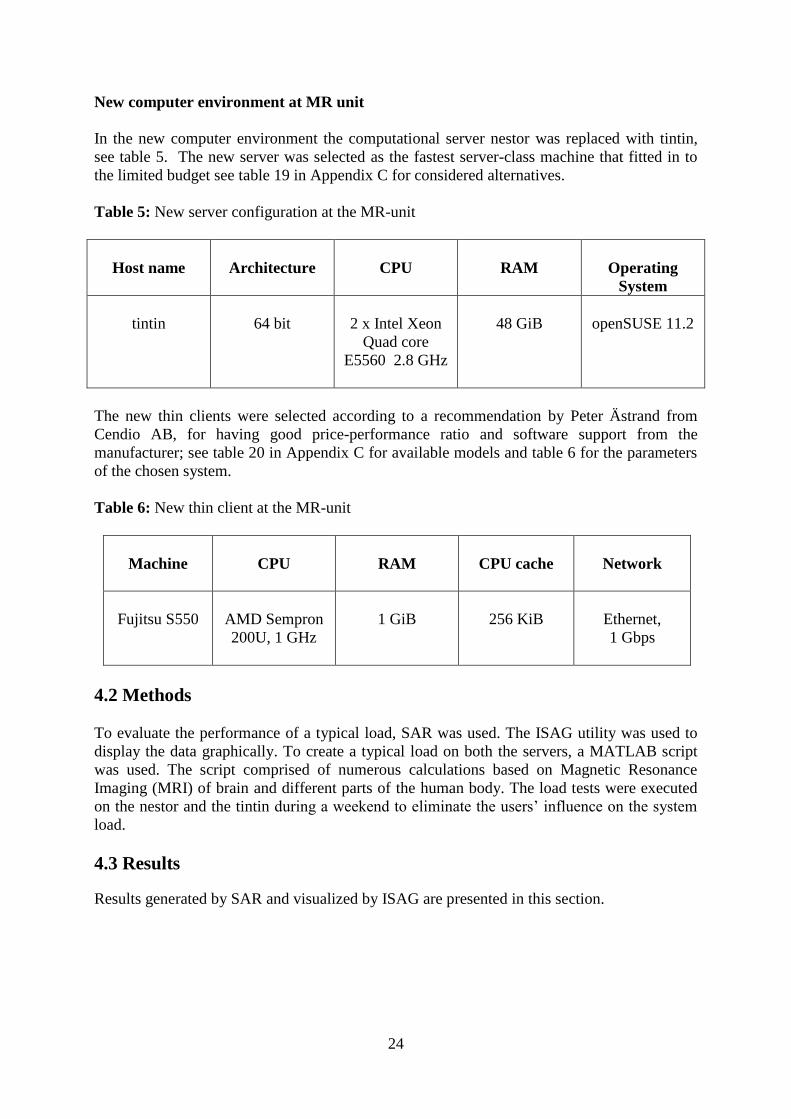
Figure 11a shows the CPU utilization during the load test. The process was started at 16.30
and took 2.12 hours to execute. The utilization of 35% indicates that the one CPU core was
fully loaded while another one was loaded up to 50% only. We theorize this was caused by
the inner working of how Matlab executed the script. The script put a low demand on network
and disk resources. Therefore the task was mainly CPU intensive.
Similar results were obtained for tintin, see figure 11b. The test started at 18:30 and took 1.32
hours to execute. The process fully utilized one core and 18% of another core. The speed up
in total run time was 2.12 1.32 1.6.
(a)
(b)
Figure 11: CPU utilization as a function of time for server nestor (a) and server tintin (b).
26
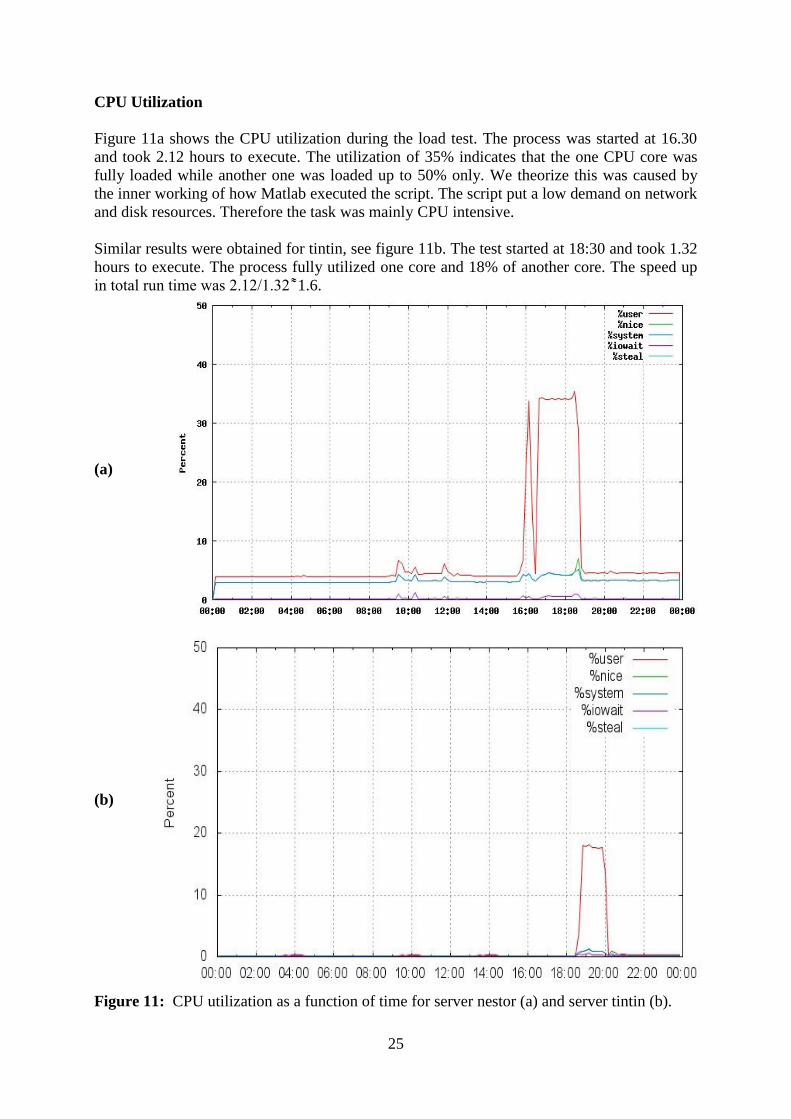
PAGING STATISTICS
Figure 12a shows paging and fault statistics obtain during the load test on nestor. The amount
of paging and major faults was negligible. The rate of minor faults reflected the activity of a
data processing job.
For tintin, the rate of minor faults was substantly lower compared to the nestor, see figure
12b. The physical memory size was sufficient to meet the dynamic memory requirements of
the load test.
(a)
(b)
Figure 12: Paging activity as a function of time for server nestor (a) and server tintin (b).
27
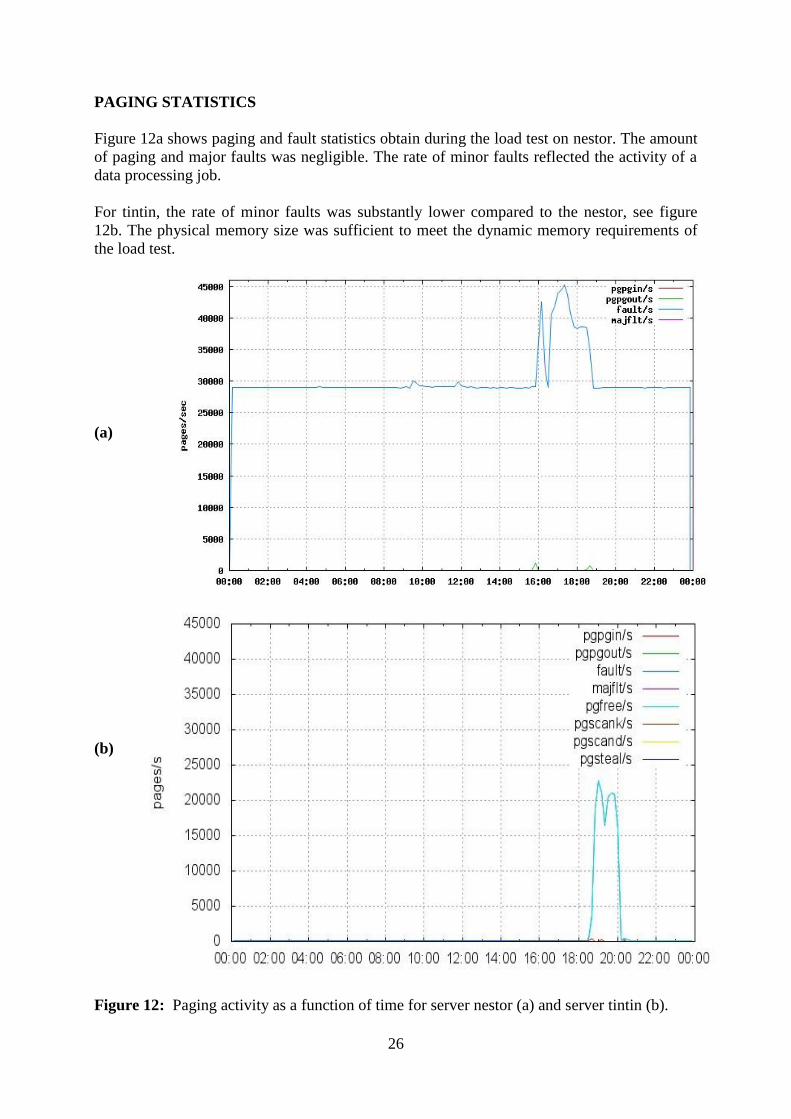
I/O Transfer Rate
Figure 13a shows the Input Output transfer rate during the load test on nestor. Substantly low
disk IO requests were reflected. On the average, the network IO requests transmitted and
received per second during the load test were 208.03 and 150 Kbps.
For tintin, the similar results were obtained, see figure 13b. The disk IO requests were slightly
reduced compared to the nestor. The average network IO request transmitted and received per
seconds during the load test were 313.15 and 271.21 Kbps.
(a)
(b)
Figure 13: Number of IO operations as a function of time for server nestor (a) tintin (b).
28
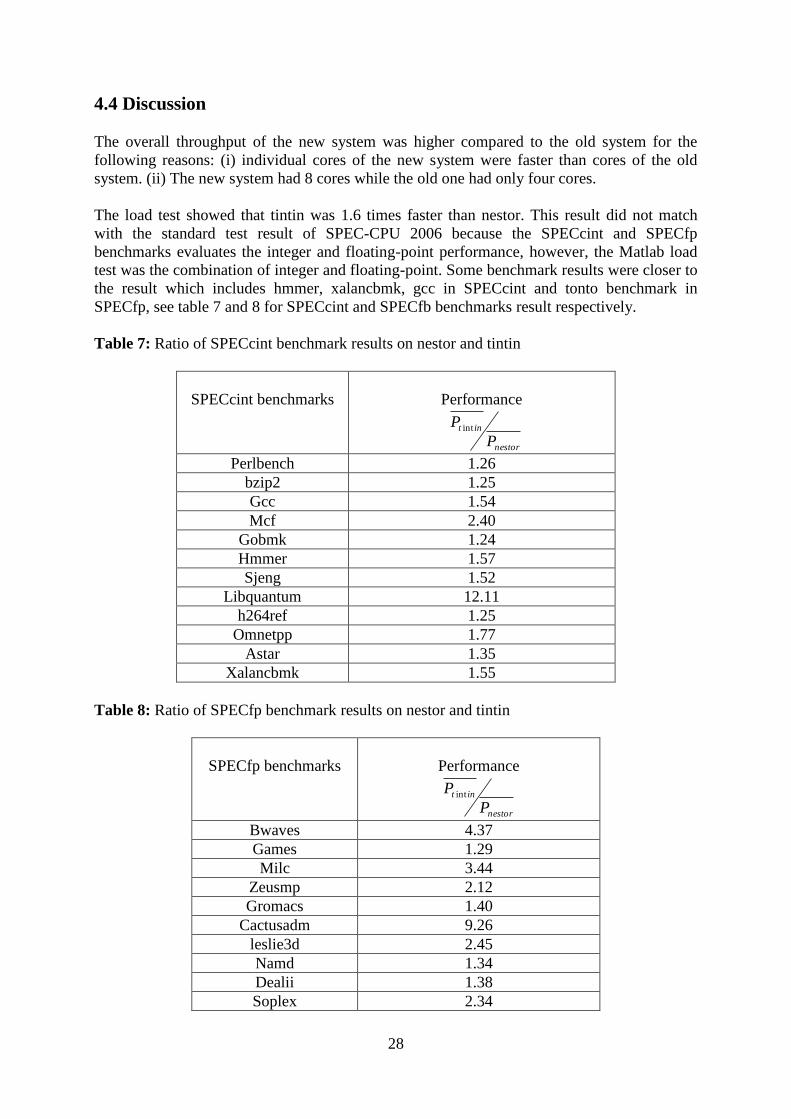
4.4 Discussion
The overall throughput of the new system was higher compared to the old system for the
following reasons: (i) individual cores of the new system were faster than cores of the old
system. (ii) The new system had 8 cores while the old one had only four cores.
The load test showed that tintin was 1.6 times faster than nestor. This result did not match
with the standard test result of SPEC-CPU 2006 because the SPECcint and SPECfp
benchmarks evaluates the integer and floating-point performance, however, the Matlab load
test was the combination of integer and floating-point. Some benchmark results were closer to
the result which includes hmmer, xalancbmk, gcc in SPECcint and tonto benchmark in
SPECfp, see table 7 and 8 for SPECcint and SPECfb benchmarks result respectively.
Table 7: Ratio of SPECcint benchmark results on nestor and tintin
SPECcint benchmarks
Performance
nestor
int
P
P int
Perlbench 1.26
bzip2 1.25
Gcc 1.54
Mcf 2.40
Gobmk 1.24
Hmmer 1.57
Sjeng 1.52
Libquantum 12.11
h264ref 1.25
Omnetpp 1.77
Astar 1.35
Xalancbmk 1.55
Table 8: Ratio of SPECfp benchmark results on nestor and tintin
SPECfp benchmarks
Performance
nestor
int
P
P int
Bwaves 4.37
Games 1.29
Milc 3.44
Zeusmp 2.12
Gromacs 1.40
Cactusadm 9.26
leslie3d 2.45
Namd 1.34
Dealii 1.38
Soplex 2.34
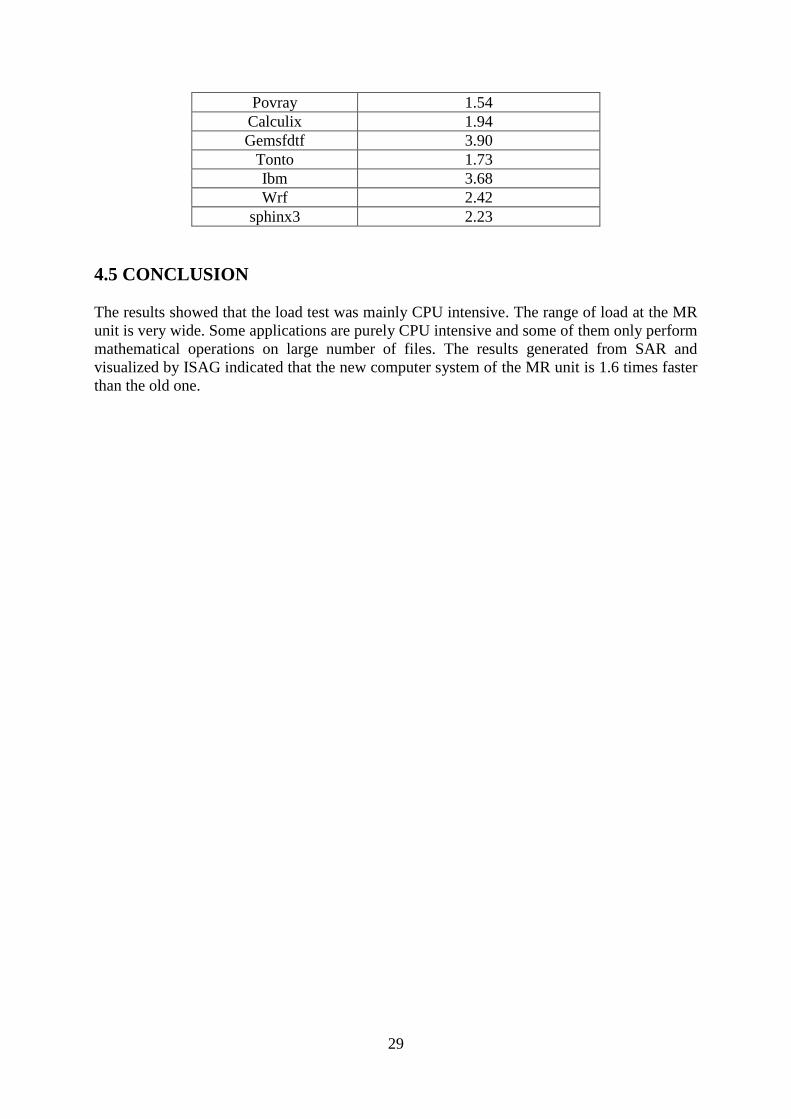
29
Povray 1.54
Calculix 1.94
Gemsfdtf 3.90
Tonto 1.73
Ibm 3.68
Wrf 2.42
sphinx3 2.23
4.5 CONCLUSION
The results showed that the load test was mainly CPU intensive. The range of load at the MR
unit is very wide. Some applications are purely CPU intensive and some of them only perform
mathematical operations on large number of files. The results generated from SAR and
visualized by ISAG indicated that the new computer system of the MR unit is 1.6 times faster
than the old one.

30
31
5
Graphic performance
analysis
5.1 Introduction
Graphics performance may affect the overall performance of applications. This aspect is
especially important in the server based computing, because the speed of the server, thin
clients, network has to be properly balanced. One way of measuring the overall graphics
performance is the usage of benchmark programs, which evaluate the performance of both the
hardware and the software implementations of visualization routines.
It is well known that desktop environment may play a significant role in the graphical
performance; the more visually rich the environment is the slower the response of applications
may be. On Linux, typically used desktop environments are KDE and Gnome. The X window
system, however, does not require the usage of a full desktop environment; a full featured
window manager like IceWM may be used instead. To keep the discussion in this chapter
simple, we use the term “desktop environment” for IceWM also. List of all tested desktop
environments is in table 11.
32
5.2 Methods
Graphics performance was evaluated using graphics benchmarks X11perf, Xbench and
SPECviewperf, refer to chapter 3 for more information about the benchmarks.
Xbench and X11perf simulations were executed from KDE, Gnome and IceWM on the old
thin client with the original software (OTC-O), new thin client with the original software
(NTC-O), new thin client with the Thinlinc (NTC-T), the computational servers were nestor
and tintin. In the case of Xbench, the AWK programming language was used to process the
output files. For X11perf, the X11perfcomp was used to merge the output data in a tabular
form. Additionally, an R script (see appendix A and B) was written to visualize the data.
Table 9: Experimental design for benchmark tests with Xbench and X11perf. Values in the
table give the number of repetition for each test.
Desktop
Environment
Xbench
X11perf
OTC-O
NTC-O
NTC-T
OTC-O
NTC-O
NTC-T
KDE
3
3
3
2
2
2
Gnome
3
3
3
2
2
2
IceWM
3
3
3
2
2
2
To estimate the effect of remote display i.e how the network transfer slows down the graphics
device performance, the Xbench benchmark was also used in the configuration described in
table 10.
Table 10: Experimental design for the estimation of remote display. Values in the table give
the number of repetition for the Xbench test.
X server/ Display device
Server
Tintin
Nestor
Nestor
2
2
33
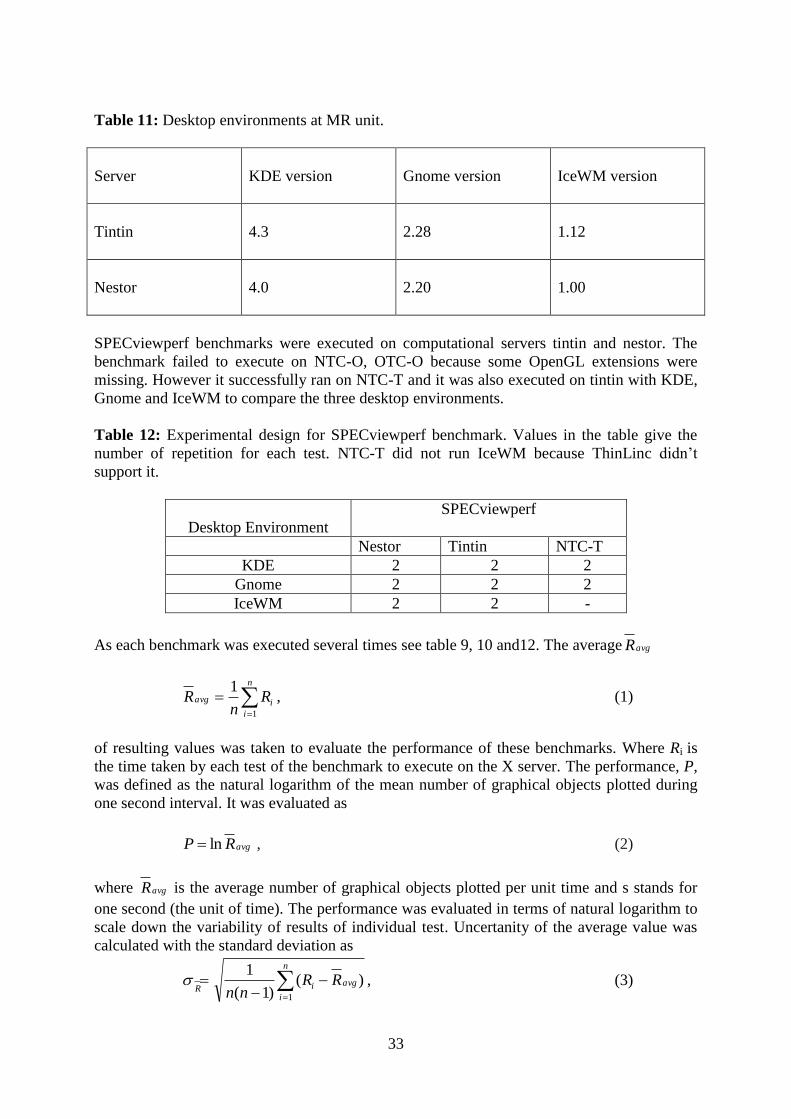
Table 11: Desktop environments at MR unit.
Server
KDE version
Gnome version
IceWM version
Tintin
4.3
2.28
1.12
Nestor
4.0
2.20
1.00
SPECviewperf benchmarks were executed on computational servers tintin and nestor. The
benchmark failed to execute on NTC-O, OTC-O because some OpenGL extensions were
missing. However it successfully ran on NTC-T and it was also executed on tintin with KDE,
Gnome and IceWM to compare the three desktop environments.
Table 12: Experimental design for SPECviewperf benchmark. Values in the table give the
number of repetition for each test. NTC-T did not run IceWM because ThinLinc didn’t
support it.
Desktop Environment
SPECviewperf
Nestor Tintin NTC-T
KDE 2 2 2
Gnome 2 2 2
IceWM 2 2 -
As each benchmark was executed several times see table 9, 10 and12. The average avgR
n
i
iavg Rn
R1
1, (1)
of resulting values was taken to evaluate the performance of these benchmarks. Where Ri is
the time taken by each test of the benchmark to execute on the X server. The performance, P,
was defined as the natural logarithm of the mean number of graphical objects plotted during
one second interval. It was evaluated as
avgRP ln , (2)
where avgR is the average number of graphical objects plotted per unit time and s stands for
one second (the unit of time). The performance was evaluated in terms of natural logarithm to
scale down the variability of results of individual test. Uncertanity of the average value was
calculated with the standard deviation as
n
i
avgiRRR
nn 1
)()1(
1 , (3)
34
Since each of the benchmarks executed tests multiple times the resulting uncertainties of
averages were low (0.01%). They are not reported here.
5.3 Results
The results of the graphic benchmarks Xbench, X11perf and SPECviewperf are discussed in
this section.
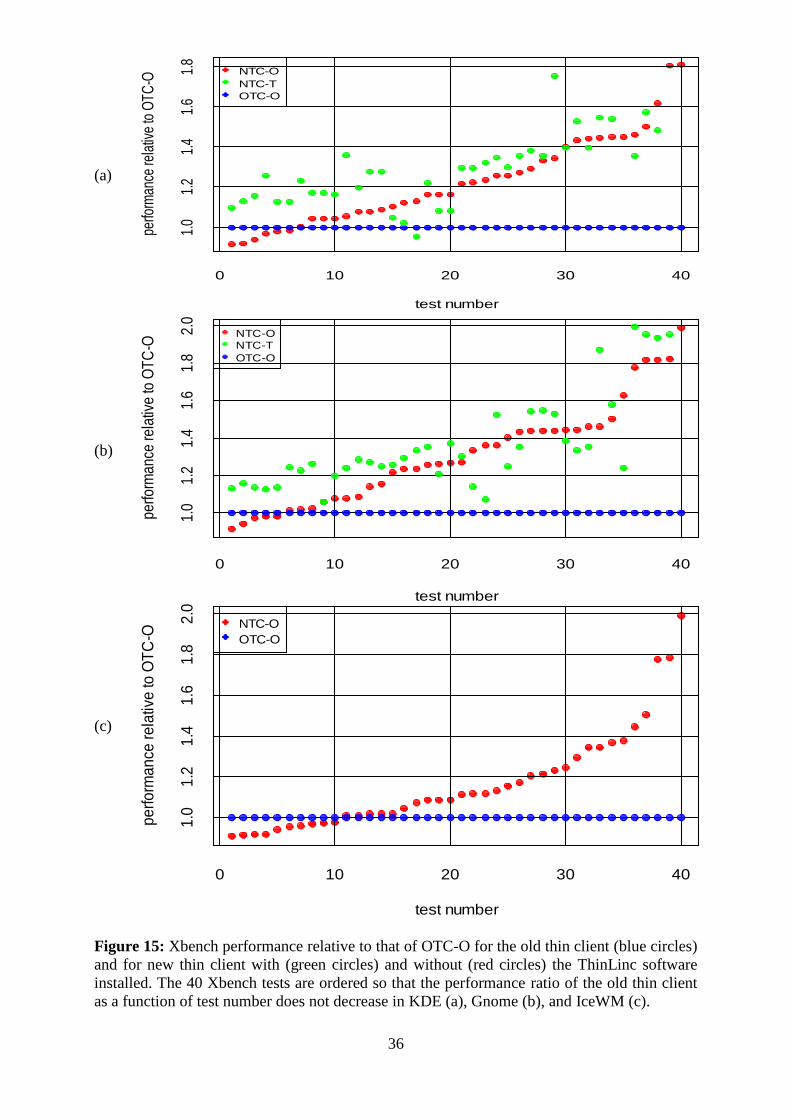
5.3.1 Xbench
The Xbench simulation executed from KDE environment revealed that the best performance
was achieved with NTC-T. NTC-O had slightly higher performance compared to OTC-O, see
Figure 14 (a). The average performance of NTC-O relative to the average performance of
OTC-O was 12 times higher. The average performance was taken as the average of individual
test performances. For NTC-T this ratio was 25. NTC-T was the fastest, followed by NTC-O
and OTC-O in this order, see Figure 15(a).
The NTC-T had highest performance, when Xbench simulations were executed from Gnome.
NTC-O had higher performance than OTC-O except for five tests 29, 30, 31, 35 and 38 out of
forty-one tests executed in the simulation, see Figure 14 (b). The ratio of the average
performances of NTC-T to OTC-O was 22. The same quantity for NTC-O and OTC-O was
10, see Figure 15 (b).
The OTC-O had slightly improved performance for IceWM as compared to KDE and Gnome.
NTC-O had better performance except for ten tests 8, 9, 20, 22, 25, 29, 30, 31, 34 and 38 out
of forty-one tests executed in the simulation, see Figure 14 (c). The ratio of average
performance of NTC-O to OTC-O was 8, see Figure 15 (c).
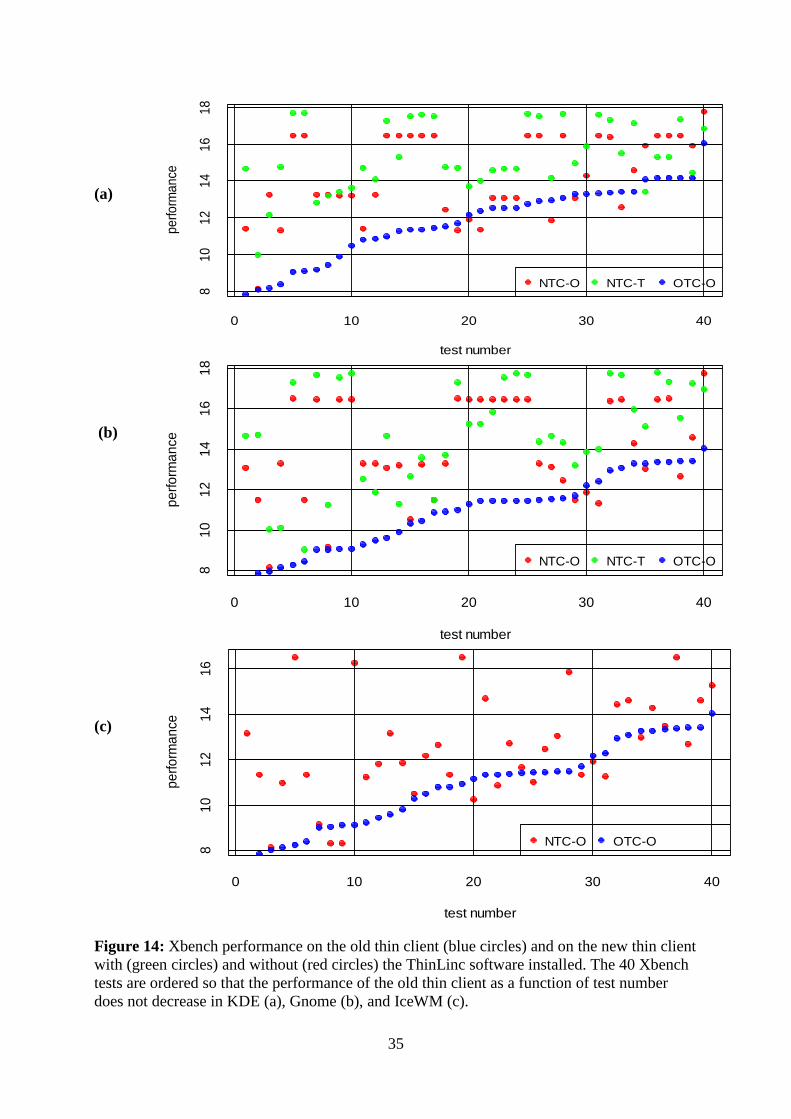
35
(a)
(b)
(c)
Figure 14: Xbench performance on the old thin client (blue circles) and on the new thin client
with (green circles) and without (red circles) the ThinLinc software installed. The 40 Xbench
tests are ordered so that the performance of the old thin client as a function of test number
does not decrease in KDE (a), Gnome (b), and IceWM (c).
0 10 20 30 40
81
01
21
41
61
8
test number
pe
rfo
rma
nce
NTC-O NTC-T OTC-O
0 10 20 30 40
81
01
21
41
61
8
test number
pe
rfo
rma
nce
NTC-O NTC-T OTC-O
0 10 20 30 40
81
01
21
41
6
test number
pe
rfo
rma
nce
NTC-O OTC-O
36
(a)
(b)
(c)
Figure 15: Xbench performance relative to that of OTC-O for the old thin client (blue circles)
and for new thin client with (green circles) and without (red circles) the ThinLinc software
installed. The 40 Xbench tests are ordered so that the performance ratio of the old thin client
as a function of test number does not decrease in KDE (a), Gnome (b), and IceWM (c).
0 10 20 30 40
1.0
1.2
1.4
1.6
1.8
test number
perfo
rman
ce re
lativ
e to
OTC
-O
NTC-O
NTC-T
OTC-O
0 10 20 30 40
1.0
1.2
1.4
1.6
1.8
2.0
test number
perfo
rman
ce re
lativ
e to
OT
C-O
NTC-ONTC-T
OTC-O
0 10 20 30 40
1.0
1.2
1.4
1.6
1.8
2.0
test number
pe
rfo
rma
nce
re
lativ
e to
OT
C-O
NTC-O
OTC-O
37
Effect of desktop environment
The Xbench benchmark executed with the NTC-O using KDE, Gnome and IceWM showed
that KDE had the highest performance compared to the Gnome and the IceWM. Gnome had
slightly lower performance than the KDE, however, the IceWM had lowest performance in
the entire three desktop environments, see figure 16 and table 13.
0 10 20 30 40
81
01
21
41
61
8
test number
pe
rfo
rma
nce
KDEGnome
IceWm
Figure 16: KDE, Gnome and IceWM performance graph on NTC-O
Table 13: Ratios of average performances for KDE, Gnome and IceWM desktop
environments.
Desktop environment
Performance ratio
B
A
P
P
A
B
KDE
Gnome
1.7
KDE
IceWM
10.3
Gnome
IceWM
5.7
38
Effect of Remote Display
The effect of the remote display for the Xbench test is plotted in figure 17. The average
performance of Xbench ran locally compared to Xbench ran remotely was 2.36 times higher.
The average performance was taken as the average of individual test performances. The
slowdown was due to the network latency and bandwidth of the 100Mbit/s twisted pair
Ethernet.
0 10 20 30 40
10
12
14
16
18
test number
pe
rfo
rma
nce
TintinNestor
Figure 17: Display performance as a function of Xbench test number. Xbench was started
locally on nestor and remotely on tintin.
39
5.3.2 X11perf
The X11perf benchmark ran from the KDE environment indicated that the highest
performance was achieved with the NTC-T. The NTC-O had slightly higher performance
compared to the OTC-O, see figure 18(a). The average performance of the NTC-O relative to
the average performance of OTC-O was 26 times higher. The average performance was taken
as the average of individual test performances. For NTC-T this ratio was 12. NTC-T was the
fastest, followed by NTC-O and OTC-O in this order, see figure 19(a).
The NTC-T had the highest performance, when X11perf benchmarks were executed from the
Gnome. NTC-O had higher performance than OTC-O except for some tests, see figure 18 (b).
The ratio of average performances of NTC-T to OTC-O was 20. The same quantity for NTC-
O and OTC-O was 9, see Figure 19(b).
Just like Xbench, the OTC-O had slightly improved performance for IceWM as compared to
the KDE and the Gnome. The NTC-O had better performance except for some tests, see
Figure 18 (c). The ratio of average performance of NTC-O to OTC-O was 11, see Figure 19
(c).
40
(a)
(b)
(c)
Figure 18: X11perf performance on the old thin client (blue circles) and on the new thin
client with (green circles) and without (red circles) the ThinLinc software installed. The 380
X11perf tests are ordered so that the performance of the old thin client as a function of test
number does not decrease in KDE (a), Gnome (b), and IceWM (c).
0 100 200 300
05
10
15
test number
pe
rfo
rma
nce
NTC-O
NTC-T
OTC-O
0 100 200 300
05
10
15
test number
pe
rfo
rma
nce
NTC-O
OTC-O
0 100 200 300
05
10
15
test number
pe
rfo
rma
nce
NTC-O
NTC-T
OTC-O
41
(a)
b)
(c)
Figure 19: X11perf performance relative to that of OTC-O for the old thin client (blue
circles) and for the new thin client with (green circles) and without (red circles) the ThinLinc
software installed. The 380 X11perf tests are ordered so that the performance of the old thin
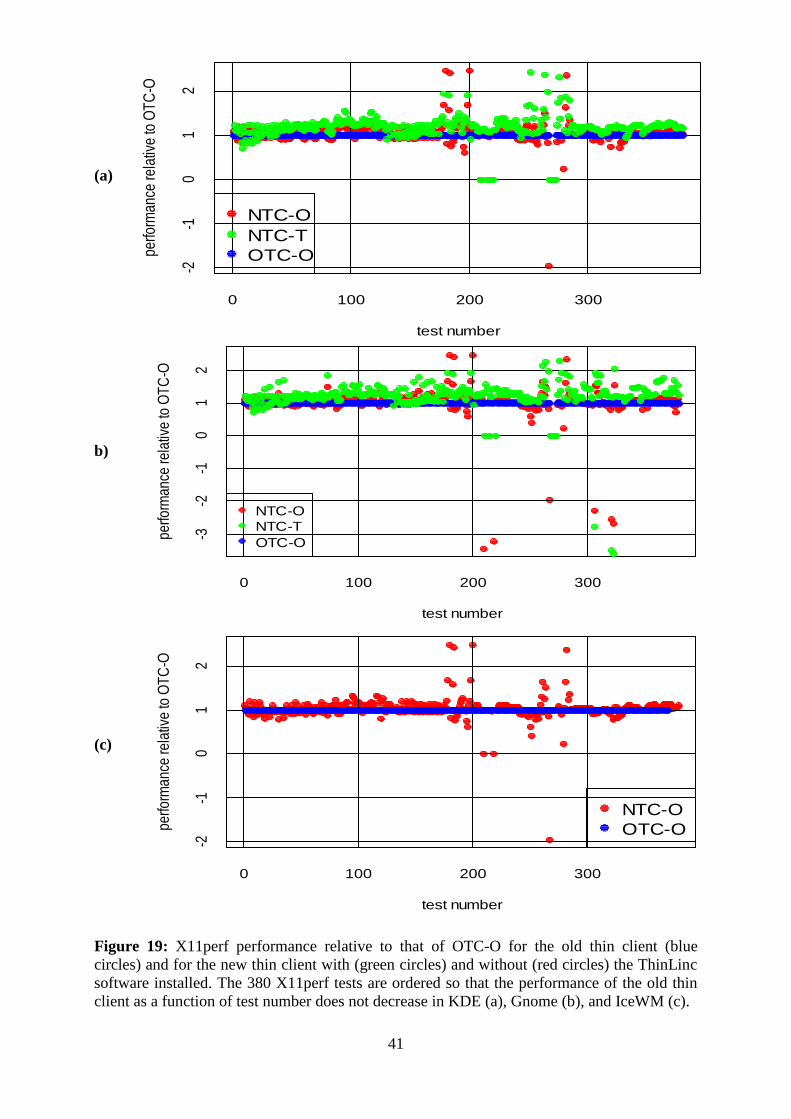
client as a function of test number does not decrease in KDE (a), Gnome (b), and IceWM (c).
0 100 200 300
-2-1
01
2
test number
perfo
rman
ce re
lativ
e to
OT
C-O
NTC-O
NTC-T
OTC-O
0 100 200 300
-3-2
-10
12
test number
perfo
rman
ce re
lativ
e to
OT
C-O
NTC-O
NTC-T
OTC-O
0 100 200 300
-2-1
01
2
test number
perfo
rman
ce re
lativ
e to
OT
C-O
NTC-O
OTC-O
42
5.3.3 SPECviewperf
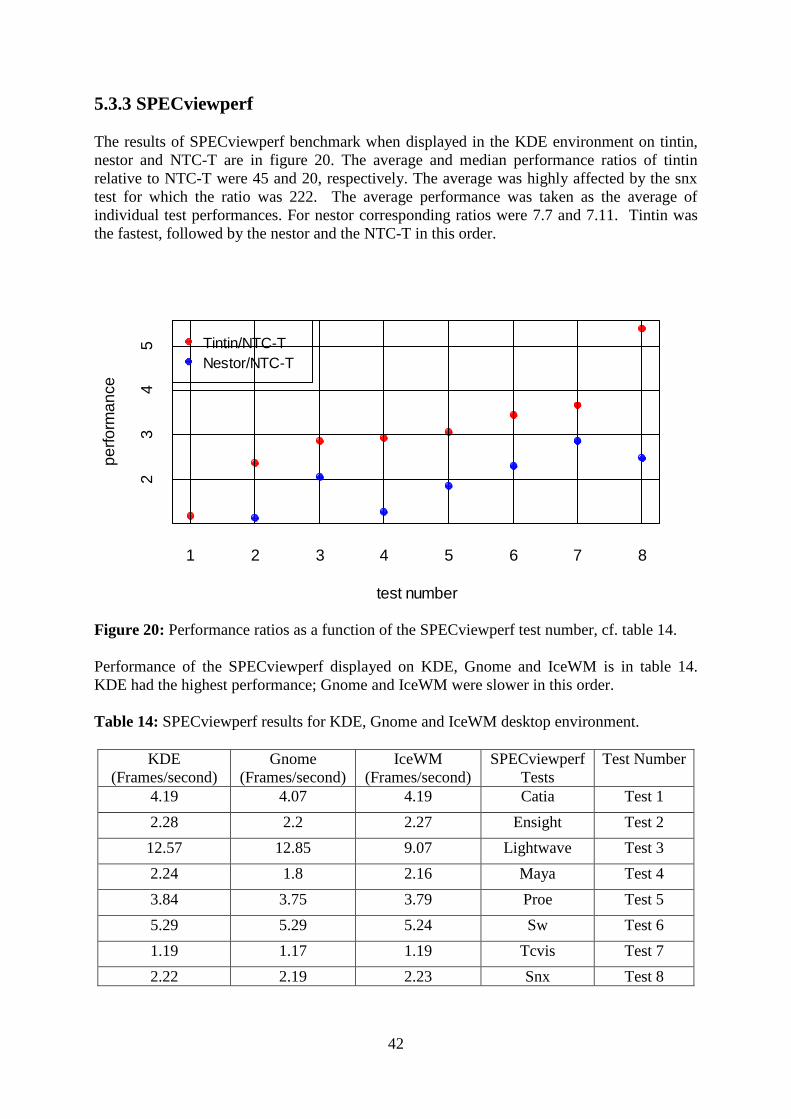
The results of SPECviewperf benchmark when displayed in the KDE environment on tintin,
nestor and NTC-T are in figure 20. The average and median performance ratios of tintin
relative to NTC-T were 45 and 20, respectively. The average was highly affected by the snx
test for which the ratio was 222. The average performance was taken as the average of
individual test performances. For nestor corresponding ratios were 7.7 and 7.11. Tintin was
the fastest, followed by the nestor and the NTC-T in this order.
1 2 3 4 5 6 7 8
23
45
test number
pe
rfo
rma
nce
Tintin/NTC-T
Nestor/NTC-T
Figure 20: Performance ratios as a function of the SPECviewperf test number, cf. table 14.
Performance of the SPECviewperf displayed on KDE, Gnome and IceWM is in table 14.
KDE had the highest performance; Gnome and IceWM were slower in this order.
Table 14: SPECviewperf results for KDE, Gnome and IceWM desktop environment.
KDE
(Frames/second)
Gnome
(Frames/second)
IceWM
(Frames/second)
SPECviewperf
Tests
Test Number
4.19 4.07 4.19 Catia Test 1
2.28 2.2 2.27 Ensight Test 2
12.57 12.85 9.07 Lightwave Test 3
2.24 1.8 2.16 Maya Test 4
3.84 3.75 3.79 Proe Test 5
5.29 5.29 5.24 Sw Test 6
1.19 1.17 1.19 Tcvis Test 7
2.22 2.19 2.23 Snx Test 8
43
5.4 Discussion
The remote display slowed down the performance by a factor of approximately 2.36. For
office applications (word processors, spread sheets, etc) this is typically not an issue. If
however the graphics performance is critical then the usage of remote displays should be
considered carefully.
Some OpenGL applications in the SPECviewperf benchmark suits did not execute on thin
clients with the original software. The Thinlinc software can be used as a workaround in this
case. The performance is however limited. For some applications a performance increase in
the order of several magnitudes may be achieved by using specialized graphics accelerators;
these are, however, not available for thin clients. For thin clients, solutions like the VirtualGL
can be used. In this work, no experiments with VirtualGL were performed.
From the three desktop environment considered, KDE was fastest followed by Gnome and
IceWM in this order. A personal experience shows that IceWM is fastest for almost all the
applications including word processing, Matlab calculation etc. This contradiction is most
likely caused by the fact that the Xbench , X11perf and SPECviewperf benchmarks test only a
subset of graphics operations while user applications like web browsers often use alpha
blending or other operations that degrade the performance of thin clients.
The ThinLinc on new thin client had improved the performance for most of the applications,
however, the performance of NTC-O for some applications were higher than NTC-T for
example reorganizing windows on NTC-O is faster than NTC-T.
5.5 Conclusion
The experiments compared the graphics performance of selected Linux SBC solutions. The
effects of factors like KDE, Gnome, IceWM desktop environments, visualization devices like
NTC-O, NTC-T, OTC-O, and computational servers (tintin, nestor and milou) were
evaluated. The result showed that the performance of the deployed software solution NTC-T
had higher performance than OTC-O. After NTC-T, the performance of deployed hardware
solution NTC-T had higher performance compared to OTC-O. Hence, the new hardware and
software have increased computer performance at the MR unit.

44
45
6
User-perceived performance
analysis
6.1 Introduction
Performance of the Linux based SBC at the MR-unit was assessed via methods of both
qualitative and quantitative research. Structured interview, a qualitative research method, was
adopted in which the number of questions in the specific order was presented to a focus
group; the answers were collected to yield an estimate of the user experience. The format used
for the questions type was open-ended in order to get a broad answer range from the users.
6.2 Methods
The questions were posed in two stages; before and after the upgrade of computer
infrastructure at the MR unit. The set of questions differed, in the first stage; the questions
presented were structured to learn more about the need for an upgrade. Six users used the
computing environment at the MR-unit on a regular basis. Of those, three users used thin
clients to connect to nestor in the period from 2008 to 2010. These three users were asked a
set of pre-selected questions, see table 15.
The second set of questions was asked to reveal, whether the upgrade process had resolved
the significant problems witnessed before by the end users. Again, three users which directly
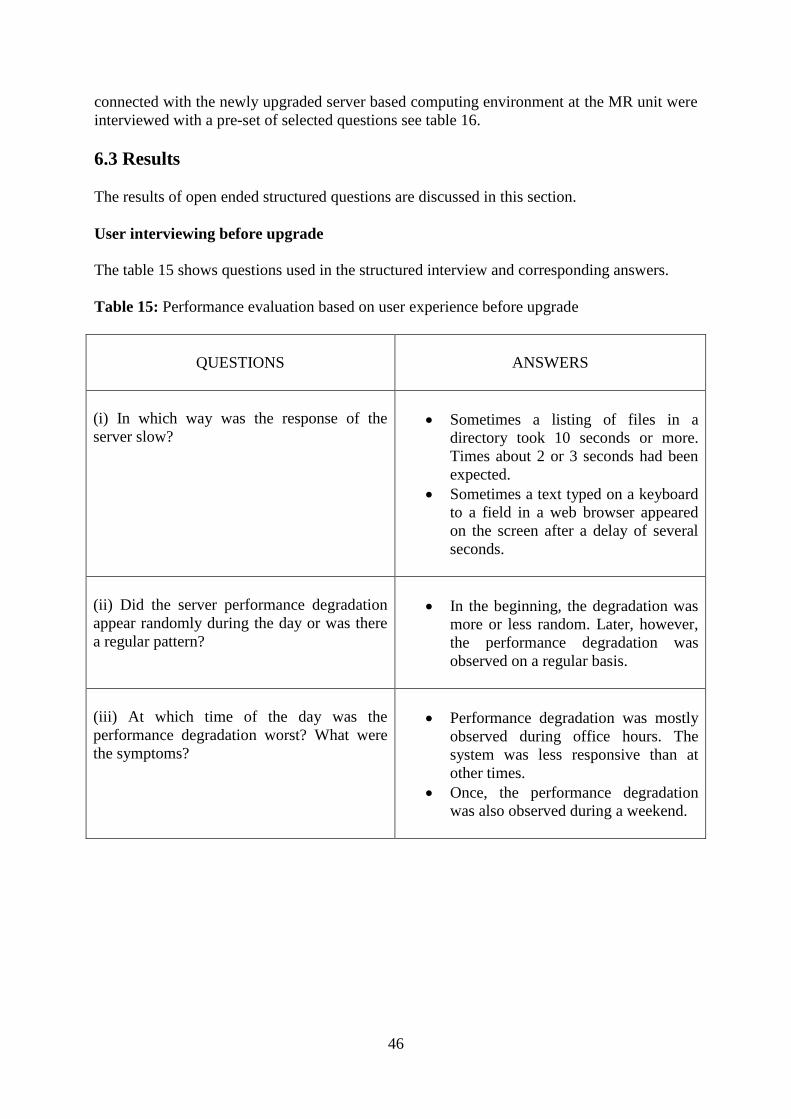
46
connected with the newly upgraded server based computing environment at the MR unit were
interviewed with a pre-set of selected questions see table 16.
6.3 Results
The results of open ended structured questions are discussed in this section.
User interviewing before upgrade
The table 15 shows questions used in the structured interview and corresponding answers.
Table 15: Performance evaluation based on user experience before upgrade
QUESTIONS
ANSWERS
(i) In which way was the response of the
server slow?
Sometimes a listing of files in a
directory took 10 seconds or more.
Times about 2 or 3 seconds had been
expected.
Sometimes a text typed on a keyboard
to a field in a web browser appeared
on the screen after a delay of several
seconds.
(ii) Did the server performance degradation
appear randomly during the day or was there
a regular pattern?
In the beginning, the degradation was
more or less random. Later, however,
the performance degradation was
observed on a regular basis.
(iii) At which time of the day was the
performance degradation worst? What were
the symptoms?
Performance degradation was mostly
observed during office hours. The
system was less responsive than at
other times.
Once, the performance degradation
was also observed during a weekend.
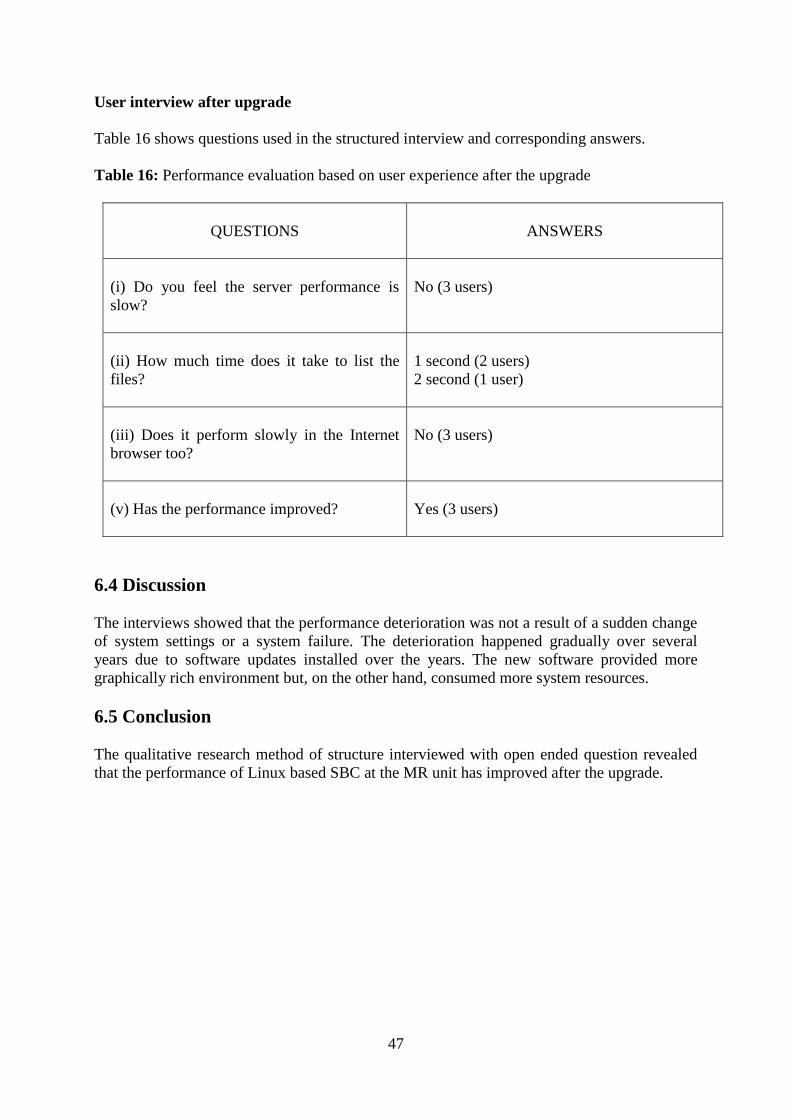
47
User interview after upgrade
Table 16 shows questions used in the structured interview and corresponding answers.
Table 16: Performance evaluation based on user experience after the upgrade
QUESTIONS
ANSWERS
(i) Do you feel the server performance is
slow?
No (3 users)
(ii) How much time does it take to list the
files?
1 second (2 users)
2 second (1 user)
(iii) Does it perform slowly in the Internet
browser too?
No (3 users)
(v) Has the performance improved?
Yes (3 users)
6.4 Discussion
The interviews showed that the performance deterioration was not a result of a sudden change
of system settings or a system failure. The deterioration happened gradually over several
years due to software updates installed over the years. The new software provided more
graphically rich environment but, on the other hand, consumed more system resources.
6.5 Conclusion
The qualitative research method of structure interviewed with open ended question revealed
that the performance of Linux based SBC at the MR unit has improved after the upgrade.

48
49
7
Conclusion
7.1 Conclusion
The first objective of the thesis work was to evaluate the performance of the existing
computing infrastructure at the MR unit. The performance of the system was measured via
benchmarks and user interviews. The first bottleneck identified was the CPU speed.
Applications installed at MR unit were also graphics-intensive. The second bottleneck, with
respect to the graphics intensive applications, includes the network latency of the X11
protocol and the subsequent performance of the old thin clients. An upgrade of both the
computational server and the thin clients were suggested.
The second objective of the thesis work was to upgrade the IT infrastructure at the MR unit.
Upgrade involved the selection and setup of the new server and the thin clients. The analysis
of the new system performance showed that the objective to increase the performance of the
IT infrastructure has been reached.
The evaluation after the upgrade involved performance analysis via quantitative and
qualitative methods. For the former benchmarks were used while for the latter structured
interviews with open-ended questions were performed. The results showed that the new
configuration had improved the performance.
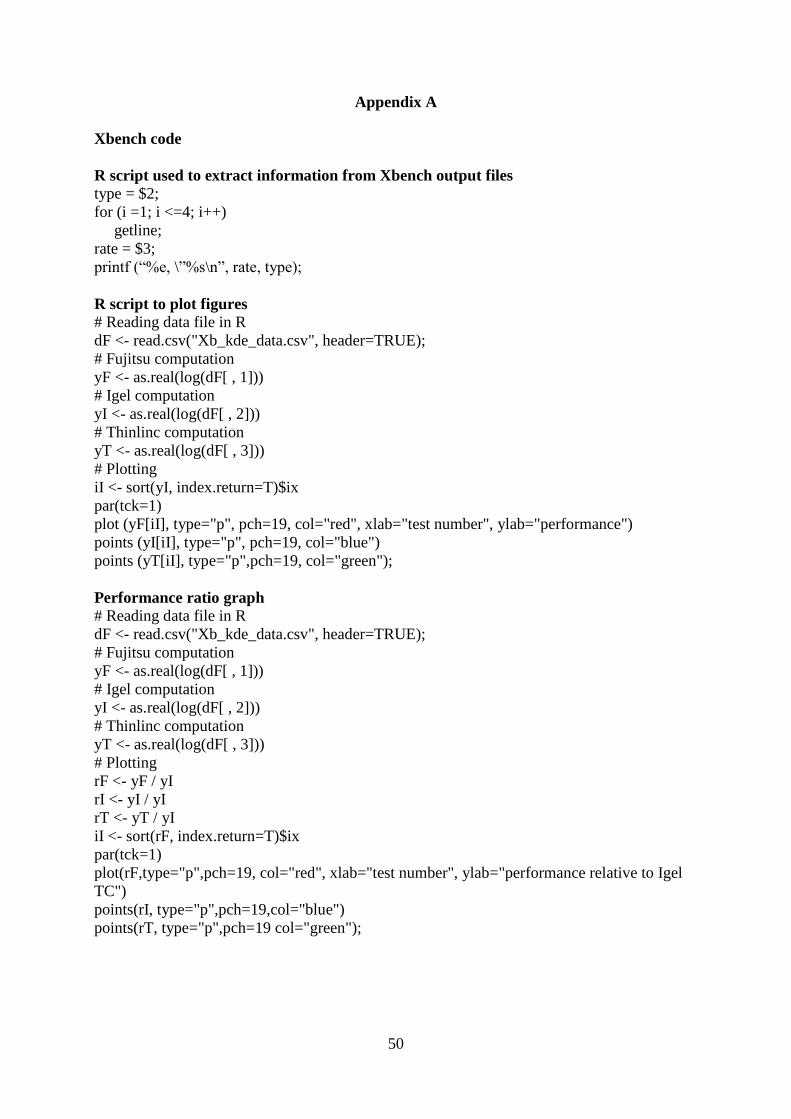
50
Appendix A
Xbench code
R script used to extract information from Xbench output files
type = $2;
for (i =1; i <=4; i++)
getline;
rate = $3;
printf (“%e, \”%s\n”, rate, type);
R script to plot figures
# Reading data file in R
dF <- read.csv("Xb_kde_data.csv", header=TRUE);
# Fujitsu computation
yF <- as.real(log(dF[ , 1]))
# Igel computation
yI <- as.real(log(dF[ , 2]))
# Thinlinc computation
yT <- as.real(log(dF[ , 3]))
# Plotting
iI <- sort(yI, index.return=T)$ix
par(tck=1)
plot (yF[iI], type="p", pch=19, col="red", xlab="test number", ylab="performance")
points (yI[iI], type="p", pch=19, col="blue")
points (yT[iI], type="p",pch=19, col="green");
Performance ratio graph
# Reading data file in R
dF <- read.csv("Xb_kde_data.csv", header=TRUE);
# Fujitsu computation
yF <- as.real(log(dF[ , 1]))
# Igel computation
yI <- as.real(log(dF[ , 2]))
# Thinlinc computation
yT <- as.real(log(dF[ , 3]))
# Plotting
rF <- yF / yI
rI <- yI / yI
rT <- yT / yI
iI <- sort(rF, index.return=T)$ix
par(tck=1)
plot(rF,type="p",pch=19, col="red", xlab="test number", ylab="performance relative to Igel
TC")
points(rI, type="p",pch=19,col="blue")
points(rT, type="p",pch=19 col="green");
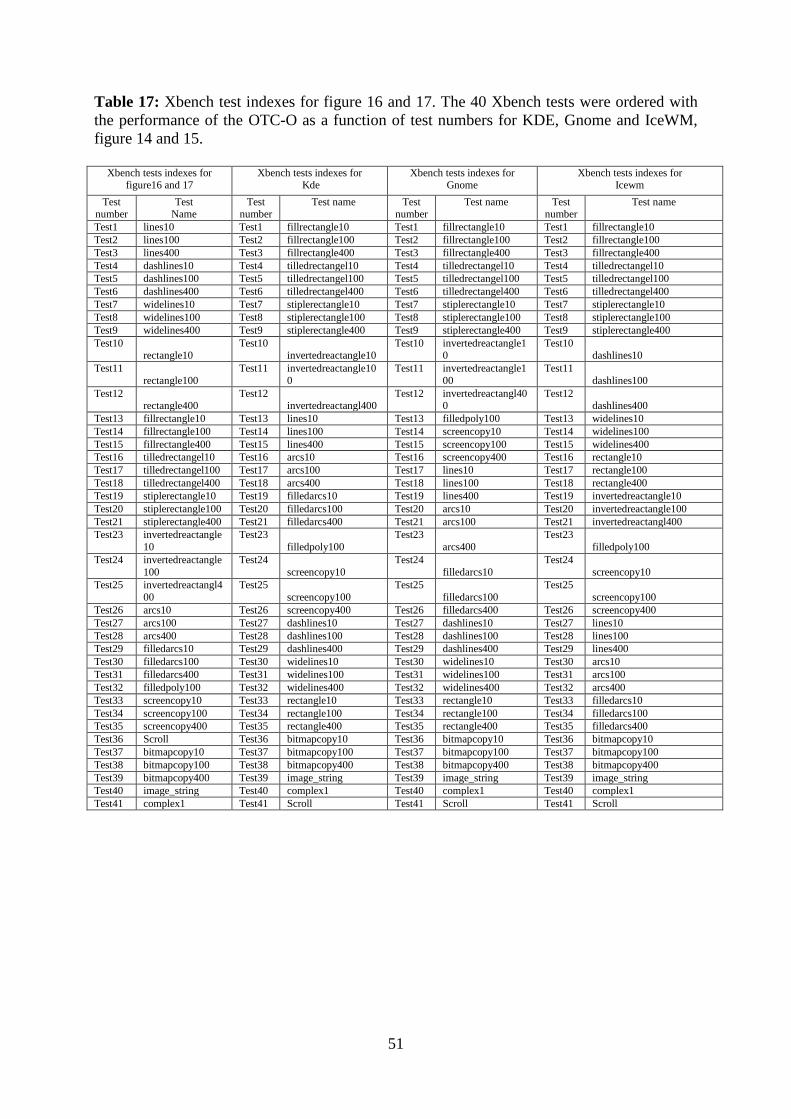
51
Table 17: Xbench test indexes for figure 16 and 17. The 40 Xbench tests were ordered with
the performance of the OTC-O as a function of test numbers for KDE, Gnome and IceWM,
figure 14 and 15.
Xbench tests indexes for
figure16 and 17 Xbench tests indexes for
Kde Xbench tests indexes for
Gnome Xbench tests indexes for
Icewm
Test number
Test Name
Test number
Test name Test number
Test name Test number
Test name
Test1 lines10 Test1 fillrectangle10 Test1 fillrectangle10 Test1 fillrectangle10
Test2 lines100 Test2 fillrectangle100 Test2 fillrectangle100 Test2 fillrectangle100
Test3 lines400 Test3 fillrectangle400 Test3 fillrectangle400 Test3 fillrectangle400
Test4 dashlines10 Test4 tilledrectangel10 Test4 tilledrectangel10 Test4 tilledrectangel10
Test5 dashlines100 Test5 tilledrectangel100 Test5 tilledrectangel100 Test5 tilledrectangel100
Test6 dashlines400 Test6 tilledrectangel400 Test6 tilledrectangel400 Test6 tilledrectangel400
Test7 widelines10 Test7 stiplerectangle10 Test7 stiplerectangle10 Test7 stiplerectangle10
Test8 widelines100 Test8 stiplerectangle100 Test8 stiplerectangle100 Test8 stiplerectangle100
Test9 widelines400 Test9 stiplerectangle400 Test9 stiplerectangle400 Test9 stiplerectangle400
Test10 rectangle10
Test10 invertedreactangle10
Test10 invertedreactangle10
Test10 dashlines10
Test11
rectangle100
Test11 invertedreactangle10
0
Test11 invertedreactangle1
00
Test11
dashlines100
Test12 rectangle400
Test12 invertedreactangl400
Test12 invertedreactangl400
Test12 dashlines400
Test13 fillrectangle10 Test13 lines10 Test13 filledpoly100 Test13 widelines10
Test14 fillrectangle100 Test14 lines100 Test14 screencopy10 Test14 widelines100
Test15 fillrectangle400 Test15 lines400 Test15 screencopy100 Test15 widelines400
Test16 tilledrectangel10 Test16 arcs10 Test16 screencopy400 Test16 rectangle10
Test17 tilledrectangel100 Test17 arcs100 Test17 lines10 Test17 rectangle100
Test18 tilledrectangel400 Test18 arcs400 Test18 lines100 Test18 rectangle400
Test19 stiplerectangle10 Test19 filledarcs10 Test19 lines400 Test19 invertedreactangle10
Test20 stiplerectangle100 Test20 filledarcs100 Test20 arcs10 Test20 invertedreactangle100
Test21 stiplerectangle400 Test21 filledarcs400 Test21 arcs100 Test21 invertedreactangl400
Test23 invertedreactangle
10
Test23
filledpoly100
Test23
arcs400
Test23
filledpoly100
Test24 invertedreactangle
100
Test24
screencopy10
Test24
filledarcs10
Test24
screencopy10
Test25 invertedreactangl4
00
Test25
screencopy100
Test25
filledarcs100
Test25
screencopy100
Test26 arcs10 Test26 screencopy400 Test26 filledarcs400 Test26 screencopy400
Test27 arcs100 Test27 dashlines10 Test27 dashlines10 Test27 lines10
Test28 arcs400 Test28 dashlines100 Test28 dashlines100 Test28 lines100
Test29 filledarcs10 Test29 dashlines400 Test29 dashlines400 Test29 lines400
Test30 filledarcs100 Test30 widelines10 Test30 widelines10 Test30 arcs10
Test31 filledarcs400 Test31 widelines100 Test31 widelines100 Test31 arcs100
Test32 filledpoly100 Test32 widelines400 Test32 widelines400 Test32 arcs400
Test33 screencopy10 Test33 rectangle10 Test33 rectangle10 Test33 filledarcs10
Test34 screencopy100 Test34 rectangle100 Test34 rectangle100 Test34 filledarcs100
Test35 screencopy400 Test35 rectangle400 Test35 rectangle400 Test35 filledarcs400
Test36 Scroll Test36 bitmapcopy10 Test36 bitmapcopy10 Test36 bitmapcopy10
Test37 bitmapcopy10 Test37 bitmapcopy100 Test37 bitmapcopy100 Test37 bitmapcopy100
Test38 bitmapcopy100 Test38 bitmapcopy400 Test38 bitmapcopy400 Test38 bitmapcopy400
Test39 bitmapcopy400 Test39 image_string Test39 image_string Test39 image_string
Test40 image_string Test40 complex1 Test40 complex1 Test40 complex1
Test41 complex1 Test41 Scroll Test41 Scroll Test41 Scroll
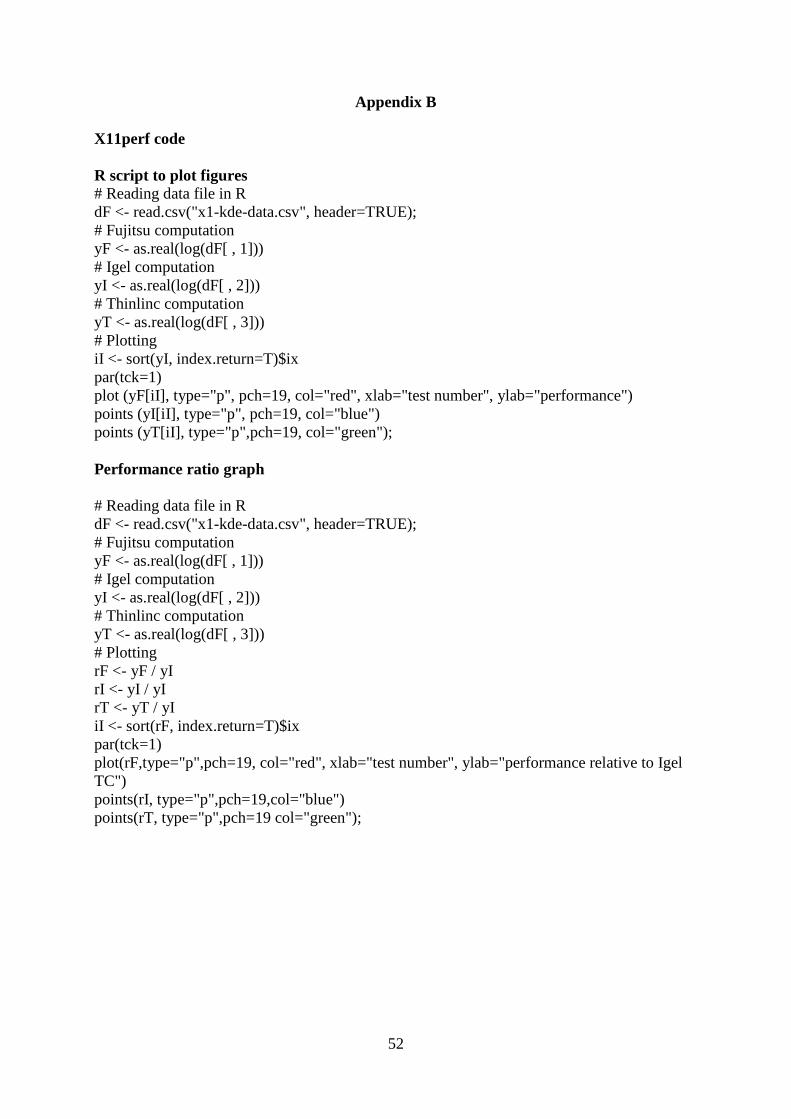
52
Appendix B
X11perf code
R script to plot figures
# Reading data file in R
dF <- read.csv("x1-kde-data.csv", header=TRUE);
# Fujitsu computation
yF <- as.real(log(dF[ , 1]))
# Igel computation
yI <- as.real(log(dF[ , 2]))
# Thinlinc computation
yT <- as.real(log(dF[ , 3]))
# Plotting
iI <- sort(yI, index.return=T)$ix
par(tck=1)
plot (yF[iI], type="p", pch=19, col="red", xlab="test number", ylab="performance")
points (yI[iI], type="p", pch=19, col="blue")
points (yT[iI], type="p",pch=19, col="green");
Performance ratio graph
# Reading data file in R
dF <- read.csv("x1-kde-data.csv", header=TRUE);
# Fujitsu computation
yF <- as.real(log(dF[ , 1]))
# Igel computation
yI <- as.real(log(dF[ , 2]))
# Thinlinc computation
yT <- as.real(log(dF[ , 3]))
# Plotting
rF <- yF / yI
rI <- yI / yI
rT <- yT / yI
iI <- sort(rF, index.return=T)$ix
par(tck=1)
plot(rF,type="p",pch=19, col="red", xlab="test number", ylab="performance relative to Igel
TC")
points(rI, type="p",pch=19,col="blue")
points(rT, type="p",pch=19 col="green");
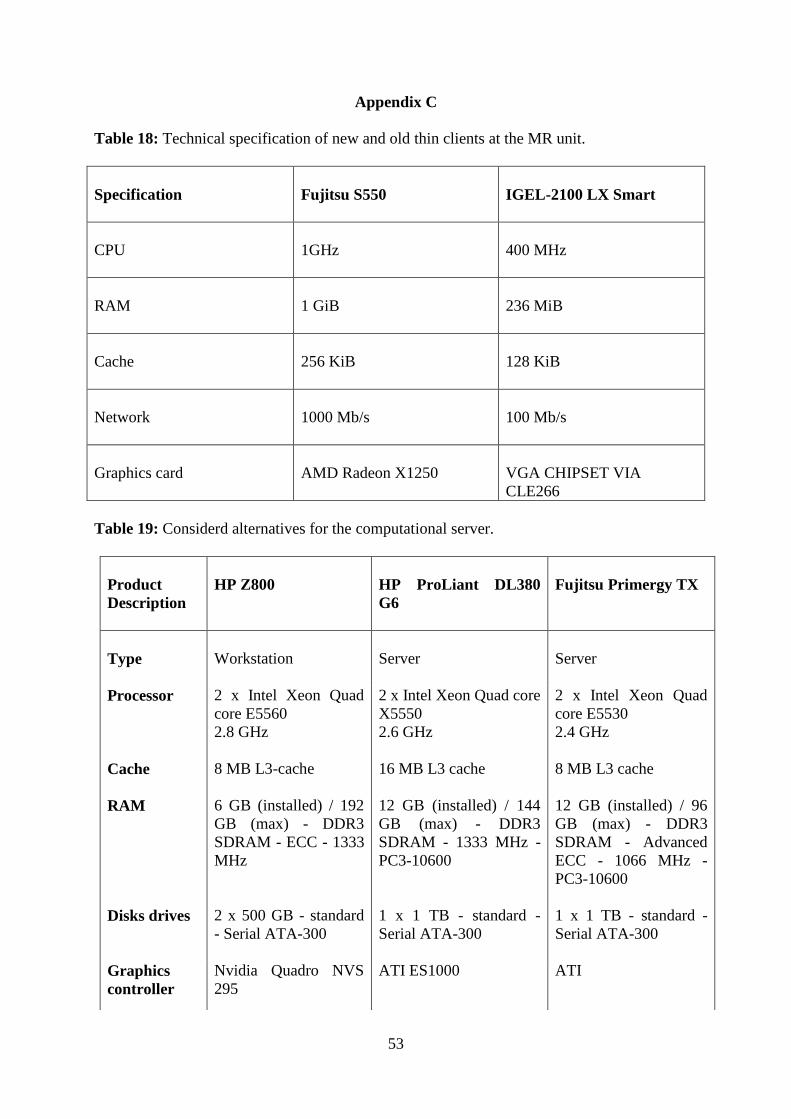
53
Appendix C
Table 18: Technical specification of new and old thin clients at the MR unit.
Specification
Fujitsu S550
IGEL-2100 LX Smart
CPU
1GHz
400 MHz
RAM
1 GiB
236 MiB
Cache
256 KiB
128 KiB
Network
1000 Mb/s
100 Mb/s
Graphics card
AMD Radeon X1250
VGA CHIPSET VIA
CLE266
Table 19: Considerd alternatives for the computational server.
Product
Description
HP Z800
HP ProLiant DL380
G6
Fujitsu Primergy TX
Type
Workstation
Server
Server
Processor
2 x Intel Xeon Quad
core E5560
2.8 GHz
2 x Intel Xeon Quad core
X5550
2.6 GHz
2 x Intel Xeon Quad
core E5530
2.4 GHz
Cache
8 MB L3-cache
16 MB L3 cache
8 MB L3 cache
RAM 6 GB (installed) / 192
GB (max) - DDR3
SDRAM - ECC - 1333
MHz
12 GB (installed) / 144
GB (max) - DDR3
SDRAM - 1333 MHz -
PC3-10600
12 GB (installed) / 96
GB (max) - DDR3
SDRAM - Advanced
ECC - 1066 MHz -
PC3-10600
Disks drives 2 x 500 GB - standard
- Serial ATA-300
1 x 1 TB - standard -
Serial ATA-300
1 x 1 TB - standard -
Serial ATA-300
Graphics
controller
Nvidia Quadro NVS
295
ATI ES1000
ATI
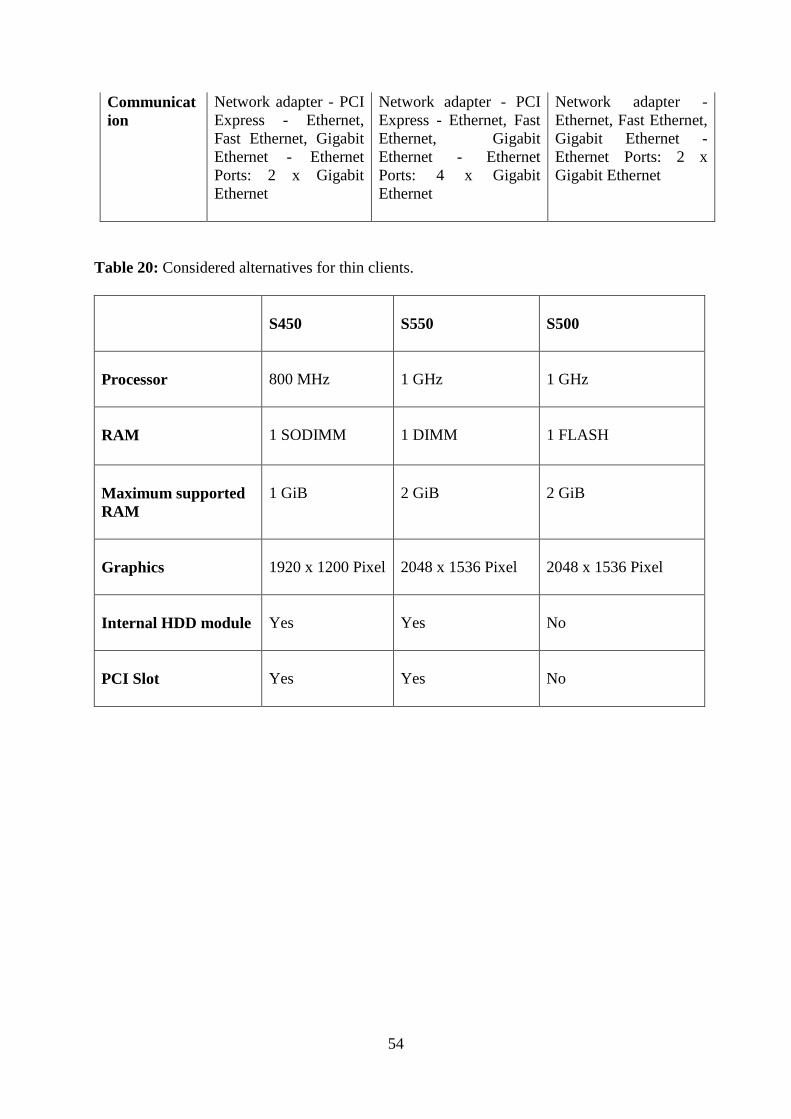
54
Communicat
ion
Network adapter - PCI
Express - Ethernet,
Fast Ethernet, Gigabit
Ethernet - Ethernet
Ports: 2 x Gigabit
Ethernet
Network adapter - PCI
Express - Ethernet, Fast
Ethernet, Gigabit
Ethernet - Ethernet
Ports: 4 x Gigabit
Ethernet
Network adapter -
Ethernet, Fast Ethernet,
Gigabit Ethernet -
Ethernet Ports: 2 x
Gigabit Ethernet
Table 20: Considered alternatives for thin clients.
S450
S550
S500
Processor
800 MHz
1 GHz
1 GHz
RAM
1 SODIMM
1 DIMM
1 FLASH
Maximum supported
RAM
1 GiB
2 GiB
2 GiB
Graphics
1920 x 1200 Pixel
2048 x 1536 Pixel
2048 x 1536 Pixel
Internal HDD module
Yes
Yes
No
PCI Slot
Yes
Yes
No
55
BIBLIOGRAPHY
[1] H.L. Yu, W.M. Zhen, and M.M Shen, “Extending the power of Server Based Computing”,
Computational science –ICCS 2004: 4th
international conference, Krakow.
[2] Server Based Computing. [Online], Available
http://www.2x.com/whitepapers/WPserverbasedcomputing.pdf, [Accessed: March 4, 2010]
[3] N.Tolia, D.G. Andersen, and M. Satyanarayanan, “Quantifying interactive user experience
on thin clients”, Computer , vol. 39, no 3, pp.46-52, March 2006, doi:10.1109/MC.2006.101
[4] B. C. Cumberland, G. Carius, A. Muir, Microsoft Windows NT Server 4.0, Terminal
Server Edition: Technical Reference, Microsoft Press, Redmond, WA, Aug. 1999
[5] J.Nieh, S.J. Yang, “Measuring the multimedia performance of Server based computing”,
10th
International workshop Network and operating system support for Digital audio and
video
[6] M. Montoro, “Remote Desktop protocol”. [Online], Available
http://www.oxid.it/downloads/rdp-gbu.pdf. [Accessed: March 20, 2010]
[7] “Citrix MetaFrame 1.8 Backgrounder”, Citrix WhitePaper, Citrix Systems, June 1998
[8] T. W. Mathers, S. P. Genoway, Windows NT Thin Client Solutions: Implementing
Terminal Server and Citrix MetaFrame, Macmillan Technical Publishing, Indianapolis, IN,
Nov. 1998
[9] NX. [Online], Available
http://www.nomachine.com/documents.php[Accessed: March 22, 2010]
[10] R.W. Scheifler and J. Gettys, “The X Window System”, MIT Laboratory of Computer
Science.
[11] J.Gettys and R.W. Scheifler, ”Xlib”. [Online], Available
http://www.x.org/docs/X11/xlib.pdf [Accessed: March 25, 2010]
[12] J. Gettys,“Open source desktop technology road map”, Vol 2, October 23, 2008.
[13] J. Sharp, and B. Massey, “An Xlib compatibility layer for XCB”, Computer, vol. 49, no
1, April 11 2002.
[14] A.Jackson, “X development, documentation and performance”. [Online], Available
http://www.x.org/wiki/Development/Documentation/Performance [Accessed: April 1, 2010]
[15] Thinlinc. [Online], Available
http://www.cendio.com/resources [Accessed: April 4, 2010]
56
[16] K. Lee, “X Window System Application Performance Tuning”. [Online], Available
http://www.rahul.net/kenton/perf.html [Accessed: April 5, 2010]
[17] S. Godard, “IOSTAT Linux man page”. [Online], Available
http://linux.die.net/man/1/iostat [Accessed: April 7, 2010]
[18] H. Ware and F. Fradarick, ”VMSTAT Linux man page”. [Online], Available
http://linux.die.net/man/8/vmstat [Accessed: April 7, 2010]
[19] S. Godard, “SAR ” Linux man page. [Online], Available
http://sebastien.godard.pagesperso-orange.fr/man_sar.html [Accessed: April 8, 2010]
[20] D. Doubrava, “I SAG Linux man page”. [Online], Available
http://man-wiki.net/index.php/1:isag [Accessed: April 8, 2010]
[21]J. Mccormack, P. Karlton, S. Angebranndt, C. kent, K.Packard and G. Gill, “X11perf
Linux man page”. [Online], Available
http://cf.ccmr.cornell.edu/cgi-bin/w3mman2html.cgi?x11perf%281%29 [Accessed: April 10,
2010]
[22] C. Gittinger, ”Xbench Linux man page”. [Online], Available
http://www.math.utah.edu/cgi-bin/man2html.cgi?/usr/local/man/man1/xbench.1 [Accessed:
April 10, 2010]
[23] SPECviewperf [Online]. Available
http://www.spec.org/gwpg/gpc.static/vp10info.html [Accessed: April 12, 2010]
[24] Z.M. Jiang, A.E Hassan, G. Hamann, and P.Flora, ” Automated performance analysis of
load”, Software Maintenance, 2009. ICM 2009 IEEE international conference
[26] TLCOS [Online]. Available
http://www.cendio.com/resources/docs/tag/TLCOS.html [Accessed: May 5, 2010]
[27] RDP [Online]. Available
http://msdn.microsoft.com/en-us/library/aa383015%28VS.85%29.aspx [Accessed: May 10,
2010]
Related Documents