A STUDY ON CLIENT PERCEPTION ABOUT THE VALUE ADDED SERVICES PROVIED BY ANGEL BROKING SERVICES IN ERODE Project report submitted in partial fulfillment of the requirement of Anna University of Technology, Coimbatore for the award of the degree of MASTER OF BUSINESS ADMINISTRATION Submitted by RAJA.G Register No: 098001602031 Under the guidance Mrs. V.KARTHI, M.B.A, Lecturer

Full Project in Angel Broking Services
Oct 29, 2015
m
Welcome message from author
This document is posted to help you gain knowledge. Please leave a comment to let me know what you think about it! Share it to your friends and learn new things together.
Transcript
A STUDY ON CLIENT PERCEPTION ABOUT THE VALUE
ADDED SERVICES PROVIED BY ANGEL BROKING
SERVICES IN ERODE
Project report submitted in partial fulfillment of the requirement of Anna University of
Technology, Coimbatore for the award of the degree of
MASTER OF BUSINESS ADMINISTRATION
Submitted by
RAJA.G
Register No: 098001602031
Under the guidance
Mrs. V.KARTHI, M.B.A,
Lecturer
DEPARTMENT OF MANAGEMENT STUDIES
CMS COLLEGE OF ENGINEERING
NAMAKKAL - 637003
MAY 2011

C.M.S COLLEGE OF ENGINEERING
Namakkal-637003
Department of Management Studies
CERTIFICATE
This is to certify that the main project entitled “ANGEL BROKING SERVICES IN
ERODE” is a record of the work done by RAJA.G, (Register No.098001602031) Submitted in
partial fulfillment of the requirement for the award of degree of Master of Business
Administration of Anna University of Technology during the academic year 2011.
………………… ……………………………
Project Guide Head of the Department
Submitted for the Project Viva-Voce examination held on……………………
Internal Examiner External Examiner

DECLARATION
I hereby declare that the project entitled “ANGEL BROKING SERVICES IN ERODE” is my
original work and that no part of this report has been submitted for the award of any other
Degree, Diploma, Fellowship or any other similar titles or prizes and that the work has not been
published in any scientific or popular journal or magazine.
Place: Signature of the student
Date: (RAJA.G)

ACKNOWLEDGEMENT
With great pleasure, I am presenting this project entitled “ANGEL BROKING SERVICES IN
ERODE” A project of this dimension would not have been possible without the sincere help
and earnest support provided to me from all sources that was approached.
It is my privilege and great pleasure to express my sincere and heart full thanks to
Mr.C.MUTHUSAMY, Founder and Chairman of CMS College of Engineering, Namakkal,
for giving opportunity to study in this prestigious institutions.
I am indebted to Dr.NELSON KENNDY BABU, Principal, CMS College of
Engineering, and Namakkal for providing me an opportunity to undertake the project
I extend my thanks to Head of the Department Mr.K.G.SENTHILKUMAR, M.B.A.,
M.Phil, and (Ph.D). CMS College of Engineering, Namakkal, for his constant encouragement
and valuable guidance throughout the study
I take this opportunity to express my gratitude to Lecturer Mr. V.KARHTHI, M.B.A,
and Lecturer of CMS College of Engineering, Namakkal, who offered constant support and
valuable guidance and remained as backbone for successful completion of my work.
I express my thanks and gratitude to the members ANGEL BROKING SERVICES IN
ERODE those who helped me to fulfill my project work.
Finally I express my sincere thanks towards my parents, friends and others for his
encouragement and support.
RAJA.G

CONTENTS
Description Page No.
Bonafide certificate
Declaration
Acknowledgement
Contents
List of Tables
List of Charts
Abstract
1. Chapter 1.1 Introduction to the study
1.2 About the Industry1.3 About the company1.4 statement of the problem1.5 Objectives of the study1.6 Scope of the study1.7 Limitations of the study1.8 Research Methodology1.9 Analytical tools used
2. Chapter 2.1Review of Literature
3. Chapter Analysis & Interpretation
4. Findings, suggestions and Conclusion4.1 Findings4.2 Suggestions4.3 Conclusion
Bibliography
Appendix
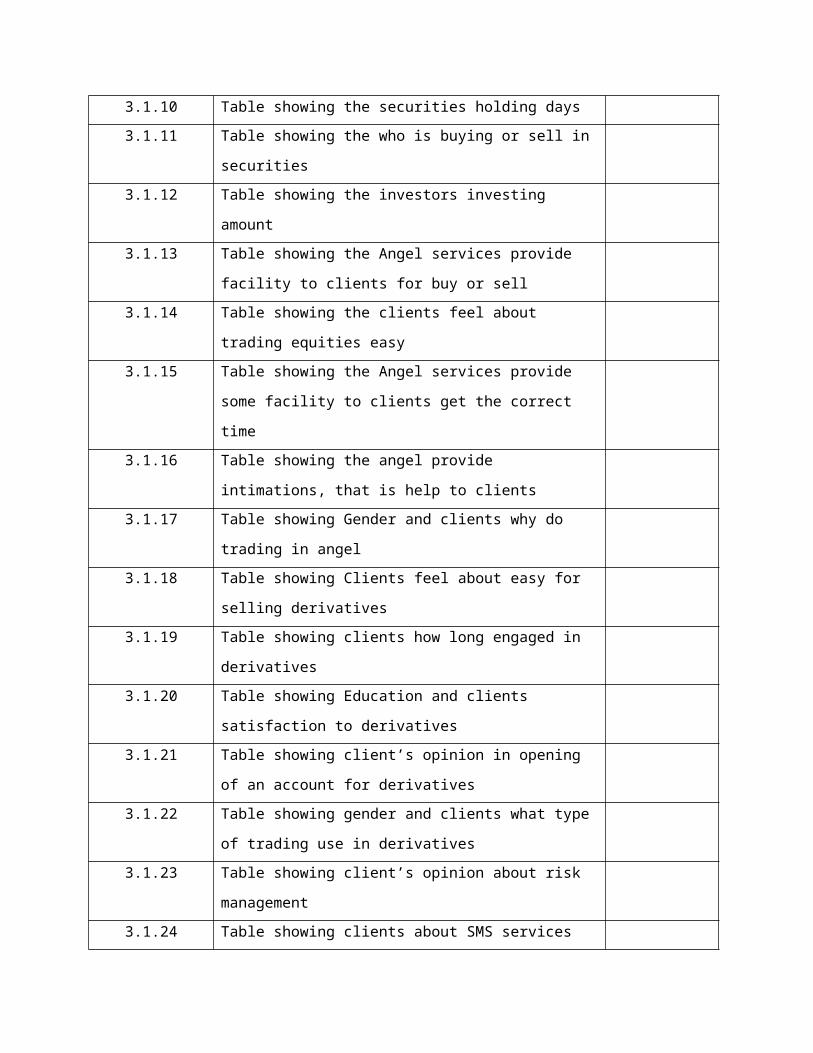
LIST OF TABLES
TABLE NO LIST OF TABLE PAGE NO
3.1.1 Chart showing gender of the respondents
3.1.2 Table showing Age of the respondents
3.1.3 Table showing Occupation and Equities Services by angel of
the respondents
3.1.4 Table showing Revenues Income of the respondents
3.1.5 Table showing clients investment decision of the respondents
3.1.6 Table showing the angel availed services and family
respondents
3.1.7 Table showing in clients how to influenced to select Angel
3.1.8 Table showing clients how long have been investing or trading
3.1.9 Table showing the gender and amount of investment per month
3.1.10 Table showing the securities holding days
3.1.11 Table showing the who is buying or sell in securities
3.1.12 Table showing the investors investing amount
3.1.13 Table showing the Angel services provide facility to clients for
buy or sell
3.1.14 Table showing the clients feel about trading equities easy
3.1.15 Table showing the Angel services provide some facility to
clients get the correct time
3.1.16 Table showing the angel provide intimations, that is help to
clients
3.1.17 Table showing Gender and clients why do trading in angel
3.1.18 Table showing Clients feel about easy for selling derivatives
3.1.19 Table showing clients how long engaged in derivatives
3.1.20 Table showing Education and clients satisfaction to derivatives
3.1.21 Table showing client’s opinion in opening of an account for
derivatives
3.1.22 Table showing gender and clients what type of trading use in
derivatives
3.1.23 Table showing client’s opinion about risk management
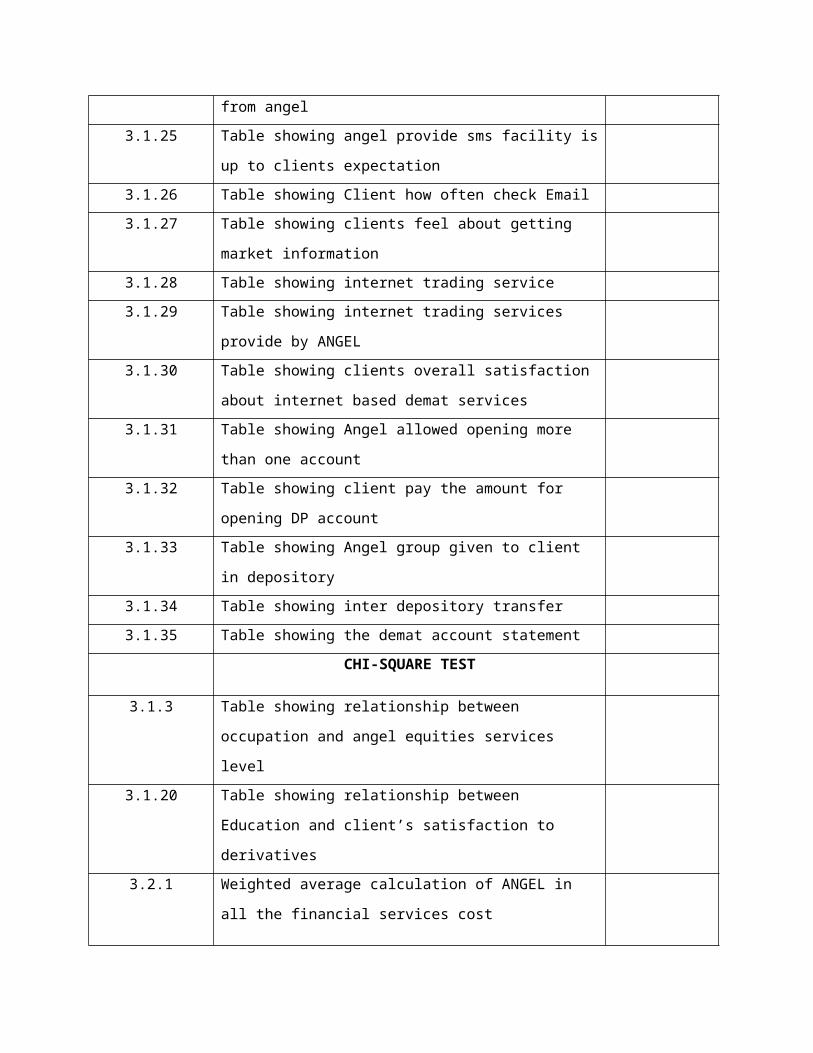
3.1.24 Table showing clients about SMS services from angel
3.1.25 Table showing angel provide sms facility is up to clients
expectation
3.1.26 Table showing Client how often check Email
3.1.27 Table showing clients feel about getting market information
3.1.28 Table showing internet trading service
3.1.29 Table showing internet trading services provide by ANGEL
3.1.30 Table showing clients overall satisfaction about internet based
demat services
3.1.31 Table showing Angel allowed opening more than one account
3.1.32 Table showing client pay the amount for opening DP account
3.1.33 Table showing Angel group given to client in depository
3.1.34 Table showing inter depository transfer
3.1.35 Table showing the demat account statement
CHI-SQUARE TEST
3.1.3 Table showing relationship between occupation and angel
equities services level
3.1.20 Table showing relationship between Education and client’s
satisfaction to derivatives
3.2.1 Weighted average calculation of ANGEL in all the financial
services cost
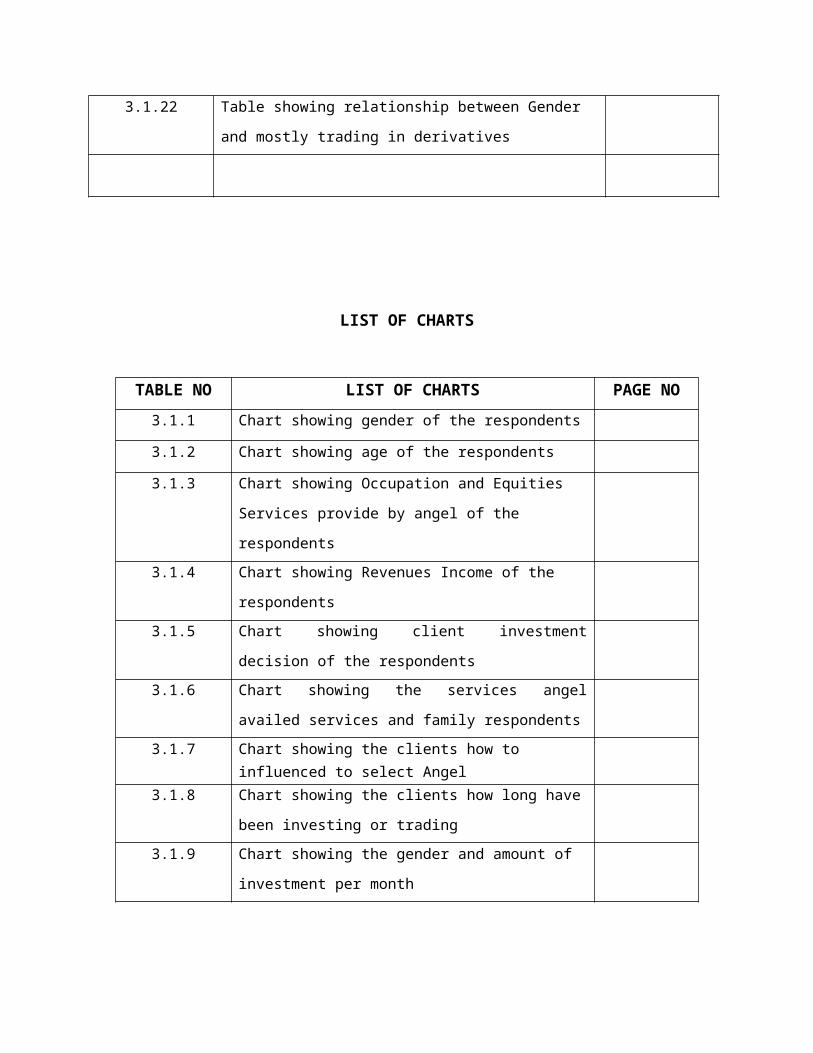
3.1.22 Table showing relationship between Gender and mostly trading
in derivatives
LIST OF CHARTS
TABLE NO LIST OF CHARTS PAGE NO
3.1.1 Chart showing gender of the respondents
3.1.2 Chart showing age of the respondents
3.1.3 Chart showing Occupation and Equities Services provide
by angel of the respondents
3.1.4 Chart showing Revenues Income of the respondents
3.1.5 Chart showing client investment decision of the
respondents
3.1.6 Chart showing the services angel availed services and
family respondents
3.1.7 Chart showing the clients how to influenced to select Angel
3.1.8 Chart showing the clients how long have been investing or
trading
3.1.9 Chart showing the gender and amount of investment per
month
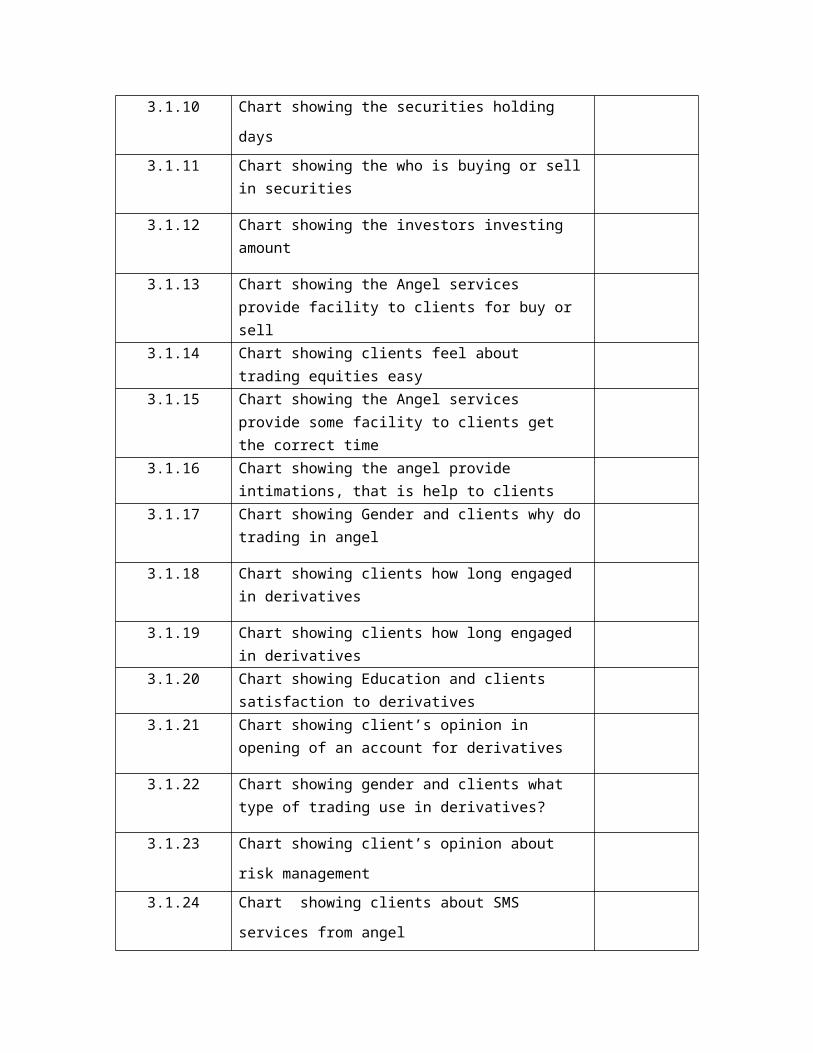
3.1.10 Chart showing the securities holding days
3.1.11 Chart showing the who is buying or sell in securities
3.1.12 Chart showing the investors investing amount
3.1.13 Chart showing the Angel services provide facility to clients for buy or sell
3.1.14 Chart showing clients feel about trading equities easy
3.1.15 Chart showing the Angel services provide some facility to clients get the correct time
3.1.16 Chart showing the angel provide intimations, that is help to clients
3.1.17 Chart showing Gender and clients why do trading in angel
3.1.18 Chart showing clients how long engaged in derivatives
3.1.19 Chart showing clients how long engaged in derivatives
3.1.20 Chart showing Education and clients satisfaction to derivatives
3.1.21 Chart showing client’s opinion in opening of an account for derivatives
3.1.22 Chart showing gender and clients what type of trading use in derivatives?
3.1.23 Chart showing client’s opinion about risk management
3.1.24 Chart showing clients about SMS services from angel
3.1.25 Chart showing angel provide sms facility is up to clients
expectation
3.1.26 Chart showing Client how often check Email
3.1.27 Chart showing clients feel about getting market
information
3.1.28 Chart showing internet trading service
3.1.29 Chart showing internet trading services provide by ANGEL
3.1.30 Chart showing clients overall satisfaction about internet based demat services
3.1.31 Chart showing Angel allowed opening more than one account
3.1.32 Chart showing client pay the amount for opening DP account
3.1.33 Chart showing Angel group given to client in depository
3.1.34 Chart showing depository transfer
3.1.35 Chart showing demat account statement
ABSTRACT
This study entitled ‘A STUDY ON CLIENT PERCEPTION ABOUT THE VALUE
ADDED SERVICES PROVIED BY ANGEL BROKING SERVICES IN ERODE. Angel
securities is one of the number one stock broking firms located Erode, Tamilnadu . Its complete
financial solutions as its key focus area the bank will offer wide range of financial product and
advisory services that enhances consumer wealth. A project aimed at studying the awareness
level and preference for various investment avenues and the perception of investors with special
reference to equity shares investment.
The entire study has been divided into three chapters. The first chapter deals with
introduction to the study, which deals with who exactly investors are and what kind of perception
they have in relation to the securities market. It also details the profile of the company angel
securities then deals with the objectives, scope and limitation of the study. The main objectives
of the study are to study and understand investors awareness and preferences on equity shares,
then analyze the various services provided by unicon securities limited.
The data was collected using standardized questionnaires. The target respondent groups
were the investors of angel, which include the salaried executives, business executives,
professionals and retried people. The sampling technique used in my research was non
probability convenience sampling. The sample size of the study was 60 investors.
Descriptive research was used for the analysis of the data collected. Through analysis is
found that majority of the investors have selected equity shares as the best mode of investment.
The second chapter deals with analysis and interpretation. The analysis in the study has
been done using tools like percentage analysis, chi-square analysis and weighted average.
Percentage analysis was used to make comparison between the data. Chi-square was used to test
hypotheses.
The third chapter deals with findings, suggestion and conclusions. The findings made from the
study help us to know that the company is very reputed and gives investors satisfaction in the
services offered. The researcher came up with suggestions like angel should create awareness
among the public and try to find ways to retain its clients. Finally it gives the conclusions that
gives in detail that the research conducted has helped us understand what the investors
perception about angel securities. The study has helped the researcher to identity the satisfaction
level of the customers and also to identity the factors influencing perception towards angel
securities limited.
CHAPTER 1
1.1 INTRODUCTION ABOUT THE STUDY:
The study purely deals with the “CLIENT PERCEPTION ABOUT THE VALUE
ADDED SERVICES”, Knowledge of investors is critical for developing strategies and
understanding their perception. While investing in securities we can find two major kinds of
investors –one who are averse and he other who are risk lovers.
Investors are generally risk averse. Given a choice between two assets with equal
expected return a risk adverse investor prefers the asset with the less risk. A risk is investor
would be indifferent.
An efficient portfolio offers the highest expected return for the desired amount of risk or
the least risk for the desired amount of return. There are many efficient portfolio for investors to
choose from investors prefer the portfolio that maximizes their utility.
An investor with a high degree of risk aversion would choose a portfolio with less risk.
An investor with little risk aversion chooses a portfolio with more risk. Generally the factors that
influence the investment decision investors are their income, occupation, education, age and
martial status.
The term commonly used to describe the ordinary share capital of a business. Ordinary
shares in the equity capital of a business entitle the holder to all distributed profits after the
holders of debentures and preference shares have been paid.
However, it is important to understand that the market value of a company’s shares has
little (if any) relationship to their nominal or face value. The market value of a company’s shares
is determined by the price another investor is prepared to pay for them. In the case of publicly-
quoted companies, this is reflected in the market value of the ordinary shares traded on the stock
exchange (the “share price”).
Since the investors differ in their perception different people will select different
portfolios. An investor with a high degree of risk aversion would choose a portfolio with less
risk. An investor with little risk aversion chooses a portfolio with more risk. Generally the
factors that influence the investment decision of the investors are their income, education, age
and occupation status.
ABOUT THE INDUSTRY
Stock markets refer to a market place where investors can buy and sell stocks. The price
at which each buying and selling transaction takes is determined by the market forces (i.e.
demand and supply for a particular stock).
A stock exchange, (formerly a securities exchange) is a corporation or mutual
organization which provides "trading" facilities for stock brokers and traders to trade stocks and
other securities.
In earlier times, buyers and sellers used to assemble at stock exchanges to make a
transaction but now with the dawn of IT, most of the operations are done electronically and the
stock markets have become almost paperless. Now investors don’t have to gather at the
Exchanges, and can trade freely from their home or office over the phone or through Internet.
Stock exchanges also provide facilities for the issue and redemption of securities as well
as other financial instruments and capital events including the payment of income and dividends.
The securities traded on a stock exchange include: shares issued by companies, unit trusts,
derivatives, pooled investment products and bonds. To be able to trade a security on a certain
stock exchange, it has to be listed there. Usually there is a central location at least for
recordkeeping, but trade is less and less linked to such a physical place, as modern markets are
electronic networks, which gives them advantages of speed and cost of transactions. Trade on an
exchange is by members only. The initial offering of stocks and bonds to investors is by
definition done in the primary market and subsequent trading is done in the secondary market.
Supply and demand in stock markets are driven by various factors which, as in all free markets,
affect the price of stocks (see stock valuation).
There is usually no compulsion to issue stock via the stock exchange itself, nor must
stock be subsequently traded on the exchange. Such trading is said to be off exchange or over-
the-counter. This is the usual way that derivatives and bonds are traded. Increasingly, stock
exchanges are part of a global market for securities.
ABOUT THE COMPANY PROFILE:
The Angel broking group, comprising the holding company, Angel broking Limited and its wholly-
owned subsidiaries, straddle the entire financial services space with offerings ranging from Equity
research, Equities and derivatives trading, Commodities trading, Portfolio Management Services,
Mutual Funds, Life Insurance, Fixed deposits, GoI bonds and other small
savings instruments to loan products and Investment banking. Angel broking also owns and manages
the websites www.angelbroking.com and www.5paisa.com.
Angel broking Limited is listed on both the leading stock exchanges in India, viz. the Stock
Exchange, Mumbai (BSE) and the National Stock Exchange (NSE) and is also a member of both
the exchanges.
It is engaged in the businesses of Equities broking, Wealth Advisory Services and Portfolio
Management Services. It offers broking services in the Cash and Derivatives segments of the
NSE as well as the Cash segment of the BSE. It is registered with NSDL as well as CDSL as a
depository participant, providing a one-stop solution for clients trading in the equities market. It
has recently launched its Investment banking and Institutional Broking business.
ANGEL BROKING PRODUCT AND SERVICES Financial Aid Loans
Financial Analysis Services
Financial Services
Life Insurance
Mutual Funds Services
Personal Finance Services
ANGEL BROKING GROUP
Angel broking Ltd
Angel broking Commodities Limited
Angel broking Marketing & Services
Angel broking Investment Services Limited

STATEMENT OF THE PROBLEM
In olden days people save money for the future competency in the bank which provides
good return and lesson risk. This investment revenue may not be suitable for young generation
were the expect higher return while compare with old age people. In India majority of the
population was scattered in young generation. Now days they are verities of investment
alternative due do liberalization, privatization and Globalization of financial sector. In this
scenario many financing companies competing one to anther to attract the proactive investors. In
the in this stock broking companies contributing higher percentage of revenue to the government
in terms of tax on investment. But the stock broking companies facing many problems like
volatility of market, less brokerage, poor service and handling of compliances. This pays was to
research to undergo research project entitle on “Client Perception about value added services
provided by ANGEL BROKING SERVICES IN ERODE”
OBJECTIVES OF THE STUDY
To understanding the preference of a customer related to purchase
of a particular investment.
To bring out the importance of portfolio management of equity
investors.
To know about the customers knowledge and experience in
investing in equities.
To find the customer attitude about financial risk, business risk
and management risk
2.2 SCOPE & LIMITATION
2.2.1 SCOPE OF THE STUDY
It relates to investment in equities
Understanding of customer / or investors about the equities
It also help us to know the portfolio management of equity investors
A better understanding of the stock market trend will facilitate
allocation of financial resources to the most profitable investment opportunity.
The study on fluctuations in equity market helps in
understanding the behavior of equitymarket.
The study also helps the customers to ascertain the risk and
return of the stocks.
LIMITATION OF THE STUDYThe Study was limited to Erode Only
The Result may be bias as some of the responses may not be
Accurate.
Validity & Reliability of the data obtained depend on the
responses from the customer.
The time at the disposal of the researcher is limited.
The size of the sample comparing to the population is very less
and hence it may not represent the whole population
RESEARCH METHODOLOGY
Research in common parlance refers to a search for knowledge one can also define research us
“the systematic search for pertinent information on specific topic” the systematic approach
concerning generalization and formulization of a theory is also a research methodology of
research provides guidelines, outline and frame work of how a project is to be conducts.
Research design:
Research involves “decision regarding what, when, where, how much, by what means
concerning an inquiry or research study constitutes research design”. A research design is the
arrangement of condition for collection and analysis of data in manner that aims to combine
relevance to the research purpose with economic in procedure.
Types of research
Descriptive research:
The study mainly used descriptive research. The descriptive research studies are concerned
with describing the characteristics of a particular individual or of a group. Here the researcher
must find adequate methods for measuring it along with clear cut definition of ‘population’ he
wants to study.
Sampling technique:
The selected respondent constitutes what is technically called a ‘sample’
and the selection procedure is called the sampling technique. The sample design is a definite plan
for obtaining a sample from given population.
It refers to the technique or the procedure the researcher would adopt in selecting items to
be include in the sample. The sample design is determined before data are collated. The type of
sampling technique used for my research is non-probability convenience sampling.
Convenience sampling:
In this method, the sample units are chosen primarily on the basis of the
convenience to the investigator.

Non probability sampling:
Non probability sampling the chance of any particular unit in the population
being selected is unknown. Since randomness is not involved in the selection process an estimate
of the sampling error cannot be made. But this does not mean that findings obtained from non
probability sampling are of questionable value.
Sampling unit:
The sampling unit of my study-private client group, Erode - which is basically
servicing a client base that invest minimum25000 and above. The group is basically the wealth
management arm of angel securities which services hi net worth individuals.
Size of sample design
Sample size : 60
Methods of data collection:
The study is based on primary data and secondary data. The first type of data to
be collected is primary data.
Primary data:
The primary data was collected through an administered questionnaire. The
questionnaire consisted of a variety of questions that were consistent with the objectives of the
research.
Primary data is the data, which is collected for the first time i.e. when secondary
data becomes outdated and becomes insufficient. Primary data may pertain to demographic and
socio economic characteristics of the consumers attitudes and options of people, their awareness
and knowledge and other similar aspect. The primary data is collected through personally. In this
study primary data has been collected with the help of questionnaire.
Collection of data through questionnaire:
This method of data collection is quite popular particularly in case of big enquires. It is
adopted by private individuals, research workers, private and public organizations and even by
governments.
Secondary data:
The study also used secondary data. The secondary data was collected from the company
journals, reports magazines and the materials obtained from head in the regional office. When
secondary data becomes outdated and becomes insufficient.
Tools used for analysis:
Percentage analysis
Percentage is used to make comparisons between two or more series of
data.
Percentage analysis= no.the respondents
Total no.the respondents
Weighted average
Weighted average may be defined as the average obtained multiplying the
various item in serious by certain values know as weighted and the total of products so obtained
is dividend by the total of weighted.
∑XW
WEIGHTED AVERAGE = -------------
∑W
Chi-square analysis:
Chi-square analysis is a non-parametric test. It is used most frequently by
marketing researchers to test hypotheses.
CHI-SQUARE TEST Ψ² =∑
(Oij−Eij )2
Eij
CHAPTER 2
2.1. REVIEW OF LITERATURE
Investor’s perception –An overview
The study of investors perception focuses on how individuals make decision to invest
their available resources like time & money based on the factors for investment in equity shares.
In every investment like risk, return capital, tax, and liquidity. The investor perception is also
influenced by the high risk return, capital appreciation, and interest etc…
Dr. Abraham Maslow formulated a widely accepted theory of motivation, based on the
nation of universal of human needs. This includes five needs they are also related to the investor
behavior in investment pattern. Physiological need, Safety and security needs, Social needs,
self esteem, Self actualization needs.
CHAPTER 3
ANALYSIS AND INTERPRETATION
Analysis refers to the ability to break down material into its component parts so that is
organizational structure may understand. This may be including the identification of the parts,
analysis of the relationship between parts and recognition of the organizational principles
involved. Learning outcomes here represent a higher intellectual level than comprehension and
application because they require an understanding of both the content and the structural from of
the material.
Systematic approaches to problem solving complex problems are made simpler by
separating them into more understandable elements. This involves the identification of purposes
and facts, the statement of defensible assumption, and the formulation of conclusions.
TABLE 3.1.1
Table showing gender of the respondents:
Gender Total Respondents %Male 37 61.7%
Female 23 38.3%Total 60 100%
(Source of primary data)
INTERPRETATION:
From The above table shows that 37 no of the respondents are male Respondents and the rest of
the 23 are female members. This shows that Majority of the respondents are male.
CHART 3.1.1
Chart showing gender of the respondents
Male Female0
5
10
15
20
25
30
35
40
37
23

TABLE 3.1.2
Table showing Age of the respondents:
Age Total Respondents %
00-20 O 0%
20-40 32 53.3%
40-60 26 43.33%
Above 40 2 3.33%
Total 60 100%
(Sources of primary data)
INTERPERTATION:
From The above table shows that 0-20 age 0 no of the respondents are under the age
group 20-40, 32 no of the respondents are under the age group 40-60, 26 no of the respondents
are under the age group above 60, 2 no of the respondents of members. This shows that Majority
of the respondents are under the age group 20- 40 no of respondents 32 Members.
CHART 3.1.2
3.1.2Chart showing age of the respondents
00 -20 20-40 40-60 Above 600
5
10
15
20
25
30
35
Age
NO
of R
espo
nden
ts
0
32
26
2
TABLE 3.1.3
Table showing Occupation and Equities Services by angel of the respondents:
S.No Business Professional Retired Govt Employee
Pvt employee
Total
Online fund transfer
12 28 1 0 11 52
Internet trading
2 1 2 0 1 6
Online book building
1 0 1 0 0 2
Other specify
0 0 0 0 0 0
Total 15 29 4 0 12 60(Sources of primary data)
INTERPERTATION:
From The above table shows that 15 no of the respondents are coming under Business
and 29 no of the respondents are coming under Professional and 4 no of the respondents are
coming under Retire and 0 no of the respondents are coming under Govt employee and 12 no of
respondents are coming under Pvt employee. This shows that majority of the respondents are
coming under Business and Professional.
CHART 3.1.3
3.1.3Chart showing Occupation and Equities Services provide by angel of the respondents:
1 2 3 4 50
5
10
15
20
25
30
Occupation
An
ge
l P
rov
ide
Se
rvic
es
in e
qu
itie
s
12
21
28
1 12
1
11
1
TABLE 3.1.4
Table showing Revenues Income of the respondents
Income Total Respondents %Salary 14 23.3%House Property 38 63.3%Capital market Investment 4 6.7%Commodity market investment 3 5%Capital Gain 1 1.7%other specify 0 0Total 60 100%
(Sources of primary data)
INTERPRETATION:
From The above table shows that 14 no of the respondents are salary and 38 no of the
respondents coming house property and 4 no of the respondents are capital market investment
and 3 no of the respondents are coming under commodity market investment and 1 no of the
respondents are coming under capital gain. This shows that majority of the respondents are
coming under the house property.
CHART 3.1.4
Chart showing Revenues Income of the respondents
Sala
ry
House P
roper
ty
Capita
l mar
ket I
nvest
men
t
Comm
odity m
arke
t inve
stm
ent
Capita
l Gai
n
other
spec
ify05
10152025303540
The revenues income
resp
on
de
nts
14
38
43 1
TABLE 3.1.5
Table showing clients investment decision of the respondents
Investment Decision Total Respondents %Yourself 39 65%Friends or Relatives 14 23.3%Agent or Brokers 2 3.3%Advertisement 5 8.4%Total 60 100%
(Sources of primary data)
INTERPRETATION:
From The above table shows that 39 no of the respondents are self and 14 no of the
respondents coming friends or relatives and 2 no of the respondents are agent or brokers and 5 no
of the respondents are coming under advertisement. This shows that majority of the respondents
are coming under the self.
CHART 3.1.5
Chart showing client investment decision of the respondents
39
14
2
5The Investment Influenced
YourselfFriends or RelativesAgent or BrokersAdvertisement
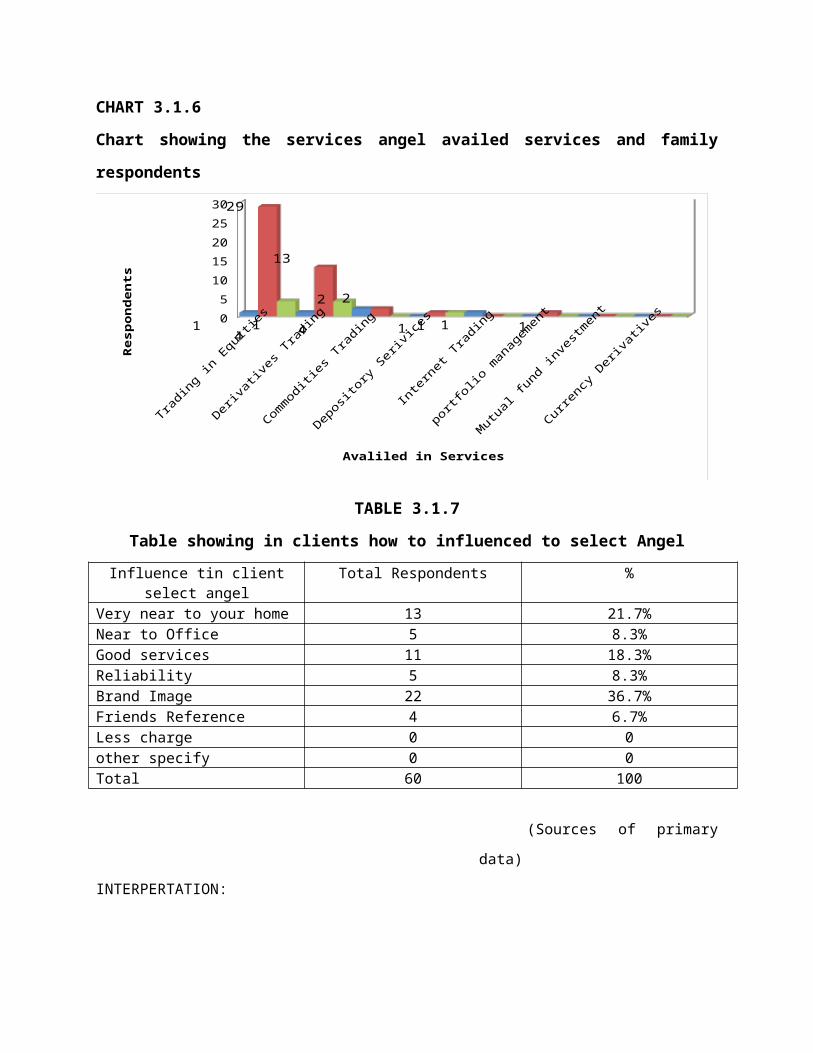
TABLE 3.1.6
Table showing the angel availed services and family respondents
Respondents Elders Younger's Kids Total Respondents
Trading in Equities 1 29 4 34Derivatives trading 1 13 4 18Commodities trading 2 2 0 4
Depository services 0 1 1 2Internet trading 1 0 0 1Portfolio management 0 1 0 1
Mutual fund investment 0 0 0 0
Currency derivatives 0 0 0 0
Total 5 46 9 60(Sources of primary data)
INTERPERTATION:
From The above table shows that 34 of the respondents are trading in equities and 18 of
the respondents are derivatives and 4 of the respondents are commodities trading and 2 of the
respondents are depository services and 1 no of respondents are internet trading and portfolio
management and mutual fund investment and currency derivative o no of respondents. This
shows the majority of the respondents are Trading in Equities.
CHART 3.1.6
Chart showing the services angel availed services and family respondents
Trad
ing i
n Equiti
es
Deriva
tives T
radin
g
Comm
odities
Trad
ing
Deposit
ory Se
rivice
s
Inte
rnet
Trad
ing
portfolio
man
agem
ent
Mutu
al fu
nd inve
stmen
t
Curren
cy D
eriva
tives0
5
10
15
20
25
30
Avaliled in Services
Re
spo
nd
en
ts
1
29
41
13
4
2 2
1 1 1 1
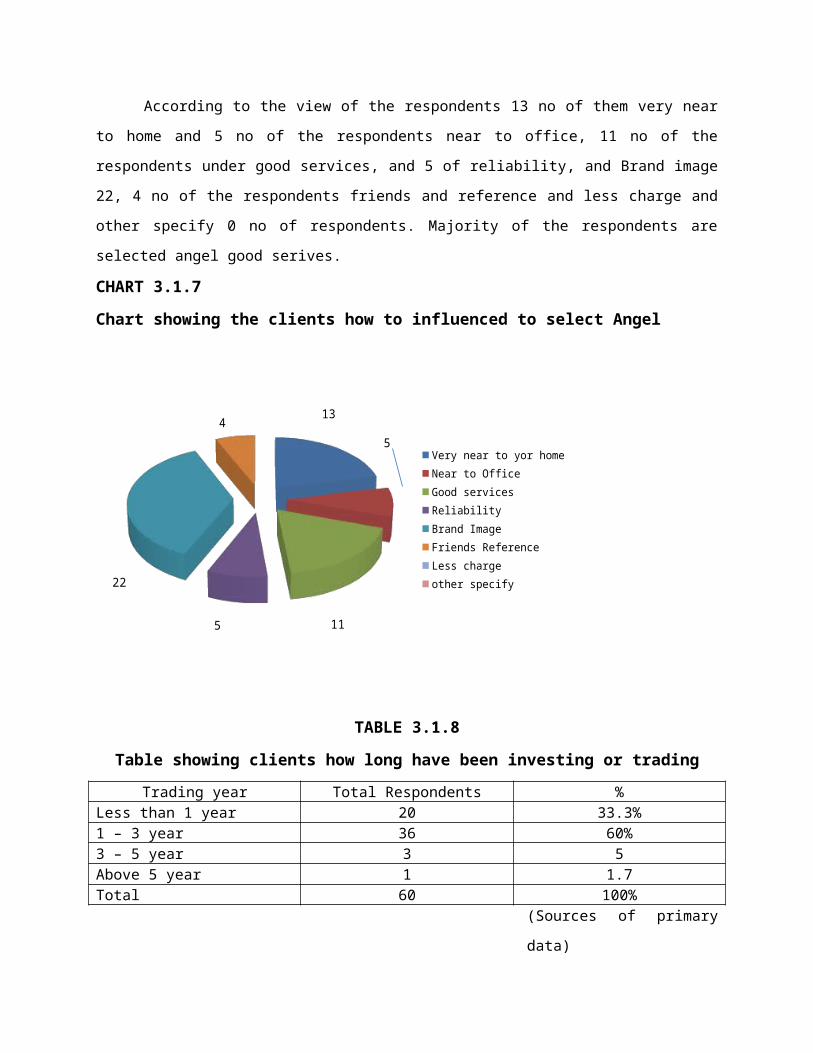
TABLE 3.1.7

Table showing in clients how to influenced to select Angel
Influence tin client select angel Total Respondents %Very near to your home 13 21.7%Near to Office 5 8.3%Good services 11 18.3%Reliability 5 8.3%Brand Image 22 36.7%Friends Reference 4 6.7%Less charge 0 0other specify 0 0Total 60 100
(Sources of primary data)
INTERPERTATION:
According to the view of the respondents 13 no of them very near to home and 5 no of the
respondents near to office, 11 no of the respondents under good services, and 5 of reliability, and Brand
image 22, 4 no of the respondents friends and reference and less charge and other specify 0 no of
respondents. Majority of the respondents are selected angel good serives.
CHART 3.1.7
Chart showing the clients how to influenced to select Angel
Very near to yor homeNear to OfficeGood servicesReliabilityBrand ImageFriends ReferenceLess charge other specify
13
5
115
22
4
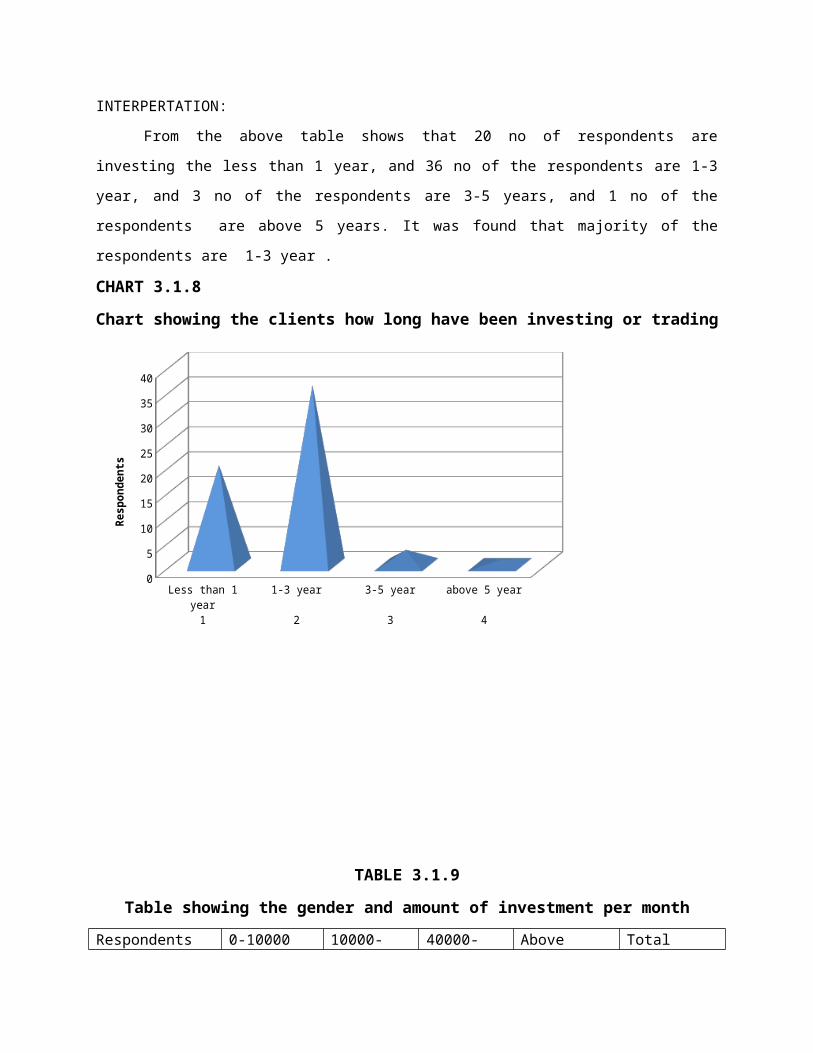
TABLE 3.1.8

Table showing clients how long have been investing or trading
Trading year Total Respondents %Less than 1 year 20 33.3%1 – 3 year 36 60%3 – 5 year 3 5Above 5 year 1 1.7Total 60 100%
(Sources of primary data)
INTERPERTATION:
From the above table shows that 20 no of respondents are investing the less than 1 year, and 36
no of the respondents are 1-3 year, and 3 no of the respondents are 3-5 years, and 1 no of the
respondents are above 5 years. It was found that majority of the respondents are 1-3 year .
CHART 3.1.8
Chart showing the clients how long have been investing or trading
1 Less than 1 year 2 1-3 year 3 3-5 year 4 above 5 year
Total 20 36 3 1
2.5
7.5
12.5
17.5
22.5
27.5
32.5
37.5
Resp
onde
nts
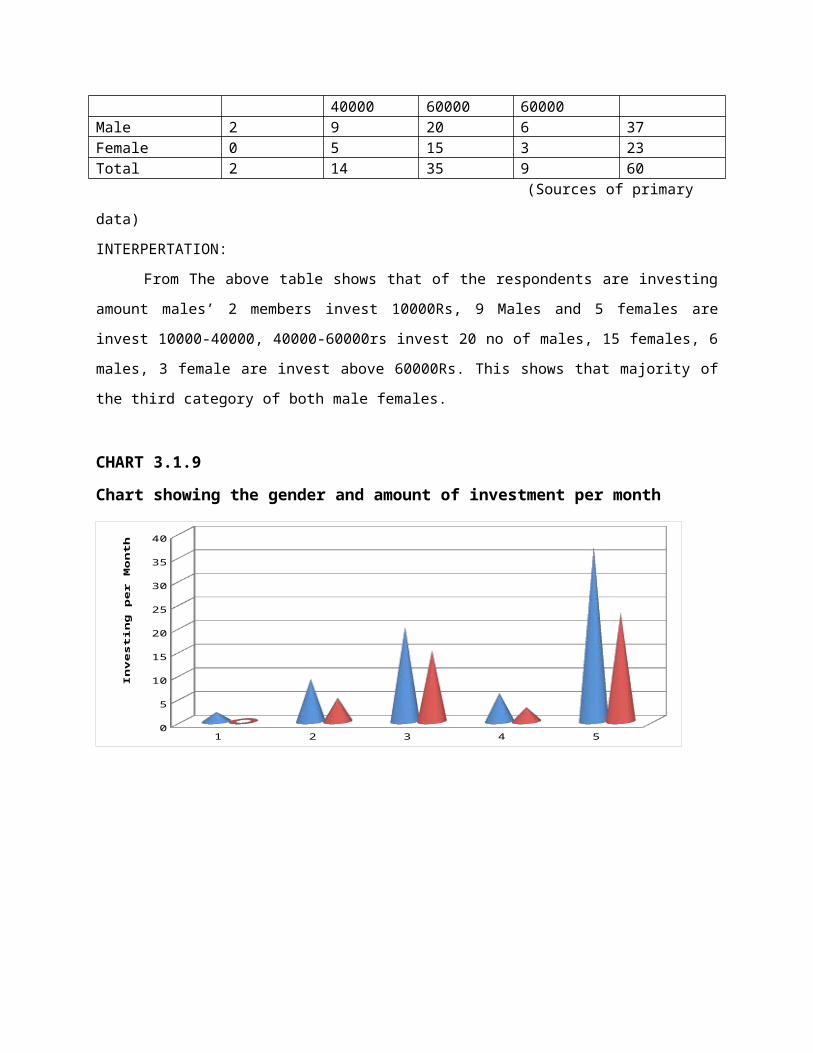
TABLE 3.1.9
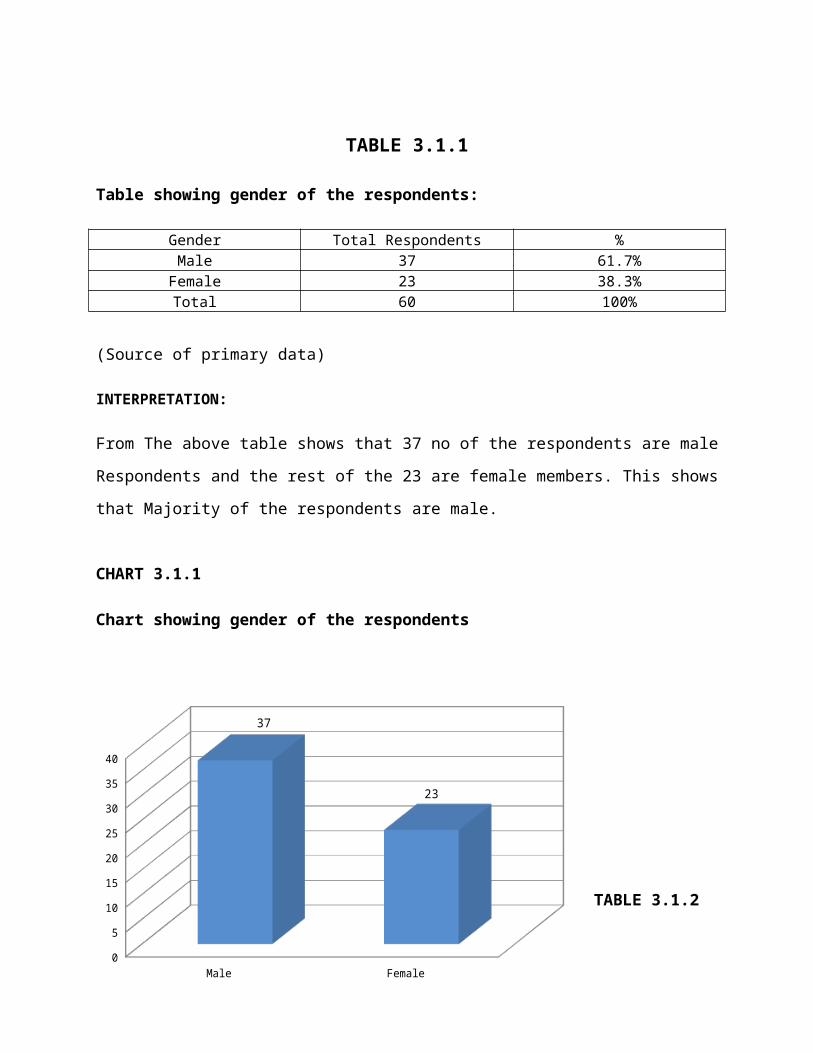
Table showing the gender and amount of investment per month
Respondents 0-10000 10000-40000 40000-60000 Above 60000 TotalMale 2 9 20 6 37Female 0 5 15 3 23Total 2 14 35 9 60
(Sources of primary data)
INTERPERTATION:
From The above table shows that of the respondents are investing amount males’ 2 members
invest 10000Rs, 9 Males and 5 females are invest 10000-40000, 40000-60000rs invest 20 no of males, 15
females, 6 males, 3 female are invest above 60000Rs. This shows that majority of the third category of
both male females.
CHART 3.1.9
Chart showing the gender and amount of investment per month
1 2 3 4 5
Male 2 9 20 6 37
Female 0 5 15 3 23
2.5
7.5
12.5
17.5
22.5
27.5
32.5
37.5
Inve
stin
g p
er
Mo
nth
TABLE 3.1.10
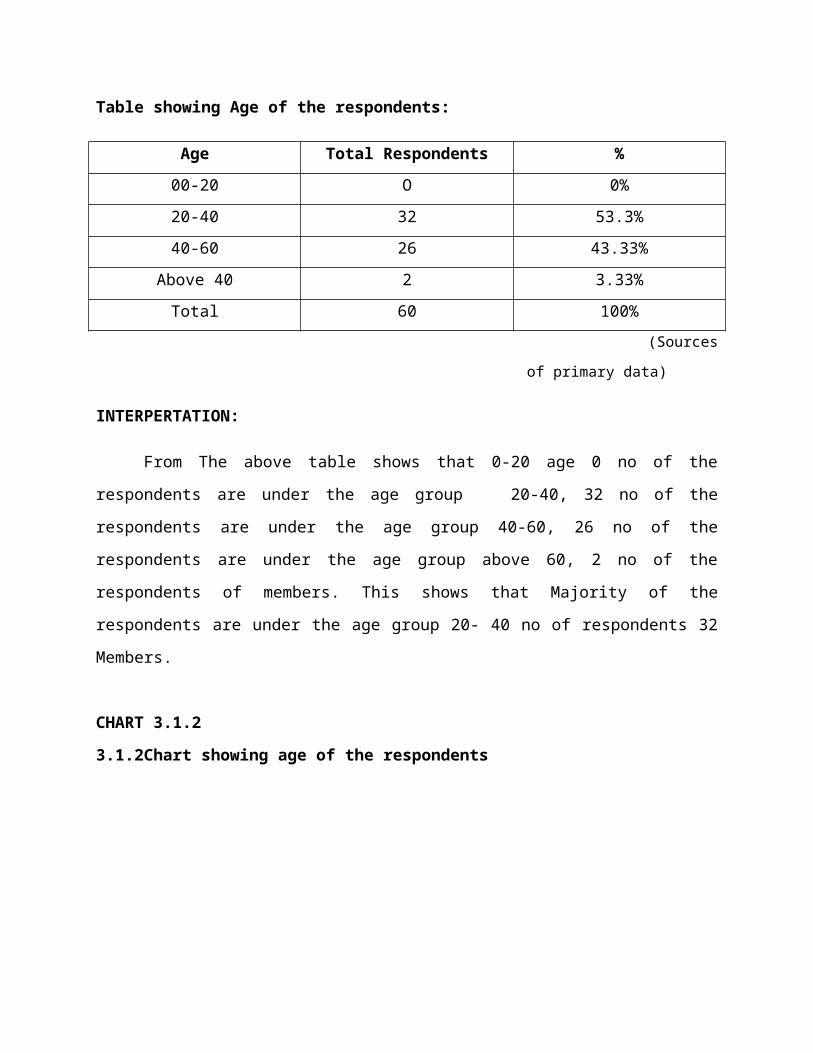
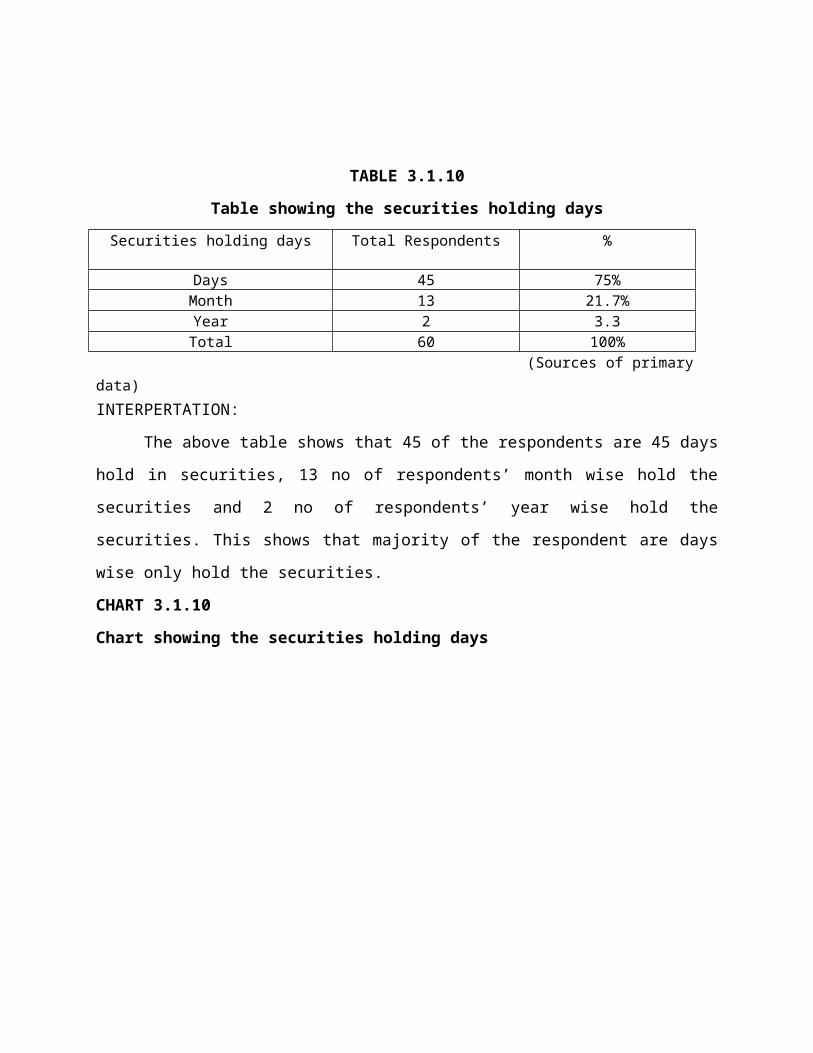
Table showing the securities holding days
Securities holding days Total Respondents %
Days 45 75%Month 13 21.7%
Year 2 3.3Total 60 100%
(Sources of primary data)INTERPERTATION:
The above table shows that 45 of the respondents are 45 days hold in securities, 13 no of
respondents’ month wise hold the securities and 2 no of respondents’ year wise hold the
securities. This shows that majority of the respondent are days wise only hold the securities.
CHART 3.1.10
Chart showing the securities holding days
Day's Month Year0
5
10
15
20
25
30
35
40
45
Securities
Resp
onde
nts
45
13
2
TABLE 3.1.11
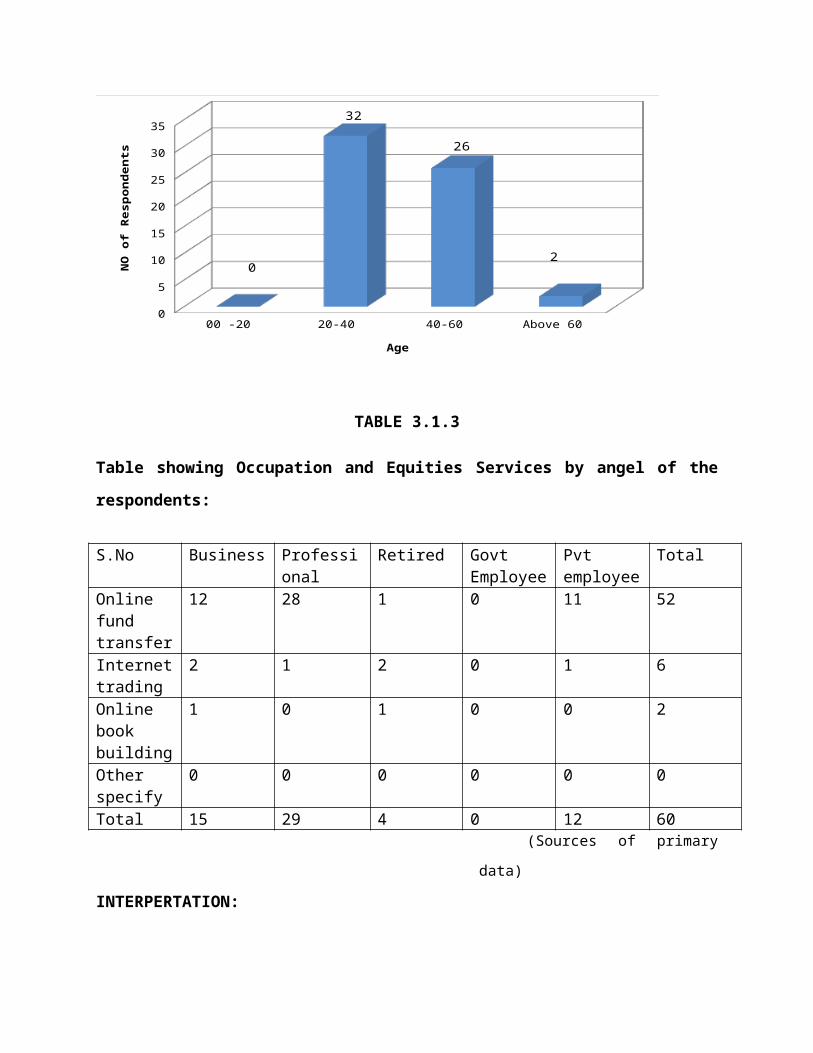
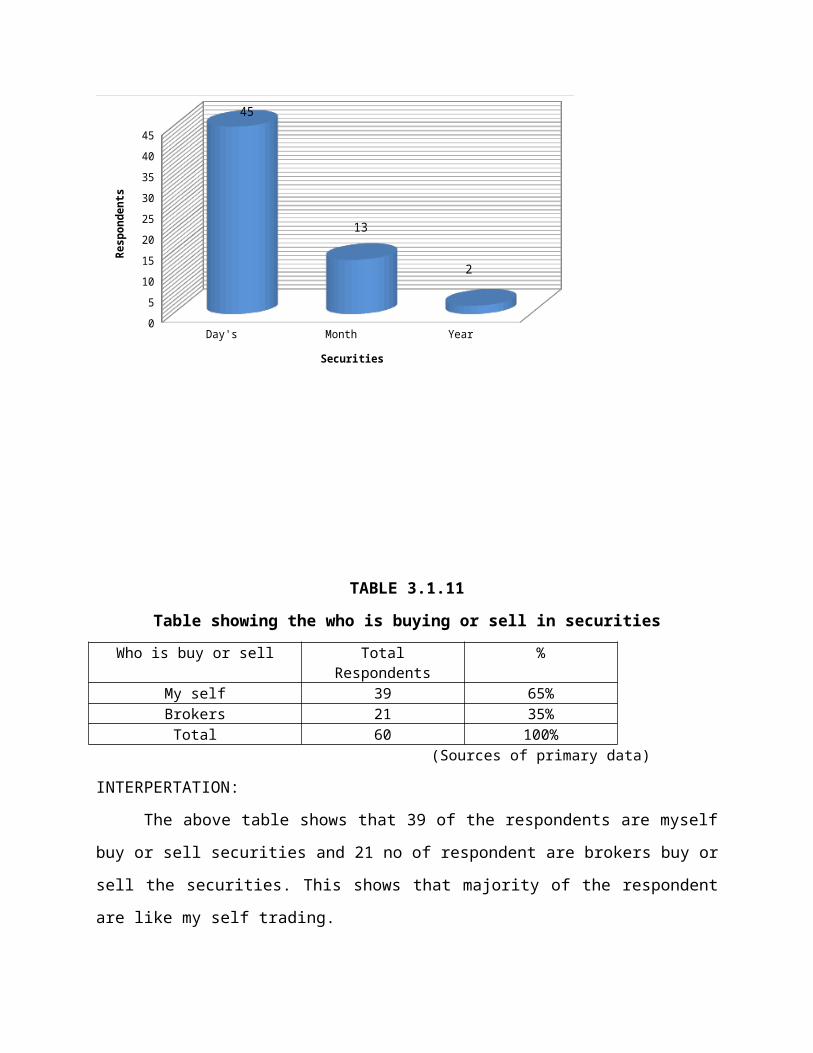
Table showing the who is buying or sell in securities
Who is buy or sell Total Respondents %
My self 39 65%Brokers 21 35%
Total 60 100% (Sources of primary data)
INTERPERTATION:
The above table shows that 39 of the respondents are myself buy or sell securities and 21
no of respondent are brokers buy or sell the securities. This shows that majority of the
respondent are like my self trading.
CHART 3.1.11
Chart showing the who is buy or sell in securities
My Self Brokers
21
39
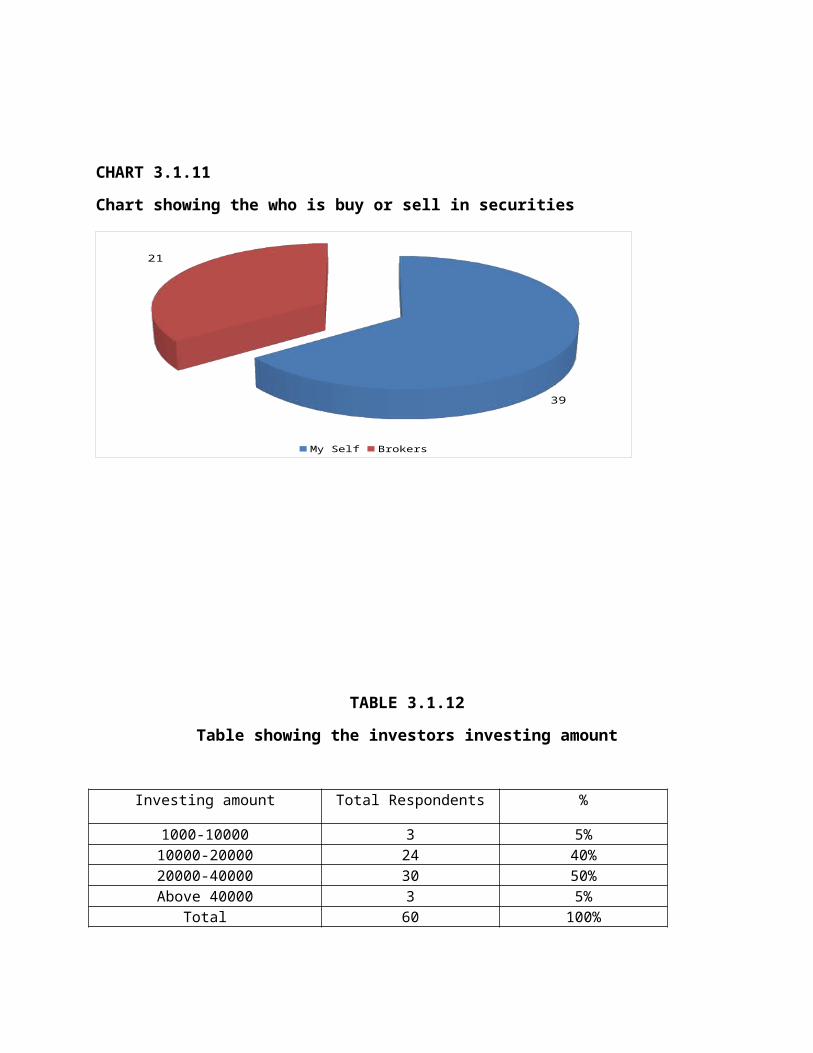
TABLE 3.1.12
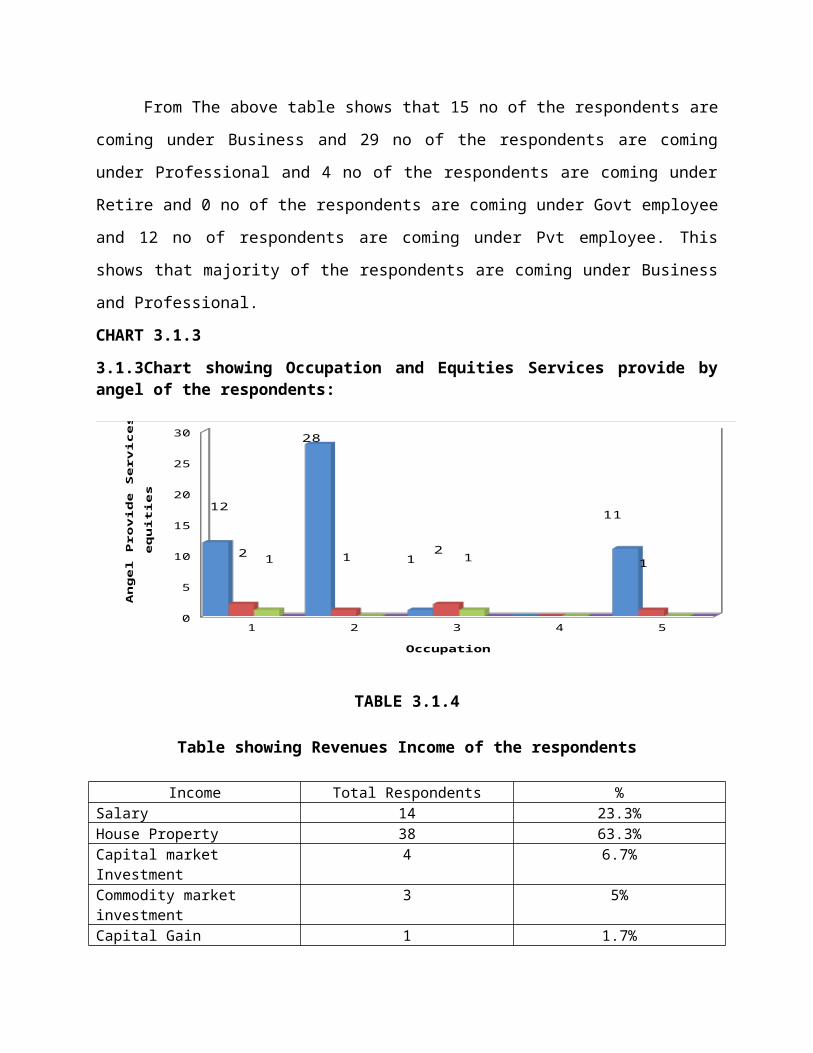
Table showing the investors investing amount
Investing amount Total Respondents %
1000-10000 3 5%10000-20000 24 40%20000-40000 30 50%Above 40000 3 5%
Total 60 100% (Source of primary data)
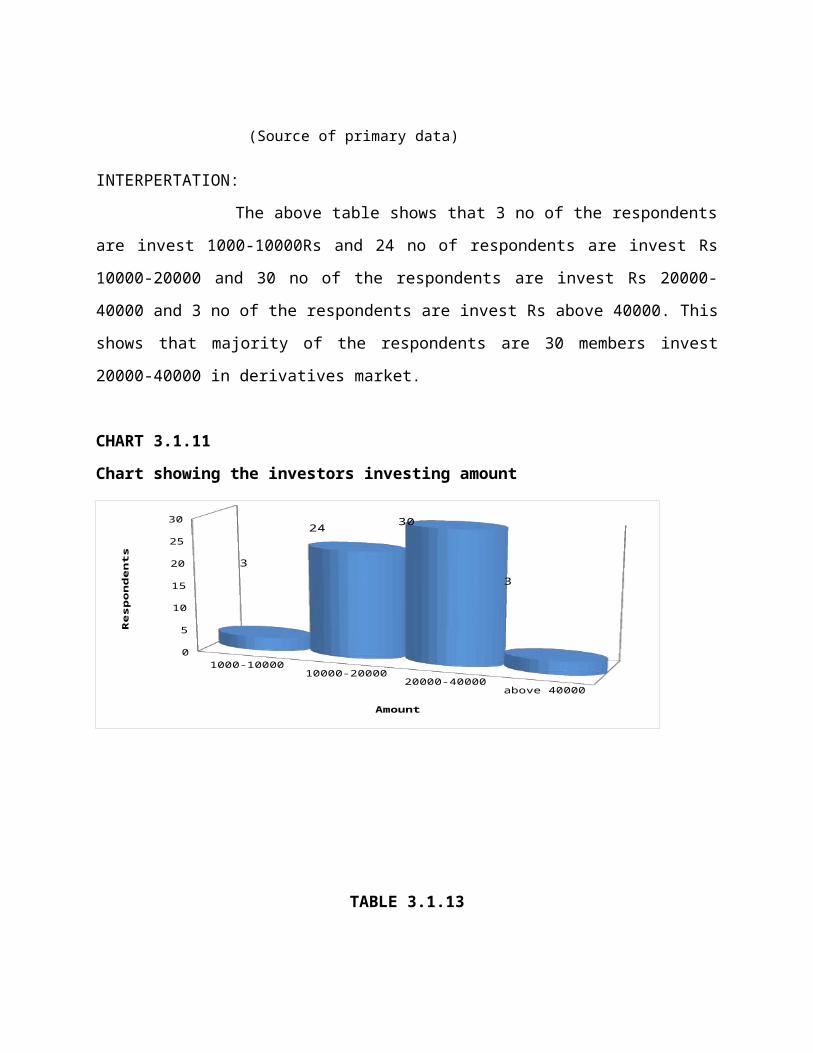
INTERPERTATION:
The above table shows that 3 no of the respondents are invest 1000-10000Rs and 24 no
of respondents are invest Rs 10000-20000 and 30 no of the respondents are invest Rs 20000-
40000 and 3 no of the respondents are invest Rs above 40000. This shows that majority of the
respondents are 30 members invest 20000-40000 in derivatives market.
CHART 3.1.11
Chart showing the investors investing amount
1000-1000010000-20000
20000-40000above 40000
0
5
10
15
20
25
30
Amount
Re
spo
nd
en
ts 3
2430
3
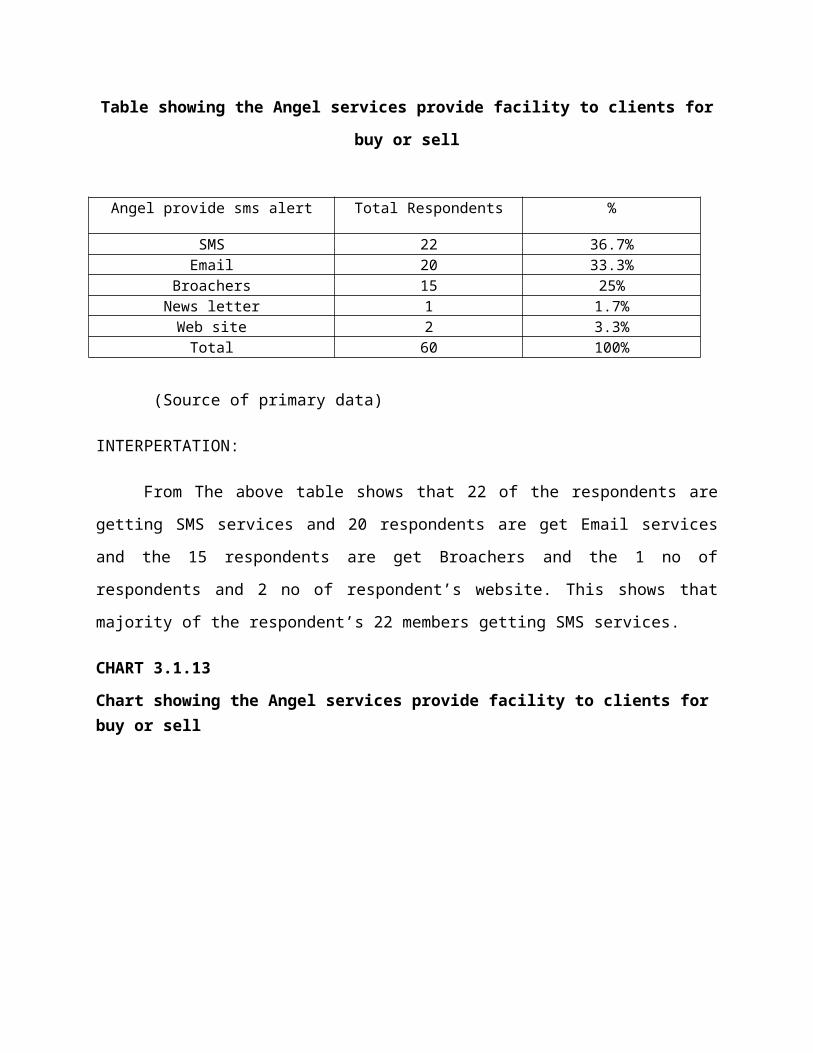
TABLE 3.1.13
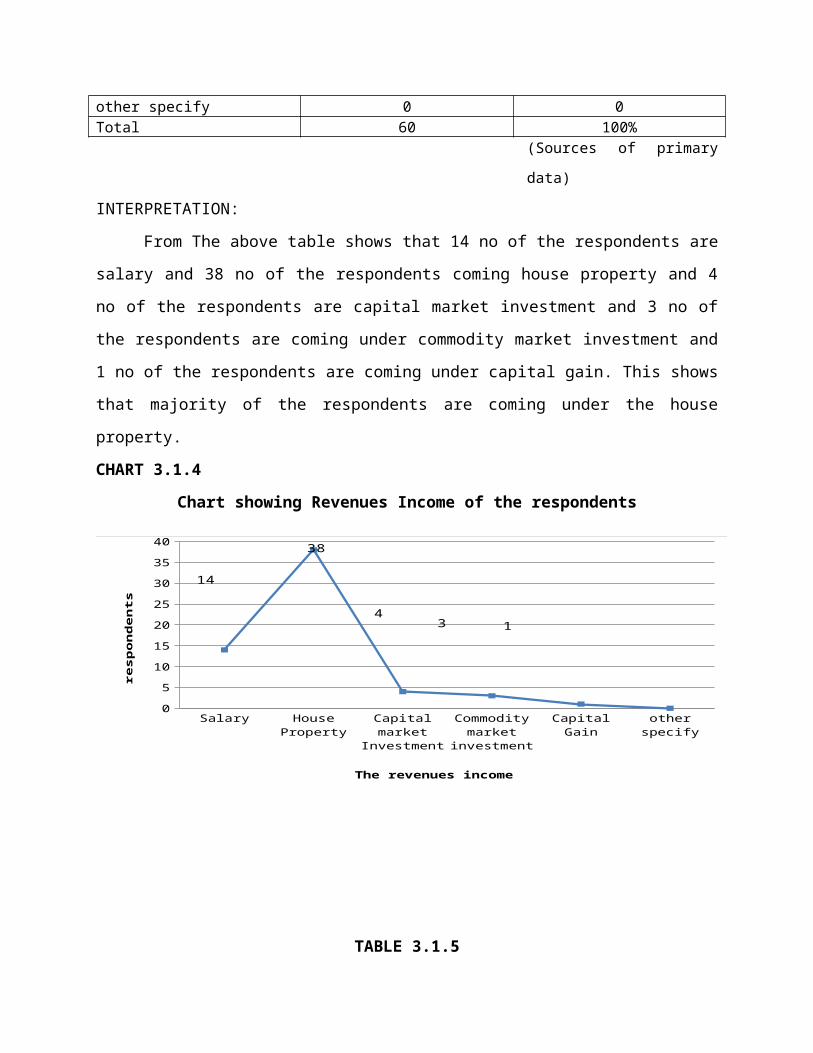
Table showing the Angel services provide facility to clients for buy or sell
Angel provide sms alert Total Respondents %
SMS 22 36.7%Email 20 33.3%
Broachers 15 25%News letter 1 1.7%
Web site 2 3.3%Total 60 100%
(Source of primary data)
INTERPERTATION:
From The above table shows that 22 of the respondents are getting SMS services and 20
respondents are get Email services and the 15 respondents are get Broachers and the 1 no of
respondents and 2 no of respondent’s website. This shows that majority of the respondent’s 22
members getting SMS services.
CHART 3.1.13
Chart showing the Angel services provide facility to clients for buy or sell
Sms E-mail Brouchers Newsletter Website0
5
10
15
20
25
Angel provied serives to clients
No
of
resp
on
de
nts
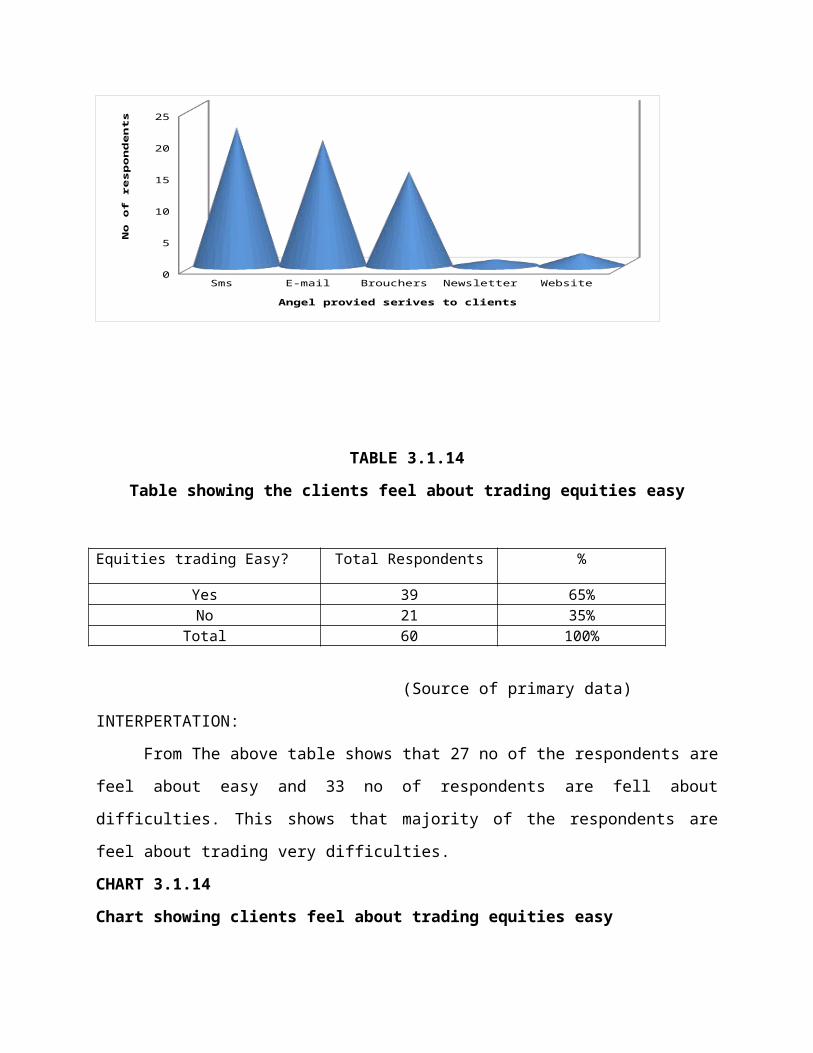
TABLE 3.1.14
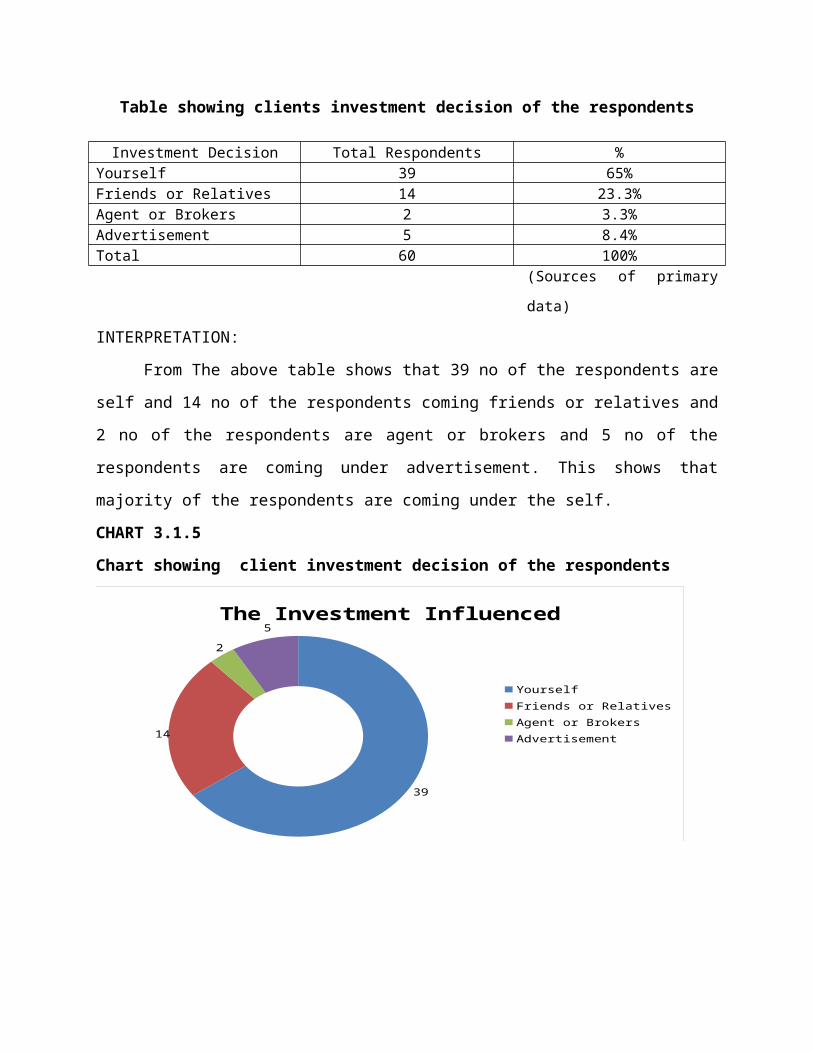
Table showing the clients feel about trading equities easy
Equities trading Easy? Total Respondents %
Yes 39 65%No 21 35%
Total 60 100% (Source of primary data)
INTERPERTATION:
From The above table shows that 27 no of the respondents are feel about easy and 33 no
of respondents are fell about difficulties. This shows that majority of the respondents are feel
about trading very difficulties.
CHART 3.1.14
Chart showing clients feel about trading equities easy
Yes No
Series1 27 33
2.5
7.5
12.5
17.5
22.5
27.5
32.5
No
of
Re
spo
nd
en
ts
TABLE 3.1.15
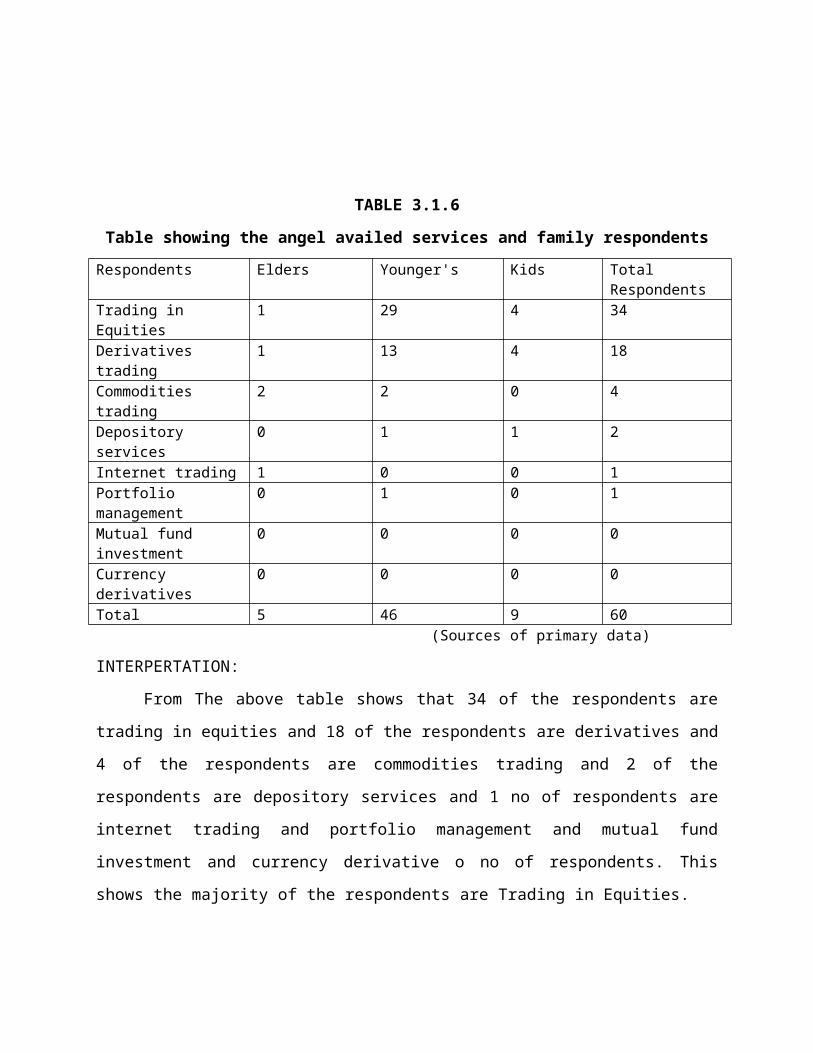
Table showing the Angel services provide some facility to clients get the correct time
Angel services provide correct time to client
Total Respondents %
Yes 32 53.3%No 28 46.7%
Total 60 100% (Source of primary data)
INTERPERTATION:
From The above table shows that 32 no of the respondents are getting some facility to
correct time and 28 respondents are not getting angel provide facility. This shows that majority
of the respondent’s 32 members getting Angel services.
CHART 3.1.15
Chart showing the Angel services provide some facility to clients get the correct time
Yes No26
27
28
29
30
31
32
33
Angel Provied Services correct time
No
of
Re
spo
nd
en
ts
32
28
TABLE 3.1.16
Table showing the angel provide intimations, that is help to clients
Angel services provide intimation for help to client
Total Respondents %
Buy back 24 40%Open offer 27 45%
Annual offer 2 3.3%Policy changes by governments 2 3.3%
Price movement 4 6.7Specify news to the share holders 1 1.7%
Total 60 100% (Source of primary data)
INTERPERTATION:
From The above table shows that 24 no of the respondents are help from buy back and 27
no of respondents are open offer and the 2 no of respondents are Annual result and policy
change by government and 4 no of respondents price movement, 1 no of respondents are specify
news to the share holders . This shows that majority of the respondents are open offer.
CHART 3.1.16
Chart showing the angel provide intimations, that is help to clients
Buy Back Open offer Annual result Policy changes by Govt
Price movement
specify news to the Share
holders
0
5
10
15
20
25
30
Angel Provide services to clients
No
of
Re
spo
nd
en
ts
2427
2 2 4 1
TABLE 3.1.17
Table showing Gender and clients why do trading in angel
S.No Respondents Digital contract
Intimation of market to market profit or loss
provide to verify the trade
provide facilities for SLBS
Intimation About FII
Direct pay off traders
Total
1 Male 32 0 5 0 0 0 372 Female 19 1 2 1 0 0 23Total 51 1 7 1 0 0 60
(Source of primary data)
INTERPERTATION:
From The above table shows that 51 no of the respondents are Digital contact and 1 no of
respondents are intimation of market profit or loss and the 7 no of respondents are provide and 1
no of respondents provide facilities. This shows that majority of the respondents are Digital
contact.
CHART 3.1.18
Chart showing Gender and clients why do trading in angel
1 2 3 4 5 6
32
0
5
0 0 0
19
1 2 1 0 0
Male female
0
TABLE 3.1.18
Table showing Clients feel about easy for selling derivatives
S.No Respondents Total1 Easy 312 Difficult 29
Total 60 (Source of primary data)
INTERPERTATION:
From The above table shows that 31 no of the respondents are Easy and 29 no of respondents are
Difficult. This shows that majority of the respondents are Easy.
CHART 3.1.19
Chart showing Clients feel about easy for selling derivatives
Easy Difficult
Series1 31 29
28.25
28.75
29.25
29.75
30.25
30.75
Clients feel about selling the derivatives
No
of R
espo
nden
ts
TABLE 3.1.19
Table showing clients how long engaged in derivatives
S.No Respondents Total1 Less than 1 year 302 1-2 year 243 2-3 year 64 Above 3 year 0Total 60
(Source of primary data)
INTERPERTATION:
From The above table shows that 30 no of the respondents are less than 1year and 24 no of
respondents are 1-2 year and the 6 no of respondents are 2-3 year. This shows that majority of the
respondents are Less than 1 year.
CHART 3.1.20
Chart showing clients how long engaged in derivatives
Less than 1 year 1-2 year 2-3 year Above 3 year0
5
10
15
20
25
30
Year
resp
on
de
nts
TABLE 3.1.20
Table showing Education and clients satisfaction to derivatives
S.NO SSLC Diploma Degree PG Illiterate TotalHigh Satisfied 5 1 30 0 0 9Satisfied 26 7 5 0 0 38Moderately satisfied
1 0 0 1 0 2
Dissatisfied 3 1 2 0 0 6High Satisfied 4 0 1 0 0 5Total 39 9 11 1 0 60
(Source of primary data)
INTERPERTATION:
From The above table shows that respondents are 9 no of high satisfied and 38 no of the
respondents are satisfied and 2 no of the respondents are moderately satisfied and 6 no of respondents are
dissatisfied and 5 no of respondents are high dissatisfied. This shows that majority of the respondents are
satisfied.
CHART 3.1.21
Chart showing Education and clients satisfaction to derivatives
1 2 3 4 50
5
10
15
20
25
30
Education
clie
nt
sati
sfac
tio
n in
de
riva
tive
s
TABLE 3.1.21
Table showing client’s opinion in opening of an account for derivatives
S.No Respondents Total1 Easy 242 Difficult 36Total 60
(Source of primary data)
INTERPERTATION:
From The above table shows that 24 no of the respondents are Easy of account opening for
derivatives and 36 no of respondents are difficult to open account for derivatives. This shows that
majority of the respondents are difficult to open account for derivatives.
CHART 3.1.22
Chart showing client’s opinion in opening of an account for derivatives
24
36
EasyDifficult
TABLE 3.1.22
Table showing gender and clients what type of trading use in derivatives?
S.No Respondents Invest Hedge Arbitrage Total1 Male 7 21 9 372 Female 6 10 7 23Total 13 31 16 60
(Source of primary data)
INTERPERTATION:
From The above table shows that 13 no of the respondents are invest and 31 no of respondents
are Hedge and the 16 no of respondents are Arbitrage. This shows that majority of the respondents are
Hedging.
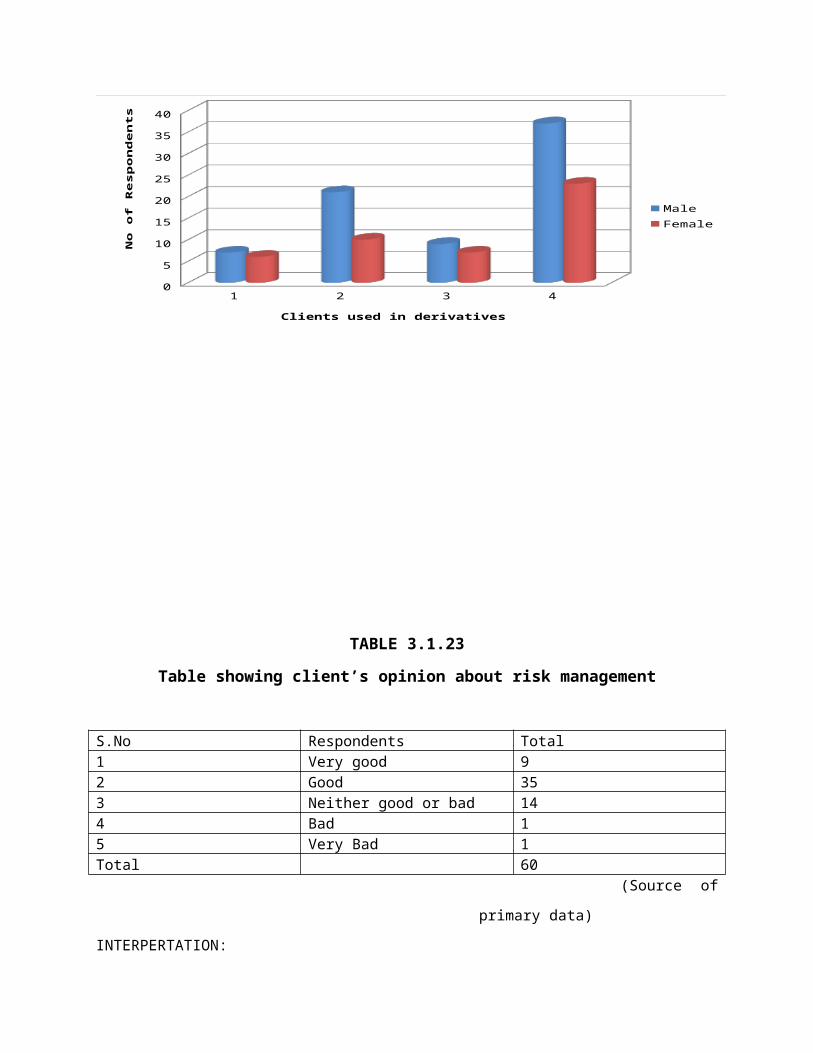
CHART 3.1.23
Chart showing gender and clients what type of trading use in derivatives?
1 2 3 40
5
10
15
20
25
30
35
40
MaleFemale
Clients used in derivatives
No
of
Re
spo
nd
en
ts
TABLE 3.1.23
Table showing client’s opinion about risk management
S.No Respondents Total1 Very good 92 Good 353 Neither good or bad 144 Bad 15 Very Bad 1Total 60
(Source of primary data)
INTERPERTATION:
From The above table shows that 35 no of the respondents are feel about good, risk management
and 1 no of respondents feel about very bad, take risk management. This shows that majority of the
respondents risk management is good saying.
CHART 3.1.24
Chart showing client’s opinion about risk management
9
35
14 1 1
Clients opinion for risk management in deriva-tives
Very good Good Neither good or badBad Very Bad
TABLE 3.1.24
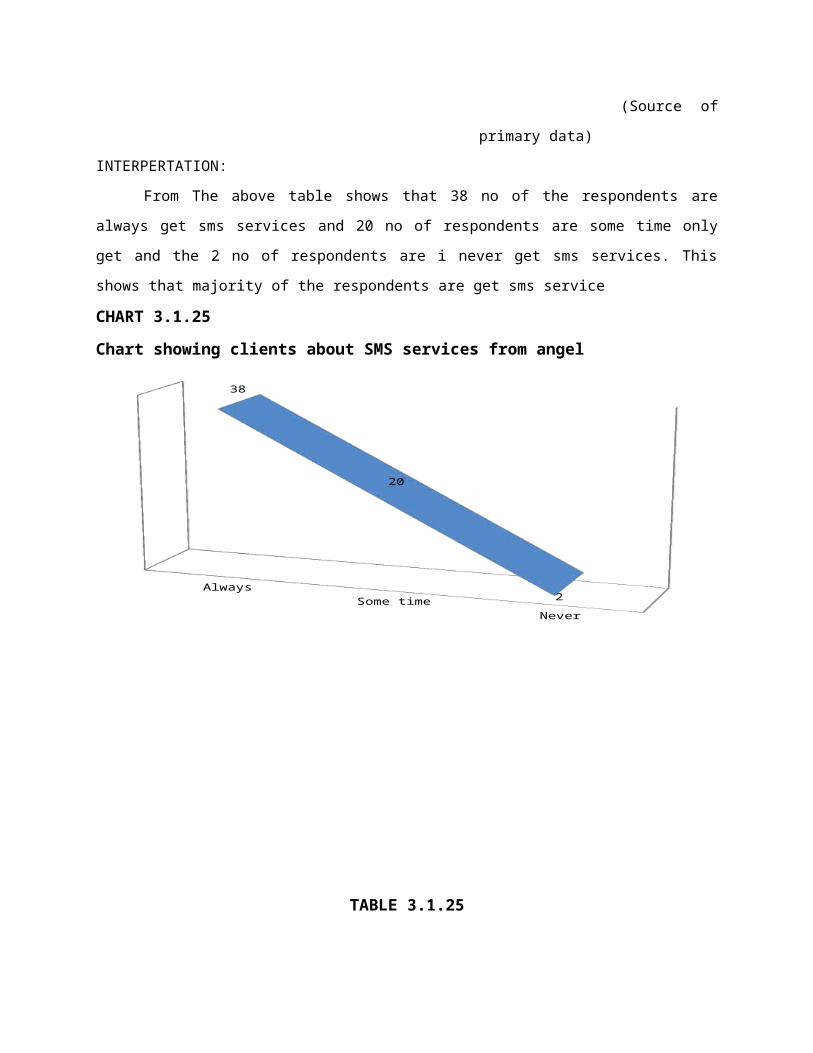
Table showing clients about SMS services from angel
S.No Respondents Total1 Always 382 Some time 203 Never 2Total 60
(Source of primary data)
INTERPERTATION:
From The above table shows that 38 no of the respondents are always get sms services and 20 no
of respondents are some time only get and the 2 no of respondents are i never get sms services. This
shows that majority of the respondents are get sms service
CHART 3.1.25
Chart showing clients about SMS services from angel
AlwaysSome time
Never
38
20
2
TABLE 3.1.25
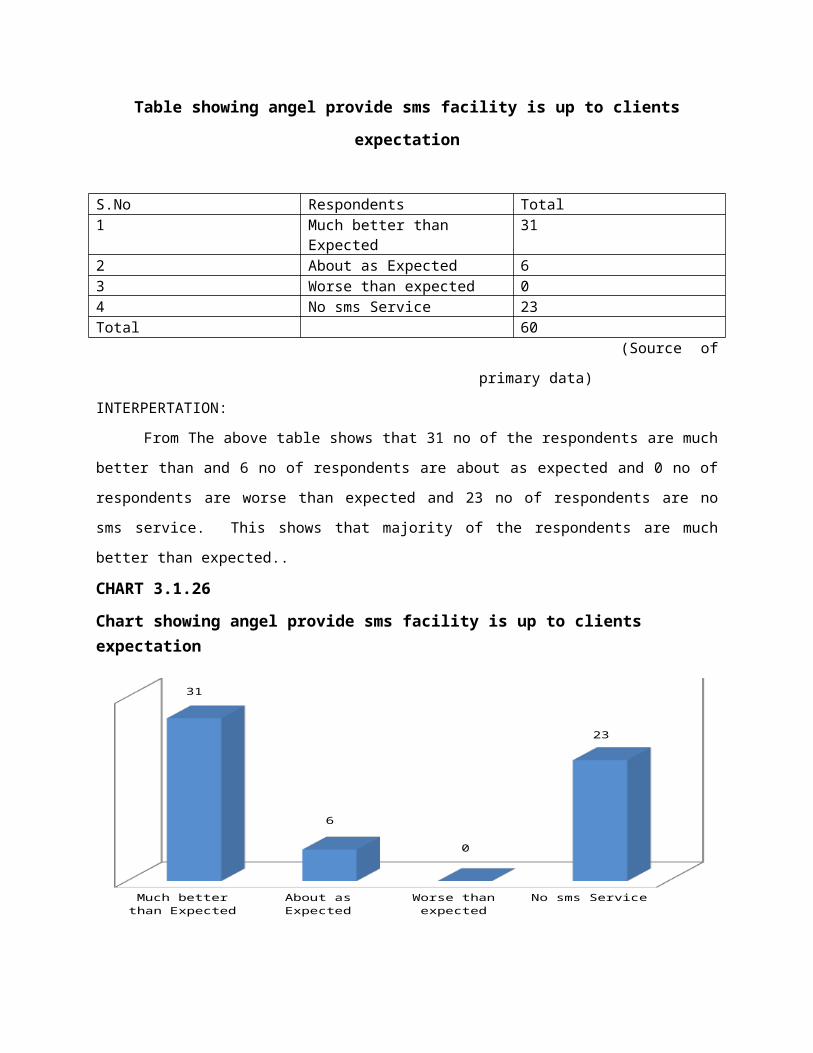
Table showing angel provide sms facility is up to clients expectation
S.No Respondents Total1 Much better than Expected 312 About as Expected 63 Worse than expected 04 No sms Service 23Total 60
(Source of primary data)
INTERPERTATION:
From The above table shows that 31 no of the respondents are much better than and 6 no of
respondents are about as expected and 0 no of respondents are worse than expected and 23 no of
respondents are no sms service. This shows that majority of the respondents are much better than
expected..
CHART 3.1.26
Chart showing angel provide sms facility is up to clients expectation
Much better than Expected
About as Expected Worse than expected No sms Service
31
6
0
23
TABLE 3.1.26
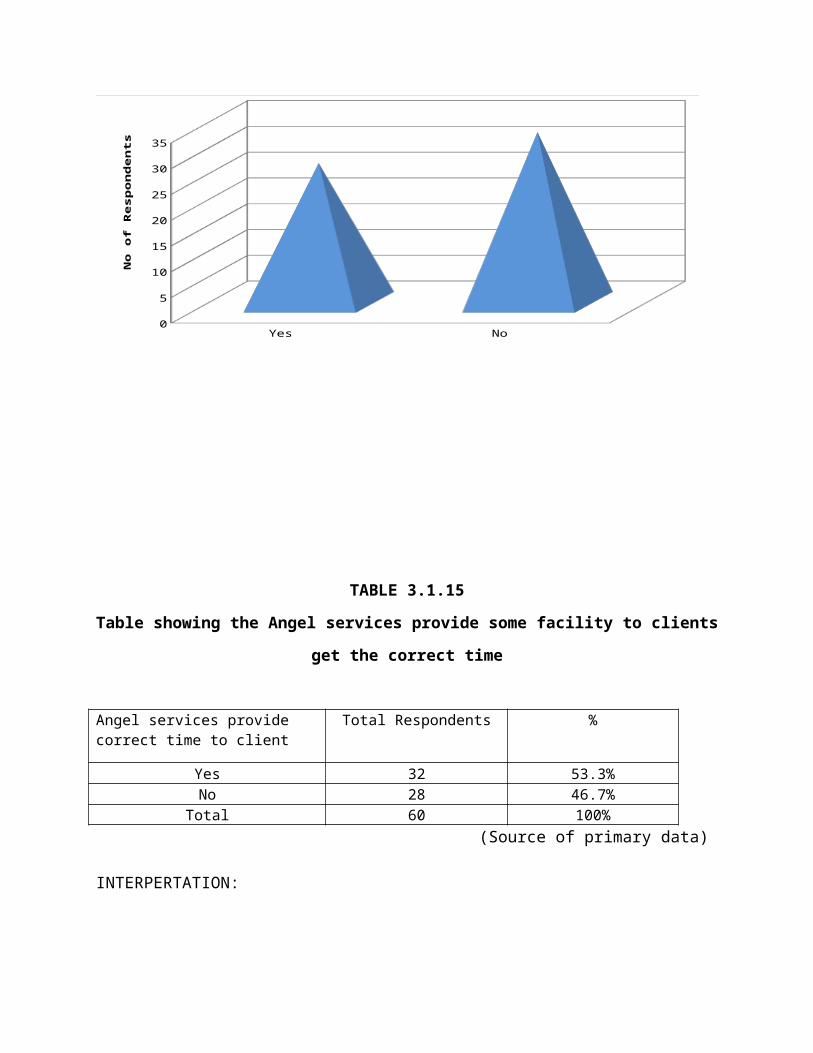
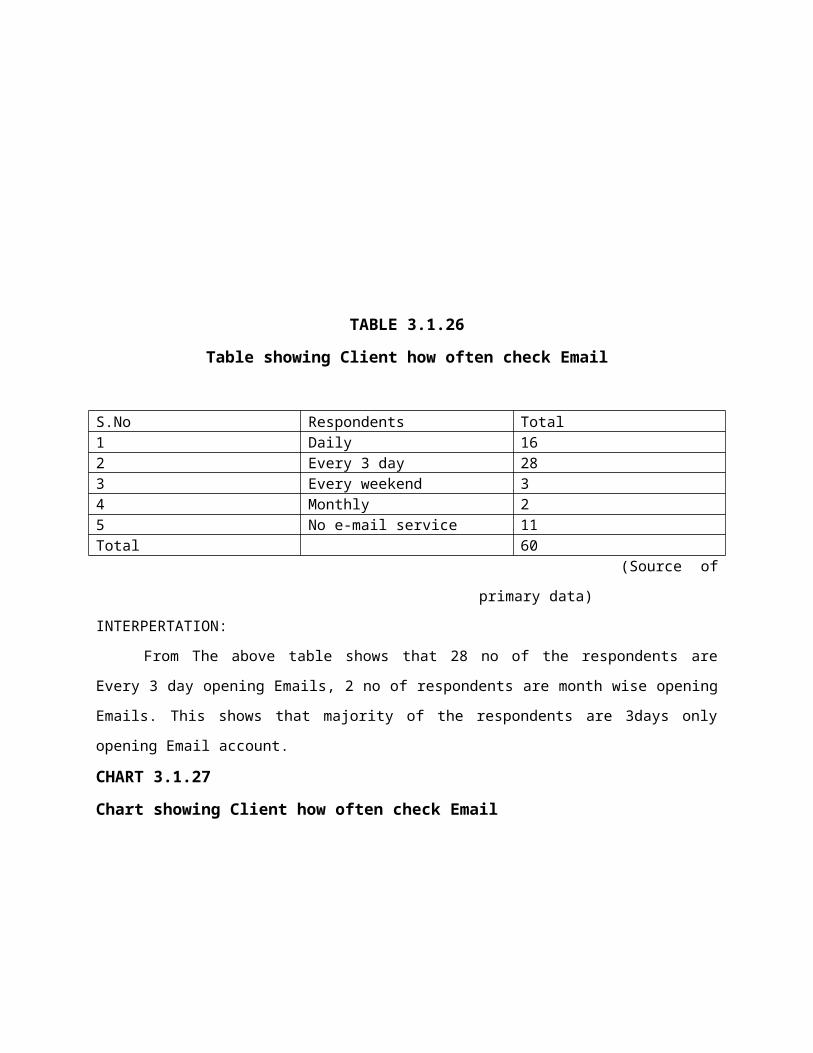
Table showing Client how often check Email
S.No Respondents Total1 Daily 162 Every 3 day 283 Every weekend 34 Monthly 25 No e-mail service 11Total 60
(Source of primary data)
INTERPERTATION:
From The above table shows that 28 no of the respondents are Every 3 day opening Emails, 2 no
of respondents are month wise opening Emails. This shows that majority of the respondents are 3days
only opening Email account.
CHART 3.1.27
Chart showing Client how often check Email
Daily Every 3 day Every weekend Monthly No e-mail service
16
28
32
11
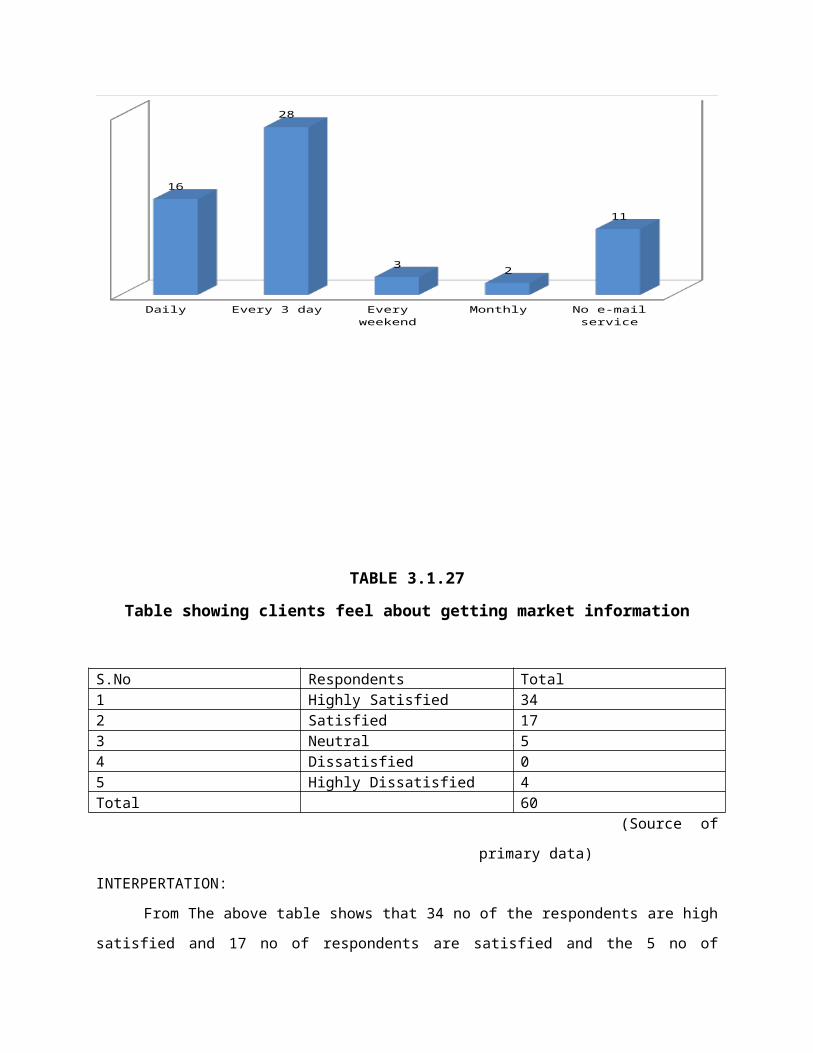
TABLE 3.1.27
Table showing clients feel about getting market information
S.No Respondents Total1 Highly Satisfied 342 Satisfied 173 Neutral 54 Dissatisfied 05 Highly Dissatisfied 4Total 60
(Source of primary data)
INTERPERTATION:
From The above table shows that 34 no of the respondents are high satisfied and 17 no of
respondents are satisfied and the 5 no of respondents are neutral and 0 no of respondents are dissatisfied
and 4 no of respondents are highly dissatisfied. This shows that majority of the respondents are highly
satisfied.
CHART 3.1.28
Chart showing clients feel about getting market information
3417
54
Highly Satisfied Satisfied Neutral Dissatisfied Highly Dissatisfied
TABLE 3.1.28
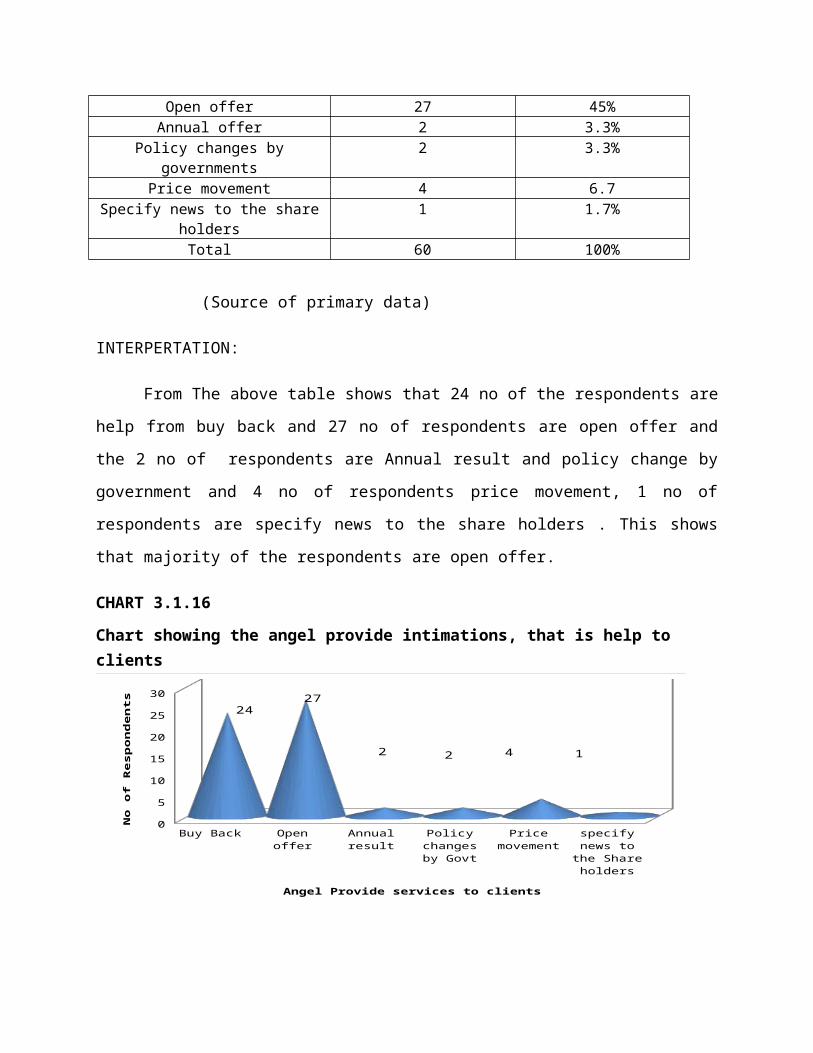
Table showing internet trading service
S.NO Respondents Yes No Total1 Male 13 24 372 Female 8 15 23Total 21 39 60
(Source of primary data)
INTERPERTATION:
From The above table shows that 21 no of the respondents are internet service easy say yes and
39 no of respondents are saying not easy. This shows that majority of the respondents are internet trading
difficult.
CHART 3.1.29
Chart showing internet trading service
1 20
5
10
15
20
25
30
35
40
FemaleMale
Clients Feel about Internet Trading Easy? yes or No
No
of
Re
spo
nd
en
ts
13
8
24
15
TABLE 3.1.29
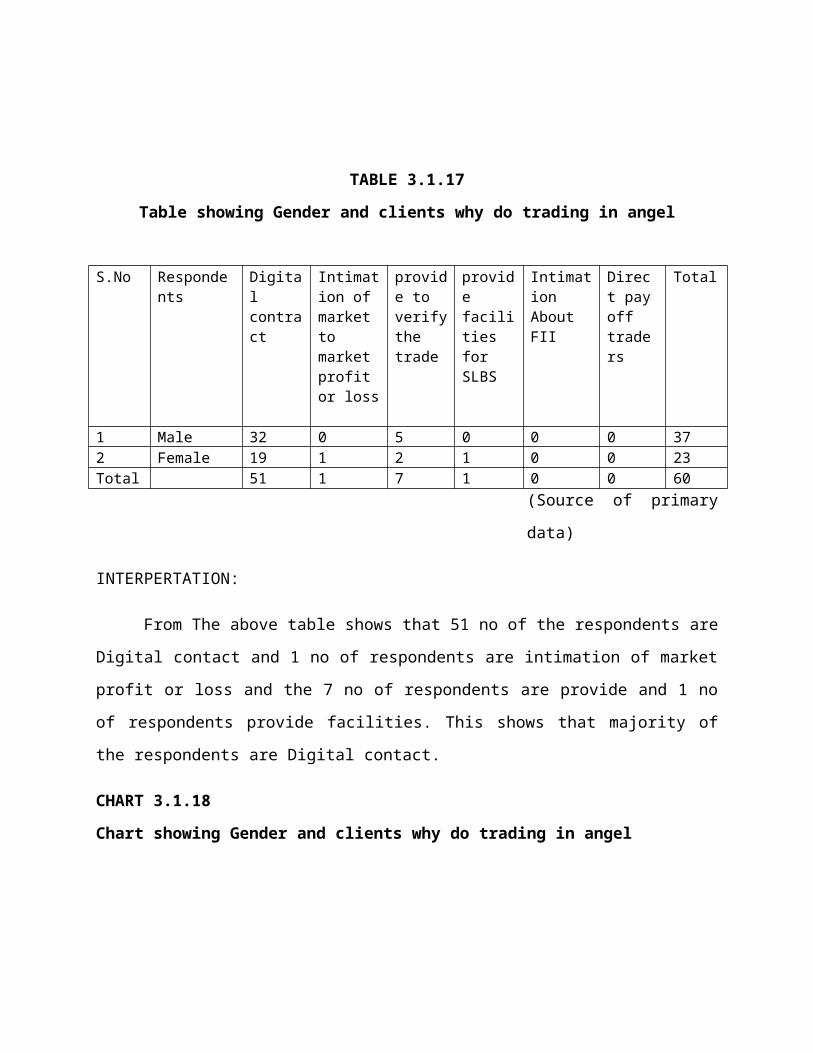
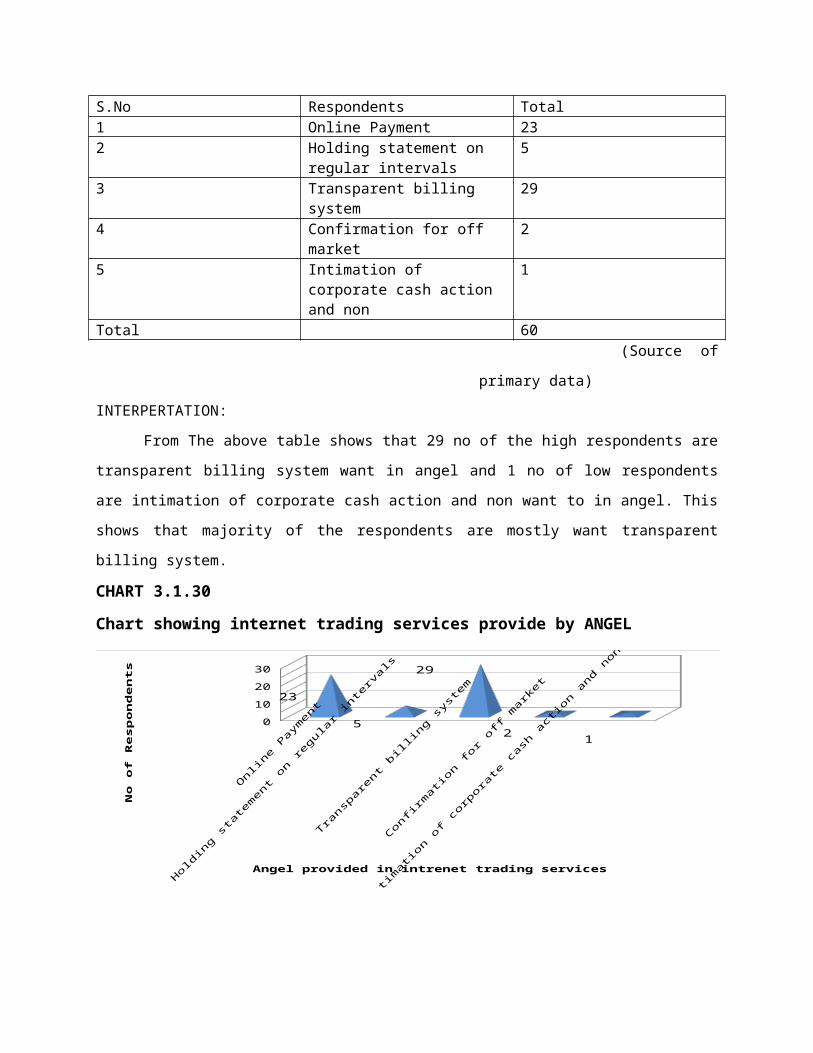
Table showing internet trading services provide by ANGEL
S.No Respondents Total1 Online Payment 232 Holding statement on regular
intervals 5
3 Transparent billing system 294 Confirmation for off market 25 Intimation of corporate cash
action and non1
Total 60 (Source of primary data)
INTERPERTATION:
From The above table shows that 29 no of the high respondents are transparent billing system
want in angel and 1 no of low respondents are intimation of corporate cash action and non want to in
angel. This shows that majority of the respondents are mostly want transparent billing system.
CHART 3.1.30
Chart showing internet trading services provide by ANGEL
Onlin
e Pay
men
t
Hold
ing
stat
emen
t on r
egula
r in
terv
als
Tran
spar
ent b
illin
g sy
stem
Confirmati
on for off
mar
ket
Intim
ation o
f corp
orate
cas
h acti
on and n
on
05
1015202530
Angel provided in intrenet trading services
No
of
Re
spo
nd
en
ts 23
5
29
21
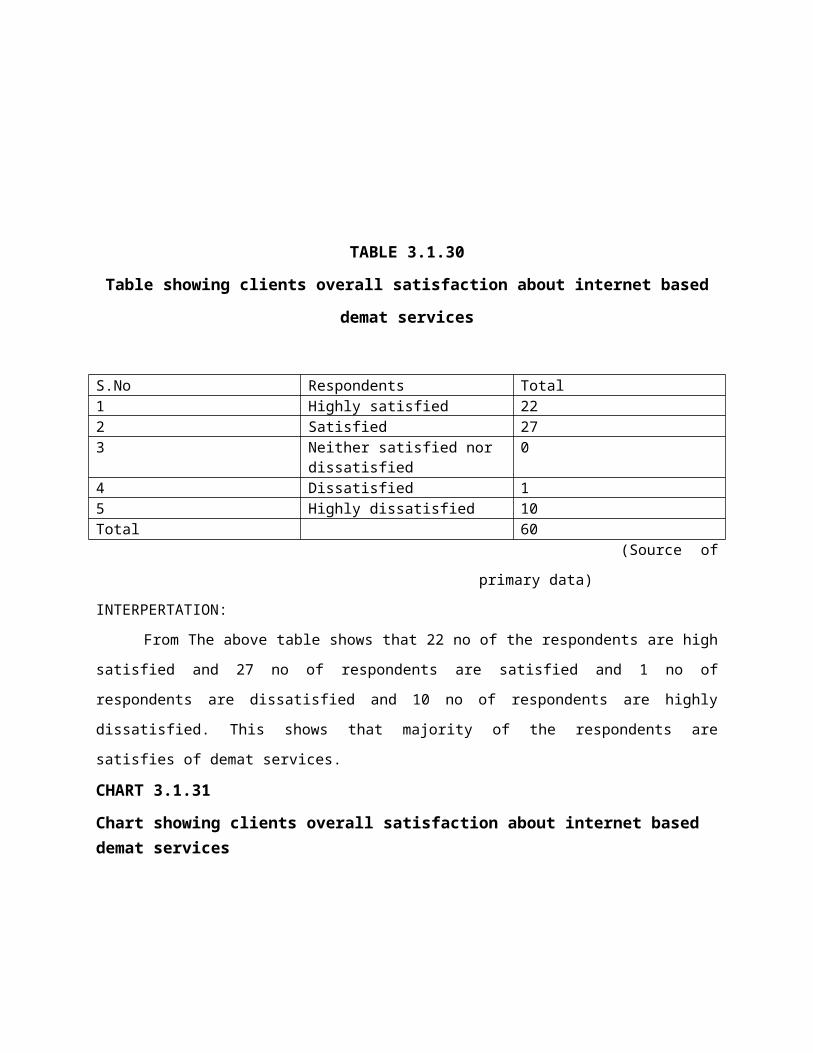
TABLE 3.1.30
Table showing clients overall satisfaction about internet based demat services
S.No Respondents Total1 Highly satisfied 222 Satisfied 273 Neither satisfied nor dissatisfied 04 Dissatisfied 15 Highly dissatisfied 10Total 60
(Source of primary data)
INTERPERTATION:
From The above table shows that 22 no of the respondents are high satisfied and 27 no of
respondents are satisfied and 1 no of respondents are dissatisfied and 10 no of respondents are highly
dissatisfied. This shows that majority of the respondents are satisfies of demat services.
CHART 3.1.31
Chart showing clients overall satisfaction about internet based demat services
Highly
satisfi
ed
Satisfi
ed
Neith
er sa
tisfied
nor d
issati
sfied
Dissati
sfied
Highly
diss
atisfi
ed0
5
10
15
20
25
30
Demat Services
No
of
Re
spo
nd
en
ts
22
27
01
10
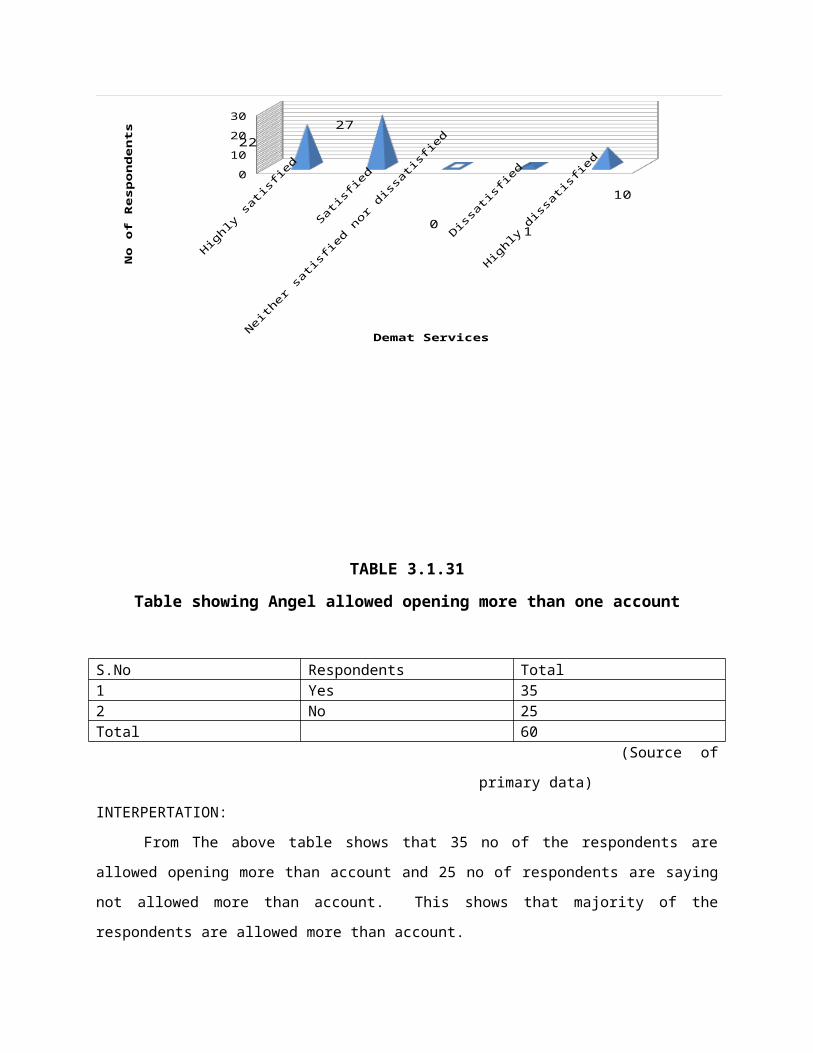
TABLE 3.1.31
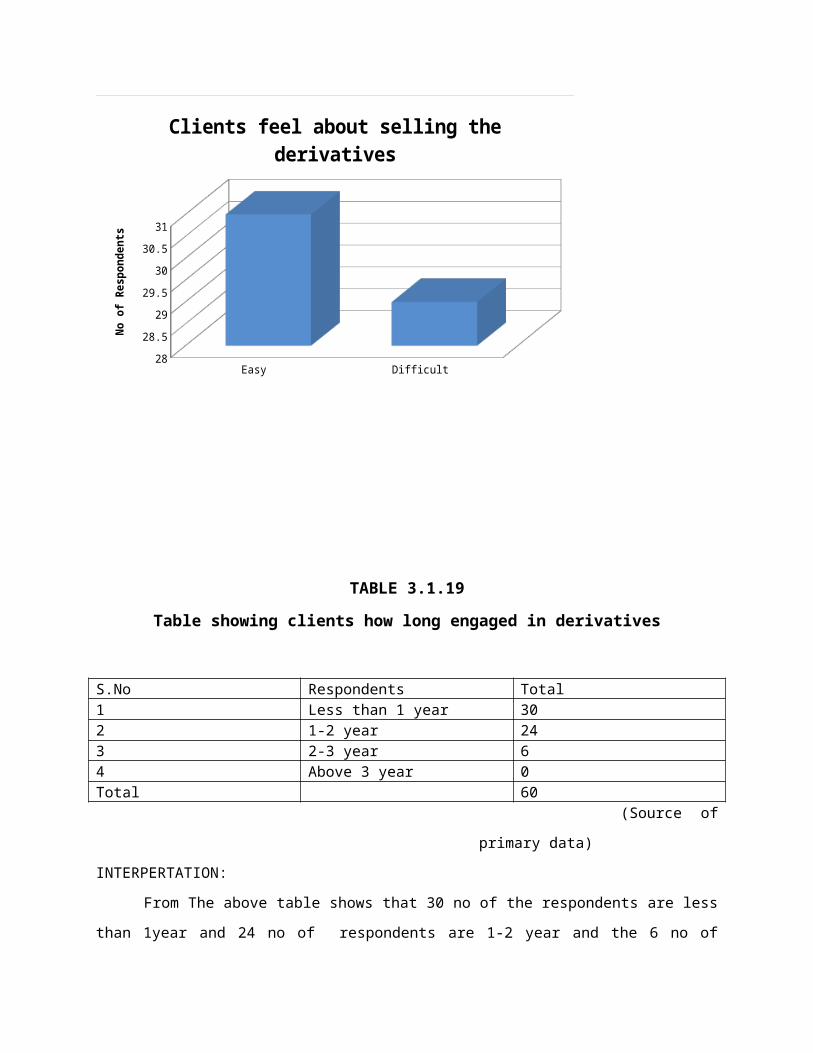
Table showing Angel allowed opening more than one account
S.No Respondents Total1 Yes 352 No 25Total 60
(Source of primary data)
INTERPERTATION:
From The above table shows that 35 no of the respondents are allowed opening more than
account and 25 no of respondents are saying not allowed more than account. This shows that majority of
the respondents are allowed more than account.
CHART 3.1.32
Chart showing Angel allowed opening more than one account
Yes35
No25
Angel Allowed to clients more than one account
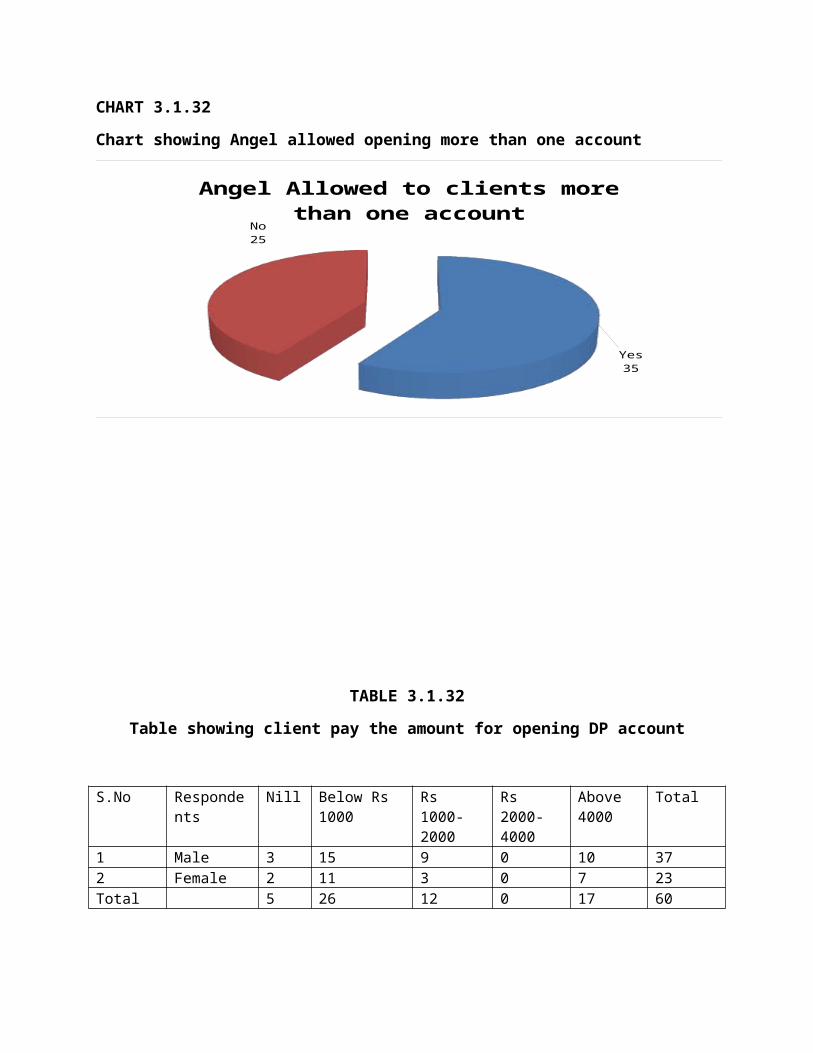
TABLE 3.1.32
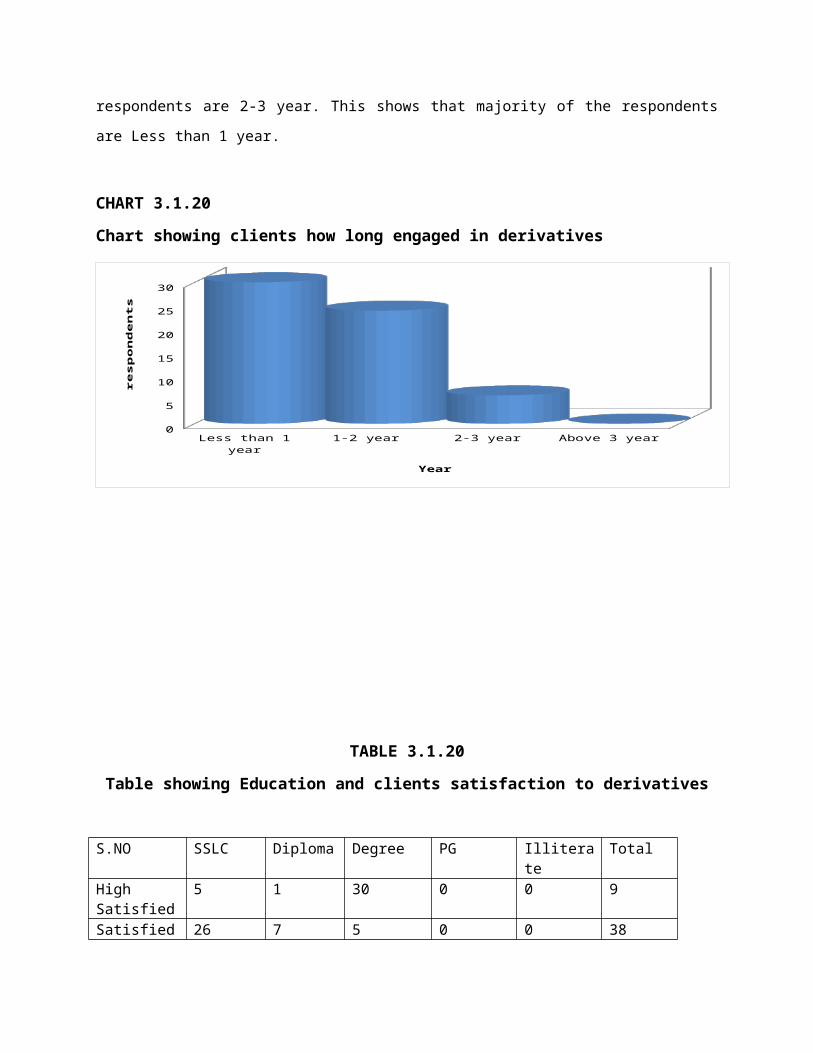
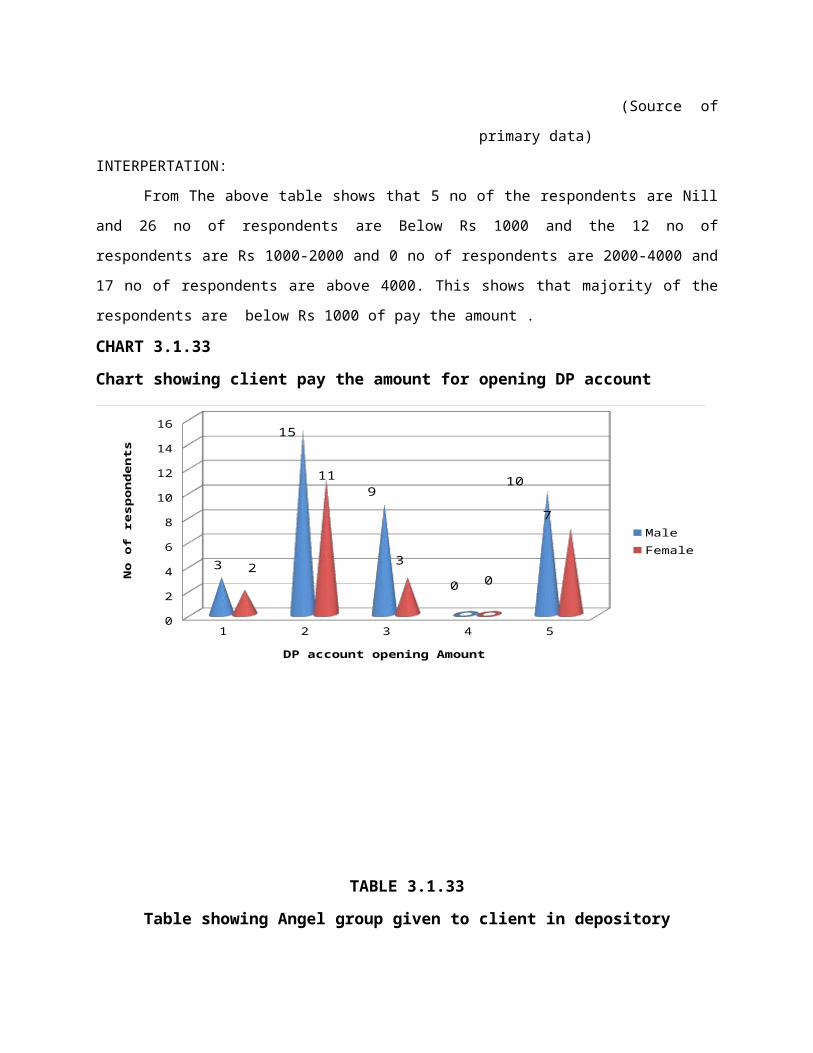
Table showing client pay the amount for opening DP account
S.No Respondents Nill Below Rs 1000 Rs 1000-2000
Rs 2000-4000
Above 4000
Total
1 Male 3 15 9 0 10 372 Female 2 11 3 0 7 23Total 5 26 12 0 17 60
(Source of primary data)
INTERPERTATION:
From The above table shows that 5 no of the respondents are Nill and 26 no of respondents are
Below Rs 1000 and the 12 no of respondents are Rs 1000-2000 and 0 no of respondents are 2000-4000
and 17 no of respondents are above 4000. This shows that majority of the respondents are below Rs 1000
of pay the amount .
CHART 3.1.33
Chart showing client pay the amount for opening DP account
1 2 3 4 50
2
4
6
8
10
12
14
16
MaleFemale
DP account opening Amount
No
of
resp
on
de
nts
3 2
15
119
3
0 0
10
7
TABLE 3.1.33
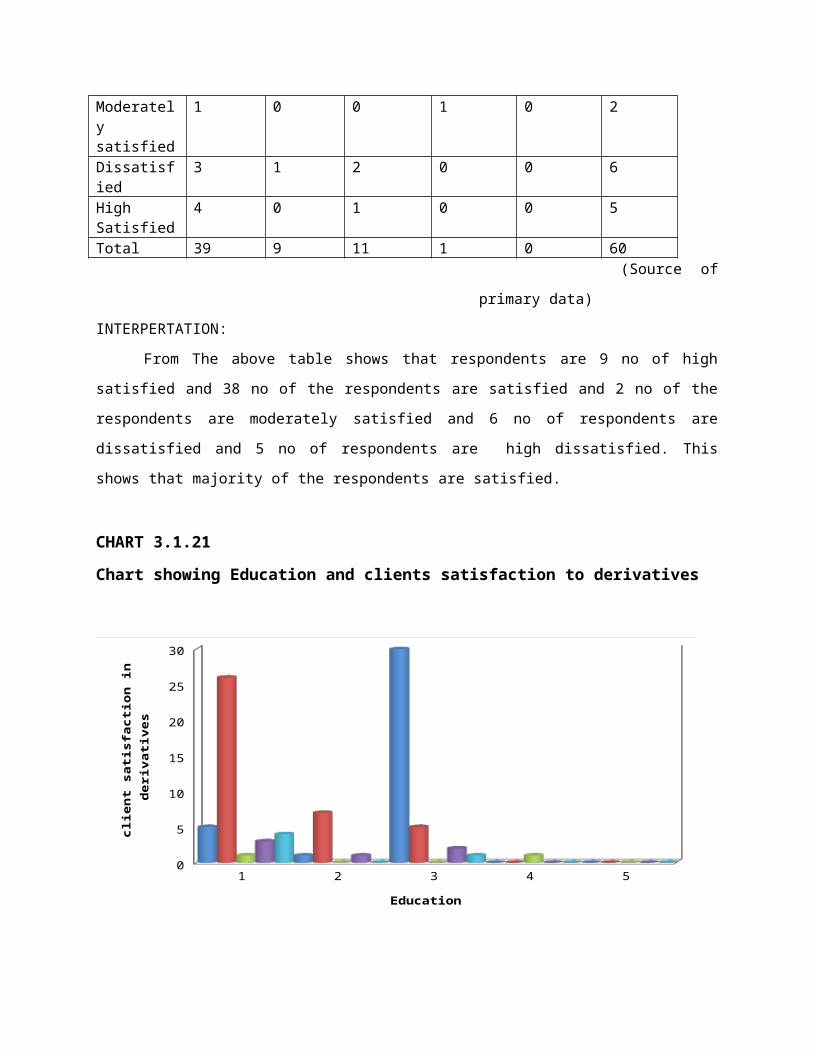
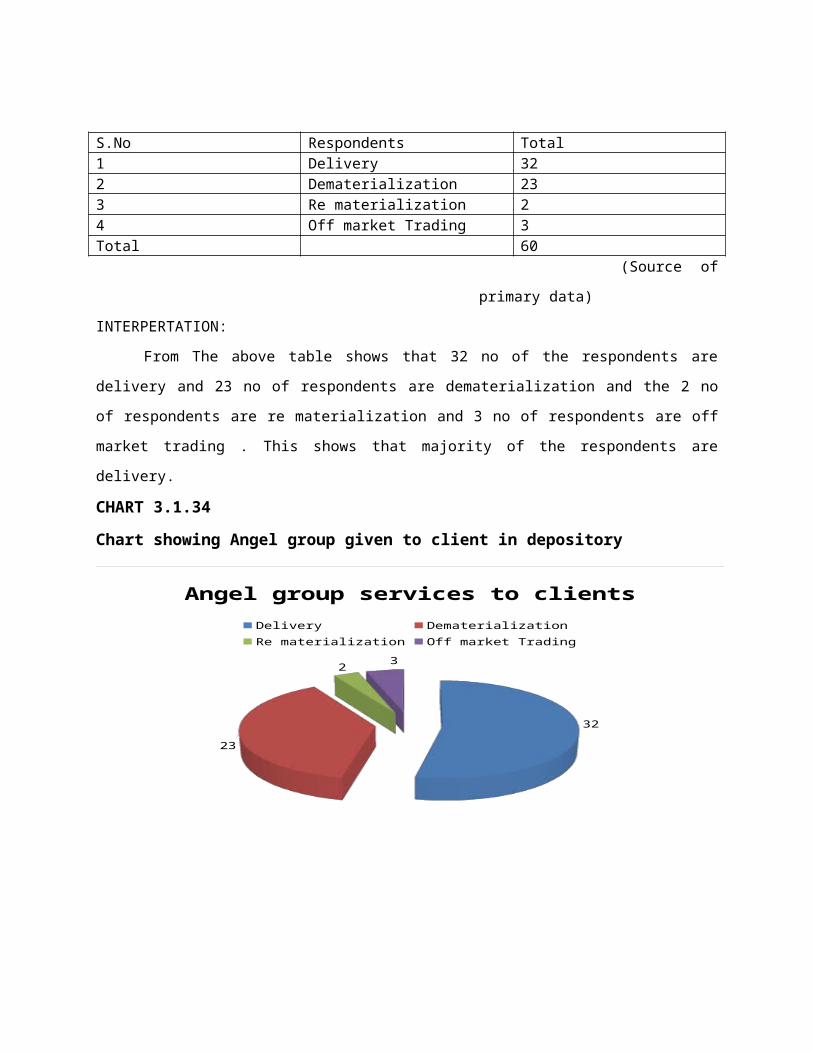
Table showing Angel group given to client in depository
S.No Respondents Total1 Delivery 322 Dematerialization 233 Re materialization 24 Off market Trading 3Total 60
(Source of primary data)
INTERPERTATION:
From The above table shows that 32 no of the respondents are delivery and 23 no of respondents
are dematerialization and the 2 no of respondents are re materialization and 3 no of respondents are off
market trading . This shows that majority of the respondents are delivery.
CHART 3.1.34
Chart showing Angel group given to client in depository
32
23
2 3
Angel group services to clientsDelivery Dematerialization Re materialization Off market Trading
TABLE 3.1.34
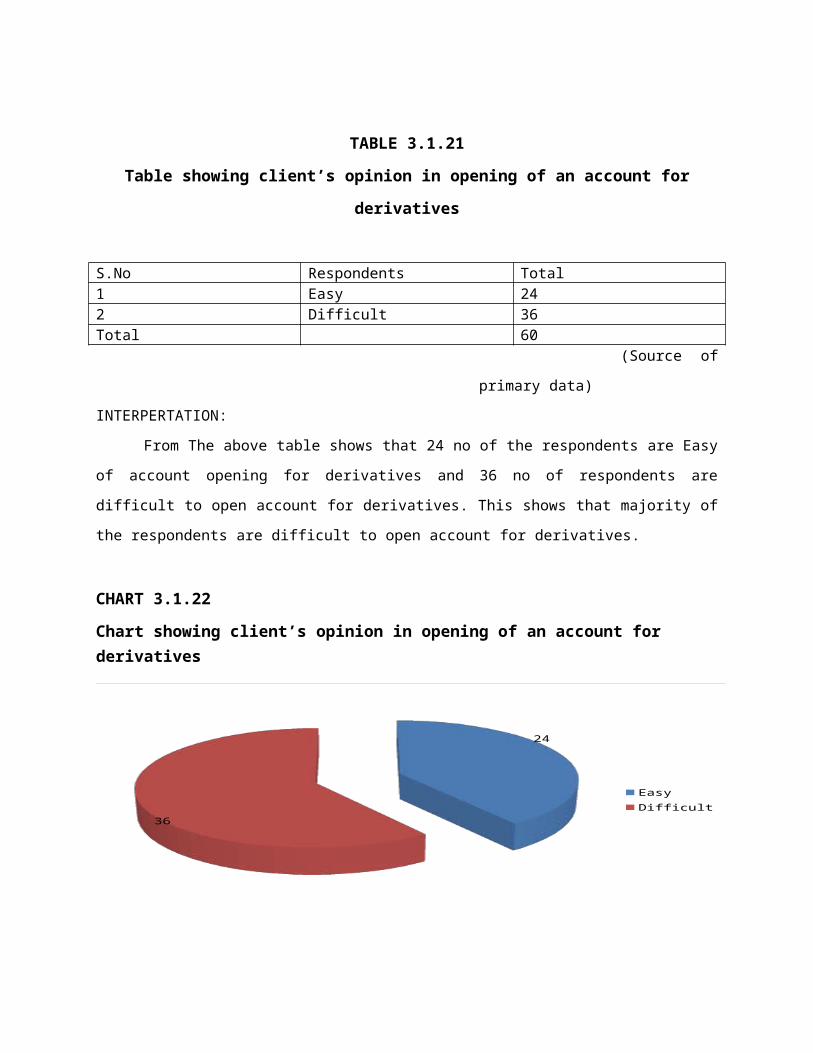
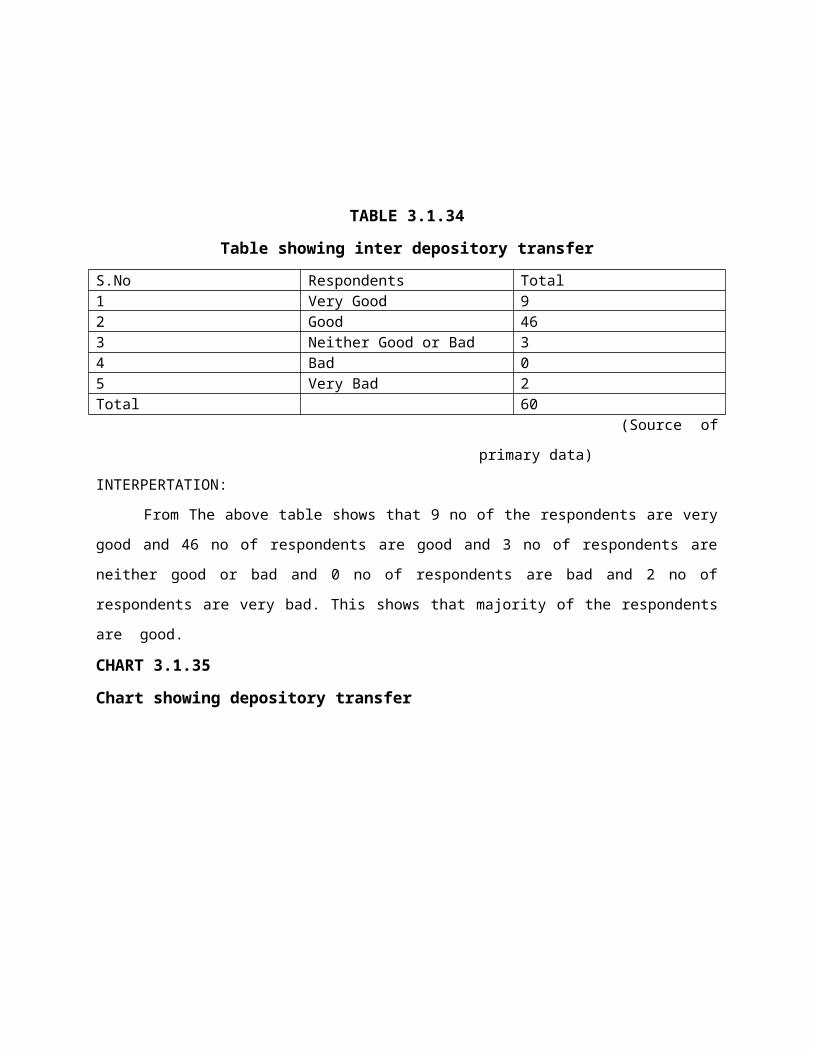
Table showing inter depository transfer
S.No Respondents Total1 Very Good 92 Good 463 Neither Good or Bad 34 Bad 05 Very Bad 2Total 60
(Source of primary data)
INTERPERTATION:
From The above table shows that 9 no of the respondents are very good and 46 no of respondents
are good and 3 no of respondents are neither good or bad and 0 no of respondents are bad and 2 no of
respondents are very bad. This shows that majority of the respondents are good.
CHART 3.1.35
Chart showing depository transfer
Very Good Good Neither Good or Bad
Bad Very Bad0
5
10
15
20
25
30
35
40
45
50
Clients opinion in inter depository of securities
No
of
Re
spo
nd
en
ts
9
46
3 0 2
TABLE 3.1.35
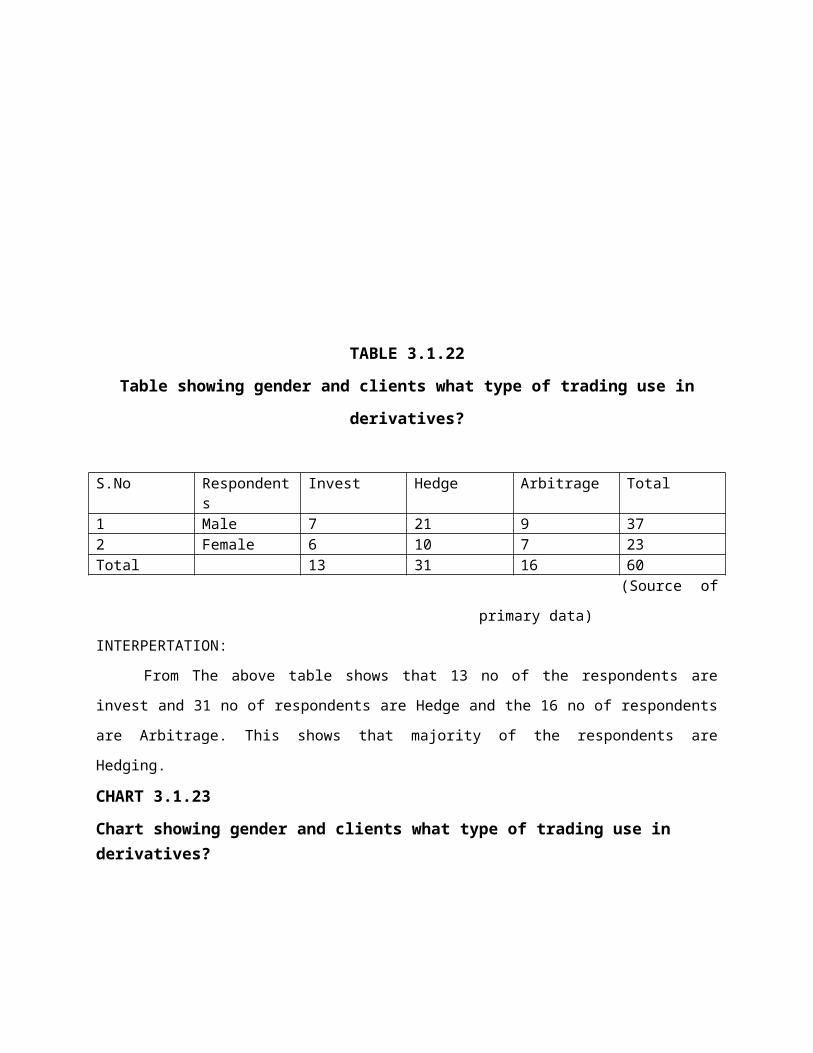
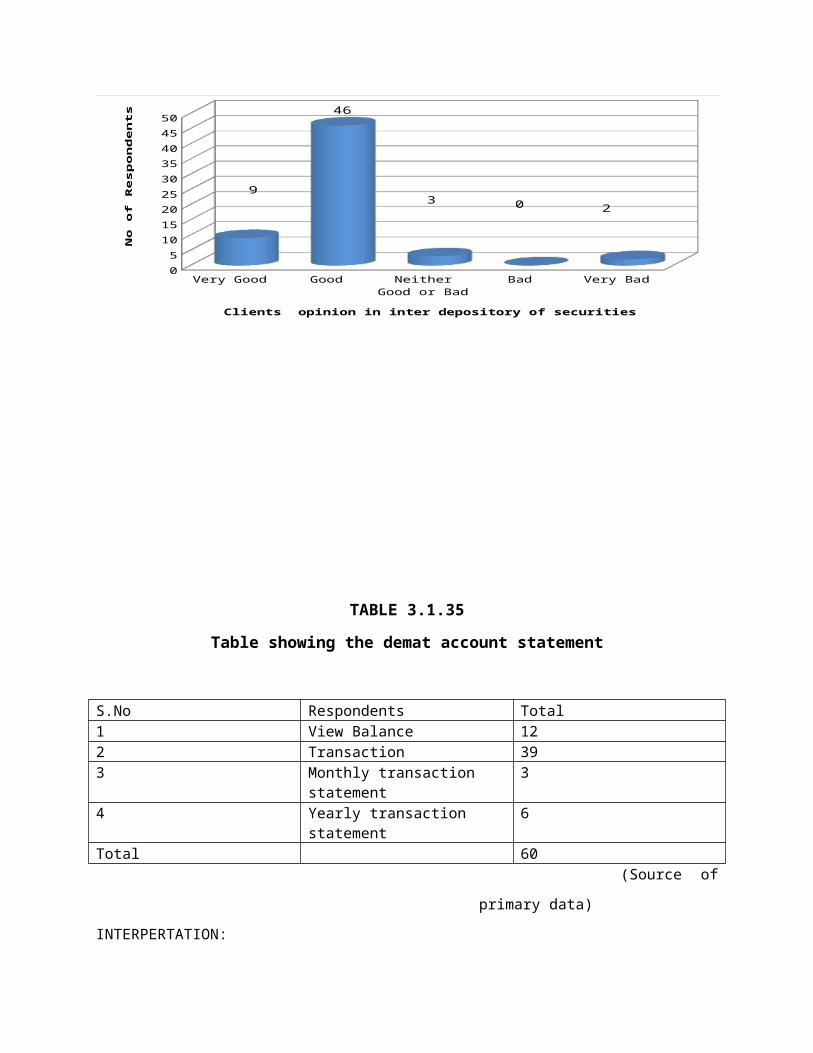
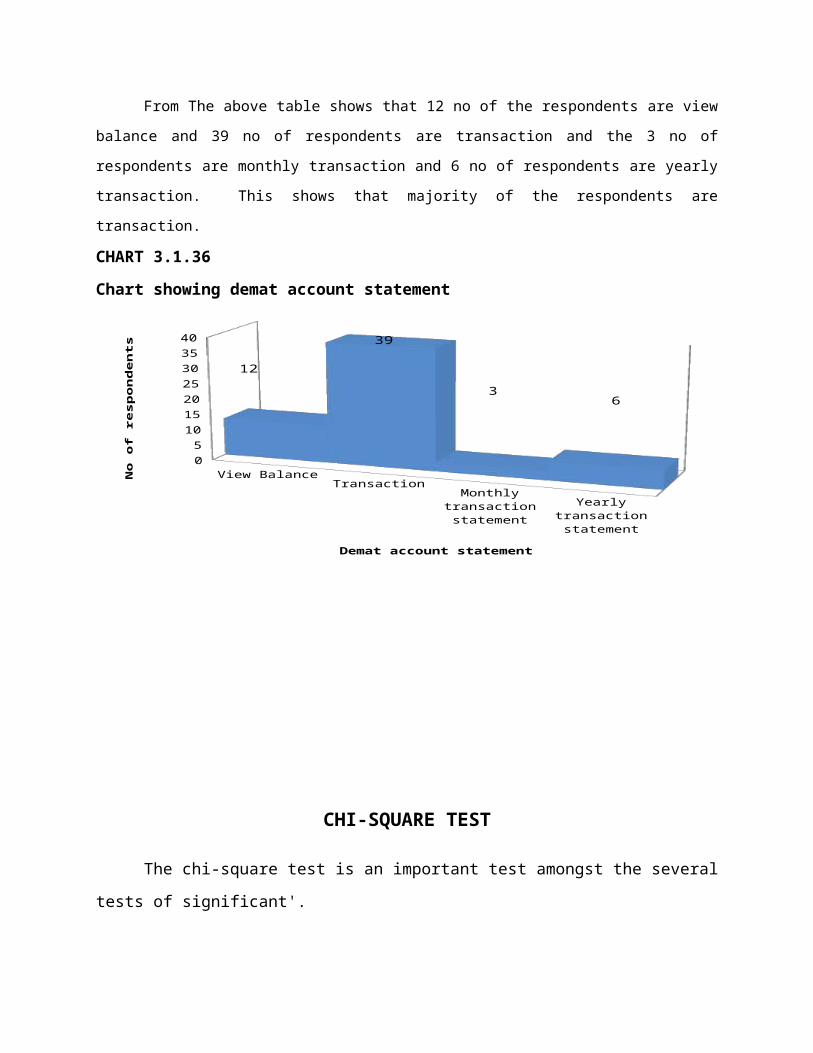
Table showing the demat account statement
S.No Respondents Total1 View Balance 122 Transaction 393 Monthly transaction statement 34 Yearly transaction statement 6Total 60
(Source of primary data)
INTERPERTATION:
From The above table shows that 12 no of the respondents are view balance and 39 no of
respondents are transaction and the 3 no of respondents are monthly transaction and 6 no of respondents
are yearly transaction. This shows that majority of the respondents are transaction.
CHART 3.1.36
Chart showing demat account statement
View
Bal
ance
Tran
sacti
on
Month
ly tr
ansa
ction st
atem
ent
Year
ly tr
ansa
ction st
atem
ent
05
10152025303540
Demat account statement
No
of
resp
on
de
nts 12
39
36
CHI-SQUARE TEST
The chi-square test is an important test amongst the several tests of significant'.
Chi-Square, symbolically written as 2 (Pronounced as Ki-Square), is a statistical
measure used in the context of sampling analysis for comparing a variance to a theoretical
variance.
It can also be used to make comparisons between theoretical populations and actual data
when categories are used. Thus, the chi-square test is applicable in large number of problems.
The tests is, in fact, a technique through the use of which it is possible for all researchers to (i)
test the goodness of fit; (ii) test the significant of association between two attributes, and (iii) test
the homogeneity or the significance of population variance.
2 =
ij
ijij
E
)EO( 2
where
Oij = Observed frequency of the cell in ith row and jth column.
Eij = Expected frequency of the cell in ith row and jth column.
TABLE 3.1.3
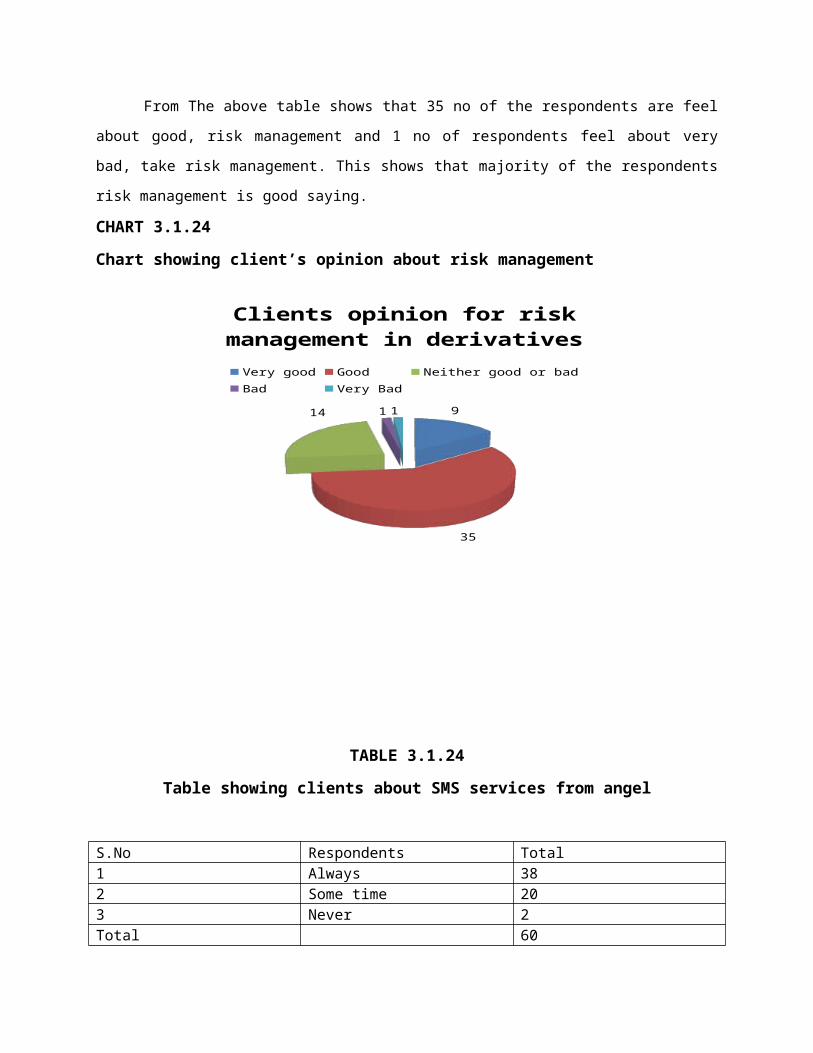
Table showing relationship between occupation and angel equities services level
Occupation
and Equities
service in
angel
Business Professional Retired Government
Employee
Private
Employee
Total
Online fund
transfer
12 28 1 0 11 52
Internet
trading
2 1 2 0 1 6
Online book
building
1 0 1 0 0 2
Other
specify
0 0 0 0 0 0
Total 15 29 4 0 12 60
Null Hypothesis (H0) : No Significant relationship between Occupation and
Angel provides Equities services.
Alternate Hypothesis (H1) : There is Close Significant relationship Occupation and
Angel provides Equities services.
2 =
ij
ijij
E
)EO( 2
where
Oij = Observed frequency of the cell in ith row and jth column.
Eij = Expected frequency of the cell in ith row and jth column.
Oi Ei (Oi-Ei) (Oi-Ei)² (Oi-Ei)²
Ei
12 13 -1 1 0.0769
28 25.13 2.87 8.2369 0.3278
1 3.47 -2.47 6.1009 1.7589
0 0 0 0 0
11 10.4 0.6 0.36 0.0346
2 1.5 0.5 0.25 0.1667
1 2.9 -1.9 3.61 1.2448
2 0.4 1.6 2.56 6.4
0 0 0 0 0
1 1.2 -0.2 0.04 0.0333
1 0.5 0.5 0.25 0.5
0 0.97 -0.97 0.9409 0.97
1 0.13 0.87 0.7569 5.8223
0 0 0 0 0
0 0.4 -0.4 0.16 0.4
0 0 0 0 0
0 0 0 0 0
0 0 0 0 0
0 0 0 0 0
0 0 0 0 0
17.7353
Chi x² = (r-1) (c-1)
= (5-1) (5-1)
= (4) (4)
= 16
FACTOR
CALCULATED
CHI-SQUARE
VALUE
TABLE
VALUE
DEGREE OF
FREEDOMREMARKS
Equities
service in
angel
17.7353 26.296 16 Not
Significant
It is noted from the above table that the calculated Chi-square value is less than the table value. So, there
is Close relationship between Occupation and Angel proved services in Equities.
TABLE 3.1.20
Table showing relationship between Education and client’s satisfaction to derivatives
Education
and Clients
satisfaction
with
derivatives
Hsc Diploma Degree PG Illiterates Total
Highly
Satisfaction
5 1 3 0 0 9
Satisfaction 26 7 5 0 0 38
Moderately
satisfied
1 0 0 1 0 2
Dissatisfied 3 1 2 0 0 6
Highly
Dissatisfied
4 0 1 0 0 5
Total 39 9 11 1 0 60
Null Hypothesis (H0) : No Significant relationship between Occupation and
Angel provides Equities services.
Alternate Hypothesis (H1) : There is Close Significant relationship Occupation and
Angel provides Equities services.
2 =
ij
ijij
E
)EO( 2
where
Oij = Observed frequency of the cell in ith row and jth column.
Eij = Expected frequency of the cell in ith row and jth column.
Oi Ei (Oi-Ei) (Oi-Ei)² (Oi-Ei)²
Ei
5 5.85 -0.85 0.7225 0.1235
1 1.35 -0.35 0.1225 0.0907
3 1.65 1.35 1.8225 1.1045
0 0.15 -0.15 0.0225 0.15
0 0 0 0 0
26 24.7 1.3 1.69 0.0684
7 5.7 1.3 1.69 0.2964
5 6.97 -1.97 3.8809 0.5568
0 0.631 -0.631 0.3969 0.63
0 0 0 0 0
1 1.3 -0.3 0.09 0.0692
0 0.3 -0.3 0.09 0.3
0 0.37 -0.37 0.1369 0.37
1 0.03 0.97 0.9409 31.36
0 0 0 0 0
3 3.9 -0.9 0.81 0.2077
1 0.9 0.1 0.1 0.0111
2 1.1 0.9 0.81 0.7364
0 0.1 -0.1 0.01 0.1
0 0 0 0 0
4 3.25 0.75 0.5625 0.1731
0 0.75 -0.75 0.5625 0.75
1 0.92 0.08 0.0064 0.0064
0 0.08 -0.08 0.0064 0.08
0 0 0 0 0
0 37.1847
Chi x² = (r-1) (c-1)
= (5-1) (5-1)
= (4) (4)
= 16
FACTOR
CALCULATED
CHI-SQUARE
VALUE
TABLE
VALUE
DEGREE OF
FREEDOMREMARKS
Client
Satisfied in
derivatives
37.1847 26.296 16 Significant
It is noted from the above table that the calculated Chi-square value is greater than the table value. So, there is Close relationship between Education and client satisfaction with derivatives.
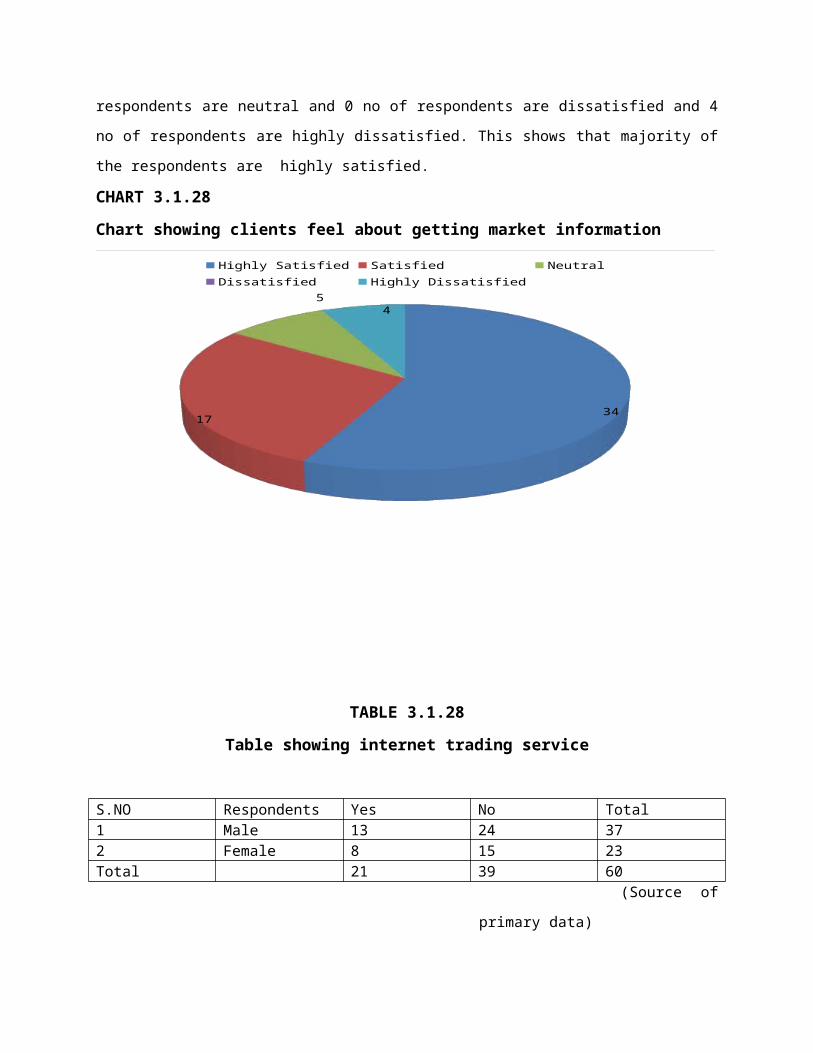
Table 3.2.1
Weighted average calculation of ANGEL in all the financial services cost
Types of
cost/Fees
Very
High
5
High
4
Medium
3
Low
2
Very
low
1
Weighted
average
total
Weighted
average
Rank
Dematerialization
Charge
14 10 18 12 6 194 3.23 8
Rematerialization
Charge
16 22 16 5 1 227 3.78 1
Custody Charge 12 19 25 0 4 215 3.58 4
Transfer fees 19 13 17 8 3 217 3.61 3
Transfer fee
intraday
11 24 19 4 2 218 3.63 2
DP Account and
closing charge
17 8 28 7 0 215 3.58 4
Annual
maintenance fees
10 26 15 6 3 214 3.57 6
Other specify 14 11 31 3 1 214 3.57 6
INTERPRETATION:
From the above table it is inferred that, the respondents are selecting the services based
on 1st rank is Re materialization, and 2nd Transfer fee intraday, 3rd Transfer fees, 4th Custody
charge and Dp account and closing charge, and 6th Annual maintenance fees and 8th
Dematerialization. Majority of the respondents are selected based on Rematerialization only.
TABLE 3.1.22
Table showing relationship between Gender and mostly trading in derivatives
Mostly trade in
derivatives and
Gender
Invest Hedge Arbitrage Total
Male 7 21 9 37
Female 6 10 7 23
Total 13 31 16 60
Null Hypothesis (H0) : No Significant relationship between Occupation and
Angel provides Equities services.
Alternate Hypothesis (H1) : There is Close Significant relationship Occupation and
Angel provides Equities services.
2 =
ij
ijij
E
)EO( 2
where
Oij = Observed frequency of the cell in ith row and jth column.
Eij = Expected frequency of the cell in ith row and jth column.
Oi Ei (Oi-Ei) (Oi-Ei)² (Oi-Ei)²
Ei
7 8.02 -1.02 1.0404 0.1297
21 19.12 1.88 3.5344 0.1849
9 9.87 -0.87 0.7569 0.0767
6 4.98 1.02 1.0404 0.2089
10 11.88 -1.88 3.5344 0.29754
7 6.13 0.87 0.7569 0.1235
0 1.0212
Chi x² = (r-1) (c-1)
= (3-1) (3-1)
= (2) (2)
= 4
FACTOR
CALCULATED
CHI-SQUARE
VALUE
TABLE
VALUE
DEGREE OF
FREEDOMREMARKS
Client
Satisfied in
derivatives
1.0212 9.488 9 Not
Significant
It is noted from the above table that the calculated Chi-square value is less than the table value. So, there is Close relationship between Gender and client mostly trade in derivatives.
CHAPTER 4
FINDINGS, SUGGESTIONS AND CONCLUSION
4.1 FINDINGS:
It has been found that table shows that 0-20 age 0 no of the respondents are under the age
group 20-40 32 no of the respondents are under the age group 40-60, 26 no of the
respondents are under the age group above 60, 2 no of the respondents of members. This
shows that Majority of the respondents are under the age group 20- 40 no of respondents
32 Members.
It has been that table shows that 14 no of the respondents are salary and 38 no of the
respondents coming house property and 4 no of the respondents are capital market
investment and 3 no of the respondents are coming under commodity market investment
and 1 no of the respondents are coming under capital gain. This shows that majority of
the respondents are coming under the house property.
It has been that table shows that 20 no of respondents are investing the less than 1 year, and 36
no of the respondents are 1-3 year, and 3 no of the respondents are 3-5 years, and 1 no of the
respondents are above 5 years. It was found that majority of the respondents are 1-3 year.
It has been that shows that 39 of the respondents are myself buy or sell securities and 21
no of respondent are brokers buy or sell the securities. This shows that majority of the
respondent are like myself trading.
It has been that table shows that respondents are 9 no of high satisfied and 38 no of the
respondents are satisfied and 2 no of the respondents are moderately satisfied and 6 no of
respondents are dissatisfied and 5 no of respondents are high dissatisfied. This shows that
majority of the respondents are satisfied.
It has been that table shows that 20 no of respondents are investing the less than 1 year, and 36
no of the respondents are 1-3 year, and 3 no of the respondents are 3-5 years, and 1 no of the
respondents are above 5 years. It was found that majority of the respondents are 1-3 year .
It has been that table shows that 35 no of the respondents are allowed opening more than account
and 25 no of respondents are saying not allowed more than account. This shows that majority of
the respondents are allowed more than account.
4.2. SUGGESTIONS:
Based on this analysis it is noticed that educated people prefer in investment
compared to uneducated people. So angel should concentrate more on uneducated
people.
Based on this analysis angel should give more attention to female investors to
improve the target compared to male investors.
Angel should be mostly covered the all age group of respondents. So it is better one.
Based on this analysis it is noticed that many investors is not seeking the Emails. So
angel should concentrate Email services.
Based on this analysis it is noticed that many investors is not get sms services. So
angel should concentrate in sms services to clients.
Angel should be mostly investors doing self trading. So it better one.
Based on this analysis it is noticed that many investors like Rematerialization. So
angel should concentrate more to Rematerialization.
4.3 CONCLUSION
Investor’s perceptions in securities vary from one person to another. While some investors
are risk averse while some are risk lovers.
The study conducted has helped the researcher to understand why investors prefer angel
securities compare to other broking house in the country and has helped to identify the
satisfaction level of the customers and also to identify the factors influenced customer preference
towards angel securities.
angel security has a good name and reputation in the market and also regarded as the
leading stock broking firm in the country. If the continues to improve itself according to
changing market conditions, and then it can certainly make more investors prefer it to the rest of
the broking houses in the country.
APPENTIX
QUESTIONNAIRE
“Client Perception about the value added services provided byANGEL BROKING SERVICES IN ERODE”
PERSONAL DETAILS……
1. Name………………………………………..2. Sex :
a) Male b) Female 3. Age………………..4. Educational Qualification:
a) Primary education b) Secondary education c) Higher secondary education d) Diploma e) Degree f) PG g) Illiterates
5. Occupation: a) Business b) Professional c) Retired d) Government employeee) Private employee
6. You fall in the annual income group:a) Less than Rs 1,00,000 b) Rs 1,00,000-2,00,000 c) Rs 2,00,000-3,00,000d) Greater than Rs 3, 00,000
7. What are the revenues of income per month?a) Salary b) House property c) Capital market investment d) Commodity market investment e) Capital gain f) Other specify………..
8. Your investment decision is influenced bya) Yourself b) Friends or relatives c) Agent or brokers d) Advertisements
9. No of dependents in your family……………… (specify the numbers)a) Elders ……. b) Younger’s……… c) Kids……….
10. What are the services you are availed from Angel?a) Trading in equities b) Derivatives trading c) Commodities trading d) Depository services e) Internet trading f) Portfolio management g) Mutual fund investment h) Currency derivatives
11. How long you have been investing or trading?a) Less than 1year b) 1-3 year c) 3-5 year d) More than 5year
12. What are the factors influenced you to select ANGEL?a) Very near to your home b) Nearer to office c) Good services d) Reliability e) Brand image f) Friends reference g) Less charges h) Other specify
13. What is the amount of investment per month Rs………………….14. How many days do you hold the securities………………..days/month/years
15. Who will quote the buying and selling price of securities/commodities…………..16. How much you can invest in derivatives market Rs………….and specify some of your
Desirable securities and commodities you invested already……………………..
TRADING IN EQUITIES:
17. Which way ANGEL informed to you buy or sell products at right time?a) Sms b) E-mail c) Brouchers d) Newsletters e) Website
18. Do you feel about trading in equities are easy?a) Yes b) No
19. ANGEL provide some value added services in equities, do you get the correct time?a) Yes b) No
20. ANGEL provide following intimations, which one is more helpful for you?a) Buy back b) Open offer c) Annual result d) Policy changes by governments e) Price movement f) Specify news to the share holders
21. Which services you most prefer in equities provide by ANGEL?a) Online fund transfer b) Internet trading c) Online book building d) Others specify…………………..
DERICATIVES:22. Why do you prefer trading in ANGEL?
a) Digital contract b) Intimation of market to market profit or loss c) Provide to verify the trade d) Provide facilities for SLBS e) Intimation about FII f) Direct pay off traders
23. Do you feel easy for selling derivatives?a) Easy b) Difficult
24. How long are you engaged in derivatives process?a) Less than 1 year b)1-2 years c) 2-3 years d) Above 3 years
25. Give your satisfaction level with derivatives contract settlement?a) Highly satisfied b) Satisfied c) Moderately satisfied d) Dissatisfied e) highly dissatisfied
26. How do you feel in opening of an account for derivatives?a) Easy b) Difficult
27. What is the type of trading you mostly prefer to use in derivatives?a) Invest b) Hedge c) Arbitrage
28. Give your opinion about risk management capacity in derivatives?a) Very good b) Good c) Neither good or bad d) Bad e) Very bad
INTERNET TRADING IN EQUITIES, DERIVATIVES AND COMMODITIES
29. Do you receive sms alert periodically about your demat account holding?a) Always b) Some time c) Never
30. Did sms facility provided by ANGEL, is up to your expectation?a) Much better than expected b) About as expected c) Worse than expected d) No sms service
31. How often you are checking e-mail in box?a) Daily b) Every 3 days c) Every weekend d) Monthly e) No e-mail service
32. How do you feel about getting market information through e-mail?a) Highly satisfied b) Satisfied c) Neutral d) Dissatisfied e) Highly dissatisfied
33. Are you feel about internet trading service is easy?a) Yes b) No
34. Which one you most prefer in internet trading services provided by ANGEL?a) Online payment b) Holding statement on regular intervals c) Transparent billing system d) Confirmation for off market e) Intimation of corporate cash action and non
35. Please rate your overall satisfaction about internet based internet based demat servicesa) Highly satisfied b)Satisfied c) Neither satisfied nor dissatisfied d) Dissatisfied e) highly dissatisfied
DEPOSITORY SERVICES:
36. Whether ANGEL allowed opening more than one account in the same DP?a) Yes b) No
37. How much amount you pay for opening DP account?a) Nill b) Below Rs 1000 c) Rs 1000-2000 d) Rs 2000-4000 e) Above Rs 3000
38. ANGEL group present multi quality different services in depository, which helping you mostly?a) Delivery b) Dematerialization c) Re materialization
d) Off market trading 39. What is your opinion about inter depository transfer of securities?
a) Very good b) Good c) Neither good or bad d) Bad e) Very bad
40. What you can know the demat account statement?a) View balance b)Transactions c) Monthly transaction statement d) Yearly transaction statement
41. Give your comment on cost / fees charged by ANGEL in all the financial services( please tick)
Types of costs/ fees
Very high High Medium Low Very low
Dematerialization charges
Rematerialization charges
Custody charges
Transfer fees
Transaction fee intraday
DP Account and closing charges
Annual maintenance fees
Others specify
List out some of the services you are receiving from the ANGEL on trading/ derivatives/DP/portfolio/mutual fund/internet trading etc…
42. Give your suggestions to improve the services of ANGEL….………………………………………………………………………………………………………………………………………………………………………………………………………………………………………………………………………………………………………………………
BIBLIOGRAPHY
Reference book
C.R Kothari, researcher methodology, published by K.K.Gupta for New age International Private
Limited. Second edition.
Philip Kotler, Marketing management, Pearson Education Private Limited, 12 th edition, New
Delhi
Jit S Chandan, Statistics, Vikas Publishing House Private Limited, 2nd edition,New Delhi.
L.M Prased, Organization Behavior, Sultan Chand & Sons Educational Publishing Private Limited.
P.Mohana Rao, Financial services, Deep and Deep publications Private Limited.
Periodicals
Business today
In house publication of unicon securities limited
Websites
Websites of the company WWW.angel.com
www.nseindia.com
Related Documents