Fuel Cell Air Intake System Final Report ME450: Winter 2009 Professor Hulbert Team 9 Timothy Diepenhorst Richard Lin Abubaker Mohammed Sedik Timothy Song Joshua Sotsky April 21, 2009

Welcome message from author
This document is posted to help you gain knowledge. Please leave a comment to let me know what you think about it! Share it to your friends and learn new things together.
Transcript

Fuel Cell Air Intake System Final Report
ME450: Winter 2009
Professor Hulbert
Team 9 Timothy Diepenhorst
Richard Lin
Abubaker Mohammed Sedik
Timothy Song
Joshua Sotsky
April 21, 2009
CONTENTS
ABSTRACT ...............................................................................................................................1
EXECUTIVE SUMMARY .........................................................................................................2
PROBLEM DESCRIPTION .......................................................................................................3
INFORMATION SOURCES ......................................................................................................3
The Proton Exchange Membrane Fuel Cell ..............................................................................3
Airflow ....................................................................................................................................5
Humidity .................................................................................................................................6
Temperature ............................................................................................................................7
Pressure ...................................................................................................................................8
Purity..................................................................................................................................... 11
Noise ..................................................................................................................................... 12
Packaging .............................................................................................................................. 13
Customer Requirements ......................................................................................................... 14
ENGINEERING SPECIFICATIONS ........................................................................................ 14
Quality Function Deployment ................................................................................................ 15
Customer Requirement Weights ............................................................................................ 15
CONCEPT GENERATION ...................................................................................................... 15
Functional Decomposition ..................................................................................................... 16
Intake Inlet Scoop .................................................................................................................. 17
The “Whale Mouth” ........................................................................................................... 17
The idea of NACA Ducts ................................................................................................... 17
Although ground ducts and inlets ....................................................................................... 17
A Multi Scoop System ....................................................................................................... 17
A Variable Duct Opening ................................................................................................... 18
Compressed Oxygen Tanks ................................................................................................ 18
Filtration ................................................................................................................................ 18
Dust Filters ........................................................................................................................ 18
Membrane Filters ............................................................................................................... 18
Donaldson Chemical Filter ................................................................................................. 18
Active carbon filtration ...................................................................................................... 18
Compression .......................................................................................................................... 21
Scroll compressors ............................................................................................................. 21
Screw compressors ............................................................................................................. 22
Centrifugal compressors ..................................................................................................... 22

Lobe Compressors ............................................................................................................. 23
Humidification ...................................................................................................................... 23
Liquid Water Injection humidifiers .................................................................................... 23
Nafion® membrane humidifiers ......................................................................................... 23
Carbon Foam humidifiers ................................................................................................... 23
Temperature Controller.......................................................................................................... 24
Induction heating system .................................................................................................... 24
Air Conditioning Unit ........................................................................................................ 24
Intercoolers ........................................................................................................................ 24
CONCEPT SELECTION .......................................................................................................... 24
Intake Inlet Scoop .................................................................................................................. 24
“Whale Mouth” Design ...................................................................................................... 25
NACA Duct ....................................................................................................................... 25
Ground Duct ...................................................................................................................... 25
Multi-Scoop System ........................................................................................................... 25
Variable Intake ................................................................................................................... 25
Compressed Oxygen .......................................................................................................... 25
Filtration ................................................................................................................................ 25
Visteon Dust Filter ............................................................................................................. 26
Activated Carbon Filter ...................................................................................................... 26
Membrane Filter ................................................................................................................ 26
Donaldson Chemical Filter ................................................................................................. 26
Compression .......................................................................................................................... 26
Screw Compressor ............................................................................................................. 27
Scroll Compressor .............................................................................................................. 27
Centrifugal Compressor ..................................................................................................... 28
Lobe Compressor ............................................................................................................... 28
Humidifier ............................................................................................................................. 28
Liquid Water Injection ....................................................................................................... 28
Radial and Linear Nafion® Membrane Concepts ................................................................ 29
Carbon Foam Humidifier ................................................................................................... 29
Temperature Controller.......................................................................................................... 29
Intercooler.......................................................................................................................... 30
Air Conditioning Unit ........................................................................................................ 30

System Order ......................................................................................................................... 30
CONCEPT DESCRIPTION ...................................................................................................... 30
ENGINEERING DESIGN PARAMETER ANALYSIS ............................................................ 33
Thermodynamic Model of System ......................................................................................... 34
The Model concludes ......................................................................................................... 36
Problems with the Model ................................................................................................... 37
Material Analysis Results ...................................................................................................... 37
Ducting .............................................................................................................................. 37
Injection line (Hoses) ......................................................................................................... 38
Environmental.................................................................................................................... 38
Design for Safety ............................................................................................................... 38
FINAL DESIGN DESCRIPTION ............................................................................................. 39
PROTOTYPE DESCRIPTION ................................................................................................. 42
Prototype Vs Final Design ..................................................................................................... 43
Omitted Aspects .................................................................................................................... 43
Reduced Targets .................................................................................................................... 43
Prototype Components........................................................................................................... 44
FABRICATION PLAN ............................................................................................................. 49
Prototype Platform................................................................................................................. 49
Mounting the Compressor...................................................................................................... 58
Compressor to Drill Adaptor .................................................................................................. 64
Mounting the Drill ................................................................................................................. 65
Mounting the Intercooler ....................................................................................................... 66
Water Injection Assembly...................................................................................................... 68
PVC Connections .................................................................................................................. 69
Sensors .................................................................................................................................. 72
Final Design Fabrication Differs ............................................................................................ 73
VALIDATION PLAN............................................................................................................... 74
Compressor Characterization Experiment .............................................................................. 74
Water Injection Characterization Experiment ......................................................................... 75
Figure 95: Water Injection Characterization Setup ................................................................. 77
Intercooler Characterization Experiment ................................................................................ 77
VALIDATION RESULTS ........................................................................................................ 78
Numerical Results ................................................................................................................. 79

Visual Observations ............................................................................................................... 80
Engineering Specifications Untested ...................................................................................... 80
Discussion ................................................................................................................................. 81
Control and Efficiency ........................................................................................................... 81
System Order ......................................................................................................................... 82
Condensation ......................................................................................................................... 82
Temperature .......................................................................................................................... 83
Filtration ................................................................................................................................ 84
Noise ..................................................................................................................................... 84
Packaging .............................................................................................................................. 84
Fuel Cell Power Requirements ............................................................................................... 86
RECOMMENDATIONS .......................................................................................................... 86
SUMMARY AND CONCLUSIONS ........................................................................................ 88
ACKNOWLEDGEMENTS....................................................................................................... 90
REFERENCE LIST .................................................................................................................. 92
Appendix A: Bill of Materials ................................................................................................... 95
Appendix B: Description of Engineering Changes since Design Review #3 ............................ 100
Appendix C: Design Analysis Assignment (Material Selection) .............................................. 105
C.1 Functional Performance ................................................................................................ 105
Ducting ............................................................................................................................ 105
Water Tank Line .............................................................................................................. 105
C.2 Material Selection Assignment (Environmental Performance) ....................................... 106
Ducting/Hoses.................................................................................................................. 106
C.3 Manufacturing Process Selection Assignment ............................................................... 110
Ducts ............................................................................................................................... 110
Hoses ............................................................................................................................... 110
Appendix D: Quality Function Deployment ............................................................................ 111
Appendix E: Fuel Cell Stack Power in Current Fuel Cell Vehicles .......................................... 112
Table E.1 Hybrid Fuel Cell Vehicles (Battery and Fuel Cell Stack) ..................................... 112
Table E.2 Fuel Cell Engine Vehicles.................................................................................... 113
Appendix F: Component Concept Generation ......................................................................... 114
Table F.1 Scoop Concept Generation ................................................................................... 114
Table F.2 Filter Concept Generation .................................................................................... 114
Table F.3 Compressor Concept Generation .......................................................................... 114

Table F.4 Humidifier Concept Generation ........................................................................... 115
Table F.5 Cooler Concept Generation .................................................................................. 115
Table F.6 Noise Concept Generation ................................................................................... 115
Appendix G: Concept Generation ............................................................................................ 116
Table H.1 Scoop Pugh Chart ................................................................................................ 118
Table H.2 Filter Pugh Chart ................................................................................................. 118
Table H.3 Compressor Pugh Chart ....................................................................................... 119
Table H.4 Humidifier Pugh Chart ........................................................................................ 119
Appendix J: Mathematical Model of System ........................................................................... 121
Model .................................................................................................................................. 121
Appendix K: Air intake System Flow Characteristics .............................................................. 124
K.1- Initial Mass Flow ......................................................................................................... 124
K.2 Liquid Injection Mass Flow .......................................................................................... 124
Appendix L: Final Design CAD Pictures ................................................................................. 127
Appendix M: Gannt Chart ....................................................................................................... 129

1
ABSTRACT
The goal of our project is to research and design an Air Intake System for a proton exchange
membrane fuel cell (PEMFC) to be used in automotive applications. Fuel cell technology will
allow cars to be powered by hydrogen. The air intake of a PEMFC is critical to its functionality;
it supplies air to the cathode side electrode where its oxygen is used in the fuel cell reaction. The
important characteristics of an air intake system include: airflow, noise, filtration, humidity,
temperature, pressure and packaging. By considering these important aspects, our team has
designed an air intake system that allows a fuel cell to function efficiently.

2
EXECUTIVE SUMMARY
Our project is the fuel cell air intake system for an automotive application and is sponsored by
Visteon Corporation. Fuel cells are one of the most popular forms of alternative technology for
automotive vehicles. Our sponsor, Visteon, is preparing to be competitive in the upcoming fuel cell
vehicle market by supplying intake systems. They have asked us to research and design an air intake
system for a Proton Exchange Membrane Fuel Cell (PEMFC) vehicle. The objective of our project is
to develop a system that delivers the proper ratio of clean air to hydrogen in the fuel cell membrane
and optimize performance.
Specifications that have been determined for our project are relative humidity (100%), temperature
(85°C), pressure (2.5 Bar), air purity (removal of dust and chemical compounds), noise (< 65 dBA),
and air flow (45 liters/sec for a 100 kW fuel cell stack). As we try to meet these technical
specifications, we must also consider our customer‟s requirements which include packaging (how the
system fits inside a medium size vehicle), cost, serviceability, and durability. A quality function
deployment (QFD) diagram was executed to analyze tradeoffs and compromises between technical
and customer specifications. This tool helps to clarify and quantify the importance of each variable,
enabling us to satisfy our specification criteria as much as possible.
To select the best design for the air intake system, we first broke our system into the following
components: air intake, filter, compressor, humidifier, and cooler. Then we generated many possible
solutions for each component. Each concept was then entered into a Pugh chart for its particular sub-
function and then evaluated on its ability to perform the necessary criterion.
For our Final Design, we chose a combination of an activated carbon filter and Visteon dust filter to
remover harmful substances, a screw compressor to increase pressure and set the mass flow rate, a
liquid injection humidifier to control humidity, and an air-air intercooler to cool the airflow. We also
determined that the components listed above and placed in that order will most effectively deliver the
proper parameters to the fuel cell.
Our prototype is composed of the same components as our final design except the chemical filter.
Our plan was to demonstrate that by using our chosen components, in their particular order, our final
design can regulate the pressure, temperature, and humidity of ambient air and deliver it to a fuel cell
at pre-specified targets. Our initial targets for our prototype were a relative humidity of 100%,
temperature of 40oC, and pressure of 1.35 Bar at the outlet. Our results were a pressure of 1.24 Bar, a
temperature increase to 33°C, and an inability to record significant humidity measurements. Failure
of our system to reach our initial targets was mostly due to the lack of power supplied to the
compressor (small airflow/rotational speed) and an inadequate humidity sensor. However, our team
did demonstrate that we could control pressure by regulating the compressor speed and back pressure
on the system; control the heat exchange across the intercooler by regulating the cross sectional area
of the cross flow, and control the amount of water entering the system by regulating the back
pressure of our water tank.
In conclusion, our team has delivered the requested information from Visteon about the
specifications necessary for a fuel cell air intake system and has also provided a unique assembly of
components to meet these specifications. In the future, more testing should be done to determine the
necessary control of our assembly.
3
PROBLEM DESCRIPTION
As more research and development is spent on fuel cell technologies, their large-scale
implementation in automobiles becomes more promising. Visteon Corporation is a large
automotive supplier which manufactures a wide range of parts including electronic products,
climate control systems, and interior products. As they foresee the proton exchange membrane
fuel cell (PEMFC) vehicle emerging in the automotive market, they are taking the necessary
steps to be first in providing their customers with a suitable air intake system. As our sponsor,
Visteon will be working with our team in designing and developing this system for small to mid-
size vehicles. The goal is to produce an intake system design which supplies air at the proper
flow-rate, humidity, temperature, pressure, and purity to achieve the optimum performance and
efficiency from a PEMFC stack. This design must also meet cost, manufacturability, packaging,
serviceability, durability, and noise requirements. The final output of our project will be a
scaled-down prototype to demonstrate our system design in operation.
INFORMATION SOURCES
To educate ourselves as much as possible on fuel cell technology and to obtain engineering
specifications for optimum performance, our team has gathered information from a variety of
sources. These sources include our sponsor, published research books, scientific journal articles,
and interviews with professors, patent searches, and other online sources.
The Proton Exchange Membrane Fuel Cell
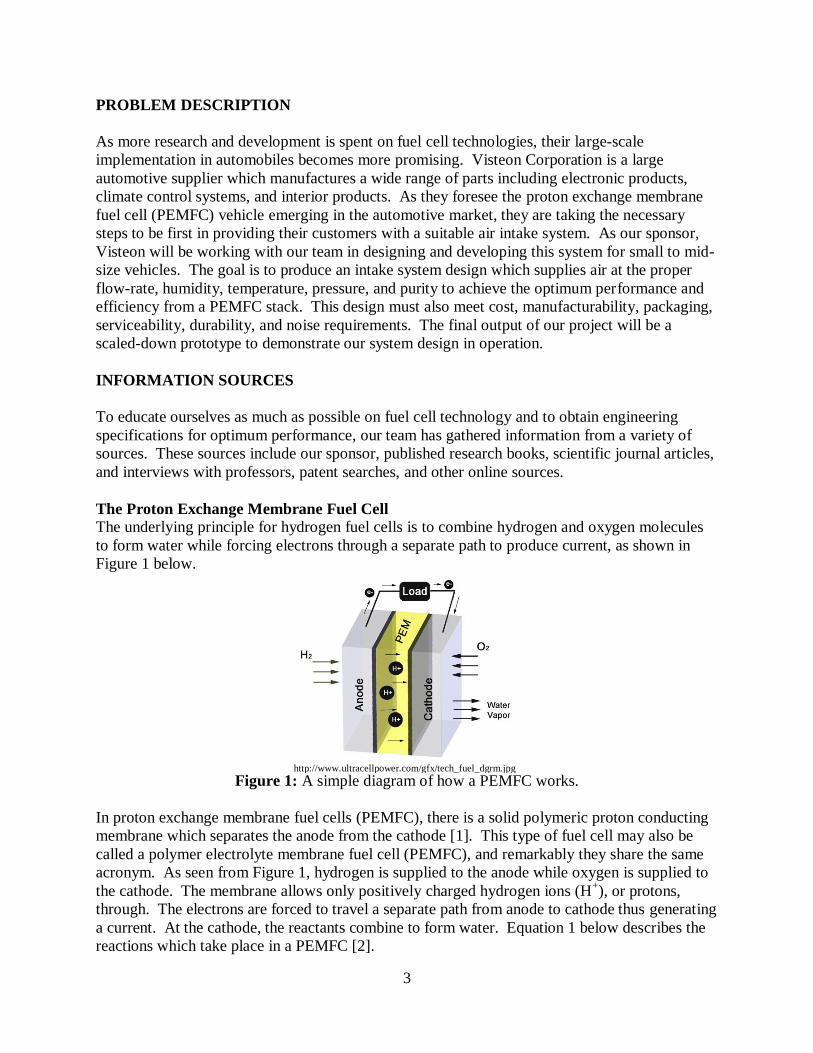
The underlying principle for hydrogen fuel cells is to combine hydrogen and oxygen molecules
to form water while forcing electrons through a separate path to produce current, as shown in
Figure 1 below.
Figure 1: A simple diagram of how a PEMFC works.
In proton exchange membrane fuel cells (PEMFC), there is a solid polymeric proton conducting
membrane which separates the anode from the cathode [1]. This type of fuel cell may also be
called a polymer electrolyte membrane fuel cell (PEMFC), and remarkably they share the same
acronym. As seen from Figure 1, hydrogen is supplied to the anode while oxygen is supplied to
the cathode. The membrane allows only positively charged hydrogen ions (H+), or protons,
through. The electrons are forced to travel a separate path from anode to cathode thus generating
a current. At the cathode, the reactants combine to form water. Equation 1 below describes the
reactions which take place in a PEMFC [2].
http://www.ultracellpower.com/gfx/tech_fuel_dgrm.jpg
4
Anode: eHH 222
Cathode: OHeHO 22 222
1
(Eq. 1)
Overall Reaction: OHOH 2222
1
The most common membrane used in PEMFCs is Nafion®, a sulphonated fluoropolymer
invented by DuPont in the 1960‟s. This material has essentially become an “industry standard”
as it is the electrolyte against which others are judged [3].
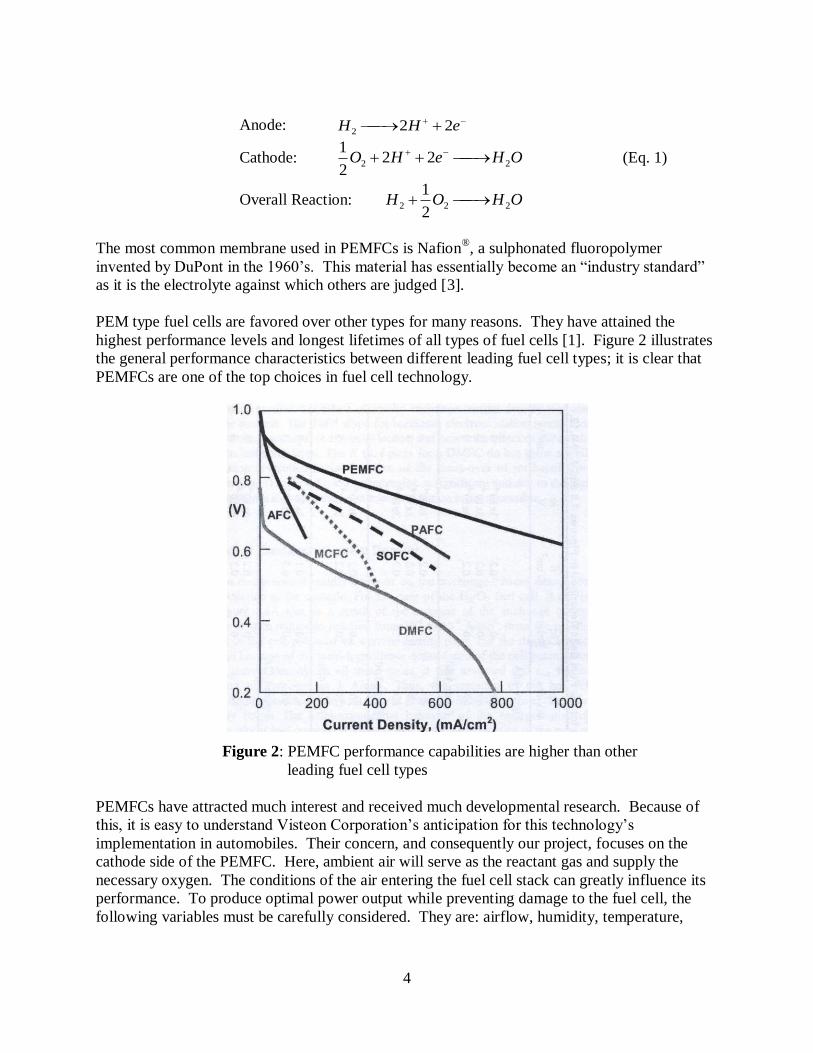
PEM type fuel cells are favored over other types for many reasons. They have attained the
highest performance levels and longest lifetimes of all types of fuel cells [1]. Figure 2 illustrates
the general performance characteristics between different leading fuel cell types; it is clear that
PEMFCs are one of the top choices in fuel cell technology.
Figure 2: PEMFC performance capabilities are higher than other
leading fuel cell types
PEMFCs have attracted much interest and received much developmental research. Because of
this, it is easy to understand Visteon Corporation‟s anticipation for this technology‟s
implementation in automobiles. Their concern, and consequently our project, focuses on the
cathode side of the PEMFC. Here, ambient air will serve as the reactant gas and supply the
necessary oxygen. The conditions of the air entering the fuel cell stack can greatly influence its
performance. To produce optimal power output while preventing damage to the fuel cell, the
following variables must be carefully considered. They are: airflow, humidity, temperature,
5
pressure, and purity. Studying these aspects and their impact on PEMFC performance will guide
the engineering specifications of the air intake system design.
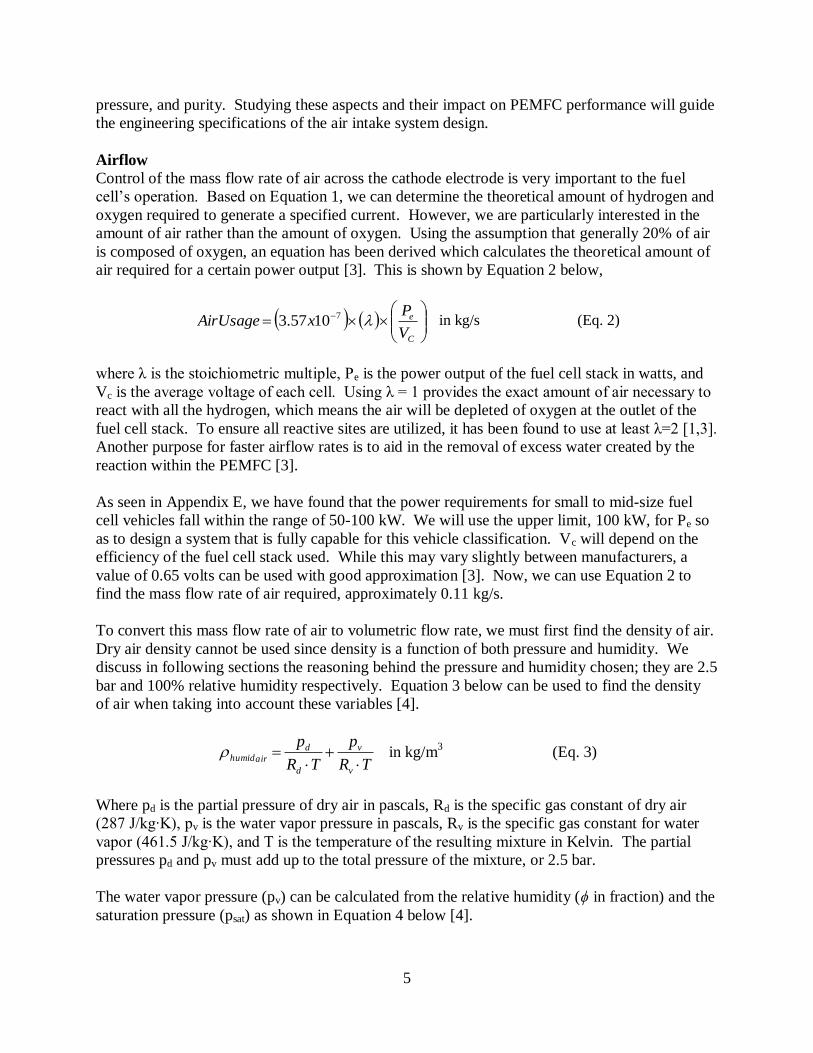
Airflow
Control of the mass flow rate of air across the cathode electrode is very important to the fuel
cell‟s operation. Based on Equation 1, we can determine the theoretical amount of hydrogen and
oxygen required to generate a specified current. However, we are particularly interested in the
amount of air rather than the amount of oxygen. Using the assumption that generally 20% of air
is composed of oxygen, an equation has been derived which calculates the theoretical amount of
air required for a certain power output [3]. This is shown by Equation 2 below,
C
e
V
PxAirUsage 71057.3 in kg/s (Eq. 2)
where λ is the stoichiometric multiple, Pe is the power output of the fuel cell stack in watts, and
Vc is the average voltage of each cell. Using λ = 1 provides the exact amount of air necessary to
react with all the hydrogen, which means the air will be depleted of oxygen at the outlet of the
fuel cell stack. To ensure all reactive sites are utilized, it has been found to use at least λ=2 [1,3].
Another purpose for faster airflow rates is to aid in the removal of excess water created by the
reaction within the PEMFC [3].
As seen in Appendix E, we have found that the power requirements for small to mid-size fuel
cell vehicles fall within the range of 50-100 kW. We will use the upper limit, 100 kW, for Pe so
as to design a system that is fully capable for this vehicle classification. Vc will depend on the
efficiency of the fuel cell stack used. While this may vary slightly between manufacturers, a
value of 0.65 volts can be used with good approximation [3]. Now, we can use Equation 2 to
find the mass flow rate of air required, approximately 0.11 kg/s.
To convert this mass flow rate of air to volumetric flow rate, we must first find the density of air.
Dry air density cannot be used since density is a function of both pressure and humidity. We
discuss in following sections the reasoning behind the pressure and humidity chosen; they are 2.5
bar and 100% relative humidity respectively. Equation 3 below can be used to find the density
of air when taking into account these variables [4].
TR
p
TR
p
v
v
d
d
airhumid
in kg/m3
(Eq. 3)
Where pd is the partial pressure of dry air in pascals, Rd is the specific gas constant of dry air
(287 J/kg∙K), pv is the water vapor pressure in pascals, Rv is the specific gas constant for water
vapor (461.5 J/kg∙K), and T is the temperature of the resulting mixture in Kelvin. The partial
pressures pd and pv must add up to the total pressure of the mixture, or 2.5 bar.
The water vapor pressure (pv) can be calculated from the relative humidity (ϕ in fraction) and the
saturation pressure (psat) as shown in Equation 4 below [4].
6
satv pp (Eq. 4)
The saturation pressure (psat) is the vapor pressure at 100% relative humidity. It is a function of
temperature and can be found from Equation 5 below [4].
85.35
625.20485.7
101078.6 T
T
sat xp in mbar [Eq. 5]
We have determined, and will explain in a following section, that the temperature of air desired
at the inlet of the fuel cell stack is 85ºC, or 358K. Therefore, Equation 5 finds psat at this
temperature to be 57700 Pa. With 100% relative humidity, Equation 4 is used to find pv equal to
psat. Since pv + pd must equal 2.5 bar (250,000 Pa), pd must be 192300 Pa. Finally, we find from
Equation 3 the density of humid air at our specified conditions to be 2.20 kg/m3.
Combining the results of density and mass flow rate from Equations 3 and 2 respectively, we
find that the volumetric flow rate of air required to the fuel cell is 0.05 m3/s, or roughly 50
liters/sec.
Humidity
Water management is a crucial topic for PEMFCs due to the nature of the Nafion® membrane. If
it is well hydrated, the H+ ions can move freely within the material and it will be a good proton
conductor. On the other hand, if there is insufficient water in the membrane, then proton
conductivity will decrease dramatically [1,3,5]. Since water is produced at the membrane as a
byproduct of the operating fuel cell, we questioned the need for externally supplying moisture. It
has been found that when a fuel cell runs at temperatures over 60ºC, dry airflow will dry out the
electrodes faster than water is produced by the H2/O2 reaction [3]. In the next section, we
conclude that the fuel cell‟s target operating temperature is 80ºC. Therefore, there is a need to
supply extra moisture to the fuel cell membrane.
One method to provide this moisture involves humidification of the reactant gases. Water can
diffuse through the membrane, and so in some cases, humidification of the air alone can be
sufficient to hydrate the entire membrane [3]. However, a potential problem with this method
involves “electro-osmotic drag” where protons can “drag” water molecules along as they travel
from the anode to the cathode. Because of this, the anode side of the membrane can become dry
even though the cathode side is completely hydrated [3]. This is an issue which must be
analyzed thoroughly and will require counter-measures beyond those capable through the
operation of an air intake system.
For our project, we will focus on the humidity of the incoming air at the cathode side. The air
supplied to the fuel cell stack will need to be humidified to at least 90% relative humidity [1],
with the goal near 100% [5]. Another potential problem which must be controlled through the
intake system is flooding of the electrode. When the electrode becomes flooded, the path lengths
increase for the reactant gas to reach catalyst sites [1]. This may occur if the air entering the fuel
cell is over humidified, above 100% relative humidity. In essence, the air stream will contain
condensed water droplets which can collect on the electrode and hinder performance [3].
Therefore, a delicate balance of water content in the air is vital and must be regulated as close to

7
100% relative humidity as possible. A complete understanding of air humidity and its
relationship between temperature and pressure is therefore necessary for proper regulation.
Temperature
Increasing temperatures of the reactant gases enhances the kinetics of the reactions at the anode
and the cathode. Higher operating temperatures for PEMFCs also reduce ohmic resistances due
to higher conductivity of the electrolyte. Furthermore, diffusion coefficients of reactants
increase with increasing temperature; thus, higher current densities are achievable before mass
transport limitations occur. These effects of increasing temperature on PEMFC performance can
be seen from Figure 3 below [1, P.462].
Figure 3: Effect of temperature on PEMFC performance.
(●) = 95ºC Oxygen
(○) = 50ºC Oxygen
(▼) = 95ºC Air
( ) = 50ºC Air
Another favorable effect of higher operating temperatures is the minimizing of CO poisoning as
shown in Figure 4 below [1, P.452].

8
Figure 4: Higher operating temperatures increases CO tolerance in PEMFCs
From these facts, the inclination would be to choose as high a temperature as possible to operate
a PEMFC.
However, determining the PEMFC operating temperature relies upon many factors. First, a
temperature limit is drawn based on the thermal stability and conductivity of the electrolyte
membrane. With Nafion® this limit should be around 85ºC [6]. At low pressures (≤ 3 bar), the
operating temperature is further limited to 80ºC due to the rapid increase of water vapor pressure
with temperature.
According to work at Los Alamos National Lab (LANL), Texas A&M University (TAMU), and
other laboratories, the ideal operating temperature for PEMFCs is 80ºC [1]. Their studies also
indicate that humidification temperatures of the oxygen should be 5ºC hotter [1]. Therefore, we
have determined that the air intake system should provide air at a temperature of around 85ºC for
optimal conditions.
Pressure
Increasing pressure has similar effects as increasing temperature on the performance of a
PEMFC. The rates of diffusion are enhanced at higher operating pressures [1], and activation
over potential is reduced by increasing catalyst site occupancy [3]. Figure 5 below illustrates the
better performance of a PEMFC due to higher pressures of the reactant gases.

9
Figure 5: Higher reactant gas pressures result in performance improvements
for PEMFCs
Of course, increasing the pressure requires the use of some compression device. This
compressor must take in some form of energy to operate. If driven by an electric motor, which is
almost always the case, there is a parasitic loss to the entire system; a portion of the power output
is lost just for operation. A relationship between voltage gained and increasing pressures is
shown in Equation 6 below. An estimate for the parasitic loss to drive the compressor is found
by combining Equation 2 with compressor efficiency; this is shown in Equation 7 [3].
1
2gain ln V
P
PC [Eq. 6]
11057.3V
286.0
1
217
lossP
PTxx
cm
[Eq. 7]
Where C is a constant, T1 is the ambient air temperature, m is the motor efficiency, c is the
compressor efficiency, P1 is the ambient air pressure, and P2 is the compressor outlet pressure.
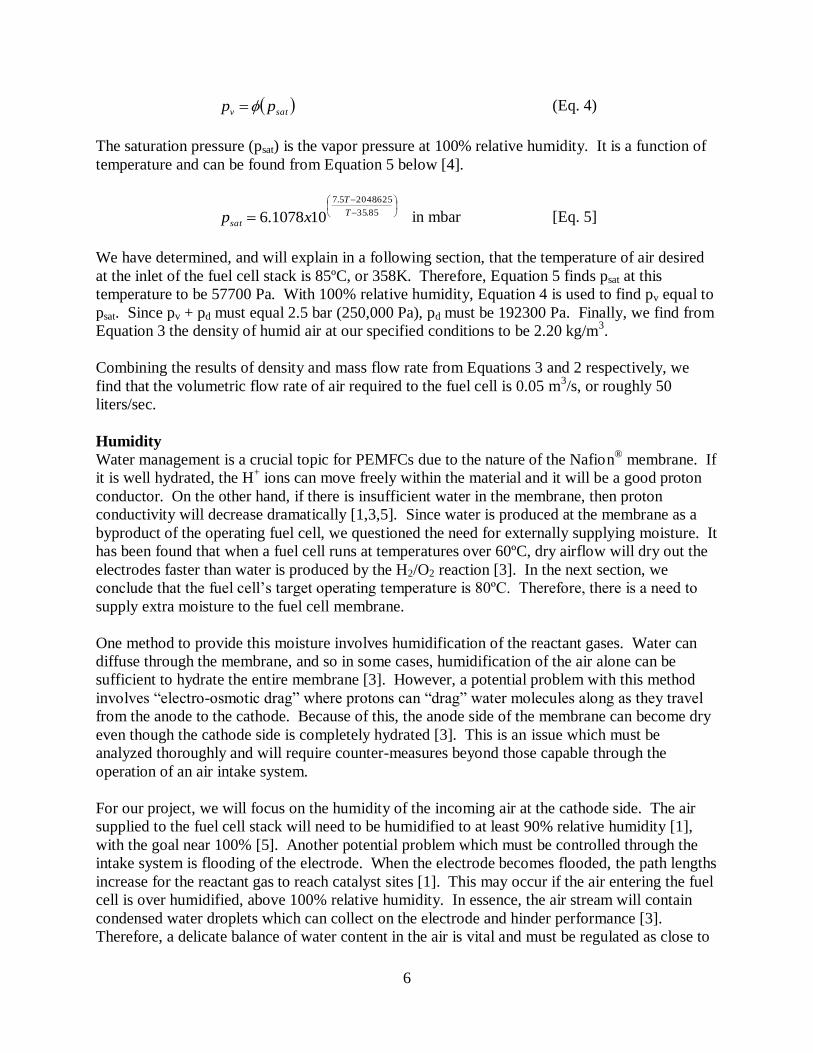
The net change in voltage, ΔVgain – ΔVloss, has been plotted with pressure rise ratio, P2/P1, for
two conditions as shown in Figure 6 below. The values for each variable used in the two models
are listed in Table 1.
Current Density
10
Table 1: Values used for the models in Figure 6 [3] Variable Realistic Model Optimistic Model
C 0.06 V 0.10 V
T1 15ºC 15ºC
ηm 0.9 0.95
ηc 0.7 0.75
Λ 2 1.75
Figure 6: Pressure maximizes PEMFC performance at 3 bar [3]
While Figure 6 above shows an optimal operating pressure for the „optimistic‟ case of around 3
bar. It also shows that there is never a net gain in the „realistic‟ model. In other words, the power
required to run a compressor is always greater than the power gained by increasing pressure.
This “realistic” model is geared more towards small fuel cells with relatively low power output
to begin with. Such little power may not be sufficient to drive even the smallest of compressors.
Therefore, it is clear why no benefit can be seen with the inclusion of a compressor.
In our system‟s application, the automotive fuel cell stack will output power ranging between 50
and 100 kW as mentioned earlier. In practice, it has been found that compressors will draw
roughly 25% of the power produced [24]. Even at 50 kW, there will be 12 kW available to drive
a compressor when assuming this 25% parasitic loss. It can now be seen how pressurizing a fuel
cell is more practical for larger, more powerful stacks.
Operating a fuel cell without pressurizing the air is not even an option for our project. It is clear
that a compressor will be required to move this air, especially at idle or low vehicle speeds.
Supplying the airflow mentioned above will require an increase in pressure. The optimal
operating pressure has been found at 2.5 bar through experiments [23]. This agrees with the

11
theoretical rough estimate shown in Figure 6 [3]. Therefore, we have set our engineering
specification for pressure to 2.5 bar.
Purity
There are certain contaminants which have negative effects on the fuel cell. They must be
filtered out of the incoming air in order to prevent damage and performance loss of the fuel cell.
Like the internal combustion engine, dust must be filtered out since the intake system, as well as
the fuel cell, is composed of many components that are sensitive to this impurity. Aside from
dust and other particulates, some harmful chemical substances must also be removed.
The common chemical contaminants to fuel cells found in air include sulfur compounds,
nitrogen compounds, carbon monoxide and other volatile organic compounds [7,8]. Of these,
sulfur compounds are most damaging to the fuel cell because they adsorb onto the Pt catalyst and
reduce the number of available reactivity sites for the oxygen reduction reaction [7]. Other
chemicals which have serious negative effects on PEMFCs include chemical warfare agents such
as cyanogen chloride, hydrogen cyanide, sulfur mustard, and saran [9]. However, because these
are very uncommon in normal atmospheric air composition, we will not consider them in our
project. We will focus only on the common contaminants listed above.
The PEMFC‟s tolerance levels to contaminants vary from one to another, and the filter
performance for allowable concentrations must be determined accordingly. For example, the
effects of carbon monoxide are temporary and fully recoverable with only a 4% drop in power
output under concentrations of 20 ppm [8]. On the contrary, only 1ppm of NO2 causes a 10%
drop and 1ppm SO2 a massive 35%. Performance losses from sulfur compounds are only
partially recoverable at best [10], meaning that these substances cause permanent damage to the
fuel cell. The effects of NO2 and SO2 on PEMFC performance can be seen in Figures 7 and 8,
shown below [11].
Figure 7: Effect of 1ppm SO2 on PEMFC performance
12
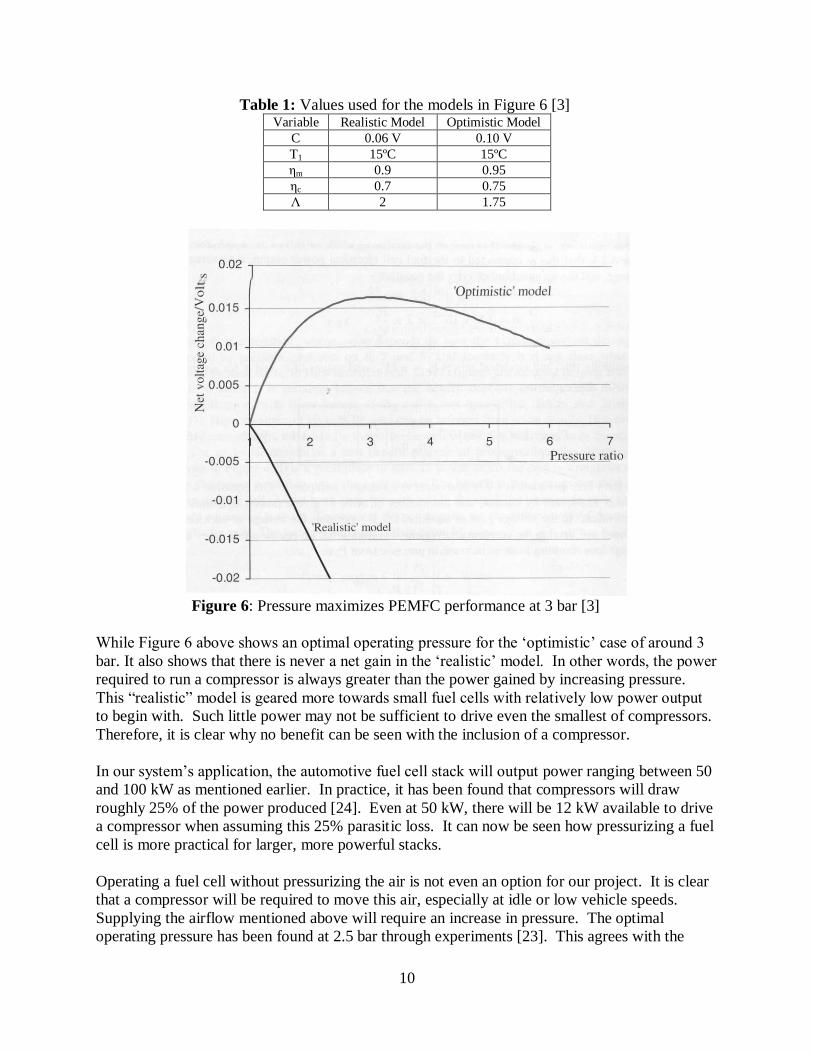
Figure 8: Effect of 1ppm NO2 on PEMFC performance
Nitrogen compounds found in the air are mainly composed of NO2 (80%) and NO (20%) [11].
As for sulfur compounds, SO2 and H2S are the major contaminants of concern in the air. [7].
The sulfur compounds should be most strictly filtered. Since even 1ppm concentration of SO2
can decrease power output by as much as 35%, we decided that chemical filters must be effective
to a point where < 100 ppb of sulfur compounds are allowed. The next most important
chemicals to filter out are the nitrogen compounds. We have determined that chemical filters
must be effective to a point where < 500 ppb is allowed. The least important of the harmful
chemicals that require filtering is carbon monoxide. We determined concentrations < 20 ppm
acceptable. In areas of high pollution created by industrialization, SO2 concentrations as high as
300-400 ppb have been recorded [12]. H2S concentrations lie in the ppt ranges and may not
present much of an issue. Nitrogen compounds range up to 500 ppb [12] and therefore may also
not be an issue. Carbon monoxide levels have been known to be recorded at the 40 to 200 ppb
range with a strong downward trend of the concentration in North America [12]. Considering
that the allowable amount of carbon monoxide concentration is in the 20 ppm range, this will
also not be a problem to the fuel cell.
Noise
We have determined our target for noise generation to be below 65 dBA [34]. Initially, we
benchmarked our system against an internal combustion engine vehicle. Visteon informed us that
their current target for such a system is between 60-70 dBA. After conducting research, we
found an article stating that their chosen compressor met the requirements of generating noise
below 65 dBA [24]. From this and the fact that the compressor is the loudest component of the
air intake system, we have set a target of 65 dBA for our entire system. To achieve this target, we
plan on using Hemholtz resonators to attenuate any frequencies exceeding this threshold. The
frequency being attenuated can be calculated based on Equation 8 below.
𝑓𝐻 =𝑣
2𝜋
𝐴
𝑉𝑜𝐿 [Eq 8]
13
where 𝑓𝐻 = frequency being attentuated 𝑣 = speed of sound in a gas 𝐴 =Cross sectional area of the neck 𝑉𝑜 = Volume of the cavity 𝐿 = Length of the neck
Another tool we will use to attenuate high dBA frequencies is a quarter-wave resonator. Quarter-
wave resonators work by use of the principal of destructive interference. Destructive interference
is the canceling out of a sound wave by interaction with another wave that is “out of phase”. A
sound wave enters the quarter-wave resonator, reflects off the back surface, and exits the
resonator cavity with a half-period shift. The exiting sound wave causes destructive interference
with the original wave.
Packaging
Our team was not given a specific car to model our design for but instead, we were told that the
design should be made for use in a “small to mid-size vehicle”. As a result, our team has made
assumptions about the packaging and size of our design. In the United States, a mid-size vehicle
today has an average wheelbase between 2.667-2.794 meters [13]. Since there is no mention on
width of mid-size vehicles in US classification, we used Japan‟s system which defines an
average width of about 1.7 meters for mid-size vehicles [13]. Since our team is concerned with
the distance from the front of the car to the fuel cell stack, our team also needed an overall length
of mid-size vehicles. Our team chose the Toyota Camry, a commonly purchased mid-size vehicle
in the US, as a typical model for the length. The Toyota Camry has a vehicle length of 4.81
meters [14]. Our team has assumed that the fuel cell stack will be exactly in the middle of the car
based on our knowledge of current fuel cell vehicles‟ packaging [15]. Our assumed length
between the front of the car and the fuel cell stack is 2.4 meters.
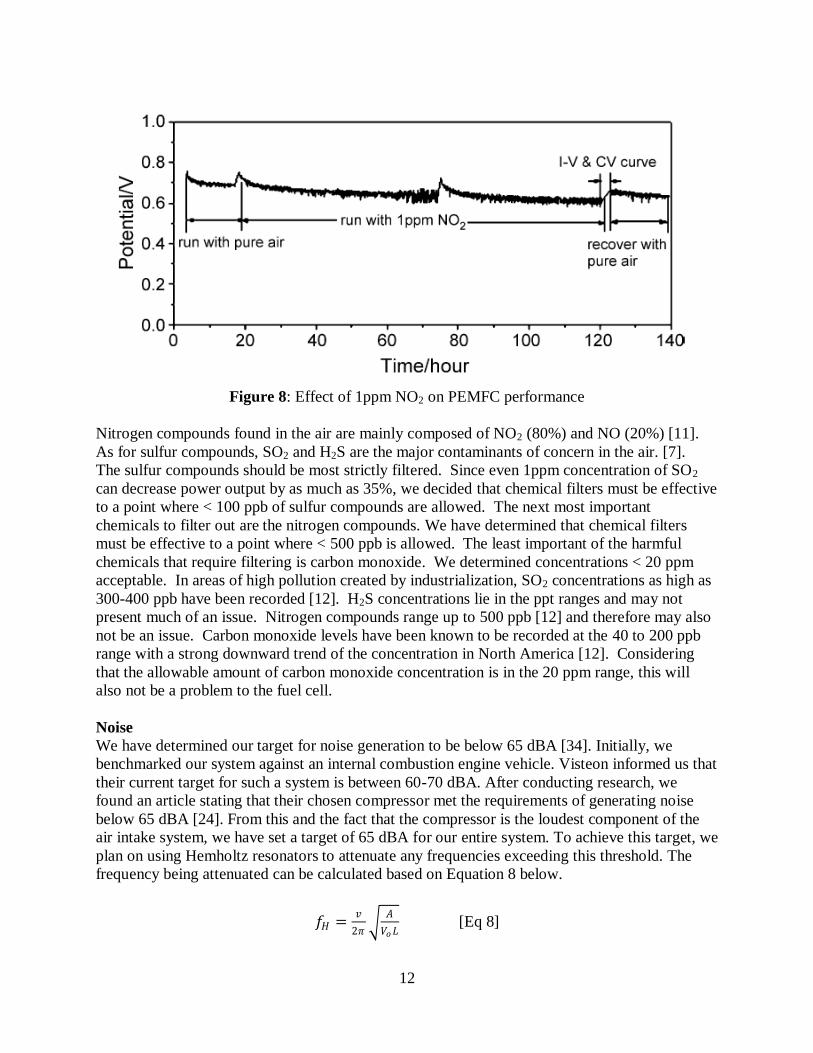
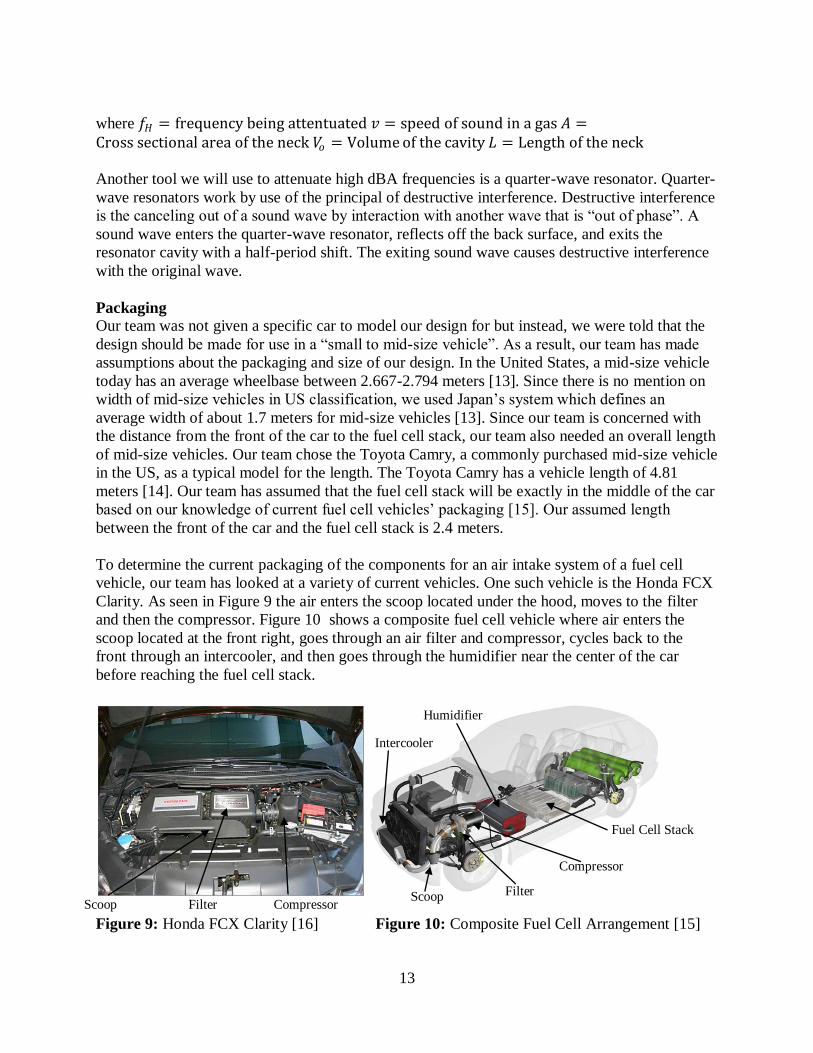
To determine the current packaging of the components for an air intake system of a fuel cell
vehicle, our team has looked at a variety of current vehicles. One such vehicle is the Honda FCX
Clarity. As seen in Figure 9 the air enters the scoop located under the hood, moves to the filter
and then the compressor. Figure 10 shows a composite fuel cell vehicle where air enters the
scoop located at the front right, goes through an air filter and compressor, cycles back to the
front through an intercooler, and then goes through the humidifier near the center of the car
before reaching the fuel cell stack.
Figure 9: Honda FCX Clarity [16] Figure 10: Composite Fuel Cell Arrangement [15]
Filter
Compressor
Scoop Compressor
Intercooler
Humidifier
Scoop Filter
Fuel Cell Stack
14
Customer Requirements
The customer requirements are at the heart of any design. The most amazing design is worthless
if it does not achieve the desires of the customer. When we think about our customer, it is
important to not only design towards the desires of our sponsor (Visteon), but to also meet the
desires of the end customer (drivers).
The best way to determine Visteon‟s requirements was to personally ask them. A meeting was
set to discuss their expectations for the air intake system. Our sponsor‟s top requirements in
order of most important to least important are: product serviceability, cost, quietness,
performance, and durability. Although not specifically mentioned as a top priority, our team
believes that there are some additional important requirements for our sponsor. These include:
ease of manufacture, packaging, and weight.
End customer requirements were more difficult to determine; however, as drivers, we had a good
idea of what might be important. We speculate that the driver‟s top priorities are: performance,
cost, quietness, durability, and serviceability.
ENGINEERING SPECIFICATIONS
The first step in meeting our customer requirements is to understand the PEMFC and identify the
engineering specifications needed for an air intake system. Through literature review and
research, we were able to accomplish this. As described in the previous section, the airflow
characteristics necessary for the fuel cell to operate at peak performance include airflow rate,
humidity, temperature, pressure, and air purity. Aside from airflow characteristics, the intake
system must also have engineering specifications set for its noise levels and packaging. Table 2
summarizes the engineering specifications determined for the air intake system of a mid-size fuel
cell vehicle.
Table 2: Fuel Cell Air Intake Engineering Specifications Characteristic Specification
1 Airflow Rate 50 L / sec
2 Humidity 100% R.H.
3 Temperature 85ºC
4 Pressure 2.5 Bar
5 SO2 Filtration <100 ppb
6 H2S Filtration <100 ppb
7 CO Filtration <20 ppm
8 NO2 Filtration <500 ppb
9 NO Filtration <500 ppb
10 Dust Filtration > 9
11 Noise < 65 dBA
12 Lifetime > 4000 hours
13 Packaging 1 m3
A quality function deployment was constructed and can be seen in Appendix D. This was used
to determine the engineering specifications hierarchy when they are considered in design.

15
Quality Function Deployment
Having determined the engineering specifications of the intake system, we needed to analyze the
interactions between them as well as how each correlates with customer requirements. A quality
function deployment (QFD) diagram was used for this analysis. Our completed QFD can be
seen in Appendix D. Assigning weights to each customer requirement was necessary. The QFD
aids in determining a hierarchy of importance for our engineering specifications. This acts as a
tool for discerning judgment when tradeoffs between one specification and another must be
considered. The top 5 are, in order of most important to least: pressure, temperature, humidity,
lifetime, and filtration.
Customer Requirement Weights
We divided the customer requirements into a hierarchy with three levels. The top of the
hierarchy includes a long lifetime for the fuel cell, a long lifetime of the air intake system, a cost
efficient intake system, and high performance from the fuel cell. The second tier of this
hierarchy includes noise generation, ease of maintenance, eco-friendliness, packaging, and ease
of manufacturing. The customer requirements with the lowest priority include the aesthetics and
weight of the air intake system.
We determined the relative importance of the customer requirements by taking into account the
order of their importance to our customer and how many of our customers are affected by the
requirement. We discussed in an earlier section how customer requirements were determined.
For our customer Visteon, we were fortunate enough to be able to ask them what their
requirements were and in what order. For the drivers, we used our own ranking as drivers
ourselves. If a requirement impacted only one of our two customers and ranked low on their
hierarchy, it received a relative weight of one. If a customer requirement was moderate to one
customer or was a requirement of both of our customers, it received a weight of three. If a
customer requirement was a high priority of either customer or of moderate importance to both
customers, it received a weight of nine.
CONCEPT GENERATION
From the literature review, we now have a general idea of the system requirements. Of course,
these requirements and engineering specifications will continually be developed and updated
with ongoing research. However, they allow us to take the next step towards reaching our goal
of creating the best tangible system design and materializing a working prototype. This step is
known as concept generation and involves the brainstorming of all possible ideas. At this stage,
no ideas are to be rejected; criticism and evaluation are unwelcome. The goal here is to avoid
narrow-mindedness and to branch out and explore every possibility. Creativity and imagination
may spark designs and ideas which otherwise would never have been considered. However, the
methodology we followed was neither random nor without reason.
We began by analyzing the engineering specifications gathered through research to break down
the air intake system into its individual functions. This allowed us to simplify our concept
generation by focusing on individual categories rather than the system as a whole. The
functional decomposition revealed five categories for which concepts were generated. These
are: intake inlet scoop, filtration, compression, humidification, and temperature control.

16
Component order was also a subject which required concept generation. A detailed list of all
concepts generated and pictures of some of these concepts can be seen in Appendix F and
Appendix G.
Functional Decomposition
From the engineering specifications, we determined the important functions which must be
performed by the air intake system. Figure 11 shows the functional decomposition.
Figure 11: Functional Decomposition of the Air Intake System
Since our design project is the air intake system of a fuel cell vehicle, the most important
component for our system is the incoming air. The primary functions of our system include:
taking in air from the ambient, filtering harmful substances out, quieting the noise of the airflow
below 65 dBA, regulating the temperature to 85°C, achieving a humidity of 100%, increasing
pressure to 2.5 bar, and guiding the air to the fuel cell stack. Inputs to the system include the air
and the energy needed to achieve the desired temperature, humidity, and pressure.
Importing air into the system includes directing the air in from the ambient, ensuring a flow rate
of 50 L/sec, and eventually directing it to the fuel cell. Filtering involves the removal of dust and
harmful chemicals (primarily SO2) from the air and storing those elements. The important
aspects of pressurizing the air include increasing the pressure to 2.5 bar, minimizing pressure
ripples, and minimizing energy usage. Temperature control involves regulating the temperature
of the air to 85°C by applying the proper amount of heating/cooling and then making sure heat
losses are minimal between the controller and the fuel cell. Controlling the humidity requires a
system that can adjust the humidity of the air at the intake to 100% and then monitor the
dampness of the fuel cell membrane to prevent it from becoming soaked. Lastly, noise must not
exceed 65 dBA.

17
Intake Inlet Scoop
The purpose of the inlet scoop is to direct air from a specified location towards the air intake
system. Some of the major concepts for this intake inlet design are described in detail below.
The “Whale Mouth” idea originates from observing a whale or a manta ray with a large mouth
opening. This allows the creature to be able to take in large amounts of water. We found this
concept inspiring because our system requires large amounts of airflow (about 50 L/s). This
design would consist of a large cross-sectional area scoop which leads to the ducting.
The idea of NACA Ducts came from the many NACA ducts seen on the Ferrari F40. Upon
some research, these ducts were developed from what is now NASA and were designed for low
drag on flight applications. The NACA duct design is a submerged scoop along the surface of a
vehicle‟s body as shown in Figure 12 below. These ducts will allow air to enter while
minimizing disturbance of the flow to the rest of the flight vehicle. [17, 18]
http://www.gtplanet.net/
Figure 12: Many NACA ducts are found on the Ferrari F40
Although ground ducts and inlets are not commonly seen in modern production cars, our team
thought this would be a good solution to the packaging constraint. Inspiration for this type of
design came from the radiator placement of the 1983 – 1989 Nissan 300zx which one of our
teammates has worked on. The radiator was placed at an angle and practically on the underside
of the car. The car itself had a low and raked hoodline limiting front space of the engine
compartment and most likely caused designers to place this radiator on the underside of the car.
Just like this car, our team thought that placing the scoop underneath the car would deliver the
proper amount of air necessary without taking away too much space from the other components
of the car.
A Multi Scoop System is commonly employed in modern race cars; however, they are usually
absent from production cars. Considering that the engines in these cars need a lot of air to
produce power and cool the components, our team felt this design could be utilized for our
project.
NACA Ducts
18
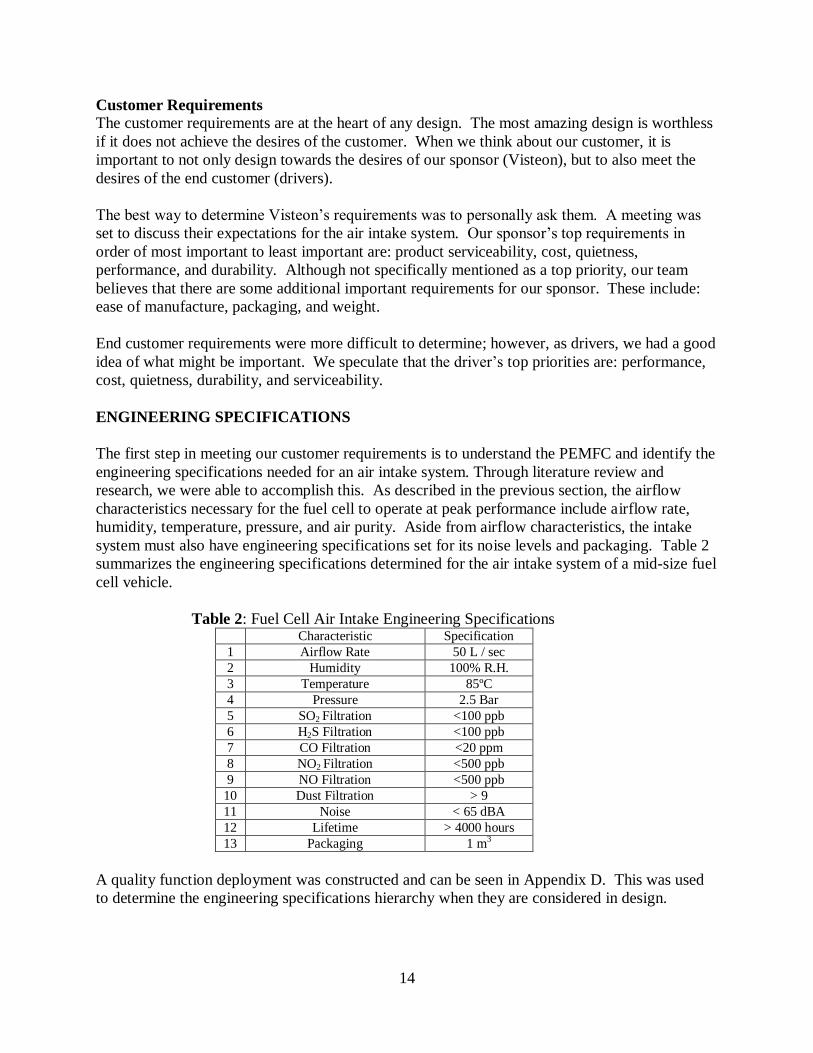
A Variable Duct Opening may be able to achieve high pressure for our intake system.
Specifically, the inspiration for this idea came from new Yamaha sport bikes YCC-I electronic
variable-length intake funnel system. The length of the intake runners would adjust according to
the speed of the bike. The intake runners would be short at low speeds to deliver air at the
optimum conditions for the engine. At higher speeds, the intake runners would lengthen to
create more of a ram air effect, increasing flow to the engine and producing more power. [19]
Compressed Oxygen Tanks would deliver pure oxygen to the fuel cell instead of using ambient
air. Removing the need for filtration and pressurization, this design would simplify the air intake
system and would still meet all the requirements set out for our design project.
Filtration
The purpose of the filter is to remove the harmful contaminants, mentioned on P.11, from
ambient air to prevent damage and power losses to the fuel cell stack. Our four major concepts
for this filtration component are described in detail below.
Dust Filters would be used in front of the chemical filter to filter out dust particles and soot
particles. Particularly the Visteon dust filter would be a very good candidate for our design. It is
efficient and Visteon manufactures it, saving them research and cost [7].
Membrane Filters are commonly used as a filter attached to the fuel cell. It would prevent
metallic compounds from entering the fuel cell via water particles [31].
Donaldson Chemical Filter is the only filter we found that is both a dust and chemical filter. It
has been specifically designed for a fuel cell [30]. This filter design is advantageous because it
combines the dust and chemical filter, thus reducing space.
Active carbon filtration has been widely used in other applications to filter chemicals out of the
air. They are more geared towards filtering air for fuel cells than just every day use. A Chinese
company that makes fuel cell vehicle powertrains investigated additions to activated carbon
filters in order to improve effectiveness in a fuel cell vehicle air intake system. Their research
concluded that MAC filters or a Modified Activated Filters, more specifically a KMAC or
Potassium Hydroxide solution Modified Activated Carbon filter improves filtration performance
[10]. Theses filters have been tested for how well they remove NOx and SO2 compounds in the
air as well as how CO2 affects the filter absorption properties. The best combination of
potassium solution with activated carbon is the KMAC-3; the components making the KMAC 3
can be seen in Table 3 [10, P.384] from the article below.
Table 3: KOH loading and textural characteristics of adsorbent samples
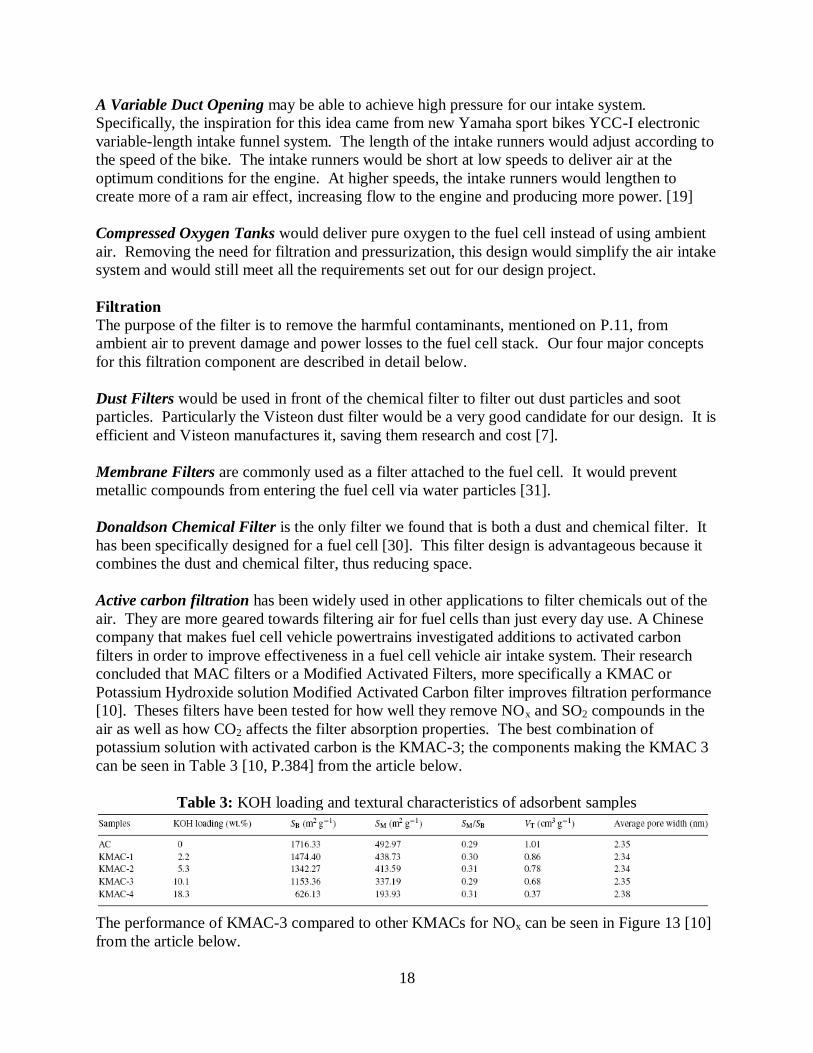
The performance of KMAC-3 compared to other KMACs for NOx can be seen in Figure 13 [10]
from the article below.
19
Figure 13: NOx adsorption weights and equivalent breakthrough times
on AC and KMACs.
The performance of KMAC-3 compared to other KMACs for SO2 can be seen in Figure 14 [10]
Figure 14: SO2 adsorption weights and equivalent breakthrough times
on AC and KMACs.
When a fuel cell is subjected to 1ppm of NOx it loses as much as 10 percent of its performance.
At 1ppm of SO2, the fuel cell looses around 30 percent of its performance within just 5 hours of
exposure [11]. To make sure that these filters worked, the fuel cells were subjected to SO2 and
NOx contaminants for 240 hours. With the filter in place (first 175 hours), performance was
steady. When they removed the filter, the output voltage of the fuel cell stack dropped
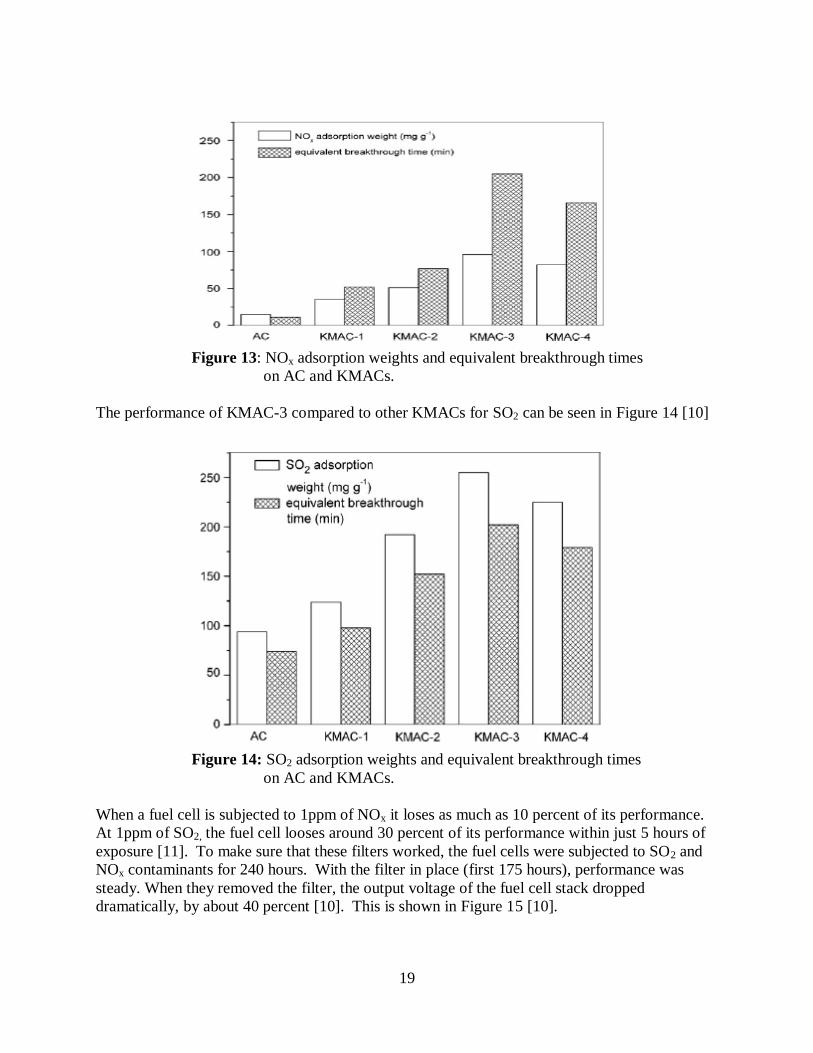
dramatically, by about 40 percent [10]. This is shown in Figure 15 [10].
20
Figure 15: Voltage output curve versus time of 250W stack
exposed to NOx and SO2 with and without filtration.
This made clear that these filters were very effective at filtering NOx and SO2 particles. CO2 has
been found to decrease performance of Activated Carbon filters. To test the KMAC-3 filter‟s
reaction to the CO2 presence, they first saturated the filter with CO2. Then, they added pure NOx
at 65 minutes.
The NOx begins to replace the CO2 and take its place on the filters surface at around 300
minutes. The CO2 is no longer in concentration and almost all of the NOx is absorbed. You can
see this in the Figure 16a below [10]. To test SO2, they introduced SO2 into the filter at the 210th
minute after it was saturated with CO2. As you can see, the SO2 begins to be absorbed and by
the 370th minute all of the CO2 is replaced by the SO2 due to its higher acidity [10]. This can be
seen in the Figure 16b below [10].

21
Figure 16: Breakthrough curves of NOx (a) and SO2 (b) adsorption on KMAC-3
with CO2 presence.
Compression
Besides increasing pressure of the air, the compressor component will also supply the necessary
airflow to the fuel cell stack. Studies over the past several years show that a variety of
compressors may be used to achieve the desired characteristics for the air intake system [23].
Therefore, we examined various well-known compressor designs for this component‟s concept
generation. A description of our main compressor designs and how they work is seen below:
Scroll compressors are rotary positive displacement mechanisms that compress air by rotating
two offset spiral disks that are nested together. The lower disk moves in an “orbital” fashion,

22
while the upper disk remains in place. Air is taken in from the ambient through inlet ports on the
compressor. The “orbiting” effect then creates sealed spaces of varying volumes which are
eventually transferred to the center of the disk where the air is discharged. The air‟s volume is
decreased and the pressure increased [29]. Figure 17 demonstrates how air enters the outer
portion of the scrolls, gets trapped between the disks, condensed towards the middle through the
“orbiting” effect and then discharged from the center.
www.fscc-online.com
Figure 17: Steps of air compression between two disks in a scroll compressor.
Screw compressors are rotary positive displacement mechanisms that compress air by either
using one screw element (single helical) or two counter rotating screws (double helical). As seen
in Figure 18, air is drawn in through the inlet and delivered to the screws. As the screw/s rotate,
the meshing creates a series of volume reducing cavities, increasing pressure. Compressed air is
then delivered at the outlet. Screw compressors may require the use of oil in the compression
process; however, more complex compressors can be oil free. Screw compressors that use oil
have a filter to extract the oil from the air and then recycle it for additional use.
http://www.itwifeuro.co.uk/Editor/Images/fig3_standard.jpg
Figure 18: Air compression for a double helical screw compressor.
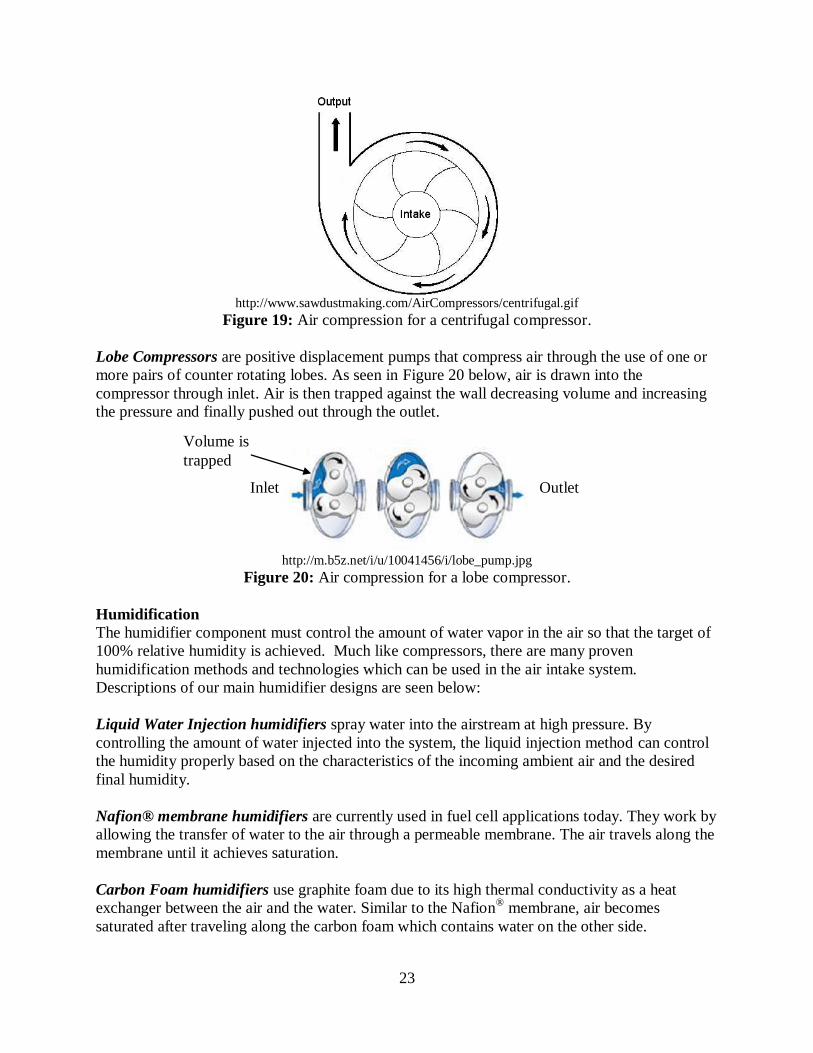
Centrifugal compressors are radial flow mechanisms mechanism that compress air by adding
kinetic energy (velocity) through a continuous flow by use of an impeller and then convert the
kinetic energy to pressure by slowing the flow through a diffuser. As seen in Figure 19, air
comes in through the center impeller, rotates outward towards the wall, and then is released
through the outlet.
Counter Rotation of
Screws
23
http://www.sawdustmaking.com/AirCompressors/centrifugal.gif
Figure 19: Air compression for a centrifugal compressor.
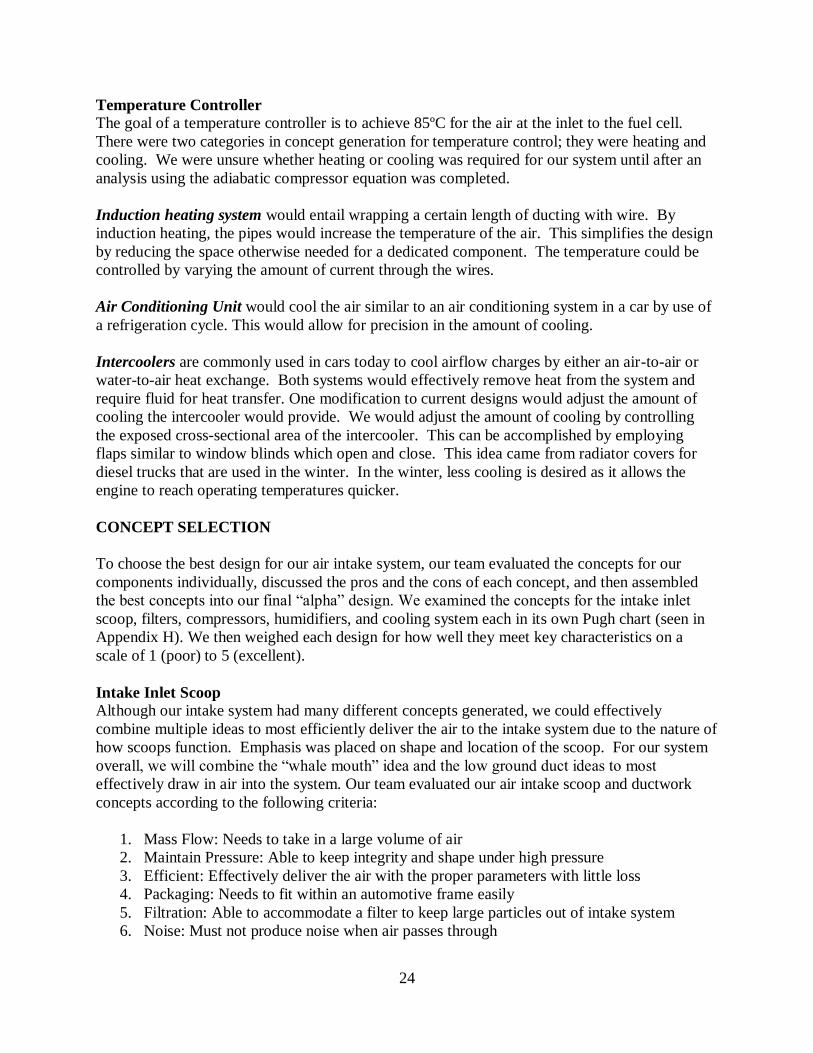
Lobe Compressors are positive displacement pumps that compress air through the use of one or
more pairs of counter rotating lobes. As seen in Figure 20 below, air is drawn into the
compressor through inlet. Air is then trapped against the wall decreasing volume and increasing
the pressure and finally pushed out through the outlet.
http://m.b5z.net/i/u/10041456/i/lobe_pump.jpg
Figure 20: Air compression for a lobe compressor.
Humidification
The humidifier component must control the amount of water vapor in the air so that the target of
100% relative humidity is achieved. Much like compressors, there are many proven
humidification methods and technologies which can be used in the air intake system.
Descriptions of our main humidifier designs are seen below:
Liquid Water Injection humidifiers spray water into the airstream at high pressure. By
controlling the amount of water injected into the system, the liquid injection method can control
the humidity properly based on the characteristics of the incoming ambient air and the desired
final humidity.
Nafion® membrane humidifiers are currently used in fuel cell applications today. They work by
allowing the transfer of water to the air through a permeable membrane. The air travels along the
membrane until it achieves saturation.
Carbon Foam humidifiers use graphite foam due to its high thermal conductivity as a heat
exchanger between the air and the water. Similar to the Nafion® membrane, air becomes
saturated after traveling along the carbon foam which contains water on the other side.
Outlet Inlet
Volume is
trapped
24
Temperature Controller
The goal of a temperature controller is to achieve 85ºC for the air at the inlet to the fuel cell.
There were two categories in concept generation for temperature control; they were heating and
cooling. We were unsure whether heating or cooling was required for our system until after an
analysis using the adiabatic compressor equation was completed.
Induction heating system would entail wrapping a certain length of ducting with wire. By
induction heating, the pipes would increase the temperature of the air. This simplifies the design
by reducing the space otherwise needed for a dedicated component. The temperature could be
controlled by varying the amount of current through the wires.
Air Conditioning Unit would cool the air similar to an air conditioning system in a car by use of
a refrigeration cycle. This would allow for precision in the amount of cooling.
Intercoolers are commonly used in cars today to cool airflow charges by either an air-to-air or
water-to-air heat exchange. Both systems would effectively remove heat from the system and
require fluid for heat transfer. One modification to current designs would adjust the amount of
cooling the intercooler would provide. We would adjust the amount of cooling by controlling
the exposed cross-sectional area of the intercooler. This can be accomplished by employing
flaps similar to window blinds which open and close. This idea came from radiator covers for
diesel trucks that are used in the winter. In the winter, less cooling is desired as it allows the
engine to reach operating temperatures quicker.
CONCEPT SELECTION
To choose the best design for our air intake system, our team evaluated the concepts for our
components individually, discussed the pros and the cons of each concept, and then assembled
the best concepts into our final “alpha” design. We examined the concepts for the intake inlet
scoop, filters, compressors, humidifiers, and cooling system each in its own Pugh chart (seen in
Appendix H). We then weighed each design for how well they meet key characteristics on a
scale of 1 (poor) to 5 (excellent).
Intake Inlet Scoop
Although our intake system had many different concepts generated, we could effectively
combine multiple ideas to most efficiently deliver the air to the intake system due to the nature of
how scoops function. Emphasis was placed on shape and location of the scoop. For our system
overall, we will combine the “whale mouth” idea and the low ground duct ideas to most
effectively draw in air into the system. Our team evaluated our air intake scoop and ductwork
concepts according to the following criteria:
1. Mass Flow: Needs to take in a large volume of air
2. Maintain Pressure: Able to keep integrity and shape under high pressure
3. Efficient: Effectively deliver the air with the proper parameters with little loss
4. Packaging: Needs to fit within an automotive frame easily
5. Filtration: Able to accommodate a filter to keep large particles out of intake system
6. Noise: Must not produce noise when air passes through
25
7. Durability: Needs to be structurally sound and last the lifetime of the vehicle
8. Cost: Perform as specified and not be expensive to design and manufacture
9. Packaging ability: Fit within the space constraints of a small to midsize vehicle frame
A comparison of all intake/scoop concepts can be seen in the Pugh chart in Appendix H.1.
“Whale Mouth” Design - Incoming air first contacts the front of any vehicle, so placing the
“Whale Mouth” concept intake in the front of a car made the most logical sense. The main
drawback of this design would be the packaging constraint.
NACA Duct - For the NACA ducts, the drawbacks are that they cannot produce large intake
pressures or flow rates, which is specifically the reason why they have been almost completely
abandoned for jet intake applications [17, 18]. For these reasons, our team decided not to use
this design.
Ground Duct - For the ground duct and inlet idea, this design is the highest scoring out of all the
designs as seen on our Pugh chart, Appendix H.1. This is due to the high efficiency of the
ducting and the ability to draw in lots of air needed for the fuel cell.
Multi-Scoop System - Upon further analysis of the multi-scoop system, the amount of ducting
being looked at was way too much for what would be proper for a production vehicle; especially
considering that this duct work would cut into a lot of the passenger compartment of the car.
Due to packaging and cost restraints, this design scored low in our Pugh chart.
Variable Intake - Regarding the variable intake concept, although their compact design would
work well for something as small as a sport bike, the amount of space our design would need to
properly vary the intake opening would be illogical for a small to midsize car. Also the added
complexity and cost of the system would conflict with our design constraints.
Compressed Oxygen - The only problem with the compressed oxygen system is that there
currently is no sort of infrastructure to supply compressed oxygen for automotive purposes. The
high cost of this sort of design is not a very good alternative to the other concepts previously
discussed. As much as this idea would be a great solution to our design project, it is not the most
ideal with our constraints and was ruled out during our concept evaluation.
Filtration
Filters are very important to the fuel cell, it is critical to make sure that the filter we recommend
is very efficient and effective. For our design we chose the Activated Carbon filter for chemical
filtration and the Visteon Long Lifetime dust filter for dust particles. We felt that this design
would work best in removing harmful chemical elements and dust from the incoming air. Our
team evaluated our filter concepts according to the following criteria:
26
1. Low Restriction
2. Large Surface Area
3. High Efficiency
4. Low Cost
5. Long Lifetime: Both for the dust and chemical filter
6. Replaceable
7. Small Size
A comparison of all filter concepts can be seen in the Pugh chart in Appendix H.2.
Visteon Dust Filter - To choose the best filter we had to look at each concept very carefully and
asses its different features. Starting with our first concept, the Visteon Dust filter, we had an on-
site tour with our sponsor to discuss filter performances. For current internal combustion engine
vehicles, we found these filters can last up to 150,000 thousand miles [20] without maintenance.
Their porosity is around 97 percent [20] making air restriction very minimal, therefore
minimizing pressure drops. In addition to these specification, Visteon added noise control to the
filter to minimize noise generation, which is important for a fuel cell vehicle. For these reasons,
the Visteon dust filter was chosen to filter dust out of the air.
Activated Carbon Filter – Our team also chose Activated Carbon filters to filter out the
chemicals from the incoming air. Specifically, after looking at the other KMAC filters, the
KMAC-3 is the best choice for our final design. According to our research, the KMAC-3 is fairly
inexpensive and functions at a very high efficiency in removing the most harmful chemicals
from air SO2 and NOx. It can take on a non-restrictive design which is important for airflow, and
appears to have a long lifetime.
Membrane Filter - Our first concept for a chemical filter was the Membrane filter. This filter
attaches to the fuel cell and would clean the air entering the cathode. Membrane filters are best
used when the fuel cell gets air that is super-saturated, meaning water particles are present. They
are good at separating metal ions and salt that travel in the water with the air, but not good at
removing harmful particles from gas that would damage the fuel cell [21]. They have not been
as thoroughly tested as other filters for PEMFC use. Because of these complications, our team
decided against this idea.
Donaldson Chemical Filter - A filter which removes both dust and chemicals from the air is the
Donaldson filter. This filter is designed specifically for a fuel cell and takes care of sulfur
compounds, nitrogen compounds, hydrocarbons, and carbon dioxide [22]. These would be good
filters to use in our air induction system as they perform exactly what we require. The problem
with these filters is that they do not have a desirable lifetime. Their lifetimes are only around
3000 to 5000 hours [22]. Plus the system would have to be built around the filter, due to their
lack of versatility. In addition, the filter is much more expensive than requested by Visteon.
Although this is a good filter, it does not fit into an air intake system very well.
Compression
To achieve the desired pressure level of 2.5 bar and volumetric flow rate of 50 L/s for the air
intake system of a PEMFC, our design requires a compressor to regulate these variables. Our
27
team has chosen the screw compressor for our final design mostly due to its ability to achieve the
desired pressure and airflow required for our air intake system. Originally our team had chosen a
scroll compressor for our alpha design. However, after further analysis of the required airflow,
our team determined that a scroll compressor of reasonable size could not reach the necessary
mass airflow rate for our system [37].
In this section, our team has evaluated our compressor choices based on their requirements for
fuel cell application in transportation. The list of criteria that our team was looking for in a
compressor is seen below:
1. Pressure Ratio: desired 2.5 bars at the outlet of the compressor
2. Oil Content: oil must be prohibited from entering the fuel cell to prevent contamination
of the membrane or electrodes.
3. Pressure Ripple: no ripple greater than 100-200 mbar should occur to avoid damage to
the membrane [24]
4. Weight: should be as small as possible
5. Size: should be as small as possible
6. Efficiency: power used to run the compressor should be minimized
7. Cost
8. Reliability
9. Noise: Must be as quiet as possible
A comparison of all compressor concepts can be seen in the Pugh chart in Appendix H.3.
Screw Compressor - After evaluating potential compressors for use in our air intake system, our
team has chosen the double helical, oil-free screw compressor. The key advantages of a scroll
compressor are as follows: [3]
1. Can maintain a pulse free airflow of 2.5 bar outlet pressure
2. Air-stream can be made oil-free
3. Efficient at a wide range of power requirements
4. Can achieve the mass airflow rate required for fuel cells
5. Have a compact size and low weight [26]
The major disadvantage of the screw compressor is its cost. Screw compressors that maintain an
oil-free flow generally cost a lot more [26]. However, our team feels that the performance and
reliability of this compressor are enough of a reason to choose it over the cheaper alternatives.
Another disadvantage of screw compressors is its ability to meet noise requirements as they tend
to be louder than most other compressor types. However, this can be remedied by using noise
dampening material around the compressor unit.
Scroll Compressor – Initially, our team chose a scroll compressor for use in our air intake
system, but after further examination, we realized that scroll compressors could not achieve the
desired mass airflow rate required at the outlet of the compressor of our air intake system. While
scroll compressors have many positives such as, oil-free operation, low noise, and high

28
pressures, our team must dismiss the idea due to the fact that reaching the desired airflow rate is
difficult for such compact size requirements.
Centrifugal Compressor - Another compressor considered for our air intake system was the
centrifugal compressor. Centrifugal compressors are most commonly used in today‟s PEMFC
automotive application due to their cost, light weight, and compact size [24]. However, our team
chose not to use a centrifugal compressor due to its major disadvantage that it‟s energy
efficiency is only high for a limited range of mass flow and pressure [24]. While the car is at idle
or at low speeds (the power requirement to run the car is below 20 kW [24]), centrifugal
compressors cannot maintain the desired outlet pressure of 2.5 bar resulting in a low efficiency
[23]. Also, some centrifugal compressors that use oil for lubrication have problems keeping the
oil out of the airstream [23]. For these reasons, our team chose not to use a centrifugal
compressor.
Lobe Compressor - Our team also considered using a lobe compressor for our design because
they are relatively cheap [27]. They are able to achieve the required pressure and mass airflow
rate. However, lobe compressors are fairly heavy, large, and may cause pressure ripples in the
airflow [23]. Due to these faults, the lobe compressor was not chosen for our design.
Humidifier
To achieve the desired 100% relative humidity for the air at the inlet of the fuel cell, our system
requires a humidifier. Several methods of humidifying the air may be used for fuel cell, such as:
water injection, absorption through a membrane, and absorption through carbon foam. Our team
chose water injection as our humidification system because of its ability for high precision in the
amount of water being added to the system. Our team has evaluated all our concepts for use in
the air intake system of fuel cells in automotive applications using the following criteria:
1. Humidity: ability to achieve desired 100% relative humidity for all air intake conditions
2. Efficiency: achieve humidity at low power consumption
3. Power: low power consumption
4. Cost
5. Lifetime: ability to last five years
6. Size: small humidifier and small water tank
7. Operating Temperature: ability to function at wide range of temperatures
8. Air Flow/Pressure: does not impair other important variables in system
A comparison of our humidifier concepts can be seen in the Pugh chart in Appendix H.4.
Liquid Water Injection - After evaluating potential humidifiers for use in our air intake system,
our team has chosen to use a liquid water injector located directly after the compressor. The
liquid water injector will spray a calculated amount of water into the airflow based on the
temperature, humidity, and mass flow rate of the incoming air. One type of injector considered is
the fuel injector as illustrated in Figure 21. The water used for injection will come from a water
reservoir tank located near the injector. A pump will be required to achieve pressures greater
than 2.5 Bar. The key advantages of the liquid water injection humidifier are as follows: [23, 30]
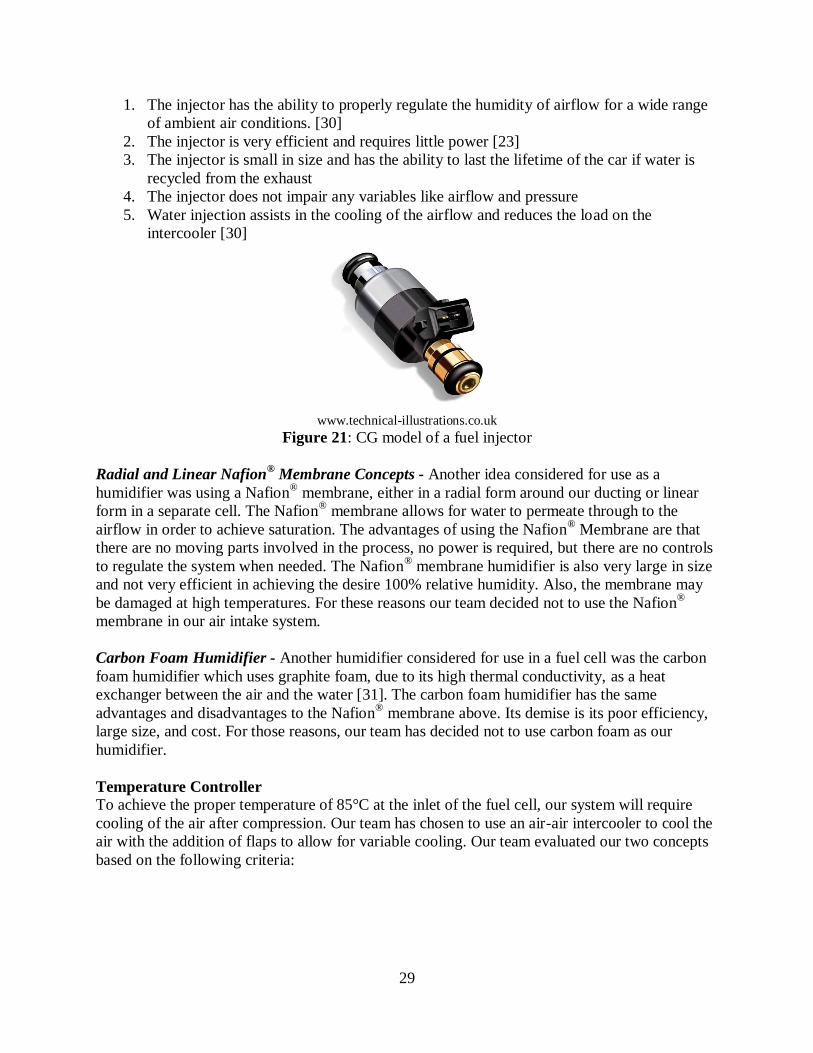
29
1. The injector has the ability to properly regulate the humidity of airflow for a wide range
of ambient air conditions. [30]
2. The injector is very efficient and requires little power [23]
3. The injector is small in size and has the ability to last the lifetime of the car if water is
recycled from the exhaust
4. The injector does not impair any variables like airflow and pressure
5. Water injection assists in the cooling of the airflow and reduces the load on the
intercooler [30]
www.technical-illustrations.co.uk
Figure 21: CG model of a fuel injector
Radial and Linear Nafion® Membrane Concepts - Another idea considered for use as a
humidifier was using a Nafion® membrane, either in a radial form around our ducting or linear
form in a separate cell. The Nafion® membrane allows for water to permeate through to the
airflow in order to achieve saturation. The advantages of using the Nafion® Membrane are that
there are no moving parts involved in the process, no power is required, but there are no controls
to regulate the system when needed. The Nafion® membrane humidifier is also very large in size
and not very efficient in achieving the desire 100% relative humidity. Also, the membrane may
be damaged at high temperatures. For these reasons our team decided not to use the Nafion®
membrane in our air intake system.
Carbon Foam Humidifier - Another humidifier considered for use in a fuel cell was the carbon
foam humidifier which uses graphite foam, due to its high thermal conductivity, as a heat
exchanger between the air and the water [31]. The carbon foam humidifier has the same
advantages and disadvantages to the Nafion® membrane above. Its demise is its poor efficiency,
large size, and cost. For those reasons, our team has decided not to use carbon foam as our
humidifier.
Temperature Controller
To achieve the proper temperature of 85°C at the inlet of the fuel cell, our system will require
cooling of the air after compression. Our team has chosen to use an air-air intercooler to cool the
air with the addition of flaps to allow for variable cooling. Our team evaluated our two concepts
based on the following criteria:

30
1. Cooling Capability: ability to control amount cooling at different temperatures.
2. Small Size
3. Low Weight
4. Low Cost
5. Efficiency/Power Consumption
Intercooler - Our team chose the air to air intercooler as the mechanism to cool our air mostly
because of its low power consumption. No parasitic losses to the fuel cell system will occur from
use of an air to air intercooler. The intercooler would use the ambient air to cool the air in our
system. The intercooler would also need to supply variable cooling based on ambient
temperature and humidity. Our team feels that using flaps to control the airflow in the intercooler
could be an effective way of providing that cooling. However, due to time limitations as well as
finite knowledge of intercooler systems, our team has not further investigated this idea to
determine its feasibility.
The air to air intercooler design was chosen over the water to air intercooler because it seemed
like a simpler design. A water to air intercooler would have required water storage, transport and
delivery which would be more difficult to accomplish than using air. For these reasons our team
chose the air to air intercooler.
Air Conditioning Unit – While our team felt that an air conditioning unit would be an effective
way of variable cooling for the air, we also felt that the parasitic losses due to an AC unit would
be large. Also, we the AC unit concept would cost a lot, require refrigerants making it more
complex, and would take up a lot of space. For these reasons our team dismissed the AC unit
concept.
System Order
Once determining the best components for each function of our system, our team focused on the
ordering of all these components. The first and most logical component would be the air intake
scoop. This is necessary to draw in air from the ambient and provide it to the rest of the system.
The second component in our design was the filter. This way the air can be filtered at a lower
pressure/flow rate. Also, since the filter is placed before the compressor, the issue of maintaining
pressure across the filter is a non issue. After the filter, we then decided to insert a compressor.
This will pressurize the rest of the system and will deliver the air at the correct pressure to the
fuel cell. The compressor was also placed third to assist with humidification. Immediately after
the compressor is the injection humidifier. The main reason for this specific humidifier
placement is because the temperature increase from the compressor will allow for more
humidification to occur at the higher temperature and pressure. The humidifier will also assist in
the cooling of the airflow. Last the air will travel through an intercooler where the air
temperature will be reduced.
CONCEPT DESCRIPTION
For our final design, our team put our individually chosen components from the concept
selection together into one assembly. This design includes a combination of an activated carbon
filter and Visteon dust filter to remove harmful substances, a screw compressor to increase
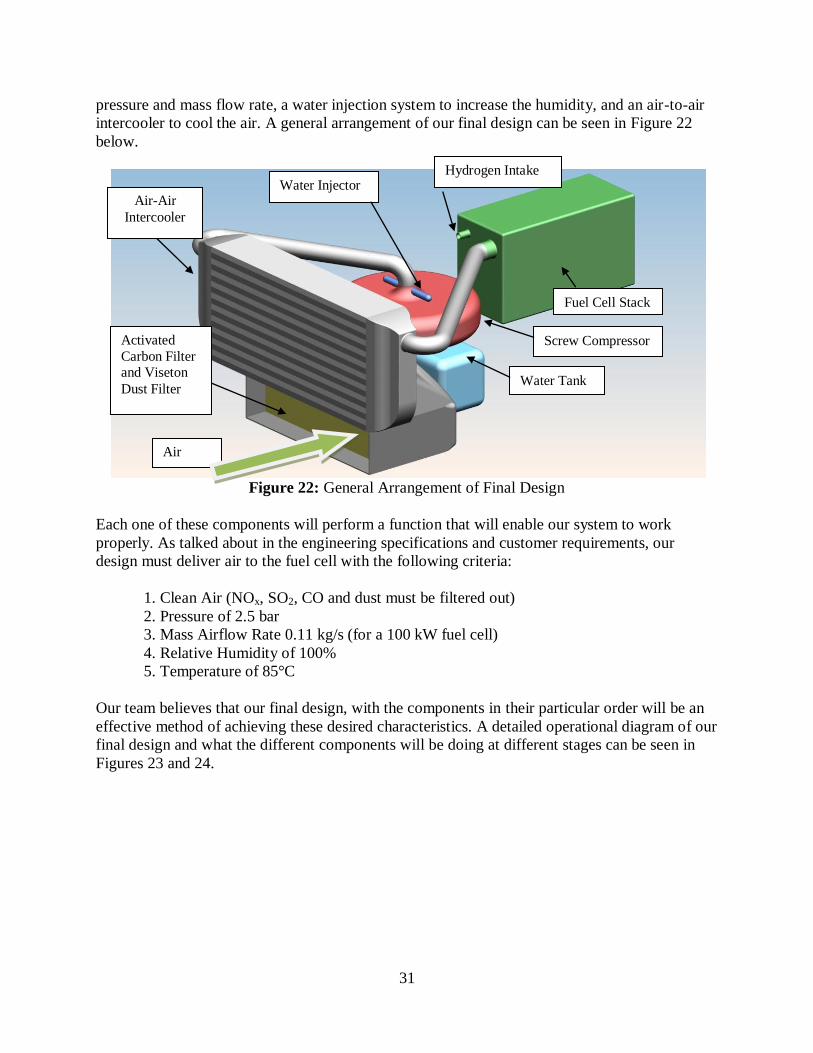
31
pressure and mass flow rate, a water injection system to increase the humidity, and an air-to-air
intercooler to cool the air. A general arrangement of our final design can be seen in Figure 22
below.
Figure 22: General Arrangement of Final Design
Each one of these components will perform a function that will enable our system to work
properly. As talked about in the engineering specifications and customer requirements, our
design must deliver air to the fuel cell with the following criteria:
1. Clean Air (NOx, SO2, CO and dust must be filtered out)
2. Pressure of 2.5 bar
3. Mass Airflow Rate 0.11 kg/s (for a 100 kW fuel cell)
4. Relative Humidity of 100%
5. Temperature of 85°C
Our team believes that our final design, with the components in their particular order will be an
effective method of achieving these desired characteristics. A detailed operational diagram of our
final design and what the different components will be doing at different stages can be seen in
Figures 23 and 24.
Water Tank
Hydrogen Intake
Activated
Carbon Filter
and Viseton
Dust Filter
Air
Flow
Air-Air
Intercooler
Screw Compressor
Water Injector
Fuel Cell Stack
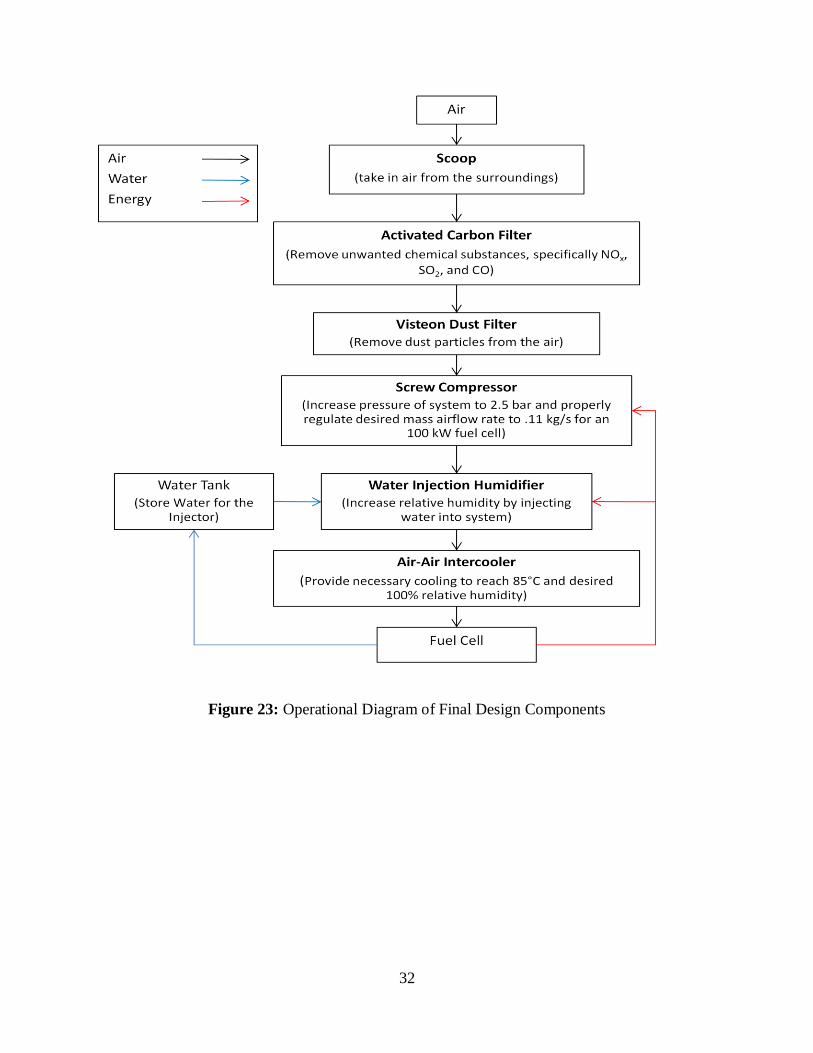
32
Figure 23: Operational Diagram of Final Design Components
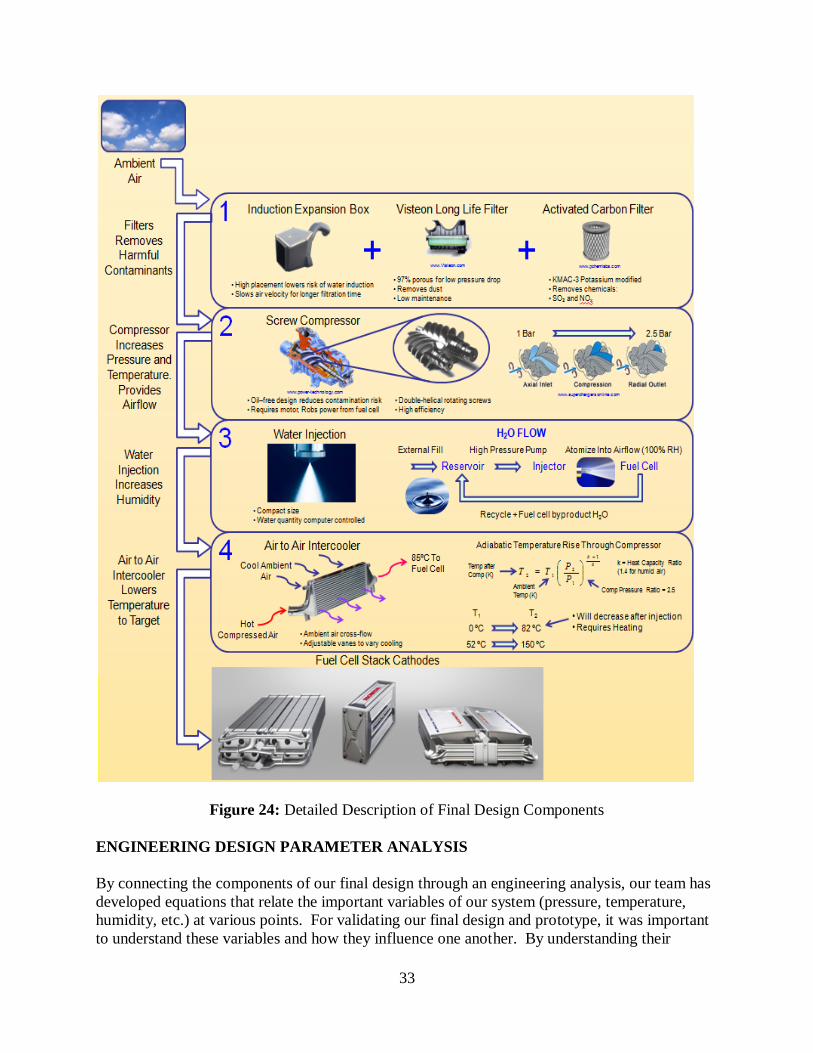
33
Figure 24: Detailed Description of Final Design Components
ENGINEERING DESIGN PARAMETER ANALYSIS
By connecting the components of our final design through an engineering analysis, our team has
developed equations that relate the important variables of our system (pressure, temperature,
humidity, etc.) at various points. For validating our final design and prototype, it was important
to understand these variables and how they influence one another. By understanding their
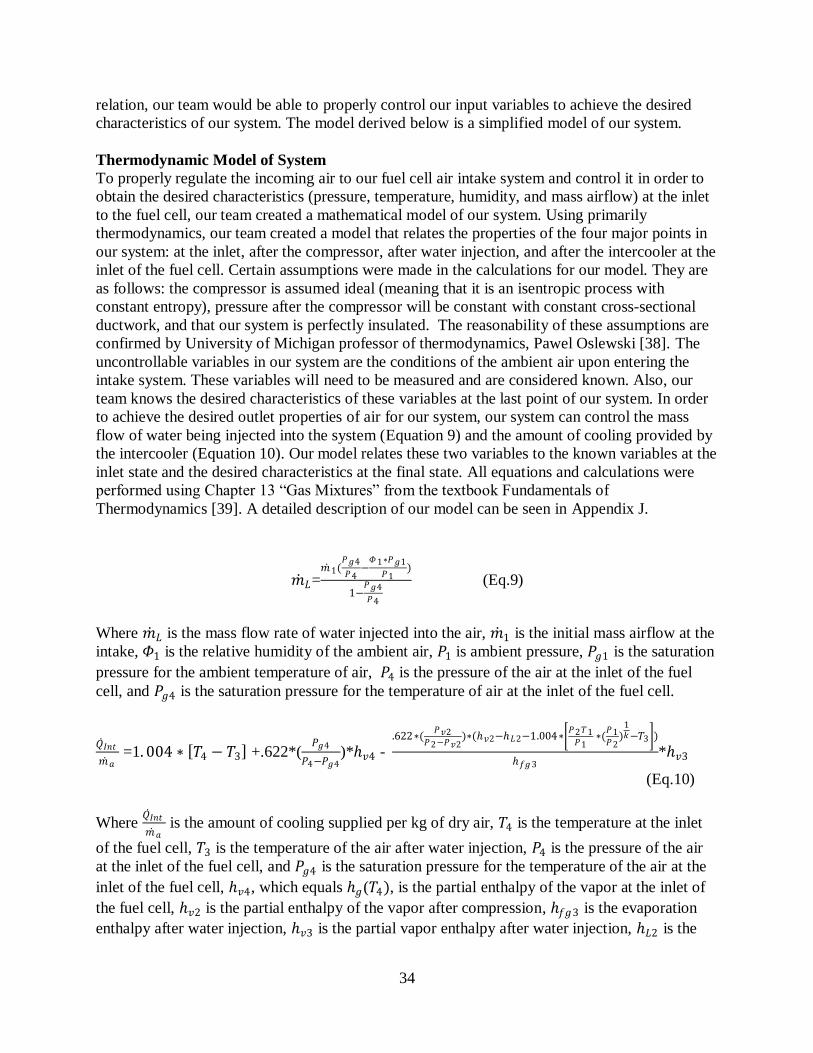
34
relation, our team would be able to properly control our input variables to achieve the desired
characteristics of our system. The model derived below is a simplified model of our system.
Thermodynamic Model of System
To properly regulate the incoming air to our fuel cell air intake system and control it in order to
obtain the desired characteristics (pressure, temperature, humidity, and mass airflow) at the inlet
to the fuel cell, our team created a mathematical model of our system. Using primarily
thermodynamics, our team created a model that relates the properties of the four major points in
our system: at the inlet, after the compressor, after water injection, and after the intercooler at the
inlet of the fuel cell. Certain assumptions were made in the calculations for our model. They are
as follows: the compressor is assumed ideal (meaning that it is an isentropic process with
constant entropy), pressure after the compressor will be constant with constant cross-sectional
ductwork, and that our system is perfectly insulated. The reasonability of these assumptions are
confirmed by University of Michigan professor of thermodynamics, Pawel Oslewski [38]. The
uncontrollable variables in our system are the conditions of the ambient air upon entering the
intake system. These variables will need to be measured and are considered known. Also, our
team knows the desired characteristics of these variables at the last point of our system. In order
to achieve the desired outlet properties of air for our system, our system can control the mass
flow of water being injected into the system (Equation 9) and the amount of cooling provided by
the intercooler (Equation 10). Our model relates these two variables to the known variables at the
inlet state and the desired characteristics at the final state. All equations and calculations were
performed using Chapter 13 “Gas Mixtures” from the textbook Fundamentals of
Thermodynamics [39]. A detailed description of our model can be seen in Appendix J.
𝑚 𝐿=𝑚 1(
𝑃𝑔4
𝑃4−
𝛷1∗𝑃𝑔1
𝑃1)
1−𝑃𝑔4
𝑃4
(Eq.9)
Where 𝑚 𝐿 is the mass flow rate of water injected into the air, 𝑚 1 is the initial mass airflow at the
intake, 𝛷1 is the relative humidity of the ambient air, 𝑃1 is ambient pressure, 𝑃𝑔1 is the saturation
pressure for the ambient temperature of air, 𝑃4 is the pressure of the air at the inlet of the fuel
cell, and 𝑃𝑔4 is the saturation pressure for the temperature of air at the inlet of the fuel cell.
𝑄 𝐼𝑛𝑡
𝑚 𝑎 =1. 004 ∗ 𝑇4 − 𝑇3 +.622*(
𝑃𝑔4
𝑃4−𝑃𝑔4)*𝑣4 -
.622∗(𝑃𝑣2
𝑃2−𝑃𝑣2)∗(𝑣2−𝐿2−1.004∗
𝑃2𝑇1𝑃1
∗(𝑃1𝑃2
)1𝑘−𝑇3 )
𝑓𝑔3*𝑣3
(Eq.10)
Where 𝑄 𝐼𝑛𝑡
𝑚 𝑎 is the amount of cooling supplied per kg of dry air, 𝑇4 is the temperature at the inlet
of the fuel cell, 𝑇3 is the temperature of the air after water injection, 𝑃4 is the pressure of the air
at the inlet of the fuel cell, and 𝑃𝑔4 is the saturation pressure for the temperature of the air at the
inlet of the fuel cell, 𝑣4, which equals 𝑔(𝑇4), is the partial enthalpy of the vapor at the inlet of
the fuel cell, 𝑣2 is the partial enthalpy of the vapor after compression, 𝑓𝑔3 is the evaporation
enthalpy after water injection, 𝑣3 is the partial vapor enthalpy after water injection, 𝐿2 is the

35
enthalpy of the water being injected, 𝑃2 is the pressure of the air after compression, k is the
isentropic constant for air, and 𝑇1is the ambient temperature.
Using Equation 9, we can estimate the amount of water required for the humidification system in
both the final design and prototype design. The mass flow corresponding to specific fuel cell
stack powers can be seen in Appendix K. For the final design, Figure 25 shows that the estimated
maximum amount of water required is around 33 g/sec. This was calculated under worst case
conditions for a 100kW fuel cell with completely dry (0% R.H.) ambient air at 0ºC. The final
design targets are the engineering specifications we have listed on P. 14. They are: pressure of
2.5 bar, temperature of 85ºC, and final humidity of 100% R.H.
Figure 25: Necessary Water to be Injected for Final Design
For the prototype design, Figure 26 shows that the estimated maximum amount of water required
is around 6 g/sec. This was calculated using worst case ambient air conditions (dry, 0% R.H. at
0ºC) and our prototype design targets (1.35 bar pressure, 40ºC at outlet, and 100% R.H. at
outlet).
5
10
15
20
25
30
35
40
0 0.1 0.2 0.3 0.4 0.5 0.6 0.7 0.8 0.9 1
Mas
s Fl
ow
of
Inje
cted
Wat
er (
gra
ms/
seco
nd
)
Relative Humidity (0-100%) for Ambient Air
Water Mass Flow Rates for Final Design
= Ambient Temperature is 0°C
= Ambient Temperature is 20°C
= Ambient Temperature is 40°C
= 100 kW Fuel Cell (Initial Mass Flow into Compressor is 0.110 𝑘𝑔
𝑠𝑒𝑐)
= 70 kW Fuel Cell (Initial Mass Flow into Compressor is 0.077 𝑘𝑔
𝑠𝑒𝑐)
= 50 kW Fuel Cell (Initial Mass Flow into Compressor is 0.055 𝑘𝑔
𝑠𝑒𝑐)
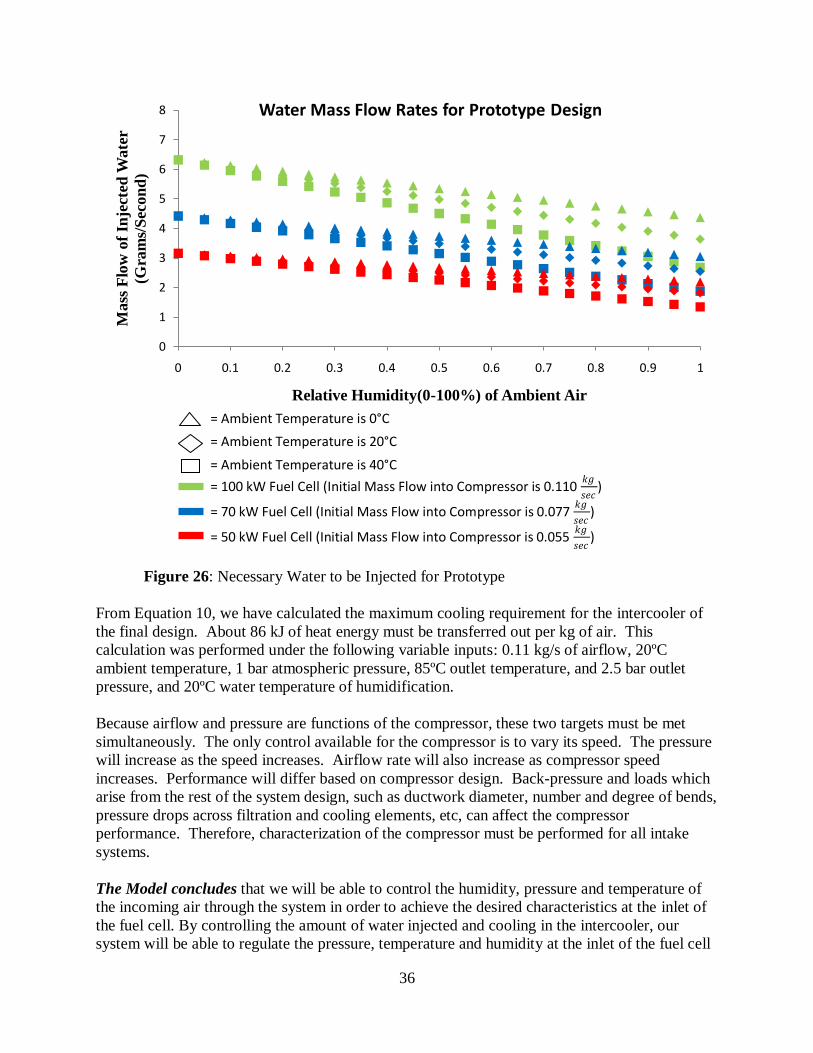
36
Figure 26: Necessary Water to be Injected for Prototype
From Equation 10, we have calculated the maximum cooling requirement for the intercooler of
the final design. About 86 kJ of heat energy must be transferred out per kg of air. This
calculation was performed under the following variable inputs: 0.11 kg/s of airflow, 20ºC
ambient temperature, 1 bar atmospheric pressure, 85ºC outlet temperature, and 2.5 bar outlet
pressure, and 20ºC water temperature of humidification.
Because airflow and pressure are functions of the compressor, these two targets must be met
simultaneously. The only control available for the compressor is to vary its speed. The pressure
will increase as the speed increases. Airflow rate will also increase as compressor speed
increases. Performance will differ based on compressor design. Back-pressure and loads which
arise from the rest of the system design, such as ductwork diameter, number and degree of bends,
pressure drops across filtration and cooling elements, etc, can affect the compressor
performance. Therefore, characterization of the compressor must be performed for all intake
systems.
The Model concludes that we will be able to control the humidity, pressure and temperature of
the incoming air through the system in order to achieve the desired characteristics at the inlet of
the fuel cell. By controlling the amount of water injected and cooling in the intercooler, our
system will be able to regulate the pressure, temperature and humidity at the inlet of the fuel cell
0
1
2
3
4
5
6
7
8
0 0.1 0.2 0.3 0.4 0.5 0.6 0.7 0.8 0.9 1
Mass
Flo
w o
f In
ject
ed W
ate
r
(Gra
ms/
Sec
on
d)
Relative Humidity(0-100%) of Ambient Air
Water Mass Flow Rates for Prototype Design
= Ambient Temperature is 0°C
= Ambient Temperature is 20°C
= Ambient Temperature is 40°C
= 100 kW Fuel Cell (Initial Mass Flow into Compressor is 0.110 𝑘𝑔
𝑠𝑒𝑐)
= 70 kW Fuel Cell (Initial Mass Flow into Compressor is 0.077 𝑘𝑔
𝑠𝑒𝑐)
= 50 kW Fuel Cell (Initial Mass Flow into Compressor is 0.055 𝑘𝑔
𝑠𝑒𝑐)

37
in order to achieve the optimal characteristics. Also, through proper control, we can ensure that
condensation does not occur in the system as relative humidity will only reach 100% after
cooling.
Problems with the Model - Our model does not address noise in our system or the pressure drop
across the filter before entering the compressor. These are two important variables in our system.
However, due to limitations in time and the fact that the dimensions of our scoop, filter and
ducting are unknown, these variables were not considered in our analysis.
Material Analysis Results
We performed an in depth analysis for the air intake system ducting and the pressure line
between the water tank and the injector. This analysis was focused around three factors:
minimizing cost while maintaining important functional criteria in order to pick an appropriate
material for each part, comparing the environmental effect of using these two materials, and
determining the most effective manufacturing process to create these parts.
Ducting
In our system the function of the ducting is to transport the air from component to component.
The important characteristics of the material used for ducting are a melting temperature above
150°C, a low thermal conductivity, and a high yield strength. Using these characteristics as a
guide lines for material selection along with the CES(Cambridge Engineering Selector) software,
we determined Polypropylene (PP, 65-70% barium sulfate) to be a good material choice for the
intake system ducting. Polypropylene has a melting temperature between 155-164°C, a high
yield strength of 1.49X10⁹ Pa and a low heat conductivity of .297 W/(m*K)
In order to determine an appropriate manufacturing process, we first needed to estimate how
many intake systems would likely be produced. With the assumption that our system would
likely be produced once the transition from combustion engines to fuel cell vehicles had
occurred, we assumed that our production volume would be similar to that of a popular mid-size
sedan. Currently, there are approximately 400,000 Camry‟s sold each year in the United States.
We found that the key characteristics of the ducting to keep in mind while picking the
manufacturing process were:
1. Large production volume
2. Constant diameter and thickness
3. Circular cross section
4. Material is a Polymer
Having a large production volume justifies the cost of investing in fast and efficient machinery
(Capital) because the investment cost will be distributed over a large number of parts produced.
Having a constant diameter and thickness and a circular cross section removes the need of more
complex manufacturing processes such as injecting molding. Because of these reasons, we
believe that the most appropriate manufacturing process to create our ducting is polymer
extrusion.

38
Injection line (Hoses)
In our system the function of the injection line is to transport the water from the water tank to the
injector. The important characteristics of the material used for ducting are high corrosion
resistance to water and capable of withstanding pressures up to 100 psi. Using these
characteristics as a guide lines for material selection along with the CES(Cambridge Engineering
Selector) software, we determined Polyvinylidene Chloride (PVDC) to be a good material choice
for the injection line.
As stated in the ducting section above, we determined our production volume to be around
400,000. Also similar to the ducting are the key characteristics to keep in mind while picking the
manufacturing process:
1. Large production volume
2. Constant diameter and thickness
3. Circular cross section
4. Material is a Polymer
Because of these characteristics, the best manufacturing process for the injection line would be
polymer extrusion.
Environmental
By using SimaPro, we were able to compare the environmental impact of using Polypropylene
and Polyvinylidene Chloride. We found that Polypropylene will have the most negative impact
on air, raw material, and waste, but Polyvinylidene Chloride will have a larger impact on water.
For a more detail analysis please refer to Appendix C.
Design for Safety
One of the important factors in our design, especially our prototype, was ensuring proper safety
precautions were taken. As mentioned in our material analysis in Appendix C, we used a safety
factor of 3 for our target pressures. We felt this would be sufficient as this is commonly used for
piping in general. For our prototype we used an overcautious safety factor of 30 as our cutoff
pressure was designed to be 10 psi and the PVC piping was designed to withstand pressures of
300 psi.
Another important safety measure designed into our prototype was the addition of a safety pop
valve. In the case that the pressure after compressor ever reached 10 psi, the valve would open
and ensure the pressure would drop. This was done less for the piping and more just to prevent
any unnecessary vibrations that might have arose from running high pressures on the system.
An additional safety measure taken for our prototype was using a variable torque drill with a
clutch that would release in the case that our compressor would seize. We ran the compressor
without using oil for lubrication and preventing possible rupture/flying debris caused from
seizure of the compressor was very important in ensuring safety.
Other safety measures included in our design were putting a pressure sensor on the water tank to
ensure we did not over pressurize it, putting a ball valve on our water injection line to ensure it
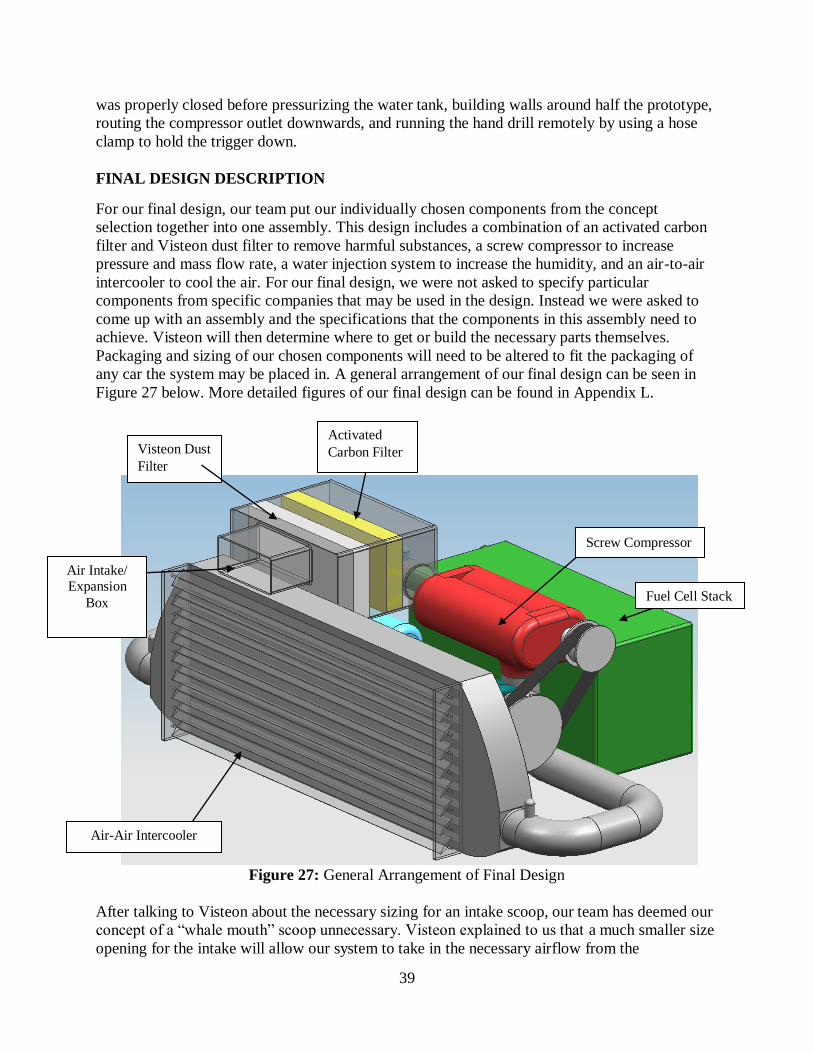
39
was properly closed before pressurizing the water tank, building walls around half the prototype,
routing the compressor outlet downwards, and running the hand drill remotely by using a hose
clamp to hold the trigger down.
FINAL DESIGN DESCRIPTION
For our final design, our team put our individually chosen components from the concept
selection together into one assembly. This design includes a combination of an activated carbon
filter and Visteon dust filter to remove harmful substances, a screw compressor to increase
pressure and mass flow rate, a water injection system to increase the humidity, and an air-to-air
intercooler to cool the air. For our final design, we were not asked to specify particular
components from specific companies that may be used in the design. Instead we were asked to
come up with an assembly and the specifications that the components in this assembly need to
achieve. Visteon will then determine where to get or build the necessary parts themselves.
Packaging and sizing of our chosen components will need to be altered to fit the packaging of
any car the system may be placed in. A general arrangement of our final design can be seen in
Figure 27 below. More detailed figures of our final design can be found in Appendix L.
Figure 27: General Arrangement of Final Design
After talking to Visteon about the necessary sizing for an intake scoop, our team has deemed our
concept of a “whale mouth” scoop unnecessary. Visteon explained to us that a much smaller size
opening for the intake will allow our system to take in the necessary airflow from the
Screw Compressor
Fuel Cell Stack
Visteon Dust
Filter
Air Intake/
Expansion
Box
Air-Air Intercooler
Activated
Carbon Filter
40
surroundings. So rather than listing a scoop as an individual component, we have chosen to start
our design with our filters.
However, the location concepts generated under the scoop component remained useful as where
to place out filter. We initially felt that the ground location for the scoop was a good idea due to
packaging constraints. However, if the intake is too low to the ground, problems may occur with
drawing in water from puddles. For that reason, we have decided to move the intake up further in
the vehicle to directly under the hood. This will provide protection from puddles and large debris
from entering the system. The intake hole will also need a mesh grating to ensure no large debris
can possibly enter our air intake system design.
The intake will directly lead into an expansion box (to create a larger surface area) between the
scoop and the compressor for two main reasons: First, slower airflow velocities at this point
allows for longer time durations in traveling across the filters, and therefore more effective
filtration. Second, placing the filters on the low pressure side of the compressor means it will not
be subject to such high pressures; filter elements may have negative effects on the airflow quality
if it is placed on the high pressure side.
We chose a Potassium Hydroxide solution Modified Activated Carbon filter to remove harmful
substances because of its high efficiency and long lifetime. It was found that 1ppm of NOx
entering the fuel cell may reduce performance as much as 10%. At 1ppm of SO2, the fuel cell
looses around 30% of its performance within just 5 hours of exposure [11]. The activated carbon
filter will be effective in controlling these harmful elements [10].
The Visteon dust filter was chosen to remove dust particles for its high efficiency and lifetime.
We do not need to detail this filter as Visteon is our sponsor and is very familiar with its
performance capability.
The third component of our design is a double helical, oil-free screw compressor. The screw
compressor was chosen due to its ability to achieve the desired pressure of 2.5 bar and the mass
airflow rate of 0.11 kg/s necessary for the fuel cell to achieve its maximum power of 100kW.
Oil-free is also a requirement, as clean air must be delivered to the fuel cell. In addition, screw
compressors are usually compact and fairly light. Power to run the compressor will be taken
from the power created by the fuel cell. Therefore it was very important to find a compressor that
causes the least amount of parasitic losses. Screw compressors are very efficient and should
minimize these losses.
While our team initially chose the scroll compressor for our final design, we later learned that it
could not deliver the necessary airflow and for that reason it was dismissed. Current scroll
compressors are designed to provide high pressures but low flow rates. A scroll compressor
which would achieve the airflow rates of 0.11 kg/s would greatly exceed the packaging restraints
[37]. While our team has chosen the screw compressor for the reasons above, we found that lobe
and centrifugal compressors are also capable for our air intake design. If Visteon wishes to
pursue one of these designs due to cost or for other reasons, the system as a whole would still
operate similarly.

41
After compression, our team chose to humidify the air through liquid injection. Water injection
was chosen due to its high precision in controlling the amount of water being put into the system.
The system will consist of a 10 gallon water tank that will be pressurized much higher than the
2.5 bar of the total system. This pressure will depend on the spray nozzle, and we recommend
experimental testing to determine optimum pressure settings. The system will take the
pressurized water and inject it into the system using either one or multiple spray nozzles into the
system. Multiple spray nozzles may be needed to achieve the water mass flows required (seen in
Appendix K).
Our team suggests using a 10 gallon water tank as a reservoir for injection. A 10 gallon water
tank should last approximately 20 minutes. For this reason, it is necessary to recycle the water
vapor created in the reaction of the fuel cell. The amount of water vapor created from the fuel
cell reaction should be more than sufficient in sustaining the injection system.
Our team designed the system to work at temperature ranges from 0-40ºC due to the fact that fuel
cell operation below 0°C is questionable and still being researched. However, if Visteon wants to
operate our water injection system at temperatures below 0°C, the temperature of the water
would also have to be controlled with a heating mechanism.
The location of our liquid injection is between the compressor and the intercooler. At this
location, the water is injected to high pressures and temperatures which will aid in mixing with
the airflow [36]. Water injection will also aid in the cooling of the air. By injecting before the
intercooler, our design must calculate and control the amount of water being injected such that a
relative humidity of 100% is attained after cooling.
The last component of our design is the air-to-air intercooler. The intercooler was chosen for its
simplicity in design and low power requirements. However, some way of performing variable
cooling, such as using flaps to control the exposed cross-sectional area, must be implemented
into a standard intercooler for our design to work. It is important to have variable cooling for our
intercooler in order to achieve the proper temperature of the air at the inlet of the fuel cell. The
intercooler is located at the front of the car to allow for a large volume flow rate of air exposure
for heat exchange to occur.
In our final design, three variables can be controlled to meet the desired characteristics at the
inlet of the fuel cell: the compressor speed, the amount of water being injected into the system,
and the amount of cooling delivered by the intercooler. The compressor speed can be regulated
by the power supplied to it. The water injection rate can be regulated by the back pressure on the
water tank. The variable cooling can be regulated by the amount exposed area to a cross flow
using flaps.
While our team has developed equations, seen in the Parameter Analysis section, that relate these
variables, sensors are necessary as part of our design to measure characteristics at particular
points in the system. To start, the ambient pressure, temperature, and humidity must be measured
at the inlet of the fuel cell. In addition the mass airflow at the inlet and the humidity after
compression should be measured. All information will be processed using a computer data
acquisition unit and related to the desired outputs of the air intake system. For more accurate
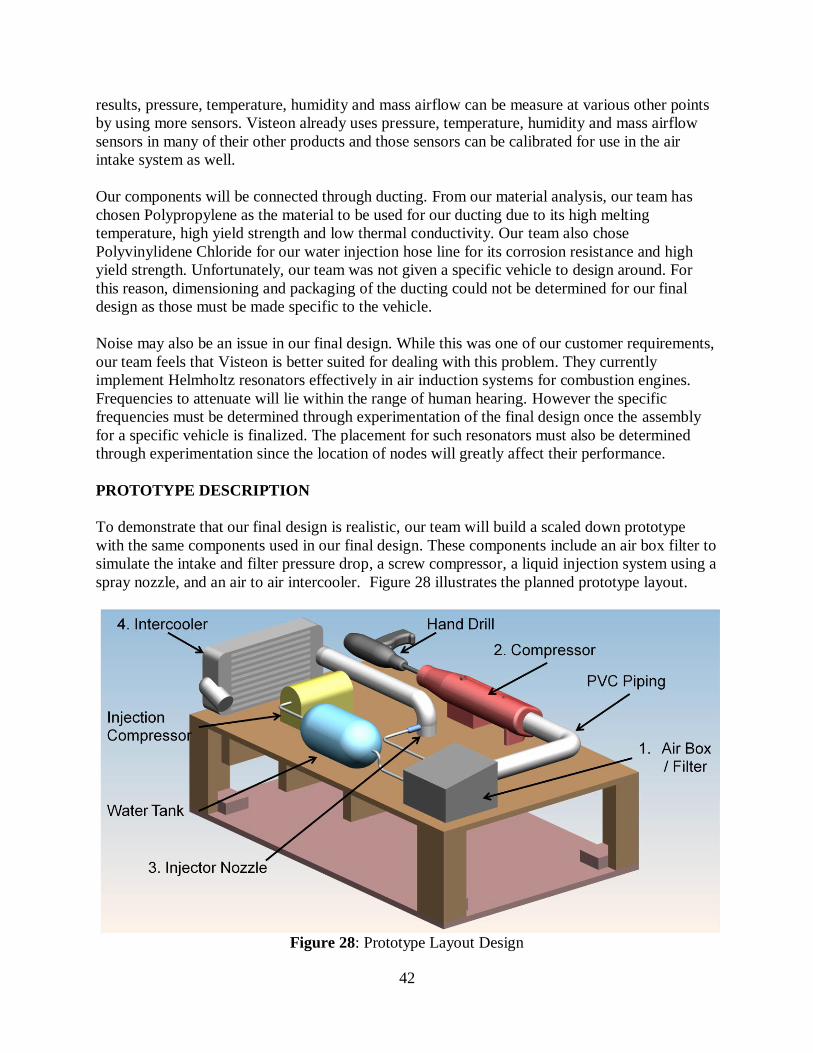
42
results, pressure, temperature, humidity and mass airflow can be measure at various other points
by using more sensors. Visteon already uses pressure, temperature, humidity and mass airflow
sensors in many of their other products and those sensors can be calibrated for use in the air
intake system as well.
Our components will be connected through ducting. From our material analysis, our team has
chosen Polypropylene as the material to be used for our ducting due to its high melting
temperature, high yield strength and low thermal conductivity. Our team also chose
Polyvinylidene Chloride for our water injection hose line for its corrosion resistance and high
yield strength. Unfortunately, our team was not given a specific vehicle to design around. For
this reason, dimensioning and packaging of the ducting could not be determined for our final
design as those must be made specific to the vehicle.
Noise may also be an issue in our final design. While this was one of our customer requirements,
our team feels that Visteon is better suited for dealing with this problem. They currently
implement Helmholtz resonators effectively in air induction systems for combustion engines.
Frequencies to attenuate will lie within the range of human hearing. However the specific
frequencies must be determined through experimentation of the final design once the assembly
for a specific vehicle is finalized. The placement for such resonators must also be determined
through experimentation since the location of nodes will greatly affect their performance.
PROTOTYPE DESCRIPTION
To demonstrate that our final design is realistic, our team will build a scaled down prototype
with the same components used in our final design. These components include an air box filter to
simulate the intake and filter pressure drop, a screw compressor, a liquid injection system using a
spray nozzle, and an air to air intercooler. Figure 28 illustrates the planned prototype layout.
Figure 28: Prototype Layout Design
43
The air is drawn in through the air box / filter, which is the first component of our prototype. It
is attached to the screw compressor through PVC piping. The screw compressor is directly
attached to and driven by an electric hand drill. The screw compressor outlet is directed
downwards through the platform and is routed back up through PVC piping. Directly after the
compressor, before the air is directed back on top of the table, our team placed a pressure release
pop valve in case pressures were unexpectedly high for safety reasons. Once the air is routed
back above the table, the injection humidifier system sprays water in through a spray nozzle.
The water is supplied by a water tank, which is pressurized through pumping by hand. The tank
has a pressure sensor attached so it can be pumped to a particular pressure and has a ball valve to
release flow when necessary. After injection, the PVC piping routes to the air-to-air intercooler
where two hair dryers will supply the necessary air cross-flow for heat exchange. Although not
shown, the outlet of the intercooler has additional PVC piping extending out of it which is
attached to a ball valve for control of the system‟s back-pressure. We have temperature, pressure,
and humidity sensors located at the end to measure the output. All components and parts are
securely mounted to the platform. A detailed list of all materials/components used for our
prototype can be seen in Appendix A.
Prototype Vs Final Design
Due to budget and time constraints our prototype will not be able to demonstrate every aspect of
our final design. Instead it will focus on the most important functions: pressurization,
humidification, and cooling.
Omitted Aspects
The other important aspects of our final design that will not be demonstrated are filtration, noise
dissipation, and packaging. Filtration will not be demonstrated because of our limited budget and
inability to measure the effectiveness of the filter due to lack of measurement equipment. Noise
dissipation will be an important aspect of our final design; however, we will not have the
equipment necessary to determine the problem frequencies nor will we have the time to add the
appropriate resonators. In addition, Visteon, our sponsor, has much experience in noise
dampening for combustion engines, and therefore, has little need in proving this functionality.
Last of all, we will not be demonstrating the packaging of our final design. As previously
discussed, we have been asked to design a general air intake system for a fuel cell vehicle. While
this has required some research into the relative location of our components, there is no specific
packaging in which our final design is based upon.
Reduced Targets
For our prototype, we have decided the most important aspects to be pressurization,
humidification, and temperature control. We have chosen these functions as they are most vital
in the performance of the fuel cell, as well as affecting the functionality of each component. Due
to safety concerns and the environment in which the prototype will be demonstrated, we reduced
the targets for each function. Our target for pressure was reduced from 2.5 bar in the final design
to 1.35 bar for the prototype. This was high enough to demonstrate the ability to increase the
pressure to a set value while maintaining a safe system. Our target for humidification was
maintained at 100% R.H. because we believed this characteristic was achievable and did not
pose a safety risk. For temperature control, we had a target of 40°C, which was lowered from
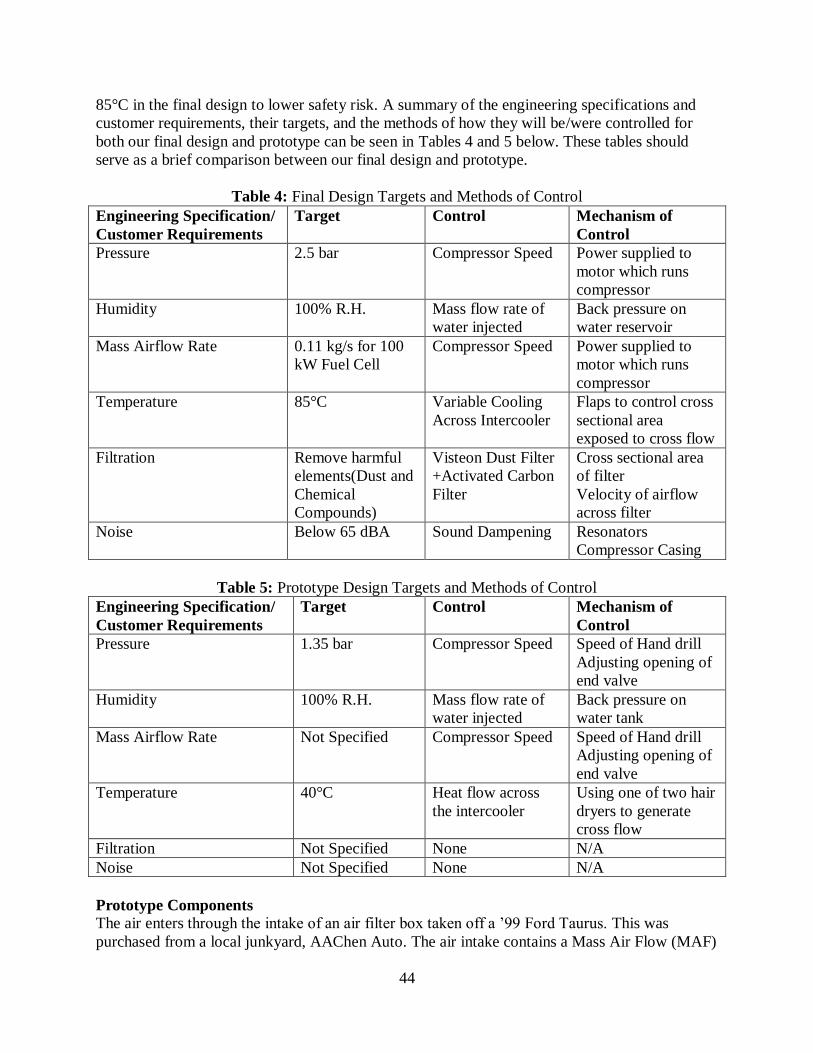
44
85°C in the final design to lower safety risk. A summary of the engineering specifications and
customer requirements, their targets, and the methods of how they will be/were controlled for
both our final design and prototype can be seen in Tables 4 and 5 below. These tables should
serve as a brief comparison between our final design and prototype.
Table 4: Final Design Targets and Methods of Control
Engineering Specification/
Customer Requirements
Target Control Mechanism of
Control
Pressure 2.5 bar Compressor Speed Power supplied to
motor which runs
compressor
Humidity 100% R.H. Mass flow rate of
water injected
Back pressure on
water reservoir
Mass Airflow Rate 0.11 kg/s for 100
kW Fuel Cell
Compressor Speed Power supplied to
motor which runs
compressor
Temperature 85°C Variable Cooling
Across Intercooler
Flaps to control cross
sectional area
exposed to cross flow
Filtration Remove harmful
elements(Dust and
Chemical
Compounds)
Visteon Dust Filter
+Activated Carbon
Filter
Cross sectional area
of filter
Velocity of airflow
across filter
Noise Below 65 dBA Sound Dampening Resonators
Compressor Casing
Table 5: Prototype Design Targets and Methods of Control
Engineering Specification/
Customer Requirements
Target Control Mechanism of
Control
Pressure 1.35 bar Compressor Speed Speed of Hand drill
Adjusting opening of
end valve
Humidity 100% R.H. Mass flow rate of
water injected
Back pressure on
water tank
Mass Airflow Rate Not Specified Compressor Speed Speed of Hand drill
Adjusting opening of
end valve
Temperature 40°C Heat flow across
the intercooler
Using one of two hair
dryers to generate
cross flow
Filtration Not Specified None N/A
Noise Not Specified None N/A
Prototype Components
The air enters through the intake of an air filter box taken off a ‟99 Ford Taurus. This was
purchased from a local junkyard, AAChen Auto. The air intake contains a Mass Air Flow (MAF)
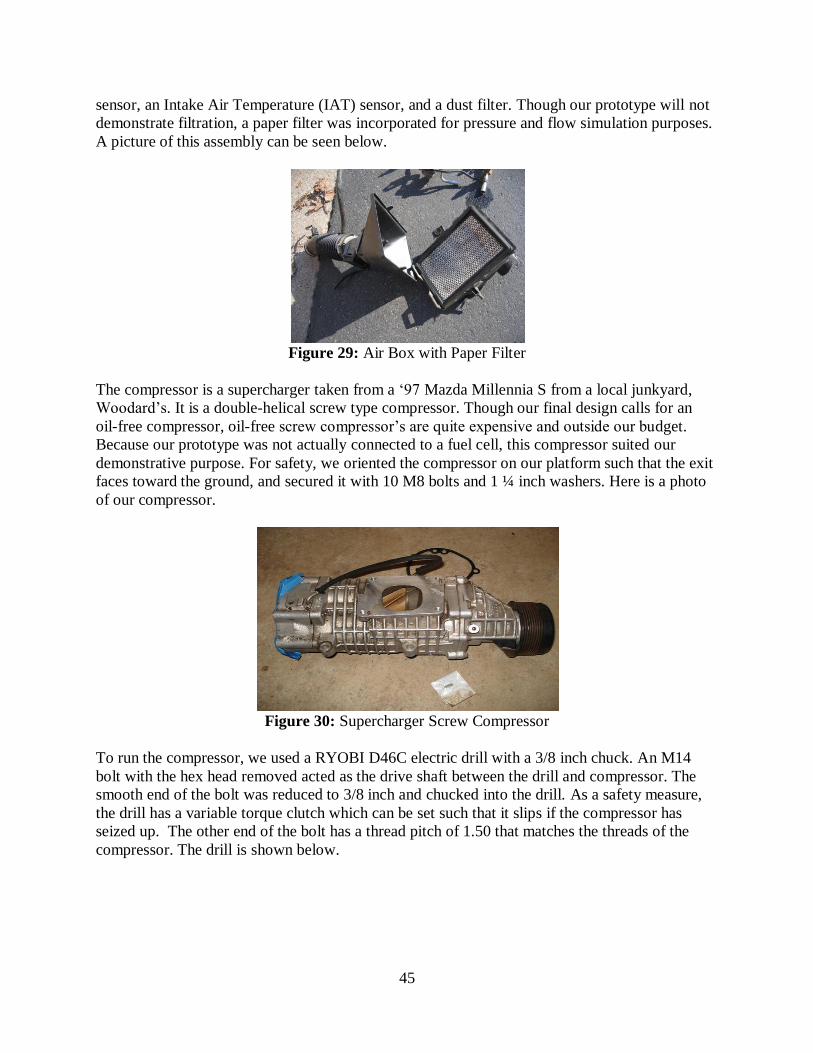
45
sensor, an Intake Air Temperature (IAT) sensor, and a dust filter. Though our prototype will not
demonstrate filtration, a paper filter was incorporated for pressure and flow simulation purposes.
A picture of this assembly can be seen below.
Figure 29: Air Box with Paper Filter
The compressor is a supercharger taken from a „97 Mazda Millennia S from a local junkyard,
Woodard‟s. It is a double-helical screw type compressor. Though our final design calls for an
oil-free compressor, oil-free screw compressor‟s are quite expensive and outside our budget.
Because our prototype was not actually connected to a fuel cell, this compressor suited our
demonstrative purpose. For safety, we oriented the compressor on our platform such that the exit
faces toward the ground, and secured it with 10 M8 bolts and 1 ¼ inch washers. Here is a photo
of our compressor.
Figure 30: Supercharger Screw Compressor
To run the compressor, we used a RYOBI D46C electric drill with a 3/8 inch chuck. An M14
bolt with the hex head removed acted as the drive shaft between the drill and compressor. The
smooth end of the bolt was reduced to 3/8 inch and chucked into the drill. As a safety measure,
the drill has a variable torque clutch which can be set such that it slips if the compressor has
seized up. The other end of the bolt has a thread pitch of 1.50 that matches the threads of the
compressor. The drill is shown below.

46
www.homedepot.com/webapp/wcs/stores/servlet/ProductDisplay
Figure 31: Ryobi Hand Drill
After exiting the compressor, airflow enters 2 inch PVC piping. The PVC will route the airflow
across the board where a pop valve will release pressure if the system reaches 10 psi. This was
done to ensure safety when testing as the compressor was bought used and the amount of power
required to achieve particular pressures was unknown. A picture of the pop valve already
installed in our piping can be seen below in Figure 32.
Figure 32: Safety Pop Valve
The pipe will then route the air back up through the plywood. Once the flow has been routed to
the top of the platform it will pass by our water injection system. A Monarch spray nozzle with a
tip angle of 80° is connected to a water tank which is pressured from hand pumping. Pictures of
our nozzle and water tank with its attached pressure gauge can be seen below in Figures 33 & 34.
This pressure pushes the water through a spray nozzle creating a fine mist in the PVC piping.
The nozzle is directly fixed and sealed into the piping. The amount of water injected into our
system will be controlled by a changing the pressure in the water tank. We placed a pressure
sensor on the water tank so that we can accurately supply a particular back pressure on the water.
A ball valve has been attached to the piping from the tank. When closed it will allow us to build
up pressure in the tank by hand pumping and then it can be opened to allow the water to enter the
system whenever we run it.
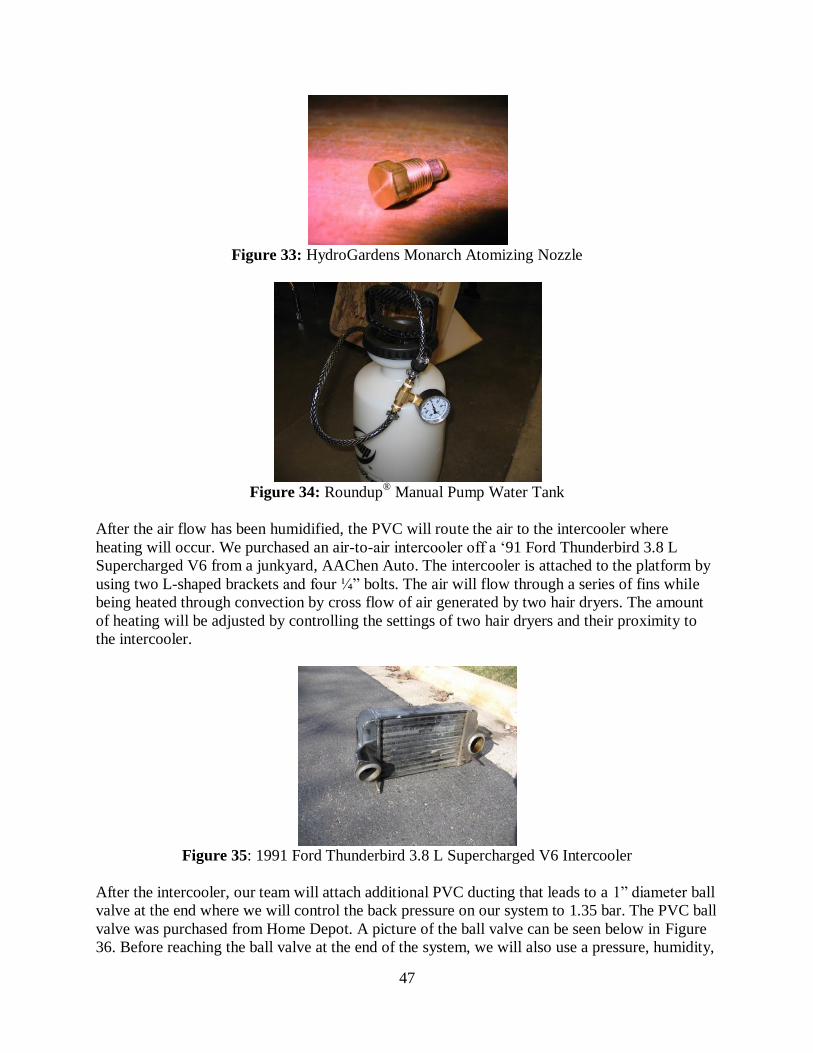
47
Figure 33: HydroGardens Monarch Atomizing Nozzle
Figure 34: Roundup
® Manual Pump Water Tank
After the air flow has been humidified, the PVC will route the air to the intercooler where
heating will occur. We purchased an air-to-air intercooler off a „91 Ford Thunderbird 3.8 L
Supercharged V6 from a junkyard, AAChen Auto. The intercooler is attached to the platform by
using two L-shaped brackets and four ¼” bolts. The air will flow through a series of fins while
being heated through convection by cross flow of air generated by two hair dryers. The amount
of heating will be adjusted by controlling the settings of two hair dryers and their proximity to
the intercooler.
Figure 35: 1991 Ford Thunderbird 3.8 L Supercharged V6 Intercooler
After the intercooler, our team will attach additional PVC ducting that leads to a 1” diameter ball
valve at the end where we will control the back pressure on our system to 1.35 bar. The PVC ball
valve was purchased from Home Depot. A picture of the ball valve can be seen below in Figure
36. Before reaching the ball valve at the end of the system, we will also use a pressure, humidity,

48
and temperature sensor in the PVC pipe. These sensors will be used to validate our final results.
The pressure sensor is a boost gauge from AutoZone. The humidity sensor is an HIH-4033
sensor made by Honeywell and was purchased online. For temperature readings, we used an
Omega thermocouple reader acquired from Tom Bress, instructional core manager for the
mechanical engineering department at the University of Michigan. Pictures of our pressure
gauge, humidity sensor, and thermocouple reader are shown below.
Figure 36: 1” PVC Ball Valve
Figure 37: Pressure Gauge
Figure 38: HIH-4033 Humidity Sensor
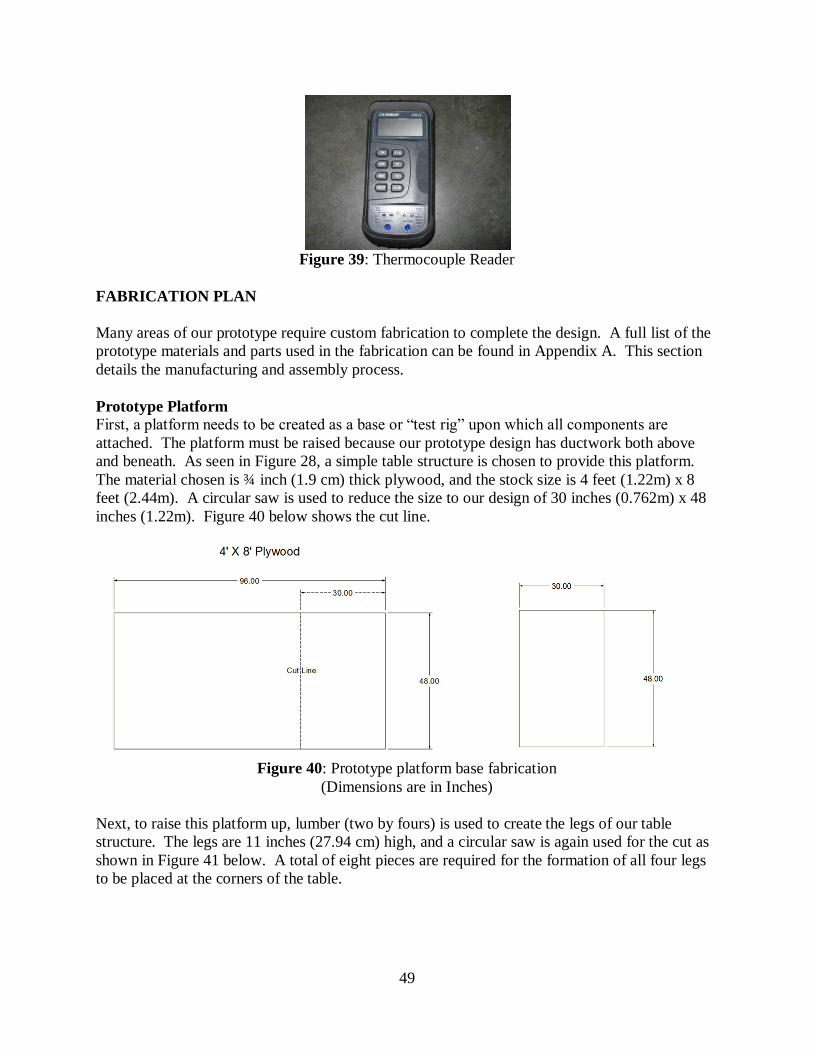
49
Figure 39: Thermocouple Reader
FABRICATION PLAN
Many areas of our prototype require custom fabrication to complete the design. A full list of the
prototype materials and parts used in the fabrication can be found in Appendix A. This section
details the manufacturing and assembly process.
Prototype Platform
First, a platform needs to be created as a base or “test rig” upon which all components are
attached. The platform must be raised because our prototype design has ductwork both above
and beneath. As seen in Figure 28, a simple table structure is chosen to provide this platform.
The material chosen is ¾ inch (1.9 cm) thick plywood, and the stock size is 4 feet (1.22m) x 8
feet (2.44m). A circular saw is used to reduce the size to our design of 30 inches (0.762m) x 48
inches (1.22m). Figure 40 below shows the cut line.
Figure 40: Prototype platform base fabrication
(Dimensions are in Inches)
Next, to raise this platform up, lumber (two by fours) is used to create the legs of our table
structure. The legs are 11 inches (27.94 cm) high, and a circular saw is again used for the cut as
shown in Figure 41 below. A total of eight pieces are required for the formation of all four legs
to be placed at the corners of the table.

50
Figure 41: Cutting of Platform leg pieces (Dimensions are in Inches)
Each leg requires two pieces. First, one piece is laid flat on the ground and another one placed
on top, such that it makes an L-shape. It is important that both the outside edge and bottom are
flush. Then, the two pieces are secured together using three 2” deck screws at approximately an
even length apart. This step is repeated three more times so that four leg posts are created.
Figure 42: Platform Legs Fabrication
Now it is time to attach the leg posts to the 30 inch x 48 inch plywood. One leg assembly is
placed at each corner of the plywood. They are oriented such that their longest dimension is
perpendicular to the platform surface. One leg is secured at a time with three 2” deck screws
from above as indicated by Figure 43. The screw locations are not critical, but approximately
along the midpoints of the leg cross-section. Our criteria involved maximizing load distribution
by spreading out the screw locations as evenly as possible.
2” Deck
Screws
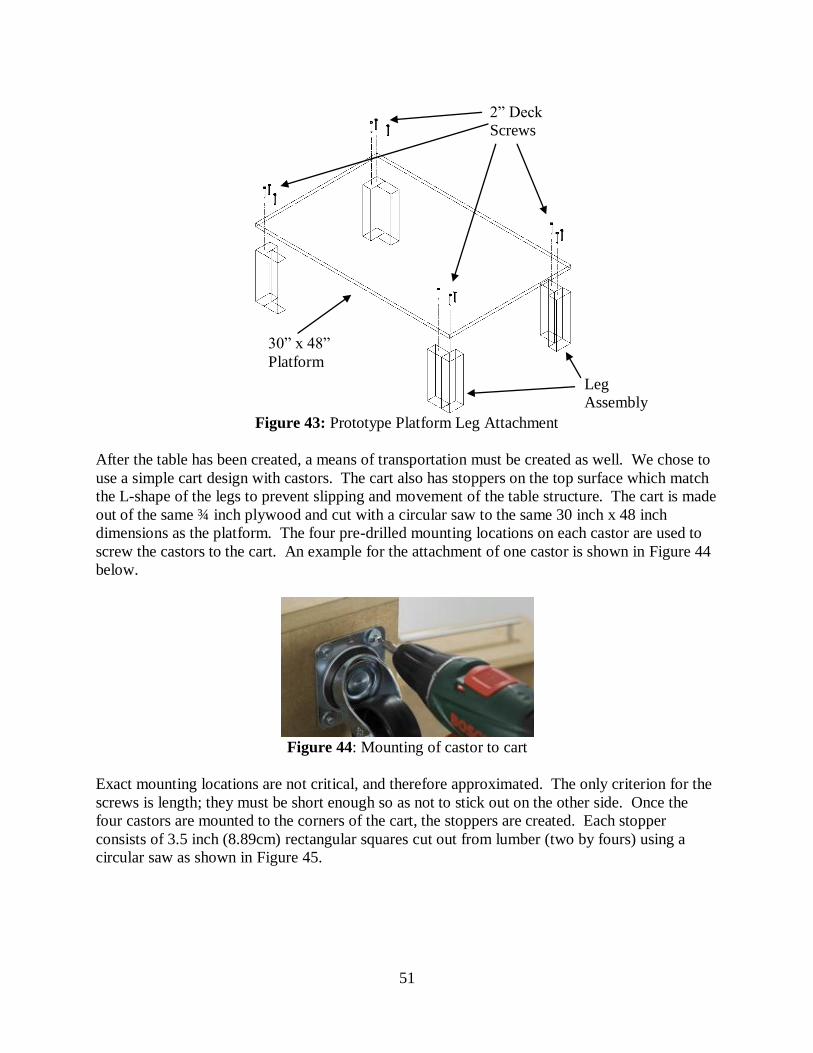
51
Figure 43: Prototype Platform Leg Attachment
After the table has been created, a means of transportation must be created as well. We chose to
use a simple cart design with castors. The cart also has stoppers on the top surface which match
the L-shape of the legs to prevent slipping and movement of the table structure. The cart is made
out of the same ¾ inch plywood and cut with a circular saw to the same 30 inch x 48 inch
dimensions as the platform. The four pre-drilled mounting locations on each castor are used to
screw the castors to the cart. An example for the attachment of one castor is shown in Figure 44
below.
Figure 44: Mounting of castor to cart
Exact mounting locations are not critical, and therefore approximated. The only criterion for the
screws is length; they must be short enough so as not to stick out on the other side. Once the
four castors are mounted to the corners of the cart, the stoppers are created. Each stopper
consists of 3.5 inch (8.89cm) rectangular squares cut out from lumber (two by fours) using a
circular saw as shown in Figure 45.
2” Deck
Screws
30” x 48”
Platform
Leg
Assembly
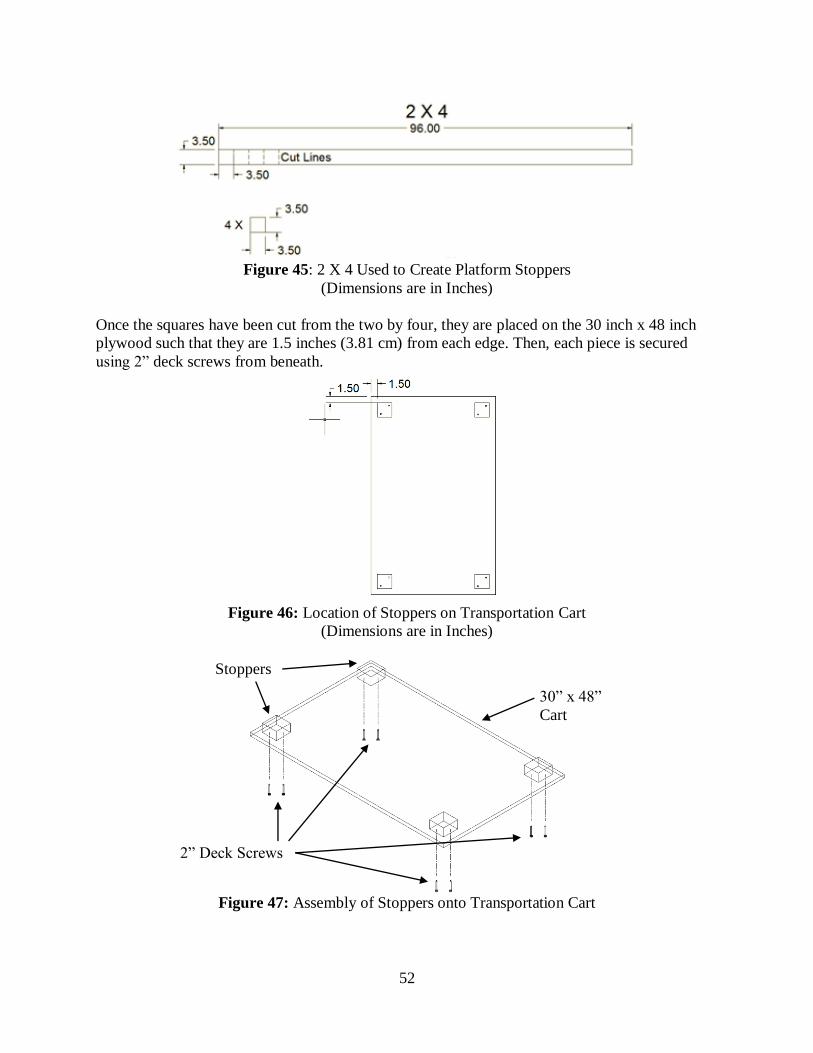
52
Figure 45: 2 X 4 Used to Create Platform Stoppers
(Dimensions are in Inches)
Once the squares have been cut from the two by four, they are placed on the 30 inch x 48 inch
plywood such that they are 1.5 inches (3.81 cm) from each edge. Then, each piece is secured
using 2” deck screws from beneath.
Figure 46: Location of Stoppers on Transportation Cart
(Dimensions are in Inches)
Figure 47: Assembly of Stoppers onto Transportation Cart
2” Deck Screws
Stoppers
30” x 48”
Cart

53
Figure 48: Table and Cart Assembly
To provide support and increase bending strength of the platform, three pieces of lumber (two by
four) are cut to a length of 26 inches (66 cm) with a circular saw.
Figure 49: Support Beam Dimensions
They are fixed underneath the platform at the locations shown in Figure 50. The orientation of
the support beams is chosen to maximize the bending stiffness of the platform against the
bending moments created by the drill and compressor shafts. Three 3” deck screws about 9
inches (22.86 cm) apart are applied from above for each support beam.
Platform
Cart
3X

54
Figure 50: Support Beams for increased bending stiffness
A support beam is also placed in the longitudinal direction of the platform to increase stiffness
against the bending moment caused by the weight of the compressor. This beam is made with a
piece of lumber (two by six) cut to a length of 37.5 inches (95.25 cm) with a circular saw.
Figure 51: Longitudinal support beam dimensions
It is placed along the edge closest to the compressor mount location, between the leg posts, and
fastened using six 3” deck screws from above, placed about six inches evenly apart as shown in
Figure 52.
3” Deck Screws
Support Beams
Increased
Bending
Stiffness

55
Figure 52: Longitudinal Support Beams
One safety measure that is built into our prototype includes walls on the two most dangerous
sides. ¾ inch plywood is used to make these walls along the edge where the compressor and
drill mount, as well as the edge where the intercooler outlet faces. The finished walls are shown
in Figure 53 below.
Figure 53: Safety Wall Locations
For the wall along the compressor, the ¾ inch plywood is first cut to 48 inches (1.22 m) x 23
inches (58.42 cm) with a circular saw.
Figure 54: Dimensions of Wall Along Compressor (in inches)
3” Deck Screws
Support Beam
Increased
Bending
Stiffness
Wall Along
Compressor/Drill
Edge
Wall
Facing Air
Outlet
Outlet
Piping

56
Next, lumber (two by four) is used to create the attachment posts. Using a circular saw, two
pieces are cut to a length of 33.5 inches (85.09 cm) and fixed 21 inches (53.34 cm) into the wall
along each width with six 3” deck screws each such that 12 inches (30.48 cm) protrudes from the
bottom wall edge. A third piece is cut to 27 inches (68.58 cm) and also fixed 21 inches into the
wall at its midpoint with six 3” deck screws.
Figure 55: Attachment posts for compressor side safety wall
The protrusions allow for attachment to the table at the leg posts. Four 3” deck screws are used
for each post and the locations are shown in Figure 56, below.
Figure 56: Attachment of compressor side safety wall to platform
3” Deck Screws
Posts
3” Deck Screws
Wall Table
Platform

57
The wall facing the ducting‟s final outlet is built in the same manner. The remaining ¾ inch
plywood is cut to 22 inches (55.88 cm) x 22.5 inches (57.15 cm) with a circular saw.
Figure 57: Outlet side safety wall dimensions
Next, lumber (two by four) is used to create the attachment posts. Using a circular saw, these are
cut to a length of 32.5 inches (82.55 cm) and fixed 20.5 inches (52.07 cm) into the wall along
each width with four 3” deck screws each such that 12 inches (30.48 cm) protrudes from the
bottom wall edge.
Figure 58: Attachment posts for outlet side safety wall
The protrusions allow for attachment to the table at the leg posts. Four 3” deck screws are used
for each post and the locations are shown in Figure 59.
3” Deck Screws
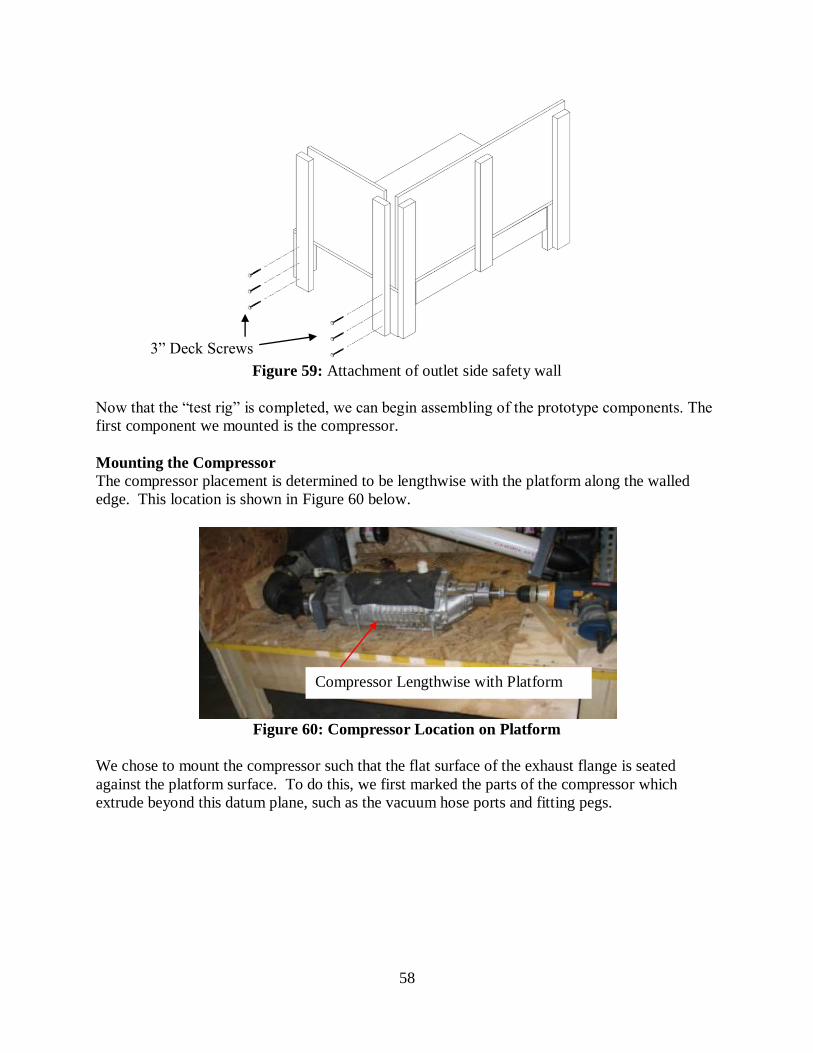
58
Figure 59: Attachment of outlet side safety wall
Now that the “test rig” is completed, we can begin assembling of the prototype components. The
first component we mounted is the compressor.
Mounting the Compressor
The compressor placement is determined to be lengthwise with the platform along the walled
edge. This location is shown in Figure 60 below.
Figure 60: Compressor Location on Platform
We chose to mount the compressor such that the flat surface of the exhaust flange is seated
against the platform surface. To do this, we first marked the parts of the compressor which
extrude beyond this datum plane, such as the vacuum hose ports and fitting pegs.
3” Deck Screws
Compressor Lengthwise with Platform

59
Figure 61: Compressor underside with extrusions to flat surface
Using whiteout and placing the compressor in the appropriate spot, we are able to stamp the
areas on the platform which must be recessed for clearance. A hand drill is used to remove
material until the compressor sits flush with its flanges.
Figure 62: Compressor sits flush on platform with exhaust flange
Next, the stock bolt locations of the compressor are marked onto the platform with the same
whiteout technique. All bolts used by the compressor are metric M8 bolts with 1.25 pitch. 3/8
inch holes are drilled with a hand drill clear through the platform for the bolts. Large 2” fender
washers are used to distribute the clamping force as much as possible. The four bolts along the
perimeter of the compressor are tightened down to 10 lb-ft and directly hold the compressor to
the platform.
Pegs
Vacuum Hose Ports Exhaust
Flange
Exhaust Flange
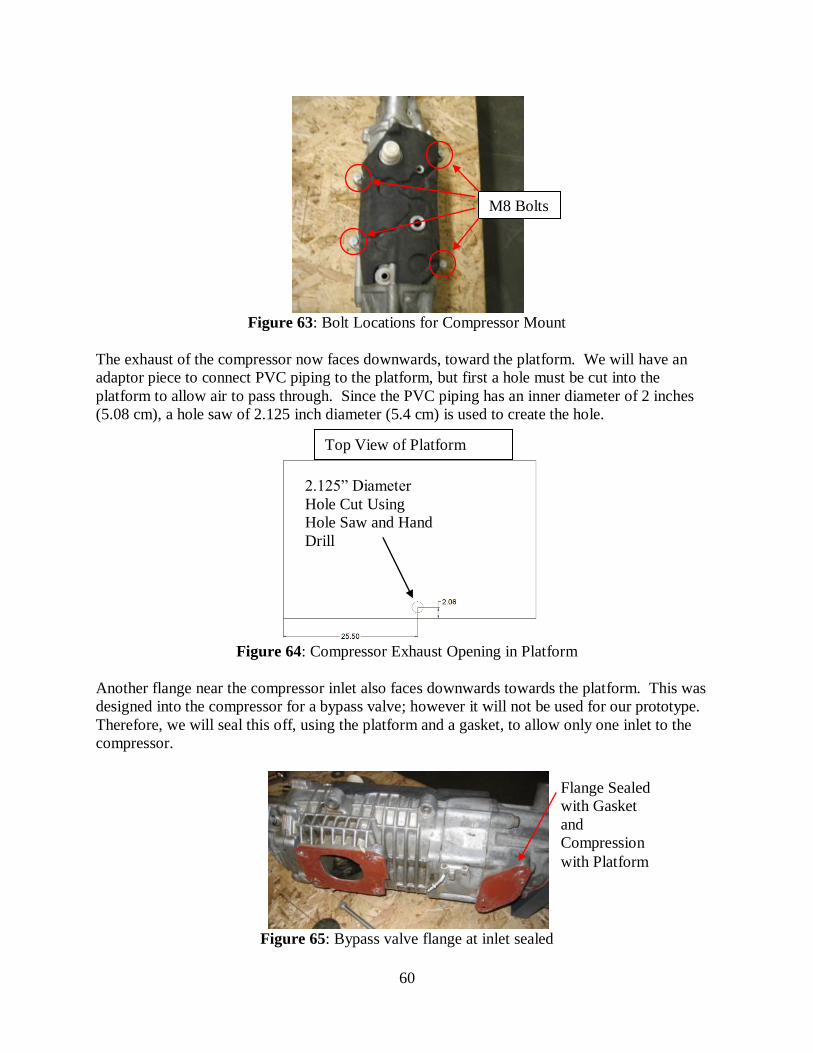
60
Figure 63: Bolt Locations for Compressor Mount
The exhaust of the compressor now faces downwards, toward the platform. We will have an
adaptor piece to connect PVC piping to the platform, but first a hole must be cut into the
platform to allow air to pass through. Since the PVC piping has an inner diameter of 2 inches
(5.08 cm), a hole saw of 2.125 inch diameter (5.4 cm) is used to create the hole.
Figure 64: Compressor Exhaust Opening in Platform
Another flange near the compressor inlet also faces downwards towards the platform. This was
designed into the compressor for a bypass valve; however it will not be used for our prototype.
Therefore, we will seal this off, using the platform and a gasket, to allow only one inlet to the
compressor.
Figure 65: Bypass valve flange at inlet sealed
M8 Bolts
Top View of Platform
2.125” Diameter
Hole Cut Using
Hole Saw and Hand
Drill
Flange Sealed
with Gasket
and
Compression
with Platform
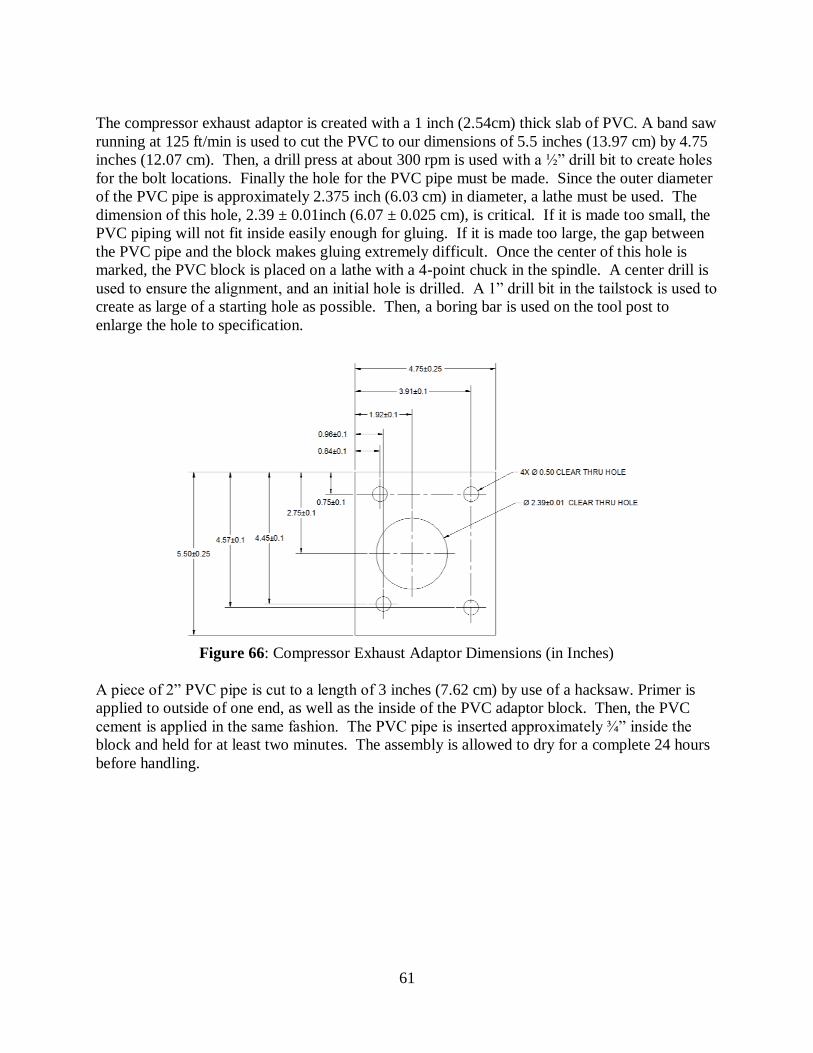
61
The compressor exhaust adaptor is created with a 1 inch (2.54cm) thick slab of PVC. A band saw
running at 125 ft/min is used to cut the PVC to our dimensions of 5.5 inches (13.97 cm) by 4.75
inches (12.07 cm). Then, a drill press at about 300 rpm is used with a ½” drill bit to create holes
for the bolt locations. Finally the hole for the PVC pipe must be made. Since the outer diameter
of the PVC pipe is approximately 2.375 inch (6.03 cm) in diameter, a lathe must be used. The
dimension of this hole, 2.39 ± 0.01inch (6.07 ± 0.025 cm), is critical. If it is made too small, the
PVC piping will not fit inside easily enough for gluing. If it is made too large, the gap between
the PVC pipe and the block makes gluing extremely difficult. Once the center of this hole is
marked, the PVC block is placed on a lathe with a 4-point chuck in the spindle. A center drill is
used to ensure the alignment, and an initial hole is drilled. A 1” drill bit in the tailstock is used to
create as large of a starting hole as possible. Then, a boring bar is used on the tool post to
enlarge the hole to specification.
Figure 66: Compressor Exhaust Adaptor Dimensions (in Inches)
A piece of 2” PVC pipe is cut to a length of 3 inches (7.62 cm) by use of a hacksaw. Primer is
applied to outside of one end, as well as the inside of the PVC adaptor block. Then, the PVC
cement is applied in the same fashion. The PVC pipe is inserted approximately ¾” inside the
block and held for at least two minutes. The assembly is allowed to dry for a complete 24 hours
before handling.

62
Figure 67: Compressor Exhaust Adaptor
Four M8 bolts inserted from underneath with 1.5” fender washers hold the compressor exhaust
adaptor to the platform.
Figure 68: Compressor exhaust adaptor mounted
A similar process is used to create the adaptor between the air box and the compressor. A slab of
1 inch thick PVC is reduced to 3.25 inches (8.255 cm) by 7.25 inches (18.42 cm) by use of a
band saw operating at 125 ft/min. The holes for both the mounting studs and M8 bolts are
created on the drill press running at 300 rpm with a ½” drill bit. The 2.39 ± 0.01inch (6.07 ±
0.025 cm) hole for PVC pipe attachment is again made using the lathe.
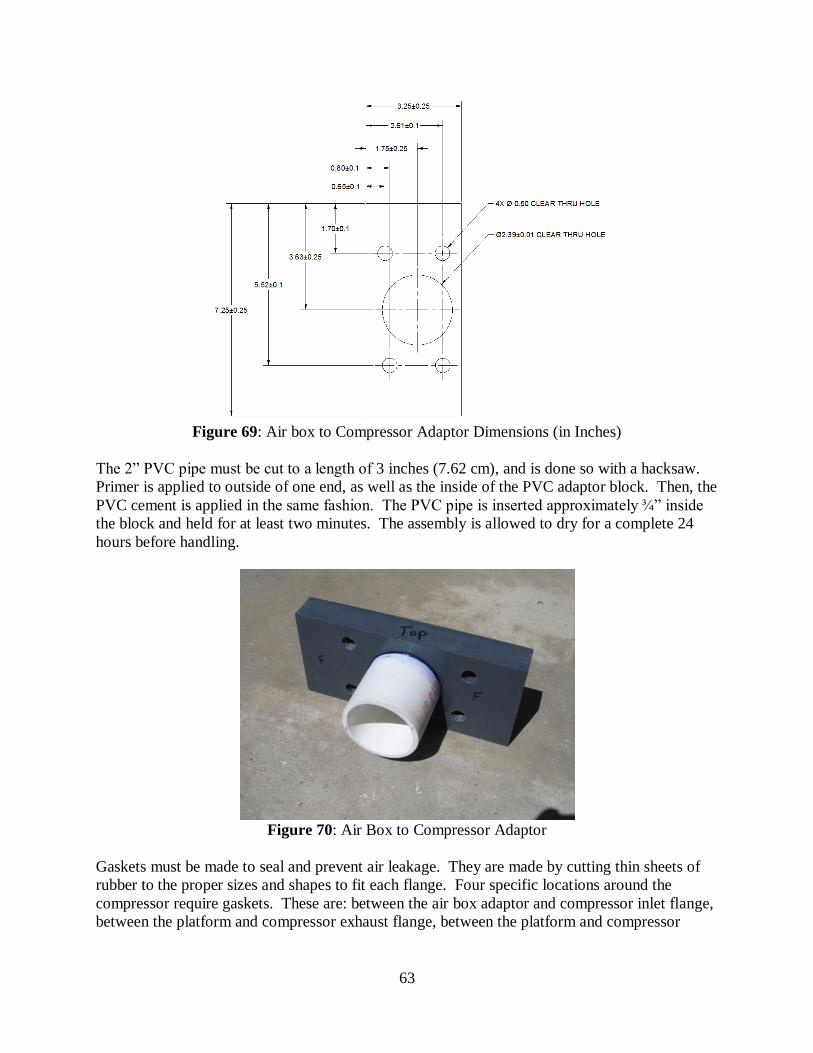
63
Figure 69: Air box to Compressor Adaptor Dimensions (in Inches)
The 2” PVC pipe must be cut to a length of 3 inches (7.62 cm), and is done so with a hacksaw.
Primer is applied to outside of one end, as well as the inside of the PVC adaptor block. Then, the
PVC cement is applied in the same fashion. The PVC pipe is inserted approximately ¾” inside
the block and held for at least two minutes. The assembly is allowed to dry for a complete 24
hours before handling.
Figure 70: Air Box to Compressor Adaptor
Gaskets must be made to seal and prevent air leakage. They are made by cutting thin sheets of
rubber to the proper sizes and shapes to fit each flange. Four specific locations around the
compressor require gaskets. These are: between the air box adaptor and compressor inlet flange,
between the platform and compressor exhaust flange, between the platform and compressor

64
exhaust adaptor, and between the inlet bypass valve flange and the platform. Figure 71 below
displays an example of a finished gasket.
Figure 71: Air Box Adaptor Gasket on Compressor
To run this compressor, the shaft is connected to the hand drill with a custom made adaptor.
Compressor to Drill Adaptor
The compressor shaft has inside threads because a bolt is originally used to hold a drive pulley
on at this end. The pulley has been removed, and the shaft‟s threads utilized in an adaptor piece.
Figure 72: Compressor Shaft Inside Threading Used for Adaptor Shaft
To start, we find the proper bolt which matches the shaft diameter and thread pitch; this turns out
to be a metric M14 bolt with 1.5 pitch. We purchase as long a bolt as possible (12 cm) because
the unthreaded end will be lathed down to < 3/8” and chucked into the hand drill. First, the
thread length is matched up to the original pulley bolt. A dye is used to extend the threads so
that a nut threaded to the end will act as the stopper or replacement bolt head. Then the original
bolt head is removed by using a hacksaw. To lathe the smooth end of the bolt down, a fixture
first needs to be made to prevent damage to the bolt threads. This fixture is made from a 3.5 cm
diameter piece of cylindrical steel stock. A ½” hole is drilled into the center and taped to match
the 1.50 pitch thread. The bolt can now be threaded into this fixture, which is placed into a collet
in the lathe spindle. A turning tool is placed into the tool post, and then centered vertically to the
bolt. The lathe is set to run at 100 rpm, and multiple passes are made to reduce 1.5 inches (3.81
M14 x 1.50
Threads Inside
Shaft
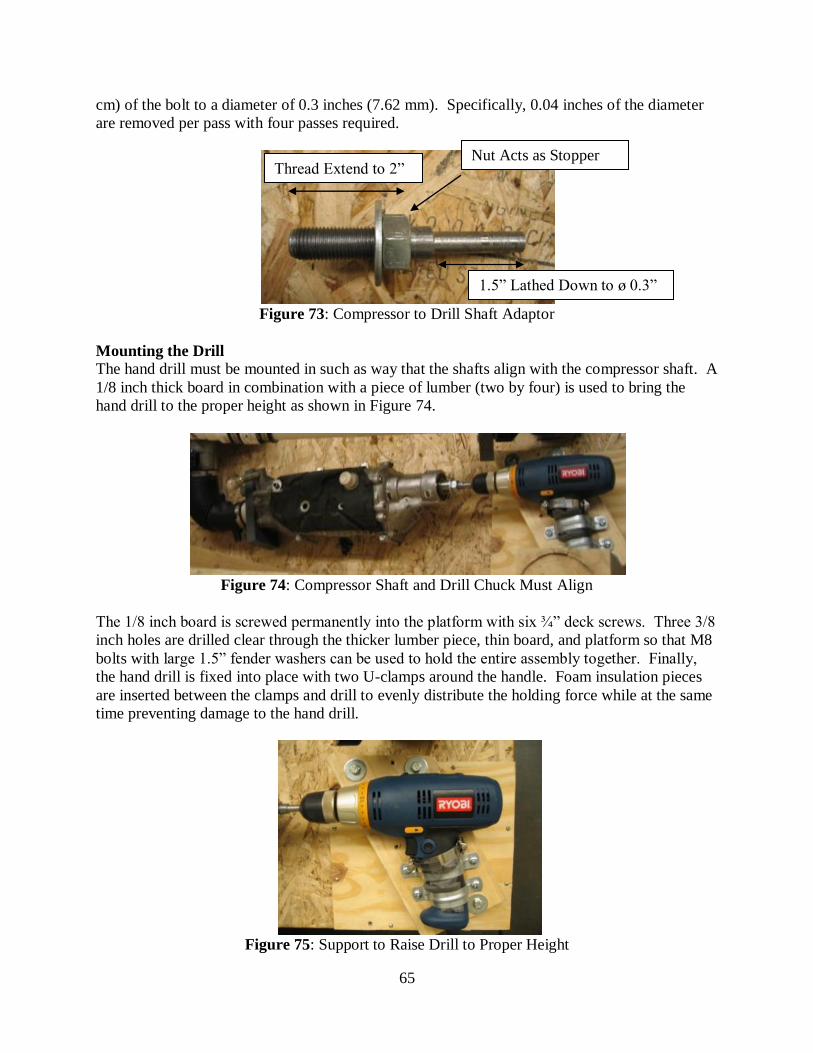
65
cm) of the bolt to a diameter of 0.3 inches (7.62 mm). Specifically, 0.04 inches of the diameter
are removed per pass with four passes required.
Figure 73: Compressor to Drill Shaft Adaptor
Mounting the Drill
The hand drill must be mounted in such as way that the shafts align with the compressor shaft. A
1/8 inch thick board in combination with a piece of lumber (two by four) is used to bring the
hand drill to the proper height as shown in Figure 74.
Figure 74: Compressor Shaft and Drill Chuck Must Align
The 1/8 inch board is screwed permanently into the platform with six ¾” deck screws. Three 3/8
inch holes are drilled clear through the thicker lumber piece, thin board, and platform so that M8
bolts with large 1.5” fender washers can be used to hold the entire assembly together. Finally,
the hand drill is fixed into place with two U-clamps around the handle. Foam insulation pieces
are inserted between the clamps and drill to evenly distribute the holding force while at the same
time preventing damage to the hand drill.
Figure 75: Support to Raise Drill to Proper Height
Thread Extend to 2” Nut Acts as Stopper
1.5” Lathed Down to ø 0.3”
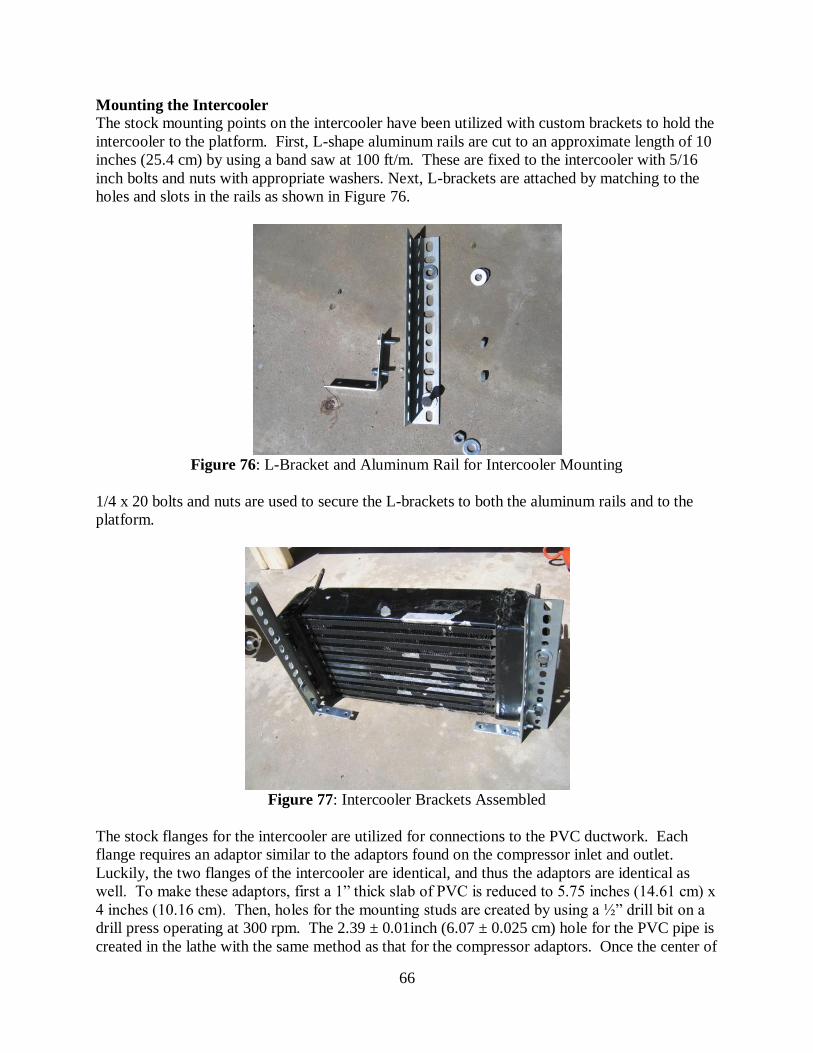
66
Mounting the Intercooler
The stock mounting points on the intercooler have been utilized with custom brackets to hold the
intercooler to the platform. First, L-shape aluminum rails are cut to an approximate length of 10
inches (25.4 cm) by using a band saw at 100 ft/m. These are fixed to the intercooler with 5/16
inch bolts and nuts with appropriate washers. Next, L-brackets are attached by matching to the
holes and slots in the rails as shown in Figure 76.
Figure 76: L-Bracket and Aluminum Rail for Intercooler Mounting
1/4 x 20 bolts and nuts are used to secure the L-brackets to both the aluminum rails and to the
platform.
Figure 77: Intercooler Brackets Assembled
The stock flanges for the intercooler are utilized for connections to the PVC ductwork. Each
flange requires an adaptor similar to the adaptors found on the compressor inlet and outlet.
Luckily, the two flanges of the intercooler are identical, and thus the adaptors are identical as
well. To make these adaptors, first a 1” thick slab of PVC is reduced to 5.75 inches (14.61 cm) x
4 inches (10.16 cm). Then, holes for the mounting studs are created by using a ½” drill bit on a
drill press operating at 300 rpm. The 2.39 ± 0.01inch (6.07 ± 0.025 cm) hole for the PVC pipe is
created in the lathe with the same method as that for the compressor adaptors. Once the center of
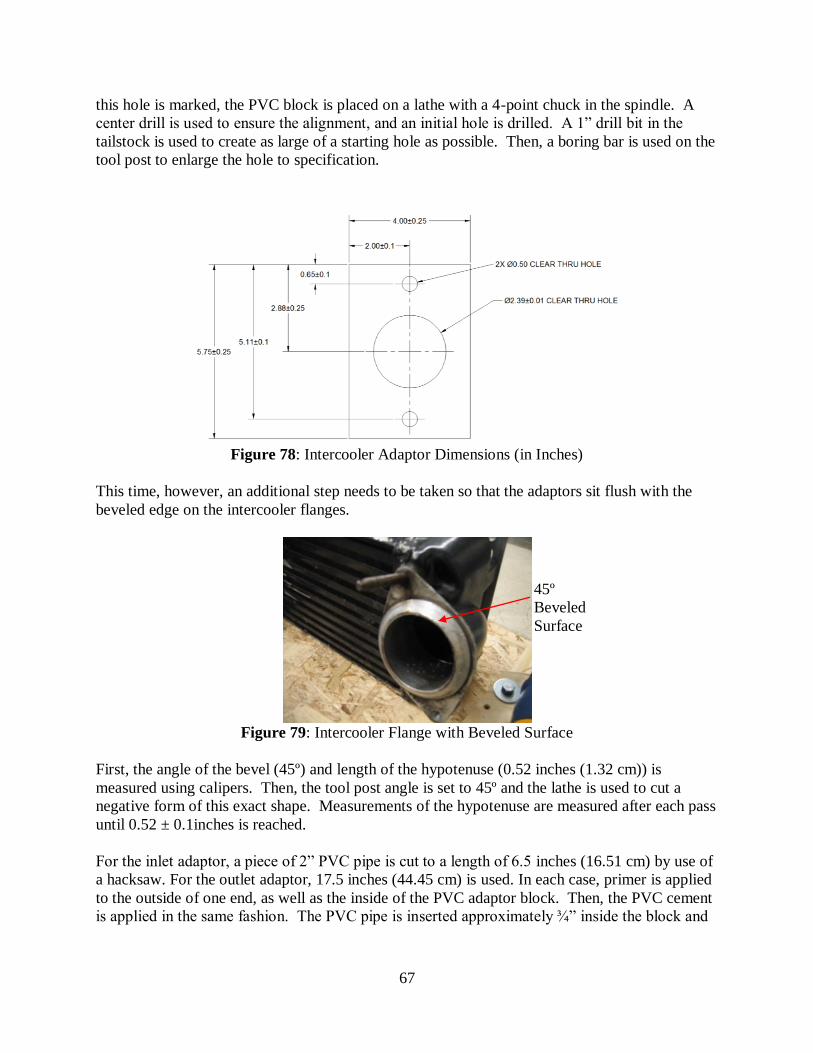
67
this hole is marked, the PVC block is placed on a lathe with a 4-point chuck in the spindle. A
center drill is used to ensure the alignment, and an initial hole is drilled. A 1” drill bit in the
tailstock is used to create as large of a starting hole as possible. Then, a boring bar is used on the
tool post to enlarge the hole to specification.
Figure 78: Intercooler Adaptor Dimensions (in Inches)
This time, however, an additional step needs to be taken so that the adaptors sit flush with the
beveled edge on the intercooler flanges.
Figure 79: Intercooler Flange with Beveled Surface
First, the angle of the bevel (45º) and length of the hypotenuse (0.52 inches (1.32 cm)) is
measured using calipers. Then, the tool post angle is set to 45º and the lathe is used to cut a
negative form of this exact shape. Measurements of the hypotenuse are measured after each pass
until 0.52 ± 0.1inches is reached.
For the inlet adaptor, a piece of 2” PVC pipe is cut to a length of 6.5 inches (16.51 cm) by use of
a hacksaw. For the outlet adaptor, 17.5 inches (44.45 cm) is used. In each case, primer is applied
to the outside of one end, as well as the inside of the PVC adaptor block. Then, the PVC cement
is applied in the same fashion. The PVC pipe is inserted approximately ¾” inside the block and
45º
Beveled
Surface

68
held for at least two minutes. The assembly is allowed to dry for a complete 24 hours before
handling.
Figure 80: Intercooler Adaptor Assembly
Gaskets are also needed between the intercooler flange and the adaptors. These are made from
the same thin rubber sheets as in the compressor gaskets.
Figure 81: Rubber Gasket on Intercooler Flange for Adaptor
Water Injection Assembly
The Roundup® sprayer must be modified slightly to fulfill our purposes. First, a pressure gauge
is attached to the line to measure water pressure behind the spray nozzle. To do this, the stock
line is cut at the middle into two pieces using scissors. ¼” male barbs are fitted into each end of
the line and secured with hose clamps. The ¼” NPT threads on the barbs allows easy attachment
of the pressure gauge to both ends of the line. Teflon tape is used to ensure a seal with the pipe
threading.
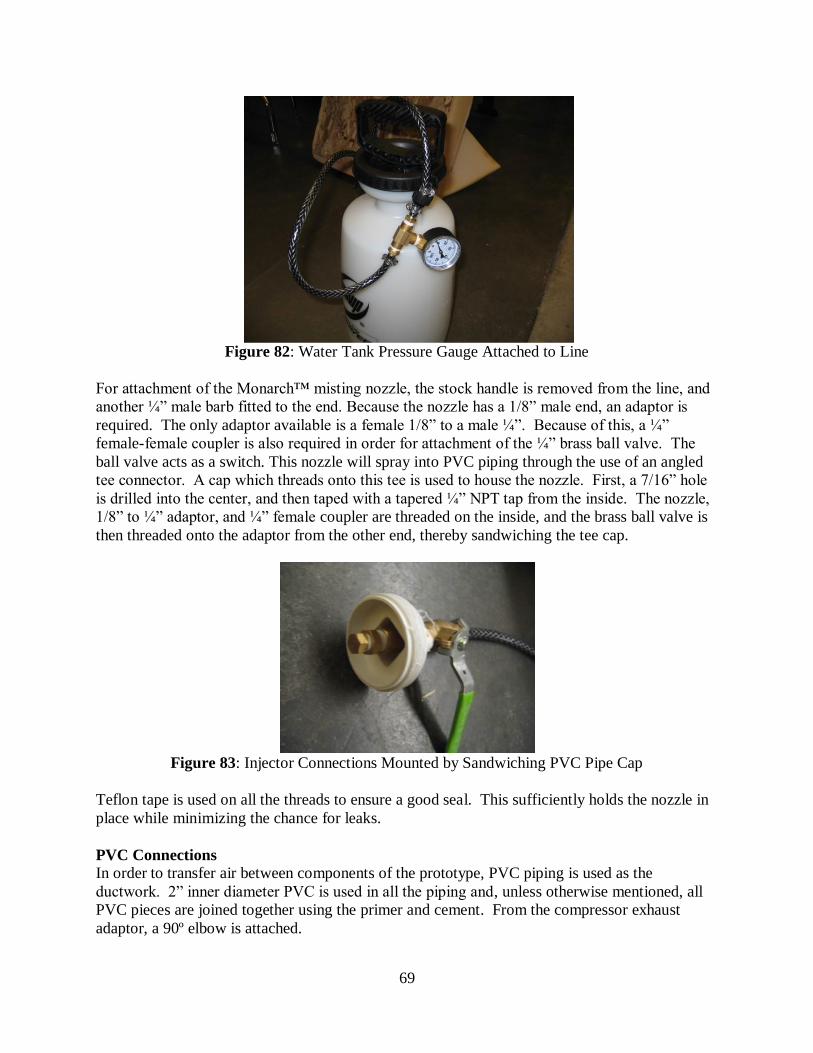
69
Figure 82: Water Tank Pressure Gauge Attached to Line
For attachment of the Monarch™ misting nozzle, the stock handle is removed from the line, and
another ¼” male barb fitted to the end. Because the nozzle has a 1/8” male end, an adaptor is
required. The only adaptor available is a female 1/8” to a male ¼”. Because of this, a ¼”
female-female coupler is also required in order for attachment of the ¼” brass ball valve. The
ball valve acts as a switch. This nozzle will spray into PVC piping through the use of an angled
tee connector. A cap which threads onto this tee is used to house the nozzle. First, a 7/16” hole
is drilled into the center, and then taped with a tapered ¼” NPT tap from the inside. The nozzle,
1/8” to ¼” adaptor, and ¼” female coupler are threaded on the inside, and the brass ball valve is
then threaded onto the adaptor from the other end, thereby sandwiching the tee cap.
Figure 83: Injector Connections Mounted by Sandwiching PVC Pipe Cap
Teflon tape is used on all the threads to ensure a good seal. This sufficiently holds the nozzle in
place while minimizing the chance for leaks.
PVC Connections
In order to transfer air between components of the prototype, PVC piping is used as the
ductwork. 2” inner diameter PVC is used in all the piping and, unless otherwise mentioned, all
PVC pieces are joined together using the primer and cement. From the compressor exhaust
adaptor, a 90º elbow is attached.

70
Figure 84: PVC Ductwork After Compressor Outlet
Next, the 10 psi safety pop valve is placed by using a tee. Since the pop valve is manufactured
with ½” national pipe threading (NPT), a reducer with matching ½” thread is needed. Teflon
tape is used to ensure a tight seal between the threads
Figure 85: 10 PSI Pop Safety Valve
Piping after the tee leads to a second 90º elbow, directing the piping upwards. At this location, a
hole must be made in the platform for piping to continue. For added clearance, a 3 inch (7.62
cm) square is cut using a jig saw.
Figure 86: Hole Cut Through Platform for PVC Piping
Pop Safety Valve
Platform Top
View
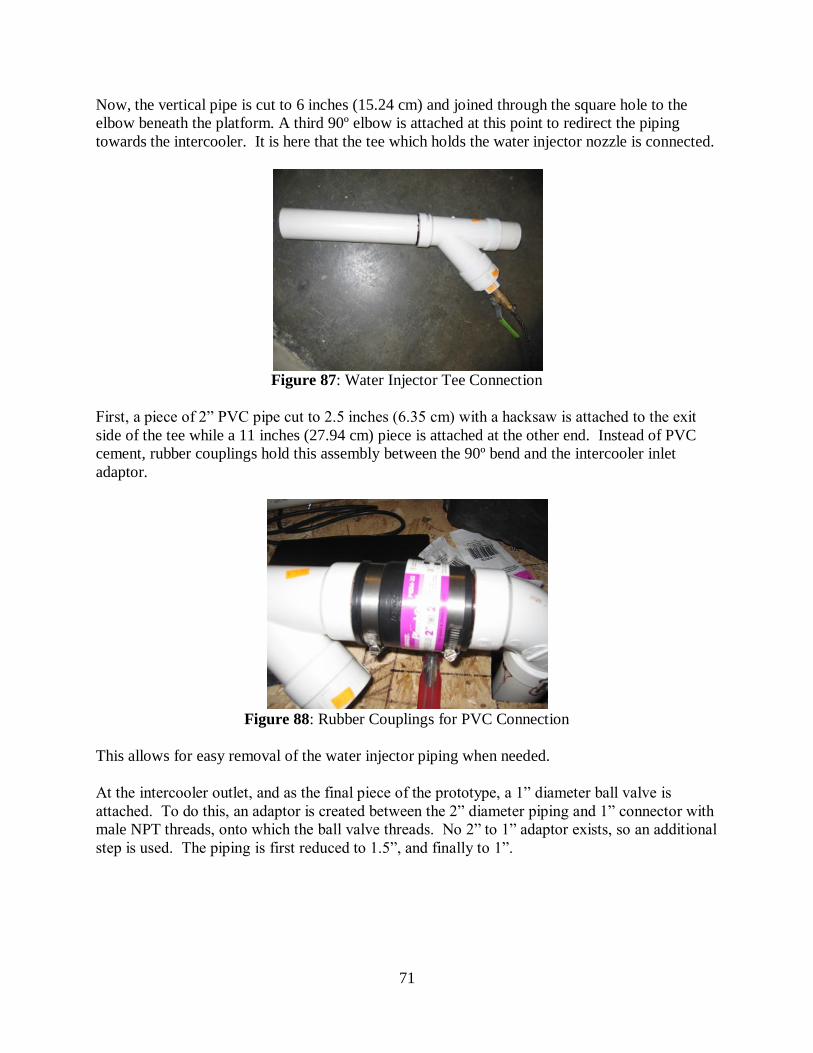
71
Now, the vertical pipe is cut to 6 inches (15.24 cm) and joined through the square hole to the
elbow beneath the platform. A third 90º elbow is attached at this point to redirect the piping
towards the intercooler. It is here that the tee which holds the water injector nozzle is connected.
Figure 87: Water Injector Tee Connection
First, a piece of 2” PVC pipe cut to 2.5 inches (6.35 cm) with a hacksaw is attached to the exit
side of the tee while a 11 inches (27.94 cm) piece is attached at the other end. Instead of PVC
cement, rubber couplings hold this assembly between the 90º bend and the intercooler inlet
adaptor.
Figure 88: Rubber Couplings for PVC Connection
This allows for easy removal of the water injector piping when needed.
At the intercooler outlet, and as the final piece of the prototype, a 1” diameter ball valve is
attached. To do this, an adaptor is created between the 2” diameter piping and 1” connector with
male NPT threads, onto which the ball valve threads. No 2” to 1” adaptor exists, so an additional
step is used. The piping is first reduced to 1.5”, and finally to 1”.
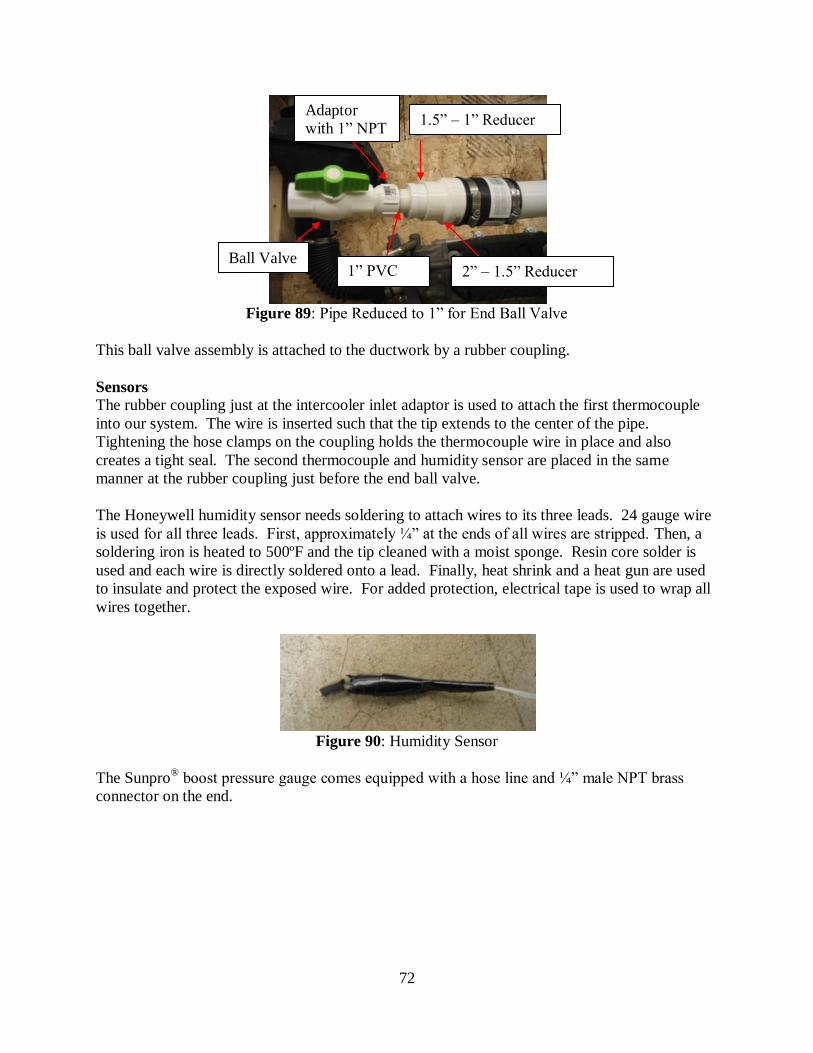
72
Figure 89: Pipe Reduced to 1” for End Ball Valve
This ball valve assembly is attached to the ductwork by a rubber coupling.
Sensors
The rubber coupling just at the intercooler inlet adaptor is used to attach the first thermocouple
into our system. The wire is inserted such that the tip extends to the center of the pipe.
Tightening the hose clamps on the coupling holds the thermocouple wire in place and also
creates a tight seal. The second thermocouple and humidity sensor are placed in the same
manner at the rubber coupling just before the end ball valve.
The Honeywell humidity sensor needs soldering to attach wires to its three leads. 24 gauge wire
is used for all three leads. First, approximately ¼” at the ends of all wires are stripped. Then, a
soldering iron is heated to 500ºF and the tip cleaned with a moist sponge. Resin core solder is
used and each wire is directly soldered onto a lead. Finally, heat shrink and a heat gun are used
to insulate and protect the exposed wire. For added protection, electrical tape is used to wrap all
wires together.
Figure 90: Humidity Sensor
The Sunpro® boost pressure gauge comes equipped with a hose line and ¼” male NPT brass
connector on the end.
Ball Valve
Adaptor
with 1” NPT
1” PVC
Pipe
1.5” – 1” Reducer
2” – 1.5” Reducer

73
Figure 91: Pressure Gauge Attachment
This is utilized for direct attachment of the gauge onto the 2” PVC piping after the intercooler
exit. Much like the attachment of the water injector nozzle, a 7/16” diameter hole is drilled into
the side of the PVC pipe with a hand drill and taped with a ¼” tapered NPT tap. Now the brass
connector can simply thread into the ductwork. Of course, Teflon tape is used to ensure a tight
seal.
Figure 92: Pressure Gauge Attachment to PVC Duct
Final Design Fabrication Differs
There is a large difference between the fabrication of our prototype and the manufacturing of our
final design. For instance, the final design will be made to fit a vehicle, not a wooden platform.
The final design will also not require many of the custom fittings and brackets mentioned for the
prototype, as mounting locations and brackets will be designed directly into the final product.
Ductwork between components may not necessarily use PVC material, and most likely will not
have a constant two inch diameter cross sectional area. This ductwork design is very flexible
and can change from vehicle to vehicle for best accommodation. Specifically made tools for
mass production by molding or extrusion processes is likely. This will allow for even more
flexible design. Sensor locations can also vary along the ductwork; however, their placement in
relation to the components is fixed for both prototype and final designs.
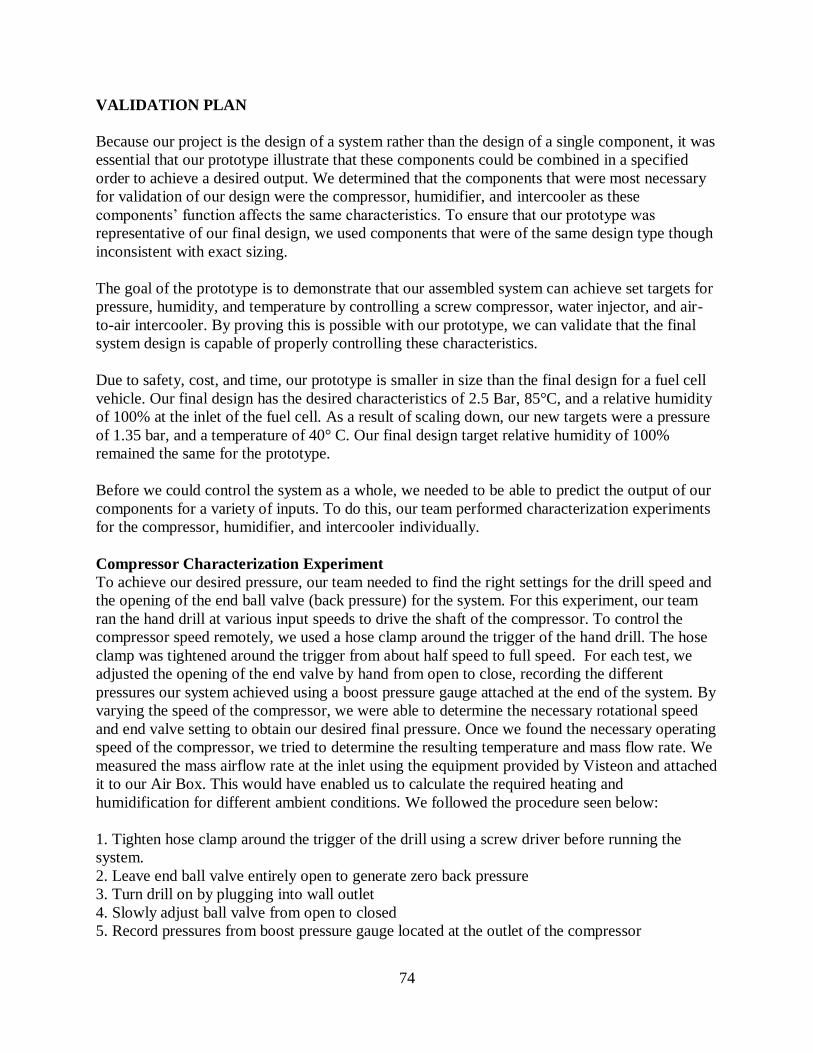
74
VALIDATION PLAN
Because our project is the design of a system rather than the design of a single component, it was
essential that our prototype illustrate that these components could be combined in a specified
order to achieve a desired output. We determined that the components that were most necessary
for validation of our design were the compressor, humidifier, and intercooler as these
components‟ function affects the same characteristics. To ensure that our prototype was
representative of our final design, we used components that were of the same design type though
inconsistent with exact sizing.
The goal of the prototype is to demonstrate that our assembled system can achieve set targets for
pressure, humidity, and temperature by controlling a screw compressor, water injector, and air-
to-air intercooler. By proving this is possible with our prototype, we can validate that the final
system design is capable of properly controlling these characteristics.
Due to safety, cost, and time, our prototype is smaller in size than the final design for a fuel cell
vehicle. Our final design has the desired characteristics of 2.5 Bar, 85°C, and a relative humidity
of 100% at the inlet of the fuel cell. As a result of scaling down, our new targets were a pressure
of 1.35 bar, and a temperature of 40° C. Our final design target relative humidity of 100%
remained the same for the prototype.
Before we could control the system as a whole, we needed to be able to predict the output of our
components for a variety of inputs. To do this, our team performed characterization experiments
for the compressor, humidifier, and intercooler individually.
Compressor Characterization Experiment
To achieve our desired pressure, our team needed to find the right settings for the drill speed and
the opening of the end ball valve (back pressure) for the system. For this experiment, our team
ran the hand drill at various input speeds to drive the shaft of the compressor. To control the
compressor speed remotely, we used a hose clamp around the trigger of the hand drill. The hose
clamp was tightened around the trigger from about half speed to full speed. For each test, we
adjusted the opening of the end valve by hand from open to close, recording the different
pressures our system achieved using a boost pressure gauge attached at the end of the system. By
varying the speed of the compressor, we were able to determine the necessary rotational speed
and end valve setting to obtain our desired final pressure. Once we found the necessary operating
speed of the compressor, we tried to determine the resulting temperature and mass flow rate. We
measured the mass airflow rate at the inlet using the equipment provided by Visteon and attached
it to our Air Box. This would have enabled us to calculate the required heating and
humidification for different ambient conditions. We followed the procedure seen below:
1. Tighten hose clamp around the trigger of the drill using a screw driver before running the
system.
2. Leave end ball valve entirely open to generate zero back pressure
3. Turn drill on by plugging into wall outlet
4. Slowly adjust ball valve from open to closed
5. Record pressures from boost pressure gauge located at the outlet of the compressor

75
6. If the pressure did not reach target of 1.35 psi, turn drill off by unplugging it.
7. Repeat steps 1-6 until proper pressure was achieved, tightening the hose clamp slightly further
each time
8. Record mass airflow rate using apparatus provided by Visteon on the air box.
Figure 93: Compressor Characterization Setup
Water Injection Characterization Experiment
To inject the proper amount of water into our system, our team needed to characterize the mass
flow of the water at different pressures. To do this we first filled the tank with approximately
1200 ml of water. We then pumped the water tank up manually to a specified gauge pressure
using the pressure gauge attached to the water tank and keeping the ball valve attached to the line
closed. We performed tests at gauge pressures of 10 psi, 15 psi, 20 psi, 25, psi, 30 psi, and 35 psi.
We would then open the ball valve completely and allow water to be sprayed into a container of
591 ml. We recorded the time it took for the container to become full and then shut the valve to
stop the water from spraying. By measuring the volume and dividing by the time, we then
determined the mass flow rate of the water. This allowed us to determine what setting will give
us the flow rate needed to achieve 100% R.H. The results of this test can be seen in the following
section.
After determining the mass flow rate of water corresponding to different pressures, we attached
our injection system into the entire assembly. We ran the compressor at a lower speed to keep
our hand drill from overheating and opened the end valve completely to ease the load on the
drill. We ran our water injector at different pressures to determine which flow rate could achieve
End Valve
Mass Flow Sensor
Hand Drill
Hose Clamp
Mass Flow Recorder in
Volts
14.5 Volt Voltage Supply for Mass Flow
Sensor
Boost Pressure Gauge
Compressor
Air Box
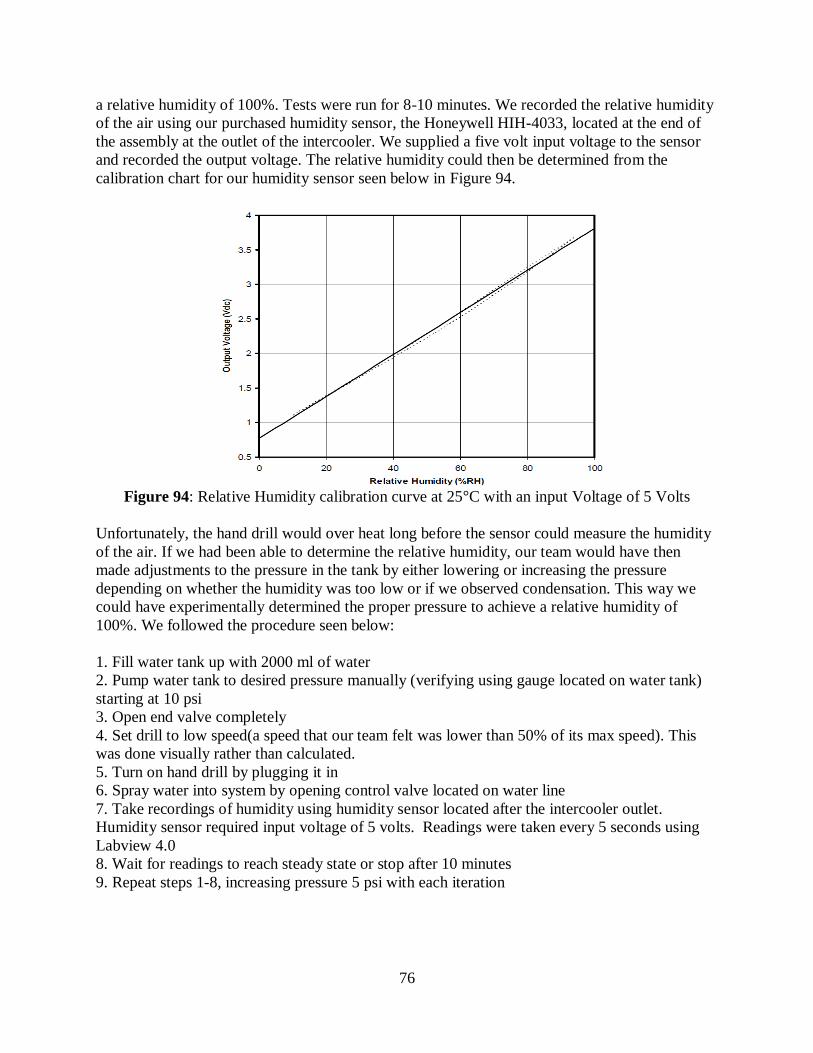
76
a relative humidity of 100%. Tests were run for 8-10 minutes. We recorded the relative humidity
of the air using our purchased humidity sensor, the Honeywell HIH-4033, located at the end of
the assembly at the outlet of the intercooler. We supplied a five volt input voltage to the sensor
and recorded the output voltage. The relative humidity could then be determined from the
calibration chart for our humidity sensor seen below in Figure 94.
Figure 94: Relative Humidity calibration curve at 25°C with an input Voltage of 5 Volts
Unfortunately, the hand drill would over heat long before the sensor could measure the humidity
of the air. If we had been able to determine the relative humidity, our team would have then
made adjustments to the pressure in the tank by either lowering or increasing the pressure
depending on whether the humidity was too low or if we observed condensation. This way we
could have experimentally determined the proper pressure to achieve a relative humidity of
100%. We followed the procedure seen below:
1. Fill water tank up with 2000 ml of water
2. Pump water tank to desired pressure manually (verifying using gauge located on water tank)
starting at 10 psi
3. Open end valve completely
4. Set drill to low speed(a speed that our team felt was lower than 50% of its max speed). This
was done visually rather than calculated.
5. Turn on hand drill by plugging it in
6. Spray water into system by opening control valve located on water line
7. Take recordings of humidity using humidity sensor located after the intercooler outlet.
Humidity sensor required input voltage of 5 volts. Readings were taken every 5 seconds using
Labview 4.0
8. Wait for readings to reach steady state or stop after 10 minutes
9. Repeat steps 1-8, increasing pressure 5 psi with each iteration

77
Figure 95: Water Injection Characterization Setup
Figure 96: Water Injection Characterization Humidity Reading Setup
Intercooler Characterization Experiment
For the intercooler characterization test, our team measured the temperature difference across the
intercooler using two thermocouples while supplying a cross flow of air across the intercooler.
We set the hand drill at the previously determined speed and end valve opening needed to
achieve our target pressure at the outlet. The water injection system was not run for this
experiment. Once achieving the desired pressure, our team recorded the temperature difference,
Spray Nozzle (Not Seen, Inside Pipe)
Water Control Valve
Water Tank
Water Tank Pressure Gauge
Hand Pump
End Valve
Humidity Sensor (Not seen, Inside Pipe)
DAQ
USB Connected to Computer to Supply and Read Voltages through
LabView
Hand Drill
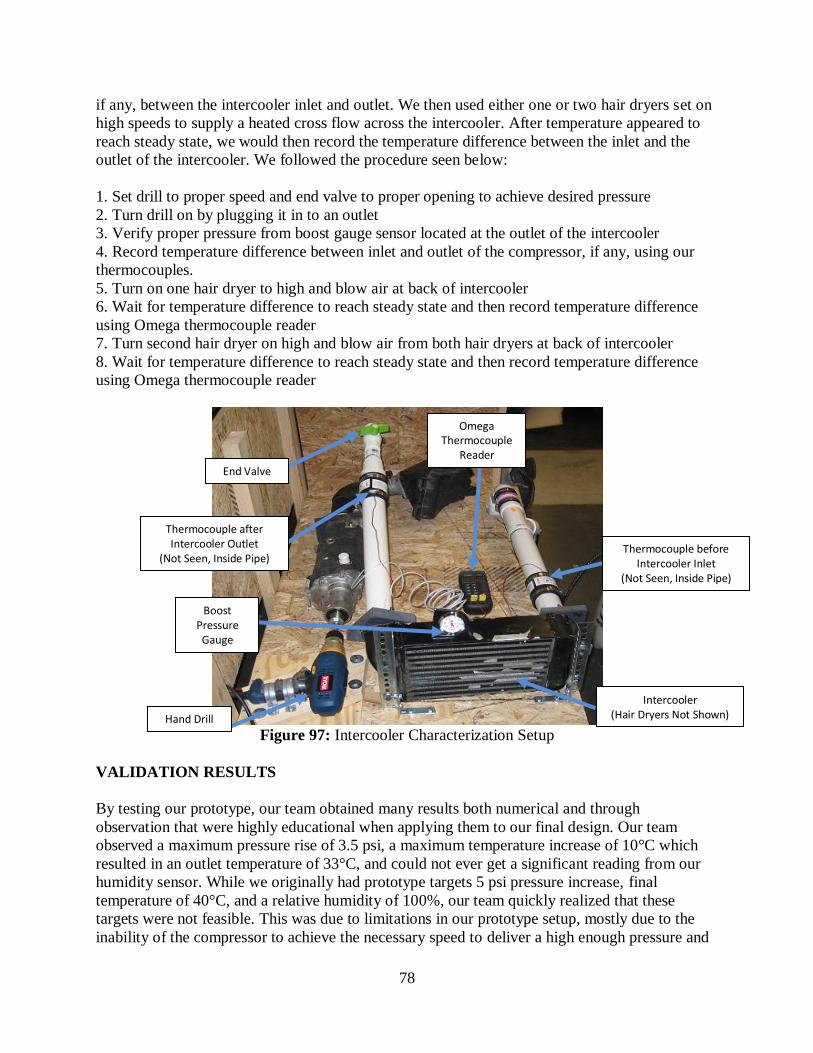
78
if any, between the intercooler inlet and outlet. We then used either one or two hair dryers set on
high speeds to supply a heated cross flow across the intercooler. After temperature appeared to
reach steady state, we would then record the temperature difference between the inlet and the
outlet of the intercooler. We followed the procedure seen below:
1. Set drill to proper speed and end valve to proper opening to achieve desired pressure
2. Turn drill on by plugging it in to an outlet
3. Verify proper pressure from boost gauge sensor located at the outlet of the intercooler
4. Record temperature difference between inlet and outlet of the compressor, if any, using our
thermocouples.
5. Turn on one hair dryer to high and blow air at back of intercooler
6. Wait for temperature difference to reach steady state and then record temperature difference
using Omega thermocouple reader
7. Turn second hair dryer on high and blow air from both hair dryers at back of intercooler
8. Wait for temperature difference to reach steady state and then record temperature difference
using Omega thermocouple reader
Figure 97: Intercooler Characterization Setup
VALIDATION RESULTS
By testing our prototype, our team obtained many results both numerical and through
observation that were highly educational when applying them to our final design. Our team
observed a maximum pressure rise of 3.5 psi, a maximum temperature increase of 10°C which
resulted in an outlet temperature of 33°C, and could not ever get a significant reading from our
humidity sensor. While we originally had prototype targets 5 psi pressure increase, final
temperature of 40°C, and a relative humidity of 100%, our team quickly realized that these
targets were not feasible. This was due to limitations in our prototype setup, mostly due to the
inability of the compressor to achieve the necessary speed to deliver a high enough pressure and
Hand Drill
Intercooler (Hair Dryers Not Shown)
Thermocouple before Intercooler Inlet
(Not Seen, Inside Pipe)
Thermocouple after Intercooler Outlet
(Not Seen, Inside Pipe)
Boost Pressure Gauge
End Valve
Omega Thermocouple
Reader
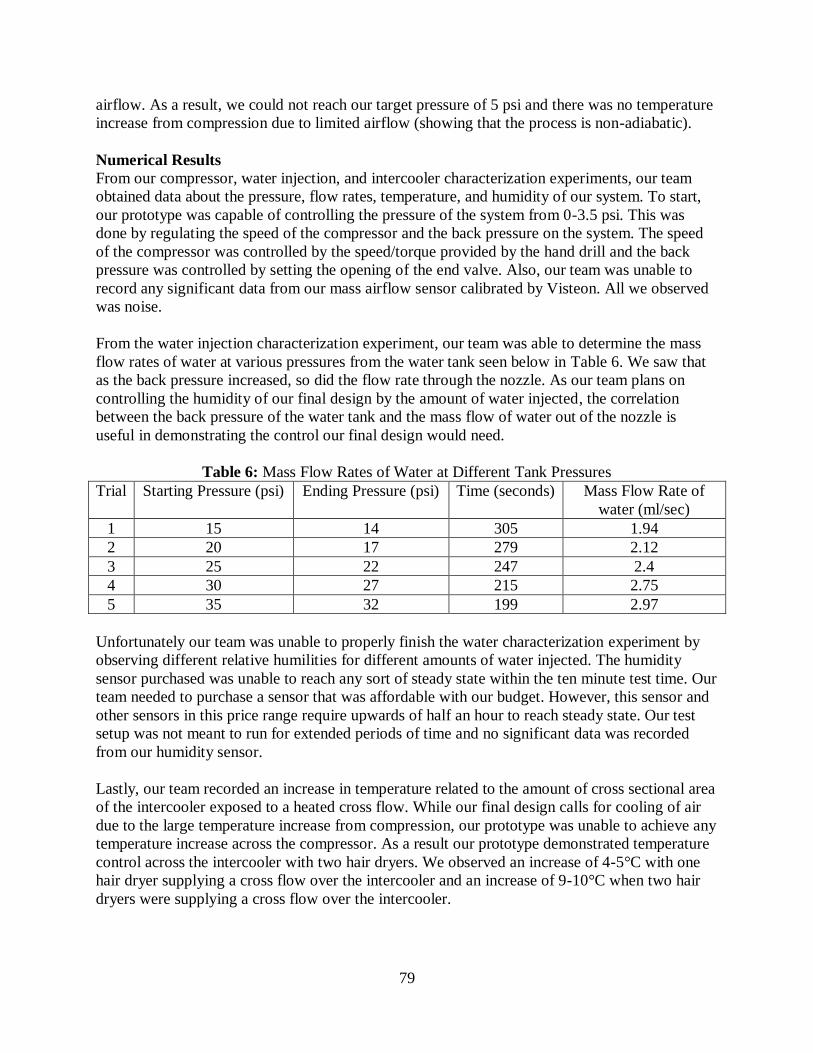
79
airflow. As a result, we could not reach our target pressure of 5 psi and there was no temperature
increase from compression due to limited airflow (showing that the process is non-adiabatic).
Numerical Results
From our compressor, water injection, and intercooler characterization experiments, our team
obtained data about the pressure, flow rates, temperature, and humidity of our system. To start,
our prototype was capable of controlling the pressure of the system from 0-3.5 psi. This was
done by regulating the speed of the compressor and the back pressure on the system. The speed
of the compressor was controlled by the speed/torque provided by the hand drill and the back
pressure was controlled by setting the opening of the end valve. Also, our team was unable to
record any significant data from our mass airflow sensor calibrated by Visteon. All we observed
was noise.
From the water injection characterization experiment, our team was able to determine the mass
flow rates of water at various pressures from the water tank seen below in Table 6. We saw that
as the back pressure increased, so did the flow rate through the nozzle. As our team plans on
controlling the humidity of our final design by the amount of water injected, the correlation
between the back pressure of the water tank and the mass flow of water out of the nozzle is
useful in demonstrating the control our final design would need.
Table 6: Mass Flow Rates of Water at Different Tank Pressures
Trial Starting Pressure (psi) Ending Pressure (psi) Time (seconds) Mass Flow Rate of
water (ml/sec)
1 15 14 305 1.94
2 20 17 279 2.12
3 25 22 247 2.4
4 30 27 215 2.75
5 35 32 199 2.97
Unfortunately our team was unable to properly finish the water characterization experiment by
observing different relative humilities for different amounts of water injected. The humidity
sensor purchased was unable to reach any sort of steady state within the ten minute test time. Our
team needed to purchase a sensor that was affordable with our budget. However, this sensor and
other sensors in this price range require upwards of half an hour to reach steady state. Our test
setup was not meant to run for extended periods of time and no significant data was recorded
from our humidity sensor.
Lastly, our team recorded an increase in temperature related to the amount of cross sectional area
of the intercooler exposed to a heated cross flow. While our final design calls for cooling of air
due to the large temperature increase from compression, our prototype was unable to achieve any
temperature increase across the compressor. As a result our prototype demonstrated temperature
control across the intercooler with two hair dryers. We observed an increase of 4-5°C with one
hair dryer supplying a cross flow over the intercooler and an increase of 9-10°C when two hair
dryers were supplying a cross flow over the intercooler.
80
Visual Observations
Just as important, if not more so, are the observations our team recorded from testing of our
prototype. Many of the problems our team faced in our prototype are problems that our final
design may face as well.
To start, our compressor was unable to reach the speed required to generate our target of 5 psi
due to the lack of power provided by the hand drill. Our team learned firsthand how large a
parasitic loss the compressor could be on our entire system. Our team tested several drills, and
for every one of them, the rotational speed significantly decreased as the end valve was closed.
This was just visual evidence of the load the compressor placed on these drills even at low
pressures. At large pressures, clearly much more powerful devices will be necessary to achieve
our desired pressure of 5 psi.
Another observation made in our system was that there was no temperature increase from
compressing our air. We think this is due to the low flow rates we were running our system at. In
an adiabatic process, our team expected a significant temperature increase. As our system is not
ideal, the adiabatic equation did not hold and we saw little to no temperature increase. This may
also be a problem faced in our final design. If we do not achieve the temperature increases
expected in our final design, at lower ambient temperatures, there would be no need to cool but
instead a need to heat the air up to our desired 85°C.
Lastly, our team observed a failure in our humidification system to control condensation/water
from accumulating in the pipes. There are several things in our prototype that led to this result:
1. The airflow was too low to properly absorb the amount of water being injected into the
system.
2. The spray nozzle did not properly atomize the water particles
3. The nozzle was located too close to the wall causing the water to act more as a stream than a
mist
Every time our team ran the water injection system, we had to empty a significant amount of
water from the piping. This could be a serious problem in the final design if not properly
addressed.
Engineering Specifications Untested
Due to cost, safety, and time, our team was not able to build and test all components of our final
design. However, through our engineering analysis and research, we feel with high certainty that
all our specifications can be met.
One component of our final design that was not demonstrated by our prototype is the air filter.
Filtration is important to ensure that damage due to harmful substances entering the fuel cell
does not occur; however, we do not believe this it is necessary to demonstrate. Demonstration of
our filtering system would be difficult within our budget, and we lack the equipment necessary to
measure the composition of the air necessary to prove the filtration effectiveness. While our team
is not building or testing a filter, we feel that our combination of a dust filter and an active
81
carbon foam filter will meet the desired specifications. We recommend Visteon perform
standard filtration tests to confirm our design choice.
Moreover, our prototype does not demonstrate the noise level of our system. Our final design
requires a noise level below 65 dBA. Noise levels were not tested for several reasons: we do not
have the finances for the measurement tools and our compressor (the major noise generating
component of our system) is being run at lower speeds than the final design and therefore will
make less noise. We believe Visteon has better experience and much more expertise than our
team to properly assess sound propagation and determine the most effective method of
eliminating the sound.
DISCUSSION
The major challenges the design faces in achieving our final engineering specifications and
customer requirements are achieving the optimum intake humidity, temperature, pressure, air
purity, air flow, and low noise. From the results of our testing, our team has gained a better
understanding of the strengths and weaknesses of our final design and its ability to meet its
requirements.
Control and Efficiency
One of the major challenges that our final design faces is the parasitic losses on the fuel cell
stack involved in running the compressor, water injection system, and airflow across the
intercooler. In our prototype, our team observed firsthand that the power supplied by many
different drills to the compressor was not sufficient to obtain a pressure increase of 1.35 bar. In
our final design, we need to obtain a final pressure of 2.5 bar which is significantly higher. In
addition, we will have to supply a high pressure to the water injection system to achieve a fine
mist and run airflow across the intercooler for cooling. All these systems will be run from the
power generated by the fuel cell stack and the more power needed to run them, the less efficient
our assembly becomes.
However, we feel that one of the major strengths of our final design is that each component has
its own control which can regulate the outputs of the design. Since each components can control
particular characteristics (compressor controls pressure, water injector controls humidity,
intercooler controls temperature), our design can utilize a sophisticated control system to
properly regulate our components. The advantage of the control system is that it can always
optimize the settings for the compressor, water injector, and intercooler, no matter the ambient
conditions.
In our prototype we demonstrated control of the pressure by controlling the speed of the
compressor and the back pressure. We also demonstrated control of the temperature difference
across the intercooler by the amount of cross flow supplied by the hair dryers. Our humidity
readings were insignificant but we were able to demonstrate the control of the amount of water
being injected into the system by setting a back pressure on our water tank. While we were only
able to demonstrate control of one variable at a time in our prototype, given more time/money
we would seek to demonstrate simultaneous control of pressure, temperature and humidity. For
82
our final design we believe that by controlling the compressor, water injector, and intercooler,
parasitic losses by these components can be minimized.
System Order
Another strength of our final design is the component order in their final assembly. By placing
the filters first, our final design can increase the cross sectional area of the expansion box and
allow for slower airflow across the filters. This increases the effectiveness of these filters by
increasing the filtration time.
Our design then compresses the air to 2.5 bar which also increases the temperature of the air
significantly. The outlet of the compressor will also be of smaller piping then the inlet/air box to
increase the mass flow per unit area. The increase in pressure, temperature, and airflow per unit
area provided by the compressor make humidification easier. One of the main problems with our
prototype was that the lack of temperature, pressure, and airflow per unit area increase made it
difficult to determine the amount of water being injected into the air that is being absorbed.
Instead we observed too much water in our piping. This was also due to the fact the our mist
nozzle did not provide the fine mist necessary for the injection system to function properly.
After compression, our water injection system and intercooler function together to achieve the
proper relative humidity of 100% and temperature of 85°C. Our water injection system was
placed before the intercooler for two main reasons. First, by injecting water into the system, the
hot airflow can absorb more of the moisture needed for the final output. This will also decrease
the amount of cooling required by the intercooler. Second, since the airflow is going to be cooled
after water injection, the relative humidity through cooling will increase. Therefore, our design
calls for a control system that injects less than the necessary water to achieve 100% relative
humidity at the time of water injection. Instead, the relative humidity will be increased to a point
where the final relative humidity of100% will be achieved through cooling the airflow in the
intercooler. If controlled properly, this could minimize condensation in our ducting. However,
this is a very delicate balance and very delicate control would be necessary for this to work well.
While we have provided fundamental equations to do this, the system/controls would require a
large amount of testing and time to perfect in the future for all operating conditions.
Unfortunately, for our prototype, we were unable to demonstrate the type of control necessary to
achieve a balance between compression, humidification, and cooling. With more time, better
sensors, and a stronger power supply attached to the compressor, demonstrating this type of
control would be one of the main objectives our team would have pursued in validating our final
design.
Condensation
Another major challenge faced by our final design will be condensation in the piping. For the
same reasons we feel the delicate control between the water injection system and the cooling in
the intercooler can be a strength, it can also be a weakness of our design. If not controlled
properly, large amounts of condensation may occur in the ducting. Testing at all ranges of
ambient conditions and flow rates would be necessary to effectively determine a proper control
of our system. Also, possibly using a valve to remove water from the piping is an option to
consider in controlling condensation. Water could collect in a U-Shaped bend. On either side of

83
the U-Shaped bend, the pipes could be slanted slightly downwards to more effectively collect
water. At the bottom of the U piece, you could place the valve and purge the system of the water
whenever necessary (a system already being used for vehicles with pressurized air brakes).
As previously stated, we observed a lot of water in our prototype after running the water
injection system. We feel this was due to low airflow and no temperature increase from the
compressor, as well as the inability of our spray nozzle to supply a fine mist. However, we feel
these problems will be of a smaller scale for our final design as the compressor will be running at
higher speeds causing more of an adiabatic compression resulting in higher airflow and
temperature at its outlet. Also, more suitable high pressure nozzles/injectors should be used in
our final design which are capable of achieving the necessary fine mist. With more time and
money, our team would have tried to fix this problem several ways. We would have bought more
appropriate mist nozzles and got a larger power supply for the compressor to achieve the desired
temperature increase and mass flow rate.
Also, for the final design, increasing the diameter of the piping where water injection occurs
should be considered. One of the problems observed in our prototype was that the water spray
was not given enough space from the nozzle to the wall of the pipe to really spread out. Instead it
acted more as a stream instead of a fine mist. With a larger area for the mist to spray, the air
could be more effective at absorbing the water in our final design.
Temperature
Another observation from our prototype was that adiabatic compression did not occur, as the
adiabatic equation for temperature increase did not hold. Our team saw no temperature increase
from compression.
In our final design, at low temperatures, the need for cooling is unnecessary. As previously
calculated, at 0°C, the temperature at the outlet of the compressor using the adiabatic equation
would be 82°C. This is already below our target of 85°C. In addition, water injection will further
cool the outlet temperature of 82°C. In this case, we originally justified that air entering the fuel
cell below 85°C does not damage the fuel cell but instead decreases the efficiency slightly. Since
82°C was only slightly lower than the target and still higher than the operating fuel cell
temperature of 80°C, we felt this would be an acceptable loss.
However, if adiabatic compression does not occur and temperature increases are minimal under
certain circumstances, then the need for heating across the intercooler may be necessary. Heating
could be supplied by wrapping electrical wire around the fins of the intercooler and supplying a
current through those wires. However, when considering this, our team suggests comparing the
tradeoffs involved in having an additional heating system. One would have to compare the
efficiency loss due to a lower temperature to the cost of adding the system and efficiency loss
due to running the heating system which would act as another parasitic component on the fuel
cell. The best way to determine these things is through testing the final design at low flow rates
and low ambient temperatures (approaching 0°C).
A general restriction of our final design is that it only would function at temperatures above 0°C.
This is a restriction many fuel cell vehicles are currently facing as below 0°C, water in the

84
piping, water tank, and created from the fuel cell reaction will freeze. If Visteon were to pursue
marketing our design in regions that approach or go below 0°C, heating of the water reservoir,
possibly the piping, and the fuel cell itself might be things that need to be considered.
Filtration
Air purity is of a great concern for our team because the conditions of the outdoor air, especially
in highly polluted areas, may have negative impacts on the fuel cell. Not only is performance
and efficiency at risk, but longevity of the fuel cell itself. The chemical filter we chose in our
final design involves a potassium hydroxide (KOH) modified activated carbon filter. This
filter‟s performance for a PEMFC has been tested and experimental data shows high
effectiveness. However, the experiment was run under controlled settings to evaluate its
filtration of main contaminants such as NOx and SO2. We do not entirely know how well this
type of filter will function for other, less harmful chemicals. In addition, sizing is still uncertain
due to lack of mainstream use in PEMFC applications.
Also, standardized data for the necessary filtration rates for PEMFC applications are still
unknown. While there clearly are chemical filters being used in fuel cell vehicles today, they are
still of the first generation and their longevity and effectiveness are still being tested and
determined. Given more time, our team would have further pursued obtaining the standards used
for chemical filters in fuel cell vehicles today. As Visteon is well connected in the automotive
industry, this may be something they have more luck in then our team did in contacting
automotive companies and chemical filter manufacturers.
Our prototype did not really address the filtration aspect of our final design. In hindsight, we
probably would have focused our entire prototype on the filtration as it is one of Visteon‟s key
interests in our prototype. We feel that maybe in the future, an ME 450 project solely focused on
developing a chemical filter for use in fuel cells may be a good idea.
Noise
Maintaining low noise generation of below 65 dBA is a challenge that our final design may face.
The ideal conditions for the inlet air and packaging may create a situation in which noise is an
issue. Above certain pressure drops, air flow through ducts may produce whistling sounds [34].
The use of a compressor and/or turbocharger may also produce unfavorable dBA levels. One
high priority customer requirement is to have as quiet a system as possible due to the lack of an
internal combustion engine in a traditional vehicle. To address this problem, our team has
discussed using Helmholtz resonators and quarter wavelength resonators to attenuate unwanted
frequencies. However, the most effective method of determining which frequencies will need
attenuation in the system is through testing. We feel that any noise attenuation necessary for our
system could be done using similar methods used for combustion air intake systems today. We
know Visteon has much experience in implementing noise controls and would be better suited to
tackle this problem through testing at their facilities.
Packaging
Our final design was not made for a specific vehicle, but instead was designed for a generic
small to mid size vehicle. As a result, placement of our components within the vehicle was not
directly determined. We have identified the order of the components to be filter/intake,

85
compressor, water injection system, and then intercooler from which the flow will be routed to
the fuel cell.
We can recommend certain locations for these components but these locations may be subject to
change according to the packaging requirements of the specific fuel cell vehicle. Our design
suggests having the filter box/intake located underneath the hood of the car similar to the Honda
FCX Clarity in Figure 98. This is done for two main reasons. First, the intake is at the front of
the car which will allow for more airflow to easily enter the system. Second, by being elevated
off the ground and protected from direct exposure to the road, this will minimize the chance of
water from puddles and large particles thrown up and entering the system.
Figure 98: Honda FCX Clarity [16]
After the filter, we suggest placing the compressor as close as possible in order to minimize
ducting/cost. The water injection nozzles should then be located directly after the compressor to
ease humidification. The water tank may be placed wherever it may fit within the packaging of
the vehicle. Since the water vapor created from the fuel cell reaction must be recycled to our
water tank, our team is not sure if the tank should be located closer to the outlet of the fuel cell or
the injection nozzle. The intercooler should then be placed at the front of the car to maximize
cross flow (seen in Figure 99). Afterwards, ducting will be required to take the airflow to where
the fuel cell is located in the center of the vehicle.
Also, it is a good idea to minimize the amount of cornering and sharp bends in the ductwork of
our system. The less cornering and bends there are in the system, the less there is a chance of
pressure ripples and drops which may be damaging to the fuel cell membrane or decrease
efficiency. Also, avoiding quick changes in piping diameter after compression is suggested for
the same reasons. If piping diameter needs to be changed for any reason (possibly for water
injection) the change should be as gradual as possible.
Along the way, we have made certain assumptions about fuel cell vehicles. From our research
we have determined that the fuel cell stack is most commonly placed in the middle of the vehicle
below the front seats. Also we have assumed that the hydrogen tanks are located in the rear of
the vehicle. For the batteries that run the car, our team has seen them located either in line with
the rear tires or in line with the front tires. This is seen visually in Figure 99 below where the
batteries are located in line with rear tires.
Filter Compressor Intake

86
Figure 99: Composite Fuel Cell Arrangement [15]
One of our suggestions to Visteon is to find a particular vehicle to model our fuel cell air intake
system for. This will help in determining actual packaging requirements and more meaningful
testing.
Fuel Cell Power Requirements
For the purpose of our project, our team designed an air intake system for a fuel stack that is
capable of delivering 100 kW. We assumed the worst case scenario in that the car would
constantly require that 100 kW to run at all times and need a mass airflow of 0.11 kg/s.
In actuality, newer fuel cell vehicles are being designed to charge a battery which then powers
the car. For small to mid size fuel cell vehicles, this would not require constant maximum power
being delivered from the fuel cell stack to the battery. If the fuel cell is constantly recharging a
battery, then the power output of the fuel cell tends to be less than 100 kW. As a result less
airflow needs to be delivered and less water needs to be injected.
In older fuel cell models, there is a small battery used to start the engine but power is mostly
delivered directly from the energy being created by the fuel cell. For these models, when driving
at lower speeds, less power would be necessary, hence requiring less airflow.
In the future, it would be a good idea for Visteon to choose a specific design for either a car that
runs almost solely on the energy provided directly by the fuel cell stack or a car that runs on a
battery which will constantly be recharged by the fuel cell stack.
RECOMMENDATIONS
As a result of all the research, design generation, and prototyping that our team has now
completed, we have developed particular recommendations for future work in designing a
functional fuel cell air intake system.
An important step in the continuation of our project is testing our design with an actual fuel cell.
This requires designing and building of a full scale prototype which can be tested in conjunction
Intercooler
Hydrogen Tanks
Batteries
Fuel Cell Stack
87
with the fuel cell size for which it has been designed. We recommend picking a specific vehicle
in which to design the air intake system.
Some cars run the fuel cell all the time in order to constantly recharge a battery and others run
the fuel cell based on when the car needs. For these different setups, the air intake system will
have to supply different mass flow rates of air. We used a 100 kW fuel cell stack power
requirement that constantly is running but this number may be lower. Determining the actual
power requirement for a specific vehicle will influence parameters such as: compressor speed,
amount of water injected into the system, and filter longevity.
Also, by designing for a specific vehicle, Visteon will be able to properly place components in
the vehicle and dimension piping between the components. By finalizing a packaging scheme,
Visteon can identify and fix any potential noise problems in the system. In addition, testing can
be done to minimize pressure ripples created by curvature in the ductwork and the back pressure
supplied from the fuel cell can be measured.
Make sure to pick an appropriately sized compressor and characterize it through
experimentation. One of the major challenges of designing a fuel cell air intake system is
reducing the parasitic losses it incurs on the fuel cell. In minimizing parasitic losses, particular
attention should be taken in the choice/design of the screw compressor. It is important to
maximize the compressor‟s efficiency as this component will require the most power to operate.
To ensure that the compressor can meet all requirements, extensive testing should be done at a
variety of ambient conditions and loads.
Next, determine the temperature rise over the compressor. This is necessary in order to design
an appropriately sized heating and cooling system. Our design incorporates cooling through the
intercooler based on the use of the adiabatic compression equation which would result in
temperature increases well above our target of 85°C. However, as demonstrated in our prototype,
there was no temperature increase across the compressor when we achieved a pressure of 1.24
Bar. We believe that experimentation is necessary to get a more accurate picture.
We recommend considering the inclusion of a heating system in addition to the cooling system.
Heating could be supplied by wrapping electrical wire around the fins of the intercooler and
supplying a current through those wires. When the heating system is active, the variable fins of
the intercooler should be completely closed to stop cross-flow of ambient air. However, when
considering a heater, our team suggests comparing the tradeoffs involved in having an additional
heating system. One would have to compare the efficiency loss due to a lower temperature to the
cost of adding the system and efficiency loss due to running the heating system which would act
as another parasitic component on the fuel cell. The best way to determine these things is
through testing of the final design at low flow rates and low temperatures (approaching 0°C).
From our prototype, we found that condensation may occur in the air intake system and soak the
membrane of the fuel cell. In the future, our team recommends trying the following methods that
may reduce or avoid condensation. The first method involves incorporating a U-shaped bend in
the ducting just after the injector. It is important that the piping on either side be slanted towards
this bend. By placing a valve at the bottom of the bend, the excess moisture can be purged out of
88
the system through using pressure in the ducts. In addition to eliminating the condensed water
from the system, several additional steps can be taken to minimize condensation in the first
place. First, a fine mist nozzle to ensure atomization of the water at high pressures can be used to
make evaporation into the air easier. Second, increasing the piping diameter at the injection
location is recommended to provide more space for the mist to spread instead of immediately
impacting the ducting walls.
We recommend testing of system controls under a wide range of ambient conditions and flow
rates. One of the important aspects for our final design to work as an assembly is the delicate
control system needed to regulate our compressor speed, amount of water injected and cooling
simultaneously. These variables can be related through theoretical equations. However, as
demonstrated in our prototype, these equations may not hold and their validity needs to be
confirmed experimentally.
Lastly, our primary focus of this project remained on the intake side of the fuel cell. However,
using the water vapor and energy from the exhaust is crucial in increasing the efficiency of the
system. From our estimates, a 100kW fuel cell will only be able to run for approximately 20
minutes on a 10 gallon tank of water. This means the water vapor exiting the exhaust must be
recycled into the humidification system. In addition to the water, the heat and pressure energy
from the exhaust should also be integrated back into the system. One possible method is to use a
turbocharger to help spin the compressor.
SUMMARY AND CONCLUSIONS
With the anticipation of emerging technologies for automotive vehicles, Visteon Corporation has
sponsored our project to design and develop an air intake system for a proton exchange
membrane fuel cell (PEMFC) vehicle. Our goal was to create such a system which optimizes the
fuel cell‟s performance and efficiency.
The key engineering specifications found for the air intake system are a flow-rate of 45 liters/sec
(for a fuel cell stack that produces 100 kW power), a relative humidity of 100% at the inlet, a
temperature of 85°C, a pressure of 2.5 bar, and air purity. The important customer requirements
for the system‟s performance are noise (below 65 dBA), cost, packaging, serviceability, and
durability.
To meet these specifications and requirements, our team split the project into the following
functions: air intake, filtration, pressurization, humidification, and cooling. For each function our
team generated as many concepts as possible. Each concept was then compared through a Pugh
chart for its particular sub-function and evaluated on its ability to perform the necessary
criterion.
For our final design, our team put our individually chosen components from the concept
selection together into one assembly. This design includes a combination of an activated carbon
filter and Visteon dust filter to remove harmful substances, a screw compressor to increase
pressure and mass flow rate, a water injection system to increase the humidity, and an air-to-air
89
intercooler to cool the air. The order of these components was chosen to maximize the efficiency
of our system after calculating the tradeoffs of different possible layouts.
Our prototype is composed of the same components as our final design minus the chemical filter.
Our plan was to demonstrate that by using our chosen components, in their particular order, our
final design can regulate the pressure, temperature, and humidity of ambient air and deliver it to
a fuel cell at pre-specified targets. Our initial targets for our prototype were a relative humidity
of 100%, temperature of 40oC, and pressure of 1.35 bar at the outlet. Our results were a pressure
of 1.24 bar, a temperature increase to 33°C, and an inability to record significant humidity
measurements. Failure of our system to reach our initial targets was mostly due to the lack of
power supplied to the compressor (small airflow/rotational speed) and an inadequate humidity
sensor. However, our team did demonstrate that we could control pressure by regulating the
compressor speed and back pressure on the system; control the heat exchange across the
intercooler by regulating the cross sectional area of the cross flow; and control the amount of
water entering the system by regulating the back pressure of our water tank.
After creating our final design and manufacturing our prototype, our team has gained a better
understanding of the many challenges our design will face. Our design needs a delicate control
system to properly regulate the compressor speed, amount of water injected and cooling across
the intercooler. The control system will require sensors that give quick feedback, less than a
minute. As our system will operate under many different ambient conditions and loads, it is
important to perform testing for all conditions.
Another important issue with our final design is the amount of power the screw compressor will
need to raise the pressure to 2.5 bar and deliver a flow rate of 0.11 kg/s. The compressor will
pose the largest parasitic loss on the fuel cell system and for this reason its efficiency needs to be
maximized.
Another important challenge that needs to be addressed in our final design is condensation in the
ductwork. While we feel this may be minimized by properly controlling our system‟s
components, it is still important to consider alternative solutions such as a valve to purge the
system of water.
In conclusion, our team has delivered the requested information from Visteon about the
specifications necessary for a fuel cell air intake system and has also provided a unique assembly
of components to meet these specifications. In the future, more testing would have to be done to
determine the necessary control of our assembly. Also, our assembly will have to be mated to a
particular fuel cell vehicle and stack to truly perform accurate testing.
90
ACKNOWLEDGEMENTS
Throughout the semester, our team has received invaluable guidance from many individuals. We
would like to spend this section of the report to acknowledge their help and time by saying thank
you.
To start, we would like to thank Professor Gregory Hulbert for all his help and input on our
project. The weekly meetings we had with him always helped guide our project in the right
direction. This project could never have been completed without his help.
Next, we would like to thank our sponsors Visteon Corporation for giving us the opportunity to
undergo this project in the first place. Specifically, we would like to thank Josh Sparks and Tony
Arruda for meeting with us so many times and answering any questions our team had regarding
our project.
Another special thanks goes to our GSI Dan Johnson who spent countless hours answering our
questions and making sure that we were always SAFE!!! Even at our worst moments, Dan
always provided a comforting opinion.
We would also like to thank our friends at the machine shop Bob Coury and Marv Cressey.
These two individuals saved our team countless hours and headaches by providing simple
solutions to many of our biggest machining problems. They showed a lot of patience and always
answered our questions, no matter how strange they may have been.
In addition, we would like to thank all the professors that have helped us mold and shape our
project into what it is today.
Professor Anna Stefanopolou basically got our project moving. When we were struggling to find
information on fuel cells, she made herself available to answer all our questions and provide
valuable sources where we could learn a lot more. We would also like to thank the graduate
students Jim Marcicki and Jason Siegel at Professor Stefanopolou‟s fuel cell lab for a tour and
providing valuable information from their first handed experience with fuel cells.
Professor Claus Bognakke was of particular help in sharing his thermodynamic expertise with us.
We appreciate the time he spent sitting down with us and explaining the principles that related to
our overall system.
Professor Pawel Oslewski was also of great help to our project. We would like to thank him for
sitting down with us and getting us started on developing our thermodynamic model of our entire
system seen in the parameter analysis.
Special thanks goes to Tom Bress who provided us with our thermocouples and data acquisit ion
system.
Lastly, we would like to thank all the people who helped us out along the way: the people at all
the salvage yards we went to for giving us great deals on all our components purchased, the

91
personnel at Home Depot and ACE for taking an interest in our project and answering our many
questions during our numerous visits, the technicians at the MAZDA dealership for providing us
with information on our used compressor, and last but not least, Tim Diepenhorst‟s mother for
letting us build our prototype in her garage while making all kinds of noise late into the night.
92
REFERENCE LIST
[1] Srinivasan, S. (2006). Fuel cells: From fundamentals to applications. New York: Springer [2] Je Seung Lee, Nguyen Dinh Quan, Jung Min Hwang, Sang Deuk Lee, Honggon Kim, Hyunjoo
Lee, and Hoon Sik Kim. Polymer Electrolyte Membranes for Fuel Cells. J. Ind. Eng. Chem., Vol 12, No.2, (2006) 175-183.
[3] Larmine, J., & Dicks, A. (2000). Fuel cell systems explained. England: John Wiley and Sons,
LTD. [4] Richard Shelquist . Air Density and Density Altitude calculations.
http://wahiduddin.net/calc/density_altitude.htm [5] Kyung-Won Suh and Anna G. Stefanopoulou. Performance Limitations of Air Flow Control in
Power-Autonomous Fuel Cell Systems. IEEE TRANSACTIONS ON CONTROL SYSTEMS TECHNOLOGY, VOL. 15, NO. 3, MAY 2007
[6] Leo J. M. J. Blomen and Michael N. Mugerwa. (1993). Fuel Cell Systems. New York: Plenum
Press. [7] Nagahara, Y., Sugawara, S., Shinohara, K. (2008). The impact of air contaminants on PEMFC
performance and durability. Journal of Power Sources, 182, (2008), 422-428. doi:10.1016/j.jpowsour.2007.12.091
[8] Daniel M. Kennedy a, Donald R. Cahela a, Wenhua H. Zhua, Kenneth C. Westrom b, R. Mark
Nelmsb, Bruce J. Tatarchuk a,∗. Fuel cell cathode air filters: Methodologies for design and optimization. Journal of Power Sources 168 (2007) 391–399
doi:10.1016/j.jpowsour.2007.03.020 [9] Jon M. Moore a,), Paul L. Adcock a, J. Barry Lakeman b, Gary O. Mepsted b. The effects of
battlefield contaminants on PEMFC performance. Journal of Power Sources 85_2000.254–260
PII: S0378- 7753_99.00341-9 [10] Xiaowei Ma,c, Daijun Yang a,b, Wei Zhoua,b, Cunman Zhang a,b, Xiangmin Pan a,b, Lin Xuc,
Minzhong Wu c, Jianxin Maa,b. Evaluation of activated carbon adsorbent for fuel cell cathode air filtration. Journal of Power Sources 175 (2008) 383–389
doi:10.1016/j.jpowsour.2007.08.116 [11] Fenning Jing ∗, Ming Hou, Weiyu Shi, Jie Fu, Hongmei Yu, Pingwen Ming, Baolian Yi. The
effect of ambient contamination on PEMFC performance. Journal of Power Sources 166 (2007) 172–176
doi:10.1016/j.jpowsour.2006.12.103
93
[12] Thad Godish. (2005). Air Quality 4th Edition. New Jersey: Lewis Publishing Co. [13] "How are vehicle size classes defined?". fueleconomy.gov. Retrieved on 2008-05-10.
[14] http://www.toyota.com/camry/specs.html# [15] http://hydrogen-car-info.com/24-fuel_cell_composite.jpg [16] http://cache.boston.com/bonzai-
fba/Original_Photo/2008/10/14/Clarity_Engine_compartment__1224008950_0702.jpg
[17] Frick, Charles W.; Davis, Wallace F.; Randall, Lauros M.; and Mossman, Emmet A.: An
Experimental Investigation of NACA Submerged Duct Entrances NACA ACR 5I20, 1945. [18] Staniforth. Race and Rally Car Sourcebook. ISBN 1859608469. (Practical guidance on
designing and building NACA ducts for motor-racing applications) [19] http://www.yamaha-motor.com/sport/products/modelfeatures/8/0/features.aspx [20] Visteon Corporation. The performance of dust filters.
http://visteon.com/products/automotive/long_life_filter.html [21] Jeffery A. Schmidt, October 4, 2001, Method and Apparatus for Maintenance of Fuel Cell
Cathode Air Quality with Breathable Hydrophobic Membrane Air Filter. Patent No.: US 6,783,882 B2. Date of Patent: August 31, 2004
[22] Lisa Kosanovic. Running on Air – Evaluation of the Donaldson Chemical filter.
http://www.memagazine.org/backissues/membersonly/jan04/features/runonair/runonair.html
[23] Benjamin BLUNIER Student Member, IEEE, Abdellatif MIRAOUI Universit´e de Technologie
de Belfort-Montb´eliard (UTBM), Belfort CEDEX 90010, France Email: [email protected], [email protected]. Air Management in PEM Fuel Cells: State-of-the-Art and Prospective.
[24] Benjamin Blunier, Member, IEEE, Marcello Pucci, Member, IEEE, Giansalvo Cirrincione,
Member, IEEE, and Abdellatif Miraoui. A Scroll Compressor With a High-Performance Induction Motor Drive for the Air Management of a PEMFC System for Automotive Applications
[25] http://www.visteon.com/products/automotive/scroll_comp.html

94
[26] http://www.hydraulicspneumatics.com/200/TechZone/ FluidPowerAcces/Article/True/6454/TechZone-FluidPowerAcces
[27] http://www.eaton.com/EatonCom/ProductsServices/
PerformanceProducts/Products/Superchargers/TVS/index.htm [28] http://library.thinkquest.org/TQ0313006/ads%20dis2.htm [29] http://www.fscc-online.com/%22Passing%20Gas%22-article/passing_gas.html [30] Seung Hun Jung a, Seok Lae Kima, Min Soo Kima,∗, Yongsun Park b, Tae Won Limb.
Experimental study of gas humidification with injectors for automotive PEM fuel cell systems. Journal of Power Sources 170 (2007) 324–333
[31] James W. Klett, and David P. Stinton, March 14, 2003, Humidifier for Fuel Cell Using High
Conductivity Carbon Foam. Patent No.: 7,147,214 B2. Date of Patent: December 12, 2006
[32] Kyung-Won Suh and Anna G. Stefanopoulou. Performance Limitations of Air Flow Control
in Power-Autonomous Fuel Cell Systems. IEEE TRANSACTIONS ON CONTROL SYSTEMS TECHNOLOGY, VOL. 15, NO. 3, MAY 2007
[33] Chen, C. H., Chung, C. C., Lin, H. H., Yan, Y. Y. (2008). Improvement of CO tolerance of
proton exchange membrane fuel cell by an air-bleeding technique. Journal of Fuel Cell Science and Technology, 5 (2008) 014501. doi: http://dx.doi.org/10.1115/1.2784278.
[34] J. Sparks Visteon Corperation, Personal interview, January 16, 2008. [35] Kim, S. Y., Kim, W. N. (2007). Effect of cathode inlet manifold configuration on performance
of 10-cell proton-exchange membrane fuel cell. Journal of Power Sources, 166 (2007) 430-434. doi:10.1016/j.jpowsour.2006.12.104
[36] Borgnakke, Claus. Thermodynamics Professor, University of Michigan, Personal interview,
Februrary 12, 2009 [37] Shaffer, Robert. Air Squared Inc., Personal phone interview, March 10, 2009. [38] Oslewski, Pawel. Thermodynamics Professor, University of Michigan, Personal interview,
March 18, 2009 [39] Borgnakke, C., Sonntag, R. (2009). Fundamentals of Thermodynamics: 7th Ed. New Jersey:
John Wiley and Sons, Inc. [40] http://www.plumbingsupply.com/pvcvalve.ht
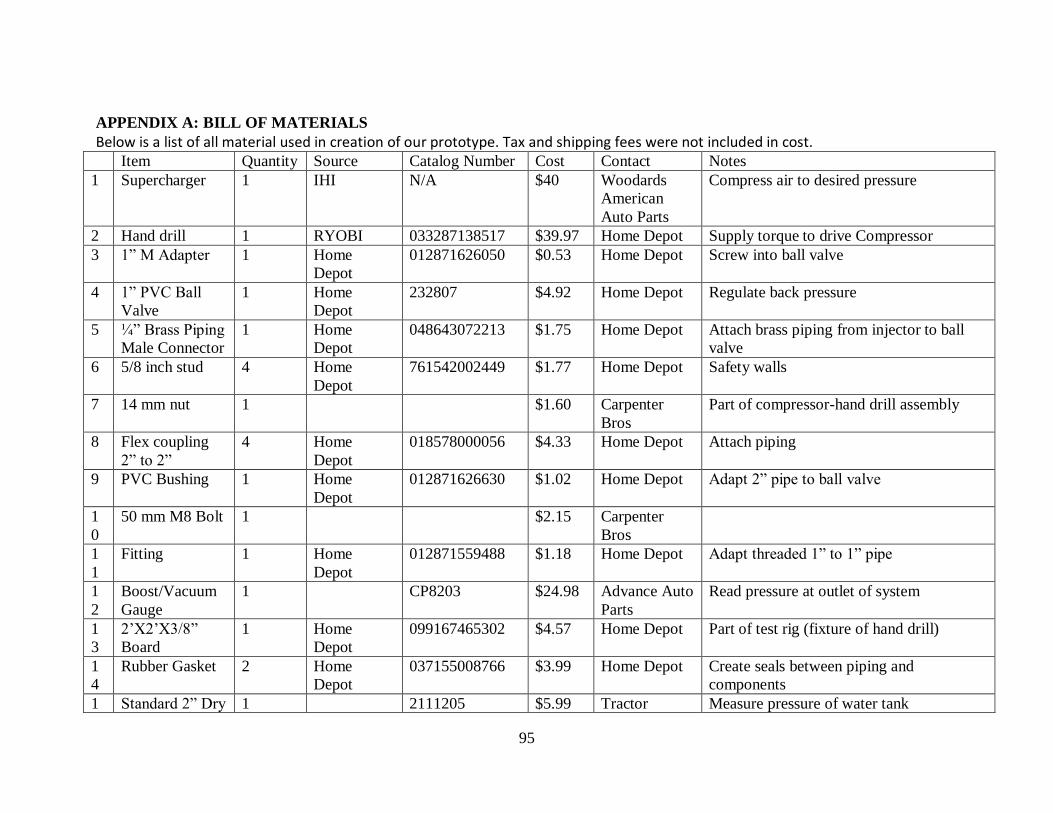
95
APPENDIX A: BILL OF MATERIALS
Below is a list of all material used in creation of our prototype. Tax and shipping fees were not included in cost. Item Quantity Source Catalog Number Cost Contact Notes
1 Supercharger 1 IHI N/A $40 Woodards
American
Auto Parts
Compress air to desired pressure
2 Hand drill 1 RYOBI 033287138517 $39.97 Home Depot Supply torque to drive Compressor
3 1” M Adapter 1 Home
Depot
012871626050 $0.53 Home Depot Screw into ball valve
4 1” PVC Ball
Valve
1 Home
Depot
232807 $4.92 Home Depot Regulate back pressure
5 ¼” Brass Piping
Male Connector
1 Home
Depot
048643072213 $1.75 Home Depot Attach brass piping from injector to ball
valve
6 5/8 inch stud 4 Home
Depot
761542002449 $1.77 Home Depot Safety walls
7 14 mm nut 1 $1.60 Carpenter
Bros
Part of compressor-hand drill assembly
8 Flex coupling
2” to 2”
4 Home
Depot
018578000056 $4.33 Home Depot Attach piping
9 PVC Bushing 1 Home
Depot
012871626630 $1.02 Home Depot Adapt 2” pipe to ball valve
1
0
50 mm M8 Bolt 1 $2.15 Carpenter
Bros
1
1
Fitting 1 Home
Depot
012871559488 $1.18 Home Depot Adapt threaded 1” to 1” pipe
1
2
Boost/Vacuum
Gauge
1 CP8203 $24.98 Advance Auto
Parts
Read pressure at outlet of system
1
3
2‟X2‟X3/8”
Board
1 Home
Depot
099167465302 $4.57 Home Depot Part of test rig (fixture of hand drill)
1
4
Rubber Gasket 2 Home
Depot
037155008766 $3.99 Home Depot Create seals between piping and
components
1 Standard 2” Dry 1 2111205 $5.99 Tractor Measure pressure of water tank

96
5 Gauge Supply Co.
1
6
Saw Kit 1 70882017280 $9.99 Meijer Drill large holes in PVC and wood
1
7
6‟ of 2”
diameter PVC
pipe
1 Home
Depot
$4.23 Home Depot Used as our team‟s piping
1
8
2‟X6‟X 8‟
Board
1 Home
Depot
090214000101 $3.18 Home Depot Test rig
1
9
PVC Cement 1 Home
Depot
038753310138 $3.76 Home Depot Gluing PVC pipes
2
0
Fitting 1 Home
Depot
012871558771 $2.52 Home Depot Used in water injection system
2
1
SS Clamp 1 Home
Depot
078575126029 $0.85 Home Depot Clamp hose piping
2
2
Barb 1 Home
Depot
048643071025 $2.23 Home Depot Used in water injection system
2
3
¼” Brass
Coupling
1 Home
Depot
048643072152 $2.33 Home Depot Used in water injection system
2
4
¼”X1/8”
Connector
1 Home
Depot
048643072190 $1.41 Home Depot Used in attaching spray nozzle to tubing
2
5
Fitting 1 Home
Depot
012871559235 $2.19 Home Depot Used in attaching spray nozzle to tubing
2
6
Fitting 1 Home
Depot
012871559396 $0.83 Home Depot Used in water injection system
2
7
Fitting 1 Home
Depot
012871558238 $2.91 Home Depot Used in water injection system
2
8
2.5” PVC
Connectors
4 Home
Depot
039003093931 $4.97 Home Depot PVC corners and connectors to route
ducting from component to component
2
9
23/32 Plywood 1 Home
Depot
776391550003 $10.95 Home Depot Test rig setup
3
0
Monarch
Nozzle M-5
Brass
2 Monarch M-5 $2.15 Monarch.com Spray nozzles for water injection system
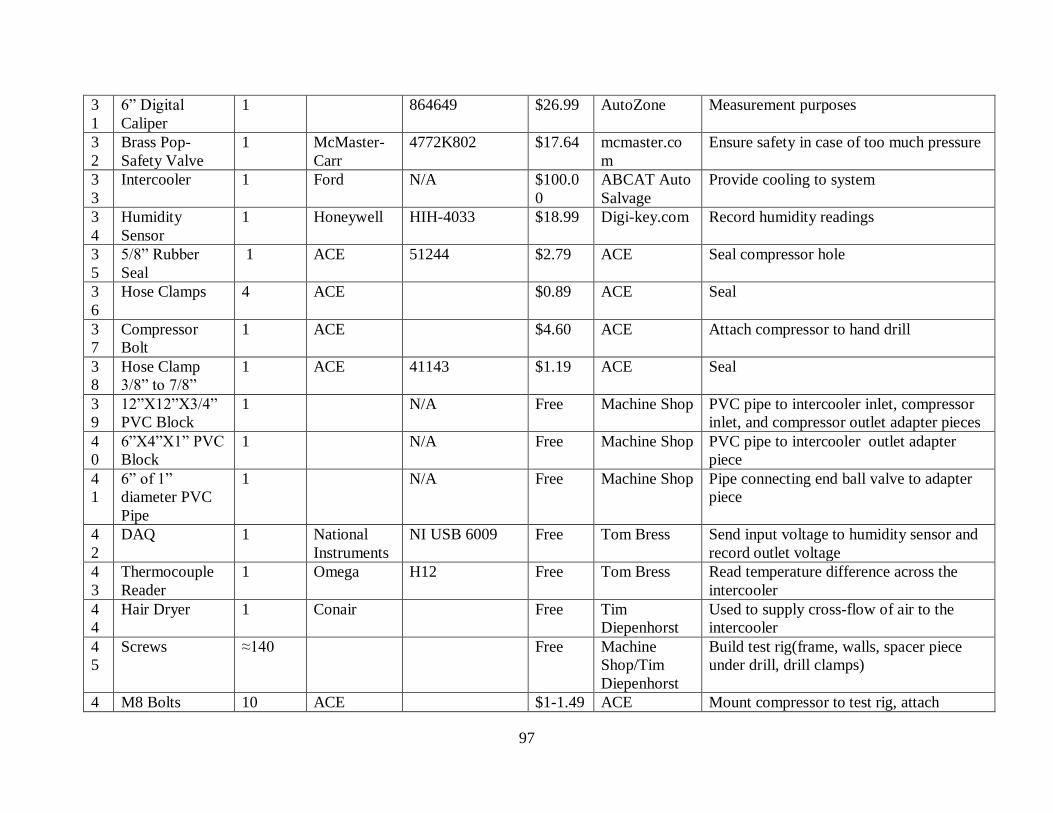
97
3
1
6” Digital
Caliper
1 864649 $26.99 AutoZone Measurement purposes
3
2
Brass Pop-
Safety Valve
1 McMaster-
Carr
4772K802 $17.64 mcmaster.co
m
Ensure safety in case of too much pressure
3
3
Intercooler 1 Ford N/A $100.0
0
ABCAT Auto
Salvage
Provide cooling to system
3
4
Humidity
Sensor
1 Honeywell HIH-4033 $18.99 Digi-key.com Record humidity readings
3
5
5/8” Rubber
Seal
1 ACE 51244 $2.79 ACE Seal compressor hole
3
6
Hose Clamps 4 ACE $0.89 ACE Seal
3
7
Compressor
Bolt
1 ACE $4.60 ACE Attach compressor to hand drill
3
8
Hose Clamp
3/8” to 7/8”
1 ACE 41143 $1.19 ACE Seal
3
9
12”X12”X3/4”
PVC Block
1 N/A Free Machine Shop PVC pipe to intercooler inlet, compressor
inlet, and compressor outlet adapter pieces
4
0
6”X4”X1” PVC
Block
1 N/A Free Machine Shop PVC pipe to intercooler outlet adapter
piece
4
1
6” of 1”
diameter PVC
Pipe
1 N/A Free Machine Shop Pipe connecting end ball valve to adapter
piece
4
2
DAQ 1 National
Instruments
NI USB 6009 Free Tom Bress Send input voltage to humidity sensor and
record outlet voltage
4
3
Thermocouple
Reader
1 Omega H12 Free Tom Bress Read temperature difference across the
intercooler
4
4
Hair Dryer 1 Conair Free Tim
Diepenhorst
Used to supply cross-flow of air to the
intercooler
4
5
Screws ≈140 Free Machine
Shop/Tim
Diepenhorst
Build test rig(frame, walls, spacer piece
under drill, drill clamps)
4 M8 Bolts 10 ACE $1-1.49 ACE Mount compressor to test rig, attach
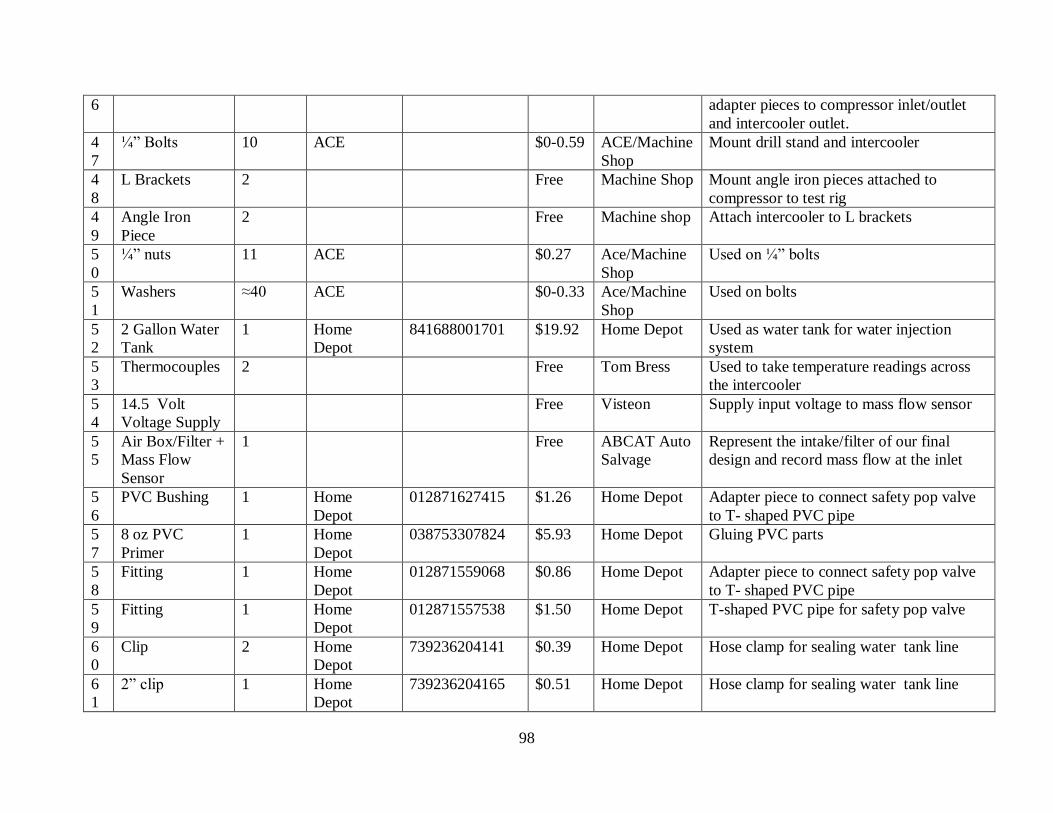
98
6 adapter pieces to compressor inlet/outlet
and intercooler outlet.
4
7
¼” Bolts 10 ACE $0-0.59 ACE/Machine
Shop
Mount drill stand and intercooler
4
8
L Brackets 2 Free Machine Shop Mount angle iron pieces attached to
compressor to test rig
4
9
Angle Iron
Piece
2 Free Machine shop Attach intercooler to L brackets
5
0
¼” nuts 11 ACE $0.27 Ace/Machine
Shop
Used on ¼” bolts
5
1
Washers ≈40 ACE $0-0.33 Ace/Machine
Shop
Used on bolts
5
2
2 Gallon Water
Tank
1 Home
Depot
841688001701 $19.92 Home Depot Used as water tank for water injection
system
5
3
Thermocouples 2 Free Tom Bress Used to take temperature readings across
the intercooler
5
4
14.5 Volt
Voltage Supply
Free Visteon Supply input voltage to mass flow sensor
5
5
Air Box/Filter +
Mass Flow
Sensor
1 Free ABCAT Auto
Salvage
Represent the intake/filter of our final
design and record mass flow at the inlet
5
6
PVC Bushing 1 Home
Depot
012871627415 $1.26 Home Depot Adapter piece to connect safety pop valve
to T- shaped PVC pipe
5
7
8 oz PVC
Primer
1 Home
Depot
038753307824 $5.93 Home Depot Gluing PVC parts
5
8
Fitting 1 Home
Depot
012871559068 $0.86 Home Depot Adapter piece to connect safety pop valve
to T- shaped PVC pipe
5
9
Fitting 1 Home
Depot
012871557538 $1.50 Home Depot T-shaped PVC pipe for safety pop valve
6
0
Clip 2 Home
Depot
739236204141 $0.39 Home Depot Hose clamp for sealing water tank line
6
1
2” clip 1 Home
Depot
739236204165 $0.51 Home Depot Hose clamp for sealing water tank line
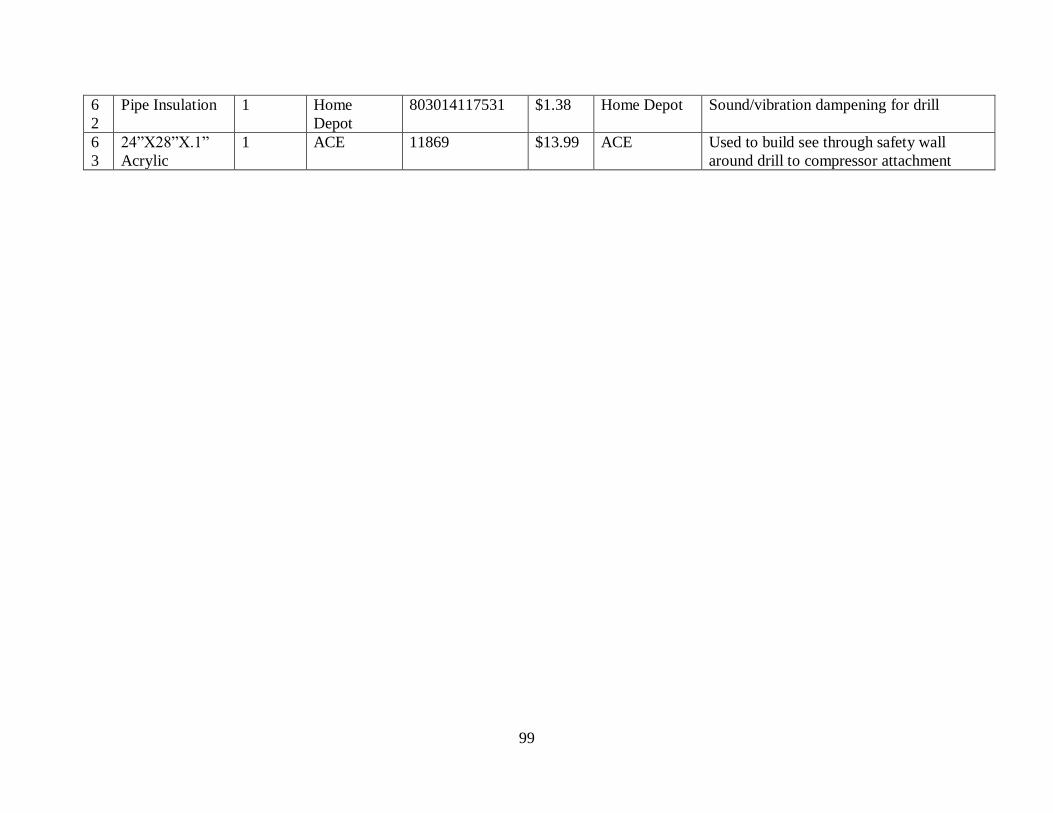
99
6
2
Pipe Insulation 1 Home
Depot
803014117531 $1.38 Home Depot Sound/vibration dampening for drill
6
3
24”X28”X.1”
Acrylic
1 ACE 11869 $13.99 ACE Used to build see through safety wall
around drill to compressor attachment
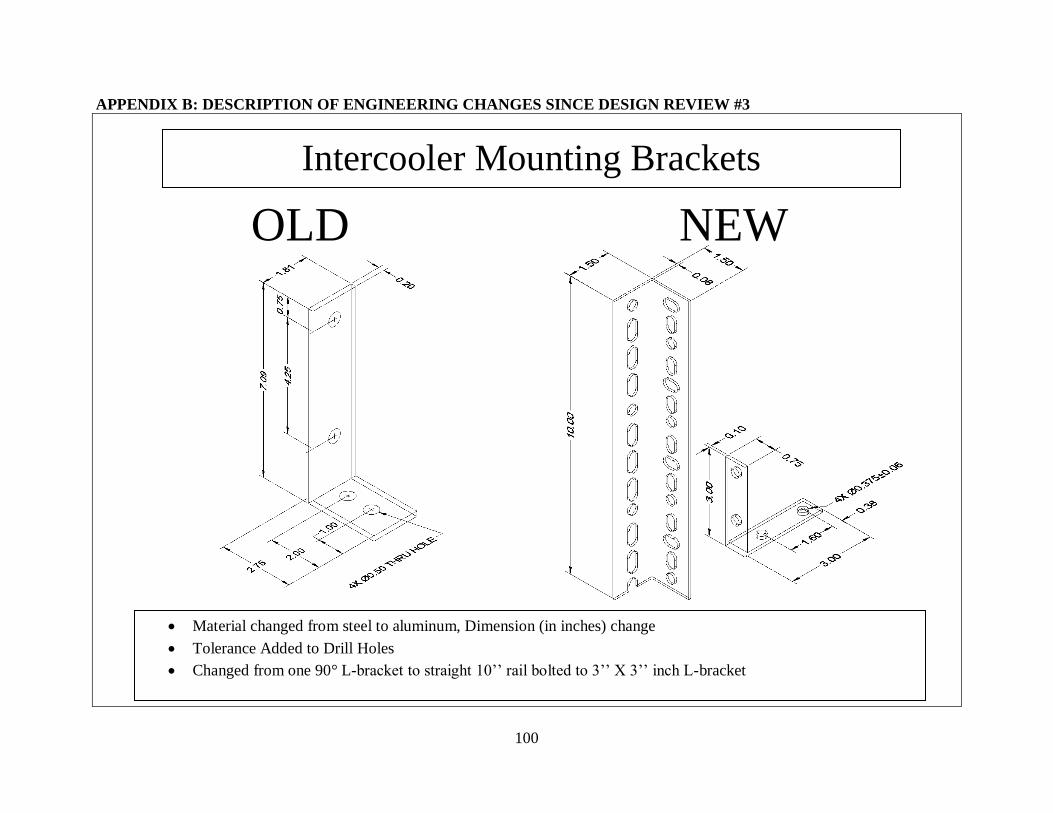
100
APPENDIX B: DESCRIPTION OF ENGINEERING CHANGES SINCE DESIGN REVIEW #3
Material changed from steel to aluminum, Dimension (in inches) change
Tolerance Added to Drill Holes
Changed from one 90° L-bracket to straight 10‟‟ rail bolted to 3‟‟ X 3‟‟ inch L-bracket
Intercooler Mounting Brackets
OLD NEW
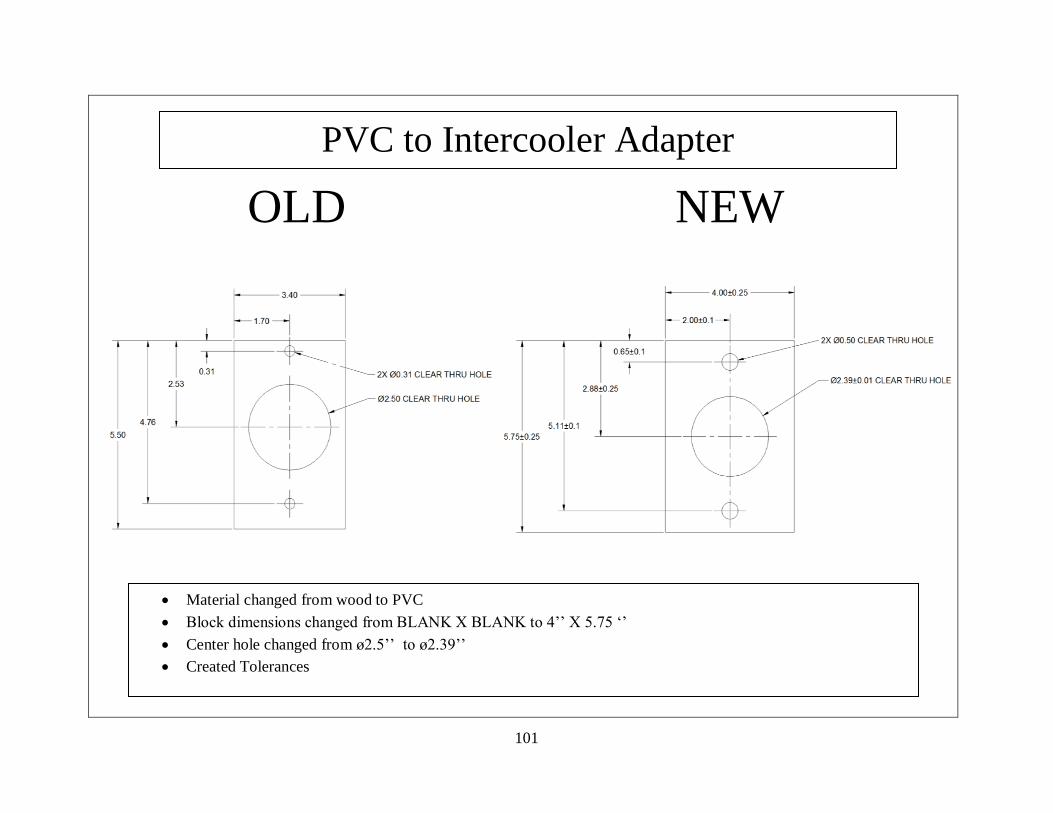
101
PVC to Intercooler Adapter
OLD NEW
Material changed from wood to PVC
Block dimensions changed from BLANK X BLANK to 4‟‟ X 5.75 „‟
Center hole changed from ø2.5‟‟ to ø2.39‟‟
Created Tolerances
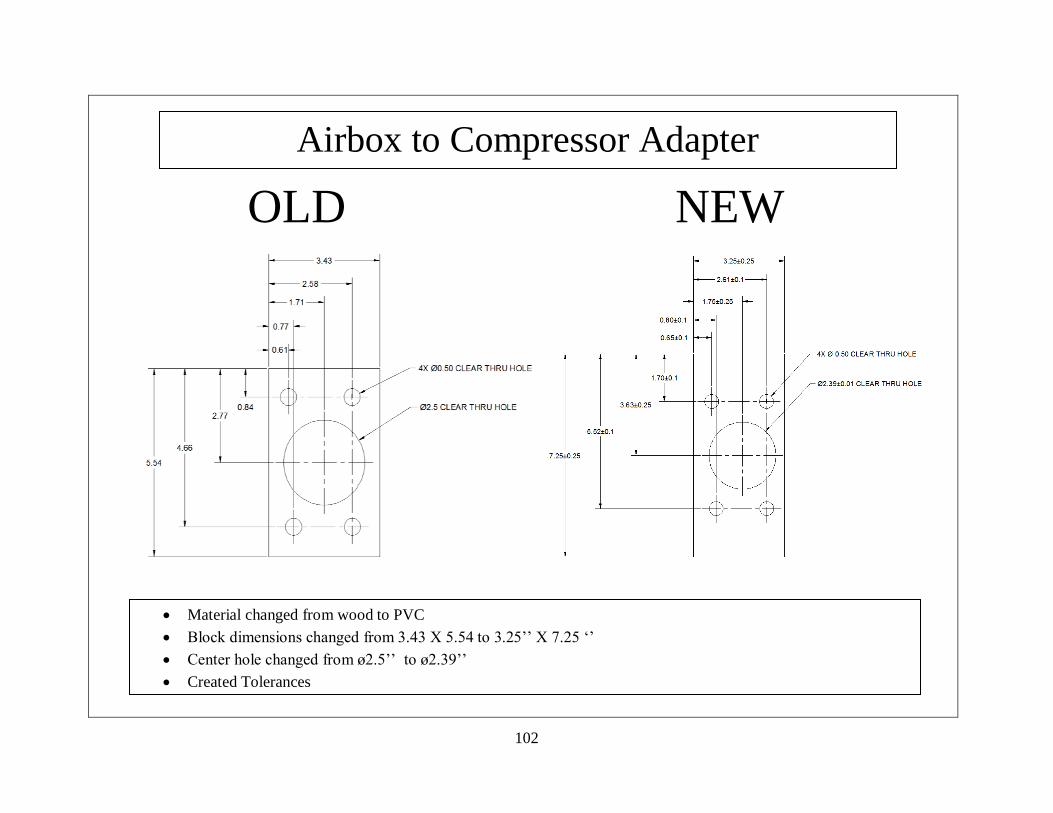
102
Airbox to Compressor Adapter
OLD NEW
Material changed from wood to PVC
Block dimensions changed from 3.43 X 5.54 to 3.25‟‟ X 7.25 „‟
Center hole changed from ø2.5‟‟ to ø2.39‟‟
Created Tolerances

103
Compressor to PVC Adapter
OLD NEW
Material changed from wood to PVC
Block dimensions changed from 3.82 X 5.50 to 4.75‟‟ X 5.5 „‟
Center hole changed from ø2.5‟‟ to ø2.39‟‟
Created tolerances
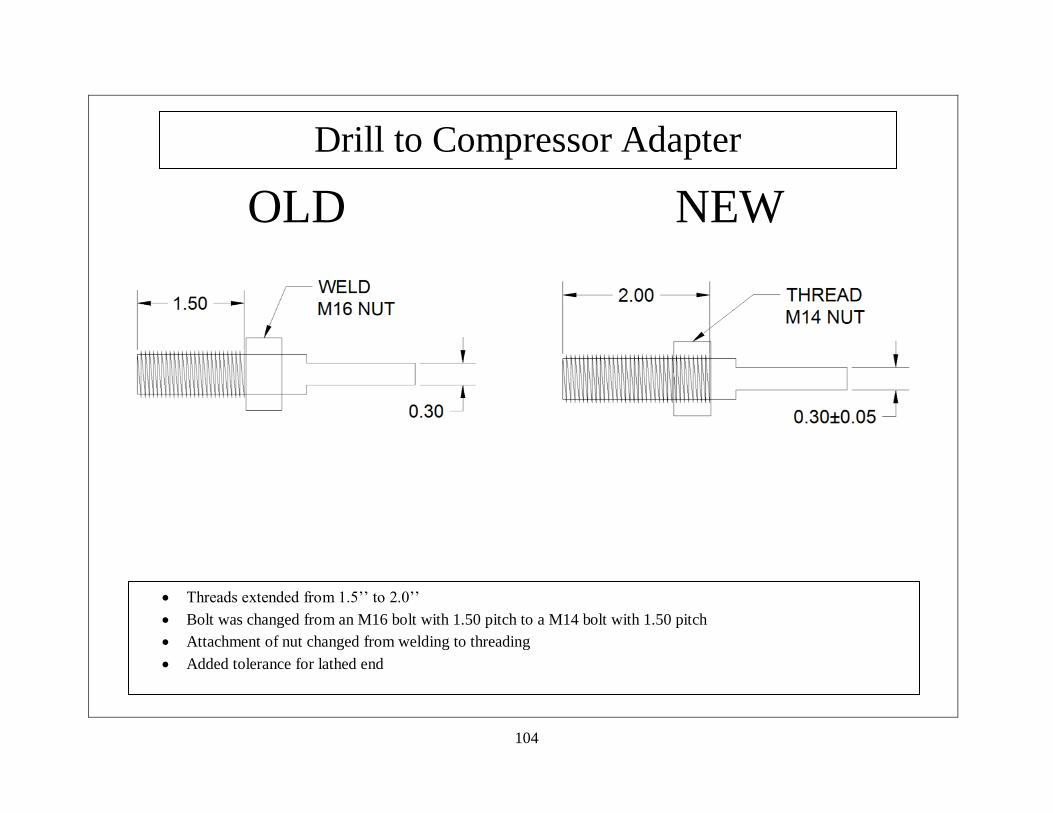
104
Drill to Compressor Adapter
OLD NEW
Threads extended from 1.5‟‟ to 2.0‟‟
Bolt was changed from an M16 bolt with 1.50 pitch to a M14 bolt with 1.50 pitch
Attachment of nut changed from welding to threading
Added tolerance for lathed end
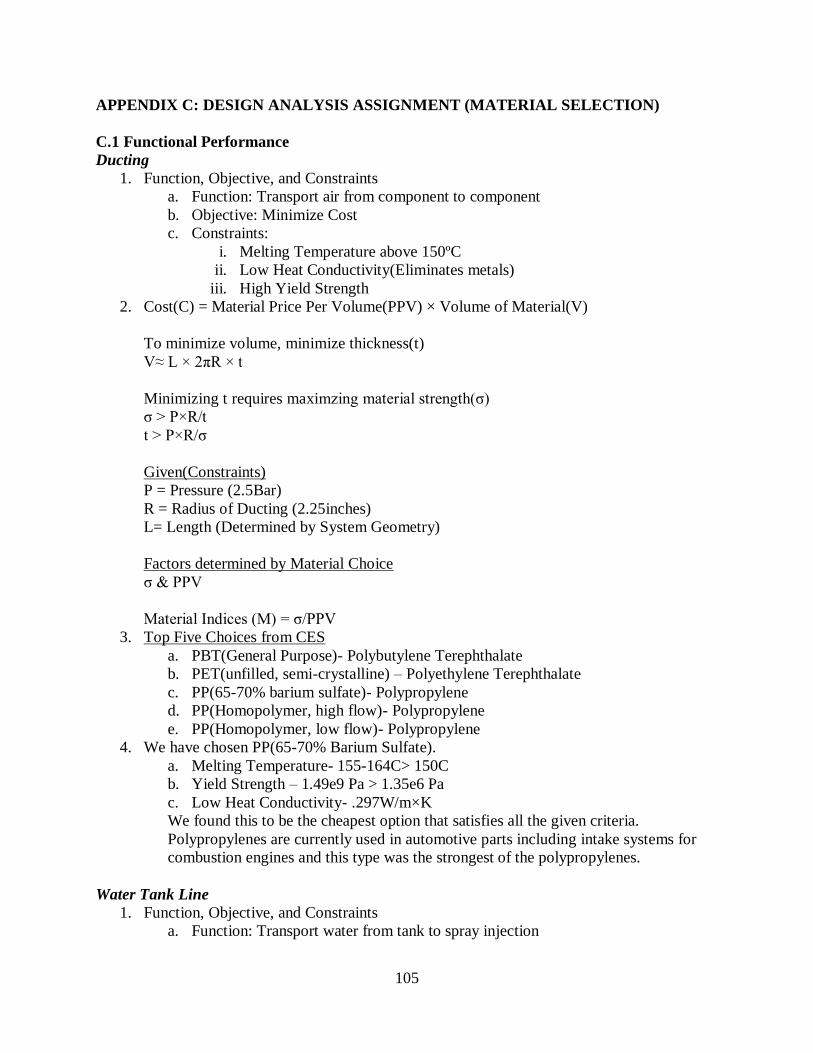
105
APPENDIX C: DESIGN ANALYSIS ASSIGNMENT (MATERIAL SELECTION)
C.1 Functional Performance
Ducting
1. Function, Objective, and Constraints
a. Function: Transport air from component to component
b. Objective: Minimize Cost
c. Constraints:
i. Melting Temperature above 150ºC
ii. Low Heat Conductivity(Eliminates metals)
iii. High Yield Strength
2. Cost(C) = Material Price Per Volume(PPV) × Volume of Material(V)
To minimize volume, minimize thickness(t)
V≈ L × 2πR × t
Minimizing t requires maximzing material strength(σ)
σ > P×R/t
t > P×R/σ
Given(Constraints)
P = Pressure (2.5Bar)
R = Radius of Ducting (2.25inches)
L= Length (Determined by System Geometry)
Factors determined by Material Choice
σ & PPV
Material Indices (M) = σ/PPV
3. Top Five Choices from CES
a. PBT(General Purpose)- Polybutylene Terephthalate
b. PET(unfilled, semi-crystalline) – Polyethylene Terephthalate
c. PP(65-70% barium sulfate)- Polypropylene
d. PP(Homopolymer, high flow)- Polypropylene
e. PP(Homopolymer, low flow)- Polypropylene
4. We have chosen PP(65-70% Barium Sulfate).
a. Melting Temperature- 155-164C> 150C
b. Yield Strength – 1.49e9 Pa > 1.35e6 Pa
c. Low Heat Conductivity- .297W/m×K
We found this to be the cheapest option that satisfies all the given criteria.
Polypropylenes are currently used in automotive parts including intake systems for
combustion engines and this type was the strongest of the polypropylenes.
Water Tank Line
1. Function, Objective, and Constraints
a. Function: Transport water from tank to spray injection
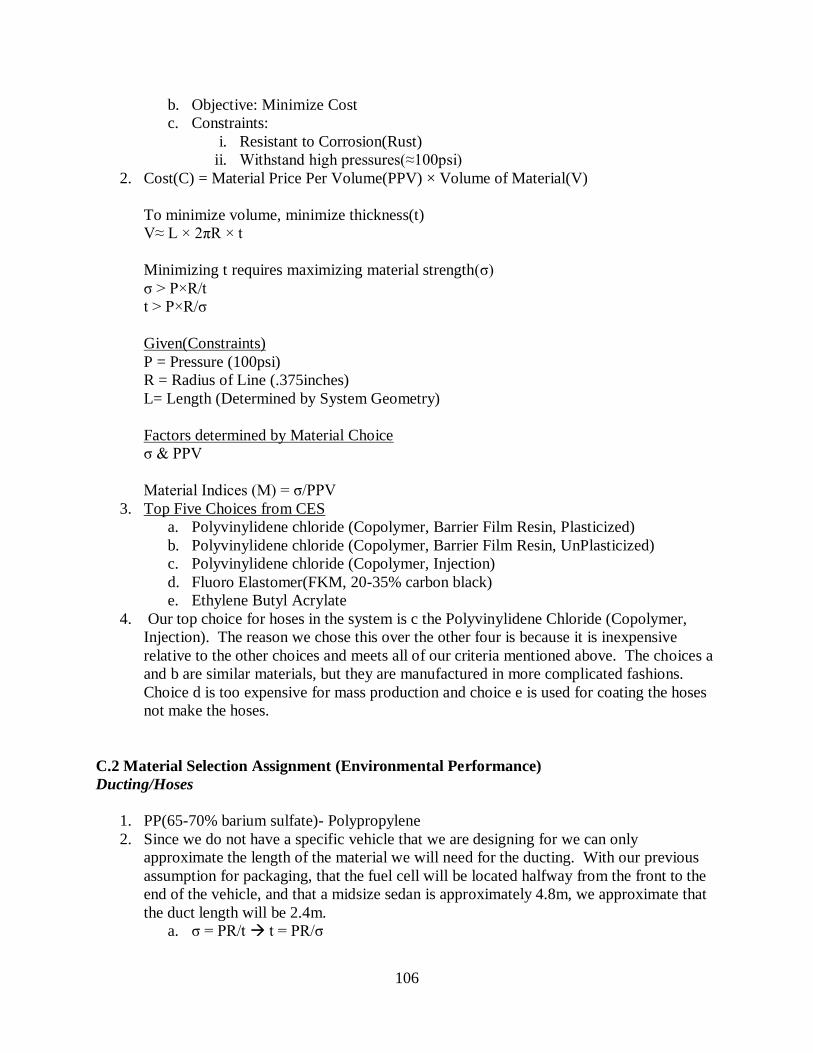
106
b. Objective: Minimize Cost
c. Constraints:
i. Resistant to Corrosion(Rust)
ii. Withstand high pressures(≈100psi)
2. Cost(C) = Material Price Per Volume(PPV) × Volume of Material(V)
To minimize volume, minimize thickness(t)
V≈ L × 2πR × t
Minimizing t requires maximizing material strength(σ)
σ > P×R/t
t > P×R/σ
Given(Constraints)
P = Pressure (100psi)
R = Radius of Line (.375inches)
L= Length (Determined by System Geometry)
Factors determined by Material Choice
σ & PPV
Material Indices (M) = σ/PPV
3. Top Five Choices from CES
a. Polyvinylidene chloride (Copolymer, Barrier Film Resin, Plasticized)
b. Polyvinylidene chloride (Copolymer, Barrier Film Resin, UnPlasticized)
c. Polyvinylidene chloride (Copolymer, Injection)
d. Fluoro Elastomer(FKM, 20-35% carbon black)
e. Ethylene Butyl Acrylate
4. Our top choice for hoses in the system is c the Polyvinylidene Chloride (Copolymer,
Injection). The reason we chose this over the other four is because it is inexpensive
relative to the other choices and meets all of our criteria mentioned above. The choices a
and b are similar materials, but they are manufactured in more complicated fashions.
Choice d is too expensive for mass production and choice e is used for coating the hoses
not make the hoses.
C.2 Material Selection Assignment (Environmental Performance)
Ducting/Hoses
1. PP(65-70% barium sulfate)- Polypropylene
2. Since we do not have a specific vehicle that we are designing for we can only
approximate the length of the material we will need for the ducting. With our previous
assumption for packaging, that the fuel cell will be located halfway from the front to the
end of the vehicle, and that a midsize sedan is approximately 4.8m, we approximate that
the duct length will be 2.4m.
a. σ = PR/t t = PR/σ

107
i. P = Pressure
ii. R = Radius of Duct
iii. t = Thickness of Duct
iv. Safety Factor = 3
b. P = 2.5bar – 1Bar = 1.5Bar 150kPa
c. R = 1in .0254m
d. σ = 1.78E4kPa
e. t = (3×150kPa×.0254m)/1.78E4kPa t = 0.000642 m
f. A = π×(Ro2 – Ri
2) = π(.026m
2-.0254
2) = 0.000104m
2
i. Ro = Outer Radius
ii. Ri = Inner Radius
g. V = A× L = 0.000104m2×2.4m = 0.000249m
3
i. L = 2.4m
h. ρ = m/V m = ρ×V m = 1890kg/m3×0.000249m
3 = .471kg
i. ρ = 1890kg/m3
3. Polyvinylidene chloride (Copolymer, Injection)
4. Since we do not have a specific vehicle that we are designing for we can only
approximate the length of the material we will need for the hoses. With our previous
assumption for packaging, that the components are going to be relatively close to each
other, we want to be on the safe side and overestimate, so we are approximating the hose
length to be 2ft.
a. σ = PR/t t = PR/σ
i. P = Pressure
ii. R = Radius of Duct
iii. t = Thickness of Duct
iv. Safety Factor = 3
b. P = 100psi 689.47kPa
c. R = 0.375in 0.009525m
d. σ = 1.93E4kPa
e. t = (3×689.47kPa×0.009525m)/1.93E4kPa t = 0.001021m
f. A = π×(Ro2 – Ri
2) = π(.01054m
2-.009525m
2) = 0.000064m
2
i. Ro = Outer Radius
ii. Ri = Inner Radius
g. V = A× L = 0.000064m2×0.3048m = 0.00002m
3
i. L = 1ft 0.3048
h. ρ = m/V m = ρ×V m = 1650kg/m3×0.00002m
3 = 0.0324kg
i. ρ = 1650kg/m3
5.
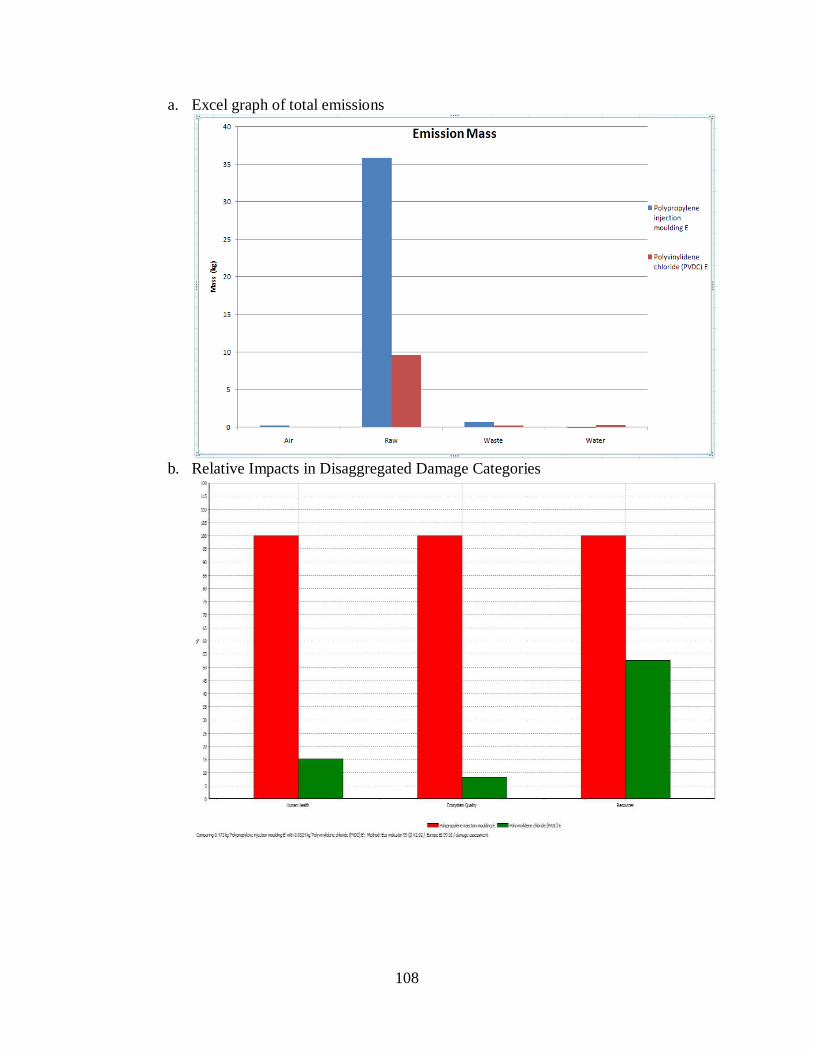
108
a. Excel graph of total emissions
b. Relative Impacts in Disaggregated Damage Categories
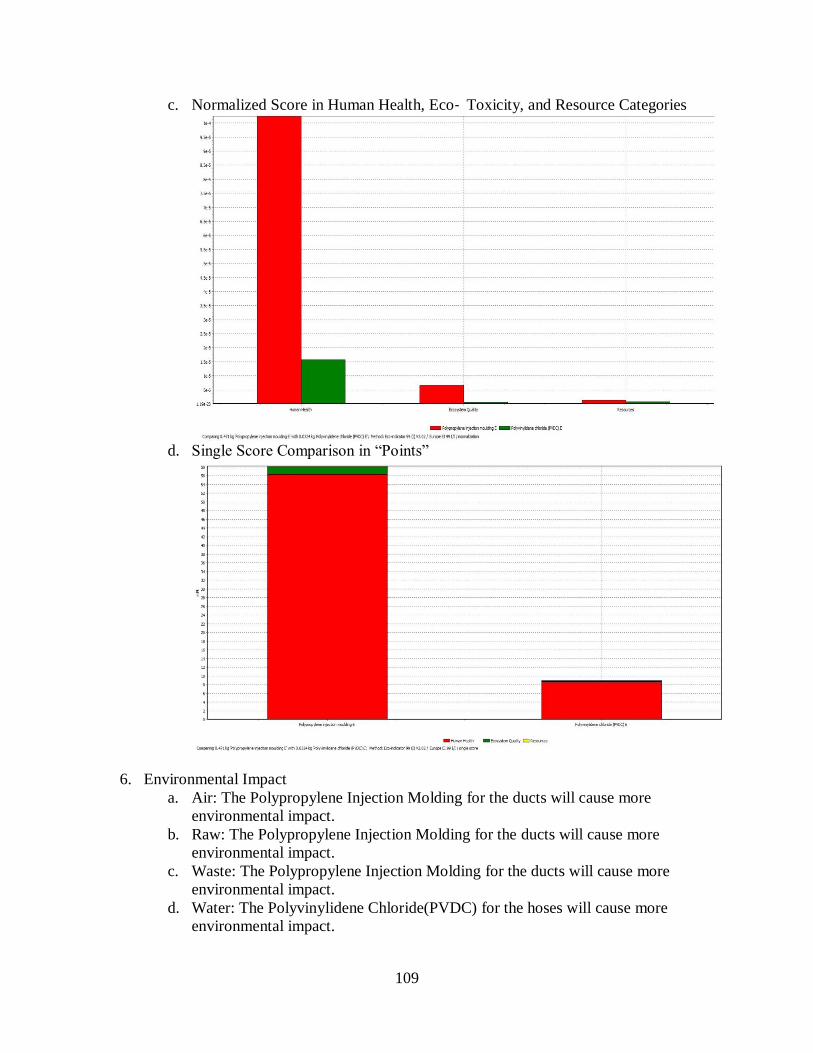
109
c. Normalized Score in Human Health, Eco‐ Toxicity, and Resource Categories
d. Single Score Comparison in “Points”
6. Environmental Impact
a. Air: The Polypropylene Injection Molding for the ducts will cause more
environmental impact.
b. Raw: The Polypropylene Injection Molding for the ducts will cause more
environmental impact.
c. Waste: The Polypropylene Injection Molding for the ducts will cause more
environmental impact.
d. Water: The Polyvinylidene Chloride(PVDC) for the hoses will cause more
environmental impact.
110
7. Damage Assessment
a. The damage assessment for the Polypropylene Injection Moulding will impact the
Human Health, Ecosystem Quality, and Resourses equally.
b. The damage assessment for the Polyvinylidene Chloride(PVDC) will impact the
Resourses most.
8. Life time Impact
a. The Polypropylene Injection Molding has a higher EcoIndicator 99 point value.
Over the Life Cycle of the vehicle the Polypropylene will have more of an impact
on the various environmental aspects such as human health, resources, ecosystem
quality…etc than the PVDC.
C.3 Manufacturing Process Selection Assignment
Ducts
1. One of the more popular mid size sedans in the US is the Toyota Camry. They sold
386,000 units in 2008. This is a reasonable estimation if fuel cell cars are mass produced
in the near future.
2. To make the ducting for our system from the PP(65-70% barium sulfate)- Polypropylene,
we will have to use the polymer extrusion process. This process lets us make a constant
diameter tube at different lengths from a polymer type composition. There is very little
waste; the process in CES says that it uses up to 99% of the material. Since we need to
produce a large volume, production time is important. This process is the fastest way to
make these parts compared to other processes.
Hoses
1. Again using the Toyota Camry model we predict that if this project becomes popular and
is mass produced, we would make around 386,000 units of hoses for the air intake
system.
2. Making the hoses would require the same process as the ducting, polymer extrusion,
because this also is a high volume production of a polymer into a constant diameter
circular cross section.

111
APPENDIX D: QUALITY FUNCTION DEPLOYMENT
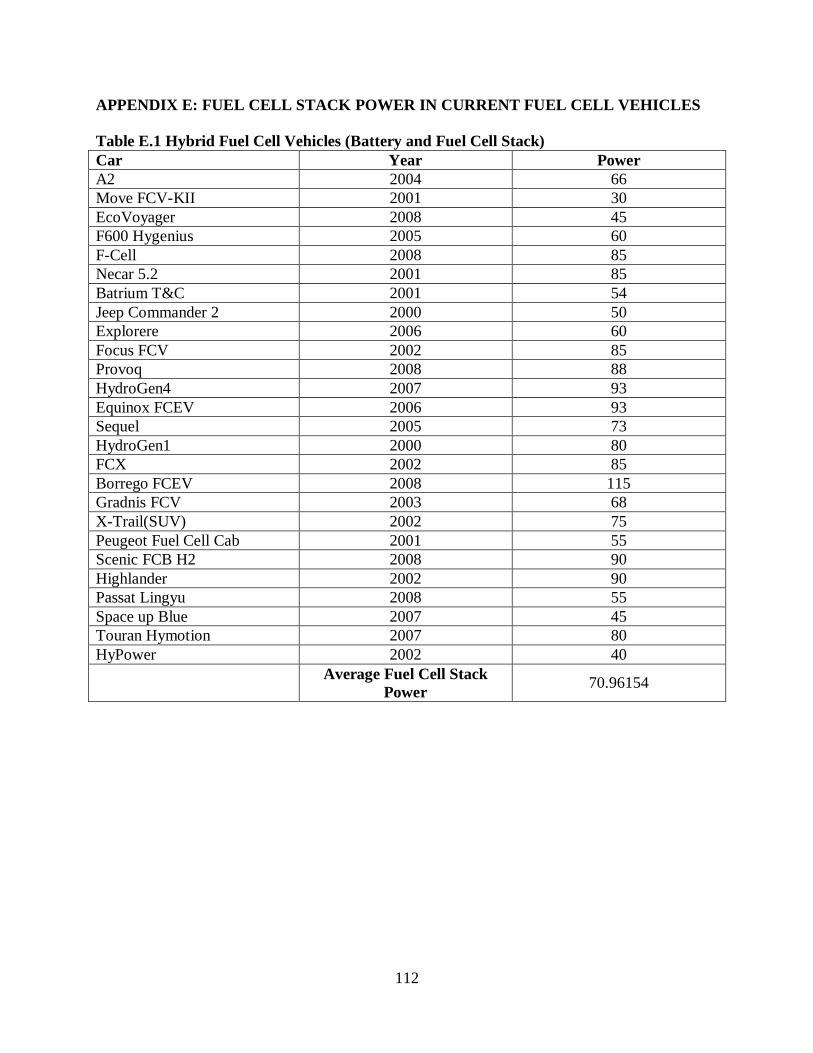
112
APPENDIX E: FUEL CELL STACK POWER IN CURRENT FUEL CELL VEHICLES
Table E.1 Hybrid Fuel Cell Vehicles (Battery and Fuel Cell Stack)
Car Year Power
A2 2004 66
Move FCV-KII 2001 30
EcoVoyager 2008 45
F600 Hygenius 2005 60
F-Cell 2008 85
Necar 5.2 2001 85
Batrium T&C 2001 54
Jeep Commander 2 2000 50
Explorere 2006 60
Focus FCV 2002 85
Provoq 2008 88
HydroGen4 2007 93
Equinox FCEV 2006 93
Sequel 2005 73
HydroGen1 2000 80
FCX 2002 85
Borrego FCEV 2008 115
Gradnis FCV 2003 68
X-Trail(SUV) 2002 75
Peugeot Fuel Cell Cab 2001 55
Scenic FCB H2 2008 90
Highlander 2002 90
Passat Lingyu 2008 55
Space up Blue 2007 45
Touran Hymotion 2007 80
HyPower 2002 40
Average Fuel Cell Stack
Power 70.96154
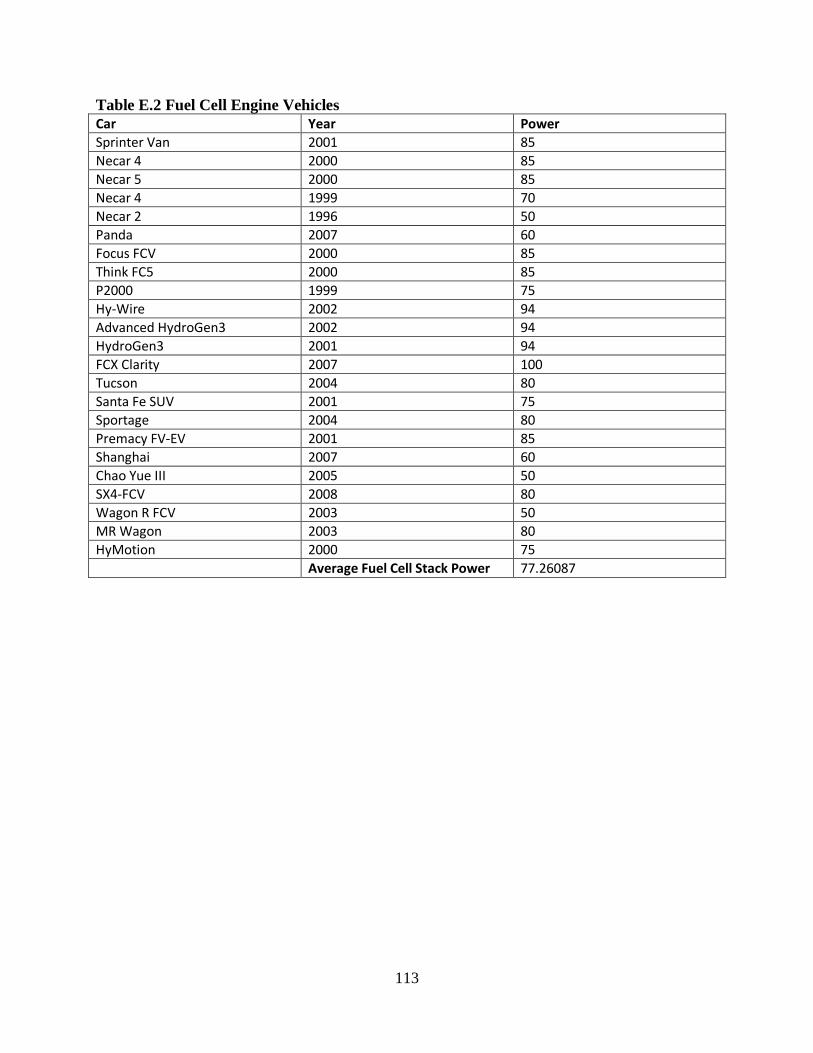
113
Table E.2 Fuel Cell Engine Vehicles
Car Year Power
Sprinter Van 2001 85
Necar 4 2000 85
Necar 5 2000 85
Necar 4 1999 70
Necar 2 1996 50
Panda 2007 60
Focus FCV 2000 85
Think FC5 2000 85
P2000 1999 75
Hy-Wire 2002 94
Advanced HydroGen3 2002 94
HydroGen3 2001 94
FCX Clarity 2007 100
Tucson 2004 80
Santa Fe SUV 2001 75
Sportage 2004 80
Premacy FV-EV 2001 85
Shanghai 2007 60
Chao Yue III 2005 50
SX4-FCV 2008 80
Wagon R FCV 2003 50
MR Wagon 2003 80
HyMotion 2000 75
Average Fuel Cell Stack Power 77.26087
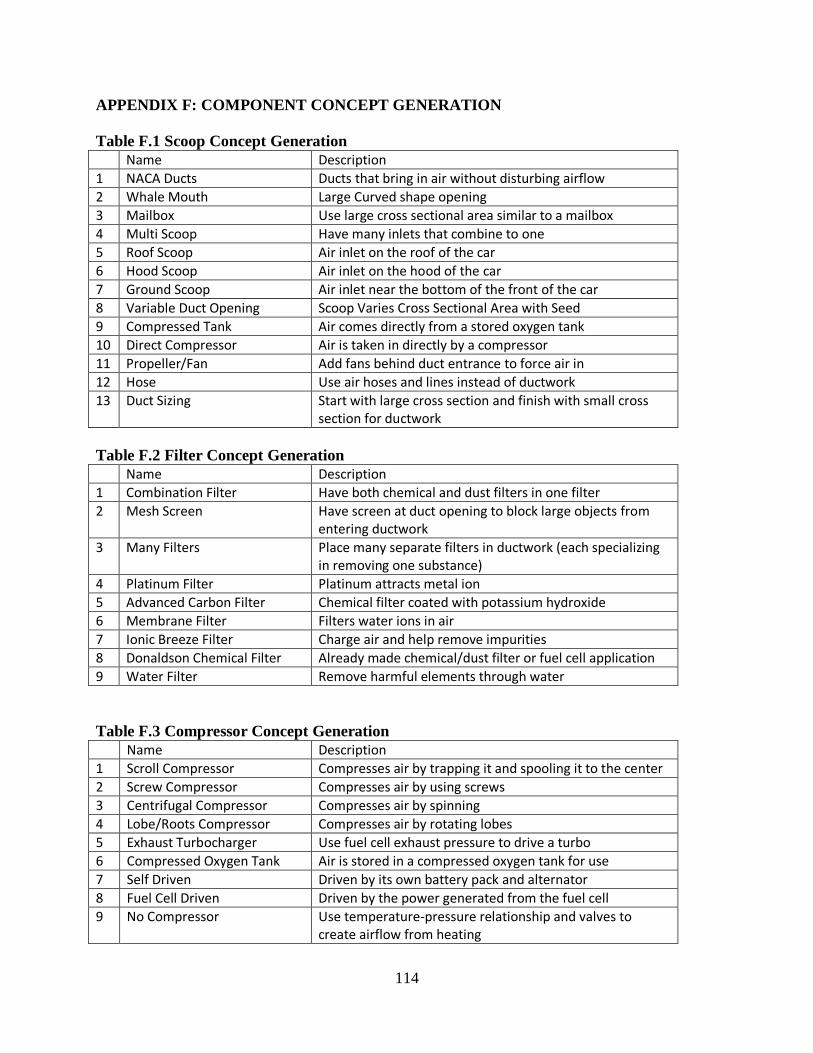
114
APPENDIX F: COMPONENT CONCEPT GENERATION
Table F.1 Scoop Concept Generation
Name Description
1 NACA Ducts Ducts that bring in air without disturbing airflow
2 Whale Mouth Large Curved shape opening
3 Mailbox Use large cross sectional area similar to a mailbox
4 Multi Scoop Have many inlets that combine to one
5 Roof Scoop Air inlet on the roof of the car
6 Hood Scoop Air inlet on the hood of the car
7 Ground Scoop Air inlet near the bottom of the front of the car
8 Variable Duct Opening Scoop Varies Cross Sectional Area with Seed
9 Compressed Tank Air comes directly from a stored oxygen tank
10 Direct Compressor Air is taken in directly by a compressor
11 Propeller/Fan Add fans behind duct entrance to force air in
12 Hose Use air hoses and lines instead of ductwork
13 Duct Sizing Start with large cross section and finish with small cross section for ductwork
Table F.2 Filter Concept Generation
Name Description
1 Combination Filter Have both chemical and dust filters in one filter
2 Mesh Screen Have screen at duct opening to block large objects from entering ductwork
3 Many Filters Place many separate filters in ductwork (each specializing in removing one substance)
4 Platinum Filter Platinum attracts metal ion
5 Advanced Carbon Filter Chemical filter coated with potassium hydroxide
6 Membrane Filter Filters water ions in air
7 Ionic Breeze Filter Charge air and help remove impurities
8 Donaldson Chemical Filter Already made chemical/dust filter or fuel cell application
9 Water Filter Remove harmful elements through water
Table F.3 Compressor Concept Generation
Name Description
1 Scroll Compressor Compresses air by trapping it and spooling it to the center
2 Screw Compressor Compresses air by using screws
3 Centrifugal Compressor Compresses air by spinning
4 Lobe/Roots Compressor Compresses air by rotating lobes
5 Exhaust Turbocharger Use fuel cell exhaust pressure to drive a turbo
6 Compressed Oxygen Tank Air is stored in a compressed oxygen tank for use
7 Self Driven Driven by its own battery pack and alternator
8 Fuel Cell Driven Driven by the power generated from the fuel cell
9 No Compressor Use temperature-pressure relationship and valves to create airflow from heating
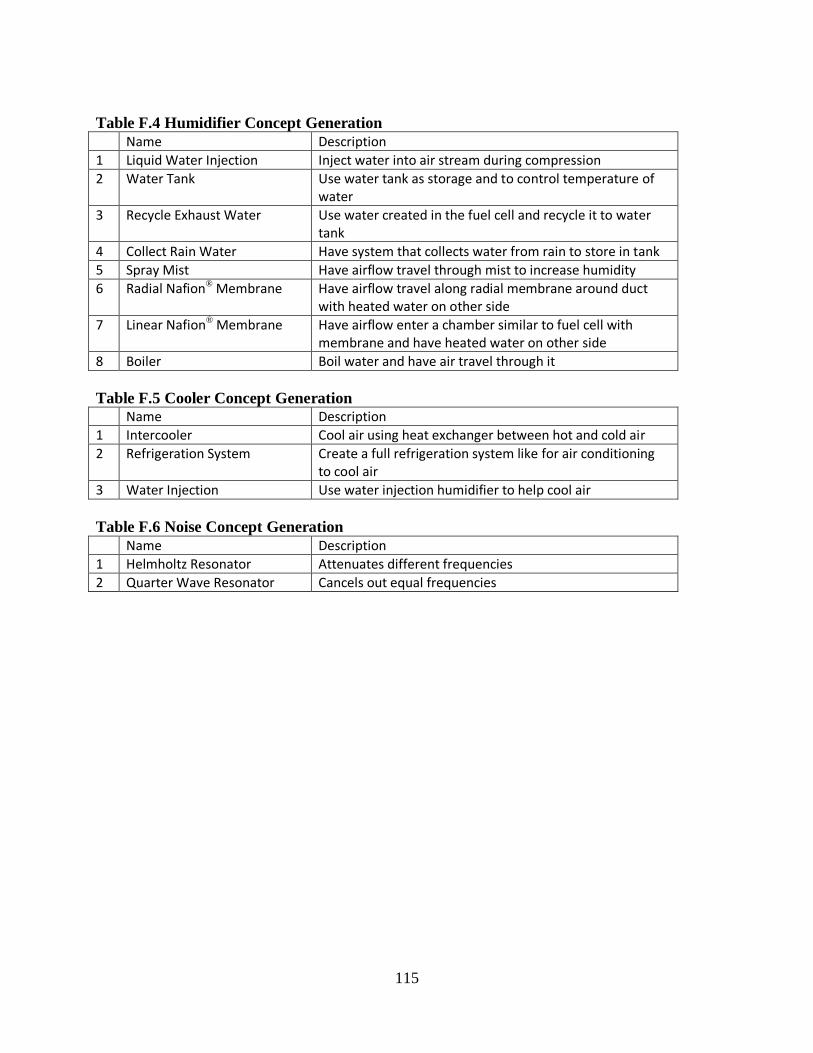
115
Table F.4 Humidifier Concept Generation
Name Description
1 Liquid Water Injection Inject water into air stream during compression
2 Water Tank Use water tank as storage and to control temperature of water
3 Recycle Exhaust Water Use water created in the fuel cell and recycle it to water tank
4 Collect Rain Water Have system that collects water from rain to store in tank
5 Spray Mist Have airflow travel through mist to increase humidity
6 Radial Nafion® Membrane Have airflow travel along radial membrane around duct with heated water on other side
7 Linear Nafion® Membrane Have airflow enter a chamber similar to fuel cell with membrane and have heated water on other side
8 Boiler Boil water and have air travel through it
Table F.5 Cooler Concept Generation
Name Description
1 Intercooler Cool air using heat exchanger between hot and cold air
2 Refrigeration System Create a full refrigeration system like for air conditioning to cool air
3 Water Injection Use water injection humidifier to help cool air
Table F.6 Noise Concept Generation
Name Description
1 Helmholtz Resonator Attenuates different frequencies
2 Quarter Wave Resonator Cancels out equal frequencies

116
APPENDIX G: CONCEPT GENERATION
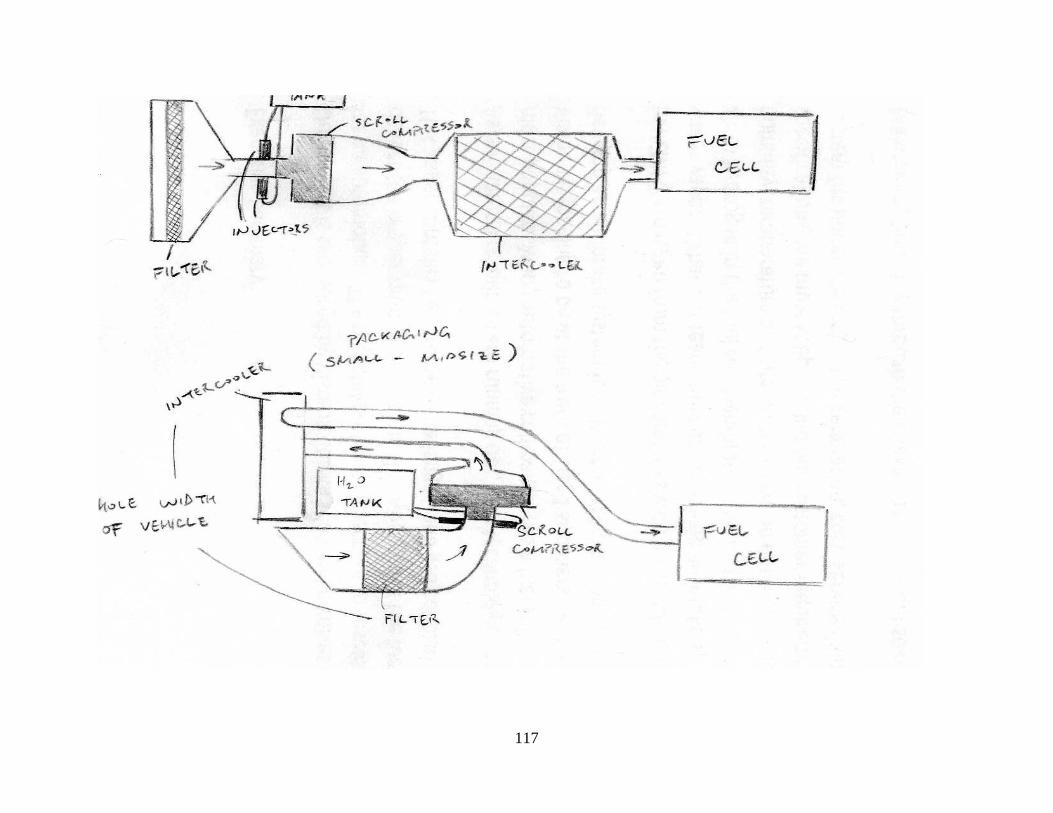
117
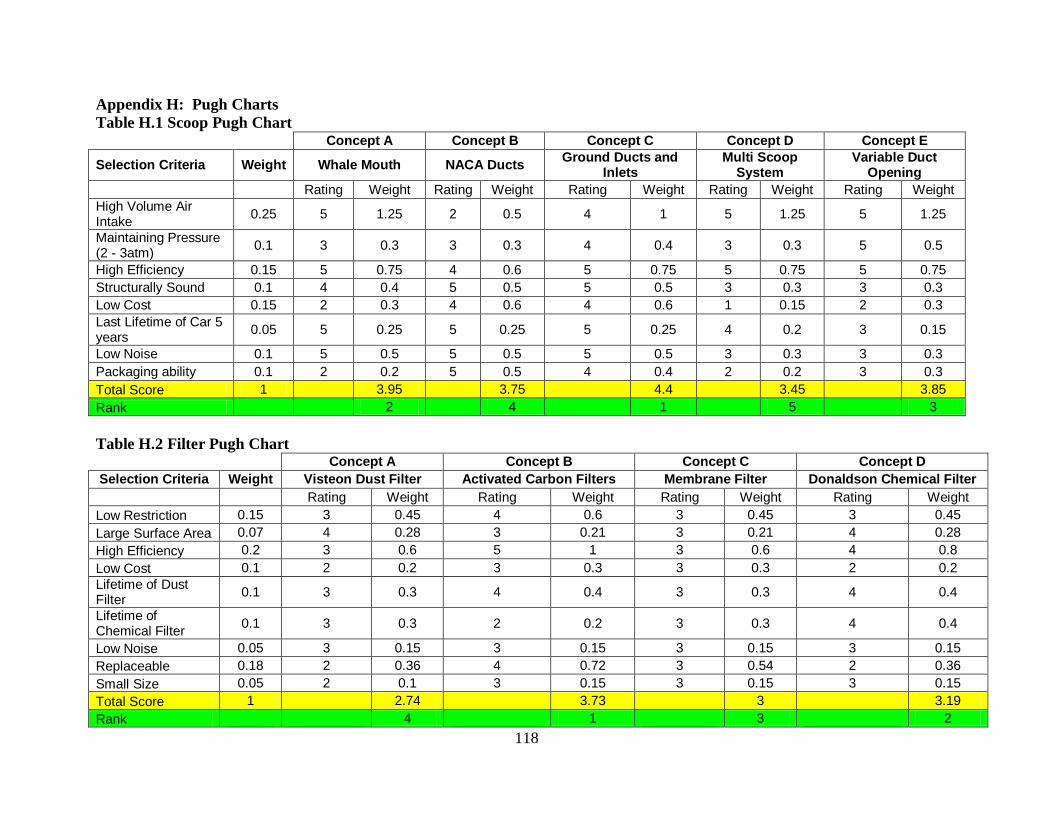
118
Appendix H: Pugh Charts
Table H.1 Scoop Pugh Chart
Concept A Concept B Concept C Concept D Concept E
Selection Criteria Weight Whale Mouth NACA Ducts Ground Ducts and
Inlets Multi Scoop
System Variable Duct
Opening
Rating Weight Rating Weight Rating Weight Rating Weight Rating Weight
High Volume Air Intake
0.25 5 1.25 2 0.5 4 1 5 1.25 5 1.25
Maintaining Pressure (2 - 3atm)
0.1 3 0.3 3 0.3 4 0.4 3 0.3 5 0.5
High Efficiency 0.15 5 0.75 4 0.6 5 0.75 5 0.75 5 0.75
Structurally Sound 0.1 4 0.4 5 0.5 5 0.5 3 0.3 3 0.3
Low Cost 0.15 2 0.3 4 0.6 4 0.6 1 0.15 2 0.3
Last Lifetime of Car 5 years
0.05 5 0.25 5 0.25 5 0.25 4 0.2 3 0.15
Low Noise 0.1 5 0.5 5 0.5 5 0.5 3 0.3 3 0.3
Packaging ability 0.1 2 0.2 5 0.5 4 0.4 2 0.2 3 0.3
Total Score 1
3.95
3.75
4.4
3.45
3.85
Rank
2
4
1
5
3
Table H.2 Filter Pugh Chart
Concept A Concept B Concept C Concept D
Selection Criteria Weight Visteon Dust Filter Activated Carbon Filters Membrane Filter Donaldson Chemical Filter
Rating Weight Rating Weight Rating Weight Rating Weight
Low Restriction 0.15 3 0.45 4 0.6 3 0.45 3 0.45
Large Surface Area 0.07 4 0.28 3 0.21 3 0.21 4 0.28
High Efficiency 0.2 3 0.6 5 1 3 0.6 4 0.8
Low Cost 0.1 2 0.2 3 0.3 3 0.3 2 0.2
Lifetime of Dust Filter
0.1 3 0.3 4 0.4 3 0.3 4 0.4
Lifetime of Chemical Filter
0.1 3 0.3 2 0.2 3 0.3 4 0.4
Low Noise 0.05 3 0.15 3 0.15 3 0.15 3 0.15
Replaceable 0.18 2 0.36 4 0.72 3 0.54 2 0.36
Small Size 0.05 2 0.1 3 0.15 3 0.15 3 0.15
Total Score 1
2.74
3.73
3
3.19
Rank
4
1
3
2
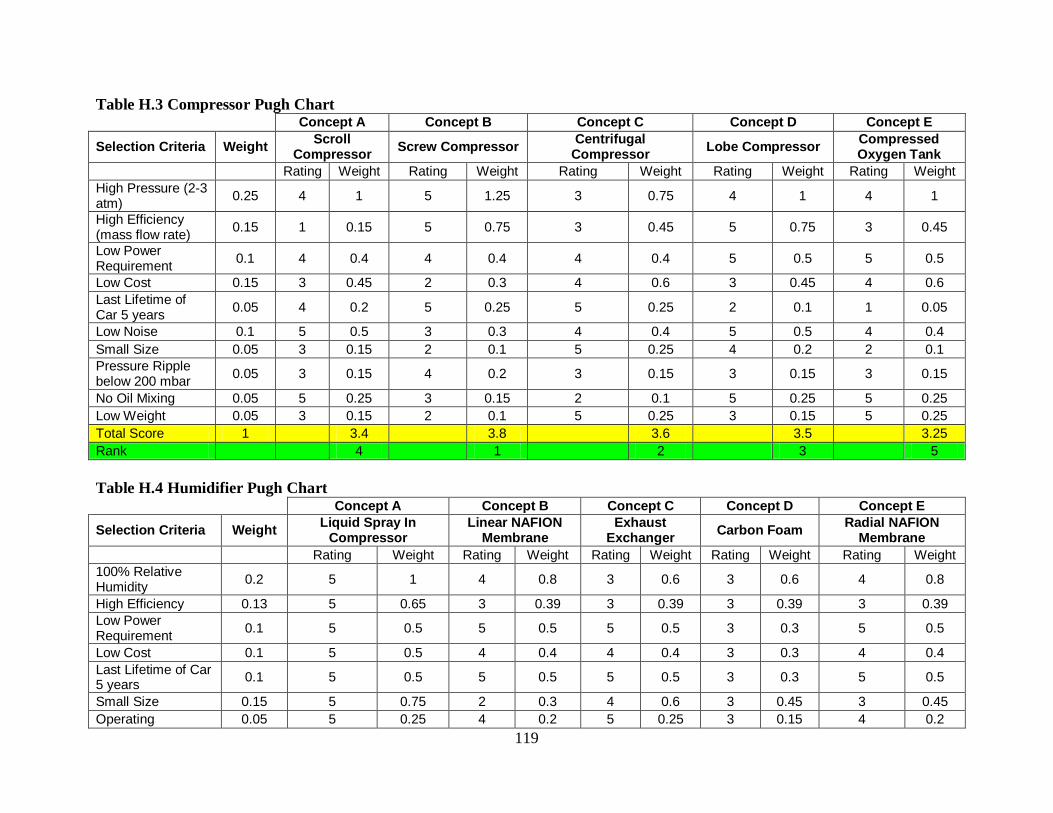
119
Table H.3 Compressor Pugh Chart
Concept A Concept B Concept C Concept D Concept E
Selection Criteria Weight Scroll
Compressor Screw Compressor
Centrifugal Compressor
Lobe Compressor Compressed Oxygen Tank
Rating Weight Rating Weight Rating Weight Rating Weight Rating Weight
High Pressure (2-3 atm)
0.25 4 1 5 1.25 3 0.75 4 1 4 1
High Efficiency (mass flow rate)
0.15 1 0.15 5 0.75 3 0.45 5 0.75 3 0.45
Low Power Requirement
0.1 4 0.4 4 0.4 4 0.4 5 0.5 5 0.5
Low Cost 0.15 3 0.45 2 0.3 4 0.6 3 0.45 4 0.6
Last Lifetime of Car 5 years
0.05 4 0.2 5 0.25 5 0.25 2 0.1 1 0.05
Low Noise 0.1 5 0.5 3 0.3 4 0.4 5 0.5 4 0.4
Small Size 0.05 3 0.15 2 0.1 5 0.25 4 0.2 2 0.1
Pressure Ripple below 200 mbar
0.05 3 0.15 4 0.2 3 0.15 3 0.15 3 0.15
No Oil Mixing 0.05 5 0.25 3 0.15 2 0.1 5 0.25 5 0.25
Low Weight 0.05 3 0.15 2 0.1 5 0.25 3 0.15 5 0.25
Total Score 1
3.4
3.8
3.6
3.5
3.25
Rank
4
1
2
3
5
Table H.4 Humidifier Pugh Chart
Concept A Concept B Concept C Concept D Concept E
Selection Criteria Weight Liquid Spray In
Compressor Linear NAFION
Membrane Exhaust
Exchanger Carbon Foam
Radial NAFION Membrane
Rating Weight Rating Weight Rating Weight Rating Weight Rating Weight
100% Relative Humidity
0.2 5 1 4 0.8 3 0.6 3 0.6 4 0.8
High Efficiency 0.13 5 0.65 3 0.39 3 0.39 3 0.39 3 0.39
Low Power Requirement
0.1 5 0.5 5 0.5 5 0.5 3 0.3 5 0.5
Low Cost 0.1 5 0.5 4 0.4 4 0.4 3 0.3 4 0.4
Last Lifetime of Car 5 years
0.1 5 0.5 5 0.5 5 0.5 3 0.3 5 0.5
Small Size 0.15 5 0.75 2 0.3 4 0.6 3 0.45 3 0.45
Operating 0.05 5 0.25 4 0.2 5 0.25 3 0.15 4 0.2
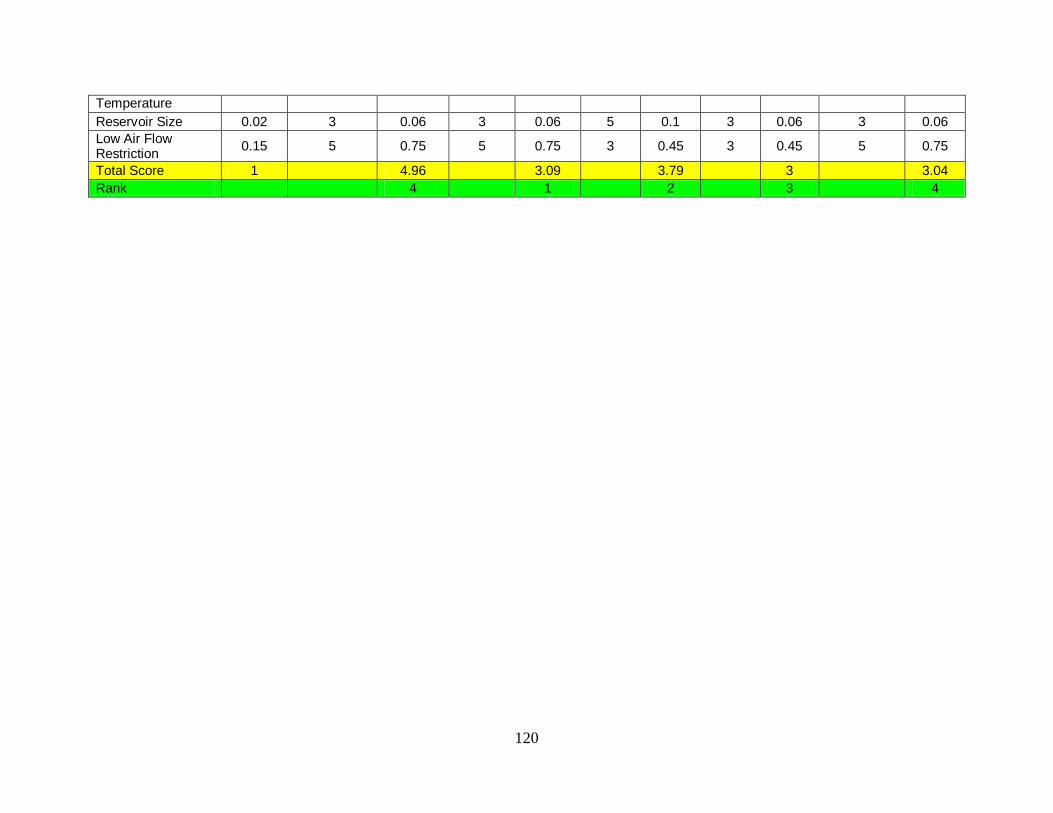
120
Temperature
Reservoir Size 0.02 3 0.06 3 0.06 5 0.1 3 0.06 3 0.06
Low Air Flow Restriction
0.15 5 0.75 5 0.75 3 0.45 3 0.45 5 0.75
Total Score 1
4.96
3.09
3.79
3
3.04
Rank
4
1
2
3
4
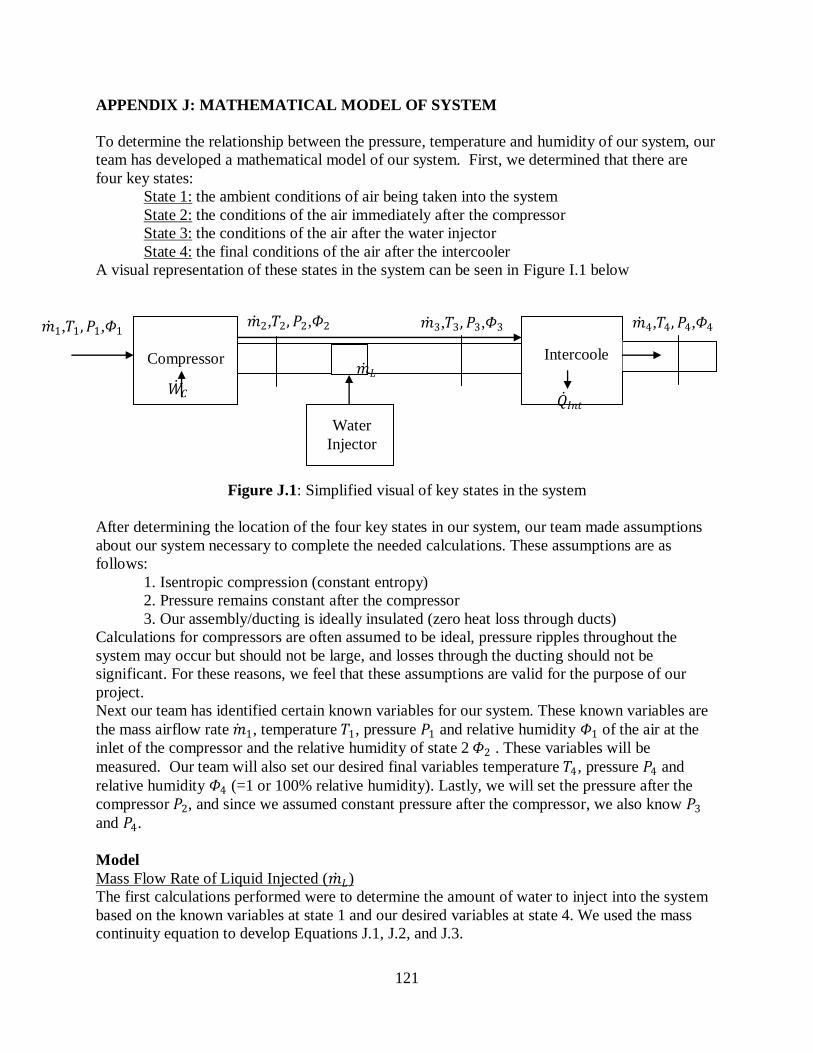
121
APPENDIX J: MATHEMATICAL MODEL OF SYSTEM
To determine the relationship between the pressure, temperature and humidity of our system, our
team has developed a mathematical model of our system. First, we determined that there are
four key states:
State 1: the ambient conditions of air being taken into the system
State 2: the conditions of the air immediately after the compressor
State 3: the conditions of the air after the water injector
State 4: the final conditions of the air after the intercooler
A visual representation of these states in the system can be seen in Figure I.1 below
Figure J.1: Simplified visual of key states in the system
After determining the location of the four key states in our system, our team made assumptions
about our system necessary to complete the needed calculations. These assumptions are as
follows:
1. Isentropic compression (constant entropy)
2. Pressure remains constant after the compressor
3. Our assembly/ducting is ideally insulated (zero heat loss through ducts)
Calculations for compressors are often assumed to be ideal, pressure ripples throughout the
system may occur but should not be large, and losses through the ducting should not be
significant. For these reasons, we feel that these assumptions are valid for the purpose of our
project.
Next our team has identified certain known variables for our system. These known variables are
the mass airflow rate 𝑚 1, temperature 𝑇1, pressure 𝑃1 and relative humidity 𝛷1 of the air at the
inlet of the compressor and the relative humidity of state 2 𝛷2 . These variables will be
measured. Our team will also set our desired final variables temperature 𝑇4, pressure 𝑃4 and
relative humidity 𝛷4 (=1 or 100% relative humidity). Lastly, we will set the pressure after the
compressor 𝑃2, and since we assumed constant pressure after the compressor, we also know 𝑃3
and 𝑃4.
Model
Mass Flow Rate of Liquid Injected (𝑚 𝐿)
The first calculations performed were to determine the amount of water to inject into the system
based on the known variables at state 1 and our desired variables at state 4. We used the mass
continuity equation to develop Equations J.1, J.2, and J.3.
Compressor Intercoole
r
Water
Injector
𝑚 𝐿
𝑚 1,𝑇1, 𝑃1,𝛷1 𝑚 2,𝑇2, 𝑃2,𝛷2 𝑚 3,𝑇3, 𝑃3,𝛷3 𝑚 4,𝑇4, 𝑃4,𝛷4
𝑄 𝐼𝑛𝑡 𝑊
𝐶
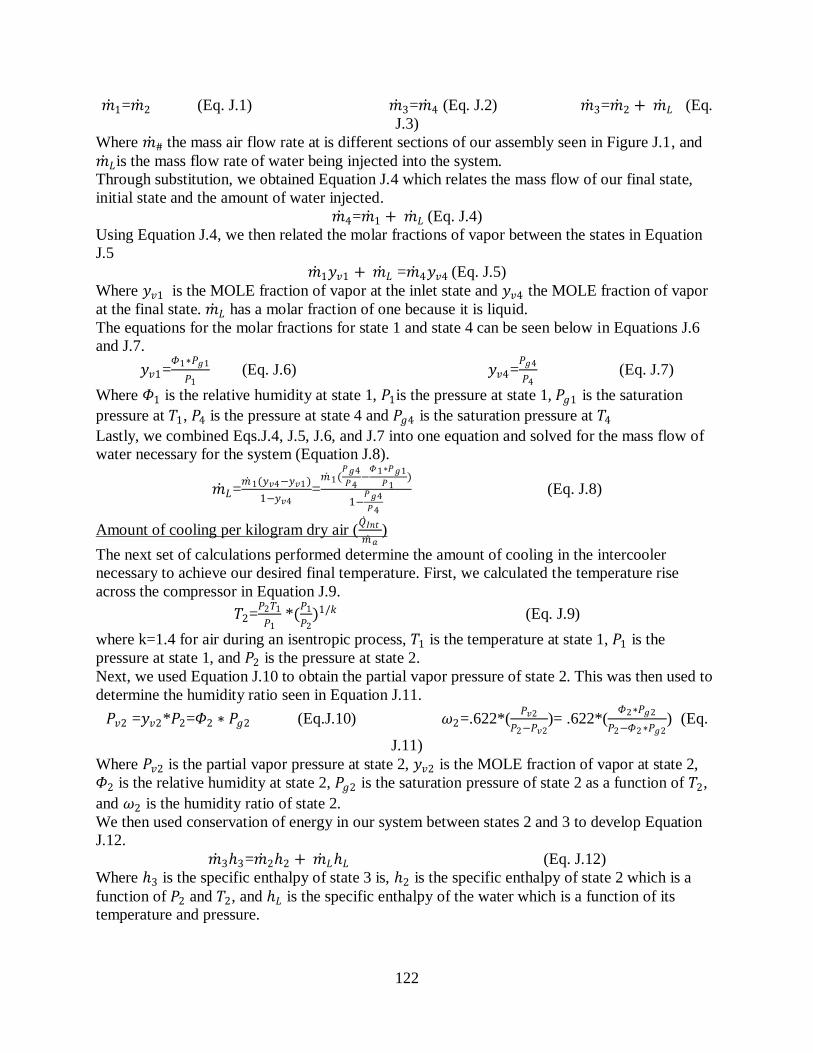
122
𝑚 1=𝑚 2 (Eq. J.1) 𝑚 3=𝑚 4 (Eq. J.2) 𝑚 3=𝑚 2 + 𝑚 𝐿 (Eq.
J.3)
Where 𝑚 # the mass air flow rate at is different sections of our assembly seen in Figure J.1, and
𝑚 𝐿is the mass flow rate of water being injected into the system.
Through substitution, we obtained Equation J.4 which relates the mass flow of our final state,
initial state and the amount of water injected.
𝑚 4=𝑚 1 + 𝑚 𝐿 (Eq. J.4)
Using Equation J.4, we then related the molar fractions of vapor between the states in Equation
J.5
𝑚 1𝑦𝑣1 + 𝑚 𝐿 =𝑚 4𝑦𝑣4 (Eq. J.5)
Where 𝑦𝑣1 is the MOLE fraction of vapor at the inlet state and 𝑦𝑣4 the MOLE fraction of vapor
at the final state. 𝑚 𝐿 has a molar fraction of one because it is liquid.
The equations for the molar fractions for state 1 and state 4 can be seen below in Equations J.6
and J.7.
𝑦𝑣1=𝛷1∗𝑃𝑔1
𝑃1 (Eq. J.6) 𝑦𝑣4=
𝑃𝑔4
𝑃4 (Eq. J.7)
Where 𝛷1 is the relative humidity at state 1, 𝑃1is the pressure at state 1, 𝑃𝑔1 is the saturation
pressure at 𝑇1, 𝑃4 is the pressure at state 4 and 𝑃𝑔4 is the saturation pressure at 𝑇4
Lastly, we combined Eqs.J.4, J.5, J.6, and J.7 into one equation and solved for the mass flow of
water necessary for the system (Equation J.8).
𝑚 𝐿=𝑚 1(𝑦𝑣4−𝑦𝑣1)
1−𝑦𝑣4=
𝑚 1(𝑃𝑔4
𝑃4−
𝛷1∗𝑃𝑔1
𝑃1)
1−𝑃𝑔4
𝑃4
(Eq. J.8)
Amount of cooling per kilogram dry air (𝑄 𝐼𝑛𝑡
𝑚 𝑎)
The next set of calculations performed determine the amount of cooling in the intercooler
necessary to achieve our desired final temperature. First, we calculated the temperature rise
across the compressor in Equation J.9.
𝑇2=𝑃2𝑇1
𝑃1 *(
𝑃1
𝑃2)1/𝑘 (Eq. J.9)
where k=1.4 for air during an isentropic process, 𝑇1 is the temperature at state 1, 𝑃1 is the
pressure at state 1, and 𝑃2 is the pressure at state 2.
Next, we used Equation J.10 to obtain the partial vapor pressure of state 2. This was then used to
determine the humidity ratio seen in Equation J.11.
𝑃𝑣2 =𝑦𝑣2*𝑃2=𝛷2 ∗ 𝑃𝑔2 (Eq.J.10) 𝜔2=.622*(𝑃𝑣2
𝑃2−𝑃𝑣2)= .622*(
𝛷2∗𝑃𝑔2
𝑃2−𝛷2∗𝑃𝑔2) (Eq.
J.11)
Where 𝑃𝑣2 is the partial vapor pressure at state 2, 𝑦𝑣2 is the MOLE fraction of vapor at state 2,
𝛷2 is the relative humidity at state 2, 𝑃𝑔2 is the saturation pressure of state 2 as a function of 𝑇2,
and 𝜔2 is the humidity ratio of state 2.
We then used conservation of energy in our system between states 2 and 3 to develop Equation
J.12.
𝑚 33=𝑚 22 + 𝑚 𝐿𝐿 (Eq. J.12)
Where 3 is the specific enthalpy of state 3 is, 2 is the specific enthalpy of state 2 which is a
function of 𝑃2 and 𝑇2, and 𝐿 is the specific enthalpy of the water which is a function of its
temperature and pressure.

123
Rearranging Equation J.12 and substituting Equations J.1, J.3, & J.8 into it, we obtained
Equation J.13.
3 =𝑚 11+ 𝑚 𝐿𝐿
𝑚 1+ 𝑚 𝐿 =
1+ (𝑃𝑔4𝑃4
−𝛷1∗𝑃𝑔1
𝑃1)
1−𝑃𝑔4𝑃4
∗𝐿
1+ (𝑃𝑔4𝑃4
−𝛷1∗𝑃𝑔1
𝑃1)
1−𝑃𝑔4𝑃4
(Eq. J.13)
From the enthalpy at state 3, we can determine the temperature of state 3 (𝑇3) as it is a function
of 3 and 𝑃3. We can then solve for the humidity ratio of state 3 using Equation J.14.
𝜔3=𝜔2∗(𝑣2−𝐿 )−1.004∗ 𝑇2−𝑇3
𝑓𝑔3 (Eq. J.14)
Where 𝜔3 is the humidity ratio of state 3, 𝑣2 is the partial vapor enthalpy of state 2 which for
our case is the saturation vapor enthalpy 𝑔2 which is a function of 𝑇2, and 𝑓𝑔3 is the
evaporation enthalpy of state 3 which is a function of 𝑇3.
Next, we calculated the humidity ratio of state 4, seen in Equation J.15.
𝜔4=.622*(𝑃𝑔4
𝑃4−𝑃𝑔4) (Eq. J.15)
Where 𝜔4 the humidity ratio of state 4, 𝑃𝑔4 is the saturation vapor pressure of state 4, and 𝑃4 is
the pressure at state 4.
Lastly, we were able to calculate the amount of cooling necessary in the intercooler per kilogram
air, seen in Equation J.16. Equation J.17 was then created by substituting Equations J.11, J.14,
and J.15 into Equation J.16. 𝑄 𝐼𝑛𝑡
𝑚 𝑎 =𝑎4 - 𝑎3 +𝜔4*𝑣4-𝜔3*𝑣3 = 1. 004 ∗ 𝑇4 − 𝑇3 +𝜔4*𝑣4-𝜔3*𝑣3 (Eq. J.16)
𝑄 𝐼𝑛𝑡
𝑚 𝑎=1. 004 ∗ 𝑇4 − 𝑇3 +.622*(
𝑃𝑔4
𝑃4−𝑃𝑔4)*𝑣4 -
.622∗(𝛷2∗𝑃𝑔2
𝑃2−𝛷2∗𝑃𝑔2)∗(𝑣2−𝐿−1.004∗
𝑃2𝑇1𝑃1
∗(𝑃1𝑃2
)1𝑘−𝑇3 )
𝑓𝑔3*𝑣3
(Eq. J.17)
Where 𝑄 𝐼𝑛𝑡
𝑚 𝑎 is the amount of cooling necessary in the intercooler per kilogram of air, 𝑎3 is the
partial enthalpy of air at state 3, 𝑣3 is the partial vapor enthalpy at state 3, 𝑎4 is the partial
enthalpy of air at state 4, and 𝑣4 is the partial vapor enthalpy at state 4 which is equal to the
saturation enthalpy at state 4, 𝑔4.
Compressor Power
The final input calculated was the power required to run the compressor seen in Equation J.18.
𝑊 𝐶=𝑚 1(2-1)= 𝑚 1*1.004* 𝑇2 − 𝑇1 (Eq. J.18)
Where 𝑊 𝐶 is the power required to run the compressor, and 𝑚 1, 1,and 𝑇1are the mass air flow,
enthalpy, and temperature, respectively, of the air at the inlet of the compressor, 2 and 𝑇2 are
the enthalpy and temperature of air after the compressor.
124
APPENDIX K: AIR INTAKE SYSTEM FLOW CHARACTERISTICS
K.1- Initial Mass Flow For our project no specific fuel cell power requirement was given to our team For this reason our
team calculated the necessary mass flow at the air intake in order to satisfy fuel cell power
requirements ranging from 10-100 kW. These flow rates can be seen in Table K.1 using the
equation seen below. A list of different fuel cell vehicles and their power requirements can be
seen in Appendix E.
Table K.1: Mass flow rates necessary for different fuel cell power requirements
Fuel cell Power (kW) Mass flow at the intake (kg/s)
10 0.011
20 0.022
30 0.033
40 0.044
50 0.055
60 0.066
70 0.077
80 0.088
90 0.099
100 0.110
(Eq. K.1) where λ is the stoichiometric multiple(=2 to
ensure proper airflow), Pe is the power output of the fuel cell stack in watts, and Vc is
the average voltage of each cell.
K.2 Liquid Injection Mass Flow
To properly regulate the humidity of our system, our team needed to know the amount of water
to inject into the system based on the input and output characteristics. Using Equation J.8
obtained from the calculation of our thermodynamic model in Appendix J, our team created
Figure K.1 Figure K.2 below. Figure K.1 shows the amount of water that needs to be injected
into our final design for different powers requirements (initial mass flow rates), at different
ambient temperatures, and different ambient humilities. We used our desired characteristics of
our final design 85°C, 2.5 bar, and 100% relative humidity for the final state in Equation J.8 in
the equation. Figure K.2 shows the amount of water that needs to be injected into our prototype
for different powers requirements (initial mass flow rates), at different ambient temperatures, and
different ambient humidity. We used our desired characteristics of our prototype 40°C, 1.35 bar,
and 100% relative humidity for the final state in Equation J.8.
C
e
V
PxAirUsage 71057.3

125
0
5
10
15
20
25
30
35
0 0.1 0.2 0.3 0.4 0.5 0.6 0.7 0.8 0.9 1
Mas
s Fl
ow
of
Inje
cted
Wat
er (g
ram
s/se
con
d)
Relative Humidity (0-100%) for Ambient Air
Figure K.1: Necessary Water for Injection for Final Design
= Ambient Temperature is 0°C
= Ambient Temperature is 20°C
= Ambient Temperature is 40°C
= 100 kW Fuel Cell (Initial Mass Flow into Compressor is 0.110𝑘𝑔
𝑠𝑒𝑐)
= 70 kW Fuel Cell (Initial Mass Flow into Compressor is 0.077𝑘𝑔
𝑠𝑒𝑐)
= 50 kW Fuel Cell (Initial Mass Flow into Compressor is 0.055𝑘𝑔
𝑠𝑒𝑐)
Calculations were performed using: 1. Final gauge pressure 2.5 bar 2. Final temperature of 85°C at the outlet of the prototype 3. Final relative humidity of 100% 4. Initial pressure was atmospheric (1 bar)
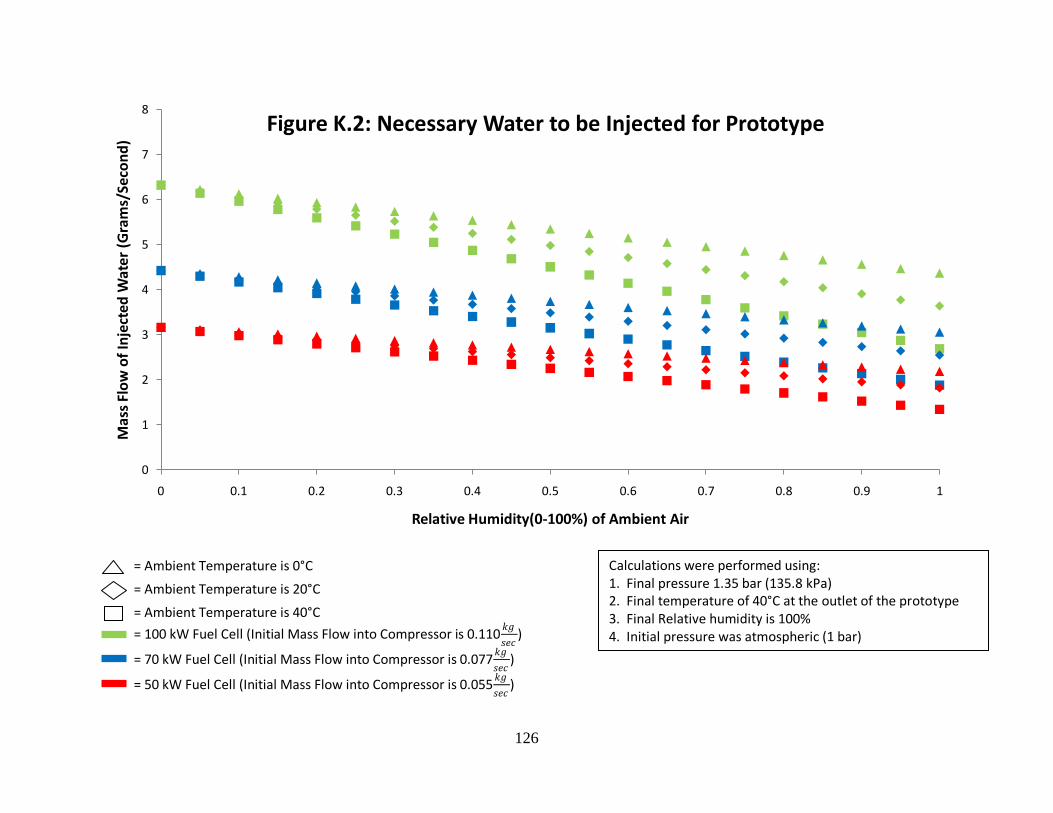
126
0
1
2
3
4
5
6
7
8
0 0.1 0.2 0.3 0.4 0.5 0.6 0.7 0.8 0.9 1
Mas
s Fl
ow
of
Inje
cted
Wat
er (
Gra
ms/
Seco
nd
)
Relative Humidity(0-100%) of Ambient Air
Figure K.2: Necessary Water to be Injected for Prototype
= Ambient Temperature is 0°C
= Ambient Temperature is 20°C
= Ambient Temperature is 40°C
= 100 kW Fuel Cell (Initial Mass Flow into Compressor is 0.110𝑘𝑔
𝑠𝑒𝑐)
= 70 kW Fuel Cell (Initial Mass Flow into Compressor is 0.077𝑘𝑔
𝑠𝑒𝑐)
= 50 kW Fuel Cell (Initial Mass Flow into Compressor is 0.055𝑘𝑔
𝑠𝑒𝑐)
Calculations were performed using: 1. Final pressure 1.35 bar (135.8 kPa) 2. Final temperature of 40°C at the outlet of the prototype 3. Final Relative humidity is 100% 4. Initial pressure was atmospheric (1 bar)
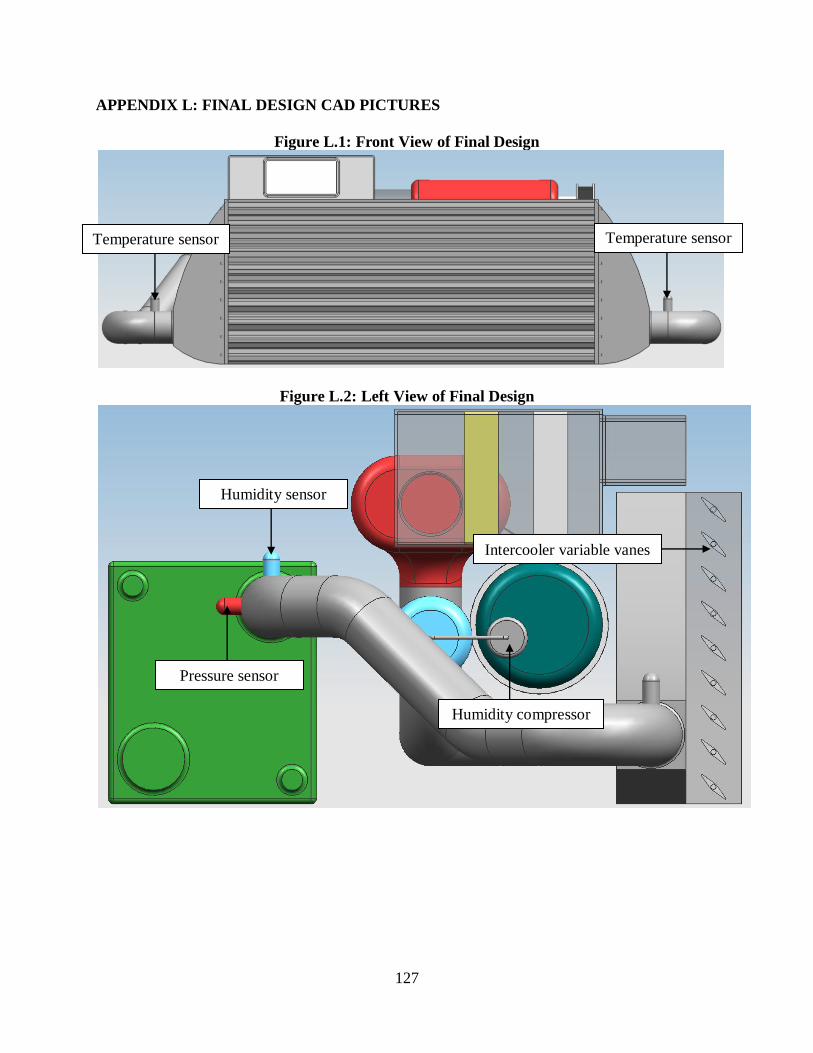
127
APPENDIX L: FINAL DESIGN CAD PICTURES
Figure L.1: Front View of Final Design
Figure L.2: Left View of Final Design
Temperature sensor Temperature sensor
Humidity sensor
Pressure sensor
Humidity compressor
Intercooler variable vanes
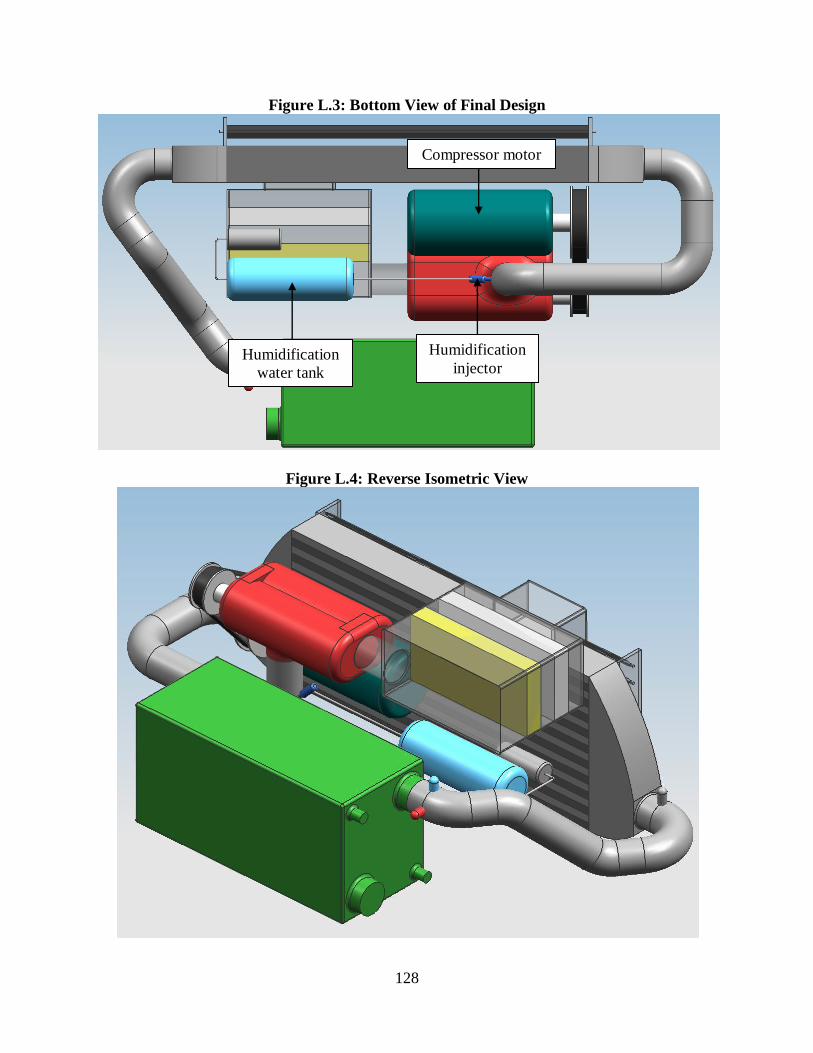
128
Figure L.3: Bottom View of Final Design
Figure L.4: Reverse Isometric View
Humidification
water tank
Humidification
injector
Compressor motor

129
APPENDIX M: GANNT CHART
Tasks
13-
Jan
15-
Jan
20-
Jan
22-
Jan
27-
Jan
29-
Jan
3-
Feb
5-
Feb
10-
Feb
12-
Feb
17-
Feb
19-
Feb
24-
Feb
26-
Feb
Form Project
Team
Set Team
Roles
Information
Gathering
Meet With
Sponsor
Meet with
Professor
Borgnake
Initial
QFD/Problem
Definition
Meet with
Professor
Stefanopolou
Create Gantt
Chart
Summarize
Info Gathering
Write
Executive
Summary
Prepare DR #1
Presentation
Design
Review #1
Meet With
Sponsor
= Individual
= Team
= Individual and
Team

130
Team Roles
Worksheet
Tasks
13-
Jan
15-
Jan
20-
Jan
22-
Jan
27-
Jan
29-
Jan
3-
Feb
5-
Feb
10-
Feb
12-
Feb
17-
Feb
19-
Feb
24-
Feb
26-
Feb
Finish DR #1
Report
Submit DR #1
Report
Discuss Ways
to make
meeting more
efficient/Refle
ct on team
failures of DR
#1 and how to
prevent them
Determine
Fuel Cell
Power
Requirements
Visit
Sponsor‟s
Facilities
Concept
Generation
Determine
Engineering
Fundamentals
required to
analyze system
Informal
Presentation
#1

131
Prepare
Functional
Decompisition
Informal
Submission #1
View Fuel
Cell on
Campus
Tasks
13-
Jan
15-
Jan
20-
Jan
22-
Jan
27-
Jan
29-
Jan
3-
Feb
5-
Feb
10-
Feb
12-
Feb
17-
Feb
19-
Feb
24-
Feb
26-
Feb
Concept
Selection
Research
Compressor
Concepts
Research
Humidifier
Concepts
Research
Cooler
Concepts
Research Air
Intake Scoop
Concepts
Research Filter
Concepts
Create Pugh
Charts for all
Concepts of
every
Components
of System
Summarize
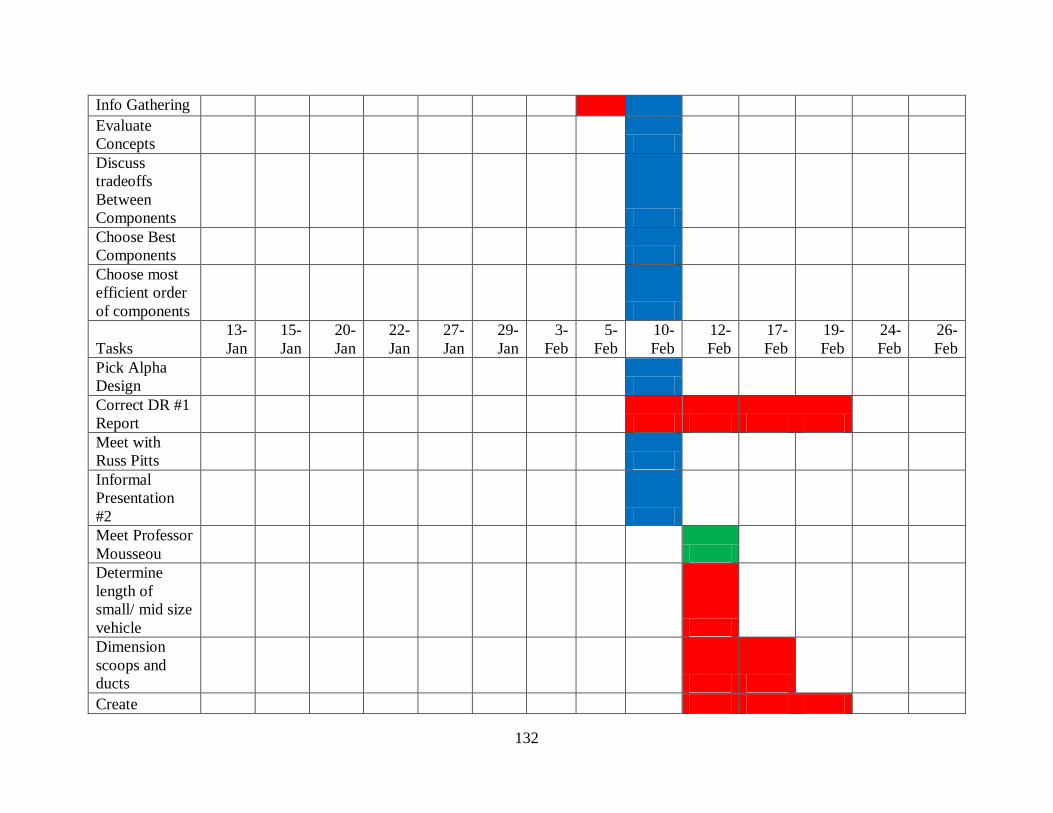
132
Info Gathering
Evaluate
Concepts
Discuss
tradeoffs
Between
Components
Choose Best
Components
Choose most
efficient order
of components
Tasks
13-
Jan
15-
Jan
20-
Jan
22-
Jan
27-
Jan
29-
Jan
3-
Feb
5-
Feb
10-
Feb
12-
Feb
17-
Feb
19-
Feb
24-
Feb
26-
Feb
Pick Alpha
Design
Correct DR #1
Report
Meet with
Russ Pitts
Informal
Presentation
#2
Meet Professor
Mousseou
Determine
length of
small/ mid size
vehicle
Dimension
scoops and
ducts
Create

133
Engineering
Drawings(CA
D)
Informal
Submission #2
Summarize
Info Gathering
Prepare DR #2
Presentation
DR #2
Finalize DR
#2 Report
Submit DR#2
Report
Spring Break
Tasks
3-
Mar
5-
Mar
10-
Mar
12-
Mar
17-
Mar
19-
Mar
24-
Mar
26-
Mar
31-
Mar
2-
Apr
7-
Apr
9-
Apr
14-
Apr
16-
Apr
21-
Apr
23-
Apr
Determine
which
components
to purchase
and which to
build
Determine
important
characteristic
s of system to
demonstrate
with our
prototype
Search for
Compressor
= Individual
= Team
= Individual and
Team

134
Perform Cost
Analysis
Perform
Temperature
Analysis
Perform Mass
flow rate
analysis
Perform
Humidity
Analysis
Visit
Junkyard/Pur
chase
Compressor
Tasks
3-
Mar
5-
Mar
10-
Mar
12-
Mar
17-
Mar
19-
Mar
24-
Mar
26-
Mar
31-
Mar
2-
Apr
7-
Apr
9-
Apr
14-
Apr
16-
Apr
21-
Apr
23-
Apr
Safety
Review of
Compressor
Meet with
Professor
Oslewski
Visit
Junkyard/Pur
chase Fuel
Injectors, Gas
Pump/Tank,
Air
Intake/Filter,

135
and
Intercooler
Safety
Review of
Fuel
Injectors, Gas
Pump/Tank,
Air
Intake/Filter,
and
Intercooler
Design Test
Rig
Determine
Other
components
to purchase
including drill
to run
compressor
and ducting
material
Work on
Safety
Review
Meet with
Sponsor
Tasks
3-
Mar
5-
Mar
10-
Mar
12-
Mar
17-
Mar
19-
Mar
24-
Mar
26-
Mar
31-
Mar
2-
Apr
7-
Apr
9-
Apr
14-
Apr
16-
Apr
21-
Apr
23-
Apr
Finalize
Alpha Design
Finalize
Prototype
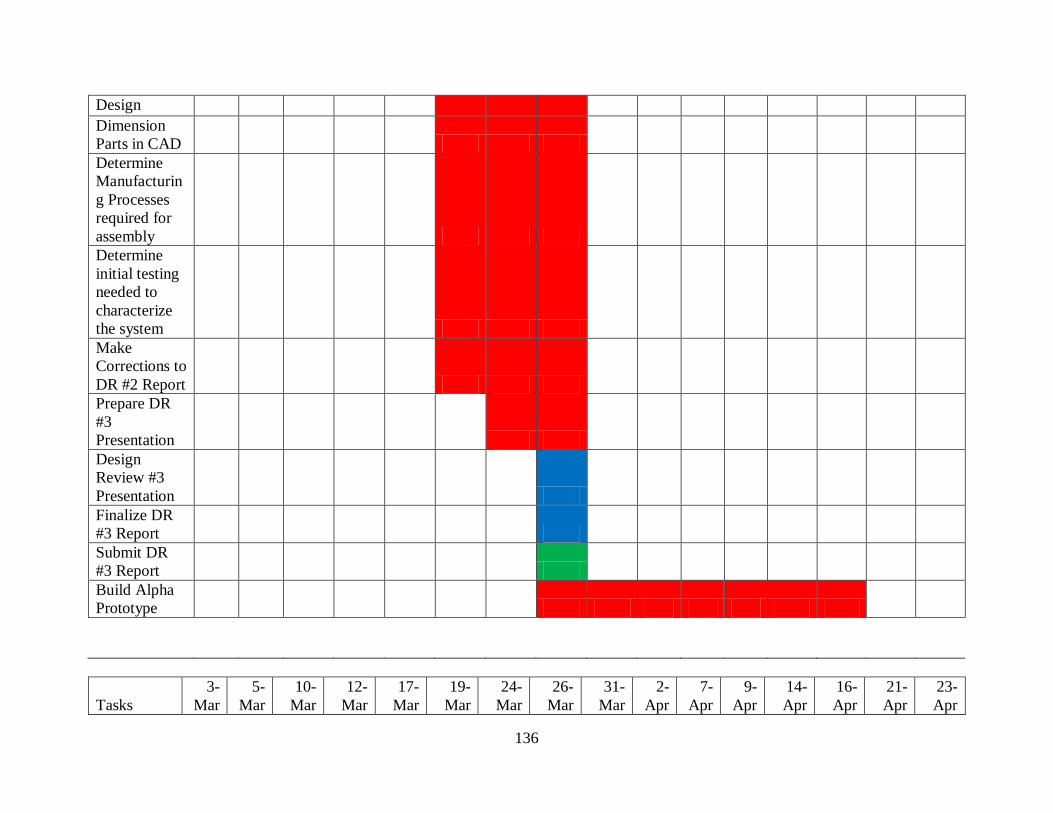
136
Design
Dimension
Parts in CAD
Determine
Manufacturin
g Processes
required for
assembly
Determine
initial testing
needed to
characterize
the system
Make
Corrections to
DR #2 Report
Prepare DR
#3
Presentation
Design
Review #3
Presentation
Finalize DR
#3 Report
Submit DR
#3 Report
Build Alpha
Prototype
Tasks
3-
Mar
5-
Mar
10-
Mar
12-
Mar
17-
Mar
19-
Mar
24-
Mar
26-
Mar
31-
Mar
2-
Apr
7-
Apr
9-
Apr
14-
Apr
16-
Apr
21-
Apr
23-
Apr

137
Build Test
Rig
Manufactur
e Adapter
Pieces in
Machine
Shop
Make
Rubber
Gaskets
Build
compressor
subassembl
y
Build water
Injector
subassembl
y
Build
intercooler
subassembl
y
Perform
compressor
characteriza
tion test
Insert
pressure,
temperature
and
humidity
sensors
= Individual
= Team
= Individual and
Team
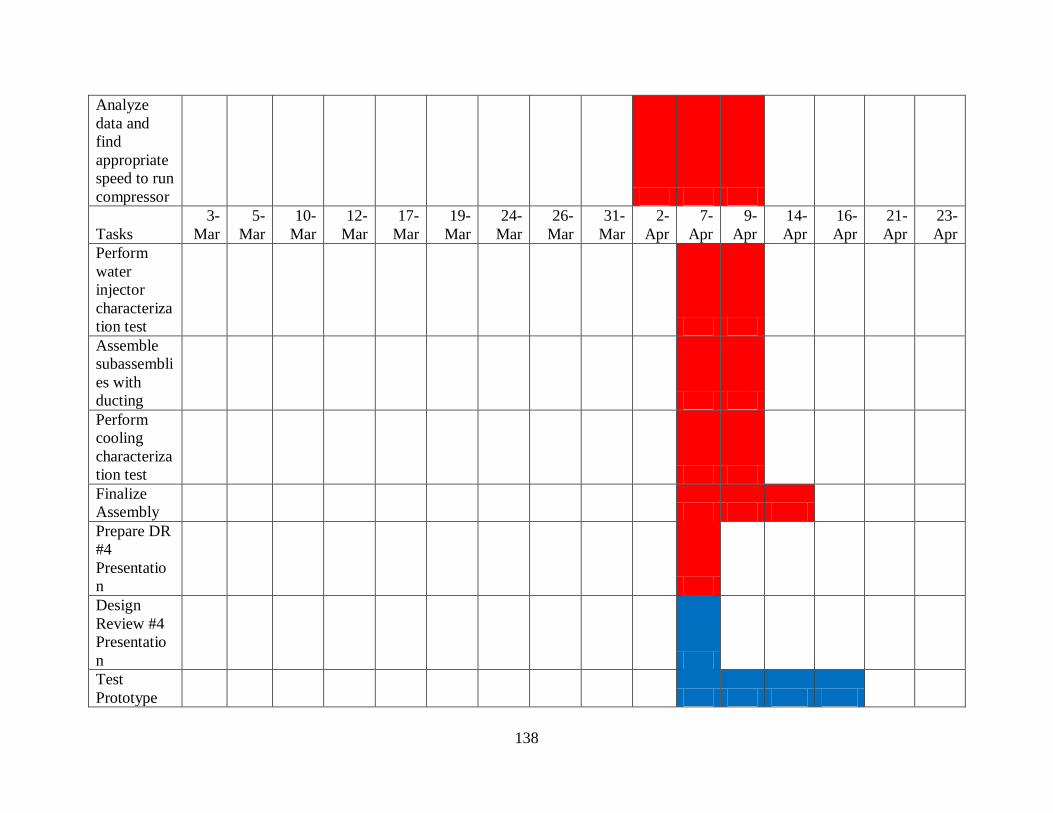
138
Analyze
data and
find
appropriate
speed to run
compressor
Tasks
3-
Mar
5-
Mar
10-
Mar
12-
Mar
17-
Mar
19-
Mar
24-
Mar
26-
Mar
31-
Mar
2-
Apr
7-
Apr
9-
Apr
14-
Apr
16-
Apr
21-
Apr
23-
Apr
Perform
water
injector
characteriza
tion test
Assemble
subassembli
es with
ducting
Perform
cooling
characteriza
tion test
Finalize
Assembly
Prepare DR
#4
Presentatio
n
Design
Review #4
Presentatio
n
Test
Prototype
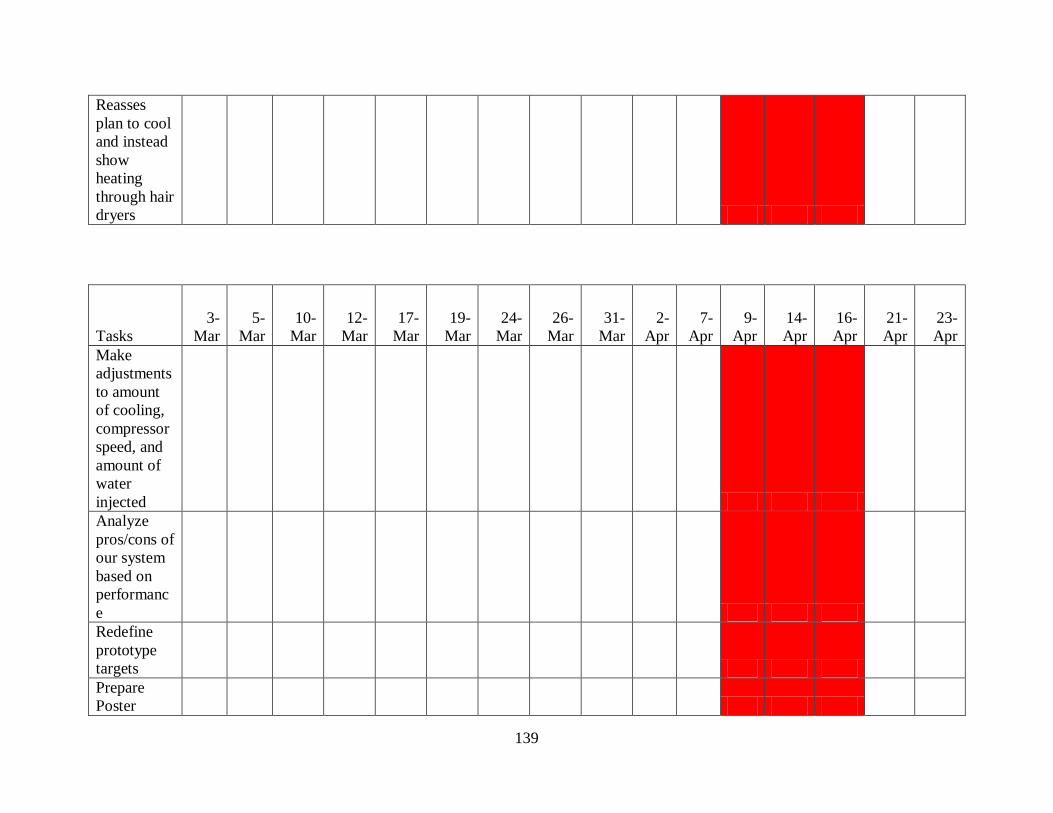
139
Reasses
plan to cool
and instead
show
heating
through hair
dryers
Tasks
3-
Mar
5-
Mar
10-
Mar
12-
Mar
17-
Mar
19-
Mar
24-
Mar
26-
Mar
31-
Mar
2-
Apr
7-
Apr
9-
Apr
14-
Apr
16-
Apr
21-
Apr
23-
Apr
Make
adjustments
to amount
of cooling,
compressor
speed, and
amount of
water
injected
Analyze
pros/cons of
our system
based on
performanc
e
Redefine
prototype
targets
Prepare
Poster
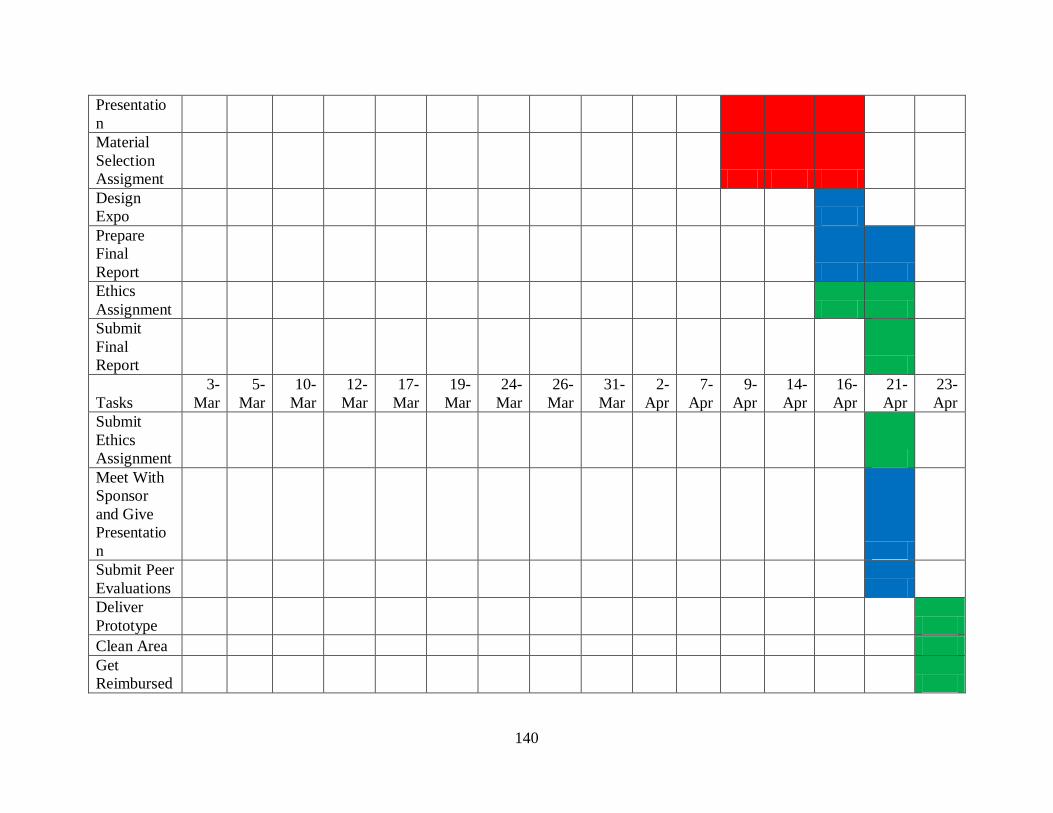
140
Presentatio
n
Material
Selection
Assigment
Design
Expo
Prepare
Final
Report
Ethics
Assignment
Submit
Final
Report
Tasks
3-
Mar
5-
Mar
10-
Mar
12-
Mar
17-
Mar
19-
Mar
24-
Mar
26-
Mar
31-
Mar
2-
Apr
7-
Apr
9-
Apr
14-
Apr
16-
Apr
21-
Apr
23-
Apr
Submit
Ethics
Assignment
Meet With
Sponsor
and Give
Presentatio
n
Submit Peer
Evaluations
Deliver
Prototype
Clean Area
Get
Reimbursed
Related Documents