MINISTRY OF NATIONAL DEVELOPMENT PLANNING/ NATIONAL DEVELOPMENT PLANNING AGENCY Presented at OECD Expert Seminar “Aligning Policies for the Transition to Low-Carbon Economy” Novotel Bogor, 4 November 2015 FROM OIL TO RENEWABLE: INDONESIA’S ENERGY PRICING POLICY by J. Rizal Primana Director for Energy Resources, Mineral, and Mining

Welcome message from author
This document is posted to help you gain knowledge. Please leave a comment to let me know what you think about it! Share it to your friends and learn new things together.
Transcript
MINISTRY OF NATIONAL DEVELOPMENT PLANNING/ NATIONAL DEVELOPMENT PLANNING AGENCY
Presented at OECD Expert Seminar “Aligning Policies for the Transition to Low-Carbon Economy” Novotel Bogor, 4 November 2015
FROM OIL TO RENEWABLE: INDONESIA’S ENERGY PRICING POLICY
by J. Rizal Primana
Director for Energy Resources, Mineral, and Mining
FUEL OIL SUBSIDY POLICY FROM TIME TO TIME
Slide - 2
2000-2005
- 5 types of subsidized fuel oil are: premium, kerosene, automotive diesel oil, diesel oil and burning oil
- Subsidy payment mechanism uses a cost & fee system
2006-2014
- 3 types of subsidized fuel oil are: premium, kerosene, and automotive diesel fuel
- Subsidy payment mechanism uses alpha BBM
2015 to date
- 2 types of subsidized fuel oil are: kerosene and automotive diesel fuel
- Subsidy payment mechanism uses fixed subsidy Rp 1.000/litre for automotive diesel fuel
HIGHER GASOLINE SUBSIDY LEADS TO
Slide - 3
o Inefficient use of energy and fuel oil in particular (no incentives on efficient use)
o Gasoline and other fuel oil smuggling (who get benefit of gasoline price subsidy?)
o Limited gasoline supply especially outside Java (shifting to other utilization instead of transportation)
o Financial and budget bleeding (as the fuel oil consumption increase so that the subsidy, and at its peak of Rp. 250 trillion or equal to around USD 20 billion)

FUEL OIL SUBSIDY AND CONSUMPTION
Slide - 4
Notes: 1) Since 2007, fuel oil subsidy include LPG 3 Kg 2) Since 2009, fuel oil subsidy include LPG 3 Kg and Biofuel 3) Since 2012, fuel oil subsidy include LPG 3 KG, Biofuel, and LGV
-
50,0
100,0
150,0
200,0
250,0
300,0
-
10,0
20,0
30,0
40,0
50,0
60,0
70,0
2005 2006 2007 2008 2009 2010 2011 2012 2013 2014 2015
Mill
ion
KL
Subsidy Volume Subsidy Budget
Rp
Trillion
Diesel and burning oil subsidy revoked
ICP decreased from 101,42 to 55,48
Premium subsidy revoked
Data Source: Ministry of Finance, 2015
At the average of 1USD=Rp. 12.000, Rp. 200 Trillon = US$16.6 billion.
2 0 0 0 2 0 0 1 2 0 0 2 2 0 0 3 2 0 0 4 2 0 0 5 2 0 0 6 2 0 0 7 2 0 0 8 2 0 0 9 2 0 1 0 2 0 1 1 2 0 1 2 2 0 1 3
4,23 4,08 4,33
4,57 4,23
4,76 5,23
5,55
6,17 5,57 5,53 5,68 5,45
6,04
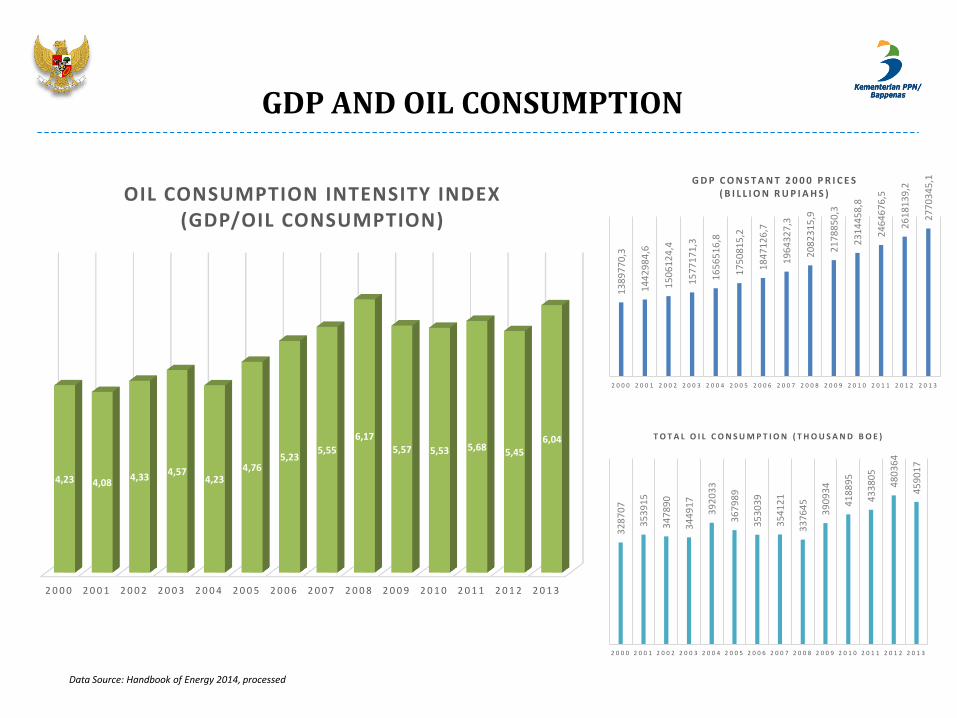
OIL CONSUMPTION INTENSITY INDEX (GDP/OIL CONSUMPTION)
32
87
07
35
39
15
34
78
90
34
49
17
39
20
33
36
79
89
35
30
39
35
41
21
33
76
45
39
09
34
41
88
95
43
38
05
48
03
64
45
90
17
2 0 0 0 2 0 0 1 2 0 0 2 2 0 0 3 2 0 0 4 2 0 0 5 2 0 0 6 2 0 0 7 2 0 0 8 2 0 0 9 2 0 1 0 2 0 1 1 2 0 1 2 2 0 1 3
T O T A L O I L C O N S U M P T I O N ( T H O U S A N D B O E )
13
89
77
0,3
14
42
98
4,6
15
06
12
4,4
15
77
17
1,3
16
56
51
6,8
17
50
81
5,2
18
47
12
6,7
19
64
32
7,3
20
82
31
5,9
21
78
85
0,3
23
14
45
8,8
24
64
67
6,5
26
18
13
9,2
27
70
34
5,1
2 0 0 0 2 0 0 1 2 0 0 2 2 0 0 3 2 0 0 4 2 0 0 5 2 0 0 6 2 0 0 7 2 0 0 8 2 0 0 9 2 0 1 0 2 0 1 1 2 0 1 2 2 0 1 3
G D P C O N S T A N T 2 0 0 0 P R I C E S ( B I L L I O N R U P I A H S )
GDP AND OIL CONSUMPTION
Data Source: Handbook of Energy 2014, processed
1
1,3
0,81
1,27
0,4
0,87
0,98
0,65
1,13
1,41
0 0,2 0,4 0,6 0,8 1 1,2 1,4 1,6
Myanmar
Kamboja
Indonesia
Laos
Brunei
Vietnam
Philipina
Malaysia
Thailand
Singapore
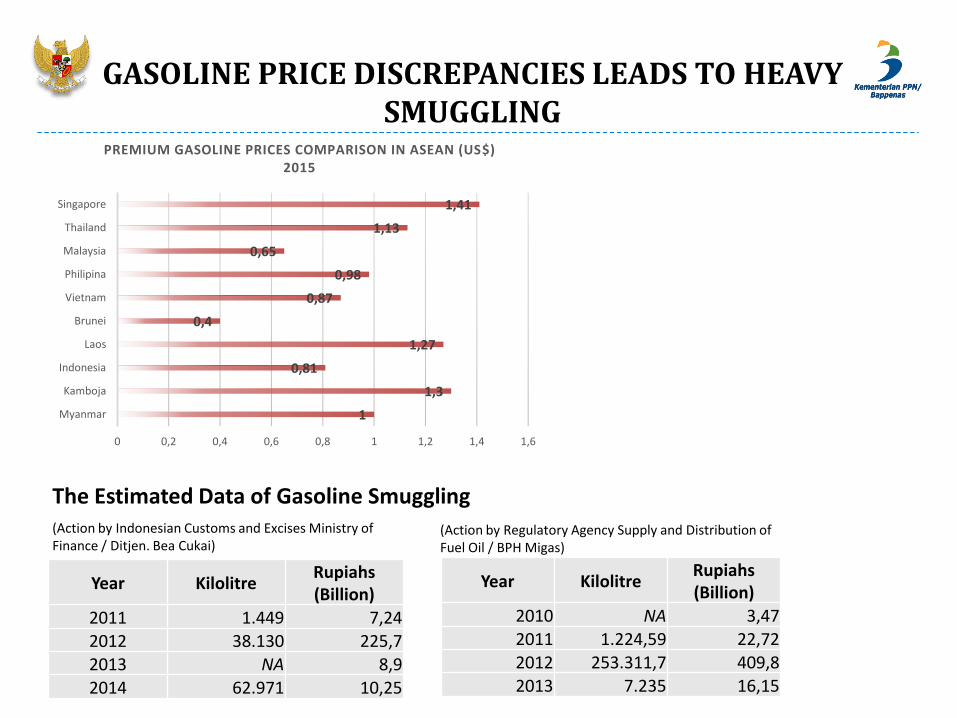
PREMIUM GASOLINE PRICES COMPARISON IN ASEAN (US$) 2015
Year Kilolitre Rupiahs (Billion)
2011 1.449 7,24 2012 38.130 225,7 2013 NA 8,9 2014 62.971 10,25
Year Kilolitre Rupiahs (Billion)
2010 NA 3,47 2011 1.224,59 22,72 2012 253.311,7 409,8 2013 7.235 16,15
The Estimated Data of Gasoline Smuggling (Action by Indonesian Customs and Excises Ministry of Finance / Ditjen. Bea Cukai)
(Action by Regulatory Agency Supply and Distribution of Fuel Oil / BPH Migas)
GASOLINE PRICE DISCREPANCIES LEADS TO HEAVY SMUGGLING

Prices, US cents/litre
Country 1998 2000 2002 2004 2006 2008 2010 2012 2014 Diesel Gasoline Diesel Gasoline Diesel Gasoline Diesel Gasoline Diesel Gasoline Diesel Gasoline Diesel Gasoline Diesel Gasoline Diesel Gasoline
Singapore 36 72 38 84 38 85 55 89 63 92 90 107 104 142 126 168 116 158
Thailand 27 30 35 39 32 36 37 54 65 70 64 87 95 141 97 156 90 129
Cambodia 28 47 44 61 44 63 61 79 78 101 89 94 98 115 127 135 124 134
Lao PDR 24 31 32 41 30 36 48 54 73 86 76 92 97 126 118 133 108 140
Philippines 22 34 28 37 27 35 34 52 67 76 81 91 85 105 101 125 82 105
Myanmar 12 13 12 33 28 36 10 12 75 66 52 43 80 80 - 104 93 114
Vietnam 26 35 27 38 27 34 32 48 53 67 77 80 77 88 106 115 91 104
Malaysia 17 28 16 28 19 35 22 37 40 53 53 53 56 59 59 62 65 68
Indonesia 7 16 6 17 19 27 18 27 44 57 42 50 51 51 47 47 62 93
Brunei 18 34 18 31 18 30 19 32 21 34 21 38 24 39 26 43 - 41
UEA 15 23 26 25 30 29 28 28 53 37 62 45 71 47 64 47 64 47
Source: http://wdi.worldbank.org/table/3.13
FUEL PRICES COMPARISON

GASOLINE SHORTAGE
• Higher price for non-transport use, creates black market and as the market grows, the intended supply to transportation reduced.
• At the state border province or nearby the border, the oil smuggling outside country, makes the supply for that particular area shiftted and leads to shortage for domestic purposes
• Highly subsidy also pushes Pertamina to deal with limited supply due to budget constraint and very limited government spending.

Sulawesi
Aceh
Southern part of Sumatera

OIL SUBSIDY AND THE BENEFICIARIES
Slide - 10
o The beneficiaries of the subsidy more to the haves rather than to the needed groups
o Creating unfair transfer leads to pushes marginal groups further away of its poverty status.
o Other social problems, as it also creates discrepancies between the poor and the wealth more deeper
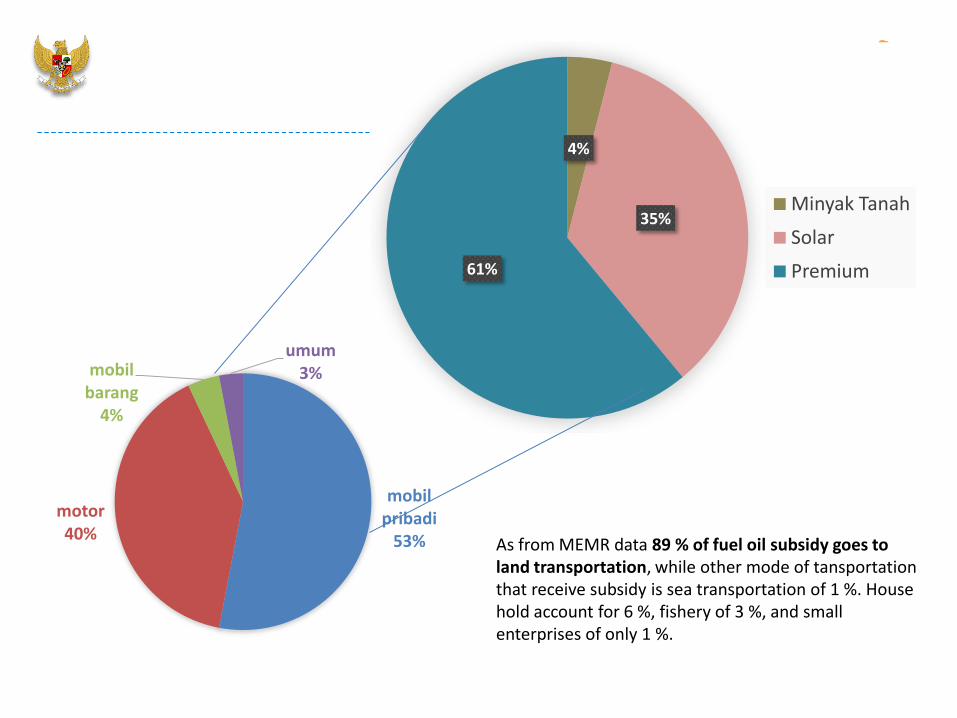
As from MEMR data 89 % of fuel oil subsidy goes to land transportation, while other mode of tansportation that receive subsidy is sea transportation of 1 %. House hold account for 6 %, fishery of 3 %, and small enterprises of only 1 %.
mobil pribadi
53%
motor 40%
mobil barang
4%
umum 3%
4%
35%
61%
Minyak Tanah
Solar
Premium
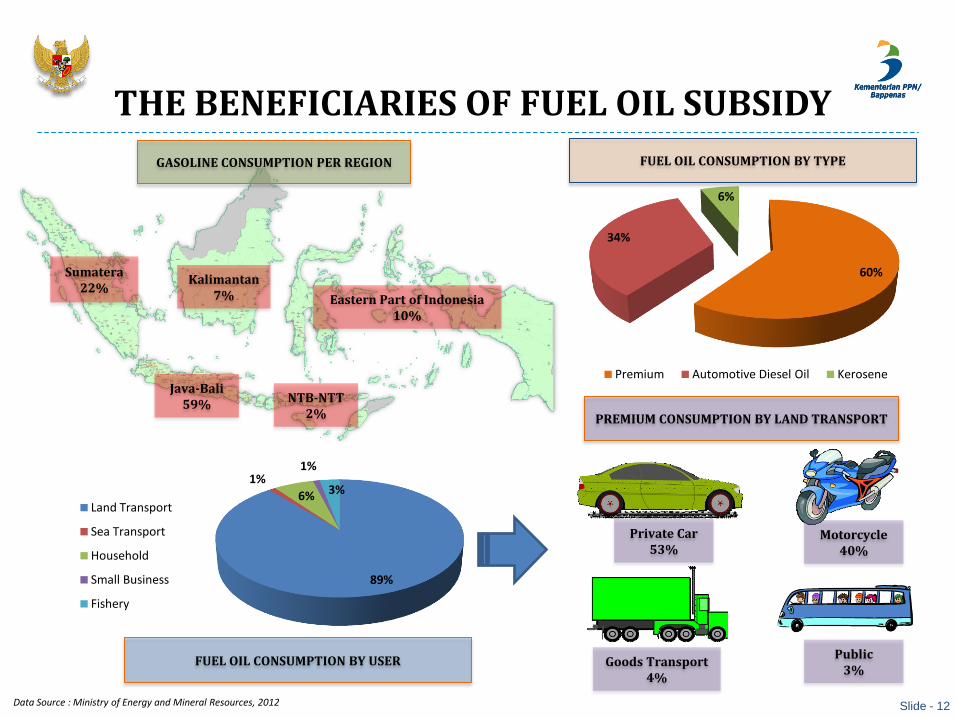
THE BENEFICIARIES OF FUEL OIL SUBSIDY
Slide - 12
Sumatera 22%
Java-Bali 59%
NTB-NTT 2%
Kalimantan 7% Eastern Part of Indonesia
10%
GASOLINE CONSUMPTION PER REGION
Private Car 53%
Motorcycle 40%
Public 3%
Goods Transport 4%
PREMIUM CONSUMPTION BY LAND TRANSPORT
89%
1%
6%
1%
3%
Land Transport
Sea Transport
Household
Small Business
Fishery
FUEL OIL CONSUMPTION BY USER
60%
34%
6%
Premium Automotive Diesel Oil Kerosene
FUEL OIL CONSUMPTION BY TYPE
Data Source : Ministry of Energy and Mineral Resources, 2012
OMITTING OIL SUBSIDY
Slide - 13
o Feed in tariff for renewable
o Direct subsidies for the needed groups
o Petroleum and natural resources fund

PHASING OUT FUEL OIL SUBSIDY TO IMPROVE FISCAL SPACE
Slide - 14 Data Source : Ministry of Finance, 2015
The percentage of subsidy budget declining and budget for ministry and regional government increased that could be used to improve infrastructure
and social welfare
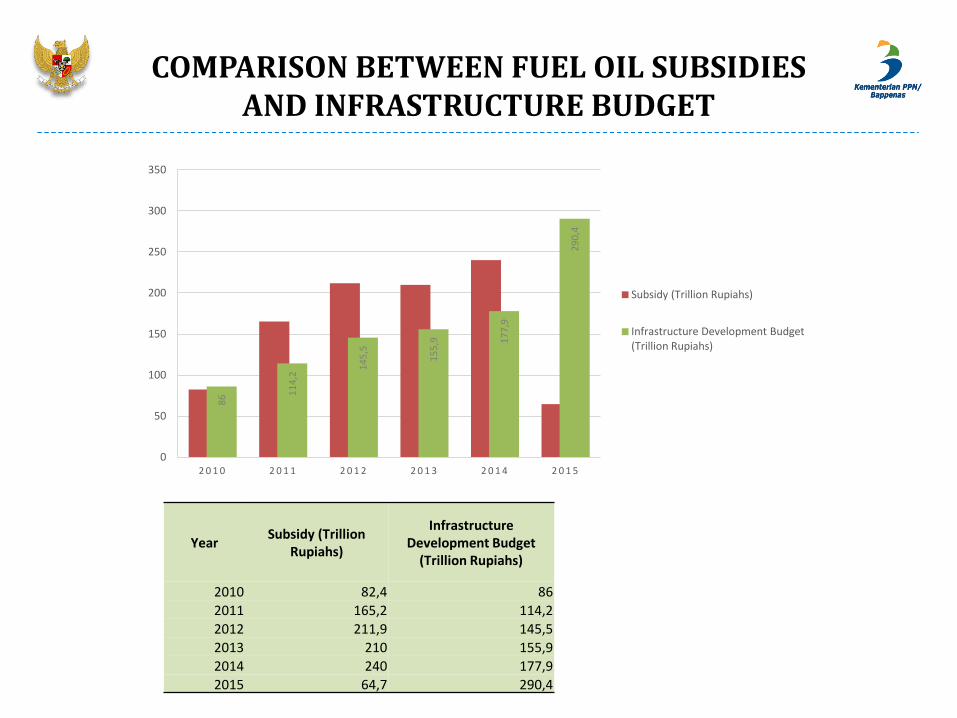
COMPARISON BETWEEN FUEL OIL SUBSIDIES AND INFRASTRUCTURE BUDGET
8
6 11
4,2
14
5,5
15
5,9
17
7,9
29
0,4
0
50
100
150
200
250
300
350
2 0 1 0 2 0 1 1 2 0 1 2 2 0 1 3 2 0 1 4 2 0 1 5
Subsidy (Trillion Rupiahs)
Infrastructure Development Budget (Trillion Rupiahs)
Year Subsidy (Trillion
Rupiahs)
Infrastructure Development Budget
(Trillion Rupiahs)
2010 82,4 86
2011 165,2 114,2
2012 211,9 145,5
2013 210 155,9
2014 240 177,9
2015 64,7 290,4

SHIFTING SUBSIDY BUDGET TO INFRASTRUCTURE
Slide - 16
Subsidy budget for fuel oil reallocated to productive sector,
especially infrastructure
0%
5%
10%
15%
20%
25%
30%
-
50,0
100,0
150,0
200,0
250,0
300,0
350,0
400,0
450,0
2005 2006 2007 2008 2009 2010 2011 2012 2013 2014 2015
Rp
Tri
llio
n
Fuel Oil Subsidy Electricity Subsidy Non Energy Subsidy % Gov't Expenditure
Infrastructure Budget
Data Source : Ministry of Finance, 2015

NATIONAL ENERGY POLICY: FROM OIL TO RENEWABLE
Slide - 17
2013
2025
2050 5%
46%
31%
18%
23%
25% 30%
22%
31%
20% 25%
24%
Total 194 MTOE
Total 400 MTOE
Total 1000 MTOE
Power Plant: 51 GW
Energy Consumption: 0,8 TOE/kap
Electricity Consumption: 776 KWh/kap
Electrification Ratio (2014): 84,33%
Power Plant:115 GW
Energy Consumption: 1,4 TOE/kap
Electricity Consumption: 2.500 KWh/kap
Electrification Ratio (2020): closely to 100%
Power Plant:430 GW
Energy Consumption: 3,2 TOE/kap
Electricity Consumption: 7.000 KWh/kap
New and Renewable Energy
Oil
Natural Gas
Coal
Data Source: National Energy Council, 2015
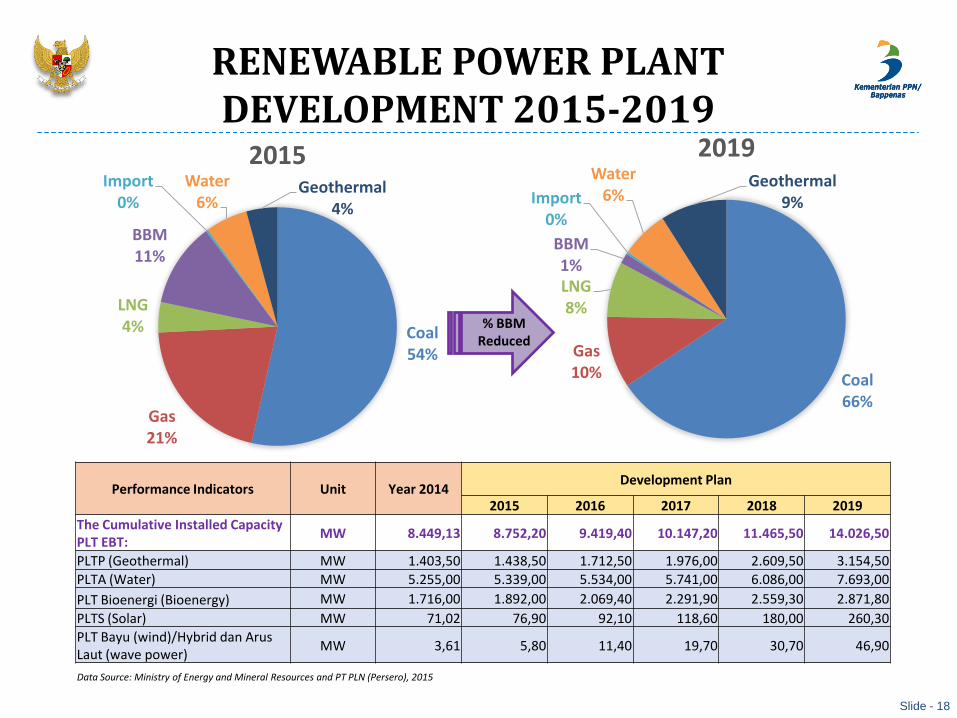
RENEWABLE POWER PLANT DEVELOPMENT 2015-2019
Slide - 18
Coal 54%
Gas 21%
LNG 4%
BBM 11%
Import 0%
Water 6%
Geothermal 4%
2015
Coal 66%
Gas 10%
LNG 8%
BBM 1%
Import 0%
Water 6%
Geothermal 9%
2019
Performance Indicators Unit Year 2014 Development Plan
2015 2016 2017 2018 2019
The Cumulative Installed Capacity PLT EBT:
MW 8.449,13 8.752,20 9.419,40 10.147,20 11.465,50 14.026,50
PLTP (Geothermal) MW 1.403,50 1.438,50 1.712,50 1.976,00 2.609,50 3.154,50
PLTA (Water) MW 5.255,00 5.339,00 5.534,00 5.741,00 6.086,00 7.693,00
PLT Bioenergi (Bioenergy) MW 1.716,00 1.892,00 2.069,40 2.291,90 2.559,30 2.871,80
PLTS (Solar) MW 71,02 76,90 92,10 118,60 180,00 260,30
PLT Bayu (wind)/Hybrid dan Arus Laut (wave power)
MW 3,61 5,80 11,40 19,70 30,70 46,90
% BBM Reduced
Data Source: Ministry of Energy and Mineral Resources and PT PLN (Persero), 2015
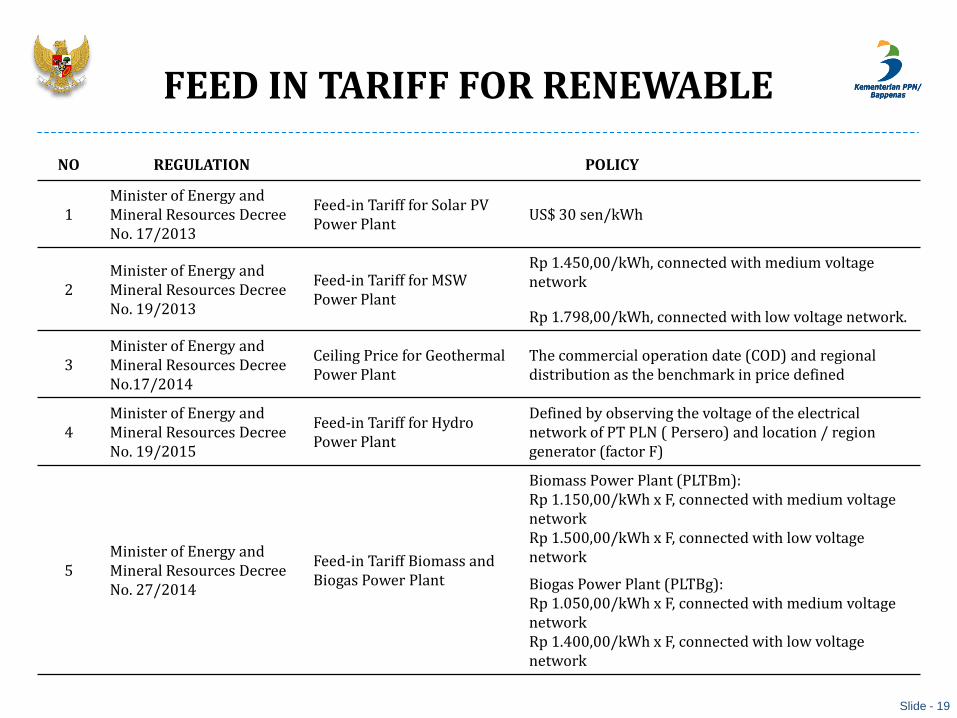
FEED IN TARIFF FOR RENEWABLE
Slide - 19
NO REGULATION POLICY
1 Minister of Energy and Mineral Resources Decree No. 17/2013
Feed-in Tariff for Solar PV Power Plant
US$ 30 sen/kWh
2 Minister of Energy and Mineral Resources Decree No. 19/2013
Feed-in Tariff for MSW Power Plant
Rp 1.450,00/kWh, connected with medium voltage network
Rp 1.798,00/kWh, connected with low voltage network.
3 Minister of Energy and Mineral Resources Decree No.17/2014
Ceiling Price for Geothermal Power Plant
The commercial operation date (COD) and regional distribution as the benchmark in price defined
4 Minister of Energy and Mineral Resources Decree No. 19/2015
Feed-in Tariff for Hydro Power Plant
Defined by observing the voltage of the electrical network of PT PLN ( Persero) and location / region generator (factor F)
5 Minister of Energy and Mineral Resources Decree No. 27/2014
Feed-in Tariff Biomass and Biogas Power Plant
Biomass Power Plant (PLTBm): Rp 1.150,00/kWh x F, connected with medium voltage network Rp 1.500,00/kWh x F, connected with low voltage network
Biogas Power Plant (PLTBg): Rp 1.050,00/kWh x F, connected with medium voltage network Rp 1.400,00/kWh x F, connected with low voltage network
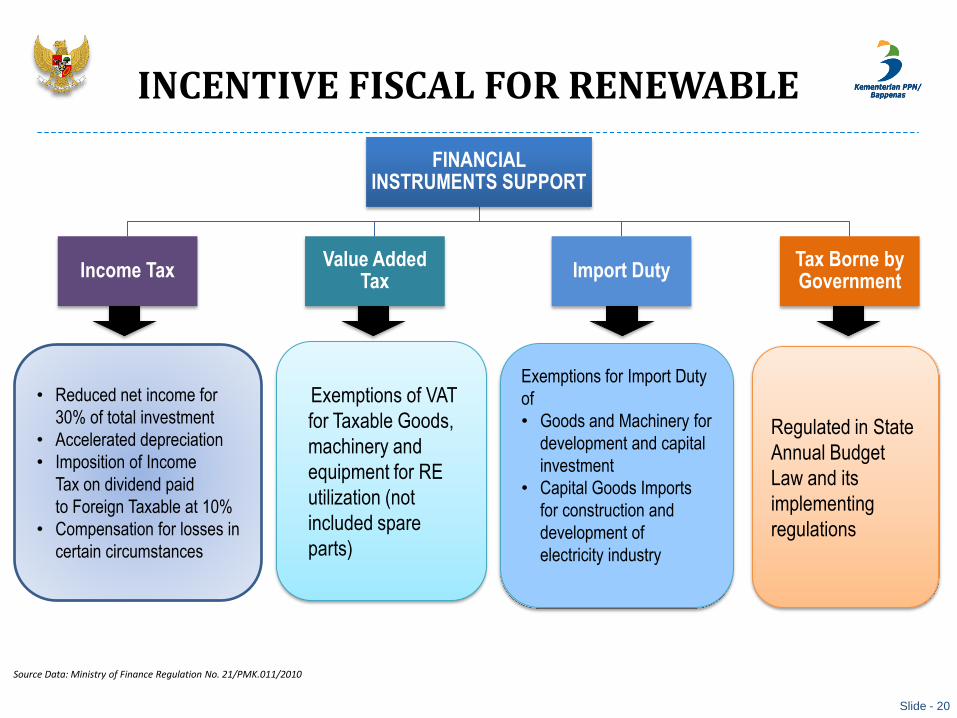
INCENTIVE FISCAL FOR RENEWABLE
Slide - 20
• Reduced net income for
30% of total investment
• Accelerated depreciation
• Imposition of Income
Tax on dividend paid
to Foreign Taxable at 10%
• Compensation for losses in
certain circumstances
Exemptions of VAT
for Taxable Goods,
machinery and
equipment for RE
utilization (not
included spare
parts)
Regulated in State
Annual Budget
Law and its
implementing
regulations
Exemptions for Import Duty
of
• Goods and Machinery for
development and capital
investment
• Capital Goods Imports
for construction and
development of
electricity industry
FINANCIAL INSTRUMENTS SUPPORT
Income Tax Value Added
Tax Import Duty
Tax Borne by Government
Source Data: Ministry of Finance Regulation No. 21/PMK.011/2010

THANK YOU
Related Documents