“We wanted faster horses…” From Excel Dashboard to Big Data Analysis Optimized processing of marketing data at reduced monthly time spent siemens.com/lowvoltage Internal © Siemens AG 2016

Welcome message from author
This document is posted to help you gain knowledge. Please leave a comment to let me know what you think about it! Share it to your friends and learn new things together.
Transcript
“We wanted faster horses…”
From Excel Dashboard to Big Data Analysis
Optimized processing of marketing data at reduced monthly time spent
siemens.com/lowvoltageInternal © Siemens AG 2016

Internal © Siemens AG 2016
“If I had asked people what they
wanted, they would have said
faster horses.”Henry Ford
19 April 2016 Jochen Weinmüller/EM LP SI MT OGPage 2
Internal © Siemens AG 2016
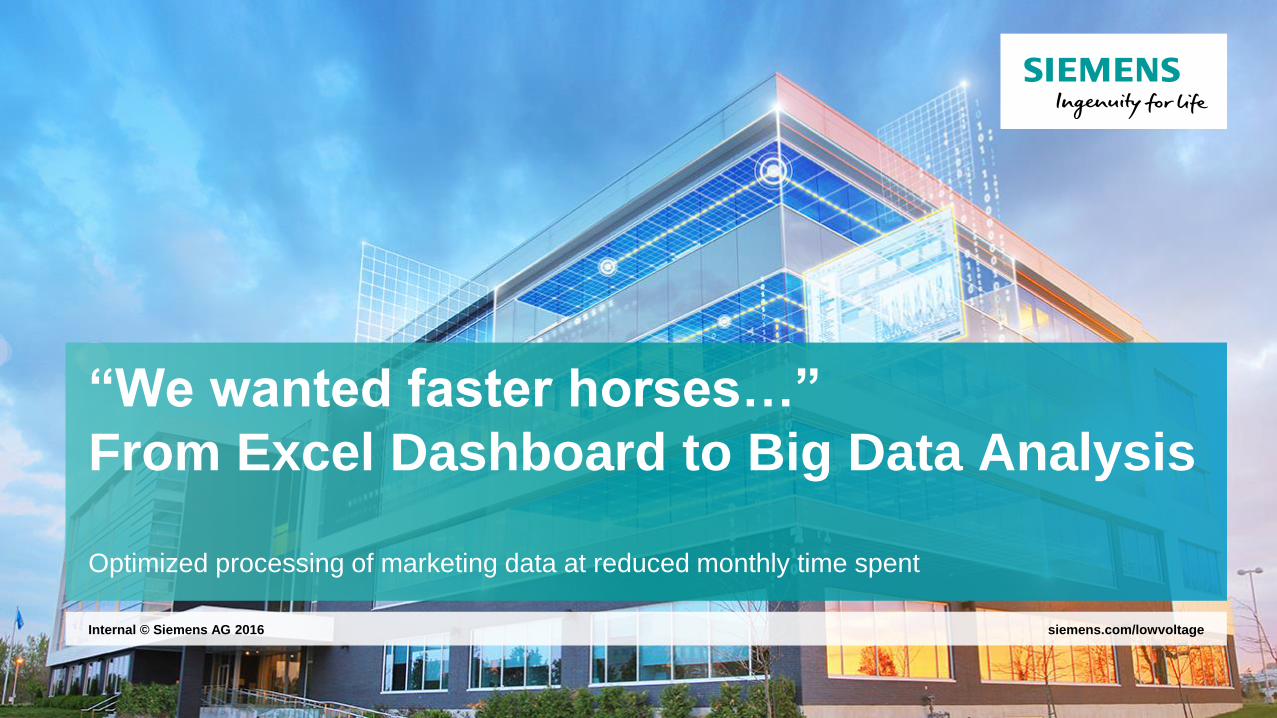
Tool Environment of Siemens
19 April 2016 Jochen Weinmüller/EM LP SI MT OGPage 3
…and many other internal and
external tools and download
platforms producing plenty of
data …

Internal © Siemens AG 2016
Tool Environment of Siemens
Problem:
• No actual reporting, only a monthly data output into an Excel file
• Outputs and reports distributed throughout different filing locations
• Partially no direct data access
• Different file formats
Requirement:
The most important KPIs from different tools and platforms merged into
one view
19 April 2016 Jochen Weinmüller/EM LP SI MT OGPage 4
Internal © Siemens AG 2016
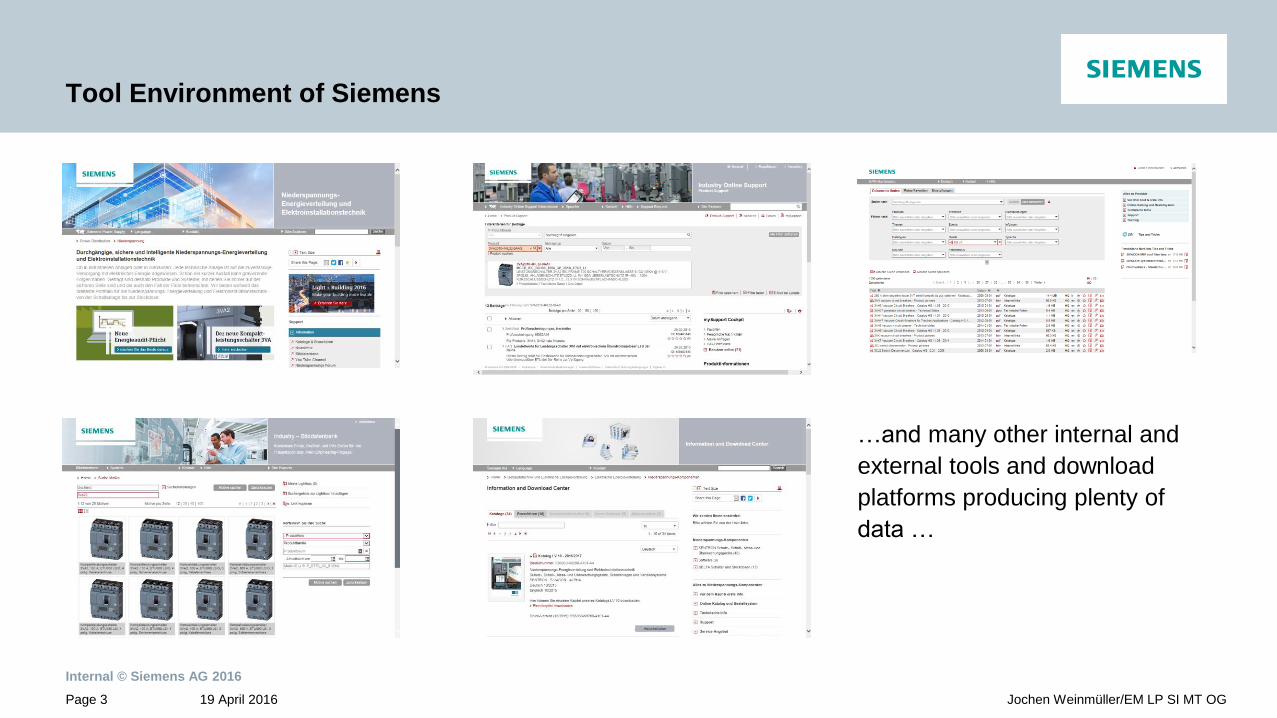
The Excel Dashboard
• High manual maintenance effort for data
= high error rate
• Highly restricted visualization options
• No sufficient level of detail, only an
overview of general tendencies
• No interactivity
Jochen Weinmüller/EM LP SI MT OG19 April 2016Page 5
Required time per month:
3 - 5 days
Level:
“Rocking Horse”

Internal © Siemens AG 2016
Tableau Including Access as a Central Database
Advantages of Tableau:
• Integration of databases and
processing of high data volumes
• Full flexibility of the visualization
• High level of detail
• Interactivity
Result:
Monthly reporting with 22 dashboards for
11 different tools and platforms
Jochen Weinmüller/EM LP SI MT OG19 April 2016Page 6

Internal © Siemens AG 2016
Necessary Work Steps Using “MyPresentationManager”as an Example
19 April 2016 Jochen Weinmüller/EM LP SI MT OGPage 7
File 1 (.csv)
1. Load from SharePoint
2. Open in Excel
3. Add date of the current month as a
new field
4. Import to Access
File 2 (.xml – copy of external DB)
1. Open in Excel
2. Cleanse data
3. Import to Access
In Access
1. Execute table generation query
2. Open table and delete data set of the
oldest month
In Tableau
1. Update extract
Required time per month for all tools:
1 - 2 days
Saved time compared to Excel
Dashboard: 2 - 3 days
Significant improvement of the
presentation and the level of detail
Level:
“Racehorse”

Internal © Siemens AG 2016
Racehorse on the Leash
With the introduction of Tableau:
• Big data volumes and more complex queries
Documentation of the data preparation required
Necessity to artificially split analysis as processing “at a stretch” is not
possible anymore (Access max. 2GB)
• Ongoing new ideas and requirements of superiors and colleagues
New situation:
With the introduction of Tableau, the amount of work for single analysis
has been reduced but the number of analysis and their complexity has
increased in return.
19 April 2016 Jochen Weinmüller/EM LP SI MT OGPage 8

Internal © Siemens AG 2016
Why Alteryx?
19 April 2016 Jochen Weinmüller/EM LP SI MT OGPage 9
Cleanse data
Insert date
field
Execute table
generation query
Delete last
month

Internal © Siemens AG 2016
New workflow:
Save original files in the correct location
Start workflow
Finished!
Required time: 10 minutes
Why Alteryx?
19 April 2016 Jochen Weinmüller/EM LP SI MT OGPage 10

Internal © Siemens AG 2016
Why Alteryx?
Prerequisites:
• No programming skills required
• Intuitive usage (drag & drop)
• Ease of learning (over lunch)
Simple data processing:
• Different data sources/file formats can be used
directly
• No preparatory processing of data
• Significantly faster processing of data than e.g. for
queries in Access
• No limitations in terms of the data volume to be
processed
• Any output format
Personal benefits:
• Significant reduction of my work load of initial 3 - 5
days using Excel to approx. 2 - 3 hours per month
using Alteryx.
• No documentation of the workflows required
anymore as all individual process steps are
displayed transparently and can be commented.
• New ideas and requirements can be implemented
in no time at all
Finally, I have time to focus on the interpretation
of my data
19 April 2016 Jochen Weinmüller/EM LP SI MT OGPage 11

Internal © Siemens AG 2016
Many Thanks for Your Attention
Jochen Weinmüller
Online Marketing Manager
Division Energy Management
You
19 April 2016 Jochen Weinmüller/EM LP SI MT OGPage 12
Jochen Weinmüller
EM LP SI MT OG
Siemensstraße 10
93053 Regensburg/Germany
Phone: +49 941 790- 2074
Fax: +49 941 790-2146
Email: [email protected]
www.siemens.com/lowvoltage
Related Documents