Welcome message from author
This document is posted to help you gain knowledge. Please leave a comment to let me know what you think about it! Share it to your friends and learn new things together.
Transcript
From Blind to Quantitative Steganalysis
Tomá² Pevný1, Jessica Fridrich2, Andrew D. Ker3
1GIPSA-Lab, INPG, France2Binghamton University, SUNY, USA
3University of Oxford, UK
19th January 2009
T. Pevný, J. Fridrich, A. Ker | From Blind to Quantitative Steganalysis 1/23
Outline
1 Motivation
2 Methodology
3 ExperimentsGeneral resultsDetailed results for Jsteg and nsF5Comparison to previous art
4 Conclusion and Future directions
T. Pevný, J. Fridrich, A. Ker | From Blind to Quantitative Steganalysis 2/23
Outline
1 Motivation
2 Methodology
3 ExperimentsGeneral resultsDetailed results for Jsteg and nsF5Comparison to previous art
4 Conclusion and Future directions
T. Pevný, J. Fridrich, A. Ker | From Blind to Quantitative Steganalysis 3/23
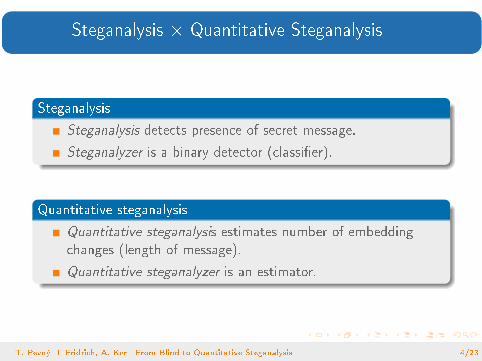
Steganalysis � Quantitative Steganalysis
Steganalysis
Steganalysis detects presence of secret message.
Steganalyzer is a binary detector (classi�er).
Quantitative steganalysis
Quantitative steganalysis estimates number of embeddingchanges (length of message).
Quantitative steganalyzer is an estimator.
T. Pevný, J. Fridrich, A. Ker | From Blind to Quantitative Steganalysis 4/23
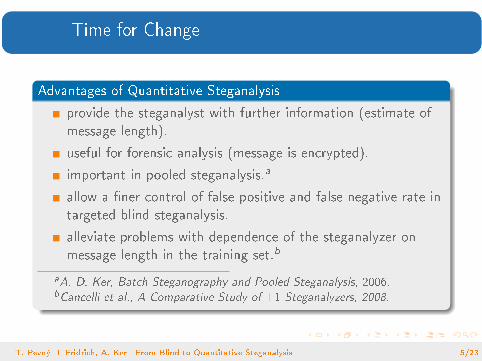
Time for Change
Advantages of Quantitative Steganalysis
provide the steganalyst with further information (estimate ofmessage length).
useful for forensic analysis (message is encrypted).
important in pooled steganalysis.a
allow a �ner control of false positive and false negative rate intargeted blind steganalysis.
alleviate problems with dependence of the steganalyzer onmessage length in the training set.b
aA. D. Ker, Batch Steganography and Pooled Steganalysis, 2006.bCancelli et al., A Comparative Study of �1 Steganalyzers, 2008.
T. Pevný, J. Fridrich, A. Ker | From Blind to Quantitative Steganalysis 5/23
Outline
1 Motivation
2 Methodology
3 ExperimentsGeneral resultsDetailed results for Jsteg and nsF5Comparison to previous art
4 Conclusion and Future directions
T. Pevný, J. Fridrich, A. Ker | From Blind to Quantitative Steganalysis 6/23
Methodology
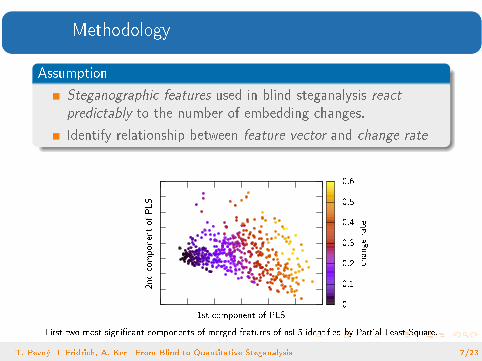
Assumption
Steganographic features used in blind steganalysis react
predictably to the number of embedding changes.
Identify relationship between feature vector and change rate
First two most signi�cant components of merged features of nsF5 identi�ed by Partial Least Square.
1st component of PLS
2ndcomponentof
PLS
0
0.1
0.2
0.3
0.4
0.5
0.6
change
rate
Figure: 3 most important components in linear partial least square of nsF5.
T. Pevný, J. Fridrich, A. Ker | From Blind to Quantitative Steganalysis 7/23
Quantitative Steganalysis by Regression
Problem
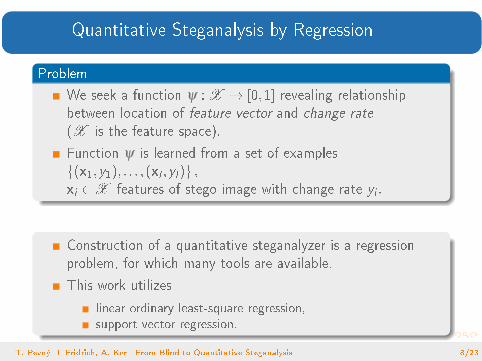
We seek a function ψ :X 7! [0;1] revealing relationshipbetween location of feature vector and change rate
(X is the feature space).
Function ψ is learned from a set of examplesf(x1;y1); : : : ;(xl ;yl )g ;
xi 2X features of stego image with change rate yi :
Construction of a quantitative steganalyzer is a regressionproblem, for which many tools are available.
This work utilizes
linear ordinary least-square regression,support vector regression.
T. Pevný, J. Fridrich, A. Ker | From Blind to Quantitative Steganalysis 8/23
Advantages over Prior Art
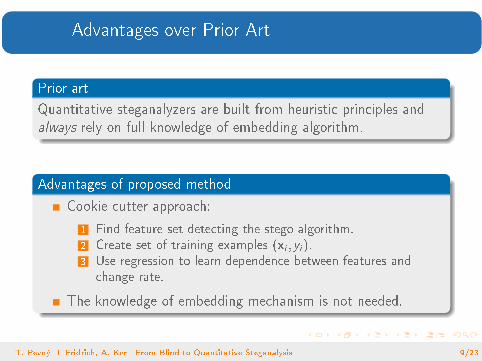
Prior art
Quantitative steganalyzers are built from heuristic principles andalways rely on full knowledge of embedding algorithm.
Advantages of proposed method
Cookie cutter approach:
1 Find feature set detecting the stego algorithm.2 Create set of training examples (xi ;yi ).3 Use regression to learn dependence between features and
change rate.
The knowledge of embedding mechanism is not needed.
T. Pevný, J. Fridrich, A. Ker | From Blind to Quantitative Steganalysis 9/23
Outline
1 Motivation
2 Methodology
3 ExperimentsGeneral resultsDetailed results for Jsteg and nsF5Comparison to previous art
4 Conclusion and Future directions
T. Pevný, J. Fridrich, A. Ker | From Blind to Quantitative Steganalysis 10/23

Experimental Settings
Quantitative steganalyzers for 8 steganographic methods:JP Hide&Seek, Jsteg, MBS1, MMx, F5 with removedshrinkage (nsF5), OutGuess, Perturbed Quantization (PQ),and Steghide.
Quantitative steganalyzers were constructed by
linear ordinary least-square regression (OLS)support vector regression (SVR).
Single-compressed JPEGs with quality factor 80, all createdfrom 9163 raw images evenly divided into training/testing set.
Random payload between zero and maximum for given imageand algorithm was embedded into images.
274 �calibrated merged features� augmented by number ofnon-zero DCTs.
T. Pevný, J. Fridrich, A. Ker | From Blind to Quantitative Steganalysis 11/23
Outline
1 Motivation
2 Methodology
3 ExperimentsGeneral resultsDetailed results for Jsteg and nsF5Comparison to previous art
4 Conclusion and Future directions
T. Pevný, J. Fridrich, A. Ker | From Blind to Quantitative Steganalysis 12/23
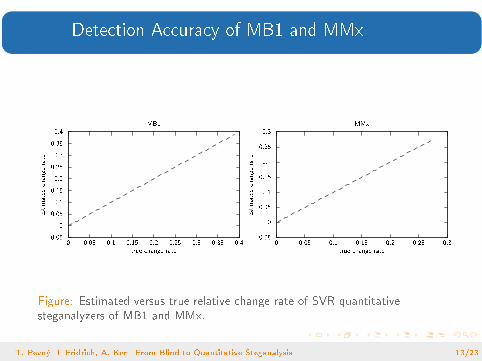
Detection Accuracy of MB1 and MMx
-0.05
0
0.05
0.1
0.15
0.2
0.25
0.3
0.35
0.4
0 0.05 0.1 0.15 0.2 0.25 0.3 0.35 0.4
estimated
change
rate
true change rate
MB1
-0.05
0
0.05
0.1
0.15
0.2
0.25
0.3
0 0.05 0.1 0.15 0.2 0.25 0.3estimated
change
rate
true change rate
MMx
Figure: Estimated versus true relative change rate of SVR quantitativesteganalyzers of MB1 and MMx.
T. Pevný, J. Fridrich, A. Ker | From Blind to Quantitative Steganalysis 13/23
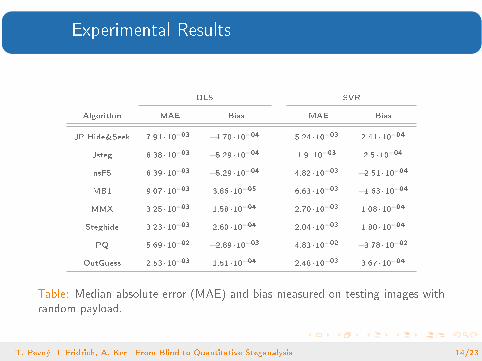
Experimental Results
OLS SVR
Algorithm MAE Bias MAE Bias
JP Hide&Seek 7:91 �10�03 �1:70 �10�04 5:24 �10�03 2:41 �10�04
Jsteg 8:38 �10�03 �5:29 �10�04 1:9 �10�03 2:5 �10�04
nsF5 8:39 �10�03 �5:29 �10�04 4:82 �10�03 �2:51 �10�04
MB1 9:07 �10�03 3:86 �10�05 6:63 �10�03 �1:63 �10�04
MMX 3:25 �10�03 1:58 �10�04 2:70 �10�03 1:08 �10�04
Steghide 3:23 �10�03 2:60 �10�04 2:04 �10�03 1:80 �10�04
PQ 5:69 �10�02 �2:89 �10�03 4:83 �10�02 �3:78 �10�02
OutGuess 2:53 �10�03 1:51 �10�04 2:48 �10�03 3:67 �10�04
Table: Median absolute error (MAE) and bias measured on testing images withrandom payload.
T. Pevný, J. Fridrich, A. Ker | From Blind to Quantitative Steganalysis 14/23
Outline
1 Motivation
2 Methodology
3 ExperimentsGeneral resultsDetailed results for Jsteg and nsF5Comparison to previous art
4 Conclusion and Future directions
T. Pevný, J. Fridrich, A. Ker | From Blind to Quantitative Steganalysis 15/23
Compound Error
0.001
0.002
0.003
0.004
0.005
0.006
0.007
0.008
0.009
0 0.1 0.2 0.3 0.4 0.5
meanabsolute
error
relative number of embedding changes
nsF5Jsteg
-0.002
-0.001
0
0.001
0.002
0.003
0.004
0.005
0.006
0.007
0 0.1 0.2 0.3 0.4 0.5bias
relative number of embedding changes
nsF5Jsteg
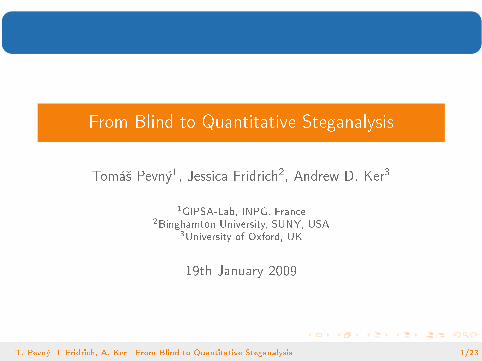
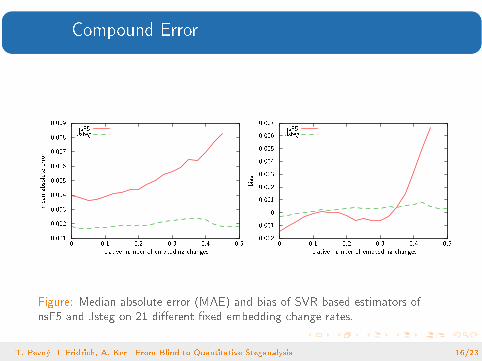
Figure: Median absolute error (MAE) and bias of SVR based estimators ofnsF5 and Jsteg on 21 di�erent �xed embedding change rates.
T. Pevný, J. Fridrich, A. Ker | From Blind to Quantitative Steganalysis 16/23
Outline
1 Motivation
2 Methodology
3 ExperimentsGeneral resultsDetailed results for Jsteg and nsF5Comparison to previous art
4 Conclusion and Future directions
T. Pevný, J. Fridrich, A. Ker | From Blind to Quantitative Steganalysis 17/23
Comparison to Previous Art
0
0.005
0.01
0.015
0.02
0.025
0.03
0 0.1 0.2 0.3 0.4 0.5
meanabsolute
error
relative number of embedding changes
JPairsWBSVR
-0.01
-0.005
0
0.005
0.01
0.015
0.02
0.025
0.03
0 0.1 0.2 0.3 0.4 0.5
bias
relative number of embedding changes
JPairsWBSVR
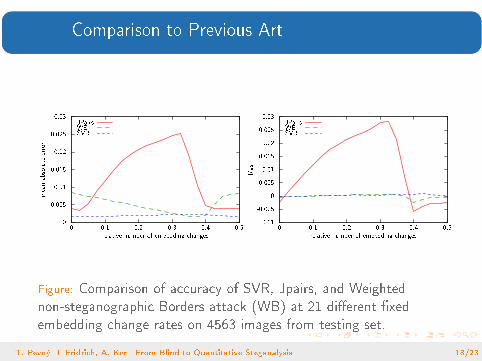
Figure: Comparison of accuracy of SVR, Jpairs, and Weightednon-steganographic Borders attack (WB) at 21 di�erent �xedembedding change rates on 4563 images from testing set.
T. Pevný, J. Fridrich, A. Ker | From Blind to Quantitative Steganalysis 18/23
Outline
1 Motivation
2 Methodology
3 ExperimentsGeneral resultsDetailed results for Jsteg and nsF5Comparison to previous art
4 Conclusion and Future directions
T. Pevný, J. Fridrich, A. Ker | From Blind to Quantitative Steganalysis 19/23
Conclusion
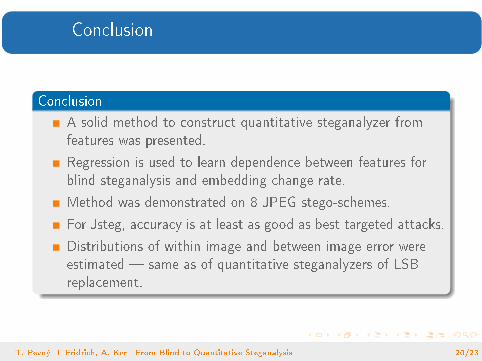
Conclusion
A solid method to construct quantitative steganalyzer fromfeatures was presented.
Regression is used to learn dependence between features forblind steganalysis and embedding change rate.
Method was demonstrated on 8 JPEG stego-schemes.
For Jsteg, accuracy is at least as good as best targeted attacks.
Distributions of within image and between image error wereestimated � same as of quantitative steganalyzers of LSBreplacement.
T. Pevný, J. Fridrich, A. Ker | From Blind to Quantitative Steganalysis 20/23
Future Directions
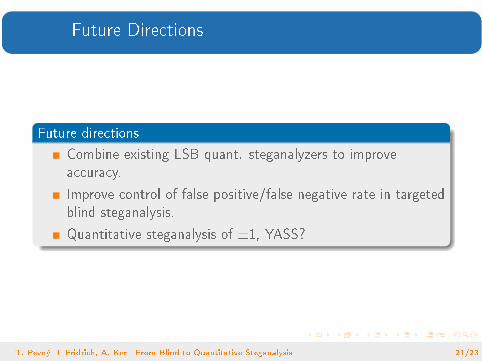
Future directions
Combine existing LSB quant. steganalyzers to improveaccuracy.
Improve control of false positive/false negative rate in targetedblind steganalysis.
Quantitative steganalysis of �1, YASS?
T. Pevný, J. Fridrich, A. Ker | From Blind to Quantitative Steganalysis 21/23
Within and Between Image Error of Jsteg
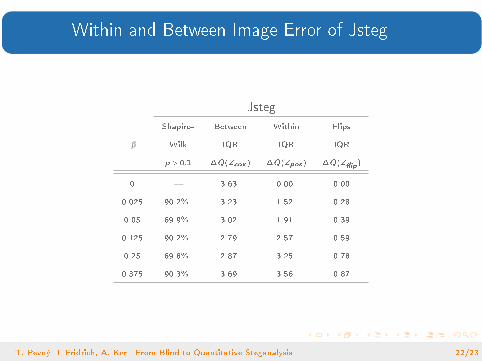
Jsteg
Shapiro- Between Within Flips
β Wilk IQR IQR IQR
p > 0:1 �Q(Zcov ) �Q(Zpos ) �Q(Z�ip)
0 � 3.63 0.00 0.00
0.025 90.2% 3.23 1.52 0.28
0.05 89.9% 3.02 1.91 0.39
0.125 90.2% 2.79 2.57 0.59
0.25 89.8% 2.87 3.25 0.78
0.375 90.3% 3.69 3.56 0.87
T. Pevný, J. Fridrich, A. Ker | From Blind to Quantitative Steganalysis 22/23
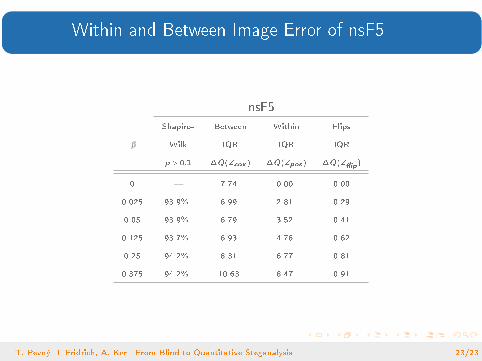
Within and Between Image Error of nsF5
nsF5
Shapiro- Between Within Flips
β Wilk IQR IQR IQR
p > 0:1 �Q(Zcov ) �Q(Zpos ) �Q(Z�ip)
0 � 7.74 0.00 0.00
0.025 93.9% 6.99 2.81 0.29
0.05 93.9% 6.79 3.52 0.41
0.125 93.7% 6.93 4.78 0.62
0.25 94.2% 8.31 6.77 0.81
0.375 94.2% 10.63 8.47 0.91
T. Pevný, J. Fridrich, A. Ker | From Blind to Quantitative Steganalysis 23/23
Related Documents