Free-Riding on Protection for Sale Kishore Gawande 1 Christopher Magee 2 Texas A&M University Bucknell University Abstract In the “Protection for Sale” model of Grossman and Helpman (1994), some industries are assumed to be able to overcome the free-rider problem and organize a lobby that represents their group interests while other industries are unable to form a lobby. This dichotomy presents a problem for the many papers that attempt to estimate the model empirically since every industry must be classified as either fully organized or completely unorganized and the data on campaign contributions do not reveal such a sharp distinction. This paper introduces free-riding into the GH model in a way that allows industries to be partially organized. The paper makes a distinction between cooperative lobbying, in which firms lobby in order to maximize the joint welfare of all firms in the industry, and noncooperative lobbying, in which each firm lobbies to maximize its own welfare. A move away from cooperative lobbying and toward noncooperative lobbying indicates greater free riding on the part of firms. Using data on U.S. trade barriers, we test the model empirically and find evidence of free riding by firms. JEL classification: F13, D72 1 Helen and Roy Ryu Professor of Economics and Government, Bush School of Government and Public Service, Texas A&M University, College Station, TX, 77843; [email protected] ; phone (979) 458- 8034. 2 Department of Economics, Bucknell University, Lewisburg, PA 17837; [email protected] ; phone (570) 577-1752.

Welcome message from author
This document is posted to help you gain knowledge. Please leave a comment to let me know what you think about it! Share it to your friends and learn new things together.
Transcript

Free-Riding on Protection for Sale
Kishore Gawande1 Christopher Magee2
Texas A&M University Bucknell University
Abstract
In the “Protection for Sale” model of Grossman and Helpman (1994), some
industries are assumed to be able to overcome the free-rider problem and organize a
lobby that represents their group interests while other industries are unable to form a
lobby. This dichotomy presents a problem for the many papers that attempt to estimate
the model empirically since every industry must be classified as either fully organized or
completely unorganized and the data on campaign contributions do not reveal such a
sharp distinction. This paper introduces free-riding into the GH model in a way that
allows industries to be partially organized. The paper makes a distinction between
cooperative lobbying, in which firms lobby in order to maximize the joint welfare of all
firms in the industry, and noncooperative lobbying, in which each firm lobbies to
maximize its own welfare. A move away from cooperative lobbying and toward
noncooperative lobbying indicates greater free riding on the part of firms. Using data on
U.S. trade barriers, we test the model empirically and find evidence of free riding by
firms.
JEL classification: F13, D72
1 Helen and Roy Ryu Professor of Economics and Government, Bush School of Government and Public Service, Texas A&M University, College Station, TX, 77843; [email protected]; phone (979) 458-8034. 2 Department of Economics, Bucknell University, Lewisburg, PA 17837; [email protected]; phone (570) 577-1752.

1
1. Introduction
The Grossman and Helpman (1994, GH hereafter) model assumes that an industry is
either fully organized, in which case it has completely overcome the free rider problem and acts
to maximize the welfare of the entire group of industry-specific capital owners, or the industry is
completely unorganized, in which case it does not lobby the government. This assumption is
useful for achieving a tractable model, but it creates a problem for empirical researchers because
industries must be classified as either fully organized or unorganized despite the fact that in the
data sets commonly used, every industry has some positive campaign contributions. This aspect
of the data means that studies must either assume that all industries are fully organized as Mitra,
Thomakos, and Ulubasoglu (2006) do, adopt a (necessarily arbitrary) threshold level of
contributions below which industries are assumed to be unorganized as Goldberg and Maggi
(1999) do, or use preliminary regressions to divide industries into organized and unorganized as
Gawande and Bandyopadhyay (2000) do. None of these methods is foolproof, however, and
Imai, Katayama, and Krishna (2007) argue that misclassification of which industries are
politically organized means that empirical estimates of the GH model are inconsistent.
A more realistic assumption is that all industries grapple with the free rider problem and
their lobby groups are only able to overcome it to some greater or lesser degree so that each
industry is partially organized. This paper introduces free-riding into the GH model in a way
that allows industries to be partially organized. The paper makes a distinction between
cooperative lobbying, in which firms lobby in order to maximize the joint welfare of all firms in
the industry, and noncooperative lobbying, in which each firm lobbies to maximize its own
welfare. Each industry lies somewhere along a continuum between fully cooperative lobbying

2
and completely noncooperative lobbying. A move away from cooperative lobbying and toward
noncooperative lobbying indicates greater free riding on the part of firms.
The paper adds to the literature in several ways. First, the theory developed here removes
the artificial distinction between organized and unorganized industries imposed by the GH
model. In this paper industries are allowed to have a range of abilities to overcome the free rider
problem, and we can measure the average ability to do so in the data. The model also shows that
even “unorganized” industries that have not overcome the free rider problem can still lobby the
government, and thus it explains why, in the data, every industry has some positive PAC
contributions. Another contribution is that the model presented here removes the need
empirically to decide which industries are organized and which are not – the level of
organization is now something that we can estimate within the structure of the model. In the
empirical tests, we also use a newer data set with trade barrier information from 1996, and thus
we update the estimates of the Grossman and Helpman (1994) model. Most of the existing
papers estimating the model for the United States use the benchmark 1983 data. Finally, we
provide a two-stage least absolute deviations estimator that reduces the influence of outliers on
the results and is new to this application.
The next section describes the existing papers estimating the GH model empirically and it
discusses how the introduction of free riding into the model can help explain a puzzling result
that emerges from this literature. Section three then presents a theoretical model in which free
riding is introduced into the GH model. Section four describes the data and section five presents
the empirical results of estimating the model. The final section concludes.

3
2. Literature review
Beginning with Goldberg and Maggi (1999) and Gawande and Bandyopadhyay (2000), a
large number of studies have attempted to estimate the Grossman and Helpman (1994)
“Protection for Sale” model empirically. While the studies generally conclude that the empirical
results support the model, the estimates suggest in nearly every case that the government places
an extremely high weight on social welfare relative to campaign contributions when it sets trade
policy. In Goldberg and Maggi (1999), for instance, the government values $1 of social welfare
50 – 70 times higher than it values $1 of campaign contributions. In Gawande and
Bandyopadhyay (2000), the policy maker values social welfare thousands of times more than she
values campaign contributions. Many subsequent papers have also found very high weights
placed on social welfare in the policy maker utility function, including Eicher and Osang (2002),
Mitra, Thomakos, and Ulubasoglu (2002), McCalman (2004), Gawande and Krishna (2005),
Fachini, van Biesebroeck, and Willmann (2006), Gawande, Krishna, and Robbins (2006), and
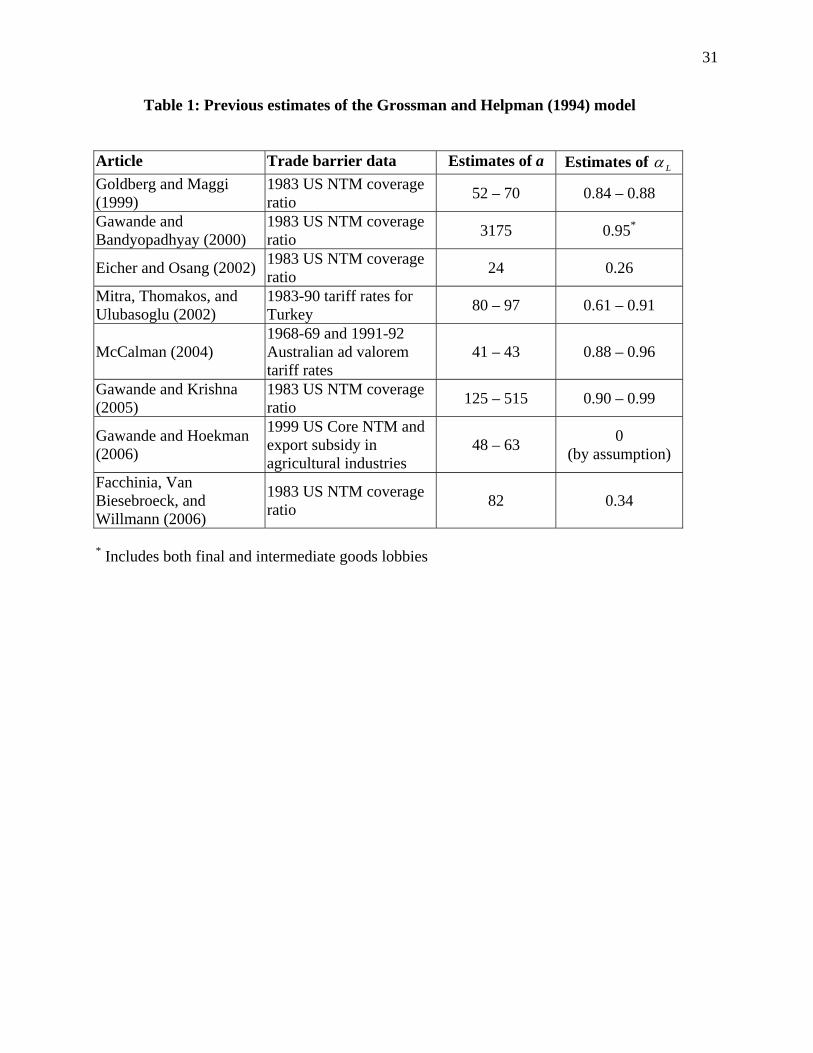
Gawande and Hoekman (2006). Table 1 summarizes the estimates from these models.
These estimates suggest that the government is very close to being welfare-maximizing
despite the fact that, as Gawande and Bandyopadhyay (2000) point out, studies have shown that
efficiency losses from protection are many times larger than what lobbies spend to get the
protection. Mitra, Thomakos, and Ulubasoglu (2006) point out a further contradiction in the
results. As shown in Table 1, most of the studies find a very high proportion of the population
represented by a lobby. Yet it does not seem realistic that the vast majority of individuals would
participate in lobbying over trade policy if the government does not value campaign
contributions. The results are also surprising in light of the vast political economy literature
showing that the government is responsive to lobbying efforts by interest groups. As Gawande
4
and Krishna (2003, 213) explain, “The primary explanation offered in this literature is that
suboptimal policies are chosen because policies are not set by those who seek to maximize
economic efficiency.”
It is not difficult to see why estimates of the GH model suggest that the government
values social welfare highly relative to contributions. Industries receive very large gains from
protection, so they have a strong incentive to offer generous campaign contributions to a policy
maker in exchange for favorable trade policies. At the same time, the welfare costs of tariffs
(consumer and producer distortion triangles) are relatively small at low levels of protection.
Thus, if the government values contributions and welfare equally, then it will be willing to grant
industries significant protection. In order to reconcile the observed low trade barriers in most
developed countries with the predictions of the model, it is necessary for the policy maker to
place almost no weight on contributions in its utility function.
The conclusion that the policy maker does not value campaign contributions is related to
the question “Why is there so little money in U.S. politics?” that is asked by Gordon Tullock
(1972) and Ansolabehere, de Figueiredo, and Snyder (2003). Since influencing government
policies is so lucrative, these scholars suggest that firms should spend much more money on
lobbying than they actually do. The parallel to the GH model is that we should observe much
larger campaign contributions and higher levels of protection than we do unless, as the estimates
suggest, policy makers really are immune to offers of funding from interest groups.
A few recent papers point out the surprising benevolence of governments in setting their
trade policies and attempt to explain it. One possibility, explored by Gawande and Krishna
(2005), is that lobbying by import-competing industries in favor of tariff protection is offset by
lobbying against tariffs from industries that use imported intermediate goods. These authors
5
incorporate lobbying by downstream users of imported goods into the GH model and they find
that including downstream lobbying against tariff protection reduces the estimated weight placed
by the policy maker on social welfare. This estimated weight the policy maker places on welfare
remains unrealistically high, however, at 125 – 500 times the weight placed on campaign
contributions.
Another explanation for why policy makers seem to care so little about campaign
contributions is policy uncertainty. Gawande and Hoekman (2006) estimate the GH model as it
applies to agricultural subsidies and protection, and they estimate that in this area as well, the
policy makers care mostly about social welfare (42 – 100 times more than they care about
contributions). If uncertainty is added to the model, however, there is a decline in the weight
policy makers place on social welfare. Uncertainty about the effect of lobbying on government
policies reduces the contributions firms offer to policy makers in exchange for tariff protection.
Thus, for any given weight on social welfare in the policy maker’s utility function, there is a
lower equilibrium level of protection. The low levels of protection in the data, then, can be
explained by uncertainty in the lobbying process rather than because politicians care greatly
about social welfare.
A final paper investigating the surprisingly large weight estimated to be on social welfare
in the policy maker utility function is Mitra, Thomakos, and Ulubasoglu (2006). They argue that
it is reasonable to treat every industry as if it is politically organized. Assuming all industries are
organized, they show that plausible (i.e. low) estimates of the policy maker weight on social
welfare are obtained if the fraction of the population represented by an industry lobby is close to
90 percent. Since a much smaller percentage of the population even owns stocks or mutual
6
funds, however, it seems unlikely that industries truly represent such a high fraction of the
population in their lobbying efforts.
This paper presents a different explanation for why estimates of the GH model suggest
policy makers are so benevolent. As Mancur Olson (1965) pointed out, a group that is trying to
obtain a public good (such as firms lobbying for tariff protection) may find it difficult to get
individual members to pay their share of the costs since each participant has an incentive to free
ride on the contributions of the others. Free riding by firms dramatically reduces the
contributions the industry offers to a policy maker in exchange for trade protection and thus it
reduces the level of trade barriers chosen in equilibrium. As a result, free riding can help
reconcile the simultaneous existence of low trade barriers and a government that cares about the
amount of campaign money it receives.
Introducing individual firm decisions on how much to contribute to the policy maker
moves the model toward one in which lobby formation is endogenous. Mitra (1999) and Magee
(2002) provide two theoretical models in which endogenous lobby formation is incorporated into
the GH model. Bombardini (2008) goes one step further by developing a theoretical model and
then presenting empirical tests of it. In her model, a firm joins the lobby only if the gain
generated by the new firm’s lobbying efforts outweighs the cost of participation. Since the gain
from participating in lobbying rises with firm size, in equilibrium the lobby should contain only
the largest firms. Empirical tests find strong support for the model’s predictions, which suggests
that adding individual firm lobbying behavior into the GH model, as this paper does, is a fruitful
avenue of research.
7
3. Model
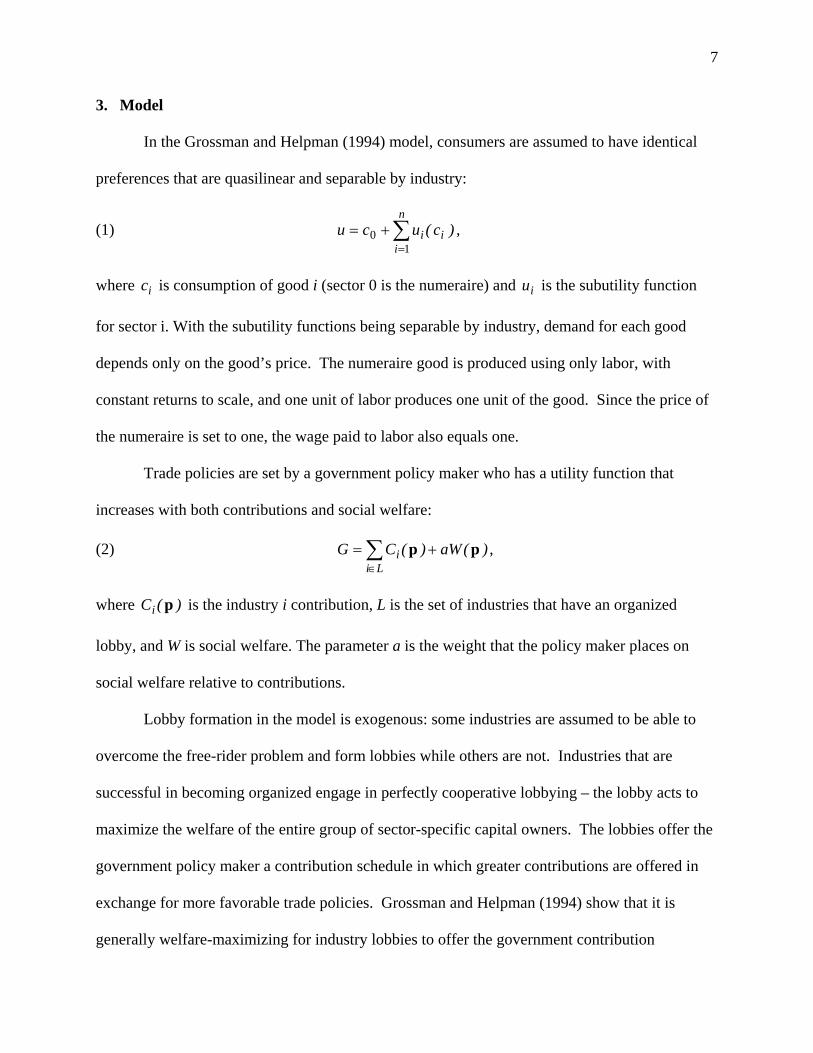
In the Grossman and Helpman (1994) model, consumers are assumed to have identical
preferences that are quasilinear and separable by industry:
(1) ∑=
+=n
iii )c(ucu
10 ,
where ic is consumption of good i (sector 0 is the numeraire) and iu is the subutility function
for sector i. With the subutility functions being separable by industry, demand for each good
depends only on the good’s price. The numeraire good is produced using only labor, with
constant returns to scale, and one unit of labor produces one unit of the good. Since the price of
the numeraire is set to one, the wage paid to labor also equals one.
Trade policies are set by a government policy maker who has a utility function that
increases with both contributions and social welfare:
(2) )(aW)(CGLi
i pp += ∑∈
,
where )(Ci p is the industry i contribution, L is the set of industries that have an organized
lobby, and W is social welfare. The parameter a is the weight that the policy maker places on
social welfare relative to contributions.
Lobby formation in the model is exogenous: some industries are assumed to be able to
overcome the free-rider problem and form lobbies while others are not. Industries that are
successful in becoming organized engage in perfectly cooperative lobbying – the lobby acts to
maximize the welfare of the entire group of sector-specific capital owners. The lobbies offer the
government policy maker a contribution schedule in which greater contributions are offered in
exchange for more favorable trade policies. Grossman and Helpman (1994) show that it is
generally welfare-maximizing for industry lobbies to offer the government contribution

8
schedules that are locally truthful so that the increase in contributions associated with a rise in
the tariff exactly matches the increase in lobby welfare. If an industry is fully organized, the
policy maker chooses an equilibrium tariff of:
(3) i
i
L
L
i
iez
att
⋅+−
=+ α
α11
,
where it is the ad valorem tariff rate, Lα is the fraction of the country’s population that is
represented by an organized industry lobby, iz is the inverse import-penetration ratio (domestic
output over imports), and ie is the absolute value of the price elasticity of import demand.
We refer to the equilibrium tariff in equation (3) as the cooperative lobbying outcome
because there is perfect cooperation between sector-specific capital owners in their lobbying
behavior. Grossman and Helpman (1994) assume that unorganized industries make no
contribution offers to the policy maker, and thus the equilibrium tariff for an unorganized
industry is zero or negative:
(4) j
j
L
L
j
j
ez
att
⋅+
−=
+ αα
1,
which in practice means that these industries would have an import subsidy if 0>Lα .
We make one initial simplification of this setup – we assume that the fraction of the
population represented by organized lobby groups is zero ( 0=Lα ). In the GH model, lobbies
oppose tariff protection for other industries because the industry’s sector-specific capital owners
do not want to pay high prices in their role as consumers. Assuming that 0=Lα in the context
of the model is equivalent to assuming that consumer interests are not represented by lobbies and
instead that industry lobbies act to maximize profits. This assumption also seems consistent with

9
the common hypothesis that firms maximize profits rather than maximizing a combination of
profits and the consumer surplus of the firm’s shareholders.
A locally truthful contribution schedule means that the increase in contributions offered
to the policy maker exactly equals the gain to the industry from an increase in the tariff. By
Hotelling’s Lemma, the gain to the industry of an increase in the price is equal to industry
output:
(5) ii
i
i
i xpt
C=
∂∂
=∂∂ π
,
where ix is total industry output of good i and iπ is total industry profits. The policy maker
maximizes utility by setting 0=∂∂
tG , or
tWa
tC
i ∂∂
−=∂∂ . With the contribution schedule in
equation (5), the equilibrium tariff with cooperative lobbying becomes:
(6) i
i
coopi
coopi
ez
att
⋅=+
11 ,
, .
The assumption in GH that industries failing to achieve cooperation in lobbying offer no
contributions to the policy maker rules out the possibility that individual sector-specific capital
owners might have a private incentive to lobby the government. It implicitly assumes that there
are fixed costs of lobbying that are greater than the net gain to any individual capital owner of
offering a contribution schedule to the policy maker (given that the other capital owners are not
offering contribution schedules). In the data sets used by Goldberg and Maggi (1999) and
Gawande and Bandyopadhyay (2000), every industry (at the 4-digit 1972 SIC level) has some
positive contributions, however, so it seems unrealistic to assume that some industries are
unorganized and offer no contributions. In the absence of fixed costs of lobbying, sector-specific
10
capital owners would have an incentive to lobby the policy maker as individuals even if their
industry is not successful at organizing an industry-wide lobby.
In practice, capital owners are organized into firms that lobby the government through
political action committees. It is much more likely that corporations, particularly large ones,
have incentives to lobby the government over trade policy even if the industry as a whole is
unable to overcome the free rider problem and organize a cooperative lobby. In this paper, we
thus distinguish between cooperative lobbying, in which the industry lobby group acts to
maximize total industry profits, and noncooperative lobbying, in which each firm acts to
maximize its own profits in offering contribution schedules to the policy maker.
Assuming that lobbying is done by firms rather than individuals faces the objection that
campaign finance laws in the United States prohibit firms from contributing directly to
candidates in federal elections. Ansolabehere, de Figueiredo, and Snyder (2003) show, however,
that PACs spent $579M on all operations but only $281M was given directly to candidates. The
nearly $300M remaining went for overhead and other activities that could legally have been paid
for by firms’ (or unions’) treasuries. Many contributions are also given by company executives
whose pay is often tied to the success of the firm. Thus, there is slack in the campaign finance
laws and they do not pose a binding constraint on firms’ abilities to transfer money to candidates.
In a noncooperative lobbying situation, a firm will offer a contribution schedule that
maximizes firm profits. A truthful contribution schedule from firm j in industry i would be:
(7) jii
ji
i
ji xpt
C,
,, =∂
∂=
∂
∂ π,

11
where jix , is the output of firm i in industry j. This contribution schedule is less generous than
the cooperative contribution schedule in equation (5) since the gain to the firm of receiving a
higher tariff is smaller than the gain to the entire industry (except in a pure monopoly case).
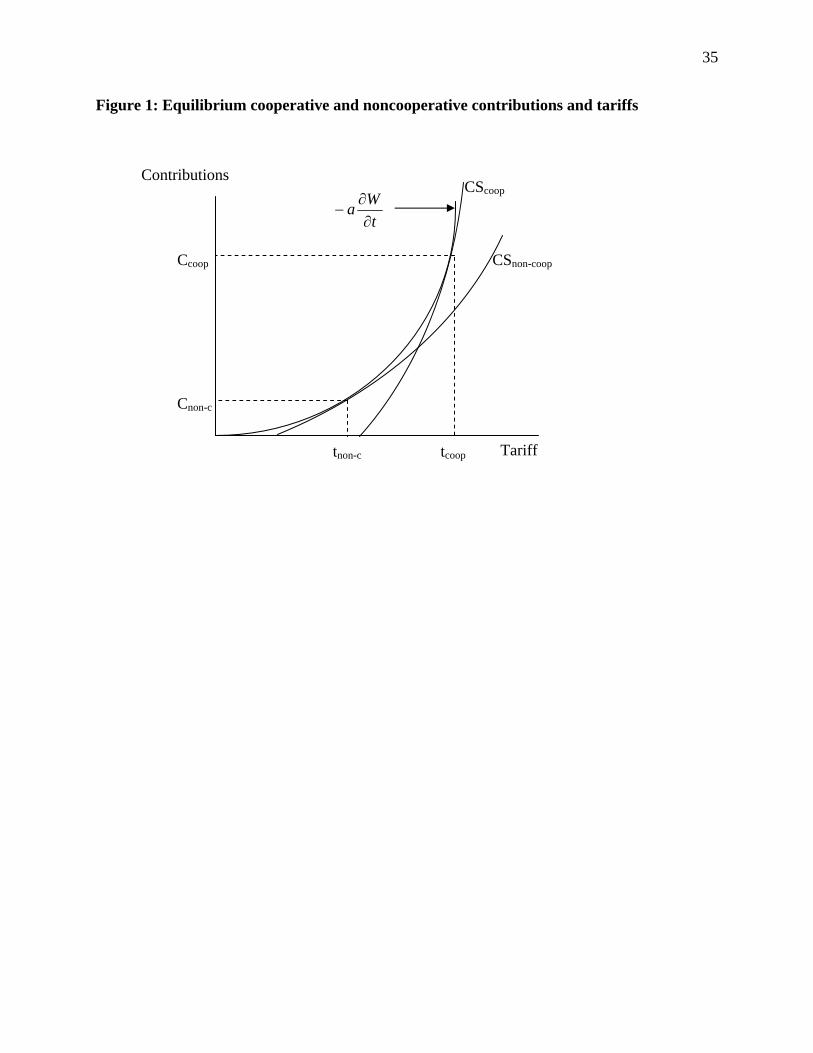
Figure 1 illustrates the government’s choice of tariff with cooperative lobbying and
compares it to the government’s choice of tariff if only the largest firm in the industry offers
contributions. In each case, the policy maker chooses a tariff to maximize his or her utility,
which means ii
ji
pWa
tC
∂∂
−=∂
∂ , . With cooperative lobbying, the industry contribution schedule is
more generous than if only one firm lobbies, and the policy maker would select a higher tariff
level, shown as coopt . The less generous contribution schedule from a single firm results in a
tariff of coopnont − .
If each firm is choosing its contributions to maximize their individual firm welfare and
the largest firm has already offered a contribution schedule to the policy maker, smaller firms in
the industry have no incentive to push the tariff above coopnont − . The increase in contributions
required to induce the government to raise the tariff above that level would be greater than the
gain to any of the smaller firms in the industry. Thus, a Nash equilibrium in the lobbying game
is for the largest firm to offer contributions just generous enough to get the government to select
coopnont − and for all other firms in the industry to offer nothing. Given that the other firms
contribute nothing, the large firm is acting in its own self-interest, and given that the largest firm
12
contributes to get the tariff to coopnont − , the other firms are rational to contribute nothing
further.3 The tariff in a non-cooperative lobbying equilibrium, then, is
(8) i
ii
cnoni
cnoni
ez
att
⋅=+ −
− δ
,
,
1,
where i
jii x
x ,=δ is the share of output produced by the largest firm in the industry. The
equilibrium in which the largest firm bears all of the costs of lobbying is an extreme example of
what Olson (1965, p. 3) calls the “tendency for the ‘exploitation’ of the great by the small.”
To quantify the extent of lobby cooperation or free riding, we introduce a parameter iφ
that measures the industry’s ability to overcome the free rider problem, with 0=iφ indicating
that there is no cooperation between firms in their lobbying efforts and 1=iφ indicating perfect
cooperation. The parameter enters into the slope of the contribution schedule offered to the
policy maker by the industry, so that the imperfectly cooperative lobbying contribution schedule
has a slope of jiiii xxtC
,)1( φφ −+=∂∂ . The equilibrium tariff, then, is
(9) i
ii
i
i
ii
i
i
ez
aez
att
δφφ −
+=+
11
.
Equation (9) provides a modified version of the Grossman and Helpman (1994) tariff that
allows for partially-organized industries, and the parameter iφ captures the extent to which they
are organized. Notice that equation (9) does not include any indicator variables for whether an
industry is organized or not since every industry is assumed to be partially organized. That is an
advantage empirically because it removes the need to classify industries as either fully organized
3 This equilibrium is likely not unique. Magee, Brock, and Young (1989, pages 278 – 291) present a more general model in which there are multiple equilibria in an n-person noncooperative lobby game.

13
or completely unorganized, a decision that is complicated by the fact that all 4-digit SIC
industries typically give some campaign contributions to candidates for office. We turn now to
the specification of econometric models for estimating the parameters a and iφ .
4. Econometric Specification and Data:
Econometric Specification
In our first estimates of the model, we adopt an econometric specification where the
extent of free riding is constant across industries ( φφ =i for all i) in equation (9). The
econometric model is:
(10) ii
ii
i
i
i
i
ez
ez
tt
εδββα +++=+ 101
where iε is an identically and independently normally distributed error term and where we have
added a constant term to reflect the fact that industries may have nonzero trade barriers in
practice even when each of the right-hand side variables is zero. Estimates of the parameters
10
0
βββ
φ+
= and 10
1ββ +
=a can then be recovered using the estimates of 0β and 1β from
equation (10). In later estimations we allow firms’ ability to overcome the free rider problem
( iφ ) to differ across two-digit industries.
Bombardini (2008, p. 340, equation 17) develops a protection equation similar to (10):
(11) iii
ii
i
ii
i
i Zez
ez
It
tεγθγγ ++++=
+ 12101,
where iθ is the share of output in industry i produced by firms contributing to the lobby effort,
iI is an indicator variable that equals one if the industry is politically organized, and iZ1
14
includes tariffs on intermediate goods as controls. The key difference between equations (10)
and (11) arises from the fact that in Bombardini’s model, as in GH, the lobby achieves perfect
cooperation between firms that participate. Her innovation is to show that only the largest firms
would choose to contribute to the lobby in the presence of fixed costs of participation. Her
model does not deviate from GH in the assumption that some industries can overcome the free
rider problem while other industries can not. Thus, the indicator variable for political
organization remains in her estimating equation. In our model, there is no distinction made
between organized and unorganized industries; instead we introduce a continuous measure of an
industry’s ability to overcome the free rider problem. Despite this difference, both models
provide a similar prediction that the share of output produced by the largest firms affects the
equilibrium tariff because individual firm considerations influence the ability of the industry to
support cooperation in its lobbying efforts.
Two issues must be confronted before estimating the parameters in (10) reliably. First,
the inverse import penetration ratio iz is endogenous, since the size of the trade barriers in an
industry affects both the levels of imports and of domestic production. An equally important
issue is that the variable i
i
ez
includes some observations that are extreme outliers in industries
where imports are small relative to domestic output. The latter problem may have dogged the
estimation of the parameter a in previous studies, resulting in overstated estimates. Consider
equation (3) on which previous estimates of a were based. Using least squares to estimate the
coefficient on i
i
ez
gives undue influence to a small number of large influential values of the
inverse import penetration ratio zi, essentially nullifying the impact of most other observations
15
(that measure i
i
ez
moderately). It is easy to see that the strong influence of these few values in
the regression result in extremely small coefficient estimates which, when inverted, yield
unreasonably large values of a.
Instrumenting for the endogeneity of i
i
ez
, even using adequate instruments, may not solve
this problem if in the first stage, the few outlying values of i
i
ez
dominate the regression. Their
large predicted values will still result in small estimates on the coefficient in the second stage
which, when inverted, yield large estimates of a. We suggest two methods, both new to this
application, potentially capable of solving the twin problem of an endogenous regressor and
influential values.
The first is the use of an estimator that is well-suited to solving precisely this problem,
namely the two-stage least absolute deviations (2SLAD) estimator due to Amemiya (1982) and
Powell (1983). While similar to the two-stage least-squares (2SLS) estimator in that the
endogenous regressor is first instrumented and then used to estimate the structural parameters,
the 2SLAD estimator minimizes the sum of absolute deviations (it estimates a median
regression) rather than the sum of squared deviations. The 2SLAD estimator thus places equal
weights on each observation rather than weighting an outlier more heavily than other
observations, as least squares regression does. Our 2SLAD method instruments i
i
ez
using a
median regression in the first stage as well as the second stage to produce estimates of the
structural parameters φ and a.4 Those estimates are less sensitive to outliers than least squares
4 Quantile regressions have used more sophisticated estimators in dealing with the endogeneity problem. Chen and Portnoy (1996) developed an estimator similar to the 2SLAD estimator for quantiles. More recently, Chernozukov
16
methods: it is interesting that the estimates are similar in magnitude to the 2SLS estimates that
obtain after dropping outliers in the data set.
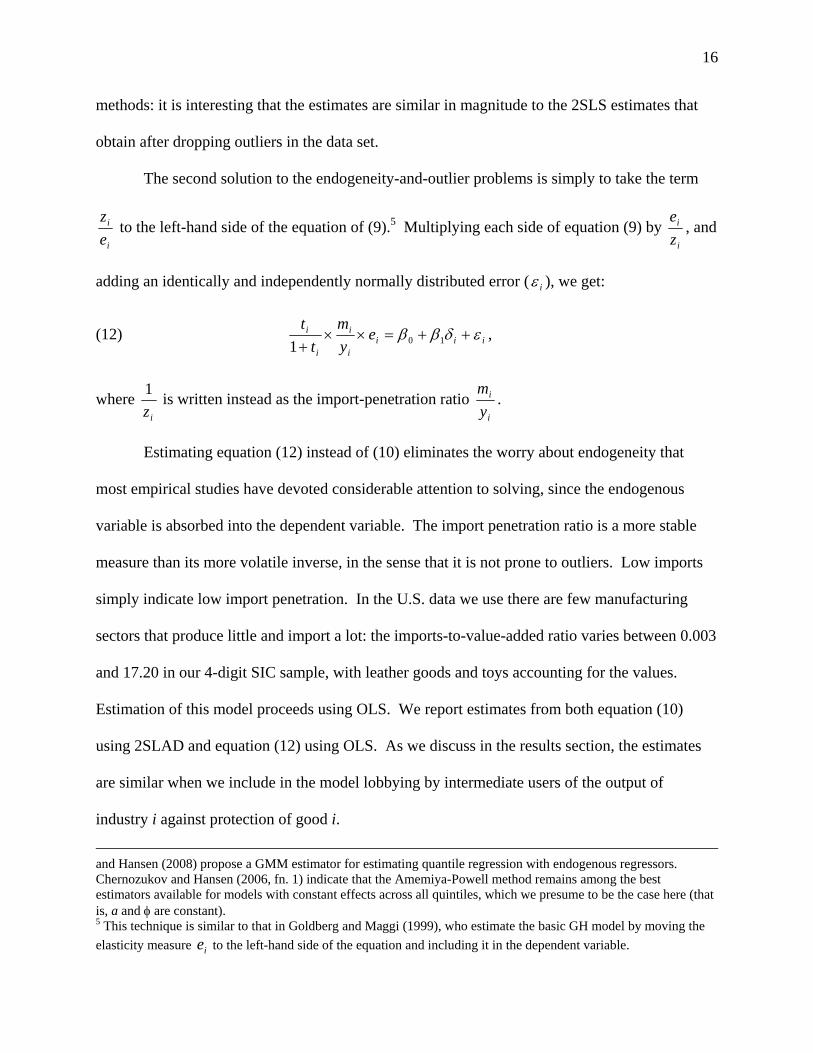
The second solution to the endogeneity-and-outlier problems is simply to take the term
i
i
ez
to the left-hand side of the equation of (9).5 Multiplying each side of equation (9) by i
i
ze
, and
adding an identically and independently normally distributed error ( iε ), we get:
(12) iiii
i
i
i eym
tt
εδββ ++=××+ 101
,
where iz
1 is written instead as the import-penetration ratio i
i
ym
.
Estimating equation (12) instead of (10) eliminates the worry about endogeneity that
most empirical studies have devoted considerable attention to solving, since the endogenous
variable is absorbed into the dependent variable. The import penetration ratio is a more stable
measure than its more volatile inverse, in the sense that it is not prone to outliers. Low imports
simply indicate low import penetration. In the U.S. data we use there are few manufacturing
sectors that produce little and import a lot: the imports-to-value-added ratio varies between 0.003
and 17.20 in our 4-digit SIC sample, with leather goods and toys accounting for the values.
Estimation of this model proceeds using OLS. We report estimates from both equation (10)
using 2SLAD and equation (12) using OLS. As we discuss in the results section, the estimates
are similar when we include in the model lobbying by intermediate users of the output of
industry i against protection of good i.
and Hansen (2008) propose a GMM estimator for estimating quantile regression with endogenous regressors. Chernozukov and Hansen (2006, fn. 1) indicate that the Amemiya-Powell method remains among the best estimators available for models with constant effects across all quintiles, which we presume to be the case here (that is, a and φ are constant). 5 This technique is similar to that in Goldberg and Maggi (1999), who estimate the basic GH model by moving the elasticity measure ie to the left-hand side of the equation and including it in the dependent variable.

17
Data
We have compiled our data from four sources. The source for the protection data is the
World Bank project on measuring trade restrictiveness (Kee, Nicita, Olarreaga 2004, 2007, 2008,
referred to as KNO), specifically the ad valorem equivalents of non-tariff measures (NTMs)
estimated by KNO. Raw NTM data for 1996 from UNCTAD’s TRAINS databases were used by
them to produce the ad valorem equivalent. Three measures of protection are available in the
KNO estimates: an ad valorem tariff measure consisting of applied rates taken directly from the
WTO and TRAINS databases; a coverage ratio measure of core NTMs; 6 and an ad valorem
equivalent of all NTMs. The ad valorem equivalent of NTMs is computed by the authors using
Leamer’s comparative advantage approach.7 The measures are available for the 1996 tariffs and
non-tariff barriers at the HS 6-digit level of over 4000 commodities. They were mapped into the
1987-basis 4-digit SIC level of industries using import-weighted averages.
The second source of data is the import demand elasticities estimated by Kee, Nicita, and
Olarreaga (2007) at the tariff line level using the GDP function approach.8 The standard errors
on the elasticity estimates are correlated with their size when the elasticity estimates themselves
are large. If the estimates were not corrected for measurement error, their use as regressors
6 Core NTMs include quantitative restrictions, price control measures, monopolistic measures and technical regulations corresponding to codes 6000, 8000, 7000 and 8100 in the UNCTAD TRAINS database, the source of the NTM indicators. This database contains detailed information on more than 30 different types of NTMs are identified. In the TRAINS classification, core NTBs include: price control measures (excluding antidumping), quantity restrictions, monopolistic measures and technical regulations. 7 Leamer’s (1990) method is as follows. First, imports are predicted using factor endowments. Then the impact of NTBs on imports is measured as deviations of imports, in the presence of NTMs, from these predicted values. Finally, this quantity impact of NTMs on imports is converted into a price equivalent (or AVE) by using the import demand elasticities estimated in Kee, Nicita and Olarreaga (2004). 8 Kohli (1991) describes the GDP function method in which imports are treated as inputs into domestic production, given exogenous world prices, productivity and endowments.
18
produces spurious results. We therefore treat the estimates as measured with error, but with
known measurement error variances (equal to the square of their standard error of estimate). A
Fuller correction is applied to the variable (Fuller (1986) and also implemented by Gawande and
Bandyopadhyay (2000)), which adjusts the elasticity estimates for (observed) measurement error.
Effectively, this correction takes the weighted average of the estimated elasticity and average
elasticity across the sample.9 The Fuller-adjusted elasticities are mapped into 4-digit SIC
industries using imports as weights. Data on 1996 imports are from Feenstra’s website. They
are aggregated down from HS 6-digits to the 1987 basis 4-digit SIC level.10
The third source of data is the Annual Survey of Manufacturing (ASM) from which we
assembled SIC 4-digit level data on industry output measured through both value added and the
value of shipments. We use value added as the measure of output for all of the regressions in
this paper but results are similar using the value of shipments. We consider only manufacturing
industries in our analysis. The ASM is also the source for the capital-labor ratio, which we use
to instrument the inverse import penetration ratio.
The fourth source of data is the Compustat database, which is used to compute the
proportion of sales in a SIC 4-digit industry accounted for by the largest firm in that industry.
Compustat is a firm-level database containing detailed financial data. The scope of coverage in
the data set is quite comprehensive. For example, in 1996, the Annual Survey of Manufactures
recorded $3.41 trillion in manufacturing sales. Compustat firms whose primary SIC code was in
9 The idea behind this correction is to limit the influence of estimates that are large and also have large standard errors. Without the correction, these large estimates would grossly overstate the true elasticity. The exact calculation is available from the authors. See Fuller (1986). 10 Care is taken to correctly map the many-to-one maps from SIC 4-digits to HS 6-digits using a uniform fractional mapping to preserve the adding up condition. The mapping is constructed from the concordance information in the Feenstra data. The many-to-one mapping from HS 6-digits to SIC 4-digits is a simple matter of aggregation.
19
manufacturing showed total sales of $3.25 trillion. While some of this may have been sales
outside of manufacturing (discussed below), the sales data indicate that Compustat firms account
for a large proportion of total sales. Most importantly, the largest firms in each industry, which
are our target, are in the Compustat database.
We focus only on firms whose primary SIC code is indicated to be in manufacturing.
Since multi-product firms sell into different industries, Compustat contains firm information
broken down by a number of business segments. From the business segments information, we
developed a concordance of the various SIC codes in which each firm operates as per Compustat.
This concordance is the basis for an equi-fractional one-firm-to-many-SIC-industries mapping
that preserves the adding-up condition. That is, if a firm operates in n SIC industries, each
industry is assigned 1/n of the firm’s sales. Firms whose primary SIC code in Compustat is
indicated to be in manufacturing collectively had total sales in 1996 of $3.7 trillion dollars
(before the mapping). After the fractional mapping, their total sales to manufacturing SIC
industries equaled 2.9 trillion dollars. Thus, 80% of the sales of manufacturing firms in
Compustat were within manufacturing while the remainder was mapped primarily into service
sectors. Notably, of the $2.9 trillion, 43% or $1.25 trillion was sold by the largest single firm in
each SIC group.
The regression analysis is carried out at the 4-digit SIC level. Output data from the ASM
and imports data from Schott (http://www.som.yale.edu/faculty/pks4/sub_international.htm) are
used to construct the output-to-import ratio z. Where imports were zero, z is missing. For some
industries, the Compustat data do not provide enough information to calculate the share of output
accounted for by the largest firm. In order to preserve these observations in the sample, we
impute missing values based on a regression of the largest firm share on the four-firm
20
concentration ratio. The theoretical model predicts that the tariff depends on the largest firm’s
share of output, so the four-firm concentration ratio is not appropriate to use directly in the
estimation but it is a good “instrument” for imputations since it is strongly correlated with the
one-firm concentration ratio. The results are largely unchanged when the observations with
imputed values are excluded. We drop export-oriented industries (those in which exports are
greater than imports) and we drop industries in which imports are less than 3% of domestic
output. These restrictions and the availability of z, the elasticity measures e, and the NTB
measures limit our sample to 315 four-digit SIC industries. These account for 76% of total
manufacturing shipments and over 95% of manufacturing imports in 1996.
5. Results
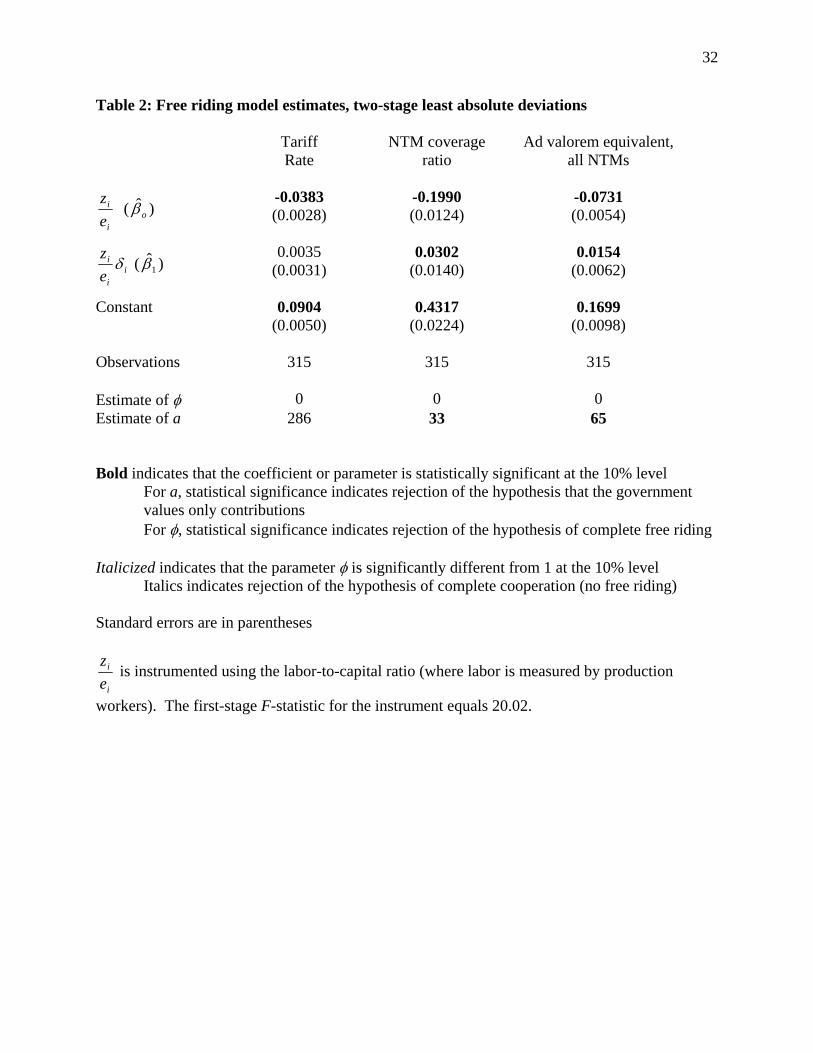
Table 2 presents two-stage least absolute deviations estimates of equation (10). The table
presents estimates for three different trade barrier measures (the ad valorem tariff, the core NTM
coverage ratio, and the ad valorem equivalent all NTMs), where value added is used as a
measure of domestic output (using value of shipments provides similar results). The inverse
capital-labor ratio is used to instrument the inverse import penetration ration. The capital-labor
ratio is an appropriate instrument according to endowments-based comparative advantage theory.
Theoretically, a negative relationship is expected between the (inverse) capital-labor ratio and
(inverse) import penetration since the U.S. is well endowed in capital relative to the rest of the
world, and has a comparative advantage in the production of capital-intensive goods. This is
what we find in the first-stage.11 Empirically, the instrument is exogenous since it is
technologically constant in the cross-section. Thus, a shock to the level of protection is
uncorrelated with the capital-labor ratio, even though it may be correlated with imports. Finally, 11 The first-stage results are available from the authors.

21
the instrument does not suffer from a weak-instrument problem. The oft-used diagnostic to test
for weak instruments, the first-stage F-statistics, is 20.02, which ensures that our instrument is
indeed empirically up to the task.
The ad valorem equivalent for all NTMs is perhaps the measure of trade barriers that is
most consistent with the theoretical model since it is set largely unilaterally rather than through
WTO/GATT trade negotiations and because it provides a measure of the effectiveness of the
trade barriers rather than indicating how many goods have some NTM applied to them as the
coverage ratio does. The last two rows in the table present the values of φ and a that are implied
by the estimates. Statistical significance of the structural parameter estimates is assessed by
means of F-tests on nonlinear test statistics, since a and φ are nonlinear functions of the
estimated coefficients 0β̂ and 1β̂ .
In all three columns of Table 2, the coefficient on the variable i
i
ez
is negative while the
coefficient on the variable ii
i
ez
δ is positive. The model presented in this paper implies that both
coefficients should be positive, so the estimates in Table 2 provide only mixed support for the
model since 0ˆ0 <β in each case, which suggests that the model has a corner solution. The result
that the coefficient on ii
i
ez
δ is positive in every regression and is statistically significant in two
of the three regressions provides support for the argument in this paper that industry lobbies
suffer from free riding. If industries had perfect cooperation in their lobbying efforts, the share
of output controlled by the largest firm in the industry would have no impact on the size of its
trade barrier. Table 2 shows, however, that industries dominated by one large firm are more

22
successful in pushing for protection, which is consistent with the contention that there is
imperfect cooperation between firms in lobbying.
In calculating the values of a and φ that are implied by the estimates, then, we set
00 =β , which means that 0=φ and 1
ˆ1β
=a . The corner solution with 0=φ is consistent with
complete free riding by firms in manufacturing industries so that firms lobby only to maximize
their own profits and are not organized politically in the sense that they cooperate in their
lobbying efforts. The estimates of the parameter a mean that the government places many times
greater weight on social welfare than on campaign contributions. While this result is consistent
with most previous estimates of the GH model, notice that the estimate of the parameter a in
column 2 is smaller than four of the five estimates from previous papers (summarized in Table 1)
using the 1983 NTM coverage ratio as the measure of protection.12
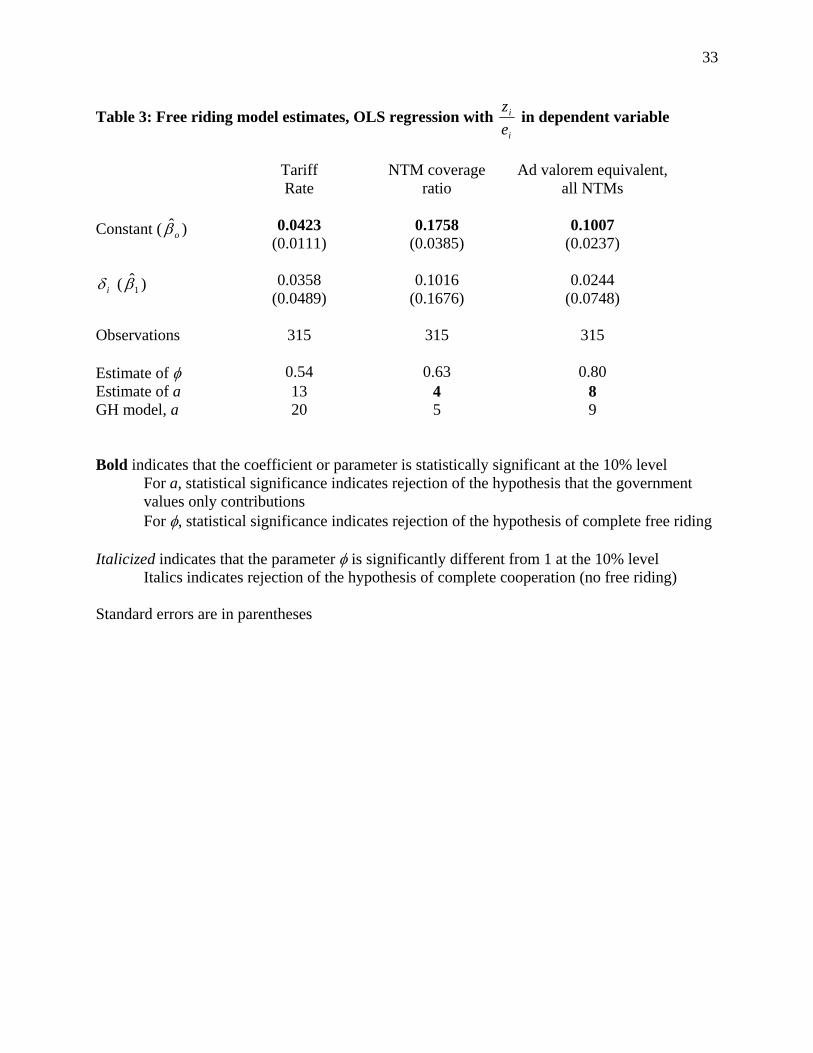
Table 3 presents ordinary least squares estimates of equation (12) in which the term i
i
ez
is
moved to the left-hand side of the equation and is included in the dependent variable. The
coefficient on the largest firm share is not significantly different from zero in any of these
regressions. In all of the regressions, however, both coefficients are greater than zero ( 0ˆ0 >β
and 0ˆ1 >β ), which is consistent with the model’s predictions and implies that 0>a and
10 << φ .
The values of φ that are implied by the coefficient estimates in Table 3 are quite
interesting and they suggest considerable free-riding by firms in most cases. The estimate of φ
12 The estimates of a are between 50% to 75% smaller when we include in the model lobbying by intermediate users of the output of industry i against protection of good i.

23
from the tariff regression is 0.54 so the industry’s contribution schedules on average are only
54% as generous as they would be if the firms could maintain perfect cooperation in their
lobbying efforts. The estimate of φ from the NTM coverage ratio and ad valorem equivalent
regressions are slightly higher (0.63 and 0.83, respectively). The standard errors on these
estimates are large enough, however, that they are not significantly different from either zero or
one at the 10% level.
The second-to-last row in the column presents the value of a (the weight the policy maker
places on social welfare relative to campaign contributions) that is implied by the estimates while
(for comparison) the final row shows the estimate of a that would emerge from the standard GH
model under the assumption that each industry is organized. The estimates show that the
estimation technique used in Table 3 (moving the term i
i
ez
into the dependent variable)
dramatically reduces the estimated weight the government places on social welfare. The
estimates suggest that the government values social welfare at between 5 and 20 times
contributions in the standard GH model. Allowing for the possibility of free riding lowers the
estimated weight on social welfare to between 4 and 13. These estimates of a are much smaller
than those in the traditional literature estimating the GH model, and they reflect both the fact that
this paper uses an updated trade barrier data set and the different estimation technique employed
in Table 3.13 Thus, unlike the conclusions from the existing literature, the estimates here indicate
that politicians are willing to impose some moderate welfare losses on society in exchange for
campaign money from special interest groups. That result seems more consistent with the many
instances in which governments adopt policies such as the sugar quota that create welfare losses
13 The estimates of a are half that size when intermediate-users lobbying is included in the model. These and other estimates from the lobbying-by-intermediates-users model are available from the authors.
24
many times greater than the contributions received from interest groups benefiting from the
policy.
One of the motivations of this paper was to investigate whether introducing free-riding
into the Grossman-Helpman model could resolve the conflict between the strong belief that
politicians are not social welfare-maximizers and the incredulously high estimates of the weight
placed by policy makers on social welfare in the GH model. A comparison of the estimates of a
from the free riding model with estimates from the standard GH model suggests that a more
complete model of lobbying that includes free-riding by firms may provide an answer to this
puzzle. On average in the three regressions in Table 3, allowing for the possibility of free riding
reduces the estimated value of a by 26%. This result is intuitive since free-riding can explain
why we might observe a low level of trade barriers even if the government places a small weight
on social welfare.
Table 4 presents estimates of equation (12) in which 20 SIC industry dummy variables
are included, which allows the extent of free riding to differ across 2-digit SIC industries. As the
theoretical model predicts, the coefficient on iδ , the largest firm share of industry output, is
positive in all regressions and statistically significant in two of the three.
In addition to the coefficient estimates, we present the values of a and iφ that are implied
by the coefficients in each industry. In the tariff regression, 13 of the 20 coefficient estimates on
the SIC dummy variables are negative but not significantly different from zero. One coefficient
estimate is negative and statistically significant. For these 14 industries, there is a corner
solution in which 0=iφ (no cooperation between the firms in the lobby). Six industries have
positive coefficients (three of them significantly different from zero) indicating there is some but
not perfect cooperation between firms. In the NTM coverage ratio regression there are seven
25
industries with positive coefficients the dummy variables (two of them significant) and in the ad
valorem equivalent of NTMs regression there are ten industries with positive coefficients (three
of them significant).
The industries with the most consistent evidence of significant cooperation between firms
are apparel (SIC 23) and leather (SIC 31). For apparel, the estimated values of φ are
significantly different from both zero and one in all three regressions, which means we can reject
both the hypothesis of perfect cooperation ( 1=φ ) and of perfect free riding by firms ( 0=φ ).
The point estimates ( 67.023 =φ to 75.023 =φ ) suggest that lobby cooperation by apparel firms is
quite strong. Cooperation by leather firms is estimated to be between 54.031 =φ and 85.031 =φ ,
with all three estimates of cooperation being significantly different from zero. The textiles
industry has estimated levels of cooperation between firms that range from 06.022 =φ to
28.022 =φ . We can reject the hypothesis of perfect cooperation between textiles firms ( 1=φ )
but we can not reject the hypothesis of complete free riding ( 0=φ ).
The estimates in Table 4 suggest that each industry has a different estimated value of a
(the weight placed on social welfare in the industry relative to contributions). If a dollar of
contributions is equally valuable to politicians regardless of its source, then this result implies
that the government cares more about the welfare in some sectors than in others. Disparities in
geographic concentration across industries might explain why the government would value a
dollar of social welfare in one industry more highly than in another. It is also possible that the
government uses trade policy in part to even out the distribution of income, which would mean
that gains in producer surplus for low-wage industries (such as apparel) are more valuable than
equivalent gains in higher-wage industries.
26
6. Conclusion
This paper develops a model incorporating a simple free-rider effect into the Grossman
and Helpman (1994) Protection for Sale framework and we show that estimating the model
empirically requires including a variable measuring the largest firm’s share of industry output.
The paper builds on the work by Bombardini (2008) by introducing a continuous measure of an
industry’s political organization, by using a new data set that has never been used before in this
application, and by introducing new econometric techniques to deal with the combined problems
of outliers and endogenous regressors.
Two-stage least absolute deviations estimates of equation (10) provide some empirical
support for the model’s predictions. The coefficient estimate on ii
i
ez
δ is positive and statistically
significant in two of three regressions, which suggests that the share of output accounted for by
the largest firm in the industry affects the trade barrier. This result is consistent with the
predictions of the free riding model. We note that in this model we obtain negative coefficients
on the variable i
i
ez
, which we presume to indicate a corner solution with complete free riding
(that is, 0=φ ).
Using model (12), which incorporates i
i
ez
into the dependent variable, yields estimates
that are consistent with the model. These estimates suggest that there is some modest
cooperation between firms but that they remain far from the perfect level of cooperation assumed
by the GH model for organized industries. When we allow the extent of free riding to differ
across industries, the estimates suggest that the apparel and leather industries have the strongest
27
level of cooperation between firms in their lobbying efforts, with contributions reaching 67-75%
of their fully cooperative levels for apparel and 54-85% of cooperative levels for leather.
Free riding presents a possible solution to the puzzling result consistently found in the
empirical literature estimating the Grossman and Helpman (1994) model that politicians value a
dollar in social welfare many hundreds of times more than they value a dollar of campaign
contributions. With free riding, the industry contribution schedules are less generous than they
would be under perfect cooperation, which leads to relatively low levels of trade protection in
many industries even when policy makers value both contributions and social welfare. The
results show that including free-riding into the model reduces the estimated weight on social
welfare in the policy maker utility function vis-à-vis the traditional Grossman-Helpman model.
Thus, the free-rider problem, which prevents industries from contributing what they would if
they were perfectly organized, can help explain why many advanced countries have low trade
barriers despite having politicians who are less than saints.
28
References
Amemiya, Takeshi 1982, “Two Stage Least Absolute Deviations Estimators,” Econometrica, 50,
689 – 711.
Ansolabehere, Stephen, John de Figueiredo, and James Snyder, 2003, “Why is there so little
money in U.S. politics?” Journal of Economic Perspectives 17 (1), 105 – 130.
Bombardini, Matilde, 2008, “Firm Heterogeneity and Lobby Participation,” Journal of
International Economics 75 (2), 329 – 378.
Chen, L., and S. Portnoy, 1996, “Two-stage regression quantiles and two-stage trimmed least
squares estimators for structural equation models,” Communications in Statistics. Theory
Methods, 25 (5), 1005–1032.
Chernozhukov Victor, and Christian Hansen, 2008, “Instrumental variable quantile regression: A
robust inference approach” Journal of Econometrics, 142 (1), 379-398.
Chernozhukov Victor, and Christian Hansen, 2006, “Instrumental quantile regression inference
for structural and treatment effect models,” Journal of Econometrics, 132(2), 2006, 491-
525.
Eicher, Theo, and Thomas Osang, 2002, “Protection for Sale: An Empirical Investigation:
Comment,” American Economic Review 92 (5), 1702 – 1710.
Facchini, Giovanni, Johannes Van Biesebroeck, and Gerald Willmann, 2006, “Protection for
Sale with Imperfect Rent Capturing,” Canadian Journal of Economics 39 (3), 845 – 873.
Fuller, Wayne. 1986. Measurement Error Models. New York: Wiley.
Gawande, Kishore, and Bernard Hoekman, 2006, “Lobbying and Agricultural Trade Policy in
the United States,” International Organization 60 (3), 527 – 561.
29
Gawande, Kishore, and Pravin Krishna, 2003, “The Political Economy of Trade Policy:
Empirical Approaches,” in James Harrigan and E. Kwan Choi, eds., Handbook of
International Trade (Blackwell Pub.: Malden, MA) 213 – 250.
Gawande, Kishore, and Pravin Krishna, 2005, “Lobbying Competition over US Trade Policy,”
NBER Working Paper 11371.
Gawande, Kishore, and Usree Bandyopdhyay, 2000, “Is Protection for Sale? A test of the
Grossman-Helpman theory of endogenous protection,” Review of Economics and
Statistics 82, 139 – 152.
Gawande, Kishore, Pravin Krishna, and Marcelo Olarreaga, 2008, “What Governments Maximize and
Why: The View from Trade.” International Organization, forthcoming.
Goldberg, Penelope, and Giovanni Maggi, 1999, “Protection for Sale: An Empirical
Investigation, American Economic Review 89, 1135 – 1155.
Grossman, Gene and Elhanan Helpman, “Protection for Sale,” American Economic Review 84 (1994):
833 – 850.
Imai, Susumu, Hajime Katayama, and Kala Krishna, 2007, “A Quantile-based Test of Protection
for Sale Model,” mimeo.
Kee, Hiau Looi, Alessandro Nicita and Marcelo Olarreaga. “Import demand elasticities and trade
distortions,” Review of Economics and Statistics, forthcoming 2008.
Kee, Hiau Looi, Alessandro Nicita and Marcelo Olarreaga. “Estimating trade restrictiveness
indices.” Economic Journal, forthcoming 2008.
Kee, Hiau Looi, Alessandro Nicita and Marcelo Olarreaga. 2004. “Ad-Valorem Equivalents of
Non-Tariff Barriers,” mimeo, The World Bank, Washington DC.
Kohli, Ulrich. 1991. Technology, duality and foreign trade: the GNP function approach to
modeling imports and exports. Ann Arbor: The University of Michigan Press.
30
Leamer, Edward, “The Structure and Effects of Tariff and Nontariff Barriers in 1983,” in The
Political Economy of International Trade: Essays in Honor of Robert E. Baldwin
(Cambridge, MA: Blackwell Publishing) 224 – 260.
Magee, Christopher, 2002, “Endogenous Trade Policy and Lobby Formation: An Application to the Free-
Rider Problem” Journal of International Economics, 57 (2): 449 – 471.
Magee, Stephen, William Brock, and Leslie Young, 1989, Black Hole Tariffs and Endogenous
Policy Theory: Political Economy in General Equilibrium. Cambridge, MA: Cambridge
University Press.
McCalman, Philip, 2004, “Protection for Sale and Trade Liberalization: An Empirical
Investigation,” Review of International Economics 12, 81 – 94.
Mitra, Devashish, 1999, “Endogenous Lobby Formation and Endogenous Protection: A Long
Run Model of Trade Policy Determination,” American Economic Review 89, 1116 –
1134.
Mitra, Devashish, Dimitrios Thomakos, and Mehmet Ulubasoglu, 2002, “‘Protection for Sale’ in
a Developing Country: Democracy vs. Dictatorship,” Review of Economics and Statistics
84 (3), 497 – 508.
Mitra, Devashish, Dimitrios Thomakos, and Mehmet Ulubasoglu, 2006, “Can we obtain realistic
parameter estimates for the ‘protection for sale’ model?” Canadian Journal of Economics
39 (1), 187 – 210.
Olson, Mancur, 1965, The Logic of Collective Action (Harvard University Press: Cambridge,
MA).
Powell, James L., 1983. “The asymptotic normality of two-stage least absolute deviations
estimators.” Econometrica 51 (5), 1569–1575.
Tullock, Gordon, 1972, “The Purchase of Politicians,” Western Economic Journal 10, 354 – 55.
31
Table 1: Previous estimates of the Grossman and Helpman (1994) model
Article Trade barrier data Estimates of a Estimates of Lα Goldberg and Maggi (1999)
1983 US NTM coverage ratio 52 – 70 0.84 – 0.88
Gawande and Bandyopadhyay (2000)
1983 US NTM coverage ratio 3175 0.95*
Eicher and Osang (2002) 1983 US NTM coverage ratio 24 0.26
Mitra, Thomakos, and Ulubasoglu (2002)
1983-90 tariff rates for Turkey 80 – 97 0.61 – 0.91
McCalman (2004) 1968-69 and 1991-92 Australian ad valorem tariff rates
41 – 43 0.88 – 0.96
Gawande and Krishna (2005)
1983 US NTM coverage ratio 125 – 515 0.90 – 0.99
Gawande and Hoekman (2006)
1999 US Core NTM and export subsidy in agricultural industries
48 – 63 0 (by assumption)
Facchinia, Van Biesebroeck, and Willmann (2006)
1983 US NTM coverage ratio 82 0.34
* Includes both final and intermediate goods lobbies
32
Table 2: Free riding model estimates, two-stage least absolute deviations Tariff
Rate
NTM coverage ratio
Ad valorem equivalent, all NTMs
i
i
ez
( oβ̂ ) -0.0383 (0.0028)
-0.1990 (0.0124)
-0.0731 (0.0054)
ii
i
ez
δ ( 1β̂ ) 0.0035
(0.0031)
0.0302 (0.0140)
0.0154 (0.0062)
Constant 0.0904 (0.0050)
0.4317 (0.0224)
0.1699 (0.0098)
Observations 315 315 315 Estimate of φ 0 0 0 Estimate of a 286 33 65 Bold indicates that the coefficient or parameter is statistically significant at the 10% level
For a, statistical significance indicates rejection of the hypothesis that the government values only contributions For φ, statistical significance indicates rejection of the hypothesis of complete free riding
Italicized indicates that the parameter φ is significantly different from 1 at the 10% level Italics indicates rejection of the hypothesis of complete cooperation (no free riding)
Standard errors are in parentheses
i
i
ez
is instrumented using the labor-to-capital ratio (where labor is measured by production
workers). The first-stage F-statistic for the instrument equals 20.02.
33
Table 3: Free riding model estimates, OLS regression with i
i
ez
in dependent variable
Tariff
Rate NTM coverage
ratio Ad valorem equivalent,
all NTMs
Constant ( oβ̂ ) 0.0423 (0.0111)
0.1758 (0.0385)
0.1007 (0.0237)
iδ ( 1β̂ ) 0.0358 (0.0489)
0.1016 (0.1676)
0.0244 (0.0748)
Observations 315 315 315 Estimate of φ 0.54 0.63 0.80 Estimate of a 13 4 8 GH model, a 20 5 9 Bold indicates that the coefficient or parameter is statistically significant at the 10% level
For a, statistical significance indicates rejection of the hypothesis that the government values only contributions For φ, statistical significance indicates rejection of the hypothesis of complete free riding
Italicized indicates that the parameter φ is significantly different from 1 at the 10% level Italics indicates rejection of the hypothesis of complete cooperation (no free riding)
Standard errors are in parentheses

34
Table 4: Free riding estimates by industry, OLS regression with i
i
ez
in dependent variable
Tariff NTM coverage Ad valorem equivalent,
all NTMs Coefficient a φ Coefficient a φ Coefficient a φ Firm share* z/e 0.0465 0.2068 0.0650 Z/e * SIC 20 -0.0008 22 0 -0.0032 5 0 0.0146 13 0.18Z/e * SIC 21 -0.0100 22 0 -0.0790 5 0 -0.0171 15 0 Z/e * SIC 22 0.0105 18 0.18 0.0122 5 0.06 0.0247 11 0.28Z/e * SIC 23 0.0946 7 0.67 0.4314 2 0.68 0.1912 4 0.75Z/e * SIC 24 -0.0034 22 0 0.0707 4 0.25 0.0251 11 0.28Z/e * SIC 25 -0.0033 22 0 -0.0289 5 0 -0.0059 15 0 Z/e * SIC 26 -0.0094 22 0 -0.0450 5 0 -0.0134 15 0 Z/e * SIC 27 -0.0025 22 0 -0.0121 5 0 -0.0036 15 0 Z/e * SIC 28 -0.0142 22 0 -0.0489 5 0 -0.0090 15 0 Z/e * SIC 29 -0.0110 22 0 -0.0496 5 0 -0.0155 15 0 Z/e * SIC 30 0.0995 7 0.68 -0.0344 5 0 0.0971 6 0.60Z/e * SIC 31 0.2111 4 .82 0.2389 2 0.54 0.3553 2 0.85Z/e * SIC 32 -0.0003 22 0 -0.0499 5 0 -0.0048 15 0 Z/e * SIC 33 0.0003 21 0.01 -0.0264 5 0 -0.0020 15 0 Z/e * SIC 34 -0.0024 22 0 -0.0136 5 0 -0.0014 15 0 Z/e * SIC 35 -0.0073 22 0 -0.0328 5 0 -0.0074 15 0 Z/e * SIC 36 -0.0037 22 0 0.0229 4 0.10 0.0172 12 0.21Z/e * SIC 37 -0.0052 22 0 0.0467 4 0.18 0.0332 10 0.34Z/e * SIC 38 -0.0103 22 0 -0.0264 5 0 0.0054 14 0.08Z/e * SIC 39 0.0130 17 0.22 0.4785 1 0.70 0.0718 7 0.52 Observations 315 315 315 Psuedo-R2 0.3811 0.1881 0.3304 Bold indicates that the coefficient or parameter is statistically significant at the 10% level
For a, statistical significance indicates rejection of the hypothesis that the government values only contributions For φ, statistical significance indicates rejection of the hypothesis of complete free riding
Italicized indicates that the parameter φ is significantly different from 1 at the 10% level Italics indicates rejection of the hypothesis of complete cooperation (no free riding)
35
Figure 1: Equilibrium cooperative and noncooperative contributions and tariffs
Contributions
Tariff
CScoop
CSnon-coop Ccoop
Cnon-c
tWa∂
∂−
tcoop tnon-c
Related Documents