Margin improvement / portfolio management / capital structure François Roger: Chief Financial Officer | September 26, 2017 | Investor Seminar 1

Welcome message from author
This document is posted to help you gain knowledge. Please leave a comment to let me know what you think about it! Share it to your friends and learn new things together.
Transcript

Margin improvement / portfolio management / capital structureFrançois Roger: Chief Financial Officer
| September 26, 2017 | Investor Seminar1

Disclaimer
This presentation contains forward looking statements which reflect
management’s current views and estimates. The forward looking
statements involve certain risks and uncertainties that could cause
actual results to differ materially from those contained in the forward
looking statements. Potential risks and uncertainties include such
factors as general economic conditions, foreign exchange fluctuations,
competitive product and pricing pressures and regulatory developments.
| September 26, 2017 | Nestlé Investor Seminar 20172

• Margin improvement
• Portfolio management
• Capital structure
• Working capital / ROIC / disclosure
| September 26, 2017 | Nestlé Investor Seminar 20173
Agenda

• Margin improvement
• Portfolio management
• Capital structure
• Working capital / ROIC / disclosure
| September 26, 2017 | Nestlé Investor Seminar 20174
Agenda

Margin improvement / bottom line focus at a time of lower organic growth
| September 26, 2017 | Nestlé Investor Seminar 20175
Targeted underlying trading operating profit (TOP) margin improvement by 2020
2016 2020
+150 bpsto
+ 250 bps
16%
17.5%to
18.5%

| September 26, 2017 | Nestlé Investor Seminar 20176
Main focus of cost reduction: structural costs
1. Manufacturing
2. Procurement
3. General & Administrative (G&A)
Structural costs: circa 20% of sales
| September 26, 2017 | Nestlé Investor Seminar 20177
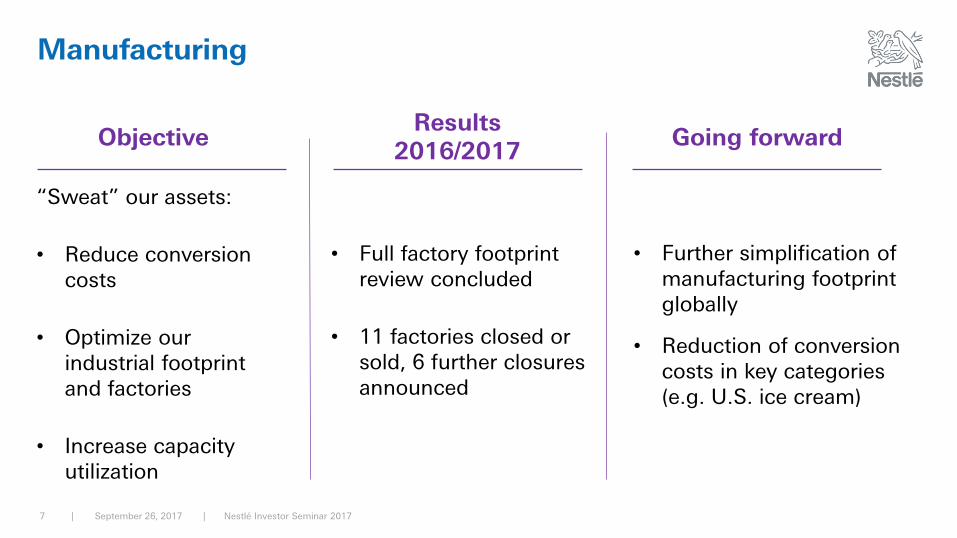
“Sweat” our assets:
• Reduce conversion costs
• Optimize our industrial footprint and factories
• Increase capacityutilization
Manufacturing
• Full factory footprint review concluded
• 11 factories closed or sold, 6 further closures announced
• Further simplification of manufacturing footprintglobally
• Reduction of conversion costs in key categories(e.g. U.S. ice cream)
Results 2016/2017
Objective Going forward

| September 26, 2017 | Nestlé Investor Seminar 20178
Procurement
• Increase global buying from 40% to 60% of total
• Optimize purchasing back-office
• CHF 500-600 m incremental savings by 2020 compared to 2016
• Global hubs in Switzerland, Malaysia and Panama fully operational
• Incremental savings of CHF 160 million in 2017
• CHF 100 million reduction in working capital
Results 2016/2017
Objective Going forward

| September 26, 2017 | Nestlé Investor Seminar 20179
G&A: Nestlé Business Excellence
• Increase shared services penetration to 50%
• Complete redesign of new processes and technologies for all six end-to-end flows
• E-invoices increase >70%
• Online purchasing tool spend coverage increase >10x to CHF 15 billion
• Shared services penetration to 17% (vs. 13% in 2015)
• Processes and technologies redesigned for four out of six end-to-end flows
• E-invoices up 10% to 50%
• Online purchasing tool coverage of CHF 1.3 billion with 50% automated orders
BusinessExcellence
FUEL FOR GROWTH
SIMPLIFY . STANDARDIZE . SHARE
Results 2016/2017
Objective Going forward

| September 26, 2017 | Nestlé Investor Seminar 201710
G&A: Optimize real estate, simplify structures, pension management
• Consolidate Vevey area sites
• Consolidate 7 Paris sites to 1• Office consolidation, most
significantly of Nestlé U.S. HQ and Group HQ
Results 2016/2017
Objective Going forward
• Optimize real estate assets
• De-layering, e.g. in Mexico and Brazil, Skin Health restructured
• Exited internal pension asset management, saving CHF 25 million in 2017
• Simplify local structures to reduce costs
• Reduce pension management costs
• Further simplify structures in the markets
• Leverage above-market centers of competence
• 2018 incremental savings of CHF 120 million over 2016

| September 26, 2017 | Nestlé Investor Seminar 201711
Significant value drivers to support margin improvement
Initiatives Savings 2020*
1. Manufacturing 0.6 – 0.8
2. Procurement 0.5 – 0.6
3. G&A 0.9 – 1.1
Permanent savings 2.0 – 2.5
In CHF billion
* Savings versus 2016

| September 26, 2017 | Nestlé Investor Seminar 201712
Restructuring costs
Around CHF 2.5 billion estimated restructuring costs from 2016 to 2020

| September 26, 2017 | Nestlé Investor Seminar 201713
Governance on savings program
• Aligned with short-term incentives
• Full board and management commitment
• Well-defined ownership of projects
• Full tracking and monitoring
• Permanent search for new initiatives

| September 26, 2017 | Nestlé Investor Seminar 201714
Target: from savings to margin
• Underlying trading operating profit margin (TOP) to increase by 150-250 bps* from 2016 to 2020
• NCE savings to continue, but largely re-invested for growth
• Structural cost savings to be the main driver of margin development
* Base: 2016 underlying TOP of 16%

| September 26, 2017 | Nestlé Investor Seminar 201715
Agenda
• Margin improvement
• Portfolio management
• Capital structure
• Working capital / ROIC / disclosure

| September 26, 2017 | Nestlé Investor Seminar 201716
Strong portfolio with profitable growth platforms and leading positions
Ability to win
Mark
et
att
racti
ven
ess
Sales 2016
Scope: Group excluding US confectionery and divested businesses Source: ATLAS
High
HighLow

| September 26, 2017 | Nestlé Investor Seminar 201717
Very consistent growth within the portfolio
Total Milk products
& ice cream
Confectionery Nutrition and Health
Science
Prepared dishes and
cooking aids
Powdered and liquid beverages
Water Petcare
3.2
1.61.8 2.0
2.7
4.65.0
5.3
FY 2016 organic growth (OG) %

| September 26, 2017 | Nestlé Investor Seminar 201718
Two dimensions to portfolio management
Internal External
• Allocate resources
• CAPEX
• Marketing spend
• HR
• R&D
• Technology
• Acquire
• Combine
• Dispose
• Access to innovation

Marketingspend vs. LY
| September 26, 2017 | Nestlé Investor Seminar 201719
With flexibility to apply different strategies
Category Sales
Results
Market over/under
performanceOG
CHF million) (CHF million)
Harvest 6’340 -127 1.5% -1.0% +540 bps
Source: Nestlé ATLAS
FY 2016
Margin vs. LY

| September 26, 2017 | Nestlé Investor Seminar 201720
Acquire: organic and natural petcare
Business performance:
• Sizable market and strong growth rates (2014-16):
• Market size: CHF 8.6 billion
• CAGR: 15%
• Complementary to existing portfolio
• Attractive channel mix

| September 26, 2017 | Nestlé Investor Seminar 201721
Combine: ice cream JV with Froneri
• Successful go-live in Q4 2016
• Strong business performance in H1 2017:
• Double-digit growth
• Profit ahead of budget
• Market share +200 bps
| September 26, 2017 | Nestlé Investor Seminar 201722
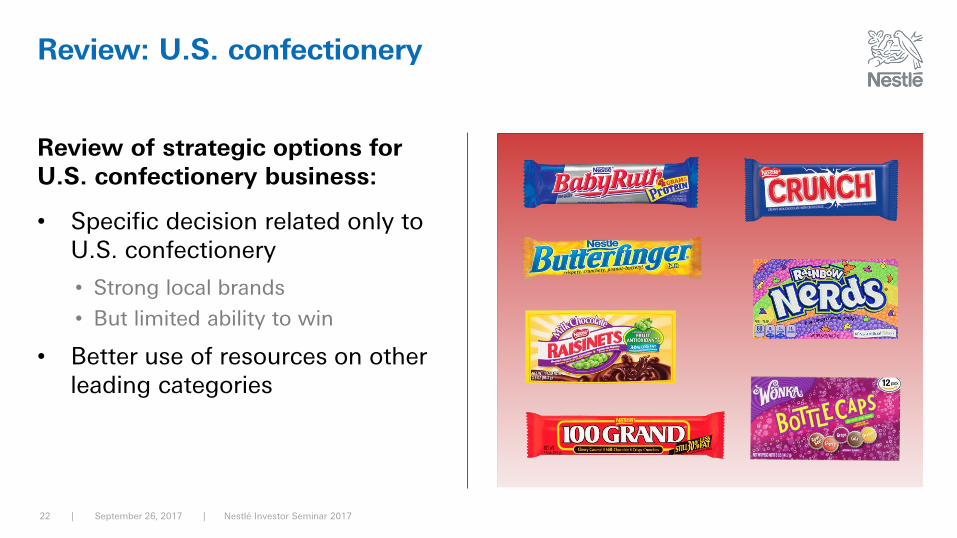
Review: U.S. confectionery
Review of strategic options for U.S. confectionery business:
• Specific decision related only to U.S. confectionery
• Strong local brands
• But limited ability to win
• Better use of resources on other leading categories

| September 26, 2017 | Nestlé Investor Seminar 201723
Portfolio management to access external innovation
Universities and public research
Start-ups and biotechs
Innovation partnerships
Complement internal competencies with external innovations, technologies and science

| September 26, 2017 | Nestlé Investor Seminar 201724
Innovation fund: direct and indirect investment
• Investment focus on
• New food and beverage business models
• Nutrition science and food technology
• Digital technologies
• Investment channels
• Direct investment in innovative companies (e.g. Freshly)
• Investment alongside focused external venture capital funds

| September 26, 2017 | Nestlé Investor Seminar 201725
Minority Stake: Freshly
High growth, direct-to-consumer (DTC), healthy, prepared meals
• Access to new business model:
• DTC
• Technology-enabled
• Real-time consumer feedback
• Minority stake with board seat
• Access to food and manufacturing knowledge:
• R&D
• Nutrition
• Sourcing
• Expand and rapidly scale reach

| September 26, 2017 | Nestlé Investor Seminar 201726
Acquisition: Sweet Earth
• Manufacturer of plant-based and vegan foods
• Growth in excess of 40% in 2017
• Complementary to Nestlé frozen portfolio
• Millennial trends
• Modern health for all meal occasions
• Strong consumer feedback on taste, quality, nutritional benefits and convenience
Access to US plant-based food segment market worth USD 5 billion

• Margin improvement
• Portfolio management
• Capital structure
• Working capital / ROIC / disclosure
| September 26, 2017 | Nestlé Investor Seminar 201727
Agenda

| September 26, 2017 | Nestlé Investor Seminar 201728
Factors taken into consideration
• Cost of debt
• Access to capital markets
• Flexibility for external growth
• Dividend practice
• Cash flow generation
• Sales growth
• Margin improvement
• Working capital
• EPS growth expectations / competitive shareholder returns

| September 26, 2017 | Nestlé Investor Seminar 201729
Outcome of capital structure review
• Leverage our balance sheet
• Keep flexibility for external growth
• Comfortable with A rating
Up to CHF 20 bn approved for share buyback
Share buyback to be spread evenly over three years untilJune 2020
Buyback will be adapted in event of large M&A

• Margin improvement
• Portfolio management
• Capital structure
• Working capital / ROIC / disclosure
| September 26, 2017 | Nestlé Investor Seminar 201730
Agenda

| September 26, 2017 | Nestlé Investor Seminar 201731
Further working capital improvement identified
8.5%
6.5%
5.3%4.7%
2.8%
2012* 2013 2014 2015 2016
Five quarter average working capital as a % of sales
*: Sales restated

| September 26, 2017 | Nestlé Investor Seminar 201732
ROIC development
29.7%
12.7%
10.8% 10.9% 11.2%
30.1% 30.4% 29.9%
31.7%
13.9%
ROIC before goodwill and intangibles
2012* 2013 2014 2015 2016
ROIC after goodwill and intangibles
*: Sales restated

| September 26, 2017 | Nestlé Investor Seminar 201733
Amendments to external reporting as of 2018
• Underlying TOP margin target provided (i.e. before restructuring costs)
• Alignment between underlying EPS and underlying TOP
• Retain full TOP transparency

| September 26, 2017 | Nestlé Investor Seminar 201734
Summary
Improve
Margins
and Returns
• CHF 2.0-2.5 billion incremental structural cost savings by 2020 over 2016
• Targeting 150 to 250 bps of margin improvement by 2020
• Supporting EPS and ROIC growth
Cash Flow • Further working capital reduction
Capital
Structure
• Leverage our balance sheet
• Up to CHF 20 billion share buyback, spread evenly until June 2020
Portfolio
Management
• Clear action and execution plans to drive growth and returns
• Open innovation and direct/indirect investment in fast growing assets
Disclosure • Move to underlying TOP with direct reconciliation to underlying EPS

| September 26, 2017 | Nestlé Investor Seminar 201735
Thank you!
Related Documents