© OECD/IEA 2014 Renewables and climate change mitigation Cédric Philibert On behalf of Paolo Frankl, Head, Renewable Energy Division International Energy Agency Our Common Future under Climate Change – Paris – 9 July 2015

Welcome message from author
This document is posted to help you gain knowledge. Please leave a comment to let me know what you think about it! Share it to your friends and learn new things together.
Transcript
© OECD/IEA 2014
Renewables and climate change mitigation
Cédric Philibert
On behalf of Paolo Frankl,
Head, Renewable Energy Division International Energy Agency
Our Common Future under Climate Change – Paris – 9 July 2015
© OECD/IEA 2015
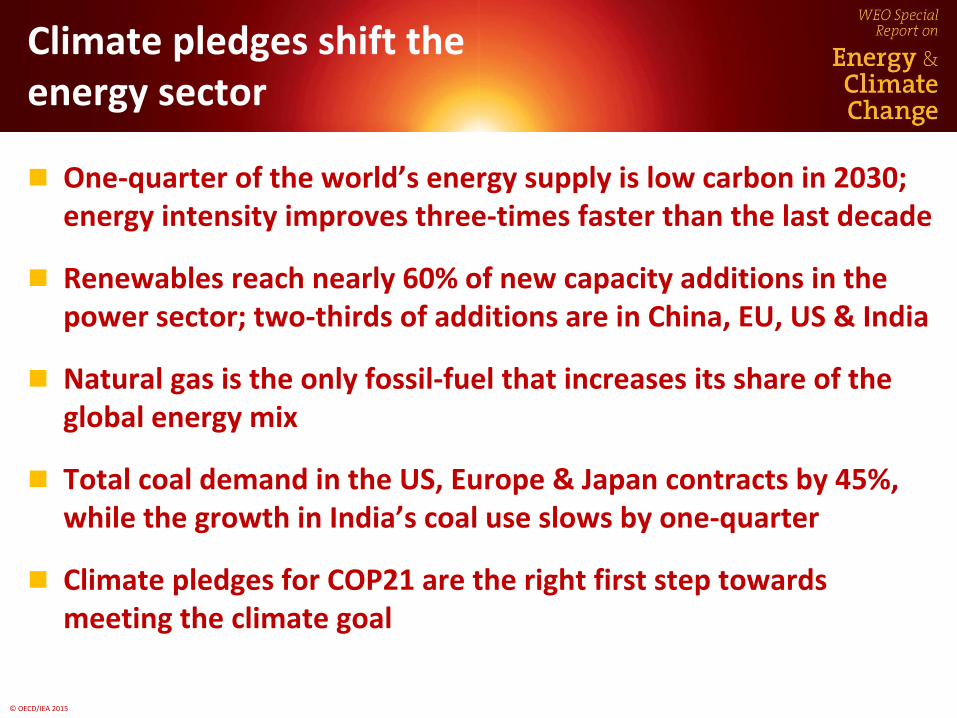
Climate pledges shift the energy sector
One-quarter of the world’s energy supply is low carbon in 2030; energy intensity improves three-times faster than the last decade
Renewables reach nearly 60% of new capacity additions in the power sector; two-thirds of additions are in China, EU, US & India
Natural gas is the only fossil-fuel that increases its share of the global energy mix
Total coal demand in the US, Europe & Japan contracts by 45%, while the growth in India’s coal use slows by one-quarter
Climate pledges for COP21 are the right first step towards meeting the climate goal
© OECD/IEA 2015
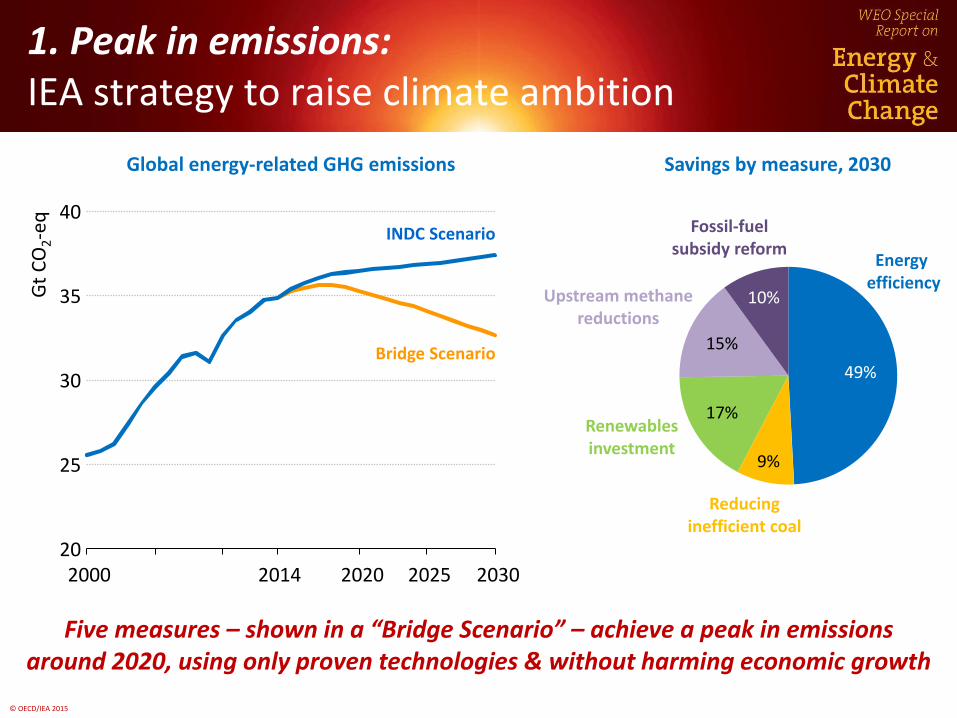
1. Peak in emissions: IEA strategy to raise climate ambition
Global energy-related GHG emissions
Five measures – shown in a “Bridge Scenario” – achieve a peak in emissions around 2020, using only proven technologies & without harming economic growth
20
25
30
35
40
2000 2014 2020 2025 2030
Gt
CO
2-e
q
Bridge Scenario
INDC Scenario
Energy efficiency
49%
Reducing inefficient coal
Renewables investment
Upstream methane reductions
Fossil-fuel subsidy reform
17%
15%
10%
Savings by measure, 2030
9%
© OECD/IEA 2013
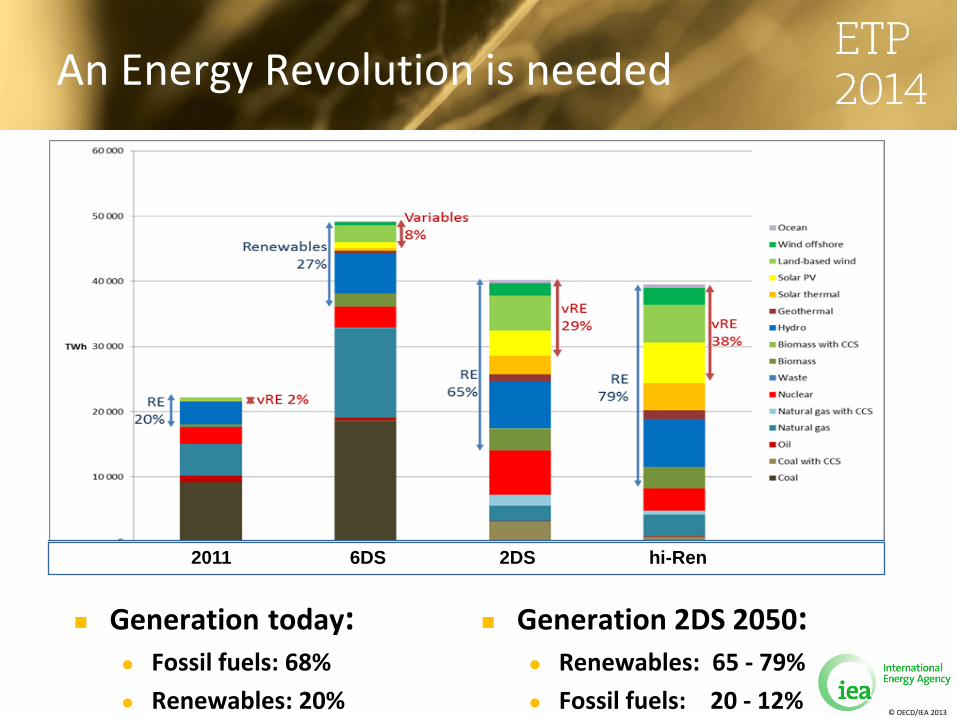
An Energy Revolution is needed
2011 6DS 2DS hi-Ren
Generation today: Fossil fuels: 68%
Renewables: 20%
Generation 2DS 2050: Renewables: 65 - 79%
Fossil fuels: 20 - 12%
© OECD/IEA 2013
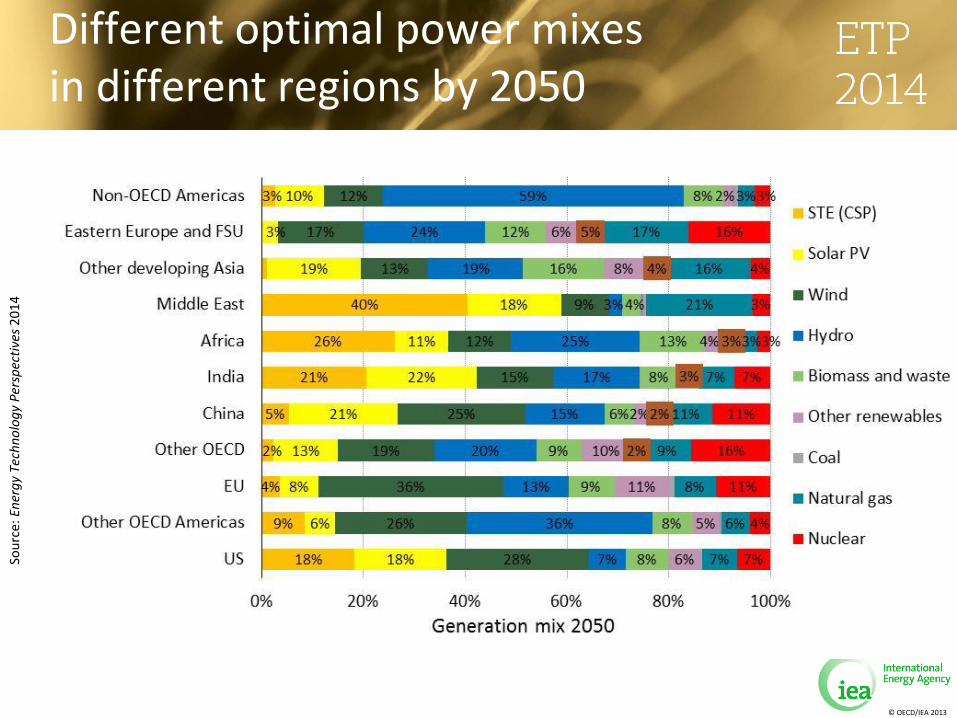
Different optimal power mixes in different regions by 2050
Sou
rce:
En
erg
y Te
chn
olo
gy
Per
spec
tive
s 2
01
4
© OECD/IEA 2013
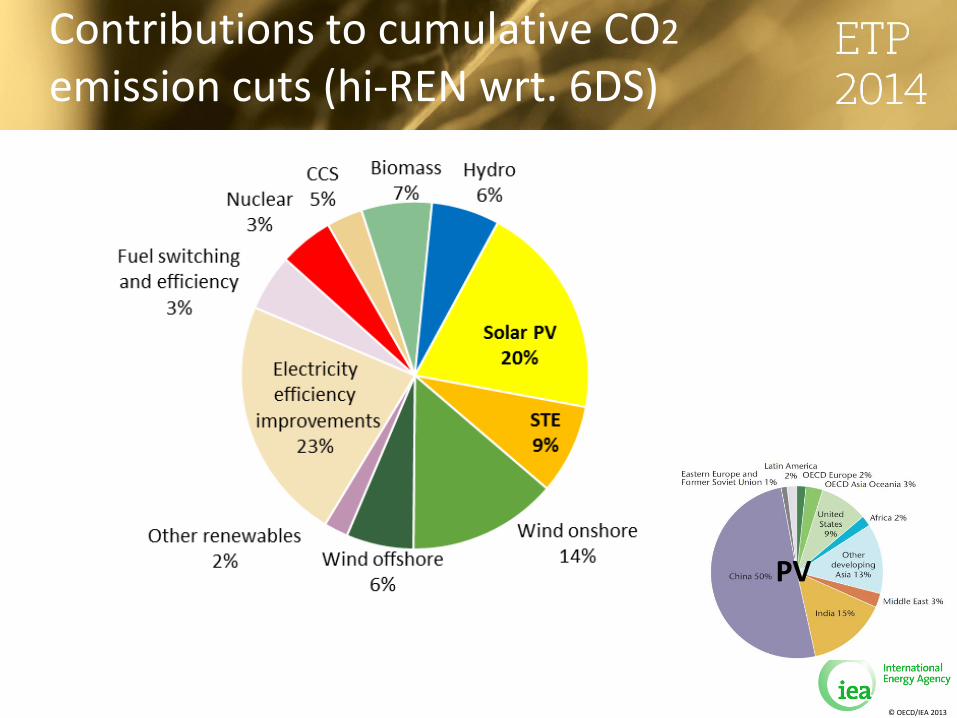
PV
Contributions to cumulative CO2 emission cuts (hi-REN wrt. 6DS)
© OECD/IEA 2015
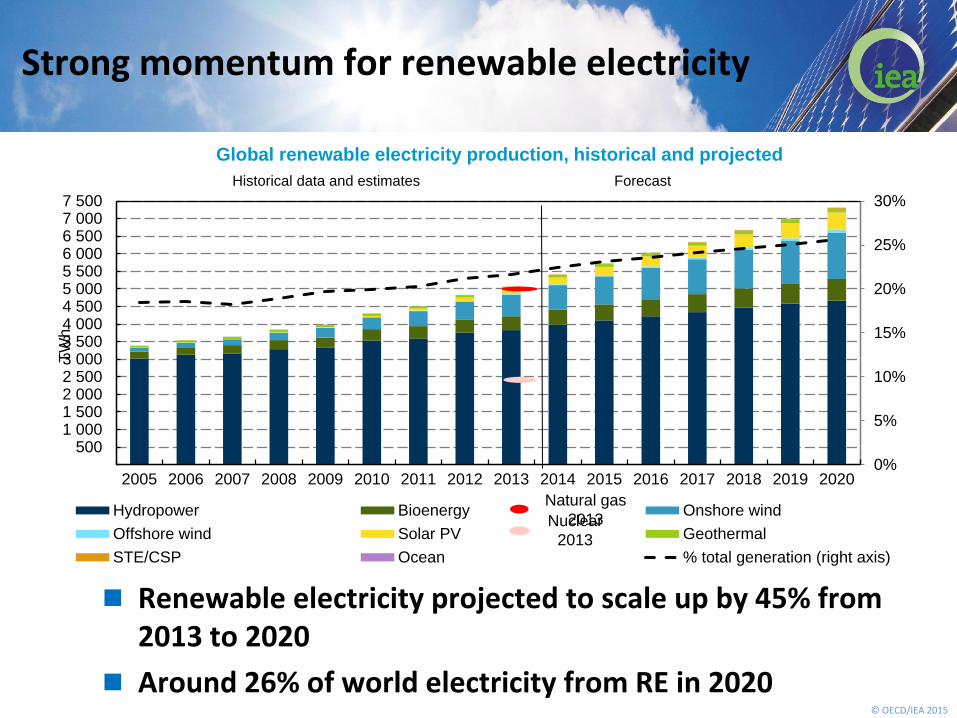
Renewable electricity projected to scale up by 45% from 2013 to 2020
Around 26% of world electricity from RE in 2020
Strong momentum for renewable electricity
Global renewable electricity production, historical and projected
0%
5%
10%
15%
20%
25%
30%
5001 0001 5002 0002 5003 0003 5004 0004 5005 0005 5006 0006 5007 0007 500
2005 2006 2007 2008 2009 2010 2011 2012 2013 2014 2015 2016 2017 2018 2019 2020
TW
h
Hydropower Bioenergy Onshore wind
Offshore wind Solar PV Geothermal
STE/CSP Ocean % total generation (right axis)
Historical data and estimates Forecast
Natural gas
2013 Nuclear
2013
© OECD/IEA 2014
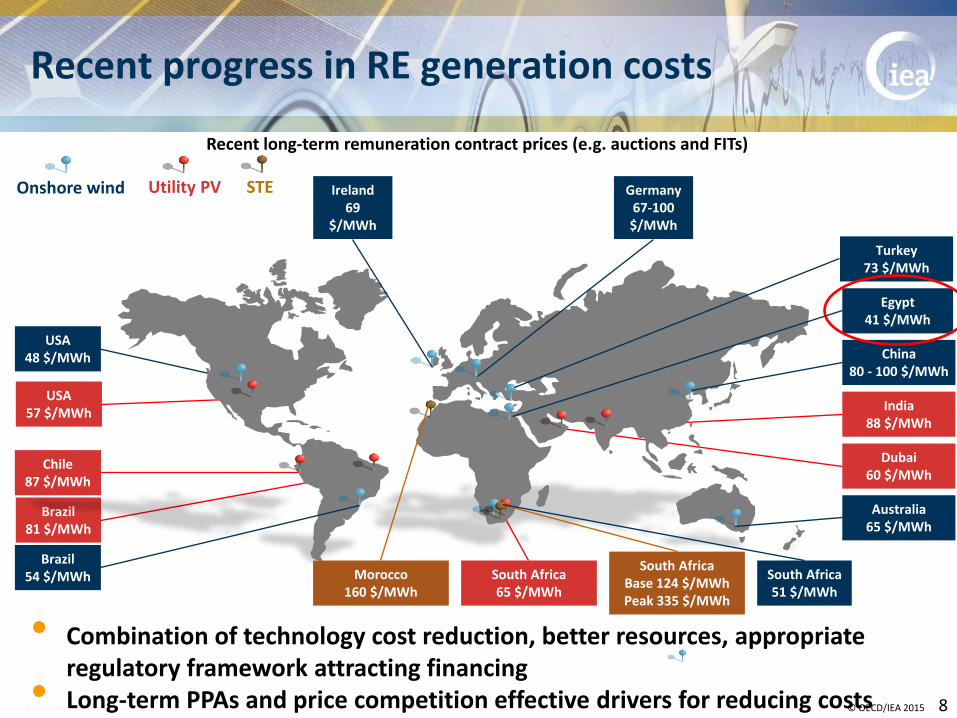
Recent progress in RE generation costs
© OECD/IEA 2015 8
• Combination of technology cost reduction, better resources, appropriate regulatory framework attracting financing
• Long-term PPAs and price competition effective drivers for reducing costs
Utility PV Onshore wind
Recent long-term remuneration contract prices (e.g. auctions and FITs)
STE
India 88 $/MWh
Chile 87 $/MWh
USA 57 $/MWh
South Africa 65 $/MWh
Brazil 81 $/MWh
Dubai 60 $/MWh
Morocco 160 $/MWh
South Africa Base 124 $/MWh Peak 335 $/MWh
South Africa 51 $/MWh
USA 48 $/MWh China
80 - 100 $/MWh
Brazil 54 $/MWh
Turkey 73 $/MWh
Germany 67-100 $/MWh
Ireland 69
$/MWh
Australia 65 $/MWh
Egypt 41 $/MWh
© OECD/IEA 2015
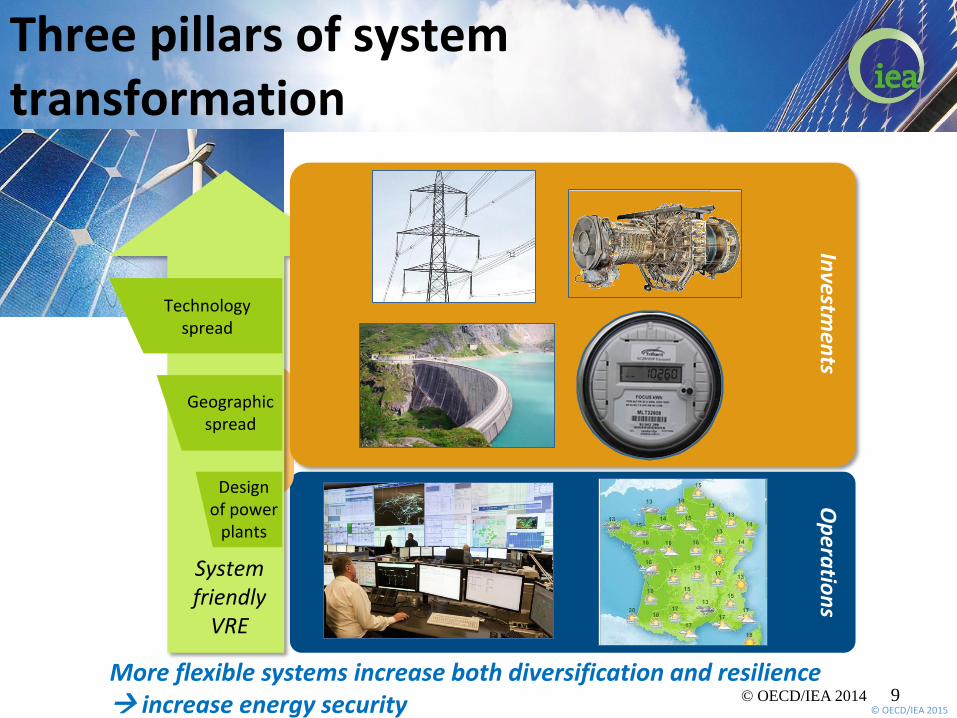
2. Make better use of
what you have
Op
eratio
ns
1. Let wind and solar play their
part
3. Take a system wide-strategic
approach to investments!
System friendly
VRE
Technology spread
Geographic spread
Design of power
plants
Three pillars of system transformation
© OECD/IEA 2014 9
Investm
ents
More flexible systems increase both diversification and resilience increase energy security
© OECD/IEA 2015
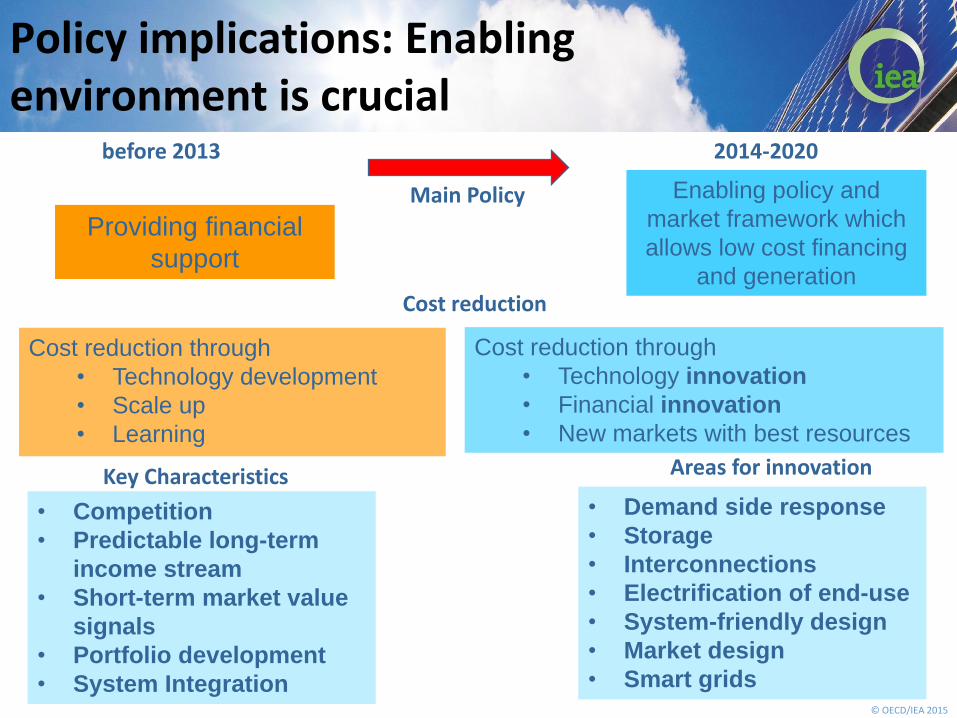
Policy implications: Enabling environment is crucial
Providing financial
support
Cost reduction through
• Technology development
• Scale up
• Learning
before 2013
Enabling policy and
market framework which
allows low cost financing
and generation
• Competition
• Predictable long-term
income stream
• Short-term market value
signals
• Portfolio development
• System Integration
Cost reduction through
• Technology innovation
• Financial innovation
• New markets with best resources
2014-2020
Main Policy
Key Characteristics
Cost reduction
• Demand side response
• Storage
• Interconnections
• Electrification of end-use
• System-friendly design
• Market design
• Smart grids
Areas for innovation
© OECD/IEA 2015
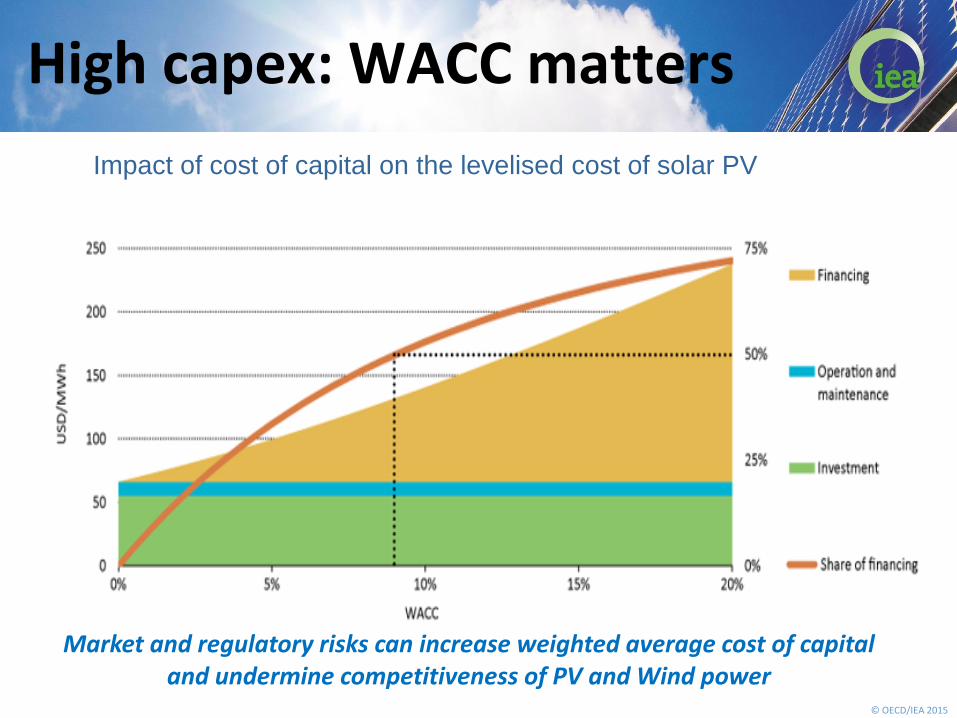
High capex: WACC matters
Market and regulatory risks can increase weighted average cost of capital and undermine competitiveness of PV and Wind power
Impact of cost of capital on the levelised cost of solar PV
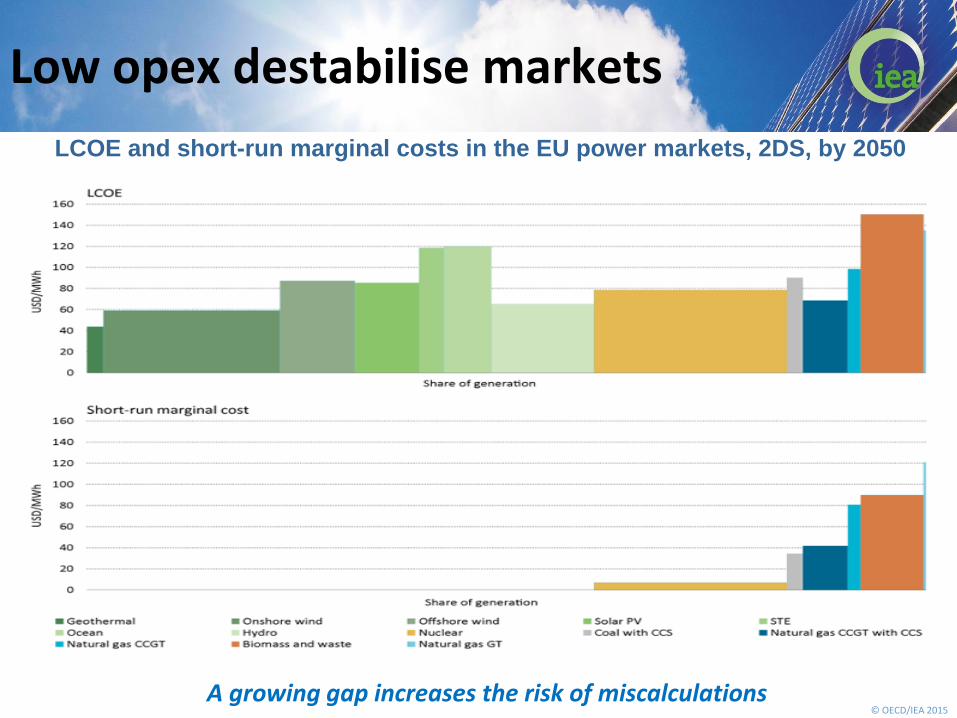
© OECD/IEA 2015 A growing gap increases the risk of miscalculations
Low opex destabilise markets
LCOE and short-run marginal costs in the EU power markets, 2DS, by 2050
© OECD/IEA 2015
Concluding Remarks
Renewables a crucial element for energy security, diversification, and climate change mitigation
As RE become competitive in many markets, the focus is more on market design and less on support policies
A global carbon price would be very welcome, but…
It is difficult in our very diverse world
It must decrease, not increase, volatility of FF use prices
Carbon taxes or trading systems with price corridors
Other tools needed to foster innnovation & investment
in renewables
In most-needed infrastructures
Related Documents