FRACTURE OF FRP IN MARINE APPLICATIONS: CONSTANT LOAD CRACK PROPAGATION William Douglas Bartron

Fracture Off Rp in m 00 Bart
Jan 28, 2016
hjtr
Welcome message from author
This document is posted to help you gain knowledge. Please leave a comment to let me know what you think about it! Share it to your friends and learn new things together.
Transcript

FRACTURE OF FRP IN MARINE APPLICATIONS:CONSTANT LOAD CRACK PROPAGATION
William Douglas Bartron

Library
Naval Postnraauate ScnoolMonterey, Califonn. 13940
FRACTURE OF FRP IN MARINE APPLICATIONS:
CONSTANT LOAD CRACK PROPAGATION
by
WILLIAM DOUGLAS BARTRON
B.S. (O.E.), United States Naval Academy
1973
SUBMITTED IN PARTIAL FULFILLMENT
OF THE REQUIREMENTS FOR THE
DEGREE OF
MASTER OF SCIENCE IN
OCEAN ENGINEERING
at the
Massachusetts Institute of Technology
May, 1974

LIBRARY
USTGRADL'ATE SCHOOCMONTEREY, CALIFORNIA 93940
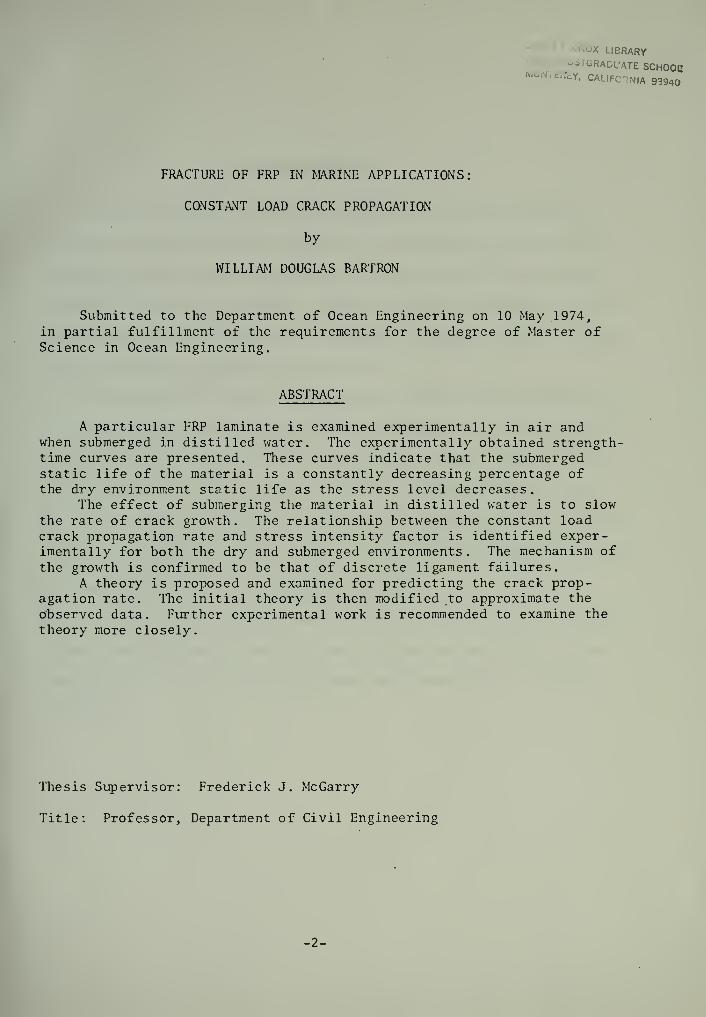
FRACTURE OF FRP IN MARINE APPLICATIONS:
CONSTANT LOAD CRACK PROPAGATION
by
WILLIAM DOUGLAS BARTRON
Submitted to the Department of Ocean Engineering on 10 May 1974,in partial fulfillment of the requirements for the degree of Master ofScience in Ocean Engineering.
ABSTRACT
A particular FRP laminate is examined experimentally in air andwhen submerged in distilled water. The experimentally obtained strength-time curves are presented. These curves indicate that the submergedstatic life of the material is a constantly decreasing percentage ofthe dry environment static life as the stress level decreases.
The effect of submerging the material in distilled water is to slowthe rate of crack growth. The relationship between the constant loadcrack propagation rate and stress intensity factor is identified exper-imentally for both the dry and submerged environments . The mechanism ofthe growth is confirmed to be that of discrete ligament failures.
A theory is proposed and examined for predicting the crack prop-agation rate. The initial theory is then modified to approximate the
observed data. Further experimental work is recommended to examine thetheory more closely.
Thesis Supervisor: Frederick J. McGarry
Title: Professor, Department of Civil Engineering
-2-

ACKNOWLEDGEMENTS
I wish to express my sincere appreciation to Professor Frederick
J. McGarry, Department of Civil Engineering, Massachusetts Institute of
Technology, for his advice, guidance, and encouragement in all areas of
this work. I am also very deeply indebted to Doctor John Mandell of the
same department whose experience, knowledge, and guidance were invaluable
in the successful completion of this work.
The instruction, advice, and assistance of Mr. Arthur Rudolph were
immensely helpful in the machining of the specimens, alterations to the
water containment system, and construction of the timing device. I am
also indebted to graduate students Conrad Fong, Dario Gasparini, and
Jorge Alva-Hurtado for lending me their time and equipment for this work.
I am especially indebted to graduate student Reiichiro Kashihara for his
continued help and advice throughout this study.
I wish to extend a special note of thanks to my wife, Beth, for her
support, and tolerance of unusual hours, through the many months of ex-
perimentation as well as for her patience and perseverance in typing
this work
.
-3-

TABLE OF CONTENTS
Page
Tit le Page 1
Ab stract 2
Acknowledgements 3
Table of Contents 4
List of Symbols 5
I
.
Introduction 6
II
.
Materials 8
III
.
Experimental Procedure 10
IV. Analytical Method 13
V. Results 16
VI
.
Discussion of Results 18
VI I
.
Conclusions 20
VIII
.
Recommendations 22
References 24
Appendices 25
List of Figures 26
List of Tables 37

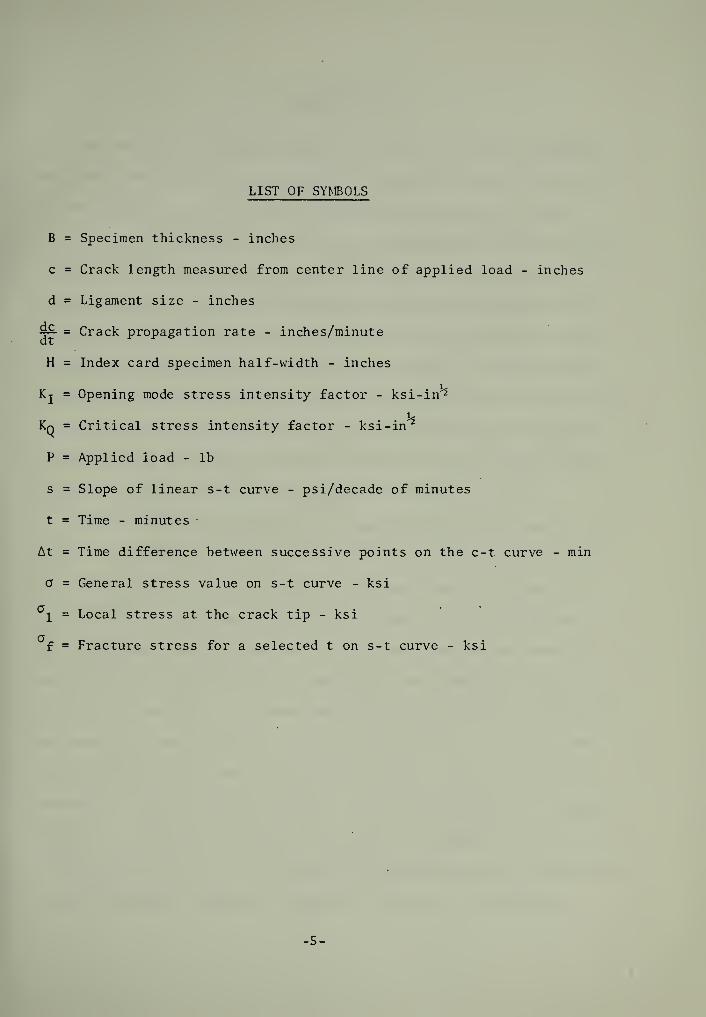
LIST OF SYMBOLS
B = Specimen thickness - inches
c = Crack length measured from center line of applied load - inches
d = Ligament size - inches
^°- = Crack propagation rate - inches/minute
H = Index card specimen half-width - inches
Kj = Opening mode stress intensity factor - ksi-in'2
Kq = Critical stress intensity factor - ksi-in 2
P = Applied load - lb
s = Slope of linear s-t curve - psi/decade of minutes
t = Time - minutes
At = Time difference between successive points on the c-t curve - min
a = General stress value on s-t curve - ksi
1 = Local stress at the crack tip - ksi
f = Fracture stress for a selected t on s-t curve - ksi
-5-


I. INTRODUCTION
The use of glass- fiber-reinforced plastics in a marine environment
has grown considerably in recent years. Among other uses in this field,
it has applications as varied as a structural hull material, a non-
structural fairing to hull shapes, and as a topside deck housing material
because of its high strength to weight ratio and easy maintenance. (1, 2).
Generally speaking, however, it is still a relatively new material for
engineering work in the marine environment and more information on its
performance characteristics is needed at this time. One aspect of the
behavior of FRP is the feasibility of the application of fracture mechanics
to the material and the modifications to this theory that are necessary.
With the proper adjustments, fracture mechanics has been used in recent
studies to predict fatigue crack propagation rates. (3, 4, 5).
The fatigue crack propagation rate was shown by Mandell and Meier (4)
to vary approximately with the eleventh power of stress intensity factor
for cross-plied Scotchply (a pre-preg, unidirectional ply, glass rein-
forced epoxy) . More recently it was shown that a number of different
glass-reinforced laminates exhibit fatigue crack propagation rates that
vary exponentially with stress intensity over the exponent range of 9 to
13. (5). For metals, it is known that dc/dN varies with Kj exponentially,
but usually in the range of 3 - 6. (6) . The initiation of static load
crack growth in metals has been predicted using a material evaluation
technique. These static-case results are expressed as the lowest stress
intensity to critical stress intensity ratio below which failure will not
occur in a given time. (7). This type of relationship has not been shown
to exist for glass composites whose mode of fracture is different.
-6-

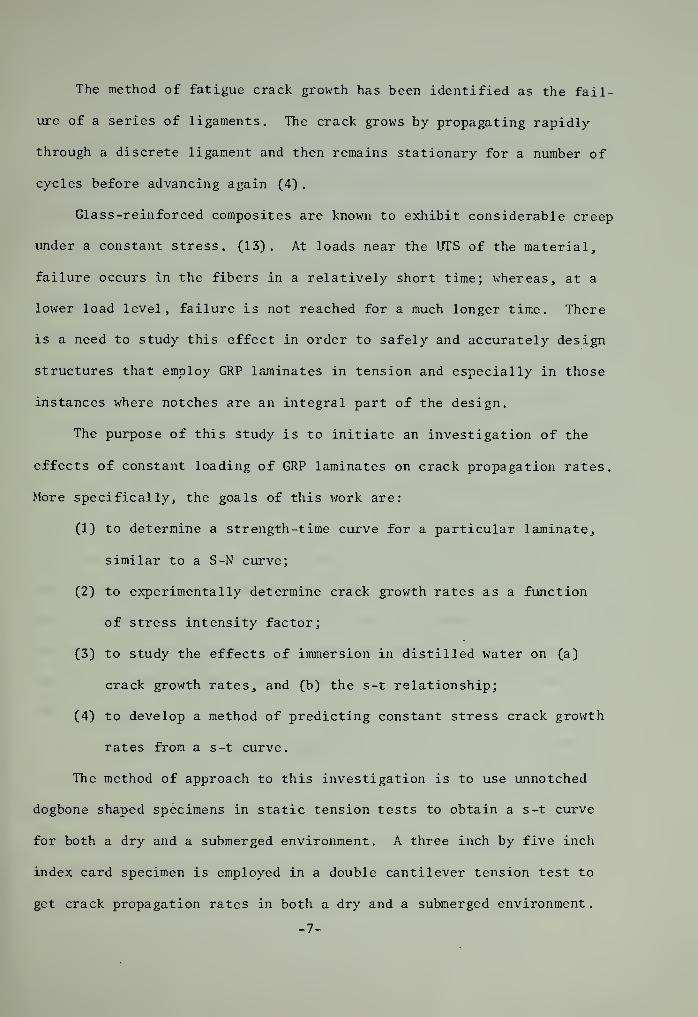
The method of fatigue crack growth has been identified as the fail-
ure of a series of ligaments. The crack grows by propagating rapidly
through a discrete ligament and then remains stationary for a number of
cycles before advancing again (4)
.
Glass-reinforced composites are known to exhibit considerable creep
under a constant stress. (13) . At loads near the UTS of the material,
failure occurs in the fibers in a relatively short time; whereas, at a
lower load level, failure is not reached for a much longer time. There
is a need to study this effect in order to safely and accurately design
structures that employ GRP laminates in tension and especially in those
instances where notches are an integral part of the design.
The purpose of this study is to initiate an investigation of the
effects of constant loading of GRP laminates on crack propagation rates.
More specifically, the goals of this work are:
(1) to determine a strength-time curve for a particular laminate,
similar to a S-N curve;
(2) to experimentally determine crack growth rates as a function
of stress intensity factor;
(3) to study the effects of immersion in distilled water on (a)
crack growth rates, and (b) the s-t relationship;
(4) to develop a method of predicting constant stress crack growth
rates from a s-t curve.
The method of approach to this investigation is to use unnotched
dogbone shaped specimens in static tension tests to obtain a s-t curve
for both a dry and a submerged environment. A three inch by five inch
index card specimen is employed in a double cantilever tension test to
get crack propagation rates in both a dry and a submerged environment
.
-7-

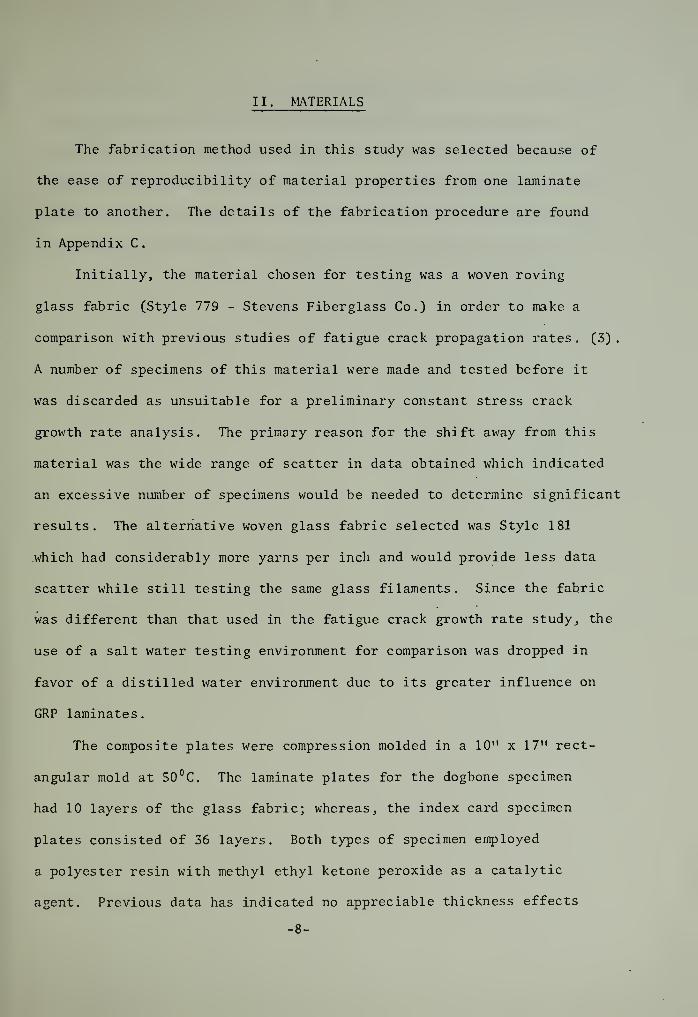
II. MATERIALS
The fabrication method used in this study was selected because of
the ease of reproducibility of material properties from one laminate
plate to another. The details of the fabrication procedure are found
in Appendix C
.
Initially, the material chosen for testing was a woven roving
glass fabric (Style 779 - Stevens Fiberglass Co.) in order to make a
comparison with previous studies of fatigue crack propagation rates. (3).
A number of specimens of this material were made and tested before it
was discarded as unsuitable for a preliminary constant stress crack
growth rate analysis. The primary reason for the shift away from this
material was the wide range of scatter in data obtained which indicated
an excessive number of specimens would be needed to determine significant
results. The alternative woven glass fabric selected was Style 181
which had considerably more yarns per inch and would provide less data
scatter while still testing the same glass filaments. Since the fabric
was different than that used in the fatigue crack growth rate study, the
use of a salt water testing environment for comparison was dropped in
favor of a distilled water environment due to its greater influence on
GRP laminates.
The composite plates were compression molded in a 10" x 17" rect-
angular mold at 50°C. The laminate plates for the dogbone specimen
had 10 layers of the glass fabric; whereas, the index card specimen
plates consisted of 36 layers. Both types of specimen employed
a polyester resin with methyl ethyl ketone peroxide as a catalytic
agent. Previous data has indicated no appreciable thickness effects
-8-


so the use of only 10 layers for the dogbone specimens was acceptable .(9)
This fabrication method yielded an average fiber volume fraction of
43.3% for the notched specimens and an average fiber volume fraction of
45.95% for the unnotched specimens. The volume fractions were obtained
by conducting burn tests on two one-inch squares from each plate made.
The shape and geometry of each specimen are illustrated in Figure 3.
-9-


III. EXPERIMENTAL PROCEDURE
The testing of the machined specimens was done on either an Instron
Model 1211 Dynamic Cycler or an Instron Universal Testing Machine. The
index card specimens were held with pin grips; whereas, standard wedge
action grips were used for the unnotched dogbone specimens . The load
level could be preset on the Dynamic Cycler, but had to be manually
adjusted on the Universal Testing Machine which was designed to apply
a constant displacement rather than a constant load. One each of the
two specimen designs was tested to obtain a rough estimate of the ulti-
mate tensile strengths. As a result, the Dynamic Cycler was set up for
2000 pounds full scale load for the index card specimens and for 4000
pounds full scale load for the dogbone specimens. The Dynamic Cycler
demonstrated a second order time response in reaching the preset load,
but, because the rise time was significantly short compared to most of
the testing times, the response was approximated as a step function.
The short duration tests (two minutes and less) were conducted on the
Universal Testing Machine. A description of all the apparatus used can
be found in Appendix D.
The procedure followed for all tests was the same for both the dry
and submerged environments except that the water containment system was
installed in the latter case. For the purpose of this paper, the dry
environment is taken to be that in an uncontrolled laboratory. It should
be noted that the large amount of rust associated with submerged testing
with this unit in previous tests was not present during the current
investigation. The two reasons for this are (i) all the metal surfaces
were sprayed with Krylon Silicone Spray (Borden, Inc.) to repel the
-10-

water and prevent rust; and (ii) any small amount of rust that did
form was not shaken loose from the surface as was caused by the cycling
in the fatigue study.
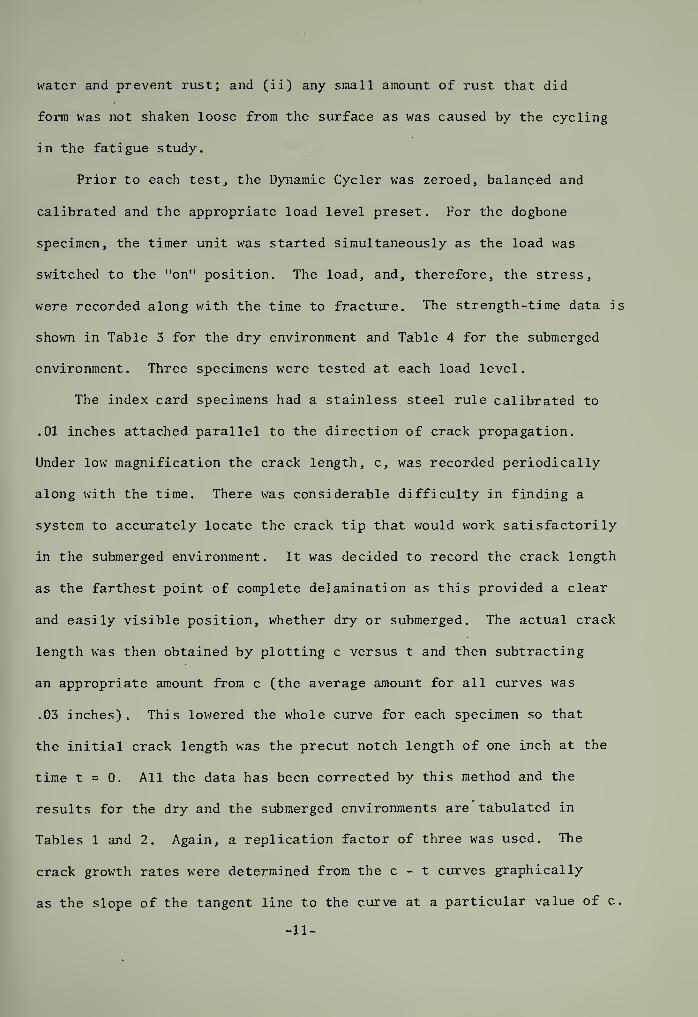
Prior to each test, the Dynamic Cycler was zeroed, balanced and
calibrated and the appropriate load level preset. For the dogbone
specimen, the timer unit was started simultaneously as the load was
switched to the "on" position. The load, and, therefore, the stress,
were recorded along with the time to fracture. The strength-time data is
shown in Table 3 for the dry environment and Table 4 for the submerged
environment. Three specimens were tested at each load level.
The index card specimens had a stainless steel rule calibrated to
.01 inches attached parallel to the direction of crack propagation.
Under low magnification the crack length, c, was recorded periodically
along with the time. There was considerable difficulty in finding a
system to accurately locate the crack tip that would work satisfactorily
in the submerged environment. It was decided to record the crack length
as the farthest point of complete delamination as this provided a clear
and easily visible position, whether dry or submerged. The actual crack
length was then obtained by plotting c versus t and then subtracting
an appropriate amount from c (the average amount for all curves was
.03 inches) . This lowered the whole curve for each specimen so that
the initial crack length was the precut notch length of one inch at the
time t = 0. All the data has been corrected by this method and the
results for the dry and the submerged environments are tabulated in
Tables 1 and 2. Again, a replication factor of three was used. The
crack growth rates were determined from the c - t curves graphically
as the slope of the tangent line to the curve at a particular value of c.
-11-

This method is illustrated in Figure 5, and the results are tabulated
in Table 5 and Table 6.
For the short duration tests, the Universal Testing Machine was
used and the data was recorded as described above. A part of the test
procedure included presoaking three specimens of each type for a period
of 40 days prior to testing. The results of these tests are in Tables
2 and 4.
-12-

IV. ANALYTICAL METHOD
The method of crack propagation under constant load is one of
ligament advance as in the case of fatigue crack propagation. The
rate of extension of the main crack can be thought of as the ligament
width divided by the number of minutes necessary to fail the ligament.
The subcracking that occurs perpendicular to the main crack is not
considered a part of the main crack extension. This propagation rate
can be obtained experimentally as the slope of the tangent to the crack
length versus time curve. One of the purposes of this investigation
was to develop a means of predicting the crack growth rate from the
information contained in a strength-time curve for the material. This
concept is an extension of a theory developed recently by Mandell and
Meier for fatigue crack growth. The theory has subsequently been ver-
ified for a number of varied composite materials and in a marine envir-
onment for fiber reinforced plastics under fatigue loading. (3, 5) .
The fundamental basis of the concept being tested here is the
hypothesis that the ligament of material at the crack tip fails accord-
ing to the constant-strength life of an unnotched specimen but at the
local stress level at the crack tip. If the strength versus log time
to failure curve can be approximated as a straight line over the range of
interest, then a linear equation can be writted as:
log ( — ) = JO (1)L
s
where °c is the stress to cause failure in some initial time, o, 0"
ro
is the applied static stress, s is the slope of the s-t curve, and t is
the time to failure. We note that the stress in the material at the
crack tip must reach the local ultimate stress to cause failure (in some
-13-


assumed time) simultaneously as the stress intensity factor reaches
the candidate critical stress intensity factor (for that same assumed
time of stress history)
.
In the case of the fatigue crack growth, good agreement was found
between theory and experiment when the relationship between stress
ratios and stress intensity ratios was assumed linear
KI
a. = a f (— ) . (2)
1 *oKQ
A slight modification to this relationship was used in this investigation
by assuming the existence of an exponent, n, where — < n < 3, which pro-
vides an approximately linear equation over the range of interest
K
1 fo Q
Substituting (3) into (1), the crack growth rate for a ligament width d,
and t = 1 minute, iso
dc d
dT=
0^ K T' "• C4 >
exp ( 2.3 Jo ( l-( -l) n))
S KQ
Any effect of the stress distribution ahead of the crack has been
assumed negligible for this initial investigation of the crack growth
rate. It should be noted that this same assumption introduced no sig-
nificant error in the case of fatigue crack growth. (4).
The value of stress intensity factor was determined from the relation-
ship found from boundary collocation (8)
3.46 P ( - + 0.7 )
h 5 (5)
BH 2
-14-

This equation was derived specifically for cleavage specimens with iso-
tropic constants. It introduces a slight error when applied to anis-
tropic material (a maximum deviation of approximately ten percent), but
provides invariant toughness results over varying crack lengths in similar
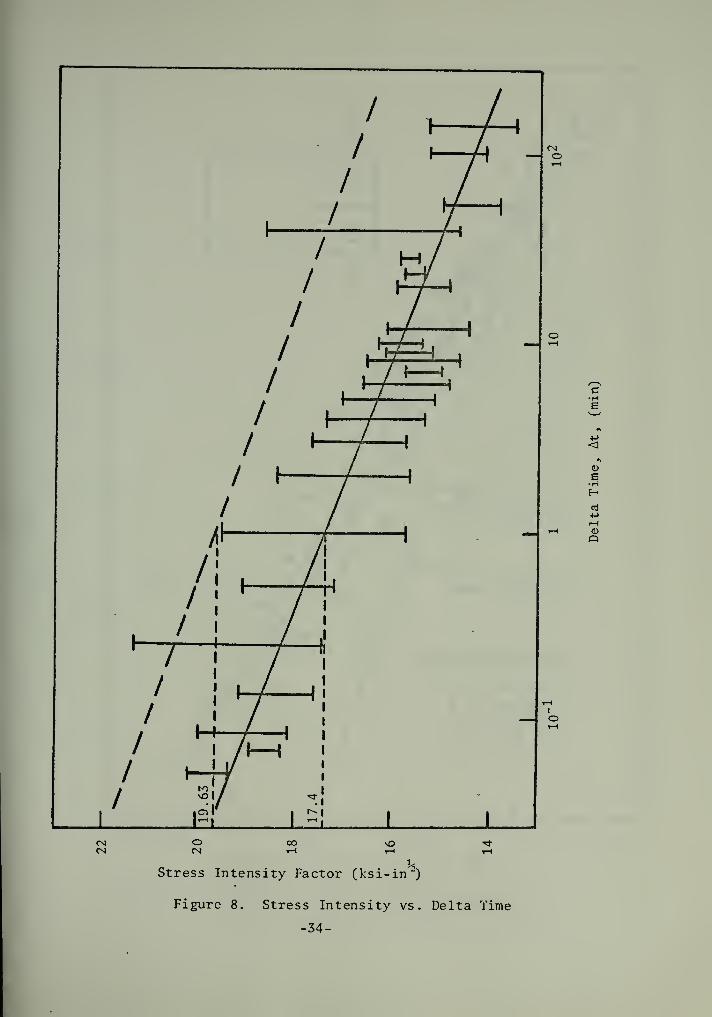
materials. (9, 5). The range of stress intensity factor at any given
At is shown in Figure 8.
The method for determining from the experimental data the relation-
ship between crack growth rates and stress intensity was to obtain the
approximate power relationship from a linear log-log curve. No analytical
derivation for the selection of the appropriate n for the dry and sub-
merged tests was used. Instead, a trial and error approach was used
to approximate the experimental data.
-15-

V. RESULTS
The ligament method of crack growth described in (4) was observed
for this material and the ligament width, d, was approximated from the
crack length vs. time curves as .02 inches.
The unnotched specimens produced nearly linear s-t curves for both
the dry and submerged environments. The linearization of these curves
yielded, for an initial time of one minute for each, a value for af
of 40.275 ksi and a slope value, s, of l'.969 ksi per decade of minutes
for the dry environment and a afQ of 42.34 ksi with a slope, s, of 7.52
ksi per decade of minutes for the submerged environment.
The effect of submerging the dogbone specimens was to increase the
slope of the s-t curve by a factor of nearly four (actual = 3.82). For
an initial time of one minute there is a higher value of °f for the
submerged specimens than the dry specimens. This is due to a crossing
of the two curves when plotted together at a stress of 39.5 ksi at 2.4
minutes. No signifigance was attached to this intersection.
The crack growth rate was determined, as described in section IV,
to vary with the twenty-fourth power of the stress intensity for the dry
specimens. The submerged specimens yielded a twenty-second power de-
pendence of crack growth rate upon stress intensity. The effect of
submerging the specimens was to slow the crack propagation. This can be
seen in the table below which compares the average total time for the crack
to reach four and one half inches for the dry and submerged environments.
Average Load Average Total Time to Failure Multiplication Factor
Dry Submerged(min) (min)
1400 33.75 1375.83 40.741500 10.42 321.83 30.89
1600 1.44 29.69 20.62
-16-


Within the specimens tested in the submerged environment, there was a
degree of variation in the crack growth rate curve. At the higher
loads where the water had less time to act upon the specimen the results
closely approximated the dry environment specimens. When the load was
low enough to allow a longer testing time, the slope of the crack growth
rate curve was distinct from the dry results initially, but approached
the value associated with the dry specimens when the crack began prop-
agating rapidly.
The theory developed does not provide a good approximation to the
experimental results for either the dry or submerged case if n is taken
as one. As no accurate analytical method exists, the experimental data
was approximated by trial and error to yield values for n for the two
cases. The data from the dry specimens was best approximated when n = 0.5
and the submerged specimens when n = 2.0. The selection of q in this
theory was made by selecting that value of Kj which corresponded to the
initial time, ^o. as taken from Figure 8.
-17-


VI. DISCUSSION OF RESULTS
The linear s-t curves for both the dry and submerged environments
are in agreement with previously observed results for the time scale of
minutes and hours. (10). The effect of distilled water on the specimens
shows a constantly increasing degradation of strength with time for the
dogbone specimens. The opposite effect is observed in the index card
specimens, where the rate of crack growth is significantly slower at the
lower load levels but approaches the dry results at the higher load levels.
Crack growth rate curves in Figure 9 appear to be stacked according
to load, rather than overlapping as expected. This indicates that, al-
though the relationship to stress intensity is nearly uniform, the absolute
value of the growth rate is dependent upon the load level
.
The theory developed in this investigation is unable to predict
crack growth rates accurately from the data in a strength-time curve.
The theory can provide good results when an additional exponent is added,
but this is a questionable procedure unless some other method can be
found to confirm that exponent as a material or environmental property.
The use of linear elastic fracture mechanics, and its variations,
in the plastic zone in front of a crack propagating under a constant load
in metals has provided some methods of predicting the crack growth rates
in these metals. Using the concept of stress relaxation of voids,
Williams has provided surprisingly similar results to those of McClintock
who considered the visco elastic strain history of the zone ahead of the
crack (11). Because of the differences in fracture mechanisms, however,
these results don't lend themselves to an analogy to our material. The
current studies in fracture mechanics of constant load crack growth rates
-18-


in metals would probably not provide, then, reasonable results for
our composite (12).
Without the existence of theories of crack growth rates for other
materials for analogy, and because the theory of Mandell and Meier for
fatigue crack growth is very near, in its analogy, to predicting constant
load crack growth rates, the concept of altering that theory slightly
does appear reasonable. There are several areas where the validity of
this theory should be subject to scrutiny. The cumulative effects ahead
of the crack might alter the stress field to the point where equation
(2) might not be inclusive of the actual stress at the crack tip. The
mode of failure of the ligament at the crack tip should also be in-
vestigated in view of the apparently significant effects of stress cor-
rosion in blunting of the crack in the submerged tests.
The effects of presoaking had no significant influence upon the
s-t curve of the submerged specimens, but decreased the average time
to fail the submerged index card specimens by 48%. The amount of sur-
face area, perpendicular to the plane of the fibers, that is exposed to
the distilled water, appears to be a significant factor in strength
retention and crack growth resistance.
-19-

VII. CONCLUSIONS
1. The composite tested produced a linear relationship between
the applied stress and the logarithm of the time to fracture over the
range of applied stresses. This is consistent with previous results
for glass specimens. The submergence in distilled water of these dog-
bone specimens increased the slope of the still linear s-t curve which
resulted in a constantly decreasing percentage of the time-to-fracture
(of a dry specimen) as the stress level was decreased.
2. The crack growth rate under constant load was found experiment-
ally to vary with the twenty-fourth power of the stress intensity factor
for dry specimens and with the twenty-second power for those submerged
in distilled water. At high load levels, the crack growth rate of the
submerged specimens approached that of the dry specimens
.
3. The method of crack growth was verified to be one of ligament
advance when under a constant load.
4. The length of time that the specimens are exposed to the dis-
tilled water prior to testing introduces no significant error for the
dogbone specimens, but greatly influences the index card shaped specimens,
The average time to fail the presoaked index card specimens was ten times
that of those in the dry environment as compared to twenty times as long
for those not presoaked but tested while submerged.
5. There is a linear relationship between the stress intensity at
the crack tip and the logarithm of the length of time the crack stays
at any given length. The slope of this curve is nearly the same for
the dry and submerged environments but for any given stress intensity at
the crack tip the submerged specimen will remain at that length for a
-20-


period of 40 to 50 times that of the dry specimen.
6. The theory developed for predicting the crack growth rate from
information obtained in a s-t curve is invalid unless it is altered
to include an additional parameter, n. The value of this parameter
was determined experimentally to be 0.5 for the dry specimens, and
2.0 for the submerged specimens.
-21-


VIII. RECOMMENDATIONS
Very little work has been done in the investigation of constant
load crack growth rates in FRP and so this study was aimed at providing
some preliminary results as to the nature of these velocities as well
as to examine a method of predicting them. There are a number of import-
ant areas that emerged from this work which should be studied further in
order to more fully understand the fracture of FRP materials in a marine
environment.
The shape of the dogbone specimen should be re-evaluated from the
viewpoint of stress concentrations to insure that the fracture will occur
in the gage section rather than in the transition zone as it did in this
study. Higher stress levels should also be used to extend the s-t curve
to where the order of magnitude of the time to failure is one to three
times less than in the current tests. Such tests would serve to identify
the linear region of the stress time curve more clearly as well as help
to understand the fracture at the crack tip of the index card specimen
when the stress intensity reaches high levels, Khere time permits, lower
stress levels should also be tested to see if there exists a practical
endurance level for this material.
The method of determining the location of the crack tip needs to
be investigated in order to reduce the amount of error that was introduced
by the method used in this study. The visual method is by far the cheap-
est and easiest, but other systems (acoustic, electronic, mechanical)
should be considered.
The length of time of presoaking before testing should be varied in
a series of experiments as this factor contributes significantly to the
-22-

crack growth rate. In this same area there are a number of other para-
meters which were neglected here but which should be included at some
future time, such as the type of bath (varied concentrations of acid,
or seawater) and temperature.
The theory used to predict the crack growth rates needs to be
modified to include other factors so that it might better approximate
the experimental data. Further tests are definitely needed to confirm
or refute the existence of the additional parameter, n. This parameter
may be a material property that varies with time as well as environment.
Additionally, this parameter may not exist, in which case, again, the
theory needs to be restructured to include those factors which have a
significant effect on the crack growth rate. In particular, the mechan-
ism of stress corrosion cracking should be considered in further work in
this area. The time dependence of the material properties is important
in these time tests and needs to be more completely understood and doc-
umented. A key area for further work is the time function of the cand-
idate critical stress intensity since it plays a crucial role in the
theory used in this study.
-23-

REFERENCES
1. N. Fried and W. R. Graner, "Durability of Reinforced PlasticStructural Materials in Marine Service", Marine Technology,July, 1966.
2. "The Glass Reinforced Plastic Minehunter", Naval Record, October,1972.
3. R. P. Demchik, "Marine Environment Effects on Fatigue CrackPropagation in GRP Laminates for Hull Construction", S. M. Thesis,M.I.T. Dept. of Ocean Engr
., 1973.
4. J. F. Mandell and U. Meier, "Fatigue Crack Propagation in 0°/90°
E-Glass/Epoxy Composites", M.I.T. Dept. of Civil Engr. ReportR74-1, 1973.
5. J. F. Mandell, "Fatigue Crack Propagation Rates in Woven and Non-Woven Fiberglass Laminates", to be published, 1974.
6. A. S. Tetelman and A. J. McEvily, Jr., Fracture of Structural Mat-erials, Wiley, 1967.
7. C. C. Osgood, "A Basic Course in Fracture Mechanics", MachineDesign Magazine, Penton Publishing Co., 1971.
8. B. Gross and J. E. Srawley, "Stress Intensity Factors by BoundaryCollocation for Single-Edge-Notch Specimens Subject to SplittingForces", NASA Technical Note D-3295, 1966.
9. J. F. Mandell, F. J. McGarry, R. Kashihara, and W. 0. Bishop, "En-
gineering Aspects of Fracture Toughness: Fiber Reinforced Laminates",M.I.T. Dept. of Civil Engr. Report R73-54, 1973.
10. H. Kolsky and D. Rader, "Stress Waves and Fracture", Fracture ,
Vol. I, H. Liebowitz, ed., Academic Press, 1968.
11. M. Williams, F. McClintock, Fracture , Vol. Ill, H. Liebowitz, ed.,
Academic Press, 1968.
12. F. McClintock, Personal Communication, M.I.T. Dept. of Mech. Engr.,
May, 1974.
13. L. J. Broutman and R. H. Krock, eds.
, Modern Composite Materials,
Addison-Wesley, 1967.
-24-

APPENDICES
Page
A. Figures 26
B. Tables 37
C. Specimen Fabrication 56
D. Description of Apparatus 58
-25-


APPENDIX A.
FIGURES
Figure 1 E-glass Reinforcement. Style 181.
Figure 2(a-b) Typical Specimen Identification
Figure 3 Specimen Geometry
Figure 4(a-b) Typical Specimens
Figure 5 Typical Notch Length vs. Time
Figure 6 Strength-Time Curve (Dry Environment)
Figure 7 Strength-Time Curve (Wet Environment)
Figure 8 KI vs. AT
Figure 9 dc. Vs .K I (Dry Environment)
dt
Figure 10 dc_vs. Kj (Wet Environment)dt
-26-

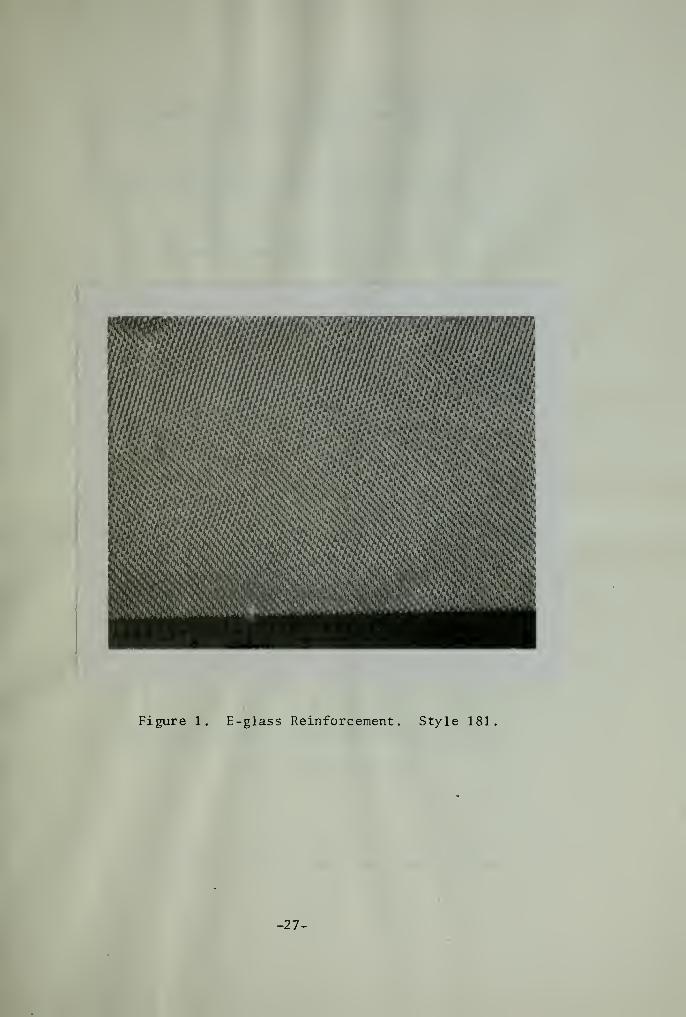
Figure 1. E-glass Reinforcement. Style 181
-27-

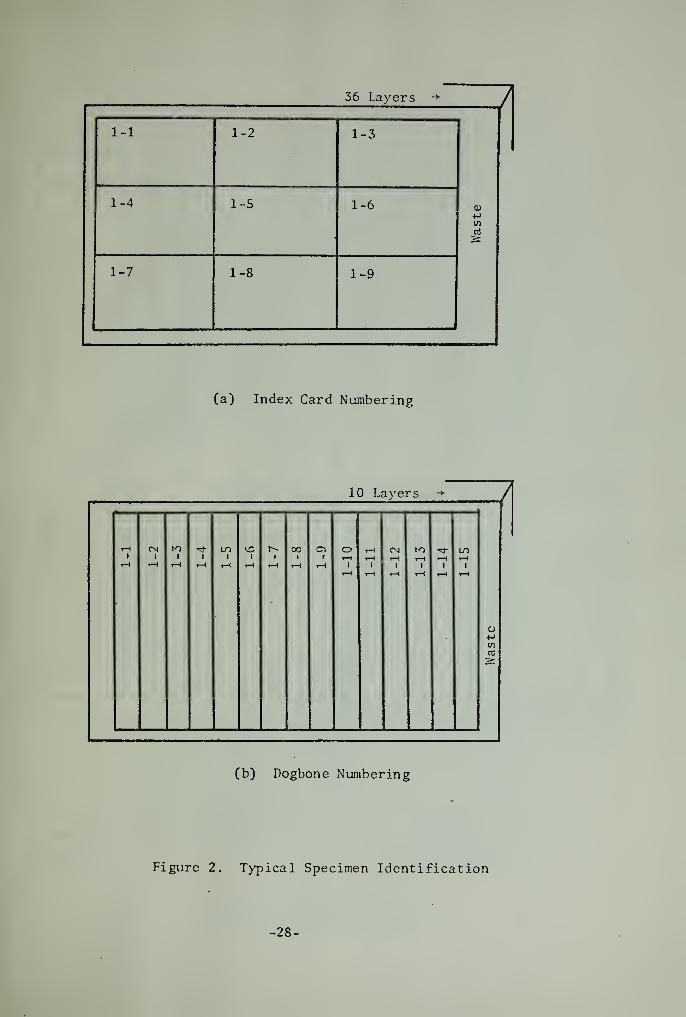
36 Layers
(a) Index Card Numbering
10 Layers -*-
1 1
to1 1
ini 1
oo1
oT—
)
1—1
T—
1
T—
1
t—
1
LO
I—
1
1—
(
r-i H T-H I—
(
i—i i-i r-< 1
I—
1
1
T—
t
1 1
t—
1
1
T—
1
1
M1/1
a
(b) Dogbone Numbering
Figure 2. Typical Specimen Identification
-28-


l-<-l"
\
2"
iK 3"R
0.8"
/ V
T
Unnotched(Pogbone)
Notched(Index Card)
(W = 4.5 inches)
Figure 3. Specimen Geometry
-29-


(a) Machined Specimens
(b) Specimens After Testing
Figure 4. Typical Specimens
-30-


o"3-
o<3
oto
tn
£2 cr-< •H
t~- o M-1 O r^
ih ^r toi—i
c -a tn
<U rt Ifl
E O o•H -J Co ^(I) Ua, •Hw X
F
10
+J
oCM
o o oto
oCM
oo
Crack Length, c, inches
Figure 5. Typical Crack Length vs. Time Curve
-31-


40
39
38
37
in
36
60coU+J
35
34
33
afQ
= 40.625 ksi
s = 1.9685 ksi/ decade of minutes
\ /
/ \
10 10'
Time, t, (min)
10"
Figure 6. Strength-Time Curve (Dry Environment)
-32-

40
39
38
37
36
CCD
U4->
(A)
35
34
33
a„ = 42.34 ksi£
s = 7.52 ksi/ decade of minutes
t
/ V
\ f
\
10
Time, t, (min)
10"
Figure 7. Strength-time Curve (Wet Environment)
-33-

oCM
00 VO
•H
4-><
oe•HHnj
a
Stress Intensity Factor (ksi-in 2
)
Figure 8. Stress Intensity vs. Delta Time
-34-

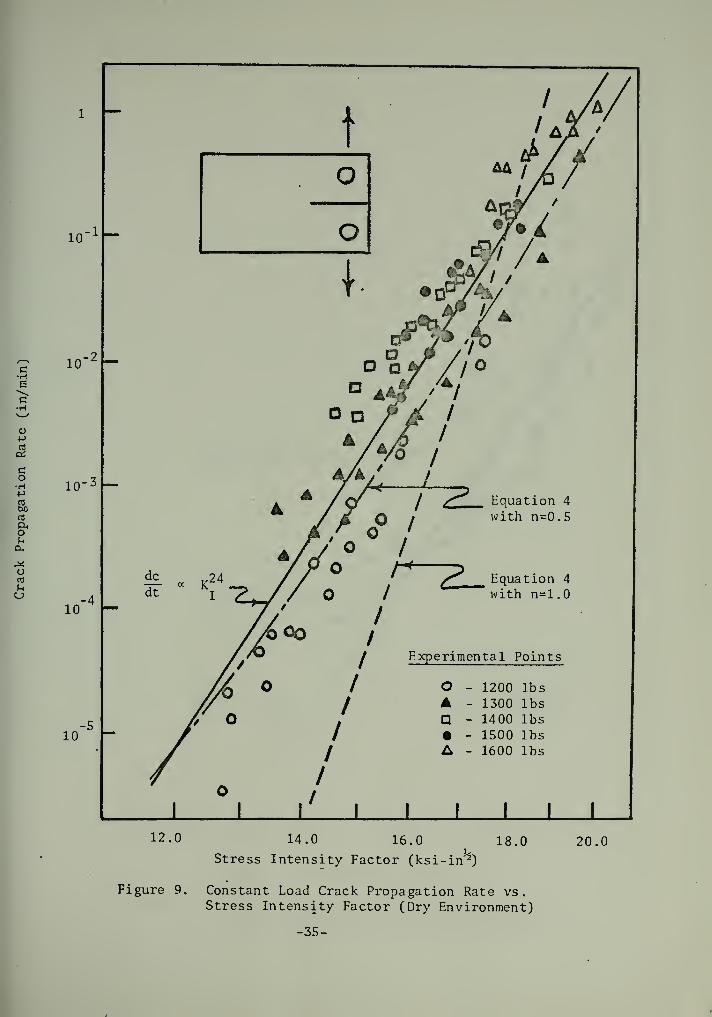
12.0
Figure 9.
14.0 16.0
Stress Intensity Factor (ksi-in'2)
18.0 20.0
Constant Load Crack Propagation Rate vs.Stress Intensity Factor (Dry Environment)
-35-

t
•HE
C•H
OS
o
oua.
ASocs
u
10
10'
10-3
10
10-5
Equation 4
with n=1.0
Equation 4
with n=2.0
dctt 22
dtKI
Experimental Points
O - 1400 lbs4 - 1500 lbs
- 1600 lbs
J I I L
12.0 14.0 16.0 18.0 20.0
Stress Intensity Factor (ksi-in 2)
Figure 10. Constant Load Crack Propagation Rate vs.Stress Intensity Factor (Wet Environment)
-36-

APPENDIX B.
TABLES
Table 1
Table 2
Table 3
Table 4
Table 5
Table 6
Table 7
Table 8
Notched Specimen Data (Dry Environment)
Notched Specimen Data (Wet Environment)
Unnotched Specimen Data (Dry Environment)
Unnotched Specimen Data (Wet Environment)
Experimental Crack Growth Rate Data(Dry Environment)
Experimental Crack Growth Rate Data(Wet Environment)
Theoretical Crack Growth Rate Data(Dry Environment)
Theoretical Crack Growth Rate Data(Wet Environment)
-37-

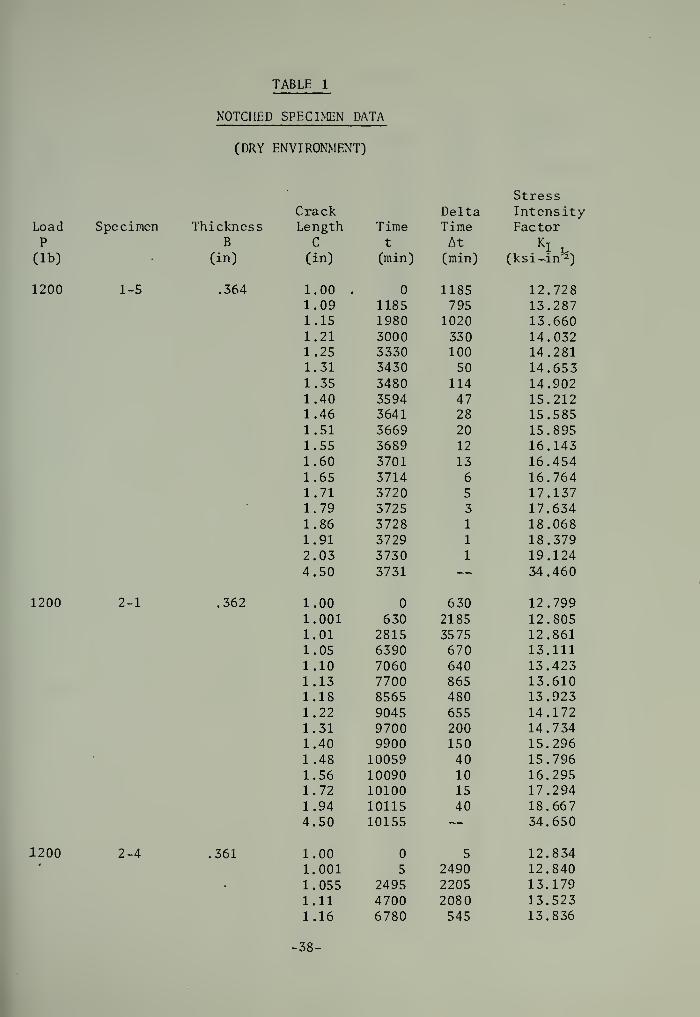
TABLE 1
NOTCHED SPECBEN DATA
(DRY ENVIRONMENT)
LoadP
(lb)
1200
Specimen
1-5
1200 2-1
1200 2-4
StressCrack Delta Intensity
Thickness Length Time Time FactorB C t At K
I ,
(in) (in) (min) (min) (ksi-in^)
.364 1.00 . 1185 12.7281.09 1185 795 13.2871.15 1980 1020 13.6601.21 3000 330 14.0321.25 3330 100 14.2811.31 3430 50 14.6531.35 3480 114 14.9021.40 3594 47 15.2121.46 3641 28 15.5851.51 3669 20 15.8951.55 3689 12 16.1431.60 3701 13 16.4541.65 3714 6 16.7641.71 3720 5 17.137
-
1.79 3725 3 17.6341.86 3728 1 18.0681.91 3729 1 18.3792.03 3730 1 19.1244.50 3731 — 34.460
.362 1.00 630 12.7991.001 630 2185 12.S051.01 2815 3575 12.8611.05 6390 670 13.1111.10 7060 640 13.4231.13 7700 865 13.6101.18 8565 480 13.9231.22 9045 655 14.1721.31 9700 200 14.7341.40 9900 150 15.2961.48 10059 40 15.7961.56 10090 10 16.2951.72 10100 15 17.2941.94 10115 40 18.6674.50 10155 — 34.650
.361 1.00 5 12.8341.001 5 2490 12.840
. 1.055 2495 2205 13.1791.11 4700 2080 13.5231.16 6780 545 13.836
-38-

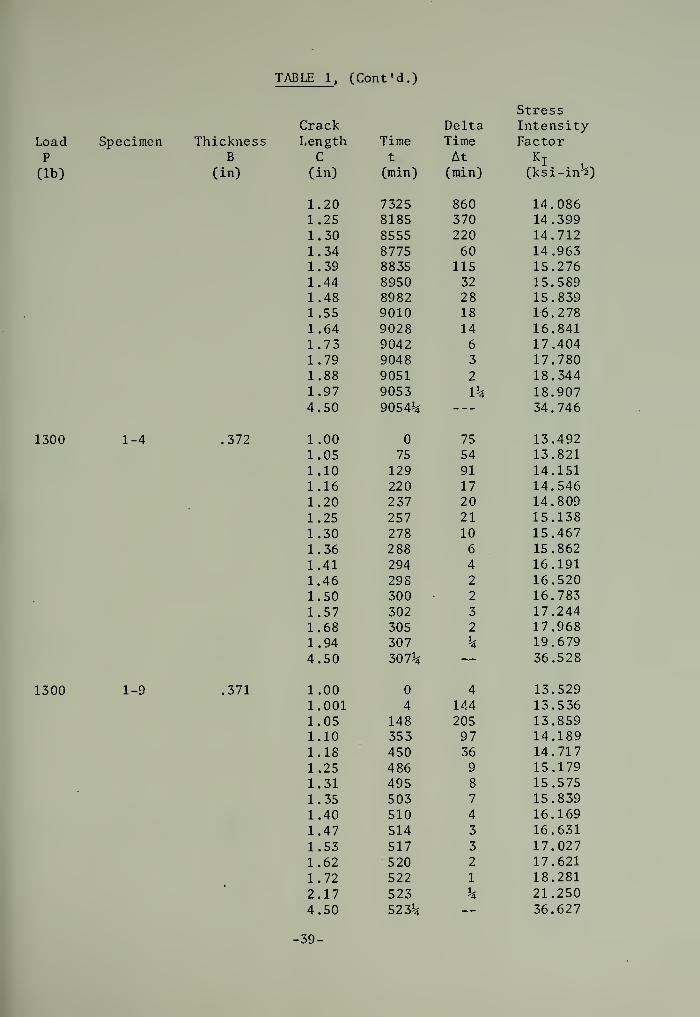
TABLE 1, (Cont'd.)
Load SpecimenP
(lb)
1300 1-4
1300 1-9
StressCrack Delta Intensity
Thickness Length Time Time FactorB C t At K
I
(in) (in) (min) (min) (ksi-in^)
1.20 7325 860 14.0861.25 8185 370 14.3991.30 8555 220 14.7121.34 8775 60 14.9631.39 8835 115 15.2761.44 8950 32 15.5891.48 8982 28 15.8391.55 9010 18 16.2781.64 9028 14 16.8411.73 9042 6 17.4041.79 9048 3 17.7801.88 9051 2 18.3441.97 9053 1% 18.9074.50 9054% 34.746
.372 1.00 75 13.4921.05 75 54 13.8211.10 129 91 14.1511.16 220 17 14.5461.20 237 20 14.8091.25 257 21 15.1381.30 278 10 15.4671.36 288 6 15.8621.41 294 4 16.1911.46 298 2 16.5201.50 300 2 16.783
1.57 302 3 17.2441.68 305 2 17.9681.94 307 % 19.6794.50 307% — 36.528
.371 1.00 4 13.5291.001 4 144 13.5361.05 148 205 13.8591.10 353 97 14.1891.18 450 36 14.7171.25 486 9 15.1791.31 495 8 15.5751.35 503 7 15.8391.40 510 4 16.1691.47 514 3 16.631
1.53 517 3 17.0271.62 520 2 17.621
1.72 522 1 18.281
2.17 523 % 21.250
4.50 523% — 36.627
39-

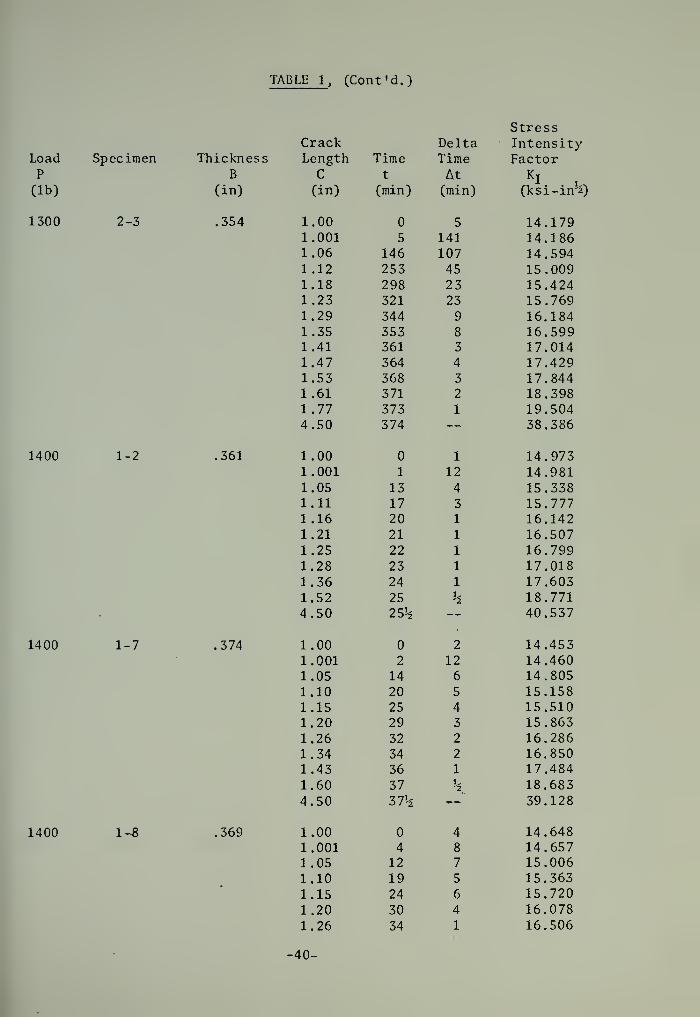
TABLE 1, (Cont'd.)
Load SpecimenP
(lb)
1300 2-3
1400 1-2
1400 1-7
1400 1-8
StressCrack Delta Intensity
Thickness Length Time Time FactorB C t At K
I(in) (in) (min) (min) (ksi-in'S)
.354 1.00 5 14.1791.001 5 141 14.1861.06 146 107 14.5941.12 253 45 15.0091.18 298 23 15.4241.23 321 23 15.7691.29 344 9 16.1841.35 353 8 16.5991.41 361 3 17.0141.47 364 4 17.4291.53 368 3 17.8441.61 371 2 18.3981.77 373 1 19.5044.50 374 — 38.386
.361 1.00 1 14.9731.001 1 12 14.9811.05 13 4 15.3381.11 17 3 15.7771.16 20 1 16.1421.21 21 1 16.5071.25 22 1 16.7991.28 23 1 17.0181.36 24 1 17.6031.52 25 k 18.7714.50 25% — 40.537
.374 1.00 2 14.4531.001 2 12 14.4601.05 14 6 14.8051.10 20 5 15.1581.15 25 4 15.5101.20 29 3 15.8631.26 32 2 16.2861.34 34 2 16.8501.43 36 1 17.4841.60 37 h 18.6834.50 37% — 39.128
.369 1.00 4 14.6481.001 4 8 14.6571.05 12 7 15.0061.10 19 5 15.3631.15 24 6 15.7201.20 30 4 16.0781.26 34 1 16.506
-40-


TABLE 1, (Cont'd.)
LoadP
(lb)
Specimen
1500 1-3
1500 1-6
1500 2-2
1600 4-4
StressCrack Delta Intensity
Thickness Length Time Time FactorB C t At K
I ,
(in).
(in) (min) (min) (ksi-in'S
1.31 35 1 16.8641.36 36 1 17.2211.45 37 1 17.8641.76 38 h 20.0794.50 38% — 39.658
.367 1.00 2 15.7801.001 2 1 15.7881.03 3 2 16.0111.08 5 1 16.3961.10 6 1 16.5501.15 7 1 16.9351.20 8 1 17.3201.34 9 1 18.3984.50 10 — 42.723
.369 1.00 1 15.6951.001 1 2 15.7021.02 3 2 15.8481.03 5 1 15.9241.04 6 1 16.0011.09 7 1 16.3841.12 8 1 16.6141.19 9 1 17.1491.24 10 1 17.5321.45 11 h 19.0634.50 11% — 42.491
.354 - 1.00 l 16.3601.001 1 l 16.3681.02 2 l 16.5191.03 3 l 16.5991.05 4 l 16.7591.06 5 l 16.8391.09 6 l 17.0781.12 7 l 17.3171.19 8 l 17.8761.31 9 .75 18.8344.50 9.75 — 44.291
.362 1.001 .883 17.0731.05 0.883 .300 17.481
1.10 1.183 .134 17.8971.15 1.317 .066 18.3141.20 1.383 .134 18.730
.41.


TABLE 1, (Cont'd.)
Load SpecimenP
(lb)
1600 4-6
StressCrack L"lelta Intensity
ickness Length Time Time FactorB C t At K
I ,
(in) (in) (min) ( min) (ksi-in^)
1.25 1.517 .133 19.1461.35 1.650 .083 19.9791.75 1.733 — 23.308
.358 1.001 .583 17.2641.05 0.583 .134 17.6771.10 0.717 .083 18.0971.15 0.800 .133 18.5181.20 0.933 .067 18.9391.25 1.000 .050 19.3601.30 1.050 .033 19.7811.35 1.083 .050 20.2021.40 1.133 .017 20.6231.45 1.150 — 21.044
-42-,

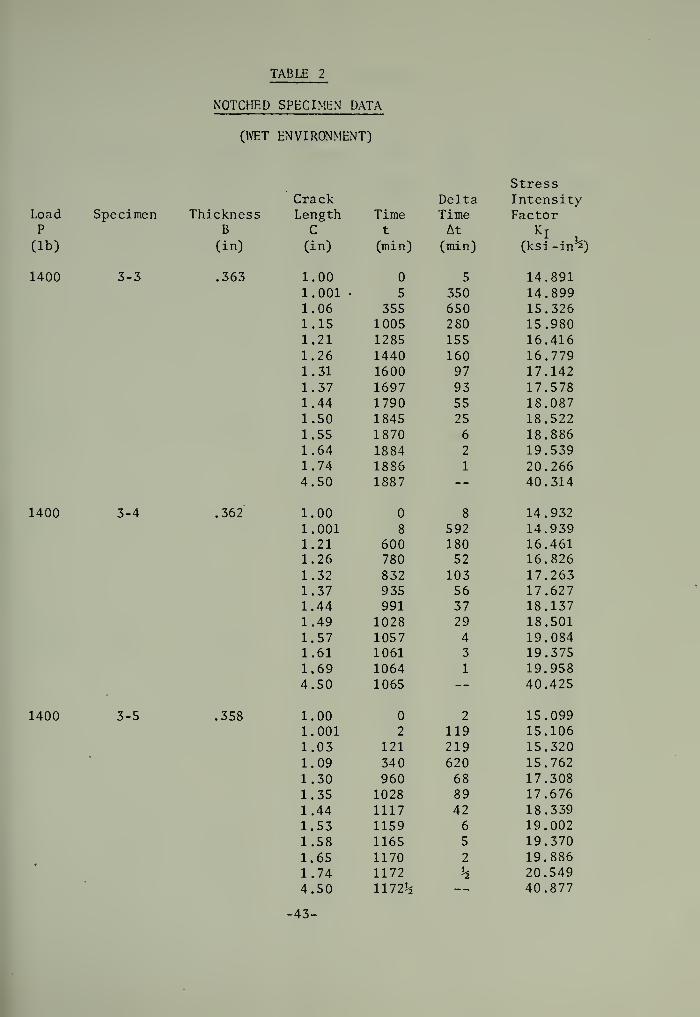
TABLE 2
NOTCHED SPECIMEN DATA
(WET ENVIRONMENT)
LoadP
(lb)
1400
Specimen
3-3
1400 3-4
1400 3-5
StressCrack Delta Intensity
Thickness Length Time Time FactorB C t At K
I ,
(in) (in) (min) (min) (ksi-in^)
.363 1.00 5 14.8911.001 • 5 350 14.8991.06 355 650 15.3261.15 1005 280 15.9801.21 1285 155 16.4161.26 1440 160 16.7791.31 1600 97 17.1421.37 1697 93 17.5781.44 1790 55 18.0871.50 1845 25 18.5221.55 1870 6 18.8861.64 1884 2 19.5391.74 1886 1 20.2664.50 1887 -- 40.314
.362 1.00 8 14.9321.001 8 592 14.9391.21 600 180 16.4611.26 780 52 16.8261.32 832 103 17.2631.37 935 56 17.6271.44 991 37 18.1371.49 1028 29 18.5011.57 1057 4 19.0841.61 1061 3 19.3751.69 1064 1 19.9584.50 1065 — 40.425
.358 1.00 2 15.0991.001 2 119 15.1061.03 121 219 15.3201.09 340 620 15.7621.30 960 68 17.3081.35 1028 89 17.6761.44 1117 42 18.3391.53 1159 6 19.0021.58 1165 5 19.3701.65 1170 2 19.8861.74 1172 h 20.5494.50 1172% — 40.877
-43-

TABLE 2, (Cont'd.)
Load SpecimenP
(lb)
1500 2-6
1500 2-7
1500 2-8
1600 2-9
StressCrack Delta Intensity
Thickness Length Time Time FactorB C t At K
I ,
(in) (in) (min) (min) (ksi-in^)
.358 1.00 7 16.1771.001 7 33 16.1851.05 40 54 16.5721.11 94 99 17.0451.19 193 100 17.6771.26 293 42 18.2291.31 335 33 18.6231.37 368 4 19.0971.41 372 1 19.4131.45 373 % 19.7284.50 373% — 43.797
.363 1.00 3 15.9541.001 3 167 15.9621.18 170 44 17.3551.23 214 52 17.7441.28 266 55 18.1331.33 321 12 18.5231.38 333 27 18.9121.43 360 17 19.3011.49 377 4 19.7681.53 381 1 20.0791.57 382 1 20.3901.62 383 % 20.7804.50 383% -- 43.193
.358 1.00 5 16.1771.001 5 24 16.1851.09 29 36 16.8871.14 65 37 17.2821.20 102 33 17.7551.25 135 30 18.1501.32 165 15 18.7021.37 180 14 19.0971.44 194 11 19.6491.53 205 3 20.3601.62 208 % 21.0704.50 208% — 43.797
.360 1.00 1 17.1601.001 1 9 17.168
1.05 10 9 17.5781.09 19 . 11 17.913
1.13 30 5 18.248
-44-

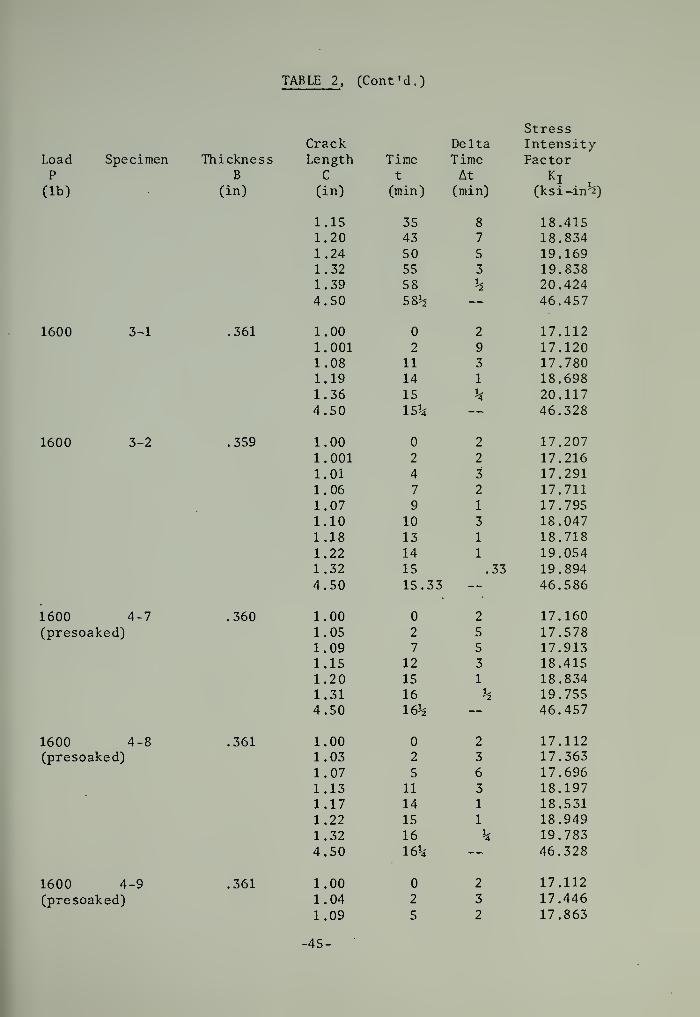
TABLE 2, (Cont'd.)
Load SpecimenP
(lb)
1600 3-1
1600 3-2
1600 4-7(presoaked)
1600 4-8(presoaked)
1600 4-9(presoaked)
StressCrack Delta Intensity
Thickness Length Time Time FactorB C t At K
Ii
(in) (in) (min) (min) (ksi-in^)
1.15 35 8 18.4151.20 43 7 18.8341.24 50 5 19.1691.32 55 3 19.8381.39 58 h 20.4244.50 S8h — 46.457
.361 1.00 2 17.1121.001 2 9 17.1201.08 11 3 17.7801.19 14 1 18.6981.36 15 % 20.1174.50 15% — 46.328
.359 1.00 2 17.2071.001 2 2 17.2161.01 4 3 17.2911.06 7 2 17.7111.07 9 1 17.7951.10 10 3 18.0471.18 13 1 18.7181.22 14 1 19.0541.32 15 .33 19.8944.50 15.33 — 46.586
.360 1.00 2 17.1601.05 2 5 17.5781.09 7 5 17.9131.15 12 3 18.4151.20 15 1 18.8341.31 16 h 19.7554.50 16% — 46.457
.361 1.00 2 17.1121.03 2 3 17.3631.07 5 6 17.6961.13 11 3 18.1971.17 14 1 18.5311.22 15 1 18.9491.32 16 h 19.7834.50 16% — 46.328
.361 1.00 2 17.112
1.04 2 3 17.446
1.09 5 2 17.863
-45-


TABLE 2, (Cont'd.)
Load SpecimenP
(lb)
StressCrack Delta Intensity
Thickness Length Time Time FactorB C t At K I ,
(in) (in) (min) (min) (ksi-in-5)
1.10 7 3 17.9471.13 10 1 18.1971.15 11 1 18.3641.20 12 1 18.7821.35 13 k 20.0344.50 13% — 46.328
-46-

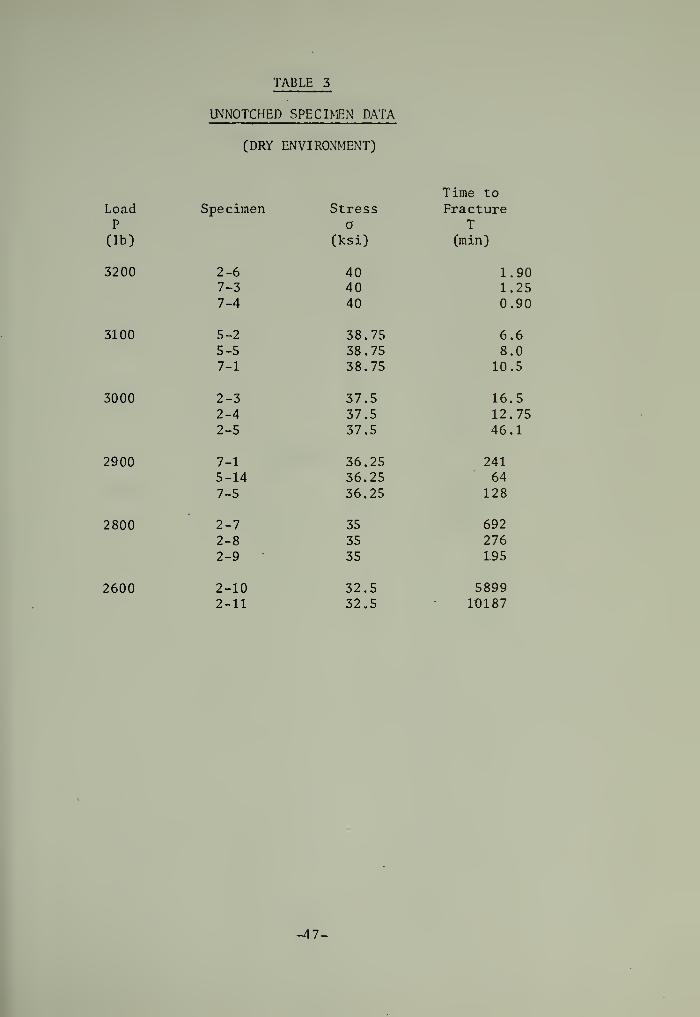
TABLE 3
UNNOTCHED SPECINEN DATA
(DRY ENVIRONMENT)
Time to
Load Specimen Stress FractureP a T(lb) (ksi) (min)
3200 2-6 40 1.907-3 40 1.257-4 40 0.90
3100 5-2 38.75 6.65-5 38.75 8.07-1 38.75 10.5
3000 2-3 37.5 16.52-4 37.5 12.752-5 37.5 46.1
2900 7-1 36.25 2415-14 36.25 647-5 36.25 128
2800 2-7 35 6922-8 35 2762-9 35 195
2600 2-10 32.5 58992-11 32.5 10187
-47-

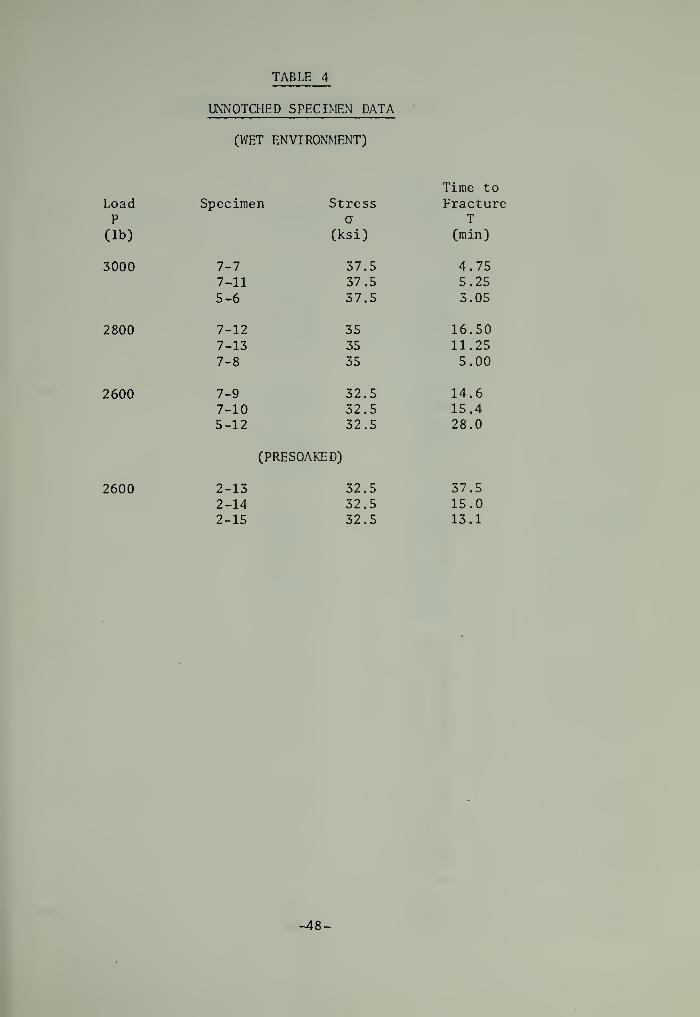
TABLE 4
UNNOTCHED SPECIMEN DATA
(WET ENVIRONMENT)
Time toLoad Specimen Stress FractureP a T(lb) (ksi) (min)
3000 7-7 37.5 4.755.253.05
vii 16.5011.255.00
2600 7-'j 14.615.428.0
2600 2-13 32.5 37.515.013.1
lecimen Stressa
(ksi)
7-7 37.57-11 37.55-6 37.5
7-12 357-13 35
7-8 35
7-9 32.57-10 32.55-12 32.5
(PRESOAKED)
2-13 32.52-14 32.52-15 32.5
-48-

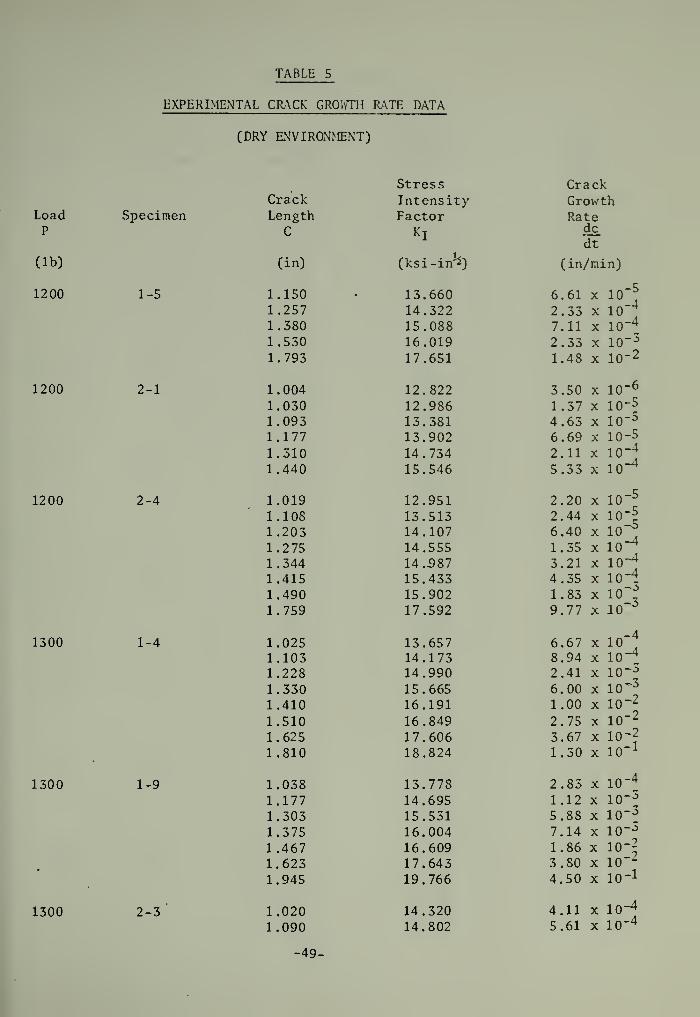
TABLE 5
EXPERIMENTAL CRACK GROWTH RATE DATA
(DRY ENVIRONMENT)
LoadP
(lb)
1200
Specimen
1-5
1200 2-1
1200 2-4
1300 1-4
1300 1-9
1300 2-3
Stress CrackCrack Intensity GrowthLength
C
Factor Ratedcdt
(in) (ksi-in^) (in/min)
1.150 13.660 6.61 X 1011.257 14.322 2.33 X lO"
4
1.380 15.088 7.11 X lO"4
1.530 16.019 2.33 X 10~3
1.793 17.651 1.48 X 10⁻²
1.004 12.822 3.50 X 10⁻⁶
1.030 12.986 1.37 X 10⁻⁵
1.093 13.381 4.63 X lO" 5
1.177 13.902 6.69 X 10⁻⁵
1.310 14.734 2.11 X lO"4
1.440 15.546 5.33 X IO"4
1.019 12.951 2.20 X io-5
1.108 13.513 2.44 X lO"3
1.203 14.107 6.40 XIO"41.275 14.555 1.35 X
1.344 14.987 3.21 X io-4
1.415 15.433 4.35 X io;4
10J10
1.490 15.902 1.83 X
1.759 17.592 9.77 X
1.025 13.657 6.67 X 10 "-44
1.103 14.173 8.94 X IO"4
1.228 14.990 2.41 X IO"3
1.330 15.665 6.00 X io-3
1.410 16.191 1.00 X 10~2
1.510 16.849 2.75 X IO" 2
1.625 17.606 3.67 X 10Z2
10 l1.810 18.824 1.30 X
1.038 13.778 2.83 X IO"4
1.177 14.695 1.12 X IO" 3
1.303 15.531 5.88 X IO" 3
1.375 16.004 7.14 X IO"5
1.467 16.609 1.86 X 10⁻²
1.623 17.643 3.80 X IO"2
1.945 19.766 4.50 X io- 1
1.020 14.320 4.11 X IO"4
1.090 14.802 5.61 X IO"4
-49-

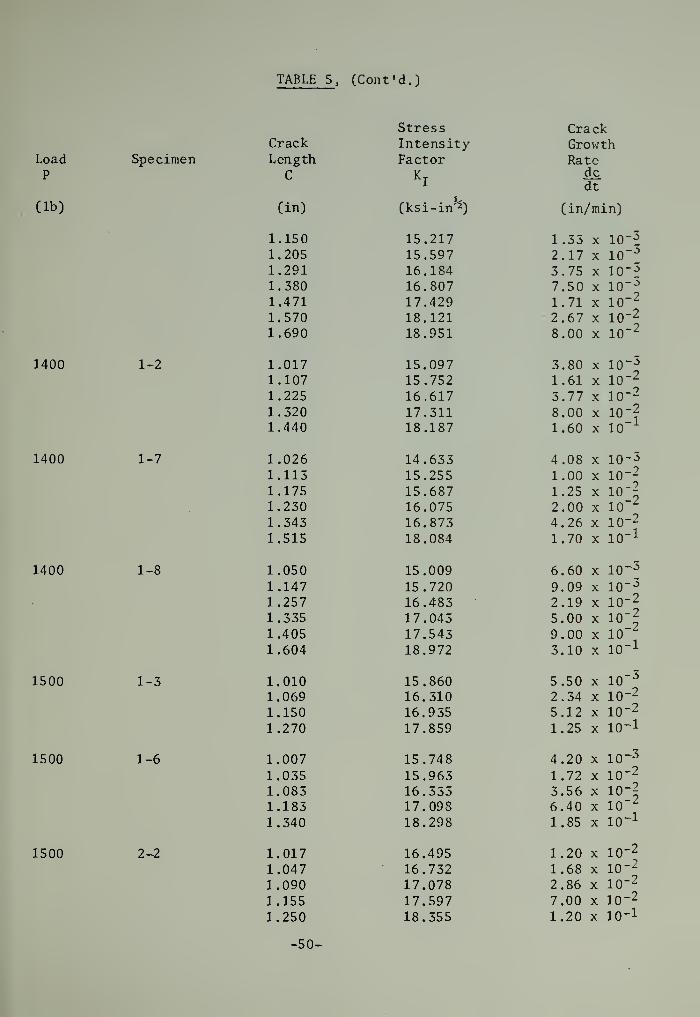
TABLE 5, (Cont'd.)
LoadP
(lb)
Specimen
1400 1-2
1400 1-7
1400 1-8
1500 1-3
1500 1-6
1500 2-2
Stress CrackCrack Intensity GrowthLength Factor Rate
C KI
<1c^It
(in) (ksi-in^) (in/min)
1.150 15.217 1.33 X 10⁻³
1.205 15.597 2.17 X io"-5
1.291 16.184 3.75 X 10'3
1.380 16.807 7.50 X io-
-3
1.471 17.429 1.71 X 10" 2
1.570 18.121 2.67 X lO- 2
1.690 18.951 8.00 X lO" 2
1.017 15.097 3.80 X 10~3
1.107 15.752 1.61 X 10~2
1.225 16.617 3.77 X io- 2
1.320 17.311 8.00 X 10⁻¹
10i1.440 18.187 1.60 X
1.026 14.633 4.08 X io- 3
1.113 15.255 1.00 X IO" 2
1.175 15.687 1.25 X io:2
10"1.230 16.075 2.00 X
1.343 16.873 4.26 X io- 2
1.515 18.084 1.70 X IO" 1
1.050 15.009 6.60 X 10~3
1.147 15.720 9.09 X IO" 3
1.257 16.483 2.19 X IO" 2
1.335 17.043 5.00 X IO" 2
101.405 17.543 9.00 X1.604 18.972 3.10 X io- 1
1.010 15.860 5.50 X IO" 3
1.069 16.310 2.34 X IO"2
1.150 16.935 5.12 X io-2
1.270 17.859 1.25 X io- 1
1.007 15.748 4.20 X IO"3
1.035 15.963 1.72 X 10~ 2
1.083 16.333 3.56 X10
l1.183 17.098 6.40 X1.340 18.298 1.85 X io- 1
1.017 16.495 1.20 X io-2
1.047 16.732 1.68 X io-2
1.090 17.078 2.86 X io-2
1.155 17.597 7.00 X 10"2
1.250 18.355 1.20 X io-1
-50-

TABLE 5, (Cont'd.)
LoadP
(lb)
1600
Specimen
4-4
CrackLength
C
(in)
1.0251.0751.1251.2001.300
StressIntensityFactor
KI
(ksi-in"2)
17.27717.68918.10618.73019.563
CrackGrowthRate
dt
(in/min)
5.55 x 10~2
1.82 x 10"1
3.73 x 10"}5.00 x 10
_1
7.52 x 10" 1
1600 4-6 1.0261.0751.1501.2251.2761.350
17.47117.88718.51819.15019.57120.202
8.403.734.637.461.001.21
10'
1010"
1010
10
-1
-1
-SI-


TABLE 6
EXPERIMENTAL CRACK GROWTH RATE DATA
Load SpecimenP
(lb)
1400 3-3
1400 3-4
1400 3-5
1500 2-6
1500 2-7
1500 2-8
(WET ENVIRONNENT)
Stress CrackCrack Intensity GrowthLength
C
Factor
Kl
Ratedcdt
(in) (ksi-in 2) (in/'min)
1.053 15.274 1.49 X <10
41.260 16.779 3.17 X
1.373 17.602 6.84 X ier«10
-310 s
1.512 18.609 1.09 X1.563 18.982 3.59 X
1.690 19.903 5.00 X lO- 2
1.118 15.790 3.43 X 10⁻⁴
1.317 17.239 9.36 X ioi1.405 17.882 1.25 X
1QJ10 "*1.465 18.319 1.35 X
1.530 18.793 2.26 X 10⁻⁵
1.590 19.230 1.00 X lO' 2
1.650 19.667 2.67 X lO"2
1.030 15.322 2.65 X io-J10
AlO"
41.195 16.535 3.39 X
1.325 17.492 7.35 X
1.395 18.008 1.01 X
10-5
10J10
-210
z
1.485 18.671 2.14 X
1.555 19.186 7.14 X
1.615 19.628 1.40 X
1.695 20.218 4.50 X
1.102 16.981 9.05 X lO"4
1.313 18.650 3.07 X lO"5
1.390 19.255 7.50 X io-31.430 19.571 4.00 X 10~2
1.138 17.030 1.05 X lO" 3
1.355 18.718 1.60 X 10⁻³
io-10
2
10z
1.460 19.535 3.53 X
1.510 19.924 1.00 X
1.573 20.416 4.50 X
1.170 17.519 1.51 X lO"3
lO-31.313 18.650 2.67 X
1.405 19.373 5.00 X 10Z3
io i1.485 20.005 8.18 X
1.575 20.715 3.00 X 10~ z
-52-


TABLE 6, (Cont'd.)
Load SpecimenP
(lb)
1600 2-9
1600 3-1
1600 3-2
Stress CrackCrack Intensity GrowthLength
C
Factor Ratedcdt
(in) (ksi-in^) (in/min)
1.105 18.039 4.12 X 10~3
1.197 18.806 5.72 X IO"3
1.280 19.504 1.55 X IO" 2
1.355 20.131 2.40 X 10" 2
1.0005 17.116 5.00 X 10~4
1.040 17.450 8.78 X IO" 3
1.139 18.274 3.67 X io- 2
1.275 19.408 1.70 X IO" 1
1.0005 17.212 5.00 X lo:43
10*1.006 17.254 4.50 X
1.047 17.599 1.20 X io-2
1.117 18.187 2.75 X io-2
1.200 18.886 4.00 X IO" 2
1.270 19.474 1.00 X IO" 1
-53-


TABLE 7
THEORETICAL CRACK GROWTH RATE DATA
(DRY ENVIRONMENT)
(af b 40.625 ksi; s = 1.9685 ksi per decade of minutes; ^q = 17.4 ksi-in"2
;
n = 0.5)
K exp|2.3ff(l-{K }n)j dc_
s Ko dt
(ksi-in"2) (minutes) (in/min)
12 3126.85 6.40 x 10" 6.
13 625.26 3.20 x 10 -5
14 132.87 1.51 x 10⁻⁴
15 29.82 6.71 x 10~4
16 7.026 2.85 x 10" 3
17 1.7312 1.16 x 10"2
18 0.4442 4.50 x 10" 2
19 0.1183 1.69 x 10" 1
20 0.0326 6.13 x 10" 1
21 0.00928 2.16
-54-

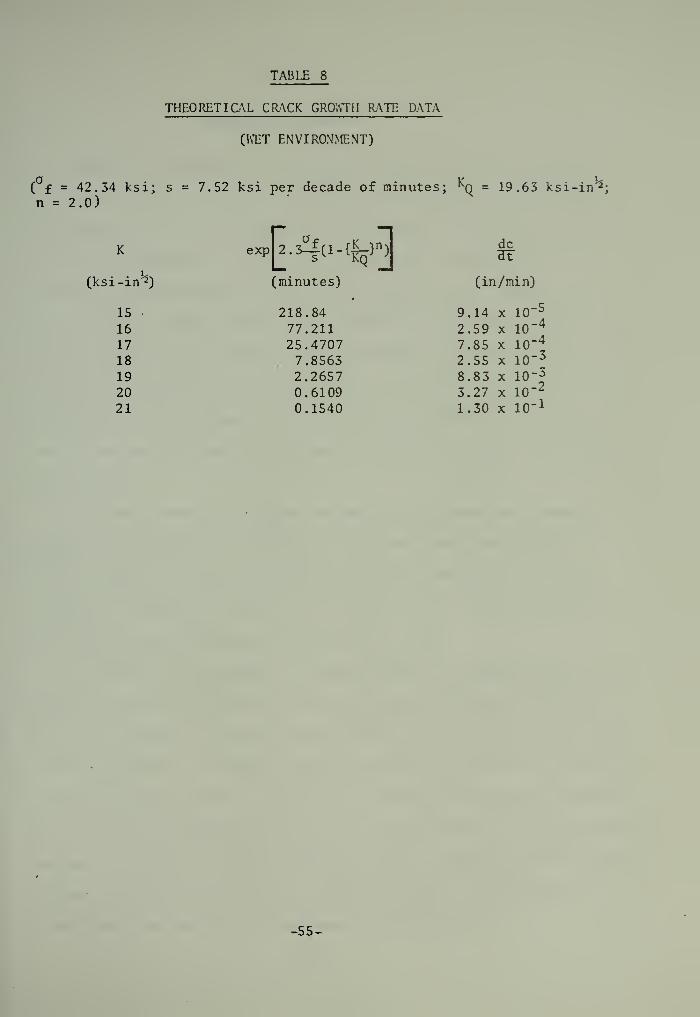
TABLE 8
THEORETICAL CRACK GROWTH RATE DATA
(WET ENVIRONMENT)
( f = 42.34 ksi; s = 7.52 ksi per decade of minutes; ^q = 19.63 ksi-in"5;
n = 2.0)
(ksi -in'2)
15
16
17
18
19
20
21
exp£-4»-<%>n
]dc
(minutes) (in/min)
218.84 9.14 x 10⁻⁵
77.211 2.59 x 10" 4
25.4707 7.85 x 10⁻⁴
7.8563 2.55 x 10" 3
2.2657 8.83 x 10~ 3
0.6109 3.27 x 10⁻²
0.1540 1.30 x 10_1
-55-

APPENDIX C
SPECIMEN FABRICATION
Compression molding was used to fabricate the GRP plates in order
to provide uniformity among the specimens. The E-glass reinforcement
(Style 181: 57 yarns per inch warp, 54 yarns per inch fill; 8.94 oz/yd 2;
satin weave--Uniglass , Ind.) was supplied with a polyester compatible
finish Dy the manufacturer (Fig. 1). The fabric was cut from 38 inch
wide roll into sections measuring 9.75 inches by 16.5 inches to fit into
the mold. Two sheets of mylar of the appropriate size were used as outer
covering to protect the press and the male half of the mold, as well as
to yield a smooth specimen which could easily be removed. The female
half of the mold was sprayed with Frekote Mold Release Agent to facilitate
easy removal
.
The resin (number 4155 Laminae Polyester resin--American Cyanamid
Company) was weighed in a one-gallon container. Methyl ethyl ketone
peroxide (Specialty Chemicals Division; Reichald Chemicals, Inc.) was
weighed in a seperate container in an amount equal to 0.5% by weight of
the resin and then thoroughly mixed with the resin.
The female mold was placed on a mylar sheet on the lower plate of the
press and the resin with catalyst was then spread generously inside the
mold. Five layers of the fabric were placed on the resin and more resin
poured over them. An aluminum roller was used to work the resin into the
entire area of the fabric. More resin was added and the process repeated
until the desired number of layers was reached (10 layers for the unnotched
specimens, 36 layers for the notched specimens). Adequate penetration and
uniform distribution of the resin as well as complete wetting of the
glass fibers was achieved by firm pressure on the roller.
-56-

Another sheet of mylar was placed on top of the uncured plate
followed by a layer of aluminum foil for extra protection to the press.
For the notched specimens, the male mold was not used and the upper press
plate came in contact with the female mold yielding a plate thickness
equal to that of the female mold, .363 inches. The appropriate shims
were used with the male mold to insure a thickness of 0.10 inches for
the unnotched specimens.
The plates of the press were then brought together and the press
pressure raised to 50 psi for 5 minutes, then 80 psi for 3 minutes, and
finally raised to 250 psi for the purpose of allowing the air and excess
resin to be forced slowly out of this highly viscous mixture. Up to this
time, the plates of the press were kept cool to retard curing during the
lay-up process. The plate temperature was now set at 50°C to promote
uniform setting of the resin. The plate was removed from the press
after two hours, and then postcured at room pressure and 100°C for two
hours. This process yielded notched specimens with an average fiber
volume fraction of 43.3% ± 1.34% and notched specimens with an average
volume fraction of 45.95% ± 1.05%.
The completed plates were then marked and labeled as shown by
example in Figures 2 a and b. The test specimens were machined to the
sizes indicated in Figure 3 using a diamond-edged wheel and a Tensil-Kut
router. The initial crack was cut with a .025" thick diamond-edged wheel.
In all cases, the weak direction (fill) of the fabric was parallel
to the line of action of the applied force so that the crack was pro-
pagated parallel to the warp direction. This was to reduce instances of
deviation of the crack from the intended direction of propagation.
Figure 4 shows some typical specimens after (a) fabrication and (b) testing.
-57-

APPENDIX D
DESCRIPTION OF APPARATUS
The apparatus used consisted of an Instron Model 1211 Dynamic Cycler
and an Instron Universal Testing Machine. Additional apparatus included
a water containment system for submerged testing and a circulating water
presoak bath.
The majority of the testing was performed on the Instron Model 1211
Dynamic Cycler. This is a self-contained servo-electronic-hydraulic
testing instrument capable of automatically maintaining a preset load.
Although it is normally used for sinusoidal load cycling, in this case
it provided a constant load with no cycling. A feedback system connects
the hydraulic ram to which the lower grip assembly is attached to the
load-measuring cell attached to the upper grip assembly. Although the
load is preset it may be adjusted through the use of a "fine tuner", and
is read visually as a percentage of full range with full load ranges of
2000, 4000, and 10,000 pounds available. This machine demonstrated a
second order response typical of most servo -hydraulic machinery with
a rise time of approximately 30 seconds and a maximum overshoot of about
25%. The time until steady state condition ± 5% was about 75 seconds
and therefore the response was assumed to be a step function for all
except the shortest tests. The response times were a function of the
precharge pressure of nitrogen gas in the system mechanical capacitor
which varied a small amount in the months of testing and so only approx-
imations are given to justify the simplification. The grips used for
the unnotched specimens were the common wedge action type, and the grips
for the notched specimens, as well as general views of the Dynamic Cycler,
have been previously reported (3)
.
-58-

APPENDIX D
DESCRIPTION OF APPARATUS
The apparatus used consisted of an Instron Model 1211 Dynamic Cycler
and an Instron Universal Testing Machine. Additional apparatus included
a water containment system for submerged testing and a circulating water
presoak bath
.
The majority of the testing was performed on the Instron Model 1211
Dynamic Cycler. This is a self-contained servo-electronic-hydraulic
testing instrument capable of automatically maintaining a preset load.
Although it is normally used for sinusoidal load cycling, in this case
it provided a constant load with no cycling. A feedback system connects
the hydraulic ram to which the lower grip assembly is attached to the
load-measuring cell attached to the upper grip assembly. Although the
load is preset it may be adjusted through the use of a "fine tuner", and
is read visually as a percentage of full range with full load ranges of
2000, 4000, and 10,000 pounds available. This machine demonstrated a
second order response typical of most servo -hydraulic machinery with
a rise time of approximately 30 seconds and a maximum overshoot of about
25%. The time until steady state condition ± 5% was about 75 seconds
and therefore the response was assumed to be a step function for all
except the shortest tests. The response times were a function of the
precharge pressure of nitrogen gas in the system mechanical capacitor
which varied a small amount in the months of testing and so only approx-
imations are given to justify the simplification. The grips used for
the unnotched specimens were the common wedge action type, and the grips
for the notched specimens, as well as general views of the Dynamic Cycler,
have been previously reported (3)
.
-58-


For the short time tests, the Instron Universal Testing Machine
was used in its manual mode. This is a constant displacement machine
in that the moving cross arm travels at a fixed rate and the load cell
senses the load variation with time so that the out -put of the chart
recorder is load versus displacement. This machine was used as a con-
stant load machine by manually controlling the speed of the cross arm
over the range zero to 20 in/min in order to maintain a constant load
out -put on the chart recorder. After several trial runs, this was a
relatively easy task.
The circulating water presoak bath was used to soak six specimens
for a forty day period prior to testing. It consisted of a three gallon
polyurethane pail with enough distilled water to cover the specimens.
An electric motor driven pump was used to circulate the water on a
continuous basis. Distilled water was added periodically to compensate
for evaporation losses.
A specially-designed water containment system had already been built
for installation on the Dynamic Cycler and minor modifications were made
to it to allow for the use of a different gripping assembly than it was
designed to accommodate. The system was a five sided rectilinear box
made of 3/8" plexiglas, open at the top and with a hole in the bottom
through which the grip holders were threaded into the moveable lower ram
of the Dynamic Cycler. Water-tight integrity was maintained at the hole
by using a 1-3/4" rubber 0-ring and a 5" diameter nut. The box was as-
sured water-tightness by dismantling it, recoating all the mating surfaces
with RTV silicone rubber adhesive/sealant (General Electric Co.), and
reassembling it.
A special timing device was constructed to record the time at
-59-


which an unnotched specimen failed. It consisted of an electric clock
with day, hour, minute, and second indicators and a switching device.
When the specimen broke, and the ram lowered the lower grips, this
switch created an open circuit and thus stopped the clock. Lag time
between failure and clock stoppage was less than four seconds.
-60-


Thes f
s
B21423463002
Bartron
Fracture of FRP f nmarine applications-constant load crack'
~6 SEP-!R/"opagationPISPLAY
/
_JThesB242:
is
3U6 BartronFracture of FRP in
marine applications:constant load crackpropagation.
? n n o

lhesB242346
Fracture of FRP in marine applications :
3 2768 002 01493 8DUDLEY KNOX LIBRARY
Related Documents