Habitat International 30 (2006) 849–862 Formulating waste management strategies based on waste management practices of households in Santiago de Cuba, Cuba Hans Joachim Mosler a, , Silke Drescher b , Christian Zurbru¨gg b , Tamara Caballero Rodrı´guez c , Omar Guzma´n Miranda c a University of Zurich, Switzerland b Swiss Federal Institute for Environmental Science and Technology, Switzerland c Universidad de Oriente, Santiago de Cuba, Cubat, Cuba Abstract Rapid urbanisation, population growth and changes in lifestyles in low- and middle-income countries contribute to increasing the per capita domestic waste generation. This trend leads to deplorable environmental and public health conditions, especially in rapidly expanding cities of low- and middle-income countries lacking appropriate waste management systems, Santiago de Cuba is no exception. To improve solid waste management in the city of Santiago de Cuba, the generation of household waste was studied and individual waste treatment approaches were assessed. The principle of a household level analysis was adopted to enable the development of strategies based on the specific conditions of households, their awareness and needs. In February 2004, a survey covering 1180 households was conducted on issues such as monthly consumed goods, waste generated and its treatment. The waste generated by the households was subsequently assessed by means of a measuring campaign. The measured volume not only comprised the collected waste fraction but also the waste materials treated on- site or recovered and recycled by all the different means available. The paper contains the results of the composition and distribution of the waste generated by the households as a function of socio-demographic data. Furthermore, the paper describes the various household treatment strategies dependent on specific waste material types. Several types of household waste can be differentiated by statistical cluster analysis. These household types are characterised not only by the amount of waste generated but also by socio-economic status and waste treatment practices. The results obtained are used to develop a range of waste management strategies, each relating to a household type and characterised by its generated amount, waste material type and spatial urban distribution. Since the strategies are adapted to the requirements and needs of the households, they are more readily accepted by the population concerned. Such socially anchored strategies will contribute to improving the waste situation in the city of Santiago de Cuba and allow an optimised allocation of local resources. r 2005 Elsevier Ltd. All rights reserved. Keywords: Household waste management; Recycling; Waste reduction; Recycling behaviour; Santiago de Cuba ARTICLE IN PRESS www.elsevier.com/locate/habitatint 0197-3975/$ - see front matter r 2005 Elsevier Ltd. All rights reserved. doi:10.1016/j.habitatint.2005.09.008 Corresponding author. Department of Systems Analysis, Integrated Assessment and Modelling, berlandstrasse 133, P.O. Box 611, 8600 D + ubendorf, Switzerland. Tel.: +41 44 823 5542; fax: +41 44 823 5375. E-mail address: [email protected] (H.J. Mosler).

Welcome message from author
This document is posted to help you gain knowledge. Please leave a comment to let me know what you think about it! Share it to your friends and learn new things together.
Transcript

ARTICLE IN PRESS
0197-3975/$ - se
doi:10.1016/j.ha
�Correspond8600 D +ubendor
E-mail addr
Habitat International 30 (2006) 849–862
www.elsevier.com/locate/habitatint
Formulating waste management strategies basedon waste management practices of households
in Santiago de Cuba, Cuba
Hans Joachim Moslera,�, Silke Drescherb, Christian Zurbruggb,Tamara Caballero Rodrıguezc, Omar Guzman Mirandac
aUniversity of Zurich, SwitzerlandbSwiss Federal Institute for Environmental Science and Technology, Switzerland
cUniversidad de Oriente, Santiago de Cuba, Cubat, Cuba
Abstract
Rapid urbanisation, population growth and changes in lifestyles in low- and middle-income countries contribute to
increasing the per capita domestic waste generation. This trend leads to deplorable environmental and public health
conditions, especially in rapidly expanding cities of low- and middle-income countries lacking appropriate waste
management systems, Santiago de Cuba is no exception. To improve solid waste management in the city of Santiago de
Cuba, the generation of household waste was studied and individual waste treatment approaches were assessed. The
principle of a household level analysis was adopted to enable the development of strategies based on the specific conditions
of households, their awareness and needs.
In February 2004, a survey covering 1180 households was conducted on issues such as monthly consumed goods, waste
generated and its treatment. The waste generated by the households was subsequently assessed by means of a measuring
campaign. The measured volume not only comprised the collected waste fraction but also the waste materials treated on-
site or recovered and recycled by all the different means available.
The paper contains the results of the composition and distribution of the waste generated by the households as a
function of socio-demographic data. Furthermore, the paper describes the various household treatment strategies
dependent on specific waste material types. Several types of household waste can be differentiated by statistical cluster
analysis. These household types are characterised not only by the amount of waste generated but also by socio-economic
status and waste treatment practices. The results obtained are used to develop a range of waste management strategies,
each relating to a household type and characterised by its generated amount, waste material type and spatial urban
distribution. Since the strategies are adapted to the requirements and needs of the households, they are more readily
accepted by the population concerned. Such socially anchored strategies will contribute to improving the waste situation in
the city of Santiago de Cuba and allow an optimised allocation of local resources.
r 2005 Elsevier Ltd. All rights reserved.
Keywords: Household waste management; Recycling; Waste reduction; Recycling behaviour; Santiago de Cuba
e front matter r 2005 Elsevier Ltd. All rights reserved.
bitatint.2005.09.008
ing author. Department of Systems Analysis, Integrated Assessment and Modelling, berlandstrasse 133, P.O. Box 611,
f, Switzerland. Tel.: +41 44 823 5542; fax: +41 44 823 5375.
ess: [email protected] (H.J. Mosler).
ARTICLE IN PRESSH.J. Mosler et al. / Habitat International 30 (2006) 849–862850
Introduction
Inappropriate waste handling, storage, collection and disposal practices pose environmental and publichealth risks. In densely populated urban centres for example, appropriate and safe solid waste management(SWM) is of utmost importance to create a healthy environment for the population. Although mostgovernments have acknowledged this fact (Rabinovitch, 1997), numerous municipalities are hardly capable ofproviding even the most basic services. According to the World Resources Institute (1996) one to two thirds ofthe municipal solid waste generated in the developing world is dumped indiscriminately on streets or in drains,thus causing floods, insect and rodent breeding grounds and the spread of diseases (UNEP-IETC, HIID,1996). The collected waste is generally dumped on land in a more or less uncontrolled manner. Suchuncontrolled waste disposal not only creates serious environmental problems and affects human and animalhealth but also causes serious financial and socio-economic losses. Due to inadequate waste disposal, surfaceand groundwater are contaminated by leachate, the soil by direct waste contact or leachate, the air by burningof waste, the spread of diseases by different vectors such as birds, insects and rodents, or the uncontrolledrelease of methane from anaerobic waste decomposition (Schertenleib & Meyer, 1992).
The traditional approach applied to environmental problems has been one of ‘‘command and control’’ bythe responsible authorities, which largely apply ‘‘end-of-pipe’’ solutions to existing problems. In the past, allwaste management elements were often only evaluated from a purely engineering and technical viewpointinstead of being embedded in a local, institutional, socio-cultural and economic context, which is alsoinfluenced by national, political and regulatory aspects as well as national, global and economic factors.
In the last decade, focus has shifted towards finding approaches which could possibly avoid or tackle theproblem as close to its source as possible. Central to this strategy is the need to minimise waste generation andenhance recycling. This is achieved by closer collaboration and exchange with the individual municipalresidents. Household involvement is paramount to the success of recycling initiatives, where focus must beplaced on the willingness of the individual to change its current behaviour and participate, provided he/she isinformed and empowered to do so. Several studies report the successful change of household waste handlingbehaviour. Burn (1991) used block leaders increasing recycling behaviour. Wang and Katzev (1990) appliedthe approach of single and group commitment and Katzev and Mishima (1992) a posted feedback to increaserecycling. In other studies the promoters successfully worked with the social context, where each behaviour isembedded (e.g. Derksen & Gartrell, 1993; Hopper & Nielsen, 1991).
This paper describes a study and survey conducted at household level in the city of Santiago de Cuba. Itidentifies specific household waste generation and management patterns, and develops appropriate strategiesfor the various household types to enhance and promote recycling activities.
The study area of Santiago de Cuba Province, the second most populated province of Cuba, is located in thesouth-eastern part of the island of Cuba. It has a population of approximately 1.2 million, with the largest citySantiago de Cuba (554,000 inhabitants) as its main administrative centre. The province is rich in naturalresources such as iron and nickel. The economy, however, relies mostly on agriculture, with large banana,cacao and coffee plantations dotting the landscape. Industry and tourism are expanding in and aroundSantiago de Cuba. In Santiago de Cuba, waste disposal is seen as a major environmental issue. However,official information on waste management is scarce.
Since the 1959 revolution and the subsequent establishment of a one-party communist government, Cubahas created a social service system where the government is exclusively responsible for developing,implementing and financing all aspects of social service delivery (Erikson, Lord, & Wolf, 2002). Private serviceproviders are non-existent, and apart from occasional minor exceptions, the system does not foresee fees forservice provisions.
Due to its special geographic situation, the island of Cuba has limited space for landfill disposal, and oceandumping is detrimental to tourism. Given its economic situation, recovery of secondary materials is of keyimportance in reducing resource dependency from other countries.
Special attention was paid to SWM after an outbreak of Dengue—a disease transmitted by the mosquitoAedes Aegypti (Schleenstein, 2002) and increased incidence of leptospirosis, a disease transmitted byrats (from 4.9 per 100,000 inhabitants in 1990 to 9.8 in 1997). A sectoral analysis conducted on SWM inCuba in 1996, identified a total of 46 critical issues that were used as targets for the subsequent priority
ARTICLE IN PRESSH.J. Mosler et al. / Habitat International 30 (2006) 849–862 851
setting (Delgado Reinoso, 2003). These key issues have been studied at institutional, legal, technical,financial, economic, environmental, health and socio-cultural level. The public cleansing services havesince then been intensified, and the authorities have increased their focus on public involvement andparticipation (Schleenstein, 2002). The socio-cultural aspects pertaining to sector analysis revealed thefollowing:
�
Lack of strategy to educate and inform the community on attaining improved waste behavioural patterns. � Poor systematic environmental education campaigns. � Insufficient socio-cultural community involvement in the waste sector. � Lack of material resources required to support environmental education. � Lack of appropriate waste management awareness by the population, and poor level of knowledge on therelations between SWM and health.
Due to an increase in population and consumption, the city of Santiago de Cuba is confronted with a seriesof waste collection and disposal problems. On the one hand, since fuel shortages are common and all fuel oilhas to be imported, waste collection is often irregular (Rivera, 2001). However, compared to other cities in thedeveloping world (e.g. Halla & Majani, 1999), waste management is quite effective and allow furtherinterventions. On the other hand, landfill space in the current landfill is limited and the setting up of newlandfills outside the city poses additional problems due to increased transport distances requiring more fuel.The city is therefore looking for options to reduce the waste flow to the landfill and, if possible, to increase theuse of secondary raw materials by its industries. This study is embedded in a collaboration project with theUniversidad de Oriente (University of Santiago de Cuba), Materias Primas, Servicios Comunales and Centrode Investigaciones en Energıa Solar. The project aims at assessing the feasibility of different technical wastetreatment options (incineration, anaerobic digestion, etc.) to reduce the final waste disposal volume. The socialcomponent of the project aims at developing a social strategy to reduce waste at household level. To identifysuitable measures, it was necessary to assess the individual solid waste generated by the households, and toanalyse household awareness of waste management. Identification of key patterns helped to developindividual intervention measures to improve the SWM system. The following assumptions summarise the goalof the study:
�
A household-centred analysis allows a clear identification of the waste generation and managementpatterns. � Different types of households can be identified and described by their generated waste and further socio-demographic variables.
� Consequently, type-specific intervention strategies can be developed to reduce the waste at household level. � The strategies developed at household level are more sophisticated and adapted to the actual wastemanagement situation than strategies developed at district level.
Methodology
This paper discusses only part of a more comprehensive socio-technical study on waste handling practices inSantiago de Cuba, and describes the relevant methodologies used to develop waste generation andmanagement strategies. It mainly analyses the current consumption and waste disposal patterns ofhouseholds, and focuses on recyclable materials such as glass, aluminium, metal, organics and PET. Theproject team used a stepwise approach to assess the SWM situation in Santiago de Cuba.
Stakeholder analysis
A rough stakeholder analysis has identified key institutions and organisations involved in SWM. These werethen contacted to obtain a better overview of the current situation.
ARTICLE IN PRESSH.J. Mosler et al. / Habitat International 30 (2006) 849–862852
Household survey
Based on the information obtained, a detailed questionnaire was developed for a household survey andsurvey plan (Cannell, Miller, & Oksenberg, 1981). The standardised questionnaire, comprising acomprehensive set of structured questions to assess quantitative and qualitative data with the SPSS software,is structured as follows:
(1)
Spatial characterisation (areas and buildings) within the defined areas. (2) Socio-demographic information (sex, age, household size, education, occupation and economic standing(e.g. animals or vehicles), etc.
(3) Waste generation and disposal practices at household level (e.g. separation, available storage space). (4) Characterisation of waste types and their reuse. (5) Awareness of existing waste management practices in Santiago de Cuba (e.g. cleanliness of area,satisfaction, need for improvement).
(6) Awareness of selected waste minimisation and treatment strategies at household level (own contribution toreuse, separation or recycling, perceived difficulties, etc.).
(7) Communication practices.Households were chosen according to the ‘‘random route procedure’’ (Hoffmeyer-Zlotnik, 1997), as theinterviewers were sent to randomly selected intersections through the city from where they started assessinghouseholds according to a fixed plan. The samples are therefore representative for the entire city. Analysis wasbased on the questionnaires completed by 1180 households.
Waste measuring campaign
The already interviewed households were subsequently asked to participate in a 1-week waste measuringcampaign. The households were given seven plastic bags and instructed to separate their waste into sevenfractions (organic waste, glass, plastic, paper and cardboard, aluminium, other metals and residues notcovered by the aforementioned categories). Table 1 contains an overview of typical items found in Cubanhousehold waste. At the end of the week, the bags were collected by students, weighed and the resultsincorporated into the existing database.
Statistical analysis
The next step consisted in a combined statistical analysis of the data obtained from the questionnaires andmeasuring campaign. Based on the results of the measuring campaign, the following two different analyseswere conducted:
Spatial analysis
Is the conventional procedure for SWM analysis. The households are grouped into seven administrativeurban districts and the average generation of all waste types is calculated. The important differences in wastegeneration and composition may be due to the economic and social standing of a district. However, such ananalysis does not require a household survey but merely an assessment of the waste collection containers.
Household-focused analysis
The questionnaire and measuring campaign at household level allows a far more detailed analysis, since itplaces the household at the centre of the analysis. The objective is to classify homogenous clusters ofhouseholds as a function of their waste generation and composition and other variables from thequestionnaire. A cluster comprises households exhibiting similar types and amounts of generated waste butclearly differing from other groups. Bivariate correlation analysis was performed with the generatedhousehold waste and socio-demographic variables using Pearsons’ ‘‘r’’ for the level of significance of po0:05
ARTICLE IN PRESS
Table 1
Definition of waste types
Type Composition
Plastic Containers for shampoo, oil, deodorants, medicine, lemonade, tubes
Metal Containers for fruits and vegetables, components of vehicles and machines
Glass Bottles of bier, rum, perfume, and medicine, glasses, window glass
Paper, cardboard Newspapers, packaging
Organic waste Inedible parts of vegetables, fruit peels, food leftovers
Aluminium Cans of bier and soft-drinks, tubes of toothpaste, containers
Residues Sweepings, sand, shoes, leaves, wood, clothes, building material
H.J. Mosler et al. / Habitat International 30 (2006) 849–862 853
(Anderberg, 1973). In combination with socio-economic data, cluster analysis allowed to define differenthousehold waste management patterns and household awareness of waste management practices.
Focus group discussion
Finally, focus group discussions on waste management strategies were conducted with households,municipal waste managers and key persons of the city administration. Thereupon, a list was established ofpossible waste management strategies and interventions relevant to Cuba.
Results
The results are presented simultaneously with the described methodological steps.
SWM stakeholders
Several SWM stakeholders were identified in Santiago de Cuba. This paper only provides a summarisedview, as the detailed results are discussed in Binder and Mosler (submitted for publication):
�
Households play a key role in the context of this study. They generate the waste and already reveal differentwaste handling practices depending on the type of waste generated: (i) reuse of bottles, (ii) disposal ofresidues in household bins, (iii) storage and forwarding of recyclables to a collection service, (iv) offerrecyclables as a gift to relatives or friends; (v) feed organic waste to pigs or chickens, (vi) sale of recyclablesto recycling centres, the so-called ‘‘Casas de Compra’’. The recycling rate in Cuba is exceptionally high for adeveloping country and comparable to countries like Germany and Switzerland. (BUWAL, 2004; seeBinder & Mosler, submitted for publication). � In Santiago de Cuba, the ‘‘Casas de Compra’’ are the recycling centres (see Photo 1). Recyclables like PET,glass and metals are traded in for goods. For example, a household brings 20 empty PET bottles inexchange for a soft drink. ‘‘Casas de Compra’’ have a low reputation and many households prefer to givetheir recyclables to the ‘‘Comite de Defensa de la Revolucion (CDR)’’, which provides a collection service.
� CDR is a political neighbourhood organisation which also fulfils a social control function. CDR motivatesthe household to separate recyclables, which are collected at irregular intervals. CDR is one of the mainstakeholders in the SWM system, as households prefer to deliver their recyclables to this committee.
� Both ‘‘Casas de Compra’’ and CDR deliver the recyclables to so-called ‘‘Materias Primas’’, which are thecentral waste separation agencies in Santiago de Cuba. They sort and bundle the waste before transferringit as secondary raw material to the Cuban recycling industry.
� The ‘‘Servicios Comunales’’, the public waste collection agency in Santiago de Cuba, is responsible forfrequent collection of the remaining residues. The household residues are disposed of in bags or bins.‘‘Servicios Comunales’’ collect the waste every 2–3 days in open trucks and transport it to the officiallandfill.

ARTICLE IN PRESS
Photo 1. Recyclables collected at a ‘‘Casas de Compra’’.
H.J. Mosler et al. / Habitat International 30 (2006) 849–862854
�
The informal sector (e.g. waste-pickers) hardly plays a role in Cuban waste management. According toBinder and Mosler (submitted for publication), the inhabitants do not have to rely on waste picking as thesocial system maintains basic food at a very low price.Characterisation of survey areas in Santiago de Cuba
According to ‘‘Servicios Comunales’’, the city is divided into seven areas with their settlement structures andliving conditions. Although the income does not vary significantly, indicators allow to distinguish betweenlow-, middle- and high-income neighbourhoods. This information is also provided by the questionnaires.Fig. 1 contains an overview of the city and its defined areas.
Area 1: Is situated in the south-western sparsely populated part of the city consisting mainly of one- or two-storey houses. There are few private gardens but numerous public green areas and undeveloped properties.The conditions of the houses indicate a rather middle-income neighbourhood.
Area 2: Is situated in the south-eastern densely populated part of the city consisting mainly of one- or two-storey houses. There are almost no private gardens, only few public green areas and few undevelopedproperties. The conditions of the houses indicate a rather low-income neighbourhood.
Area 3: Is situated in the eastern sparsely populated part of the city consisting mainly of large one-storeyvillas with big gardens. There are many public green areas and no undeveloped properties. The conditions ofthe houses indicate an upper-income neighbourhood.
Area 4: Is situated in the north-eastern densely populated part of the city consisting mainly of one- to two-storey villas or houses. There are only few private gardens, few public green areas and few undevelopedproperties. The conditions of the houses indicate a middle- to upper-income neighbourhood.

ARTICLE IN PRESS
Fig. 1. Boundaries of defined survey areas in Santiago de Cuba.
H.J. Mosler et al. / Habitat International 30 (2006) 849–862 855
Area 5: Is situated in the northern part of the city and consists mainly of one- to two-storey villas or houseswith big gardens. There are only few public green areas and few undeveloped properties. The conditions of thehouses indicate a middle- to upper-income neighbourhood; however, the entire area is very inhomogeneous.
Area 6: Is situated in the north-western part of the city and consists mainly of four- to six-storey blocks. Theblocks are surrounded by public green areas and few undeveloped properties. The conditions of the housesindicate a middle-income neighbourhood.
Area 7: Is situated in the centre of the city and close to the harbour. It is very densely populated with noundeveloped sites. It consists mainly of colonial style one- to three-storey buildings; however, there are also afew 18-storey buildings. The conditions of the houses indicate an upper-income neighbourhood. There areonly few public green areas in the centre.
Areal waste generation
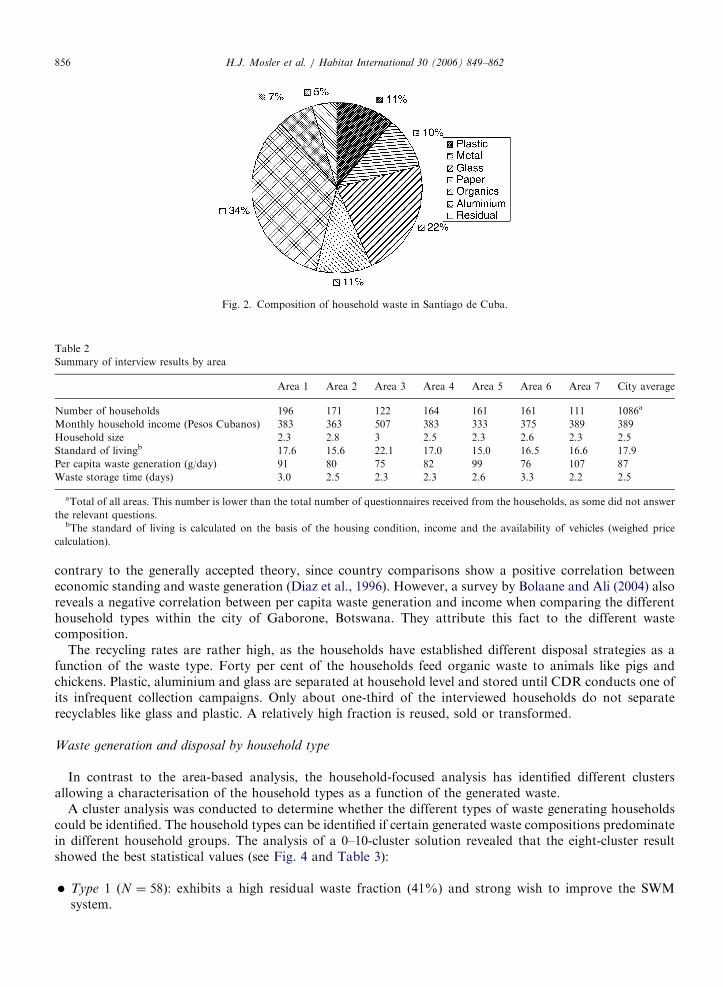
The average amount of waste generated amounts to 86 g per capita and day. Compared to other countries inthe region, these values are exceptionally low. The waste generation rate determined in the 1970s revealed thatthe waste produced in different communities varied between 150 g/capita/day (Santa Clara) and 600 g/capita/day (Guantanamo) (Schleenstein, 2002). Even in countries like Bolivia and Peru, the per capita wastegeneration rate ranges from 300 to 600 g/day. (Diaz, Savage, Eggerth, & Golueke, 1996). The household wastecomposition is given in Fig. 2. Glass (22%) and organic waste (34%) constitute the bulk of the householdwaste. The low fraction of residues (5%) proves that the separation instructions during the measuringcampaign have been well understood by the responsible household persons. The relevant basic statistical meanvalues and socio-economic data are given in Table 2.
A comparison of the different areas surprisingly reveals only marginal differences in the per capita wastegeneration and composition as shown in Fig. 3. However, a statistical analysis reveals clear correlations andindications, which can be used to characterise these seven areas.
The correlation analysis also reveals that total waste per cap/day is negatively correlated to several socio-demographic factors, e.g. the per capita waste generation is decreasing with increasing household income(correlation factor r ¼ �0:36, level of significance po0:001). Similar negative correlations are found for thestandard of living ðr ¼ �0:22, po0:001Þ, and persons per household ðr ¼ �0:60, po0:001Þ. This correlation is
ARTICLE IN PRESS
Table 2
Summary of interview results by area
Area 1 Area 2 Area 3 Area 4 Area 5 Area 6 Area 7 City average
Number of households 196 171 122 164 161 161 111 1086a
Monthly household income (Pesos Cubanos) 383 363 507 383 333 375 389 389
Household size 2.3 2.8 3 2.5 2.3 2.6 2.3 2.5
Standard of livingb 17.6 15.6 22.1 17.0 15.0 16.5 16.6 17.9
Per capita waste generation (g/day) 91 80 75 82 99 76 107 87
Waste storage time (days) 3.0 2.5 2.3 2.3 2.6 3.3 2.2 2.5
aTotal of all areas. This number is lower than the total number of questionnaires received from the households, as some did not answer
the relevant questions.bThe standard of living is calculated on the basis of the housing condition, income and the availability of vehicles (weighed price
calculation).
Fig. 2. Composition of household waste in Santiago de Cuba.
H.J. Mosler et al. / Habitat International 30 (2006) 849–862856
contrary to the generally accepted theory, since country comparisons show a positive correlation betweeneconomic standing and waste generation (Diaz et al., 1996). However, a survey by Bolaane and Ali (2004) alsoreveals a negative correlation between per capita waste generation and income when comparing the differenthousehold types within the city of Gaborone, Botswana. They attribute this fact to the different wastecomposition.
The recycling rates are rather high, as the households have established different disposal strategies as afunction of the waste type. Forty per cent of the households feed organic waste to animals like pigs andchickens. Plastic, aluminium and glass are separated at household level and stored until CDR conducts one ofits infrequent collection campaigns. Only about one-third of the interviewed households do not separaterecyclables like glass and plastic. A relatively high fraction is reused, sold or transformed.
Waste generation and disposal by household type
In contrast to the area-based analysis, the household-focused analysis has identified different clustersallowing a characterisation of the household types as a function of the generated waste.
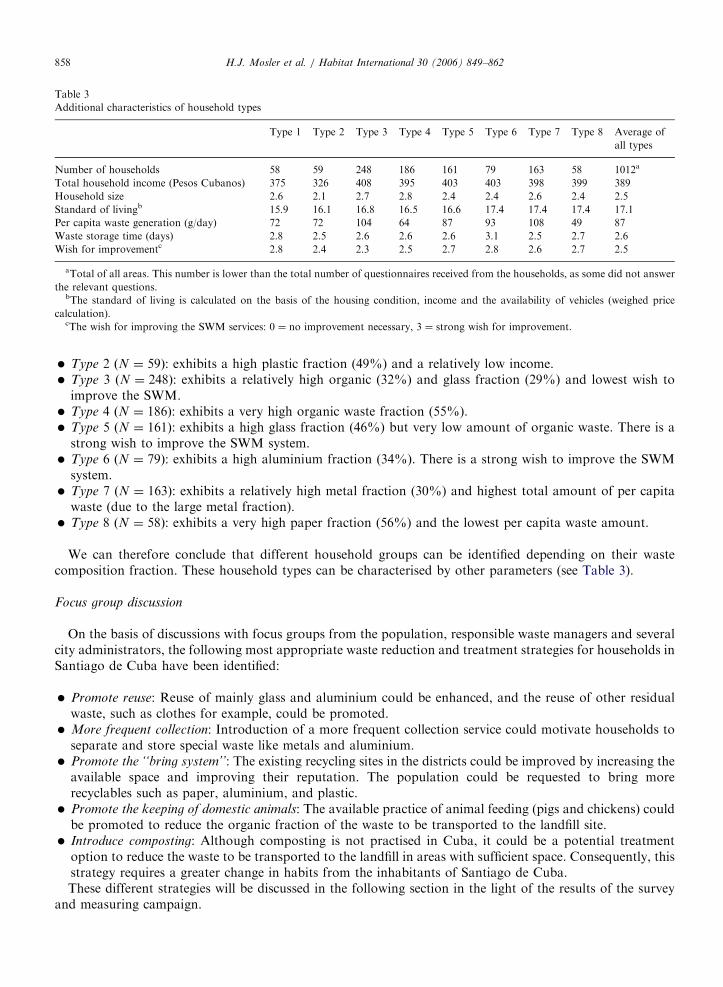
A cluster analysis was conducted to determine whether the different types of waste generating householdscould be identified. The household types can be identified if certain generated waste compositions predominatein different household groups. The analysis of a 0–10-cluster solution revealed that the eight-cluster resultshowed the best statistical values (see Fig. 4 and Table 3):
�
Type 1 ðN ¼ 58Þ: exhibits a high residual waste fraction (41%) and strong wish to improve the SWMsystem.
ARTICLE IN PRESS
Fig. 3. Per capita waste generation and composition by area.
Fig. 4. Waste generation and composition by household types (cluster analysis).
H.J. Mosler et al. / Habitat International 30 (2006) 849–862 857
ARTICLE IN PRESS
Table 3
Additional characteristics of household types
Type 1 Type 2 Type 3 Type 4 Type 5 Type 6 Type 7 Type 8 Average of
all types
Number of households 58 59 248 186 161 79 163 58 1012a
Total household income (Pesos Cubanos) 375 326 408 395 403 403 398 399 389
Household size 2.6 2.1 2.7 2.8 2.4 2.4 2.6 2.4 2.5
Standard of livingb 15.9 16.1 16.8 16.5 16.6 17.4 17.4 17.4 17.1
Per capita waste generation (g/day) 72 72 104 64 87 93 108 49 87
Waste storage time (days) 2.8 2.5 2.6 2.6 2.6 3.1 2.5 2.7 2.6
Wish for improvementc 2.8 2.4 2.3 2.5 2.7 2.8 2.6 2.7 2.5
aTotal of all areas. This number is lower than the total number of questionnaires received from the households, as some did not answer
the relevant questions.bThe standard of living is calculated on the basis of the housing condition, income and the availability of vehicles (weighed price
calculation).cThe wish for improving the SWM services: 0 ¼ no improvement necessary, 3 ¼ strong wish for improvement.
H.J. Mosler et al. / Habitat International 30 (2006) 849–862858
�
Type 2 ðN ¼ 59Þ: exhibits a high plastic fraction (49%) and a relatively low income. � Type 3 ðN ¼ 248Þ: exhibits a relatively high organic (32%) and glass fraction (29%) and lowest wish toimprove the SWM.
� Type 4 ðN ¼ 186Þ: exhibits a very high organic waste fraction (55%). � Type 5 ðN ¼ 161Þ: exhibits a high glass fraction (46%) but very low amount of organic waste. There is astrong wish to improve the SWM system.
� Type 6 ðN ¼ 79Þ: exhibits a high aluminium fraction (34%). There is a strong wish to improve the SWMsystem.
� Type 7 ðN ¼ 163Þ: exhibits a relatively high metal fraction (30%) and highest total amount of per capitawaste (due to the large metal fraction).
� Type 8 ðN ¼ 58Þ: exhibits a very high paper fraction (56%) and the lowest per capita waste amount.We can therefore conclude that different household groups can be identified depending on their wastecomposition fraction. These household types can be characterised by other parameters (see Table 3).
Focus group discussion
On the basis of discussions with focus groups from the population, responsible waste managers and severalcity administrators, the following most appropriate waste reduction and treatment strategies for households inSantiago de Cuba have been identified:
�
Promote reuse: Reuse of mainly glass and aluminium could be enhanced, and the reuse of other residualwaste, such as clothes for example, could be promoted. � More frequent collection: Introduction of a more frequent collection service could motivate households toseparate and store special waste like metals and aluminium.
� Promote the ‘‘bring system’’: The existing recycling sites in the districts could be improved by increasing theavailable space and improving their reputation. The population could be requested to bring morerecyclables such as paper, aluminium, and plastic.
� Promote the keeping of domestic animals: The available practice of animal feeding (pigs and chickens) couldbe promoted to reduce the organic fraction of the waste to be transported to the landfill site.
� Introduce composting: Although composting is not practised in Cuba, it could be a potential treatmentoption to reduce the waste to be transported to the landfill in areas with sufficient space. Consequently, thisstrategy requires a greater change in habits from the inhabitants of Santiago de Cuba.These different strategies will be discussed in the following section in the light of the results of the survey
and measuring campaign.
ARTICLE IN PRESSH.J. Mosler et al. / Habitat International 30 (2006) 849–862 859
Formulating waste management strategies
The spatial and cluster analyses are two different approaches leading to different conclusions andintervention measures. It is worth comparing the results of these two approaches and discuss a possiblecombination of the two.
Spatial analysis versus household-focused analysis
As spatial analysis reveals a rather similar waste composition in all areas, focus could be placed on just oneintervention, i.e. on the main waste fraction or on the most valuable waste component. This interventionwould be applied throughout the city, irrespective of households with different waste fractions or individualwaste management strategies. As shown in the previous section, the household survey and cluster analysisallow a much more detailed characterisation of the households and their waste generation:
According to Table 3: Type 3 (organic waste) and Type 4 (organic waste and glass) are the main householdtypes with N ¼ 248 and 186, respectively. The household size is the largest among these types. The presence ofchildren is assumed to lead to a different consumption behaviour resulting in a higher content of organicwaste. Types 5 (glass) and 7 (metal) also mainly predominate in number compared to the others with N ¼ 161and 163, respectively. Only households with a relatively high income generate a high amount of glass waste(Types 3 and 5). The high plastic fraction generated by Type 2 household could not be explained by a higherincome.
Types 3–5 households can be easily grouped as they all mainly produce organic waste and glass. Theyaccount for 59% of the total households surveyed. Hence, it is worth considering interventions especiallyadapted to these groups, such as the separation and reuse of glass or the separation and treatment of organicwaste.
Since Type 7 is also a major group, it should also receive special attention. The questionnaires reveal that thehigh metal fraction can be attributed to the presence of cars in these households. This group has one of thehighest standards of living. The poor economic conditions of the inhabitants of Santiago de Cuba force them torepair their cars in their backyard with partly self-constructed spare parts. The scrap metal is collected by thepublic waste collection service, thereby increasing the metal fraction as well as the total per capita waste fraction.
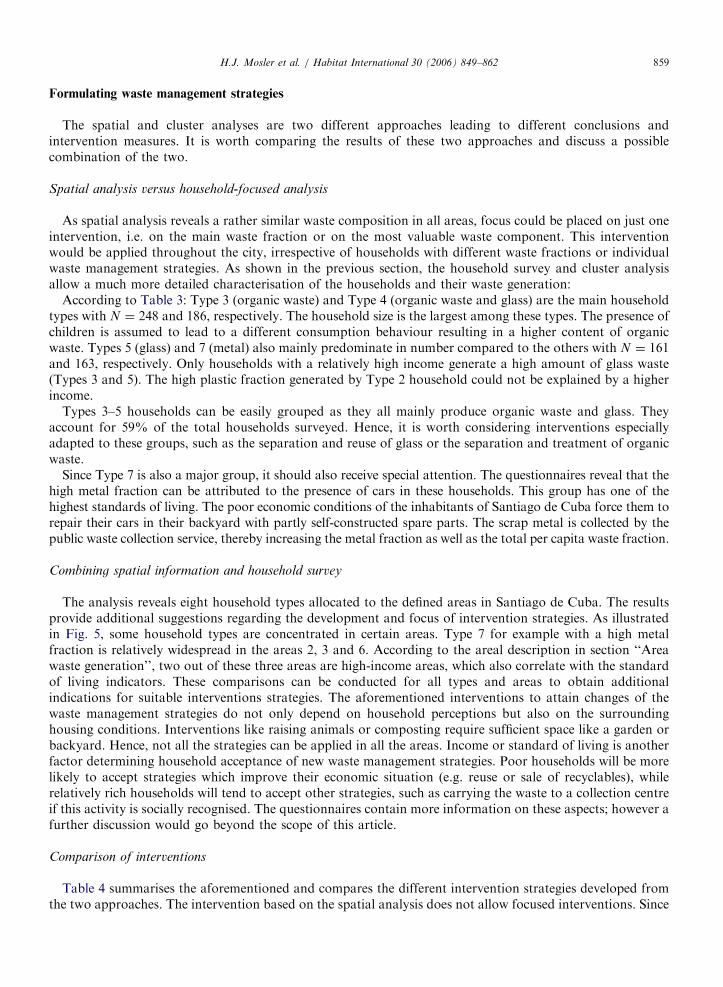
Combining spatial information and household survey
The analysis reveals eight household types allocated to the defined areas in Santiago de Cuba. The resultsprovide additional suggestions regarding the development and focus of intervention strategies. As illustratedin Fig. 5, some household types are concentrated in certain areas. Type 7 for example with a high metalfraction is relatively widespread in the areas 2, 3 and 6. According to the areal description in section ‘‘Areawaste generation’’, two out of these three areas are high-income areas, which also correlate with the standardof living indicators. These comparisons can be conducted for all types and areas to obtain additionalindications for suitable interventions strategies. The aforementioned interventions to attain changes of thewaste management strategies do not only depend on household perceptions but also on the surroundinghousing conditions. Interventions like raising animals or composting require sufficient space like a garden orbackyard. Hence, not all the strategies can be applied in all the areas. Income or standard of living is anotherfactor determining household acceptance of new waste management strategies. Poor households will be morelikely to accept strategies which improve their economic situation (e.g. reuse or sale of recyclables), whilerelatively rich households will tend to accept other strategies, such as carrying the waste to a collection centreif this activity is socially recognised. The questionnaires contain more information on these aspects; however afurther discussion would go beyond the scope of this article.
Comparison of interventions
Table 4 summarises the aforementioned and compares the different intervention strategies developed fromthe two approaches. The intervention based on the spatial analysis does not allow focused interventions. Since
ARTICLE IN PRESS
Fig. 5. Areal distribution of household types.
Table 4
Comparison of strategies based on spatial analysis and household waste types
Area Intervention strategies based on household waste types and
spatial information
Intervention strategies based on the spatial analysis
1 Promote the keeping of domestic animals/composting and
glass separation
City-wide intervention
for organic waste:
Promote the keeping of
domestic animals and
probably composting
City-wide intervention
for glass: Enhance
reuse/separation and
collection of glass
2 Promote metal collection
3 Promote metal and glass collection, keeping of domestic
animals/composting
4 Promote glass separation and collection
5 Promote the keeping of domestic animals/composting and
glass collection
6 Promote metal collection
7 Promote organic waste separation and collection for
composting outside the area
H.J. Mosler et al. / Habitat International 30 (2006) 849–862860
only glass and organic waste have been identified as main waste fractions, possible interventions couldpromote the keeping of domestic animals (pigs and chickens), composting of the organic waste fraction andpromoting of glass recycling. These interventions could be applied citywide, as spatial analysis does not revealany differences between the surveyed areas.

ARTICLE IN PRESSH.J. Mosler et al. / Habitat International 30 (2006) 849–862 861
It is possible to develop a more focused intervention strategy as the household survey classifies thehousehold types, main waste generated and local conditions in these areas. If waste separation is promotedthroughout the city, increased metal separation and collection should be promoted in areas 2, 3 and 6.Composting and the keeping of domestic animals may be applied in areas 1, 3 and 5. Area 7 (city centre)requires further considerations, as the dense housing structure is unsuitable for composting or keeping of pigs,although the waste reveals a very high organic fraction. In this case, a more suitable strategy would consist inpromoting waste separation and introducing a collection and treatment service outside the city centre. Such adifferentiated strategy allows a more efficient allocation of the limited local waste management resources (e.g.trucks, public workers, equipment, etc.).
Conclusions
Waste composition surveys on household level provide more detailed and valuable information on theactual waste generation patterns of a city. In combination with spatial information, it is possible to identifyhousehold types and adapt possible interventions to the available waste management strategies and prevailinghousing conditions. The analysis allows a selective intervention for different household groups (e.g.information campaign or adjustment of collection schedules) or the saving of valuable resources in specificareas of the mostly ill-equipped SWM departments. Additionally, such household level interventions willfinally reduce the waste to be transported and disposed of in landfills, prolong the lifespan of these sites andreduce their environmental impact.
It is interesting to note that the findings of this study concur with the ones of Bolaane and Ali (2004), whichconclude that waste generation does not necessarily increase with higher income within one survey area.However, this is likely to be true at national level.
The project team will continue research on a mostly psychological level and further elaborate and apply theintervention strategies to certain household types in the relevant areas (e.g. separation of metals andintroduction of composting). Perception and acceptance of these new interventions by the households will bestudied further to learn more about the effect and scope of user-targeted interventions on SWM.
Acknowledgement
The authors would like to thank the Swiss Agency for Development Cooperation SDC and the SwissNational Centre of Competence in Research North–South (NCCR North–South) for their financial support.We are also indebted to the following Swiss students who contributed to this study either by collecting data inthe field or by analysing it: Adrian Brugger, Madeleine Guyer, Livia Metzger, Andrea Tamas, RadmilaVukelic and the 53 students of the first-year course in Sociology at the Universidad de Oriente. Finally, ourthanks also go to Sylvie Peter for her thorough linguistic revision of this paper.
References
Anderberg, M. R. (1973). Cluster analysis for applications. New York: Academic Press.
Binder, C., & Mosler, H. J. (submitted for publication). Waste-resource flows of short-lived goods in Santiago de Cuba: Social norm as a
main driver of recycling paths. Resources Conservation & Recycling.
Bolaane, B., & Ali, M. (2004). Sampling household waste at source: Lessons learnt in Gaborone. Waste Management & Research, 22,
142–148.
Burn, S. M. (1991). Social psychology and the stimulation of recycling behaviors: The block leader approach. Journal of Applied Social
Psychology, 21, 611–629.
BUWAL (2004). Zahlen und Fakten, Statistiken, mehrjahrige Statistiken—Separatsammlungen: Mengen und Quoten im Uberblick.
www.umwelt-schweiz.ch; retrieved from the net 02.02.2004.
Cannell, C. F., Miller, P. V., & Oksenberg, L. (1981). Research on interviewing techniques. In S. Leinhardt (Ed.), Sociological methodology
(pp. 389–437). San Francisco: Jossey-Bass.
Delgado Reinoso, J. A., 2003. Analysis of sectoral solid waste evolution in Cuba (1997–2003). United Nations expert meeting on waste
management in small island developing states, Havana, Cuba, 27 October to 1 November 2003. http://www.sidsnet.org/workshop/
experts_meetings.html (visited 07.12.2004).
Derksen, L., & Gartrell, J. (1993). The social context of recycling. American Sociological Review, 58, 434–442.
ARTICLE IN PRESSH.J. Mosler et al. / Habitat International 30 (2006) 849–862862
Diaz, L. F., Savage, G. M., Eggerth, L. L., & Golueke, C. G. (1996). Solid waste management for economically developing countries.
Hercules, CA: Cal Recovery Inc.
Erikson, D., Lord, A., & Wolf, P., 2002. Cuba’s social services. A review of education, health and sanitation. Inter-American Dialogue,
January 31, 2002. Commissioned as background paper for the World Development Report 2004: Making Services Work for Poor
People.
Halla, F., & Majani, B. (1999). Innovative ways for solid waste management in Dar-Es-Salaam: Toward stakeholder partnerships. Habitat
International, 23(3), 351–361.
Hoffmeyer-Zlotnik, J. H. P. (1997). Random-Route-Stichproben nach ADM. In S. Gabler, & J. H. P. Hoffmeyer-Zlotnik (Eds.),
Stichproben in der Umfragepraxis (pp. 33–42). Opladen: Westdeutscher Verlag.
Hopper, J. R., & Nielsen, J. M. (1991). Recycling as altruistic behavior. Normative and behavioral strategies to expand participation in a
community recycling program. Environment and Behavior, 23(2), 195–220.
Katzev, R. D., & Mishima, H. (1992). The use of posted feedback to promote recycling. Psychological Reports, 71, 259–264.
Rabinovitch, J., 1997. Urban problems remain similar world wide—unemployment and insufficient solid waste disposal are main
concerns. International colloquium of Mayors at the international conference on governance for sustainable growth and equity, 28–31 July
1997. http://magnet.undp.org/Docs/urban/Maysur.htm. (visited 7.12.2004).
Rivera, L. A., 2001. Hace dos semanas que no se colecta la basura en Santiago de Cuba. CUBANET.INDEPENDIENTE, http://
www.cubanet.org/CNews/y01/jan01/31a2.htm (visited 7.12.2004).
Schertenleib, R., & Meyer, W., 1992. Municipal solid waste management in DC’s: Problems and issues; need for future research. IRCWD
News (No. 26), Duebendorf, Switzerland.
Schleenstein, G., 2002. Gestion de Residuos Solidos Urbanos en Cuba con un Enfoque al Municipio Minero de Moa. Programa ASA 2002
de la Carl-Duisberg-Gesellschaft e.V. http://rzserv1-sud.fhnon.de/�sud16407/project_pages/Schleenstein_Gestion_de_RSU_en_Cuba.pdf
(visited 07.12.2004).
UNEP-IETC, HIID, 1996. International source book on environmentally sound technologies for municipal solid waste management, United
Nations Environment Programme (UNEP). International Environmental Technology Centre (IETC).
Wang, T. H., & Katzev, R. D. (1990). Group commitment and resource conservation: Two field experiments on promoting recycling.
Journal of Applied Social Psychology, 20(4), 265–275.
World Resources Institute (1996). United Nations environment programme, United Nations development programme. The World Bank,
World Resources 1996–97—The Urban Environment. Oxford: Oxford University Press.
Related Documents