Formation of the Cameroon Volcanic Line by lithospheric basal erosion: Insight from mantle seismic anisotropy A.A. Elsheikh ⇑ , S.S. Gao, K.H. Liu Department of Geosciences and Geological and Petroleum Engineering, Missouri University of Science and Technology, Rolla, MO 65409, USA article info Article history: Received 26 December 2013 Received in revised form 13 June 2014 Accepted 15 June 2014 Available online 27 June 2014 Keywords: Shear-wave splitting Cameroon Volcanic Line Intraplate volcanic segments Lithospheric channel abstract The formation mechanism of intraplate volcanism such as that along the Cameroon Volcanic Line (CVL) is one of the controversial problems in global tectonics. Models proposed by previous studies include re- activation of ancient suture zones, lithospheric thinning by mantle plumes, and edge-driven mantle con- vection. To provide additional constraints on the models for the formation of the CVL, we measured shear-wave splitting parameters at 36 stations in the vicinity of the CVL using a robust procedure involv- ing automatic batch processing and manual screening to reliably assess and objectively rank shear-wave splitting parameters (fast polarization directions and splitting times). The resulting 432 pairs of splitting parameters show a systematic spatial variation. Most of the measurements with ray-piercing points (at 200 km depth) beneath the CVL show a fast direction that is parallel to the volcanic line, while the fast directions along the coastline are parallel to the continental margin. The observations can best be inter- preted using a model that involves a channel flow at the bottom of the lithosphere originated from the NE-ward movement of the asthenosphere relative to the African plate. We hypothesize that progressive thinning of the lithosphere through basal erosion by the flow leads to decompression melting and is responsible for the formation of the CVL. The model is consistent with the lack of age progression of the volcanoes in the CVL, can explain the formation of both the continental and oceanic sections of the CVL, and is supported by previous geophysical observations and geodynamic modeling results. Ó 2014 Elsevier Ltd. All rights reserved. 1. Introduction Most of the Earth’s magmatism is associated with dehydration of minerals in subducting slabs and with decompression melting along mid-ocean ridges, and thus can be well-explained by the the- ory of plate tectonics (e.g., Turcotte and Oxburgh, 1978; Courtillot et al., 2003). The formation mechanism for intraplate magmatism, on the other hand, remains enigmatic. Various models have been proposed to explain intraplate magmatism, including those involv- ing mantle plumes (Morgan, 1972; Courtillot et al., 2003), tensional cracking in the lithosphere (Turcotte and Oxburgh, 1978; Anderson, 2000), and edge-driven convection (EDC) (King and Anderson, 1998). The African plate is ideal for studying intraplate magmatism. It contains several intraplate volcanic segments or centers that are remote from the African plate boundaries (Fig. 1). One of such seg- ments is the NE–SW oriented Cameroon Volcanic Line (CVL), which consists of a continental and an oceanic section. The CVL intercepts with the Atlantic coastline at the joint point between the E–W and N–S segments of the coastline (Fig. 2). Many studies proposed that the CVL was the result of the NE- ward movement of the African plate over a mantle plume that is currently beneath St. Helena (e.g., Morgan, 1983)(Fig. 1). This model predicts that the age of the volcanoes decreases toward the SW. Such an age progression, however, is not observed (e.g., Fitton and Dunlop, 1985). Additionally, 3 He/ 4 He ratios measured along the CVL are lower than those observed at typical hotspots such as Loihi and Iceland (Aka et al., 2004), probably suggesting an upper-mantle origin of the magmatism. Other studies con- cluded that the CVL was due to decompression melting beneath re-activated shear zones on the African continent (e.g., Fairhead, 1988). This model, while can explain the lack of age progression, cannot satisfactorily explain the existence of the oceanic section of the CVL. The third group of studies advocated edge-driven con- vection as the major cause of the CVL (King and Ritsema, 2000; Koch et al., 2012; Milelli et al., 2012). This model suggests that the upwelling flow thins the lithosphere and creates a line of vol- canoes parallel to the boundary between two areas with contrast- ing lithospheric thickness. In the study area, the northern edge of the Congo craton is a potential locale for the EDC to occur and thus http://dx.doi.org/10.1016/j.jafrearsci.2014.06.011 1464-343X/Ó 2014 Elsevier Ltd. All rights reserved. ⇑ Corresponding author. Tel.: +1 5733414058; fax: +1 5733416935. E-mail addresses: [email protected] (A.A. Elsheikh), [email protected] (S.S. Gao), [email protected] (K.H. Liu). Journal of African Earth Sciences 100 (2014) 96–108 Contents lists available at ScienceDirect Journal of African Earth Sciences journal homepage: www.elsevier.com/locate/jafrearsci

Welcome message from author
This document is posted to help you gain knowledge. Please leave a comment to let me know what you think about it! Share it to your friends and learn new things together.
Transcript

Journal of African Earth Sciences 100 (2014) 96–108
Contents lists available at ScienceDirect
Journal of African Earth Sciences
journal homepage: www.elsevier .com/locate / ja f rearsc i
Formation of the Cameroon Volcanic Line by lithospheric basal erosion:Insight from mantle seismic anisotropy
http://dx.doi.org/10.1016/j.jafrearsci.2014.06.0111464-343X/� 2014 Elsevier Ltd. All rights reserved.
⇑ Corresponding author. Tel.: +1 5733414058; fax: +1 5733416935.E-mail addresses: [email protected] (A.A. Elsheikh), [email protected] (S.S. Gao),
[email protected] (K.H. Liu).
A.A. Elsheikh ⇑, S.S. Gao, K.H. LiuDepartment of Geosciences and Geological and Petroleum Engineering, Missouri University of Science and Technology, Rolla, MO 65409, USA
a r t i c l e i n f o
Article history:Received 26 December 2013Received in revised form 13 June 2014Accepted 15 June 2014Available online 27 June 2014
Keywords:Shear-wave splittingCameroon Volcanic LineIntraplate volcanic segmentsLithospheric channel
a b s t r a c t
The formation mechanism of intraplate volcanism such as that along the Cameroon Volcanic Line (CVL) isone of the controversial problems in global tectonics. Models proposed by previous studies include re-activation of ancient suture zones, lithospheric thinning by mantle plumes, and edge-driven mantle con-vection. To provide additional constraints on the models for the formation of the CVL, we measuredshear-wave splitting parameters at 36 stations in the vicinity of the CVL using a robust procedure involv-ing automatic batch processing and manual screening to reliably assess and objectively rank shear-wavesplitting parameters (fast polarization directions and splitting times). The resulting 432 pairs of splittingparameters show a systematic spatial variation. Most of the measurements with ray-piercing points (at200 km depth) beneath the CVL show a fast direction that is parallel to the volcanic line, while the fastdirections along the coastline are parallel to the continental margin. The observations can best be inter-preted using a model that involves a channel flow at the bottom of the lithosphere originated from theNE-ward movement of the asthenosphere relative to the African plate. We hypothesize that progressivethinning of the lithosphere through basal erosion by the flow leads to decompression melting and isresponsible for the formation of the CVL. The model is consistent with the lack of age progression ofthe volcanoes in the CVL, can explain the formation of both the continental and oceanic sections of theCVL, and is supported by previous geophysical observations and geodynamic modeling results.
� 2014 Elsevier Ltd. All rights reserved.
1. Introduction
Most of the Earth’s magmatism is associated with dehydrationof minerals in subducting slabs and with decompression meltingalong mid-ocean ridges, and thus can be well-explained by the the-ory of plate tectonics (e.g., Turcotte and Oxburgh, 1978; Courtillotet al., 2003). The formation mechanism for intraplate magmatism,on the other hand, remains enigmatic. Various models have beenproposed to explain intraplate magmatism, including those involv-ing mantle plumes (Morgan, 1972; Courtillot et al., 2003), tensionalcracking in the lithosphere (Turcotte and Oxburgh, 1978;Anderson, 2000), and edge-driven convection (EDC) (King andAnderson, 1998).
The African plate is ideal for studying intraplate magmatism. Itcontains several intraplate volcanic segments or centers that areremote from the African plate boundaries (Fig. 1). One of such seg-ments is the NE–SW oriented Cameroon Volcanic Line (CVL), whichconsists of a continental and an oceanic section. The CVL intercepts
with the Atlantic coastline at the joint point between the E–W andN–S segments of the coastline (Fig. 2).
Many studies proposed that the CVL was the result of the NE-ward movement of the African plate over a mantle plume that iscurrently beneath St. Helena (e.g., Morgan, 1983) (Fig. 1). Thismodel predicts that the age of the volcanoes decreases towardthe SW. Such an age progression, however, is not observed (e.g.,Fitton and Dunlop, 1985). Additionally, 3He/4He ratios measuredalong the CVL are lower than those observed at typical hotspotssuch as Loihi and Iceland (Aka et al., 2004), probably suggestingan upper-mantle origin of the magmatism. Other studies con-cluded that the CVL was due to decompression melting beneathre-activated shear zones on the African continent (e.g., Fairhead,1988). This model, while can explain the lack of age progression,cannot satisfactorily explain the existence of the oceanic sectionof the CVL. The third group of studies advocated edge-driven con-vection as the major cause of the CVL (King and Ritsema, 2000;Koch et al., 2012; Milelli et al., 2012). This model suggests thatthe upwelling flow thins the lithosphere and creates a line of vol-canoes parallel to the boundary between two areas with contrast-ing lithospheric thickness. In the study area, the northern edge ofthe Congo craton is a potential locale for the EDC to occur and thus

Fig. 1. Topographic relief map of Africa showing major intraplate volcanic centers and cratons (Turcotte and Oxburgh, 1978; Abdelsalam et al., 2011). CVL, Cameroon VolcanicLine. TC, Tanzania Craton. The area inside the red dashed rectangle is shown in Figs. 2 and 3. The green arrows represent absolute plate motion (APM) vectors calculated usingthe GMHRF model (Doubrovine et al., 2012), and the black arrows show APM vectors determined by the HS3-NUVEL1A model (Gripp and Gordon, 2002). The blue arrowsindicate the horizontal component of mantle flow predicted at 250 km depth (Forte et al., 2010). Red stars represent the locations of the Atlantic mantle plumes (Doubrovineet al., 2012). (For interpretation of the references to color in this figure legend, the reader is referred to the web version of this article.)
A.A. Elsheikh et al. / Journal of African Earth Sciences 100 (2014) 96–108 97
could be responsible for the formation of the continental section ofthe CVL (Fig. 3). However, this model cannot explain the orienta-tion of the oceanic section of the CVL, because the anticipatedstrike of the zone of thinned oceanic lithosphere should be parallelto the coastline, while the actual CVL has a NE–SW strike. In addi-tion, as described below, neither the plume nor the EDC model issupported by shear-wave splitting (SWS) measurements.
Splitting analysis of P-to-S converted phases at the core-mantleboundary on the receiver side, including the PKS, SKKS, and SKS(hereinafter collectively referred to as XKS) phases, is consideredto be one of the most effective tools in measuring seismic anisot-ropy, which is mostly caused by deformational processes in themantle (see Silver, 1996; Savage, 1999, and Fouch and Rondenay,2006 for reviews). Numerous XKS splitting studies demonstratedthat the spatial distribution of the two splitting parameters U,which is the polarization direction of the faster wave, and dt, thesplitting time between the faster and slower waves, are crucial tounderstand mantle circulation patterns. The fast direction reflectsthe mantle deformation direction, while the splitting time quanti-fies the magnitude of the mantle deformation (Conrad and Behn,2010; Kreemer, 2009).
The coefficient of anisotropy is defined as (Vfast � Vslow)/Vmean
where Vfast and Vslow are the fast and slow shear-wave velocities,respectively and Vmean is the mean velocity (Birch, 1960; Wolfeand Solomon, 1998). The global average of the splitting timeobserved using teleseismic XKS waves is 1.0 s, which correspondsto a thickness of about 100 km for a 4% anisotropy (Silver, 1996).Olivine lattice-preferred orientations (LPO) likely forms as a resultof dislocation creep deformation, leading to a macroscopic anisot-ropy in the upper mantle (e.g., McKenzie, 1979; Ribe, 1989; Fouch
and Rondenay, 2006; Conrad et al., 2007). Numerical modeling andexperimental mineral physics studies indicate that under uniaxialcompression, the olivine a-axis rotates to be orthogonal to themaximum compressional strain direction. Under pure shear, itbecomes perpendicular to the shortening direction; and under pro-gressive simple shear, it aligns parallel to the flow direction (Ribeand Yu, 1991; Chastel et al., 1993; Zhang and Karato, 1995;Savage, 1999; Liu, 2009). Therefore, the fast direction may revealthe flow direction in the asthenosphere as observed in oceanbasins, continental rifts, and passive margins (Wolfe andSolomon, 1998; Gao et al., 1994, 1997, 2008, 2010; Refayee et al.,2013).
In the lithosphere, U is primarily parallel to the trend of pasttectonic events, as revealed at numerous locales (McNamaraet al., 1994; Liu et al., 1995; Silver, 1996; Barruol and Hoffmann,1999; Fouch and Rondenay, 2006; Li and Chen, 2006; Liu, 2009).In addition, vertical magmatic dikes in the lithosphere can resultin XKS splitting with a fast direction parallel to the main strikedirection of the dikes (Gao et al., 1997, 2010). This mechanismwas suggested to explain rift-parallel fast directions detected inactive continental rifts such as the Baikal rift zone (Gao et al.,1997), the East African rift system (Gao et al., 1997, 2010;Kendall et al., 2005), and failed rifts such as the southern Oklahomaaulacogen (Gao et al., 2008).
2. Geophysical background
The CVL is an �1600 km elongated Y-shaped feature ofCenozoic volcanoes (e.g., Fitton, 1987; Aka et al., 2004; Tokamet al., 2010; Reusch et al., 2010; Milelli et al., 2012) (Fig. 3). It is

Fig. 2. Major tectonic elements of western and central Africa showing main geological subdivision units (International Geological Map of Africa, 1990). The white squares andrectangles show seismic stations used in the study.
98 A.A. Elsheikh et al. / Journal of African Earth Sciences 100 (2014) 96–108
located between the Congo craton to the south and the Ouban-guides Belt to the north, which was created by the collisionbetween four different terranes including the São Francisco andCongo cratons, the West African craton, and a Pan-African mobiledomain during the formation of the Gondwana (e.g., Castainget al., 1994; Toteu et al., 2004; Begg et al., 2009; Tokam et al.,2010). The land section of the CVL includes several major volcanoessuch as Mounts Cameroon, Manengouba, Bambouto, and Oku, andextends from the Gulf of Guinea all the way to the Chad frontier(e.g., Aka et al., 2004) (Fig. 3). The oceanic section includes theislands of Annobon (formerly called Pagalu), São Tomé, Principe,and Bioko (Fig. 3). The Pan-African basement rocks almost coverthe entire continental portion of the CVL with more than 60 anor-ogenic ring complexes exposed on the surface of the continentalsection of the CVL. The majority of these ring complexes are con-centrated in the southwestern part of the continental section.The basement rocks exposed on the CVL are mainly alkaline (bas-alts, basanites, trachytes, and phonolites) with the exception ofthe nephelinitic lava that erupted near Mt. Etinde (Fitton andHughes, 1981; Fitton, 1987; Lee et al., 1994; Aka et al., 2004;Deruelle et al., 1991, 2007).
Nearly all of the global and regional tomographic models agreethat the CVL is underlain by upper mantle low-velocity anomalies,while the Congo and West Africa cratons are underlain byhigh-velocity anomalies (e.g., King and Ritsema, 2000; Ritsema and
van Heijst, 2000; Priestley et al., 2008; Reusch et al., 2010). However,the lateral and depth extent of the upper mantle low-velocityanomalies beneath the CVL, which plays an important role for under-standing the origin of the CVL, is still a subject of considerable debate(e.g., Reusch et al., 2010). King and Ritsema (2000) used numericalmodeling constrained by seismic tomography results to understandthe origin of African and South American intraplate volcanisms. Theyfound relatively high seismic shear-wave velocities in the mantletransition zone beneath the Congo and West African cratons andsuggested that EDC from beneath the Congo craton is responsiblefor the formation of the CVL.
On a local scale, Dorbath et al. (1986) performed inversion ofteleseismic P-wave travel-time residuals across the Adamawa Pla-teau and the central African shear zone (CASZ) in central Cameroon(Fig. 3). They revealed a low-velocity anomaly beneath the Adam-awa Plateau striking ENE at the depth of �190 km. Plomerova et al.(1993) examined the lithospheric thickness and anisotropy withinthe upper mantle in the Adamawa Plateau using teleseismic.
P-and PKP-arrival times recorded by a network of 40 seismicstations deployed along the plateau. They concluded that a thinnedlithosphere and a 2% low-velocity anomaly beneath the CASZ inCameroon are caused by mantle upwelling. The most recent tomo-graphic imaging using body-waves shows a tabular low-velocityanomaly beneath the CVL with a depth extension not less than300 km (Reusch et al., 2010). They argued that the low-velocity

Fig. 3. A map of the study area showing locations and ages of the Cameroon Volcanic Line (magenta features) (Fitton and Dunlop, 1985; Fitton, 1987) and previous shear-wave splitting measurements (red and blue bars). The orientation of the bars represents the fast direction, the length is proportional to the splitting time, and red circlesrepresent null measurements. The blue bar near the right edge of the figure represents the measurement from Barruol and Ismail (2001), and the red bars and circlesrepresent measurements from Koch et al. (2012). FSZ, Foumban Shear Zone. CASZ, Central African Shear Zone. CFZ, Cameroon Fracture Zone (Meyers et al., 1998; Reusch et al.,2010). OB, Oubanguides Belt. The dashed magenta line represents the northern edge of the Congo craton (Schlüter, 2006; Reusch et al., 2010). The red star shows the locationof the Cameroon mantle plume (Burke, 2001). The letters in the rectangles indicate the name of the sub-area that the stations belong to (see Section 5.1). (For interpretation ofthe references to color in this figure legend, the reader is referred to the web version of this article.)
Fig. 4. An azimuthal equidistant projection map of the Earth showing thedistribution of earthquakes used in the study (open dots). The radius of the dotsis proportional to the number of resulting well-defined splitting measurementsfrom the events. Circles and corresponding labels show the distance (in degree) tothe center of the study area.
A.A. Elsheikh et al. / Journal of African Earth Sciences 100 (2014) 96–108 99
anomaly beneath the CVL is consistent with a model involving EDCalong the northern boundary of the Congo craton.
Many studies have analyzed crustal structure beneath the studyarea using a variety of techniques including active and passive seis-mic source analysis (e.g., Stuart et al., 1985; Dorbath et al., 1986;Tabod et al., 1992; Plomerova et al., 1993; Sandvol et al., 1998;Hansen et al., 2009; Obrebski et al., 2010; Tokam et al., 2010;Gallacher and Bastow, 2012) and gravity studies (e.g., Fairheadand Okereke, 1987; Djomani et al., 1995; Nnange et al., 2000;Toteu et al., 2004; Tadjou et al., 2009). Tokam et al. (2010) useddata from the Cameroon Broadband Seismic Experiment (CBSE)network, which consisted of 32 portable broad-band seismometersdeployed between January 2005 and February 2007 acrossCameroon, to investigate crustal structure beneath the CVL byutilizing P-wave receiver functions (RFs) and surface wave disper-sion data. They found a thin crust of 26–31 km in thicknessbeneath the Garoua rift and the coastal plain (Fig. 3), and a thickercrust of 43–48 km with a mafic lower crust beneath the Congo cra-ton. The crustal thickness in the CVL and the Oubanguides Belt var-ies between 35 and 39 km (Fig. 3). They suggested that the thincrust beneath the coastal plain is caused by the opening of thesouthern Atlantic Ocean, while the formation of the Benue Troughin the early Cretaceous thinned the crust in the Garoua rift. Thethicker crust in the Congo craton was formed as a result of conti-nent–continent collision in the development of the Gondwana.Recently, Gallacher and Bastow (2012) applied a RFs stacking tech-nique (Zhu and Kanamori, 2000) using the CBSE data to study
100 A.A. Elsheikh et al. / Journal of African Earth Sciences 100 (2014) 96–108
crustal structure beneath the CVL. Most of the crustal thicknessmeasurements by Gallacher and Bastow (2012) are comparablewith those obtained by Tokam et al. (2010).
3. Previous seismic anisotropy studies
During the past two decades, XKS splitting studies providedimportant constraints on various models for the formation, struc-ture, and dynamics of various Cenozoic tectonic processes on theAfrican plate including rifting, uplifting, volcanism, and lithospheredeformation (e.g., Vinnik et al., 1989; Gao et al., 1997, 2010;Barruol and Hoffmann, 1999; Silver et al., 2001; Barruol andIsmail, 2001; Gashawbeza et al., 2004; Walker et al., 2004;Kendall et al., 2005, 2006; Bagley and Nyblade, 2013; Elsheikhet al., 2014). In our study area, Chevrot (2000) conducted multi-channel SKS splitting analysis to constrain seismic anisotropybeneath station BGCA (formerly called BNG). He suggested thatthe splitting parameters U = 17 ± 1.0� and dt = 0.74 ± 0.03 sobserved at the station are due to the present-day movement ofthe African plate. For the same station, Barruol and Hoffmann(1999) found U = 29 ± 4.0� and dt = 0.84 ± 0.11 s. Barruol andIsmail (2001) investigated upper mantle anisotropy beneath theAfrican plate using data from the Incorporated ResearchInstitutions for Seismology (IRIS) and GEOSCOPE stations including
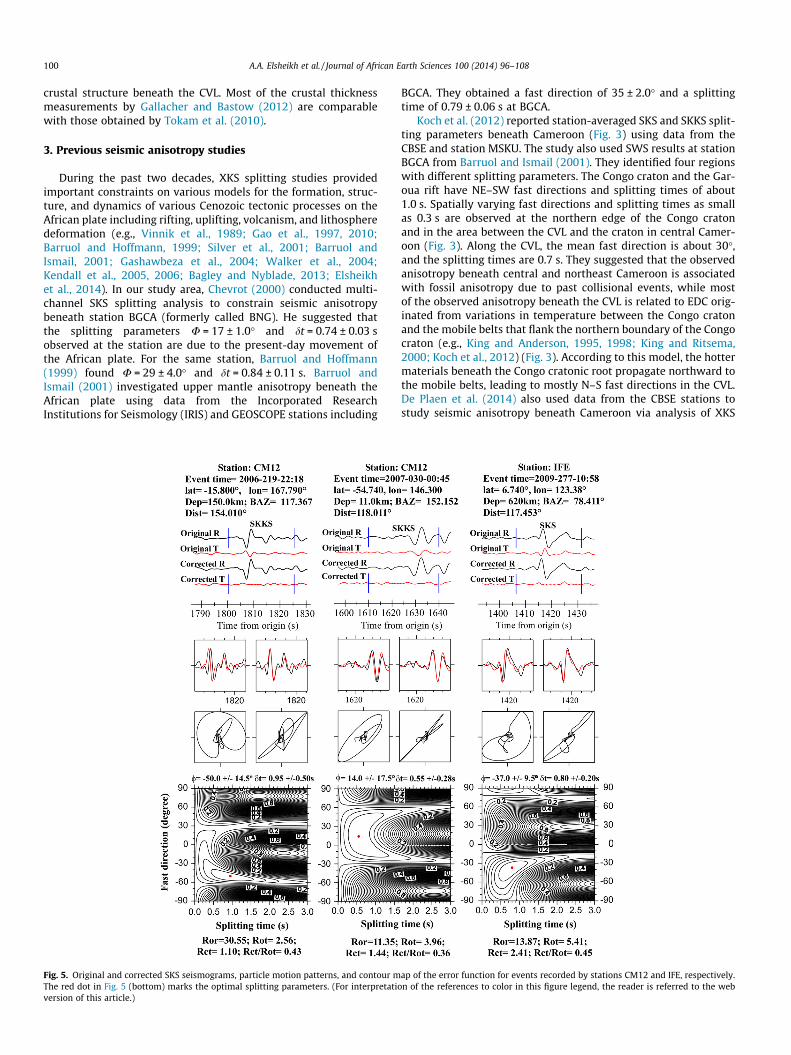
Fig. 5. Original and corrected SKS seismograms, particle motion patterns, and contour mThe red dot in Fig. 5 (bottom) marks the optimal splitting parameters. (For interpretatioversion of this article.)
BGCA. They obtained a fast direction of 35 ± 2.0� and a splittingtime of 0.79 ± 0.06 s at BGCA.
Koch et al. (2012) reported station-averaged SKS and SKKS split-ting parameters beneath Cameroon (Fig. 3) using data from theCBSE and station MSKU. The study also used SWS results at stationBGCA from Barruol and Ismail (2001). They identified four regionswith different splitting parameters. The Congo craton and the Gar-oua rift have NE–SW fast directions and splitting times of about1.0 s. Spatially varying fast directions and splitting times as smallas 0.3 s are observed at the northern edge of the Congo cratonand in the area between the CVL and the craton in central Camer-oon (Fig. 3). Along the CVL, the mean fast direction is about 30�,and the splitting times are 0.7 s. They suggested that the observedanisotropy beneath central and northeast Cameroon is associatedwith fossil anisotropy due to past collisional events, while mostof the observed anisotropy beneath the CVL is related to EDC orig-inated from variations in temperature between the Congo cratonand the mobile belts that flank the northern boundary of the Congocraton (e.g., King and Anderson, 1995, 1998; King and Ritsema,2000; Koch et al., 2012) (Fig. 3). According to this model, the hottermaterials beneath the Congo cratonic root propagate northward tothe mobile belts, leading to mostly N–S fast directions in the CVL.De Plaen et al. (2014) also used data from the CBSE stations tostudy seismic anisotropy beneath Cameroon via analysis of XKS
ap of the error function for events recorded by stations CM12 and IFE, respectively.n of the references to color in this figure legend, the reader is referred to the web

A.A. Elsheikh et al. / Journal of African Earth Sciences 100 (2014) 96–108 101
splitting. They reported NNE–ENE fast directions with splittingtime varies from 0.48 to 1.95 s in Cameroon. They concluded thatthe observed anisotropy in Cameroon was related to frozen anisot-ropy developed as a result of Cretaceous rifting in the Gondwanasupercontinent.
In this study, we take the advantage of the recently releasedbroadband seismic data in a larger area surrounding the CVL thanthat in previous studies, including data from Cameroon, the CentralAfrican Republic, Gabon, and Nigeria, to provide additional con-straints on the origin of the CVL. We conclude that SWS resultsfavor a model that involves a lithospheric channel that developedas a result of gradual basal erosion by the underlying astheno-sphere on the northern edge of the Congo craton. This mechanismin turn causes decompression melting and is responsible for theformation of both the continental and oceanic sections of the CVL.
4. Data and methods
We use all the broadband XKS data recorded in the study areaand archived until early 2013 at IRIS Data Management Center(DMC). The seismic events were selected based on the followingcriteria: For PKS, the epicentral distance range is 120–180�, andthe cutoff magnitude is 5.8; for SKKS, the corresponding valuesare 95–180� and 5.6; and for SKS, they are 84–180 and 5.6. In orderto take the advantage of the sharper waveforms for all the PKS,SKKS, and SKS phases from deeper events, the cutoff magnitudeis reduced by 0.1 unit for events with a focal depth equal or greaterthan 100 km (Liu and Gao, 2013). Fig. 4 shows the distribution ofthe 204 events that produced at least one well-defined measure-ment. The majority of the events are located in the western Pacificand Nazca subduction zones. Thirty-six stations were found to pro-duce at least one well-defined XKS splitting measurement. One ofthe stations used in this study, BGCA in Central Africa, belongs toGEOSCOPE. This station has been operating since June 1994. Sta-tions EKNA, IFE, and YNDE are part of the African Array, while sta-tion TORO is a Nigerian National Seismic Network station. Inaddition, we used data from station MSKU, which belongs toIRIS/USGS Global Seismographic Network in Masuku Gabon. Thisstation has been operating since March 1999. The rest of thestations are from the CBSE (Tokam et al., 2010). During ourshear-wave-splitting analysis, we detected and corrected amisidentification of the vertical and E–W components at station IFE.
This study used a procedure for measuring and objectivelyranking XKS splitting parameters based on the minimization oftransverse energy method (Silver and Chan, 1991; Liu et al.,2008; Gao and Liu, 2009; Liu, 2009; Gao et al., 2010; Liu andGao, 2013). The seismograms were band-pass filtered in the0.04–0.5 Hz range which is the most effective frequency band forenhancing the signal-to-noise ratio (S/N). The optimal XKS timewindow is visually verified and adjusted if necessary to excludenon-XKS arrivals (Liu and Gao, 2013). The uncertainties in the mea-surements are calculated based on the inverse F-test (Silver andChan, 1991).
Fig. 5 shows examples of the original and corrected waveformsand their particle motion diagrams. The quality of the resultingmeasurements are ranked using the S/N on the original radial(Ror), original transverse (Rot), and corrected transverse (Rct) com-ponents (Liu et al., 2008). We classified a measurement as a qualityA measurement when Ror P 10.0, Rot P 2.0, and Rct/Rot 6 0.7, thatis, outstanding energy on both the radial and transverse compo-nents is observed, and the resulting parameters were effective inreducing the energy on the transverse component (Liu et al.,2008). For a quality B event, the corresponding values are3.0 6 Ror < 10.0, Rot P 2.0, and Rct/Rot 6 0.7. The ranking was man-ually screened and adjusted if necessary.
5. Results
A total of 432 pairs of quality A or B measurements wereobtained after manual screening of the results (Fig. 6). In addition,we observed null measurements at almost all of the stations. Nullmeasurements are characterized by the lack of observable energyon the transverse component as a result of the backazimuth(BAZ) directions being either parallel or perpendicular to the fastdirection, or the media traveled by the XKS phase is isotropic(e.g., Silver and Chan, 1991; Liu and Gao, 2013). Two or more nullevents with non-parallel or orthogonal back-azimuths indicate thepaucity of anisotropy. Our results demonstrate that clear splittingis observed at all stations in the study area, and thus the null mea-surements are not used in the discussions below.
5.1. Spatial variations of SWS measurements
We divide the CVL and the adjacent regions into five sub-areasbased on the characteristics of the SWS measurements and also ondifferent tectonic provinces (Figs. 2 and 3). Area A is on the Congocraton and includes stations CM02, 03, 04, 06, BGCA and MSKU andcontains 208 pairs of SWS measurements. The mean fast directionin this area 44.4 ± 20�, and the mean splitting time is 0.91 ± 0.29 s.Area B lies on the northern edge of the Congo craton and includesstations CM07, 10, 11, 12, 17, and YNDE, possessing 40 pairs ofSWS measurements. The mean fast direction is 22 ± 28�, and themean splitting time is 1.17 ± 0.40 s. This area also includes stationsCM08 and CM14, but data from these stations cannot be used forSWS analysis due to the lack of high-quality waveforms. Area C,the area along the Cameroon shoreline, consists of stations CM01and 05 and contains 10 pairs of SWS measurements with a meanfast direction of 44 ± 22� and a mean splitting time of 0.7 ± 0.2 s.Area D is the main part of the CVL and spans from southern Cam-eroon to the Chad border, and includes stations EKNA, CM09, 13,15, 16, and CM19–CM32 with 156 pairs of SWS measurements.Within Area D, we observed a mean fast direction of 53.3 ± 20.7�,which is parallel to the general strike of the CVL, and a mean split-ting time of 1.0 ± 0.32 s. Area E consists of stations IFE, TORO, andCM18 (Figs. 2 and 3). These stations are located in Nigeria and wes-tern Cameroon, wherein we observed a mean fast direction of�55.9 ± 15.9� and a mean splitting time of 1.3 ± 0.39 s from 17pairs of SWS measurements. The fast directions observed in AreaE are mostly sub-parallel to the African coastline.
We next examine azimuthal variations of the observed splittingparameters, which are diagnostics of complex anisotropy (Silverand Savage, 1994). None of the stations shows periodic variations,suggesting that a single layer of anisotropy with a horizontal axisof symmetry is sufficient to explain the observations. There is,however, piercing-point dependence of the splitting parameters.For instance, at CM12, two events with a BAZ of 117� and 152�,respectively, shows a fast direction of �50� and 14�, respectively(Fig. 6), and nearly N–S fast directions were obtained from eventswith a BAZ of 26� and 66�, respectively. Similarly, at CM20, weobserved fast directions of 15� and 62� for events with a BAZ of28� and 81�, respectively. In general, measurements with ray-piercing points (at 200 km depth) beneath the CVL have a fastdirection that is parallel to the CVL.
5.2. Comparison with previous results
To compare results from this study with station-averagedresults of previous studies, we calculate the circular mean of thefast direction and the simple mean of the splitting times for eachof the stations (Table 1). The major difference between our andprevious results is that our splitting times are about twice as large

Fig. 6. Resulting XKS splitting parameters plotted above ray-piercing points at the depth of 200 km (black bars). The color image in the background shows the topographicrelief of the study area. The white lines represent the boundary of the low-velocity zone at the depth of 200 km (Reusch et al., 2010). The dashed gray lines represent sutures(see Fig. 3). (For interpretation of the references to color in this figure legend, the reader is referred to the web version of this article.)
Table 1Station locations and station-averaged splitting parameters.
Area Station Lat. Long. U STD U dt STD dt Number of measurements
A BGCA 5.18 18.42 25.85 19.53 0.95 0.04 73CM02 2.7 13.29 53.04 7.05 0.98 0.02 17CM03 3.52 15.03 40.94 19.93 0.63 0.09 5CM04 2.98 11.96 66.23 7.05 0.99 0.06 18CM06 2.38 11.27 52.32 10.84 0.91 0.04 43MSKU �1.66 13.61 49.3 13.43 0.88 0.04 52
B CM07 3.87 11.46 �42.32 26.36 0.85 0.15 4CM10 4.22 10.62 42.03 7.69 0.91 0.13 6CM11 3.98 13.19 24.69 5.86 0.78 0.02 6CM12 4.48 11.63 �5.42 39.88 1.13 0.15 6CM17 5.55 12.31 25.24 6 1.46 0.07 16YNDE 3.87 11.46 �33.5 0.5 1.7 0.25 2
C CM01 2.39 9.83 14.5 4.51 0.98 0.38 2CM05 2.94 9.91 51.89 17.69 0.69 0.06 8
D CM09 4.23 9.33 22.5 2.5 1.23 0.03 2CM13 4.59 9.46 10.5 8.78 1.06 0.07 5CM15 5.03 9.93 5.22 6.99 1.1 0.15 5CM16 5.48 10.57 21 13.23 0.85 0.05 2CM19 5.97 11.23 15.65 7.81 0.96 0.2 4CM20 6.22 10.05 38.5 25.06 1.15 0.25 2CM21 6.47 12.62 50.9 13.09 1.1 0.1 13CM22 6.48 13.27 72.15 5.83 1.24 0.08 13CM23 6.37 10.79 55 25.68 0.98 0.48 2CM24 6.52 14.29 78.21 6.34 1.27 0.11 13CM25 6.76 11.81 62 20.92 1.18 0.58 2CM26 7.26 13.55 52.91 15.5 0.78 0.06 15CM27 7.36 12.67 57.5 2.5 0.65 0 2CM28 8.47 13.24 58.15 23.56 1.1 0.12 3CM29 9.35 13.39 53.57 9.28 1.04 0.05 19CM30 9.76 13.95 47.67 9.59 1.2 0.09 16CM31 10.33 15.26 61.06 8.01 0.98 0.05 19CM32 10.62 14.37 51.44 15.18 1.09 0.09 19EKNA 4.23 9.33 19 5 1.5 0.28 1
E CM18 5.72 9.35 �76.22 4.36 1.32 0.22 5IFE 7.55 4.46 �45.12 9.52 1.27 0.12 9TORO 10.99 8.12 �54.95 7.1 1.32 0.27 3
102 A.A. Elsheikh et al. / Journal of African Earth Sciences 100 (2014) 96–108

Fig. 7. Comparisons between our station-averaged measurements and those from previous studies. (A). Fast directions from this study plotted against the latitude. Thedashed line shows the APM direction from the model of Gripp and Gordon (2002). (B). Splitting times from this study plotted against the latitude. The dashed line representsthe average splitting time. (C). Fast directions from Barruol and Ismail (2001) (green diamond) and Koch et al. (2012) (red triangles) plotted against the latitude. The dashedline indicates the APM direction from the model of Doubrovine et al. (2012). (D). Splitting times obtained by Barruol and Ismail (2001) (green diamond) and Koch et al. (2012)(red triangles) plotted against the latitude. The dashed line shows the average splitting time observed by Koch et al. (2012). (For interpretation of the references to color inthis figure legend, the reader is referred to the web version of this article.)
A.A. Elsheikh et al. / Journal of African Earth Sciences 100 (2014) 96–108 103
as those obtained by previous studies at almost all of the stations(Fig. 7). We hypothesize that this variation in splitting times iscaused by the different method used by the studies. In additionto the obvious differences in most of the splitting time measure-ments between this and previous studies (Fig. 7), there are severalother notable discrepancies. The first is that we did not use datafrom stations CM08 and CM14 due to equipment failures. CM08did not yield sufficient data for our SWS analysis, while the N–Scomponent at CM14 was not working (Tokam et al., 2010;Gallacher and Bastow, 2012), resulting in a nearly linear particlemotion pattern (Liu and Gao, 2013). Using data from this station,Koch et al. (2012) obtained a fast direction of 25� and a splittingtime of 1.1 s at station CM08. At CM14, they obtained a fast direc-tion of �32� and a splitting time of 0.35 s. The second disagree-ment is that Koch et al. (2012) obtained null results at stationsCM07 and CM18, but this study observed a mean fast directionof �42.3� and a mean splitting time of 0.9 ± 0.30 s at stationCM07, and a fast direction of �76.2� and a splitting time of1.3 ± 0.5 s at CM18. Third, at station CM20, we obtained a fastdirection of 38� and a splitting time of 1.1 s while Koch et al.(2012) reported a fast direction of �1� and a splitting time of0.48 s. Also, at station CM23, we observed a fast direction of54.9� and a splitting time of 0.9 s while Koch et al. (2012) obtaineda fast direction of�15� and a splitting time of 0.53 s. These discrep-ancies were mostly caused by the differences in the standards fordata selection and result ranking, and the techniques used toobtain the results.
6. Discussion
In the cratonic environment, seismic anisotropy detectable byXKS splitting occurs either by LPO of crystallographic axes of aniso-tropic minerals (mainly olivine) developed under axis compressionand simple shear, or shape-preferred orientation (SPO) formed by
preferably aligned vertical magmatic dikes. The former can eitherbe resulted from shortening of the lithosphere or from flow inthe asthenosphere, and the latter is mostly found in areas under-gone extension (e.g., Nicolas and Christensen, 1987; Silver, 1996;Gao et al., 1997, 2010; Savage, 1999; Vauchez et al., 2000; Fouchand Rondenay, 2006; Nowacki et al., 2010; Refayee et al., 2013).In the following, we discuss each of the possibilities in light ofthe observed anisotropy and propose a model that explains boththe SWS observations and the formation and evolution of the CVL.
6.1. Fossil anisotropy due to Precambrian collisional events
Many previous studies attributed observed anisotropy to litho-spheric fabrics created by the last significant collisional tectonicevents (e.g., Silver and Chan, 1991; Babuška and Plomerová, 1989;James and Assumpcao, 1996; McNamara et al., 1994; Silver, 1996;Fouch et al., 2004; Fouch and Rondenay, 2006). The observed anisot-ropy on the Kaapvaal and Zimbabwe cratons as well as on the Limp-opo belt sandwiched between the cratons was considered as mostlythe result of lithospheric fabrics (e.g., Silver et al., 2001; Barruol andIsmail, 2001; Fouch et al., 2004). Most of the study area lies betweenthe Congo and West Africa cratons which consist of several tectonicshields including the Bomu-Kibalian, Nigerian, Gabon-Cameroon,and Man-Leo Shields developed during the Precambrian (e.g., Begget al., 2009) (Figs. 2 and 3).
The N–S fast directions observed in the northern edge of theCongo craton (Area B) might originate from Precambrian collisionevents. These converging events include the collision betweenthe Gabon-Cameroon Shield and the Bomu-Kibalian Shield to formthe northern part of the Congo craton, and the collision betweenthe Congo craton and the Oubanguides mobile belt (e.g., Castainget al., 1994; Toteu et al., 2004; Begg et al., 2009). This speculationis in agreement with Koch et al. (2012) who suggested that mea-surements from the northern edge of the Congo craton represent

104 A.A. Elsheikh et al. / Journal of African Earth Sciences 100 (2014) 96–108
a fossil anisotropy resulted from Precambrian collisional events.However, most of our fast directions throughout the study areaare aligned perpendicular to the suture zones (Figs. 3 and 6), andconsequently, fossil seismic anisotropy, which has remained inthe cratonic lithosphere since the Precambrian, cannot accountfor the majority of splitting parameters observed in the study.
6.2. Fossil anisotropy due to rifting of the Gondwana supercontinent
In areas of extended lithosphere such as continental extensionalor rifting areas, the fast direction may align orthogonal to theextensional direction (Silver, 1996). This mechanism wasemployed to explain rift-parallel fast directions observed in theMain Ethiopian rift (Gashawbeza et al., 2004) and the Baikal andKenya rifts (Gao et al., 1997). A recent study by De Plaen et al.(2014) suggested that the observed seismic anisotropy beneaththe CVL was developed as a result of the rifting of the Gondwanasupercontinent. While this model can explain the NE-SW fastdirections in the CVL and adjacent areas (Figs. 2 and 6), an unusu-ally large lithospheric anisotropy of about 9% is needed in order forthe �100 km thick lithosphere to produce the large (e.g., 1.95 s atCM12) splitting times. In addition, this model cannot account forthe NE–SW fast directions observed at stations CM28–32 whichare outside the ancient rifted zone (Fig. 2 and 6). If the anisotropyis originated in the lithosphere, these stations should have NW–SEfast directions parallel to the Garoua Rift and sutures (Fig. 2) whichis not observed. Thus, fossil anisotropy resides in the lithosphere asa result of the rifting within the Gondwana supercontinent maynot satisfactorily explain the observed anisotropy.
6.3. Mantle flow field associated with a mantle plume
Continental intraplate flood basalt development, uplifts, andbathymetric swells in Africa were often attributed to one or moremantle plumes (e.g., Morgan, 1972; Burke and Dewey, 1973;Nyblade and Robinson, 1994). Similarly, a mantle upwelling wasproposed for the formation of the CVL (Van Houten, 1983;Morgan, 1983; Lee et al., 1994; Ebinger and Sleep, 1998; Burke,2001). Burke (2001) suggested that a mantle plume, which islocated at latitude 7�N and longitude 11.5�E (Fig. 3), could beresponsible for the development of the CVL. Due to the upwellingof the plume material and the relative movement between the lith-osphere and the asthenosphere, a parabolic flow pattern isexpected in the vicinity of the plume, as observed in Hawaii andwest-central Europe (Walker et al., 2001, 2005). Such a parabolicpattern is not observed (Fig. 6). Directly above a mantle plume, lab-oratory experiments suggest a complicated pattern of splittingparameters and small splitting times in the case of A-type olivinefabrics (Karato et al., 2008; Druken et al., 2013), which is notobserved either. Therefore, our SWS results do not support anactive plume beneath the CVL. This conclusion is consistent withthe observation that the 3He/4He ratios measured on basaltic rocksalong the CVL are lower than those observed at typical hotspotssuch as Loihi and Iceland (Aka et al., 2004). In addition, if a mantleplume was responsible for the formation of the CVL, the melt gen-eration, as reflected by the expected higher-than-normal crustalVp/Vs, should be much higher than what was observed beneaththe CVL (Gallacher and Bastow, 2012). Thus, the mantle potentialtemperature beneath the CVL is significantly lower than thatobserved in Afar, Iceland, and other typical mantle plumes(Gallacher and Bastow, 2012). Body-wave seismic velocitiesobserved beneath the CVL are also higher than those observedbeneath the Ethiopia rift (Stuart et al., 1985; Bastow and Keir,2011; Gallacher and Bastow, 2012). The absence of a deep mantleplume is also suggested by a nearly normal transition zone thick-ness (251 ± 10 km) observed beneath the CVL (Reusch et al., 2011).
6.4. Edge-driven convective flow
Geodynamic modeling suggests that variations in lithosphericthickness create a lateral contrast in temperature and viscositynear the top of the mantle, and the contrast may induce a small-scale convective mantle flow beneath the cratonic margin andcould lead to uplifting, rifting, and formation of flood basalts(e.g., Anderson, 1994, 2001; King and Anderson, 1995, 1998; Kingand Ritsema, 2000; King, 2007).
The CVL is flanked by the Congo craton to the south and an areawith thinner lithosphere to the north (Fig. 3), and thus is a prefer-able location for EDC with a flow direction that is approximatelyperpendicular to the CVL. Several studies (King and Ritsema,2000; Reusch et al., 2010; Koch et al., 2012; Milelli et al., 2012)argued that this small-scale convection system is responsible forthe formation of the CVL. This model can explain the lack of ageprogression along the CVL. However, the anticipated fast directionsassociated with the proposed EDC should mostly be NW–SE, whichis almost orthogonal to the observed fast directions which aredominantly NE–SW along the northern edge of the craton and inthe CVL (Fig. 6).
Another possible locale for EDC is the boundary between theCongo craton and the Atlantic Ocean basin with a nearly E–W flowdirection (Reusch et al., 2010; Koch et al., 2012; Milelli et al., 2012).This EDC system, if exists, should produce a volcanic line in theAtlantic Ocean that is parallel to the western edge of the Congo cra-ton with a N–S strike, which is not observed. Thus EDC cannot beresponsible for the seismic anisotropy observed beneath the conti-nental or the oceanic section of the CVL.
6.5. APM induced anisotropy
Numerous studies have suggested that simple shear at the baseof the plate can lead to LPO oriented in the direction of shearbeneath plates that move at velocities significantly different fromthose of the deep convection (e.g., Zhang and Karato, 1995;Tommasi et al., 1996; Tommasi, 1998; Walker et al., 2004; Liu,2009; Barruol and Fontaine, 2013). As a result, a model thatinvolves asthenospheric flow induced by a moving plate is usedto account for large-scale uniform anisotropy with fast directionsthat are parallel to the APM (e.g., Vinnik et al., 1989; Walkeret al., 2004; Marone and Romanowicz, 2007; Liu, 2009). However,the assumption of a positive relationship between fast directionsand APM may not hold true for plates that move at small velocitiesrelative to the underlain asthenosphere.
The APM for the African plate is small, which is partially respon-sible for the poorly constrained plate motion directions (e.g.,Walker et al., 2004; Barruol and Fontaine, 2013). The currentAPM direction of the study area based on the HS3-NUVEL1A hot-spot model (Gripp and Gordon, 2002) is approximately towardthe west (260�) (Fig. 1), with a rate of 1.7 cm/yr. The majority ofthe observed fast directions in the vicinity of the CVL (Figs. 1 and6) are at a high angle (>30�) with the APM direction predicted bythe HS3-NUVEL1A model. The GMHRF model (Doubrovine et al.,2012) predicts that the present-day motion of Africa is ENE (68�)at a rate of 1.3 cm/yr (Fig. 1). The spatially varying fast directionsand the large misfit between the fast directions and the APM direc-tion from either of the models in the study area (Figs. 1 and 6) sug-gest that APM-induced fabrics beneath slow-moving plates such asAfrica may not be a major contribution to the observed anisotropy.
6.6. Mantle flow in a lithospheric channel
The dominantly CVL-parallel fast directions can be explained byNE-ward (relative to the lithosphere) mantle flow along a litho-spheric channel beneath the CVL (Fig. 8A). Recent mantle flow

Fig. 8. (A). A map view of the study area showing station-averaged XKS splitting parameters (blue bars) and proposed mantle flow lines (brown bands with arrows). (B). Aschematic Three-dimensional perspective view illustrates how the asthenospheric material flows along the base of the CVL continental lithosphere. (For interpretation of thereferences to color in this figure legend, the reader is referred to the web version of this article.)
A.A. Elsheikh et al. / Journal of African Earth Sciences 100 (2014) 96–108 105
models suggest that the lithosphere in the study areas is underlainby a NE (relative to the lithosphere) directed flow (Conrad andBehn, 2010; Forte et al., 2010). Forte et al. (2010) studied the man-tle flow field at the depth of 250 km using the joint inversion ofmantle rheological structure and density perturbations. Forte
et al. (2010) suggested that the asthenosphere is moving towardthe NE with a velocity of 5.0 cm/yr beneath the CVL and the neigh-boring regions (Fig. 1). In addition, most seismic tomographic stud-ies of the upper mantle clearly show the existence of low-velocityanomalies beneath the CVL relative to the bordering cratons/

106 A.A. Elsheikh et al. / Journal of African Earth Sciences 100 (2014) 96–108
shields (e.g., King and Ritsema, 2000; Reusch et al., 2010). Reuschet al. (2010) used data recorded by the CBSE network to studythe upper mantle structure beneath the CVL. They found a tabular,low-velocity anomaly underlying both the continental and oceanicsections of the CVL with a depth that extends to �300 km (Fig. 6).
We propose that the flow is driven by the SW movements of thelithosphere relative to the asthenosphere, and the direction of theflow is modulated by the geometry of the channel (Fig. 8), resultingin fast directions that are dominantly parallel to the CVL for mea-surements with ray-piercing points beneath the CVL. Under thismodel, stations adjacent to the CVL but with non-CVL-parallel fastdirections such as CM20 (Fig. 2) and those in Area B (Fig. 3) couldbe interpreted as being located near the northern and southernboundaries, respectively, of the lithospheric channel (Fig. 6). Addi-tionally, the coast-parallel fast directions observed at stations onthe Nigerian shield could be explained as reflecting the flowdeflected by the keel of the African continent. Such a deflectionwas suggested beneath the western (Refayee et al., 2013) andsouthern (Fouch et al., 2000; Gao et al., 2008) edges of the NorthAmerican craton.
6.7. Implications on the formation of the CVL
As detailed above, in spite of numerous geochemical, geophys-ical, and geodynamic investigations, the formation of the CVLremains enigmatic. The lack of a clear age progression of the volca-noes in the CVL and the isotopic signatures ruled out a plumeorigin of both the continental and oceanic sections of the CVL.Edge-driven small-scale mantle convection cannot explain the ori-entation of the CVL or the formation of its oceanic section. Viablehypotheses for its formation should be able to explain the linearity,orientation, location, lack of age progression, and possibly itsupper-mantle origin (as indicated by isotopic studies) of the volca-nic line. In this section, we propose a hypothesis for the formationof the CVL that can explain most, if not all, of previous observationsas well as our new shear-wave splitting measurements. Thishypothesis is based on recent geodynamic modeling results sug-gesting the possibility of thermal–mechanical erosion of the baseof the lithosphere by concentrated asthenospheric flow (Davies,1994; Ribe and Christensen, 1994; Sleep, 1994; Artemieva andMooney, 2002; Conrad et al., 2011). We propose that the CVLwas developed by gradual basal erosion of the underlying litho-sphere, along a line with the maximum flow intensity originatedfrom the 90� sharp change in the orientation of the western marginof central Africa, from E–W north of the CVL to N–S south of theCVL (Fig. 2).
This hypothesis can explain one of the puzzling features of theCVL, i.e., it intercepts the African coastline exactly at the joint pointbetween the E–W and N–S segments of the coastline, and forms anearly 45� angle with both segments (Fig. 8). We suggest that the90� turn of the continental margin creates a perfect locale for theconcentration of mantle flow that originates from the SW-wardmovement (relative to the asthenosphere) of the African litho-sphere and is deflected by the cratonic keel (Fig. 8A). Such a rela-tive movement is suggested by geodynamic modeling (Forteet al., 2010) (Fig. 1). Beneath the Atlantic Ocean, the flow concen-tration extends toward the SW with a gradually decreasing inten-sity and produces the oceanic section of the CVL. Thisinterpretation is consistent with the SW-ward decrease of the sizeof the volcanoes on the ocean floor (Fig. 8A). It is also consistentwith the suggestion that there is a low-velocity zone beneath thePrinncipe Island (Meyers et al., 1998) and beneath the rest of theoceanic section of the CVL (Reusch et al., 2010).
This model suggests that the source of magma is at the base ofthe thinned lithosphere which is consistent with isotopic observa-tions (e.g., Aka et al., 2004). According to this hypothesis, the lack
of age progression of the eruptions can be explained by the factthat volcanic eruptions took place in areas with the maximumlithospheric thinning, which is controlled by pre-existing zonesof weakness and the distribution of mechanical strength in thelithosphere.
7. Conclusions
The CVL and the adjacent areas are tectonically complex regionswhich includes cratons, mobile belts, and shear zones, and activemagmatism. Our SWS results suggest that the anisotropy beneaththe CVL and surrounding areas is mostly located in the astheno-sphere, although fossilized anisotropy in the northern part of theCongo craton cannot be ruled out. Spatial distribution of the split-ting parameters in the study area does not support the small-scalemantle convection hypothesis nor the mantle plume and APMmodels as a cause for the observed anisotropy. We suggest thatthe predominant NE oriented anisotropy beneath the CVL is froma NE-ward (relative to the lithosphere) mantle flow along a litho-spheric channel beneath the CVL. This channel is developed dueto the differential movement of the African plate relative to theunderlying asthenosphere as suggested by several geodynamicmodeling studies. The model attributes coast-parallel fast direc-tions north of the CVL to mantle flow deflected by the edge ofthe Africa continent keel. We suggest that the flood basalts alongthe CVL were formed by gradual basal erosion of the lithosphere,as a result of concentration of mantle flow associated with thesharp change in the orientation of the continental margin of wes-tern Africa. Additional shear-wave splitting and other measure-ments in the coastal areas and on the ocean floor in the vicinityof the CVL should be able to test and refine the proposedhypothesis.
Acknowledgments
We thank the participants of the CBSE and the IRIS DMC for pro-viding the high-quality seismic data used in the study. We alsothank C. Conrad and A. Forte for providing mantle flow modelingresults and A. Mohamed for helping with illustrating Fig. 8B. Weare grateful to H. Al-Doukhi and R. Haselwander for discussions.We thank the Associate Editor and two anonymous reviewers fortheir constructive comments and suggestions. The work was par-tially supported by NSF award EAR-1009946.
References
Abdelsalam, M.G., Gao, S.S., Liégeois, J.-P., 2011. Upper mantle structure of theSaharan Metacraton. J. Afr. Earth Sc. 60, 328–336. http://dx.doi.org/10.1016/j.jafrearsci.2011.03.009.
Aka, F.T., Nagao, K., Kusakabe, M., Sumino, H., Tanyileke, G., Ateba, B., Hell, J., 2004.Symmetrical Helium isotope distribution on the Cameroon Volcanic Line, WestAfrica. Chem. Geol. 203, 205–223. http://dx.doi.org/10.1016/j.chemgeo.2003.10.003.
Anderson, D.L., 1994. The sublithospheric mantle as the source of continental floodbasalts; the case against the continental lithosphere and plume head reservoirs.Earth Planet. Sci. Lett. 123, 269–280. http://dx.doi.org/10.1016/0012-821X(94)90273-9.
Anderson, D.L., 2000. The thermal state of the upper mantle; No role for mantleplumes. Geophys. Res. Lett. 27, 3623–3626. http://dx.doi.org/10.1029/2000GL011533.
Anderson, D.L., 2001. Top-down tectonics? Science 293, 2016–2018.Artemieva, I.M., Mooney, W.D., 2002. On the relations between cratonic lithosphere
thickness, plate motions, and basal drag. Tectonophysics 358, 211–231. http://dx.doi.org/10.1016/S0040-1951(02)00425-0.
Babuška, V., Plomerová, J., 1989. Seismic Anisotropy of the Subcrustal Lithosphere inEurope: Another Clue to Recognition of Accreted Terranes. AGU, Washington,DC, pp. 209–217.
Bagley, B., Nyblade, A.A., 2013. Seismic anisotropy in eastern Africa, mantle flow,and the African superplume. Geophys. Res. Lett. 40, 1500–1505. http://dx.doi.org/10.1002/grl.50315.

A.A. Elsheikh et al. / Journal of African Earth Sciences 100 (2014) 96–108 107
Barruol, G., Fontaine, F.R., 2013. Mantle flow beneath La Réunion hotspot track fromSKS splitting. Earth Planet. Sci. Lett. 362, 108–121. http://dx.doi.org/10.1016/j.epsl.2012.11.017.
Barruol, G., Hoffmann, R., 1999. Upper mantle anisotropy beneath the Geoscopestations. J. Geophys. Res.: Solid Earth 104, 10757–10773. http://dx.doi.org/10.1029/1999JB900033.
Barruol, G., Ismail, W.B., 2001. Upper mantle anisotropy beneath the African IRISand geoscope stations. Geophys. J. Int. 146, 549–561. http://dx.doi.org/10.1046/j.0956-540x.2001.01481.x.
Bastow, I.D., Keir, D., 2011. The protracted development of the continent-oceantransition in Afar. Nat. Geosci. 4, 248–250. http://dx.doi.org/10.1038/ngeo1095.
Begg, G.C., Griffin, W.L., Natapov, L.M., O’Reilly, S.Y., Grand, S.P., O’Neill, C.J.,Hronsky, J.M.A., Djomani, Y.P., Swain, C.J., Deen, T., Bowden, P., 2009. Thelithospheric architecture of Africa: seismic tomography, mantle petrology, andtectonic evolution. Geosphere 5, 23–50.
Birch, F., 1960. The velocity of compressional waves in rocks to 10 kilobars: 1. J.Geophys. Res. 65, 1083–1102. http://dx.doi.org/10.1029/JZ065i004p01083.
Burke, K., 2001. Origin of the Cameroon Line of Volcano-capped swells. J. Geol. 109,349–362, http://www.jstor.org/stable/10.1086/319977.
Burke, K., Dewey, J.F., 1973. Plume-generated triple junctions: key indicators inapplying plate tectonics to old rocks. J. Geol. 81, 406–433.
Castaing, C., Feybesse, J.L., Thiéblemont, D., Triboulet, C., Chèvremont, P., 1994.Palaeogeographical reconstructions of the Pan-African/Brasiliano orogen:closure of an oceanic domain or intracontinental convergence between majorblocks? Precambr. Res. 69, 327–344. http://dx.doi.org/10.1016/0301-9268(94)90095-7.
Chastel, Y.B., Dawson, P.R., Wenk, H.-R., Bennett, K., 1993. Anisotropic convectionwith implications for the upper mantle. J. Geophys. Res.: Solid Earth 98, 17757–17771. http://dx.doi.org/10.1029/93JB01161.
Chevrot, S., 2000. Multichannel analysis of shear wave splitting. J. Geophys. Res.:Solid Earth 105, 21579–21590. http://dx.doi.org/10.1029/2000JB900199.
Conrad, C.P., Behn, M.D., 2010. Constraints on lithosphere net rotation andasthenospheric viscosity from global mantle flow models and seismicanisotropy. Geochem. Geophys. Geosyst. 11, 1–19. http://dx.doi.org/10.1029/2009GC002970.
Conrad, C.P., Behn, M.D., Silver, P.G., 2007. Global mantle flow and the developmentof seismic anisotropy: differences between the oceanic and continental uppermantle. J. Geophys. Res.: Solid Earth 112, B07317. http://dx.doi.org/10.1029/2006JB004608.
Conrad, C.P., Bianco, T.A., Smith, E.I., Wessel, P., 2011. Patterns of intraplatevolcanism controlled by asthenospheric shear. Nat. Geosci. 4, 317–321. http://dx.doi.org/10.1038/ngeo1111.
Courtillot, V., Davaille, A., Besse, J., Stock, J., 2003. Three distinct types of hotspots inthe Earth’s mantle. Earth Planet. Sci. Lett. 205, 295–308. http://dx.doi.org/10.1016/S0012-821X(02)01048-8.
Davies, G.F., 1994. Thermomechanical erosion of the lithosphere by mantle plumes.J. Geophys. Res.: Solid Earth 99, 15709–15722. http://dx.doi.org/10.1029/94JB00119.
De Plaen, R.S.M., Bastow, I.D., Chambers, E.L., Keir, D., Gallacher, R.J., Keane, J., 2014.The development of magmatism along the Cameroon Volcanic Line: evidencefrom seismicity and seismic anisotropy. J. Geophys. Res.: Solid Earth. http://dx.doi.org/10.1002/2013jb010583.
Deruelle, B., Moreau, C., Nkoumbou, C., Kambou, R., Lissom, J., Njonfang, E.,Ghogomu, R.T., Nono, A., 1991. The Cameroon Line: a review. In: Kampunzu,A.B., Lubala, R.T. (Eds.), Magmatism in Extensional Structural Settings. Springer,Berlin, Heidelberg, pp. 274–327, http://dx.doi.org/10.1007/978-3-642-73966-8_12.
Deruelle, B., Ngounouno, I., Demaiffe, D., 2007. The ‘Cameroon Hot Line’ (CHL): aunique example of active alkaline intraplate structure in both oceanic andcontinental lithospheres. C.R. Geosci. 339, 589–600. http://dx.doi.org/10.1016/j.crte.2007.07.007.
Djomani, Y.H.P., Nnange, J.M., Diament, M., Ebinger, C.J., Fairhead, J.D., 1995.Effective elastic thickness and crustal thickness variations in west central Africainferred from gravity data. J. Geophys. Res.: Solid Earth 100, 22047–22070.http://dx.doi.org/10.1029/95JB01149.
Dorbath, C., Dorbath, L., Fairhead, J.D., Stuart, G.W., 1986. A teleseismic delay timestudy across the central African shear zone in the Adamawa region ofCameroon, west Africa. Geophys. J. Roy. Astron. Soc. 86 (3), 751–766. http://dx.doi.org/10.1111/j.1365-246X.1986.tb00658.x.
Doubrovine, P.V., Steinberger, B., Torsvik, T.H., 2012. Absolute plate motions in areference frame defined by moving hot spots in the Pacific, Atlantic, and Indianoceans. J. Geophys. Res.: Solid Earth 117, B09101. http://dx.doi.org/10.1029/2011JB009072.
Druken, K.A., Kincaid, C., Griffiths, R.W., 2013. Directions of seismic anisotropy inlaboratory models of mantle plumes. Geophys. Res. Lett. 40, 3544–3549. http://dx.doi.org/10.1002/grl.50671.
Ebinger, C.J., Sleep, N.H., 1998. Cenozoic magmatism throughout east Africaresulting from impact of a single plume. Nature 395, 788–791. http://dx.doi.org/10.1038/27417.
Elsheikh, A.A., Gao, S.S., Liu, K.H., Mohamed, A.A., Yu, Y., Fat-Helbary, R.E., 2014.Seismic anisotropy and subduction-induced mantle fabrics beneath the Arabianand Nubian Plates adjacent to the Red Sea. Geophys. Res. Lett. 41, 2376–2381.
Fairhead, J.D., 1988. Mesozoic plate tectonic reconstructions of the central SouthAtlantic Ocean: the role of the West and Central African rift system.Tectonophysics 155, 181–191. http://dx.doi.org/10.1016/0040-1951(88)90265-X.
Fairhead, J.D., Okereke, C.S., 1987. A regional gravity study of the West African riftsystem in Nigeria and Cameroon and its tectonic interpretation. Tectonophysics143, 141–159. http://dx.doi.org/10.1016/0040-1951(87)90084-9.
Fitton, J.G., 1987. The Cameroon line, West Africa: a comparison between oceanicand continental alkaline volcanism. Geol. Soc., London, Spec. Publ. 30, 273–291.
Fitton, J.G., Dunlop, H.M., 1985. The Cameroon line, West Africa, and its bearing onthe origin of oceanic and continental alkali basalt. Earth Planet. Sci. Lett. 72, 23–38. http://dx.doi.org/10.1016/0012-821X(85)90114-1.
Fitton, J.G., Hughes, D.J., 1981. Strontian melilite in nephelinite lava from Etinde.Mineral. Mag. 44, 261–264.
Forte, A.M., Quéré, S., Moucha, R., Simmons, N.A., Grand, S.P., Mitrovica, J.X., Rowley,D.B., 2010. Joint seismic–geodynamic–mineral physical modelling of Africangeodynamics: a reconciliation of deep-mantle convection with surfacegeophysical constraints. Earth Planet. Sci. Lett. 295, 329–341. http://dx.doi.org/10.1016/j.epsl.2010.03.017.
Fouch, M.J., Rondenay, S., 2006. Seismic anisotropy beneath stable continentalinteriors. Phys. Earth Planet. Inter. 158, 292–320. http://dx.doi.org/10.1016/j.pepi.2006.03.024.
Fouch, M.J., Fischer, K.M., Parmentier, E.M., Wysession, M.E., Clarke, T.J., 2000. Shearwave splitting, continental keels, and patterns of mantle flow. J. Geophys. Res.:Solid Earth 105, 6255–6275. http://dx.doi.org/10.1029/1999JB900372.
Fouch, M.J., Silver, P.G., Bell, D.R., Lee, J.N., 2004. Small-scale variations in seismicanisotropy near Kimberley, South Africa. Geophys. J. Int. 157, 764–774. http://dx.doi.org/10.1111/j.1365-246X.2004.02234.x.
Gallacher, R.J., Bastow, I.D., 2012. The development of magmatism along theCameroon Volcanic Line: evidence from teleseismic receiver functions.Tectonics 31, TC3018. http://dx.doi.org/10.1029/2011TC003028.
Gao, S.S., Liu, K.H., 2009. Significant seismic anisotropy beneath the southern LhasaTerrane, Tibetan Plateau. Geochem. Geophys. Geosyst. 10, Q02008. http://dx.doi.org/10.1029/2008GC002227.
Gao, S., Davis, P.M., Liu, H., Slack, P.D., Zorin, Y.A., Mordvinova, V.V., Kozhevnikov,V.M., Meyer, R.P., 1994. Seismic anisotropy and mantle flow beneath the Baikalrift zone. Nature 371, 149–151. http://dx.doi.org/10.1038/371149a0.
Gao, S., Davis, P.M., Liu, H., Slack, P.D., Rigor, A.W., Zorin, Y.A., Mordvinova, V.V.,Kozhevnikov, V.M., Logatchev, N.A., 1997. SKS splitting beneath continental riftzones. J. Geophys. Res.: Solid Earth 102, 22781–22797. http://dx.doi.org/10.1029/97JB01858.
Gao, S.S., Liu, K.H., Stern, R.J., Keller, G.R., Hogan, J.P., Pulliam, J., Anthony, E.Y., 2008.Characteristics of mantle fabrics beneath the south-central United States:constraints from shear-wave splitting measurements. Geosphere 4, 411–417.
Gao, S.S., Liu, K.H., Abdelsalam, M.G., 2010. Seismic anisotropy beneath the AfarDepression and adjacent areas: implications for mantle flow. J. Geophys. Res.:Solid Earth 115, B12330. http://dx.doi.org/10.1029/2009JB007141.
Gashawbeza, E.M., Klemperer, S.L., Nyblade, A.A., Walker, K.T., Keranen, K.M., 2004.Shear-wave splitting in Ethiopia: Precambrian mantle anisotropy locallymodified by Neogene rifting. Geophys. Res. Lett. 31, L18602. http://dx.doi.org/10.1029/2009JB007141.
Gripp, A.E., Gordon, R.G., 2002. Young tracks of hotspots and current plate velocities.Geophys. J. Int. 150, 321–361. http://dx.doi.org/10.1046/j.1365-246X.2002.01627.x.
Hansen, S.E., Nyblade, A.A., Julià, J., 2009. Estimates of crustal and lithosphericthickness in Sub-Saharan Africa from S-wave receiver functions. S. Afr. J. Geol.112, 229–240.
CGMW and UNESCO 1990. International Geological Map of Africa.James, D.E., Assumpcao, M., 1996. Tectonic implications of S-wave anisotropy
beneath SE Brazil. Geophys. J. Int. 126, 1–10.Karato, S.C., Jung, H., Katayama, I., Skemer, P., 2008. Geodynamic significance of
seismic anisotropy of the upper mantle: new insights from laboratory studies.Annu. Rev. Earth Planet. Sci. 36, 59–95, http://dx.doi:10.1146/annurev.earth.36.031207.124120.
Kendall, J.M., Stuart, G.W., Ebinger, C.J., Bastow, I.D., Keir, D., 2005. Magma-assistedrifting in Ethiopia. Nature 433, 146–148. http://dx.doi.org/10.1038/nature03161.
Kendall, J.M., Pilidou, S., Keir, D., Bastow, I.D., Stuart, G.W., Ayele, A., 2006. Mantleupwellings, melt migration and the rifting of Africa: insights from seismicanisotropy. Geol. Soc., London, Spec. Publ. 259, 55–72. http://dx.doi.org/10.1144/gsl.sp.2006.259.01.06.
King, S.D., 2007. Hotspots and edge-driven convection. Geology 35, 223–226.King, S.D., Anderson, D.L., 1995. An alternative mechanism of flood basalt formation.
Earth Planet. Sci. Lett. 136, 269–279. http://dx.doi.org/10.1016/0012-821X(95)00205-Q.
King, S.D., Anderson, D.L., 1998. Edge-driven convection. Earth Planet. Sci. Lett. 160,289–296. http://dx.doi.org/10.1016/S0012-821X(98)00089-2.
King, S.D., Ritsema, J., 2000. African Hot Spot Volcanism: small-scale convection inthe upper mantle beneath cratons. Science 290, 1137–1140. http://dx.doi.org/10.1126/science.290.5494.1137.
Koch, F.W., Wiens, D.A., Nyblade, A.A., Shore, P.J., Tibi, R., Ateba, B., Tabod, C.T.,Nnange, J.M., 2012. Upper-mantle anisotropy beneath the Cameroon VolcanicLine and Congo Craton from shear wave splitting measurements. Geophys. J. Int.190, 75–86. http://dx.doi.org/10.1111/j.1365-246X.2012.05497.x.
Kreemer, C., 2009. Absolute plate motions constrained by shear wave splittingorientations with implications for hot spot motions and mantle flow. J.Geophys. Res.: Solid Earth 114, B10405. http://dx.doi.org/10.1029/2009JB006416.
Lee, D.-C., Halliday, A.N., Fitton, J.G., Poli, G., 1994. Isotopic variations with distanceand time in the volcanic islands of the Cameroon line: evidence for a mantle

108 A.A. Elsheikh et al. / Journal of African Earth Sciences 100 (2014) 96–108
plume origin. Earth Planet. Sci. Lett. 123, 119–138. http://dx.doi.org/10.1016/0012-821X(94)90262-3.
Li, A., Chen, C., 2006. Shear wave splitting beneath the central Tien Shan andtectonic implications. Geophys. Res. Lett. 33, L22303. http://dx.doi.org/10.1029/2006GL027717.
Liu, K.H., 2009. NA-SWS-1.1: a uniform database of teleseismic shear wave splittingmeasurements for North America. Geochem. Geophys. Geosyst. 10, Q05011.http://dx.doi.org/10.1029/2009GC002440.
Liu, K.H., Gao, S.S., 2013. Making reliable shear-wave splitting measurements. Bull.Seismol. Soc. Am. 103, 2680–2693. http://dx.doi.org/10.1785/0120120355.
Liu, H., Davis, P.M., Gao, S., 1995. SKS splitting beneath southern California.Geophys. Res. Lett. 22, 767–770. http://dx.doi.org/10.1029/95GL00487.
Liu, K.H., Gao, S.S., Gao, Y., Wu, J., 2008. Shear wave splitting and mantle flowassociated with the deflected Pacific slab beneath northeast Asia. J. Geophys.Res.: Solid Earth 113, B01305. http://dx.doi.org/10.1029/2007JB005178.
Marone, F., Romanowicz, B., 2007. The depth distribution of azimuthal anisotropy inthe continental upper mantle. Nature 447, 198–201. http://dx.doi.org/10.1038/nature05742.
McKenzie, D., 1979. Finite deformation during fluid flow. Geophys. J. Roy. Astron.Soc. 58, 689–715. http://dx.doi.org/10.1111/j.1365-246X.1979.tb04803.x.
McNamara, D.E., Owens, T.J., Silver, P.G., Wu, F.T., 1994. Shear wave anisotropybeneath the Tibetan Plateau. J. Geophys. Res.: Solid Earth 99, 13655–13665.http://dx.doi.org/10.1029/93JB03406.
Meyers, J.B., Rosendahl, B.R., Harrison, C.G.A., Ding, Z.-D., 1998. Deep-imagingseismic and gravity results from the offshore Cameroon Volcanic Line, andspeculation of African hotlines. Tectonophysics 284, 31–63. http://dx.doi.org/10.1016/S0040-1951(97)00173-X.
Milelli, L., Fourel, L., Jaupart, C., 2012. A lithospheric instability origin for theCameroon Volcanic Line. Earth Planet. Sci. Lett. 335–336, 80–87. http://dx.doi.org/10.1016/j.epsl.2012.04.028.
Morgan, W.J., 1972. Deep mantle convection plumes and plate motions. AAPG Bull.56, 203–213.
Morgan, W.J., 1983. Hotspot tracks and the early rifting of the Atlantic.Tectonophysics 94, 123–139. http://dx.doi.org/10.1016/0040-1951(83)90013-6.
Nicolas, A., Christensen, N.I., 1987. Formation of anisotropy in upper mantleperidotites: a review, composition, structure and dynamics of the lithosphere–asthenosphere system. Am. Geophys. Union 16, 111–123. http://dx.doi.org/10.1029/GD016p0111.
Nnange, J.M., Ngako, V., Fairhead, J.D., Ebinger, C.J., 2000. Depths to densitydiscontinuities beneath the Adamawa Plateau region, Central Africa, fromspectral analyses of new and existing gravity data. J. Afr. Earth Sc. 30, 887–901.http://dx.doi.org/10.1016/S0899-5362(00)00058-0.
Nowacki, A., Wookey, J., Kendall, J.M., 2010. Deformation of the lowermost mantlefrom seismic anisotropy. Nature 467, 1091–1094. http://dx.doi.org/10.1038/nature09507.
Nyblade, A.A., Robinson, S.W., 1994. The African Superswell. Geophys. Res. Lett. 21,765–768. http://dx.doi.org/10.1029/94GL00631.
Obrebski, M., Kiselev, S., Vinnik, L., Montagner, J.P., 2010. Anisotropic stratificationbeneath Africa from joint inversion of SKS and P receiver functions. J. Geophys.Res.: Solid Earth 115, B09313. http://dx.doi.org/10.1029/2009JB006923.
Plomerova, J., Babuška, V., Dorbath, C., Dorbath, L., Lillie, R.J., 1993. Deeplithospheric structure across the Central African Shear Zone in Cameroon.Geophys. J. Int. 115, 381–390.
Priestley, K., McKenzie, D., Debayle, E., Pilidou, S., 2008. The African upper mantleand its relationship to tectonics and surface geology. Geophys. J. Int. 175, 1108–1126. http://dx.doi.org/10.1111/j.1365-246X.2008.03951.x.
Refayee, H.A., Yang, B.B., Liu, K.H., Gao, S.S., 2013. Mantle flow and lithosphere–asthenosphere coupling beneath the southwestern edge of the North Americancraton: constraints from shear-wave splitting measurements. Earth Planet. Sci.Lett. http://dx.doi.org/10.1016/j.epsl.2013.01.031.
Reusch, A.M., Nyblade, A.A., Wiens, D.A., Shore, P.J., Ateba, B., Tabod, C.T., Nnange,J.M., 2010. Upper mantle structure beneath Cameroon from body wavetomography and the origin of the Cameroon Volcanic Line. Geochem.Geophys. Geosyst. 11, Q10W07. http://dx.doi.org/10.1029/2010GC003200.
Reusch, A.M., Nyblade, A.A., Tibi, R., Wiens, D.A., Shore, P.J., Bekoa, A., Tabod, C.T.,Nnange, J.M., 2011. Mantle transition zone thickness beneath Cameroon:evidence for an upper mantle origin for the Cameroon Volcanic Line. Geophys. J.Int. 187, 1146–1150. http://dx.doi.org/10.1111/j.1365-246X.2011.05239.x.
Ribe, N.M., 1989. Seismic anisotropy and mantle flow. J. Geophys. Res.: Solid Earth94, 213–4223. http://dx.doi.org/10.1029/JB094iB04p04213.
Ribe, N.M., Christensen, U.R., 1994. Three-dimensional modeling of plume–lithosphere interaction. J. Geophys. Res.: Solid Earth 99, 669–682. http://dx.doi.org/10.1029/93JB02386.
Ribe, N.M., Yu, Y., 1991. A theory for plastic deformation and textural evolution ofolivine polycrystals. J. Geophys. Res.: Solid Earth 96, 8325–8335. http://dx.doi.org/10.1029/90JB02721.
Ritsema, J., van Heijst, H., 2000. New seismic model of the upper mantle beneathAfrica. Geology 28, 63–66.
Sandvol, E., Seber, D., Calvert, A., Barazangi, M., 1998. Grid search modeling ofreceiver functions: implications for crustal structure in the Middle East andNorth Africa. J. Geophys. Res.: Solid Earth 103, 26899–26917. http://dx.doi.org/10.1029/98JB02238.
Savage, M.K., 1999. Seismic anisotropy and mantle deformation: what have welearned from shear wave splitting? Rev. Geophys. 37, 65–106. http://dx.doi.org/10.1029/98RG02075.
Schlüter, T., 2006. Geological Atlas of Africa: With Notes on Stratigraphy, Tectonics,Economic Geology, Geohazards and Geosites of Each Country, second ed.Springer, New York.
Silver, P.G., 1996. Seismic anisotropy beneath the continents: probing the depths ofgeology. Annu. Rev. Earth Planet. Sci. 24, 385–432. http://dx.doi.org/10.1146/annurev.earth.24.1.385.
Silver, P.G., Chan, W.W., 1991. Shear wave splitting and subcontinental mantledeformation. J. Geophys. Res.: Solid Earth 96, 16429–16454. http://dx.doi.org/10.1029/91JB00899.
Silver, P.G., Savage, M.K., 1994. The interpretation of shear-wave splittingparameters in the presence of two anisotropic layers. Geophys. J. Int. 119,949–963. http://dx.doi.org/10.1111/j.1365-246X.1994.tb04027.x.
Silver, P.G., Gao, S.S., Liu, K.H., 2001. Mantle deformation beneath southern Africa.Geophys. Res. Lett. 28, 2493–2496. http://dx.doi.org/10.1029/2000GL012696.
Sleep, N.H., 1994. Lithospheric thinning by midplate mantle plumes and thethermal history of hot plume material ponded at sublithospheric depths. J.Geophys. Res.: Solid Earth 99, 9327–9343. http://dx.doi.org/10.1029/94JB00240.
Stuart, G.W., Fairhead, J.D., Dorbath, L., Dorbath, C., 1985. A seismic refraction studyof the crustal structure associated with the Adamawa Plateau and Garoua Rift,Cameroon, West Africa. Geophys. J. Int. 81, 1–12.
Tabod, C.T., Fairhead, J.D., Stuart, G.W., Ateba, B., Ntepe, N., 1992. Seismicity of theCameroon Volcanic Line, 1982–1990. Tectonophysics 212, 303–320. http://dx.doi.org/10.1016/0040-1951(92)90297-J.
Tadjou, J.M., Nouayou, R., Kamguia, J., Kande, H.L., 2009. Gravity analysis of theboundary between the Congo craton and the Pan-African belt of Cameroon.Austrian J. Earth Sci. 102, 71–79.
Tokam, A.-P.K., Tabod, C.T., Nyblade, A.A., Julià, J., Wiens, D.A., Pasyanos, M.E., 2010.Structure of the crust beneath Cameroon, West Africa, from the joint inversionof Rayleigh wave group velocities and receiver functions. Geophys. J. Int. 183,1061–1076.
Tommasi, A., 1998. Forward modeling of the development of seismic anisotropy inthe upper mantle. Earth Planet. Sci. Lett. 160, 1–13. http://dx.doi.org/10.1016/S0012-821X(98)00081-8.
Tommasi, A., Vauchez, A., Russo, R., 1996. Seismic anisotropy in ocean basins:resistive drag of the sublithospheric mantle? Geophys. Res. Lett. 23, 2991–2994.http://dx.doi.org/10.1029/96GL02891.
Toteu, S.F., Penaye, J., Djomani, Y.P., 2004. U–Pb and Sm–Nd evidence for Eburneanand Pan-African high-grade metamorphism in cratonic rocks of southernCameroon. Can. J. Earth Sci. 41, 73–85.
Turcotte, D.L., Oxburgh, E.R., 1978. Intra-plate volcanism and discussion. Philos.Trans. R. Soc. London. Ser. A: Math. Phys. Sci. 288, 561–579.
Van Houten, F.B., 1983. Sirte Basin, north-central Libya: cretaceous rifting above afixed mantle hotspot? Geology 11, 115–118.
Vauchez, A., Tommasi, A., Barruol, G., Maumus, J., 2000. Upper mantle deformationand seismic anisotropy in continental rifts. Phys. Chem. Earth Part A. 25, 111–117. http://dx.doi.org/10.1016/S1464-1895(00)00019-3.
Vinnik, L.P., Farra, V., Romanowicz, B., 1989. Azimuthal anisotropy in the Earth fromobservations of SKS at GEOSCOPE and NARS broadband stations. Bull. Seismol.Soc. Am. 79, 1542–1558.
Walker, K.T., Bokelmann, G.H.R., Klemperer, S.L., 2001. Shear-wave splitting to testmantle deformation models around Hawaii. Geophys. Res. Lett. 28, 4319–4322.http://dx.doi.org/10.1029/2001GL013299.
Walker, K.T., Nyblade, A.A., Klemperer, S.L., Bokelmann, G.H.R., Owens, T.J., 2004. Onthe relationship between extension and anisotropy: constraints from shearwave splitting across the East African Plateau. J. Geophys. Res.: Solid Earth 109,B08302. http://dx.doi.org/10.1029/2003JB002866.
Walker, K.T., Bokelmann, G.H.R., Klemperer, S.L., Bock, G., 2005. Shear-wavesplitting around the Eifel hotspot: evidence for a mantle upwelling. Geophys.J. Int. 163, 962–980.
Wolfe, C.J., Solomon, S.C., 1998. Shear-wave splitting and implications for mantleflow beneath the MELT region of the East Pacific Rise. Science 280, 1230–1232.
Zhang, S., Karato, S.I., 1995. Lattice preferred orientation of olivine aggregatesdeformed in simple shear. Nature 375, 774–777. http://dx.doi.org/10.1038/375774a0.
Zhu, L., Kanamori, H., 2000. Moho depth variation in southern California fromteleseismic receiver functions. J. Geophys. Res.: Solid Earth 105, 2969–2980.http://dx.doi.org/10.1029/1999JB900322.
Related Documents