Eur. Phys. J. D 42, 243–251 (2007) DOI: 10.1140/epjd/e2007-00017-9 T HE EUROPEAN P HYSICAL JOURNAL D Formation of silver nanoclusters in transparent polyimides by Ag-K ion-exchange process S. Carturan 1, a , A. Quaranta 2 , M. Bonafini 3, b , A. Vomiero 3, c , G. Maggioni 1 , G. Mattei 4 , C. de Juli´ an Fern´ andez 4 , M. Bersani 4 , P. Mazzoldi 4 , and G. Della Mea 2 1 University of Padova, c/o Istituto Nazionale di Fisica Nucleare, Laboratori Nazionali di Legnaro, Viale dell’Universit`a 2, 35020 Legnaro, Padova, Italy 2 Department of Materials Engineering and Industrial Technologies, University of Trento, Trento, Italy 3 Istituto Nazionale di Fisica Nucleare, Laboratori Nazionali di Legnaro, Viale dell’Universit`a 2, 35020 Legnaro, Padova, Italy 4 Department of Physics, University of Padova, Via Marzolo 8, 35131 Padova, Italy Received 5 October 2006 / Received in final form 13 December 2006 Published online 31 January 2007 – c EDP Sciences, Societ`a Italiana di Fisica, Springer-Verlag 2007 Abstract. Silver nanoclusters embedded in two transparent fluorinated polyimides, 4,4’- hexafluoroisopropylidene diphthalic anhydride — 2,3,5,6-tetramethyl paraphenylene diamine (6FDA-DAD) and 3,3’,4,4’ — biphenyltetracarboxylic acid dianhydride — 1,1-bis(4-aminophenyl)-1-phenyl-2,2,2- trifluoroethane (BPDA-3F), have been produced by surface modification with KOH aqueous solution followed by K-assisted Ag doping and thermal reduction in hydrogen atmosphere. The reaction rate of the nucleophilic hydrolysis in KOH, studied by Fourier transform infrared spectroscopy (FT-IR) and Rutherford backscattering spectrometry (RBS), depends on the polyimide chemical structure. After ion-exchange in AgNO3 solution and subsequent annealing, the polyimide structure recovery was monitored by FT-IR whereas the characteristic surface plasmon absorption band of silver nanoparticles was evidenced by optical absorption measurements. The structure of silver nanoclusters as related to size and size distribution in the different polyimide matrices was thoroughly investigated by Transmission electron microscopy (TEM) and X-ray diffraction (XRD). The collected data evidenced a uniform distribution of Ag clusters of nanometric size after thermal treatment at 300 ◦ C in both polyimides. For the same ion-exchange treatment parameters and annealing temperature, XRD analyses evidenced the presence of crystallites with similar sizes. PACS. 71.20.Rv Polymers and organic compounds – 82.30.Nr Association, addition, insertion, cluster formation – 36.40.Vz Optical properties of clusters 1 Introduction Nowadays a number of investigations are focused on the production of nanocomposite materials made up of metal nanoclusters embedded in organic matrices, owing to their unusual optical, electronic, magnetic and chemical prop- erties [1,2]. In fact, the incorporation of metal particles in polymeric hosts allows their stabilization and prevents agglomeration, thus facilitating the fabrication into use- ful catalytic, optical and electronic devices. The opti- cal properties of noble metal nanoparticles (Cu, Au, Ag) are related to a typical absorption peak in the UV-VIS range [3], known as surface plasmon resonance (SPR) peak, whose intensity, position and band-width are af- a e-mail: [email protected] b Present address: Spinlab1 srl, Via Bellavitis 19, Bassano del Grappa, Vicenza, Italy. c Present address: INFM Sensor Laboratory, Via Valotti 9, 25133 Brescia, Italy. fected by the size, size distribution and shape of the nanoparticles. Furthermore, since the SPR peak features are strongly correlated to the physico-chemical nature of the host medium [4,5], the possibility to exploit the opti- cal properties of this kind of nanocomposites in the optical sensing field has received increasing attention [6,7]. Metal- polymer nanocomposites have been usually prepared by mixing metal particles with polymer solutions [8], by vac- uum co-deposition procedures [9,10], by metal precursor doping and decomposition [11–14], and by ion implanta- tion [15,16]. Recent papers investigated the synthesis of metal clusters into commercially available polyimides ob- tained by ion-exchange technique followed by annealing in reducing atmosphere [17–20]. This method relies on a sur- face treatment of the bare polyimide films in KOH to pro- duce a surface-modified polyimide layer (potassium polya- mate) with ion-exchange capability. Thereafter, metal ions are introduced through ion-exchange with the bound potassium ions. By a subsequent annealing in reducing

Welcome message from author
This document is posted to help you gain knowledge. Please leave a comment to let me know what you think about it! Share it to your friends and learn new things together.
Transcript

Eur. Phys. J. D 42, 243–251 (2007)DOI: 10.1140/epjd/e2007-00017-9 THE EUROPEAN
PHYSICAL JOURNAL D
Formation of silver nanoclusters in transparent polyimidesby Ag-K ion-exchange process
S. Carturan1,a, A. Quaranta2, M. Bonafini3,b, A. Vomiero3,c, G. Maggioni1, G. Mattei4, C. de Julian Fernandez4,M. Bersani4, P. Mazzoldi4, and G. Della Mea2
1 University of Padova, c/o Istituto Nazionale di Fisica Nucleare, Laboratori Nazionali di Legnaro, Viale dell’Universita 2,35020 Legnaro, Padova, Italy
2 Department of Materials Engineering and Industrial Technologies, University of Trento, Trento, Italy3 Istituto Nazionale di Fisica Nucleare, Laboratori Nazionali di Legnaro, Viale dell’Universita 2, 35020 Legnaro, Padova, Italy4 Department of Physics, University of Padova, Via Marzolo 8, 35131 Padova, Italy
Received 5 October 2006 / Received in final form 13 December 2006Published online 31 January 2007 – c© EDP Sciences, Societa Italiana di Fisica, Springer-Verlag 2007
Abstract. Silver nanoclusters embedded in two transparent fluorinated polyimides, 4,4’-hexafluoroisopropylidene diphthalic anhydride — 2,3,5,6-tetramethyl paraphenylene diamine (6FDA-DAD)and 3,3’,4,4’ — biphenyltetracarboxylic acid dianhydride — 1,1-bis(4-aminophenyl)-1-phenyl-2,2,2-trifluoroethane (BPDA-3F), have been produced by surface modification with KOH aqueous solutionfollowed by K-assisted Ag doping and thermal reduction in hydrogen atmosphere. The reaction rateof the nucleophilic hydrolysis in KOH, studied by Fourier transform infrared spectroscopy (FT-IR)and Rutherford backscattering spectrometry (RBS), depends on the polyimide chemical structure.After ion-exchange in AgNO3 solution and subsequent annealing, the polyimide structure recovery wasmonitored by FT-IR whereas the characteristic surface plasmon absorption band of silver nanoparticleswas evidenced by optical absorption measurements. The structure of silver nanoclusters as related to sizeand size distribution in the different polyimide matrices was thoroughly investigated by Transmissionelectron microscopy (TEM) and X-ray diffraction (XRD). The collected data evidenced a uniformdistribution of Ag clusters of nanometric size after thermal treatment at 300 ◦C in both polyimides. Forthe same ion-exchange treatment parameters and annealing temperature, XRD analyses evidenced thepresence of crystallites with similar sizes.
PACS. 71.20.Rv Polymers and organic compounds – 82.30.Nr Association, addition, insertion, clusterformation – 36.40.Vz Optical properties of clusters
1 Introduction
Nowadays a number of investigations are focused on theproduction of nanocomposite materials made up of metalnanoclusters embedded in organic matrices, owing to theirunusual optical, electronic, magnetic and chemical prop-erties [1,2]. In fact, the incorporation of metal particlesin polymeric hosts allows their stabilization and preventsagglomeration, thus facilitating the fabrication into use-ful catalytic, optical and electronic devices. The opti-cal properties of noble metal nanoparticles (Cu, Au, Ag)are related to a typical absorption peak in the UV-VISrange [3], known as surface plasmon resonance (SPR)peak, whose intensity, position and band-width are af-
a e-mail: [email protected] Present address: Spinlab1 srl, Via Bellavitis 19, Bassano
del Grappa, Vicenza, Italy.c Present address: INFM Sensor Laboratory, Via Valotti 9,
25133 Brescia, Italy.
fected by the size, size distribution and shape of thenanoparticles. Furthermore, since the SPR peak featuresare strongly correlated to the physico-chemical nature ofthe host medium [4,5], the possibility to exploit the opti-cal properties of this kind of nanocomposites in the opticalsensing field has received increasing attention [6,7]. Metal-polymer nanocomposites have been usually prepared bymixing metal particles with polymer solutions [8], by vac-uum co-deposition procedures [9,10], by metal precursordoping and decomposition [11–14], and by ion implanta-tion [15,16]. Recent papers investigated the synthesis ofmetal clusters into commercially available polyimides ob-tained by ion-exchange technique followed by annealing inreducing atmosphere [17–20]. This method relies on a sur-face treatment of the bare polyimide films in KOH to pro-duce a surface-modified polyimide layer (potassium polya-mate) with ion-exchange capability. Thereafter, metalions are introduced through ion-exchange with the boundpotassium ions. By a subsequent annealing in reducing
244 The European Physical Journal D
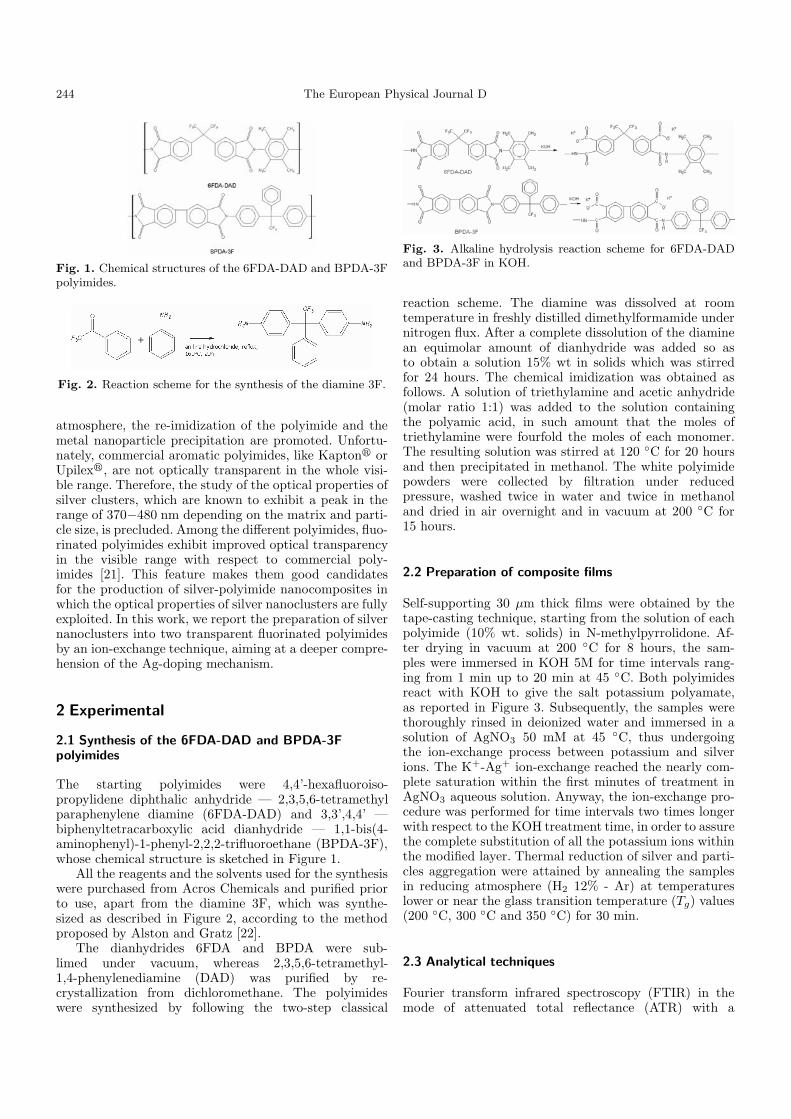
Fig. 1. Chemical structures of the 6FDA-DAD and BPDA-3Fpolyimides.
Fig. 2. Reaction scheme for the synthesis of the diamine 3F.
atmosphere, the re-imidization of the polyimide and themetal nanoparticle precipitation are promoted. Unfortu-nately, commercial aromatic polyimides, like Kapton� orUpilex�, are not optically transparent in the whole visi-ble range. Therefore, the study of the optical properties ofsilver clusters, which are known to exhibit a peak in therange of 370−480 nm depending on the matrix and parti-cle size, is precluded. Among the different polyimides, fluo-rinated polyimides exhibit improved optical transparencyin the visible range with respect to commercial poly-imides [21]. This feature makes them good candidatesfor the production of silver-polyimide nanocomposites inwhich the optical properties of silver nanoclusters are fullyexploited. In this work, we report the preparation of silvernanoclusters into two transparent fluorinated polyimidesby an ion-exchange technique, aiming at a deeper compre-hension of the Ag-doping mechanism.
2 Experimental
2.1 Synthesis of the 6FDA-DAD and BPDA-3Fpolyimides
The starting polyimides were 4,4’-hexafluoroiso-propylidene diphthalic anhydride — 2,3,5,6-tetramethylparaphenylene diamine (6FDA-DAD) and 3,3’,4,4’ —biphenyltetracarboxylic acid dianhydride — 1,1-bis(4-aminophenyl)-1-phenyl-2,2,2-trifluoroethane (BPDA-3F),whose chemical structure is sketched in Figure 1.
All the reagents and the solvents used for the synthesiswere purchased from Acros Chemicals and purified priorto use, apart from the diamine 3F, which was synthe-sized as described in Figure 2, according to the methodproposed by Alston and Gratz [22].
The dianhydrides 6FDA and BPDA were sub-limed under vacuum, whereas 2,3,5,6-tetramethyl-1,4-phenylenediamine (DAD) was purified by re-crystallization from dichloromethane. The polyimideswere synthesized by following the two-step classical
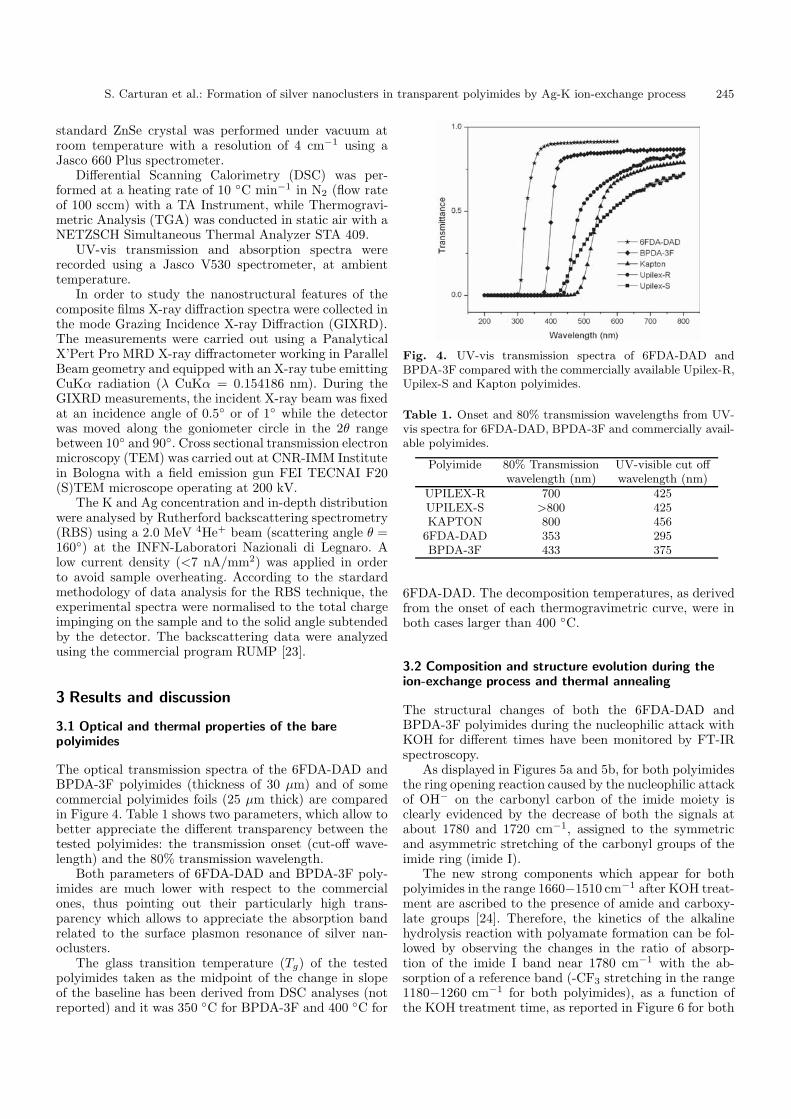
Fig. 3. Alkaline hydrolysis reaction scheme for 6FDA-DADand BPDA-3F in KOH.
reaction scheme. The diamine was dissolved at roomtemperature in freshly distilled dimethylformamide undernitrogen flux. After a complete dissolution of the diaminean equimolar amount of dianhydride was added so asto obtain a solution 15% wt in solids which was stirredfor 24 hours. The chemical imidization was obtained asfollows. A solution of triethylamine and acetic anhydride(molar ratio 1:1) was added to the solution containingthe polyamic acid, in such amount that the moles oftriethylamine were fourfold the moles of each monomer.The resulting solution was stirred at 120 ◦C for 20 hoursand then precipitated in methanol. The white polyimidepowders were collected by filtration under reducedpressure, washed twice in water and twice in methanoland dried in air overnight and in vacuum at 200 ◦C for15 hours.
2.2 Preparation of composite films
Self-supporting 30 µm thick films were obtained by thetape-casting technique, starting from the solution of eachpolyimide (10% wt. solids) in N-methylpyrrolidone. Af-ter drying in vacuum at 200 ◦C for 8 hours, the sam-ples were immersed in KOH 5M for time intervals rang-ing from 1 min up to 20 min at 45 ◦C. Both polyimidesreact with KOH to give the salt potassium polyamate,as reported in Figure 3. Subsequently, the samples werethoroughly rinsed in deionized water and immersed in asolution of AgNO3 50 mM at 45 ◦C, thus undergoingthe ion-exchange process between potassium and silverions. The K+-Ag+ ion-exchange reached the nearly com-plete saturation within the first minutes of treatment inAgNO3 aqueous solution. Anyway, the ion-exchange pro-cedure was performed for time intervals two times longerwith respect to the KOH treatment time, in order to assurethe complete substitution of all the potassium ions withinthe modified layer. Thermal reduction of silver and parti-cles aggregation were attained by annealing the samplesin reducing atmosphere (H2 12% - Ar) at temperatureslower or near the glass transition temperature (Tg) values(200 ◦C, 300 ◦C and 350 ◦C) for 30 min.
2.3 Analytical techniques
Fourier transform infrared spectroscopy (FTIR) in themode of attenuated total reflectance (ATR) with a
S. Carturan et al.: Formation of silver nanoclusters in transparent polyimides by Ag-K ion-exchange process 245
standard ZnSe crystal was performed under vacuum atroom temperature with a resolution of 4 cm−1 using aJasco 660 Plus spectrometer.
Differential Scanning Calorimetry (DSC) was per-formed at a heating rate of 10 ◦C min−1 in N2 (flow rateof 100 sccm) with a TA Instrument, while Thermogravi-metric Analysis (TGA) was conducted in static air with aNETZSCH Simultaneous Thermal Analyzer STA 409.
UV-vis transmission and absorption spectra wererecorded using a Jasco V530 spectrometer, at ambienttemperature.
In order to study the nanostructural features of thecomposite films X-ray diffraction spectra were collected inthe mode Grazing Incidence X-ray Diffraction (GIXRD).The measurements were carried out using a PanalyticalX’Pert Pro MRD X-ray diffractometer working in ParallelBeam geometry and equipped with an X-ray tube emittingCuKα radiation (λ CuKα = 0.154186 nm). During theGIXRD measurements, the incident X-ray beam was fixedat an incidence angle of 0.5◦ or of 1◦ while the detectorwas moved along the goniometer circle in the 2θ rangebetween 10◦ and 90◦. Cross sectional transmission electronmicroscopy (TEM) was carried out at CNR-IMM Institutein Bologna with a field emission gun FEI TECNAI F20(S)TEM microscope operating at 200 kV.
The K and Ag concentration and in-depth distributionwere analysed by Rutherford backscattering spectrometry(RBS) using a 2.0 MeV 4He+ beam (scattering angle θ =160◦) at the INFN-Laboratori Nazionali di Legnaro. Alow current density (<7 nA/mm2) was applied in orderto avoid sample overheating. According to the stardardmethodology of data analysis for the RBS technique, theexperimental spectra were normalised to the total chargeimpinging on the sample and to the solid angle subtendedby the detector. The backscattering data were analyzedusing the commercial program RUMP [23].
3 Results and discussion
3.1 Optical and thermal properties of the barepolyimides
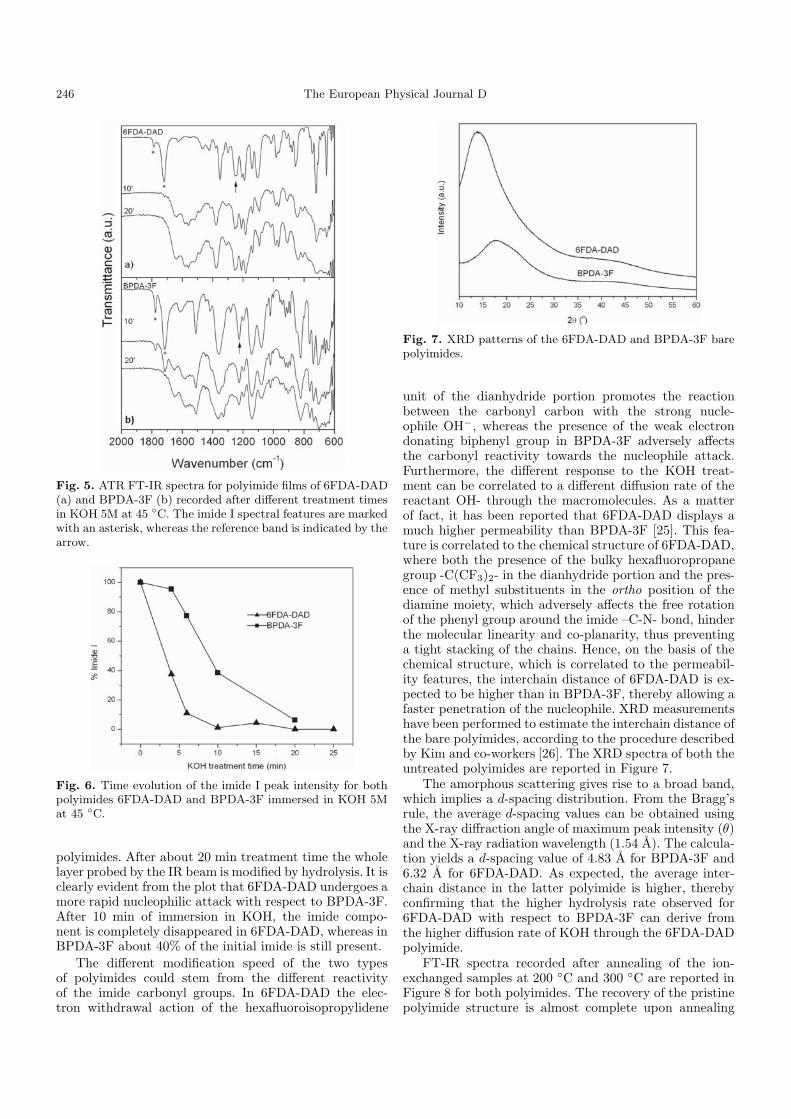
The optical transmission spectra of the 6FDA-DAD andBPDA-3F polyimides (thickness of 30 µm) and of somecommercial polyimides foils (25 µm thick) are comparedin Figure 4. Table 1 shows two parameters, which allow tobetter appreciate the different transparency between thetested polyimides: the transmission onset (cut-off wave-length) and the 80% transmission wavelength.
Both parameters of 6FDA-DAD and BPDA-3F poly-imides are much lower with respect to the commercialones, thus pointing out their particularly high trans-parency which allows to appreciate the absorption bandrelated to the surface plasmon resonance of silver nan-oclusters.
The glass transition temperature (Tg) of the testedpolyimides taken as the midpoint of the change in slopeof the baseline has been derived from DSC analyses (notreported) and it was 350 ◦C for BPDA-3F and 400 ◦C for
Fig. 4. UV-vis transmission spectra of 6FDA-DAD andBPDA-3F compared with the commercially available Upilex-R,Upilex-S and Kapton polyimides.
Table 1. Onset and 80% transmission wavelengths from UV-vis spectra for 6FDA-DAD, BPDA-3F and commercially avail-able polyimides.
Polyimide 80% Transmission UV-visible cut offwavelength (nm) wavelength (nm)
UPILEX-R 700 425UPILEX-S >800 425KAPTON 800 456
6FDA-DAD 353 295BPDA-3F 433 375
6FDA-DAD. The decomposition temperatures, as derivedfrom the onset of each thermogravimetric curve, were inboth cases larger than 400 ◦C.
3.2 Composition and structure evolution during theion-exchange process and thermal annealing
The structural changes of both the 6FDA-DAD andBPDA-3F polyimides during the nucleophilic attack withKOH for different times have been monitored by FT-IRspectroscopy.
As displayed in Figures 5a and 5b, for both polyimidesthe ring opening reaction caused by the nucleophilic attackof OH− on the carbonyl carbon of the imide moiety isclearly evidenced by the decrease of both the signals atabout 1780 and 1720 cm−1, assigned to the symmetricand asymmetric stretching of the carbonyl groups of theimide ring (imide I).
The new strong components which appear for bothpolyimides in the range 1660−1510 cm−1 after KOH treat-ment are ascribed to the presence of amide and carboxy-late groups [24]. Therefore, the kinetics of the alkalinehydrolysis reaction with polyamate formation can be fol-lowed by observing the changes in the ratio of absorp-tion of the imide I band near 1780 cm−1 with the ab-sorption of a reference band (-CF3 stretching in the range1180−1260 cm−1 for both polyimides), as a function ofthe KOH treatment time, as reported in Figure 6 for both
246 The European Physical Journal D
Fig. 5. ATR FT-IR spectra for polyimide films of 6FDA-DAD(a) and BPDA-3F (b) recorded after different treatment timesin KOH 5M at 45 ◦C. The imide I spectral features are markedwith an asterisk, whereas the reference band is indicated by thearrow.
Fig. 6. Time evolution of the imide I peak intensity for bothpolyimides 6FDA-DAD and BPDA-3F immersed in KOH 5Mat 45 ◦C.
polyimides. After about 20 min treatment time the wholelayer probed by the IR beam is modified by hydrolysis. It isclearly evident from the plot that 6FDA-DAD undergoes amore rapid nucleophilic attack with respect to BPDA-3F.After 10 min of immersion in KOH, the imide compo-nent is completely disappeared in 6FDA-DAD, whereas inBPDA-3F about 40% of the initial imide is still present.
The different modification speed of the two typesof polyimides could stem from the different reactivityof the imide carbonyl groups. In 6FDA-DAD the elec-tron withdrawal action of the hexafluoroisopropylidene
Fig. 7. XRD patterns of the 6FDA-DAD and BPDA-3F barepolyimides.
unit of the dianhydride portion promotes the reactionbetween the carbonyl carbon with the strong nucle-ophile OH−, whereas the presence of the weak electrondonating biphenyl group in BPDA-3F adversely affectsthe carbonyl reactivity towards the nucleophile attack.Furthermore, the different response to the KOH treat-ment can be correlated to a different diffusion rate of thereactant OH- through the macromolecules. As a matterof fact, it has been reported that 6FDA-DAD displays amuch higher permeability than BPDA-3F [25]. This fea-ture is correlated to the chemical structure of 6FDA-DAD,where both the presence of the bulky hexafluoropropanegroup -C(CF3)2- in the dianhydride portion and the pres-ence of methyl substituents in the ortho position of thediamine moiety, which adversely affects the free rotationof the phenyl group around the imide –C-N- bond, hinderthe molecular linearity and co-planarity, thus preventinga tight stacking of the chains. Hence, on the basis of thechemical structure, which is correlated to the permeabil-ity features, the interchain distance of 6FDA-DAD is ex-pected to be higher than in BPDA-3F, thereby allowing afaster penetration of the nucleophile. XRD measurementshave been performed to estimate the interchain distance ofthe bare polyimides, according to the procedure describedby Kim and co-workers [26]. The XRD spectra of both theuntreated polyimides are reported in Figure 7.
The amorphous scattering gives rise to a broad band,which implies a d-spacing distribution. From the Bragg’srule, the average d-spacing values can be obtained usingthe X-ray diffraction angle of maximum peak intensity (θ)and the X-ray radiation wavelength (1.54 A). The calcula-tion yields a d-spacing value of 4.83 A for BPDA-3F and6.32 A for 6FDA-DAD. As expected, the average inter-chain distance in the latter polyimide is higher, therebyconfirming that the higher hydrolysis rate observed for6FDA-DAD with respect to BPDA-3F can derive fromthe higher diffusion rate of KOH through the 6FDA-DADpolyimide.
FT-IR spectra recorded after annealing of the ion-exchanged samples at 200 ◦C and 300 ◦C are reported inFigure 8 for both polyimides. The recovery of the pristinepolyimide structure is almost complete upon annealing
S. Carturan et al.: Formation of silver nanoclusters in transparent polyimides by Ag-K ion-exchange process 247
Fig. 8. ATR FT-IR spectra of 6FDA-DAD (a) and BPDA-3F (b) recorded after treatment in KOH for 20 min followedby ion-exchange in AgNO3 solution and annealed at 200 and300 ◦C. The imide I spectral features are marked with an as-terisk.
at 300 ◦C for both polyimides, as evidenced by the reap-pearance of the typical imide I spectral features at 1780and 1720 cm−1.
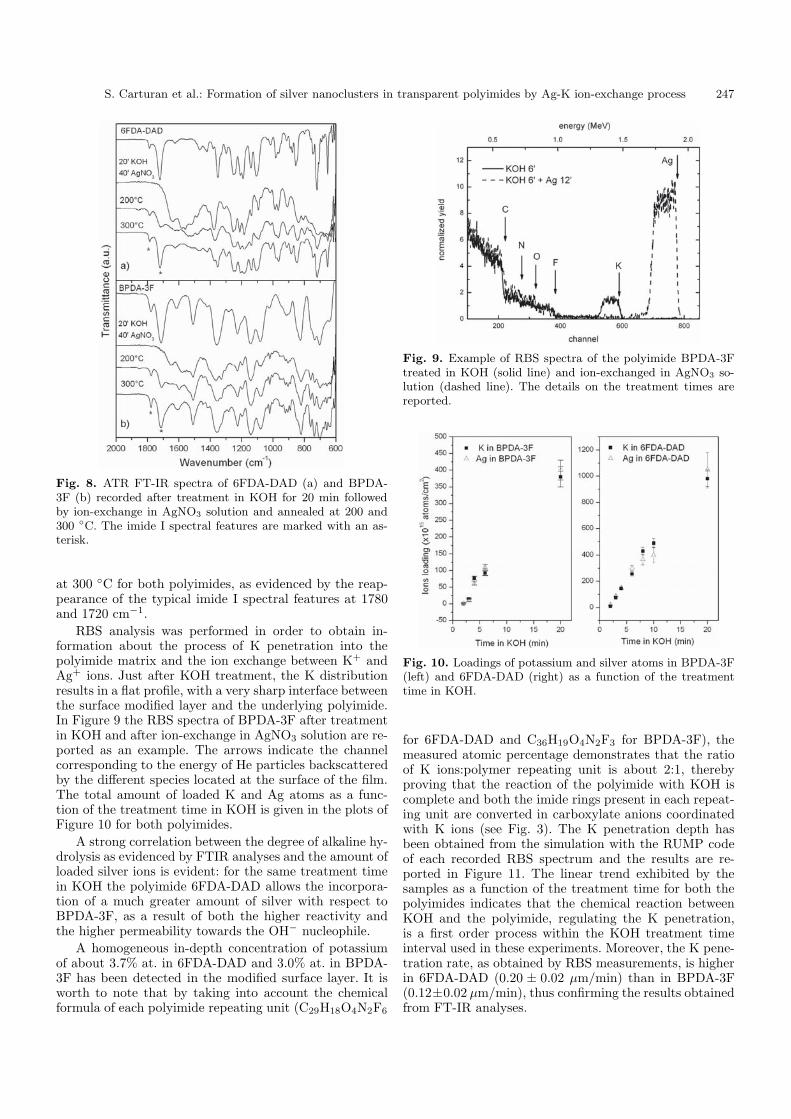
RBS analysis was performed in order to obtain in-formation about the process of K penetration into thepolyimide matrix and the ion exchange between K+ andAg+ ions. Just after KOH treatment, the K distributionresults in a flat profile, with a very sharp interface betweenthe surface modified layer and the underlying polyimide.In Figure 9 the RBS spectra of BPDA-3F after treatmentin KOH and after ion-exchange in AgNO3 solution are re-ported as an example. The arrows indicate the channelcorresponding to the energy of He particles backscatteredby the different species located at the surface of the film.The total amount of loaded K and Ag atoms as a func-tion of the treatment time in KOH is given in the plots ofFigure 10 for both polyimides.
A strong correlation between the degree of alkaline hy-drolysis as evidenced by FTIR analyses and the amount ofloaded silver ions is evident: for the same treatment timein KOH the polyimide 6FDA-DAD allows the incorpora-tion of a much greater amount of silver with respect toBPDA-3F, as a result of both the higher reactivity andthe higher permeability towards the OH− nucleophile.
A homogeneous in-depth concentration of potassiumof about 3.7% at. in 6FDA-DAD and 3.0% at. in BPDA-3F has been detected in the modified surface layer. It isworth to note that by taking into account the chemicalformula of each polyimide repeating unit (C29H18O4N2F6
Fig. 9. Example of RBS spectra of the polyimide BPDA-3Ftreated in KOH (solid line) and ion-exchanged in AgNO3 so-lution (dashed line). The details on the treatment times arereported.
Fig. 10. Loadings of potassium and silver atoms in BPDA-3F(left) and 6FDA-DAD (right) as a function of the treatmenttime in KOH.
for 6FDA-DAD and C36H19O4N2F3 for BPDA-3F), themeasured atomic percentage demonstrates that the ratioof K ions:polymer repeating unit is about 2:1, therebyproving that the reaction of the polyimide with KOH iscomplete and both the imide rings present in each repeat-ing unit are converted in carboxylate anions coordinatedwith K ions (see Fig. 3). The K penetration depth hasbeen obtained from the simulation with the RUMP codeof each recorded RBS spectrum and the results are re-ported in Figure 11. The linear trend exhibited by thesamples as a function of the treatment time for both thepolyimides indicates that the chemical reaction betweenKOH and the polyimide, regulating the K penetration,is a first order process within the KOH treatment timeinterval used in these experiments. Moreover, the K pene-tration rate, as obtained by RBS measurements, is higherin 6FDA-DAD (0.20 ± 0.02 µm/min) than in BPDA-3F(0.12±0.02 µm/min), thus confirming the results obtainedfrom FT-IR analyses.

248 The European Physical Journal D
Fig. 11. Penetration depth for K vs. time treatment in KOH.For 6FDA-DAD the penetration depth of Ag is also reported,in order to highlight the complete exchange between K+ andAg+ ions. The linear fits allow to estimate the speed of theK penetration process.
As far as the process of Ag doping is concerned, RBSanalysis detected a complete emptying of K, as a result ofthe treatment in AgNO3 solution and a 1:1 substitution ofK+ by Ag+ within the experimental errors in all the sam-ples, as can be observed from the data of Figure 10. Asa matter of fact, Ag exhibits a flat concentration profile(3.7% at. in 6FDA-DAD and 3.0% at. in BPDA-3F) andits penetration depth is determined by the thickness of theKOH modified layer, as demonstrated by the data relativeto 6FDA-DAD reported in Figure 11. On the other hand,no silver was detected in polyimide thin films which didnot undergo any pre-treatment in KOH before the immer-sion in AgNO3 aqueous solution, thus indicating that thestep of potassium polyamate salt formation is needed toachieve the Ag doping of the polyimide.
The concentration profile of Ag was also measuredin the samples after thermal treatments at 200, 300 and350 ◦C in reducing atmosphere. The influence of the an-nealing temperature on the Ag in-depth distribution isnegligible, thus indicating that silver reduction and clus-ters formation and growth occur uniformly within thedepth without significant migration phenomena. TEManalyses performed on the sample 6FDA-DAD treated for10 min in KOH, 20 min in AgNO3 and annealed at 300 ◦Cin reducing atmosphere confirmed the experimental RBSresults as regarding the penetration depth of Ag (esti-mated in 1.6 µm for this sample), as clearly observed inthe micrograph reported in Figure 12, and the homogene-ity of the silver clusters distribution, as evidenced in themicrographs of Figure 16.
3.3 Silver clusters characterization
Absorption spectra from samples treated for 4 minutes inKOH and for 8 minutes in AgNO3 solution are reportedin Figures 13a and 13b for annealing temperatures of 200,300 and 350 ◦C. 6FDA-DAD treated at 200 ◦C exhibits afaint shoulder at about 420 nm, which grows up at 300 ◦C
Fig. 12. Cross sectional TEM image of 6FDA-DAD treated for10 min in KOH, for 20 min in AgNO3 solution and annealed at300 ◦C in reducing atmosphere, showing the thickness of themodified layer. The arrow indicates a crack in the modifiedlayer.
Fig. 13. Absorption spectra of 6FDA-DAD (a) and BPDA-3F(b) treated for 4 min in KOH, for 8 min in AgNO3 solutionand annealed at 200, 300 and 350 ◦C in reducing atmosphere.The spectra of BPDA-3F treated for 6 min in KOH, 12 min inAgNO3 are also reported in (c).
and becomes a well defined peak at 440 nm after annealingat 350 ◦C. On the other hand, the absorption spectrum at200 ◦C of BPDA-3F does not exhibit any SPR feature, andat 300 ◦C a faint and broad band appears at about 440 nm,whose intensity slightly increases at 350 ◦C. The concen-tration of silver atoms in the samples is about the same, asrevealed by RBS measurements. However, the comparisonbetween the spectra of the two polyimides is not mean-ingful in this case, since the absorption peak intensity iscorrelated to the total amount of silver clusters present inthe whole layer. Moreover, the cut-off wavelength of thepolyimides, as reported in Table 1, must be taken into ac-count. In the range 420−440 nm the transmission percent-age varies from 75 to 82% in the case of BPDA-3F, whereasthe transmittance of 6FDA-DAD polyimide is about con-stant at 90%.
S. Carturan et al.: Formation of silver nanoclusters in transparent polyimides by Ag-K ion-exchange process 249
On the basis of the total silver ions loading reported inFigure 10, a more significant comparison should be derivedfrom the spectra of 6FDA-DAD treated for 4 min in KOH,8 min in AgNO3 and those of BPDA-3F treated for 6 minin KOH, 12 min in AgNO3. The latter ones are reported inFigure 13c. After the treatment at 200 ◦C the BPDA-3Fsample displays only a faint increase in the absorptionbaseline, but the SPR peak features are still absent. Afterthe treatment at 300 ◦C, the same sample shows a veryintense SPR peak at about 433 nm. The SPR absorptionintensity is almost the same for the samples treated at350 ◦C. Many factors contribute to the process of forma-tion and growth of the silver clusters, so that in order toanalyze the optical absorption spectra it is important tosummarize the different steps which are involved duringthe thermal treatment in reducing atmosphere.
Ikeda and co-workers [19] have already pictured there-imidization process in the case of Cu(II) ion dopingin PMDA-ODA polyimide. Metal reduction is attainedby accepting electrons from molecular hydrogen, then thecarboxylate anions are immediately protonated and con-verted in polyamic acid groups. The temperature is highenough (200 ◦C) to allow the de-hydration and condensa-tion reaction of carboxylic groups to form imide rings.However, the stability of the metal-polyamate complexcan play an important role on the overall reduction/re-imidization process rate.
One of the most stable forms of the silver (I) com-plexes is the linear one, thus it can be predicted that inthe present case the carboxylate ligand has the unidentateform and it behaves as one-electron donor. In this config-uration, the stability of the silver (I) complex depends onthe electron-donating ability of the carboxylate oxygenatom. In the 6FDA-DAD derived polyamate, the electronwithdrawing hexafluoro isopropylidene moiety is expectedto lower the carboxylate donating capability, thereby pro-ducing a less stable silver (I) complex than in the case ofBPDA-3F polyamate.
On the basis of these considerations, a correlation be-tween the SPR peak intensity and the silver (I) reductionprocess in the different polyimides annealed at 200 ◦C canbe found.
At 200 ◦C the reduction of silver ions is not effec-tive in the BPDA-3F sample as in 6FDA-DAD, owing tothe higher silver (I) complex stability in the former sys-tem. Hence, the SPR peak features are not visible in theBPDA-3F sample.
At 300 ◦C the re-imidization of both polyimides andthe consequent reduction to metallic silver is complete.The SPR peak intensity increases accordingly in both sam-ples. The aforementioned lower transparency in the wave-length range of interest of the bare BPDA-3F polyimideaccounts for the higher absorption edge observed in thespectra of the BPDA-3F derived samples. Although nan-oclusters average diameter can be derived using the fullwidth half maximum (FWHM) of the SPR peak, accord-ing to the literature [27], the contribution of the back-ground arising from the polyimide matrix can not be eas-ily removed without introducing some artefacts, such as
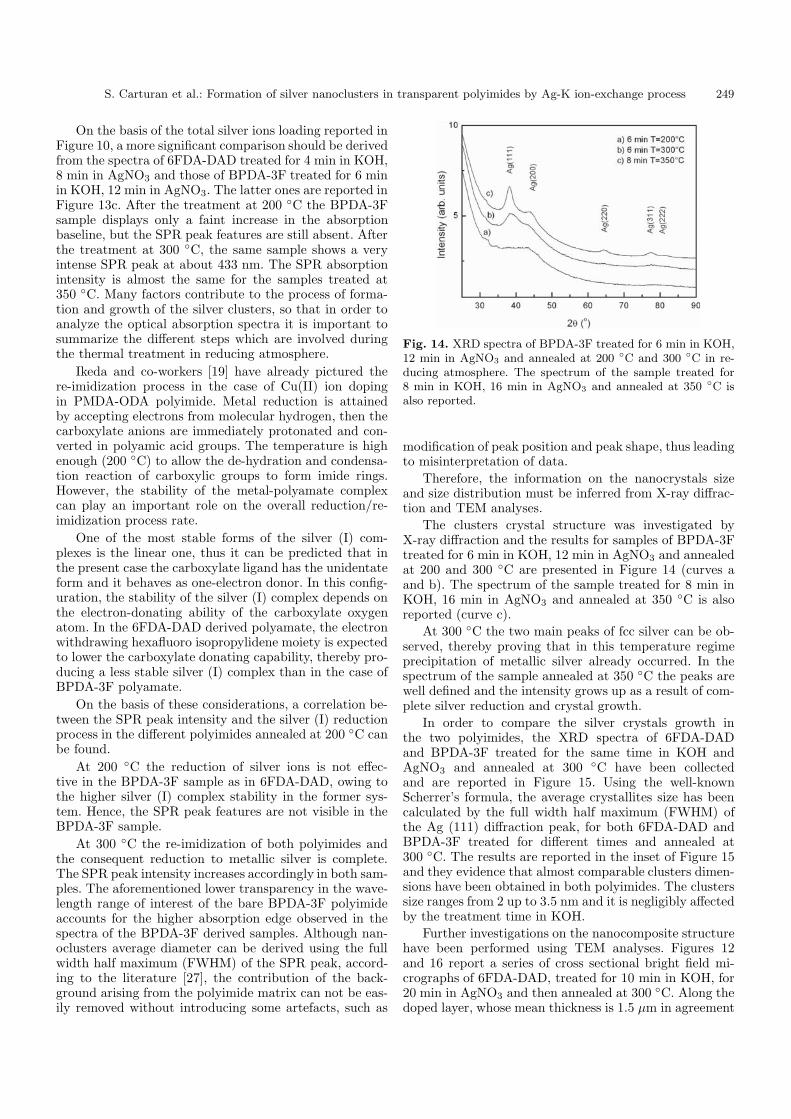
Fig. 14. XRD spectra of BPDA-3F treated for 6 min in KOH,12 min in AgNO3 and annealed at 200 ◦C and 300 ◦C in re-ducing atmosphere. The spectrum of the sample treated for8 min in KOH, 16 min in AgNO3 and annealed at 350 ◦C isalso reported.
modification of peak position and peak shape, thus leadingto misinterpretation of data.
Therefore, the information on the nanocrystals sizeand size distribution must be inferred from X-ray diffrac-tion and TEM analyses.
The clusters crystal structure was investigated byX-ray diffraction and the results for samples of BPDA-3Ftreated for 6 min in KOH, 12 min in AgNO3 and annealedat 200 and 300 ◦C are presented in Figure 14 (curves aand b). The spectrum of the sample treated for 8 min inKOH, 16 min in AgNO3 and annealed at 350 ◦C is alsoreported (curve c).
At 300 ◦C the two main peaks of fcc silver can be ob-served, thereby proving that in this temperature regimeprecipitation of metallic silver already occurred. In thespectrum of the sample annealed at 350 ◦C the peaks arewell defined and the intensity grows up as a result of com-plete silver reduction and crystal growth.
In order to compare the silver crystals growth inthe two polyimides, the XRD spectra of 6FDA-DADand BPDA-3F treated for the same time in KOH andAgNO3 and annealed at 300 ◦C have been collectedand are reported in Figure 15. Using the well-knownScherrer’s formula, the average crystallites size has beencalculated by the full width half maximum (FWHM) ofthe Ag (111) diffraction peak, for both 6FDA-DAD andBPDA-3F treated for different times and annealed at300 ◦C. The results are reported in the inset of Figure 15and they evidence that almost comparable clusters dimen-sions have been obtained in both polyimides. The clusterssize ranges from 2 up to 3.5 nm and it is negligibly affectedby the treatment time in KOH.
Further investigations on the nanocomposite structurehave been performed using TEM analyses. Figures 12and 16 report a series of cross sectional bright field mi-crographs of 6FDA-DAD, treated for 10 min in KOH, for20 min in AgNO3 and then annealed at 300 ◦C. Along thedoped layer, whose mean thickness is 1.5 µm in agreement

250 The European Physical Journal D
Fig. 15. XRD spectra of 6FDA-DAD and BPDA-3F treatedfor 20 min in KOH, 40 min in AgNO3 and annealed at 300 ◦Cin reducing atmosphere. In the inset, the average grain size ofsilver crystals as derived from the Scherrer’s formula is reportedfor both modified polyimides annealed at 300 ◦C as a functionof the treatment time in KOH.
Fig. 16. Cross sectional TEM images at different magnifica-tions of 6FDA-DAD treated for 10 min in KOH, for 20 minin AgNO3 solution and annealed at 300 ◦C in reducing atmo-sphere. In the inset of the upper image, the size histogram isreported.
with RBS data, a uniform distribution of spherical silverclusters can be observed. The mean size was evaluated tobe 〈D〉 = 3.3 nm with standard deviation σ = 1.2 nm, asshown by the histogram of Figure 16.
4 Conclusions
The formation of silver nanoparticles in transparent fluori-nated polyimides, as a consequence of K-assisted Ag dop-ing and thermal reduction in hydrogen atmosphere, hasbeen studied using different microanalytical, microstruc-tural and optical techniques. The first stage of the pro-cess, leading to the formation of the potassium polya-mate salt, and the following K+-Ag+ ion-exchange processhave been correlated to the starting polyimide chemicalstructure. RBS analysis evidenced that the K penetrationdepth is a linear function of the treatment time in KOH,thereby proving that the chemical reaction between thenucleophile and the polyimide is in both cases a first or-der process. Moreover, the K penetration rate depends onthe polyimide structure: both the chemical nature of thesubstituents along the polymeric chain and the networkpermeability to aqueous solution are considered to affectthe K penetration rate. XRD measurements have beenused to estimate the intersegmental distance (d-spacing)in both the original polyimides and the results evidenceda loosened chain packing in 6FDA-DAD with respect toBPDA-3F, thus proving that a faster permeation of theKOH solution through the 6FDA-DAD matrix can effec-tively occur.
The ion-exchange step in AgNO3 solutions affordscomplete substitution of K by Ag ions in both polyimides,within the treatment times used in these experiments. TheAg nanocrystals precipitation in reducing atmosphere hasbeen correlated to the silver reduction process, which inturns is related to the silver (I) polyamate complex stabil-ity in the two different polyimides. The subsequent step ofclusters growth as a function of the annealing temperaturehas been investigated by XRD and TEM analyses. Similarclusters dimensions have been estimated in the differentpolyimides, ranging from 2 to 3.5 nm. The effective ap-plication of such nanocomposites for optical gas sensors iscurrently under investigation.
This research was financially supported by the Fifth Com-mission of Istituto Nazionale di Fisica Nucleare (ASTHICOproject) and by Micropolys FIRB 2003 project.
References
1. F. Gonella, P. Mazzoldi, in Handbook of NanostructuredMaterials and Nanotechnology, edited by H. Nalwa(Academic, San Diego, 2000), Vol. 4, Chap. 2
2. A.N. Shipway, Chem. Phys. Chem. 1, 18 (2000)3. U. Kreibig, M. Vollmer, Optical Properties of Metal
Clusters (Springer, Berlin, 1995)4. P. Mulvaney, Langmuir 12, 788 (1996)5. G. Chumanov, K. Sokolov, B.W. Gregory, T.M. Cotton, J.
Phys. Chem. 99, 9466 (1995)
S. Carturan et al.: Formation of silver nanoclusters in transparent polyimides by Ag-K ion-exchange process 251
6. J. Matsui, K. Akamatsu, S. Nishiguchi, D. Miyoshi, H.Nawafune, K. Tamaki, N. Sugimoto, Anal. Chem. 76, 1310(2004)
7. C. de Julian Fernandez, M.G. Manera, J. Spadavecchia,G. Maggioni, A. Quaranta, G. Mattei, M. Bazzan, E.Cattaruzza, M. Bonafini, E. Negro, A. Vomiero, S.Carturan, C. Scian, G. Della Mea, R. Rella, L. Vasanelli,P. Mazzoldi, Sens. Actuators B 111-112, 225 (2005)
8. Y. Dirix, C. Bastiaansen, W. Caseri, P. Smith, J. Mater.Sci. 34, 3859 (1999)
9. H. Biederman, Vacuum 37, 367 (1987)10. K. Akamatsu, T. Kawamura, H. Nabika, S. Deki, T.
Strunskus, F. Faupel, J. Mater. Chem. 12, 3610 (2002)11. R.J. Angelo, U.S. Patent 3,073,785 (1959)12. M.W. Wllison, L.T. Taylor, Chem. Mater. 6, 990 (1994)13. R.E. Southward, D.W. Thompson, Chem. Mater. 16, 1277
(2004)14. S. Yoda, A. Hasegawa, H. Suda, Y. Uchimaru, K. Haraya,
T. Tsuji, K. Otake, Chem. Mater. 16, 2363 (2004)15. A.L. Stepanov, Tech. Phys. 49, 143 (2004)16. G. Maggioni, A. Vomiero, S. Carturan, C. Scian, G.
Mattei, M. Bazzan, C. de Julian Fernandez, P. Mazzoldi,
A. Quaranta, G. Della Mea, Appl. Phys. Lett. 85, 5712(2004)
17. K. Akamatsu, S. Ikeda, H. Nawafune, S. Deki, Chem.Mater. 15, 2488 (2003)
18. K. Akamatsu, Eur. Phys. J. D 24, 377 (2003)19. S. Ikeda, K. Akamatsu, H. Nawafune, T. Nishino, S. Deki,
J. Phys. Chem. B 108, 15599 (2004)20. Y. Li, Q. Lu, X. Qian, Z. Zhu, J. Yin, Appl. Surf. Sci. 233,
299 (2004)21. S. Sasaki, S. Nishi, in Polyimides: fundamentals and ap-
plications, edited by Ghosh, Mittal (Marcel Dekker Inc.,New York, 1996), p. 71
22. W.B. Alston, R.F. Gratz, US Patent 4,885,116 (1989)23. L.R. Doolittle, Nucl. Instrum. Meth. B 9, 334 (1985)24. R.M. Silverstein, G.C. Bassler, T.C. Morrill, in
Spectrometric Indentification of Organic Compounds(J. Wiley & Sons, New York, 1981), p. 116
25. A.Y. Alentiev, K.A. Loza, Y.P. Yampolskii, J. Membr. Sci.167, 91 (2000)
26. T.H. Kim, W.J. Koros, G.R. Husk, K.C. O’Brien, J.Membr. Sci. 37, 45 (1988)
27. G.W. Arnold, J. Appl. Phys. 46, 4466 (1975)
Related Documents