21JAN200918403258 UNITED STATES SECURITIES AND EXCHANGE COMMISSION Washington, D.C. 20549 FORM 20-F (Mark One) អ REGISTRATION STATEMENT PURSUANT TO SECTION 12(b) OR (g) OF THE SECURITIES EXCHANGE ACT OF 1934 OR ፤ ANNUAL REPORT PURSUANT TO SECTION 13 OR 15(d) OF THE SECURITIES EXCHANGE ACT OF 1934 For the fiscal year ended: December 31, 2010 OR អ TRANSITION REPORT PURSUANT TO SECTION 13 OR 15(d) OF THE SECURITIES EXCHANGE ACT OF 1934 For the transition period from to OR អ SHELL COMPANY REPORT PURSUANT TO SECTION 13 or 15(d) OF THE SECURITIES EXCHANGE ACT OF 1934 Date of event requiring this shell company report: Commission file number: 1-31466 (Exact name of Registrant as specified in its charter) COCA-COLA HELLENIC BOTTLING COMPANY S.A. (Translation of Registrant’s name into English) THE HELLENIC REPUBLIC (Jurisdiction of incorporation or organization) 9, Fragoklissias Street 151 25 Maroussi Athens, Greece (Address of principal executive offices) Jan Gustavsson, +30 (210) 618-3100, [email protected], 9, Fragoklissias Street, 151 25 Maroussi Athens, Greece (Name, Telephone, E-mail and/or Facsimile number and Address of Company Contact Person) Securities registered or to be registered pursuant to Section 12(b) of the Securities Exchange Act of 1934: Ordinary shares of nominal value E0.50 per ordinary share New York Stock Exchange* American Depositary Shares (ADSs), each ADS representing one ordinary share New York Stock Exchange * Not for trading, but only in connection with the listing of the ADSs, pursuant to the requirements of the New York Stock Exchange Securities registered or to be registered pursuant to Section 12(g) of the Securities Exchange Act of 1934: None Securities for which there is a reporting obligation pursuant to Section 15(d) of the Securities Exchange Act of 1934: None Indicate the number of outstanding shares of each of the Registrant’s classes of capital or common stock as at December 31, 2010, the close of the period covered by the annual report: 366,136,440 ordinary shares of nominal value E0.50 per ordinary share Indicate by check mark if the registrant is a well-known seasoned issuer, as defined in Rule 405 of the Securities Act Yes ፤ No អ If this report is an annual or transition report, indicate by check mark if the registrant is not required to file reports pursuant to Section 13 or 15(d) of the Securities Exchange Act of 1934. Yes អ No ፤ Note—Checking the box above will not relieve any registrant required to file reports pursuant to Section 13 or 15(d) of the Securities Exchange Act of 1934 from their obligations under those Sections. Indicate by check mark whether the registrant (1) has filed all reports required to be filed by Section 13 or 15(d) of the Securities Exchange Act of 1934 during the preceding 12 months (or for such shorter period that the Registrant was required to file such reports), and (2) has been subject to such filing requirements for the past 90 days. Yes ፤ No អ Indicate by check mark whether the registrant has submitted electronically and posted on its corporate Web site, if any, every Interactive Data File required to be submitted and posted pursuant to Rule 405 of Regulation S-T (§232.405 of this chapter) during the preceding 12 months (or for such shorter period that the registrant was required to submit and post such files).* Yes ፤ No អ Indicate by check mark whether the registrant is a large accelerated filer, an accelerated filer, or a non-accelerated filer. See definition of ‘‘accelerated filer and large accelerated filer’’ in Rule 12b-2 of the Exchange Act. (Check one): Large accelerated filer ፤ Accelerated filer អ Non-accelerated filer អ Indicate by check mark which basis of accounting the registrant has used to prepare the financial statements included in the filing. US GAAP អ International Financial Reporting Standards as issued by Other អ the International Accounting Standards Board ፤ If ‘‘Other’’ has been checked in response to the previous question, indicate by check mark which financial statement item the registrant has elected to follow. Item 17 អ Item 18 អ If this is an annual report, indicate by check mark whether the registrant is a shell company (as defined in Rule 12b-2 of the Exchange Act). Yes អ No ፤ * This requirement does not apply to the registrant until its fiscal year ending December 31, 2011.

Welcome message from author
This document is posted to help you gain knowledge. Please leave a comment to let me know what you think about it! Share it to your friends and learn new things together.
Transcript
21JAN200918403258
UNITED STATESSECURITIES AND EXCHANGE COMMISSION
Washington, D.C. 20549
FORM 20-F(Mark One)
� REGISTRATION STATEMENT PURSUANT TO SECTION 12(b) OR (g) OF THE SECURITIESEXCHANGE ACT OF 1934
OR� ANNUAL REPORT PURSUANT TO SECTION 13 OR 15(d) OF THE SECURITIES EXCHANGE ACT
OF 1934For the fiscal year ended: December 31, 2010
OR� TRANSITION REPORT PURSUANT TO SECTION 13 OR 15(d) OF THE SECURITIES EXCHANGE ACT
OF 1934For the transition period from to
OR� SHELL COMPANY REPORT PURSUANT TO SECTION 13 or 15(d) OF THE SECURITIES EXCHANGE
ACT OF 1934Date of event requiring this shell company report:
Commission file number: 1-31466
(Exact name of Registrant as specified in its charter)COCA-COLA HELLENIC BOTTLING COMPANY S.A.
(Translation of Registrant’s name into English)
THE HELLENIC REPUBLIC(Jurisdiction of incorporation or organization)
9, Fragoklissias Street151 25 Maroussi Athens, Greece(Address of principal executive offices)
Jan Gustavsson, +30 (210) 618-3100, [email protected],9, Fragoklissias Street, 151 25 Maroussi Athens, Greece
(Name, Telephone, E-mail and/or Facsimile number and Address of Company Contact Person)
Securities registered or to be registered pursuant to Section 12(b) of the Securities Exchange Act of 1934:Ordinary shares of nominal value E0.50 per ordinary share New York Stock Exchange*American Depositary Shares (ADSs),each ADS representing one ordinary share New York Stock Exchange
* Not for trading, but only in connection with the listing of the ADSs, pursuant to the requirements of the New York Stock ExchangeSecurities registered or to be registered pursuant to Section 12(g) of the Securities Exchange Act of 1934: NoneSecurities for which there is a reporting obligation pursuant to Section 15(d) of the Securities Exchange Act of 1934: NoneIndicate the number of outstanding shares of each of the Registrant’s classes of capital or common stock as at December 31, 2010,the close of the period covered by the annual report: 366,136,440 ordinary shares of nominal value E0.50 per ordinary shareIndicate by check mark if the registrant is a well-known seasoned issuer, as defined in Rule 405 of the Securities Act
Yes � No �If this report is an annual or transition report, indicate by check mark if the registrant is not required to file reports pursuant to
Section 13 or 15(d) of the Securities Exchange Act of 1934. Yes � No �Note—Checking the box above will not relieve any registrant required to file reports pursuant to Section 13 or 15(d) of the
Securities Exchange Act of 1934 from their obligations under those Sections.Indicate by check mark whether the registrant (1) has filed all reports required to be filed by Section 13 or 15(d) of the Securities
Exchange Act of 1934 during the preceding 12 months (or for such shorter period that the Registrant was required to file such reports),and (2) has been subject to such filing requirements for the past 90 days. Yes � No �
Indicate by check mark whether the registrant has submitted electronically and posted on its corporate Web site, if any, everyInteractive Data File required to be submitted and posted pursuant to Rule 405 of Regulation S-T (§232.405 of this chapter) during thepreceding 12 months (or for such shorter period that the registrant was required to submit and post such files).* Yes � No �
Indicate by check mark whether the registrant is a large accelerated filer, an accelerated filer, or a non-accelerated filer. Seedefinition of ‘‘accelerated filer and large accelerated filer’’ in Rule 12b-2 of the Exchange Act. (Check one):
Large accelerated filer � Accelerated filer � Non-accelerated filer �Indicate by check mark which basis of accounting the registrant has used to prepare the financial statements included in the filing.
US GAAP � International Financial Reporting Standards as issued by Other �the International Accounting Standards Board �
If ‘‘Other’’ has been checked in response to the previous question, indicate by check mark which financial statement item theregistrant has elected to follow.
Item 17 � Item 18 �If this is an annual report, indicate by check mark whether the registrant is a shell company (as defined in Rule 12b-2 of the
Exchange Act).Yes � No �
* This requirement does not apply to the registrant until its fiscal year ending December 31, 2011.
TABLE OF CONTENTS
Page
Special Note Regarding Forward Looking Statements . . . . . . . . . . . . . . . . . . . . . . . . . . . . . . . . 3
Presentation of Financial and Other Information . . . . . . . . . . . . . . . . . . . . . . . . . . . . . . . . . . . . 4
PART I . . . . . . . . . . . . . . . . . . . . . . . . . . . . . . . . . . . . . . . . . . . . . . . . . . . . . . . . . . . . . . . . . . 5
Item 1 Identity of Directors, Senior Management and Advisers . . . . . . . . . . . . . . . . . . . . . . 5
Item 2 Offer Statistics and Expected Timetable . . . . . . . . . . . . . . . . . . . . . . . . . . . . . . . . . 5
Item 3 Key Information . . . . . . . . . . . . . . . . . . . . . . . . . . . . . . . . . . . . . . . . . . . . . . . . . . 5
Item 4 Information on the Company . . . . . . . . . . . . . . . . . . . . . . . . . . . . . . . . . . . . . . . . . 26
Item 4A Unresolved Staff Comments . . . . . . . . . . . . . . . . . . . . . . . . . . . . . . . . . . . . . . . . . . 63
Item 5 Operating and Financial Review and Prospects . . . . . . . . . . . . . . . . . . . . . . . . . . . . 63
Item 6 Directors, Senior Management and Employees . . . . . . . . . . . . . . . . . . . . . . . . . . . . 109
Item 7 Major Shareholders and Related Party Transactions . . . . . . . . . . . . . . . . . . . . . . . . . 131
Item 8 Financial Information . . . . . . . . . . . . . . . . . . . . . . . . . . . . . . . . . . . . . . . . . . . . . . 146
Item 9 The Offer and Listing . . . . . . . . . . . . . . . . . . . . . . . . . . . . . . . . . . . . . . . . . . . . . . 147
Item 10 Additional Information . . . . . . . . . . . . . . . . . . . . . . . . . . . . . . . . . . . . . . . . . . . . . 155
Item 11 Quantitative and Qualitative Disclosures about Market Risk . . . . . . . . . . . . . . . . . . 174
Item 12 Description of Securities Other than Equity Securities . . . . . . . . . . . . . . . . . . . . . . . 175
PART II . . . . . . . . . . . . . . . . . . . . . . . . . . . . . . . . . . . . . . . . . . . . . . . . . . . . . . . . . . . . . . . . . 176
Item 13 Defaults, Dividend Arrearages and Delinquencies . . . . . . . . . . . . . . . . . . . . . . . . . . 176
Item 14 Material Modifications to the Rights of Security Holders and Use of Proceeds . . . . . 176
Item 15 Controls and Procedures . . . . . . . . . . . . . . . . . . . . . . . . . . . . . . . . . . . . . . . . . . . . 176
Item 16A Audit Committee Financial Expert . . . . . . . . . . . . . . . . . . . . . . . . . . . . . . . . . . . . . 177
Item 16B Code of Ethics . . . . . . . . . . . . . . . . . . . . . . . . . . . . . . . . . . . . . . . . . . . . . . . . . . . 177
Item 16C Principal Accountant Fees and Services . . . . . . . . . . . . . . . . . . . . . . . . . . . . . . . . . 177
Item 16D Exemption from the Listing Standards of Audit Committees . . . . . . . . . . . . . . . . . . 178
Item 16E Purchases of Equity Securities by the Issuer and Affiliated Persons . . . . . . . . . . . . . 178
Item 16F Change In Registrant’s Certifying Accountant . . . . . . . . . . . . . . . . . . . . . . . . . . . . . 178
Item 16G Corporate Governance . . . . . . . . . . . . . . . . . . . . . . . . . . . . . . . . . . . . . . . . . . . . . 178
PART III . . . . . . . . . . . . . . . . . . . . . . . . . . . . . . . . . . . . . . . . . . . . . . . . . . . . . . . . . . . . . . . . 179
Item 17 Financial Statements . . . . . . . . . . . . . . . . . . . . . . . . . . . . . . . . . . . . . . . . . . . . . . . 179
Item 18 Financial Statements . . . . . . . . . . . . . . . . . . . . . . . . . . . . . . . . . . . . . . . . . . . . . . . 179
Item 19 Exhibits . . . . . . . . . . . . . . . . . . . . . . . . . . . . . . . . . . . . . . . . . . . . . . . . . . . . . . . . 179
Signatures . . . . . . . . . . . . . . . . . . . . . . . . . . . . . . . . . . . . . . . . . . . . . . . . . . . . . . . 182
2
SPECIAL NOTE REGARDING FORWARD LOOKING STATEMENTS
This annual report contains forward-looking statements that involve risks and uncertainties, inparticular under Item 3, ‘‘Key Information—Risk Factors’’, Item 4, ‘‘Information on the Company’’ andItem 5, ‘‘Operating and Financial Review and Prospects’’. These statements may generally, but notalways, be identified by the use of words such as ‘‘believe’’, ‘‘outlook’’, ‘‘guidance’’, ‘‘intend’’, ‘‘expect’’,‘‘anticipate’’, ‘‘plan’’, ‘‘target’’ and similar expressions to identify forward-looking statements. Allstatements other than statements of historical facts, including, among others, statements regarding ourfuture financial position and results, our outlook for 2011 and future years, business strategy and theeffects of the global economic slowdown, currency volatility, our recent acquisitions, and restructuringinitiatives on our business and financial condition, our future dealings with The Coca-Cola Company,budgets, projected levels of consumption and production, projected raw material and other costs,estimates of capital expenditure and plans and objectives of management for future operations, areforward-looking statements. You should not place undue reliance on such forward-looking statements.By their nature, forward-looking statements involve risk and uncertainty because they reflect ourcurrent expectations and assumptions as to future events and circumstances that may not proveaccurate. Our actual results could differ materially from those anticipated in the forward-lookingstatements for many reasons, including the risks described under Item 3, ‘‘Key Information—RiskFactors’’ included elsewhere in this annual report.
Although we believe that, as of the date of this annual report, the expectations reflected in theforward-looking statements are reasonable, we cannot assure you that our future results, level ofactivity, performance or achievements will meet these expectations. Moreover, neither we nor any otherperson assumes responsibility for the accuracy and completeness of the forward-looking statements.After the date of this annual report, unless we are required by law to update these forward-lookingstatements, we will not necessarily update any of these forward-looking statements to conform themeither to actual results or to changes in our expectations.
3
PRESENTATION OF FINANCIAL AND OTHER INFORMATION
Our financial year is January 1 to December 31. We prepare our financial statements inaccordance with the International Financial Reporting Standards, or IFRS, as issued by theInternational Accounting Standards Board, or IASB. Our financial statements are also in compliancewith IFRS as adopted by the European Union, or EU. This annual report includes our auditedconsolidated balance sheets as at December 31, 2010 and 2009, and the related consolidated statementsof income, of other comprehensive income, changes in equity, and cash flows for each of the threeyears in the period ended December 31, 2010.
In 2002, the European Council adopted a regulation requiring EU publicly-traded companies toprepare financial statements under IFRS effective for the fiscal year commencing January 1, 2005. Inline with such EU regulation, Greek legislation has provided that Greek publicly-traded companiesprepare their statutory financial statements in accordance with IFRS as adopted by the EU, with effectfrom January 1, 2005.
In this annual report, references to ‘‘euro’’ and ‘‘A’’ are to the official currency of the memberstates of the EU that adopted the single currency in accordance with the Treaty Establishing theEuropean Economic Community (signed in Rome on March 25, 1957), as amended by the Treaty ofEuropean Union signed in Maastricht on February 7, 1992. Greece adopted the euro as its officialcurrency as of January 1, 2001, at the irrevocably fixed exchange rate of A1.00 = 340.75 Greekdrachmas. The following countries in which we operate have also adopted the euro as their officialcurrency: Austria, Cyprus, Italy, Montenegro, the Republic of Ireland, Slovakia, Slovenia and, effectiveJanuary 1, 2011, Estonia. Additionally, the currencies of six countries in which we operate are peggedto the euro. The euro-pegged currencies of Latvia, Lithuania, the Former Yugoslav Republic ofMacedonia, and prior to January 1, 2011, Estonia, are permitted to fluctuate within certain parameterswhereas the currencies of Bosnia and Herzegovina and Bulgaria are not permitted to fluctuate.
All references to ‘‘US dollar’’ and ‘‘$’’ are to the lawful currency of the United States. You shouldread Item 3, ‘‘Key Information—Selected Financial Data—Exchange rate information’’ for historicalinformation regarding the exchange rates between the euro and the US dollar based on the NoonBuying Rate for cable transfers as certified by the Federal Reserve Board of New York (the ‘‘NoonBuying Rate’’). No representation is made that euro or US dollar amounts referred to in this annualreport have been, could have been or could be converted into US dollars or euro at these particularrates or at any rates at all. Solely for convenience, this annual report contains translations of certaineuro balances into US dollars at specified rates. These are simply translations, and you should notexpect that a euro amount actually represents a stated US dollar amount or that it could be convertedinto US dollars at specified rates. In this annual report, unless otherwise specified, the translations ofeuro into US dollars have been made at a rate of A1.00 = $1.3968, being the Noon Buying Ratebetween the euro and the US dollar on March 15, 2011.
Unless otherwise specified, sales volume is measured in terms of unit cases sold. A unit caseequals 5.678 liters or 24 servings of 8 US fluid ounces each. The unit case is the typical volumemeasure used in our industry.
Unless the context requires otherwise, references to ‘‘we’’, ‘‘us’’, ‘‘our’’ or ‘‘the group’’ refer to theCoca-Cola Hellenic Bottling Company S.A. and its subsidiaries, references to the ‘‘parent’’ refer toCoca-Cola Hellenic Bottling Company S.A., and references to ‘‘owners of the parent’’ refer to itsshareholders.
Information on or accessible through our corporate website, www.coca-colahellenic.com, does notform part of and is not incorporated into this document.
4
PART I
ITEM 1 IDENTITY OF DIRECTORS, SENIOR MANAGEMENT AND ADVISERS
A. Directors and Senior Management
Not applicable.
B. Advisors
Not applicable.
C. Auditors
Not applicable.
ITEM 2 OFFER STATISTICS AND EXPECTED TIMETABLE
A. Offer Statistics
Not applicable.
B. Method and Expected Timetable
Not applicable.
ITEM 3 KEY INFORMATION
A. Selected Financial Data
The summary financial information (statement of operations, cash flow, balance sheet, and shareand per share data, adjusted EBITDA and reconciliation of profit after tax attributable to owners ofthe parent to adjusted EBITDA) set forth below for the five year period ended December 31, 2010 hasbeen derived from our audited consolidated financial statements prepared in accordance with IFRS.Our consolidated balance sheets as of December 31, 2010 and 2009, and the related consolidatedstatements of income, shareholders’ equity and cash flows for each of the three years in the periodended December 31, 2010, are included elsewhere in this annual report and the historical informationfor the years ended December 31, 2007 and 2006 is derived from the audited financial statementswhich are not included in this document.
We define adjusted EBITDA as operating profit before deductions for depreciation (included bothin cost of goods sold and in selling, delivery and administrative expenses), impairment of property,plant and equipment, stock option compensation, impairment of intangible assets, amortization of andadjustments to intangible assets and other non-cash items. Adjusted EBITDA serves as an additionalindicator of our operating performance and not as a replacement for measures such as cash flows fromoperating activities and operating profit as defined and required under IFRS. We believe that adjustedEBITDA is useful to investors as a measure of our operating performance because it reflects theunderlying operating cash costs by eliminating the non-cash items listed above. In addition, we believethat although EBITDA is a measure commonly used by analysts and investors in our industry, ourcurrent shareholders and potential investors in our company use multiples of our adjusted EBITDA inmaking investment decisions about our company. Accordingly, we have disclosed this information topermit a more complete analysis of our operating performance. Adjusted EBITDA, as we calculate it,may not be comparable to similarly titled measures reported by other companies.
5
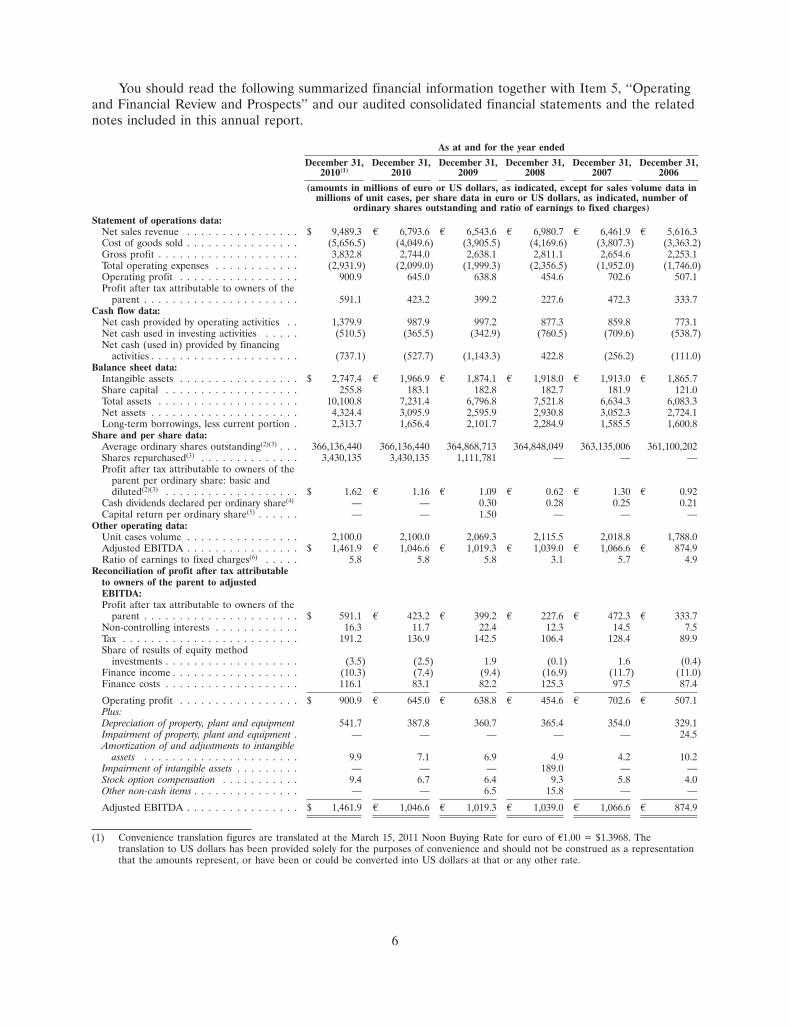
You should read the following summarized financial information together with Item 5, ‘‘Operatingand Financial Review and Prospects’’ and our audited consolidated financial statements and the relatednotes included in this annual report.
As at and for the year ended
December 31, December 31, December 31, December 31, December 31, December 31,2010(1) 2010 2009 2008 2007 2006
(amounts in millions of euro or US dollars, as indicated, except for sales volume data inmillions of unit cases, per share data in euro or US dollars, as indicated, number of
ordinary shares outstanding and ratio of earnings to fixed charges)Statement of operations data:
Net sales revenue . . . . . . . . . . . . . . . . $ 9,489.3 A 6,793.6 A 6,543.6 A 6,980.7 A 6,461.9 A 5,616.3Cost of goods sold . . . . . . . . . . . . . . . . (5,656.5) (4,049.6) (3,905.5) (4,169.6) (3,807.3) (3,363.2)Gross profit . . . . . . . . . . . . . . . . . . . . 3,832.8 2,744.0 2,638.1 2,811.1 2,654.6 2,253.1Total operating expenses . . . . . . . . . . . . (2,931.9) (2,099.0) (1,999.3) (2,356.5) (1,952.0) (1,746.0)Operating profit . . . . . . . . . . . . . . . . . 900.9 645.0 638.8 454.6 702.6 507.1Profit after tax attributable to owners of the
parent . . . . . . . . . . . . . . . . . . . . . . 591.1 423.2 399.2 227.6 472.3 333.7Cash flow data:
Net cash provided by operating activities . . 1,379.9 987.9 997.2 877.3 859.8 773.1Net cash used in investing activities . . . . . (510.5) (365.5) (342.9) (760.5) (709.6) (538.7)Net cash (used in) provided by financing
activities . . . . . . . . . . . . . . . . . . . . . (737.1) (527.7) (1,143.3) 422.8 (256.2) (111.0)Balance sheet data:
Intangible assets . . . . . . . . . . . . . . . . . $ 2,747.4 A 1,966.9 A 1,874.1 A 1,918.0 A 1,913.0 A 1,865.7Share capital . . . . . . . . . . . . . . . . . . . 255.8 183.1 182.8 182.7 181.9 121.0Total assets . . . . . . . . . . . . . . . . . . . . 10,100.8 7,231.4 6,796.8 7,521.8 6,634.3 6,083.3Net assets . . . . . . . . . . . . . . . . . . . . . 4,324.4 3,095.9 2,595.9 2,930.8 3,052.3 2,724.1Long-term borrowings, less current portion . 2,313.7 1,656.4 2,101.7 2,284.9 1,585.5 1,600.8
Share and per share data:Average ordinary shares outstanding(2)(3) . . . 366,136,440 366,136,440 364,868,713 364,848,049 363,135,006 361,100,202Shares repurchased(3) . . . . . . . . . . . . . . 3,430,135 3,430,135 1,111,781 — — —Profit after tax attributable to owners of the
parent per ordinary share: basic anddiluted(2)(3) . . . . . . . . . . . . . . . . . . . $ 1.62 A 1.16 A 1.09 A 0.62 A 1.30 A 0.92
Cash dividends declared per ordinary share(4) — — 0.30 0.28 0.25 0.21Capital return per ordinary share(5) . . . . . . — — 1.50 — — —
Other operating data:Unit cases volume . . . . . . . . . . . . . . . . 2,100.0 2,100.0 2,069.3 2,115.5 2,018.8 1,788.0Adjusted EBITDA . . . . . . . . . . . . . . . . $ 1,461.9 A 1,046.6 A 1,019.3 A 1,039.0 A 1,066.6 A 874.9Ratio of earnings to fixed charges(6) . . . . . 5.8 5.8 5.8 3.1 5.7 4.9
Reconciliation of profit after tax attributableto owners of the parent to adjustedEBITDA:Profit after tax attributable to owners of the
parent . . . . . . . . . . . . . . . . . . . . . . $ 591.1 A 423.2 A 399.2 A 227.6 A 472.3 A 333.7Non-controlling interests . . . . . . . . . . . . 16.3 11.7 22.4 12.3 14.5 7.5Tax . . . . . . . . . . . . . . . . . . . . . . . . . 191.2 136.9 142.5 106.4 128.4 89.9Share of results of equity method
investments . . . . . . . . . . . . . . . . . . . (3.5) (2.5) 1.9 (0.1) 1.6 (0.4)Finance income . . . . . . . . . . . . . . . . . . (10.3) (7.4) (9.4) (16.9) (11.7) (11.0)Finance costs . . . . . . . . . . . . . . . . . . . 116.1 83.1 82.2 125.3 97.5 87.4
Operating profit . . . . . . . . . . . . . . . . . $ 900.9 A 645.0 A 638.8 A 454.6 A 702.6 A 507.1Plus:Depreciation of property, plant and equipment 541.7 387.8 360.7 365.4 354.0 329.1Impairment of property, plant and equipment . — — — — — 24.5Amortization of and adjustments to intangible
assets . . . . . . . . . . . . . . . . . . . . . . 9.9 7.1 6.9 4.9 4.2 10.2Impairment of intangible assets . . . . . . . . . — — — 189.0 — —Stock option compensation . . . . . . . . . . . 9.4 6.7 6.4 9.3 5.8 4.0Other non-cash items . . . . . . . . . . . . . . . — — 6.5 15.8 — —
Adjusted EBITDA . . . . . . . . . . . . . . . . $ 1,461.9 A 1,046.6 A 1,019.3 A 1,039.0 A 1,066.6 A 874.9
(1) Convenience translation figures are translated at the March 15, 2011 Noon Buying Rate for euro of A1.00 = $1.3968. Thetranslation to US dollars has been provided solely for the purposes of convenience and should not be construed as a representationthat the amounts represent, or have been or could be converted into US dollars at that or any other rate.
6
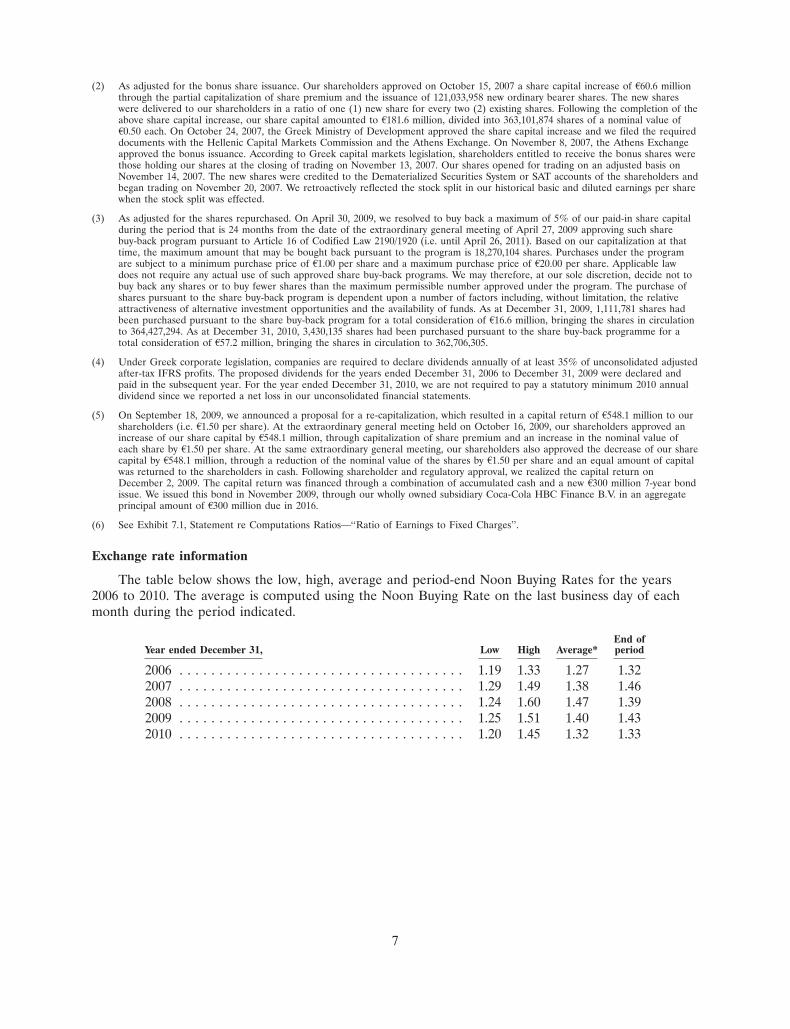
(2) As adjusted for the bonus share issuance. Our shareholders approved on October 15, 2007 a share capital increase of A60.6 millionthrough the partial capitalization of share premium and the issuance of 121,033,958 new ordinary bearer shares. The new shareswere delivered to our shareholders in a ratio of one (1) new share for every two (2) existing shares. Following the completion of theabove share capital increase, our share capital amounted to A181.6 million, divided into 363,101,874 shares of a nominal value ofA0.50 each. On October 24, 2007, the Greek Ministry of Development approved the share capital increase and we filed the requireddocuments with the Hellenic Capital Markets Commission and the Athens Exchange. On November 8, 2007, the Athens Exchangeapproved the bonus issuance. According to Greek capital markets legislation, shareholders entitled to receive the bonus shares werethose holding our shares at the closing of trading on November 13, 2007. Our shares opened for trading on an adjusted basis onNovember 14, 2007. The new shares were credited to the Dematerialized Securities System or SAT accounts of the shareholders andbegan trading on November 20, 2007. We retroactively reflected the stock split in our historical basic and diluted earnings per sharewhen the stock split was effected.
(3) As adjusted for the shares repurchased. On April 30, 2009, we resolved to buy back a maximum of 5% of our paid-in share capitalduring the period that is 24 months from the date of the extraordinary general meeting of April 27, 2009 approving such sharebuy-back program pursuant to Article 16 of Codified Law 2190/1920 (i.e. until April 26, 2011). Based on our capitalization at thattime, the maximum amount that may be bought back pursuant to the program is 18,270,104 shares. Purchases under the programare subject to a minimum purchase price of A1.00 per share and a maximum purchase price of A20.00 per share. Applicable lawdoes not require any actual use of such approved share buy-back programs. We may therefore, at our sole discretion, decide not tobuy back any shares or to buy fewer shares than the maximum permissible number approved under the program. The purchase ofshares pursuant to the share buy-back program is dependent upon a number of factors including, without limitation, the relativeattractiveness of alternative investment opportunities and the availability of funds. As at December 31, 2009, 1,111,781 shares hadbeen purchased pursuant to the share buy-back program for a total consideration of A16.6 million, bringing the shares in circulationto 364,427,294. As at December 31, 2010, 3,430,135 shares had been purchased pursuant to the share buy-back programme for atotal consideration of A57.2 million, bringing the shares in circulation to 362,706,305.
(4) Under Greek corporate legislation, companies are required to declare dividends annually of at least 35% of unconsolidated adjustedafter-tax IFRS profits. The proposed dividends for the years ended December 31, 2006 to December 31, 2009 were declared andpaid in the subsequent year. For the year ended December 31, 2010, we are not required to pay a statutory minimum 2010 annualdividend since we reported a net loss in our unconsolidated financial statements.
(5) On September 18, 2009, we announced a proposal for a re-capitalization, which resulted in a capital return of A548.1 million to ourshareholders (i.e. A1.50 per share). At the extraordinary general meeting held on October 16, 2009, our shareholders approved anincrease of our share capital by A548.1 million, through capitalization of share premium and an increase in the nominal value ofeach share by A1.50 per share. At the same extraordinary general meeting, our shareholders also approved the decrease of our sharecapital by A548.1 million, through a reduction of the nominal value of the shares by A1.50 per share and an equal amount of capitalwas returned to the shareholders in cash. Following shareholder and regulatory approval, we realized the capital return onDecember 2, 2009. The capital return was financed through a combination of accumulated cash and a new A300 million 7-year bondissue. We issued this bond in November 2009, through our wholly owned subsidiary Coca-Cola HBC Finance B.V. in an aggregateprincipal amount of A300 million due in 2016.
(6) See Exhibit 7.1, Statement re Computations Ratios—‘‘Ratio of Earnings to Fixed Charges’’.
Exchange rate information
The table below shows the low, high, average and period-end Noon Buying Rates for the years2006 to 2010. The average is computed using the Noon Buying Rate on the last business day of eachmonth during the period indicated.
End ofYear ended December 31, Low High Average* period
2006 . . . . . . . . . . . . . . . . . . . . . . . . . . . . . . . . . . . . 1.19 1.33 1.27 1.322007 . . . . . . . . . . . . . . . . . . . . . . . . . . . . . . . . . . . . 1.29 1.49 1.38 1.462008 . . . . . . . . . . . . . . . . . . . . . . . . . . . . . . . . . . . . 1.24 1.60 1.47 1.392009 . . . . . . . . . . . . . . . . . . . . . . . . . . . . . . . . . . . . 1.25 1.51 1.40 1.432010 . . . . . . . . . . . . . . . . . . . . . . . . . . . . . . . . . . . . 1.20 1.45 1.32 1.33
7
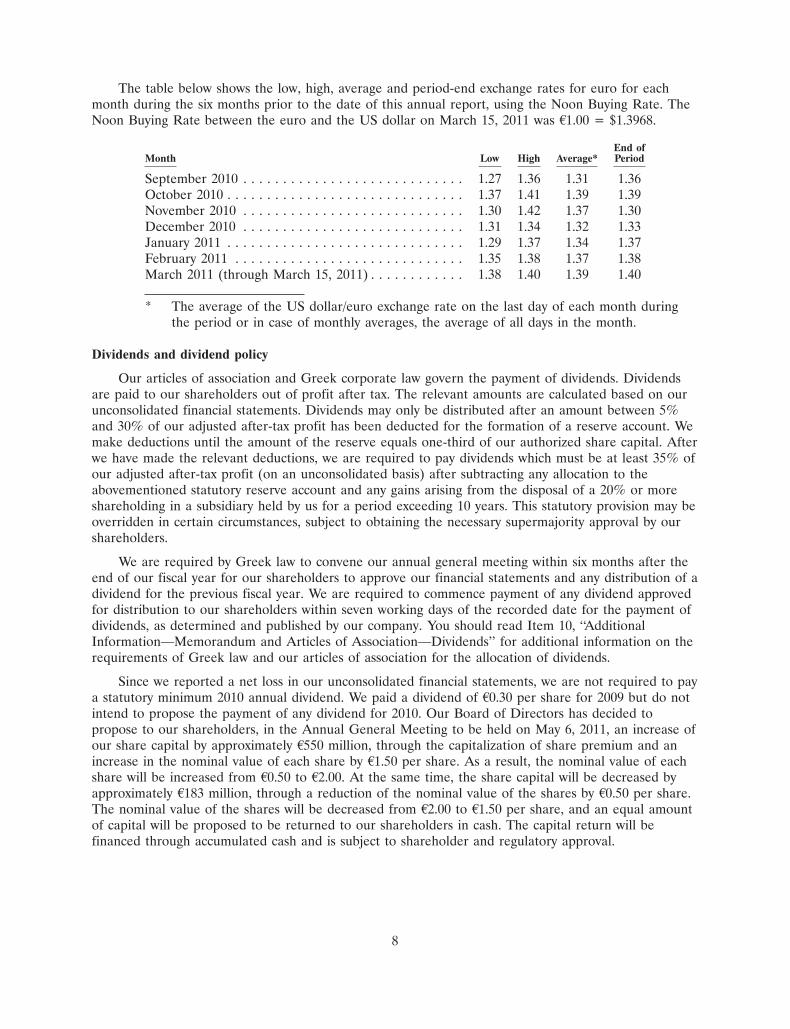
The table below shows the low, high, average and period-end exchange rates for euro for eachmonth during the six months prior to the date of this annual report, using the Noon Buying Rate. TheNoon Buying Rate between the euro and the US dollar on March 15, 2011 was A1.00 = $1.3968.
End ofMonth Low High Average* Period
September 2010 . . . . . . . . . . . . . . . . . . . . . . . . . . . . 1.27 1.36 1.31 1.36October 2010 . . . . . . . . . . . . . . . . . . . . . . . . . . . . . . 1.37 1.41 1.39 1.39November 2010 . . . . . . . . . . . . . . . . . . . . . . . . . . . . 1.30 1.42 1.37 1.30December 2010 . . . . . . . . . . . . . . . . . . . . . . . . . . . . 1.31 1.34 1.32 1.33January 2011 . . . . . . . . . . . . . . . . . . . . . . . . . . . . . . 1.29 1.37 1.34 1.37February 2011 . . . . . . . . . . . . . . . . . . . . . . . . . . . . . 1.35 1.38 1.37 1.38March 2011 (through March 15, 2011) . . . . . . . . . . . . 1.38 1.40 1.39 1.40
* The average of the US dollar/euro exchange rate on the last day of each month duringthe period or in case of monthly averages, the average of all days in the month.
Dividends and dividend policy
Our articles of association and Greek corporate law govern the payment of dividends. Dividendsare paid to our shareholders out of profit after tax. The relevant amounts are calculated based on ourunconsolidated financial statements. Dividends may only be distributed after an amount between 5%and 30% of our adjusted after-tax profit has been deducted for the formation of a reserve account. Wemake deductions until the amount of the reserve equals one-third of our authorized share capital. Afterwe have made the relevant deductions, we are required to pay dividends which must be at least 35% ofour adjusted after-tax profit (on an unconsolidated basis) after subtracting any allocation to theabovementioned statutory reserve account and any gains arising from the disposal of a 20% or moreshareholding in a subsidiary held by us for a period exceeding 10 years. This statutory provision may beoverridden in certain circumstances, subject to obtaining the necessary supermajority approval by ourshareholders.
We are required by Greek law to convene our annual general meeting within six months after theend of our fiscal year for our shareholders to approve our financial statements and any distribution of adividend for the previous fiscal year. We are required to commence payment of any dividend approvedfor distribution to our shareholders within seven working days of the recorded date for the payment ofdividends, as determined and published by our company. You should read Item 10, ‘‘AdditionalInformation—Memorandum and Articles of Association—Dividends’’ for additional information on therequirements of Greek law and our articles of association for the allocation of dividends.
Since we reported a net loss in our unconsolidated financial statements, we are not required to paya statutory minimum 2010 annual dividend. We paid a dividend of A0.30 per share for 2009 but do notintend to propose the payment of any dividend for 2010. Our Board of Directors has decided topropose to our shareholders, in the Annual General Meeting to be held on May 6, 2011, an increase ofour share capital by approximately A550 million, through the capitalization of share premium and anincrease in the nominal value of each share by A1.50 per share. As a result, the nominal value of eachshare will be increased from A0.50 to A2.00. At the same time, the share capital will be decreased byapproximately A183 million, through a reduction of the nominal value of the shares by A0.50 per share.The nominal value of the shares will be decreased from A2.00 to A1.50 per share, and an equal amountof capital will be proposed to be returned to our shareholders in cash. The capital return will befinanced through accumulated cash and is subject to shareholder and regulatory approval.
8
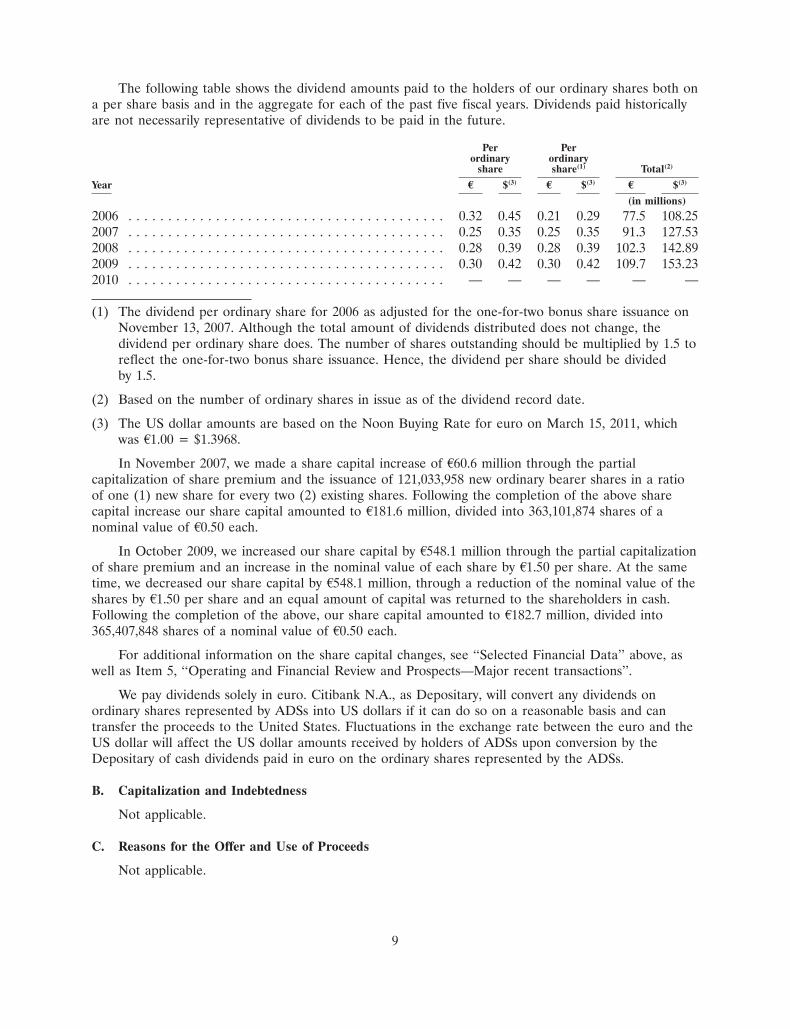
The following table shows the dividend amounts paid to the holders of our ordinary shares both ona per share basis and in the aggregate for each of the past five fiscal years. Dividends paid historicallyare not necessarily representative of dividends to be paid in the future.
Per Perordinary ordinary
share share(1) Total(2)
Year E $(3) E $(3) E $(3)
(in millions)
2006 . . . . . . . . . . . . . . . . . . . . . . . . . . . . . . . . . . . . . . . . 0.32 0.45 0.21 0.29 77.5 108.252007 . . . . . . . . . . . . . . . . . . . . . . . . . . . . . . . . . . . . . . . . 0.25 0.35 0.25 0.35 91.3 127.532008 . . . . . . . . . . . . . . . . . . . . . . . . . . . . . . . . . . . . . . . . 0.28 0.39 0.28 0.39 102.3 142.892009 . . . . . . . . . . . . . . . . . . . . . . . . . . . . . . . . . . . . . . . . 0.30 0.42 0.30 0.42 109.7 153.232010 . . . . . . . . . . . . . . . . . . . . . . . . . . . . . . . . . . . . . . . . — — — — — —
(1) The dividend per ordinary share for 2006 as adjusted for the one-for-two bonus share issuance onNovember 13, 2007. Although the total amount of dividends distributed does not change, thedividend per ordinary share does. The number of shares outstanding should be multiplied by 1.5 toreflect the one-for-two bonus share issuance. Hence, the dividend per share should be dividedby 1.5.
(2) Based on the number of ordinary shares in issue as of the dividend record date.
(3) The US dollar amounts are based on the Noon Buying Rate for euro on March 15, 2011, whichwas A1.00 = $1.3968.
In November 2007, we made a share capital increase of A60.6 million through the partialcapitalization of share premium and the issuance of 121,033,958 new ordinary bearer shares in a ratioof one (1) new share for every two (2) existing shares. Following the completion of the above sharecapital increase our share capital amounted to A181.6 million, divided into 363,101,874 shares of anominal value of A0.50 each.
In October 2009, we increased our share capital by A548.1 million through the partial capitalizationof share premium and an increase in the nominal value of each share by A1.50 per share. At the sametime, we decreased our share capital by A548.1 million, through a reduction of the nominal value of theshares by A1.50 per share and an equal amount of capital was returned to the shareholders in cash.Following the completion of the above, our share capital amounted to A182.7 million, divided into365,407,848 shares of a nominal value of A0.50 each.
For additional information on the share capital changes, see ‘‘Selected Financial Data’’ above, aswell as Item 5, ‘‘Operating and Financial Review and Prospects—Major recent transactions’’.
We pay dividends solely in euro. Citibank N.A., as Depositary, will convert any dividends onordinary shares represented by ADSs into US dollars if it can do so on a reasonable basis and cantransfer the proceeds to the United States. Fluctuations in the exchange rate between the euro and theUS dollar will affect the US dollar amounts received by holders of ADSs upon conversion by theDepositary of cash dividends paid in euro on the ordinary shares represented by the ADSs.
B. Capitalization and Indebtedness
Not applicable.
C. Reasons for the Offer and Use of Proceeds
Not applicable.
9
D. Risk Factors
You should carefully consider the risks and uncertainties described below. You should also refer to theother information set out in this annual report, including our audited consolidated financial statements andthe related notes. The risks and uncertainties described below may materially affect our company and anyinvestment you make in our company. If these events occur, the trading price of our ordinary shares andADSs could decline. Additional risks and uncertainties that do not currently exist, or that we are unawareof, may also become important factors that adversely affect our company and your investment.
Risks relating to our relationship with The Coca-Cola Company, Kar-Tess Holding and Nestle S.A.
If The Coca-Cola Company exercises its right to terminate our bottlers’ agreements, upon the occurrence ofcertain events, or is unwilling to renew these agreements, our net sales revenue may decline dramatically. Inaddition, if The Coca-Cola Company is unwilling to renew our bottlers’ agreements on terms at least asfavorable to us as the current terms, our net sales revenue could also be adversely affected.
Our bottlers’ agreements with The Coca-Cola Company are fundamental to our business. Thetrademarked beverages of The Coca-Cola Company represented approximately 96% of our total salesvolume in 2010. We produce, sell and distribute The Coca-Cola Company’s trademarked beveragespursuant to standard bottlers’ agreements with The Coca-Cola Company covering each of ourterritories. The bottlers’ agreements include limitations on our degree of exclusivity in our territoriesand, to the extent permitted by law, on our ability to market competing brands not owned by TheCoca-Cola Company in our countries outside the European Economic Area. The European EconomicArea comprises the member states of the EU as well as Norway, Iceland and Liechtenstein.
We enter into bottlers’ agreements with The Coca-Cola Company for each of our territories. Eachof our bottlers’ agreements has a fixed initial term. These agreements, the terms of which wereextended with effect as of January 1, 2004 and most of which expire in December 2013, may berenewed, at The Coca-Cola Company’s discretion, until 2023. Accordingly, our business is dependenton The Coca-Cola Company’s willingness to renew our bottlers’ agreements when they expire. Inaddition, The Coca-Cola Company has the right to terminate our bottlers’ agreements upon theoccurrence of certain events. You should read Item 7, ‘‘Major Shareholders and Related PartyTransactions—Related Party Transactions—Our relationship with The Coca-Cola Company’’ for adescription of the circumstances under which The Coca-Cola Company may terminate its bottlers’agreements with us. If The Coca-Cola Company exercises its right to terminate the bottlers’ agreementsupon the occurrence of certain events, or, if upon expiration of their initial term, The Coca-ColaCompany is unwilling to renew these agreements, our net sales revenue will decline dramatically. Inaddition, if The Coca-Cola Company is unwilling to renew our bottlers’ agreements on terms at least asfavorable to us as the current terms, our business could also be adversely affected.
The Coca-Cola Company could exercise its rights under the bottlers’ agreements in a manner that would makeit difficult for us to achieve our financial goals.
Our bottlers’ agreements govern our purchases of concentrate, which represents our mostsignificant raw materials cost. The Coca-Cola Company determines the price we pay for concentrate atits discretion. The Coca-Cola Company normally sets concentrate prices after discussions with us so asto reflect trading conditions in the relevant country. The Coca-Cola Company has other importantrights under the bottlers’ agreements, including the right, to the extent permitted by local law, to setthe maximum price we may charge to our customers and the right to approve our suppliers of certainpackaging and other raw materials. The combination of The Coca-Cola Company’s right to set ourconcentrate prices and its right to limit our selling prices could give The Coca-Cola Companyconsiderable influence over our profit margins, business, results of operations and financial condition.
10
There can be no assurance that The Coca-Cola Company’s objectives with the exercise of its rightsunder the bottlers’ agreements will in all cases be fully aligned with our objective to realize profitablevolume growth. It is thus possible that The Coca-Cola Company could exercise its rights under thebottlers’ agreements to determine concentrate prices, to set maximum prices we may charge tocustomers and to approve certain of our suppliers, in a manner that would make it difficult for us toachieve our financial goals.
Kar-Tess Holding and The Coca-Cola Company have substantial influence over the conduct of our businessand their interests may differ from the interests of other shareholders.
Kar-Tess Holding currently owns approximately 23% and The Coca-Cola Company currentlyindirectly owns approximately 23% of our outstanding share capital. The Coca-Cola Company holds itsshares through five companies which constitute The Coca-Cola Company Entities: Coca-Cola OverseasParent Limited, The Coca-Cola Export Corporation, Barlan, Inc. and Refreshment ProductServices, Inc., each a company incorporated in Delaware, and Atlantic Industries, a companyincorporated in the Cayman Islands. On December 6, 2010, Kar-Tess Holding transferred 22,453,254shares representing 6.13% of our outstanding shares by transferring its wholly owned subsidiaries underthe trade names ‘‘Sammy LLC’’, ‘‘Lucky 70 LLC’’, ‘‘Zoe 20 LLC’’, ‘‘Kooky LLC’’, ‘‘Utopia BusinessCompany Ltd.’’, ‘‘Harmonia Commercial S.A.’’, ‘‘Ice Cold Holdings Limited’’ and ‘‘Red & WhiteHoldings Limited’’, to entities and individuals, who were either ultimate beneficial owners of Kar-TessHolding or who were nominated by such ultimate beneficial owners of Kar-Tess Holding. No such entityor individual owns individually more than 2% of our outstanding share capital. In connection with theacquisition of Coca-Cola Beverages plc in August 2000, the Kar-Tess Group, of which Kar-Tess Holdingis the sole remaining member, and The Coca-Cola Company Entities, entered into a shareholders’agreement that governs certain aspects of their relationship. Kar-Tess Holding and The Coca-ColaCompany Entities have agreed to maintain their combined shareholdings until January 2014 at no lessthan 44% of our outstanding share capital (and at no less than 40% of our outstanding share capitalthereafter, until expiration of the shareholders’ agreement in December 31, 2018). Kar-Tess Holdingand The Coca-Cola Company Entities have also agreed to maintain their individual shareholdings untilJanuary 2014 at no less than 22% of our outstanding share capital (and at no less than 20% of ouroutstanding share capital thereafter until expiration of the shareholders’ agreement). Under theirshareholders’ agreement, Kar-Tess Holding and The Coca-Cola Company Entities have also agreed that,based on a twelve-member board of directors, The Coca-Cola Company would be represented by twodirectors and Kar-Tess Holding would be represented by four directors. Kar-Tess Holding and TheCoca-Cola Company Entities have also agreed that they will each vote their shares so as to maintaintheir respective proportional representation on our board of directors in the event that the number ofdirectors increases or decreases. Kar-Tess Holding and The Coca-Cola Company Entities have agreed tonominate the remaining directors jointly. Our board of directors currently consists of twelve members.No party or group of parties may unilaterally terminate the shareholders’ agreement prior to December2018. However, the parties may jointly agree to terminate the shareholders’ agreement at any time,which would also be terminated if we cease to exist or if one group of parties elects to terminate itupon breach of the agreement by the other group of parties. After December 2018, the shareholders’agreement will remain in force unless terminated by either group of parties upon three months writtennotice.
11
These arrangements give Kar-Tess Holding and The Coca-Cola Company substantial influence overour business and enables them, together, to determine the outcome of all actions requiring approval byour board of directors and the outcome of corporate actions that require shareholder approval, withthe exception of matters requiring an extraordinary quorum and supermajority approval. You shouldread Item 7, ‘‘Major Shareholders and Related Party Transactions—Related Party Transactions—Theshareholders’ agreement between Kar-Tess Holding and The Coca-Cola Company Entities’’ for adescription of the shareholders’ agreement and Item 10, ‘‘Additional Information—Memorandum andArticles of Association—Matters requiring extraordinary quorum and supermajority approval’’ foradditional information on the matters requiring extraordinary quorum and supermajority approval(consisting of at least 67% of paid-in share capital).
The interests of Kar-Tess Holding and The Coca-Cola Company may differ from those of othershareholders. As a result of their influence on our business, Kar-Tess Holding and The Coca-ColaCompany could prevent us from making certain decisions or taking certain actions that would protectthe interests of shareholders other than The Coca-Cola Company and Kar-Tess Holding or which wouldotherwise benefit us. For example, they might vote against an acquisition of us by a third party,meaning our other shareholders would not receive the premium over the then-current market price ofour ordinary shares that they might otherwise receive upon such an acquisition. You should readItem 7, ‘‘Major Shareholders and Related Party Transactions’’ for additional information on ourrelationship with Kar-Tess Holding and The Coca-Cola Company and Item 10, ‘‘AdditionalInformation—Memorandum and Articles of Association—Matters requiring extraordinary quorum andsupermajority approval’’ for information on the rights of majority and minority shareholders pursuantto our articles of association and under Greek law.
Our success depends in part on The Coca-Cola Company’s success in marketing and product developmentactivities.
We derive the majority of our revenues from the production, sale and distribution of thetrademarked beverages of The Coca-Cola Company. The Coca-Cola Company owns the trademarks ofthese products and has primary responsibility for consumer marketing and brand promotion. Theprofitable growth of our existing brands depends in part on The Coca-Cola Company’s consumermarketing activities, including The Coca-Cola Company’s discretionary contributions to our annualmarketing plan. The expansion of our family of brands depends to a considerable extent on TheCoca-Cola Company’s product expansion strategy, particularly with respect to new brands. If TheCoca-Cola Company were to reduce its marketing activities, the level of its contributions to our annualmarketing plan or its commitment to the development or acquisition of new products, particularly newstill and water beverages, these reductions could lead to decreased consumption of trademarkedbeverages of The Coca-Cola Company in the countries in which we operate. This would, in turn, leadto a decline in our share of the non-alcoholic beverages market and sales volume and adversely affectour growth prospects.
We depend on The Coca-Cola Company to protect its trademarks.
Brand recognition is critical in attracting consumers to our products. In each country in which weoperate, The Coca-Cola Company owns the trademarks of all of its products which we produce,distribute and sell. We rely on The Coca-Cola Company to protect its trademarks in the countrieswhere we operate, which include some countries that offer less comprehensive intellectual propertyprotection than the United States and the EU. The trademarked beverages of The Coca-Cola Companyrepresented approximately 96% of our total sales volume in 2010. If The Coca-Cola Company fails toprotect its proprietary rights against infringement or misappropriation, this could undermine thecompetitive position of the products of The Coca-Cola Company and lead to a significant decrease inthe volume of our sales of trademarked beverages of The Coca-Cola Company, which would materiallyand adversely affect our results of operations.
12
The Beverage Partners Worldwide joint venture between The Coca-Cola Company and Nestle S.A. could bedissolved or altered in a manner that adversely affects our business.
Beverage Partners Worldwide is a joint venture between The Coca-Cola Company and Nestle S.A.Recent efforts to expand our presence in the combined still and water beverages category have focused,in part, on products for which Beverage Partners Worldwide owns the trademarks. Sales of our Nesteaready-to-drink tea products comprised approximately 5% of our total sales volume in 2010. We dependon The Coca-Cola Company to protect our interests associated with Beverage Partners Worldwide. IfBeverage Partners Worldwide is dissolved or altered in a manner that adversely affects our business,then our net sales revenue may decline dramatically. There can be no assurance that we would be ableto replace any Beverage Partners Worldwide products that are removed from our product portfolio as aresult of such dissolution or alteration.
Risks relating to the non-alcoholic beverages industry
Weaker consumer demand for sparkling beverages could harm our revenues and profitability.
At the present time, our revenues and profitability remain substantially dependent upon sales ofour core sparkling beverages, particularly in our established countries. Although per capita consumptionof sparkling beverages in our established countries has generally continued to increase, the rate ofincrease has slowed down in recent years. This weakening of consumer demand for sparkling beveragescan be explained, in part, by demographic trends. Teenagers and young people account for the majorityof sparkling beverages consumption in our established countries. Currently these countries areexperiencing declining birth rates and ageing populations, which reduce the number of people in thoseage groups that traditionally are most likely to consume sparkling beverages.
Another trend adversely affecting growth in sparkling beverages consumption in our establishedcountries is the increased consumer focus on well-being, health and fitness, as well as concerns aboutobesity. Some consumers perceive still and water beverages such as juices, waters, ready-to-drink teas,sports and energy drinks to be more closely associated with a healthier life style. Consequently,consumption of these alternative beverages is growing at a faster rate than consumption of sparklingbeverages. While this trend is most pronounced in our established countries, it also exists to someextent in our developing and emerging countries. If this trend toward alternative beverages becomesmore prevalent in our developing and emerging countries, it could materially and adversely affect ourprospects for future profitable growth in the sparkling beverages category.
If any of these trends impedes profitable growth in consumption of our core sparkling beveragesbrands, our business and prospects would be severely impacted.
Our growth prospects may be harmed if we are unable to expand successfully in the combined still and waterbeverages category.
We believe that the combined still and water beverages category offers significant growth potential.We intend, together with The Coca-Cola Company, to continue to expand our product offerings in thiscategory, which includes juices, waters, sports and energy drinks and other ready-to-drink beverages,such as teas or coffees. Expanding our presence in this highly competitive category will require TheCoca-Cola Company to spend significantly on consumer marketing, brand promotion and/or brandacquisition and us to invest significantly in production, sales, distribution development and/or businessacquisitions. There is no assurance that The Coca-Cola Company will successfully develop and promotenew still and water beverage brands or that we will be able to increase our sales of new still and waterproducts. If we are unable to continue to expand in the combined still and water beverages category,then our growth prospects may be materially and adversely affected.
13
Risks relating to emerging and developing countries
The lack of institutional continuity and safeguards in our emerging and developing countries could adverselyaffect our competitive position, increase our cost of regulatory compliance and/or expose us to a heightenedrisk of loss due to fraud and criminal activity.
Whilst some of our emerging and developing countries are in the process of transitioning tomarket economies, stable political institutions and comprehensive regulatory systems, some of themlack the institutional continuity and strong procedural and regulatory safeguards typical in ourestablished countries. As a result, in these countries we are exposed to regulatory uncertainty in certainareas, which could increase our cost of regulatory compliance, and we enjoy less comprehensiveprotection for some of our rights, including intellectual property rights, which could undermine ourcompetitive position.
The lack of institutional continuity also exacerbates the effect of political uncertainty in ouremerging and developing countries and could adversely affect the orderly operation of markets andconsumer purchasing power. In addition, in countries with a large and complicated structure ofgovernment and administration, such as the Russian Federation, national, regional, local and othergovernmental bodies may issue inconsistent decisions and opinions that could increase our cost ofregulatory compliance.
Finally, we operate in some countries where corruption has historically been a problem. It is ourpolicy to comply with the US Foreign Corrupt Practices Act and similar regulations. This may put us ata competitive disadvantage against competitors that are not subject to, or do not comply with, the sameregulations. In addition, in some of the environments in which we operate, businesses like ours areexposed to a heightened risk of loss due to fraud and criminal activity, even though we review ourfinancial systems regularly in order to minimize such losses.
We are exposed to emerging and developing countries’ risks.
A substantial proportion of our operations, representing approximately 58% of 2010 net salesrevenue, is carried out in emerging and developing countries. Operations in these markets are subjectto the customary risks of operating in emerging and developing countries, which include potentialpolitical and economic uncertainty, application of exchange controls, reliance on foreign investment,nationalization or expropriation, crime and lack of law enforcement, political insurrection, externalinterference, currency fluctuations and changes in government policy. Such factors could affect ourresults by causing interruptions to operations or by increasing the costs of operating in those countriesor by limiting the ability to repatriate profits from those countries. Financial risks of operating inemerging and developing countries also include risks of liquidity, inflation, devaluation, price volatility,currency convertibility and country default resulting from significant deficits as well as other factors.These circumstances could adversely impact our business, results of operations and financial condition.Currency volatility resulting from financial and political instability in certain of our emerging anddeveloping countries materially impacted our results over the past years. Due to our specific exposure,these factors could affect us more than our competitors with less exposure to emerging and developingcountries, and any general decline in emerging and developing countries as a whole could impact usdisproportionately compared to our competitors.
14
The sustainability of our growth in our developing and emerging countries depends partly on our ability toattract and retain sufficient number of qualified and experienced personnel for which there is strong demand.
In recent years, we have been experiencing significant growth in a number of our developing andemerging countries. As our business continues to grow and the level of our investment in suchcountries increases, we are faced with the challenge of being able to attract and retain a sufficientnumber of qualified and experienced personnel in an increasingly competitive labor market. Our abilityto sustain our growth in these countries may be hindered if we are unable to successfully meet thischallenge.
Risks relating to competition
Competition law enforcement by the EU and national authorities may have a significant adverse effect on ourcompetitiveness and results of operations.
Our business is subject to the competition laws of the countries in which we operate and, withrespect to our activities affecting the EU, is also subject to EU competition law. The admission in 2004and 2007 to the EU of eleven of the European countries in which we operate has increased the impactof EU competition law on our business.
We cannot predict if competition law enforcement by the EU or national competition authoritieswill result in significant fines being imposed upon us or result in adverse publicity, or require us tochange our commercial practices or whether related private lawsuits could require us to pay significantamounts in damages. Any of these outcomes could limit our competitiveness and adversely affect ouroperating results.
You should read Item 8, ‘‘Financial Information—Consolidated Statements and Other FinancialInformation—Legal proceedings’’ for additional information.
We are engaged in a highly competitive business. Adverse actions by our competitors or other changes in thecompetitive environment may adversely affect our results of operations.
The non-alcoholic beverages business is highly competitive in each of our countries. We competewith, among others, bottlers of other international or regional brands of non-alcoholic beverages, someof which are aggressively expanding in some of our territories. We also face significant competitionfrom private label brands of large retail groups. A change in the number of competitors, the level ofmarketing or investment undertaken by our competitors, or other changes in the competitiveenvironment in our markets may cause a reduction in the consumption of our products and in ourmarket share, and may lead to a decline in our revenues and/or an increase in our marketing orinvestment expenditures, which may materially and adversely affect our results of operations.Competitive pressure may also cause channel and product mix to shift away from our more profitablepackages and channels, for example the immediate consumption channel.
15
In particular, we face intense price competition, especially in our emerging and developingcountries, from producers of local non-premium non-alcoholic, ready-to-drink beverages brands, whichare typically sold at prices lower than ours. In addition, we face increasing price competition fromcertain large retailers that sell private label products in their outlets at prices that are lower than ours,especially in countries with a highly concentrated retail sector. In some of our countries, we are alsoexposed to the effect of imports from adjacent countries of lower priced products, including, in somecases, trademarked products of The Coca-Cola Company bottled by other bottlers in the Coca-Colabottling system. The entry into the EU of all but one of our developing countries, as well as that ofRomania and Bulgaria, has increased the exposure of such countries to such imports from other EUcountries. In addition, the enlargement of the EU could lead to increased imports by wholesalers andlarge retailers of products produced and sold by us in any of these countries for resale at lower pricesin our other territories, particularly our established countries, where the prices of our products aregenerally higher than in most of our developing countries. While this practice would not affect oursales volume overall, it could put pressure on our pricing in the countries that receive such imports oflower priced products.
If there is a change in our competitors’ pricing policies, an increase in the volume of cheapercompeting products imported into our countries or the introduction of new competing products orbrands, including private label brands, and if we fail to effectively respond to such actions, we may losecustomers and market share and/or the implementation of our pricing strategy may be restricted, inwhich case our results of operations will be adversely affected.
The increasing concentration of retailers and independent wholesalers, on which we depend to distribute ourproducts in certain countries, could lower our profitability and harm our ability to compete.
We derive, particularly in our established countries, a large and increasing proportion of ourrevenues from sales of our products either directly to large retailers, including supermarkets andhypermarkets, or to wholesalers for resale to smaller retail outlets. We expect such sales to continue torepresent a significant portion of our revenues. Most of our countries are experiencing increasedconcentration in the retail and wholesale sectors, either because large retailers and wholesalers areexpanding their share in the relevant market, or as a result of increased consolidation among largeretailers and wholesalers.
We believe that such concentration increases the bargaining power of large retailers andwholesalers. Our products compete with other non-alcoholic beverage brands for shelf space in retailstores and with other fast-moving consumer goods for preferential in-store placement. Our retailer andwholesaler customers also offer other products, sometimes including their own brands that competedirectly with our products. These large retailers and wholesalers could use their increasing marketpower in a way that could lower our profitability and harm our ability to compete.
16
Changes in how significant customers market or promote our products could reduce sales volumes.
Our revenue is impacted by how large retailers, such as supermarket and hypermarket chains, andindependent wholesalers market or promote our products. Revenue may, for example, be negativelyimpacted by unfavorable product placement at points of sale or less aggressive price promotions bylarge retailers or independent wholesalers, particularly in future consumption channels. Brand imagemay be negatively affected by aggressive price positioning close to that of non-premium products andprivate labels. Although we seek to engage our large retail and independent wholesale customers toachieve favorable product placement and in the development and implementation of marketing andpromotional programs, our sales volumes, revenues and profitability may be adversely impacted by themanner in which large retailers or independent wholesalers engage in the marketing or promotion ofour products. In addition, there can be no assurance that our large retailer and independent wholesalercustomers, who often act for us, our competitors and themselves, will not give our competitors, or theirproducts, higher priority, thereby reducing their efforts to sell our products.
Risks relating to prevailing economic conditions
The Greek government debt crisis and the associated impact on the economic and fiscal prospects of Greeceand other EU countries in which we operate could have a material adverse effect on our business.
Greece, which accounted for approximately 7% of our unit case sales volume and approximately8% of our consolidated operating profit in 2010, is currently facing a severe economic crisis resultingfrom significant government fiscal deficits and high levels of government borrowing. The currentpolitical, economic and budgetary challenges that the Greek government faces with respect to its highpublic debt burden and Greece’s weakening economic growth prospects have led to a downgrade onApril 27, 2010 by Standard & Poor’s Ratings Services of Greece’s long- and short-term sovereign creditratings to ‘BB+’ and ‘B’, respectively, and Greece was characterized as credit watch negative onDecember 2, 2010. Additionally, on March 7, 2011, Moody’s Ratings Services downgraded Greece’ssovereign credit rating to Ba1 from B1. Greece faces increasing pressures for more aggressive andwide-ranging fiscal retrenchment, including increases in taxation. A further tightening of thegovernment’s multiyear fiscal consolidation program is likely under the European Monetary Union /International Monetary Fund agreement, which will further depress Greece’s medium-term economicgrowth prospects.
Other countries in which we operate face similar economic conditions. Italy accounted forapproximately 15% of our unit case sales volume in 2010. In May 2010, the Italian governmentannounced significant reductions in public expenditure, designed to reduce the fiscal deficit to 3% orless of gross domestic product by 2012. The Republic of Ireland accounted for approximately 2% ofour unit case sales volume in 2010. In November 2010, the Irish government agreed a rescue packagewith the European Union and International Monetary Fund that requires severe fiscal austerity. Suchmeasures are likely to negatively impact GDP and employment. The economic crisis, the measuresaimed at addressing such crisis and the consequences thereof could adversely affect the results of ourlocal operations and on a consolidated basis.
17
These measures are likely to reduce disposable income and discretionary spending by customers inour countries of operation located within the EU, and could adversely affect the tourism industry,which could result in a reduced demand for our products. Further, the governments’ fiscal measureshave resulted and may continue to result in increased taxation on our business, which would reduce ourprofits. Finally, the European sovereign debt crisis may create a downward pressure on the euro,resulting in an increase in the prices we must pay for certain raw and packaging materials which arepriced in other currencies (principally US dollars), which will depress our profit margins if we areunable to recover these additional operating costs from our customers through market-based activities.Any one or a combination of these factors may have a material effect on our results of operations andfinal condition.
Negative financial and economic conditions could lead to reduced demand for our products.
Negative financial and economic conditions in many countries in which we operate has led andcould continue to lead to reduced demand for our products, or an increase in price discount activity, orboth, which would have a negative impact on our financial position, results of operations and cashflows. Governments have been facing greater pressure on public finances, leading to risk of increasedtaxation. These factors may also lead to intensified competition for market share and available marginas well as reduced tourist activity, with consequential potential adverse effects on volumes. Negativefinancial and economic conditions may have a negative impact on our customers and other parties withwhom we do, or may do, business.
Consumers’ disposable income appears to have come under pressure in several of our key marketsas a result of price increases for fuel and food, among other things. Such price increases, along withlocal economic disruptions and economic uncertainty more generally, have also adversely affectedconsumer sentiment, which may further dampen discretionary spending over time. To the extent thatthis proves to be the case, sales volumes and pricing strategies in certain of our key markets may beadversely affected for an indeterminate period of time.
Increased taxation on our business may reduce our profitability.
We are subject to a myriad of taxes across each of the jurisdictions in which we operate. Theimposition of new taxes, or increases in taxes on our products, may have a material adverse effect onour business, financial condition, prospects and results of operations. The severe fiscal crises currentlyimpacting many of our countries have resulted in increased taxation on our business. In particular,pursuant to Article 5 of Law 3845/2010, on May 6, 2010, the Greek government imposed an‘Extraordinary Contribution of Social Responsibility’ on net income for the fiscal year endedDecember 31, 2009. The amount of the ‘Extraordinary Contribution of Social Responsibility’ assessedfor 2009 was A21.2 million, which we recorded as a tax charge in 2010. Further fiscal measures maycontinue to result in increased taxation on our business, which would reduce our profits. Governmentsmay also enact or increase taxes that apply to the sale, or production, of our products. Higher taxes onthe sale of our products, in the form of excise or other consumption taxes, could lead to increasedprices, which in turn may adversely affect the sale and consumption of our products and reduce ourrevenues and profitability. Government imposed deposits or taxes on glass and/or metal packagingmaterial, and/or other materials used in our business, would also reduce our profitability.
18
The global financial and credit crisis and the Greek government debt crisis may have impacts on our liquiditythat currently cannot be predicted, and increasing interest rates may affect our ability to obtain credit.
The credit crisis and related turmoil in the global financial systems as well as, the Greekgovernment debt crisis, may have a material impact on our liquidity and financial condition, and wemay ultimately face major challenges if conditions do not improve. If the capital and credit marketsexperience volatility and the availability of funds becomes limited to us, then we may face increasedinterest rates and incur other costs associated with debt financings and our ability to access the capitalmarkets or borrow money may become restricted at a time when we would like, or need, to raisecapital, which could have an adverse impact on our flexibility to react to changing economic andbusiness conditions, as well as on our ability to fund our operations and capital expenditures in thefuture, on our growth rate and shareholder returns. Decreases in the funded levels of our pension plansmay also increase pension funding requirements. In this context, changes in our credit rating couldhave a material adverse effect on our interest costs and financing sources. Our credit rating can bematerially influenced by a number of factors including, but not limited to, acquisitions, investmentdecisions, and capital management activities. While the ultimate outcome and impact of the currentcrises cannot be predicted, they may have a material adverse effect on our future liquidity.
Risks relating to our business
We rely on the reputation of our brands.
Our success depends on our ability to maintain and enhance the image and reputation of ourexisting products and to develop a favorable image and reputation for new products. An event, orseries of events, that materially damages the reputation of one or more of our brands could have anadverse effect on the value of that brand and subsequent revenues from that brand or business.
Contamination or deterioration of our products could hurt our reputation and depress our revenues.
The contamination or deterioration of our products, whether actual or alleged, deliberate oraccidental, could harm our reputation and business. A risk of contamination or deterioration existsduring each stage of the production cycle, including during the production and delivery of rawmaterials, the bottling and packaging of our products, the stocking and delivery of our products toretailers and wholesalers, and the storage and shelving of our products at the final points of sale. Anysuch contamination or deterioration could result in a recall of our products and/or criminal or civilliability could restrict our ability to sell our products which, in turn, could have a material adverseeffect on our business and prospects. These events, including incidents involving other bottlers of TheCoca-Cola Company’s products, could also materially and adversely impact our competitiveness andrevenues by harming the reputation of The Coca-Cola Company’s brands.
Adverse weather conditions and reduced tourist activity could reduce demand for our products.
Demand for our products is affected by weather conditions in the countries in which we operate.Consumption is particularly strong during the second and third quarters when demand rises due towarmer weather and, in some of our countries, increased tourist activity. As a result, unseasonably cooltemperatures in our countries or reduced tourist activity in certain countries could adversely affect oursales volume and the results of our operations for the year.
19
Climate change may negatively affect our business.
There is increasing concern that a gradual increase in global average temperatures due toincreased concentration of carbon dioxide and other greenhouse gases in the atmosphere will causesignificant changes in weather patterns around the globe and an increase in the frequency and severityof natural disasters. Decreased agricultural productivity in certain regions as a result of changingweather patterns may limit availability or increase the cost of key agricultural commodities, such assugarcane, corn, beets, citrus, coffee and tea, which are important ingredients for our products.Increased frequency or duration of extreme weather conditions could also impair productioncapabilities, disrupt our supply chain or impact demand for our products. Climate change may alsoexacerbate water scarcity and cause a further deterioration of water quality in affected regions, whichcould limit water availability for our operations. In addition, public expectations for reductions ingreenhouse gas emissions could result in increased energy, transportation and raw material costs andmay require us to make additional investments in facilities and equipment. As a result, the effects ofclimate change could have a long-term adverse impact on our business and results of operations.
Miscalculation of infrastructure investment needs could impact our financial results.
Our projected requirements for infrastructure investments may differ from actual levels ifanticipated sales volume growth does not materialize. We have, in the past, invested substantially inproduction capacity and sales and distribution infrastructure, particularly in our key emerging countries.Such infrastructure investments are generally long-term in nature and it is possible that investmentsmay not generate expected returns due to changes in the marketplace. Significant changes from ourexpected returns on cold drink equipment, fleet, technology and supply chain infrastructure investmentscould adversely affect our financial results.
Technology failures could disrupt our operations and negatively impact our business.
We increasingly rely on information technology, or IT, systems to process, transmit and storeelectronic information. For example, our production and distribution facilities and inventorymanagement all utilize IT to maximize efficiencies and minimize costs. Furthermore, a significantportion of the communication between personnel, customers and suppliers depends on IT.
If we do not allocate and effectively manage the resources necessary to build and sustain theproper IT infrastructure, we could be subject to transaction errors, processing inefficiencies, customerservice disruptions and, in some instances, loss of customers. Challenges relating to the building of newIT structures can also subject us to certain errors, inefficiencies, disruptions and, in some instances, lossof customers. Our IT systems may also be vulnerable to a variety of interruptions due to events beyondour control, including, but not limited to, natural disasters, terrorist attacks, telecommunicationsfailures, computer viruses, hackers and other security issues. Although we have security initiatives anddisaster recovery plans in place to mitigate our risk to these vulnerabilities, such measures may nothave been effectively implemented or may not be adequate to ensure that our operations are notdisrupted.
Disruptions to our supply or distribution infrastructure could adversely affect our business.
We depend on effective supply and distribution networks to obtain necessary inputs for ourproduction processes and to deliver our products to our customers. Damage or disruption to our supplyor distribution capabilities due to weather, natural disaster, fire, loss of water or power supply,terrorism, political instability, military conflict, pandemic, strikes, the financial and/or operationalinstability of key suppliers, distributors, warehousing and transportation providers or brokers, or otherreasons, could impair our ability to manufacture or sell our products.
20
Although the risk of such disruptions is particularly acute in our emerging countries, wheredistribution infrastructure is relatively undeveloped, our developed and established country operationsare also subject to such risks. In Greece, for example, which is one of our key markets, generaltransportation strikes in 2008 and 2010 limited our ability to fulfill customer orders for several weeks,particularly in our higher margin immediate consumption channels. The current economic crisis inGreece may result in similar events.
To the extent we are unable to effectively manage such events if they occur, or cannot financiallymitigate the likelihood or potential impact of such events, there could be a materially adverse effect onour business and results of operations.
Price increases in, and shortages of, raw materials and packaging materials could materially and adverselyaffect our results of operations.
Our results of operations may be affected by the availability and pricing of raw materials andpackaging materials, including water, sugar and other sweeteners, juice concentrates, glass, labels,plastic resin, closures, plastic crates, aluminum, aseptic packages and other packaging products andingredients, some of which are priced in currencies other than the functional currencies of ouroperating companies.
Water, in particular, is the main ingredient in substantially all of our products. As demand forwater continues to increase around the world and as the quality of available water deteriorates, we mayincur increasing production costs or face capacity constraints. Sugar is also a primary ingredient inmany of our products and has recently experienced significant price increases.
The supply and price of raw materials and packaging materials used for the production of ourproducts can be affected by a number of factors beyond our control, including the level of cropproduction around the world, global supply and demand, export demand, market fluctuations,speculative movements in the raw materials or commodities markets, exchange rates, currency controls,government regulations and legislation affecting agriculture, adverse weather conditions, economicfactors affecting growth decisions, various plant diseases and pests.
We cannot predict future availability, or prices, of the raw materials or commodities required forour products. The markets for certain raw materials or commodities have experienced, and willcontinue to experience, shortages and significant price fluctuations. The foregoing may affect the priceand availability of ingredients that we use to manufacture our products, as well as the cans and bottlesin which our products are packaged.
In addition, changes in global supply and demand, market fluctuations, weather conditions,government controls, exchange rates, currency controls and other factors may substantially affect theprice of both raw and packaging materials. A substantial increase in the prices of these materials willincrease our operating costs, which will depress our profit margins if we are unable to recover theseadditional operating costs from our customers. Although supply agreements and derivative financialinstruments can protect against increases in raw material and commodities costs, they can not providecomplete protection over the longer term. Moreover, since hedging instruments establish a purchaseprice for the applicable commodities in advance of the time of delivery, it is possible that we maybecome locked into prices that are ultimately higher than the actual market price at the time ofdelivery.
21
A sustained interruption in the supply of raw materials and packaging materials could also lead toa significant increase in the price of such materials or could impede our production process if we areunable to find suitable substitutes. In each case, this could have a materially adverse effect on ourresults of operations. You should read Item 4, ‘‘Information on the Company—Business Overview—Raw materials’’ and Item 5, ‘‘Operating and Financial Review and Prospects—Principal factors affectingthe results of our operations—Raw material costs’’ for additional information on our procurement ofpackaging and raw materials and the cost of raw materials.
Increase in the cost of energy could affect our profitability.
We use a significant amount of electricity, natural gas and other energy sources to operate ourbottling plants and, in some of our countries, to operate fleets of motor vehicles. A substantial increasein the price of fuel and other energy sources would increase our costs and, therefore, could negativelyimpact our profitability. We are particularly reliant on natural gas exports from the Russian Federationand would be particularly affected by any restriction of natural gas exports from that country.
Fluctuations in exchange rates may adversely affect the results of our operations and financial condition.
We derive a portion of our revenues from countries that have functional currencies other than ourreporting currency, the euro. As a result, any fluctuations in the values of these currencies against theeuro impact our income statement and balance sheet when results are translated into euro. If the euroappreciates in relation to these currencies, then the euro value of the contribution of these operatingcompanies to our consolidated results and financial position will decrease.
We incur currency transaction risks whenever one of our operating companies enters into either apurchase or sale transaction using a currency other than its functional currency. In particular, wepurchase raw materials which are priced predominantly in euro and US dollars, while we currently sellour products in countries other than Austria, Cyprus, Estonia, Greece, Italy, Montenegro, the Republicof Ireland, Slovakia and Slovenia, in local currencies. Although we do use financial instruments toattempt to reduce our net exposure to currency fluctuations, there can be no assurance that we will beable to successfully hedge against the effects of this foreign exchange exposure, particularly over thelong term. We attempt to reduce our currency transaction risk, where possible, by matching currencysales revenue and operating costs. Given the volatility of currency exchange rates, we cannot assure thatwe will be able to manage our currency transaction risks effectively or that any volatility in currencyexchange rates will not have a material and adverse effect on our financial condition or results ofoperations.
We are exposed to the impact of exchange controls, which may adversely affect our profitability or our abilityto repatriate profits.
The currencies of Nigeria, the Russian Federation, Bulgaria, Ukraine, Serbia, Armenia, Bosnia andHerzegovina, Belarus and Moldova can only be converted in limited amounts or for specified purposesestablished by their governments. These countries represented approximately 35% of our net salesrevenue in 2010. In countries where the local currency is convertible only within prescribed limits or forspecified purposes, it may be necessary for us to comply with exchange control formalities and toensure that all relevant permits are obtained before we can repatriate profits of our subsidiaries inthese countries. Such controls may have a material adverse effect on our profitability or on our abilityto repatriate profits that we earn out of these countries.
22
Our operations are subject to extensive regulation, including resource recovery, environmental and health andsafety standards. Changes in the regulatory environment may cause us to incur liabilities or additional costsor limit our business activities.
Our production, sales and distribution operations are subject to a broad range of regulations,including environmental, trade, labor, production, food safety, advertising and other regulations.Governments may also enact or increase taxes that apply to the sale of our products. More restrictiveregulations or higher taxes could lead to increasing prices, which in turn may adversely affect the saleand consumption of our products and reduce our revenues and profitability. You should read Item 4,‘‘Information on the Company—Business Overview—Regulation’’ for additional information on theregulations to which we are subject.
Some environmental laws and regulations may result in significant additional costs or diminish ourability to formulate and implement marketing strategies that we believe could be more effective, suchas the use of a particular packaging material or method. A number of governmental authorities in thecountries in which we operate have adopted, considered or are expected to consider legislation aimedat reducing the amount of discarded waste. Such programs have included, for example, requiring theattainment of certain quotas for recycling and/or the use of recycled materials, imposing deposits ortaxes on plastic, glass or metal packaging material and/or requiring retailers or manufacturers to takeback packaging used for their products. Such legislation, as well as voluntary initiatives similarly aimedat reducing the level of waste, could require us to incur greater costs for packaging and set higherwholesale prices to cover these incremental costs, which could be passed on to consumers and hurt oursales. In addition, such legislation could prevent us from promoting certain forms of profitablenon-returnable packages or could otherwise adversely impact our business and prospects. For additionalinformation, see Item 4, ‘‘Information on the Company—Business Overview—Environmental matters’’.
In addition, we are subject to a broad range of environmental, health and safety laws andregulations in each of the countries in which we operate. They relate to, among other things, wastewater discharges, air emissions from solvents used in coatings, inks and compounds, the use andhandling of hazardous materials and waste disposal practices. If we fail to comply with applicableenvironmental standards, we may face liabilities. In the event of gradual pollution, potential liabilitiescould be greater for which insurance policies are not readily available in the insurance market.However, we do hold insurance coverage restricted to third party bodily injury and/or property damagein respect of sudden, identifiable, unintended and unexpected incidents.
Environmental regulations are becoming more stringent in many of the countries in which weoperate. In particular, governments and public interest groups are becoming increasingly aware of andconcerned about the public health and environmental consequences of carbon dioxide emissions. Theintroduction of regulation seeking to restrict carbon dioxide emissions, as well as our own commitmentto social and environmental responsibility, might require increased investment in energy conservationand emissions reduction technologies, both at the production stage and with respect to our coolerinfrastructure, which may result in increased capital expenditure, greater operating costs, or both.
The enlargement of the EU in 2004 and in 2007 has resulted in the application of EU labor, tax,accounting and environmental regulations in eleven additional countries in which we operate. Thiscould lead to an increase in our compliance costs and make compliance more complicated, at least inthe short-term.
23
Other risks relating to an investment in our ordinary shares or ADSs
You may not be able to enforce judgments against us or some of our directors or officers.
We are incorporated under the laws of Greece. Substantially all of our assets are located outsidethe United States. In addition, the majority of our officers and directors are residents of countriesother than the United States. As a result, you may not be able to effect service of process within theUnited States upon these persons or enforce a US court judgment based on civil liabilities under theUS federal securities laws against us or these persons. Courts outside the United States, including inGreece, may decide not to impose civil liability on us, our directors or our officers for a violation ofthe federal securities laws of the United States. In addition, there is uncertainty as to the enforceabilityin Greece of judgments of United States courts because such enforcement is subject to ascertainmentby the Greek courts of a number of conditions, including that the foreign court has jurisdiction underGreek law and that the judgment is not contrary to good morals and public policy, as determined byGreek courts. In addition, it is uncertain if a Greek court would apply the federal laws of the UnitedStates in any action brought before such court. You may therefore not be able to enforce certain USjudgments in civil and commercial matters against us or some of our officers or directors.
Sales of substantial amounts of our ordinary shares by Kar-Tess Holding or The Coca-Cola Company Entitiesor the perception that such sales could occur, could adversely affect the market value of our ordinary shares orADSs.
Kar-Tess Holding and The Coca-Cola Company Entities have agreed among themselves tomaintain their combined shareholding until January 2014 at no less than 44% of our outstanding sharecapital (and at no less than 40% of our outstanding share capital thereafter, until expiration of theshareholders’ agreement). Kar-Tess Holding and The Coca-Cola Company Entities have also agreed tomaintain their individual shareholdings until January 2014 at no less than 22% of our outstanding sharecapital (and at no less than 20% of our outstanding share capital thereafter until expiration of theshareholders’ agreement). The current term of the shareholders’ agreement extends to December 2018,after which either group of parties may terminate it on three months’ written notice. However, Kar-TessHolding and The Coca-Cola Company Entities may sell additional ordinary shares in our company,subject only to the limitations set forth in their shareholders’ agreement. Under the shareholders’agreement, Kar-Tess Holding or The Coca-Cola Company Entities may consent to sales of ordinaryshares by the other party at any time. Sales of substantial amounts of our ordinary shares or ADSs inthe public market by Kar-Tess Holding or The Coca-Cola Company Entities, or the perception thatsuch sales could occur, could adversely affect the market price of our ordinary shares or ADSs andcould adversely affect our ability to raise capital through future capital increases.
The euro/US dollar exchange rate could adversely affect the market price of our ordinary shares and the USdollar value of dividends we pay in respect of our ordinary shares and ADSs.
The price of our ordinary shares is quoted in euro. Movements in the euro/US dollar exchangerate may affect the US dollar price of our ADSs and the US dollar equivalent of the price of ourordinary shares. We will calculate and pay any cash dividends in euro. As a result, exchange ratemovements will affect the US dollar amount of dividends that you will receive from the Depositary ifyou hold ADSs.
24
Pre-emptive rights may not be available to you and, as a result, your investment could be diluted.
Under Greek law, prior to the issue of any class of shares, a company incorporated in Greece isrequired to offer existing holders of such class of shares pre-emptive rights to subscribe and pay forsufficient new shares to maintain their existing ownership percentages. US holders of our ADSs orordinary shares may not be able to exercise pre-emptive rights for new ordinary shares unless aregistration statement under the US Securities Act of 1933 is effective with respect to such rights andnew ordinary shares, or an exemption from the registration requirements is available. Our decision tofile a registration statement will depend on the costs and potential liabilities associated with any suchregistration statement, the perceived benefits to us of enabling US holders of our ADSs or ordinaryshares to exercise their pre-emptive rights and any other facts, which we consider appropriate at thetime. To the extent that US holders of our ADSs or ordinary shares are not able to exercisepre-emptive rights granted in connection with an issue of our ordinary shares, their proportionalshareholding in our company would be diluted.
The Athens Exchange may be less liquid than other major exchanges, and may exhibit volatility, which mayadversely affect your ability to trade our ordinary shares.
The principal trading market for our ordinary shares is the Athens Exchange. The AthensExchange may be less liquid than major markets in Western Europe and the United States. As a result,shareholders may have difficulty buying and selling our ordinary shares, especially in large numbers. In2010, the average daily trading volume on the Athens Exchange was approximately A139.4 million andthe average daily trading volume of our ordinary shares on the Athens Exchange was approximatelyA6.2 million. By comparison, in 2009, the average daily trading volume on the Athens Exchange wasapproximately A205.7 million and the average daily trading volume of our ordinary shares on theAthens Exchange was approximately A5.3 million.
In addition, stock markets in general, including the Athens Exchange, can be highly volatile. Youmay not be able to trade large amounts of our ordinary shares or ADSs during or following periods ofvolatility. You should read Item 9, ‘‘The Offer and Listing—Offer and Listing Details’’ for additionalinformation on the Athens Exchange.
Greek corporate law and our articles of association may not grant you certain of the rights and protectionsgenerally afforded to shareholders of US companies under US federal and state laws.
The rights provided to our shareholders under Greek corporate law and our articles of associationdiffer in certain respects from the rights that you would typically enjoy as a shareholder of a UScompany under applicable US federal and/or state laws. For example, only shareholders holding aminimum of 5% of our share capital may ask for an inspection of our corporate records, while underDelaware corporate law any shareholder, irrespective of the size of his or her shareholdings, may do so.Furthermore, we will generally be exempt from the US Securities Exchange Act of 1934 rules regardingthe content and furnishing of proxy statements to our shareholders. In particular, the notice to ageneral meeting of the shareholders of a Greek company typically sets forth only the items on theagenda for this meeting but it does not include management’s recommendations with respect to suchitems. Accordingly, if you participate in a general meeting of our shareholders through a representative,you may not be able to give him or her voting instructions with advance knowledge of management’sposition on the items included in the agenda for that meeting.
25
Under Greek corporate law, shareholders are also unable to initiate a derivative action, a remedytypically available to shareholders of US companies, in order to enforce a right of our company, in casewe fail to enforce such right ourselves. In addition, a majority of more than 75% of our shareholdersmay release a director from any liability, including if he or she has acted in bad faith or has breachedhis or her duty of loyalty, provided that two years have lapsed since the cause of action arose againstsuch director. In contrast, most US federal and state laws prohibit a company from releasing a directorfrom liability if he or she has acted in bad faith or has breached his or her duty of loyalty. Ourdirectors, officers and principal shareholders will also be exempt from the reporting and the short-swingprofit recovery provisions contained in Section 16 of the US Securities Exchange Act of 1934. However,these persons are and will continue to be required to comply with applicable Greek legislationprohibiting insider dealing. Finally, Greek corporate law imposes a particular set of restrictions on theability of a Greek company to repurchase its own shares, which could be more restrictive than theshare repurchase regime applicable to US companies, and does not provide for any kind of appraisalrights in the case of a business combination.
26
For additional information on these and other aspects of Greek corporate law and our articles ofassociation, you should read Item 9, ‘‘The Offer and Listing—Markets—Market regulation,’’ Item 10,‘‘Additional Information—Share Capital’’ and Item 10, ‘‘Additional Information—Memorandum andArticles of Association’’. As a result of these differences between Greek corporate law and our articlesof association, and US federal and state laws, in certain instances you could receive less protection as ashareholder of our company than you would as a shareholder of a US company.
ADS holders may not be able to exercise voting rights or receive distributions as readily as holders of ordinaryshares.
Holders of ADSs who would like to vote their underlying shares at our general meetings mustinstruct Citibank N.A. as Depositary on how to vote these underlying shares. Neither we nor CitibankN.A. as Depositary can guarantee that you will receive the notice for the general meeting or any votingmaterials provided by Citibank N.A. in time to ensure that you instruct Citibank N.A. to vote theordinary shares underlying your ADSs. In addition, Citibank N.A. and its agents are not responsible forfailure to carry out voting instructions or for the manner of carrying out voting instructions. Therefore,there is a risk that your vote may not be carried out in the manner intended and, in such instance,there is no recourse. In addition, you may not receive the distributions we make on our ordinary sharesor any value for them if it is illegal or impracticable for Citibank N.A. to make them available to you.
ITEM 4 INFORMATION ON THE COMPANY
A. History and Development of the Company
We were formed through the combination of Hellenic Bottling Company S.A. and Coca-ColaBeverages plc on August 9, 2000.
Hellenic Bottling Company S.A., a corporation incorporated under the laws of Greece in 1969, washeadquartered in Athens. In 1981, Kar-Tess Holding acquired a 99.9% interest in Hellenic BottlingCompany S.A. The shares of Hellenic Bottling Company S.A. were listed on the Athens Exchange inJuly 1991 and it became the largest non-financial company listed on the Athens Exchange. TheKar-Tess Group held an interest of approximately 68.6% in Hellenic Bottling Company S.A.immediately prior to its acquisition of Coca-Cola Beverages plc in August 2000.
Hellenic Bottling Company S.A.’s original territory was Greece, where The Coca-Cola Companygranted it bottling rights in 1969. After 1981, Hellenic Bottling Company S.A. expanded its businessthrough acquisitions and, immediately prior to the acquisition of Coca-Cola Beverages plc, operatedbottling plants in 11 countries having an aggregate population of approximately 200 million. HellenicBottling Company S.A. had operations in Greece, Bulgaria, Armenia, the Former Yugoslav Republic ofMacedonia (through an equity investment), Serbia, Montenegro, Northern Ireland, the Republic ofIreland, Nigeria, part of Romania, Moldova and part of the Russian Federation (through an equityinvestment).
26
In July 1998, Coca-Cola Amatil Limited, an Australian-based bottler of the products of TheCoca-Cola Company, de-merged its European operations, resulting in the formation of Coca-ColaBeverages plc. These territories consisted of Austria, Switzerland, Croatia, the Czech Republic,Hungary, Poland, Slovakia, Slovenia, Belarus, Bosnia and Herzegovina, part of Romania and Ukraine.Coca-Cola Beverages plc also acquired the Northern and Central Italian bottling operations of TheCoca-Cola Company. As a result, immediately prior to its acquisition by Hellenic BottlingCompany S.A., Coca-Cola Beverages plc had bottling operations in 13 countries with an aggregatepopulation of approximately 200 million. Coca-Cola Beverages plc was incorporated under the laws ofEngland and Wales and was listed on the London Stock Exchange, with a secondary listing on theAustralian Stock Exchange. Immediately prior to Coca-Cola Beverages plc’s acquisition by HellenicBottling Company S.A., The Coca-Cola Company held, directly and indirectly, a 50.5% interest inCoca-Cola Beverages plc, The Olayan Group, a diversified multinational Saudi Arabian group whichholds an interest in the bottler of products of The Coca-Cola Company for Saudi Arabia, held a 10.8%interest, while the remainder of Coca-Cola Beverages plc’s shares were publicly held.
Following the acquisition of Coca-Cola Beverages plc, Hellenic Bottling Company S.A. wasrenamed Coca-Cola Hellenic Bottling Company S.A. and became the second largest bottler of productsof The Coca-Cola Company in the world at that time, based on sales volume. We retained ourheadquarters in Athens and our shares were listed on the Athens Exchange, with secondary listings onthe London Stock Exchange and the Australian Stock Exchange.
On November 23, 2001, we purchased from The Coca-Cola Company all of its wholly owned andmajority owned bottling operations in the Russian Federation through the purchase of the Cyprusholding company, Star Bottling Limited and LLC Coca-Cola Stavropolye Bottlers. The Russianoperating subsidiary of Star Bottling Limited is LLC Coca-Cola HBC Eurasia following the mergerof LLC Coca-Cola Vladivostok Bottlers in 2005. In addition, on the same date we also purchased TheCoca-Cola Company’s 40% interest in Coca-Cola Molino Beverages Limited, a company in which wealready held the remaining 60%. As a result of this acquisition, we gained the exclusive rights to selland distribute products of The Coca-Cola Company throughout the Russian Federation. On January 2,2002, we completed the acquisition from The Coca-Cola Company of its bottling operations in theBaltic countries of Lithuania, Estonia and Latvia.
On April 5, 2006, we successfully completed the tender offer for the outstanding share capital ofLanitis Bros Public Limited (subsequently renamed Lanitis Bros Limited), a beverage company inCyprus, with a strong portfolio of products, including those of The Coca-Cola Company, as well as itsown juice and dairy products. Following completion of the tender offer, we acquired 95.43% of theshare capital of Lanitis Bros Limited. The total consideration paid for these shares was A71.5 million(excluding acquisition costs) with the assumption of debt of an additional A5.6 million. Followingcompletion of the tender offer, we initiated a mandatory buy-out process in accordance with Cypriotlaw for the purposes of acquiring the remaining shares in Lanitis Bros Limited. Lanitis Bros Limitedwas subsequently delisted from the Cyprus Stock Exchange. Subsequent to the date of acquisition andup to December 31, 2006, we acquired an additional 11,218,735 shares representing 4.48% of the sharecapital of Lanitis Bros Limited for a total consideration of A3.4 million, bringing our equity ownershipto 99.91%. Effective March 28, 2008, we sold the ‘‘Lanitis’’ juice trademarks to The Coca-ColaCompany. In December 2008, we acquired the remaining share capital of Lanitis Bros Limited,bringing our equity ownership to 100%.
On December 11, 2008, we acquired 100% of Socib S.p.A. and related entities, the second largestCoca-Cola franchise bottler in Italy. The franchise territory of Socib S.p.A. covers the southern Italianmainland plus Sardinia. The total consideration for the transaction was A209.3 million (excludingacquisition costs), which includes the assumption of debt of A38.9 million.
27
We listed our ADSs on the New York Stock Exchange on October 10, 2002. We believe that thislisting has increased our visibility to the international investment community and enhanced ourcomparability with our international peer group.
Since 2002, we have expanded our presence in the combined still and water beverages category.We acquired Romerquelle GmbH, an Austrian mineral water company (December 2003), Gotalkad.o.o., a Croatian mineral water company (January 2004), Bankya Mineral Waters Bottling CompanyEOOD, a Bulgarian mineral water company (June 2005), and we developed the NaturAqua mineralwater brand in Hungary (November 2002) and the Olimpja water brand in Bosnia (August 2004).
We acquired jointly with The Coca-Cola Company, Valser Mineralquellen AG, a Swiss mineralwater bottler (September 2002), Dorna Apemin S.A., Romania’s premier sparkling mineral watercompany (December 2002), Multivita sp. z o.o., a Polish mineral water company (October 2003),Vlasinka d.o.o., a Serbian mineral water company (April 2005), the Multon Z.A.O. group, a leadingRussian fruit juice producer (April 2005), Fresh & Co, a leading juice company in Serbia (March 2006)and Fonti del Vulture S.r.l., a producer of high quality mineral water in Italy with significant waterreserves (July 2006).
We also acquired a hot beverages vending operator in Hungary, Yoppi Kft. (August 2006), a directfull service vending company in Italy, Eurmatik S.r.l. (May 2007) and a company owning a newlyconstructed production facility in the Russian Federation, OOO Aqua Vision (September 2007).Eurmatik S.r.l. was subsequently sold in February 2011.
Our address is: 9 Fragoklissias Street, 151 25 Maroussi, Athens, Greece. Our telephone number is(011) 30 210 618 3100. We have appointed CT Corporation System, located at 111 Eighth Avenue,13th Floor, New York, NY 10011, USA, as our agent for service of process in any suit, action orproceeding with respect to our ordinary shares or ADSs and for actions under US federal or statesecurities laws brought in any US federal or state court located in The City of New York, Borough ofManhattan, and we have submitted to the jurisdiction of such courts. Our authorized representative inthe United States is Puglisi & Associates.
B. Business Overview
Overview
Our business and our products
Our business consists of producing, selling and distributing non-alcoholic beverages consistingprimarily of products of The Coca-Cola Company. We are one of the largest bottlers of non-alcoholicbeverages in Europe, operating in 28 countries with a total population of approximately 567 millionpeople (including our equity investment in Brewinvest S.A., a business engaged in the bottling anddistribution of beer and non-alcoholic beverages in Bulgaria and the Former Yugoslav Republic ofMacedonia). In 2010, we sold approximately 2.1 billion unit cases, generating net sales revenue ofA6.8 billion.
Our products include sparkling, still and water beverages. The combined still and water beveragescategory includes juices, waters, sports and energy drinks and other ready-to-drink beverages such asteas and coffees. In 2010, sparkling beverages category accounted for 66% and the combined still andwater beverages category accounted for 34% of our sales volume, as compared, respectively, to 66%and 34% in 2009 and 65% and 35%, respectively in 2008. We offer our products in a range of flavorsand package combinations which vary from country to country.
28
We are one of The Coca-Cola Company’s key bottlers, that is, bottlers in which The Coca-ColaCompany has a significant equity interest and which The Coca-Cola Company regards as strategicpartners based on factors such as size, geographical diversification and financial and managementresources. We believe that our success and the success of the products of The Coca-Cola Company inour markets, relies in large part upon the alignment of strategic objectives between us and TheCoca-Cola Company, with the two companies working together and combining their respective skillsand assets to maximize opportunities to increase sales and profits in the countries in which we operate.As part of this relationship, we work together with The Coca-Cola Company such that The Coca-ColaCompany has primary responsibility for consumer marketing and brand promotion, while we produce,sell and distribute the products of The Coca-Cola Company and execute customer marketing at thepoints of sale.
Under our bottlers’ agreements with The Coca-Cola Company, we have the right to produce andthe exclusive right, subject to certain limitations, to sell and distribute products of The Coca-ColaCompany in each of our territories. Sales of products of The Coca-Cola Company representedapproximately 96% of our total sales volume in 2010, with sales of products under the Coca-Colabrand, the world’s most recognized brand, representing approximately 38% of our total sales volume. Inaddition to Coca-Cola, our other core brands include Fanta, Sprite, Coca-Cola light (which we sell insome of our countries under the Diet Coke trademark) and Coca-Cola Zero. Our core brands togetheraccounted for approximately 60% of our total sales volume in 2010. We also produce, sell anddistribute a broad family of brands of other sparkling, still and water beverages which varies fromcountry to country. Together with The Coca-Cola Company, we are committed to exploring new growthopportunities by introducing new products and packages that satisfy the changing demands andpreferences of consumers in our markets.
Our markets
We group our countries into three reporting segments. The countries included in each segmentshare similar levels of political and economic stability and development, regulatory environments,growth opportunities, customers and distribution infrastructures. Our three reporting segments are asfollows:
• established countries, which are Italy, Greece, Austria, the Republic of Ireland, Northern Ireland,Switzerland and Cyprus;
• developing countries, which are Poland, Hungary, the Czech Republic, Croatia, Lithuania, Latvia,Estonia, Slovakia and Slovenia; and
• emerging countries, which are the Russian Federation, Romania, Nigeria, Ukraine, Bulgaria,Serbia (including the Republic of Kosovo), Montenegro, Belarus, Bosnia and Herzegovina,Armenia, Moldova and the Former Yugoslav Republic of Macedonia (through an equityinvestment).
Our strengths
World’s leading brands
We produce, sell and distribute Coca-Cola, the world’s leading brand of non-alcoholic beverages interms of sales volume and the world’s most recognized brand. The other brands licensed to us by TheCoca-Cola Company are also among the leading brands in their market categories. In particular,Coca-Cola light (Diet Coke), Sprite and Fanta, together with Coca-Cola, are four of the world’s fivebest selling non-alcoholic beverages in terms of sales volume.
29
Substantial scale benefits
We are the largest independent bottler of products of The Coca-Cola Company in the world interms of net sales revenue and the second largest in terms of volume. We operate in 28 countries witha total population of approximately 567 million. Our scale offers significant opportunities arising fromthe sharing of knowledge and best practices across our countries, procurement savings, andcoordination and optimization of investment planning, including capital expenditure.
Key bottler of The Coca-Cola Company
We are one of The Coca-Cola Company’s key bottlers, reflecting our strategic importance withinthe Coca-Cola bottling system. We work closely with The Coca-Cola Company, utilizing our respectiveskills and assets to maximize the opportunities to increase sales in our countries and, ultimately,increase value to our shareholders over the long-term. However, The Coca-Cola Company couldexercise significant influence over our profit margins by virtue of its rights under our bottlers’agreements to determine the price of concentrate we buy from The Coca-Cola Company and, to theextent permitted by local law, the maximum price we may charge to our customers outside theEuropean Economic Area.
Balanced portfolio of markets
Our established countries provide us with a stable source of revenues and cash flow, while ourdeveloping and emerging countries provide us with significant growth opportunities. This balance allowsus to minimize external financing of our long-term growth, reduce earnings volatility and limit ourexposure to the effects of potential economic or political instability in our developing and emergingcountries.
Significant markets with high growth potential
We believe that many of our developing and emerging countries are underdeveloped in terms ofsparkling, still and water beverages consumption. As the beverage of choice in our emerging anddeveloping countries continues to evolve from tap water and homemade drinks toward brandedsparkling, still and water beverages, we believe that we are well positioned to capture a substantialshare of this market growth. Not only is there an opportunity for sales revenue growth in thesecountries through increased market penetration, but countries such as Nigeria generally have a morefavorable demographic profile for sparkling beverages consumption since there are larger numbers ofyoung people who generally consume more sparkling beverages.
30
Modern business infrastructure
Since 2001, we have invested approximately A4.1 billion in property, plant and equipment, tomodernize our plant infrastructure and to expand the availability of cold drink equipment such ascoolers. As a result, we believe that we have the production capacity and distribution infrastructure tomeet volume growth at a relatively low incremental capital cost and to expand the availability of ourproducts, especially the more profitable single-serve packages.
In cooperation with Contour Global, a third-party developer of electric power and district heatingsystems, we have committed to build 15 combined heat and power units across 15 countries. We expectthat such units will collectively cut our direct CO2 emissions by more than 250,000 tons annually.Installing a combined heat and power unit generally improves the energy efficiency of the bottling plantit services by approximately 40%. By using quad-generation technology to recover food-grade CO2, ourbottling plants are able to further reduce their emissions by up to 40%. Combined heat and powerunits have become operational in Hungary, Romania, Northern Ireland and Italy. A further four unitsare near completion in Nigeria and Poland and are expected to become operational over the nexttwelve months.
Large and skilled sales force
We believe that we have one of the largest and best-trained sales forces in the non-alcoholicbeverages industry in each of our countries. This allows us to work closely and develop strongrelationships with our customers.
Experienced management
Our senior management team has extensive experience in the non-alcoholic beverages industry.This provides us with strong knowledge of the industry, familiarity with our customers, andunderstanding of the development, manufacture and sale of our products.
Our strategy
Our strategic objective is to maximize shareholder value over time. Our management uses four keymeasures to evaluate our performance: profitable volume growth, growth in operating profit, growth inadjusted EBITDA, and return on invested capital, or ROIC. Within this framework, in light of thecurrent financial and credit crisis, we are paying particular attention to volume, market share and cashgeneration. For further details on our calculation of ROIC, refer to Item 5, ‘‘Operating and FinancialReview and Prospects’’.
In order to achieve this objective we have set the following six main priorities:
• to increase our beverage categories in order to become a more diverse non-alcoholic beveragecompany;
• to build brand equity in order to create value for customers;
• to drive profitable package mix and exploit new channels in order to enhance margins;
• to manage capital for growth and value;
• to drive cost efficiency throughout our business; and
• to create superior sustainable returns.
31
Building capabilities
Our strategy starts with our people. We believe that our success to date is due in large part to ourexperienced management team and to the dedication and professionalism of our approximately42,500 employees. We intend to continue to build employee excellence by recruiting the best peopleand by providing intensive and ongoing training and career development. At the same time, we willcontinue to use our compensation system to closely align our employees’ incentives with theachievement of financial targets that enable us to meet our strategic objective of maximizingshareholder value over time.
Operating across 28 countries has taught us that our local employees are in the best position toevaluate the particular circumstances of each market category in which we are active and to address itsspecific needs. Accordingly, throughout our operations, responsibility and accountability for improvingperformance and delivering results is placed in the hands of those closest to the market, including ourcountry and local managers. We believe that this fosters a high degree of innovation and responsivenessto our customers.
Developing our markets by delivering superior customer service and quality products
The second key element of our strategy is to further develop each of our markets by deliveringsuperior customer service and quality products. Our blueprint for executing this strategy can besummarized in a simple formula: availability; affordability; acceptability; and activation.
Availability means placing our range of products within easy reach of consumers in the ‘‘right’’package, in the ‘‘right’’ location, at the ‘‘right’’ time. We focus on developing strong relationships withour customers in order to ensure that the ‘‘right’’ products are in stock, highly visible and readilyaccessible wherever and whenever consumers may desire a non-alcoholic beverage.
Affordability means offering a wide variety of desirable, premium quality products, in packagesappropriate for the occasion, at the ‘‘right’’ price. In doing so, we aim to reach as many consumers aspossible while taking into account the differing levels of purchasing power in the countries in which weoperate.
Acceptability means supplying an extensive and growing range of products that meet the highestquality standards in each country, enhancing their acceptability to consumers. Our experience in qualitycontrol, customer service and efficient distribution, combined with a detailed understanding ofconsumer needs and access to the most effective communications channels, allows us to reach out tocustomers and consumers in each of our markets and meet their demands.
Activation means motivating consumers to choose our products by improving product availabilityand attractiveness at the point of purchase and by building brand strength in our local markets. Weachieve this in close cooperation with our customers through the placement of cold drink equipment,such as coolers and vending machines, the provision of signage and other point-of-sale materials andthe implementation of local marketing and promotional initiatives.
Broadening our product range
Consumer preferences and demands are constantly evolving throughout our markets. In order tosatisfy these demands, we continuously build on our strong family of brands by introducing new flavorsand packages for our existing brands, launching existing brands in new markets and re-launching orreinvigorating existing brands where appropriate. In addition, in order to take full advantage ofopportunities in market categories with high growth potential, such as the combined still and waterbeverages category, we plan to continue to launch new products developed by The Coca-Cola Companyand pursue our strategy of recent years to both acquire (whether alone or together with The Coca-ColaCompany) and develop new local products to offer consumers more choice.
32
We believe our strategy of acquiring and developing promising new products has been successful todate. This strategy has resulted in our acquisition of Romerquelle GmbH, an Austrian mineral watercompany (December 2003), Gotalka d.o.o., a Croatian mineral water company (January 2004), BankyaMineral Waters Bottling Company EOOD, a Bulgarian mineral water company (June 2005), LanitisBros Limited, a Coca-Cola franchise bottler in Cyprus that included a significant juice and dairybusiness (April 2006), and our development of the NaturAqua mineral water brand in Hungary(November 2002) and the Olimpija water brand in Bosnia (August 2004). Our acquisition of OOOAqua Vision (September 2007), has also provided us with capabilities to produce a full range ofnon-alcoholic beverages in the key Moscow market, including sparkling beverages, fruit drinks andjuices, bottled water, ready-to-drink tea and sports drinks.
Jointly with The Coca-Cola Company, we have also acquired Valser Mineralquellen AG, a Swissmineral water bottler (September 2002), Dorna Apemin S.A., Romania’s premier sparkling mineralwater company (December 2002), Multivita sp. z o.o., a Polish mineral water company (October 2003),Vlasinka d.o.o., a Serbian mineral water company (April 2005), the Multon Z.A.O. group, a leadingRussian fruit juice producer (April 2005), Fresh & Co, a leading juice company in Serbia (March 2006)and Fonti del Vulture S.r.l., a producer of high quality mineral water in Italy (July 2006).
In addition, as part of our strategy of broadening out product range, by leveraging our distributioncapabilities, we have entered into several distribution agreements with third parties. You should readItem 4, ‘‘Information on the Company—Business Overview—Our products’’ for additional informationon third party products distributed by us.
Improving efficiency and optimizing use of capital
We have benefited from the increase in the size of our company over the past ten years:
• by centralizing our strategic procurement function, we have been able to reduce our costs of rawmaterials and packaging; and
• by implementing best practices across the company, we have been able to improve ourmanufacturing, sales and distribution systems.
We intend to continue taking advantage of these benefits of scale to improve the efficiency of ouroperations. We also intend to continue to balance investment in new production and distributioninfrastructure with improved utilization of existing capacity. We also continue to invest in advancedIT systems in some of our markets to enhance productivity.
At the same time, we intend to continue to manage our capital expenditure carefully by focusingour investment on more profitable areas of our business, such as cold drink equipment for use in theimmediate consumption channel. Our immediate consumption channels include restaurants and cafes,bars, kiosks, grocery stores, gas stations, sports and leisure venues and hotels. Products sold in ourimmediate consumption channels typically generate lower volume and higher margins per retail outletthan our future consumption channels. Through the careful management of our capital expenditure, theefficient deployment of our assets, including cold drink equipment and distribution infrastructure,across our countries and the use of appropriate financing arrangements, we aim to optimize theutilization of our capital.
We believe that considerable opportunities exist for sustained, profitable growth in our existingterritories. While we remain open to the possibility of acquiring new territories over time on anopportunistic basis, this does not currently form part of our core business strategy.
33
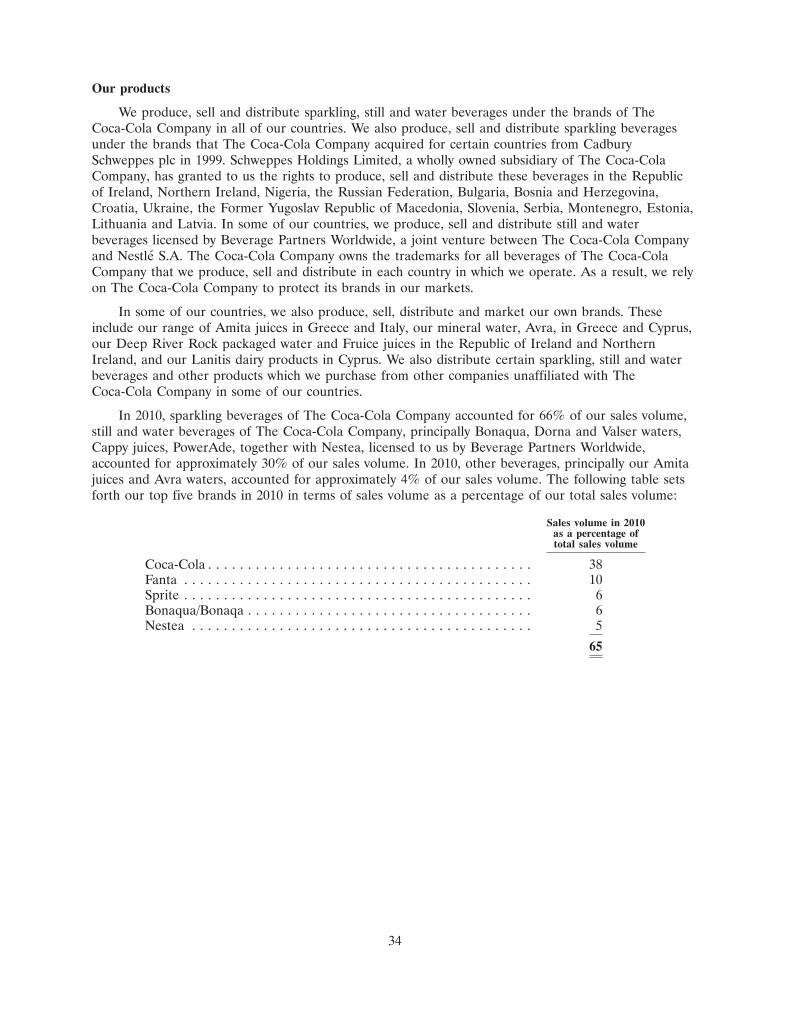
Our products
We produce, sell and distribute sparkling, still and water beverages under the brands of TheCoca-Cola Company in all of our countries. We also produce, sell and distribute sparkling beveragesunder the brands that The Coca-Cola Company acquired for certain countries from CadburySchweppes plc in 1999. Schweppes Holdings Limited, a wholly owned subsidiary of The Coca-ColaCompany, has granted to us the rights to produce, sell and distribute these beverages in the Republicof Ireland, Northern Ireland, Nigeria, the Russian Federation, Bulgaria, Bosnia and Herzegovina,Croatia, Ukraine, the Former Yugoslav Republic of Macedonia, Slovenia, Serbia, Montenegro, Estonia,Lithuania and Latvia. In some of our countries, we produce, sell and distribute still and waterbeverages licensed by Beverage Partners Worldwide, a joint venture between The Coca-Cola Companyand Nestle S.A. The Coca-Cola Company owns the trademarks for all beverages of The Coca-ColaCompany that we produce, sell and distribute in each country in which we operate. As a result, we relyon The Coca-Cola Company to protect its brands in our markets.
In some of our countries, we also produce, sell, distribute and market our own brands. Theseinclude our range of Amita juices in Greece and Italy, our mineral water, Avra, in Greece and Cyprus,our Deep River Rock packaged water and Fruice juices in the Republic of Ireland and NorthernIreland, and our Lanitis dairy products in Cyprus. We also distribute certain sparkling, still and waterbeverages and other products which we purchase from other companies unaffiliated with TheCoca-Cola Company in some of our countries.
In 2010, sparkling beverages of The Coca-Cola Company accounted for 66% of our sales volume,still and water beverages of The Coca-Cola Company, principally Bonaqua, Dorna and Valser waters,Cappy juices, PowerAde, together with Nestea, licensed to us by Beverage Partners Worldwide,accounted for approximately 30% of our sales volume. In 2010, other beverages, principally our Amitajuices and Avra waters, accounted for approximately 4% of our sales volume. The following table setsforth our top five brands in 2010 in terms of sales volume as a percentage of our total sales volume:
Sales volume in 2010as a percentage oftotal sales volume
Coca-Cola . . . . . . . . . . . . . . . . . . . . . . . . . . . . . . . . . . . . . . . . . 38Fanta . . . . . . . . . . . . . . . . . . . . . . . . . . . . . . . . . . . . . . . . . . . . 10Sprite . . . . . . . . . . . . . . . . . . . . . . . . . . . . . . . . . . . . . . . . . . . . 6Bonaqua/Bonaqa . . . . . . . . . . . . . . . . . . . . . . . . . . . . . . . . . . . . 6Nestea . . . . . . . . . . . . . . . . . . . . . . . . . . . . . . . . . . . . . . . . . . . 5
65
34
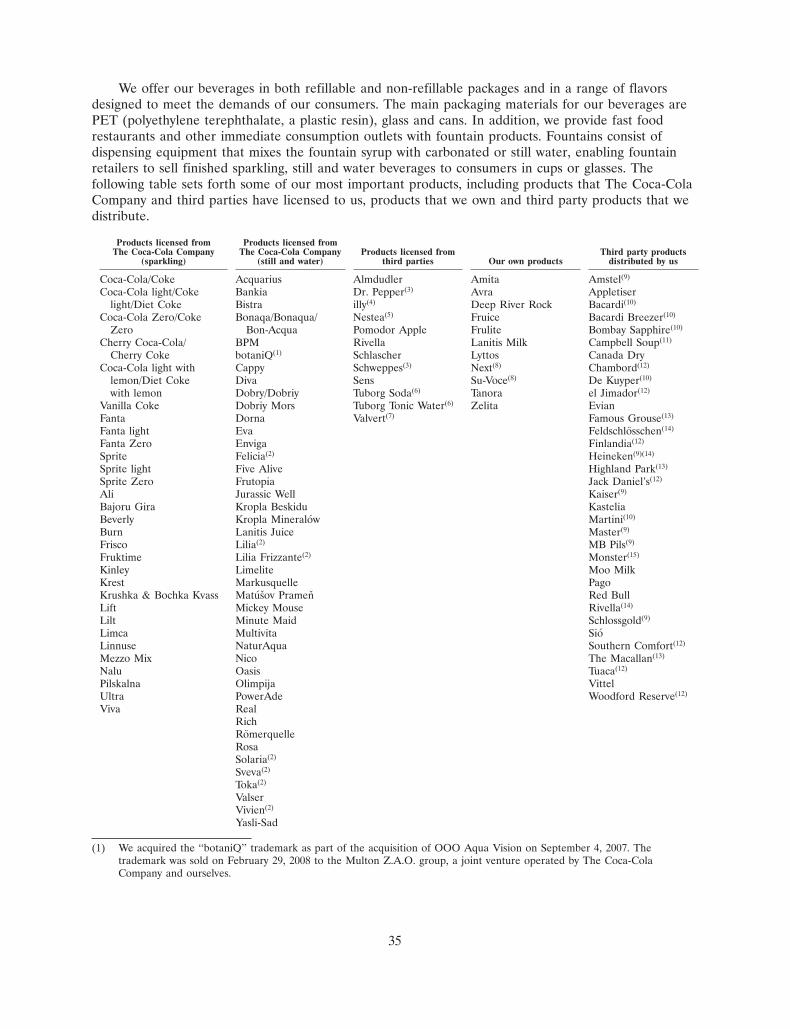
We offer our beverages in both refillable and non-refillable packages and in a range of flavorsdesigned to meet the demands of our consumers. The main packaging materials for our beverages arePET (polyethylene terephthalate, a plastic resin), glass and cans. In addition, we provide fast foodrestaurants and other immediate consumption outlets with fountain products. Fountains consist ofdispensing equipment that mixes the fountain syrup with carbonated or still water, enabling fountainretailers to sell finished sparkling, still and water beverages to consumers in cups or glasses. Thefollowing table sets forth some of our most important products, including products that The Coca-ColaCompany and third parties have licensed to us, products that we own and third party products that wedistribute.
Products licensed from Products licensed fromThe Coca-Cola Company The Coca-Cola Company Products licensed from Third party products
(sparkling) (still and water) third parties Our own products distributed by us
Coca-Cola/Coke Acquarius Almdudler Amita Amstel(9)
Coca-Cola light/Coke Bankia Dr. Pepper(3) Avra Appletiserlight/Diet Coke Bistra illy(4) Deep River Rock Bacardi(10)
Coca-Cola Zero/Coke Bonaqa/Bonaqua/ Nestea(5) Fruice Bacardi Breezer(10)
Zero Bon-Acqua Pomodor Apple Frulite Bombay Sapphire(10)
Cherry Coca-Cola/ BPM Rivella Lanitis Milk Campbell Soup(11)
Cherry Coke botaniQ(1) Schlascher Lyttos Canada DryCoca-Cola light with Cappy Schweppes(3) Next(8) Chambord(12)
lemon/Diet Coke Diva Sens Su-Voce(8) De Kuyper(10)
with lemon Dobry/Dobriy Tuborg Soda(6) Tanora el Jimador(12)
Vanilla Coke Dobriy Mors Tuborg Tonic Water(6) Zelita EvianFanta Dorna Valvert(7) Famous Grouse(13)
Fanta light Eva Feldschlosschen(14)
Fanta Zero Enviga Finlandia(12)
Sprite Felicia(2) Heineken(9)(14)
Sprite light Five Alive Highland Park(13)
Sprite Zero Frutopia Jack Daniel’s(12)
Ali Jurassic Well Kaiser(9)
Bajoru Gira Kropla Beskidu KasteliaBeverly Kropla Mineralow Martini(10)
Burn Lanitis Juice Master(9)
Frisco Lilia(2) MB Pils(9)
Fruktime Lilia Frizzante(2) Monster(15)
Kinley Limelite Moo MilkKrest Markusquelle PagoKrushka & Bochka Kvass Matusov Pramen Red BullLift Mickey Mouse Rivella(14)
Lilt Minute Maid Schlossgold(9)
Limca Multivita SioLinnuse NaturAqua Southern Comfort(12)
Mezzo Mix Nico The Macallan(13)
Nalu Oasis Tuaca(12)
Pilskalna Olimpija VittelUltra PowerAde Woodford Reserve(12)
Viva RealRichRomerquelleRosaSolaria(2)
Sveva(2)
Toka(2)
ValserVivien(2)
Yasli-Sad
(1) We acquired the ‘‘botaniQ’’ trademark as part of the acquisition of OOO Aqua Vision on September 4, 2007. Thetrademark was sold on February 29, 2008 to the Multon Z.A.O. group, a joint venture operated by The Coca-ColaCompany and ourselves.
35
(2) These brands are originally owned by Fonti del Vulture S.r.l., a water company in Italy, which we purchased jointly withThe Coca-Cola Company in July 2006. In October 2008, the brands of Fonti del Vulture S.r.l were transferred to TheCoca-Cola Company.
(3) We produce, sell and distribute Dr. Pepper and Schweppes under a license from Schweppes Holdings Limited.
(4) We sell and distribute of premium ready-to-drink coffee under the illy brand across several of our territories under a licensefrom Ilko Hellenic GmbH.
(5) We produce, sell and distribute Nestea under a license from Beverage Partners Worldwide.
(6) We produce, sell and distribute Tuborg Soda and Tonic Water under a license from Carlsberg Breweries A/S.
(7) We sell and distribute Valvert under a license from Nestle S.A.
(8) These brands are owned by Fresh & Co, a juice company in Serbia which we purchased jointly with The Coca-ColaCompany in March 2006.
(9) We distribute Heineken products in the south-west region of the Republic of Ireland, Bulgaria and the Former YugoslavRepublic of Macedonia and Amstel products in Cyprus. In March 2008, we entered into an agreement with Heineken todistribute Amstel, Heineken, Master, MB Pils, Kaiser and Schlossgold products in Serbia and Montenegro.
(10) We distribute Bacardi Limited products in Hungary, pursuant to a distribution agreement entered into in June 2008.
(11) We distribute Campbell Soup Company products in the Russian Federation pursuant to distribution agreements enteredinto in May 2009.
(12) We distribute Brown-Forman products in Hungary, Ukraine, Serbia/Croatia and Russia pursuant to distribution agreementsentered into in January 2006, April 2008, August 2009 and October 2010, respectively.
(13) We distribute the Edrington Group products in Serbia, Croatia, Hungary and Ukraine pursuant to distribution agreementsentered into in March 2010.
(14) We distribute Rivella and Heineken beer brands (Heineken and Feldschlosschen) via the Swiss Home Delivery Channel.
(15) We distribute Monster products in Hungary, Czech Republic and Slovakia pursuant to distribution agreements entered intoin April 2010. We distribute Monster products in Bulgaria pursuant to a distribution agreement entered into in November2010.
Our operations
Our territories encompass whole countries except Italy, where our territory excludes Sicily (theacquisition of Socib S.p.A. in December 2008 expanded our territory in Italy to the southern Italianmainland and Sardinia), and Northern Ireland, which is the only region of the United Kingdom inwhich we operate.
36
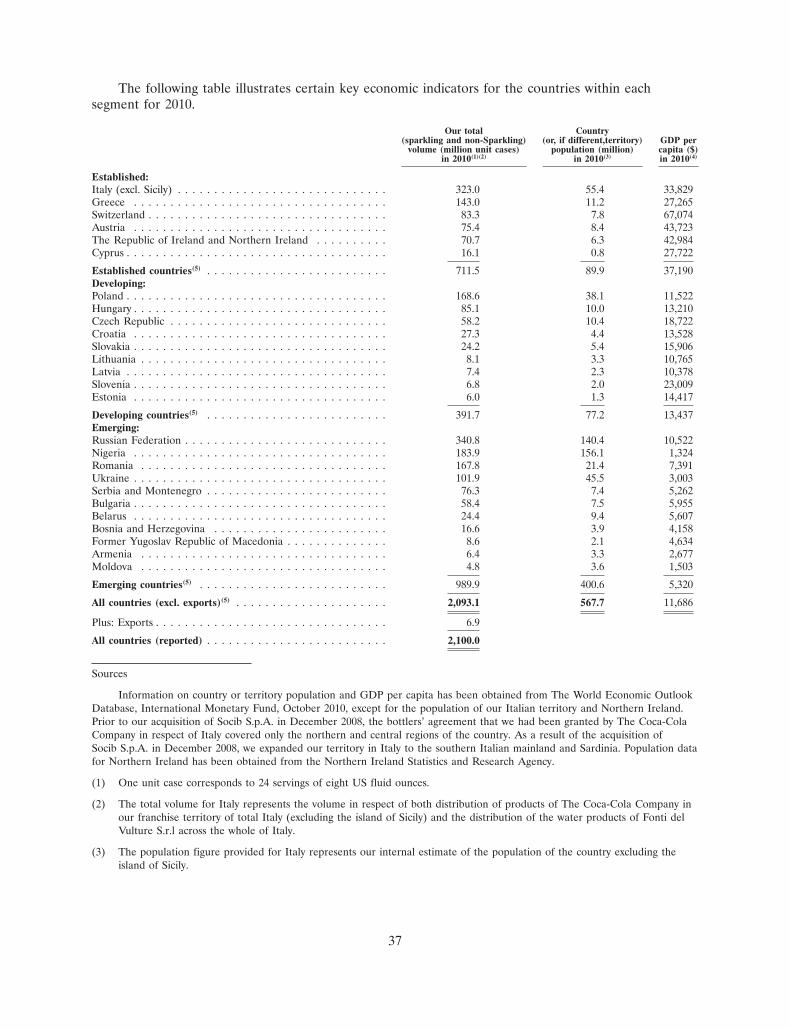
The following table illustrates certain key economic indicators for the countries within eachsegment for 2010.
Our total Country(sparkling and non-Sparkling) (or, if different,territory) GDP per
volume (million unit cases) population (million) capita ($)in 2010(1)(2) in 2010(3) in 2010(4)
Established:Italy (excl. Sicily) . . . . . . . . . . . . . . . . . . . . . . . . . . . . . 323.0 55.4 33,829Greece . . . . . . . . . . . . . . . . . . . . . . . . . . . . . . . . . . . 143.0 11.2 27,265Switzerland . . . . . . . . . . . . . . . . . . . . . . . . . . . . . . . . . 83.3 7.8 67,074Austria . . . . . . . . . . . . . . . . . . . . . . . . . . . . . . . . . . . 75.4 8.4 43,723The Republic of Ireland and Northern Ireland . . . . . . . . . . 70.7 6.3 42,984Cyprus . . . . . . . . . . . . . . . . . . . . . . . . . . . . . . . . . . . . 16.1 0.8 27,722
Established countries(5) . . . . . . . . . . . . . . . . . . . . . . . . . 711.5 89.9 37,190Developing:Poland . . . . . . . . . . . . . . . . . . . . . . . . . . . . . . . . . . . . 168.6 38.1 11,522Hungary . . . . . . . . . . . . . . . . . . . . . . . . . . . . . . . . . . . 85.1 10.0 13,210Czech Republic . . . . . . . . . . . . . . . . . . . . . . . . . . . . . . 58.2 10.4 18,722Croatia . . . . . . . . . . . . . . . . . . . . . . . . . . . . . . . . . . . 27.3 4.4 13,528Slovakia . . . . . . . . . . . . . . . . . . . . . . . . . . . . . . . . . . . 24.2 5.4 15,906Lithuania . . . . . . . . . . . . . . . . . . . . . . . . . . . . . . . . . . 8.1 3.3 10,765Latvia . . . . . . . . . . . . . . . . . . . . . . . . . . . . . . . . . . . . 7.4 2.3 10,378Slovenia . . . . . . . . . . . . . . . . . . . . . . . . . . . . . . . . . . . 6.8 2.0 23,009Estonia . . . . . . . . . . . . . . . . . . . . . . . . . . . . . . . . . . . 6.0 1.3 14,417
Developing countries(5) . . . . . . . . . . . . . . . . . . . . . . . . . 391.7 77.2 13,437Emerging:Russian Federation . . . . . . . . . . . . . . . . . . . . . . . . . . . . 340.8 140.4 10,522Nigeria . . . . . . . . . . . . . . . . . . . . . . . . . . . . . . . . . . . 183.9 156.1 1,324Romania . . . . . . . . . . . . . . . . . . . . . . . . . . . . . . . . . . 167.8 21.4 7,391Ukraine . . . . . . . . . . . . . . . . . . . . . . . . . . . . . . . . . . . 101.9 45.5 3,003Serbia and Montenegro . . . . . . . . . . . . . . . . . . . . . . . . . 76.3 7.4 5,262Bulgaria . . . . . . . . . . . . . . . . . . . . . . . . . . . . . . . . . . . 58.4 7.5 5,955Belarus . . . . . . . . . . . . . . . . . . . . . . . . . . . . . . . . . . . 24.4 9.4 5,607Bosnia and Herzegovina . . . . . . . . . . . . . . . . . . . . . . . . 16.6 3.9 4,158Former Yugoslav Republic of Macedonia . . . . . . . . . . . . . . 8.6 2.1 4,634Armenia . . . . . . . . . . . . . . . . . . . . . . . . . . . . . . . . . . 6.4 3.3 2,677Moldova . . . . . . . . . . . . . . . . . . . . . . . . . . . . . . . . . . 4.8 3.6 1,503
Emerging countries(5) . . . . . . . . . . . . . . . . . . . . . . . . . . 989.9 400.6 5,320
All countries (excl. exports)(5) . . . . . . . . . . . . . . . . . . . . . 2,093.1 567.7 11,686
Plus: Exports . . . . . . . . . . . . . . . . . . . . . . . . . . . . . . . . 6.9
All countries (reported) . . . . . . . . . . . . . . . . . . . . . . . . . 2,100.0
Sources
Information on country or territory population and GDP per capita has been obtained from The World Economic OutlookDatabase, International Monetary Fund, October 2010, except for the population of our Italian territory and Northern Ireland.Prior to our acquisition of Socib S.p.A. in December 2008, the bottlers’ agreement that we had been granted by The Coca-ColaCompany in respect of Italy covered only the northern and central regions of the country. As a result of the acquisition ofSocib S.p.A. in December 2008, we expanded our territory in Italy to the southern Italian mainland and Sardinia. Population datafor Northern Ireland has been obtained from the Northern Ireland Statistics and Research Agency.
(1) One unit case corresponds to 24 servings of eight US fluid ounces.
(2) The total volume for Italy represents the volume in respect of both distribution of products of The Coca-Cola Company inour franchise territory of total Italy (excluding the island of Sicily) and the distribution of the water products of Fonti delVulture S.r.l across the whole of Italy.
(3) The population figure provided for Italy represents our internal estimate of the population of the country excluding theisland of Sicily.
37
(4) The GDP per capita of Italy represents the GDP per capita of Italy as a whole. The GDP per capita reported for Irelandreflects a population-weighted average of the GDP per capita for the Republic of Ireland and Northern Ireland (as basedon the GDP for the United Kingdom).
(5) Population-weighted average for all territories in the category, apart from total volume and country population.
Established countries
Introduction
Our established countries are Italy, Greece, Austria, the Republic of Ireland, Northern Ireland,Switzerland and Cyprus. These countries generally enjoy a relatively high degree of political andeconomic stability and have broadly similar economic characteristics. In particular, they typically exhibithigh levels of disposable income per capita, which enhances the affordability of our products, especiallyour more profitable single-serve packages designed for immediate consumption.
Established countries are characterized by high consumer sophistication, high net sales revenue perunit case, moderate rates of consumption growth for sparkling beverages and a trend toward fastergrowth in consumption of products in our combined still and water beverages category, particularlyjuices. We believe that the growth in consumption of products in our combined still and waterbeverages category, which some consumers perceive as being associated with physical well-being, healthand fitness, is strongly influenced by current demographic trends.
The most important trend generally affecting the future consumption channel in our establishedcountries is an increasing concentration of the retail sector. At the same time, we see manyopportunities in these countries for further growth in the more profitable immediate consumptionchannel, specialized consumption venues and workplaces. Activation at final points of sale is also a keyfocus of our sales and marketing efforts in these countries.
We sell our products in our established countries through a combination of wholesalers and ourdirect delivery system. We continue to successfully expand our direct distribution capabilities,particularly in Italy.
We have taken certain initiatives to consolidate our production network by rationalizing facilities,through consolidation, relocation of manufacturing lines, and streamlining of warehouses. Theestablished countries that have principally benefited from such initiatives include the Republic ofIreland and Northern Ireland, Austria and Greece.
Net sales revenue in our established countries amounted to A2,704.0 million in 2008,A2,927.8 million in 2009 and A2,834.6 million in 2010, which accounted for 38.7%, 44.7% and 41.7% ofour total net sales revenue in 2008, 2009 and 2010, respectively.
Italy
Our business in Italy encompasses the manufacture and distribution of the products of TheCoca-Cola Company, as well as water products of Fonti del Vulture S.r.l. across all of Italy, excludingthe island of Sicily. Fonti del Vulture S.r.l. was acquired jointly with The Coca-Cola Company in July2006. In December 2008, we acquired Socib S.p.A., the second largest Coca-Cola bottler in Italy, with afranchise territory consisting of southern Italy and the island of Sardinia, which together includeapproximately 24% of the Italian population. In February 2011, we sold Eurmatik S.r.l., a direct fullservice vending company in Italy acquired in May 2007. Our franchise territory in Italy encompassesover 90% of the Italian population. We believe that we are one of the largest bottlers of non-alcoholicbeverages in the territory and the leader in the sparkling beverages category in terms of sales volume.On January 1, 2010, SAP ‘Wave 2’ was rolled-out in Italy, and is expected to enhance our commercialcapabilities and increase our customer satisfaction levels in that country.
38
Our total volume in Italy decreased by 2.2% in 2010. Sparkling category volume declined by 3.1%and combined still and water category volume increased by 2.4% in 2010. This increase in still andwater category volume was aided by strong growth of 2.4% in sales of water resulting from ourexpanding the distribution of Lilia with single serve packages of 50 cl PET, sales of which grew by13.1% within the hotel, restaurant and cafe channel. Nevertheless, unfavorable economic conditions inItaly persisted throughout 2010 and negatively impacted household spending. In additionunemployment increased to 8.7% in 2010, with youth unemployment reaching 28.9%, a level that isamong the highest in Europe. In May 2010, the Italian government announced significant reductions inpublic expenditure, intended to reduce the country’s fiscal deficit to 3% or less of gross domesticproduct by 2012. Such measures are likely to negatively impact GDP and employment in the short andmedium term, which could adversely affect the results of our operations.
During 2010, we installed solar panels at all of our production facilities in Italy.
Greece
We have operated in Greece since 1969 and believe that we are the largest bottler of non-alcoholicbeverages and the leader in the sparkling beverages category in Greece in terms of sales volume. Ourstrength in the Greek sparkling beverages category has been complemented by our success in theGreek combined still and water beverages category, where we are the leading producer of fruit juiceswith our Amita and Frulite brands and the second largest producer of water with our Avra mineralwater and Lyttos brands. Immediate consumption channels, including those associated with the tourismindustry, are particularly important for our business in Greece. The Greek market is very fragmentedand thus we sell the majority of our products to wholesalers and distributors, which distribute ourproducts to small outlets. Direct delivery is limited to certain customers, including supermarket chainsand other key accounts. On January 1, 2010, SAP ‘Wave 2’ was rolled-out in Greece, and is expected toenhance our commercial capabilities and increase our customer satisfaction levels in that country.
We achieved a sales volume of 143.0 million unit cases in 2010. Our total sales volume in Greecedecreased by 11.5% in 2010, despite notable growth of the sparkling category during the fourth quarter.Our strategy for 2010 was focused on engaging our consumers via innovation spanning our five corebrands, as well as, activating our priority channels while supporting both the fragmented and moderntrade. However, our performance reflects a protracted recession and related conditions, includingreduced tourism and two separate transport strikes, which negatively affected distribution and productavailability. New government austerity measures introduced in December 2010 are expected to furthererode consumer purchasing power and confidence. However, we continue to maintain our long-termfocus on market leadership while adapting our business to a new economic environment of economicausterity.
In 2010, we continued our ‘‘Mission Water’’ program by maintaining our support of rainwaterharvesting program for a second year. In particular, we implemented the program in six CycladicIslands by installing and repairing 13 rainwater harvesters with a total capacity of 650.000 liters of rainwater. We also conducted maintenance seminars for 60 technical workers and rolled out an educationalprogram entitled ‘‘Gift of Rain’’ to 504 students and 135 teachers on the six islands. We have alsocontinued our ongoing three-year support of reforestation activities in Greece under the auspices ofour Avra water program, pursuant to which we have planted approximately 100,000 trees.
39
Austria
We believe that we are the largest bottler of non-alcoholic beverages, and the leader in thesparkling beverages category, in Austria in terms of sales volume. In addition to the core brands of TheCoca-Cola Company, our sparkling beverages portfolio includes Mezzo Mix and Almdudler, a popularnational sparkling beverage, as well as the energy drinks Burn and Monster, which were launched inAustria at the end of 2008 and 2010, respectively. In addition, Romerquelle is the third largest waterbrand in Austria and constitutes nearly 20% of our sales volume. Romerquelle Emotion, a flavoredvariant of Romerquelle, is the leader in the rapidly growing flavored water segment in Austria.
In an effort to rationalize our product portfolio we de-listed our second water brand,Markusquelle, in 2009. Although this resulted in some lost volume in 2010, this de-listing streamlinedour portfolio and contributed to an improvement of our net results. The Austrian retail market ishighly concentrated with two major retailers holding nearly a 60% market share. For sales in theimmediate consumption channel, we rely on a combined direct and indirect service system with two keywholesalers servicing half of our Austrian hotel, restaurant and cafe customers. In line with ourroute-to-market strategy, we have continuously increased our efforts to activate all of our direct, as wellas indirect accounts to improve quality and availability in the more profitable immediate consumptionchannel. Improved relationships with our wholesale partners have resulted in increased availability ofour products (especially Romerquelle and Nestea). On January 1, 2011, SAP ‘Wave 2’ was rolled-out inAustria, and is expected to enhance our commercial capabilities and increase our customer satisfactionlevels in that country.
Our total volume in Austria decreased by 0.4% in 2010. Sparkling category volume increased by1.2% while juice sub-category volume declined by 6.3% and water sub-category volume declined by6.3% as a result of the de-listing of Markusquelle. Favourable package and price mix contributed to netsales revenues increasing by 0.8% in 2010 in comparison to 2009.
Our plant in Vienna is now one of our largest facilities. In 2010, we successfully implemented allplanned warehouse and distribution restructuring projects and improved system line efficiency inproduction.
Switzerland
We believe that we are the largest bottler of non-alcoholic beverages in Switzerland in terms ofsales volume. In addition to the core sparkling beverages brands of The Coca-Cola Company, oursparkling beverages brands include Ali and Kinley, our still and water category beverages brandsinclude Valser mineral water, Nestea ice teas, Minute Maid juices, Powerade sports drinks and bothBurn and Monster in the energy sub-category. We believe that our mix of sparkling, still and waterbeverages provides us with flexibility to address the changing preferences and tastes of Swissconsumers. In the hotel, restaurant and cafe channel, representing nearly half of the Swiss volume, thedistribution system for non-alcoholic beverages relies primarily on wholesalers that are highlyconcentrated. As a result, our relationship with our key wholesalers is particularly important to us. In2010, we continued the successful implementation of the wholesaler partner model, which hassignificantly improved the manner in which we interact with key customers. This partnership model isinstrumental in providing us with better access to our customers and data transparency at the outletlevel, which ultimately improves our understanding of the end consumer.
40
Sales volume of Coca-Cola trademarked products grew by 4.1% in 2010. The listing of ourproducts with the largest retailer in Switzerland, which historically had only carried private labelproducts, contributed to such increase. We have also expanded our training and development programto all target groups in the commercial department and have invested strongly in new marketingprograms and materials for marketplace activation. As a result, both our household penetration overall,and our sales of single-serve packages, improved significantly in 2010. In addition, we enhanced salesfocus on our Coca-Cola brands through the use of new outlet activation standards. We also continuedto drive distribution of our Nestea range of products and further expanded the sales force coverage ofthe workplace channel, where we believe that there is good growth potential. All these activitiescontributed to sales of our Coca-Cola brands growing by 7.8% and sales of our Nestea range ofproducts growing by 10.2%.
The Republic of Ireland and Northern Ireland
We believe we are the largest bottler of non-alcoholic beverages in the Republic of Ireland andNorthern Ireland and the leader in the sparkling beverages category in terms of sales volume. Ourstrategy has been to diversify our portfolio of sparkling, still and water beverages. Our brands in thejuice sub-category include Fruice pure juice, Five Alive and Oasis. Our primary water brand, DeepRiver Rock, is proprietary to our company, and we also hold a license to distribute Vittel. In theRepublic of Ireland and Northern Ireland, we sell the majority of our products to independentwholesalers and distributors that distribute our products to smaller outlets, and we deliver our productsdirectly to certain key customers, including supermarket chains. While smaller outlets have retained asignificant portion of the retail market in the Republic of Ireland throughout 2010, there is anincreasing trend towards chain stores.
Our total sales volume in Ireland declined by 1.7% in 2010. Although our brand building activitiescontributed to gains in market share and volume growth in the fourth quarter, our share in the watersub-category declined slightly in 2010 due to the strengthening of private label products. During 2010,the government of the Republic of Ireland introduced significant austerity measures, including a 10%cut in public sector pay coupled with income tax increases, designed to reduce the budget deficit andrestore confidence in the economy. In May 2010, the new government of the United Kingdomannounced reductions in public expenditure to reduce the fiscal deficit, as a percentage of the grossnational product, significantly. In the short and medium term, such measures are likely to negativelyimpact GDP and employment making economic conditions within the whole of Ireland significantlymore challenging.
Developing countries
Introduction
Our developing countries are Poland, Hungary, the Czech Republic, Croatia, Lithuania, Latvia,Estonia, Slovakia and Slovenia. All but Croatia entered the EU on May 1, 2004. All our developingcountries have market-oriented economies. Our developing countries generally have lower disposableincome per capita than our established countries and continue to be exposed to economic volatilityfrom time to time.
41
Macroeconomic conditions had been positive in our developing countries in years prior to 2008,with all countries experiencing positive real GDP growth. However, economic growth has slowed orreversed in the last two years as a result of the global financial and credit crisis. Over the last twoyears, GDP growth in our developing countries has declined and unemployment has increased. Netsales revenue declined by 1% in 2010 compared to 2009. During 2009, our net sales revenue indeveloping countries was also negatively impacted by foreign currency fluctuations. The entry of all ofour developing countries, other than Croatia, into the EU, has resulted in increased political stabilitydue to their gradual alignment with the principles, objectives and regulations of the EU.
Our developing countries are typically characterized by lower net sales revenue per unit case thanin our established countries. The Coca-Cola Company’s products were introduced in the early 1990s inmost of our developing countries, where they have since become established premium brands.Consumers in some developing countries continue to move away from tap water and home made drinksto branded products as beverages of choice. In addition, consumers in these markets have shown anincreasing interest in branded beverages associated with well-being and fitness, such as water and juices.
The non-alcoholic beverages market tends to be fragmented in our developing countries, with nosingle market participant typically holding a leading share in more than one market category. Inaddition, consumers tend to be more price-sensitive in our developing countries than in our establishedcountries. Consequently, our products often face competition from local non-premium brands, which, ina number of cases, have been present in the market for many years and remain popular withconsumers.
We believe that developing countries offer significant growth opportunities for both our sparkling,still and water beverages and we are committed to maximizing these opportunities by introducingexisting and new products, flavors and packages in both the future consumption and the immediateconsumption channels. We plan to support the increased presence of our products across both thefuture and immediate consumption channels with our route-to-market systems and the increasedavailability of coolers and other cold drink equipment.
Net sales revenue in our developing countries amounted to A1,348.4 million in 2008,A1,149.1 million in 2009 and A1,140.0 million in 2010, which accounted for 19.3%, 17.6% and 16.8% ofour total net sales revenue in 2008, 2009 and 2010, respectively.
Poland
Poland is our largest developing country in terms of both population and sales volume. We believewe are the largest bottler of non-alcoholic beverages in Poland in terms of sales volume. Poland’s lowurbanization and vast population represent an opportunity for growth of our business. In addition tothe core brands of The Coca-Cola Company, our sparkling beverages brands in Poland include Lift.Our portfolio of water brands in Poland includes Kropla Beskidu, Kropla Mineralow, Vita andMultivita. We continue to see a significant shift to modern trade channels in Poland and are adaptingour business to address this change. On January 1, 2011, SAP ‘Wave 2’ was rolled-out in Poland, and isexpected to enhance our commercial capabilities and increase our customer satisfaction levels in thatcountry.
Total volume in Poland grew by 0.5% in 2010, supported by successful promotional activity andgrowth in sales of Coca-Cola trademarked products. Volume in our combined still and water categorydecreased by 1.7% in 2010. Nestea retained its leadership position in the ice tea sub-category in 2010.Despite losing share, PowerAde also remained a leader in the sports drink sub-category. Innovationenabled Burn to continue building its position within the energy drinks sub-category, increasing volumeshare to 4.9% and value share to 8.0% in 2010.
42
During 2010, we also invested in cold drink equipment and increased our production capacity forsparkling, still and water beverages.
Hungary
We believe that we are the largest bottler of non-alcoholic beverages in Hungary in terms of salesvolume. Hungary has one of the most developed sparkling beverages markets in Central and EasternEurope. In addition to the core brands of The Coca-Cola Company, our sparkling beverages brands inHungary include Lift and Kinley, and our still and water beverages brands include NaturAqua mineralwater. Other brands include the range of PowerAde sports drinks, Nestea ice teas, Cappy juice, CappyIcefruit juice drink and Burn energy drinks. We believe that we are leaders in the sparkling beveragescategory and both the water and ice tea sub-categories in Hungary. On January 1, 2011, SAP ‘Wave 2’was rolled-out in Hungary, and is expected to enhance our commercial capabilities and increase ourcustomer satisfaction levels in that country.
Our total volume in Hungary declined by 2.5% in 2010. Key developments during 2010 includedminor declines in sales of our NaturAqua mineral water, significant increases in sales of our flavoredwaters. Sales of Nestea ice tea slightly decreased versus 2009. In 2010, we explored furtheropportunities within the energy segment by launching Monster energy drinks and believe that we havenow acquired leadership in the energy sub-category. Our juice volume slightly declined compared to theprior year consistent with a decline in the broader juice sub-category. During 2010, we continued tofocus on increasing sales of our high margin single-serve packages. We continued our distribution ofBrown-Forman and Bacardi-Martini products and also began distributing a Hungarian spirit calledRezangyal, as well as certain products of The Edrington Group. Unfavorable economic conditions havecaused retail sales to continue their decline in Hungary.
Emerging Countries
Introduction
Our emerging countries are the Russian Federation, Romania, Nigeria, Ukraine, Bulgaria, Serbia(including the Republic of Kosovo), Montenegro, Belarus, Bosnia and Herzegovina, Armenia, Moldovaand The Former Yugoslav Republic of Macedonia. These countries are exposed to greater political andeconomic volatility and have lower per capita GDP than our developing or established countries. As aresult, consumer demand in our emerging countries is especially price sensitive, making the affordabilityof our products even more important. The global financial and credit crisis has exacerbated suchstructural issues in our emerging countries. We seek to promote our products through a strategiccombination of pricing, packaging and promotional programs taking into account local economicconditions.
Most of our emerging countries are characterized by lower net sales revenue per unit case thanour established and developing countries. Consumers in some emerging countries are moving awayfrom tap water and home made drinks as their principal beverages and have shown an increasinginterest in branded beverages. In some of our emerging countries, consumers are showing particularinterest in juices and branded waters.
In general, our emerging countries have a relatively undeveloped distribution infrastructure and afragmented retail sector. In order to expand the availability of our products, our priority has been toestablish reliable distribution networks through a combination of our own direct delivery system andindependent distributors and wholesalers where this is economically more efficient. We also focus onimproving the availability of chilled products by placing coolers and other cold drink equipment in themarket.
43
We believe that our emerging countries provide significant growth opportunities. Some of thefactors that influence these growth opportunities include relatively low consumption rates, populationsize (especially in the Russian Federation, Nigeria and Ukraine) and favorable demographiccharacteristics, notably the larger proportion of young people in countries such as Nigeria who typicallyconsume a higher amount of sparkling beverages.
Net sales revenue in our emerging countries amounted to A2,928.3 million in 2008, A2,466.7 millionin 2009 and A2,819.0 million in 2010, which accounted for 42.0%, 37.7% and 41.5% of our total netsales revenue in 2008, 2009 and 2010, respectively.
Russian Federation
We are the exclusive bottler of the products of The Coca-Cola Company for all of the RussianFederation and we believe we are the leader in the sparkling beverages category in terms of salesvolume. Our juice brands in the Russian Federation include Rich, Nico, Dobry and Yasli-Sad, all ofwhich are part of the product portfolio of the Multon Z.A.O. group, a leading juice producer jointlyacquired with The Coca-Cola Company in April 2005. Our other main non-sparkling brands areBonaqua water and Nestea ice teas. We also distribute the energy drink Burn, the range of Poweradesports drinks, the popular local drink Fruktime, Dobry lemonade, Schweppes-branded mixer productsand ‘‘Kruzhka I Bochka’’ kvass. On September 4, 2007, we acquired 100% of OOO Aqua Vision, acompany owning a newly constructed production facility located in close proximity to Moscow. OnFebruary 29, 2008, the ‘‘BotaniQ’’ trademark was sold to the Multon Z.A.O. group of companies. Wedistribute our products primarily through our direct delivery system but also through wholesalers andindependent distributors. We believe that we have one of the largest direct distribution networks in theRussian Federation comprising over 71 distribution centers in all key cities of the country. We continueto implement our distribution strategy for improving the availability of our products, in particular ofour single-serve packages, across the country. We are also making progress in the integration of oursales and distribution systems with the Multon Z.A.O. group.
Our total volume in Russia grew by 13.7% in 2010. Positive GDP growth, decreasingunemployment and low inflation benefited consumer sentiment in the country during 2010. Ourperformance was also benefited by an extraordinarily hot summer, which contributed to increased salesof our Bonaqua waters and Nestea ice teas in particular. Together with The Coca-Cola Company, wecontinue to invest in brands so as to strengthen our market position. We also continue to invest in ourmanufacturing facilities, sales equipment and distribution infrastructure in the Russian Federation. In2010, our investment in such assets exceeded A102 million. We distribute Campbell Soup Companyproducts in Russia pursuant to distribution agreements entered into in May 2009 and Brown-Formanproducts pursuant to a distribution agreement entered into in October 2010.
44
Nigeria
We believe that we are the largest bottler of non-alcoholic beverages in Nigeria in terms of salesvolume. Our still and water beverages are leading brands in their respective sub-categories. Togetherwith our corporate predecessors, we have bottled products of The Coca-Cola Company in Nigeria since1953. At December 31, 2010, we owned 66.4% of our Nigerian bottler, Nigerian Bottling Company plc,with the balance of the shares being publicly held and listed on the Nigerian Stock Exchange. OnDecember 14, 2010, Nigerian Bottling Company plc announced that it is considering a Scheme ofArrangement, which subject to regulatory approval, would entail Nigerian Bottling Company plcbecoming our wholly-owned subsidiary. In addition to the core brands of The Coca-Cola Company, oursparkling beverage brands in Nigeria include a range of Schweppes products and Limca, a lemon-limeproduct. In 2010, we consolidated ownership of Limca franchise for all of Nigeria. Our still and waterbeverage category brands include Eva bottled water, which is the leading bottled water brand in Nigeriain terms of sales volume, and Five Alive and Cappy juices, which were added to our Nigerian productportfolio in October 2010.
Nigeria is the most populous country in Africa, with an estimated 150 million inhabitants, and hasa warm climate and young population that offer growth opportunities for our sparkling, still and waterproducts. The GDP of Nigeria grew 7.4% in 2010. The Nigerian retail sector remains highlyfragmented despite the modest growth of modern trade channels. As a result, we manage ourdistribution either directly or through wholesalers and third party distributors. We are working to makedistribution more efficient by expanding our pre-selling system for high-volume outlets, adding thirdparty distributors and directly delivering to key accounts. More than 70% of our sales are nowgenerated through our pre-selling system. In addition, we are continuing to expand our dealer base inselected areas and are working on improving merchandising standards, while expanding the availabilityof chilled products. Due to the low availability of electricity in Nigeria, we also manufacture anddistribute ice to support the supply of cold drinks in the immediate consumption channel.
Our total volume in Nigeria grew by 4.6% in 2010. Increased availability of one-way packagesresulting from increased capacity had a positive impact on sales of Coca-Cola trademarked products,while sales of Sprite grew significantly as well. We are also continuing to gain share in the juicesub-category. In 2010, we installed one sparkling PET line in Benin and two juice lines in Ikeja. Thelight-weight Ultra glass bottle that was launched during 2009 was rolled out across most of Nigeria in2010.
By May 2011, we anticipate that all our production facilities in Nigeria will have been upgradedwith effluent treatment plants. In 2010, we partnered with state governments to invest in educationalinfrastructure benefiting over 4,000 pre-college students across four communities. We also sponsoredtwo key leadership building programmes for undergraduate students across the country. Finally, ourwater stewardship programme continued in 2010 with a ‘Water Ambassador’ initiative to raiseawareness regarding water quality issues.
Romania
We believe that we are the largest bottler of non-alcoholic beverages in Romania in terms of salesvolume with a total 2010 volume of 167.8 million unit cases, of which 60.8% related to sparklingbeverages. We are the leader in the sparkling beverages category in terms of sales volume. In additionto the core brands of The Coca-Cola Company, we also produce and sell Dorna water, Schweppes-branded mixer products, Cappy juices and Nestea ice teas. We believe that we became the leader in thewater sub-category in 2010. On January 1, 2011, SAP ‘Wave 2’ was rolled-out in Romania and isexpected to enhance our commercial capabilities and increase our customer satisfaction levels in thatcountry.
45
Our total volume in Romania declined by 3.6% in 2010, with volume in the sparkling beveragescategory declining by 3.9% and volume in the combined still and water beverages category declining by3.2%. Challenging economic conditions, including the implementation of strict austerity measures, havehad an adverse impact on consumer demand. Real GDP in Romania declined by 1.9% in 2010 andinflation increased to 7.8%. However, the local currency has depreciated only slightly versus the euro.
In 2010, our strategy continued to build on the production and logistic developments that wecompleted in 2008 and 2009. In 2010, we further outsourced both warehousing and distributionfunctions and centralized our dispatching function in Bucharest.
Sales and marketing
Brand and market development
In all our countries, and particularly in our emerging and developing countries, we believe thatsignificant opportunities exist to promote increased consumption of sparkling, still and water beverages.Where beverage per capita consumption is low, we develop these opportunities by executing brand-specific promotions and quality merchandising designed to develop consumer preferences for ourbrands, increase our consumer base and drive purchasing frequency. As beverage per capitaconsumption increases, we focus on developing specialized distribution channels (including workplaceand leisure venues) to improve margins and increase volume.
The Coca-Cola Company generally focuses on consumer marketing, which involves building brandequity, analyzing consumer preferences and formulating brand marketing strategies and mediaadvertising designs. The principal focus of The Coca-Cola Company has traditionally been on the coreCoca-Cola, Coca-Cola light, Coca-Cola Zero, Fanta and Sprite brands. However, we are working closelywith The Coca-Cola Company to develop new products in the combined still and water beveragescategory that cater to our consumers increasing focus on well-being, health and fitness. We recognizechanging preferences in favor of products in our combined still and water beverages category and areworking to satisfy this increasing demand and maximize our growth potential. We plan to achieve thisby cultivating existing brands, such as Cappy, Nestea and PowerAde, as well as by launching oracquiring new brands, as we have done in the past with Dobry, Nico and Rich in the RussianFederation, Bankia in Bulgaria, Rosa, Next and Su-Voce in Serbia, and Lilia and Lilia Frizzante in Italy.
We cultivate our fully-owned brands (Amita, Avra, RiverRock, Tsakiris snacks, Lanitis dairyproducts and others) with the same criteria as above.
We develop strong relationships with our customers by focusing on excellent execution of customermarketing promotions and merchandising at the point of sale. We support such market execution byconducting regular customer satisfaction surveys and by developing innovative materials for retail salesactivation, including new racks, point-of-sale visuals and sales aids for our customers. We conductmarket analyses to better understand unique shoppers and purchase occasions in different tradechannels. This information is used to develop all of our non-alcoholic beverage categories at everypoint of sale. Finally, we also work closely with The Coca-Cola Company to develop annual sales,promotions and marketing plans for each of our established, developing and emerging countries.
We sponsor significant sporting, cultural and community activities across all of our countries inpartnership with The Coca-Cola Company, a major supporter of important international events andprograms. We seek to integrate consumer marketing and sponsorship activities with our retailpromotions. In conjunction with the global sponsorship of the Olympic Games by The Coca-ColaCompany, which dates back to 1928, we engage in a range of promotions. The Coca-Cola Company’sassociation with international sporting events such as the Olympics, the European Cup and the WorldCup also enables us to realize significant benefits from the unique marketing opportunities of some ofthe largest and most prestigious sporting events in the world.
46
Our partnership with The Coca-Cola Company extends beyond sports and includes other verypopular sponsorship-related marketing initiatives. At the same time, these sponsorship initiativescomplement our local initiatives, which involve active participation in a broad range of events, frommusical and entertainment promotions to cultural and festive occasions, including a wide variety ofnational celebrations.
Revenue growth initiative
As part of our effort to engage successfully in what we call our ‘‘revenue growth initiative’’, weseek to optimize our product prices relative to value, identify the best mix of brands, packages andchannels, drive packaging innovation and emphasize customer management. As a result of thisapproach, we have introduced new packages to attract new consumers in each of our productcategories, developed immediate consumption channels in each of our territories by investing in colddrink equipment and put in place an employee training program together with The Coca-ColaCompany for our employees, in which we emphasize revenue growth initiative principles. We also seekto identify good revenue growth practices in our territories based on actual results which we share withthe other territories across our group.
Our sales and marketing organization
In each of our territories, we tailor our sales and marketing strategy to reflect the level ofdevelopment and local customs in the marketplace. We ensure that those closest to the market, ournational and regional sales and marketing organizations, are responsible and accountable forsuccessfully implementing that strategy. We believe that local sales forces are in the best position toevaluate the particular circumstances of each market and address its specific needs. Accordingly, weseek to encourage responsibility, flexibility and innovation at a local level.
Our key sales and marketing personnel typically include:
• the commercial director, who has overall responsibility for country specific sales and marketingactivities;
• the marketing manager, who has overall responsibility for the development of channel-specificplans and programs, marketing analysis and company-owned brand plans;
• the key account managers, who are responsible for developing customer-specific plans andprograms; and
• the national sales manager, who leads the sales organization.
We usually divide a country into different sales areas, each with a region manager who hasresponsibility for implementing national strategies at the local level and who leads a team ofrepresentatives responsible for sales, customer relations, merchandising and individual accountmanagement. Our teams work closely with the relevant marketing teams of The Coca-Cola Company indeveloping and executing our sales and marketing plan.
Key account management
We use collaborative key account management principles to build strong and long-termrelationships with our major customers. Our key account managers work together with our majorcustomers to improve our respective profit margins by increasing volume and revenue growth whilereducing distribution costs. Our key account managers also negotiate the terms of our commercialcooperation arrangements with our major customers, including marketing activities and promotionalevents. To ensure that our key account managers have the right skills, we regularly run trainingprograms for them on how to manage large customers.
47
Distribution
Our distribution channels
We classify different categories of customers into two broad distribution channels based on thetype of consumption that they supply:
• future (mainly at home) consumption, where consumers buy beverages in multi-serve (typicallyone liter and above or multi-package) packages for consumption at a later time; and
• immediate or impulse (mainly away from home) consumption, where consumers buy beveragesin chilled single-serve (typically 0.5 liter or smaller) packages and fountain products forimmediate consumption.
We then segment these two broad channels further into specific channels, such as hypermarkets,supermarkets, discount stores, grocery stores, wholesalers, hotels, restaurants and cafes, entertainmentcenters and offices in order to collate data and develop marketing plans specific to each channel. Someof these channels, such as grocery stores, fall into both consumption channels. For all channels andconsumption occasions, we strive to offer consumers the appropriate choice of beverage categories andbrands to address their refreshment and hydration needs. At the same time we also strive to satisfy ourcustomers’ service and business needs.
Future consumption
Our principal future consumption channels are traditional grocery stores, supermarkets,hypermarkets and discount stores. Products sold in our future consumption channels typically generatehigher volume and lower margins per retail outlet than those sold in our immediate consumptionchannels.
We believe that one key to success in future consumption channels is working effectively withcustomers by driving total category growth in order to achieve favorable product placement at the pointof sale. Key account managers are an important part of this strategy.
We continuously develop and implement marketing and promotional programs to profitablyincrease volume in our future consumption channels. Examples include price promotions on multi-servemulti-packs, offering gifts for multiple purchases, running prize competitions and product samplingevents.
We have begun to coordinate with our customers on optimizing our supply chain through dataexchange and other initiatives that help us avoid out-of-stock events, while streamlining inventorymanagement.
Since the early 1990s, major retailers, such as hypermarket and supermarket chains, have grownand consolidated significantly in many of the countries in which we operate. Such retailers areincreasing their market share within the retail sector and account for a growing proportion of retailsales. The most international among them have also built powerful information systems which allowthem to analyze their purchases across countries and compare prices and the profitability of ourproducts. Some have also created international buying offices or participate in international buyinggroups that seek to establish agreements with suppliers at an international level. In addition, in somecountries hypermarkets and supermarket chains have developed or may develop their own private labelproducts that compete directly with ours.
48
Immediate consumption
Our immediate consumption channels include restaurants and cafes, bars, kiosks, gas stations,sports and leisure venues, hotels and offices. Products sold in our immediate consumption channelstypically generate lower volume and higher margins per retail outlet than our future consumptionchannels.
We believe that consumers generally prefer consuming our beverages chilled. Accordingly, a keystrategy to increase sales in the immediate consumption channel is to ensure that products are availableat the right temperature by making our products available in cold drink equipment, such as coolers.This type of investment also expands our marketplace for impulse consumption by reaching consumersin areas not served by traditional retail outlets, such as offices.
Our focus in developing and emerging countries, such as Poland, Ukraine, the Russian Federationand Nigeria, is to build a basic cold drink infrastructure through the placement of cold drinkequipment. We believe that this will enable us to capitalize on opportunities from the expectedlong-term development of retail outlets in the immediate consumption channel.
As in our future consumption channels, key account management is also necessary in certainimmediate consumption channels, such as national or international quick-service restaurant groups.
Our distribution infrastructure
We operate a mixed distribution system under which we deliver our products to the ultimate pointof sale directly or indirectly through wholesalers and independent distributors.
We deliver our products to the point of sale directly using our own fleet of vehicles or dedicatedindependent third party carriers wherever it is appropriate, based on the structure of the local retailsector and other local considerations. By establishing a dedicated direct delivery capability in certain ofour countries, we have been able to reach customers in areas where few adequate alternativedistribution systems are available. In these countries, we believe that direct delivery to customersrepresents a significant competitive advantage by enabling closer customer relationships and greaterinfluence over how our products are presented to consumers. Direct delivery facilitates locally relevantmarketing and allows us to analyze and respond to retail demand and consumer purchasing patternsthrough merchandising and in-store execution.
In all of our countries, we coordinate and monitor our deliveries through our own warehouse anddistribution network and control centers. Our direct delivery system covers a significant portion of ourcustomers across our countries through 278 distribution centers. Deliveries are generally made between24 and 48 hours from the time an order is taken. We are engaged in an ongoing process of adjustingand restructuring our distribution systems in order to improve customer service, reduce costs andinventory levels and increase asset utilization.
Wholesalers fulfill an important role in the distribution of most retail product categories. We areworking to develop closer relationships with our key wholesalers to ensure that all elements of our salesand marketing efforts are implemented as effectively as possible and that appropriate customer servicelevels are met.
Production
We produce our sparkling beverages by mixing treated water, concentrate and sweetener. Wecarbonate the mixture and fill it into refillable or non-refillable containers on automated filling linesand then package the containers into plastic cases, cardboard cartons or encase them in plastic film onautomated packaging lines.
49
Our processed table waters, Eva and Bonaqua, are produced by stabilizing treated water withozone, subsequently filled into glass and plastic packages for distribution. We add a certain mix andquantity of minerals supplied by The Coca-Cola Company to Bonaqua water as part of the productionprocess. We also add carbon dioxide to carbonated Bonaqua products. For purposes of our Bonaquaproduction in Slovakia, only, we extract and bottle natural spring water from a water source. Themajority of our water products, other than Bonaqua, are natural spring or mineral waters. We producethem by bottling water drawn directly from a water source or well using automated filling lines.
Our non-carbonated products are produced by mixing treated water with, depending on theproduct, concentrated juice and/or concentrate flavors and sugar. They are then pasteurized and filled,in one of three ways: aseptically into multi-layer cardboard or plastic packages: by way of hot-filling andsealing in glass or aluminum packages: or by pasteurizing the product in glass or aluminum packagesafter it is filled and sealed in the container.
Our dairy products are produced from fresh milk to which we apply a separation process toremove the cream. The cream is then added back into the milk at various percentages depending onrequirements for the final product and the final product is subsequently pasteurized. Surplus cream isthen transferred to another line, which is used only for cream pasteurization. The final products arefilled into plastic bottles and distributed to the market place in chilled storage.
Sealed cans and bottles are imprinted with date codes that allow us to fully trace the product’spoint of origin, including the production line on which it was produced, the production batch and thetime of filling. This allows us to identify the ingredients, production parameters and primary packagingused to manufacture each product. The date codes also permit us to track products in the trade and tomonitor and replace inventory in order to provide fresh products. We purchase all of the packages forour products from third parties, except in the case of PET bottles which, in many of our productionfacilities, we manufacture ourselves from preforms or resin.
Quality assurance and food safety
We believe that ensuring our products are safe and of a high quality is critical to the success ofour business. We are fully committed to maintaining the highest standards in each of our countries withrespect to the purity of water, the quality of our other raw materials and ingredients and the integrityof our packaging.
50
We continuously monitor the production process for compliance with these standards. We havesophisticated control equipment for the key areas of our processes to ensure that we comply withapplicable specifications. We manage these control systems through formalized quality managementsystems compliant with the ISO 9001 standard. By the end of 2010, 75 of 77 production sites hadachieved ISO 9001 certification. Two remaining plants, including one newly commissioned site and areopened facility, are scheduled to achieve ISO 9001 certification in 2011. We have implementedHazard and Critical Control Points food safety programs to ensure the safety and hygiene of ourproducts. During 2010, 3 additional plants achieved ISO 22000 food safety standard certification,resulting in 60 of 77 plants being certified by the end of the year. This program will expand to moremanufacturing facilities in 2011, with 10 additional production facilities planned for ISO 22000 foodsafety standard certification. In 2010, The Global Food Safety Initiative (GFSI) formally endorsedFSSC 22000, based on ISO 22000 and PAS 220. During 2010, we enhanced our food safetymanagement systems and achieved FSSC certification in 32 of 77 plants. We plan to enhance andcertify 33 additional locations to FSSC 22000 in 2011. Independent quality audits are also performedregularly to confirm that we comply with quality standards, to assess the effectiveness of our qualityand food safety management systems and to assure that all our key controls are independentlyvalidated. During 2010, 76 quality system audits and 25 compliance audits were conducted on behalf ofThe Coca-Cola Company, and 62 food safety system audits were conducted by independent agenciesacross our 77 production facilities, comprising sparkling beverages and/or juice plants, milk and mineralwater plants, including the production facilities of our joint ventures, were conducted by externalagencies.
We maintain a quality control laboratory at each production facility for the testing of rawmaterials, packaging and finished products to ensure that they comply with local regulatoryrequirements and the strict quality standards stipulated in our bottlers’ agreements with The Coca-ColaCompany. We are also required to obtain supplies of raw materials (ingredients and packaging)exclusively from suppliers approved by The Coca-Cola Company.
In addition, we regularly undertake quality audits in our distribution channels to check compliancewith package and product specifications. This process involves taking regular random samples ofbeverages from various channels and testing them against established quality criteria.
Seasonality
Product sales in all of our countries are generally higher during the warmer months of the year,which are also periods of increased tourist activity in many of our countries, as well as during holidayperiods such as Christmas and Easter. We typically experience our best results of operations during thesecond and third quarters. In 2010, for example, we realized 20.5% of our sales volume in the firstquarter, 27.5% in the second quarter, 29.1% in the third quarter and 22.9% in the fourth quarter.
Raw and packaging materials
Our principal raw material, in terms of volume, is water, and all of our beverages productionfacilities are equipped with water treatment systems to provide treated water that meets all localregulatory requirements and the strict standards of The Coca-Cola Company. Our second keyingredient is concentrate, which we purchase from companies designated by The Coca-Cola Company.Our other major raw materials include sugar and other sweeteners, juice concentrates, carbon dioxide,glass, labels, PET resin, closures, plastic crates, aluminum cans, aseptic carton packages and otherpackaging materials.
51
Expenditure for concentrate constitutes our largest individual raw material cost, representingapproximately 47.1% of our total raw material costs in 2010. Under our bottlers’ agreements with TheCoca-Cola Company, we are required to purchase concentrate for all of the beverages of TheCoca-Cola Company exclusively from companies designated by The Coca-Cola Company. TheCoca-Cola Company also determines the price of concentrate for all of the brands of The Coca-ColaCompany for each country. In practice, however, The Coca-Cola Company normally sets prices afterdiscussions with us so as to reflect trading conditions in the relevant countries and so as to ensure thatsuch prices are in line with our annual marketing plan. Such prices reflect a percentage of our net salesrevenue, otherwise called the incidence rate.
Our principal sweetener is beet sugar, which we purchase from multiple suppliers in Europe. Wealso purchase raw sugar for some of our countries that is then refined into white sugar by third partycontractors, and in some cases we purchase high fructose syrup, which is used either alone or incombination with sugar. We do not separately purchase low-calorie sweeteners because sweeteners forour low-calorie beverage products are contained in the concentrate that we purchase from TheCoca-Cola Company. The term of purchase contracts for sugar is typically for periods of 12 to36 months. Our Armenian, Bosnian, the Former Yugoslav Republic of Macedonia, Nigerian andRussian operations are exposed to the world sugar market. All of our EU markets and Switzerland(indirectly) operate within the sugar regime of the EU. This means that the minimum selling price forsugar is the EU intervention price plus the cost of transport and profit margin. Our operations in thesefifteen EU member countries plus Switzerland use either locally produced or imported sugar or highfructose syrup during the production process. The cost of these sweeteners has begun to decrease as aresult of EU sugar regime reforms, which have reduced subsidies and removed incentives tooverproduce by prohibiting cheap exports outside EU and partially opening the EU market to someless developed countries. Our non-EU markets may be exposed to other local government regulations,which normally restrict imports of sugar below local market prices.
During 2010, we experienced a significant increase in most of our other raw material andpackaging costs. In particular, we experienced a higher than anticipated increase in PET costs. Pricesfor PET had crashed to record low levels in 2009 but have now moved back into line with high crudeoil prices. Prices for PET have also been influenced by increasing sea container demand. As Europeanresin producers struggle, new capacity is becoming limited to the Middle East and Asia, a fact thatthreatens to make our supply chains longer and more complex. We have not experienced supply issueshowever, and believe that price increases are largely the result of strong growth in BRIC countries(Brazil, Russia, India and China) and a return to commodity speculation. Although the price ofaluminum has also increased, our cost for aluminum and cans has decreased due to contracts andhedging executed before such increase. Furthermore, the cost for glass, crowns and aseptic cartonsimproved compared to 2009. Agricultural commodities like sugar, corn and juices are also considerablyimpacted by weather conditions, crop failures and other local supply disruptions.
In compliance with the quality standards prescribed by our bottlers’ agreements with TheCoca-Cola Company, we purchase all containers, closures, cases, aseptic packages and other packagingmaterials and labels from approved manufacturers. We also purchase cold drink equipment, such ascoolers, from approved third party suppliers.
52
Our major cold drink equipment supplier is Frigoglass S.A. In 2010, we made purchases fromFrigoglass S.A. totaling A101.0 million compared to A58.8 million in 2009 and A117.5 million in 2008.The purchases from Frigoglass S.A. in 2010 were comprised of A84.6 million for coolers, other colddrink equipment and spare parts and A16.4 million for raw and packaging materials and otherpurchases. This compares to A21.3 million for the purchase of coolers, other cold drink equipment andspare parts and A37.5 million for purchases of raw and packaging materials in 2009 and A82.6 millionand A34.9 million, respectively, in 2008. The increase in total purchases between 2010 and 2009primarily reflects the fact that capital expenditure for cold drink equipment was significantly reduced in2009.
The purchases of coolers from Frigoglass S.A. in 2010 represented 93.7% of our total coolerrequirements. Boval S.A., the parent of Kar-Tess Holding, holds a 43.9% interest in Frigoglass S.A.Under the terms of a supply agreement that we entered into with Frigoglass S.A. in 1999, initially setto expire on December 31, 2004, but extended in June 2004 and again in December 2008, onsubstantially similar terms, to December 31, 2013, we have the status of a non-exclusive most favoredclient of Frigoglass S.A. We are required to obtain at least 60% of our annual requirements of coolersfrom Frigoglass S.A., in order to maintain our status as a non-exclusive most favored client. We haveentered into all our supply agreements with Frigoglass S.A. on an arm’s length basis. You should readItem 7, ‘‘Major Shareholders and Related Party Transactions—Related Party Transactions—Ourrelationship with Kar-Tess Holding—Supply agreement with Frigoglass S.A.’’ for additional informationon our relationships with Kar-Tess Holding and Frigoglass S.A.
We seek to ensure the reliability of our supplies by using, where possible, a number of alternatesuppliers and transportation contractors. The majority of our procurement operations, other than thoserelating to The Coca-Cola Company’s concentrate, are centrally managed by our central procurementdepartment. During 2008, we began integrating all our procurement activities into a specializedcompany, Coca-Cola Hellenic Procurement GmbH, located in Vienna, Austria.
We believe that we presently have sufficient access to materials and supplies, although strikes,weather conditions, customs duty regulations or other governmental controls or national emergencysituations could adversely affect the supply of specific materials in particular territories. Decreasingglobal demand may result in financing difficulties and excess capacity reductions with respect to certainof our suppliers, although these risks were successfully managed during 2010, during which period wedid not lose any key supplier due to such issues. You should read Item 3 ‘‘Key Information—RiskFactors’’ for additional information on the effect price increases and shortages of raw materials couldhave on our results of operations.
Competition
The non-alcoholic beverages industry is highly competitive in each of our countries. Non-alcoholicbeverages are offered by a wide range of competitors, including major international, European, localand regional beverage companies and hypermarket and supermarket chains through their own privatelabels. In particular, we face intense price competition from local non-premium brand producers anddistributors, which typically produce, market and sell lower quality sparkling beverages and othernon-alcoholic beverages at prices lower than ours, especially during the summer months. In some ofour countries, we are also exposed to the effect of imports from adjacent countries of lower pricedproducts, including, in some cases, trademarked products of The Coca-Cola Company bottled by otherbottlers in the Coca-Cola bottling system.
53
In most of our countries we face greater competition in our combined still and water beveragescategory, where our business is typically less developed and our brands are less established than in ourcore sparkling beverages category, and there are often significant national and international competitorswith established brands and strong market positions. However, we intend to continue to develop ourstill and water beverages business and are confident that our significant capabilities in the sale,marketing and distribution of non-alcoholic beverages, combined with our substantial businessinfrastructure and strong customer relationships, will allow us to improve our competitive position inthis category of our business.
We compete primarily on the basis of pricing, advertising, brand awareness, distribution channels,customer service, retail space management, customer marketing and customer point of access, localconsumer promotions, package innovations, product quality and new products. One of the mostsignificant factors affecting our competitive position is the consumer and customer goodwill associatedwith the trademarks of our products. The Coca-Cola Company plays a central role in the globalmarketing and brand building of its products. We rely on The Coca-Cola Company to enhance theawareness of The Coca-Cola Company’s brands against other non-alcoholic international and localbeverage brands.
The diversity in consumer tastes, distribution channels and economic conditions in the differentcountries in which we operate, and even among the different regions of these countries, is one of themain challenges of our business. We adjust our competitive strategy to local market conditions so thatour products remain attractive, widely available and affordable to local consumers.
Regulation
The production, packaging, transportation, safety, advertising, labeling and ingredients of ourproducts are each subject to various EU, national and local regulations. In particular, EU regulation isincreasingly important to us as approximately 58.0% of our 2010 sales volume was generated from ourcountries that are members of the EU.
The principal areas of regulation to which we are subject are environmental matters and traderegulation. Other regulatory issues involve food laws and food safety, excise and value added taxes.
Environmental matters
We are subject to different environmental legislation and controls in each of our countries. Inaddition, we have initiated our own environmental standards, performance indicators and internalreporting. These controls and standards are often stricter than those required by the local laws of thecountries in which our facilities are located and address specific issues that impact our business. To thisend we are implementing the ISO 14001 environmental management systems in our facilities. By theend of 2010, 70 of our 77 production facilities had been certified to this standard by internationallyrecognized audit bodies. We anticipate further certifications in 2011 in line with our plans to certify allof our plants over the next few years. We plan to achieve certification of newly acquired orcommissioned plants within two years.
54
During 2010, 71 environmental systems audits and 28 compliance audits conducted on behalf ofThe Coca-Cola Company were carried out by independent agencies in our 77 production facilities,comprising sparkling beverages and/or juice, milk and mineral water facilities, including the facilities ofour joint ventures. Our other facilities underwent internal audits. All of these audits were performedfor purposes of establishing key performance indicators and internal reporting processes so as tomonitor compliance with environmental standards going-forward. We have appointed countryenvironmental coordinators who are responsible for implementing and maintaining our environmentalmanagement system, as well as for collecting and reporting country-specific data. They meet on aregular basis to share best practices in this area in order to better manage environmental controlprocesses across the group.
In addition, we have implemented waste minimization and environmental management programswith respect to several aspects of our business, including usage of raw materials, energy consumptionand water discharge. We also cooperate with packaging suppliers to reduce the potential impact ofpackaging materials on global warming in accordance with international guidelines and standards.
Achieving compliance with applicable standards and legislation may require facility modificationsand capital expenditure, such as the installation of waste water treatment plants, and we have in placean active program to ensure that we fully comply with any such requirements. Laws and regulationsmay also restrict noise levels and the discharge of waste products, as well as impose waste treatmentand disposal requirements. Some of the jurisdictions in which we operate have laws and regulations,which require polluters or site owners or occupants to remediate contamination.
EU legislation requires each member state and accession candidate to implement the EU directiveon packaging and packaging waste at the national law level, set waste recovery and recycling targetsand require manufacturers and retailers, including ourselves and our customers, to implement theapplicable standards. The EU packaging directive relates to all types of packaging and its primaryobjective is the minimization of packaging and packaging waste, by requiring an increase in recyclingand re-usage of packaging waste, the promotion of other forms of recovery for packaging waste and, asa result, a reduction of the quantity of disposed packaging waste.
In particular, the directive sets targets for both the recovery and recycling of waste and for thereduction in the quantity of packaging waste for disposal. The directive of 1994, as amended in 2004,required that these targets be achieved by the end of 2008 (2011 for Greece, the Republic of Irelandand Portugal). All new member states had 18 months, until August 2005, to enact national laws toimplement the new directive. New member states of the EU are required to comply by the end of 2012(2013 for Malta, 2014 for Poland and 2015 for Latvia). The directives set forth certain requirements forpackaging and authorize member states to introduce national economic instruments (taxes and levies)to achieve the directives’ objectives within the regulatory framework of a functioning internal marketwithout obstacles to trade and competition distortions. We continue to work closely with governmentsand other industry participants to implement packaging collection schemes. These schemes have eitherbeen implemented or are in the process of implementation in all our EU countries, including ourdeveloping countries.
We expect environmental regulatory standards in the countries in which we operate to continuebecoming increasingly strict. In particular, the regulatory regimes of our Central and Eastern Europeancountries are being aligned with the standards that exist within the rest of the EU. As part of thistrend, the recently admitted EU member countries in which we operate have been implementing newenvironmental standards that are applicable to our operations in those countries. These newenvironmental standards have already increased, and are expected to further increase, our compliancecosts.
55
Trade regulation
Our business, as the bottler of beverages of The Coca-Cola Company and other producers withinspecified geographic countries, is subject to competition laws of general applicability. In particular, theTreaty of Rome, which established the European Economic Community (now the EU), precludesrestrictions on the free movement of goods among the member states. As a result, unlike ourinternational bottlers’ agreements, our European bottlers’ agreements grant exclusive bottling territoriesto us subject to the exception that the EU and/or European Economic Area bottlers of The Coca-ColaCompany’s beverages can, in response to unsolicited orders, sell such products in any EU and/orEuropean Economic Area country. You should read Item 7, ‘‘Major Shareholders and Related PartyTransactions—Related Party Transactions—Our relationship with The Coca-Cola Company—Bottlers’Agreements’’, for additional information on the provisions of our international and European bottlers’agreements, and Item 8, ‘‘Financial Information—Consolidated Statements and Other FinancialInformation—Legal proceedings’’ for information on our undertaking to the European Commissionapplying to our commercial practices in the EU and on certain proceedings against us before nationalcompetition authorities.
Risk management and insurance
You should read Item 6, ‘‘Directors, Senior Management and Employees—Board Practices—Corporate Governance—The identification and management of risk’’.
Information technology
IT systems are critical to our ability to manage our business. Our IT systems enable us tocoordinate our operations, from planning, production scheduling and raw material ordering to order-taking, truck loading, routing, customer delivery, invoicing, customer relationship management anddecision support.
We continue to implement SAP, an integrated system of software applications providing a commonframework for our accounting, planning, production, procurement, infrastructure maintenance, humanresources and cost management activities. We have developed our SAP applications based on a globaltemplate that is being deployed across the group to establish a platform for cross-country operationsand reporting. Our SAP template covers the business areas of commercial, procurement, finance,human resources and supply chain management.
The template is being deployed in two phases, with the first phase covering the back-officeactivities of finance, human resources, supply chain, demand planning/forecasting, cross-border supplychain management, plant/fleet maintenance and business planning with integrated informationreporting. We successfully deployed the first phase across 14 countries, representing 60% of ourvolume, between 2003 and 2006.
In 2006, we further enhanced our SAP template to cover sales and distribution management thatwill eventually replace the legacy system originally developed and maintained by The Coca-ColaCompany. This second phase provides advanced capabilities to address customer-centric activities in theareas of customer relationship management, promotion management, equipment management, fieldsales execution, truck management and yard management. Following the implementation in the CzechRepublic and Slovakia on January 1, 2008, we successfully implemented the enhanced SAP template inItaly, Greece, Bulgaria and Cyprus on January 1, 2010. This deployment was considered by SAP to bethe biggest in Europe, addressing 10,000 employees and one million customers, without any businessdisruption.
56
On January 1, 2011, we further deployed our enhanced template in Austria, Slovenia, Hungary,Poland, Romania and Moldova. The new countries represent an additional 11 production plants and9,000 users serving the needs of 600,000 customers through standard business processes and data.
Our plan is to fully deploy this template across all of our countries by 2014, with a projectedinvestment for the entire program being approximately A230.0 million.
Information technology personnel
In late 2003, we decided to reorganize our corporate and country information systems, or IS,organizations into one functional organization for our entire group. This decision complemented ourstrategy of deploying SAP template based solutions, including applications, data, and hardware, insupport of best practice standards. As a result of this decision, accountability for all IS activities,personnel and budgets has been concentrated with a central IS team. This new organizational structurehas proved instrumental in driving standardization, best practice deployment and operating efficienciesacross our countries. Following the establishment of a shared services organization in Sofia, Bulgaria,we continue to transition country based IT activities and services to this more efficient andcost-effective center, while focusing country capabilities on account management and servicemanagement skills, as well as, specialization in key business processes. Our shared services organizationalso provides new and critical services such as data management, training and SAP consulting in aneffective manner. We continue to reap the benefits of this reorganization from a cost, responsivenessand capability perspective, backed by an ISO 9000 certification by Lloyds Register Quality Assurance.
Information technology infrastructure
We continue to implement infrastructure optimization programs to upgrade, consolidate andoptimize pieces of our IT infrastructure, including desktops/laptops, servers, printers and user supportprocesses.
In 2010, we expanded our communications network and exceeded the 500 interconnected locations,we introduced a secondary internet based cloud for redundancy on critical locations and we generatedan additional A1.1 million savings from infrastructure optimizations and contract re-negotiations. Amajor laptop security improvement program has also been initiated along with an end user devicere-generation.
Green IT
In 2008, we introduced a fourth strategic pillar to IT, ‘‘Green IT’’, with the objective of supportingour goal towards environmental responsibility. Since then, the Green IT initiative has reported a totalsaving of 3837 tons CO2; 900 tons of that during 2010 through audio, webex and video conferencing,multifunction device deployment, server consolidation and data centre improvements. We haveconcluded our major infrastructure optimization projects and expect a natural tapering of new GreenIT savings until new environmental initiatives are identified and launched.
57
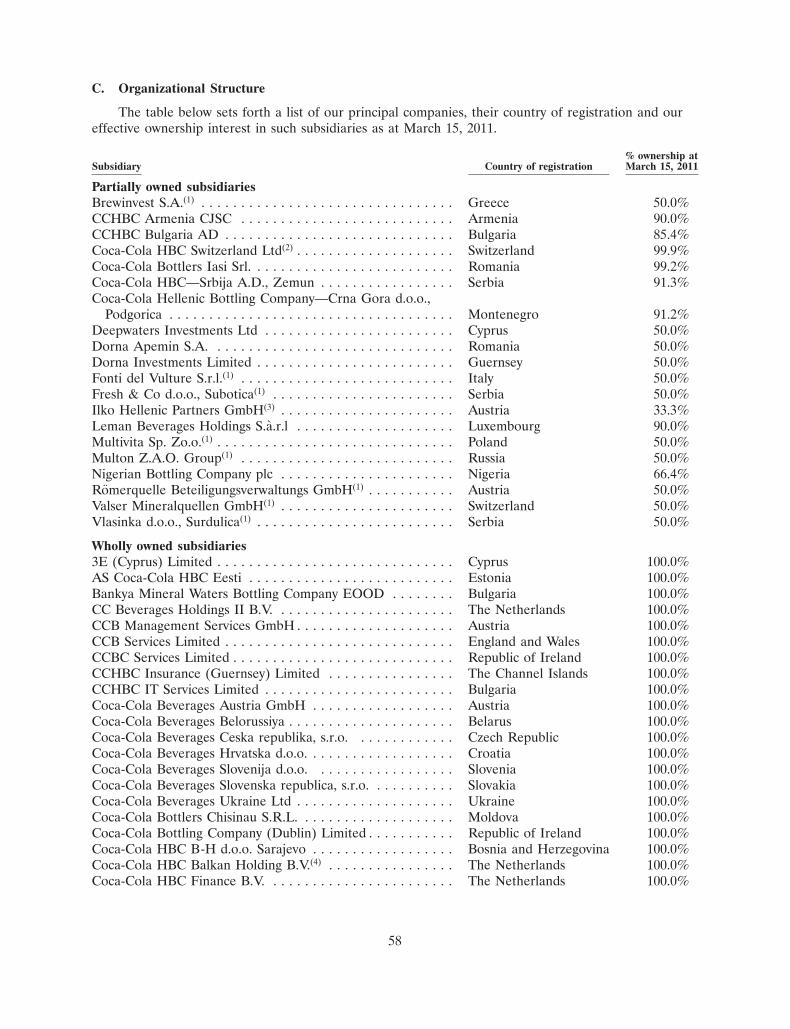
C. Organizational Structure
The table below sets forth a list of our principal companies, their country of registration and oureffective ownership interest in such subsidiaries as at March 15, 2011.
% ownership atSubsidiary Country of registration March 15, 2011
Partially owned subsidiariesBrewinvest S.A.(1) . . . . . . . . . . . . . . . . . . . . . . . . . . . . . . . . Greece 50.0%CCHBC Armenia CJSC . . . . . . . . . . . . . . . . . . . . . . . . . . . Armenia 90.0%CCHBC Bulgaria AD . . . . . . . . . . . . . . . . . . . . . . . . . . . . . Bulgaria 85.4%Coca-Cola HBC Switzerland Ltd(2) . . . . . . . . . . . . . . . . . . . . Switzerland 99.9%Coca-Cola Bottlers Iasi Srl. . . . . . . . . . . . . . . . . . . . . . . . . . Romania 99.2%Coca-Cola HBC—Srbija A.D., Zemun . . . . . . . . . . . . . . . . . Serbia 91.3%Coca-Cola Hellenic Bottling Company—Crna Gora d.o.o.,
Podgorica . . . . . . . . . . . . . . . . . . . . . . . . . . . . . . . . . . . . Montenegro 91.2%Deepwaters Investments Ltd . . . . . . . . . . . . . . . . . . . . . . . . Cyprus 50.0%Dorna Apemin S.A. . . . . . . . . . . . . . . . . . . . . . . . . . . . . . . Romania 50.0%Dorna Investments Limited . . . . . . . . . . . . . . . . . . . . . . . . . Guernsey 50.0%Fonti del Vulture S.r.l.(1) . . . . . . . . . . . . . . . . . . . . . . . . . . . Italy 50.0%Fresh & Co d.o.o., Subotica(1) . . . . . . . . . . . . . . . . . . . . . . . Serbia 50.0%Ilko Hellenic Partners GmbH(3) . . . . . . . . . . . . . . . . . . . . . . Austria 33.3%Leman Beverages Holdings S.a.r.l . . . . . . . . . . . . . . . . . . . . Luxembourg 90.0%Multivita Sp. Zo.o.(1) . . . . . . . . . . . . . . . . . . . . . . . . . . . . . . Poland 50.0%Multon Z.A.O. Group(1) . . . . . . . . . . . . . . . . . . . . . . . . . . . Russia 50.0%Nigerian Bottling Company plc . . . . . . . . . . . . . . . . . . . . . . Nigeria 66.4%Romerquelle Beteiligungsverwaltungs GmbH(1) . . . . . . . . . . . Austria 50.0%Valser Mineralquellen GmbH(1) . . . . . . . . . . . . . . . . . . . . . . Switzerland 50.0%Vlasinka d.o.o., Surdulica(1) . . . . . . . . . . . . . . . . . . . . . . . . . Serbia 50.0%
Wholly owned subsidiaries3E (Cyprus) Limited . . . . . . . . . . . . . . . . . . . . . . . . . . . . . . Cyprus 100.0%AS Coca-Cola HBC Eesti . . . . . . . . . . . . . . . . . . . . . . . . . . Estonia 100.0%Bankya Mineral Waters Bottling Company EOOD . . . . . . . . Bulgaria 100.0%CC Beverages Holdings II B.V. . . . . . . . . . . . . . . . . . . . . . . The Netherlands 100.0%CCB Management Services GmbH . . . . . . . . . . . . . . . . . . . . Austria 100.0%CCB Services Limited . . . . . . . . . . . . . . . . . . . . . . . . . . . . . England and Wales 100.0%CCBC Services Limited . . . . . . . . . . . . . . . . . . . . . . . . . . . . Republic of Ireland 100.0%CCHBC Insurance (Guernsey) Limited . . . . . . . . . . . . . . . . The Channel Islands 100.0%CCHBC IT Services Limited . . . . . . . . . . . . . . . . . . . . . . . . Bulgaria 100.0%Coca-Cola Beverages Austria GmbH . . . . . . . . . . . . . . . . . . Austria 100.0%Coca-Cola Beverages Belorussiya . . . . . . . . . . . . . . . . . . . . . Belarus 100.0%Coca-Cola Beverages Ceska republika, s.r.o. . . . . . . . . . . . . Czech Republic 100.0%Coca-Cola Beverages Hrvatska d.o.o. . . . . . . . . . . . . . . . . . . Croatia 100.0%Coca-Cola Beverages Slovenija d.o.o. . . . . . . . . . . . . . . . . . Slovenia 100.0%Coca-Cola Beverages Slovenska republica, s.r.o. . . . . . . . . . . Slovakia 100.0%Coca-Cola Beverages Ukraine Ltd . . . . . . . . . . . . . . . . . . . . Ukraine 100.0%Coca-Cola Bottlers Chisinau S.R.L. . . . . . . . . . . . . . . . . . . . Moldova 100.0%Coca-Cola Bottling Company (Dublin) Limited . . . . . . . . . . . Republic of Ireland 100.0%Coca-Cola HBC B-H d.o.o. Sarajevo . . . . . . . . . . . . . . . . . . Bosnia and Herzegovina 100.0%Coca-Cola HBC Balkan Holding B.V.(4) . . . . . . . . . . . . . . . . The Netherlands 100.0%Coca-Cola HBC Finance B.V. . . . . . . . . . . . . . . . . . . . . . . . The Netherlands 100.0%
58
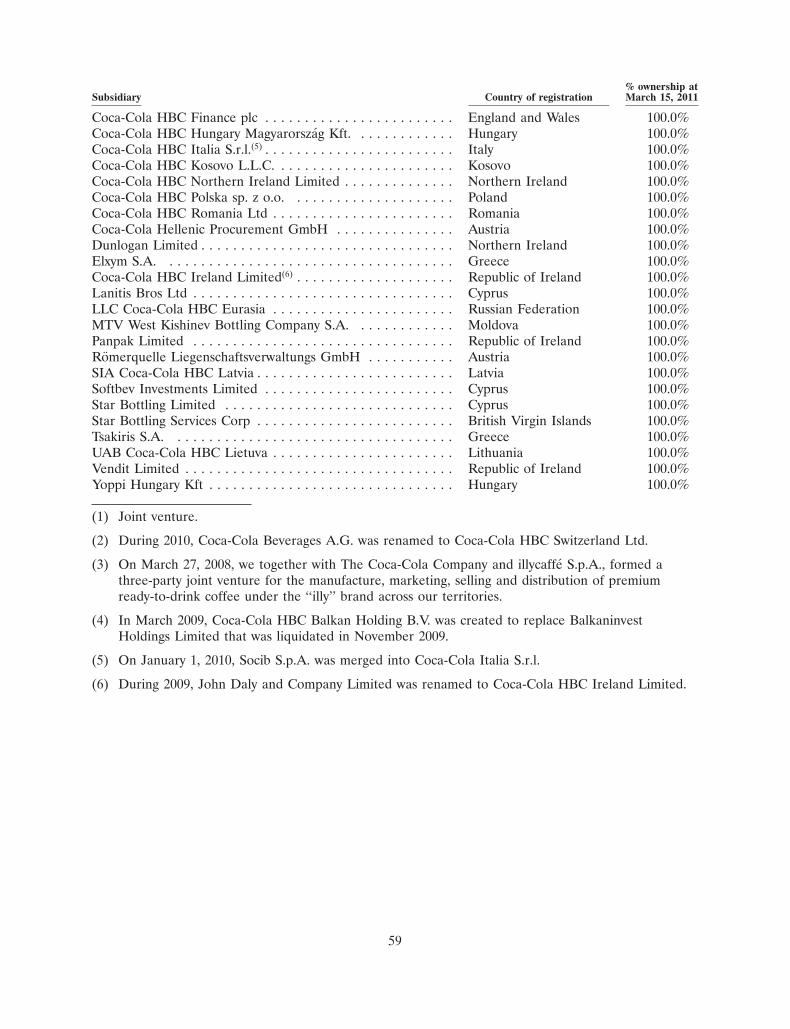
% ownership atSubsidiary Country of registration March 15, 2011
Coca-Cola HBC Finance plc . . . . . . . . . . . . . . . . . . . . . . . . England and Wales 100.0%Coca-Cola HBC Hungary Magyarorszag Kft. . . . . . . . . . . . . Hungary 100.0%Coca-Cola HBC Italia S.r.l.(5) . . . . . . . . . . . . . . . . . . . . . . . . Italy 100.0%Coca-Cola HBC Kosovo L.L.C. . . . . . . . . . . . . . . . . . . . . . . Kosovo 100.0%Coca-Cola HBC Northern Ireland Limited . . . . . . . . . . . . . . Northern Ireland 100.0%Coca-Cola HBC Polska sp. z o.o. . . . . . . . . . . . . . . . . . . . . Poland 100.0%Coca-Cola HBC Romania Ltd . . . . . . . . . . . . . . . . . . . . . . . Romania 100.0%Coca-Cola Hellenic Procurement GmbH . . . . . . . . . . . . . . . Austria 100.0%Dunlogan Limited . . . . . . . . . . . . . . . . . . . . . . . . . . . . . . . . Northern Ireland 100.0%Elxym S.A. . . . . . . . . . . . . . . . . . . . . . . . . . . . . . . . . . . . . Greece 100.0%Coca-Cola HBC Ireland Limited(6) . . . . . . . . . . . . . . . . . . . . Republic of Ireland 100.0%Lanitis Bros Ltd . . . . . . . . . . . . . . . . . . . . . . . . . . . . . . . . . Cyprus 100.0%LLC Coca-Cola HBC Eurasia . . . . . . . . . . . . . . . . . . . . . . . Russian Federation 100.0%MTV West Kishinev Bottling Company S.A. . . . . . . . . . . . . Moldova 100.0%Panpak Limited . . . . . . . . . . . . . . . . . . . . . . . . . . . . . . . . . Republic of Ireland 100.0%Romerquelle Liegenschaftsverwaltungs GmbH . . . . . . . . . . . Austria 100.0%SIA Coca-Cola HBC Latvia . . . . . . . . . . . . . . . . . . . . . . . . . Latvia 100.0%Softbev Investments Limited . . . . . . . . . . . . . . . . . . . . . . . . Cyprus 100.0%Star Bottling Limited . . . . . . . . . . . . . . . . . . . . . . . . . . . . . Cyprus 100.0%Star Bottling Services Corp . . . . . . . . . . . . . . . . . . . . . . . . . British Virgin Islands 100.0%Tsakiris S.A. . . . . . . . . . . . . . . . . . . . . . . . . . . . . . . . . . . . Greece 100.0%UAB Coca-Cola HBC Lietuva . . . . . . . . . . . . . . . . . . . . . . . Lithuania 100.0%Vendit Limited . . . . . . . . . . . . . . . . . . . . . . . . . . . . . . . . . . Republic of Ireland 100.0%Yoppi Hungary Kft . . . . . . . . . . . . . . . . . . . . . . . . . . . . . . . Hungary 100.0%
(1) Joint venture.
(2) During 2010, Coca-Cola Beverages A.G. was renamed to Coca-Cola HBC Switzerland Ltd.
(3) On March 27, 2008, we together with The Coca-Cola Company and illycaffe S.p.A., formed athree-party joint venture for the manufacture, marketing, selling and distribution of premiumready-to-drink coffee under the ‘‘illy’’ brand across our territories.
(4) In March 2009, Coca-Cola HBC Balkan Holding B.V. was created to replace BalkaninvestHoldings Limited that was liquidated in November 2009.
(5) On January 1, 2010, Socib S.p.A. was merged into Coca-Cola Italia S.r.l.
(6) During 2009, John Daly and Company Limited was renamed to Coca-Cola HBC Ireland Limited.
59
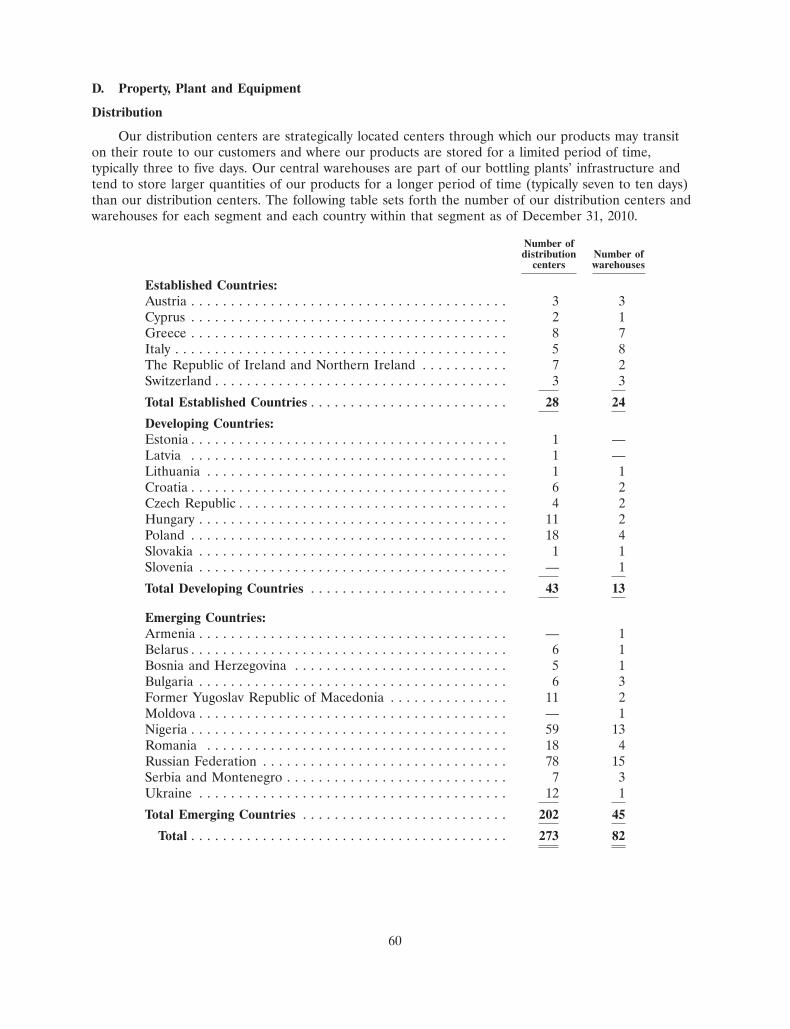
D. Property, Plant and Equipment
Distribution
Our distribution centers are strategically located centers through which our products may transiton their route to our customers and where our products are stored for a limited period of time,typically three to five days. Our central warehouses are part of our bottling plants’ infrastructure andtend to store larger quantities of our products for a longer period of time (typically seven to ten days)than our distribution centers. The following table sets forth the number of our distribution centers andwarehouses for each segment and each country within that segment as of December 31, 2010.
Number ofdistribution Number of
centers warehouses
Established Countries:Austria . . . . . . . . . . . . . . . . . . . . . . . . . . . . . . . . . . . . . . . . 3 3Cyprus . . . . . . . . . . . . . . . . . . . . . . . . . . . . . . . . . . . . . . . . 2 1Greece . . . . . . . . . . . . . . . . . . . . . . . . . . . . . . . . . . . . . . . . 8 7Italy . . . . . . . . . . . . . . . . . . . . . . . . . . . . . . . . . . . . . . . . . . 5 8The Republic of Ireland and Northern Ireland . . . . . . . . . . . 7 2Switzerland . . . . . . . . . . . . . . . . . . . . . . . . . . . . . . . . . . . . . 3 3
Total Established Countries . . . . . . . . . . . . . . . . . . . . . . . . . 28 24
Developing Countries:Estonia . . . . . . . . . . . . . . . . . . . . . . . . . . . . . . . . . . . . . . . . 1 —Latvia . . . . . . . . . . . . . . . . . . . . . . . . . . . . . . . . . . . . . . . . 1 —Lithuania . . . . . . . . . . . . . . . . . . . . . . . . . . . . . . . . . . . . . . 1 1Croatia . . . . . . . . . . . . . . . . . . . . . . . . . . . . . . . . . . . . . . . . 6 2Czech Republic . . . . . . . . . . . . . . . . . . . . . . . . . . . . . . . . . . 4 2Hungary . . . . . . . . . . . . . . . . . . . . . . . . . . . . . . . . . . . . . . . 11 2Poland . . . . . . . . . . . . . . . . . . . . . . . . . . . . . . . . . . . . . . . . 18 4Slovakia . . . . . . . . . . . . . . . . . . . . . . . . . . . . . . . . . . . . . . . 1 1Slovenia . . . . . . . . . . . . . . . . . . . . . . . . . . . . . . . . . . . . . . . — 1
Total Developing Countries . . . . . . . . . . . . . . . . . . . . . . . . . 43 13
Emerging Countries:Armenia . . . . . . . . . . . . . . . . . . . . . . . . . . . . . . . . . . . . . . . — 1Belarus . . . . . . . . . . . . . . . . . . . . . . . . . . . . . . . . . . . . . . . . 6 1Bosnia and Herzegovina . . . . . . . . . . . . . . . . . . . . . . . . . . . 5 1Bulgaria . . . . . . . . . . . . . . . . . . . . . . . . . . . . . . . . . . . . . . . 6 3Former Yugoslav Republic of Macedonia . . . . . . . . . . . . . . . 11 2Moldova . . . . . . . . . . . . . . . . . . . . . . . . . . . . . . . . . . . . . . . — 1Nigeria . . . . . . . . . . . . . . . . . . . . . . . . . . . . . . . . . . . . . . . . 59 13Romania . . . . . . . . . . . . . . . . . . . . . . . . . . . . . . . . . . . . . . 18 4Russian Federation . . . . . . . . . . . . . . . . . . . . . . . . . . . . . . . 78 15Serbia and Montenegro . . . . . . . . . . . . . . . . . . . . . . . . . . . . 7 3Ukraine . . . . . . . . . . . . . . . . . . . . . . . . . . . . . . . . . . . . . . . 12 1
Total Emerging Countries . . . . . . . . . . . . . . . . . . . . . . . . . . 202 45
Total . . . . . . . . . . . . . . . . . . . . . . . . . . . . . . . . . . . . . . . . 273 82
60
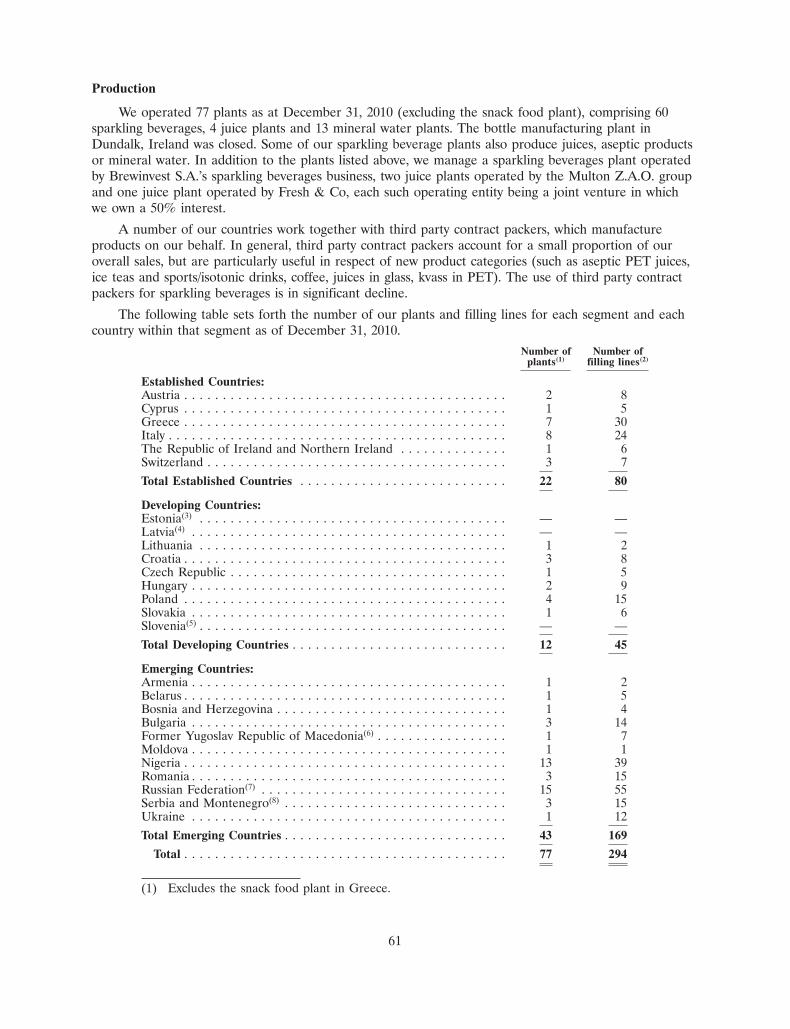
Production
We operated 77 plants as at December 31, 2010 (excluding the snack food plant), comprising 60sparkling beverages, 4 juice plants and 13 mineral water plants. The bottle manufacturing plant inDundalk, Ireland was closed. Some of our sparkling beverage plants also produce juices, aseptic productsor mineral water. In addition to the plants listed above, we manage a sparkling beverages plant operatedby Brewinvest S.A.’s sparkling beverages business, two juice plants operated by the Multon Z.A.O. groupand one juice plant operated by Fresh & Co, each such operating entity being a joint venture in whichwe own a 50% interest.
A number of our countries work together with third party contract packers, which manufactureproducts on our behalf. In general, third party contract packers account for a small proportion of ouroverall sales, but are particularly useful in respect of new product categories (such as aseptic PET juices,ice teas and sports/isotonic drinks, coffee, juices in glass, kvass in PET). The use of third party contractpackers for sparkling beverages is in significant decline.
The following table sets forth the number of our plants and filling lines for each segment and eachcountry within that segment as of December 31, 2010.
Number of Number ofplants(1) filling lines(2)
Established Countries:Austria . . . . . . . . . . . . . . . . . . . . . . . . . . . . . . . . . . . . . . . . . . 2 8Cyprus . . . . . . . . . . . . . . . . . . . . . . . . . . . . . . . . . . . . . . . . . . 1 5Greece . . . . . . . . . . . . . . . . . . . . . . . . . . . . . . . . . . . . . . . . . . 7 30Italy . . . . . . . . . . . . . . . . . . . . . . . . . . . . . . . . . . . . . . . . . . . . 8 24The Republic of Ireland and Northern Ireland . . . . . . . . . . . . . . 1 6Switzerland . . . . . . . . . . . . . . . . . . . . . . . . . . . . . . . . . . . . . . . 3 7Total Established Countries . . . . . . . . . . . . . . . . . . . . . . . . . . . 22 80
Developing Countries:Estonia(3) . . . . . . . . . . . . . . . . . . . . . . . . . . . . . . . . . . . . . . . . — —Latvia(4) . . . . . . . . . . . . . . . . . . . . . . . . . . . . . . . . . . . . . . . . . — —Lithuania . . . . . . . . . . . . . . . . . . . . . . . . . . . . . . . . . . . . . . . . 1 2Croatia . . . . . . . . . . . . . . . . . . . . . . . . . . . . . . . . . . . . . . . . . . 3 8Czech Republic . . . . . . . . . . . . . . . . . . . . . . . . . . . . . . . . . . . . 1 5Hungary . . . . . . . . . . . . . . . . . . . . . . . . . . . . . . . . . . . . . . . . . 2 9Poland . . . . . . . . . . . . . . . . . . . . . . . . . . . . . . . . . . . . . . . . . . 4 15Slovakia . . . . . . . . . . . . . . . . . . . . . . . . . . . . . . . . . . . . . . . . . 1 6Slovenia(5) . . . . . . . . . . . . . . . . . . . . . . . . . . . . . . . . . . . . . . . . — —Total Developing Countries . . . . . . . . . . . . . . . . . . . . . . . . . . . . 12 45
Emerging Countries:Armenia . . . . . . . . . . . . . . . . . . . . . . . . . . . . . . . . . . . . . . . . . 1 2Belarus . . . . . . . . . . . . . . . . . . . . . . . . . . . . . . . . . . . . . . . . . . 1 5Bosnia and Herzegovina . . . . . . . . . . . . . . . . . . . . . . . . . . . . . . 1 4Bulgaria . . . . . . . . . . . . . . . . . . . . . . . . . . . . . . . . . . . . . . . . . 3 14Former Yugoslav Republic of Macedonia(6) . . . . . . . . . . . . . . . . . 1 7Moldova . . . . . . . . . . . . . . . . . . . . . . . . . . . . . . . . . . . . . . . . . 1 1Nigeria . . . . . . . . . . . . . . . . . . . . . . . . . . . . . . . . . . . . . . . . . . 13 39Romania . . . . . . . . . . . . . . . . . . . . . . . . . . . . . . . . . . . . . . . . . 3 15Russian Federation(7) . . . . . . . . . . . . . . . . . . . . . . . . . . . . . . . . 15 55Serbia and Montenegro(8) . . . . . . . . . . . . . . . . . . . . . . . . . . . . . 3 15Ukraine . . . . . . . . . . . . . . . . . . . . . . . . . . . . . . . . . . . . . . . . . 1 12Total Emerging Countries . . . . . . . . . . . . . . . . . . . . . . . . . . . . . 43 169
Total . . . . . . . . . . . . . . . . . . . . . . . . . . . . . . . . . . . . . . . . . . 77 294
(1) Excludes the snack food plant in Greece.
61
(2) Excludes fountain product filling lines and snack food production lines.
(3) In December 2009, we announced the closure of our plant with three bottling lines in Estonia.Two of these bottling lines were subsequently transferred to Lithuania.
(4) We produce the majority of products for the Estonian and Latvian market in Lithuania.
(5) We produce products for the Slovenian market in Austria, Croatia, Czech Republic, Hungary andItaly.
(6) Includes plants and filling lines of Brewinvest S.A., a joint venture of which we own 50% andwhich is engaged in the bottling and distribution of our products in the Former YugoslavRepublic of Macedonia.
(7) Includes plants and filling lines of Multon Z.A.O. group, a virtual joint venture of which we own50% and which is engaged in the bottling and distribution of our juice products in the RussianFederation.
(8) Includes plants and filling lines of Fresh & Co d.o.o. and Vlasinka d.o.o., joint ventures of whichwe own 50% and which are engaged in the bottling of our juice and water products in Serbia andMontenegro.
In recent years, we have made substantial investments in developing modern, highly automatedproduction facilities throughout our countries. In certain cases, this has also entailed establishing plantson greenfield sites and installing our own infrastructure where necessary to ensure consistency andquality of supply of electricity and raw materials, such as water.
We have reduced the number of plants in our countries over time as we have built new and moreefficient plants that have enabled us to close older less efficient plants. For instance, in 2005, wecommenced work on a project in Ireland to develop a single all-island production facility at KnockmoreHill which would replace our existing production facilities there. We have since closed our plants inBelfast and Dublin and have transferred all our production for Ireland to Knockmore Hill. In an effortto consolidate our supply chain infrastructure in Crete, Greece, in 2005 we commenced construction ofa new manufacturing plant and warehouse, which was completed in 2006. Upon completion, we closedthe existing facility and shifted operations to the new one. In February 2006, we closed our Athens,Greece plant and transferred production to our Schimatari plant (which is 40 kilometers away fromAthens). In addition, as part of our rationalization efforts, we closed our warehouses in Messologi,Corfu and Rhodes in Greece, in March 2006, as well as the Oradea plant in Romania in 2008. In 2009,we continued our infrastructure rationalization by closing one plant in Romania, two plants in Italy andone plant in Baltics. In the first quarter of 2007, we also established a new sparkling beverages plant atAbuja, the Nigerian capital to add capacity in the central region with growing demand. Originallycontaining only one returnable glass bottle production line, this plant now includes an additional PETproduction line. Finally, the new production facility at Rostov in the Russian Federation startedproduction in 2010 and will cover demand in the region and eastern Ukraine. The facility features oneaseptic production line, one PET production line and one can production line.
On December 19, 2008 we announced that our production facility in Benin City, Nigeria, wassubstantially damaged by fire, resulting in the destruction of seven production lines. These productionlines were fully replaced in 2009.
In 2009, we began to successfully operate our second fully automated warehouse at the Ploiestiplant in Romania, Nogara being our first such automated warehouse of this size. The Ploiestiwarehouse has 35,000 pallet storage capacity and ensures delivery of up to 400 trucks per day.
We use computer modeling techniques to optimize our production and distribution cost structureon a country-by-country basis. Our system seeks to optimize the location and capacity of ourproduction and distribution facilities based upon present and estimated consumer demand.
62
We believe that we have a modern and technologically advanced mix of production facilities andequipment that is sufficient to satisfy current and estimated future demand. We also believe that ourproduction facilities and equipment give us the ability to further increase our production capacity at arelatively low incremental capital cost. We aim to continually improve the utilization of our asset baseand carefully manage our capital expenditure.
ITEM 4A UNRESOLVED STAFF COMMENTS
None.
ITEM 5 OPERATING AND FINANCIAL REVIEW AND PROSPECTS
Overview
The following Operating and Financial Review and Prospects section is intended to help the readerunderstand our company. This section is provided as a supplement to, and should be read inconjunction with, our audited financial statements and the other financial information containedelsewhere in this annual report. Our financial statements have been prepared in accordance with IFRS.The Operating and Financial Review and Prospects includes the following sections:
• our business, a general description of our business;
• key financial results, a presentation of the most critical financial measures we use to track ouroperating performance;
• major recent transactions, a description of the recent acquisitions and other transactions that haveimpacted, or will impact, our performance;
• application of critical accounting policies, a discussion of accounting policies that require criticaljudgments and estimates;
• principal factors affecting the results of our operations, a discussion of the primary factors thathave a significant impact on our operating performance;
• operating results, an analysis of our consolidated results of operations during the three yearspresented in our financial statements. The analysis is presented both on a consolidated basis,and by business segment through to operating profit;
• liquidity and capital resources, an analysis of cash flows, sources and uses of cash;
• outlook and trend information, a review of the outlook for, and trends affecting, our business;and
• tabular disclosure of contractual obligations, a discussion of our contractual obligations as atDecember 31, 2010.
Our business
Our business consists of producing, selling and distributing non-alcoholic beverages, primarilyproducts of The Coca-Cola Company, which accounted for approximately 96% of our sales volume in2010. We operate in 28 countries, serving a population of approximately 567 million people (includingthrough our equity investment in Brewinvest S.A., a business engaged in the bottling and distribution ofbeer and non-alcoholic beverages in Bulgaria and the Former Yugoslav Republic of Macedonia).
63
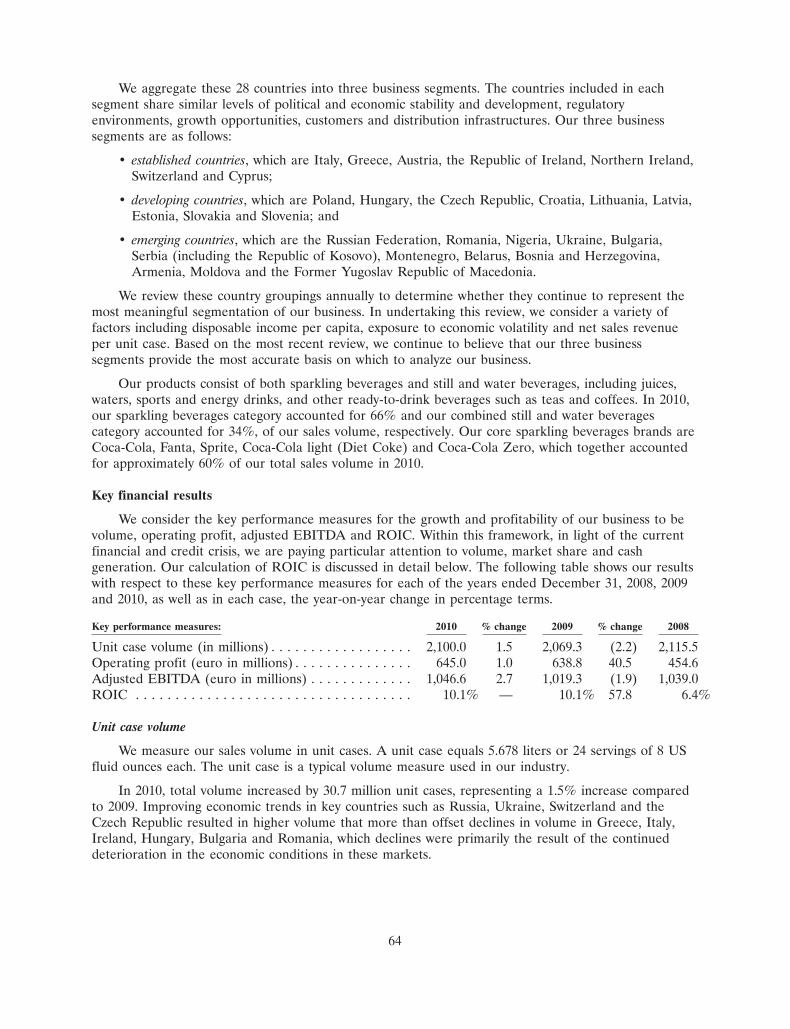
We aggregate these 28 countries into three business segments. The countries included in eachsegment share similar levels of political and economic stability and development, regulatoryenvironments, growth opportunities, customers and distribution infrastructures. Our three businesssegments are as follows:
• established countries, which are Italy, Greece, Austria, the Republic of Ireland, Northern Ireland,Switzerland and Cyprus;
• developing countries, which are Poland, Hungary, the Czech Republic, Croatia, Lithuania, Latvia,Estonia, Slovakia and Slovenia; and
• emerging countries, which are the Russian Federation, Romania, Nigeria, Ukraine, Bulgaria,Serbia (including the Republic of Kosovo), Montenegro, Belarus, Bosnia and Herzegovina,Armenia, Moldova and the Former Yugoslav Republic of Macedonia.
We review these country groupings annually to determine whether they continue to represent themost meaningful segmentation of our business. In undertaking this review, we consider a variety offactors including disposable income per capita, exposure to economic volatility and net sales revenueper unit case. Based on the most recent review, we continue to believe that our three businesssegments provide the most accurate basis on which to analyze our business.
Our products consist of both sparkling beverages and still and water beverages, including juices,waters, sports and energy drinks, and other ready-to-drink beverages such as teas and coffees. In 2010,our sparkling beverages category accounted for 66% and our combined still and water beveragescategory accounted for 34%, of our sales volume, respectively. Our core sparkling beverages brands areCoca-Cola, Fanta, Sprite, Coca-Cola light (Diet Coke) and Coca-Cola Zero, which together accountedfor approximately 60% of our total sales volume in 2010.
Key financial results
We consider the key performance measures for the growth and profitability of our business to bevolume, operating profit, adjusted EBITDA and ROIC. Within this framework, in light of the currentfinancial and credit crisis, we are paying particular attention to volume, market share and cashgeneration. Our calculation of ROIC is discussed in detail below. The following table shows our resultswith respect to these key performance measures for each of the years ended December 31, 2008, 2009and 2010, as well as in each case, the year-on-year change in percentage terms.
Key performance measures: 2010 % change 2009 % change 2008
Unit case volume (in millions) . . . . . . . . . . . . . . . . . . 2,100.0 1.5 2,069.3 (2.2) 2,115.5Operating profit (euro in millions) . . . . . . . . . . . . . . . 645.0 1.0 638.8 40.5 454.6Adjusted EBITDA (euro in millions) . . . . . . . . . . . . . 1,046.6 2.7 1,019.3 (1.9) 1,039.0ROIC . . . . . . . . . . . . . . . . . . . . . . . . . . . . . . . . . . . 10.1% — 10.1% 57.8 6.4%
Unit case volume
We measure our sales volume in unit cases. A unit case equals 5.678 liters or 24 servings of 8 USfluid ounces each. The unit case is a typical volume measure used in our industry.
In 2010, total volume increased by 30.7 million unit cases, representing a 1.5% increase comparedto 2009. Improving economic trends in key countries such as Russia, Ukraine, Switzerland and theCzech Republic resulted in higher volume that more than offset declines in volume in Greece, Italy,Ireland, Hungary, Bulgaria and Romania, which declines were primarily the result of the continueddeterioration in the economic conditions in these markets.
64
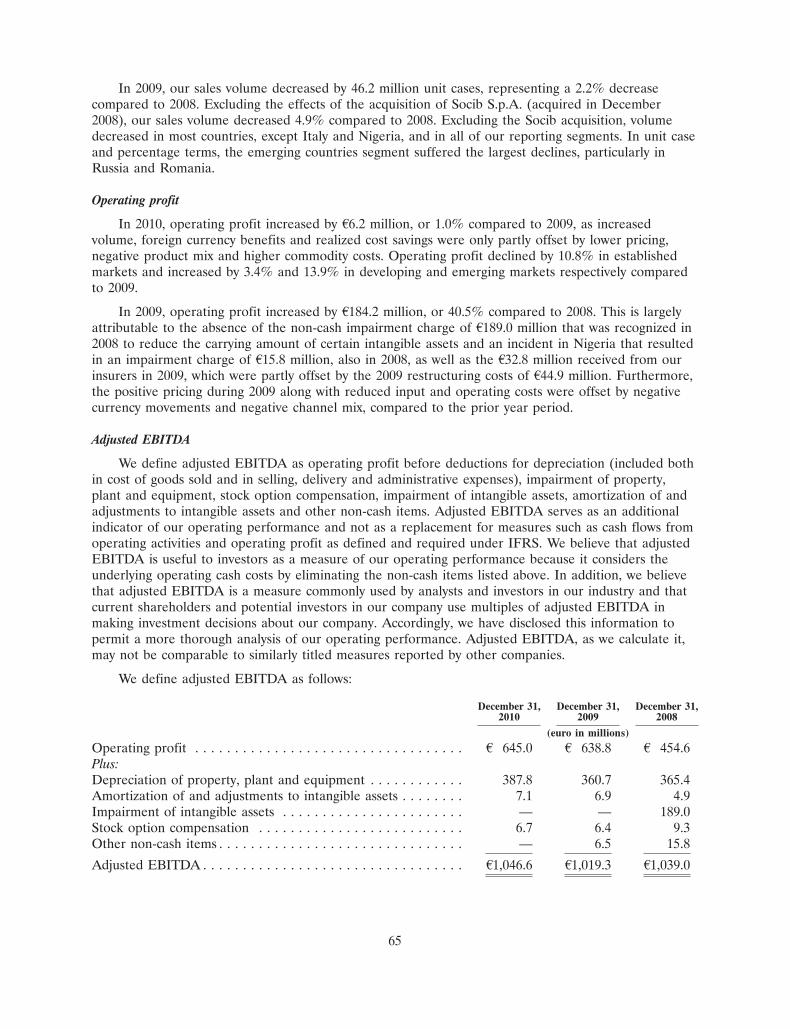
In 2009, our sales volume decreased by 46.2 million unit cases, representing a 2.2% decreasecompared to 2008. Excluding the effects of the acquisition of Socib S.p.A. (acquired in December2008), our sales volume decreased 4.9% compared to 2008. Excluding the Socib acquisition, volumedecreased in most countries, except Italy and Nigeria, and in all of our reporting segments. In unit caseand percentage terms, the emerging countries segment suffered the largest declines, particularly inRussia and Romania.
Operating profit
In 2010, operating profit increased by A6.2 million, or 1.0% compared to 2009, as increasedvolume, foreign currency benefits and realized cost savings were only partly offset by lower pricing,negative product mix and higher commodity costs. Operating profit declined by 10.8% in establishedmarkets and increased by 3.4% and 13.9% in developing and emerging markets respectively comparedto 2009.
In 2009, operating profit increased by A184.2 million, or 40.5% compared to 2008. This is largelyattributable to the absence of the non-cash impairment charge of A189.0 million that was recognized in2008 to reduce the carrying amount of certain intangible assets and an incident in Nigeria that resultedin an impairment charge of A15.8 million, also in 2008, as well as the A32.8 million received from ourinsurers in 2009, which were partly offset by the 2009 restructuring costs of A44.9 million. Furthermore,the positive pricing during 2009 along with reduced input and operating costs were offset by negativecurrency movements and negative channel mix, compared to the prior year period.
Adjusted EBITDA
We define adjusted EBITDA as operating profit before deductions for depreciation (included bothin cost of goods sold and in selling, delivery and administrative expenses), impairment of property,plant and equipment, stock option compensation, impairment of intangible assets, amortization of andadjustments to intangible assets and other non-cash items. Adjusted EBITDA serves as an additionalindicator of our operating performance and not as a replacement for measures such as cash flows fromoperating activities and operating profit as defined and required under IFRS. We believe that adjustedEBITDA is useful to investors as a measure of our operating performance because it considers theunderlying operating cash costs by eliminating the non-cash items listed above. In addition, we believethat adjusted EBITDA is a measure commonly used by analysts and investors in our industry and thatcurrent shareholders and potential investors in our company use multiples of adjusted EBITDA inmaking investment decisions about our company. Accordingly, we have disclosed this information topermit a more thorough analysis of our operating performance. Adjusted EBITDA, as we calculate it,may not be comparable to similarly titled measures reported by other companies.
We define adjusted EBITDA as follows:
December 31, December 31, December 31,2010 2009 2008
(euro in millions)
Operating profit . . . . . . . . . . . . . . . . . . . . . . . . . . . . . . . . . . A 645.0 A 638.8 A 454.6Plus:Depreciation of property, plant and equipment . . . . . . . . . . . . 387.8 360.7 365.4Amortization of and adjustments to intangible assets . . . . . . . . 7.1 6.9 4.9Impairment of intangible assets . . . . . . . . . . . . . . . . . . . . . . . — — 189.0Stock option compensation . . . . . . . . . . . . . . . . . . . . . . . . . . 6.7 6.4 9.3Other non-cash items . . . . . . . . . . . . . . . . . . . . . . . . . . . . . . . — 6.5 15.8
Adjusted EBITDA . . . . . . . . . . . . . . . . . . . . . . . . . . . . . . . . . A1,046.6 A1,019.3 A1,039.0
65
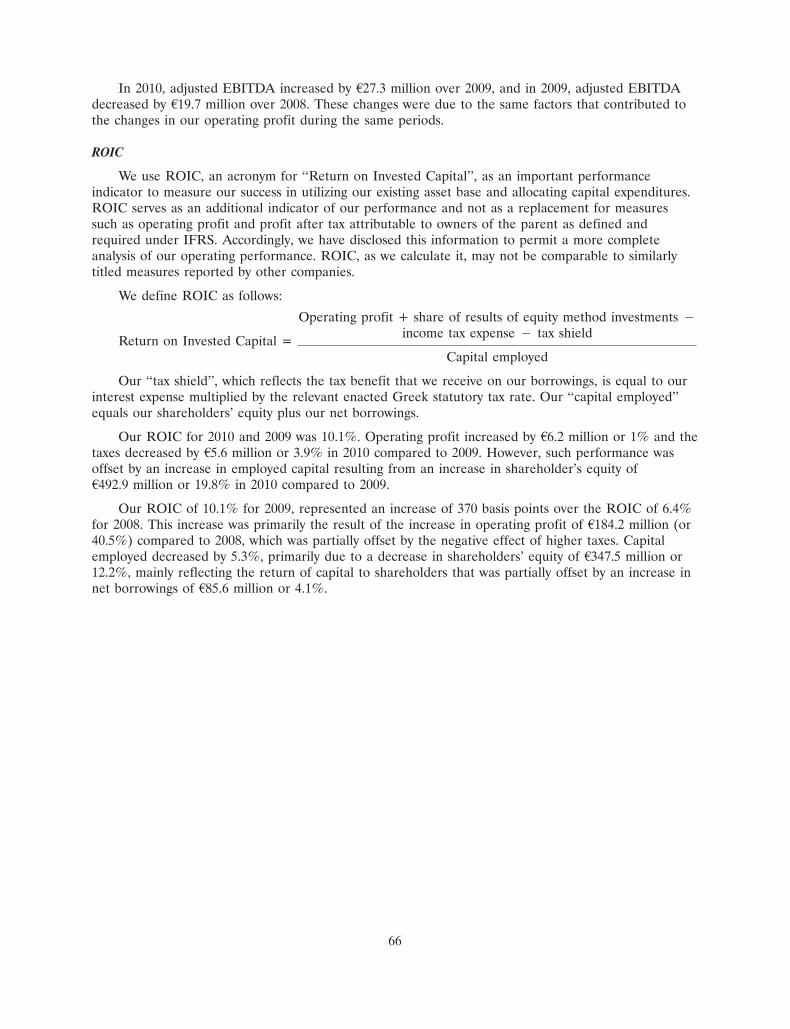
In 2010, adjusted EBITDA increased by A27.3 million over 2009, and in 2009, adjusted EBITDAdecreased by A19.7 million over 2008. These changes were due to the same factors that contributed tothe changes in our operating profit during the same periods.
ROIC
We use ROIC, an acronym for ‘‘Return on Invested Capital’’, as an important performanceindicator to measure our success in utilizing our existing asset base and allocating capital expenditures.ROIC serves as an additional indicator of our performance and not as a replacement for measuressuch as operating profit and profit after tax attributable to owners of the parent as defined andrequired under IFRS. Accordingly, we have disclosed this information to permit a more completeanalysis of our operating performance. ROIC, as we calculate it, may not be comparable to similarlytitled measures reported by other companies.
We define ROIC as follows:
Operating profit + share of results of equity method investments �income tax expense � tax shieldReturn on Invested Capital =
Capital employed
Our ‘‘tax shield’’, which reflects the tax benefit that we receive on our borrowings, is equal to ourinterest expense multiplied by the relevant enacted Greek statutory tax rate. Our ‘‘capital employed’’equals our shareholders’ equity plus our net borrowings.
Our ROIC for 2010 and 2009 was 10.1%. Operating profit increased by A6.2 million or 1% and thetaxes decreased by A5.6 million or 3.9% in 2010 compared to 2009. However, such performance wasoffset by an increase in employed capital resulting from an increase in shareholder’s equity ofA492.9 million or 19.8% in 2010 compared to 2009.
Our ROIC of 10.1% for 2009, represented an increase of 370 basis points over the ROIC of 6.4%for 2008. This increase was primarily the result of the increase in operating profit of A184.2 million (or40.5%) compared to 2008, which was partially offset by the negative effect of higher taxes. Capitalemployed decreased by 5.3%, primarily due to a decrease in shareholders’ equity of A347.5 million or12.2%, mainly reflecting the return of capital to shareholders that was partially offset by an increase innet borrowings of A85.6 million or 4.1%.
66
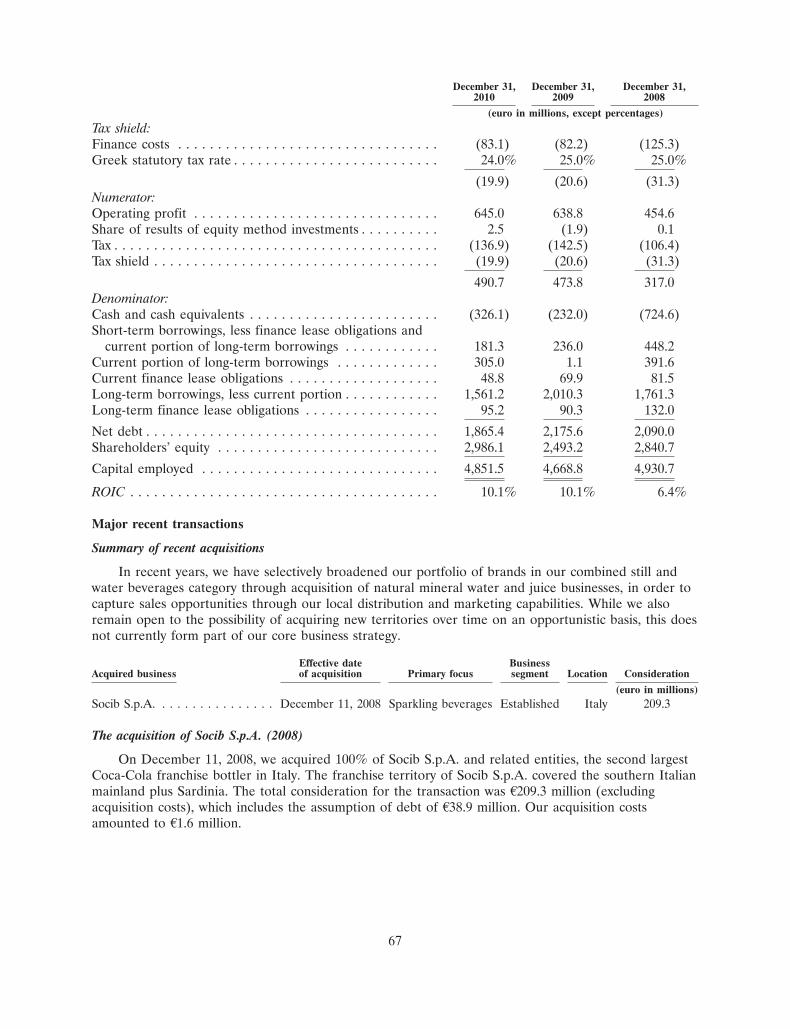
December 31, December 31, December 31,2010 2009 2008
(euro in millions, except percentages)
Tax shield:Finance costs . . . . . . . . . . . . . . . . . . . . . . . . . . . . . . . . . (83.1) (82.2) (125.3)Greek statutory tax rate . . . . . . . . . . . . . . . . . . . . . . . . . . 24.0% 25.0% 25.0%
(19.9) (20.6) (31.3)Numerator:Operating profit . . . . . . . . . . . . . . . . . . . . . . . . . . . . . . . 645.0 638.8 454.6Share of results of equity method investments . . . . . . . . . . 2.5 (1.9) 0.1Tax . . . . . . . . . . . . . . . . . . . . . . . . . . . . . . . . . . . . . . . . . (136.9) (142.5) (106.4)Tax shield . . . . . . . . . . . . . . . . . . . . . . . . . . . . . . . . . . . . (19.9) (20.6) (31.3)
490.7 473.8 317.0Denominator:Cash and cash equivalents . . . . . . . . . . . . . . . . . . . . . . . . (326.1) (232.0) (724.6)Short-term borrowings, less finance lease obligations and
current portion of long-term borrowings . . . . . . . . . . . . 181.3 236.0 448.2Current portion of long-term borrowings . . . . . . . . . . . . . 305.0 1.1 391.6Current finance lease obligations . . . . . . . . . . . . . . . . . . . 48.8 69.9 81.5Long-term borrowings, less current portion . . . . . . . . . . . . 1,561.2 2,010.3 1,761.3Long-term finance lease obligations . . . . . . . . . . . . . . . . . 95.2 90.3 132.0
Net debt . . . . . . . . . . . . . . . . . . . . . . . . . . . . . . . . . . . . . 1,865.4 2,175.6 2,090.0Shareholders’ equity . . . . . . . . . . . . . . . . . . . . . . . . . . . . 2,986.1 2,493.2 2,840.7
Capital employed . . . . . . . . . . . . . . . . . . . . . . . . . . . . . . 4,851.5 4,668.8 4,930.7
ROIC . . . . . . . . . . . . . . . . . . . . . . . . . . . . . . . . . . . . . . . 10.1% 10.1% 6.4%
Major recent transactions
Summary of recent acquisitions
In recent years, we have selectively broadened our portfolio of brands in our combined still andwater beverages category through acquisition of natural mineral water and juice businesses, in order tocapture sales opportunities through our local distribution and marketing capabilities. While we alsoremain open to the possibility of acquiring new territories over time on an opportunistic basis, this doesnot currently form part of our core business strategy.
Effective date BusinessAcquired business of acquisition Primary focus segment Location Consideration
(euro in millions)Socib S.p.A. . . . . . . . . . . . . . . . December 11, 2008 Sparkling beverages Established Italy 209.3
The acquisition of Socib S.p.A. (2008)
On December 11, 2008, we acquired 100% of Socib S.p.A. and related entities, the second largestCoca-Cola franchise bottler in Italy. The franchise territory of Socib S.p.A. covered the southern Italianmainland plus Sardinia. The total consideration for the transaction was A209.3 million (excludingacquisition costs), which includes the assumption of debt of A38.9 million. Our acquisition costsamounted to A1.6 million.
67
Sale of Romerquelle trademark (2008)
On June 26, 2008, we sold to The Coca-Cola Company a legal entity owning the trademarks forthe Romerquelle group of brands and 50% of a legal entity that acts as the operating entity, and thatholds rights to the water source, for the Romerquelle group of brands. We have formed a joint venturewith The Coca-Cola Company in respect of the production, sale and distribution of the Romerquellegroup of brands.
Share buy-back (2009 and 2010)
On April 30, 2009, our board of directors authorized a buy-back program for a maximum of up to5% of our paid-in share capital during the 24-month period from the date of the ExtraordinaryGeneral Meeting of April 27, 2009 which approved a share buy-back program pursuant to Article 16 ofCodified Law 2190/1920 (i.e. until April 26, 2011). Based on our capitalization at that date, themaximum amount that may be bought back pursuant to the program is 18,270,104 shares. Purchasesunder the program are subject to a minimum purchase price of A1.00 per share and a maximumpurchase price of A20.00 per share. Applicable law does not require any actual use of suchauthorization. We may therefore, in our sole discretion, decide not to buy back any shares or to buyfewer shares than the maximum permissible number approved under the program. As at December 31,2010, 3,430,135 shares had been bought back pursuant to the share buy-back program for a total ofA57.2 million. No additional shares were subsequently purchased up to March 15, 2011.
Delisting from Australian Stock Exchange (2009)
On June 2, 2009, we announced our intention to seek our removal from the official list of theAustralian Stock Exchange Limited, or ASX. Trading of our CHESS Depositary Interests, or CDIs wassuspended from the close of the market on August 26, 2009 with delisting of our CDIs effected at theclose of trading on September 2, 2009. Our decision to delist was due to the low level of CDIs quotedon the ASX and the low level of trading on the ASX compared to the other exchanges. These factorsmade it unlikely that we would seek to raise further equity capital via our ASX listing. Under thesecircumstances, we wanted to avoid the administrative costs related to an ASX listing.
Re-capitalization (capital return) (2009)
On September 18, 2009, we announced proposals for a re-capitalization, which resulted in a capitalreturn of A548.1 million to our shareholders, i.e. A1.50 per share. At the extraordinary general meetingheld on October 16, 2009, our shareholders approved an increase of our share capital by A548.1 million,through the partial capitalization of share premium and an increase in the nominal value of each shareby A1.50 per share. At the same extraordinary general meeting, our shareholders also approved thedecrease of our share capital by A548.1 million, through a reduction of the nominal value of the sharesby A1.50 per share and an equal amount of capital was returned to the shareholders in cash. Followingshareholders and regulatory approval, we realized the capital return on December 2, 2009. The capitalreturn was financed through a combination of accumulated cash and new debt.
Application of critical accounting policies
Our discussion and analysis of financial condition and results of operations are based upon ourconsolidated financial statements. Our consolidated financial statements are prepared in accordancewith IFRS, both as issued by the IASB and as adopted by the EU. All IFRS issued by the IASB, whichapply to the preparation of these consolidated financial statements, have been adopted by the EUfollowing an approval process undertaken by the European Commission and the European FinancialReporting Advisory Group, or EFRAG.
68
We believe the following critical accounting policies include our more significant judgments andestimates used in the preparation of our consolidated financial statements. You should read this sectionin conjunction with note 1 to our consolidated financial statements contained elsewhere in this annualreport. Management has discussed the development, selection and disclosure of these criticalaccounting policies with the audit committee of our board of directors.
Critical accounting judgments and estimates
In conformity with generally accepted accounting principles, the preparation of our consolidatedfinancial statements requires management to make estimates and assumptions that affect the reportedamounts of assets, liabilities, revenues and expenses, and the disclosure of contingent assets andliabilities in the consolidated financial statements and accompanying notes. Although these estimatesare based on management’s knowledge of current events and actions that may be undertaken in thefuture, actual results may ultimately differ from these estimates.
Income taxes
We are subject to income taxes in numerous jurisdictions. There are many transactions andcalculations for which the ultimate tax determination is uncertain during the ordinary course ofbusiness. We recognize liabilities for anticipated tax audit issues based on estimates of whetheradditional taxes will be due. Where the final tax outcome of these matters is different from theamounts that were initially recorded, such differences will impact the income tax provision in theperiod in which such determination is made. We anticipate that were the final tax outcome, on thejudgment areas, to differ from management’s estimates by up to 10%, our consolidated tax expensewould increase (or decrease) by less than A3.0 million.
Impairment of goodwill and indefinite-lived intangible assets
Determining whether goodwill or indefinite-lived intangible assets are impaired requires anestimation of the value-in-use of the cash-generating units to which they have been allocated. Thevalue-in-use calculation requires that we estimate the future cash flows expected to arise from thecash-generating unit and a suitable discount rate in order to calculate present value. These assumptionsand a discussion on how they are established are described in note 4 to our consolidated financialstatements.
Employee Benefits—Defined Benefit Pension Plans
We provide defined benefit pension plans as an employee benefit in certain territories.Determining the value of these plans requires several actuarial assumptions and estimates aboutdiscount rates, expected rates of return on assets, future salary increases, mortality rates and futurepension increases. Due to the long-term nature of these plans, such estimates are subject to significantuncertainty. These assumptions and a discussion on how they are established are described in note 17to our consolidated financial statements.
69
Intangible assets
Intangible assets comprise a significant portion of our balance sheet. As at December 31, 2010,there was A1,966.9 million of intangible assets recorded on our balance sheet, reflecting 27.2% of ourtotal assets. The main components of this intangible asset balance were A1,710.3 million of goodwill,A157.7 million of franchise agreements (primarily related to our bottlers’ agreements with TheCoca-Cola Company) and A85.4 million of trademarks. Goodwill is the excess of the cost of anacquisition over the fair value of the share of net assets acquired. The Coca-Cola Company does notgrant perpetual franchise rights outside the United States, however, we believe our franchiseagreements, consistent with past experience, will continue to be renewed at each expiration date andhave therefore been assigned indefinite useful lives. Goodwill and other indefinite-lived intangibleassets are not amortized but rather tested for impairment annually and whenever there is an indicationof impairment. Goodwill and other indefinite-lived intangible assets are carried at cost less accumulatedimpairment losses. The useful lives, both finite and indefinite, assigned to intangible assets areevaluated on an annual basis.
Impairment of non-financial assets
Goodwill and other indefinite-lived assets are not subject to amortization but are tested forimpairment at least annually. Property, plant and equipment and other non-financial assets that aresubject to amortization are reviewed for impairment whenever events or changes in circumstancesindicate that the carrying amount may not be recoverable. An impairment loss is recognized for theamount by which the carrying amount of the asset exceeds its recoverable amount, which is the higherof the asset’s fair value less cost to sell and its value-in-use. For the purposes of assessing impairment,assets are grouped at the lowest level of separately identifiable cash flows.
Contingencies
We are subject to various claims and contingencies related to legal proceedings and tax matters.Due to their nature, such legal proceedings and tax matters involve inherent uncertainties including,but not limited to, court rulings, negotiations between affected parties and governmental actions.Management assesses the probability of loss for such contingencies and accrues a liability and/ordiscloses the relevant circumstances, as appropriate. For additional information, see also Item 8,‘‘Financial Information—Consolidated Statements and Other Financial Information—Legalproceedings’’.
Principal factors affecting the results of our operations
Our relationship with The Coca-Cola Company
General
We are a producer, distributor and seller primarily of the products of The Coca-Cola Company.The Coca-Cola Company controls the global product development and marketing of its brands. TheCoca-Cola Company’s ability to perform these functions successfully has a direct effect on our salesvolume and results of operations. We produce the beverages of The Coca-Cola Company, engage inlocal marketing and promotional activities, establish business relationships with local customers, developlocal distribution channels and distribute the products of The Coca-Cola Company to customers eitherdirectly or indirectly through independent distributors and wholesalers. Our business relationship withThe Coca-Cola Company is mainly governed by bottlers’ agreements entered into between TheCoca-Cola Company and us. You should read Item 7 ‘‘Major Shareholders and Related PartyTransactions—Related Party Transactions—Our relationship with The Coca-Cola Company’’ foradditional information on our relationship with The Coca-Cola Company and a detailed description ofthe terms of the bottlers’ agreements.
70
Purchase of concentrate
Expenditure for concentrate constitutes our largest individual raw material cost. The cost ofconcentrate purchased from The Coca-Cola Company during 2010 amounted to A1,294.9 million, ascompared to A1,246.0 million for 2009 and A1,297.2 million in 2008. Concentrate purchased from TheCoca-Cola Company represented approximately 32.0% of our total cost of goods sold in 2010,compared with 35.0% in 2009 and 35.9% in 2008. Under our bottlers’ agreements, we are required topurchase concentrate for all beverages of The Coca-Cola Company from companies designated by TheCoca-Cola Company. The Coca-Cola Company is entitled under the bottlers’ agreements to determinethe price we pay for concentrate at its discretion. In practice, however, The Coca-Cola Companynormally sets the price after discussions with us to reflect trading conditions in the relevant countriesand to be in line with our annual marketing plan.
We expect amounts of concentrate purchased from The Coca-Cola Company to track our salesvolume growth. We anticipate the price of concentrate we purchase from The Coca-Cola Company foreach of the countries in which we operate to be determined mainly by reference to inflation and ourability to implement price increases in the relevant country.
Pricing in countries outside the EU
The Coca-Cola Company is also entitled, under the bottlers’ agreements and to the extentpermitted by local law, to set the maximum price we may charge to our customers in countries outsidethe EU. In practice, we work closely with The Coca-Cola Company to determine our pricing strategy inlight of the trading conditions prevailing at the relevant time in each of these countries. Thecombination of The Coca-Cola Company’s right to set our concentrate prices and its right to limit ourselling prices in our countries outside the EU could give The Coca-Cola Company considerableinfluence over our gross profit margins.
Marketing and promotional support
The Coca-Cola Company makes contributions to us in respect of marketing and promotionalsupport programs to promote the sale of its products in our territories. Contributions received fromThe Coca-Cola Company for marketing and promotional support programs amounted to A60.8 million,A56.9 million and A45.8 million for the years ended December 31, 2010, 2009 and 2008, respectively.These contributions, if related to payments we make to specific customers for marketing andpromotional incentives, are recognized as a reduction of our payments to customers. These payments tocustomers, net of contributions received from The Coca-Cola Company, are deducted from salesrevenue. In 2010, such contributions totaled A48.8 million as compared to A39.9 million in 2009 andA37.6 million in 2008. Payments for marketing programs not specifically attributable to a particularcustomer are recognized as a reduction of selling expenses. In 2010, these contributions amounted toA15.8 million compared to A22.5 million in 2009 and A15.2 million in 2008. The levels of supportprograms are jointly determined annually on a territory-by-territory basis to reflect the mutually agreedannual marketing plan for that territory and expected sales volume for the year. The Coca-ColaCompany is under no obligation to participate in the programs or continue past levels of funding intothe future. Given our relationship with The Coca-Cola Company to date, there is no reason to believethat such support will be reduced or withdrawn in the future.
71
Other transactions with The Coca-Cola Company
We enter into a number of other transactions with The Coca-Cola Company in the context of ourbusiness relationship. During 2008, we sold trademarks to The Coca-Cola Company for total cashproceeds of A35.0 million. Of this, A25.7 million related to the sale of the ‘‘Romerquelle’’ trademark,A5.5 million to the sale of the ‘‘Lanitis’’ juice trademark and A3.8 million related to the sale of the‘‘botaniQ’’ trademark. The A3.8 million paid for the ‘‘botaniQ’’ trademark represented The Coca-ColaCompany’s share of the A7.6 million purchase price paid by the Multon Z.A.O. group. In June 2008, wesold to The Coca-Cola Company a legal entity containing the trademarks for the Romerquelle group ofbrands and 50% of a legal entity that will act as the operating entity, and that contains rights to thewater source, for the Romerquelle group of brands.
Other income primarily comprises rent, facility and other costs of A14.3 million in 2010 comparedto A4.4 million in 2009 and A2.9 million in 2008, and a toll-filling relationship in Poland of A17.6 millionin 2010 compared to A15.0 million in 2009 and A18.2 million in 2008. Other expenses relate to facilitycosts charged by The Coca-Cola Company, and shared costs. There were no other expenses in 2010related to facility costs charged by The Coca-Cola Company and shared costs, compared to A1.5 millionin 2009 and A2.5 million in 2008. With the exception of the toll-filling arrangements, balances areincluded in operating expenses.
In addition to concentrate, we purchase from The Coca-Cola Company finished goods and othermaterials. The cost of these purchases amounted to A78.0 million in 2010, as compared to A37.6 millionin 2009 and A93.7 million in 2008. The purchases of finished goods are primarily purchases ofPowerAde products. We also purchase concentrate from Beverage Partners Worldwide, a 50/50 jointventure between The Coca-Cola Company and Nestle. Purchases of concentrate from BeveragePartners Worldwide amounted to A89.4 million in 2010, as compared to A70.4 million in 2009 andA102.0 million in 2008. These amounts are included in our cost of goods sold.
During 2010, we sold A19.0 million of finished goods and raw materials to The Coca-ColaCompany, as compared to sales of A20.5 million for 2009 and of A11.7 million for 2008.
In March 2008, we formed a three-party joint venture with The Coca-Cola Company and illycaffeSpA for the manufacture, marketing, selling and distributing of premium ready-to-drink coffee underthe illy brand across our territories.
During 2010, we purchased A4.4 million in franchise rights, as compared to nil in 2009. In 2010, wereceived A4.9 million as compared to nil in 2009, from the sale of available-for-sale assets to TheCoca-Cola Company.
All transactions with The Coca-Cola Company are conducted on an arm’s length basis.
Amounts payable to and receivable from The Coca-Cola Company
As at December 31, 2010, The Coca-Cola Company owed us A53.8 million, as compared toA64.2 million and A106.8 million as at December 31, 2009 and 2008, respectively of which A3.0 million,A6.7 million, A4.5 million as at December 31, 2010, 2009 and 2008 related to loans to joint ventureswith The Coca-Cola Company. We owed The Coca-Cola Company a total of A166.0 million,A125.1 million and A160.0 million as at December 31, 2010, 2009 and 2008, respectively.
72
Economic conditions
Challenging economic and financial conditions continued to play a major role in our operatingperformance and financial results in 2010. Although we have witnessed a continued impact fromausterity measures implemented in markets, including Greece, Romania, Bulgaria, the Republic ofIreland and Northern Ireland, we have also witnessed early signs of increased consumer confidence andspending in key countries including, Russia and Ukraine. GDP growth rates and unemployment ratesvaried significantly across our territories during 2010. Whereas Greece experienced an estimatednegative GDP growth of 4.3% and a record unemployment rate of 12%, Russia estimated positive GDPgrowth of 4.0% and an unemployment rate of 8%. Although exchange rate volatility had a significantnegative impact on our financial results in 2008 and 2009, we experienced a materially positivecontribution such exchange rate volatility in 2010.
Major western countries have responded to the world economic crisis by taking fiscal measuresdesigned to restore confidence, stimulate demand and support liquidity. Not all countries have beenaffected to the same extent by the crisis. Some countries began taking steps to reduce their fiscaldeficits in 2009, while others have done so in 2010. Towards the end of 2009, the Greek economic crisiscreated downward pressure on the euro, resulting in an increase in the prices we must pay for certainraw and packaging materials which are priced in other currencies (principally US dollars), whichdepresses our profit margins if we are unable to recover these additional operating costs from ourcustomers. Greece faces increasing pressures for more aggressive and wide-ranging fiscal retrenchment,including increases in taxation. A further tightening of the government’s multiyear fiscal consolidationprogram is likely under the new European Monetary Union / International Monetary Fund agreement,which will further depress Greece’s medium-term economic growth prospects. In May 2010, the Italiangovernment announced significant reductions in public expenditure, designed to reduce the fiscal deficitto 3% or less of gross domestic product by 2012. In November 2010, the Irish government agreed arescue package with the European Union and International Monetary Fund that requires severe fiscalausterity. Such measures are likely to negatively impact GDP and employment. The economic crisis, themeasures aimed at addressing such crisis and the consequences thereof could adversely affect theresults of our local operations and on a consolidated basis.
Channel mix
We sell our products through two broadly defined distribution channels: future consumptionchannels, including hypermarkets, supermarkets, discount stores and grocery stores, where consumerstypically buy beverages in multi-serve (one liter and above or multi-package) packages for future (athome) consumption; and immediate consumption channels, including restaurants and cafes, grocerystores, gas stations, sports and leisure venues hotels and offices, where consumers typically buybeverages in chilled single-serve (0.5 liter or smaller) packages and fountain products for immediateconsumption. Single-serve packages sold through immediate consumption channels typically generatehigher margins than multi-serve packages sold through future consumption channels. This is primarilydue to consumers’ willingness to pay a premium to consume our products chilled at a convenientlocation. In addition, this is also influenced by the price sensitivity and bargaining power of largeretailers and wholesalers that represent our principal customers in the future consumption channel.
Channel mix refers to the relative percentages of our sales volume comprising single-servepackages sold for immediate consumption and multi-serve packages sold for future consumption. Afavorable channel mix occurs when sales of our higher margin single-serve packages increase relative tosales of multi-serve packages, while an unfavorable channel mix occurs when our volume shifts towardmore multi-serve packages that generate lower margins. One of the strategies we use to improvechannel mix is to invest in cold drink equipment, such as coolers, which we make available to retailoutlets. This represents a significant portion of our capital expenditure. During 2010, for example,approximately 19% of our additions of property, plant and equipment were for coolers.
73
Raw material costs
Raw material costs, including concentrate, represented 75.7% of our total cost of goods sold in2010, as compared to 76.8% in 2009 and 77.2% in 2008. Our major raw materials, other than water andconcentrate, are sugar and other sweeteners, carbon dioxide, juice concentrates, glass, labels, plasticresin, closures, plastic crates, aluminum cans, aseptic packages and other packaging materials. The entryinto the EU in recent years of eleven of our countries has led to an increase in the cost of sugar. Foradditional information, see below ‘‘Impact of governmental, economic, fiscal, monetary and politicalpolicies—EU regulations’’.
Under the terms of a supply agreement that we entered into with Frigoglass S.A. in 1999, initiallyset to expire on December 31, 2004 but subsequently extended, on substantially similar terms, in June2004 and, again in December 2008 to December 31, 2013, we have the status of a non-exclusive mostfavored client of Frigoglass S.A. We are required to obtain at least 60% of our annual requirements ofcoolers from Frigoglass S.A., in order to maintain our status as a non-exclusive most favored client.
The prices, at which we purchase these products, are agreed between us and Frigoglass S.A. at thebeginning of each year. If an agreement is not reached, the applicable prices will be determined basedon the average prices of other non-exclusive primary European suppliers to The Coca-Cola Company’sEuropean bottlers.
Our major cold drink equipment supplier is Frigoglass S.A. In 2010, we made purchases fromFrigoglass S.A. totaling A101.0 million, compared to A58.8 million in 2009 and A117.5 million in 2008.The purchases from Frigoglass S.A. in 2010 were comprised of A84.6 million for coolers, other colddrink equipment and spare parts and A16.4 million for raw and packaging materials and otherpurchases. This compares to A21.3 million for the purchase of coolers, other cold drink equipment andspare parts and A37.5 million for purchases of raw and packaging materials in 2009 and A82.6 millionand A34.9 million, respectively, in 2008. The increase in total purchases in 2010 compared with 2009primarily a reflection of reduced planned capital expenditure for cold drink equipment. Boval S.A., theparent of Kar-Tess Holding, holds a 43.9% interest in Frigoglass S.A. You should read Item 7 ‘‘MajorShareholders and Related Party Transactions—Related Party Transactions—Our relationship withKar-Tess Holding—Supply agreement with Frigoglass S.A.’’ for additional information on ourrelationship with Frigoglass S.A.
Weather conditions
Weather conditions directly affect consumption of all our products. High temperatures andprolonged periods of warm weather favor increased consumption of our products, while unseasonablycool weather, especially during the spring and summer months, adversely affects our sales volume andconsequently, net sales revenue.
Seasonality
Product sales in all of our countries are generally higher during the warmer months of the year,which are also periods of increased tourist activity in many of these countries, as well as during holidayperiods such as Christmas and Easter. We typically experience our best results of operations during thesecond and third quarters. In 2010, for example, we realized 20.5% of our sales volume in the firstquarter, 27.5% in the second quarter, 29.1% in the third quarter and 22.9% in the fourth quarter.
74
Foreign currency
Our results of operations are affected by foreign exchange exposures, which arise primarily fromadverse changes in exchange rates in our emerging and developing countries. In particular:
• Our operating companies, other than those in Italy, Greece, Austria, the Republic of Ireland,Cyprus, Estonia, Slovenia, Slovakia and Montenegro have functional currencies other than ourreporting currency, the euro. As a result, any change in the exchange rates between thesefunctional currencies and the euro affects our statement of income and balance sheet when theresults of those operating companies are translated into euro.
• Raw materials purchased in currencies such as the US dollar or the euro can lead to higher costof goods sold in countries with weaker functional currencies which, if not recovered throughlocal price increases, will lead to reduced gross profit margins. As at December 31, 2010, all ofour concentrate, which represents 47.1% of our raw material costs, was sourced through supplyagreements denominated in euro, US dollars or Nigerian naira.
• Currency fluctuations impact our foreign currency denominated balances, such as interestexpense on borrowings denominated in foreign currencies.
Taxation
The Greek statutory income tax rate was 24% for 2010 and 25% for 2009 and 2008. Statutoryincome tax rates in the countries in which we operate range from 0% to 31%. Our effective income taxrate was 24% for 2010, 25% for 2009 and 31% for 2008. The decrease of our effective income tax ratein 2010 compared to 2009 was mainly attributable to the recognition of deferred tax asset on losses thathad previously not been recognised on acquisition of Coca-Cola Beverages Austria GmbH ofA10.2 million. Furthermore, our current tax expense was decreased by A2.0 million reflecting the benefitobtained pursuant to tax incentives legislation applying in some of our tax jurisdictions in which weoperate. The decrease in 2009 compared to 2008 was mainly attributable to the non-cash charge ofA189.0 million in 2008 regarding the impairment of intangible assets recorded for our Irish operationsand the Fresh & Co juice business in Serbia, which was a non-deductible expense.
On December 10, 2009, the Greek government introduced a special tax defined as ‘ExtraContribution of Social Responsibility by the Large Companies’ pursuant to Law 3808/2009. This lawprovided for a special additional tax on 2008 total net income. As a result, we recorded a tax charge ofA19.8 million in 2009.
Pursuant to Article 5 of Law 3845/2010, on May 6, 2010, the Greek government imposed an‘Extraordinary Contribution of Social Responsibility’ on net income for the fiscal year endedDecember 31, 2009. The amount of the ‘Extraordinary Contribution of Social Responsibility’ assessedfor 2009 was A21.2 million, which we recorded as a tax charge in 2010.
Amortization and impairment of intangible assets
As discussed above under ‘‘Application of critical accounting policies—Intangible assets’’, intangibleassets comprise a significant portion of our balance sheet. We consider that 99.3% of theA1,966.9 million of intangible assets recorded on our balance sheet as at December 31, 2010 relates toassets that have indefinite useful lives.
We conduct tests for impairment of goodwill and indefinite-lived intangible assets in accordancewith IAS 36, Impairment of assets annually and whenever there is an indication of impairment. Our2008 test indicated that the carrying amounts of certain goodwill and indefinite-lived intangible assetsexceeded their fair values and consequently that those assets were impaired by A189.0 million. Noimpairment was indicated from the impairment tests of 2010 and 2009.
75
Impact of governmental, economic, fiscal, monetary and political policies
EU regulations
On May 1, 2004, nine countries in which we operate entered the EU. These are Cyprus, the CzechRepublic, Estonia, Hungary, Latvia, Lithuania, Poland, Slovakia and Slovenia. Bulgaria and Romaniaentered the EU on January 1, 2007. As of December 31, 2010 we operated in 16 EU countries. Inaddition, Croatia is having accession negotiations with the EU as a candidate country.
These countries have implemented extensive reforms to facilitate their transition to marketeconomies and have adopted strict fiscal and monetary policies to converge with the fiscal andmonetary standards set by the EU. We believe that, overall, we benefit from the increased economicand political stability in these countries as a result of their gradual alignment with the principles,objectives, economic standards and regulations of the EU. Conversely, the application of EU labor, tax,accounting and environmental regulations, increases the cost and complexity of compliance, at least inthe short-term, and the implementation of the EU packaging directive in the new EU countries hasfurther restricted our ability to use certain packaging materials or methods.
Our countries in the EU have adopted the EU sugar regime, which means that the minimumselling price for sugar has become the EU intervention price plus the cost of transport and profitmargin. This has generally meant a significant rise in sweetener costs in these countries, although theongoing reform of the EU sugar regime could help to counteract inflationary pressure caused by recentincreases in energy and transport costs.
EU competition law
Our business activities affecting the EU are subject to EU competition law. In 2005, the EuropeanCommission ended an investigation into various commercial practices of The Coca-Cola Company andcertain Coca-Cola bottlers in Austria, Belgium, Denmark, Germany and Great Britain regardingpossible abuse of dominant position. Together with The Coca-Cola Company and other Coca-Colabottlers, we undertook to address all such practices in the EU. The undertaking potentially applied inthe Member States of the European Economic Area, covering those channels of distribution where TheCoca-Cola Company-branded sparkling beverages account for over 40% of the national sales and twicethe nearest competitor’s share. The commitments related broadly to exclusivity, percentage-basedpurchasing commitments, transparency, target rebates, tying, assortment or range commitments andagreements concerning products of other suppliers. In addition to these commitments, the undertakingapplied to shelf space commitments in agreements with take-home customers, to financing andavailability agreements in the on-premise channel and to commercial arrangements concerning theinstallation and use of technical equipment, such as coolers, fountain equipment, and vendingmachines. We believe that our compliance with the undertaking has not had a material adverse effecton our business and financial results. The undertaking expired on December 31, 2010.
Greek economic crisis and EU response
Greece, which accounted for approximately 7% of our unit case sales volume in 2010, is currentlyfacing a severe economic crisis resulting from long standing government fiscal deficits and high levels ofgovernment borrowing. The current political, economic and budgetary challenges that the Greekgovernment faces with respect to its high public debt burden and Greece’s weakening economic growthprospects have led to the announcement of wide-ranging fiscal measures, including increases intaxation, and further measures may become necessary. Other countries in Europe in which we operate,such as Ireland and Italy, are facing similar economic conditions and have announced similar fiscalmeasures. The economic crisis, the measures aimed at addressing the situation, the consequencesthereof or a combination of the aforementioned could adversely affect the results of our localoperations and on a consolidated basis.
76
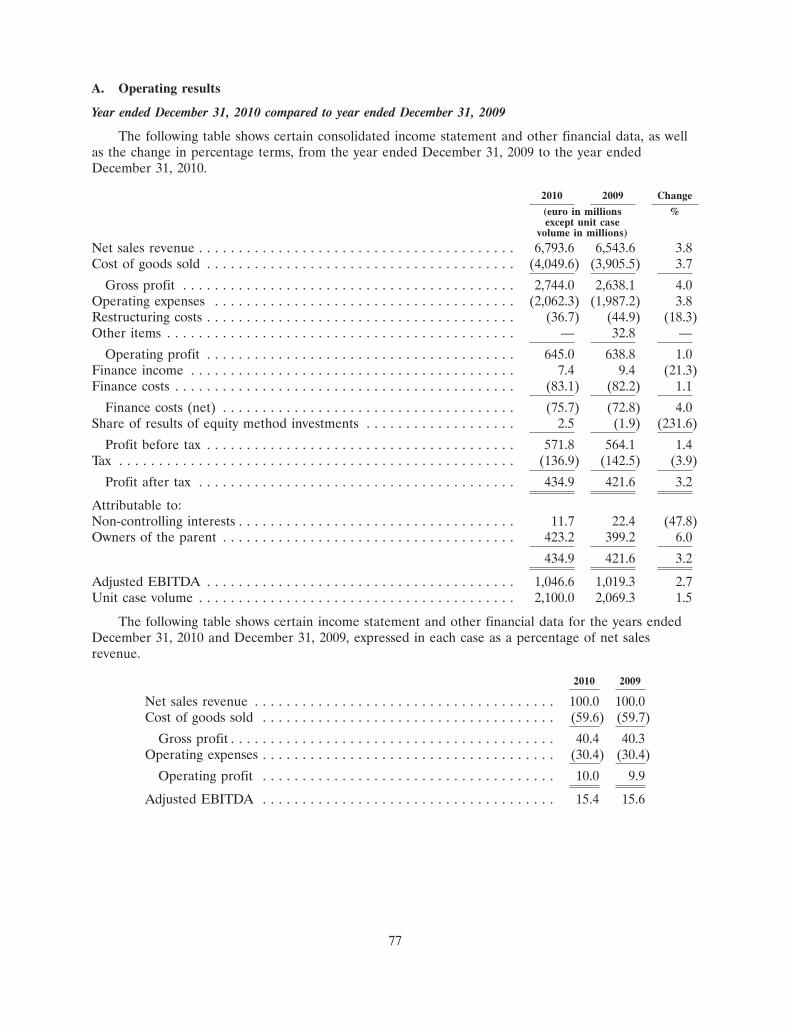
A. Operating results
Year ended December 31, 2010 compared to year ended December 31, 2009
The following table shows certain consolidated income statement and other financial data, as wellas the change in percentage terms, from the year ended December 31, 2009 to the year endedDecember 31, 2010.
2010 2009 Change
(euro in millions %except unit case
volume in millions)
Net sales revenue . . . . . . . . . . . . . . . . . . . . . . . . . . . . . . . . . . . . . . . . 6,793.6 6,543.6 3.8Cost of goods sold . . . . . . . . . . . . . . . . . . . . . . . . . . . . . . . . . . . . . . . (4,049.6) (3,905.5) 3.7
Gross profit . . . . . . . . . . . . . . . . . . . . . . . . . . . . . . . . . . . . . . . . . . 2,744.0 2,638.1 4.0Operating expenses . . . . . . . . . . . . . . . . . . . . . . . . . . . . . . . . . . . . . . (2,062.3) (1,987.2) 3.8Restructuring costs . . . . . . . . . . . . . . . . . . . . . . . . . . . . . . . . . . . . . . . (36.7) (44.9) (18.3)Other items . . . . . . . . . . . . . . . . . . . . . . . . . . . . . . . . . . . . . . . . . . . . — 32.8 —
Operating profit . . . . . . . . . . . . . . . . . . . . . . . . . . . . . . . . . . . . . . . 645.0 638.8 1.0Finance income . . . . . . . . . . . . . . . . . . . . . . . . . . . . . . . . . . . . . . . . . 7.4 9.4 (21.3)Finance costs . . . . . . . . . . . . . . . . . . . . . . . . . . . . . . . . . . . . . . . . . . . (83.1) (82.2) 1.1
Finance costs (net) . . . . . . . . . . . . . . . . . . . . . . . . . . . . . . . . . . . . . (75.7) (72.8) 4.0Share of results of equity method investments . . . . . . . . . . . . . . . . . . . 2.5 (1.9) (231.6)
Profit before tax . . . . . . . . . . . . . . . . . . . . . . . . . . . . . . . . . . . . . . . 571.8 564.1 1.4Tax . . . . . . . . . . . . . . . . . . . . . . . . . . . . . . . . . . . . . . . . . . . . . . . . . . (136.9) (142.5) (3.9)
Profit after tax . . . . . . . . . . . . . . . . . . . . . . . . . . . . . . . . . . . . . . . . 434.9 421.6 3.2
Attributable to:Non-controlling interests . . . . . . . . . . . . . . . . . . . . . . . . . . . . . . . . . . . 11.7 22.4 (47.8)Owners of the parent . . . . . . . . . . . . . . . . . . . . . . . . . . . . . . . . . . . . . 423.2 399.2 6.0
434.9 421.6 3.2
Adjusted EBITDA . . . . . . . . . . . . . . . . . . . . . . . . . . . . . . . . . . . . . . . 1,046.6 1,019.3 2.7Unit case volume . . . . . . . . . . . . . . . . . . . . . . . . . . . . . . . . . . . . . . . . 2,100.0 2,069.3 1.5
The following table shows certain income statement and other financial data for the years endedDecember 31, 2010 and December 31, 2009, expressed in each case as a percentage of net salesrevenue.
2010 2009
Net sales revenue . . . . . . . . . . . . . . . . . . . . . . . . . . . . . . . . . . . . . . 100.0 100.0Cost of goods sold . . . . . . . . . . . . . . . . . . . . . . . . . . . . . . . . . . . . . (59.6) (59.7)
Gross profit . . . . . . . . . . . . . . . . . . . . . . . . . . . . . . . . . . . . . . . . . 40.4 40.3Operating expenses . . . . . . . . . . . . . . . . . . . . . . . . . . . . . . . . . . . . . (30.4) (30.4)
Operating profit . . . . . . . . . . . . . . . . . . . . . . . . . . . . . . . . . . . . . 10.0 9.9
Adjusted EBITDA . . . . . . . . . . . . . . . . . . . . . . . . . . . . . . . . . . . . . 15.4 15.6
77
Volume
In 2010, our sales volume increased by 30.7 million unit cases, or 1.5%, compared to 2009. Ourestablished countries segment made a negative contribution of 25.0 million unit cases, whereas ourdeveloping and emerging countries made a positive contribution of 3.4 million unit cases and52.3 million unit cases, respectively.
In our established countries segment unit case volume declined by 3.4% in 2010. In Italy, volumedeclined by 2.2%, representing a decrease of 7.3 million unit cases due to the adverse impact on salesin the immediate consumption channels from economic conditions and poor consumer sentiment. InGreece, volume declined by 18.5 million unit cases, or 11.5% as the austerity measures negativelyimpacted consumer purchasing power and demand. In Switzerland, volume increased by 3.6 million unitcases, or 4.5%. This increase was strongly driven by the listing of our products with the largest retailerin Switzerland, which historically had only carried private label products.
In our developing countries segment unit case volume increased by 0.9% in 2010. Volume inPoland increased by 0.9 million unit cases, or 0.5%. In Hungary, volume declined by 2.5% representinga decrease of 2.2 million unit cases due to unfavorable economic conditions. Volume in the CzechRepublic increased by 3.9 million unit cases, or 7.2%. In the remaining developing countries, volumeincreased by 0.8 million unit cases.
In our emerging countries segment unit case volume increased by 5.6% in 2010. Volume in theRussian Federation increased by 13.7%, or 41.2 million unit cases, in 2010 as a result of improvedconsumer sentiment increasing purchasing power and declining unemployment levels. Our successfulimplementation of targeted activation programs during the holiday season, together with increasedmarketing investments and exceptionally hot weather in summer also contributed to our performance.Unit case volume in Nigeria grew by 4.6% in 2010, representing an increase of 8.1 million cases andreflecting solid growth in the sparkling beverages category. Unit case volume in Romania declined by3.6% in 2010, as declining GDP and a VAT increase in the middle of the year depressed consumersentiment.
Net sales revenue
We recognize net sales revenue at the time we deliver products to our customers. Revenues arerecognized when all of the following conditions are met: evidence of a binding arrangement exists(generally purchase orders), products have been delivered and there is no future performance required,amounts are collectible under normal payment terms and both revenue and associated costs can bemeasured reliably.
Net sales revenue increased by A250.0 million in 2010 compared with 2009, primarily reflectingvolume growth and positive currency impact, partly offset by adverse impact from pricing and categorymix. Net sales revenue per unit case increased by approximately 2% in 2010.
In our established countries net sales revenue decreased by A93.2 million in 2010 compared with2009, as lower volume and unfavorable category and package mix more than offset the positivecurrency movements. Net sales revenue in Greece and Italy decreased by A109.5 million andA31.1 million respectively following the decline in volume and the unfavorable product mix. Net salesrevenue in Switzerland increased by A50.1 million, reflecting the impact of an improved economicenvironment, the listing of Trademark Coca-Cola with one of the largest retail chains in the countryand the appreciation of the swiss franc against the euro.
In our developing countries segment, net sales revenue decreased by A9.1 million compared with2009, reflecting adverse product mix mainly coming from the ongoing changes in the Polish retailenvironment.
78
In our emerging countries segment, net sales revenue increased by A352.3 million compared with2009. Net sales revenue in the Russian Federation increased by A260.5 million, and in Nigeria byA82.6 million as a result of higher volumes, better pricing and product mix and favorable currencymovements. Net sales revenue in Romania declined A27.1 million mainly as a result of lower volume.
Overall pricing, in terms of net sales revenue per unit case increased to A3.24 in 2010 comparedwith A3.16 in 2009.
Cost of goods sold
Our cost of goods sold is comprised of raw materials, inward freight and warehousing, labor andmanufacturing costs. Our average cost of goods sold per unit case increased by 2.1% from A1.89 in2009, to A1.93 in 2010, reflecting higher commodity costs and the foreign currency effects of a weakereuro, partly offset by improved cost efficiencies in manufacturing and haulage.
The cost of concentrate purchased from The Coca-Cola Company, our most important rawmaterial, increased from 20.9% of our net sales revenue in 2009, to 21.2% in 2010. Depreciationincluded in our cost of goods sold increased from A190.9 million in 2009 to A218.9 million in 2010.
Gross profit
Our gross profit margin improved slightly to 40.4% in 2010, from 40.3% in 2009, as a result of anincrease in the cost of goods sold slightly lower to the increase in net sales revenue. On a unit casebasis, gross profit increased by approximately 2% in 2010 compared to the prior year.
Operating expenses
Our selling expenses include the cost of our sales force, advertising expenses and our investment incoolers. Delivery expenses consist primarily of the cost of our fleet of vehicles, distribution centers andwarehouses through which we distribute a significant portion of our products, as well as fees charged bythird party shipping agents. Also included in our selling, delivery and administrative expenses isdepreciation, which is mainly of coolers, vehicles, distribution centers and warehouses and othernon-production related items. The single most significant component of our operating expenses is thecost of our sales force.
In 2010, our selling costs (including depreciation) amounted to A1,031.9 million, compared toA968.1 million in 2009. The ratio of selling costs over net sales revenue increased to 15.2% from 14.8%in 2009. The increase in operating expenses reflects our increased investment behind our brands tostrengthen our position in the market place as well as a negative effect from currency movements.
Delivery costs (including depreciation), increased, in absolute terms, to A628.5 million in 2010 fromA602.8 million in 2009, reflecting higher fuel and warehouse costs compared to 2009, which resulted inan increase in delivery costs (including depreciation) per unit case, from A0.29 in 2009 to A0.30 in 2010.
Administrative expenses (including depreciation) amounted to A388.4 million in 2010, compared toA402.5 million in 2009. Administration costs slightly decreased as a percentage of net sales revenuecompared to 2009, from 6.2% in 2009 to 5.7% in 2010.
Stock option expenses amounted to A6.7 million in 2010, compared with A6.4 million in 2009.Amortization of intangible assets increased from A4.7 million in 2009 to A6.8 million in 2010.
79
As part of our effort to optimize our cost base and sustain competitiveness in the market place, weundertook restructuring initiatives in 2010 which amounted to A36.7 million before taxes. Theserestructuring activities are expected to deliver benefits in the form of reduced costs in cost of goodssold and operating expenses, as well as improved cash flows of A35 - A40 million from 2011 onwards.We recorded A25.7 million, A2.3 million and A8.7 million of restructuring charges in our established,developing and emerging markets respectively, during 2010. Such restructurings mainly concernemployee costs, outsourcing of certain functions as well as closure of production facilities.
Impairment of intangible assets
In 2008, following our annual impairment testing process in accordance with IAS 36, Impairment ofassets, we recognized a non-cash impairment charge of A189.0 million to reduce the carrying amount ofintangible assets relating to our Irish operations and the Fresh & Co. juice business in Serbia. Theimpairment charge relating to our Irish operations resulted primarily from the deterioration of theeconomic environment on the island of Ireland, reflected across most key macro-economic indicators,as well as the significant devaluation of the sterling against the euro. No impairment was indicated as aresult of impairment tests in 2010 and 2009.
Other items
On December 19, 2008, we announced that a production plant in Benin City, Nigeria, which wasowned by Nigerian Bottling Company plc in which we have a 66.4% interest, had been substantiallydamaged by fire. An impairment charge was recorded in December 2008 on certain assets totalingA15.8 million. Of this impairment charge, A9.8 million related to impairment of property, plant andequipment, and A4.5 million related to the impairment of inventory balances. During 2009,A32.8 million was received from our insurers.
Operating profit
Operating profit increased by 1.0% in 2010 as higher volume and positive currency movementswere only partly offset by the adverse product mix, lower pricing and higher commodity costs.
Finance income
Finance income decreased from A9.4 million for 2009 to A7.4 million for 2010, as a result of lowerinterest rates on our invested cash balances in 2010.
Finance costs
Finance costs increased slightly from A82.2 million for 2009 to A83.1 million for 2010, as a result ofhigher interest expenses due to the conversion from lower floating interest rates to higher fixed interestrates during the year more than offsetting the impact of on average lower debt balances in 2010. Theconversion from floating to fixed rate terms was achieved when we restructured the interest rate termsof outstanding cross currency swap contracts relating to the $400.0 million US bonds and by unwindingoutstanding fixed to floating interest rate swap contracts with an aggregate notional amount ofA792.5 million. An amount of A1.7 million was charged to the income statement during 2010 as a resultof our repurchase of an aggregate amount of Notes equal to A198.9 million, being a portion of theA500.0 million fixed rate bond due in 2011.
80
Share of results of equity method investments
The share of results of equity method investments primarily reflected the results of FrigoglassIndustries Limited in which the group holds an effective interest through a 23.9% (2009: 23.9%)interest held by Nigerian Bottling Company plc, in which we have a 66.4% (2009: 66.4%) interest andFonti del Vulture S.r.l., a joint venture engaged in the production of water products in Italy. The shareof results of equity method investments increased from a loss of A1.9 million in 2009 to an income ofA2.5 million in 2010.
Tax
Our effective tax rate decreased from 25% in 2009 to 24% in 2010. This decrease was mainlyattributable to the recognition of a deferred tax asset on losses that had previously not been recognizedon acquisition of Coca-Cola Beverages Austria GmbH of A10.2 million.
Pursuant to Article 5 of Law 3845/2010, on May 6, 2010, the Greek government by virtue ofArticle 5 of Law 3845/2010 imposed an ‘Extraordinary Contribution of Social Responsibility’ on netincome for the fiscal year ended December 31, 2009. The amount of the ‘Extraordinary Contribution ofSocial Responsibility’ assessed for 2009 was A21.2 million, which we recorded as a tax charge in 2010.
On December 10, 2009, the Greek government introduced a special tax defined as ‘ExtraContribution of Social Responsibility by the Large Companies’ pursuant to Law 3808/2009. This lawprovided for a special additional tax on 2008 total net income. As a result, we recorded a tax charge ofA19.8 million in 2009.
Profit after tax attributable to non-controlling interests
Profit after tax attributable to non-controlling interests consists primarily of the minorityshareholders’ 33.6% interest in Nigerian Bottling Company plc, our operating company in Nigeria,which is listed on the Nigerian Stock Exchange, as well as from the minority shareholders’ interests inour operations in the Former Yugoslav Republic of Macedonia, Bulgaria and Serbia of 44.7%, 14.6%and 8.8% respectively. Profit after tax attributable to non-controlling interests decreased fromA22.4 million in 2009 to A11.7 million in 2010, as a consequence of the net profit decrease of ourNigerian operation and the decrease of minority shareholders’ interest in our operations in Serbia.
Profit after tax attributable to owners of the parent
Profit after tax attributable to owners of the parent was A423.2 million in 2010, as compared toA399.2 million in 2009. The A 24.0 million increase primarily reflects the net impact of increasedoperating profit, lower taxes and reduced non-controlling interests.
Adjusted EBITDA
In 2010, our adjusted EBITDA increased by 2.7% over 2009 as a result of the same performancefactors that contributed to the increase of our operating profit.
81
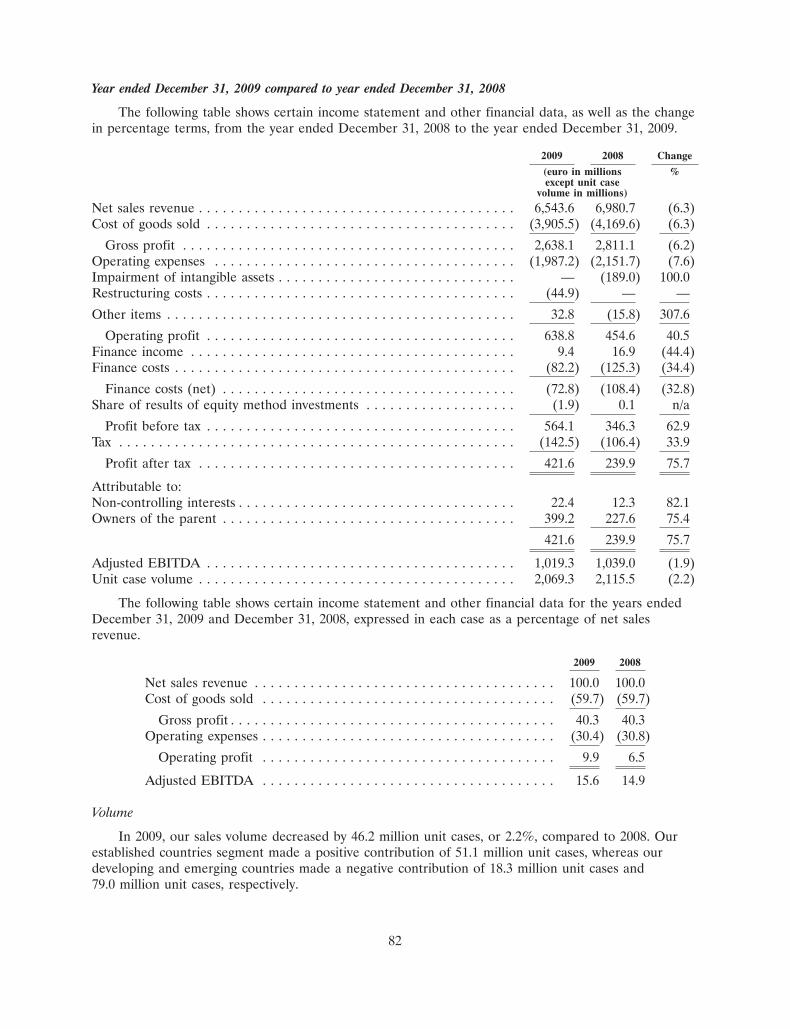
Year ended December 31, 2009 compared to year ended December 31, 2008
The following table shows certain income statement and other financial data, as well as the changein percentage terms, from the year ended December 31, 2008 to the year ended December 31, 2009.
2009 2008 Change
(euro in millions %except unit case
volume in millions)
Net sales revenue . . . . . . . . . . . . . . . . . . . . . . . . . . . . . . . . . . . . . . . . 6,543.6 6,980.7 (6.3)Cost of goods sold . . . . . . . . . . . . . . . . . . . . . . . . . . . . . . . . . . . . . . . (3,905.5) (4,169.6) (6.3)
Gross profit . . . . . . . . . . . . . . . . . . . . . . . . . . . . . . . . . . . . . . . . . . 2,638.1 2,811.1 (6.2)Operating expenses . . . . . . . . . . . . . . . . . . . . . . . . . . . . . . . . . . . . . . (1,987.2) (2,151.7) (7.6)Impairment of intangible assets . . . . . . . . . . . . . . . . . . . . . . . . . . . . . . — (189.0) 100.0Restructuring costs . . . . . . . . . . . . . . . . . . . . . . . . . . . . . . . . . . . . . . . (44.9) — —
Other items . . . . . . . . . . . . . . . . . . . . . . . . . . . . . . . . . . . . . . . . . . . . 32.8 (15.8) 307.6
Operating profit . . . . . . . . . . . . . . . . . . . . . . . . . . . . . . . . . . . . . . . 638.8 454.6 40.5Finance income . . . . . . . . . . . . . . . . . . . . . . . . . . . . . . . . . . . . . . . . . 9.4 16.9 (44.4)Finance costs . . . . . . . . . . . . . . . . . . . . . . . . . . . . . . . . . . . . . . . . . . . (82.2) (125.3) (34.4)
Finance costs (net) . . . . . . . . . . . . . . . . . . . . . . . . . . . . . . . . . . . . . (72.8) (108.4) (32.8)Share of results of equity method investments . . . . . . . . . . . . . . . . . . . (1.9) 0.1 n/a
Profit before tax . . . . . . . . . . . . . . . . . . . . . . . . . . . . . . . . . . . . . . . 564.1 346.3 62.9Tax . . . . . . . . . . . . . . . . . . . . . . . . . . . . . . . . . . . . . . . . . . . . . . . . . . (142.5) (106.4) 33.9
Profit after tax . . . . . . . . . . . . . . . . . . . . . . . . . . . . . . . . . . . . . . . . 421.6 239.9 75.7
Attributable to:Non-controlling interests . . . . . . . . . . . . . . . . . . . . . . . . . . . . . . . . . . . 22.4 12.3 82.1Owners of the parent . . . . . . . . . . . . . . . . . . . . . . . . . . . . . . . . . . . . . 399.2 227.6 75.4
421.6 239.9 75.7
Adjusted EBITDA . . . . . . . . . . . . . . . . . . . . . . . . . . . . . . . . . . . . . . . 1,019.3 1,039.0 (1.9)Unit case volume . . . . . . . . . . . . . . . . . . . . . . . . . . . . . . . . . . . . . . . . 2,069.3 2,115.5 (2.2)
The following table shows certain income statement and other financial data for the years endedDecember 31, 2009 and December 31, 2008, expressed in each case as a percentage of net salesrevenue.
2009 2008
Net sales revenue . . . . . . . . . . . . . . . . . . . . . . . . . . . . . . . . . . . . . . 100.0 100.0Cost of goods sold . . . . . . . . . . . . . . . . . . . . . . . . . . . . . . . . . . . . . (59.7) (59.7)
Gross profit . . . . . . . . . . . . . . . . . . . . . . . . . . . . . . . . . . . . . . . . . 40.3 40.3Operating expenses . . . . . . . . . . . . . . . . . . . . . . . . . . . . . . . . . . . . . (30.4) (30.8)
Operating profit . . . . . . . . . . . . . . . . . . . . . . . . . . . . . . . . . . . . . 9.9 6.5
Adjusted EBITDA . . . . . . . . . . . . . . . . . . . . . . . . . . . . . . . . . . . . . 15.6 14.9
Volume
In 2009, our sales volume decreased by 46.2 million unit cases, or 2.2%, compared to 2008. Ourestablished countries segment made a positive contribution of 51.1 million unit cases, whereas ourdeveloping and emerging countries made a negative contribution of 18.3 million unit cases and79.0 million unit cases, respectively.
82
In our established countries segment unit case volume grew 7.4% in 2009, including a contributionof 56.3 million unit cases from the operations of Socib S.p.A., acquired in December 2008. Excludingthe effect of this acquisition, our established countries segment volume decreased by 5.2 million unitcases. Excluding the contribution of Socib S.p.A., Italy grew volume by 2.1% for the full year,representing an increase of 5.5 million unit cases, supported by solid growth in our Lilia water brandand Amita juice brand. In the remaining established countries, volume decreased by 10.7 million unitcases.
In our developing countries segment unit case volume decreased 4.5% in 2009, although ourmarket share increased in a contracting market. Volume in Poland decreased by 3.7 million unit casesas a result of a challenging environment and poor weather conditions in summer. In the remainingdeveloping countries, volume decreased by 14.5 million unit cases.
In our emerging countries segment unit case volume decreased by 7.8% in 2009, although ourmarket share increased in a contracting market. Volume in the Russian Federation declined by 13.4%in 2009 due to the challenging economic conditions of the downturn in the Russian economy, consumerprice increases and an overall decrease in consumer demand. Unit case volume in Nigeria grew by6.0% in 2009 reflecting solid growth in the sparkling beverages category and water sub-category, partlyoffset by a significant decline in the juice sub-category following the loss of production capacity as aresult of fire damage sustained at the Benin plant in late 2008. Unit case volume in Romania declinedby 12.1% in 2009, due to the rapid deterioration in economic conditions in the country in the secondhalf of the year, which resulted in lower consumer spending, particularly in the immediate consumptionchannels.
Net sales revenue
We recognize net sales revenue at the time we deliver products to our customers. Revenues arerecognized when all of the following conditions are met: evidence of a binding arrangement exists(generally purchase orders), products have been delivered and there is no future performance required,amounts are collectible under normal payment terms and both revenue and associated costs can bemeasured reliably.
Net sales revenue decreased by A437.1 million in 2009 compared with 2008, primarily reflectinglower sales volume and price pressure across most of the markets we serve. Net sales revenue per unitcase decreased by approximately 4% in 2009.
In our established countries net sales revenue increased by A223.8 million in 2009 compared with2008, of which A229.9 million was attributable to the operations of Socib S.p.A., acquired in December2008. Excluding the effect of such acquisition, net sales revenue in Italy increased by A32.3 million as aresult of good price realization through more effective and efficient promotional management alongwith the volume performance and positive mix impact. Net sales revenue in Switzerland also increasedby A18.6 million, despite flat volume, as a result of improved mix, price increases in some categoriesand the appreciation of the swiss franc against the euro.
In our developing countries segment, net sales revenue decreased by A199.3 million compared with2008, reflecting lower volume, adverse product mix and a double-digit negative impact from currencies,partially offset by positive pricing. Poland recorded a net sales revenue decrease of A96.2 million,attributable mainly to the significant depreciation of the Polish zloty against the euro during the year.In local currency terms, net sales revenues increased slightly as improved pricing more than offset theeffect of slightly lower volume.
83
In our emerging countries segment, net sales revenue decreased by A461.6 million compared with2008. Net sales revenue declined by 15.8% in the full year, reflecting a double-digit negative currencyimpact and negative channel mix, partly offset by higher pricing. Net sales revenue in the RussianFederation decreased A244.1 million, mainly due to the significant depreciation of the ruble against theeuro, lower volume (mainly in still, water, energy and tea) and a negative impact from product mix.Net sales revenue in Romania declined A96.6 million as a result of both volume declines and theexchange rate deterioration, although this was partly offset by an improved category mix versus theprior year.
Overall pricing, in terms of net sales revenue per unit case decreased to A3.16 in 2009 comparedwith A3.30 in 2008.
Cost of goods sold
Our cost of goods sold is comprised of raw materials, inward freight and warehousing, labor andmanufacturing costs. Our average cost of goods sold per unit case decreased by 4.2% from A1.97 in2008, to A1.89 in 2009, reflecting reduced raw material costs, various cost saving initiatives and currencybenefits.
The cost of concentrate purchased from The Coca-Cola Company, our most important rawmaterial, decreased from 21.4% of our net sales revenue in 2008, to 20.9% in 2009. Depreciationincluded in our cost of goods sold increased from A179.5 million in 2008 to A190.9 million in 2009.
Gross profit
Our gross profit margin remained stable at 40.3% in 2009, same as in 2008, as a result of adecrease in the cost of goods sold roughly equivalent to the decrease in net sales revenue. On a unitcase basis, gross profit decreased by approximately 4% in 2009 compared to the prior year, largelyreflecting negative currency movements.
Operating expenses
Our selling expenses include the cost of our sales force, advertising expenses and our investment incoolers. Delivery expenses consist primarily of the cost of our fleet of vehicles, distribution centers andwarehouses through which we distribute a significant portion of our products, as well as fees charged bythird party shipping agents. Also included in our selling, delivery and administrative expenses isdepreciation, which is mainly of coolers, vehicles, distribution centers and warehouses and othernon-production related items. The single most significant component of our selling, delivery andadministrative expenses is the cost of our sales force.
In 2009, our selling costs (including depreciation) amounted to A968.1 million, compared toA1,059.0 million in 2008. The ratio of selling costs over net sales revenue decreased to 14.8% from15.2% in 2008. The decrease in operating expenses reflects the impact of ongoing cost saving initiativesand an operating cost benefit from currency movements.
Delivery costs (including depreciation), decreased, in absolute terms, to A602.8 million in 2009from A658.7 million in 2008, reflecting lower fuel costs compared to 2008, which resulted in a decreasein delivery costs (including depreciation) per unit case, from A0.31 in 2008 to A0.29 in 2009.
Administrative expenses (including depreciation) amounted to A402.5 million in 2009, compared toA419.8 million in 2008. Administration costs slightly increased as a percentage of net sales revenuecompared to 2008, from 6.0% in 2008 to 6.2% in 2009.
Stock option expenses amounted to A6.4 million in 2009, compared with A9.3 million in 2008.Amortization of intangible assets increased from A3.7 million in 2008 to A4.7 million in 2009.
84
During 2009 and 2008, we recognized deferred tax assets on losses that had previously not beenrecognized on acquisition of Coca-Cola Beverages plc by Hellenic Bottling Company S.A. Inaccordance with IAS 12, Income Taxes, when deferred tax assets on losses have not been recognized onacquisition and are subsequently recognized, both goodwill and deferred tax assets are adjusted withcorresponding entries to operating expenses and tax in the income statement. Therefore, a charge ofA2.2 million was recorded in operating expense for the full year of 2009, compared to A1.2 million in2008, and a deferred tax credit of A1.6 million was recorded for the full year of 2009, compared toA0.9 million in 2008, included within tax on the income statement.
As part of the effort to optimize the cost base and sustain competitiveness in the market place, weundertook restructuring initiatives in 2009 which amounted to A44.9 million before tax. Suchrestructuring activities are expected to deliver benefits in the form of reduced costs in costs of goodsold and operating expenses, as well as improved cash flows of approximately A50 million from 2010onwards. We recorded A29.9m, A10.8m and A4.2m of restructuring charges in our established,developing and emerging countries, respectively, during 2009. The restructuring concerns mainlyemployee costs, outsourcing of certain functions as well as closure of production facilities.
Impairment of intangible assets
In 2008, following the annual impairment testing process in accordance with IAS 36, Impairment ofassets, we recognized a non-cash impairment charge of A189.0 million to reduce the carrying amount ofintangible assets relating to our Irish operations and the Fresh & Co. juice business in Serbia. Theimpairment charge relating to our Irish operations resulted primarily from the deterioration of theireconomies, reflected across most key macro-economic indicators, as well as the significant devaluationof the sterling against the euro. No impairment was indicated from the impairment test of 2009.
Other items
On December 19, 2008, we announced that a production plant in Benin City, Nigeria, owned bythe Nigerian Bottling Company plc in which we have a 66% interest, was substantially damaged by fire.An impairment charge was recorded in December 2008 on certain assets totaling A15.8 million. Of thisimpairment charge, A9.8 million related to impairment of property, plant and equipment, andA4.5 million related to the impairment of inventory balances. During 2009, A32.8 million was receivedfrom our insurers.
Operating profit
Operating profit increased by 40.5% in 2009, mainly due to the absence of the non-cashimpairment charge of A189.0 million that was recognized in 2008 to reduce the carrying amount ofcertain intangible assets and an incident in Nigeria that resulted in an impairment charge ofA15.8 million, also in 2008, as well as the A32.8 million received from our insurers in 2009, which werepartly offset by the 2009 restructuring costs of A44.9 million. Excluding the effect of these items,operating profit decreased by 1.3% in 2009, mainly because positive pricing along with reduced inputand operating costs were offset by negative currency movements and negative channel mix, comparedto the prior year period.
Finance income
Finance income decreased from A16.9 million for 2008 to A9.4 million for 2009, as a result of lowerinterest rates in 2009.
85
Finance costs
Finance costs decreased from A125.3 million for 2008 to A82.2 million for 2009, as a result of lowerinterest rates and debt outstanding in 2009. Average short-term interest rates decreased byapproximately 329 basis points in 2009 compared to 2008.
Share of results of equity method investments
The share of results of equity method investments primarily reflected the results of FrigoglassIndustries Limited in which the group holds an effective interest through a 23.9% (2008: 23.9%)interest held by Nigerian Bottling Company plc, in which we have a 66.4% (2008: 66.4%) interest andFonti del Vulture S.r.l. a joint venture engaged in the production of water products in Italy. The shareof results of equity method investments decreased from an income of A0.1 million in 2008 to a loss ofA1.9 million in 2009.
Tax
Our effective tax rate decreased from 31% in 2008 to 25% in 2009. This decrease was mainlyattributable to the non-cash charge of A189.0 million regarding the impairment of intangible assetsrecorded for both our Irish operations and the Fresh & Co juice business in Serbia, which charge was anon-deductible expense in 2008. This decrease was partially offset in 2009 by the ‘Extra Contribution ofSocial Responsibility for Large Companies’, which was introduced by the Greek government andresulted in a tax charge of A19.8 million in 2009.
Profit after tax attributable to non-controlling interests
Profit after tax attributable to non-controlling interests consists primarily of the non-controllinginterests’ 33.6% interest in Nigerian Bottling Company plc, our operating company in Nigeria, which islisted on the Nigerian Stock Exchange, as well as from our non-controlling interests in the FormerYugoslav Republic of Macedonia, Bulgaria and Serbia operations of 44.7%, 14.6% and 10.9%respectively. Profit after tax attributable to non-controlling interests increased from A12.3 million in2008 to A22.4 million in 2009, as a consequence of the net profit increase of our Nigerian operation.
Profit after tax attributable to owners of the parent
Profit after tax attributable to owners of the parent was A399.2 million in 2009, as compared toA227.6 million in 2008. The A171.6 million increase, as explained above, was primarily due to theabsence of the non-cash impairment charge of A189.0 million that was recognized in 2008 to reduce thecarrying amount of certain intangible assets and an incident in Nigeria that resulted in an impairmentcharge of A15.8 million, also in 2008, as well as the A32.8 million received from our insurers in 2009,which were partly offset by the restructuring costs of A44.9 million. Excluding the effect of these items,profit after tax attributable to owners of the parent decreased by 4.9% in 2009, as a result of the samefactors that contributed to the reduction of our operating profit.
Adjusted EBITDA
In 2009, our adjusted EBITDA decreased by 1.9% over 2008 as a result of the same performancefactors that contributed to the reduction of our operating profit.
86
Reporting segments
Year ended December 31, 2010 compared to year ended December 31, 2009
The following table provides certain financial information for our three reporting segments, as wellas our corporate center, for each of the two years ended December 31, in each case, both in absolutenumbers and as a percentage of our total corresponding to each line item of this table. Internally, ourmanagement uses operating profit as the main measure in order to allocate resources and evaluate theperformance of each of our business segments. There are no material amounts of product sales ortransfers between our countries. The elimination of inter-segment assets reflects loans from ourfinancing subsidiaries to our various operating companies to cover a portion of our operatingcompanies’ funding requirements.
Year ended Year endedDecember 31, 2010 December 31, 2009
(euro in millions (euro in millionsexcept unit case except unit case
volume in millions) % volume in millions) %
Established countriesUnit case volume . . . . . . . . . . . . . . . . . . . . . . . . . 718.2 34.2 743.2 35.9Net sales revenue . . . . . . . . . . . . . . . . . . . . . . . . . 2,834.6 41.7 2,927.8 44.7Operating profit . . . . . . . . . . . . . . . . . . . . . . . . . . 265.5 41.2 297.6 46.6Depreciation of property, plant and equipment . . . 132.3 34.1 122.3 33.9Stock option expense . . . . . . . . . . . . . . . . . . . . . . 2.4 35.8 2.2 34.4Amortization and adjustment of intangible assets . . 4.5 63.4 3.6 52.2Other items . . . . . . . . . . . . . . . . . . . . . . . . . . . . . — — — —Adjusted EBITDA . . . . . . . . . . . . . . . . . . . . . . . . 404.6 38.7 425.7 41.8Total assets . . . . . . . . . . . . . . . . . . . . . . . . . . . . . 3,657.3 50.6 3,512.1 51.7
Developing countriesUnit case volume . . . . . . . . . . . . . . . . . . . . . . . . . 391.7 18.7 388.3 18.8Net sales revenue . . . . . . . . . . . . . . . . . . . . . . . . . 1,140.0 16.8 1,149.1 17.6Operating profit . . . . . . . . . . . . . . . . . . . . . . . . . . 89.2 13.8 86.3 13.5Depreciation of property, plant and equipment . . . 72.9 18.8 77.0 21.4Stock option expense . . . . . . . . . . . . . . . . . . . . . . 1.2 17.9 1.2 18.7Amortization and adjustment of intangible assets . . 0.5 7.0 0.5 7.2Other items . . . . . . . . . . . . . . . . . . . . . . . . . . . . . — — — —Adjusted EBITDA . . . . . . . . . . . . . . . . . . . . . . . . 163.9 15.7 165.0 16.2Total assets . . . . . . . . . . . . . . . . . . . . . . . . . . . . . 1,026.8 14.2 1,059.1 15.6
Emerging countriesUnit case volume . . . . . . . . . . . . . . . . . . . . . . . . . 990.1 47.1 937.8 45.3Net sales revenue . . . . . . . . . . . . . . . . . . . . . . . . . 2,819.0 41.5 2,466.7 37.7Operating profit . . . . . . . . . . . . . . . . . . . . . . . . . . 290.3 45.0 254.9 39.9Depreciation of property, plant and equipment . . . 182.6 47.1 161.4 44.7Stock option expense . . . . . . . . . . . . . . . . . . . . . . 3.1 46.3 3.0 46.9Amortization and adjustment of intangible assets . . 2.1 29.6 2.8 40.6Other items . . . . . . . . . . . . . . . . . . . . . . . . . . . . . — — 6.5 100.0Adjusted EBITDA . . . . . . . . . . . . . . . . . . . . . . . . 478.1 45.7 428.6 42.0Total assets . . . . . . . . . . . . . . . . . . . . . . . . . . . . . 2,570.0 35.5 2,421.2 35.6
87
Year ended Year endedDecember 31, 2010 December 31, 2009
(euro in millions (euro in millionsexcept unit case except unit case
volume in millions) % volume in millions) %
Corporate/inter-segment assetsTotal assets . . . . . . . . . . . . . . . . . . . . . . . . . . . . . (22.7) (0.3) (195.6) (2.9)
TotalUnit case volume . . . . . . . . . . . . . . . . . . . . . . . . . 2,100.0 100.0 2,069.3 100.0Net sales revenue . . . . . . . . . . . . . . . . . . . . . . . . . 6,793.6 100.0 6,543.6 100.0Operating profit . . . . . . . . . . . . . . . . . . . . . . . . . . 645.0 100.0 638.8 100.0Depreciation of property, plant and equipment . . . 387.8 100.0 360.7 100.0Stock option expense . . . . . . . . . . . . . . . . . . . . . . 6.7 100.0 6.4 100.0Amortization and adjustment of intangible assets . . 7.1 100.0 6.9 100.0Other items . . . . . . . . . . . . . . . . . . . . . . . . . . . . . — 100.0 6.5 100.0Adjusted EBITDA . . . . . . . . . . . . . . . . . . . . . . . . 1,046.6 100.0 1,019.3 100.0Total assets . . . . . . . . . . . . . . . . . . . . . . . . . . . . . 7,231.4 100.0 6,796.8 100.0
Established countries
The following table shows our volume performance for the year ended December 31, 2010 ascompared to the year ended December 31, 2009:
2010 2009 Change Change
(in millions of unit cases) %
Italy . . . . . . . . . . . . . . . . . . . . . . . . . . . . . . . . . . . . . . . . . . . . . . . . 323.0 330.3 (7.3) (2.2)Greece . . . . . . . . . . . . . . . . . . . . . . . . . . . . . . . . . . . . . . . . . . . . . . 143.0 161.5 (18.5) (11.5)Switzerland . . . . . . . . . . . . . . . . . . . . . . . . . . . . . . . . . . . . . . . . . . . 84.0 80.4 3.6 4.5Austria . . . . . . . . . . . . . . . . . . . . . . . . . . . . . . . . . . . . . . . . . . . . . . 76.9 77.2 (0.3) (0.4)The Republic of Ireland and Northern Ireland . . . . . . . . . . . . . . . . . . 75.2 76.5 (1.3) (1.7)Cyprus . . . . . . . . . . . . . . . . . . . . . . . . . . . . . . . . . . . . . . . . . . . . . . . 16.1 17.3 (1.2) (6.9)
718.2 743.2 (25.0) (3.4)
Unit case volume in our established countries segment was 718.2 million in 2010, a decrease of3.4% over 2009. In Italy, volume declined by 2.2%, representing a decrease of 7.3 million unit cases.This was primarily due to an adverse impact on sales in the immediate consumption channels fromeconomic conditions and poor consumer sentiment. In Greece, volume declined by 11.5%, or18.5 million unit cases, as the austerity measures negatively impacted consumer purchasing power anddemand. In Switzerland, volume increased by 3.6 million unit cases, or 4.5%. The listing of ourproducts with the largest retailer in Switzerland, which historically had only carried private labelproducts, contributed to such increase. In our remaining established countries, volume remained at thelevels of 2009.
Our operations in established countries contributed A404.6 million to our adjusted EBITDA for theyear 2010, representing a 5.0% decrease compared to 2009.
88
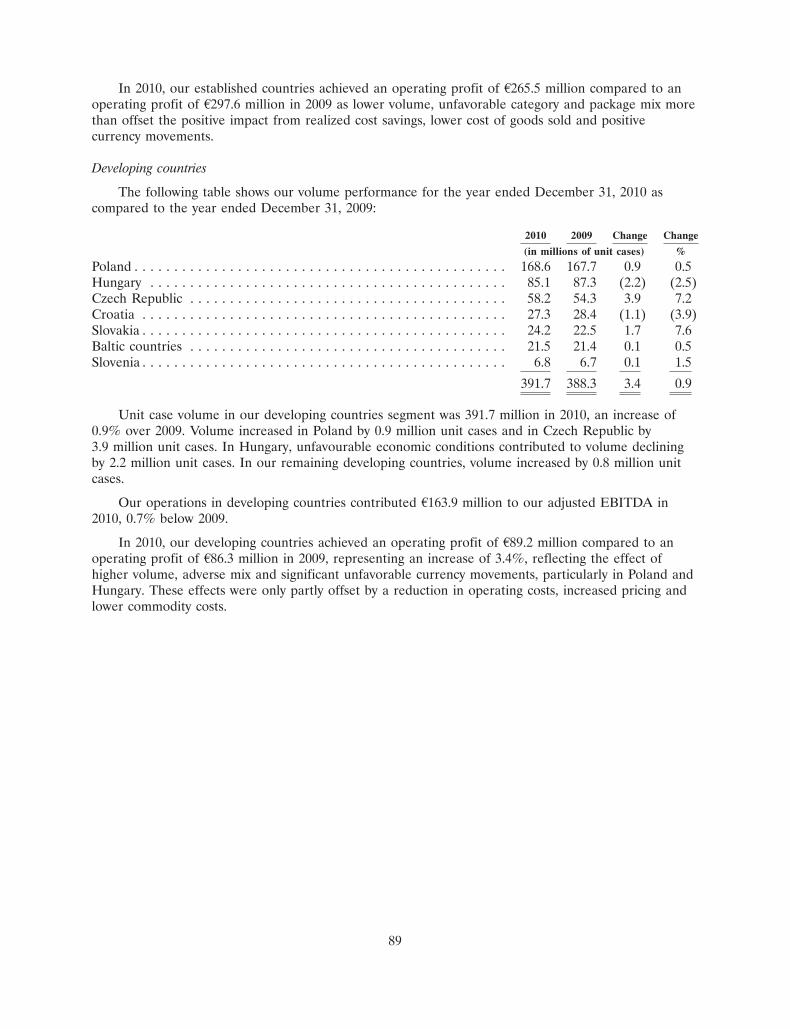
In 2010, our established countries achieved an operating profit of A265.5 million compared to anoperating profit of A297.6 million in 2009 as lower volume, unfavorable category and package mix morethan offset the positive impact from realized cost savings, lower cost of goods sold and positivecurrency movements.
Developing countries
The following table shows our volume performance for the year ended December 31, 2010 ascompared to the year ended December 31, 2009:
2010 2009 Change Change
(in millions of unit cases) %
Poland . . . . . . . . . . . . . . . . . . . . . . . . . . . . . . . . . . . . . . . . . . . . . . . 168.6 167.7 0.9 0.5Hungary . . . . . . . . . . . . . . . . . . . . . . . . . . . . . . . . . . . . . . . . . . . . . 85.1 87.3 (2.2) (2.5)Czech Republic . . . . . . . . . . . . . . . . . . . . . . . . . . . . . . . . . . . . . . . . 58.2 54.3 3.9 7.2Croatia . . . . . . . . . . . . . . . . . . . . . . . . . . . . . . . . . . . . . . . . . . . . . . 27.3 28.4 (1.1) (3.9)Slovakia . . . . . . . . . . . . . . . . . . . . . . . . . . . . . . . . . . . . . . . . . . . . . . 24.2 22.5 1.7 7.6Baltic countries . . . . . . . . . . . . . . . . . . . . . . . . . . . . . . . . . . . . . . . . 21.5 21.4 0.1 0.5Slovenia . . . . . . . . . . . . . . . . . . . . . . . . . . . . . . . . . . . . . . . . . . . . . . 6.8 6.7 0.1 1.5
391.7 388.3 3.4 0.9
Unit case volume in our developing countries segment was 391.7 million in 2010, an increase of0.9% over 2009. Volume increased in Poland by 0.9 million unit cases and in Czech Republic by3.9 million unit cases. In Hungary, unfavourable economic conditions contributed to volume decliningby 2.2 million unit cases. In our remaining developing countries, volume increased by 0.8 million unitcases.
Our operations in developing countries contributed A163.9 million to our adjusted EBITDA in2010, 0.7% below 2009.
In 2010, our developing countries achieved an operating profit of A89.2 million compared to anoperating profit of A86.3 million in 2009, representing an increase of 3.4%, reflecting the effect ofhigher volume, adverse mix and significant unfavorable currency movements, particularly in Poland andHungary. These effects were only partly offset by a reduction in operating costs, increased pricing andlower commodity costs.
89
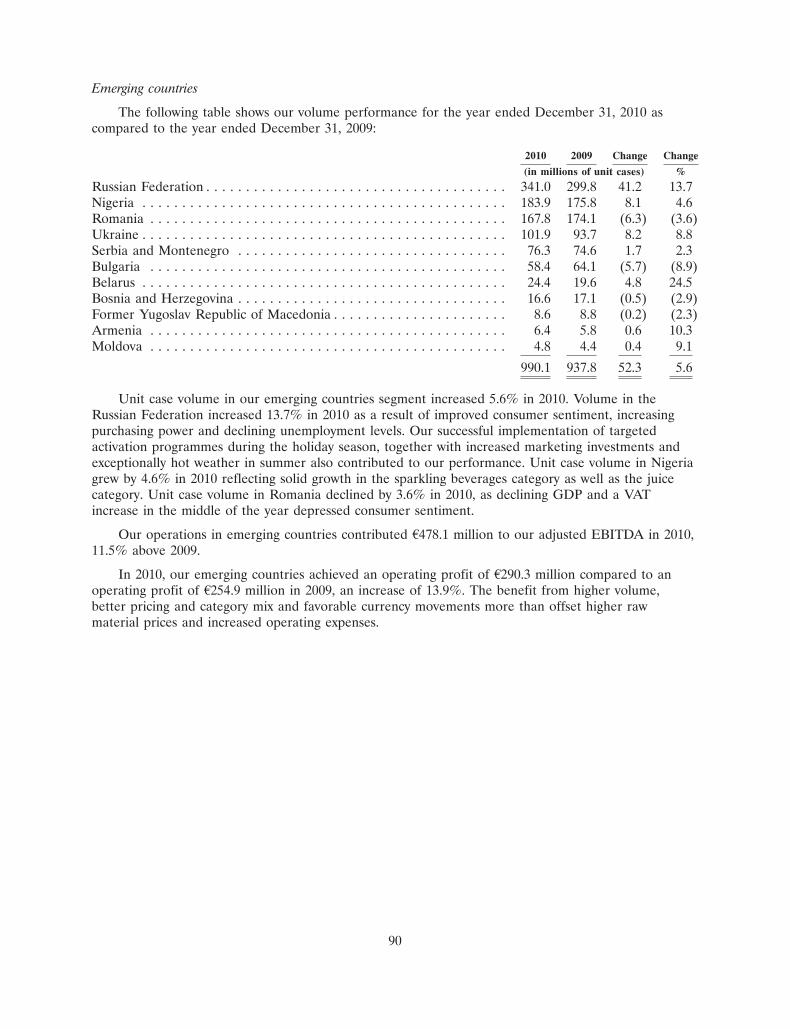
Emerging countries
The following table shows our volume performance for the year ended December 31, 2010 ascompared to the year ended December 31, 2009:
2010 2009 Change Change
(in millions of unit cases) %
Russian Federation . . . . . . . . . . . . . . . . . . . . . . . . . . . . . . . . . . . . . . 341.0 299.8 41.2 13.7Nigeria . . . . . . . . . . . . . . . . . . . . . . . . . . . . . . . . . . . . . . . . . . . . . . 183.9 175.8 8.1 4.6Romania . . . . . . . . . . . . . . . . . . . . . . . . . . . . . . . . . . . . . . . . . . . . . 167.8 174.1 (6.3) (3.6)Ukraine . . . . . . . . . . . . . . . . . . . . . . . . . . . . . . . . . . . . . . . . . . . . . . 101.9 93.7 8.2 8.8Serbia and Montenegro . . . . . . . . . . . . . . . . . . . . . . . . . . . . . . . . . . 76.3 74.6 1.7 2.3Bulgaria . . . . . . . . . . . . . . . . . . . . . . . . . . . . . . . . . . . . . . . . . . . . . 58.4 64.1 (5.7) (8.9)Belarus . . . . . . . . . . . . . . . . . . . . . . . . . . . . . . . . . . . . . . . . . . . . . . 24.4 19.6 4.8 24.5Bosnia and Herzegovina . . . . . . . . . . . . . . . . . . . . . . . . . . . . . . . . . . 16.6 17.1 (0.5) (2.9)Former Yugoslav Republic of Macedonia . . . . . . . . . . . . . . . . . . . . . . 8.6 8.8 (0.2) (2.3)Armenia . . . . . . . . . . . . . . . . . . . . . . . . . . . . . . . . . . . . . . . . . . . . . 6.4 5.8 0.6 10.3Moldova . . . . . . . . . . . . . . . . . . . . . . . . . . . . . . . . . . . . . . . . . . . . . 4.8 4.4 0.4 9.1
990.1 937.8 52.3 5.6
Unit case volume in our emerging countries segment increased 5.6% in 2010. Volume in theRussian Federation increased 13.7% in 2010 as a result of improved consumer sentiment, increasingpurchasing power and declining unemployment levels. Our successful implementation of targetedactivation programmes during the holiday season, together with increased marketing investments andexceptionally hot weather in summer also contributed to our performance. Unit case volume in Nigeriagrew by 4.6% in 2010 reflecting solid growth in the sparkling beverages category as well as the juicecategory. Unit case volume in Romania declined by 3.6% in 2010, as declining GDP and a VATincrease in the middle of the year depressed consumer sentiment.
Our operations in emerging countries contributed A478.1 million to our adjusted EBITDA in 2010,11.5% above 2009.
In 2010, our emerging countries achieved an operating profit of A290.3 million compared to anoperating profit of A254.9 million in 2009, an increase of 13.9%. The benefit from higher volume,better pricing and category mix and favorable currency movements more than offset higher rawmaterial prices and increased operating expenses.
90
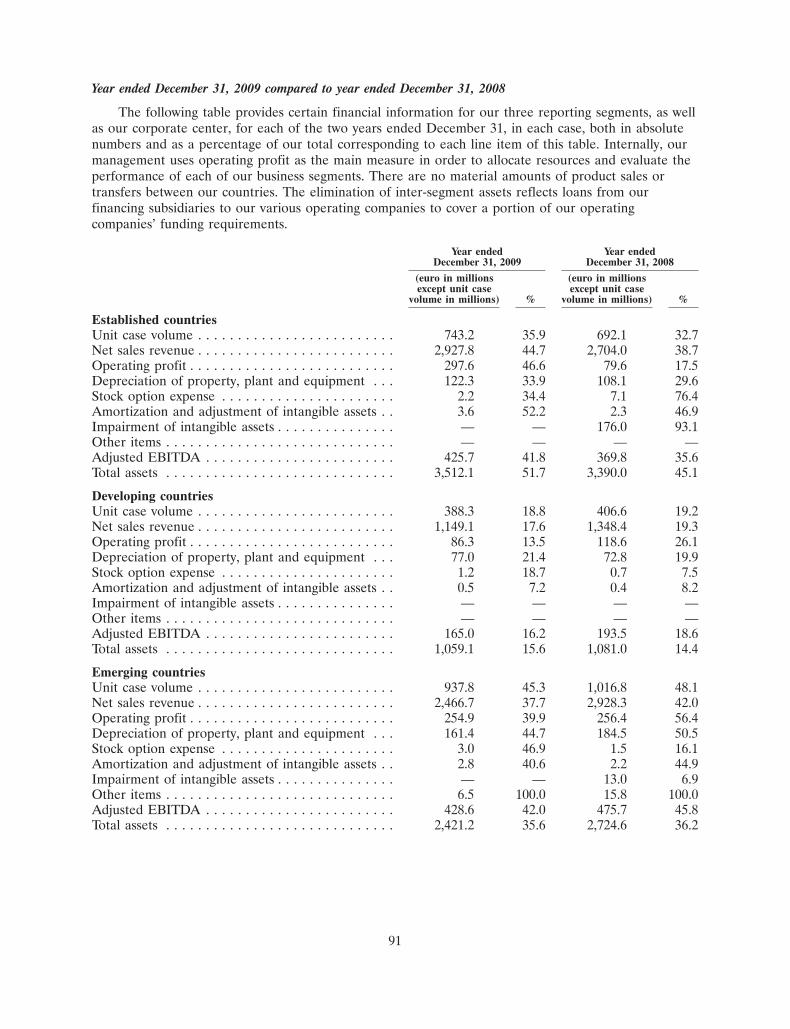
Year ended December 31, 2009 compared to year ended December 31, 2008
The following table provides certain financial information for our three reporting segments, as wellas our corporate center, for each of the two years ended December 31, in each case, both in absolutenumbers and as a percentage of our total corresponding to each line item of this table. Internally, ourmanagement uses operating profit as the main measure in order to allocate resources and evaluate theperformance of each of our business segments. There are no material amounts of product sales ortransfers between our countries. The elimination of inter-segment assets reflects loans from ourfinancing subsidiaries to our various operating companies to cover a portion of our operatingcompanies’ funding requirements.
Year ended Year endedDecember 31, 2009 December 31, 2008
(euro in millions (euro in millionsexcept unit case except unit case
volume in millions) % volume in millions) %
Established countriesUnit case volume . . . . . . . . . . . . . . . . . . . . . . . . . 743.2 35.9 692.1 32.7Net sales revenue . . . . . . . . . . . . . . . . . . . . . . . . . 2,927.8 44.7 2,704.0 38.7Operating profit . . . . . . . . . . . . . . . . . . . . . . . . . . 297.6 46.6 79.6 17.5Depreciation of property, plant and equipment . . . 122.3 33.9 108.1 29.6Stock option expense . . . . . . . . . . . . . . . . . . . . . . 2.2 34.4 7.1 76.4Amortization and adjustment of intangible assets . . 3.6 52.2 2.3 46.9Impairment of intangible assets . . . . . . . . . . . . . . . — — 176.0 93.1Other items . . . . . . . . . . . . . . . . . . . . . . . . . . . . . — — — —Adjusted EBITDA . . . . . . . . . . . . . . . . . . . . . . . . 425.7 41.8 369.8 35.6Total assets . . . . . . . . . . . . . . . . . . . . . . . . . . . . . 3,512.1 51.7 3,390.0 45.1
Developing countriesUnit case volume . . . . . . . . . . . . . . . . . . . . . . . . . 388.3 18.8 406.6 19.2Net sales revenue . . . . . . . . . . . . . . . . . . . . . . . . . 1,149.1 17.6 1,348.4 19.3Operating profit . . . . . . . . . . . . . . . . . . . . . . . . . . 86.3 13.5 118.6 26.1Depreciation of property, plant and equipment . . . 77.0 21.4 72.8 19.9Stock option expense . . . . . . . . . . . . . . . . . . . . . . 1.2 18.7 0.7 7.5Amortization and adjustment of intangible assets . . 0.5 7.2 0.4 8.2Impairment of intangible assets . . . . . . . . . . . . . . . — — — —Other items . . . . . . . . . . . . . . . . . . . . . . . . . . . . . — — — —Adjusted EBITDA . . . . . . . . . . . . . . . . . . . . . . . . 165.0 16.2 193.5 18.6Total assets . . . . . . . . . . . . . . . . . . . . . . . . . . . . . 1,059.1 15.6 1,081.0 14.4
Emerging countriesUnit case volume . . . . . . . . . . . . . . . . . . . . . . . . . 937.8 45.3 1,016.8 48.1Net sales revenue . . . . . . . . . . . . . . . . . . . . . . . . . 2,466.7 37.7 2,928.3 42.0Operating profit . . . . . . . . . . . . . . . . . . . . . . . . . . 254.9 39.9 256.4 56.4Depreciation of property, plant and equipment . . . 161.4 44.7 184.5 50.5Stock option expense . . . . . . . . . . . . . . . . . . . . . . 3.0 46.9 1.5 16.1Amortization and adjustment of intangible assets . . 2.8 40.6 2.2 44.9Impairment of intangible assets . . . . . . . . . . . . . . . — — 13.0 6.9Other items . . . . . . . . . . . . . . . . . . . . . . . . . . . . . 6.5 100.0 15.8 100.0Adjusted EBITDA . . . . . . . . . . . . . . . . . . . . . . . . 428.6 42.0 475.7 45.8Total assets . . . . . . . . . . . . . . . . . . . . . . . . . . . . . 2,421.2 35.6 2,724.6 36.2
91
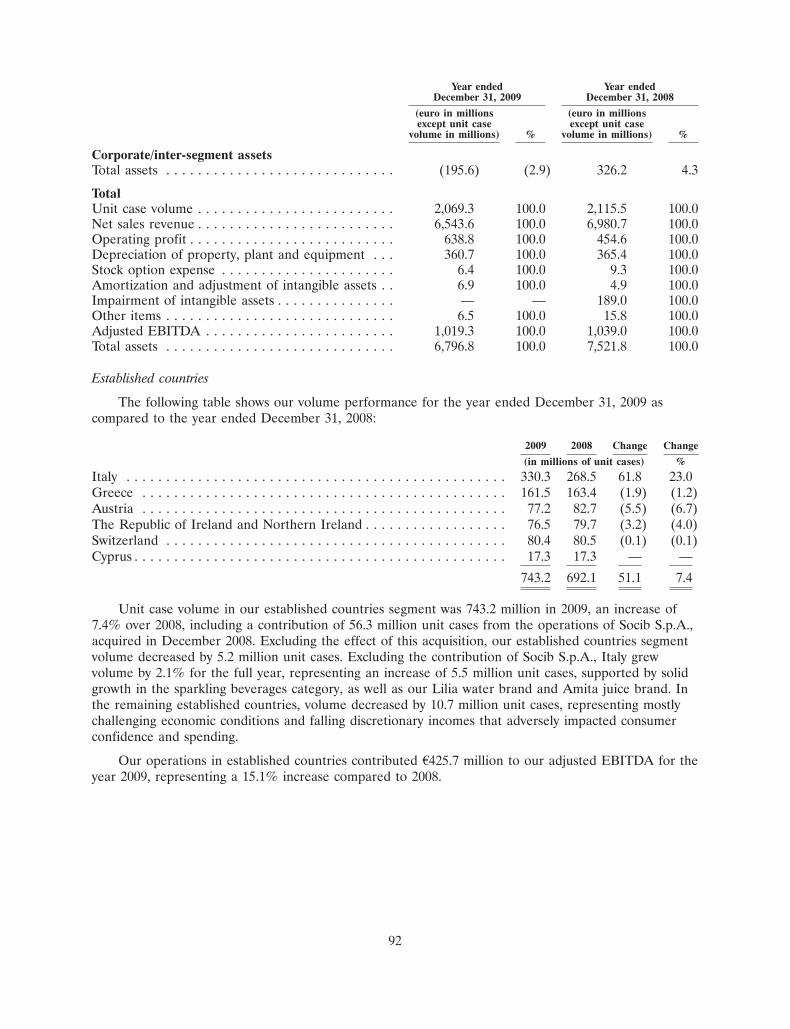
Year ended Year endedDecember 31, 2009 December 31, 2008
(euro in millions (euro in millionsexcept unit case except unit case
volume in millions) % volume in millions) %
Corporate/inter-segment assetsTotal assets . . . . . . . . . . . . . . . . . . . . . . . . . . . . . (195.6) (2.9) 326.2 4.3
TotalUnit case volume . . . . . . . . . . . . . . . . . . . . . . . . . 2,069.3 100.0 2,115.5 100.0Net sales revenue . . . . . . . . . . . . . . . . . . . . . . . . . 6,543.6 100.0 6,980.7 100.0Operating profit . . . . . . . . . . . . . . . . . . . . . . . . . . 638.8 100.0 454.6 100.0Depreciation of property, plant and equipment . . . 360.7 100.0 365.4 100.0Stock option expense . . . . . . . . . . . . . . . . . . . . . . 6.4 100.0 9.3 100.0Amortization and adjustment of intangible assets . . 6.9 100.0 4.9 100.0Impairment of intangible assets . . . . . . . . . . . . . . . — — 189.0 100.0Other items . . . . . . . . . . . . . . . . . . . . . . . . . . . . . 6.5 100.0 15.8 100.0Adjusted EBITDA . . . . . . . . . . . . . . . . . . . . . . . . 1,019.3 100.0 1,039.0 100.0Total assets . . . . . . . . . . . . . . . . . . . . . . . . . . . . . 6,796.8 100.0 7,521.8 100.0
Established countries
The following table shows our volume performance for the year ended December 31, 2009 ascompared to the year ended December 31, 2008:
2009 2008 Change Change
(in millions of unit cases) %
Italy . . . . . . . . . . . . . . . . . . . . . . . . . . . . . . . . . . . . . . . . . . . . . . . . 330.3 268.5 61.8 23.0Greece . . . . . . . . . . . . . . . . . . . . . . . . . . . . . . . . . . . . . . . . . . . . . . 161.5 163.4 (1.9) (1.2)Austria . . . . . . . . . . . . . . . . . . . . . . . . . . . . . . . . . . . . . . . . . . . . . . 77.2 82.7 (5.5) (6.7)The Republic of Ireland and Northern Ireland . . . . . . . . . . . . . . . . . . 76.5 79.7 (3.2) (4.0)Switzerland . . . . . . . . . . . . . . . . . . . . . . . . . . . . . . . . . . . . . . . . . . . 80.4 80.5 (0.1) (0.1)Cyprus . . . . . . . . . . . . . . . . . . . . . . . . . . . . . . . . . . . . . . . . . . . . . . . 17.3 17.3 — —
743.2 692.1 51.1 7.4
Unit case volume in our established countries segment was 743.2 million in 2009, an increase of7.4% over 2008, including a contribution of 56.3 million unit cases from the operations of Socib S.p.A.,acquired in December 2008. Excluding the effect of this acquisition, our established countries segmentvolume decreased by 5.2 million unit cases. Excluding the contribution of Socib S.p.A., Italy grewvolume by 2.1% for the full year, representing an increase of 5.5 million unit cases, supported by solidgrowth in the sparkling beverages category, as well as our Lilia water brand and Amita juice brand. Inthe remaining established countries, volume decreased by 10.7 million unit cases, representing mostlychallenging economic conditions and falling discretionary incomes that adversely impacted consumerconfidence and spending.
Our operations in established countries contributed A425.7 million to our adjusted EBITDA for theyear 2009, representing a 15.1% increase compared to 2008.
92
In 2009, our established countries achieved an operating profit of A297.6 million compared to anoperating profit of A79.6 million in 2008. This is primarily due to a non-cash impairment charge ofA176.0 million that was recognized to reduce the carrying amount of intangible assets relating to ourIrish operations. Excluding this effect, the operating profit of our established countries in 2008 wouldhave been A255.6 million and the increase for 2009 would have been 16.4%, reflecting increasedpricing, the realization of cost savings, lower commodity costs and a slight currency benefit, whichcollectively more than offset negative package and channel mix.
Developing countries
The following table shows our volume performance for the year ended December 31, 2009 ascompared to the year ended December 31, 2008:
2009 2008 Change Change
(in millions of unit cases) %
Poland . . . . . . . . . . . . . . . . . . . . . . . . . . . . . . . . . . . . . . . . . . . . . . . 167.7 171.4 (3.7) (2.2)Hungary . . . . . . . . . . . . . . . . . . . . . . . . . . . . . . . . . . . . . . . . . . . . . 87.3 91.8 (4.5) (4.9)Czech Republic . . . . . . . . . . . . . . . . . . . . . . . . . . . . . . . . . . . . . . . . 54.3 56.7 (2.4) (4.2)Croatia . . . . . . . . . . . . . . . . . . . . . . . . . . . . . . . . . . . . . . . . . . . . . . 28.4 30.0 (1.6) (5.3)Baltic countries . . . . . . . . . . . . . . . . . . . . . . . . . . . . . . . . . . . . . . . . 21.4 27.6 (6.2) (22.5)Slovakia . . . . . . . . . . . . . . . . . . . . . . . . . . . . . . . . . . . . . . . . . . . . . . 22.5 22.4 0.1 0.4Slovenia . . . . . . . . . . . . . . . . . . . . . . . . . . . . . . . . . . . . . . . . . . . . . . 6.7 6.7 — —
388.3 406.6 (18.3) (4.5)
Unit case volume in our developing countries segment was 388.3 million in 2009, a decrease of4.5% over 2008, although our market share increased in a contracting market. Volume in Polanddecreased by 3.7 million unit cases as a result of a changing environment and poor weather conditionsin summer. In the remaining developing countries, volume decreased by 14.5 million unit cases.
Our operations in developing countries contributed A165.0 million to our adjusted EBITDA in2009, 14.7% below 2008.
In 2009, our developing countries achieved an operating profit of A86.3 million compared to anoperating profit of A118.6 million in 2008, representing a decrease of 27.2%, reflecting the effect oflower volumes, adverse mix and significant unfavorable currency movements, particularly in Poland andHungary. These effects were only partly offset by a reduction in operating costs, increased pricing andlower commodity costs.
93
Emerging countries
The following table shows our volume performance for the year ended December 31, 2009 ascompared to the year ended December 31, 2008:
2009 2008 Change Change
(in millions of unit cases) %
Russian Federation . . . . . . . . . . . . . . . . . . . . . . . . . . . . . . . . . . . . 299.8 346.3 (46.5) (13.4)Romania . . . . . . . . . . . . . . . . . . . . . . . . . . . . . . . . . . . . . . . . . . . . 174.1 198.0 (23.9) (12.1)Nigeria . . . . . . . . . . . . . . . . . . . . . . . . . . . . . . . . . . . . . . . . . . . . . 175.8 165.9 9.9 6.0Ukraine . . . . . . . . . . . . . . . . . . . . . . . . . . . . . . . . . . . . . . . . . . . . 93.7 100.8 (7.1) (7.0)Bulgaria . . . . . . . . . . . . . . . . . . . . . . . . . . . . . . . . . . . . . . . . . . . . 64.1 71.3 (7.2) (10.1)Serbia and Montenegro . . . . . . . . . . . . . . . . . . . . . . . . . . . . . . . . . 74.6 75.5 (0.9) (1.2)Belarus . . . . . . . . . . . . . . . . . . . . . . . . . . . . . . . . . . . . . . . . . . . . . 19.6 20.7 (1.1) (5.3)Bosnia and Herzegovina . . . . . . . . . . . . . . . . . . . . . . . . . . . . . . . . . 17.1 16.6 0.5 3.0Former Yugoslav Republic of Macedonia . . . . . . . . . . . . . . . . . . . . 8.8 9.3 (0.5) (5.4)Armenia . . . . . . . . . . . . . . . . . . . . . . . . . . . . . . . . . . . . . . . . . . . . 5.8 6.5 (0.7) (10.8)Moldova . . . . . . . . . . . . . . . . . . . . . . . . . . . . . . . . . . . . . . . . . . . . 4.4 5.9 (1.5) (25.4)
937.8 1,016.8 (79.0) (7.8)
Unit case volume in our emerging countries segment decreased 7.8% in 2009, although our marketshare increased in a contracting market. Volume in the Russian Federation declined by 13.4% in 2009due to the challenging economic conditions of the downturn in the Russian economy, consumer priceincreases and an overall decrease in consumer demand. Unit case volume in Nigeria grew by 6.0% in2009 reflecting solid growth in the sparkling beverages category and water sub-category, partly offset bya significant decline in the juice sub-category following the loss of production capacity as a result of firedamage sustained at the Benin plant in late 2008. Unit case volume in Romania declined by 12.1% in2009, due to the rapid deterioration in economic conditions in the country in the second half of theyear, which resulted in lower consumer spending, particularly in the immediate consumption channels.
Our operations in emerging countries contributed A428.6 million to our adjusted EBITDA in 2009,9.9% below 2008.
In 2009, our emerging countries achieved an operating profit of A254.9 million compared to anoperating profit of A256.4 million in 2008, a marginal reduction of 0.6%. The benefit of higher pricingand lower operating costs only partially offset the lower volume, higher one-off production andwarehousing costs from disruptions to the supply of our juice products in Nigeria, negative mix andmaterial adverse currency movements.
B. Liquidity and capital resources
Our sources of capital include, but are not limited to, cash flows from operations, the issuance ofdebt, syndicated loan facility and the issuance of equity securities. We believe that available short-termand long-term capital resources are sufficient to fund our financial commitments and operating needs.
94
Cash flows from operating activities
Our cash flows provided by operating activities from the year ended December 31, 2008 to theyear ended December 31, 2010 are as follows:
2010 2009 2008
(euro in millions)
Operating profit . . . . . . . . . . . . . . . . . . . . . . . . . . . . . . . . . . . . . . . . . . . . . 645.0 638.8 454.6Depreciation, amortization and other non-cash items . . . . . . . . . . . . . . . . . . . 414.8 391.0 572.1Working capital changes . . . . . . . . . . . . . . . . . . . . . . . . . . . . . . . . . . . . . . . . 69.1 56.7 (19.6)Tax paid . . . . . . . . . . . . . . . . . . . . . . . . . . . . . . . . . . . . . . . . . . . . . . . . . . . (141.0) (89.3) (129.8)
Net cash from operating activities . . . . . . . . . . . . . . . . . . . . . . . . . . . . . . . . 987.9 997.2 877.3
Our primary source of cash flow is funds generated from operations. In 2010, cash flow fromoperating activities decreased only 0.9% despite the significantly increased tax payments as a result ofthe improved operating results and working capital management. In 2009, the increase in net cashprovided by operating activities amounted to an additional A119.9 million compared with 2008. This wasdue to the implementation of cost reduction and restructuring programs aimed at improvingoperational efficiencies and our focus on improved working capital management.
Cash flows used in investing activities
Our cash flows used in investing activities from the year ended December 31, 2008 to the yearended December 31, 2010 are as follows:
2010 2009 2008
(euro in millions)
Payments for purchases of property, plant and equipment . . . . . . . . . . . . . . . (376.2) (383.9) (590.5)Payments for purchases of intangible assets . . . . . . . . . . . . . . . . . . . . . . . . . (15.8) (0.5) (3.9)Proceeds from sales of property, plant and equipment . . . . . . . . . . . . . . . . . 12.0 18.2 42.7Proceeds from sales of trademarks and other intangible assets . . . . . . . . . . . . — — 35.0Net receipts from (payments for) investments . . . . . . . . . . . . . . . . . . . . . . . 7.2 (4.7) (35.3)Interest received . . . . . . . . . . . . . . . . . . . . . . . . . . . . . . . . . . . . . . . . . . . . . 7.3 10.5 16.8Net refunds from/(payments for) acquisitions . . . . . . . . . . . . . . . . . . . . . . . . — 17.5 (225.3)
Net cash used in investing activities . . . . . . . . . . . . . . . . . . . . . . . . . . . . . . (365.5) (342.9) (760.5)
Purchases of property, plant and equipment accounted for our most significant cash outlay forinvesting activities in each of the three years ended December 31. We focus our capital investment onthe most profitable areas of the business, such as marketing equipment and immediate consumptionpackaging. We continue to redeploy plant and equipment within our group where possible, thusminimizing cash outflows and improving our returns on existing assets.
95
Set forth below are our purchases of non-current assets in our three business segments for theperiod from the year ended December 31, 2008 to the year ended December 31, 2010. We have alsoset forth these capital expenditures as a percentage of our total capital expenditure in the relevantperiod.
2010 2009 2008
(euro in (euro in (euro inmillions) % millions) % millions) %
Business segmentEstablished countries . . . . . . . . . . . . . . . . . . . . . . 123.2 31.4 96.6 25.1 156.0 26.2Developing countries . . . . . . . . . . . . . . . . . . . . . . 61.0 15.6 48.8 12.7 132.0 22.2Emerging countries . . . . . . . . . . . . . . . . . . . . . . . 207.8 53.0 239.0 62.2 306.4 51.6
Total purchases of non-current assets . . . . . . . . . 392.0 100.0 384.4 100.0 594.4 100.0
Purchases of non-current assets totaled A392.0 million in 2010. Of this, 48.6% related to investmentin production equipment and facilities and 19.3% to the acquisition of marketing equipment. There wasonly a slight increase of A7.6 million, or 2.0%, in purchases in 2010 compared to 2009. The decrease ofA210.0 million, or 35.3%, in purchases in 2009 compared to 2008 has been achieved through theoptimization of the efficiency of our existing asset infrastructure and undertaking a more prudentcapital investment program. The decrease is mainly attributed to a decrease of investment in marketingequipment of A64.0 million and a decrease of investment in production equipment and facilities ofA151.7 million.
Cash refunds from acquisitions of A17.5 million in 2009 relate to a refund of certain purchaseconsideration regarding the acquisition of Socib S.p.A. Cash payments for acquisitions of A225.3 millionin 2008 relate to the acquisition of Socib S.p.A.. In 2008, we received A35.0 million from TheCoca-Cola Company in respect of the sale of the Romerquelle water trademark and botaniQ andLanitis juice trademarks. For additional information, see above ‘‘Major recent transactions—Sale ofRomerquelle trademark (2008)’’.
Cash flows (used in)/from financing activities
Our cash flows provided by financing activities from the year ended December 31, 2008 to the yearended December 31, 2010 are as follows:
2010 2009 2008
(euro in millions)
Return of capital to shareholders . . . . . . . . . . . . . . . . . . . . . . . . . . . . . — (546.3) —Payments of expenses related to the share capital increase . . . . . . . . . . . — (6.0) —Share buy-back payments . . . . . . . . . . . . . . . . . . . . . . . . . . . . . . . . . . (42.3) (16.6) —Proceeds from shares issued to employees exercising stock options . . . . . 5.7 1.8 21.1Dividends paid . . . . . . . . . . . . . . . . . . . . . . . . . . . . . . . . . . . . . . . . . . (109.0) (107.6) (102.8)Purchase of shares held by non-controlling interests . . . . . . . . . . . . . . . (3.7) — —Proceeds from external borrowings . . . . . . . . . . . . . . . . . . . . . . . . . . . . 927.1 1,199.8 1,937.3Repayments of external borrowings . . . . . . . . . . . . . . . . . . . . . . . . . . . (1,191.0) (1,508.0) (1,231.7)Principal repayments of finance lease obligations . . . . . . . . . . . . . . . . . (75.2) (85.3) (67.5)Proceeds from sale of interest rate swaps attributable to fair value . . . . . 33.0 — —Interest paid . . . . . . . . . . . . . . . . . . . . . . . . . . . . . . . . . . . . . . . . . . . . (72.3) (75.1) (133.6)
Net cash (used in)/from financing activities . . . . . . . . . . . . . . . . . . . . . (527.7) (1,143.3) 422.8
96
On September 18, 2009, we announced proposals for a re-capitalization, which resulted in a capitalreturn of A548.1 million to our shareholders, i.e. A1.50 per share. At the extraordinary general meetingheld on October 16, 2009, our shareholders approved an increase of our share capital by A548.1 million,through the partial capitalization of share premium and an increase in the nominal value of each shareby A1.50 per share. At the same extraordinary general meeting, our shareholders also approved thedecrease of our share capital by A548.1 million, through a reduction of the nominal value of the sharesby A1.50 per share and an equal amount of capital was returned to the shareholders in cash. Followingshareholder and regulatory approval, we realized the capital return on December 2, 2009. The capitalreturn was financed through a combination of accumulated cash and new debt.
On April 30, 2009, our board of directors resolved to buy-back a maximum of 5% of our paid-inshare capital during the period that is 24 months from the date of the extraordinary general meeting ofApril 27, 2009 which approved a share buy-back program pursuant to article 16 of codified law2190/1920 (i.e. until April 26, 2011). Based on our capitalization at that time, the maximum amountthat may be bought back pursuant to the program is 18,270,104 shares. Purchases under the programare subject to a minimum purchase price of A1.00 per share and a maximum purchase price of A20.00per share. Applicable law does not require any actual use of such approved share buy-back programs.We may therefore, in our sole discretion, decide not to buy back any shares or to buy fewer shares thanthe maximum permissible number approved under the program. The purchase of shares pursuant to theshare buy-back program is dependent upon a number of factors including, without limitation, therelative attractiveness of alternative investment opportunities and the availability of funds. As atDecember 31, 2009, 1,111,781 shares had been purchased pursuant to the share buy-back program for atotal value of A16.6 million, bringing the shares in circulation to 364,427,294. During 2010, 2,318,354shares were purchased pursuant to the share buy-back program for a total value of A42.3 million. As atDecember 31, 2010, 3,430,135 shares were purchased pursuant to the share buy-back program for atotal value of A57.2 million bringing the shares in circulation to 362,706,305. No additional shares weresubsequently purchased up to March 15, 2011.
During 2010, we adjusted our interest rate profile to reduce exposure to fluctuations in EURIBORso as to stabilize future interest expenses. This was executed by restructuring the interest rate terms ofoutstanding cross currency swap contracts relating to $400.0 million in US bonds and by unwindingoutstanding fixed to floating interest rate swap contracts with an aggregate notional principal amount ofA792.5 million.
Proceeds and repayments of external borrowings include both short-term and long-term financingactivities.
We repaid a net amount of A263.9 million in external borrowings in 2010. On December 14, 2010we repaid an aggregate principal amount of Notes equal to A198.9 million, being a portion of theA500.0 million fixed rate bond due in 2011.
Proceeds and repayment of external borrowings in 2009 and 2008 were under our A2.0 billion euromedium term note, or EMTN program, and under the commercial paper program. The net repaymentsof external borrowings in 2009 were A308.2 million and represent mainly the repayment of theA350.0 million bond that matured in March 2009, as well as the reduction in the outstandingborrowings under the commercial paper program by A201.5 million, which were partly offset by theA300.0 million bond issued in November 2009.
The net proceeds from external borrowings in 2008 were A705.6 million. The additional fundingwas required in order to fund the acquisition of Socib S.p.A. and the A350.0 million bond maturing inMarch 2009.
97
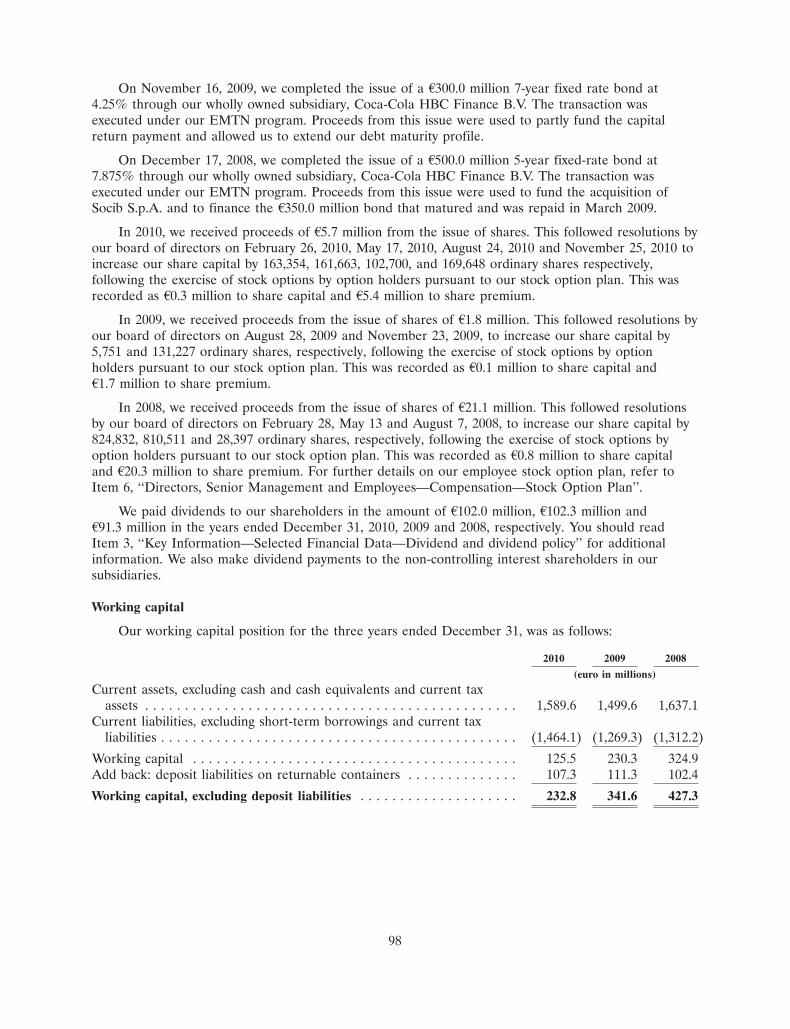
On November 16, 2009, we completed the issue of a A300.0 million 7-year fixed rate bond at4.25% through our wholly owned subsidiary, Coca-Cola HBC Finance B.V. The transaction wasexecuted under our EMTN program. Proceeds from this issue were used to partly fund the capitalreturn payment and allowed us to extend our debt maturity profile.
On December 17, 2008, we completed the issue of a A500.0 million 5-year fixed-rate bond at7.875% through our wholly owned subsidiary, Coca-Cola HBC Finance B.V. The transaction wasexecuted under our EMTN program. Proceeds from this issue were used to fund the acquisition ofSocib S.p.A. and to finance the A350.0 million bond that matured and was repaid in March 2009.
In 2010, we received proceeds of A5.7 million from the issue of shares. This followed resolutions byour board of directors on February 26, 2010, May 17, 2010, August 24, 2010 and November 25, 2010 toincrease our share capital by 163,354, 161,663, 102,700, and 169,648 ordinary shares respectively,following the exercise of stock options by option holders pursuant to our stock option plan. This wasrecorded as A0.3 million to share capital and A5.4 million to share premium.
In 2009, we received proceeds from the issue of shares of A1.8 million. This followed resolutions byour board of directors on August 28, 2009 and November 23, 2009, to increase our share capital by5,751 and 131,227 ordinary shares, respectively, following the exercise of stock options by optionholders pursuant to our stock option plan. This was recorded as A0.1 million to share capital andA1.7 million to share premium.
In 2008, we received proceeds from the issue of shares of A21.1 million. This followed resolutionsby our board of directors on February 28, May 13 and August 7, 2008, to increase our share capital by824,832, 810,511 and 28,397 ordinary shares, respectively, following the exercise of stock options byoption holders pursuant to our stock option plan. This was recorded as A0.8 million to share capitaland A20.3 million to share premium. For further details on our employee stock option plan, refer toItem 6, ‘‘Directors, Senior Management and Employees—Compensation—Stock Option Plan’’.
We paid dividends to our shareholders in the amount of A102.0 million, A102.3 million andA91.3 million in the years ended December 31, 2010, 2009 and 2008, respectively. You should readItem 3, ‘‘Key Information—Selected Financial Data—Dividend and dividend policy’’ for additionalinformation. We also make dividend payments to the non-controlling interest shareholders in oursubsidiaries.
Working capital
Our working capital position for the three years ended December 31, was as follows:
2010 2009 2008
(euro in millions)
Current assets, excluding cash and cash equivalents and current taxassets . . . . . . . . . . . . . . . . . . . . . . . . . . . . . . . . . . . . . . . . . . . . . . . 1,589.6 1,499.6 1,637.1
Current liabilities, excluding short-term borrowings and current taxliabilities . . . . . . . . . . . . . . . . . . . . . . . . . . . . . . . . . . . . . . . . . . . . . (1,464.1) (1,269.3) (1,312.2)
Working capital . . . . . . . . . . . . . . . . . . . . . . . . . . . . . . . . . . . . . . . . . 125.5 230.3 324.9Add back: deposit liabilities on returnable containers . . . . . . . . . . . . . . 107.3 111.3 102.4
Working capital, excluding deposit liabilities . . . . . . . . . . . . . . . . . . . . 232.8 341.6 427.3
98
As at December 31, 2010, our working capital, excluding deposit liabilities on returnablecontainers, decreased by A108.8 million, compared with the working capital balance as at December 31,2009. The reason for the decrease is the increase in trade and other payables of A194.8 million,increase of trade and other receivables of A40.8 million and the increase in the level of inventories heldof A56.6 million As at December 31, 2009, our working capital, excluding deposit liabilities onreturnable containers, decreased by A85.7 million, compared with the working capital balance as atDecember 31, 2008. The reasons for this decrease were the reduction in the level of inventories held ofA50.4 million, combined with the decrease of trade and other receivables of A87.1 million and thedecrease in trade and other payables of A42.9 million.
As at December 31, 2008, 2009 and 2010, we had a positive working capital of A427.3 million,A341.6 million and A232.8 million respectively, excluding deposit liabilities for returnable containers ofA102.4 million, A111.3 million and A107.3 million respectively. Although our deposit liabilities areclassified as part of current liabilities, our returnable containers, to which the deposits relate, areclassified as part of property, plant and equipment. We believe that presenting our working capitalexcluding deposit liabilities for returnable containers is useful to investors because it allows them tocompare our working capital information with that of other bottlers that do not use returnablepackaging.
Although we seek to finance our capital expenditures from operating cash flows, we may also useshort-term borrowing facilities. As a result, we may operate with working capital deficits until theseborrowings and expenditures are funded with either further operating cash flows or long-termborrowings. We review our cash requirements and financial resources on a monthly basis for a rolling12-month period. We continue to maintain adequate current assets to satisfy current liabilities whenthey are due and have sufficient liquidity and financial resources to manage our day-to-day cashrequirements. Taking into consideration our established borrowing facilities, operating cash flows andaccess to capital markets, we believe that we have sufficient liquidity and working capital to meet ourpresent and budgeted requirements.
Holding company structure
The amount of dividends payable by our operating subsidiaries to us is subject to, among otherrestrictions, general limitations imposed by the corporate laws and exchange control restrictions of therespective jurisdictions where those subsidiaries are organized and operate. Dividends paid to us bycertain of our subsidiaries are also subject to withholding taxes. In the context of our taxationmanagement policy, our subsidiaries do not remit dividends to us in cases where it would bedisadvantageous to do so from a tax point of view. We seek to satisfy the operating cash flowrequirements of our operations in each country with cash generated from that country. Acquisitions andsignificant capital investments are financed centrally, with funds provided to our operating subsidiariesin the form of equity or inter-company loans, depending on a variety of considerations including tax.Where withholding taxes on dividends are potentially significant, we are able to extract cash fromoperating subsidiaries in other ways, such as through capital reduction techniques and loans fromoperating subsidiaries to holding companies. Consequently, we have not incurred material withholdingtaxes on the remittance of dividends or cash from our operating subsidiaries. However, in the future,we may have to satisfy our cash requirements at the holding company level through sources offinancing other than dividends, including external sources.
99
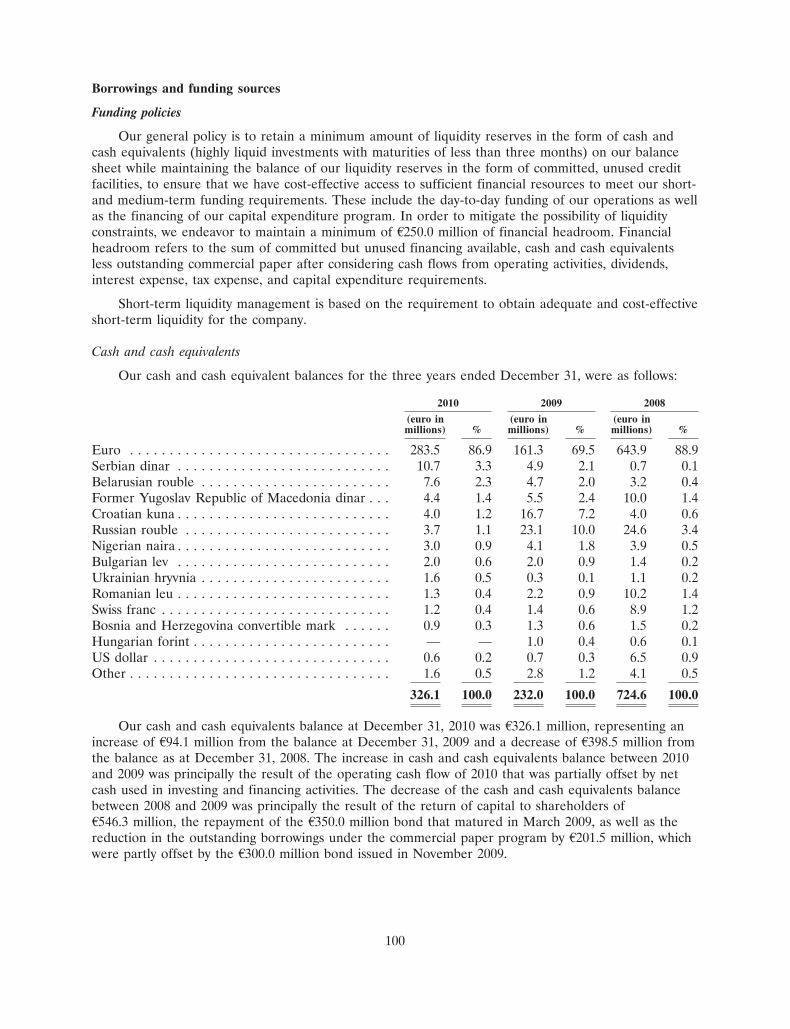
Borrowings and funding sources
Funding policies
Our general policy is to retain a minimum amount of liquidity reserves in the form of cash andcash equivalents (highly liquid investments with maturities of less than three months) on our balancesheet while maintaining the balance of our liquidity reserves in the form of committed, unused creditfacilities, to ensure that we have cost-effective access to sufficient financial resources to meet our short-and medium-term funding requirements. These include the day-to-day funding of our operations as wellas the financing of our capital expenditure program. In order to mitigate the possibility of liquidityconstraints, we endeavor to maintain a minimum of A250.0 million of financial headroom. Financialheadroom refers to the sum of committed but unused financing available, cash and cash equivalentsless outstanding commercial paper after considering cash flows from operating activities, dividends,interest expense, tax expense, and capital expenditure requirements.
Short-term liquidity management is based on the requirement to obtain adequate and cost-effectiveshort-term liquidity for the company.
Cash and cash equivalents
Our cash and cash equivalent balances for the three years ended December 31, were as follows:
2010 2009 2008
(euro in (euro in (euro inmillions) % millions) % millions) %
Euro . . . . . . . . . . . . . . . . . . . . . . . . . . . . . . . . . 283.5 86.9 161.3 69.5 643.9 88.9Serbian dinar . . . . . . . . . . . . . . . . . . . . . . . . . . . 10.7 3.3 4.9 2.1 0.7 0.1Belarusian rouble . . . . . . . . . . . . . . . . . . . . . . . . 7.6 2.3 4.7 2.0 3.2 0.4Former Yugoslav Republic of Macedonia dinar . . . 4.4 1.4 5.5 2.4 10.0 1.4Croatian kuna . . . . . . . . . . . . . . . . . . . . . . . . . . . 4.0 1.2 16.7 7.2 4.0 0.6Russian rouble . . . . . . . . . . . . . . . . . . . . . . . . . . 3.7 1.1 23.1 10.0 24.6 3.4Nigerian naira . . . . . . . . . . . . . . . . . . . . . . . . . . . 3.0 0.9 4.1 1.8 3.9 0.5Bulgarian lev . . . . . . . . . . . . . . . . . . . . . . . . . . . 2.0 0.6 2.0 0.9 1.4 0.2Ukrainian hryvnia . . . . . . . . . . . . . . . . . . . . . . . . 1.6 0.5 0.3 0.1 1.1 0.2Romanian leu . . . . . . . . . . . . . . . . . . . . . . . . . . . 1.3 0.4 2.2 0.9 10.2 1.4Swiss franc . . . . . . . . . . . . . . . . . . . . . . . . . . . . . 1.2 0.4 1.4 0.6 8.9 1.2Bosnia and Herzegovina convertible mark . . . . . . 0.9 0.3 1.3 0.6 1.5 0.2Hungarian forint . . . . . . . . . . . . . . . . . . . . . . . . . — — 1.0 0.4 0.6 0.1US dollar . . . . . . . . . . . . . . . . . . . . . . . . . . . . . . 0.6 0.2 0.7 0.3 6.5 0.9Other . . . . . . . . . . . . . . . . . . . . . . . . . . . . . . . . . 1.6 0.5 2.8 1.2 4.1 0.5
326.1 100.0 232.0 100.0 724.6 100.0
Our cash and cash equivalents balance at December 31, 2010 was A326.1 million, representing anincrease of A94.1 million from the balance at December 31, 2009 and a decrease of A398.5 million fromthe balance as at December 31, 2008. The increase in cash and cash equivalents balance between 2010and 2009 was principally the result of the operating cash flow of 2010 that was partially offset by netcash used in investing and financing activities. The decrease of the cash and cash equivalents balancebetween 2008 and 2009 was principally the result of the return of capital to shareholders ofA546.3 million, the repayment of the A350.0 million bond that matured in March 2009, as well as thereduction in the outstanding borrowings under the commercial paper program by A201.5 million, whichwere partly offset by the A300.0 million bond issued in November 2009.
100
While there are restrictive controls on the movement of funds out of certain of the countries inwhich we operate, these restrictions have not had a material impact on our liquidity, as the amounts ofcash and cash equivalents held in such countries, particularly Nigeria, are generally retained for capitalexpenditure and working capital purposes.
Debt
Our medium and long-term funding is based on the need to ensure a consistent supply ofcommitted funding at group and subsidiary level, at minimum cost given market conditions, to meetour anticipated capital and operating funding requirements. Short-term liquidity management is basedon the requirement to obtain adequate and cost-effective short-term liquidity. As a result of thesuccessful completion of a A300.0 million bond issue on November 16, 2009 and other existing financialarrangements including our unused A500.0 million syndicated loan facility, as well as our currentlyforecasted cash flow from operations, we believe that we have sufficient financial resources to meet ourmedium-term financial commitments.
Our debt as at December 31, 2010, 2009 and 2008 is as follows:
2010 2009 2008
(euro in millions)
Short-term borrowings, less finance lease obligations and current portionof long-term debt . . . . . . . . . . . . . . . . . . . . . . . . . . . . . . . . . . . . . . . . 181.3 236.0 448.2
Current portion of long-term debt . . . . . . . . . . . . . . . . . . . . . . . . . . . . . . 305.0 1.1 391.6Short-term finance lease obligations . . . . . . . . . . . . . . . . . . . . . . . . . . . . . 48.8 69.9 81.5
Total short-term borrowings, including finance lease obligations . . . . . . . . . 535.1 307.0 921.3
Long-term borrowings, less finance lease obligations . . . . . . . . . . . . . . . . . 1,561.2 2,010.3 1,761.3Long-term finance lease obligations . . . . . . . . . . . . . . . . . . . . . . . . . . . . . 95.2 90.3 132.0
Total long-term borrowings, including finance lease obligations . . . . . . . . . 1,656.4 2,100.6 1,893.3
Gross debt, including finance lease obligations . . . . . . . . . . . . . . . . . . . . . 2,191.5 2,407.6 2,814.6
Cash and cash equivalents . . . . . . . . . . . . . . . . . . . . . . . . . . . . . . . . . . . . (326.1) (232.0) (724.6)
Net debt . . . . . . . . . . . . . . . . . . . . . . . . . . . . . . . . . . . . . . . . . . . . . . . . . 1,865.4 2,175.6 2,090.0
As at December 31, 2010, 62.5% of our gross debt was denominated in euro and 34.0% in USdollars. This compared to 69.7% in euro and 28.2% in US dollars, as at December 31, 2009 and 72.8%in euro and 26.0% in US dollars, as at December 31, 2008.
We manage our debt in two distinct portfolios: short-term debt and long-term debt. The short-termdebt portfolio includes all debt repayment and working capital requirements within 12 months, and thelong-term portfolio contains all other debt, such as Eurobonds, with maturities longer than 12 months.We launched our commercial paper program during 2002 to fund our short-term debt portfolio needs.We service our short-term debt portfolio principally through operating cash flows.
During 2010, we adjusted our interest rate profile to reduce exposure to fluctuations in EURIBORso as to stabilize future interest expenses. This was executed by restructuring the interest rate terms ofoutstanding cross currency swap contracts relating to $400.0 million in US bonds and by unwindingoutstanding fixed to floating interest rate swap contracts with an aggregate notional principal amount ofA792.5 million. As a result, an amount of A1.4 million was credited to our income statement.
101
Commercial paper program and committed credit facilities
In March 2002, we established a A1.0 billion global commercial paper program to further diversifyour short term funding sources. The program consists of a euro commercial paper facility and a USdollar denominated US commercial paper facility, of which the latter is currently not active. Thecommercial paper notes may be issued either as non-interest bearing notes sold at a discount or asinterest bearing notes at a fixed or at a floating rate, or by reference to an index or formula. Allcommercial paper issued under the program must be repaid within 1 to 365 days. The outstandingamount under the euro commercial paper program was A127.0 million as at December 31, 2010,A189.5 million as at December 31, 2009 and A391.0 million as at December 31, 2008.
As at March 15, 2011, we had outstanding balances of A127.0 million under the commercial paperprogram. The weighted average interest rate that applies to this outstanding balance is 0.92%.
As at December 31, 2008, we had a A600.0 million syndicated loan facility with an expiry date ofAugust 1, 2010. During December 2009, we replaced this facility with a new A500.0 million facility thatwas issued through various financial institutions and expires on December 17, 2012. This facility can beused for general corporate purposes and carries a floating interest rate over EURIBOR and LIBOR.The facility allows us to draw down, on three to five days notice, amounts in tranches and repay themin periods ranging from one to six months, or any other period agreed between us and the financialinstitutions. No amounts have been drawn under the syndicated loan facility since inception.
US debt-shelf program
In December 2003, we filed a registration statement with the US Securities and ExchangeCommission, or SEC, for a shelf registration, which expired in December 2008. The amount registeredwas $2.0 billion. No amounts were drawn under the shelf registration.
Euro medium-term note program
In 2001, we established a A2.0 billion euro medium-term note program which has been renewedannually since then. Bonds issued under the program through our 100% owned subsidiary Coca-ColaHBC Finance B.V. are fully, unconditionally and irrevocably guaranteed by Coca-Cola Hellenic BottlingCompany S.A., as well as Coca-Cola HBC Finance plc (for issues prior to 2009) and are not subject toany financial covenants.
102
The program has been used six times, raising a total of A2,775.0 million. The first note issueoccurred in June 2001 and related to a A625.0 million 5-year fixed-rate bond at 5.250%. The secondand third note issues occurred in December 2001 and related to a A200.0 million 2-year floating-ratebond and a A300.0 million 3-year fixed-rate bond at 4.000%. Over the course of 2003, we purchasedand cancelled A70.0 million of the outstanding A625.0 million bond that matured in June 2006. In July2004, we realized a tender offer for a further A322.0 million of the outstanding debt on theA625.0 million bond that matured in June 2006. On the same date, we issued a A500.0 million 7-yearfixed-rate bond at 4.375%. Proceeds from that issue were used to finance the A332.0 million tenderoffer for the A625.0 million bond that matured in June 2006 and to partially fund the repayment of theA300.0 million bond that matured in December 2004. The remaining A233.0 million outstanding on theA625.0 million bond was repaid in June 2006. The repayment of this bond was pre-funded in March2006, with the issue of a A350.0 million 3-year floating-rate bond. Part of the proceeds of theA350.0 million bond were used to fund the acquisition of Lanitis Bros Public Limited. In December2008, we issued a A500.0 million fixed-rate bond at 7.875% maturing in 2014. Proceeds from this issuewere partly used to fund the acquisition of Socib S.p.A. and partly for the financing of theA350.0 million bond that matured in March 2009. In November 2009, we issued a A300.0million 7-yearfixed-rate bond at 4.25%. Proceeds from this issue were used to fund the capital return payment andallowed us to extend our debt maturity profile. In December 2010, we finalized a cash tender offerthrough our subsidiary Coca-Cola HBC Finance B.V. for the repurchase of our existing A500.0 million4.375% fixed rate notes due in 2011. On December 14, 2010, Coca-Cola HBC Finance B.V. purchasedan aggregate amount of A198.9 million which is almost 40% of the total issued A500.0 millioneuro-denominated bond. As a consequence, an amount of A1.7million was charged to the incomestatement in the finance cost line.
At December 31, 2010, there was A1,101.1 million of bonds outstanding under the euromedium-term note program, with details as follows:
Issue Date Amount Interest Maturity date
July 15, 2004 . . . . . . . . . . . . . . . . . . . . . . . . . . . . . A301.1 million 4.375% July 15, 2011December 17, 2008 . . . . . . . . . . . . . . . . . . . . . . . . A500.0 million 7.875% January 15, 2014November 16, 2009 . . . . . . . . . . . . . . . . . . . . . . . . A300.0 million 4.250% November 16, 2016
Notes issued in the US market
On September 17, 2003, we successfully completed, through our wholly owned finance subsidiaryCoca-Cola HBC Finance B.V., a US$900.0 million (A673.4 million at December 31, 2010 exchangerates) global offering of privately placed notes with registration rights. The first tranche consisted of anaggregate principal amount of US$500.0 million (A374.1 million at December 31, 2010 exchange rates)due in 2013 and the second tranche consisted of an aggregate principal amount of US$400.0 million(A299.3 million at December 31, 2010 exchange rates) due in 2015. The net proceeds of the offeringwere used to refinance certain outstanding debt, our leveraged re-capitalization and the acquisition ofRomerquelle GmbH. In December 2003, an exchange offer was made by us in order to effect theexchange of the privately placed notes for similar notes registered with the SEC. Acceptances under theoffer, which was finalized in February 2004, were US$898.1 million. The notes are fully, unconditionallyand irrevocably guaranteed by Coca-Cola Hellenic Bottling Company S.A. These notes are not subjectto financial covenants.
103
Credit rating
Our corporate credit rating by Standard and Poor’s is ‘‘A (stable)’’ and by Moody’s is ‘‘A3 (stable)’’for long-term obligations and A-1 and P-2, respectively, for short-term obligations. The long-term ratingof our senior unsecured debt issued by Coca-Cola HBC Finance B.V. was downgraded to ‘‘A�’’ onNovember 16, 2010 by Standard and Poor’s. Our credit ratings may be changed, suspended orwithdrawn at any time and are not a recommendation to buy, hold or sell any of our securities. Anychange in our credit ratings could have a significant impact on the cost of debt capital to us and/orability to raise capital in the debt markets.
Market risk
Treasury policies and objectives
We face financial risks arising from adverse fluctuations in interest rates, foreign exchange rates,commodity prices and other market risks. Our board of directors has approved our treasury policy andchart of authority, which together provide the control framework for all treasury and treasury-relatedtransactions. Our treasury function is responsible for managing our financial risks in a controlledmanner, consistent with the board of directors approved policies. These policies include:
• hedging transactional exposures (i.e. forecasted raw materials purchases) to reduce risk and limitvolatility. Derivatives may be used provided they qualify as hedging activities defined by thepolicy. Hedging of financial risks includes activities that reduce risk or convert one type of riskto another. To qualify as a hedge, an activity should be expected to produce a measurable offsetto the risk relating to an asset, liability or committed or forecasted transaction; and
• an investment policy to minimize counterparty risks whilst ensuring an acceptable return is beingmade on excess cash positions. Counterparty limits are approved by our board of directors toensure that risks are controlled effectively and transactions are undertaken with approvedcounterparties only.
In the context of our overall treasury policy, and in line with the operating parameters approved byour board of directors, specific objectives apply to the management of financial risks. These objectivesare disclosed under the following headings.
Operating parameters
The board of directors has delegated authority to execute transactions, including derivative activitywith approved financial institutions, to the chief financial officer and the director of treasury and riskmanagement. Under this delegation of authority, only specified permitted financial instruments,including derivatives, may be used for specified permitted transactions. The policy restricts the use ofderivatives to circumstances that do not subject us to increased market risk. The market rate riskcreated by the use of derivatives must be offset by the market rate risk on the specific underlyingexposures they are hedging. The estimated fair value of derivatives used to hedge or modify our risksfluctuates over time. Fair value amounts should not be viewed in isolation, but rather in relation to thefair values of the underlying hedged transactions and to the overall reduction in our exposure toadverse fluctuations in interest rates, foreign exchange rates, commodity prices and other market risks.
Derivative financial instruments
We use derivative financial instruments to manage actual interest, currency and commodity risksarising in the normal course of business, some of which are and will be accounted for as effectivehedges whereas others are not and cannot be accounted for as hedges. We do not use derivativefinancial instruments for any trading activities. It is our policy to negotiate the terms of the hedgederivatives to match the terms of the hedged items to maximize hedge effectiveness.
104
Interest rate risk
Our interest rate exposure generally relates to our debt obligations. We manage our interest ratecosts primarily with interest rate swaps and options. All non-euro bond issues have been fully swappedinto euro with no residual currency risk.
As at December 31, 2010, there were no Euro denominated interest rate swap contractsoutstanding, compared to A792.5 million at December 31, 2009. During June and July 2010, weadjusted our interest rate profile by unwinding the euro denominated interest rate swap contractsmaturing in 2011 and 2014. As a result, an amount of A1.4 million was credited to the incomestatement. In addition, we changed the interest rate conditions of the paying leg of the cross currencyswap contracts maturing in 2015 from EURIBOR plus margin to a fixed rate.
During 2010, we did not have any interest rate swaps that were not eligible for hedge accounting.By comparison, during 2009, we recognized in finance costs losses of A8.8 million in relation to interestrate swaps that were not eligible for hedge accounting.
During 2010, we recognized in interest expense a gain of A1.0 million in relation to the ineffectiveportion of interest rate swaps which qualified for hedge accounting. During 2009, we recognized ininterest expense a loss of A1.6 million in relation to the ineffective portion of interest rate swaps whichqualified for hedge accounting.
Since 2004, we have been using interest rate and cross-currency swaps to convert our$500.0 million and $400.0 million notes issued in the US market from fixed rate US dollar denominateddebt to floating rate obligation based on EURIBOR. The agreements involve the receipt of fixed rateinterest payments in exchange for floating rate interest payments over the life of the issued notes, aswell as the exchange of the underlying principal amounts upon inception and at maturity.
During 2009, we purchased interest rate cap options in order to continue to benefit from lowerfloating interest rates whilst ensuring protection against adverse interest rate movements. In June 2010,we sold these option contracts. Consequently, there were no outstanding interest rate option contractsas at December 31, 2010, compared to A857.0 million of aggregate notional amounts of interest rateoptions outstanding at December 31, 2009.
A 1% increase in the market interest rates on floating rate debt outstanding at December 31, 2010would increase our interest expense on an annual basis by A1.8 million, compared to A19.0 million andA17.4 million for 2009 and 2008, respectively, and a 1% decrease in rates would decrease our interestexpense by A1.8 million, compared to A19.0 million and A17.4 million for 2009 and 2008, respectively.These amounts are determined by calculating the effect of a hypothetical interest rate change on ourfloating rate debt, after giving consideration to our interest rate swap agreements. These amounts donot include the effects of certain potential results of changing interest rates, such as a different level ofoverall economic activity, or other actions management may take to mitigate this risk. Furthermore, thissensitivity analysis does not assume alterations in our gross debt or other changes in our financialposition.
Foreign exchange risk
Our foreign exchange exposures arise from adverse changes in exchange rates between the euro,the US dollar and the currencies in our non-euro countries. This exposure affects our results in thefollowing ways:
• Raw materials purchased in currencies such as the US dollar or euro can lead to higher cost ofsales which, if not recovered in local pricing or cost reductions, will lead to reduced profitmargins;
• Devaluations of weaker currencies that are accompanied by high inflation and decliningpurchasing power can adversely affect sales and unit case volume; and
105
• As some operations have functional currencies other than our presentation currency (euro), anychange in the functional currency against the euro impacts our consolidated income statementand balance sheet when results are translated into euro.
Our treasury policy requires the hedging of rolling 12-month forecasted transactional exposureswithin defined minimum (25%) and maximum (80%) coverage levels if there is a forward marketavailable at economical terms. Hedging beyond a 12-month period may occur, subject to certainmaximum coverage levels, provided the forecasted transactions are highly probable. We use forwardforeign exchange contracts and foreign currency options to hedge our forecasted transactionalexposures. These contracts normally mature within one year. Transaction exposures arising fromadverse movements in assets and liabilities denominated in another currency than the reportingcurrency are normally fully hedged using mainly forward foreign exchange contracts.
The aggregate notional amounts of forward foreign exchange contracts for both purchase and saleof foreign currencies totaled A246.0 million as at December 31, 2010, compared with A385.3 million asat December 31, 2009.
The notional amounts of foreign currency option contracts totaled A158.0 million as atDecember 31, 2010, compared with A144.7 million as at December 31, 2009.
During 2003, we entered into cross currency swaps to cover the currency risk related to the$500.0 million and $400.0 million notes discussed above under ‘‘Borrowings and funding sources—Notesissued in the US market’’. At December 31, 2010 and 2009 the fair value of the cross currency swapsrepresented a payable of A136.1 million and A175.4 million, respectively. We restructured the interestrate terms of outstanding cross currency swap contracts relating to the $400.0 million US bonds byconverting floating rates to fixed rates.
Commodity price risk
We are exposed to the effect of changes in the price of sugar, mainly in our emerging countrieswhere there is no, or only limited, regulatory control over the price of sugar. We are also exposed toprice fluctuations in aluminum and resin. We aim to mitigate the effect of fluctuations in market pricesfor raw material through various risk management strategies available to us, such as commodity futures,option contracts and supplier agreements. The hedge horizon for such instruments can be up to amaximum of three years. We have no material exposure to the effect of short-term changes in the priceof sugar, fructose and aluminum as where possible we contract prices with suppliers up to one year inadvance.
To manage a portion of the price risk of sugar costs, we have the ability to use sugar futurescontracts traded on regulated futures exchanges. Sugar futures contracts would typically have maturitiesof up to 18 months after the balance sheet date. The changes in market values of such contracts havehistorically been effective in offsetting sugar price fluctuations. We did not enter into any sugar futurescontracts in 2010, 2009 and 2008.
We enter into multi-year volume purchase commitments with aluminum can manufacturers for aportion of our production requirements. Generally, these volume commitments are at fixed pricesexcept for the aluminum content. We can, in quantities of our choice, request the manufacturer to fixthe prices of the aluminum content in reference to market rates. We try to reduce our exposure toresin price fluctuations by pre-buying where it is commercially reasonable to do so, but there is notrading market to fix prices for a future period. We apply a variety of contract structures and acompetitive supply base to mitigate our exposure and link our contracts to different indexes within thePET value chain. We do also use imported Asian and Middle East resin to balance European resinmarket prices and increasingly use recycled content within the EU.
106
Credit risk
We have limited concentration of credit risk across trade and financial counterparties. We have putin place policies to help ensure that credit sales of products and services are only made to customerswith an appropriate credit history. Derivative counterparties and cash transactions are limited to highcredit quality financial institutions. We have policies that limit the amount of credit exposure to anysingle financial institution.
Our maximum exposure to credit risk in the event that counterparties fail to perform theirobligations in relation to each class of recognized financial asset is the carrying amount of those assetsas indicated in the balance sheet. We typically assess the credit quality of customers applying for creditby using external agencies and historic experience. Credit limits are set accordingly. Further informationregarding credit risk exposure is shown within note 12 to our consolidated financial statements
Within the context of treasury operations, our exposure to credit risk is managed by establishingapproved counterparty and country limits, detailing the maximum exposure that we are prepared toaccept with respect to individual counterparties/countries. With respect to derivative financialinstruments, credit risk arises from the potential failure of counterparties to meet their obligationsunder the contract or arrangement. Our maximum credit risk exposure for each derivative financialinstrument is the carrying amount of the derivative. The counterparty financial institutions to derivativetransactions must have at least one credit rating which is not lower than ‘‘A+’’ or ‘‘A1’’ fromStandard & Poor’s or Moody’s, respectively.
In addition, we regularly make use of the money market funds to invest temporarily excess cashbalances and to diversify our counterparty risk. These funds all have a minimum ‘‘AAA’’ rating andstrict investment limits are set, per fund, depending on the size of the fund. We only undertakeinvestment transactions with banks and financial institutions that have a minimum independent creditrating of ‘‘A’’ from Standard & Poor’s or ‘‘A2’’ from Moody’s.
C. Research and development, patent and licenses
Not applicable.
D. Outlook and trend information
We continue to experience difficult economic conditions in several key markets. The improvementin GDP growth in some of our markets has yet to translate to a noticeable increase in consumerconfidence and consumption. We are also experiencing significant retailer consolidation in the moderntrade channel.
As a result of volatile economic conditions, low purchasing power and competitive pressures, weanticipate executing price increases at a rate slightly below inflation in 2011. At the same time,commodity costs are expected to increase, reflecting primarily higher world sugar and resin prices. Wecontinue to focus on improving productivity and reducing operating costs. To this end, we expect toexecute significant restructuring initiatives in 2011 that will result in a charge of A30-A35 million forsuch year. Cumulative net capital expenditure, which is defined as payments for purchases of property,plant and equipment, net of proceeds from the disposal of non-current assets and including principlerepayments of finance lease obligations, is expected to be approximately A1.5 billion in the three-yearperiod ending in 2013. In the three-year period ending in 2013, operating cash flow excluding capitalexpenditure is expected to be approximately A1.6 billion.
107
Our Board of Directors has decided to propose to our shareholders, in the Annual GeneralMeeting to be held on May 6, 2011, an increase of our share capital by approximately A550 million,through the capitalization of share premium and an increase in the nominal value of each share byA1.50 per share. As a result, the nominal value of each share will be increased from A0.50 to A2.00. Atthe same time, the share capital will be decreased by approximately A183 million, through a reductionof the nominal value of the shares by A0.50 per share. The nominal value of the shares will bedecreased from A2.00 to A1.50 per share, and an equal amount of capital will be proposed to bereturned to our shareholders in cash. The capital return will be financed through accumulated cash andis subject to shareholder and regulatory approval.
E. Off-balance sheet arrangements
We do not have any off-balance sheet arrangements, as such term is defined for purposes ofItem 5E of Form 20-F, that have or are reasonably likely to have a current or future effect on ourfinancial condition, changes in financial condition, revenues or expenses, results of operations, liquidity,capital expenditures or capital resources that is material to investors.
F. Tabular disclosure of contractual obligations
The following table reflects our contractual obligations as at December 31, 2010, excluding theitems discussed below.
Payment due by period
Less than More thanContractual obligations Total 1 year 1-3 years 4-5 years 5 years
(euro in millions)
Short-term borrowings, less finance lease obligationsand current portion of long-term borrowings . . . . 181.3 181.3 — — —
Long-term borrowings, less finance lease obligations . 1,866.2 305.0 — 1,262.8 298.4Estimated interest payments . . . . . . . . . . . . . . . . . . 337.6 88.7 142.5 87.5 18.9Operating lease obligations . . . . . . . . . . . . . . . . . . . 230.7 62.6 82.9 58.4 26.8Finance lease obligations . . . . . . . . . . . . . . . . . . . . 144.0 48.8 35.4 15.9 43.9Capital commitments . . . . . . . . . . . . . . . . . . . . . . . 66.3 66.1 0.2 — —Other long-term purchase commitments . . . . . . . . . 203.8 82.5 21.5 19.1 80.7
Total . . . . . . . . . . . . . . . . . . . . . . . . . . . . . . . . . . . 3,029.9 835.0 282.5 1,443.7 468.7
Refer to note 15 to our consolidated financial statements included elsewhere in this annual reportfor further information regarding short-term borrowings, long-term debt and finance leases.
Long-term debt bears fixed interest rate or has been swapped from fixed to variable interest ratethrough the use of interest rate and cross currency swaps. We calculated estimated interest paymentson the basis of estimated interest rates and payment dates based on our determination of the mostlikely scenarios for each relevant debt instrument. We typically expect to settle such interest paymentswith cash flows from operating activities and/or short-term borrowings.
Refer to note 32 to our consolidated financial statements included elsewhere in this annual reportfor further information regarding operating leases, capital commitments, and other long-term purchasecommitments.
The above table does not reflect employee benefit obligations of A128.6 million consisting ofcurrent obligations of A22.4 million and non-current obligations of A106.2 million. Refer to note 17 toour consolidated financial statements included elsewhere in this annual report for further information.
The above table does not reflect the impact of derivatives and hedging instruments, other than forlong-term debt, which are discussed in detail above under ‘‘Market Risk’’.
108
ITEM 6 DIRECTORS, SENIOR MANAGEMENT AND EMPLOYEES
A. Directors and Senior Management
Our board of directors and senior management are responsible for our management. In particular,senior management is responsible for the day-to-day management of our company in accordance withthe instructions, policies and operating guidelines established by our board of directors. The board ofdirectors approves three-year strategic and financial plans and detailed annual budgets. The businessaddress of our directors and senior management is c/o Coca-Cola Hellenic Bottling Company S.A.,9 Fragoklissias Street, 151 25 Maroussi, Athens, Greece.
Directors nominated by Kar-Tess Holding and The Coca-Cola Company Entities
Mr. George A. David, Mr. Anastassis G. David, Mr. Anastasios P. Leventis andMr. Haralambos K. Leventis were nominated by Kar-Tess Holding. Mr. John Hunter and Mr. IrialFinan were nominated by The Coca-Cola Company Entities. Kar-Tess Holding and The Coca-ColaCompany Entities also agreed to designate the remaining non-executive members of our board ofdirectors jointly and to maintain their respective proportional representation on our board of directorsin the event that the number of directors increases or decreases.
Mr. George A. David is the father of Mr. Anastassis G. David and a first cousin ofMr. Anastasios P. Leventis and Mr. Haralambos K. Leventis. Mr. Anastasios P. Leventis, CBE, OFRand Mr. Haralambos K. Leventis are brothers. By virtue of their responsibilities within The Kar-TessGroup, Mr. George A. David, OBE, MFR, Mr. Anastassis G. David, Mr. Anastasios P. Leventis, CBEOFR and Mr. Haralambos K. Leventis may be deemed, under the rules of the SEC, to be thebeneficial owners of our ordinary shares held by Kar-Tess Holding. However, each of these individualsdisclaims such beneficial ownership. Boval S.A., the parent of Kar-Tess Holding, currently holds 43.9%of Frigoglass S.A. Other than as described in the previous sentence, there are no existing or potentialconflicts of interest between any duties of our directors of and their private interests and other duties.
Directors
Name Age Title Company / Nominated by Initially Elected
George A. David, OBE, MFR . . . . 74 Chairman of the Board The Kar-Tess Holding January 2, 1981Doros Constantinou . . . . . . . . . . 60 Chief Executive Officer Coca-Cola Hellenic Bottling Company S.A. August 22, 2003Anastasios P. Leventis, CBE, OFR . . 69 Vice-Chairman of the Board The Kar-Tess Holding October 27, 2000Kent Atkinson . . . . . . . . . . . . . . 65 Non-Executive Director Independent September 6, 2000Antonio D’Amato . . . . . . . . . . . . 53 Non-Executive Director Independent January 1, 2002Anastassis G. David . . . . . . . . . . 40 Non-Executive Director The Kar-Tess Holding July 27, 2006Irial Finan . . . . . . . . . . . . . . . . 53 Non-Executive Director The Coca-Cola Company October 23, 1997(1)
John Hunter . . . . . . . . . . . . . . . 73 Non-Executive Director The Coca-Cola Company December 8, 2010Christos Ioannou . . . . . . . . . . . . 39 Non-Executive Director Independent March 19, 2010Haralambos K. Leventis . . . . . . . . 68 Non-Executive Director The Kar-Tess Holding September 18, 2002Sir Michael Llewellyn-Smith, KCVO,
CMG . . . . . . . . . . . . . . . . . . 71 Non-Executive Director Independent September 6, 2000Nigel Macdonald . . . . . . . . . . . . 65 Non-Executive Director Independent June 17, 2005
(1) Mr. Irial Finan originally served as a member of the board of directors of Hellenic Bottling Company S.A. from October 23, 1997 toAugust 30, 2000 (Hellenic Bottling Company S.A. consummated its acquisition of Coca-Cola Beverages plc and was renamed Coca-ColaHellenic Bottling Company S.A. on August 9, 2000). He then served on the board of directors from May 18, 2001 to August 21, 2003. Hiscurrent term began on June 17, 2005.
109
George A. David, OBE, MFR
Mr. David, chairman of our board of directors, graduated from the University of Edinburgh in1959. He began his career that same year with the group of companies controlled by his uncleMr. A.G. Leventis in Nigeria. Today, he holds a position on the board of directors of PetrosPetropoulos AVEE, Titan Cement Co. S.A. and AXA Insurance S.A. Mr. David is a trustee of theA.G. Leventis Foundation, a member of the boards of the Hellenic Institute of Defense and ForeignPolicy, or ELIAMEP, and the Center for Asia Minor Studies. In 2009, Mr. David was appointed amember of the order of the British Empire for his services to UK/Greek relations in the field ofeducation. He was also appointed member of the order of the Federal Republic of Nigeria, or MFR,for his special and outstanding service to the benefit and progress of the Nigerian nation. Mr. David isa member of our human resources committee and social responsibility committee.
Doros Constantinou
Mr. Constantinou graduated from the University of Piraeus in 1974 and holds a degree in BusinessAdministration. Mr. Constantinou began his career in auditing with PricewaterhouseCoopers S.A.where he worked for ten years. In 1985, he joined Hellenic Bottling Company S.A., where he heldseveral senior financial positions. In 1996, he was appointed to the position of chief financial officerand remained in that position until August 2000. He was a key member of the management team thatled the integration of Hellenic Bottling Company S.A. and Coca-Cola Beverages plc. In 2001,Mr. Constantinou became managing director of Frigoglass S.A., a leading manufacturer of commercialrefrigerators and packaging products with operations in 16 countries. Mr. Constantinou was appointedchief executive officer of Coca-Cola Hellenic Bottling Company S.A. in August 2003. Mr. Constantinouwill retire as the Group’s Chief Executive Officer in the third quarter of 2011.
Anastasios P. Leventis, CBE, OFR
Mr. Leventis worked in Nigeria for companies controlled by Mr. A.G. Leventis since the 1960s. Heis on the board of directors of Boval S.A., which has widespread investments worldwide, as well as onthe boards of directors of subsidiaries of Boval S.A. in Nigeria. Mr. Leventis is chairman of theA.G. Leventis Foundation. On April 4, 1990, Mr. Leventis was appointed honorary commissioner forthe Republic of Cyprus to Nigeria by the government of the Republic of Cyprus. Mr. Leventis washonored with the award of Commander of the Order of the British Empire in the Queen’s BirthdayHonors List of 2004 and was also honored with the award of Order of ‘‘Madarski Konnik’’ by thePresident of Bulgaria in 2004. He was appointed Officer of the Order of the Federal Republic ofNigeria in 2002. Mr. Leventis also serves on the councils of several non-profit organizations.
Kent Atkinson
Mr. Atkinson joined the Bank of London in South America (later acquired by Lloyds Bank plc)and held a number of senior managerial positions in Latin America and the Middle East beforereturning to the United Kingdom. He was regional executive director for Lloyds TSB’s South Eastregion until he joined the main board as group finance director, a position he held for eight years untilhis retirement as an executive. He remained on the Lloyds TSB board for a further year asnon-executive director. Mr. Atkinson is a non-executive director and chairman of the group audit andcompliance committee of Standard Life plc and a member of Standard Life’s Investment Committeeand Risk and Capital Committee. Mr. Atkinson is a non-executive director and a member of the auditcommittee and the strategy and mergers and acquisitions committee of Gemalto N.V. Mr. Atkinson is anon-executive director and chairman of the audit committee of UK Asset Resolution Ltd (whichincludes Northern Rock (Asset Management) plc and Bradford & Bingely plc) and a member of its riskcommittee. Mr. Atkinson is also a non-executive director and chairman of the audit committee ofBallarpur International Graphic Paper Holdings Ltd.
110
Antonio D’Amato
Mr. D’Amato began his business career in 1979 with Cartoprint in Milan, part of the FinsedaGroup, a leading European company in the production of food packaging. He was employed in variouscapacities and he became president of the Finseda Group in 1991. Since 1996, Mr. D’Amato has beena member of the board of directors of Confindustria, the Confederation of Italian Industry. From 1999to May 2000, he was president of the Industrial Union of Naples. In May 2000, he was electedpresident of Confindustria. In August 2000, Mr. D’Amato was appointed vice president of the Union ofIndustrial and Employers’ Confederations of Europe, or UNICE, and later that year became a memberof the Italian National Council for Economy and Labor, or CNEL. In July 2001, he became presidentof the LUISS University in Rome, a leading private Italian university.
Anastassis G. David
Mr. David graduated from Tufts University in 1993 and began his career in the Coca-Cola bottlingsystem in the United States. From 1994 to 1997, Mr. David held several positions in the sales andmarketing departments of Hellenic Bottling Company S.A. During 1997, Mr. David worked forPricewaterhouseCoopers S.A., focusing on accounting and business finance. From 1998, Mr. David’sprincipal activity is advisor to Kar-Tess Holding on its bottling investments. Mr. David was Chairman ofNavios Corporation, a major bulk shipping company, from 2002 to 2005 and currently serves as amember on the board of directors of IDEAL Group S.A. and Aegean Airlines S.A. Mr. David is also amember of the Advisory Board of the Fares Center at Tufts University, as well as a member of theInternational Board of Overseers of Tufts University. He is a member of the Board of Trustees ofCollege Year in Athens and member of the Executive Committee of the Cyprus Union of Shipowners.
Irial Finan
Mr. Finan is executive vice president of The Coca-Cola Company and president of bottlinginvestments. He is responsible for managing a multi-billion dollar internal bottling business, which hasoperations in 5 continents (North America, South America, Europe, Africa and Asia), revenues of over$8 billion and more than 85,000 employees. Additionally, he is responsible for stewarding TheCoca-Cola Company’s equity investments. Mr. Finan has over 29 years experience in the Coca-ColaSystem. From 2001 to 2003, he served as chief executive officer of Coca-Cola Hellenic BottlingCompany S.A., during which time he managed the merger and integration of Coca-Cola Beverages plcand Hellenic Bottling S.A., and led the combined company’s operations in 26 countries. Mr. Finanjoined The Coca-Cola Company in 2004 as president, bottling investments and supply chain and wasnamed executive vice president of the The Coca-Cola Company in October 2004. From 1995 to 1999,he was managing director of Molino Beverages, with responsibility for expanding markets, including theRepublic of Ireland, Northern Ireland, Romania, Moldova, Russia and Nigeria. Prior to that role,Mr. Finan worked in several markets across Europe. From 1991 to 1993, he served as managingdirector of Coca-Cola Bottlers Ulster, Ltd., based in Belfast. He was finance director of Coca-ColaBottlers Ireland, Ltd., based in Dublin from 1984 to 1990. Mr. Finan serves on the board of directorsof Coca-Cola FEMSA S.A. and the supervisory board of Coca-Cola Erfrischungsgetranke AG. He alsoserves as a non-executive director of Co-operation Ireland and Galway University Foundation. He holdsa Bachelor of Commerce degree from National University of Ireland in Galway and is an Associate(later fellow) of the Institute of Chartered Management Accountants.
111
John Hunter
Mr. Hunter began his career with Coca-Cola in 1967. Mr. Hunter held positions of increasingresponsibility in Hong Kong, Australia, Japan and Atlanta where he was named President of Coca-ColaInternational in 1991, a position he held until his retirement in 1996. Mr. Hunter has served on theBoard of Directors of Coca-Cola Amatil, Coca-Cola Bottlers Philippines Inc., Coca-Cola Ltd,Coca-Cola Bottling Company of New York and Coca-Cola Beverages plc. The latter merged withCoca-Cola Hellenic in 2000. From 1998 to 2000 Mr. Hunter was Chairman of Seagram Spirits andWine Group and from October 2008 through April 2010 he served as a member of the Board ofDirectors of Coca-Cola Enterprises. Mr. Hunter is a member of our human resources committee andsocial responsibility committee.
Christos Ioannou
Mr. Ioannou received his BA from Cornell University in 1994 and his MBA from the MIT SloanSchool of Management in 1998. Mr. Ioannou’s primary involvement is with J&P (Overseas) andJ&P-AVAX, where he serves on both boards of directors. The J&P Group is involved in construction,concessions and real estate in the Middle East, North Africa and Southeast Europe. Mr. Ioannou isalso involved in the hotel business, holding directorships in Athinaion SA (Athenaeum Intercontinental)and YES Hotels. Mr. Ioannou also serves on several other boards of directors including Food Plus andAegean Airlines S.A. Mr. Ioannou is a member of our audit committee.
Haralambos K. Leventis
Mr. Leventis graduated from Cambridge University in 1963 and was admitted to the English Barin 1964. He moved to Nigeria in 1964 to work for the companies controlled by Mr. A.G. Leventis. Hewas involved in the management of a number of companies in the group, including LeventisMotors Ltd, where he was the executive director responsible to the board of directors for themanagement of the company. Mr. Leventis is a director of several companies in the Leventis group inNigeria and elsewhere, and also a trustee of the A.G. Leventis Foundation.
Sir Michael Llewellyn-Smith, KCVO, CMG
Sir Michael has had a distinguished career in the British diplomatic service, including postings toMoscow, Paris and Athens, culminating in positions as British Ambassador to Poland (1991-1996) andthen British Ambassador to Greece (1996-1999). He is currently vice president of the British School ofAthens, Honorary Fellow of St Antony’s College, Oxford, and member of the council of the Anglo-Hellenic League. He is also a historian and author of a number of books about Greece. Sir Michael ischairman of our human resources committee and social responsibility committee.
112
Nigel Macdonald
Mr. Macdonald was formerly a senior partner in Ernst & Young’s UK practice, having been apartner for 27 years, during which he served as vice chairman of the accounting and auditingcommittees of Ernst & Young’s worldwide practice. Mr. Macdonald is a member of the Institute ofChartered Accountants of Scotland, of which he was the president between 1993 and 1994. He is amember of the audit committee of the International Oil Pollution Compensation Fund and also anadvisor to it, as well as a trustee of the National Maritime Museum and chairman of both itsremuneration committee and audit committee. Mr. Macdonald is also chairman of a privately heldretail business in London. Between 1994 and 2001, he was a member of the Industrial DevelopmentAdvisory Board of the UK government and, from 1992 until the end of 2004 he was a member of theBoard of the British Standards Institute and chairman of its audit committee. From 1990 until 2006 hewas a member of the Review Panel of the Financial Reporting Council and from 1998 until 2005 hewas a member of the UK Competition Commission, serving on its specialist panels on electricity andwater. Mr. Macdonald is a member of our audit committee.
Senior Management
Our senior management team consists of the following persons, all of whom are members of ouroperating committee:
Name Age Title
Doros Constantinou . . . . . . . . 60 Chief Executive OfficerDimitris Lois . . . . . . . . . . . . . 49 Chief Operating OfficerPer Breimyr . . . . . . . . . . . . . . 49 Group Commercial DirectorJohn Brady . . . . . . . . . . . . . . . 53 Regional Director; Bosnia and Herzegovina, Croatia, Cyprus,
Czech Republic and Slovakia, Greece, Hungary, Republic ofIreland and Northern Ireland
Richard Smyth . . . . . . . . . . . . 52 Regional Director; Austria, Estonia, Latvia, Lithuania, theFormer Yugoslav Republic of Macedonia, Italy, Slovenia andSwitzerland
Keith Sanders . . . . . . . . . . . . . 49 Regional Director; Armenia, Belarus, Poland, RussianFederation and Ukraine
Alain Brouhard . . . . . . . . . . . . 48 Regional Director; Bulgaria, Moldova, Nigeria, Romania andSerbia (including the Republic of Kosovo) and Montenegro
Kleon Giavassoglou . . . . . . . . . 58 Supply Chain Services DirectorJan Gustavsson . . . . . . . . . . . . 44 General Counsel, Director of Strategic Development and
Company SecretaryRobert Murray . . . . . . . . . . . . 51 Chief Financial OfficerBernard P. Kunerth . . . . . . . . . 55 Human Resources Director
Doros Constantinou
Mr. Constantinou is a member of both our board of directors and our senior management team.His biography is set forth above under ‘‘Directors’’.
113
Dimitris Lois
Mr. Lois joined Coca-Cola Hellenic Bottling Company S.A. in June 2007 as executive advisor tothe chief executive officer. In August 2007, he was appointed regional director responsible for ouroperations in Romania, Greece Nigeria, Bulgaria, Cyprus and Moldova. In August 2009, Mr. Lois wasappointed chief operating officer. Prior to joining Coca-Cola Hellenic Bottling Company S.A., heserved as managing director of Frigoglass S.A. He joined Frigoglass S.A. in 1997, as the generalmanager of the STIND S.A. glass plant in Bulgaria, later becoming country manager for Bulgaria. In2000, he was appointed commercial refrigeration director, and in 2001, following Frigoglass S.A.’sacquisition of the Norcool Group and Husky, he was appointed director of the newly created ‘‘cooldivision’’. He was appointed managing director of Frigoglass S.A. in August 2003. Mr. Lois began hiscareer in 1988 at Grecian Magnesite S.A., where he held various managerial posts including theposition of business development manager. Mr. Lois holds a Master of Science Degree in ChemicalEngineering from Northeastern University and a Bachelor of Science Degree in Chemical Engineeringfrom Illinois Institute of Technology. Mr. Lois has been appointed to succeed Doros Constantinou asthe Group’s Chief Executive Officer in the third quarter of 2011.
John Brady
Mr. Brady joined the Coca-Cola bottling system in 1982. He held various positions with Coca-ColaUSA until 1992, when he became general manager and operations director for Coca-Cola Indonesia.From 1994 to 1998 Mr. Brady worked as region manager for The Coca-Cola Company and Coca-ColaAmatil in Indonesia. In 1998, Mr. Brady became regional director for Coca-Cola Beverages plc, wherehe was responsible for the Czech Republic, Hungary, Poland and Slovakia. In 2001, Mr. Brady becameresponsible for Austria, Italy, Switzerland and Nigeria as a regional director of Coca-Cola HellenicBottling Company S.A. From 2003 to 2004 he worked as regional vice president for the NortheastRegion for Coca-Cola North America and in March 2004, he was appointed president and chiefexecutive officer for Coca-Cola Bottlers’ Sales and Services Company. In January 2006, Mr. Bradyreturned to Coca-Cola Hellenic Bottling Company S.A. as regional director and currently he isresponsible for our operations in Bosnia and Herzegovina, Croatia, Cyprus, Czech Republic andSlovakia, Greece, Hungary, Republic of Ireland and Northern Ireland. Mr. Brady holds a Bachelor ofScience Degree from the University of North Carolina.
Richard Smyth
Mr. Smyth joined our management team in February 2003 after working for Bristol-Myers Squibbin Bangkok, where he was vice president—Southeast Asia responsible for the company’s nutritionaldrinks business. As vice president, he was responsible for operations in the Philippines, Malaysia,Singapore, Thailand, Indonesia, Vietnam and Australia. Prior to this, he was the general manager forBristol-Myers Squibb in the Philippines. Mr. Smyth spent 13 years working with Nestle where his rolesincluded serving as general manager of a joint venture with Danone in Slovakia, working as chiefoperating officer of their Filipino Confectionery Division, and holding senior marketing roles inHungary and the Czech Republic. While based in Switzerland, he was responsible for Nestle’sworld-wide duty free business. As regional director, he is currently responsible for our operations inAustria, Estonia, Latvia, Lithuania, the Former Yugoslav Republic of Macedonia, Italy, Slovenia andSwitzerland. Mr. Smyth holds a PhD in Organic Chemistry from the University of Kent.
114
Keith Sanders
Mr. Sanders has been working within the Coca-Cola system for 18 years. He began his career withThe Coca-Cola Company in a regional marketing role within the Gulf Region. In 1993 he wasappointed HR & training manager for the Gulf Region. In 1994 he assumed his first bottling generalmanager role in Bahrain, and then moved through a series of larger country general management rolesuntil 2001 when he was appointed Director for Bottling Operations in the Eurasia & Middle EastDivision with responsibility for Saudi Arabia, Pakistan, UAE, Oman, Bahrain, and Qatar. Mr. Sandersjoined Coca-Cola Hellenic Bottling Company as the country general manager for Russia in May, 2004.Hewas appointed regional director in July 2009 and is currently responsible for our operations inArmenia, Belarus, Poland, Russian Federation and Ukraine. Mr. Sanders holds a Masters Degree inBusiness Administration from TCU and an Engineering Degree from the University of Kansas.
Alain Brouhard
Mr. Brouhard joined Coca-Cola Hellenic Bottling Company S.A. in June 2010 as regional director,responsible for Bulgaria, Moldova, Nigeria, Romania and Serbia (including the Republic of Kosovo)and Montenegro. He began his career in Procter & Gamble, where for sixteen years he held a varietyof roles with responsibility including field unit manager, national key accounts manager, associatedirector—customer business development and finally global customer team leader—Global & WesternEurope. Mr. Brouhard joined adidas in 2002, serving as vice president—commercial operations Europe.Under his management, adidas Europe captured market leadership. In 2005, he took on the role ofmanaging director—Iberia, based in Spain, having responsibility for Spain and Portugal. Among his keyachievements was the strengthening of relationships with key accounts which contributed to improvedbrand equity and increased market share in the region. Finally, since 2007 he held the position ofmanaging director—Italy & Southeast Europe, covering 11 countries. Mr. Brouhard holds a Master’sDegree in Business Administration from Ohio State University and a Diploma in BusinessAdministration from Audencia Business School in France.
Per Breimyr
Mr. Breimyr joined Coca-Cola Hellenic Bottling Company S.A. in February 2008 as groupcommercial director. He began his career as a semi-professional football player in Norway, after whichhe joined Mars Inc. in August 1987, where he held various sales positions before becoming nationalaccount director. In November 1992, he moved into a sales director position with Duracell andeventually joined PepsiCo Nordic as sales director in January 1994. In 1997, Mr. Breimyr moved toLondon with PepsiCo Europe and PepsiCo Beverages Intl. where he held various positions in Europeanand global account management. In 2003, he joined InBev, taking on the position of vice president,global sales. During his tenure at InBev, he also held the position of global vice president of sales anddistribution and in 2006 was appointed commercial vice president, responsible for the development andimplementation of brand initiatives, distribution programs, sales and innovation strategies for Centraland Eastern Europe and Cuba. Mr. Breimyr holds a diploma in shipping from the London School ofForeign Trade and a degree from the Marketing College, Arendal Handelsskole.
115
Kleon Giavassoglou
Prior to joining the Coca-Cola bottling system, Dr. Giavassoglou worked as an assistant professorat the University of Patras and as a consultant for engineering projects. He was also associated withHellenic Bottling Company S.A. as a consultant engineer, supervising the construction of the Patrasplant from 1979 to 1980. Dr. Giavassoglou commenced his career with Hellenic Bottling Company S.A.in 1983. He held several positions of increasing responsibility in the maintenance and technicaloperations departments until 1993, when he was appointed general manager of our operations inNorthern Greece. In 1995, he was appointed technical operations manager of our Greek operationsand in 1998 technical director of Hellenic Bottling Company S.A. In 2000, Dr. Giavassoglou becameregional technical and engineering director of Coca-Cola Hellenic Bottling Company S.A. and becamesupply chain services director in February 2004. Dr. Giavassoglou holds a PhD in Electrical Engineeringas well as a Masters in Civil Engineering from the University of Patras.
Jan Gustavsson
Mr. Gustavsson began his career with the Coca-Cola bottling system in 1995. From 1995 to 1997,he served as assistant division counsel in the Nordic & Northern Eurasia Division of The Coca-ColaCompany. Mr. Gustavsson worked with the law firm of White & Case LLP from 1997 to 1999 andpreviously from 1993 to 1995. In 1999, Mr. Gustavsson joined Coca-Cola Beverages plc as deputygeneral counsel and was appointed general counsel and company secretary of Coca-Cola HellenicBottling Company S.A. in August 2001. In May 2009, he also assumed the responsibilities of director ofstrategic development. Mr. Gustavsson holds an LL.B. from University of Uppsala in Sweden and anLL.M. from Harvard Law School.
Robert Murray
Mr. Murray joined the Coca-Cola bottling system in 1987 and has subsequently held several keysenior positions. He was chief financial officer for the BevServ Division and director of purchasing atThe Coca-Cola Bottling Company of New York. In 1997, he joined Coca-Cola Amatil in Vienna asbusiness planning manager and then vending manager for Europe. Having acquired significant cross-functional experience, Mr. Murray joined Coca-Cola Hellenic Bottling Company S.A. in 2001 and wasappointed general manager in Hungary. Under his leadership, the operation achieved significanttop-line growth and a successful turnaround in profitability. In 2006, he was appointed general managerin Switzerland, where he oversaw the implementation of an enhanced route-to-market strategy, whichdrove volume and profitability growth. In January 2009, Mr. Murray was appointed to the position ofchief financial officer. Mr. Murray holds a diploma of Business Administration and Accounting fromGeorge Washington University.
Bernard P. Kunerth
Prior to joining the Coca-Cola bottling system, Mr. Kunerth held various human resourcemanagement positions with 3M, Financiere Agache and Henkel in France. From 1987 to 1996 he wasthe regional human resources director for Western Europe and then the Americas with S.C. Johnson.Mr. Kunerth joined the Coca-Cola bottling system in 1996 as regional human resources director forThe Coca-Cola Company in London. In 1997, he transferred to the position of vice-president of humanresources for Europe with Coca-Cola Enterprises Inc. and in July 2001 was appointed vice-president forhuman resources for all of Coca-Cola Enterprises Inc., responsible for compensation, benefits,performance management and talent management. He became human resources director of Coca-ColaHellenic Bottling Company S.A. in 2004. Mr. Kunerth holds a Masters degree in Psychology from theUniversity of Bordeaux.
116
Mr. Constantinou, Mr. Lois, Dr. Giavassoglou and Mr. Brouhard are employed by Coca-ColaHellenic Bottling Company S.A. All other members of our senior management are employed by varioussubsidiaries of Coca-Cola Hellenic Bottling Company S.A. although their responsibilities cover theentire group.
Operating Committee
Our operating committee is comprised of the members of senior management listed above and ischaired by our chief executive officer. The operating committee seeks to ensure effective coordinationand decision-making through our business. The committee meets eleven times each year and isresponsible for:
• the overall operational direction of our company;
• developing group strategy;
• agreeing action plans to support each of our territories;
• setting annual targets and agreeing annual business plans which include a comprehensiveprogram of goals and strategies agreed between the country general managers and the regionaldirectors. These annual business plans form the basis of the company’s performance progress;and
• working with the country general managers to review and adjust, where necessary, thecooperation framework ensuring consistent behavior throughout the different countries.
B. Compensation
Remuneration policy
We aim to provide total compensation for our employees that is fair and sufficient to attract andretain people with the right talent and skills necessary to grow the business in order to maximizeshareholder value. We also need to motivate employees to achieve business targets and reward themaccordingly. To achieve our operating objectives, we must attract, retain and motivate high calibersenior managers for whom we recognize there is an international market. The human resourcescommittee aims to provide total compensation that is competitive by reference to other multinationalcompanies similar to us in terms of size, geographic spread and complexity. In line with ourcommitment to maximize shareholder value, our policy is to link a significant portion of remunerationfor our senior managers to the performance of the business through short and long-term incentives.Equity-related compensation of senior managers aligns the financial interests of senior managementwith those of our shareholders. Our emphasis is on linking pay with performance by rewarding effectivemanagement of long-term business performance, as well as individual achievement.
Compensation and pension benefits of directors and senior management
Our board of directors believes that the level of remuneration offered to directors and seniormanagement should reflect their experience, responsibility and market value as determined by, amongother factors, a comparison with similar multinational companies and should be sufficient to attract andretain high caliber directors and senior management who will guide our company successfully. Theremuneration of the directors is subject to the approval of shareholders.
The total remuneration paid to or accrued for our directors and senior management, includingstock option grants, during 2010 amounted to A14.1 million. Pension and post-employment benefits fordirectors and for our senior management during 2010 amounted to A0.9 million. Members of our seniormanagement either participate in their home country pension scheme or in the Coca-Cola HellenicInternational Retirement Savings Plan, as appropriate.
117
Management incentive plan
We operate a management incentive plan for all our managers. In 2010, the individual incentivewas based on annual business performance against targets in volume, adjusted EBITDA, economicprofit and receivable and inventory days, as well as individual accomplishments against annualobjectives. Individual objectives are designed to be demanding but achievable. The target award as apercentage of annual base salary increases with the level of responsibility. Exceptional business unitperformance where objectives are exceeded may result in awards in excess of the individual targetawards. In December 2010, the structure of the management incentive plan was revised. Following thisrevision, starting 2011 the economic profit indicator has been replaced by the ROIC in order to bettercomplement the upcoming long term incentive plan changes and reduce exposure to externalenvironment volatility.
Long-term incentive plan
All middle and senior management, excluding our senior management team presented above,participate in the Coca-Cola Hellenic Long-Term Incentive Plan. We adopted this cash-based plan in2003 as a replacement of stock options for middle-ranking employees. Incentive payouts for the2008-2010 plan were based on business performance against three-year objectives, which are set everyyear. We use three years aggregated economic profit as a performance criterion in the plan. The targetpayout from the plan is determined for each individual based on the level of responsibility,performance and potential. Exceptional business performance may result in awards in excess of theindividual target payout. In December 2010 the plan was revised and significant changes were made inrelation to its purpose, design and key business indicators. The newly designed plan is more focused inconnecting employees to business priorities, motivating and rewarding competitively in order to achievebusiness targets for today and for tomorrow. The past plans under way (2009-2011 and 2010-2012) willbe in transition while the new plan will be enforced starting in 2011. The performance of the plan willbe measured against three years achievement of: market share; net sales revenue per unit case; andROIC. The target payout for the plan will be determined for each individual based on performance,potential and level of responsibility and the plan payout will be every three years at plan end.
Stock option plan
Senior managers of our company are eligible to participate in the Coca-Cola Hellenic StockOption Plan. Options are viewed as an integral part of the total remuneration package for seniormanagers. Options are granted at an exercise price equal to the price of our shares at close of tradingon the Athens Exchange on the date of grant. Option grants vest in one-third increments each year forthree years and can be exercised for up to ten years from the date of grant. Stock options may besatisfied through the issuance of new shares or through existing treasury stock, at the option of ourboard of directors.
The numbers of options awarded are approved by the board of directors upon therecommendation of the human resources committee after reviewing the advice of management and arebased on a view of competitive market conditions for employee remuneration and employeeperformance and potential. The stock option award for the chief executive officer is approved by theboard of directors based on the recommendation of the human resources committee.
We view stock options as a long-term component of the total remuneration package of our seniormanagers, whose roles have an impact on the results of the business as a whole. We will continue toevaluate the issuance of stock options to these employees, taking into account, among other factors,our business prospects and financial condition, as well as individual employee performance andpotential and the competitive market conditions of employee remuneration. Under Greek law, theterms of any options granted must be approved by our shareholders at a general meeting. In addition,under Greek legislation, all options outstanding at any time under all our stock option plans may notexceed 10% of our outstanding share capital.
118
The following table summarizes information about stock option plans outstanding as atDecember 31, 2010.
Exercise Vesting Vesting Vesting Number ofprice after dates for dates for dates for End of stockthe capital Vesting further further further option optionsreturn (E) status 2010 increments increments increments period outstanding
2001 Stock Option PlanSub Plan 6 . . . . . . . . . . . 8.19 fully vested — — — 12.12.2011 61,313
2003-2004 Stock OptionPlan/2003 Grant . . . . . . . 9.67 fully vested — — — 14.12.2013 27,000
2003-2004 Stock OptionPlan/2004 Grant . . . . . . . 10.92 fully vested — — — 2.12.2014 99,577
2005-2009 Plan/2005 Grant . 14.03 fully vested — — — 1.12.2015 642,6362005-2009 Plan/2006A Grant 15.07 fully vested — — — 20.3.2016 50,0012005-2009 Plan/2006B Grant 13.85 fully vested — — — 22.6.2016 15,0002005-2009 Plan/2006 Grant . 17.21 fully vested — — — 12.12.2016 1,140,6512005-2009 Plan/2007 Grant . 27.25 fully vested — — — 12.12.2017 1,374,2832005-2009 Plan/2008A Grant 23.04 two thirds 20.06.2011 — — 19.06.2018 30,0002005-2009 Plan/2008 Grant . 9.86 two thirds 11.12.2011 — — 10.12.2018 1,526,6682009-2011 Plan/2009 Grant . 16.54 one third 10.12.2011 10.12.2012 — 9.12.2019 1,782,6332009-2011 Plan/2010A Grant 20.00 none 18.03.2011 18.03.2012 18.03.2013 17.03.2020 30,0002009-2011 Plan/2010 Grant . 20.15 none 09.12.2011 09.12.2012 09.12.2013 08.12.2020 1,980,100
Total . . . . . . . . . . . . . . . . 8,759,862
A summary of the stock option activity under all plans is as follows:
Number Weighted Number Weightedof stock average of stock averageoptions exercise price options exercise price
2010 2010 (E) 2009 2009 (E)
Outstanding at January 1 . . . . . . . . . . . . . . . . . . . . 7,415,442 16.33 6,168,726 16.08Granted . . . . . . . . . . . . . . . . . . . . . . . . . . . . . . . . . 2,010,100 20.15 1,793,300 16.54Exercised . . . . . . . . . . . . . . . . . . . . . . . . . . . . . . . . (597,365) 9.59 (140,245) 11.36Expired . . . . . . . . . . . . . . . . . . . . . . . . . . . . . . . . . (1,453) 8.29 (26,472) 9.87Forfeited . . . . . . . . . . . . . . . . . . . . . . . . . . . . . . . . (66,862) 18.08 (379,867) 17.66
Outstanding at December 31 . . . . . . . . . . . . . . . . . . 8,759,862 17.65 7,415,442 16.33
Exercisable at December 31 . . . . . . . . . . . . . . . . . . 5,001,036 17.77 4,007,973 16.76
Compensation expense recorded for the year ended December 31, 2010, 2009 and 2008 for allstock options was A6.7 million, A6.4 million and A9.3 million, respectively. The weighted averageremaining contractual life of share options outstanding under the stock option compensation plans atDecember 31, 2010, 2009 and 2008 was 7.8 years, 7.9 years and 8.2 years, respectively.
119
At the annual general meeting in June 2005, our shareholders approved the adoption of amulti-year plan to grant stock options to senior managers for a maximum of 4,950,000 ordinary shares,subject to approval by the board of directors. Further to the decision of the extraordinary generalmeeting in October 2007 approving the bonus shares issuance, the maximum number of stock optionshas been changed to 7,417,417 for the plan 2005-2009. During 2007, the board of directors approvedthe grant of 1,532,200 stock options under this authorization, at an exercise price of A28.75,representing approximately 0.4% of our outstanding share capital as of December 31, 2007. Our seniormanagement team received an aggregate of 915,000 stock options under this grant for theirperformance. During 2008, the board of directors approved the grant of 30,000 stock options at anexercise price of A23.04 (as adjusted for the capital return in 2009) and the grant of 1,830,500 stockoptions at an exercise price of A9.86 (as adjusted for the capital return in 2009), representingapproximately 0.5% of our outstanding share capital as of December 31, 2008.
At the annual general meeting in June 2009, our shareholders approved the adoption of amulti-year plan to grant stock options to senior managers for a maximum of 6,000,000 ordinary shares,subject to approval by the board of directors, for the period 2009-2011, During 2009, the board ofdirectors approved the grant of 1,793,300 stock options at an exercise price of A16.54 representingapproximately 0.5% of our outstanding share capital as of December 31, 2009. Our senior managementteam received an aggregate of 1,164,000 stock options under this grant for their recent performance.During 2010, the Board approved the grant of 2,010,100 stock options at an average exercise price ofA20.15 representing approximately 0.5% of our outstanding share capital as of December 31, 2010. Oursenior management received an aggregate of 1,248,000 stock options under this grant for theirperformance.
Our option holders have the opportunity to exercise their options once per quarter. Eligibleemployees who leave our company for another company of the Coca-Cola system in which TheCoca-Cola Company holds, directly or indirectly, at least a 20% interest, or employees who retire at noearlier than the age of 55 and with a minimum service of 10 years within the Coca-Cola system, maystill exercise options granted to them under the plan in accordance with the plan rules. In the event theemployment of an option holder is terminated due to death, injury or disability, all his outstandingoptions vest and are exercisable no later than the same day of the twelfth (12th) month following thedate of the option holder’s death or cessation of employment. If the employment terminates for anyother reason or we cease to control the subsidiary employing the option holder, the options that havealready vested may be exercised no later than the following December for options granted before 2007,and no later than the same day of the sixth (6th) month following the date of such cessation for optionsgranted after 2007. Options lapse and cease to be exercisable if the option holder transfers, pledges orencumbers the option in any way, if their employment is terminated due to dishonesty, fraud ormisconduct or if we enter into liquidation.
You should read note 26 to our consolidated financial statements for additional information on ourstock option compensation plans.
Stock appreciation rights
We adopted the employee stock option plan in 2001. Previously, we had issued stock appreciationrights to certain of our employees, including employees who previously held Coca-Cola Beverages plcstock options. Upon adoption of the stock option plan, all such rights, except those held by retirees andemployees located in countries where granting and exercising stock options was impractical or notpermitted, were converted into stock options carrying over the same exercise prices, vesting periods andexpiration dates.
120
We are not currently operating any stock-based compensation plan under which senior managersare granted stock appreciation rights. There are some stock appreciation rights that remain unexercisedfrom grants that occurred in the past. The terms of these stock appreciation rights were based on thebasic terms and conditions of stock option grants except that instead of shares, the holders receive apayment equal to the positive difference between the market price of our ordinary shares at the closingtime of the Athens Exchange at the date of exercise and the exercise price. Stock appreciation rightscan be exercised for up to ten years from the date of award.
The following table summarizes information on stock appreciation rights outstanding onDecember 31, 2010.
Exercise Vesting status End of option Number of SARsprice (E) 2010 period outstanding
2001—Sub Plan 6 . . . . . . . . . . . . . . . . . . . . . . . . 8.19 fully vested 12.12.2011 13,950
A summary of stock appreciation rights activity under all plans is as follows:
Number Weighted average Number Weighted averageof SARs exercise price of SARs exercise price
2010 2010 (E) 2009 2009 (E)
Outstanding at January 1 . . . . . . . . . . . . . . . . . . 77,250 11.10 152,266 9.73Exercised . . . . . . . . . . . . . . . . . . . . . . . . . . . . . . (63,300) 9. 91 (69,698) 9.87Expired . . . . . . . . . . . . . . . . . . . . . . . . . . . . . . . — — (5,318) 9.87
Outstanding at December 31 . . . . . . . . . . . . . . . . 13,950 8.19 77,250 9.60
Exercisable at December 31 . . . . . . . . . . . . . . . . 13,950 8.19 77,250 9.60
In 2010, we recorded in the income statement a credit of A0.5 million relating to SARs, comparedto a debit of A0.5 million and a credit of A2.3 million recorded in 2009 and 2008, respectively. Theaggregate intrinsic value for the vested SARs at December 31, 2010 was A0.2 million, compared toA0.5 million and nil at December 31, 2009 and 2008, respectively.
The weighted average remaining contractual life of share options outstanding under the stockappreciation rights schemes at December 31, 2010, 2009 and 2008 was 0.9 years, 2.5 years and2.2 years, respectively.
Stock purchase plan
We operate an employee share ownership plan, The Coca-Cola Hellenic Stock Purchase plan, inwhich eligible employees can participate. The human resources committee of the board of directorsdetermines eligibility. Under the terms of this plan, employees have the opportunity to invest 1% to15% of their salary in our ordinary shares by contributing to the plan monthly. We match up to amaximum of 3% of the employees’ salary by way of contribution. Our contributions are used topurchase matching shares on a monthly basis on the open market, currently the Athens Exchange.Shares are either held in the employees’ name or by a trust, The Coca-Cola Hellenic Employee StockPurchase Trust. Matching shares vest one year after the purchase. In order to adapt the plan to theGreek legal framework in the case of employees resident in Greece, we match the contribution ofemployees resident in Greece with an annual employer contribution of up to 5% of the employees’salary, which we make in December, and matching shares purchased in December vest immediately.Dividends received in respect of shares held by the trust accrue to the employees.
Forfeited shares (i) do not revert back to us and (ii) may be used to reduce future matchingcontributions. The cost of shares purchased by our matching contributions is amortized over twelvemonths and the unamortized deferred compensation is reflected in shareholders’ equity.
121
During 2010, 272,279 shares were purchased by us, compared to 334,859 in 2009 and 302,654 in2008, as matching shares to employee investments. The charge to the income statement in 2010 totaledA5.2 million, compared to A4.8 million in 2009 and A4.8 million in 2008. Of this amount, A1.1 millionrepresented employer contributions made for Greek resident employees, compared to A1.0 million for2009 and A1.2 million for 2008. The cost of unvested matching shares held by the trust at the end of2010, before they vest to employees, was A4.1 million compared to A3.8 million and A3.6 million at theend of 2009 and 2008, respectively. The total number of shares held by the trust at December 31, 2010,2009 and 2008 was 2,428,353, 2,327,925 and 1,588,959, respectively. The total contribution made byemployees to the trust during 2010 was A6.0 million, compared to A5.5 million and A5.6 million during2009 and 2008, respectively.
Employee benefit obligations
Statutory termination benefits and pension benefits for employees
Employees of our subsidiaries in Austria, Bulgaria, Croatia, Greece, Italy, Montenegro, Nigeria,Poland, Romania, Serbia and Slovenia are entitled to employee leaving indemnities, generally based oneach employee’s length of service, employment category and remuneration.
Our subsidiaries in Austria, Greece, Northern Ireland, the Republic of Ireland and Switzerlandsponsor defined benefit pension plans. Of the four plans in the Republic of Ireland, two have planassets as do the two plans in Northern Ireland, the plan in Greece and one plan in Switzerland. TheAustrian plans do not have plan assets.
The total amounts set aside or accrued for the provision of statutory termination benefits foremployees as at December 31, 2010, 2009 and 2008 were A91.9 million, A95.3 million and A95.9 million,respectively. The total amounts set aside or accrued for defined benefit pension plans for employees asat December 31, 2010, 2009 and 2008 were A2.7 million, A2.3 million and A2.9 million, respectively.
Jubilee plans
We provide long service benefits in the form of jubilee plans to our employees in Austria, Croatia,Nigeria, Poland, Slovenia and Switzerland.
The total amounts set aside or accrued for jubilee plans for employees as at December 31, 2010,2009 and 2008 were A7.7 million, A7.0 million and A6.7 million, respectively.
Defined contribution plans
We also sponsor defined contribution plans covering employees at nine of our subsidiaries. Ourcontributions to these plans were A9.0 million in 2010, A10.6 million in 2009 and A10.0 million in 2008.
122
C. Board Practices
Board of directors
Our articles of association require that our board of directors consists of a minimum of 7 and amaximum of 15 members. Currently, we have 12 directors and there is no age retirement requirement.Our board of directors is appointed by our shareholders at a general meeting for a three-year term.The current term of our directors expires in 2011. The term of each member is extended until the dateof the annual general meeting of the shareholders of the year in which such term expires. In case ofdeath, resignation or removal of any member of the board of directors, the remaining directors,provided that they are more than six, may choose to either continue to manage the company withoutelecting new members or to elect replacements for the remainder of the board’s term. Such electionmust be announced at the next general meeting of the shareholders following the replacement. If ourshareholders do not approve such election, then such shareholders elect the replacement for thedirector whose position has been vacated.
Our board of directors meets at regular intervals during the year. There are certain matters thatare reserved for full consideration by the board of directors, including issues of policy, strategy andapproval of our chart of authority and business plans. The members of our board of directors aresupplied on a timely basis with comprehensive information on the business development and financialposition of our company, the form and content of which the board of directors believes is in a formand of a quality to enable it to discharge its duties and carry out its responsibilities. All directors haveaccess to our general counsel, as well as independent professional advice at the expense of ourcompany. All directors have full access to the chief executive officer, senior managers, as well as ourexternal auditors and our internal audit team.
Greek Law 3016/2002 requires that at least one-third of the board of directors of Greek listedcompanies is comprised of non-executive members, two of whom must be independent. Greek Law3016/2002 provides that an independent director must not have any direct or indirect relationship withthe company or its affiliates that would interfere with the exercise of independent judgment. Our boardof directors complies with these provisions of Greek Law 3016/2002.
123
In 2000, in connection with the listing of our shares on the London Stock Exchange, we enteredinto a relationship agreement with The Kar-Tess Group (of which Kar-Tess Holding is the soleremaining member) and The Coca-Cola Company Entities which, among other things, requires us tomaintain during the term of the agreement on our board of directors two independent directors, that is,directors free from any business or other relationship with The Kar-Tess Group or The Coca-ColaCompany which could materially interfere with the exercise of their independent judgment in relationto matters concerning our company. The relationship agreement also restricts the directors nominatedby The Kar-Tess Group and The Coca-Cola Company from taking part in and voting at board ofdirectors meetings in connection with matters in which the shareholder they represent has an interest.You should read Item 7, ‘‘Major Shareholders and Related Party Transactions—Related PartyTransactions—The relationship agreement among us, The Kar-Tess Group and The Coca-ColaCompany Entities’’ for additional information on the relationship agreement. There is no specificprovision in our articles of association with respect to the directors’ power, in the absence of anindependent quorum, to vote compensation to themselves or any members of their body. However,pursuant to Greek Codified Law 2190/20, Article 24, compensation to a company’s board members isto be paid out of our profit after tax (after deductions for ordinary reserves and the amount requiredfor distribution to shareholders of the first dividend declared for the relevant financial year, equal to atleast 6% of the company’s paid-up share capital) or otherwise must be approved by a special resolutionof the ordinary general meeting of its shareholders. The amount of compensation granted to acompany’s board member, or members, may be reduced by a Greek court if an objection is raised byshareholders representing at least one-tenth of the company’s share capital and if the court finds suchcompensation to be ‘‘exorbitant’’. The remuneration of our directors is subject to approval by ourshareholders.
Directors’ service agreements
Mr. Constantinou, our chief executive officer, has an employment agreement with us. Suchemployment agreement includes no termination benefits other than as mandated by Greek law. Noneof the other members of our board of directors has entered into a service contract or otherarrangements with us or any of our subsidiaries.
Committees of the board of directors
Human resources committee
The human resources committee consists of the following three non-executive directors: SirMichael Llewellyn-Smith (chairman), Mr. John Hunter and Mr. George A. David. The chairman of thehuman resources committee is appointed by the board of directors. The chief executive officer and thehuman resources director typically attend meetings of the human resources committee, except when thediscussions concern matters affecting them personally. The human resources committee meets at leastfour times a year. The human resources committee operates in accordance with a written charter and isresponsible for:
• establishing the principles governing our human resources policy, which will guide managementdecision-making and action;
• overseeing the evaluation of senior management;
• overseeing succession planning and approving the appointments and terminations of seniormanagers;
• overseeing the talent management framework to ensure a continuous development of talent forkey roles;
124
• establishing our compensation strategy and approving company-wide compensation and benefitplans, as well as compensation for senior managers;
• making recommendations to the board of directors regarding compensation of the chiefexecutive officer;
• establishing the policies governing severance and approve severance terms for the chief executiveofficer and senior managers;
• approving contracts of employment signed with the chief executive officer and senior managers;
• making recommendations to the board of directors regarding the appointment of the chiefexecutive officer and the members of the board; and
• considering other topics as appropriate.
Audit committee
The audit committee consists of three non-executive directors who our board of directors believesare independent: Mr. Kent Atkinson (chairman), Mr. Nigel Macdonald and Mr. Christos Ioannou.Mr. Ioannou was appointed to the audit committee effective March 19, 2010. The chairman of theaudit committee is appointed by the board of directors. Our chief financial officer, as well as ourgeneral counsel, external auditors and the director of our internal audit normally attend all meetings ofthe audit committee. The director of internal audit, as well as the external auditors, regularly meetswith the audit committee without the presence of our management, to discuss the adequacy of internalcontrol over financial reporting and any other matters deemed relevant for the attention of thecommittee. The audit committee has access to outside legal counsel and other independent professionaladvice, as it may deem necessary. The audit committee meets at least four times a year. The auditcommittee operates under a written charter and is responsible for:
• recommending the appointment, selection and termination of our external auditors andapproving the remuneration and terms of engagement of such external auditors;
• discussing the nature and scope of forthcoming audits with the external auditors, ensuring thatappropriate audit plans are in place for the audit, as well as assessing at the end of each annualaudit cycle the effectiveness of the audit process;
• monitoring and reviewing the external auditors’ independence, objectivity and effectiveness,taking into consideration the requirements of Greek, EU and applicable United States law, thelisting requirements of the exchanges on which we are listed, as well as the applicableprofessional standards;
• approving the appointment or termination of the director of internal audit, monitoring andreviewing internal audit annual work programs, and the effectiveness of our internal auditdepartment and otherwise overseeing the work of the internal audit department;
• appointing the members of the disclosure committee, overseeing the work of the disclosurecommittee and revise its charter, if needed, and reviewing the preparation of our interimreports, earnings releases, annual reports on Form 20-F and shareholders’ reports;
• monitoring the quality, fairness and integrity of our financial statements, reviewing significantfinancial reporting issues and judgments contained in them;
• reviewing our annual financial statements before submission to the board of directors, focusingparticularly on any changes in accounting policies and practices, major decision areas, significantadjustments resulting from the audit, the going concern assumption, compliance with accountingstandards and compliance with any applicable stock exchange and legal requirements;
125
• discussing issues with management, the disclosure committee, the external auditors and theinternal audit department any significant matters arising from the audit;
• considering prior to the filing of our annual report to shareholders and our annual report onForm 20-F with the SEC the external auditors’ report referring to all critical accounting policiesand practices to be used, all material alternative treatments of financial information that havebeen discussed with our management, including ramifications of the use of such alternativedisclosures and treatments and the treatment preferred by the external auditors, as well as othermaterial written communications between the external auditors and our management, such asany management representation letter or summary of unadjusted differences, any reports onobservations and recommendations on internal controls, the engagement letter and theindependence letter;
• considering any other reports or communications submitted by the external auditors, as well asmanagement’s and/or the internal audit responses thereto;
• reviewing and seeking the input of the external auditors and the internal audit department withrespect to our internal financial control and anti-fraud systems and our risk management systems(including computerized information system controls and security);
• monitoring, in conjunction with our general counsel and the internal audit department, ourcompliance with legal and regulatory requirements;
• reviewing, evaluating and recommending approval to the board of directors of our code ofbusiness conduct, as well as our treasury policy and chart of authority, which together providethe control framework for all transactions;
• administering and enforcing, in conjunction with the board of directors, our code of ethics forsenior management and directors;
• establishing procedures for the receipt, retention and treatment of complaints received by ourcompany regarding accounting, internal accounting controls, auditing matters or mattersinvolving fraudulent behavior, including procedures for the confidential, anonymous submissionby company employees of concerns regarding questionable accounting or auditing matters, aswell as monitoring and reviewing any complaints received and the manner in which thosecomplaints have been resolved; and
• considering any other matters, as appropriate.
The audit committee is also responsible for the oversight and monitoring of our compliance withthe Sarbanes-Oxley Act, Section 404, regarding internal control over financial reporting.
Social responsibility committee
The social responsibility committee is comprised of three non-executive directors: Sir MichaelLlewellyn-Smith (chairman), Mr. John Hunter and Mr. George A. David. The chief executive officerand the director of public affairs typically attend meetings of the social responsibility committee. Thecommittee is responsible for the development and supervision of procedures and systems to ensure thepursuit of our social and environmental goals. The social responsibility committee operates inaccordance with a written charter and is responsible for:
• overseeing the development and maintenance of procedures and systems that promote our socialand environmental goals;
• establishing principles governing corporate social responsibility and environmental goals,including transparent business conduct in connection therewith;
126
• establishing an operating council responsible for developing and implementing appropriatepolicies and strategies to promote our social responsibility and environmental goals;
• ensuring group-wide capabilities to enable execution of policies and strategies to promote oursocial responsibility and environmental goals;
• overseeing communication with stakeholders of our social and environmental policies, goals andachievements, including the level of compliance with internationally accepted standards; and
• considering other topics as appropriate.
Corporate governance
As part of our commitment to best practices in corporate governance matters, we haveimplemented a number of measures to enhance internal control and risk management within ourcompany. We continually review our corporate governance standards and procedures in light of currentdevelopments and rulemaking projects in Greece, Europe and the United States, in order to ensurethat our corporate governance systems remain in line with international best practices.
Internal audit
Our internal audit department reports directly to the audit committee, which reviews and approvesthe internal audit plan for each year. The internal audit department consists of 22 full-time internalstaff covering a range of disciplines and business expertise. The function of the internal auditdepartment is to confirm the maintenance and effectiveness of our internal controls to the board ofdirectors. For this purpose, the director of internal audit makes regular presentations to the auditcommittee. The director of internal audit meets regularly with the audit committee without thepresence of our management.
The internal audit function monitors the internal financial control system across all the countries inwhich we operate and reports to management and the audit committee on its findings. The work of theinternal audit function is focused on the areas of greatest risk to the company, as determined by usinga risk based approach to audit planning. As part of our commitment to maintain and strengthen bestpractices in corporate governance matters, we consistently seek to enhance our internal controlenvironment and risk management capability across our organization.
The internal audit function prepares audit reports and recommendations following each audit andappropriate measures are then taken to implement such recommendations. Status reports onmanagement’s action plans to internal audit findings are provided to the audit committee and board ofdirectors on a biannual basis. The chief executive officer, along with regional and country managers, aswell as our chief financial officer, general counsel and corporate controller each receive a copy of suchsummary.
Disclosure committee
A disclosure committee has been established and disclosure controls and procedures have beenadopted to ensure the accuracy and completeness of our public disclosures. The disclosure committee iscomprised of our chief financial officer, our general counsel and director of strategic development, ourdirector of investor relations and our corporate controller.
127
Performance reporting
Reports on our annual performance and prospects are presented in the annual report and in theform 20-F filed annually with the SEC. Interim financial information is also released, on a quarterlybasis, to the stock exchanges on which we are listed and to the financial press. Internally, our financialresults and key business indicators are circulated and reviewed by senior management on a monthlybasis. This information includes comparisons against business plans, forecasts and previous yearperformance. The board of directors receives updates on performance at each board of directorsmeeting, as well as a monthly report on our business and financial performance.
Internal control processes
Our board of directors acknowledges that it has ultimate responsibility for ensuring that we haveadequate systems of financial control. It should be noted that such systems of financial control canprovide only reasonable and not absolute assurance against material misstatements or loss. In certain ofthe territories in which we operate, businesses like ours are exposed to a heightened risk of loss due tofraud and criminal activity. We review our systems of financial control regularly in order to minimizesuch losses. The board of directors has adopted a chart of authority defining financial and otherauthorization limits and setting procedures for approving capital and investment expenditure. Theboard of directors also approves three-year strategic and financial plans and detailed annual budgets. Itsubsequently reviews monthly performance against targets set forth in such plans and budgets. A keyfocus of the financial management strategy is the protection of our earnings stream and management ofour cash flow.
The identification and management of risk
We have adopted a strategic Enterprise Wide Risk Management, or EWRM, approach to riskmanagement, providing a comprehensive risk management framework across the company. The primaryaim of this framework is to minimize the organization’s exposure to unforeseen events and to providecertainty to the management of identified risks in order to create a stable environment within which wecan deliver our operational and strategic objectives. There are two principal EWRM objectives:
• the compilation and maintenance of an up-to-date risk register detailing the risks to theachievement of our operational and strategic objectives; and
• consistent and replicable risk identification, management and escalation of identified risks acrossthe company.
These objectives are achieved by:
• regular risk reviews within the countries to chart and verify progress of the management of theidentified risk exposure;
• followed by escalation of significant operational risks together with progress on agreedmanagement actions to the regional directors; and
• annual communication of cumulative regional risk exposure to the operating committee andaudit committee.
Outputs from this EWRM process are embedded in all business planning activities.
Third party insurance is secured to cover any residual insurable risk exposure such as propertydamage or business interruption and liability protection. Local insurance policies have been arrangedunder this cover to provide working loss protection and necessary legal compliance.
128
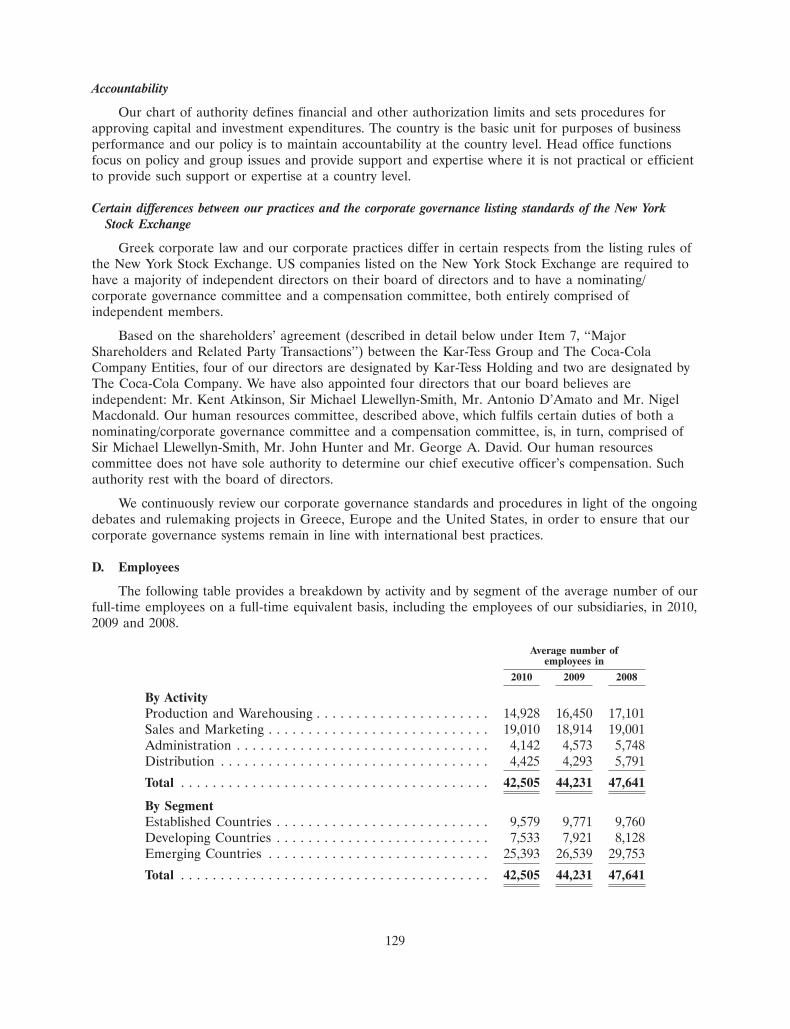
Accountability
Our chart of authority defines financial and other authorization limits and sets procedures forapproving capital and investment expenditures. The country is the basic unit for purposes of businessperformance and our policy is to maintain accountability at the country level. Head office functionsfocus on policy and group issues and provide support and expertise where it is not practical or efficientto provide such support or expertise at a country level.
Certain differences between our practices and the corporate governance listing standards of the New YorkStock Exchange
Greek corporate law and our corporate practices differ in certain respects from the listing rules ofthe New York Stock Exchange. US companies listed on the New York Stock Exchange are required tohave a majority of independent directors on their board of directors and to have a nominating/corporate governance committee and a compensation committee, both entirely comprised ofindependent members.
Based on the shareholders’ agreement (described in detail below under Item 7, ‘‘MajorShareholders and Related Party Transactions’’) between the Kar-Tess Group and The Coca-ColaCompany Entities, four of our directors are designated by Kar-Tess Holding and two are designated byThe Coca-Cola Company. We have also appointed four directors that our board believes areindependent: Mr. Kent Atkinson, Sir Michael Llewellyn-Smith, Mr. Antonio D’Amato and Mr. NigelMacdonald. Our human resources committee, described above, which fulfils certain duties of both anominating/corporate governance committee and a compensation committee, is, in turn, comprised ofSir Michael Llewellyn-Smith, Mr. John Hunter and Mr. George A. David. Our human resourcescommittee does not have sole authority to determine our chief executive officer’s compensation. Suchauthority rest with the board of directors.
We continuously review our corporate governance standards and procedures in light of the ongoingdebates and rulemaking projects in Greece, Europe and the United States, in order to ensure that ourcorporate governance systems remain in line with international best practices.
D. Employees
The following table provides a breakdown by activity and by segment of the average number of ourfull-time employees on a full-time equivalent basis, including the employees of our subsidiaries, in 2010,2009 and 2008.
Average number ofemployees in
2010 2009 2008
By ActivityProduction and Warehousing . . . . . . . . . . . . . . . . . . . . . . 14,928 16,450 17,101Sales and Marketing . . . . . . . . . . . . . . . . . . . . . . . . . . . . 19,010 18,914 19,001Administration . . . . . . . . . . . . . . . . . . . . . . . . . . . . . . . . 4,142 4,573 5,748Distribution . . . . . . . . . . . . . . . . . . . . . . . . . . . . . . . . . . 4,425 4,293 5,791
Total . . . . . . . . . . . . . . . . . . . . . . . . . . . . . . . . . . . . . . . 42,505 44,231 47,641
By SegmentEstablished Countries . . . . . . . . . . . . . . . . . . . . . . . . . . . 9,579 9,771 9,760Developing Countries . . . . . . . . . . . . . . . . . . . . . . . . . . . 7,533 7,921 8,128Emerging Countries . . . . . . . . . . . . . . . . . . . . . . . . . . . . 25,393 26,539 29,753
Total . . . . . . . . . . . . . . . . . . . . . . . . . . . . . . . . . . . . . . . 42,505 44,231 47,641
129
In order to meet the increased demand for our products in the summer months, we supplementour workforce with temporary employees during peak season. On average, in 2010, we employedapproximately 2,259 temporary full-time equivalent employees, around 5% of our total workforce.
Approximately 27% of our employees were members of the 49 independent trade unions operatingin our business as of December 31, 2010. Trade union participation varies within our unionizedcountries, for example, in Nigeria, nearly 99% of our nearly 4,700 employees are union members,whereas in Romania 18% of our nearly 2,000 employees are union members. Part of our workforce inBosnia, Bulgaria, Croatia, Cyprus, Greece, the Republic of Ireland, Northern Ireland, Italy, Poland, theRussian Federation, Slovenia, Serbia and Montenegro is also unionized. Furthermore, over 50% of ouremployees are covered by collective labor agreements. Typically, these agreements cover procedural andsubstantive issues including terms and conditions of employment, employment benefits, access totraining, grievance and disciplinary procedures, right of appeal and health and safety in the workplace.In countries where unions do not exist, we typically recommend the establishment of employee bodiesfor the purposes of information and consultation.
We are committed to communicating directly with all employees, whether unionized or not, aboutmajor change initiatives. In the event of redundancies, we comply with local legislation in relation toinformation and consult with employees and their representatives on the reasons for the change, theimpact and the implications for affected employees. In 2010, there were 2,429 redundancies due tooperational changes. We aim to develop a working environment where employees are valued, respectedand able to develop the skills necessary to address our challenging business needs. A unionized laborenvironment carries a risk of industrial action. However, we consider our relationship with ourworkforce to be good.
Aside from some sporadic labor actions of short duration in Italy and Greece, restructuring in2010 took place without incident and there was no disruption to supply as a result. We worked hard toensure our affected employees were treated fairly, with dignity and respect, in accordance with ourvalues. We provided severance packages that met and frequently exceeded statutory requirements. Aswith any major organizational change, we developed plans in consultation with unions and workscouncils where relevant. We also liaised with the Select Committee of our European Works Council, orEWC, and engaged in regular dialogue with local works councils and town hall meetings attended byall employees.
The Coca-Cola HBC EWC was established in 2002 under the European Works Council Directive94/95/EU. This forum previously comprised of employee and management representatives from Austria,Greece, Italy, Northern Ireland and the Republic of Ireland. In 2005, representation was expanded toinclude operations in our countries that joined the EU in 2004, namely the Czech Republic, Estonia,Hungary, Latvia, Lithuania, Poland, Slovakia and Slovenia. In 2007, our EWC was enlarged to includerepresentatives from the most recently admitted members of the EU, Bulgaria and Romania, as well asCyprus which became one of our territories in 2006. Our EWC is comprised of representatives ofmanagement and representatives of employees. It provides an annual forum for information andconsultation on transnational matters affecting more than one of our countries in the EU. Under theterms of the agreement, the parties undertake to participate in the council in a spirit of co-operation,good faith and mutual trust. The operation of the council does not affect the exclusive right ofmanagement to make business, financial, commercial and technological decisions.
130
The health, safety and welfare of our employees are paramount, and we are committed toachieving the most stringent standards of workplace safety and health. The Occupational Health andSafety Policy was adopted in 2004 and a group-wide initiative was launched to introduce theOccupational Health and Safety Assessment Series, or OHSAS, 18001 across all territories. The healthand safety program is designed to enhance both performance and conformance by implementingindependently certificated and standardized OHSAS 18001 systems. Compliance with nationaloccupational health and safety standards, our previous standard, still remains the minimum requirementin all operations. By the end of 2010, 65 of our 77 plants had achieved certification to OHSAS 18001.A comprehensive plan is in place to achieve full certification of all plants, including new acquisitions. In2011 an additional 7 manufacturing plants are scheduled to achieve certification, in line with our plansto certify all of our plants over the next few years.
During 2010, 66 health and safety systems audits and 23 compliance audits on behalf of TheCoca-Cola Company were conducted by independent agencies in 76 of our 77 production facilities,comprising sparkling beverages and/or juice, milk and mineral water facilities, including the facilities ofour joint ventures. All of these audits were performed for purposes of establishing key performanceindicators and internal reporting processes to monitor compliance with health and safety standardsgoing-forward.
E. Share Ownership
Except as disclosed below under Item 7 ‘‘Major Shareholders and Related Party Transactions—Major shareholders’’, as of the date of this annual report, none of the members of our board ofdirectors beneficially owns more than 1% of our ordinary shares. You should read Item 6 ‘‘Directors,Senior Management and Employees—Compensation’’ for further information on the stock option plansand stock appreciation rights available to directors and senior management.
ITEM 7 MAJOR SHAREHOLDERS AND RELATED PARTY TRANSACTIONS
A. Major shareholders
Prior to the acquisition of Coca-Cola Beverages plc, the Kar-Tess Group (of which Kar-TessHolding is the sole remaining member) had a combined 68.6% interest in us, while The Coca-ColaCompany held, directly and indirectly, a 50.5% interest in the outstanding share capital of Coca-ColaBeverages plc, and The Olayan Group, a diversified multinational Saudi Arabian group which holds aninterest in the bottler of products of The Coca-Cola Company for Saudi Arabia, held a 10.8% interest.The Coca-Cola Company and The Olayan Group exchanged their entire shareholdings in Coca-ColaBeverages plc for our ordinary shares at the time of the acquisition.
Our principal shareholders are Kar-Tess Holding (a Luxembourg company) holding approximately23.3% of our outstanding ordinary shares, and The Coca-Cola Company, which indirectly holdsapproximately 23.2% of our outstanding ordinary shares. Four members of our board of directors,Mr. George A. David, Mr. Anastassis G. David, Mr. Anastasios P. Leventis and Mr. Haralambos K.Leventis, were nominated by Kar-Tess Holding and elected in accordance with the provisions of ashareholders’ agreement between The Kar-Tess Group and The Coca-Cola Company Entities. Youshould read ‘‘The shareholders’ agreement between The Kar-Tess Group and The Coca-Cola CompanyEntities’’ for a more detailed description of the shareholders’ agreement. By virtue of theirresponsibilities within The Kar-Tess Group, Mr. George A. David, Mr. Anastassis G. David,Mr. Anastasios P. Leventis and Mr. Haralambos K. Leventis may be deemed, under the rules of theSEC, to be the beneficial owners of our ordinary shares held by Kar-Tess Holding. However, each ofthese individuals disclaims such beneficial ownership.
131
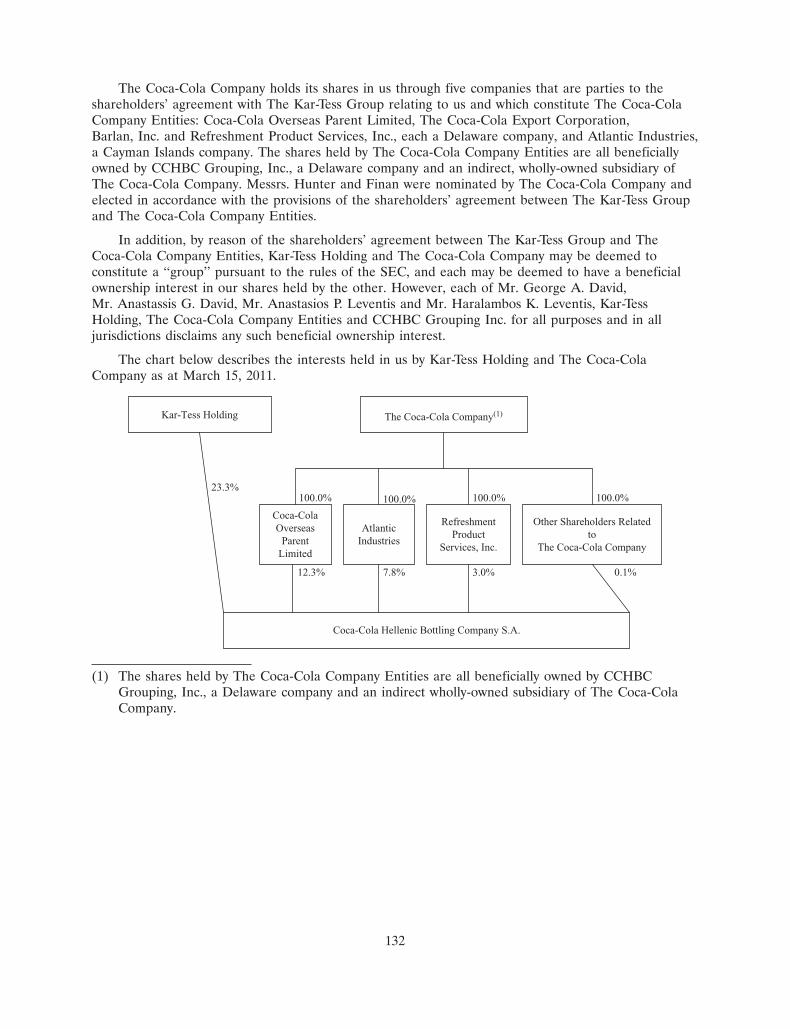
28MAR201109145031
The Coca-Cola Company holds its shares in us through five companies that are parties to theshareholders’ agreement with The Kar-Tess Group relating to us and which constitute The Coca-ColaCompany Entities: Coca-Cola Overseas Parent Limited, The Coca-Cola Export Corporation,Barlan, Inc. and Refreshment Product Services, Inc., each a Delaware company, and Atlantic Industries,a Cayman Islands company. The shares held by The Coca-Cola Company Entities are all beneficiallyowned by CCHBC Grouping, Inc., a Delaware company and an indirect, wholly-owned subsidiary ofThe Coca-Cola Company. Messrs. Hunter and Finan were nominated by The Coca-Cola Company andelected in accordance with the provisions of the shareholders’ agreement between The Kar-Tess Groupand The Coca-Cola Company Entities.
In addition, by reason of the shareholders’ agreement between The Kar-Tess Group and TheCoca-Cola Company Entities, Kar-Tess Holding and The Coca-Cola Company may be deemed toconstitute a ‘‘group’’ pursuant to the rules of the SEC, and each may be deemed to have a beneficialownership interest in our shares held by the other. However, each of Mr. George A. David,Mr. Anastassis G. David, Mr. Anastasios P. Leventis and Mr. Haralambos K. Leventis, Kar-TessHolding, The Coca-Cola Company Entities and CCHBC Grouping Inc. for all purposes and in alljurisdictions disclaims any such beneficial ownership interest.
The chart below describes the interests held in us by Kar-Tess Holding and The Coca-ColaCompany as at March 15, 2011.
Kar-Tess Holding The Coca-Cola Company(1)
Coca-ColaOverseas
ParentLimited
AtlanticIndustries
RefreshmentProduct
Services, Inc.
Other Shareholders Relatedto
The Coca-Cola Company
Coca-Cola Hellenic Bottling Company S.A.
23.3%
12.3% 7.8% 3.0% 0.1%
100.0% 100.0% 100.0% 100.0%
(1) The shares held by The Coca-Cola Company Entities are all beneficially owned by CCHBCGrouping, Inc., a Delaware company and an indirect wholly-owned subsidiary of The Coca-ColaCompany.
132
The table below sets forth the interests equal to or exceeding 5% of our outstanding share capitalnotified to us by the relevant shareholders as at March 15, 2011.
Percentage of Number ofName ordinary shares ordinary shares
The Kar-Tess Group(1)
Kar-Tess Holding(1) . . . . . . . . . . . . . . . . . . . . . . . . . . . . . . . . . . . . . . . . 23.3 85,355,019
The Coca-Cola CompanyCoca-Cola Overseas Parent Limited(2) . . . . . . . . . . . . . . . . . . . . . . . . . . 12.3 45,002,970Atlantic Industries(2) . . . . . . . . . . . . . . . . . . . . . . . . . . . . . . . . . . . . . . . 7.8 28,774,369Refreshment Product Services, Inc. . . . . . . . . . . . . . . . . . . . . . . . . . . . 3.0 10,833,612Other shareholders related to The Coca-Cola Company(2) . . . . . . . . . . . 0.1 501,127
23.2 85,112,078
Credit Suisse Group AGCredit Suisse International . . . . . . . . . . . . . . . . . . . . . . . . . . . . . . . . . . 4.9 17,968,300Other shareholders related to Credit Suisse Group AG . . . . . . . . . . . . . 0.3 1,000,995
5.2 18,969,295
(1) On September 23, 2008, Kar-Tess Holding informed us that on September 19, 2008 it acquired22,303,875 of our share capital from its parent, Boval S.A., in an intra-group transaction. OnDecember 6, 2010 Kar-Tess Holding transferred 22,453,254 of our shares and voting rights bytransferring 9 of its wholly owned subsidiaries to entities and individuals who were either ultimatebeneficial owners of Kar-Tess Holding or have been nominated by them. None of these entities andindividuals owns individually more than 2% of our outstanding shares and voting rights.
(2) These shares are all beneficially owned by CCHBC Grouping, Inc., a Delaware company and anindirect, wholly-owned subsidiary of The Coca-Cola Company.
Except as set forth in the shareholders’ agreement between The Kar-Tess Group and TheCoca-Cola Company Entities, none of our major shareholders have special voting rights. You shouldread ‘‘The shareholders’ agreement between The Kar-Tess Group and The Coca-Cola CompanyEntities’’ below for a more detailed description of the voting rights of, and the voting arrangementsamong, the parties to the shareholders’ agreement.
B. Related Party Transactions
Our relationship with The Coca-Cola Company
The Coca-Cola Company bottling system
The Coca-Cola Company bottling system is based on a division of functions between TheCoca-Cola Company and its various bottlers that is intended to optimize the production, marketing anddistribution of The Coca-Cola Company’s beverages world-wide.
The Coca-Cola Company owns the trademarks of the beverages of The Coca-Cola Company,controls the global marketing of The Coca-Cola Company’s brands and supplies the bottlers of TheCoca-Cola Company’s products with the concentrate for such products.
In their local markets, the bottlers of The Coca-Cola Company’s products undertake to:
• produce the products of The Coca-Cola Company;
• engage in local marketing and promotional activities customized to the particular circumstancesof the markets in which they operate;
133
• establish business relationships with local customers and develop local distribution channels, forexample, by investing in cold drink equipment, such as coolers; and
• distribute the products of The Coca-Cola Company to retailers either directly or indirectlythrough wholesalers.
The Coca-Cola Company maintains relationships with independently owned bottlers in whom TheCoca-Cola Company has no ownership interest, with bottlers in which The Coca-Cola Company hasinvested and holds a non-controlling ownership interest and with bottlers in which The Coca-ColaCompany has invested and holds a controlling ownership interest.
Key bottler of The Coca-Cola Company
We are the largest independent bottler of products of The Coca-Cola Company in the world interms of net sales revenue and the second largest in terms of volume, and we believe that we havestrategic importance within the Coca-Cola bottling system. As one of The Coca-Cola Company’s keybottlers, we work closely with The Coca-Cola Company, utilizing our respective skills and assets tomaximize the opportunities to increase sales in our countries and, ultimately, increase value over thelong-term to our shareholders. In 2010, the products of The Coca-Cola Company accounted forapproximately 96% of our total sales volume. The Coca-Cola Company has also licensed to us the useof The Coca-Cola Company trademark in our corporate names. We view our objectives as beingaligned with The Coca-Cola Company’s objectives and we believe that The Coca-Cola Company sharesthis view.
Bottlers’ agreements
The Coca-Cola Company has the ability to exert significant influence over the conduct of ourbusiness under a number of bottlers’ agreements entered into between The Coca-Cola Company andour operating companies for the countries in which we operate. Bottlers’ agreements are the standardcontracts that The Coca-Cola Company enters into with bottlers outside the United States for the saleof concentrate for The Coca-Cola Company’s trademarked beverages. All the bottlers’ agreementsentered into by The Coca-Cola Company and ourselves with respect to our non-EU markets are in theform of The Coca-Cola Company’s standard international bottlers’ agreements. The bottlers’agreements for our EU countries, including Austria, Greece, Italy (Northern and Central), NorthernIreland and the Republic of Ireland, are The Coca-Cola Company’s standard EU bottlers’ agreements.On August 19, 2003, we announced that The Coca-Cola Company has granted an extension of thebottlers’ agreements between us and The Coca-Cola Company covering the 26 countries in which weoperated at that time, effective on January 1, 2004 and for an initial term of ten years, lasting untilDecember 2013, with the option to request a further ten-year extension to 2023. The new agreementscover our developing countries that entered the EU on May 1, 2004. These are in the form of EUInternational Bottlers’ Agreements. On May 1, 2004, we received waivers from The Coca-ColaCompany bringing the existing bottlers’ agreements for countries entering the EU on May 1, 2004 incompliance with EU rules of competition until such time as negotiations for new bottlers’ agreementshave been completed and new agreements have been entered into. Any provisions in the existingbottlers’ agreements which were not in compliance with the EU rules of competition were waived. Inall other respects the provisions of these bottlers’ agreements remain in full force and effect.
134
On July 30, 1999, The Coca-Cola Company announced that it had completed the acquisition of thebeverage brands of Cadbury Schweppes plc in certain countries. Schweppes Holdings Limited, a whollyowned subsidiary of The Coca-Cola Company, has granted to us the rights to sell and distribute thesebeverages in the Republic of Ireland and Northern Ireland pursuant to bottlers’ agreementssubstantially similar to the standard EU bottlers’ agreement and in Nigeria, the Russian Federation,Bulgaria, Bosnia and Herzegovina, Croatia, Ukraine, the Former Yugoslav Republic of Macedonia,Serbia, Montenegro, Slovenia, Estonia, Lithuania and Latvia pursuant to bottlers’ agreementssubstantially similar to the standard international bottlers’ agreement of The Coca-Cola Company,except that the bottlers’ agreements for Bosnia and Herzegovina, Croatia and Slovenia are renewablefor an additional term of five years.
International bottlers’ agreements (for countries outside the European Economic Area)
Exclusivity. Our operating companies have the right to produce and the exclusive rights grantedby The Coca-Cola Company in their territories to sell and distribute those beverages of The Coca-ColaCompany in those containers, such as glass bottles, plastic bottles and/or cans, specifically identified ineach agreement. The Coca-Cola Company retains the right to produce and sell, or authorize thirdparties to produce and sell, beverages of The Coca-Cola Company in any manner or form not specifiedin the bottlers’ agreement within the relevant territory. The Coca-Cola Company also retains the rightto produce or authorize third parties to produce the products covered by the agreement in the territoryof the operating company for sale outside that territory. The international bottlers’ agreements alsocontemplate that there may be instances in which large or special buyers have operations transcendingthe boundaries of our operating company’s territories and, in such instances, our operating companiesagree not to oppose any additional measures deemed necessary by The Coca-Cola Company to improvesales and distribution to such customers. Our local operating companies are prohibited from producingor handling any beverage product other than products of The Coca-Cola Company or from acquiringor holding an interest in a party that engages in such business in the territories covered by theseagreements without The Coca-Cola Company’s prior consent.
Supply of concentrate. Our international bottlers’ agreements require us to purchase all ourrequirements of concentrate for beverages of The Coca-Cola Company from The Coca-Cola Companyand its authorized suppliers. The Coca-Cola Company sells concentrate to us at prices that TheCoca-Cola Company determines on an annual basis in its sole discretion, including the conditions ofshipment and payment as well as the currency of the transaction. The Coca-Cola Company normallyincreases concentrate prices after discussions with us so as to reflect trading conditions in the relevantcountry.
Packaging of the products of The Coca-Cola Company. We must distribute all the products of TheCoca-Cola Company in containers authorized by The Coca-Cola Company. The Coca-Cola Companyhas the right to approve, in its sole discretion, any kind of packages and containers for The Coca-ColaCompany’s beverages, including their size, shape and other attributes. The Coca-Cola Company may, inits sole discretion, redesign or discontinue any package of any beverage of The Coca-Cola Company,subject to certain limitations, so long as The Coca-Cola Company’s beverages covered by the relevantagreement are not all discontinued. We must purchase all containers, closures, cases and otherpackaging materials and labels from manufacturers approved by The Coca-Cola Company. TheCoca-Cola Company is the sole owner of the trademarks that identify The Coca-Cola Company’sbeverages and of the secret formulae used in concentrates. We are prohibited from producing otherproducts or packages that would imitate, infringe or cause confusion with the products, trade dress,containers or trademarks of The Coca-Cola Company, or from acquiring or holding an interest in aparty that engages in such activities.
135
Other conditions. We are required to maintain adequate production and distribution facilities andinventories of bottles, caps, boxes, cartons and other exterior packaging or materials as well as toundertake adequate quality control measures prescribed by The Coca-Cola Company. We alsoundertake to develop, stimulate and meet the demand for The Coca-Cola Company’s beverages anduse all approved means and spend such funds on advertising and other forms of marketing as may bereasonably required to meet that objective and to maintain sound financial capacity to secure theperformance of our obligations to The Coca-Cola Company. We are required to submit to TheCoca-Cola Company for each of our territories an annual business plan, which must be acceptable toThe Coca-Cola Company. In practice, however, we work closely with The Coca-Cola Company todevelop our annual business plan in light of the then prevailing trading conditions in each territory.
Trans-shipping. Our operating companies are prohibited from making sales of The Coca-ColaCompany’s beverages outside of their prescribed territories or to anyone intending to resell thebeverages outside those territories without the consent of The Coca-Cola Company. The Coca-ColaCompany may impose financial penalties on operating companies whose products are found in anotherbottler’s territory or even cancel the license for the type of containers found in the other bottler’sterritory.
Pricing. Our operating companies set the price of products sold to retailers at their discretion.The Coca-Cola Company is also entitled, to the extent permitted by local law, to set the maximumprice we may charge to our customers for products covered by the applicable bottlers’ agreements. Inpractice, we work closely with The Coca-Cola Company to determine our pricing strategy in light of thetrading conditions prevailing at the relevant time in each country. Our purchases of concentrate,beverage base, finished goods and other goods are at prices that are set from time-to-time by TheCoca-Cola Company in its sole discretion. The combination of The Coca-Cola Company’s right to setthe maximum price we may charge to our customers for products covered by the applicable bottlers’agreements and its right to set our concentrate prices in its sole discretion could give The Coca-ColaCompany considerable influence over our gross profit margins.
Assignment/Change of control. Each operating company is prohibited from assigning, transferringor pledging its bottlers’ agreement with The Coca-Cola Company, or any interest in it, whethervoluntarily or involuntarily, without the consent of The Coca-Cola Company. In addition, our operatingcompany may not undergo a change of control without the consent of The Coca-Cola Company.
Term. The international bottlers’ agreements expire in 2013. If our operating companies havecomplied fully with the agreements during the initial term, are ‘‘capable of the continued promotion,development and exploitation of the full potential of the business’’ and request an extension of theagreement, an additional term until 2023 may be granted in The Coca-Cola Company’s sole discretion.
Termination. Either party to an international bottlers’ agreement may, with 60 days’ written noticeto the other party, terminate the bottlers’ agreement in the event of non-compliance of the other partywith its terms so long as the party in non-compliance has not cured such noncompliance during this60-day period. Either party may also terminate the agreement by written notice to the other party if itsterms violate applicable law or if any of the parties is unable to legally obtain foreign exchange to remitabroad in payment of imports of concentrate.
In addition, The Coca-Cola Company may terminate an international bottlers’ agreement with anyof our operating companies immediately by written notice to our operating company in the event that:
• the operating company suspends payments to creditors, declares bankruptcy, is declaredbankrupt, is expropriated or nationalized, is liquidated or dissolved or if a receiver is appointedto manage the business of the operating company;
136
• the operating company transfers control, assigns the bottlers’ agreement, delegates performanceunder the agreement or fails to report to The Coca-Cola Company material changes in itsownership; or
• if the operating company or any individual or legal entity that controls, owns a majority of theshares in or, directly or indirectly, influences the management of the operating company engagesin the production of non-alcoholic beverages other than The Coca-Cola Company’snon-alcoholic beverages, whether through direct ownership of such operations or through controlor administration thereof, provided that, upon request, the operating company shall be given sixmonths to remedy such situation.
Moreover, if an operating company does not wish to pay the required price for concentrate for thebeverage ‘‘Coca-Cola’’, it must so notify The Coca-Cola Company in writing within 30 days of receiptof The Coca-Cola Company’s new prices, in which case the bottlers’ agreement in relation toconcentrate for the beverage ‘‘Coca-Cola’’ will terminate automatically 3 months after the date of suchnotice. In case an operating company refuses to pay the required price for concentrate other thanconcentrate for the beverage ‘‘Coca-Cola’’, The Coca-Cola Company may at its option cancel thebottlers’ agreement in relation to such concentrate or terminate the entire agreement, in each case withthree months’ written notice.
In addition to The Coca-Cola Company’s termination rights described above, if our operatingcompany does not comply with the standards and instructions established by The Coca-Cola Companyrelating to the production of the licensed products, The Coca-Cola Company is entitled to suspend theoperating company’s authorization to produce such products of The Coca-Cola Company until thedefault has been corrected to The Coca-Cola Company’s satisfaction. The Coca-Cola Company mayalso elect, in the event that an operating company breaches the terms of the agreement with respect toa particular product, to cancel the authorization granted to such operating company under theagreement in respect of that product.
EU bottlers’ agreements
Exclusivity. Our operating companies have the right to produce and the exclusive rights grantedby The Coca-Cola Company in their territories to sell and distribute the products of The Coca-ColaCompany in those containers, such as glass bottles, plastic bottles and/or cans, specifically identified ineach agreement. The Coca-Cola Company retains the right to produce and sell, or authorize thirdparties to produce and sell, the beverages in any manner or form not specified in the bottlers’agreement within the relevant territory. The Coca-Cola Company also retains the right to produce, orauthorize third parties to produce in the territory of the operating company, the products covered bythe agreement for sale outside that territory. The EU bottlers’ agreements also contemplate that theremay be instances in which large or special buyers have operations transcending the boundaries of theoperating company’s territories. In such instances, our operating companies agree not to oppose,without valid reason, any additional measures deemed necessary by The Coca-Cola Company toimprove sales and distribution to such customers. Our operating companies also agree not to opposeany measures taken by The Coca-Cola Company in compliance with the competition rules of theEuropean Economic Area.
Supply of concentrate. The provisions of the EU bottlers’ agreements relating to the supply ofconcentrate are substantially similar to the corresponding provisions of the international bottlers’agreements described above.
Packaging of the products of The Coca-Cola Company. The provisions of the EU bottlers’agreements relating to the packaging of the products of The Coca-Cola Company are substantiallysimilar to the corresponding provisions of the international bottlers’ agreement described above.
137
Other conditions. The EU bottlers’ agreements contain substantially similar conditions to theconditions of the international bottlers’ agreements described above.
Trans-shipping. Our operating companies are prohibited from making sales of The Coca-ColaCompany’s beverages outside their prescribed territories, or to anyone intending to resell thesebeverages outside those territories, without the consent of The Coca-Cola Company, except for salesarising out of an unsolicited order from a customer in another Member State of the EuropeanEconomic Area or sales to a customer intending to export to another such Member State. TheCoca-Cola Company may impose financial penalties on operating companies whose products are foundin another bottler’s territory in violation of the bottlers’ agreement or even cancel the license for thetype of containers found in the other bottler’s territory.
Pricing. The provision of the EU bottlers’ agreements relating to pricing of the products of TheCoca-Cola Company are substantially similar to the corresponding provisions of the internationalbottlers’ agreement described above.
Assignment/Change of control. The assignment and change of control provisions of the Europeanbottlers’ agreement are substantially similar to the assignment provisions of the international bottlers’agreements described above.
Term. The EU bottlers’ agreements expire in 2013, unless terminated earlier as provided in theagreements. If our operating companies have complied fully with the agreements during the initialterm, are ‘‘capable of the continued promotion, development and exploitation of the full potential ofthe business’’ and request an extension of the agreement, an additional term until 2023 may be grantedin the sole discretion of The Coca-Cola Company. The bottlers’ agreement relating to the production,distribution and sale of products of The Coca-Cola Company in Greece does not specifically providefor our ability to request the renewal of such agreement.
Termination. The termination provisions of the EU bottlers’ agreements are substantially similarto the termination provisions of the international bottlers’ agreements described above, except that theEU bottlers’ agreements may not be terminated in connection with the violation of terms that areparticular to the international bottlers’ agreements, such as the restriction on the production ofbeverages other than beverages of The Coca-Cola Company.
Purchase of concentrate, other raw materials and finished goods
Our operating companies purchase concentrate and other items such as finished products fromThe Coca-Cola Company and its subsidiaries. The total purchases of concentrate for 2010 amounted toA1,294.9 million as compared to and A1,246.0 in 2009 and A1,297.2 million in 2008. In addition toconcentrate, we purchase from The Coca-Cola Company finished goods and other materials. The costof these purchases amounted to A78.0 million in 2010, as compared to A37.6 million in 2009 andA 93.7 million in 2008. In 2010, we purchased concentrate from Beverage Partners Worldwide, a jointventure between The Coca-Cola Company and Nestle S.A., on an arm’s length basis amounting toA89.4 million compared to A70.4 million in 2009 and A102.0 million in 2008. In addition to concentrate,we purchase from Beverage Partners Worldwide finished goods. The cost of these purchases amountedto nil in 2010, as compared to nil in 2009 and A2.0 million in 2008.
138
Marketing and promotional support
The Coca-Cola Company makes contributions to us in respect of marketing and promotionalsupport programs to promote the sale of its products in our territories. Contributions received fromThe Coca-Cola Company for marketing and promotional support programs amounted to A60.8 million,A 56.9 million and A45.8 million for the years ended December 31, 2010, 2009 and 2008, respectively.These contributions, if related to payments we make to specific customers for marketing andpromotional incentives, are recognized as a reduction of our payments to customers. These payments tocustomers, net of contributions received from The Coca-Cola Company, are deducted from salesrevenue. In 2010, such contributions totaled A48.8 million as compared to A39.9 million in 2009 andA 37.6 million in 2008. Payments for marketing programs not specifically attributable to a particularcustomer are recognized as either a reduction of selling and delivery expenses or cost of goods sold. In2010, these contributions amounted to A15.8 million compared to A22.5 million in 2009 andA15.2 million in 2008. The levels of support programs are jointly determined annually on aterritory-by-territory basis to reflect the mutually agreed annual marketing plan for that territory andexpected sales volume for the year. The Coca-Cola Company is under no obligation to participate inthe programs or continue past levels of funding into the future. Given our relationship with TheCoca-Cola Company to date, there is no reason to believe that such support will be reduced orwithdrawn in the future.
Recent acquisitions with The Coca-Cola Company
We and The Coca-Cola Company are jointly pursuing the development or acquisition of mineralwater and juice opportunities with a view to expanding our presence in the water and juice segments.As part of this strategy, we have a common understanding with The Coca-Cola Company with respectto water acquisitions, whereas we will have full ownership of the operating assets and exercisemanagerial control over the relevant business, while The Coca-Cola Company will own the brands and,jointly with our company, the water source in the case of mineral waters. Where a separation of brandsfrom operating assets is not feasible due to legal or tax reasons, the acquired property will continue tobe jointly owned by The Coca-Cola Company and us. In that case, we will retain the management andoperational control of the acquired business and we will work with The Coca-Cola Company towardsthe eventual transfer of the brands to The Coca-Cola Company on a cost-neutral basis. In relation tojuice acquisitions, we each own 50% of the jointly acquired entities to date, the Multon Z.A.O. groupand Fresh & Co, which we account for as joint ventures. For additional information on theseacquisitions, see Item 5 ‘‘Operating and Financial Review and Prospects—Major recent transactions’’.
Amounts payable to and receivable from The Coca-Cola Company and Beverage Partners Worldwide
At December 31, 2010, The Coca-Cola Company owed us A53.8 million, as compared toA64.2 million and A106.8 million as at December 31, 2009 and 2008, respectively of which A3.0 million,A6.7 million, A4.5 million as at December 31, 2010, 2009 and 2008 related to loans to joint ventureswith The Coca-Cola Company. We owed The Coca-Cola Company a total of A166.0 million as atDecember 31, 2010, compared to A125.1 million and A160.0 million as at December 31, 2009 and 2008,respectively. As of December 31, 2010, we owed A4.4 million to Beverage Partners Worldwide and wewere not owed any amounts from Beverage Partners Worldwide. This compared with A1.7 million andA 4.1 million owed to Beverage Partners Worldwide and A0.3 million and A0.6 million owed by BeveragePartners Worldwide to us, as at December 31, 2009 and 2008, respectively.
139
Other transactions with The Coca-Cola Company
We enter into a number of other transactions with The Coca-Cola Company in the context of ourbusiness relationship. In the first quarter of 2008, we sold trademarks to The Coca-Cola Company fortotal cash proceeds of A9.3 million. Of this, A3.8 million related to the sale of the ‘‘botaniQ’’ trademark,and the remainder to the sale of the ‘‘Lanitis’’ juice trademark. The A3.8 million paid for the‘‘botaniQ’’ trademark represented The Coca-Cola Company’s share of the A7.6 million purchase pricepaid by the Multon joint venture.
In June 2008, we sold to The Coca-Cola Company a legal entity containing the trademarks for theRomerquelle group of brands and 50% of a legal entity that acts as the operating entity and that holdsrights to the water source, for the Romerquelle group of brands. We have formed a joint venture withThe Coca-Cola Company in respect of the production, sale and distribution of the Romerquelle groupof brands.
Other income primarily comprises rent, facility and other items of A14.3 million in 2010 comparedto A4.4 million in 2009 and A2.9 million in 2008 and a toll-filling relationship in Poland of A17.6 millionin 2010 compared to A15.0 million in 2009 and A18.2 million in 2008. There were no other expenses in2010 related to facility costs charged by the The Coca-Cola Company and shared costs compared toA1.5 million in 2009 and A2.5 million in 2008 included in operating expenses.
During 2010, we sold A19.0 million of finished goods and raw materials to The Coca-ColaCompany, compared to sales of A20.5 million for 2009 and A11.7 million for 2008.
During 2010, we purchased A4.4 million in franchise rights, as compared to nil in 2009. For 2010,we received A4.9 million as compared to nil in 2009, from the sale of available-for-sale assets to TheCoca-Cola Company.
In March 2008, we formed a three-party joint venture with The Coca-Cola Company and illycaffeSpA for the manufacture, marketing, selling and distributing of premium ready-to-drink coffee underthe illy brand across our territories. During 2010, we received reimbursement for direct marketingexpenses incurred of A0.8 million, compared to A0.5 million in 2009 and A0.8 million in 2008 andrecorded other income of A0.3 million, compared to A0.4 million in 2009 and nil in 2008. As atDecember 31, 2010, the receivables from Ilko Hellenic Partners GmbH were A1.4 million, compared toA1.3 million and A2.6 million at December 31, 2009 and 2008, respectively.
All transactions with The Coca-Cola Company are conducted on an arm’s length basis.
Other Coca-Cola Bottlers
In 2010, we sold A1.3 million of finished goods and purchased A0.5 million of finished goods fromother Coca-Cola bottlers, compared to nil in 2009 and 2008, incurred A0.1 million of expensescompared to A0.1 million and nil in 2009 and 2008, respectively, and did not record any income in 2010and 2009, compared to A0.1 million in 2008, with respect to other Coca-Cola bottlers where TheCoca-Cola Company has significant influence. At December 31, 2010 we had receivables of A0.1 millionfrom such bottlers, compared to nil in 2009 and 2008.
Our relationship with The Kar-Tess Group
Supply agreement with Frigoglass S.A.
Until June 2000, we owned 20% of Frigoglass S.A., a company listed on the Athens Exchangewhich manufactures coolers, glass bottles and crowns. Boval S.A., the parent of Kar-Tess Holding,currently owns 43.9% of Frigoglass S.A.
140
Under the terms of a supply agreement that we entered into with Frigoglass S.A. in 1999 initiallyset to expire on December 31, 2004, and extended first in June 2004 and again in December 2008, onsubstantially similar terms, to December 31, 2013, we are obligated to obtain at least 60% of ourannual requirements of coolers from Frigoglass S.A., in order to maintain our status as a non-exclusivemost favored client. The prices at which we purchase these products are agreed between us andFrigoglass S.A. at the beginning of each year. If an agreement is not reached, the applicable prices willbe determined based on the average prices of non-exclusive other primary European suppliers to TheCoca-Cola Company’s European bottlers. We have the status of a non-exclusive most favored customerof Frigoglass S.A., which means that the price to us must be less than the prices charged to othercustomers of Frigoglass S.A. that do not have this status and any orders placed by us must be dealtwith in absolute priority with respect to orders from those other customers. Frigoglass S.A., however, isnot required to apply most favored customer pricing for any product for which they provide us with lessthan 50% of our annual supply requirements. In addition, most favored customer status does not applyto any products which we purchase from Frigoglass S.A. which are categorized as commodities and forwhich we have requested, and have received, fixed prices.
In 2010, we made purchases from Frigoglass S.A. totaling A101.0 million compared to A58.8 millionin 2009 and A117.5 million in 2008. The purchases from Frigoglass S.A. in 2010 were comprised ofA84.6 million for coolers, other cold drink equipment and spare parts and A16.4 million for raw andpackaging materials and other purchases. This compares to A21.3 million for the purchase of coolers,other cold drink equipment and spare parts and A37.5 million for purchases of raw and packagingmaterials in 2009 and A82.6 million and A34.9 million, respectively, in 2008. The increase in totalpurchases between 2009 and 2010 and the reduction in total purchases between 2008 and 2009primarily reflects the fact that capital expenditure for cold drink equipment was significantly reduced in2009.
As at December 31, 2010, we owed A13.9 million to Frigoglass S.A. in connection with the supplyagreement, and Frigoglass S.A. owed to us A1.2 million. This compared with A3.6 million andA 12.2 million owed to Frigoglass S.A. and A4.7 million and A 1.8 million owed by Frigoglass S.A. to usas at December 31, 2009 and 2008, respectively. All transactions with Frigoglass S.A. are conducted onan arm’s length basis. Frigoglass S.A. has a controlling interest in Frigoglass Industries (Nigeria)Limited, a company in which we have a 16% effective interest through our investment in NigerianBottling Company plc.
Leventis Overseas and AG Leventis (Nigeria) plc
Leventis Overseas and AG Leventis (Nigeria) plc are related to us by way of common directorswhere significant influence exists. During 2010, we purchased from Leventis Overseas and AG Leventis(Nigeria) plc finished goods and other materials totaling A10.8 million, this compares to A10.0 millionfor 2009 and A11.1 million for 2008. We had no purchases of fixed assets in 2010 from LeventisOverseas and AG Leventis (Nigeria) plc, compared to A0.4 million and A2.6 million in 2009 and 2008,respectively. In 2010, we sold A0.1 million finished goods and raw materials to Leventis Overseas andAG Leventis (Nigeria) plc, compared to sales of nil and A0.2 million of finished goods and rawmaterials in 2009 and 2008, respectively, and we incurred rental expenses of A0.6 million, compared torental expenses of A2.9 million and A0.4 million for 2009 and 2008, respectively. In addition during2010, we incurred other expenses of A0.4 million, compared to nil in 2009 and 2008 and recorded otherincome of A1,0 million in 2010 compared to nil in 2009 and 2008. At December 31, 2010, we owed toLeventis Overseas and AG Leventis (Nigeria) plc A1.3 million, compared to A2.2 million andA1.1 million, as at December 31, 2009 and 2008, respectively, and Leventis Overseas and AG Leventis(Nigeria) plc owed to us A0.8 million, compared to A 0.2 million and nil, as at December 31, 2009 and2008, respectively.
141
Plias S.A.
Plias S.A. is related to us by way of some common shareholdings. During 2010 and 2009 we didnot purchase any finished goods and other materials, compared to A0.2 million in 2008, and did notrecord any income from Plias S.A., compared to A0.2 million in 2008. At December 31, 2010 and 2009,we were owed nil from Plias S.A. and its subsidiaries, compared to A0.6 million as at December 31,2008, and at December 31, 2010 we owed nil to Plias S.A. and its subsidiaries, compared to A0.2 millionand nil at December 31, 2009 and 2008, respectively.
Other related parties
During 2010, we purchased A1.4 million of raw materials and finished goods, compared toA2.1 million in 2009 and A3.0 million in 2008, and A 0.3 million of fixed assets from other relatedparties, compared to A 0.2 million in 2009 and A0.6 million in 2008. Further, we incurred expenses ofA2.1 million, compared to A1.0 million and A2.6 million, respectively, in 2009 and 2008 and we recordedincome of A0.2 million, compared to A0.2 million and A0.1 million, respectively, in 2009 and nil in 2008.At December 31, 2010, we owed A0.1 million to other related parties compared to A0.4 million andA0.4 million, respectively in 2009 and 2008, and we were owed A0.8 million by other related parties,compared to nil and A0.1 million, respectively at December 31, 2009 and at December 31, 2008.
The shareholders’ agreement between The Kar-Tess Group and The Coca-Cola Company Entities
General
On November 3, 1999, The Kar-Tess Group and The Coca-Cola Company Entities entered into ashareholders’ agreement, which became effective at the date of the acquisition of Coca-ColaBeverages plc by Hellenic Bottling Company S.A. and which governs many important aspects of theirrelationship. On December 29, 2008, Kar-Tess Holding and The Coca-Cola Company agreed to extendtheir existing shareholders’ agreement until 31 December 2018. The following summarizes certainprovisions of the shareholders’ agreement.
Restriction on transfer
The shareholders’ agreement restricts the sale of our ordinary shares owned by Kar-Tess Holdingand The Coca-Cola Company Entities with a view toward maintaining the combined shareholdings ofKar-Tess Holding and The Coca-Cola Company Entities until January 2014 at no less than 44% of ouroutstanding share capital (and at no less than 40% of our outstanding share capital thereafter untilexpiration of the shareholders’ agreement). Kar-Tess Holding and The Coca-Cola Company Entitieshave also agreed to maintain their individual shareholdings until January 2014 at no less than 22% ofour outstanding share capital (and at no less than 20% of our outstanding share capital thereafter untilexpiration of the shareholders’ agreement). However, Kar-Tess Holding and The Coca-Cola CompanyEntities have also agreed to negotiate in good faith an agreement that allows transfer of our ordinaryshares below these minimum thresholds provided that they continue to jointly control us.
Composition of our board of directors
The amended shareholders’ agreement provides that the composition of our board of directors betwelve directors comprising:
• two directors designated by The Coca-Cola Company Entities;
• four directors designated by Kar-Tess Holding; and
• the remaining directors jointly designated by The Kar-Tess Group and The Coca-Cola CompanyEntities.
142
Kar-Tess Holding and The Coca-Cola Company Entities have also agreed to cast the votesattaching to their ordinary shares so that each other’s nominees are elected to our board of directorsand, in the event that there are more or less than twelve directors on our board, so that Kar-TessHolding and The Coca-Cola Company Entities maintain their respective proportional representation onour board of directors. Either shareholder may request by written notice to the other shareholder thata director nominated by such shareholder be removed and the other shareholder has agreed to procurethat any necessary action is taken in accordance with our articles of association and Greek law toremove or replace such director and to fill the board vacancy with a new director nominated by theshareholder requesting the removal and replacement.
Decisions of our board of directors
Kar-Tess Holding and The Coca-Cola Company Entities have agreed to seek to convene anextraordinary general meeting of our shareholders to replace our board of directors in the event aresolution is passed by our board of directors in circumstances where a representative director of eitherKar-Tess Holding or The Coca-Cola Company Entities has voted against such resolution to:
• engage in any business other than the bottling of beverages;
• incur any indebtedness, including in the form of guarantees, or approve capital expenditures inexcess of A30.0 million;
• enter into any arrangements providing for payments or other consideration in excess ofA30.0 million;
• sell, lease, exchange, transfer or otherwise dispose of all or substantially all of our assets or sellthe majority of the value of our assets, if not in the ordinary course of business, unless such saleis in connection with a sale-leaseback transfer;
• appoint our top executive (chief executive officer); or
• approve our annual budget and annual business plan.
Our articles of association provide that approval of these matters requires a quorum of three-quarters of the total number of the members of our board of directors and the vote of two-thirds ofthe directors present or represented at the meeting. In the event of a tied voted, the vote of theboard’s chairman prevails.
Shareholder approvals
Kar-Tess Holding and The Coca-Cola Company Entities have agreed to consult before every vote,and to vote against any proposal where either of them has indicated its intention to reject suchproposal, on any of the following matters:
• a modification of our articles of association;
• any increase or decrease of our share capital;
• the merger or consolidation of our company with or into another company;
• the liquidation or dissolution of our company; or
• the general assignment for the benefit of creditors of, or the appointment of a custodian,receiver or trustee for, any part of our assets.
143
The Kar-Tess Group (of which Kar-Tess Holding is the sole remaining member) and TheCoca-Cola Company Entities also entered into a supplemental agreement on March 3, 2000, providingthat, after the termination of the shareholders’ agreement, for so long as any of The Kar-Tess Group orThe Coca-Cola Company Entities is a shareholder in our company, each of The Kar-Tess Group andThe Coca-Cola Company Entities will vote their ordinary shares against any proposal to liquidate ordissolve our company unless they have separately agreed to the contrary.
Termination
No party or group of parties may unilaterally terminate the shareholders’ agreement prior toDecember 2018. However, at any time the parties may agree to terminate the shareholders’ agreement,which would also be terminated if we cease to exist or if one group of parties elects to terminate itupon breach of the agreement by the other group of parties. After December 2018, the shareholders’agreement will remain in force unless terminated by either group of parties on three months’ writtennotice.
The relationship agreement among us, The Kar-Tess Group and The Coca-Cola Company Entities
General
On August 29, 2000, in connection with the listing of our ordinary shares on the London StockExchange, we, The Kar-Tess Group (of which Kar-Tess Holding is the sole remaining member) and TheCoca-Cola Company Entities entered into a relationship agreement in accordance with Rule 3.12 of theListing Rules of the Financial Services Authority.
Enforcement of relationship agreement and obligation to maintain independent directors
The Kar-Tess Group and The Coca-Cola Company Entities have agreed to cast the votes attachingto their ordinary shares, and to procure (so far as they are reasonably able) that the directorsnominated by them on our board of directors vote at all times in a manner so as to ensure that:
• the terms of the relationship agreement are fully implemented;
• we comply with all our obligations under the relationship agreement;
• changes in our articles of association do not contradict the relationship agreement; and
• there are at least two independent directors on our board of directors at any given time.
Independent directors are directors free from any business relationship with The Kar-Tess Groupor The Coca-Cola Company Entities that could materially interfere with the exercise of theirindependent judgment in relation to matters concerning our company.
Quorum and voting restrictions
The Coca-Cola Company Entities have agreed not to cast the votes attaching to their ordinaryshares or be counted in any quorum at any of our general meetings and to procure (so far as they arereasonably able) that no director nominated by The Coca-Cola Company Entities votes or is counted inany quorum in relation to any of the following matters:
• transactions between us (including any of our directors, officers or employees) and any member(including any director, officer or employee of such member) of The Coca-Cola Company’sGroup or any of its associates;
• any matter in which any member of The Coca-Cola Company’s Group or any of its associates isinterested; and
• any decision by our company concerning the enforcement of our rights under the relationshipagreement.
144
The Kar-Tess Group has agreed not to cast the votes attaching to their ordinary shares or becounted in any quorum at any of our general meetings and to procure (so far as they are reasonablyable) that no director nominated by The Kar-Tess Group votes or is counted in any quorum in relationto any of the following matters:
• transactions between us (including any of our directors, officers or employees) and any member(including any director, officer or employee of such member) of The Kar-Tess Group or any ofits associates;
• any matter in which any member of The Kar-Tess Group or any of its associates is interested;and
• any decision by our company concerning the enforcement of our rights under the relationshipagreement.
Each of The Kar-Tess Group and The Coca-Cola Company Entities has also agreed to procure (sofar as they are reasonably able) that, to the extent applicable, it casts its votes attaching to the shares itholds and participate in our general meetings in a manner consistent with the obligations of TheKar-Tess Group and The Coca-Cola Company Entities, as applicable, described above.
Exceptions to quorum and voting restrictions
There are two exceptions to these voting restrictions:
• Directors nominated by The Kar-Tess Group or by The Coca-Cola Company Entities may becounted for quorum purposes but cannot speak or vote on any of the matters that require atwo-thirds voting majority of our directors as described above under ‘‘The shareholders’agreement between The Kar-Tess Group and The Coca-Cola Company Entities—Decisions ofour board of directors’’.
• The Kar-Tess Group and The Coca-Cola Company Entities can vote and their votes are countedfor quorum purposes on these matters when they are required by the shareholders’ agreement tovote against a resolution as described above under ‘‘The shareholders’ agreement between TheKar-Tess Group and The Coca-Cola Company Entities—Shareholder approvals’’.
Other obligations of The Kar-Tess Group and The Coca-Cola Company Entities
The Kar-Tess Group (of which Kar-Tess Holding is the sole remaining member) and TheCoca-Cola Company Entities have agreed severally as to themselves to ensure that, for so long as theyare able to exercise 30% of the voting rights attaching to our ordinary shares or can control theappointment of a majority of our board of directors, any transactions or other arrangements betweenany of them and us will be conducted at arm’s length. However, such agreement does not limit orrestrict the rights of any member of The Coca-Cola Company’s group as set forth in The Coca-ColaCompany’s bottlers’ agreements with us.
The Kar-Tess Group and The Coca-Cola Company Entities have also agreed that, as long as theyjointly hold 30% or more of the voting rights attaching to our ordinary shares, they will not takeactions in breach of the relationship agreement that will render our company unsuitable for listingpursuant to the Listing Rules unless a new relationship agreement satisfactory to the London StockExchange is entered into among us, The Kar-Tess Group and The Coca-Cola Company Entities.
Conflict
If there is any conflict between the provisions of the relationship agreement and the shareholders’agreement, the provisions of the relationship agreement will prevail.
145
Termination
The relationship agreement will terminate if The Kar-Tess Group and The Coca-Cola CompanyEntities, acting jointly, are no longer able to exercise 30% of the voting rights attaching to our ordinaryshares and can no longer control the appointment of a majority of our board of directors or ourordinary shares are delisted from the London Stock Exchange.
C. Interests of experts and counsel
Not applicable.
ITEM 8 FINANCIAL INFORMATION
A. Consolidated Statements and Other Financial Information
Consolidated Statements and Other Financial Information
You should read Item 18 ‘‘Financial Statements’’.
Legal proceedings
The Greek Competition Authority issued a decision on January 25, 2002, imposing a fine on us ofapproximately A2.9 million for certain discount and rebate practices and required changes to ourcommercial practices with respect to placing coolers in certain locations and lending them free ofcharge. On June 16, 2004, the fine was reduced on appeal to A1.8 million. On June 29, 2005, the GreekCompetition Authority requested that we provide information on our commercial practices as a resultof a complaint by certain third parties regarding our compliance with the decision of January 25, 2002.On October 7, 2005, we were served with notice to appear before the Greek Competition Authority.
On June 14, 2006, the Greek Competition Authority issued a decision imposing a daily penalty ofA5,869 for each day that we allegedly failed to comply with the decision of January 25, 2002. OnAugust 31, 2006, we deposited an amount of A8.9 million, reflecting the amount of the fine andapplicable tax, with the Greek authorities. As a result of this deposit, we increased the charge to our2006 financial statements in connection to this case.
On November 23, 2007, the Court of Appeals partly reversed and partly upheld the decision of theGreek Competition Authority reducing the amount of the fine to A5.9 million. The reduction of thefine by A2.8 million was recognized in our 2007 income statement. We have appealed the decision ofthe Court of Appeals to the extent it upholds the fine, to the Supreme Administrative Court of Greece.We believe that we have substantial legal grounds for our appeal against the judgment of the Court ofAppeals. The Greek Competition Authority and one of our competitors have also appealed thedecision of the Court of Appeals. The hearing of the cases on May 5, 2010 was postponed and they arestill pending before the Supreme Administrative Court of Greece.
In relation to the Greek Competition Authority’s decision of January 25, 2002, one of ourcompetitors has filed a lawsuit claiming damages in an amount of A7.7 million. The court of firstinstance heard the case on January 21, 2009 and subsequently rejected the lawsuit. The plaintiff hasappealed the judgment. At present, it is not possible to predict the final outcome of this lawsuit orquantify the likelihood or materiality of any potential liability arising from it. We have not provided forany losses related to this case.
In the second quarter of 2010, the Serbian Competition Authority opened an investigation into thecommercial practices of our Serbian subsidiary for potential abuse of dominance in the market fordistribution of alcoholic and non-alcoholic beverages. The authority published an invitation forcomments by third parties. At present, it is not possible to predict the final outcome of thisinvestigation or quantify the likelihood or materiality of any potential liability arising from it.
146
Other than these actions, we are not subject to any litigation, arbitration, regulatory actions orother disputes that, individually or in the aggregate, involve potential liabilities that could have amaterial adverse effect on the results of our operations, cash flow or financial condition, nor are weaware that any such disputes are pending or threatened against us or any of our subsidiaries.
Dividends policy
You should read Item 3, ‘‘Key Information—Selected Financial Data—Dividends and DividendPolicy’’ for a discussion of our policy on dividend distributions.
B. Significant Changes
Not applicable.
ITEM 9 THE OFFER AND LISTING
A. Offer and Listing Details
The following table sets forth, for the periods indicated, the reported high and low marketquotations in euro for our ordinary shares on the main market of the Athens Exchange, as adjusted toreflect the one-for-two bonus share issuance that took effect on November 13, 2007.
euro perordinary share
High Low
Calendar Year2006 . . . . . . . . . . . . . . . . . . . . . . . . . . . . . . . . . . . . . . . . . . . . . . . . . . . . . . . . . . . . . 20.00 14.872007 . . . . . . . . . . . . . . . . . . . . . . . . . . . . . . . . . . . . . . . . . . . . . . . . . . . . . . . . . . . . . 29.60 18.602008 . . . . . . . . . . . . . . . . . . . . . . . . . . . . . . . . . . . . . . . . . . . . . . . . . . . . . . . . . . . . . 32.20 8.002009 . . . . . . . . . . . . . . . . . . . . . . . . . . . . . . . . . . . . . . . . . . . . . . . . . . . . . . . . . . . . . 18.84 8.802010 . . . . . . . . . . . . . . . . . . . . . . . . . . . . . . . . . . . . . . . . . . . . . . . . . . . . . . . . . . . . . 20.98 15.702011 (through March 15, 2011) . . . . . . . . . . . . . . . . . . . . . . . . . . . . . . . . . . . . . . . . . . 22.10 19.23
Calendar Quarter2009First Quarter . . . . . . . . . . . . . . . . . . . . . . . . . . . . . . . . . . . . . . . . . . . . . . . . . . . . . . . 12.16 8.80Second Quarter . . . . . . . . . . . . . . . . . . . . . . . . . . . . . . . . . . . . . . . . . . . . . . . . . . . . . 15.45 10.74Third Quarter . . . . . . . . . . . . . . . . . . . . . . . . . . . . . . . . . . . . . . . . . . . . . . . . . . . . . . 18.19 14.58Fourth Quarter . . . . . . . . . . . . . . . . . . . . . . . . . . . . . . . . . . . . . . . . . . . . . . . . . . . . . 18.84 13.802010First Quarter . . . . . . . . . . . . . . . . . . . . . . . . . . . . . . . . . . . . . . . . . . . . . . . . . . . . . . . 20.98 15.70Second Quarter . . . . . . . . . . . . . . . . . . . . . . . . . . . . . . . . . . . . . . . . . . . . . . . . . . . . . 20.84 16.75Third Quarter . . . . . . . . . . . . . . . . . . . . . . . . . . . . . . . . . . . . . . . . . . . . . . . . . . . . . . 20.00 17.30Fourth Quarter . . . . . . . . . . . . . . . . . . . . . . . . . . . . . . . . . . . . . . . . . . . . . . . . . . . . . 20.69 17.992011First Quarter (through March 15, 2011) . . . . . . . . . . . . . . . . . . . . . . . . . . . . . . . . . . . 22.10 19.23
MonthDecember 2010 . . . . . . . . . . . . . . . . . . . . . . . . . . . . . . . . . . . . . . . . . . . . . . . . . . . . . 20.69 19.00January 2011 . . . . . . . . . . . . . . . . . . . . . . . . . . . . . . . . . . . . . . . . . . . . . . . . . . . . . . . 22.06 19.25February 2011 . . . . . . . . . . . . . . . . . . . . . . . . . . . . . . . . . . . . . . . . . . . . . . . . . . . . . . 22.10 19.30March 2011 (through March 15, 2011) . . . . . . . . . . . . . . . . . . . . . . . . . . . . . . . . . . . . 20.38 19.23
147
On October 15, 2007 our shareholders approved a share capital increase of A60.6 million throughthe partial capitalization of share premium and the issuance of 121,033,958 new ordinary bearer shares.The new shares were delivered to our shareholders in a ratio of one (1) new share for every two(2) existing shares. Following the completion of the above share capital increase, our share capitalamounted to A181.6 million, divided into 363,101,874 shares of a nominal value of A0.50 each.
Our market capitalization as at March 15, 2011, was approximately A7.0 billion.
The following table sets forth, for the periods indicated, the reported high and low marketquotations in US dollars for our ADSs in the United States, as adjusted to reflect the one-for-twobonus share issuance that took effect on November 20, 2007.
dollars perADS
High Low
Calendar Year2006 . . . . . . . . . . . . . . . . . . . . . . . . . . . . . . . . . . . . . . . . . . . . . . . . . . . . . . . . . . . . . 26.65 18.892007 . . . . . . . . . . . . . . . . . . . . . . . . . . . . . . . . . . . . . . . . . . . . . . . . . . . . . . . . . . . . . 43.89 24.872008 . . . . . . . . . . . . . . . . . . . . . . . . . . . . . . . . . . . . . . . . . . . . . . . . . . . . . . . . . . . . . 48.93 11.002009 . . . . . . . . . . . . . . . . . . . . . . . . . . . . . . . . . . . . . . . . . . . . . . . . . . . . . . . . . . . . . 28.10 10.932010 . . . . . . . . . . . . . . . . . . . . . . . . . . . . . . . . . . . . . . . . . . . . . . . . . . . . . . . . . . . . . 28.26 19.802011 (through March 15, 2011) . . . . . . . . . . . . . . . . . . . . . . . . . . . . . . . . . . . . . . . . . . 30.47 25.30
Calendar Quarter2009First Quarter . . . . . . . . . . . . . . . . . . . . . . . . . . . . . . . . . . . . . . . . . . . . . . . . . . . . . . . 16.10 10.93Second Quarter . . . . . . . . . . . . . . . . . . . . . . . . . . . . . . . . . . . . . . . . . . . . . . . . . . . . . 21.77 14.20Third Quarter . . . . . . . . . . . . . . . . . . . . . . . . . . . . . . . . . . . . . . . . . . . . . . . . . . . . . . 26.36 20.07Fourth Quarter . . . . . . . . . . . . . . . . . . . . . . . . . . . . . . . . . . . . . . . . . . . . . . . . . . . . . 28.10 21.652010First Quarter . . . . . . . . . . . . . . . . . . . . . . . . . . . . . . . . . . . . . . . . . . . . . . . . . . . . . . . 27.47 21.94Second Quarter . . . . . . . . . . . . . . . . . . . . . . . . . . . . . . . . . . . . . . . . . . . . . . . . . . . . . 24.68 23.13Third Quarter . . . . . . . . . . . . . . . . . . . . . . . . . . . . . . . . . . . . . . . . . . . . . . . . . . . . . . 26.37 24.70Fourth Quarter . . . . . . . . . . . . . . . . . . . . . . . . . . . . . . . . . . . . . . . . . . . . . . . . . . . . . 28.26 26.372011First Quarter (through March 15, 2011) . . . . . . . . . . . . . . . . . . . . . . . . . . . . . . . . . . . 30.47 25.30
MonthDecember 2010 . . . . . . . . . . . . . . . . . . . . . . . . . . . . . . . . . . . . . . . . . . . . . . . . . . . . . 27.11 25.11January 2011 . . . . . . . . . . . . . . . . . . . . . . . . . . . . . . . . . . . . . . . . . . . . . . . . . . . . . . . 29.85 25.30February 2011 . . . . . . . . . . . . . . . . . . . . . . . . . . . . . . . . . . . . . . . . . . . . . . . . . . . . . . 30.47 26.60March 2011 (through March 15, 2011) . . . . . . . . . . . . . . . . . . . . . . . . . . . . . . . . . . . . 28.50 27.27
Fluctuations in the exchange rates between the euro and the US dollar may affect the relativemarket prices of the ADSs in the United States.
B. Plan of Distribution
Not applicable.
148
C. Markets
We have been listed on the Athens Exchange since 1991, and we are part of the Athens ExchangeComposite Index. We are one of the largest companies, based on market capitalization, quoted on theAthens Exchange. Our ordinary shares trade on the Athens Exchange under the symbol ‘‘EEEK’’. TheAthens Exchange is the primary trading market for our ordinary shares. Our shares are also listed onthe London Stock Exchange and, until September 2, 2009, the Australian Stock Exchange, by way ofCHESS Depository Interests, or CDIs. Trading of our CDIs on the Australian Stock Exchange wassuspended from the close of the market on August 26, 2009 with delisting of our CDIs effected at theclose of trading on September 2, 2009. In addition, our ordinary shares are listed on the New YorkStock Exchange under the symbol ‘‘CCH’’. Our shares trade on the New York Stock Exchange in theform of ADSs evidenced by American depositary receipts, or ADRs. Each ADR represents oneordinary share. We have a sponsored ADS facility, with Citibank N.A. acting as Depositary under anAmended and Restated Deposit Agreement dated April 30, 2010. Prior to this date the Depositary wasThe Bank of New York Mellon.
As at January 31, 2011, and based exclusively on external research performed by ThomsonReuters, there were 69 holders of our ordinary shares in the United States holding an aggregate of34,350,185 ordinary shares, or approximately 9.4% of our current total outstanding share capital. Inaddition, 85,112,078 ordinary shares, or 23.2%, were attributable to The Coca-Cola Company Entities.Given that the research was conducted in January 2011, the actual portion of our ordinary sharesbeneficially owned by US holders and the number of beneficial US holders may vary considerably.
The Athens Exchange
Following authorization by Law 3152/2003, the Athens Exchange issued on June 8, 2004 theAthens Exchange Regulation, or the Regulation, which came into effect on June 16, 2004. TheRegulation contains in a consolidated form provisions which were previously included in a largenumber of decisions that were issued by the Athens Exchange itself and certain other competentauthorities, such as the former Derivatives Exchange, either in their original form or as amended.Following authorization by Law 3371/2005, the Regulation was substantially amended and all theexisting markets of the Athens Exchange were abolished. Finally, the Regulation was once moresubstantially amended and restated by Law 3606/2007. Currently, the Athens Exchange consists of twomarkets: the Securities Market and the Derivatives Market. The securities of companies listed on theSecurities Market are classified into one of eight (8) main categories:
• Large Cap Category;
• Small and Medium Cap Category;
• Under Surveillance Category;
• Limited Free Float and Special Stock Exchange Characteristics Category;
• Limited Free Float and Special Stock Exchange Characteristics of Weekly Hourly TradingCategory;
• Under Suspension Category;
• Fixed Income Securities Category; and
• Category of Exchange Traded Funds, or ETFs.
When shares are listed for the first time on the Securities Market of the Athens Exchange theywill fall within one of the first two categories.
149
As at January 31, 2011, 47 companies had shares classified in the Large Cap category of theAthens Exchange, 129 companies had shares classified in the Small and Mid Cap category,50 companies had shares classified in the Limited Free Float and Special Stock ExchangeCharacteristics Category, 29 companies had shares classified in the Under Surveillance Category and 21had been classified in the Under Suspension Category.
The Large Cap Category consists of those companies that have a market capitalization of morethan A100.0 million and free float more than 20%. Also in this category the companies that participateneed to meet the following criteria of financial performance: shareholders equity of no less thanA15.0 million, three year pre-tax profits of no less than A6.0 million and pre-tax profits for the last twofinancial years or three-year EBITDA of no less than A8.0 million and a positive EBITDA for the lasttwo financial years. In addition to the above, a company being admitted to trading in the Large CapCategory for the first time should have a minimum capitalization of A150.0 million. The companies thathave either a small free float (less than 15%) of the total of its common shares or price below A0.30per share for 3 consecutive days or a free float of less than 10% of the total of its common shares dueto specific events announced by the company (public offer or other equity participations) are classifiedin the Limited Free Float and Special Stock Exchange Characteristics category. Companies that are infinancial distress are classified in the Under Surveillance Category, whereas if the company does notimprove its float to at least 10% in no more than 6 months (that can be extended to another 6 monthsif the company requests an extension) then the company is classified in the Limited Free Float andSpecial Stock Exchange Characteristics of Weekly Hourly Trading category. If a company’s annual salesincome drops below A2.0 million it is also classified in the Limited Free Float and Special StockExchange Characteristics of Weekly Hourly Trading category. Lastly, companies that have beenidentified as being in continued financial distress can be classified in the Under Suspension Categoryunder which there is no trading of the stock. In all other cases the companies are classified under theSmall and Mid Cap category.
The Greek capital markets and the Athens Exchange in particular are regulated under a series oflaws enacted by the Greek Parliament, decisions and regulations issued by the board of directors of theHellenic Capital Markets Commission, and the board of directors of the Athens Exchange. On May 31,2001, the Athens Exchange was upgraded by the Morgan Stanley Composite Index from an emerging toa developed market status. The creation of stock and derivatives exchanges in addition to the stock andderivatives markets of the Athens Exchange and the Athens Derivatives Exchange were originallypermitted in Greece pursuant to Law 3152/2003 subsequently in accordance with the provision ofarticle 21 of Law 3371/2005. These licenses remain in effect under article 71 of Law 3606/2007implementing the Directive on Markets and Financial Instruments in Greece. The operating license ofthese exchanges is granted by the Hellenic Capital Markets Commission, provided these exchangesfulfill certain capital, organizational and other requirements set forth in the Law 3606/2007 and indecision 8/452/2007 of the board of directors of the Hellenic Capital Markets Commission. TheHellenic Capital Markets Commission approved the Regulation for the operation of the exchange anddetermined the process for its publication.
Membership in the Athens Exchange
Membership is required for brokerage firms in order to effect transactions on the AthensExchange and is subject to approval by the board of directors of the Athens Exchange and licensing bythe Hellenic Capital Markets Commission. In addition, brokerage firms must appoint at least oneofficial representative who is authorized to conduct transactions on the Athens Exchange, who mustfulfill certain qualifications required by law and pass an examination given by the Hellenic CapitalMarkets Commission. For companies established in Greece, the minimum capital requirement in orderto obtain a license to operate a brokerage firm or an Investment Services Firm and qualify as anAthens Exchange member is A0.5 million.
150
All transactions through the Athens Exchange may only be carried out by brokers or banks thatare members of the Athens Exchange. Membership in the Athens Exchange is subject to the licensingrequirements stipulated in the Directive on Markets and Financial Instruments and to the approval ofthe Athens Exchange board of directors. Brokerage firms and banks that are members of the AthensExchange must appoint and have present during trading sessions at least one official representativeauthorized to conduct Athens Exchange transactions, which must fulfill certain qualifications requiredby law and pass an examination given by the Hellenic Capital Markets Commission.
Members of the Athens Exchange may engage in transactions through the Automated ExchangeTrading System, or OASIS, an electronic trading system, on behalf of their customers or on their ownbehalf. As at January 31, 2011, the Athens Exchange had 72 members (including the remote members),the vast majority of which were brokerage firms. Pursuant to the Directive on Markets and FinancialInstruments, which was implemented in Greece in August 2007 pursuant to Law 3606/2007, investmentservices may only be provided by investment services companies and banks. The investment servicescompanies need to have a minimum share capital of A0.5 million if only engaging in receiving andtransmitting buy and sell orders without holding client’s funds or other financial instruments,A1.5 million if providing a variety of investment services and A5.0 million if engaging in underwriting,trade for their own portfolio or operate a multilateral trading facility, and which have received anappropriate operating license from the Hellenic Capital Markets Commission. In addition, the HellenicCapital Markets Commission has also introduced rules relating to the performance of portfoliomanagement by Investment Services Firms. Orders Companies are companies that are only allowed toreceive and transfer their customers’ orders to Investment Services Firms, and are prohibited fromdealing in Athens Exchange transactions on behalf of their customers or from acting as a custodian fortheir customers’ shares or cash. The receipt and transfer of shares by Orders Companies is governed byLaw 3606/2007 and the Hellenic Capital Markets Commission’s decisions. Pursuant to the provisions ofthe Directive on Markets and Financial Instruments and the Regulation, Investment Services Firmsestablished in the EU or the European Economic Area may become remote members of the AthensExchange without being required to have a permanent establishment in Greece. Nevertheless, theywould need to appoint (a) a local custodian to clear and settle stock exchange transactions and anyother actions in relation to which they would be otherwise required to perform by being physicallypresent in Greece and (b) a local person to act as their representative and as agent for service ofprocess.
Stock market indices
The most widely followed index in Greece is the ATHEX Main Market Composite Index, a marketcapitalization index that tracks the price movement in the shares of 42 leading listed Greek companies.In addition, the FTSE/ATHEX20 Index was introduced in September 1997 to track the price movementof the shares of the 20 largest companies. As of March 15, 2011, our market capitalization representedapproximately 15.3% of the ATHEX Main Market Composite Index and approximately 11.5% of theFTSE/ATHEX20 Index.
The following table sets out the movement of the ATHEX Main Market Composite Index. Thehighs and lows are for the periods indicated, and the close is on the last trading day of the period.
Year High Low Close
2006 . . . . . . . . . . . . . . . . . . . . . . . . . . . . . . . . . . . . . . 4,395.4 3,379.3 4,394.12007 . . . . . . . . . . . . . . . . . . . . . . . . . . . . . . . . . . . . . . 5,334.5 4,344.8 5,178.82008 . . . . . . . . . . . . . . . . . . . . . . . . . . . . . . . . . . . . . . 5,207.4 1,626.6 1,786.52009 . . . . . . . . . . . . . . . . . . . . . . . . . . . . . . . . . . . . . . 2,896.9 1,469.4 2,196.22010 . . . . . . . . . . . . . . . . . . . . . . . . . . . . . . . . . . . . . . 2,327.6 1,403.9 1,413.92011 (through March 15, 2011) . . . . . . . . . . . . . . . . . . . 1,715.1 1,354.6 1,590.4
151
Trading on the Athens Exchange
Athens Exchange trading takes place every week from Monday to Friday, except for publicholidays. The daily trading session starts at 10.30 a.m. and ends at 5.00 p.m., Athens time, for theLarge Cap category. For the Mid and Small Cap categories the trading starts at 10.30 a.m. andconcludes at 5.05 p.m. On both cases there is a pre-opening session followed by a continuousautomated matching session.
A pre-opening session, operating through a call auction method, precedes the trading session from10.15 a.m. until 10.30 a.m. for the Large Cap and the Mid and Small Cap categories. The call auctionsprovide for the entry of orders to be collected and then executed in a batch. Auction matching takesplace at one price. The objective of the pre-opening auction is to maximize the volume of shares tradedat the auction price by calculating the price at which the greatest number of securities can be matched.For the Large Cap category the after hours trading session is between 5.00 p.m. to 5.20 pm. Between5.00 p.m. to 5.20 p.m. trades are executed at any price. The closing price is determined either by theclosing auction or from the weighted average price of the last 30% of the trades of the session. For theMid and Small Cap category there is also ‘‘an after hours’’ trading session from 5.05 p.m. to 5.20 p.m.for orders placed with instructions to execute ‘‘at Closing’’.
The trading system of the Athens Exchange is fully automated and orders can be placed fromremote locations. After the pre-opening auction session, orders are executed in continuous tradingfollowing the price and time priority rule: orders are ranked by price, and orders at the same price areranked based on time of entry into the system. Incoming orders always match pre-existing ordersalready included in the ranked list. Buy and sell orders can be matched in any number of multiples ofthe lot size authorized for a particular security. Depending on the order’s price type (limit or market),the order matches against eligible orders in the book, progressing from the best price to the worstavailable until the order’s quantity is exhausted.
The opening price is determined automatically from the system independently for every tradedsecurity through the method of determination of the opening price. Limit orders that have beenentered at a specified price prior to the commencement of the trading period, are calculated by thesystem to determine the opening prices. If no opening price has been determined during the durationof such method on a given day, the opening price is determined by the first order to be executedsubsequently.
According to an Athens Exchange specifying, the different fluctuation limits for the varioussecurity classes, the FTSE/ATHEX20 securities prices may fluctuate up to 30% from the closing priceof the preceding trading session (reference price). For all other securities, excluding the two specialcategories described in a previous chapter (Special Stock Exchange Characteristics securities and UnderSurveillance) prices may fluctuate up to 10% from the closing price of the preceding trading session(reference price). However, if all incoming purchase orders remain at the 10% limit up or if all saleorders remain at the 10% limit down for 15 minutes, the 10% limit for the particular security is thenextended by a further 10%. The price of a security that is classified on any of the two special categories(Special Stock Exchange Characteristics or Under Surveillance) may fluctuate on the auction market ata limit of 10% range. In this case also, if all incoming purchase orders remain at the 10% limit up or ifall sale orders remain at the 10% limit down for 15 minutes, the 10% limit for the particular security isthen extended by a further 10%. The Regulation has also introduced an automated system offluctuation control process applicable to securities listed in the Large Cap Category and the Categoryof ETFs, which is intended to prevent sudden fluctuations of the said securities. Newly listed securitiesare allowed to fluctuate freely during the first three sessions of their listing.
152
Simple block trades of equity securities are conducted under the following rules (temporarythreshold limit). The Athens Exchange authorities maintain the right to change the minimum value of ablock trade. Block trades are executed by competent personnel of the Athens Exchange that check theabovementioned requirements and authorize the block trade. Normally the minimum value for a blocktrade is as follows:
• for shares with an average daily turnover of the stock traded that is less than A25.0 million, theminimum value of a block trade is A250 thousand;
• for shares with an average daily turnover of the stock traded that is equal or greater than25.0 million and up to A50.0 million, the minimum value of a block trade is A400 thousand; and
• in case of shares with average daily turnover of the stock traded equal or greater thanA50.0 million, the minimum value of a block trade is A500 thousand.
The Greek stock market authorities have not advised on the time that the normal regulation willre-apply on the block’s trading.
All prices of completed transactions are published on electronic screens in the Athens Exchange.The prices of block trades do not affect the trade price. All transactions require cash settlement withinthree business days of the trade date. Trades are noted in the official register of the Athens Exchange,and all information on bids and offers is made available to Telerate and Reuters on a continuous basis.Bond trading is conducted by agreement among brokers on the electronic system.
All shares listed in the Athens Exchange are traded with a trading unit of 1 share.
Prices of all securities listed on the Athens Exchange are published in the Athens Exchange officialdaily price bulletin.
Law 3606/2007 implementing the Directive on Markets and Financial Instruments abolishednumerous limitations on over the counter trading of listed securities. Furthermore, a newly enactedamendment of the Regulation regarding clearing and settlement has facilitated the execution of overthe counter transactions, or OTC, through orders of Investment Services Firms, while in the recent pastover the counter transactions were only executed through the facilities of the Central SecuritiesDepositary department of the Hellenic Exchanges. These over the counter transactions are not subjectto price limitations.
Market regulation
Under Greek law, regulation of securities trading activities on the Athens Exchange is subject tosimilar restrictions to those imposed in other jurisdictions in the EU and in the United States.However, because we are a foreign private issuer our directors, officers and principal shareholders willbe exempt from the reporting and short-swing profit recovery provisions contained in Section 16 of theUS Securities Exchange Act of 1934.
Under Greek legislation, members of the board of directors, managers, auditors, supervisingauthorities of listed companies, shareholders, other professionals with access to confidential informationand individuals who represent any of the foregoing are prohibited from acquiring or disposing, directlyor indirectly, securities due to, or through the use of, for their account or on behalf of third parties,such confidential information. Insider trading prohibitions are extended to any third party that hasacquired confidential information that could not have been provided only by one of the foregoingpersons.
153
Confidential information is that which has not been made public, is specific and concerns one ormore issuers of securities or one or more securities, and which, if announced to the public, could havea material effect on the price of such securities, or on the price of the derivatives related to suchsecurities and generally information that a prudent investor would substantially evaluate, amongst otherfactors, while making an investment.
All persons with access to confidential information may only disclose it to third parties if actingwithin their ordinary course of business. Under no circumstances can such persons disclose confidentialinformation to third parties for the purpose of such third parties acquiring or disposing securities whichare traded on the Athens Exchange.
Civil and criminal charges can be imposed for insider trading violations. The competent authorityfor monitoring insider dealing infringements is the Hellenic Capital Markets Commission or the Bankof Greece when the infringement is conducted by a bank. However, because we are a foreign privateissuer our directors, officers and principal shareholders will be exempt from the reporting and short-swing profit recovery provisions contained in Section 16 of the US Securities Exchange Act of 1934.
Settlement, clearance and the Central Securities Depositary
Settlement of both registered and bearer shares listed on the Athens Exchange is affected throughthe department of Central Securities Depositary of the Hellenic Exchanges S.A. The Central SecuritiesDepositary was originally founded in February 1991 as a societe anonyme. On November 2006 themerger by absorption of the Central Securities Depositary by its parent company HellenicExchanges S.A. was completed. The department of the Central Securities Depositary of HellenicExchanges S.A. is responsible for settling and clearing Athens Exchange transactions and holding theshares deposited with it in book entry form.
Book entry of listed securities was originally introduced by virtue of Law 2396/1996. Thedematerialization of Greek shares commenced in March 1999, with the market becoming fullydematerialized in December 1999.
To participate in the Dematerialized Securities System, or SAT, each investor is required to open aSAT account, which is identified by a SAT account number. Shareholders who wish to open a SATaccount can appoint one or more Athens Exchange members or custodian banks as authorizedoperators of their SAT accounts. Only the authorized operators have access to balances and otherinformation concerning a SAT account. The Athens Exchange has also introduced the possibility ofholding a joint SAT account for two or more investors.
The clearance and settlement procedure through the department of the Central SecuritiesDepositary of the Hellenic Exchanges S.A. is effected through a multilateral system and consists ofthree stages:
• First, a notification by the Athens Exchange to the Central Securities Depositary of thetransactions completed within each trading day. More specifically, on trade date ‘‘T’’, followingthe closing of the trading day, the Athens Exchange sends electronically to the Central SecuritiesDepositary department of Hellenic Exchanges S.A. a magnetic file containing information on thetrading activity of such day. The file is downloaded to the SAT, where securities and values oftrades (buy or sell) are aggregated per investor, broker, security and type of trade, and then theweighted average value of the trade is calculated by dividing the total value of the trades by thequantity of securities traded (trade averaging).
154
• Second, a notification by the brokers to the Central Securities Depositary of HellenicExchanges S.A. with the SAT account of the seller and buyer and the number of shares to bedebited and credited to their respective SAT accounts. The brokers are required to notify toHellenic Exchanges S.A. each trade along with the broker’s account for the securities to becredited or debited to the relevant accounts. This is completed by day T+3. Following thenotification of the SAT account of the seller, the shares sold are ‘‘temporarily blocked’’ fortransfer purposes. Under Greek law, a person may not enter into sales of securities on theAthens Exchange if such person does not have full and unencumbered title to, and possessionof, the securities being sold at the time the order is matched. Short sales of securities listed onthe Athens Exchange are strictly regulated by the Hellenic Capital Markets Commission andpermitted in the case of derivative contracts previously executed either on the Athens Exchangeor on a private basis.
• Third, the settlement cycles are carried out on day T+3 in time intervals determined by theHellenic Exchanges S.A., which also transfers the securities from the securities accounts of thesellers to the securities accounts of the buyers and simultaneously executes the equivalent debitsand credits of the brokers’ cash accounts in the cash settlement bank. The settlement asmentioned is multilateral and is executed in accordance with the delivery versus paymentprinciple. By day T+3, brokers are required to deposit in the cash account, which they hold forthis purpose in the cash settlement bank, the amount of cash corresponding to their cashobligation. The results of the settlement, as reflected in the investors’ securities accounts and thebrokers’ cash accounts, are deemed final and irrevocable. Bilateral clearance is also possible incase of block trades or in exceptional circumstances, and in accordance with the HellenicExchanges S.A. clearing and settlement of dematerialized securities regulations. The transfer ofshares is affected by debiting the SAT account of the seller and crediting the SAT account of thebuyer on the settlement date.
Liabilities of brokerage firms resulting from their trading activities are guaranteed by the AthensExchange Guarantee Fund, to which each Athens Exchange member contributes, and which is operatedas a separate legal entity.
D. Selling Shareholders
Not applicable.
E. Dilution
Not applicable.
F. Expenses of the Issue
Not applicable.
ITEM 10 ADDITIONAL INFORMATION
A. Share Capital
Share capital and denomination
The nominal value of our issued share capital as of December 31, 2010, is A183,068,220 dividedinto 366,136,440 ordinary registered shares with a par value of A0.50 each, all of which is paid-up. Nospecific classes of stock are provided for in our articles of association and no special rights attach toany of our ordinary shares. There are no authorized but unissued ordinary shares.
155
Development in share capital
Total number Nominal increase Share capitalDate Transaction of shares Par value (decrease) in euro in euro
March 20, 2000 . . . . . . . Issue of shares(1) 142,938,836 A0.29 per share 392.08 41,948,301.10August 9, 2000 . . . . . . . Issue of shares(2) 236,668,596 A0.29 per share 27,506,899.49 69,455,200.59November 22, 2001 . . . . Capitalization of reserves(3) 236,668,596 A0.30 per share 1,545,378.21 71,000,578.80May 20, 2002 . . . . . . . . Capitalization of reserves(4) 236,668,596 A0.31 per share 2,366,685.96 73,367,264.76October 1, 2003 . . . . . . Leveraged re-capitalization(5) 236,668,596 A2.50 per share 518,304,225.24 591,671,490.00November 10, 2003 . . . . Leveraged re-capitalization(5) 236,668,596 A0.50 per share (473,337,192.00) 118,334,298.00December 23, 2003 . . . . Issue of shares(6) 236,925,277 A0.50 per share 128,340.50 118,462,638.50December 22, 2004 . . . . Issue of shares(7) 238,260,129 A0.50 per share 667,426.00 119,130,064.50December 21, 2005 . . . . Issue of shares(8) 240,692,002 A0.50 per share 1,215,936.50 120,346,001.00December 20, 2006 . . . . Issue of shares(9) 242,067,916 A0.50 per share 687,957.00 121,033,958.00October 15, 2007 . . . . . . Capitalization of reserves(10) 363,101,874 A0.50 per share 60,516,979.00 181,550,937.00November 20, 2007 . . . . Issue of shares(11) 363,738,357 A0.50 per share 318,241.50 181,869,178.50February 28, 2008 . . . . . Issue of shares(12) 364,563,189 A0.50 per share 412,416.00 182,281,594.50May 13, 2008 . . . . . . . . Issue of shares(13) 365,373,700 A0.50 per share 405,255.50 182,686,850.00August 7, 2008 . . . . . . . Issue of shares(14) 365,402,097 A0.50 per share 14,198.50 182,701,048.50August 28, 2009 . . . . . . Issue of shares(15) 365,407,848 A0.50 per share 2,875.50 182,703,924.00October 16, 2009 . . . . . . Capitalization of reserves(16) 365,407,848 A1.50 per share 548,111,772.00 730,815,696.00October 16, 2009 . . . . . . Re-capitalization(16) 365,407,848 A1.50 per share (548,111,772.00) 182,703,924.00November 23, 2009 . . . . Issue of shares(17) 365,539,075 A0.50 per share 65,613.50 182,769,537.50February 26, 2010 . . . . . Issue of shares(18) 365,702,429 A0.50 per share 81,677.00 182,851,214.50May 17, 2010 . . . . . . . . Issue of shares(19) 365,864,092 A0.50 per share 80,831.50 182,932,046.00August 24, 2010 . . . . . . Issue of shares(20) 365,966,792 A0.50 per share 51,350.00 182,983,396.00November 25, 2010 . . . . Issue of shares(21) 366,136,440 A0.50 per share 84,824.00 183,068,220.00
(1) Issued in connection with the absorption by way of merger of 3I S.A., previously a wholly owned subsidiary of The Kar-TessGroup, by us. The merger, which became effective on April 3, 2000, involved the simultaneous issuance of 17,035,610 ofour ordinary shares to The Kar-Tess Group and the cancellation of 17,034,274 of our ordinary shares held by 3I S.A. at thetime.
(2) Issued pursuant to the scheme of arrangement for the acquisition of Coca-Cola Beverages plc. This increase was initiallyapproved by the extraordinary general meeting of our shareholders held on April 19, 2000, which authorized an increase inour share capital of up to A33,000,242.70 depending on the amount actually paid up. The extraordinary general meeting ofour shareholders held on August 9, 2000 determined this amount to be A27,506,899.49 and amended the articles ofassociation accordingly.
(3) Approved at an extraordinary general meeting of our shareholders held on November 22, 2001, in connection with aresolution to increase the par value of our shares from GRD100, or A0.29, to GRD102.225 or A0.30, in order to convert ourshare capital to euro as required by Greek law. The amount of the share capital increase was paid through thecapitalization of a share premium reserve of A1,545,378.21 in our financial statements for the year ended December 31,2001.
(4) Approved at the annual general meeting of our shareholders held on May 20, 2002, in connection with a resolution toincrease the par value of our shares from A0.30 to A0.31, in order to increase our share capital by the amount ofA2,366,685.96, which resulted from a revaluation of our land and buildings as required by Article 21 of Law 2065/92.
156
(5) On August 19, 2003, we announced our intention to effect a leveraged re-capitalization with a view towards improving theefficiency of our capital structure. In connection with the leveraged re-capitalization, we held an extraordinary generalmeeting on September 15, 2003, which approved a share capital increase through the capitalization of A518,304,225.24 ofadditional paid-in capital (reflecting an increase of the par value of ordinary shares from A0.31 to A2.50 per ordinary share).This capital increase was approved by the Greek Ministry of Development on September 24, 2003 and consummated onOctober 1, 2003 with the payment of certain related taxes. On October 1, 2003, our board of directors called a secondextraordinary general meeting which took place on October 31, 2003 and which approved a share capital decrease ofA473,337,192.00 (reflecting a decrease of the par value of ordinary shares from A2.50 to A0.50 per ordinary share) and thereturn of A2.00 per ordinary share to all of our shareholders. The capital decrease was approved by the Greek Ministry ofDevelopment on November 10, 2003 and the Athens Exchange was duly notified at its board meeting of November 14,2003. The capital return payment to our shareholders began on December 5, 2003. As at December 31, 2003, A472.9 millionhad been returned to our shareholders. The leveraged re-capitalization resulted in a capital return of A2.00 per ordinaryshare to all of our shareholders. The capital return and the payment of taxes and related expenses of A4.0 million werefinanced with the net proceeds from the offering of $900.0 million notes. We issued these notes in September 2003, throughour wholly owned subsidiary Coca-Cola HBC Finance B.V. by means of a private, in the United States, and offshoreplacement in an aggregate principal amount of $500.0 million due in 2013 and in an aggregate principal amount of$400.0 million due in 2015. In December 2003, we made an exchange offer in order to effect the exchange of the privatelyplaced notes for similar notes registered with the SEC. Acceptances under the offer, which was finalized in February 2004,were $898.1 million.
(6) On December 23, 2003, our board of directors resolved to increase our share capital by 256,681 ordinary shares, followingthe exercise of stock options by option holders pursuant to our stock option plans. Total proceeds from this issue of shareswere A3,371,556.03.
(7) On December 22, 2004, our board of directors resolved to increase our share capital by 1,334,852 ordinary shares, followingthe exercise of stock options by option holders pursuant to our stock option plans. Total proceeds from this issue of shareswere A19,211,254.97.
(8) On December 21, 2005, our board of directors resolved to increase our share capital by 2,431,873 ordinary shares, followingthe exercise of stock options by option holders pursuant to our stock option plans. Total proceeds from this issue of shareswere A36,655,271.38.
(9) On December 21, 2006, our board of directors resolved to increase our share capital by 1,375,914 ordinary shares, followingthe exercise of stock options by option holders pursuant to our stock option plans. Total proceeds from this issue of shareswere A22,634,670.71.
(10) Our shareholders approved on October 15, 2007 a share capital increase of A60,516,979 through the partial capitalization ofshare premium and the issuance of 121,033,958 new ordinary bearer shares. The new shares were delivered to ourshareholders in a ratio of one (1) new share for every two (2) existing shares. Following the completion of the above sharecapital increase our share capital amounted to A181,550,937, divided into 363,101,874 shares of a nominal value of A0.50each. On October 24, 2007, the Greek Ministry of Development approved the share capital increase and we filed requireddocuments with the Hellenic Capital Markets Commission and the Athens Exchange. On November 8, 2007, the AthensExchange approved the bonus issuance. According to Greek capital markets legislation, shareholders entitled to receive thebonus shares were those holding our shares at the closing of trading on November 13, 2007. Our shares opened on anadjusted basis on November 14, 2007. The new shares were credited to the SAT accounts of the shareholders and begantrading on November 20, 2007. We retroactively reflected the stock split in our historical basic and diluted earnings pershare when the stock split was effected.
(11) On November 20, 2007, our board of directors resolved to increase our share capital by 636,483 ordinary shares, followingthe exercise of stock options by option holders pursuant to our stock option plans. Total proceeds from the issue of shareswere A8,677,840.
(12) On February 28, 2008, our board of directors resolved to increase our share capital by 824,832 ordinary shares, followingthe exercise of stock options by option holders pursuant to our stock option plans. Total proceeds from the issue of shareswere A11,641,787.
(13) On May 13, 2008, our board of directors resolved to increase our share capital by 810,511 ordinary shares, following theexercise of stock options by option holders pursuant to our stock option plans. Total proceeds from the issue of shares wereA9,218,941.
(14) On August 7, 2008, our board of directors resolved to increase our share capital by 28,397 ordinary shares, following theexercise of stock options by option holders pursuant to our stock option plans. Total proceeds from the issue of shares wereA325,343.
157
(15) On August 11, 2009, our board of directors resolved to increase our share capital by 5,751 ordinary shares, following theexercise of stock options by option holders pursuant to our stock option plans. Total proceeds from the issue of shares wereA64,042.
(16) On September 18, 2009, we announced proposals for a re-capitalization, which resulted in a capital return of A548.1 millionto our shareholders, i.e. A1.50 per share. At the extraordinary general meeting held on October 16, 2009, our shareholdersapproved an increase of our share capital by A548.1 million, through the partial capitalization of share premium and anincrease in the nominal value of each share by A1.50 per share. At the same extraordinary general meeting, ourshareholders also approved the decrease of our share capital by A548.1 million, through a reduction of the nominal value ofthe shares by A1.50 per share and an equal amount of capital was returned to the shareholders in cash. Followingshareholders and regulatory approval, we realized the capital return on December 2, 2009.
(17) On November 10, 2009, our board of directors resolved to increase our share capital by 131,227 ordinary shares, followingthe exercise of stock options by option holders pursuant to our stock option plans. Total proceeds from the issue of shareswere A1,702,869.
(18) On February 9, 2010, our board of directors resolved to increase our share capital by 163,354 ordinary shares, following theexercise of stock options by option holders pursuant to our stock option plans. Total proceeds from the issue of shares wereA1,540,582.
(19) On May 4, 2010, our board of directors resolved to increase our share capital by 161,663 ordinary shares, following theexercise of stock options by option holders pursuant to our stock option plans. Total proceeds from the issue of shares wereA1,656,788.
(20) On August 3, 2010, our board of directors resolved to increase our share capital by 102,700 ordinary shares, following theexercise of stock options by option holders pursuant to our stock option plans. Total proceeds from the issue of shares wereA891,368.
(21) On November 2, 2010, our board of directors resolved to increase our share capital by 169,648 ordinary shares, followingthe exercise of stock options by option holders pursuant to our stock option plans. Total proceeds from the issue of shareswere A1,644,777.
B. Memorandum and Articles of Association
Term, object and purposes
We are incorporated under the name Coca-Cola Hellenic Bottling Company S.A. and we areregistered in Greece in the Registry of Societes Anonymes under number 13630/06/B/86/49. The termof our company expires on December 31, 2070, but it can be extended by shareholders’ resolution.Article 2 of our articles of association provides that our object includes the establishment of plants inGreece and abroad, the production and packaging in all types of packaging of the products of TheCoca-Cola Company, the production, distribution, trading, import and export in any kind of packagingof any other refreshments, natural juices, water and, in general, food and beverage products, as well asany goods and items, including packaging materials, bearing the trademarks of such products and theprovision of administrative and related services to our subsidiaries and other related affiliates.
158
Dividends
Determination of dividends
We distribute dividends out of our non-consolidated profit after tax as determined under IFRS.This is in line with EU regulation and enacted Greek legislation has provided that Greek publicly-traded companies must prepare their statutory financial statements in accordance with IFRS, effectivefor the fiscal year commencing January 1, 2005. Dividends may only be distributed after an amountbetween 5% and 30% of our adjusted after-tax profit has been deducted for the formation of a reserveaccount. We make deductions until the amount of the reserve equals one-third of our authorized sharecapital. After we have made the relevant deductions, we are required to pay dividends which must beat least 35% of our adjusted after-tax profit (on an unconsolidated basis) after subtracting anyallocation to the abovementioned statutory reserve account and any gains arising from the disposal of a20% or more shareholding in a subsidiary held by us for a period exceeding 10 years. This statutoryprovision may be overridden in certain circumstances, subject to obtaining the necessary supermajorityapproval by our shareholders.
We may distribute any profit after tax not otherwise distributed by way of dividend to ourshareholders if this is approved by a majority of our shareholders at a general meeting following aproposal from our board of directors.
The amount distributed to shareholders may not exceed the aggregate of the accumulated earningsand any reserves approved for distribution by the shareholders, less the amount required to be retainedas a reserve under Greek law and our articles of association. We may not distribute dividends to theextent that it would reduce our shareholders’ equity below the aggregate of our paid-up share capitaland any statutory reserves.
Interim dividends
We may declare interim dividends only if:
• at least 20 days prior to the date of distribution, an unaudited accounting report prepared byour board of directors reflecting our financial position as of a reasonably recent date ispublished in an Athens daily newspaper which, in the board of directors’ opinion, has asufficiently large national circulation;
• the accounting report is published 20 days prior to the distribution in the Greek Bulletin forSocietes Anonymes and Companies with Limited Liability of the Governmental Gazette; and
• the accounting report is submitted to the competent supervisory authority.
Interim dividends so distributed may not exceed one half of the profit after tax shown in theaccounting report.
Payment of dividends
Dividends must be paid to our shareholders on a date fixed either by our shareholders at a generalmeeting or by our board of directors, if the board has been so authorized by our shareholders. Thepayment date must commence within three working days from delivery by Hellenic Exchange S.A. ofthe file that contains the names of the persons entitled to receive the dividend, as specified in theOperating Regulation of the SAT and the Regulation of the Athens Exchange. Any dividend that hasremained unclaimed for five years from the date of its declaration will be forfeited to the benefit of theHellenic Republic and cease to remain owed by us.
159
Undistributed dividends
There are provisions of Greek law providing for a minimum cash dividend that we are obliged todistribute if we have profits on an unconsolidated basis. Such minimum dividend must be at least 35%of our profit after tax on an unconsolidated basis. We may decide not to distribute dividends followinga shareholders’ resolution passed by a supermajority of at least 65% of our paid up share capital.However, in case of such a 65% supermajority, the undistributed amount of the minimum dividends istransferred to a special reserve account and must be capitalized and converted into new ordinary shareswithin four years from the creation of the account for delivery as bonus shares to our shareholdersregistered as at the date of the conversion in proportion to the number of ordinary shares held by eachshareholder at the conversion date. We may not distribute dividends and not make any transfer to aspecial reserve account in case a shareholders’ resolution is passed by a supermajority of at least 70%.
Liquidation rights
Upon liquidation, our net assets must be distributed to our shareholders in cash and in proportionto the number of ordinary shares held by each of them.
Shareholders’ meetings and notices
As a general matter, the board of directors convenes the annual general meeting and determinesthe items on the agenda. However, shareholders holding 5% or more of our paid-up share capital alsohave the right to convene an extraordinary general meeting of our shareholders. You should read‘‘Rights of major shareholders’’ below for additional information on the rights of our majorshareholders. The annual general meeting must be held once a year within the first six monthsfollowing the end of our fiscal year. The Company Law provides that the general meeting of listedcompanies may be held in the municipality of Athens, where the Athens Exchange is seated. Theannual general meeting:
• approves the financial statements for the preceding fiscal year;
• approves the management and the auditors’ report;
• votes to release the members of the board of directors from any liability incurred from theirmanagement or the auditors from any liability incurred from their audit;
• votes on the distribution of dividends;
• votes on the appointment of the auditors for the next financial year; and
• decides on any other matter on the agenda.
The invitation to attend a general meeting must be submitted to the Ministry of Development forpublication in the Government Gazette and is posted on the company’s website. A summary of theinvitation must be published at least twenty calendar days prior to the date of the meeting (the date ofpublication and the date of convocation being excluded) in a daily newspaper published in Athenswhich, in the board of directors’ opinion, has a sufficiently large national circulation, in one of the dailyfinancial papers determined by the Minister of Development and in one local paper published in theprefecture of our registered offices. The invitation summary of the must state the place, date and timeof the meeting as well as the items on the agenda. The invitation for an adjourned meeting must bepublished in the newspapers determined by the Minister of Development at least ten calendar daysprior to the date of the meeting. In the event that the initial invitation specifies the place and time ofthe reiterative meetings of the general meeting it is not necessary to publish a new invitation. Theinvitation does not set forth management’s or any other party’s proposals relating to the items on theagenda.
160
Extraordinary general meetings may be convened:
• by the board of directors if required by law;
• at any other time when a meeting is considered necessary by the board; or
• pursuant to a request submitted by the holders of 5% or more of our paid-up share capital.
As a foreign private issuer, we will generally be exempt from the proxy rules contained in the USSecurities Exchange Act of 1934, requiring US issuers to comply with notice and disclosurerequirements relating to the solicitation of proxies for shareholders meetings. The notice of orinvitation to attend the general meeting of the shareholders of a Greek company typically sets forthonly the items on the agenda for such meeting and it does not include management’s recommendationswith respect to such items. As a result, if you participate in a general meeting of our shareholdersthrough a representative, you may not be able to give him or her voting instructions with advanceknowledge of management’s position on the items included in the agenda for that meeting.
Voting rights
Every ordinary share gives its holder the right to vote. Unless a poll is requested in accordancewith our articles of association, votes are taken on a show of hands. At the request of shareholdersrepresenting 5% or more of our paid-up share capital, resolutions must be passed by poll. The mannerand form of the casting of votes at a general meeting are determined by the chairman of the generalmeeting in accordance with our articles of association. Greek law does not permit cumulative voting.
There are no limitations imposed by Greek law or the articles of association on the right ofnon-residents or foreign persons to hold or vote our ordinary shares other than those limitations thatwould generally apply to all shareholders.
Conditions
Under Greek law:
• each shareholder may participate in any general meeting either in person or through arepresentative. Persons under age or under judicial supervision and legal entities must berepresented by their legal representatives (documents of representation need not be notarized,as long as they are dated and signed by the person issuing them);
• persons who appear as shareholders on the records of ‘‘HELLENIC EXCHANGES S.A.’’(‘‘HELEX’’) at the beginning of the fifth day (record date) preceding the General Meeting areentitled to participate in such General Meeting, provided that written confirmation by HELEXto that effect is submitted to the company not later than three day prior to the GeneralMeeting.
• eligible shareholders may participate in the General Meeting in person or by proxy. Eachshareholder may appoint up to three proxies. The completed and signed proxy statement mustbe submitted to the company at least three days prior to the General Meeting.
• failure by a shareholder to comply promptly with the procedures described above deprives theshareholder of his or her right to participate in a general meeting, unless the general meetingpermits otherwise; and
• twenty-four hours prior to any general meeting, a list of shareholders having the right to vote atthe meeting and/or their representatives must be prominently displayed at our registered office.The list must indicate the names of the shareholders and of their representatives, if any, theiraddresses and the number of ordinary shares and votes held by each of them.
161
Ordinary quorum and voting majority
The quorum necessary for a valid general meeting is one-fifth of the paid-up share capital. Thereis no minimum quorum required for an adjourned meeting held twenty days following the generalmeeting that did not meet the quorum requirement. Resolutions may be validly passed by an absolutemajority (50% plus one) of the share capital present and entitled to vote. In the absence of a quorum,the general meeting is adjourned.
Matters requiring extraordinary quorum and supermajority approval
A quorum of 67% of the holders of our share capital and a supermajority of two-thirds of theshare capital present and entitled to vote, provided that such vote exceeds 50% of the company’sshares, is required to pass resolutions concerning the following matters:
• a merger;
• decreases and increases in share capital;
• issuance of any convertible bonds;
• the decision not to distribute dividends where the minimum dividend required to be paid is 35%of our profit after tax;
• the distribution of dividends and any change in the method of distribution of dividends;
• any increase in shareholders’ obligations;
• any restrictions or the abolition of pre-emptive rights;
• any change of our registered offices;
• any change in our country of incorporation;
• the establishment of extraordinary reserve funds or other reserve funds in excess of thecompulsory reserve fund required pursuant to our articles of association and Greek law;
• our dissolution and the appointment of a receiver, trustee or custodian for our company or anypart of our assets;
• any change to our term, objects and purposes; and
• any change in our articles of association.
In the absence of the 67% quorum, the general meeting is adjourned, the next meeting requires aquorum of 55% and, if this is not met either, a third meeting is convened to which a quorum of 50%plus one applies.
Our articles of association provide that any amendment to such articles that would change therights of its shareholders is subject to the extraordinary quorum and supermajority approvalrequirements described above. However, certain fundamental shareholder rights, including the right tovote, the right to participate in a general meeting, the right to receive dividends and liquidation rights,are expressly provided for by Greek law and cannot be revoked or modified by the general meeting ofshareholders.
Action by written consent
Resolutions of the board of directors may be taken by written consent.
162
Rights of major shareholders
Under Greek corporate law shareholders holding 5% or more of our paid-up share capital havethe right to:
• apply to the board of directors asking to convene a general meeting;
• once postpone a resolution (or resolutions) of an annual or extraordinary general meeting for nomore than thirty days;
• demand from the board of directors to include additional topics to the agenda of the generalmeeting already convened. The application of the shareholders must be notified to the board ofdirectors 15 days prior to the day of the general meeting;
• five days prior to the day of an annual general meeting, request from the board of directorsinformation concerning any amount paid by us within the two most recent years to members ofthe board, or our management, as well as details of any other consideration paid to suchpersons.
• request from the board of directors to provide drafts of resolutions for each of the items on theinitial or the revised agenda of a General Meeting at least seven days prior to the such GeneralMeeting. The board of directors must make these available to the shareholders at least six daysprior to the General Meeting.
Furthermore, any shareholder may request from the board of directors to provide at the generalmeeting any specific information related to the affairs of the company, as long as they are relevant anduseful for the assessment of the items of the agenda of the general meeting. Such request must bemade at least five days prior to the general meeting.
The board of directors may refuse to disclose the requested information for good and substantialreasons, which must be set forth in the minutes of the general meeting. On the other hand, if, forexample, we were a Delaware company, any of our shareholders, irrespective of the size of his or hershareholdings, would have the right to inspect our books and records and make copies of suchdocuments; and request a competent court to review our operations if the shareholder believes that thecompany is not being managed properly.
Shareholders holding 33% of the company’s share capital represented in a general meeting mayoppose the approval of any other contract of any nature between the company and the management,the persons controlling the company, their relatives up to the third degree and any legal entitycontrolled by them. Such restriction is not applicable to contracts that are within the usual businesspractice of the company. The approval of the general meeting may be granted at a later stage followingthe signing of the contract. However, the approval may not be granted if shareholders holding 5% ormore of the company’s shareholding represented in the general meeting object to the decision.
Shareholders holding 10% or more of our paid-up share capital have the right to object to theapproval by our shareholders at a general meeting of any remuneration or compensation granted to thedirectors not expressly provided for by Greek law or our articles of association.
163
Shareholders holding 20% or more of our paid-up share capital have the right to object to aresolution of a general meeting concerning the settlement or waiver by us of any claim for damagesagainst any of our directors. Finally, shareholders holding 20% or more of our paid-up share capitalhave the right to request from the board of directors, five days prior to the day of a general meeting,particular information relating to the conduct of our corporate affairs and our financial condition. Theboard of directors may refuse to give such information for good and substantial reasons (including theirrepresentation in the board of directors of the company), which must be set forth in the minutes of thegeneral meeting. Furthermore, shareholders holding 20% or more of our paid-up share capital have theright to petition at any time a competent court to order an audit in connection with a possiblemismanagement of our corporate affairs. The petitioners must show probable cause before the courtwill order an audit. A similar right is available to shareholders holding 5% or more of our paid-upshare capital with respect to alleged breaches of the law, our articles of association or decisions of thegeneral meeting. Such shareholders must petition the court within three years from the approval of thefinancial statements for the year in which the alleged breaches occurred.
Shareholder appointment of directors
Under Greek law, the articles of association of a Greek company may grant a specific shareholderor shareholders the right to appoint, without election at a general meeting, their representatives to theboard of directors up to an aggregate of no more than one-third of the total number of boardmembers. Our articles of association do not currently provide for any such special appointments.
Removal of directors
Under Greek law, directors may be removed at any time by a resolution approved by a simplemajority of shareholders present at a general meeting. Directors appointed by shareholders may beremoved at any time by the shareholders who appointed them. Our articles of association do notcurrently provide for any such special appointments. Furthermore, shareholders representing at least10% of our paid-up share capital may request the court to dismiss a director for a serious breach ofduty.
Board of directors
Our board of directors is appointed by our shareholders at a general meeting for a three-yearterm.
Directors’ liability
In accordance with Greek law, directors who negligently or deliberately inflict damage or losses onour company in connection with the performance of their duties, especially relating to the preparationof the annual financial statements, are liable to us for such damage. The annual general meetingcustomarily releases our directors from liability, but the shareholders may retain specific claims, inconnection with the approval of the annual financial statements provided that such release is limited tothe general management of our company during the fiscal year of approved accounts. In addition, ageneral meeting may release a director from liability for any specific claims we may have against him orher, provided that two years have already lapsed since the cause of action arose against the directorand a minority representing at least 20% of our paid-up share capital represented in the company’sannual general meeting does not object to such resolution. In contrast, most US federal and state lawsprohibit a company from releasing a director from liability if he or she has acted in bad faith or hasbreached his or her duty of loyalty.
164
In general, actions for damages as against directors for loss incurred by the company are exercisedunder Greek law through the company, rather than through derivative actions, a remedy typicallyavailable to shareholders of US companies. However, under certain circumstances the shareholders of aGreek company may have the right to bring an action against directors on behalf of the company. Ourboard of directors may decide by a simple majority to bring an action on behalf of us against any of itsmembers. In addition, if our shareholders so resolve at a general meeting by an absolute majority, or ifshareholders representing 10% of our paid-up share capital so request, we are under an obligation tobring a claim for damages against members of the board of directors for mismanagement of corporateaffairs within six months either from the day of the general meeting or from the day such request issubmitted to us. We are then represented in court by special independent representatives appointedeither at a general meeting or by the court.
The application of the abovementioned minority shareholders is executed only after they provideevidence that they have had the shareholder capacity for at least three months before filing theapplication.
We have obtained insurance against our executive officers’ and directors’ potential liability underUS securities laws.
Issue of share capital
Subject to the pre-emptive rights contained in our articles of association, our share capital may beincreased by a resolution of the shareholders. A quorum of 67% of the holders of our share capital anda supermajority of 67% of the share capital present, provided that such vote exceeds 50% of ourshares, and entitled to vote is required to pass the resolution.
Issue of shares for non-cash consideration
Greek corporate law requires a valuation of non-cash assets offered as payment for an issue ofshares. Under Greek law, a commission set up by the Greek Ministry of Development must determinethe value of the assets. Under certain conditions specified in article 9a of Codified Law 2190/1920, suchvaluation may not be required.
Issue of shares in connection with a business combination
We are required to obtain approval from the Ministry of Development and the Athens Exchange,if we decide to increase our share capital for any reason (other than pursuant to a stock optionexercise), including for the purpose of a merger with another company or for the acquisition of sharesin another company, in which case the Ministry of Development or the Athens Exchange is more likelyto undertake a substantive review of the proposed transaction.
Pre-emptive rights and appraisal rights
Under Greek law, all share capital increases, including increases in the form of convertible bondsbut excluding those for non-cash consideration, must be offered first on a pre-emptive basis to ourexisting shareholders. Pre-emptive rights may only be waived or restricted by a resolution of the generalmeeting upon delivery of a written report from the board of directors justifying the reasons for theproposed waiver. A quorum of 67% of the holders of our share capital and a supermajority of 67% ofthe share capital present (following the amendment of our articles of association) and entitled to voteis required to pass the resolution. Shareholders of many US companies typically have no pre-emptiverights. For example, under Delaware law shareholders have no pre-emptive rights unless these rightsare specifically granted in a Delaware company’s certificate of incorporation.
165
Unlike the shareholders of a US company, under Greek law our shareholders have no appraisalrights in connection with merger transactions involving us.
Rights issues
The time period for the exercise of rights under a rights issue is fixed by a resolution of thegeneral meeting and may not be less than 15 days, during which time our ordinary shares must betraded on the Athens Exchange. All new shares not acquired by our shareholders may be allocated bythe board of directors in its sole discretion and may be offered to non-shareholders at a price that is atleast equal to that of the rights issue.
Rights of purchase and redemption of our ordinary shares
Under Greek law, we are prohibited from acquiring our own ordinary shares, except:
• in connection with a redemption or reduction of our share capital or as a result of a sharebuyout;
• if ordered by a law or a court order for the purpose of repaying our debts or protecting minorityshareholders in case of merger, change of corporate objective, etc;
• with respect to ordinary shares which have been donated to us by a shareholder;
• as a result of a transfer of all of our assets; or
• in the context of a purchase of ordinary shares for the purpose of distributing them to ouremployees or to the employees of one of our affiliates; or
• if acquired by forced execution for the repayment of a claim to the company.
We may also acquire our ordinary shares up to a maximum of 10% of our share capital after aresolution of the company’s general meeting approving such acquisition. The shareholders resolutionmust specify the maximum number of ordinary shares to be purchased, the high and low prices atwhich we may purchase the ordinary shares and the time period of the redemption program, which maynot exceed 24 months from the date of the resolution. The shareholders resolution must beimmediately notified to the Athens Exchange and in the Athens Exchange Daily Official List at least 2business days before the start of the time period of the redemption program. The board of directorsmay decide to acquire the shares in stages within the time period and upper limit set by the generalmeeting of shareholders upon prior notification of the Athens Exchange and publication of the relevantboard resolution in one political and one financial newspaper. Under Greek law, we are required tofund a share buy-back exclusively from funds that could be distributed to shareholders as dividends.
The day following the expiration of the time period during which we may be authorized topurchase our ordinary shares, we must submit to the Hellenic Capital Markets Commission and theAthens Exchange a statement setting forth the number of ordinary shares acquired, the averageacquisition price, the total number of treasury shares as at that date, as well as the percentage of sharecapital which corresponds to this number. This information is published in the Athens Exchange DailyOfficial List and is disclosed to our shareholders at the following general meeting. The purchasedshares must be fully paid-up and acquired from the broad investing public. Any ordinary shares soacquired must be sold within three years of purchase, which may be extended for a further two yearsupon application to the Hellenic Capital Markets Commission, or otherwise must be cancelled. Boththe decision to sell and the decision to cancel such shares must be communicated to the AthensExchange. All ordinary shares so acquired do not have voting rights and are not taken into account forthe purpose of assessing a quorum.
166
Dividends of such shares increase additionally the dividend of the other shareholders of thecompany. In the event of a capital increase, the pre-emption right of these shares is not exercised andincreases the pre-emption right of the rest of the shareholders.
As a general matter, in light of the restrictions on the ability of a Greek company to repurchase itsown shares under Greek law described above, we are subject to a share repurchase regime that couldbe more restrictive than that applicable to US companies.
Disclosure of interests in shares
Under Greek law, any person who acquires or sells, directly or indirectly, shares, as a result ofwhich the percentage of such person’s voting rights reaches, directly or indirectly, exceeds or falls belowthe limits of 5%, 10%, 15%, 20%, 25%, 1⁄3, 50% or 2⁄3 of our total voting rights, will have to inform usand the Athens Exchange in writing by submitting a specific standard form within three trading days ofthe date of acquisition or sale. The shareholder is deemed by law to be aware of the sale or acquisitionon the second trade day after such sale or acquisition.
A similar obligation exists for a shareholder who owns more than 10% of our total voting rightswhen the percentage of the shareholder’s voting rights is increased or decreased by 3% or more.
Adoption of anti-takeover measures by our board of directors
Unlike the laws of many states in the United States, Greek law prevents directors from adoptinganti-takeover measures in the case of a hostile bid, including the implementation of a shareholderrights plan or a so-called ‘‘poison pill’’, without prior shareholder approval. In addition, there is noprovision in our articles of association that will have the effect of delaying, deferring or preventing achange of control.
C. Material Contracts
You should read Item 5, ‘‘Operating and Financial Review and Prospects,’’ and Item 7, ‘‘MajorShareholders and Related Party Transactions—Related Party Transactions’’ for a discussion of ourmaterial contracts, as well as Item 19, ‘‘Exhibits’’ for a list of our material contracts.
D. Exchange Controls
There are currently no exchange controls in Greece that would restrict the payment of dividendsor other capital distributions to a holder of ordinary shares or ADSs outside Greece, and there arecurrently no restrictions in Greece that would affect the right of a non-Greek holder of ordinary sharesor ADSs to dispose of his or her shares or ADSs, as the case may be, and receive the proceeds of suchdisposal outside Greece.
All forms of capital movement in and out of Greece have been deregulated. Foreign investors maypurchase securities listed on the Athens Exchange, as well as Greek government bonds and treasurybills. Repatriation of capital and dividends and any other income on securities is fully deregulated.
Potential purchasers of listed companies’ shares should consult their professional advisers inconnection with the internal procedures and requirements established by credit institutions in Greecewith regard to such repatriation.
167
E. Taxation
Greek taxation
Introduction
The following is a summary of material Greek tax considerations that may be relevant to theownership and disposition of the ordinary shares. The summary does not purport to be nor should it berelied upon as a comprehensive description or analysis of all the tax considerations which may berelevant to a decision to hold the ordinary shares or ADSs.
This summary is based on tax laws and regulations in effect in Greece on the date of this annualreport which are subject to change without notice. Potential purchasers should consult their own taxadvisers concerning the overall Greek tax (including Greek capital gains, inheritance or succession, andgift tax), possible changes therein, or other tax consequences of the ownership and disposition of theordinary shares or ADSs.
Corporate taxation
The profit before tax of Greek societe anonymes had been taxed at a flat rate of 35% until 2004.The rate was reduced to 32% for 2005, to 29% for 2006, and to 25% for 2007 up to and including2009. The 2010 tax law provided that with effect for financial statements of years ending onDecember 31, 2010 and onwards, two separate corporate tax rates would apply for non-distributed anddistributed profits of Greek societe anonymes. Non-distributed profits would be taxed at 24%, graduallyreduced by 1% per financial year from 2011 through to 2014, when it would be finally set at 20%whereas distributed profits would be taxed at 40%. Therefore, based on the 2010 tax law, the tax rateon non-distributed profits for 2010 tax year had been set at 24%.
The 2011 tax law abolishes the 40% corporate tax rate on distributed profits, introduces a dividendwithholding tax (refer to the following item ‘‘Taxation on dividends’’) and provides that for accountingyears starting as of January 1, 2011 and onwards the corporate tax rate will be decreased from 24% to20%.
The 2011 tax law also provides exemption from corporate income tax of inbound dividends thatGreek societe anonymes and limited liability partnerships receive from qualifying investments in EUsubsidiaries on condition that such dividends are recorded in a special tax free reserve account. Suchtax free reserve will be subject to dividend withholding tax upon distribution to the shareholders orcapitalization.
Taxation of dividends
Dividends (including shares allocated to shareholders from capitalized profits or reserves, butexcluding the capitalization of share premium reserve or certain other reserves), distributed by Greeksociete anonymes were subject to withholding tax at 10%. This withholding tax applied to distributionsapproved by the general meetings of shareholders of Greek societe anonymes held on or afterJanuary 1, 2009. Certain exceptions to this withholding tax requirement exist for qualifyingshareholders. Because of the specific nature of these exceptions, we recommend to obtain professionaltax advice for guidance.
168
The 2010 tax law provided that dividend income deriving from financial statements of years endingon or after December 31, 2010 were not subject to withholding tax. When earned by Greek tax residentindividuals, such dividend income would be taxed as normal income and the tax paid at the level of thesociete anonyme would be credited against the income tax due. In case that the net profit of a Greeksociete anonyme also included profits deriving from its participation in other Greek corporate entities,which had also been subject to the 40% tax, the part of the tax that was already paid andcorresponding to these profits would be deducted from the 40% tax due.
The 2011 tax law introduces a withholding tax on dividends. On this basis the distribution ofprofits approved by the general meetings of the shareholders as from January 1, 2012 and onwards willbe subject to withholding tax at 25% while the distribution of profits approved in 2011 will be subjectto a withholding tax of 21%. Such withholding tax extinguishes the beneficiary’s tax liability on therespective income. Individual shareholders resident in Greece may be entitled to a tax refund, if theirmarginal tax rate for the total reported income does not exceed 25%.
Taxation of capital gains
Pursuant to Article 38 of Law 2238/94, capital gains resulting from the sale of securities listed onthe Athens Exchange that have been acquired before January 1, 2011 are tax exempt as follows:
Capital gains resulting from the sale of shares by entities incorporated in Greece (excluding banks)or foreign entities operating in Greece through a permanent establishment that maintain double entryaccounts are not subject to income tax, as long as such gains are maintained in a special reserveaccount. In case of subsequent distribution of the reserve or dissolution of the entity, these gains willbe added to the account of the entity and taxed accordingly.
Capital gains from the sale of listed shares earned by Greek or foreign resident individuals andentities incorporated in Greece or foreign entities operating in Greece through a permanentestablishment, without obligation to maintain double entry accounts, are exempt from taxation. Foreignentities not operating in Greece through a permanent establishment are also exempt from Greek tax oncapital gain from the sale of listed shares on the Athens Stock Exchange.
Pursuant to Article 38 of Law 2238/94, capital gains from the sale of securities listed on foreignstock exchanges, earned by Greek individuals or legal entities without obligation to maintain doubleentry accounting records are also exempt from taxation. Legal entities that maintain double entryaccounts are not subject to income tax, as long as such gains are maintained in a special reserveaccount. In case of subsequent distribution of the reserve or dissolution of the entities, these gains areadded to the account of the enterprise and taxed accordingly. Capital gains of US holders (as definedbelow in United States Taxation—Introduction) who are not Greek residents on the sale or otherdisposition of the ordinary shares will not be subject to income tax in Greece.
The 2010 tax law amended Article 38 of Law 2238/1994 concerning the tax treatment of the capitalgains that will result from the sale of securities listed on the Athens Exchange or other internationallyrecognized foreign exchanges in respect of securities acquired for whatever reason on or afterJanuary 1, 2011 and provided that any gains arising from the sale of listed shares are exempt fromincome tax, if the shares have been held for a minimum period of twelve months and as long as thegain is maintained in a special reserve account. The 2010 tax law further introduced a withholding taxof 20% or 10% in cases where the shares have been held for a period of less than three months or fora period between three and twelve months respectively.
However, by virtue of a recent Circular (POL1004/3.1.11) of the Ministry of Finance, the above taxtreatment of the gains from the sale of shares acquired on or after January 1, 2011 was suspended witha retrospective effect as from January 1, 2011.
169
The 2011 tax law abolishes the withholding tax on the capital gain from the sale of shares. It alsoprovides that the capital gain from the sale of listed shares acquired on or after January 1, 2012 is fullytaxable as part of the taxable base reported for the year in which such gain/loss arises, while any lossfrom the same reason is tax deductible.
Transfer taxes and charges
A transfer tax is imposed on the sale of securities listed on the Athens Exchange at the rate of0.15% of the sale price. The tax is borne by the seller and is charged by the Central SecuritiesDepositary to brokers, which in turn charge their clients. In addition, a levy is charged to both thepurchaser and the seller by the Central Securities Depositary of approximately 0.08% of the value ofthe transaction to cover settlement costs and a freely negotiable commission and other costs are paid tothe brokers by each of the buyer and seller.
The 2011 tax law provides that from April 1, 2011 onwards, the transfer tax on the sale of sharesas above acquired up to December 31, 2011 will be increased from 0.15% to 0.2%. The transfer tax willnot apply to the sale of shares acquired from January 1, 2012 onwards.
Stamp duty
The issuance and transfer of shares as well as the payment of dividends is exempt from stampduty.
Inheritance or succession taxes
Inheritance or succession taxes are payable in Greece on listed shares of Greek domiciledcompanies or foreign securities at the rates of 0.6% or 1.2% for relatives of first or second degree.With regard to third degree relatives, inheritance or succession taxes are payable on a progressivesystem, the rates of which range from 0% to 40%. The taxable basis for stock exchange listed shares isprescribed in Law 2961/2001, as currently in force (effective up to April 22, 2010).
Following recent amendments in the Code of Taxation of Inheritance and Donations with effectfrom April 23, 2010 onwards, inheritance and succession taxes payable in Greece on listed shares ofGreek domiciled companies or foreign securities are calculated based on tax scales which varyaccording to the degree of kinship (first, second or third degree relatives). With respect to first degreerelatives inheritance or succession taxes are payable on a progressive scale the rates of which rangefrom 0% to 10%, for second degree from 0% to 20% and for third degree from 0% to 40%.
Gift tax (donation taxes)
A similar (to that applying to inheritance) system of taxation applies to the donation of listedshares.
United States taxation
Introduction
This section describes the material United States federal income tax consequences of owningordinary shares or ADSs. It applies to you only if you are a US holder, as defined below, and you holdyour ordinary shares or ADSs as capital assets for tax purposes. This section does not apply to you ifyou are a member of a special class of holders subject to special rules, including:
• a dealer in securities or currencies;
• a trader in securities that elects to use a mark-to-market method of accounting for yoursecurities holdings;
170
• a tax-exempt organization;
• a life insurance company;
• a person liable for alternative minimum tax;
• a person that actually or constructively owns 10% or more of the voting stock of Coca-ColaHellenic Bottling Company S.A.;
• a person that holds ordinary shares or ADSs as part of a straddle or a hedging or conversiontransaction; or
• a person whose functional currency is not the US dollar.
This section is based on the Internal Revenue Code of 1986, as amended, its legislative history,existing and proposed regulations, published rulings and court decisions, all as currently in effect. Theselaws are subject to change, possibly on a retroactive basis. In addition, this section is based in partupon the representations of the Depositary and the assumption that each obligation in the depositagreement and any related agreement will be performed in accordance with its terms.
In general, and taking into account this assumption, for United States federal income tax purposes,if you hold ADRs evidencing ADSs, you will be treated as the owner of the ordinary sharesrepresented by those ADRs. Exchanges of ordinary shares for ADRs, and ADRs for ordinary shares,generally will not be subject to United States federal income tax.
You are a US holder if you are a beneficial owner of ordinary shares or ADSs and you are forUnited States federal income tax purposes:
• a citizen or resident of the United States;
• a United States domestic corporation;
• an estate whose income is subject to United States federal income tax regardless of its source; or
• a trust if a United States court can exercise primary supervision over the trust’s administrationand one or more United States persons are authorized to control all substantial decisions of thetrust.
This section does not apply to you if you are a beneficial owner of ordinary shares or ADSs who isnot a United States person for United States federal income tax purposes.
You should consult your own tax advisor regarding the United States federal, state, local and othertax consequences of owning and disposing of ordinary shares and ADSs in your particularcircumstances. Currently, a reciprocal tax treaty, with a protocol thereto, is in effect between theUnited States and Greece. You should consult your tax advisers with respect to the effect of such treaty(and the protocol thereto) on owning and disposing of ordinary shares or ADSs in your particularcircumstances.
If a partnership holds the ordinary shares or ADSs, the tax treatment of a partner will generallydepend upon the status of the partner and the activities of the partnership. Each such partner havingan interest in the ordinary shares or ADSs is urged to consult his, her or its own tax advisor.
This discussion addresses only United States federal income taxation.
171
Taxation of dividends
Under the United States federal income tax laws, and subject to the passive foreign investmentcompany rules discussed below, if you are a US holder, the gross amount of any dividend paid by usout of our current or accumulated earnings and profits (as determined for United States federalincome tax purposes) is subject to United States federal income taxation. You must include any Greektax withheld from the dividend payment in this gross amount even though you do not in fact receive it.If you are a non-corporate US holder, dividends paid to you in taxable years beginning beforeJanuary 1, 2013 that constitute qualified dividend income will be taxable to you at a maximum tax rateof 15% provided that you hold the ordinary shares or ADSs for more than 60 days during the 121-dayperiod beginning 60 days before the ex-dividend date and meet other holding period requirements.Dividends paid by us with respect to our ordinary shares or ADSs generally will be qualified dividendincome. The dividend is taxable to you when you, in the case of ordinary shares, or the Depositary, inthe case of ADSs, receive the dividend, actually or constructively. The dividend will not be eligible forthe dividends- received deduction generally allowed to United States corporations in respect ofdividends received from other United States corporations.
The amount of the dividend distribution that you must include in your income as a US holder willbe the US dollar value of the euro payments made, determined at the spot euro/US dollar rate on thedate the dividend distribution is includable in your income, regardless of whether the payment is in factconverted into US dollars. Generally, any gain or loss resulting from currency exchange fluctuationsduring the period from the date you include the dividend payment in income to the date you convertthe payment into US dollars will be treated as ordinary income or loss and will not be eligible for thespecial tax rate applicable to qualified dividend income. The gain or loss generally will be income orloss from sources within the United States for foreign tax credit limitation purposes. Distributions inexcess of current and accumulated earnings and profits, as determined for United States federal incometax purposes, will be treated as a non-taxable return of capital to the extent of your basis in theordinary shares or ADSs and thereafter as capital gain.
Dividends will be income from sources outside the United States. Dividend will, depending onyour circumstances, generally be either ‘‘passive’’ or ‘‘general’’ income for purposes of computing theforeign tax credit allowable to you. Subject to certain limitations, the Greek tax withheld and paid overto Greece will be creditable or deductible against your United States federal income tax liability.Special rules apply in determining the foreign tax credit limitation with respect to dividends that aresubject to the maximum 15% tax rate. To the extent a refund of the tax withheld is available to youunder Greek law, the amount of tax withheld that is refundable will not be eligible for credit againstyour United States federal income tax liability.
Taxation of capital gains
Subject to the passive foreign investment company rules discussed below, if you are a US holderand you sell or otherwise dispose of your ordinary shares or ADSs, you will recognize capital gain orloss for United States federal income tax purposes equal to the difference between the US dollar valueof the amount that you realize and your tax basis, determined in US dollars, in your ordinary shares orADSs. Capital gain of a non-corporate US holder is generally taxed at preferential rates where theproperty is held for more than one year. The gain or loss will generally be income or loss from sourceswithin the United States for foreign tax credit limitation purposes.
Passive foreign investment company rules
We believe that our ordinary shares and ADSs should not be treated as stock of a passive foreigninvestment company, PFIC, for United States federal income tax purposes, but this conclusion is afactual determination that is made annually and thus may be subject to change.
172
In general, if you are a US holder, we will be a PFIC with respect to you if for any taxable year inwhich you held our ordinary shares or ADSs: (i) at least 75% of our gross income for the taxable yearis passive income or (ii) at least 50% of the value, determined on the basis of a quarterly average, ofour assets is attributable to assets that produce or are held for the production of passive income.
Passive income generally includes dividends, interest, royalties, rents (other than certain rents androyalties derived in the active conduct of a trade or business), annuities and gains from assets thatproduce passive income. If a foreign corporation owns at least 25% by value of the stock of anothercorporation, the foreign corporation is treated for purposes of the PFIC tests as owning itsproportionate share of the assets of the other corporation, and as receiving directly its proportionateshare of the other corporation’s income.
If we were to be treated as a PFIC, and you are a US holder that did not make a mark-to-marketelection, you would be subject to special rules with respect to: (i) any gain realized on the sale or otherdisposition of ordinary shares or ADSs and (ii) any excess distribution that we make to you (generally,any distributions during a single taxable year that are greater than 125% of the average annualdistributions received in respect of the ordinary shares or ADSs during the three preceding taxableyears or, if shorter, the holding period for the ordinary shares or ADSs).
Under these rules: (i) the gain or excess distribution will be allocated ratably over the holdingperiod for the ordinary shares or ADSs, (ii) the amount allocated to the taxable year in which the USholder realized the gain or excess distribution will be taxed as ordinary income, (iii) the amountallocated to each prior year, with certain exceptions, will be taxed at the highest tax rate in effect forthat year, and (iv) the interest charge generally applicable to underpayments of tax will be imposed inrespect of the tax attributable to each such year. Special rules apply for calculating the amount of theforeign tax credit with respect to excess distributions by a PFIC.
Your ordinary shares or ADSs will be treated as stock in a PFIC if we were a PFIC at any timeduring your holding period in the ordinary shares or ADSs, even if we are not currently a PFIC.
If you own ordinary shares or ADSs in a PFIC that are treated as marketable stock, you may makea mark-to-market election. If you make this election, you will not be subject to the PFIC rulesdescribed above. Instead, in general, you will include as ordinary income each year the excess, if any, ofthe fair market value of your ordinary shares or ADSs at the end of the taxable year over youradjusted basis in your ordinary shares or ADSs. These amounts of ordinary income will not be eligiblefor the favorable tax rates applicable to qualified dividend income or long-term capital gains. You willalso be allowed to take an ordinary loss in respect of the excess, if any, of the adjusted basis of yourordinary shares or ADSs over their fair market value at the end of the taxable year (but only to theextent of the net amount of previously included income as a result of the mark-to-market election).Your basis in the ordinary shares or ADSs will be adjusted to reflect any such income or loss amounts.
In addition, notwithstanding any election you make with regard to the ordinary shares or ADSs,dividends that you receive from us would not constitute qualified dividend income to you if we were aPFIC either in the taxable year of the distribution or the preceding taxable year. Dividends that youreceive that do not constitute qualified dividend income are not eligible for taxation at the 15%maximum rate applicable to qualified dividend income. Instead, you must include the gross amount ofany such dividend paid by us out of our accumulated earnings and profits (as determined for UnitedStates federal income tax purposes) in your gross income, and it will be subject to tax at ratesapplicable to ordinary income.
If you own ordinary shares or ADSs during any year that we are a PFIC, you must file an InternalRevenue Service Form 8621.
173
F. Dividends and Paying Agents
Not applicable.
G. Statement by Experts
Not applicable.
H. Documents on Display
We are subject to the informational requirements of the US Securities Exchange Act of 1934, asthey apply to foreign private issuers, and will file reports and other information with the SEC. As aforeign private issuer, we are exempt from Exchange Act rules regarding the content and furnishing ofproxy statements to shareholders and our officers, directors and principal shareholders are exempt fromthe reporting and a short-swing profit recovery provisions contained in Section 16 of the Exchange Act.The reports and other information can be inspected and copied at the public reference facilities of thePublic Reference Section of the SEC at 100 F Street, N.W., Washington DC 20549, from which youmay also obtain copies at prescribed rates. You may obtain more information concerning the operationof the Public Reference Section of the SEC by calling the SEC at 1-800-SEC-0330. The SEC filings arealso available to the public from commercial document retrieval services and, for filings made on orafter November 4, 2002, at the website maintained by the SEC at www.sec.gov.
We furnish holders of our ordinary shares with annual reports containing consolidated financialstatements audited by independent accountants. We file quarterly financial statements under cover ofForm 6-K. We also furnish other reports as we may determine or as required by law.
I. Subsidiary Information
See Item 4, ‘‘Information on the Company—Organizational Structure’’.
ITEM 11 QUANTITATIVE AND QUALITATIVE DISCLOSURES ABOUT MARKET RISK
You should read Item 5, ‘‘Operating and financial review and prospects—Market risk’’ , as well asnote 30 to our consolidated financial statements included elsewhere in this annual report forquantitative and qualitative disclosures about market risk.
174
ITEM 12 DESCRIPTION OF SECURITIES OTHER THAN EQUITY SECURITIES
Fees and charges payable by a holder of American Depositary Shares
Citibank N.A., as Depositary, collects fees for delivery and surrender of ADSs directly frominvestors or from intermediaries acting for them depositing shares or surrendering ADSs for thepurpose of withdrawal. The Depositary collects fees for making distributions to investors by deductingthose fees from the amounts distributed or by selling a portion of distributable property to pay the fees.The Depositary may generally refuse to provide fee-attracting services until its fees for those servicesare paid.
Persons depositing or withdrawing shares must pay: For:
$5.00 (or less) per 100 ADSs (or portion of • Issuance of ADSs, including issuances100 ADSs) resulting from a distribution of shares or rights
or other property• Cancellation of ADSs for the purpose of
withdrawal, including if the deposit agreementterminates
$5.00 (or less) per 100 ADSs (or portion of • Distribution of deposited securities by the100 ADSs) (A fee equivalent to the fee that Depositary to ADS registered holderswould be payable if securities distributed hadbeen shares and the shares had been depositedfor issuance of ADSs)
$0.02 (or less) per ADS • Any cash distribution to ADS registeredholders
Applicable Registration or transfer fees • Transfer and registration of shares on ourshare register to or from the name of theDepositary or its agent when the holderdeposits or withdraws shares
Applicable Expenses of the Depositary • Cable, telex and facsimile transmissions• Converting foreign currency to US dollars
Applicable Taxes and other governmental charges • As necessarythe Depositary or the custodian have to pay onany ADS or share underlying an ADS, forexample, stock transfer taxes, stamp duty orwithholding taxes
Any charges incurred by the Depositary or its • As necessaryagents for servicing the deposited securities
Fees and other direct and indirect payments made by the Depositary to the Company
A payment of $350,000 was made by the Citibank N.A., as Depositary, to the Company for theyear ended December 31, 2010. During the year ended December 31, 2009, the Depositary was TheBank of New York Mellon. With effect from April 30, 2010, Citibank N.A. is acting as Depositary forour sponsored ADS facility.
175
PART II
ITEM 13 DEFAULTS, DIVIDEND ARREARAGES AND DELINQUENCIES
None applicable.
ITEM 14 MATERIAL MODIFICATIONS TO THE RIGHTS OF SECURITY HOLDERS AND USEOF PROCEEDS
None applicable.
ITEM 15 CONTROLS AND PROCEDURES
a. Disclosure Controls and Procedures
We have evaluated, under the supervision and with the participation of our management, includingour chief executive officer and our chief financial officer, our disclosure controls and procedures as ofDecember 31, 2010 pursuant to Rule 13a-15 of the Securities Exchange Act of 1934, as amended.Based on that evaluation, these officers have concluded that our disclosure controls and procedures areeffective as of the end of the period covered by this report.
In some of the environments in which we operate, businesses like ours are exposed to aheightened risk of loss due to fraud and criminal activity. We have established a system of internalcontrols and procedures and regular review of our financial records designed to identify and correctcontrol weaknesses so as to minimize such losses before they could become material to our results orfinancial position. From time to time, we have experienced acts of fraud and criminal activity in ouroperations in Nigeria, Romania, Serbia and the Russian Federation. We take all such incidents seriouslyand conduct extensive investigations through our internal audit department and in coordination withlocal authorities, so that appropriate disciplinary measures are taken. In 2010, the individual andaggregate impact of all such incidents was immaterial to our consolidated financial statements.
b. Management’s Annual Report on Internal Control over Financial Reporting
Management is responsible for establishing and maintaining adequate internal control over ourfinancial reporting. Management conducted an evaluation of the effectiveness of internal control overfinancial reporting based on the Internal Control—Integrated Framework issued by the Committee ofSponsoring Organizations of the Treadway Commission. Based on this evaluation, managementconcluded that our internal control over financial reporting was effective as at December 31, 2010.
PricewaterhouseCoopers S.A., our independent registered public accounting firm, has issued anaudit report on the effectiveness of our internal control over financial reporting, which is included onpage F-1.
c. Attestation Report of the Registered Public Accounting Firm
The attestation report called for by Item 15(c) of the Form 20-F is included on page F-1.
d. Changes in Internal Control over Financial Reporting
We have continued our gradual implementation of SAP software applications, which we expect tofurther strengthen our internal controls over financial reporting. For additional information on ourimplementation of SAP, see Item 4, ‘‘Information on the Company—Business Overview—Informationtechnology’’.
176
ITEM 16A AUDIT COMMITTEE FINANCIAL EXPERT
Our board of directors believes that both Mr. Kent Atkinson and Mr. Nigel Macdonald arefinancial experts as such term is defined for purposes of section 407 of the Sarbanes-Oxley Act of 2002and the rules promulgated thereunder.
ITEM 16B CODE OF ETHICS
We have adopted a code of ethics covering our senior management and directors to preventwrongdoing and promote honest and ethical conduct, full, fair, accurate, timely and understandabledisclosure, and compliance with applicable governmental rules and regulations. This code of ethicscomplies with the standards prescribed in the Sarbanes-Oxley Act of 2002. We also have in place acorporate code of business conduct applicable to all our employees, which is available on our websiteat www.coca-colahellenic.com.
ITEM 16C PRINCIPAL ACCOUNTANT FEES AND SERVICES
Audit fees and all other fees
Audit fees
Fees for audit services paid to PricewaterhouseCoopers S.A. and affiliates totaled approximatelyA6.2 million for the year ended December 31, 2010, including fees associated with the annual integratedaudit and reviews of our quarterly reports, prepared in accordance with IFRS, and local statutoryaudits. Fees for audit services paid to PricewaterhouseCoopers S.A. and affiliates totaled approximatelyA6.7 million for the year ended December 31, 2009, including fees associated with the annual audit andreviews of our quarterly reports, prepared in accordance with IFRS, and local statutory audits.
Audit related fees
Fees paid to PricewaterhouseCoopers S.A. and affiliates for audit related services were A0.2 millionfor the year ended December 31, 2010 and A0.1 million for the year ended December 31, 2009.
Tax fees
No fees were in 2010 paid to PricewaterhouseCoopers S.A. and affiliates for tax services, includingtax compliance, tax advice and planning, compared to no fees paid in 2009.
All other fees
All other fees paid to PricewaterhouseCoopers S.A. or affiliates were A0.2 million for the yearended December 31, 2010, compared to no fees paid in 2009.
Audit committee pre-approval of audit and permissible non-audit services of independent auditors
Our audit committee pre-approves all audit and permissible non-audit services provided by theindependent auditors. These services may include audit services, audit related services, tax services andother services. The audit committee has adopted a policy of pre-approval of services provided by theindependent auditors.
177
Under the policy, pre-approval is generally provided for work associated with registrationstatements under the Securities Act of 1933 (for example, comfort letters or consents); statutory orother financial audit work under IFRS or according to local requirements; due diligence work forpotential acquisitions or disposals; attestation services not required by statute or regulation; adoption ofnew accounting pronouncements or auditing and disclosure requirements and accounting or regulatoryconsultations; internal control reviews and assistance with internal control reporting requirements;review of information systems security and controls; tax compliance, tax planning and related taxservices, excluding any tax service prohibited by regulatory or other oversight authorities; expatriatesand other individual tax services; and assistance and consultation on questions raised by regulatoryagencies. For each proposed service, the independent auditor is required to provide detailed back-updocumentation at the time of approval to permit the audit committee to make a determination whetherthe provision of such services would impair the independent auditor’s independence.
ITEM 16D EXEMPTION FROM THE LISTING STANDARDS OF AUDIT COMMITTEES
None. Our board of directors believes that all members of our audit committee satisfy theindependence requirement of Rule 10A-3 of the US Securities and Exchange Act of 1934, as amended.Mr. Christos Ioannou replaced Mr. Antonio D’Amato effective March 19, 2010. Mr. Antonio D’Amatoalso satisfied the independence requirement of Rule 10A-3.
ITEM 16E PURCHASES OF EQUITY SECURITIES BY THE ISSUER AND AFFILIATEDPERSONS
None.
ITEM 16F CHANGE IN REGISTRANT’S CERTIFYING ACCOUNTANT
Not applicable.
ITEM 16G CORPORATE GOVERNANCE
Certain differences between our practices and the corporate governance listing standards of the New YorkStock Exchange
Greek corporate law and our corporate practices differ in certain respects from the listing rules ofthe New York Stock Exchange. US companies listed on the New York Stock Exchange are required tohave a majority of independent directors on their board of directors and to have a nominating/corporate governance committee and a compensation committee, both entirely comprised ofindependent members.
Based on the shareholders’ agreement (described in detail above under Item 7, ‘‘MajorShareholders and Related Party Transactions’’) between Kar-Tess Holding and The Coca-Cola CompanyEntities, four of our directors are designated by Kar-Tess Holding and two are designated by TheCoca-Cola Company. The remaining directors are jointly designated by Kar-Tess Holding and TheCoca-Cola Company Entities too. We have also appointed five directors that our board believes areindependent: Mr. Kent Atkinson, Sir Michael Llewellyn-Smith, Mr. Antonio D’Amato, Mr. NigelMacdonald and Mr. Christos Ioannou. Our human resources committee, described above, which fulfilscertain duties of both a nominating/corporate governance committee and a compensation committee, is,in turn, comprised of Mr. John Hunter, Mr. George A. David and Sir Michael Llewellyn-Smith. Ourhuman resources committee does not have sole authority to determine our chief executive officer’scompensation.
We continuously review our corporate governance standards and procedures in light of the ongoingdebates and rulemaking projects in Greece, Europe and the United States, in order to ensure that ourcorporate governance systems remain in line with international best practices.
178
PART III
ITEM 17 FINANCIAL STATEMENTS
See Item 18.
ITEM 18 FINANCIAL STATEMENTS
The following consolidated financial statements, together with the report thereon ofPricewaterhouseCoopers, are filed as part of this Annual Report:
Page
Report of Independent Registered Public Accounting Firm . . . . . . . . . . . . . . . . . . . . . . . . . . . . F-1Consolidated Balance Sheets—December 31, 2010 and 2009 . . . . . . . . . . . . . . . . . . . . . . . . . . . F-2Consolidated Income Statements—Years Ended December 31, 2010, 2009 and 2008 . . . . . . . . . . F-3Consolidated Statements of Comprehensive Income—Years Ended December 31, 2010, 2009 and
2008 . . . . . . . . . . . . . . . . . . . . . . . . . . . . . . . . . . . . . . . . . . . . . . . . . . . . . . . . . . . . . . . . . . F-4Consolidated Statements of Changes in Equity—Years Ended December 31, 2010, 2009 and 2008 F-5Consolidated Cash Flow Statements—Years Ended December 31, 2010, 2009 and 2008 . . . . . . . . F-7Notes to Consolidated Financial Statements . . . . . . . . . . . . . . . . . . . . . . . . . . . . . . . . . . . . . . . F-8
ITEM 19 EXHIBITS
The following exhibits are filed as part of this Annual Report:
ExhibitNumber Description
1.1 Articles of Association of Coca-Cola Hellenic Bottling Company S.A., as last amended onOctober 16, 2009(1)
1.2 Articles of Association of Coca-Cola HBC Finance B.V., as last amended on May 20, 2002(2)
2.1 Amended and Restated Deposit Agreement between Coca-Cola Hellenic BottlingCompany S.A. and Citibank, N.A., dated April 30, 2010(1)
2.2 A500.0 million Multicurrency Revolving Credit Facility Agreement, dated December 18, 2009for Coca-Cola Hellenic Bottling Company S.A., arranged by Citigroup Global MarketsLimited and ING Bank N.V. with ING Bank N.V., London Branch acting as Facility Agent(1)
2.3 Amended and Restated Trust Deed relating to A2.0 billion Euro Medium-Term Note Programamong Coca-Cola HBC Finance B.V., as issuer, Citicorp Trustee Company Limited, as trustee,and Coca-Cola Hellenic Bottling Company S.A. and Coca-Cola HBC Finance B.V., asguarantors(1)
2.4 Indenture, among Coca-Cola HBC Finance B.V., Coca-Cola Hellenic Bottling Company S.A.and The Bank of New York, dated September 17, 2003(2)
2.5 Form of new notes of Coca-Cola HBC Finance B.V. and guarantees relating thereto (includedin Exhibit 2.3)(2)
3.1 Shareholders’ Agreement dated November 3, 1999 by and among The Coca-Cola ExportCorporation, Barlan, Inc., Atlantic Industries, Coca-Cola Overseas Parent Limited,Refreshment Product Services, Inc., Kar-Tess Holding, Boval S.A. and Socomex S.A.(3)
179
ExhibitNumber Description
3.2 Amendment to the Shareholders’ Agreement of November 3, 1999, dated March 3, 2000 byand among The Coca-Cola Export Corporation, Barlan, Inc., Atlantic Industries, Coca-ColaOverseas Parent Limited, Refreshment Product Services, Inc., Kar-Tess Holding, Boval S.A.and Socomex S.A.(3)
3.3 Amendment to the Shareholders’ Agreement of November 3, 1999, as initially amended onMarch 3, 2000, dated August 7, 2003 by and among The Coca-Cola Export Corporation,Barlan, Inc., Atlantic Industries, Coca-Cola Overseas Parent Limited, Refreshment ProductServices, Inc., Kar-Tess Holding, Boval S.A. and Socomex S.A.(2)
3.4 Relationship Agreement dated August 29, 2000 by and among The Coca-Cola ExportCorporation, Barlan, Inc., Atlantic Industries, Coca-Cola Overseas Parent Limited,Refreshment Product Services, Inc., Kar-Tess Holding, Boval S.A., Socomex S.A. and HellenicBottling Company S.A. (subsequently Coca-Cola Hellenic Bottling Company S.A.)(3)
3.5 Amended and Restated Shareholders’ Agreement, dated December 29, 2008 by and amongThe Coca-Cola Export Corporation, Barlan Inc., Atlantic Industries, Coca-Cola OverseasParent Ltd., Refreshment Product Services Inc., CCHBC Grouping, Inc. and Kar-TessHolding(4)
4.1 Form of European Bottlers’ Agreement(4)
4.2 European Bottlers’ Agreement for Greece entered into with effect from June 1, 1997, by andamong The Coca-Cola Company, The Coca-Cola Export Corporation and Hellenic BottlingCompany S.A.(5)
4.3 Form of International (Non-European) Bottlers’ Agreement(4)
4.4 Form of Distribution Agreement(3)
4.5 Supply Agreement dated June 8, 2004 between Frigoglass S.A. and Coca-Cola HellenicBottling Company S.A.(6)
4.6 Agreement dated November 23, 2001 by and between The Coca-Cola Export Corporation,International Beverages, Jayce Enterprises Limited, Coca-Cola Molino Beverages limited and3E (Cyprus) for the sale and purchase of shares in Star Bottling Limited (Cyprus), LLCCoca-Cola Stavropolye Bottlers and Coca-Cola Molino Beverages Limited(3)
4.7 Letter from The Coca-Cola Company, dated August 15, 2003(2)
4.8 Form of Letter from The Coca-Cola Company waiving certain provisions of bottlers’agreements for our countries that entered the European Union on May 1, 2004(6)
7.1 Statement re Computation of Ratios
8.1 Subsidiaries of the Registrant (provided under ‘‘Item 4—Information On The Company—Organizational Structure’’ in the Annual Report)
11.1 Code of Ethics(6)
12 Certifications of Chief Executive Officer and Chief Financial Officer pursuant to Section 302of the Public Company Accounting Reform and Investor Protection Act of 2002
180
ExhibitNumber Description
13 Certifications of Chief Executive Officer and Chief Financial Officer pursuant to Section 906of the Public Company Accounting Reform and Investor Protection Act of 2002(7)
(1) Incorporated by reference to the Annual Report on Form 20-F of Coca-Cola Hellenic BottlingCompany S.A. for the year ended December 31, 2009, as filed with the SEC on June 4, 2010.
(2) Incorporated by reference to the Registration Statement on Form F-4 of Coca-Cola HBCFinance B.V. and Coca-Cola Hellenic Bottling Company S.A. filed with the SEC on November 13,2003.
(3) Incorporated by reference to the Registration Statement on Form F-1 of Coca-Cola HellenicBottling Company S.A. filed with the SEC on September 18, 2002.
(4) Incorporated by reference to the Annual Report on Form 20-F of Coca-Cola Hellenic BottlingCompany S.A. for the year ended December 31, 2008, as filed with the SEC on June 30, 2009.
(5) Incorporated by reference to the Annual Report on Form 20-FR12B of Coca-Cola HellenicBottling Company S.A. for the year ended December 31, 2001 and the six-month period endedJune 28, 2002, as filed with the SEC on September 30, 2002.
(6) Incorporated by reference to the Annual Report on Form 20-F of Coca-Cola Hellenic BottlingCompany S.A. for the year ended December 31, 2003, as filed with the SEC on June 30, 2004.
(7) Furnished but not filed.
181
SIGNATURES
The registrant hereby certifies that it meets all of the requirements for filing on Form 20-F andthat it has duly caused and authorized the undersigned to sign this annual report on its behalf.
COCA-COLA HELLENIC BOTTLING COMPANY S.A.(Registrant)
By: /s/ JAN GUSTAVSSON
Name: Jan GustavssonTitle: General Counsel, Director of Strategic
Development and Company Secretary
Date: March 28, 2011
182
Report of Independent Registered Public Accounting Firm
To the Board of Directors and Shareholders of Coca-Cola Hellenic Bottling Company S.A.
In our opinion, the accompanying consolidated balance sheets and the related consolidatedstatements of income, comprehensive income, changes in equity and cash flow present fairly, in allmaterial respects, the financial position of Coca-Cola Hellenic Bottling Company S.A. and itssubsidiaries at December 31, 2010 and December 31, 2009, and the results of their operations and theircash flows for each of the three years in the period ended December 31, 2010 in conformity withInternational Financial Reporting Standards as issued by the International Accounting Standards Boardand in conformity with International Financial Reporting Standards as adopted by the European Union.Also in our opinion, the Company maintained, in all material respects, effective internal control overfinancial reporting as of December 31, 2010, based on criteria established in Internal Control—Integrated Framework issued by the Committee of Sponsoring Organizations of the TreadwayCommission (COSO). The Company’s management is responsible for these financial statements, formaintaining effective internal control over financial reporting and for its assessment of the effectivenessof internal control over financial reporting, included in the Management’s report on Internal Controlover Financial Reporting appearing in Item 15(b) of the 2010 Annual Report on Form 20-F. Ourresponsibility is to express opinions on these financial statements and on the Company’s internalcontrol over financial reporting based on our integrated audits. We conducted our audits in accordancewith the standards of the Public Company Accounting Oversight Board (United States). Thosestandards require that we plan and perform the audits to obtain reasonable assurance about whetherthe financial statements are free of material misstatement and whether effective internal control overfinancial reporting was maintained in all material respects. Our audits of the financial statementsincluded examining, on a test basis, evidence supporting the amounts and disclosures in the financialstatements, assessing the accounting principles used and significant estimates made by management,and evaluating the overall financial statement presentation. Our audit of internal control over financialreporting included obtaining an understanding of internal control over financial reporting, assessing therisk that a material weakness exists, and testing and evaluating the design and operating effectiveness ofinternal control based on the assessed risk. Our audits also included performing such other proceduresas we considered necessary in the circumstances. We believe that our audits provide a reasonable basisfor our opinions.
A company’s internal control over financial reporting is a process designed to provide reasonableassurance regarding the reliability of financial reporting and the preparation of financial statements forexternal purposes in accordance with generally accepted accounting principles. A company’s internalcontrol over financial reporting includes those policies and procedures that (i) pertain to themaintenance of records that, in reasonable detail, accurately and fairly reflect the transactions anddispositions of the assets of the company; (ii) provide reasonable assurance that transactions arerecorded as necessary to permit preparation of financial statements in accordance with generallyaccepted accounting principles, and that receipts and expenditures of the company are being made onlyin accordance with authorizations of management and directors of the company; and (iii) providereasonable assurance regarding prevention or timely detection of unauthorized acquisition, use, ordisposition of the company’s assets that could have a material effect on the financial statements.
Because of its inherent limitations, internal control over financial reporting may not prevent ordetect misstatements. Also, projections of any evaluation of effectiveness to future periods are subjectto the risk that controls may become inadequate because of changes in conditions, or that the degreeof compliance with the policies or procedures may deteriorate.
/s/ PricewaterhouseCoopers S.A.Athens, GreeceMarch 28, 2011
F-1
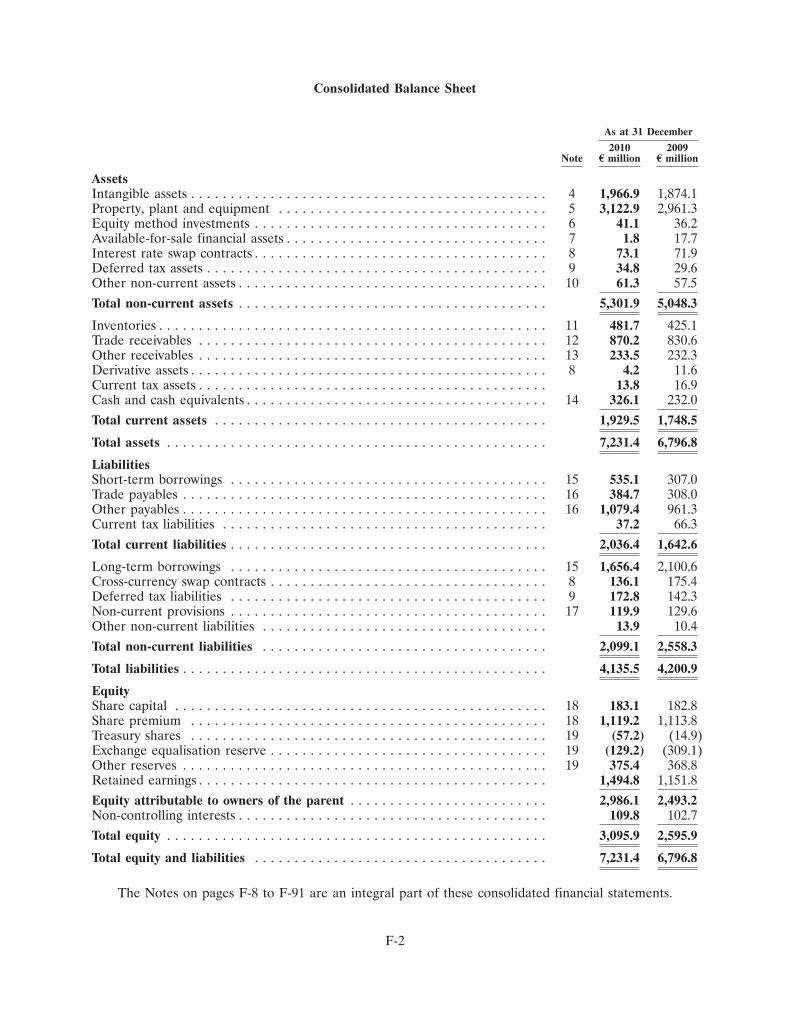
Consolidated Balance Sheet
As at 31 December
2010 2009Note E million E million
AssetsIntangible assets . . . . . . . . . . . . . . . . . . . . . . . . . . . . . . . . . . . . . . . . . . . . . 4 1,966.9 1,874.1Property, plant and equipment . . . . . . . . . . . . . . . . . . . . . . . . . . . . . . . . . . 5 3,122.9 2,961.3Equity method investments . . . . . . . . . . . . . . . . . . . . . . . . . . . . . . . . . . . . . 6 41.1 36.2Available-for-sale financial assets . . . . . . . . . . . . . . . . . . . . . . . . . . . . . . . . . 7 1.8 17.7Interest rate swap contracts . . . . . . . . . . . . . . . . . . . . . . . . . . . . . . . . . . . . . 8 73.1 71.9Deferred tax assets . . . . . . . . . . . . . . . . . . . . . . . . . . . . . . . . . . . . . . . . . . . 9 34.8 29.6Other non-current assets . . . . . . . . . . . . . . . . . . . . . . . . . . . . . . . . . . . . . . . 10 61.3 57.5Total non-current assets . . . . . . . . . . . . . . . . . . . . . . . . . . . . . . . . . . . . . . . 5,301.9 5,048.3
Inventories . . . . . . . . . . . . . . . . . . . . . . . . . . . . . . . . . . . . . . . . . . . . . . . . . 11 481.7 425.1Trade receivables . . . . . . . . . . . . . . . . . . . . . . . . . . . . . . . . . . . . . . . . . . . . 12 870.2 830.6Other receivables . . . . . . . . . . . . . . . . . . . . . . . . . . . . . . . . . . . . . . . . . . . . 13 233.5 232.3Derivative assets . . . . . . . . . . . . . . . . . . . . . . . . . . . . . . . . . . . . . . . . . . . . . 8 4.2 11.6Current tax assets . . . . . . . . . . . . . . . . . . . . . . . . . . . . . . . . . . . . . . . . . . . . 13.8 16.9Cash and cash equivalents . . . . . . . . . . . . . . . . . . . . . . . . . . . . . . . . . . . . . . 14 326.1 232.0Total current assets . . . . . . . . . . . . . . . . . . . . . . . . . . . . . . . . . . . . . . . . . . 1,929.5 1,748.5
Total assets . . . . . . . . . . . . . . . . . . . . . . . . . . . . . . . . . . . . . . . . . . . . . . . . 7,231.4 6,796.8
LiabilitiesShort-term borrowings . . . . . . . . . . . . . . . . . . . . . . . . . . . . . . . . . . . . . . . . 15 535.1 307.0Trade payables . . . . . . . . . . . . . . . . . . . . . . . . . . . . . . . . . . . . . . . . . . . . . . 16 384.7 308.0Other payables . . . . . . . . . . . . . . . . . . . . . . . . . . . . . . . . . . . . . . . . . . . . . . 16 1,079.4 961.3Current tax liabilities . . . . . . . . . . . . . . . . . . . . . . . . . . . . . . . . . . . . . . . . . 37.2 66.3Total current liabilities . . . . . . . . . . . . . . . . . . . . . . . . . . . . . . . . . . . . . . . . 2,036.4 1,642.6
Long-term borrowings . . . . . . . . . . . . . . . . . . . . . . . . . . . . . . . . . . . . . . . . 15 1,656.4 2,100.6Cross-currency swap contracts . . . . . . . . . . . . . . . . . . . . . . . . . . . . . . . . . . . 8 136.1 175.4Deferred tax liabilities . . . . . . . . . . . . . . . . . . . . . . . . . . . . . . . . . . . . . . . . 9 172.8 142.3Non-current provisions . . . . . . . . . . . . . . . . . . . . . . . . . . . . . . . . . . . . . . . . 17 119.9 129.6Other non-current liabilities . . . . . . . . . . . . . . . . . . . . . . . . . . . . . . . . . . . . 13.9 10.4Total non-current liabilities . . . . . . . . . . . . . . . . . . . . . . . . . . . . . . . . . . . . 2,099.1 2,558.3
Total liabilities . . . . . . . . . . . . . . . . . . . . . . . . . . . . . . . . . . . . . . . . . . . . . . 4,135.5 4,200.9
EquityShare capital . . . . . . . . . . . . . . . . . . . . . . . . . . . . . . . . . . . . . . . . . . . . . . . 18 183.1 182.8Share premium . . . . . . . . . . . . . . . . . . . . . . . . . . . . . . . . . . . . . . . . . . . . . 18 1,119.2 1,113.8Treasury shares . . . . . . . . . . . . . . . . . . . . . . . . . . . . . . . . . . . . . . . . . . . . . 19 (57.2) (14.9)Exchange equalisation reserve . . . . . . . . . . . . . . . . . . . . . . . . . . . . . . . . . . . 19 (129.2) (309.1)Other reserves . . . . . . . . . . . . . . . . . . . . . . . . . . . . . . . . . . . . . . . . . . . . . . 19 375.4 368.8Retained earnings . . . . . . . . . . . . . . . . . . . . . . . . . . . . . . . . . . . . . . . . . . . . 1,494.8 1,151.8Equity attributable to owners of the parent . . . . . . . . . . . . . . . . . . . . . . . . . 2,986.1 2,493.2Non-controlling interests . . . . . . . . . . . . . . . . . . . . . . . . . . . . . . . . . . . . . . . 109.8 102.7Total equity . . . . . . . . . . . . . . . . . . . . . . . . . . . . . . . . . . . . . . . . . . . . . . . . 3,095.9 2,595.9
Total equity and liabilities . . . . . . . . . . . . . . . . . . . . . . . . . . . . . . . . . . . . . 7,231.4 6,796.8
The Notes on pages F-8 to F-91 are an integral part of these consolidated financial statements.
F-2
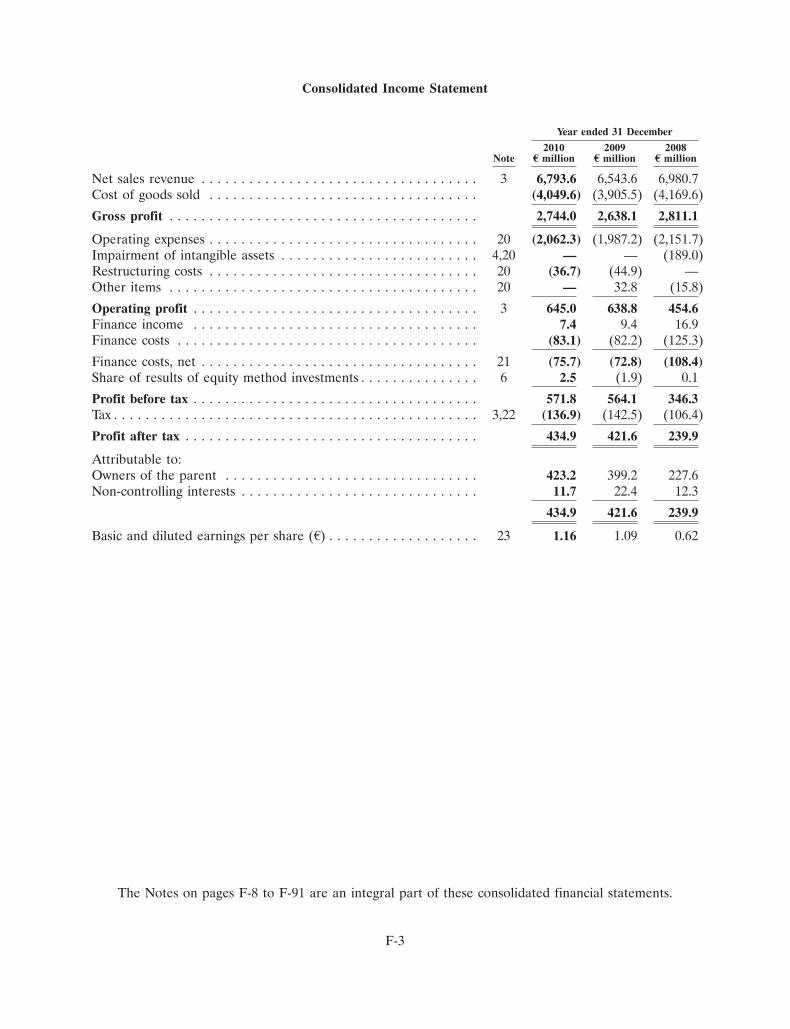
Consolidated Income Statement
Year ended 31 December
2010 2009 2008Note E million E million E million
Net sales revenue . . . . . . . . . . . . . . . . . . . . . . . . . . . . . . . . . . . 3 6,793.6 6,543.6 6,980.7Cost of goods sold . . . . . . . . . . . . . . . . . . . . . . . . . . . . . . . . . . (4,049.6) (3,905.5) (4,169.6)
Gross profit . . . . . . . . . . . . . . . . . . . . . . . . . . . . . . . . . . . . . . . 2,744.0 2,638.1 2,811.1
Operating expenses . . . . . . . . . . . . . . . . . . . . . . . . . . . . . . . . . . 20 (2,062.3) (1,987.2) (2,151.7)Impairment of intangible assets . . . . . . . . . . . . . . . . . . . . . . . . . 4,20 — — (189.0)Restructuring costs . . . . . . . . . . . . . . . . . . . . . . . . . . . . . . . . . . 20 (36.7) (44.9) —Other items . . . . . . . . . . . . . . . . . . . . . . . . . . . . . . . . . . . . . . . 20 — 32.8 (15.8)
Operating profit . . . . . . . . . . . . . . . . . . . . . . . . . . . . . . . . . . . . 3 645.0 638.8 454.6Finance income . . . . . . . . . . . . . . . . . . . . . . . . . . . . . . . . . . . . 7.4 9.4 16.9Finance costs . . . . . . . . . . . . . . . . . . . . . . . . . . . . . . . . . . . . . . (83.1) (82.2) (125.3)
Finance costs, net . . . . . . . . . . . . . . . . . . . . . . . . . . . . . . . . . . . 21 (75.7) (72.8) (108.4)Share of results of equity method investments . . . . . . . . . . . . . . . 6 2.5 (1.9) 0.1
Profit before tax . . . . . . . . . . . . . . . . . . . . . . . . . . . . . . . . . . . . 571.8 564.1 346.3Tax . . . . . . . . . . . . . . . . . . . . . . . . . . . . . . . . . . . . . . . . . . . . . . 3,22 (136.9) (142.5) (106.4)
Profit after tax . . . . . . . . . . . . . . . . . . . . . . . . . . . . . . . . . . . . . 434.9 421.6 239.9
Attributable to:Owners of the parent . . . . . . . . . . . . . . . . . . . . . . . . . . . . . . . . 423.2 399.2 227.6Non-controlling interests . . . . . . . . . . . . . . . . . . . . . . . . . . . . . . 11.7 22.4 12.3
434.9 421.6 239.9
Basic and diluted earnings per share (A) . . . . . . . . . . . . . . . . . . . 23 1.16 1.09 0.62
The Notes on pages F-8 to F-91 are an integral part of these consolidated financial statements.
F-3
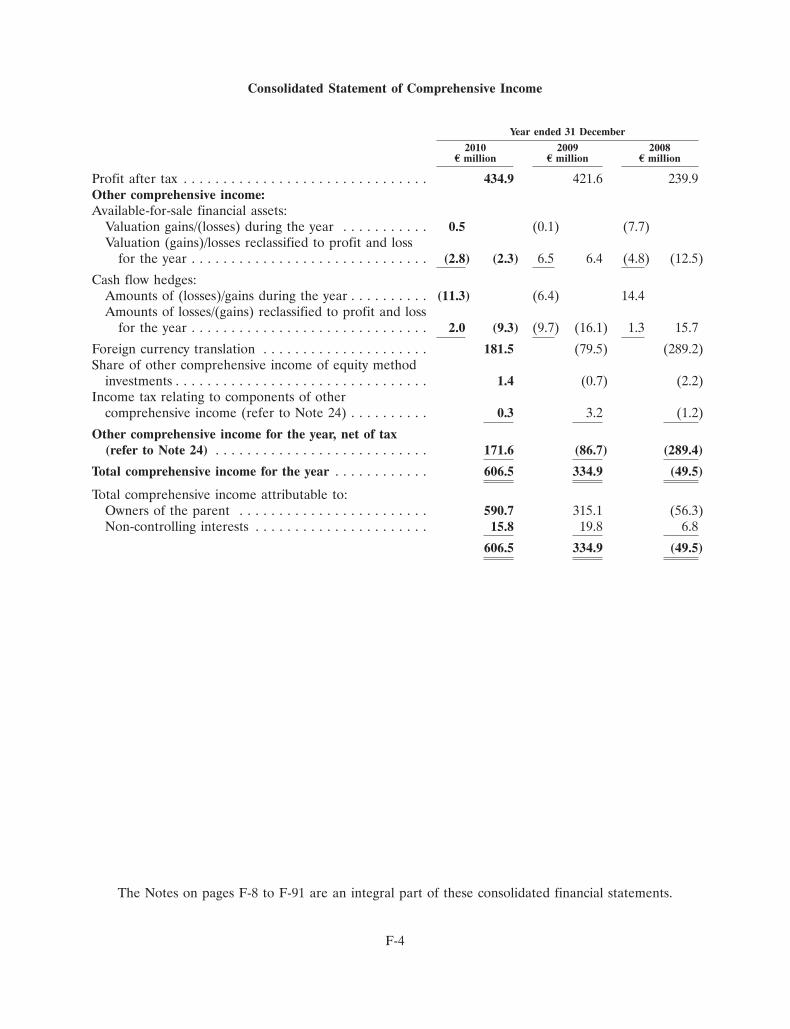
Consolidated Statement of Comprehensive Income
Year ended 31 December
2010 2009 2008E million E million E million
Profit after tax . . . . . . . . . . . . . . . . . . . . . . . . . . . . . . . 434.9 421.6 239.9Other comprehensive income:Available-for-sale financial assets:
Valuation gains/(losses) during the year . . . . . . . . . . . 0.5 (0.1) (7.7)Valuation (gains)/losses reclassified to profit and loss
for the year . . . . . . . . . . . . . . . . . . . . . . . . . . . . . . (2.8) (2.3) 6.5 6.4 (4.8) (12.5)
Cash flow hedges:Amounts of (losses)/gains during the year . . . . . . . . . . (11.3) (6.4) 14.4Amounts of losses/(gains) reclassified to profit and loss
for the year . . . . . . . . . . . . . . . . . . . . . . . . . . . . . . 2.0 (9.3) (9.7) (16.1) 1.3 15.7
Foreign currency translation . . . . . . . . . . . . . . . . . . . . . 181.5 (79.5) (289.2)Share of other comprehensive income of equity method
investments . . . . . . . . . . . . . . . . . . . . . . . . . . . . . . . . 1.4 (0.7) (2.2)Income tax relating to components of other
comprehensive income (refer to Note 24) . . . . . . . . . . 0.3 3.2 (1.2)
Other comprehensive income for the year, net of tax(refer to Note 24) . . . . . . . . . . . . . . . . . . . . . . . . . . . 171.6 (86.7) (289.4)
Total comprehensive income for the year . . . . . . . . . . . . 606.5 334.9 (49.5)
Total comprehensive income attributable to:Owners of the parent . . . . . . . . . . . . . . . . . . . . . . . . 590.7 315.1 (56.3)Non-controlling interests . . . . . . . . . . . . . . . . . . . . . . 15.8 19.8 6.8
606.5 334.9 (49.5)
The Notes on pages F-8 to F-91 are an integral part of these consolidated financial statements.
F-4
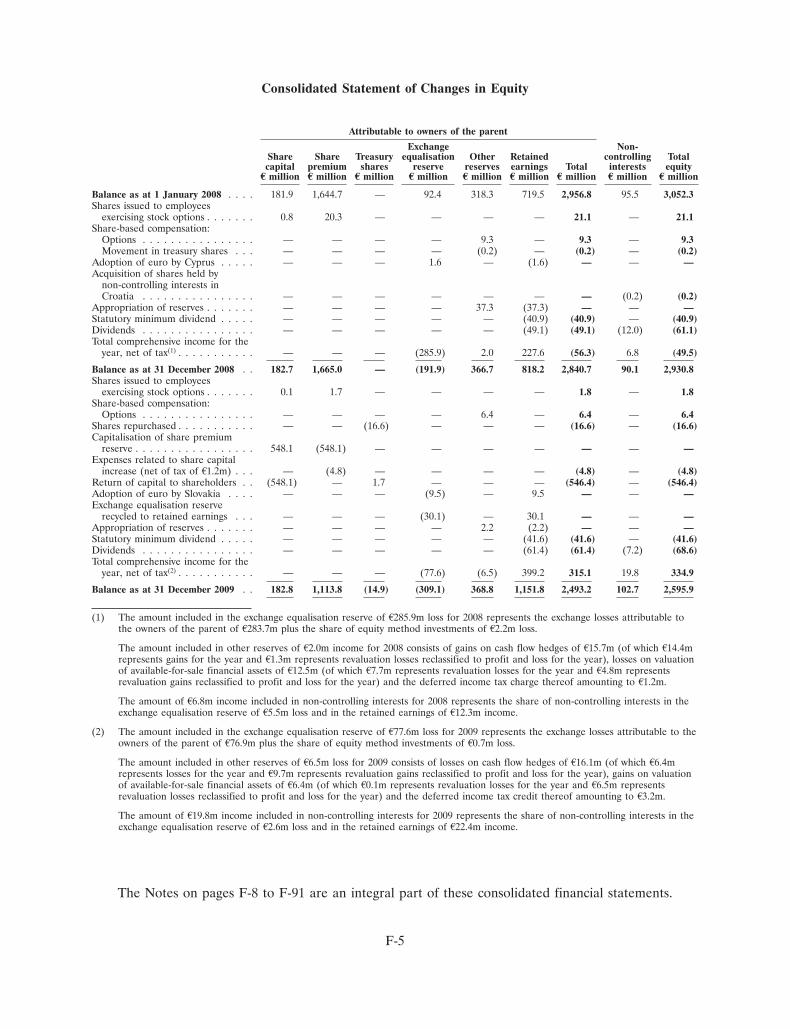
Consolidated Statement of Changes in Equity
Attributable to owners of the parent
Exchange Non-Share Share Treasury equalisation Other Retained controlling Totalcapital premium shares reserve reserves earnings Total interests equityE million E million E million E million E million E million E million E million E million
Balance as at 1 January 2008 . . . . 181.9 1,644.7 — 92.4 318.3 719.5 2,956.8 95.5 3,052.3Shares issued to employees
exercising stock options . . . . . . . 0.8 20.3 — — — — 21.1 — 21.1Share-based compensation:
Options . . . . . . . . . . . . . . . . — — — — 9.3 — 9.3 — 9.3Movement in treasury shares . . . — — — — (0.2) — (0.2) — (0.2)
Adoption of euro by Cyprus . . . . . — — — 1.6 — (1.6) — — —Acquisition of shares held by
non-controlling interests inCroatia . . . . . . . . . . . . . . . . — — — — — — — (0.2) (0.2)
Appropriation of reserves . . . . . . . — — — — 37.3 (37.3) — — —Statutory minimum dividend . . . . . — — — — — (40.9) (40.9) — (40.9)Dividends . . . . . . . . . . . . . . . . — — — — — (49.1) (49.1) (12.0) (61.1)Total comprehensive income for the
year, net of tax(1) . . . . . . . . . . . — — — (285.9) 2.0 227.6 (56.3) 6.8 (49.5)
Balance as at 31 December 2008 . . 182.7 1,665.0 — (191.9) 366.7 818.2 2,840.7 90.1 2,930.8Shares issued to employees
exercising stock options . . . . . . . 0.1 1.7 — — — — 1.8 — 1.8Share-based compensation:
Options . . . . . . . . . . . . . . . . — — — — 6.4 — 6.4 — 6.4Shares repurchased . . . . . . . . . . . — — (16.6) — — — (16.6) — (16.6)Capitalisation of share premium
reserve . . . . . . . . . . . . . . . . . 548.1 (548.1) — — — — — — —Expenses related to share capital
increase (net of tax of A1.2m) . . . — (4.8) — — — — (4.8) — (4.8)Return of capital to shareholders . . (548.1) — 1.7 — — — (546.4) — (546.4)Adoption of euro by Slovakia . . . . — — — (9.5) — 9.5 — — —Exchange equalisation reserve
recycled to retained earnings . . . — — — (30.1) — 30.1 — — —Appropriation of reserves . . . . . . . — — — — 2.2 (2.2) — — —Statutory minimum dividend . . . . . — — — — — (41.6) (41.6) — (41.6)Dividends . . . . . . . . . . . . . . . . — — — — — (61.4) (61.4) (7.2) (68.6)Total comprehensive income for the
year, net of tax(2) . . . . . . . . . . . — — — (77.6) (6.5) 399.2 315.1 19.8 334.9
Balance as at 31 December 2009 . . 182.8 1,113.8 (14.9) (309.1) 368.8 1,151.8 2,493.2 102.7 2,595.9
(1) The amount included in the exchange equalisation reserve of A285.9m loss for 2008 represents the exchange losses attributable tothe owners of the parent of A283.7m plus the share of equity method investments of A2.2m loss.
The amount included in other reserves of A2.0m income for 2008 consists of gains on cash flow hedges of A15.7m (of which A14.4mrepresents gains for the year and A1.3m represents revaluation losses reclassified to profit and loss for the year), losses on valuationof available-for-sale financial assets of A12.5m (of which A7.7m represents revaluation losses for the year and A4.8m representsrevaluation gains reclassified to profit and loss for the year) and the deferred income tax charge thereof amounting to A1.2m.
The amount of A6.8m income included in non-controlling interests for 2008 represents the share of non-controlling interests in theexchange equalisation reserve of A5.5m loss and in the retained earnings of A12.3m income.
(2) The amount included in the exchange equalisation reserve of A77.6m loss for 2009 represents the exchange losses attributable to theowners of the parent of A76.9m plus the share of equity method investments of A0.7m loss.
The amount included in other reserves of A6.5m loss for 2009 consists of losses on cash flow hedges of A16.1m (of which A6.4mrepresents losses for the year and A9.7m represents revaluation gains reclassified to profit and loss for the year), gains on valuationof available-for-sale financial assets of A6.4m (of which A0.1m represents revaluation losses for the year and A6.5m representsrevaluation losses reclassified to profit and loss for the year) and the deferred income tax credit thereof amounting to A3.2m.
The amount of A19.8m income included in non-controlling interests for 2009 represents the share of non-controlling interests in theexchange equalisation reserve of A2.6m loss and in the retained earnings of A22.4m income.
The Notes on pages F-8 to F-91 are an integral part of these consolidated financial statements.
F-5
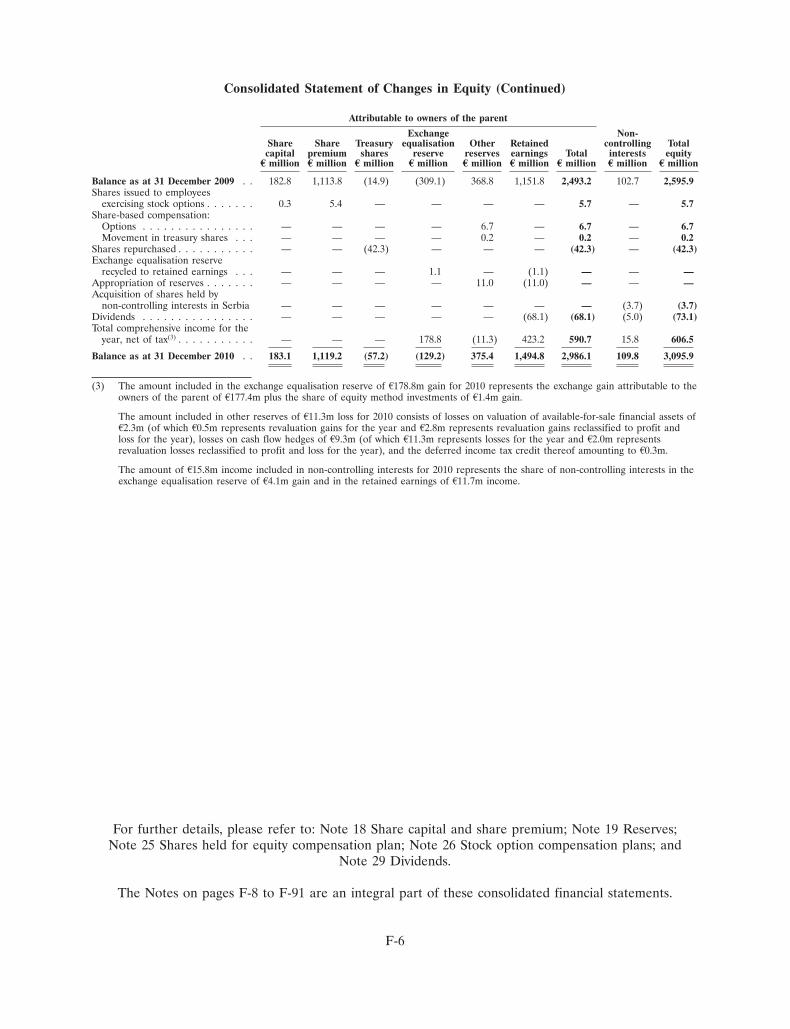
Consolidated Statement of Changes in Equity (Continued)
Attributable to owners of the parent
Exchange Non-Share Share Treasury equalisation Other Retained controlling Totalcapital premium shares reserve reserves earnings Total interests equityE million E million E million E million E million E million E million E million E million
Balance as at 31 December 2009 . . 182.8 1,113.8 (14.9) (309.1) 368.8 1,151.8 2,493.2 102.7 2,595.9Shares issued to employees
exercising stock options . . . . . . . 0.3 5.4 — — — — 5.7 — 5.7Share-based compensation:
Options . . . . . . . . . . . . . . . . — — — — 6.7 — 6.7 — 6.7Movement in treasury shares . . . — — — — 0.2 — 0.2 — 0.2
Shares repurchased . . . . . . . . . . . — — (42.3) — — — (42.3) — (42.3)Exchange equalisation reserve
recycled to retained earnings . . . — — — 1.1 — (1.1) — — —Appropriation of reserves . . . . . . . — — — — 11.0 (11.0) — — —Acquisition of shares held by
non-controlling interests in Serbia — — — — — — — (3.7) (3.7)Dividends . . . . . . . . . . . . . . . . — — — — — (68.1) (68.1) (5.0) (73.1)Total comprehensive income for the
year, net of tax(3) . . . . . . . . . . . — — — 178.8 (11.3) 423.2 590.7 15.8 606.5
Balance as at 31 December 2010 . . 183.1 1,119.2 (57.2) (129.2) 375.4 1,494.8 2,986.1 109.8 3,095.9
(3) The amount included in the exchange equalisation reserve of A178.8m gain for 2010 represents the exchange gain attributable to theowners of the parent of A177.4m plus the share of equity method investments of A1.4m gain.
The amount included in other reserves of A11.3m loss for 2010 consists of losses on valuation of available-for-sale financial assets ofA2.3m (of which A0.5m represents revaluation gains for the year and A2.8m represents revaluation gains reclassified to profit andloss for the year), losses on cash flow hedges of A9.3m (of which A11.3m represents losses for the year and A2.0m representsrevaluation losses reclassified to profit and loss for the year), and the deferred income tax credit thereof amounting to A0.3m.
The amount of A15.8m income included in non-controlling interests for 2010 represents the share of non-controlling interests in theexchange equalisation reserve of A4.1m gain and in the retained earnings of A11.7m income.
For further details, please refer to: Note 18 Share capital and share premium; Note 19 Reserves;Note 25 Shares held for equity compensation plan; Note 26 Stock option compensation plans; and
Note 29 Dividends.
The Notes on pages F-8 to F-91 are an integral part of these consolidated financial statements.
F-6
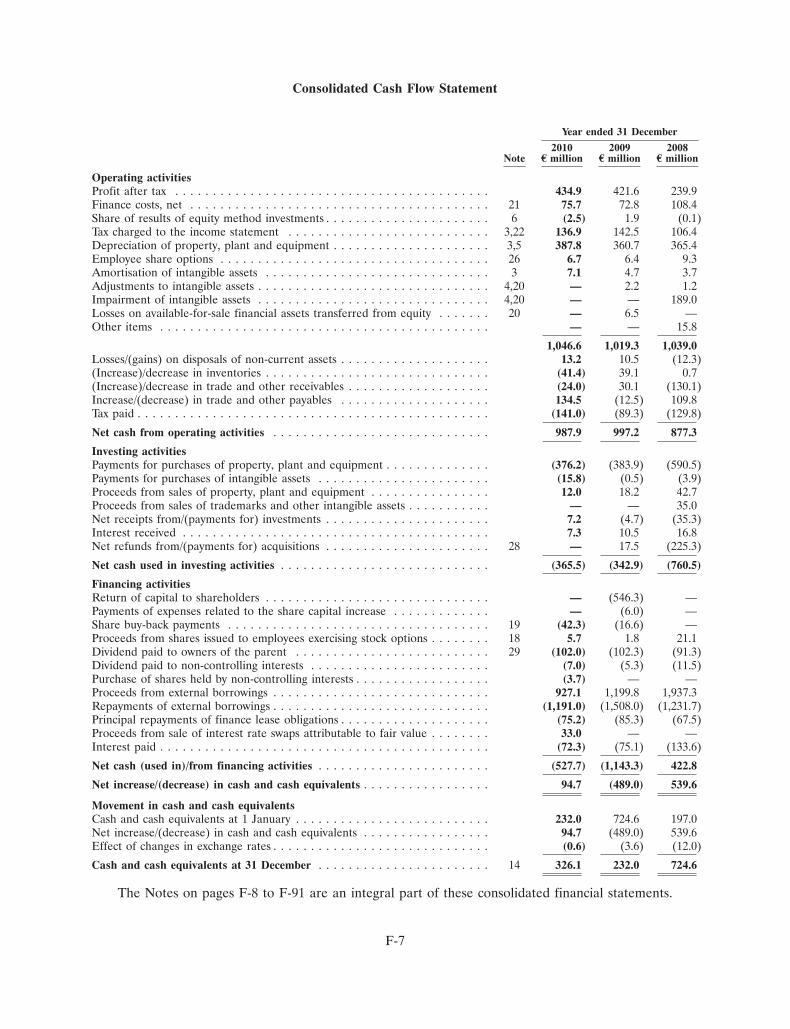
Consolidated Cash Flow Statement
Year ended 31 December
2010 2009 2008Note E million E million E million
Operating activitiesProfit after tax . . . . . . . . . . . . . . . . . . . . . . . . . . . . . . . . . . . . . . . . . . 434.9 421.6 239.9Finance costs, net . . . . . . . . . . . . . . . . . . . . . . . . . . . . . . . . . . . . . . . . 21 75.7 72.8 108.4Share of results of equity method investments . . . . . . . . . . . . . . . . . . . . . . 6 (2.5) 1.9 (0.1)Tax charged to the income statement . . . . . . . . . . . . . . . . . . . . . . . . . . . 3,22 136.9 142.5 106.4Depreciation of property, plant and equipment . . . . . . . . . . . . . . . . . . . . . 3,5 387.8 360.7 365.4Employee share options . . . . . . . . . . . . . . . . . . . . . . . . . . . . . . . . . . . . 26 6.7 6.4 9.3Amortisation of intangible assets . . . . . . . . . . . . . . . . . . . . . . . . . . . . . . 3 7.1 4.7 3.7Adjustments to intangible assets . . . . . . . . . . . . . . . . . . . . . . . . . . . . . . . 4,20 — 2.2 1.2Impairment of intangible assets . . . . . . . . . . . . . . . . . . . . . . . . . . . . . . . 4,20 — — 189.0Losses on available-for-sale financial assets transferred from equity . . . . . . . 20 — 6.5 —Other items . . . . . . . . . . . . . . . . . . . . . . . . . . . . . . . . . . . . . . . . . . . . — — 15.8
1,046.6 1,019.3 1,039.0Losses/(gains) on disposals of non-current assets . . . . . . . . . . . . . . . . . . . . 13.2 10.5 (12.3)(Increase)/decrease in inventories . . . . . . . . . . . . . . . . . . . . . . . . . . . . . . (41.4) 39.1 0.7(Increase)/decrease in trade and other receivables . . . . . . . . . . . . . . . . . . . (24.0) 30.1 (130.1)Increase/(decrease) in trade and other payables . . . . . . . . . . . . . . . . . . . . 134.5 (12.5) 109.8Tax paid . . . . . . . . . . . . . . . . . . . . . . . . . . . . . . . . . . . . . . . . . . . . . . . (141.0) (89.3) (129.8)
Net cash from operating activities . . . . . . . . . . . . . . . . . . . . . . . . . . . . . 987.9 997.2 877.3
Investing activitiesPayments for purchases of property, plant and equipment . . . . . . . . . . . . . . (376.2) (383.9) (590.5)Payments for purchases of intangible assets . . . . . . . . . . . . . . . . . . . . . . . (15.8) (0.5) (3.9)Proceeds from sales of property, plant and equipment . . . . . . . . . . . . . . . . 12.0 18.2 42.7Proceeds from sales of trademarks and other intangible assets . . . . . . . . . . . — — 35.0Net receipts from/(payments for) investments . . . . . . . . . . . . . . . . . . . . . . 7.2 (4.7) (35.3)Interest received . . . . . . . . . . . . . . . . . . . . . . . . . . . . . . . . . . . . . . . . . 7.3 10.5 16.8Net refunds from/(payments for) acquisitions . . . . . . . . . . . . . . . . . . . . . . 28 — 17.5 (225.3)
Net cash used in investing activities . . . . . . . . . . . . . . . . . . . . . . . . . . . . (365.5) (342.9) (760.5)
Financing activitiesReturn of capital to shareholders . . . . . . . . . . . . . . . . . . . . . . . . . . . . . . — (546.3) —Payments of expenses related to the share capital increase . . . . . . . . . . . . . — (6.0) —Share buy-back payments . . . . . . . . . . . . . . . . . . . . . . . . . . . . . . . . . . . 19 (42.3) (16.6) —Proceeds from shares issued to employees exercising stock options . . . . . . . . 18 5.7 1.8 21.1Dividend paid to owners of the parent . . . . . . . . . . . . . . . . . . . . . . . . . . 29 (102.0) (102.3) (91.3)Dividend paid to non-controlling interests . . . . . . . . . . . . . . . . . . . . . . . . (7.0) (5.3) (11.5)Purchase of shares held by non-controlling interests . . . . . . . . . . . . . . . . . . (3.7) — —Proceeds from external borrowings . . . . . . . . . . . . . . . . . . . . . . . . . . . . . 927.1 1,199.8 1,937.3Repayments of external borrowings . . . . . . . . . . . . . . . . . . . . . . . . . . . . . (1,191.0) (1,508.0) (1,231.7)Principal repayments of finance lease obligations . . . . . . . . . . . . . . . . . . . . (75.2) (85.3) (67.5)Proceeds from sale of interest rate swaps attributable to fair value . . . . . . . . 33.0 — —Interest paid . . . . . . . . . . . . . . . . . . . . . . . . . . . . . . . . . . . . . . . . . . . . (72.3) (75.1) (133.6)
Net cash (used in)/from financing activities . . . . . . . . . . . . . . . . . . . . . . . (527.7) (1,143.3) 422.8
Net increase/(decrease) in cash and cash equivalents . . . . . . . . . . . . . . . . . 94.7 (489.0) 539.6
Movement in cash and cash equivalentsCash and cash equivalents at 1 January . . . . . . . . . . . . . . . . . . . . . . . . . . 232.0 724.6 197.0Net increase/(decrease) in cash and cash equivalents . . . . . . . . . . . . . . . . . 94.7 (489.0) 539.6Effect of changes in exchange rates . . . . . . . . . . . . . . . . . . . . . . . . . . . . . (0.6) (3.6) (12.0)
Cash and cash equivalents at 31 December . . . . . . . . . . . . . . . . . . . . . . . 14 326.1 232.0 724.6
The Notes on pages F-8 to F-91 are an integral part of these consolidated financial statements.
F-7
Notes to the Consolidated Financial Statements
1. Basis of preparation and accounting policies
Description of business
Coca-Cola Hellenic Bottling Company S.A. (‘Coca-Cola Hellenic’) is a Societe Anonyme(corporation) incorporated in Greece and founded in 1969. It took its current form in August 2000through the acquisition of the Coca-Cola Beverages plc (‘CCB’) by Hellenic Bottling Company S.A.(‘HBC’). Coca-Cola Hellenic and its subsidiaries (collectively ‘the Company’ or ‘the Group’) areprincipally engaged in the production and distribution of non-alcoholic beverages, under franchise fromThe Coca-Cola Company (‘TCCC’). The Company distributes its products in Europe and Nigeria.Information on the Company’s operations by segment is included in Note 3.
Coca-Cola Hellenic’s shares are listed on the Athens Exchange (symbol: EEEK), with a secondarylisting on the London Stock Exchange (symbol: CCB). Coca-Cola Hellenic’s American DepositaryReceipts (ADRs) are listed on the New York Stock Exchange (symbol: CCH).
These consolidated financial statements were approved for issue by the Board of Directors on15 March 2011 and are expected to be verified at the Annual General Meeting to be held on 6 May2011.
Basis of preparation
The consolidated financial statements included in this document are prepared in accordance withInternational Financial Reporting Standards (‘IFRS’) issued by the International Accounting StandardsBoard (‘IASB’) and IFRS as adopted by the European Union (‘EU’).
All IFRS issued by the IASB, which apply to the preparation of these consolidated financialstatements, have been adopted by the EU following an approval process undertaken by the EuropeanCommission and the European Financial Reporting Advisory Group (‘EFRAG’).
The consolidated financial statements are prepared under the historical cost convention, asmodified by the revaluation of available-for-sale financial assets and derivative financial instruments.
Basis of consolidation
Subsidiary undertakings are those companies over which the Group, directly or indirectly, haspower to exercise control. Subsidiary undertakings are consolidated from the date on which effectivecontrol is transferred to the Group and cease to be consolidated from the date on which effectivecontrol is transferred out of the Group.
The purchase method of accounting is used to account for the acquisition of subsidiaries. The costof an acquisition is measured at the fair value of the assets transferred, shares issued and/or liabilitiesassumed at the date of acquisition. The cost of an acquisition includes the fair value of any asset orliability resulting from a contingent consideration arrangement. All acquisition related costs areexpensed as incurred. The excess of the cost of acquisition over the fair value of the share of theidentifiable net assets of the subsidiary acquired is recorded as goodwill.
All material intercompany transactions and balances between Group companies are eliminated.Where necessary, accounting policies of subsidiaries are modified to ensure consistency with policiesadopted by the Group.
F-8
Notes to the Consolidated Financial Statements (Continued)
1. Basis of preparation and accounting policies (Continued)
Critical accounting judgments and estimates
In conformity with generally accepted accounting principles, the preparation of the consolidatedfinancial statements for Coca-Cola Hellenic requires management to make estimates and assumptionsthat affect the reported amounts of assets, liabilities, revenues and expenses, and the disclosure ofcontingent assets and liabilities in the consolidated financial statements and accompanying notes.Although these estimates are based on management’s knowledge of current events and actions that maybe undertaken in the future, actual results may ultimately differ from estimates.
Income taxes
The Group is subject to income taxes in numerous jurisdictions. There are many transactions andcalculations for which the ultimate tax determination cannot be assessed with certainty in the ordinarycourse of business. The Group recognises provision for potential liabilities that may arise as a result oftax audit issues based on assessment of the probabilities as to whether additional taxes will be due.Where the final tax outcome on these matters is different from the amounts that were initiallyrecorded, such differences will impact the income tax provision in the period in which suchdetermination is made. The Group anticipates that were the final tax outcome, on the judgment areas,to differ from management’s estimates by up to 10%, the Group’s tax expense would increase (ordecrease) by less than A3.0m.
Impairment of goodwill and indefinite-lived intangible assets
Determining whether goodwill or indefinite-lived intangible assets are impaired requires anestimation of the value-in-use of the cash-generating units to which they have been allocated. Thevalue-in-use calculation requires the Group to estimate the future cash flows expected to arise from thecash-generating unit and a suitable discount rate in order to calculate present value. These assumptionsand a discussion on how they are established are described in Note 4.
Employee Benefits—Defined Benefit Pension Plans
The Group provides defined benefit pension plans as an employee benefit in certain territories.Determining the value of these plans requires several actuarial assumptions and estimates aboutdiscount rates, expected rates of return on assets, future salary increases, mortality rates and futurepension increases. Due to the long-term nature of these plans, such estimates are subject to significantuncertainty. These assumptions and a discussion on how they are established are described in Note 17.
Revenue recognition
Revenues are recognised when all of the following conditions are met: evidence of a bindingarrangement exists (generally purchase orders), products have been delivered and there is no futureperformance required, amounts are collectible under normal payment terms and both revenue andassociated costs can be measured reliably.
F-9
Notes to the Consolidated Financial Statements (Continued)
1. Basis of preparation and accounting policies (Continued)
Revenue is stated net of sales discounts, listing fees and marketing and promotional incentivesprovided to customers. Listing fees are incentives provided to customers for carrying the Company’sproducts in their stores. Listing fees that are subject to contract-based term arrangements arecapitalised and amortised over the term of the contract. All other listing fees as well as marketing andpromotional incentives are expensed as incurred. The amount of listing fees capitalised at 31 December2010 was A31.6m (2009: A26.9m, 2008: A36.9m). Of this balance, A19.5m (2009: A16.6m, 2008: A23.2m)was classified as current prepayments and the remainder as non-current prepayments. Listing feesexpensed for the year ended 31 December 2010 amounted to A240.0m (2009: A123.4m, 2008: A148.6m).Marketing and promotional incentives provided to customers during 2010 amounted to A160.1m (2009:A167.9m, 2008: A159.6m).
Coca-Cola Hellenic receives contributions from TCCC in order to promote sales of Coca-Colabranded products. Contributions for price support and marketing and promotional campaigns in respectof specific customers are recognised as an offset to promotional incentives provided to those customersto which the contributions contractually relate. These contributions are accrued and matched to theexpenditure to which they relate. In 2010, such contributions totalled A48.8m (2009: A39.9m, 2008:A37.6m).
Earnings per share
Basic earnings per share is calculated by dividing the net profit attributable to the owners of theparent by the weighted average number of ordinary shares outstanding during the year. The weightedaverage number of ordinary shares outstanding during the year is the number of ordinary sharesoutstanding at the beginning of the year, adjusted by the number of ordinary shares bought back orissued during the year multiplied by a time-weighting factor. Diluted earnings per share incorporatesstock options for which the average share price for the year is in excess of the exercise price of thestock option and there is a dilutive effect.
Intangible assets
Intangible assets consist mainly of goodwill, trademarks and franchise agreements. Goodwill is theexcess of the cost of an acquisition over the fair value of the share of net assets acquired. Goodwill andother indefinite-lived intangible assets are not amortised but rather tested for impairment annually andwhenever there is an indication of impairment. Goodwill and other indefinite-lived intangible assets arecarried at cost less accumulated impairment losses.
For the purpose of impairment testing, goodwill is allocated to each of the Group’s cash-generatingunits expected to benefit from the business combination in which the goodwill arose. Other indefinite-lived intangible assets are also allocated to the Group’s cash-generating units expected to benefit fromthose intangibles. The cash-generating units to which goodwill and other indefinite-lived intangibleassets have been allocated are tested for impairment annually, or more frequently when there is anindication that the unit may be impaired. If the recoverable amount of the cash-generating unit is lessthan the carrying amount of the unit, the impairment loss is allocated first to reduce the carryingamount of any goodwill allocated to the unit and then pro-rata to the other assets of the unit on thebasis of the carrying amount of each asset in the unit. Impairment losses recognised against goodwillare not reversed in subsequent periods.
Intangible assets with finite lives consist mainly of trademarks and water rights and are amortisedover their useful economic lives.
F-10
Notes to the Consolidated Financial Statements (Continued)
1. Basis of preparation and accounting policies (Continued)
The useful life of trademarks is determined after considering potential limitations that couldimpact the life of the trademark, such as technological and market limitations and the intent ofmanagement. The majority of the Group’s trademarks have been assigned an indefinite useful life asthey have an established sales history in the applicable region, it is the intention of the Group toreceive a benefit from them indefinitely and there is no indication that this will not be the case.
The useful life of franchise agreements is usually based on the term of the respective franchiseagreements. TCCC does not grant perpetual franchise rights outside the United States, however, theGroup believes its franchise agreements, consistent with past experience, will continue to be renewed ateach expiration date and have therefore been assigned indefinite useful lives.
The useful lives, both finite and indefinite, assigned to intangible assets are evaluated on an annualbasis.
Goodwill and fair value adjustments arising on the acquisition of subsidiaries are included in theassets and liabilities of those subsidiaries. These balances are denominated in the functional currency ofthe subsidiary and are translated to euro on a basis consistent with the other assets and liabilities of thesubsidiary.
Property, plant and equipment
All property, plant and equipment is initially recorded at cost and subsequently measured at costless accumulated depreciation and impairment losses. Subsequent expenditure is added to the carryingvalue of the asset when it is probable that future economic benefits, in excess of the original assessedstandard of performance of the existing asset, will flow to the operation. All other subsequentexpenditure is expensed in the period in which it is incurred.
Depreciation is calculated on a straight-line basis to allocate the depreciable amount over theestimated useful life of the assets as follows:
Freehold buildings . . . . . . . . . . . . . . . . . . . . 40 yearsLeasehold buildings and improvements . . . . . Over the lease term, up to 40 yearsProduction equipment . . . . . . . . . . . . . . . . . 4 to 12 yearsVehicles . . . . . . . . . . . . . . . . . . . . . . . . . . . . 5 to 8 yearsComputer hardware and software . . . . . . . . . 3 to 7 yearsMarketing equipment . . . . . . . . . . . . . . . . . . 3 to 10 yearsFixtures and fittings . . . . . . . . . . . . . . . . . . . 8 yearsReturnable containers . . . . . . . . . . . . . . . . . 3 to 12 years
Freehold land is not depreciated as it is considered to have an indefinite life.
Deposits received for returnable containers by customers are accounted for as deposit liabilities.
Residual values and useful lives of assets are reviewed and adjusted if appropriate at each balancesheet date.
F-11
Notes to the Consolidated Financial Statements (Continued)
1. Basis of preparation and accounting policies (Continued)
Impairment of non-financial assets
Goodwill and other indefinite-lived assets are not subject to amortisation but are tested forimpairment at least annually. Property, plant and equipment and other non-financial assets that aresubject to amortisation are reviewed for impairment whenever events or changes in circumstancesindicate that the carrying amount may not be recoverable. An impairment loss is recognised for theamount by which the carrying amount of the asset exceeds its recoverable amount, which is the higherof the asset’s fair value less cost to sell and its value-in-use. For the purposes of assessing impairment,assets are grouped at the lowest level of separately identifiable cash flows.
Borrowing costs
Borrowing costs directly attributable to the acquisition, construction or production of qualifyingassets, which are assets that necessarily take a substantial period of time to be prepared for theirintended use or sale, are added to the cost of those assets, until such time as the assets aresubstantially ready for their intended use or sale. Investment income earned on the temporaryinvestment of specific borrowings pending their use for qualifying assets is deducted from theborrowing costs eligible for capitalisation.
All other borrowing costs are expensed as part of finance costs in the period in which they areincurred.
Investments in associates
Investments in associated undertakings are accounted for by the equity method of accounting.Associated undertakings are all entities over which the Group has significant influence but not control,generally accompanying a shareholding of between 20% to 50% of the voting rights.
The equity method of accounting involves recognising the Group’s share of the associates’ profit orloss for the period in the income statement and its share of the post-acquisition movement in othercomprehensive income is recognized in other comprehensive income. The Group’s interest in eachassociate is carried in the balance sheet at an amount that reflects its share of the net assets of theassociate and includes goodwill on acquisition. When the Group’s share of losses in an associate equalsor exceeds its interest in the associate, the Group does not recognise further losses, unless the Grouphas incurred obligations or made payments on behalf of the associate.
Investment in joint ventures
The Group’s interests in its jointly controlled entities are accounted for using the equity method ofaccounting. In respect of its interests in jointly controlled operations and jointly controlled assets theGroup recognises its proportional share of related assets, liabilities, income and expenses.
F-12
Notes to the Consolidated Financial Statements (Continued)
1. Basis of preparation and accounting policies (Continued)
Other investments
The Group classifies its investments in debt and equity securities into the following categories:financial assets at fair value through profit or loss (‘FVTPL’), held-to-maturity and available-for-sale.The classification depends on the purpose for which the investment was acquired. FVTPL andavailable-for-sale financial assets are carried at fair value. Investments that are acquired principally forthe purpose of generating a profit from short-term fluctuations in price are classified as FVTPLinvestments and included in current assets. Investments with a fixed maturity that management has theintent and ability to hold to maturity are classified as held-to-maturity and are included in non-currentassets, except for those with maturities within twelve months from the balance sheet date, which areclassified as current assets. Investments intended to be held for an indefinite period of time, which maybe sold in response to needs for liquidity or changes in interest rates, are classified as available-for-saleand are classified as non-current assets, unless they are expected to be realised within twelve months ofthe balance sheet date.
Investments are recognised using trade date accounting. They are recognised on the day the Groupcommits to purchase the investments and derecognised on the day when the Group commits to sell theinvestments. The cost of purchase includes transaction costs for investments other than those carried atFVTPL. For investments traded in active markets, fair value is determined by reference to stockexchange quoted bid prices. For other investments, fair value is estimated by reference to the currentmarket value of similar instruments or by reference to the discounted cash flows of the underlying netassets.
Gains and losses on investments classified as FVTPL are recognised in the income statement inthe period in which they arise. Unrealised gains and losses on available-for-sale financial assets arerecognised in other comprehensive income, except for impairment losses and foreign exchange gainsand losses on monetary financial assets that are recognized in the income statement, until the financialassets are derecognised at which time the cumulative gains or losses previously recognized in equity arereclassified to the income statement.
Held-to-maturity investments are carried at amortised cost using the effective interest rate method.Gains and losses on held-to-maturity investments are recognised in the income statement, when theinvestments are derecognised or impaired.
Non-current assets held for sale
Non-current assets and disposal groups are classified as held for sale if their carrying amount willbe principally recovered through a sale transaction rather than through continuing use. This conditionis regarded as met only when the sale is highly probable and the asset (or disposal group) is availablefor immediate sale in its present condition. In order for a sale to be considered highly probable,management must be committed to the sale, an active programme to locate a buyer and complete theplan has been initiated, and the sale is expected to be completed within one year from the date ofclassification.
Non-current assets and disposal groups classified as held for sale are measured at the lower of theindividual assets’ previous carrying amount and their fair value less costs to sell.
Inventories
Inventories are stated at the lower of cost and net realisable value.
F-13
Notes to the Consolidated Financial Statements (Continued)
1. Basis of preparation and accounting policies (Continued)
Cost for raw materials and consumables is determined either on a first-in, first-out or weightedaverage basis, depending on the type of inventory. Cost for work in progress and finished goods iscomprised of the cost of direct materials and labour plus attributable overhead costs. Cost includes allcosts incurred to bring the product in its present location and condition.
Net realisable value is the estimated selling price in the ordinary course of business, less theestimated costs necessary to complete and sell the inventory.
Trade receivables
Trade receivables are initially recognised at fair value and subsequently measured at amortisedcost. A provision for doubtful debts is established when there is objective evidence that the Group willnot be able to collect all amounts due, according to the original terms of the trade receivable.Significant financial difficulties of the debtor, probability that the debtor will enter into bankruptcy orfinancial reorganisation and default or delinquency in payments are considered indicators that the tradereceivable could be uncollectible. The amount of the provision is the difference between thereceivable’s carrying amount and the present value of its estimated future cash flows, discounted at theoriginal effective interest rate. The carrying amount of the receivable is reduced by the amount of theprovision, which is recognised as part of operating expenses. If a trade receivable ultimately becomesuncollectible, it is written off initially against any provision made in respect of that receivable with anyexcess recognised as part of operating expenses. Subsequent recoveries of amounts previously writtenoff or provisions no longer required are credited against operating expenses.
Trade payables
Trade payables are recognised initially at fair value and, when applicable, subsequently measured atamortised cost using the effective interest rate method.
Foreign currency and translation
The individual financial statements of each Group entity are presented in the currency of theprimary economic environment in which the entity operates (its functional currency). For the purposeof the consolidated financial statements, the results and financial position of each entity are expressedin euro, which is the functional currency of the Coca-Cola Hellenic and the presentation currency forthe consolidated financial statements.
The assets and liabilities of foreign subsidiaries are translated into euro at the exchange rate rulingat the balance sheet date. The results of foreign subsidiaries are translated into euro using the averagemonthly exchange rate. The exchange differences arising on translation are recorded directly to equityas part of the exchange equalisation reserve. On disposal of a foreign entity, accumulated exchangedifferences are recognised as a component of the gain or loss on disposal.
Transactions in foreign currencies are recorded at the rate ruling at the date of transaction.Monetary assets and liabilities denominated in foreign currencies are remeasured at the rate ofexchange ruling at the balance sheet date. All gains and losses arising on remeasurement are includedin net profit or loss for the period, except for exchange differences arising on assets and liabilitiesclassified as cash flow hedges which are deferred in equity until the occurrence of the hedgedtransaction, at which time they are recognised in the income statement.
F-14
Notes to the Consolidated Financial Statements (Continued)
1. Basis of preparation and accounting policies (Continued)
Cash and cash equivalents
Cash and cash equivalents comprise cash balances and highly liquid investments with a maturity ofthree months or less when purchased. Bank overdrafts are classified as short-term borrowings in thebalance sheet and for the purpose of the cash flow statement.
Borrowings
All loans and borrowings are initially recognised at the fair value of the consideration received netof transaction costs associated with the loan or borrowing.
After initial recognition, all interest-bearing loans and borrowings are subsequently measured atamortised cost. Amortised cost is calculated using the effective interest rate method whereby anydiscount, premium or transaction costs associated with a loan or borrowing is amortised to the incomestatement over the borrowing period. Gains or losses associated with loans and borrowings carried atamortised cost, which are not part of a hedging relationship, are recognised in the income statementover the borrowing period and when the loans and borrowings are derecognised or impaired.
Derivative financial instruments
The Group uses derivative financial instruments, including interest rate, currency and commodityderivatives, to manage interest, currency and commodity price risk associated with the Group’sunderlying business activities. The Group does not use its derivative financial instruments for anytrading activities.
All derivative financial instruments are initially recognised in the balance sheet at fair value andare subsequently remeasured at their fair value. Changes in the fair value of derivative financialinstruments are recognised at each reporting date either in the income statement or in equity,depending on whether the derivative financial instrument qualifies for hedge accounting, and if so,whether it qualifies as a fair value hedge or a cash flow hedge. All derivative financial instruments thatare not part of an effective hedging relationship (undesignated hedges) are classified as assets orliabilities at FVTPL.
At the inception of a hedge transaction the Group documents the relationship between thehedging instrument and the hedged item, as well as its risk management objective and strategy forundertaking the hedge transaction. This process includes linking the derivative financial instrumentdesignated as a hedging instrument to the specific asset, liability, firm commitment or forecasttransaction. Both at the hedge inception and on an ongoing basis, the Group assesses and documentswhether the derivative financial instrument used in the hedging transaction is highly effective inoffsetting changes in fair value or cash flow of the hedged item.
Changes in the fair values of derivative financial instruments that are designated and qualify as fairvalue hedges and are effective, are recorded in the income statement, together with the changes in thefair values of the hedged items that relate to the hedged risks. Changes in the fair value of derivativefinancial instruments that are designated and effective as hedges of future cash flows are recogniseddirectly in equity and the ineffective portion is recognised immediately in profit or loss. Amountsrecognised directly in equity are recycled to profit and loss as the related asset acquired or liabilityassumed affects profit and loss. Changes in the fair values of derivative financial instruments that donot qualify for hedge accounting are recognised in the income statement as they arise. Regular waypurchases and sales of financial assets are accounted for at their trade date.
F-15
Notes to the Consolidated Financial Statements (Continued)
1. Basis of preparation and accounting policies (Continued)
Hedge accounting is discontinued when the hedging instrument expires or is sold, terminated, orexercised, or no longer qualifies for hedge accounting. At that time, any cumulative gain or loss on thehedging instrument recognised in equity is retained in equity until the forecast transaction occurs. If ahedged transaction is no longer expected to occur, the net cumulative gain or loss recognised in equityis transferred to profit or loss for the period.
Leases
Leases of property, plant and equipment, where the Group has substantially all the risks andrewards of ownership, are classified as finance leases. Other leases are classified as operating leases.
Rentals paid under operating leases are charged to the income statement on a straight-line basisover the lease term.
Finance leases are capitalised at the inception of the lease at the lower of the fair value of theleased assets and the present value of the minimum lease payments. Each lease payment is allocatedbetween liability and finance charges to achieve a constant rate on the finance balance outstanding.The corresponding lease obligations, net of finance charges, are included in long-term borrowings. Theinterest element of the finance cost is charged to the income statement over the lease period, so as toproduce a constant periodic rate of interest on the remaining balance of the liability for each period.Property, plant and equipment acquired under finance lease is depreciated over the shorter of theuseful life of the asset and the lease term. The useful life for leased assets corresponds with the Grouppolicy for the depreciable life of property, plant and equipment.
Provisions
Provisions are recognised as follows: when the Group has a present obligation (legal orconstructive) as a result of a past event; when it is probable that an outflow of resources embodyingeconomic benefits will be required to settle the obligation; and when a reliable estimate can be madeof the amount of the obligation. Where the Group expects a provision to be reimbursed, for exampleunder an insurance contract, the reimbursement is recognised as a separate asset when suchreimbursement is virtually certain. If the effect of the time value of money is material, provisions aredetermined by discounting the expected future cash flows at a pre-tax rate that reflects current marketassessments of the time value of money and the risks specific to the liability. Where discounting isused, the increase in the provision due to the passage of time is recognised as an interest expense.
Offsetting financial instruments
The Group offsets financial assets and financial liabilities to the net amount reported in thebalance sheet when it currently has a legally enforceable right to offset the recognised amounts and itintends to settle on a net basis or to realise the asset and settle the liability simultaneously.
Employee benefits
The Group operates a number of defined benefit and defined contribution pension plans in itsterritories.
The defined benefit plans are made up of both funded and unfunded pension plans and employeeleaving indemnities. The assets of funded plans are generally held in separate trustee-administeredfunds and are financed by payments from employees and/or the relevant Group companies.
F-16
Notes to the Consolidated Financial Statements (Continued)
1. Basis of preparation and accounting policies (Continued)
The liability recognised in the balance sheet in respect of defined benefit plans is the present valueof the defined benefit obligation at the balance sheet date less the fair value of the plan assets,together with adjustments for unrecognised actuarial gains or losses and past service costs. The value ofany defined benefit asset recognized is restricted to the sum of any past service costs and the presentvalue of any economic benefits available in the form of refunds from the plan or reductions in thefuture contributions to the plan.
For defined benefit pension plans, pension costs are assessed using the projected unit creditmethod. Actuarial gains and losses are recognised as income or expense, when the cumulativeunrecognised actuarial gains or losses for each individual plan exceed 10% of the greater of the definedbenefit obligation or the fair value of plan assets. The defined benefit obligations are measured at thepresent value of the estimated future cash outflows using interest rates of corporate or governmentbonds, depending on whether or not there is a deep market for corporate bonds in the relevantcountry, which have terms to maturity approximating the terms of the related liability. Actuarial gainsand losses arising from experience adjustments or changes in assumptions are recognised over theremaining vesting period, which represents the average remaining service life of participatingemployees. Past service cost is recognised immediately to the extent that the benefits are already vestedand otherwise amortised over the remaining vesting period.
A number of the Group’s operations have other long service benefits in the form of jubilee plans.These plans are measured at the present value of the estimated future cash outflows with immediaterecognition of actuarial gains and losses.
The Group’s contributions to the defined contribution pension plans are charged to the incomestatement in the period to which the contributions relate.
Share-based payments
Coca-Cola Hellenic issues equity-settled (stock options) and cash-settled (stock appreciation rights)share-based payments to its senior managers.
Equity-settled share-based payments are measured at fair value at the date of grant using abinomial stock option valuation model. Fair value reflects the parameters of the compensation plan, therisk-free interest rate, the expected volatility, the dividend yield and the early exercise experience of theGroup’s plans. Expected volatility is determined by calculating the historical volatility of Coca-ColaHellenic’s share price over previous years. The fair value determined at the grant date of the equity-settled share-based payments is expensed on a straight-line basis over the vesting period.
For cash-settled share-based payments, a liability equal to the portion of the vested stockappreciation rights is recognised at the current fair value determined at each balance sheet date usingthe same model and inputs as used for determining the fair value of stock options, with the exceptionof the risk-free interest rate, as described in Note 27.
In addition, the Group operates a stock purchase plan, in which eligible employees can participate.The Group makes contributions to a trust for participating employees and recognises expenses over thevesting period of the contributed shares. Any unvested shares held by the trust are owned by theGroup and are recorded at cost in the balance sheet, within equity, until they vest.
F-17
Notes to the Consolidated Financial Statements (Continued)
1. Basis of preparation and accounting policies (Continued)
Termination benefits
Termination benefits are payable whenever an employee’s employment is terminated before thenormal retirement date or whenever an employee accepts voluntary redundancy in exchange for thesebenefits. The Group recognises termination benefits when it is evidently committed to either terminatethe employment of current employees or to provide termination benefits as a result of an offer made toencourage voluntary redundancy.
Taxes
The current income tax charge is calculated on the basis of the tax laws enacted or substantivelyenacted at the balance sheet date in the countries where the Company’s subsidiaries, joint ventures andassociates operate and generate taxable income. Management periodically evaluates positions taken intax returns with respect to situations in which applicable tax regulations are subject to interpretationand establishes provisions where appropriate, on the basis of amounts expected to be paid to the taxauthorities.
Deferred tax is provided using the liability method for all temporary differences arising betweenthe tax bases of assets and liabilities and their carrying values for financial reporting purposes.However, the deferred tax is not accounted for if it arises from initial recognition of an asset or liabilityin a transaction other than a business combination that at the time of the transaction affects neitheraccounting nor taxable profit or loss. Tax rates enacted or substantially enacted at the balance sheetdate are those that are expected to apply when the deferred tax asset is realised or deferred tax liabilityis settled.
Deferred tax assets are recognised to the extent that it is probable that future taxable profit will beavailable against which the temporary differences can be utilised.
Deferred tax is provided on temporary differences arising on investments in subsidiaries, associatesand joint ventures, except where the timing of the reversal of the temporary difference can becontrolled by the Group, and it is probable that the temporary difference will not reverse in theforeseeable future.
Franchise incentive arrangements
TCCC, at its sole discretion, provides the Group with various incentives, including contributionstoward the purchase of cold drink equipment. Payments are made on placement of coolers and arebased on franchise incentive arrangements. The terms and conditions of these arrangements requirereimbursement if certain conditions stipulated in the agreements are not met, including minimumvolume through-put requirements. Support payments received from TCCC for the placement of colddrink equipment are deducted from the cost of the related asset.
Share capital
Coca-Cola Hellenic has only one class of shares, ordinary shares. When new shares are issued, theyare recorded in share capital at their par value. The excess of the issue price over the par value isrecorded to the share premium reserve.
F-18
Notes to the Consolidated Financial Statements (Continued)
1. Basis of preparation and accounting policies (Continued)
Incremental external costs directly attributable to the issue of new shares or to the process ofreturning capital to shareholders are recorded in equity as a deduction, net of tax, in the sharepremium reserve.
Dividends
Dividends are recorded in the Group’s consolidated financial statements in the period in whichthey are approved by the Group’s shareholders, with the exception of the statutory minimum dividend.
Under Greek corporate legislation, companies are required to declare dividends annually of atleast 35% of unconsolidated adjusted after-tax IFRS profits. This statutory minimum dividend isrecognised as a liability.
Comparative Figures
Comparative figures have been reclassified where necessary to conform with changes inpresentation in the current year.
Accounting pronouncements adopted in 2010
In the current year, the Group has adopted all of the new and revised standards andinterpretations issued by the IASB and the International Financial Reporting InterpretationsCommittee (‘IFRIC’) of the IASB that are relevant to its operations and effective for accountingperiods beginning on or after 1 January 2010. None of these standards and interpretations had asignificant effect on the consolidated financial statements of the Company.
In January 2008, the IASB issued a revised version of IFRS 3, Business Combinations. The revisedstandard still requires the purchase method of accounting to be applied to business combinations butintroduced some changes. For example, contingent consideration should be measured at fair value atthe date of acquisition and subsequently remeasured to fair value with changes recognised in profit orloss. Goodwill may be calculated based on the parent’s share of net assets or it may include goodwillrelated to the minority interest. All transaction costs are expensed as incurred. The standard isapplicable to business combinations occurring in annual periods beginning on or after 1 July 2009.Assets and liabilities arising from business combinations occurring before the date of adoption by theGroup have not been restated and thus there was no effect on the Group’s reported income or netassets on adoption. As there were no business combinations effected in 2010, the revised standard hadno material impact on the Group’s consolidated financial statements.
In January 2008, the IASB issued an amendment to IAS 27, Consolidated and Separate FinancialStatements. The amendment relates primarily to the accounting for non-controlling interests and theloss of control of a subsidiary. The amendment requires the effects of all transactions withnon-controlling interests to be recorded in equity if there is no change in control and these transactionswill no longer result in goodwill or gains and losses. Additionally, any remaining interest in anon-controlling interest is re-measured to fair value. The amended standard is applicable to annualperiods beginning on or after 1 July 2009. There was no material impact to the Group’s consolidatedfinancial statements as a result of adopting this amendment.
F-19
Notes to the Consolidated Financial Statements (Continued)
1. Basis of preparation and accounting policies (Continued)
In November 2008, the IFRIC issued IFRIC 17, Distribution of Non-cash Assets to Owners. Theinterpretation applies to pro-rata distributions of non-cash assets to owners and clarifies the recognitionand measurement criteria for dividends. IFRIC 17 is effective for annual periods beginning on or after1 July 2009. There was no impact to the Group’s consolidated financial statements as a result ofadopting this interpretation.
In January 2009, the IFRIC issued IFRIC 18, Transfers of Assets from Customers. The IFRICrelates to agreements in which an entity receives from a customer an item of property, plant, andequipment that the entity must then use either to connect the customer to a network or to provide thecustomer with ongoing access to a supply of goods or services or both. If the transferred asset meetsthe definition of an asset, it must be recorded by the entity at its fair value on the date of the transfer.IFRIC 18 is effective for transfers received on or after 1 July 2009. There was no impact to theGroup’s consolidated financial statements as a result of adopting this interpretation.
In April 2009, the IASB issued an amendment to IFRS 2, Share Based Payment as part of itsannual improvements process published in April 2009. The standard has been amended to confirm thatthe contribution of a business on the formation of a joint venture and common control transactions arenot within the scope of IFRS 2. The amended standard is effective for annual periods beginning on orafter 1 July 2009. There was no impact to the Group’s consolidated financial statements as a result ofadopting this amendment.
In April 2009, the IASB issued an amendment to IFRS 5, Non-Current Assets Held for Sale andDiscontinued Operations as part of its annual improvements process published in April 2009. Theamendment specifies the disclosures required in respect of non-current assets classified as held for saleor discontinued operations. The amended standard is effective prospectively for annual periodsbeginning on or after 1 January 2010. There was no material impact to the Group’s consolidatedfinancial statements as a result of adopting this amendment.
In April 2009, the IASB issued an amendment to IFRS 8, Operating Segments as part of its annualimprovements process published in April 2009. The standard has been amended to clarify that ameasure of segment assets should be disclosed if that amount is regularly provided to the chiefoperating decision maker. The amended standard is effective for annual periods beginning on or after1 January 2010. There was no impact to the Group’s consolidated financial statements as a result ofadopting this amendment.
In April 2009, the IASB issued an amendment to IAS 1, Presentation of Financial Statements aspart of its annual improvements process published in April 2009. The standard has been amended toclarify the classification of the liability component of a convertible instrument as current ornon-current. If an unconditional right to defer settlement of a liability for at least twelve months afterthe reporting period does not exist, the liability should be classified as current. The amended standardis effective for annual periods beginning on or after 1 January 2010. There was no impact to theGroup’s consolidated financial statements as a result of adopting this amendment.
In April 2009, the IASB issued an amendment to IAS 7, Statement of Cash Flows as part of itsannual improvements process published in April 2009. The standard has been amended to clarify thedisclosure of cash flows arising from investing activities to include only expenditures that result in arecognised asset on the balance sheet. The amended standard is effective for periods beginning on orafter 1 January 2010. There was no impact to the Group’s consolidated financial statements as a resultof adopting this amendment.
F-20
Notes to the Consolidated Financial Statements (Continued)
1. Basis of preparation and accounting policies (Continued)
In April 2009, the IASB issued an amendment to IAS 17, Leases as part of its annualimprovements process published in April 2009. The standard has been amended to remove therebuttable presumption that land leases are operating leases unless title is expected to pass to thelessee at the end of the lease term. The amended standard is effective for annual periods beginning onor after 1 January 2010. There was no material impact to the Group’s consolidated financial statementsas a result of adopting this amendment.
In April 2009, the IASB issued an amendment to IAS 36, Impairment of Assets as part of its annualimprovements process published in April 2009. The amendment clarifies the allocation of goodwill toan operating segment in response to the amendment of IFRS 8, Operating Segments. The amendedstandard is effective for annual periods beginning on or after 1 January 2010. The Group tests forimpairment at the cash generating unit level which corresponds to the operating segment level.Accordingly, the adoption of this amendment did not have an impact on the Group’s consolidatedfinancial statements.
In April 2009, the IASB issued an amendment to IAS 38, Intangible Assets as part of its annualimprovements process published in April 2009. The amendment clarifies the description of valuationtechniques commonly used to measure intangible assets at fair value when assets are not traded in anactive market and it permits the grouping of intangible assets as a single asset if each asset has similaruseful economic lives. The amended standard is effective for annual periods beginning on or after1 July 2009. There was no impact to the Group’s consolidated financial statements as a result ofadopting this amendment.
In April 2009, the IASB issued amendments to IAS 39, Financial Instruments: Recognition andMeasurement as part of its annual improvements process published in April 2009. The amendments tothe standard provide a scope exemption for forward contracts between an acquirer and a sellingshareholder to buy or sell an acquiree that will result in a business combination. The amendments alsoclarify that the gains or losses on a hedged instrument should be reclassified from equity to profit orloss during the period that the hedged forecast cash flows affect profit or loss. In addition, theamendments provide clarification on treating loan pre-payment penalties as closely related derivatives.Furthermore the amendment clarifies that an entity is permitted to designate a portion of the fair valuechanges or cash flow variability of a financial instrument as a hedged item. This also covers thedesignation of inflation as a hedged risk or portion in particular situations. The amended standard iseffective for annual periods beginning on or after 1 January 2010. There was no impact to the Group’sconsolidated financial statements as a result of adopting this amendment.
In April 2009 the IASB issued an amendment to IFRIC 16, Hedges of a Net Investment in a ForeignOperation as part of its annual improvements process published in April 2009. The amendment allowsentities to designate as a hedging instrument in a net investment in a foreign operation, an instrumentthat is held by the foreign operation that is being hedged. IFRIC 16 is effective for annual periodsbeginning on or after 1 July 2009. There was no impact to the Group’s consolidated financialstatements as a result of adopting this interpretation.
F-21
Notes to the Consolidated Financial Statements (Continued)
1. Basis of preparation and accounting policies (Continued)
In June 2009, the IASB issued amendments to IFRS 2, Share-based Payment. The amendmentsclarify how an individual subsidiary of a Group should account for cash-settled share-based paymentarrangements in its own financial statements. The amendments state that an entity that receives goodsor services in a share-based payment arrangement must account for those goods or services no matterwhich entity in the Group settles the transaction, and no matter whether the transaction is settled inshares or cash. In IFRS 2 a ‘Group’ has the same meaning as in IAS 27 Consolidated and SeparateFinancial Statements, that is, it includes only a parent and its subsidiaries. The amended standard iseffective for annual periods beginning on or after 1 January 2010 and must be applied retrospectively.The amendments incorporate guidance previously included in IFRIC 8, Scope of IFRS 2 and IFRIC 11,IFRS 2—Group and Treasury Share Transactions which have already been adopted by the Group. Assuch, there was no impact to the Group’s consolidated financial statements as a result of adoptingthis amendment.
Accounting pronouncements not yet adopted
At the date of approval of these consolidated financial statements, the following standards andinterpretations relevant to Company’s operations were issued but not yet effective:
In November 2009, the IASB issued IFRS 9, Financial Instruments as the first step in its project toreplace IAS 39, Financial Instruments: Recognition and Measurement. The standard introduces newrequirements for classifying and measuring financial assets and eliminates the available-for-sale andheld-to-maturity categories. It separates financial assets into two categories; those measured atamortised cost and those measured at fair value. On 28 October 2010, the IASB reissued IFRS 9,incorporating new requirements on accounting for financial liabilities. Specifically, financial liabilitiesheld for trading are measured at FVTPL, and all other financial liabilities are measured at amortisedcost unless the fair value option is applied. Any gains and losses on financial liabilities designated atFVTPL shall be split into the amount of change in the fair value that is attributable to changes in thecredit risk of the liability, which shall be presented in other comprehensive income, and the remainingamount of change in the fair value of the liability which shall be presented in profit or loss. In additionthe standard carries over from IAS 39 the requirements for derecognition of financial assets andfinancial liabilities. IFRS 9 will be effective for annual periods beginning on or after 1 January 2013.The standard has not yet been adopted by the EU. The Group is currently evaluating the impact thisstandard will have on its consolidated financial statements.
In November 2009, the IFRIC issued amendments to IFRIC 14, The Limit on a Defined BenefitAsset, Minimum Funding Requirements and their Interaction. The amendments correct an unintendedconsequence of IFRIC 14, originally issued in 2007, whereby in some circumstances entities are notpermitted to recognise as an asset some voluntary prepayments for minimum funding contributions.The amended interpretation is effective for periods beginning on or after 1 January 2011. The Groupdoes not have material assets from voluntary prepayments for minimum funding contributions andtherefore the amendments are not expected to have a material impact on the Group’s consolidatedfinancial statements.
F-22
Notes to the Consolidated Financial Statements (Continued)
1. Basis of preparation and accounting policies (Continued)
In November 2009, the IFRIC issued IFRIC 19, Extinguishing Financial Liabilities with EquityInstruments. The interpretation addresses accounting used by entities issuing equity instruments in orderto settle, in full or in part, a financial liability. The interpretation states that if a debtor issues an equityinstrument to a creditor to extinguish all or part of a financial liability those equity instruments are‘‘consideration paid’’ in accordance with IAS 39 and the debtor should derecognise the financialliability fully or partly. The interpretation also states that the debtor should measure the equityinstruments issued to the creditor at fair value and the debtor should recognise in profit or loss thedifference between the carrying amount of the financial liability (or part) extinguished and themeasurement of the equity instruments issued. The interpretation is effective for annual periodsbeginning on or after 1 July 2010, with earlier application permitted. The interpretation is not expectedto have an impact on the Group’s consolidated financial statements.
In November 2009, the IASB issued a revised version of IAS 24, Related Party Disclosures. Therevisions to the standard simplify the disclosure requirements for government-related entities and clarifythe definition of a related party. The revised standard is effective for periods beginning on or afterJanuary 1, 2011. The revised standard is not expected to have a material impact on the Group’sconsolidated financial statements.
In May 2010, the IASB issued amendments to IAS 1, Presentation of Financial Statements as part ofits annual improvements process published in May 2010. The amendments to the standard clarify thatan entity may present the analysis of other comprehensive income by item either in the statement ofchanges in equity or in the notes to the financial statements. The amended standard is effective forperiods beginning on or after January 1, 2011. The amended standard has not yet been adopted by theEU. The amended standard will affect the presentation of other comprehensive income on the Group’sconsolidated financial statements.
In May 2010, the IASB issued amendments to IFRS 3, Business Combinations as part of its annualimprovements process published in May 2010.The amendments to the standard specify that the optionto measure non-controlling interests either at fair value or at the proportionate share of the acquiree’snet identifiable assets at the acquisition date applies only to non-controlling interests that are presentownership interests and entitle their holders to a proportionate share of the acquiree’s net assets in theevent of liquidation. All other components of non-controlling interests should be measured at theiracquisition date fair value. Furthermore, the amendments to the standard clarify the treatment of theun-replaced and voluntary replaced share based payment awards and also clarify the transitionalrequirements for contingent consideration from a business combination that occurred before theeffective date of IFRS 3(2008). The amended standard is effective for annual periods beginning on orafter July 1, 2010. The amended standard has not yet been adopted by the EU. The amendments to thestandard will have no impact on the Group’s consolidated financial statements.
In May 2010, the IASB issued amendments to IFRS 7, Financial Instruments: Disclosures as part ofits annual improvements process published in May 2010. The amendments to the standard encouragespecific qualitative disclosures and clarify the required level of disclosure around credit risk andcollateral held and provide relief from disclosure of renegotiated loans. The amended standard iseffective for annual periods beginning on or after January 1, 2011. The amended standard has not yetbeen adopted by the EU. The amendments to the standard are not expected to have a material impacton the Group’s consolidated financial statements.
F-23
Notes to the Consolidated Financial Statements (Continued)
1. Basis of preparation and accounting policies (Continued)
In May 2010, the IASB issued amendments to IAS 27, Consolidated and Separate FinancialStatements as part of its annual improvements process published in May 2010. The amendments to thestandard provide clarification on the transitional requirements resulting from the amendments ofIAS 27 (2008). The amended standard is effective for annual periods beginning on or after July 1, 2010.The amended standard has not yet been adopted by the EU. The amendments to the standard are notexpected to have a material impact on the Group’s consolidated financial statements.
In May 2010, the IASB issued amendments to IAS 34, Interim Financial Reporting as part of itsannual improvements process published in May 2010. The amendments to the standard provide furtherclarification that disclosures for significant events and transactions in interim periods should update therelevant information presented in the most recent annual financial report. The amended standard iseffective for annual periods beginning on or after January 1, 2011. The standard has not yet beenadopted by the EU. The amendments to the standard are not expected to have a material impact onthe Group’s consolidated financial statements.
In May 2010, the IASB issued amendments to IFRIC 13, Customer Loyalty Programmes as part ofits annual improvements process published in May 2010. The amendments to the interpretation clarifythat the ‘fair value’ of award credits should take into account i) the amount of discounts or incentivesthat would otherwise be offered to customers who have not earned award credits from an initial sale,and ii) any expected forfeitures. The amended interpretation is effective for annual periods beginningon or after January 1, 2011. The amended interpretation has not yet been adopted by the EU. Theamendments to the interpretation are not expected to have a material impact on the Group’sconsolidated financial statements.
In October 2010, the IASB issued amendments to IFRS 7, Financial Instruments: Disclosures aspart of its comprehensive review of off balance sheet activities. The amendments require additionaldisclosures of the full or partial derecognition of financial assets that are transferred to a counterpartyunder certain conditions. Specifically, the amendments require disclosures of the relationship betweentransferred financial assets that are not derecognised in their entirety and the associated liabilities; aswell as disclosure of the nature of, and risks associated with, an entity’s continuing involvement inderecognised financial assets. The amended standard is effective for annual periods beginning on orafter July 1, 2011. The standard has not yet been adopted by the EU. The amendment to the standardare not expected to have a material impact on the Group’s consolidated financial statements.
F-24
Notes to the Consolidated Financial Statements (Continued)
2. Exchange rates
The Group’s reporting currency is the euro (A). Coca-Cola Hellenic translates the incomestatements of subsidiary operations to euro at average exchange rates and the balance sheets at theclosing exchange rates at 31 December. The principal exchange rates used for transaction andtranslation purposes in respect of one euro are:
Average Average Average Closing Closing2010 2009 2008 2010 2009
US dollar . . . . . . . . . . . . . . . . . . . . . . . . . . . . . . . . . . . . . 1.32 1.40 1.48 1.31 1.44UK sterling . . . . . . . . . . . . . . . . . . . . . . . . . . . . . . . . . . . 0.85 0.89 0.80 0.85 0.90Polish zloty . . . . . . . . . . . . . . . . . . . . . . . . . . . . . . . . . . . . 4.01 4.34 3.55 3.99 4.15Nigerian naira . . . . . . . . . . . . . . . . . . . . . . . . . . . . . . . . . 196.41 206.76 176.81 196.01 213.71Hungarian forint . . . . . . . . . . . . . . . . . . . . . . . . . . . . . . . . 276.38 279.86 252.60 279.30 272.70Swiss franc . . . . . . . . . . . . . . . . . . . . . . . . . . . . . . . . . . . . 1.38 1.51 1.58 1.25 1.49Russian rouble . . . . . . . . . . . . . . . . . . . . . . . . . . . . . . . . . 40.11 44.18 36.69 39.95 43.33Romanian leu . . . . . . . . . . . . . . . . . . . . . . . . . . . . . . . . . . 4.22 4.23 3.69 4.29 4.21Ukrainian hryvnia . . . . . . . . . . . . . . . . . . . . . . . . . . . . . . . 10.49 10.92 7.75 10.50 11.47Czech crown . . . . . . . . . . . . . . . . . . . . . . . . . . . . . . . . . . . 25.31 26.45 25.10 25.27 26.45Serbian Dinar . . . . . . . . . . . . . . . . . . . . . . . . . . . . . . . . . . 103.40 94.12 81.59 105.88 96.30
3. Segmental Analysis
Coca-Cola Hellenic has one business, being the production, distribution and sale of non-alcoholic,ready-to-drink beverages. The Group operates in 28 countries and its financial results are reported inthe following three reportable segments:
Established countries: Austria, Cyprus, Greece, Italy, Northern Ireland, Republic of Ireland andSwitzerland.
Developing countries: Croatia, Czech Republic, Estonia, Hungary, Latvia, Lithuania, Poland,Slovakia and Slovenia.
Emerging countries: Armenia, Belarus, Bosnia and Herzegovina, Bulgaria, FYROM, Moldova,Montenegro, Nigeria, Romania, Russia, Serbia and Ukraine.
F-25
Notes to the Consolidated Financial Statements (Continued)
3. Segmental Analysis (Continued)
The Group’s operations in each of these segments have similar levels of political and economicstability and development, regulatory environments, growth opportunities, customers and distributioninfrastructures. The accounting policies of the Group’s reportable segments are the same as thosedescribed in Note 1. The Group’s Chief Operating Decision Maker is its operating committee, whichevaluates performance and allocates resources based on operating profit.
There are no material amounts of sales or transfers between the Group’s segments. In additionthere are no customers who represent more than 5% of the total balance of trade receivables for theGroup.
2010 2009 2008Year ended 31 December Note E million E million E million
Volume in unit cases(1)
Established . . . . . . . . . . . . . . . . . . . . . . . . . . . . . . . . . . . . . . . . . 718.2 743.2 692.1Developing . . . . . . . . . . . . . . . . . . . . . . . . . . . . . . . . . . . . . . . . . 391.7 388.3 406.6Emerging . . . . . . . . . . . . . . . . . . . . . . . . . . . . . . . . . . . . . . . . . . 990.1 937.8 1,016.8
Total volume in unit cases . . . . . . . . . . . . . . . . . . . . . . . . . . . . . . 2,100.0 2,069.3 2,115.5
Net sales revenueEstablished . . . . . . . . . . . . . . . . . . . . . . . . . . . . . . . . . . . . . . . . . 2,834.6 2,927.8 2,704.0Developing . . . . . . . . . . . . . . . . . . . . . . . . . . . . . . . . . . . . . . . . . 1,140.0 1,149.1 1,348.4Emerging . . . . . . . . . . . . . . . . . . . . . . . . . . . . . . . . . . . . . . . . . . 2,819.0 2,466.7 2,928.3
Total net sales revenue . . . . . . . . . . . . . . . . . . . . . . . . . . . . . . . . . 6,793.6 6,543.6 6,980.7
(1) One unit case corresponds to approximately 5.678 litres or 24 servings, being a typically usedmeasure of volume. Volume data is derived from unaudited operational data.
F-26
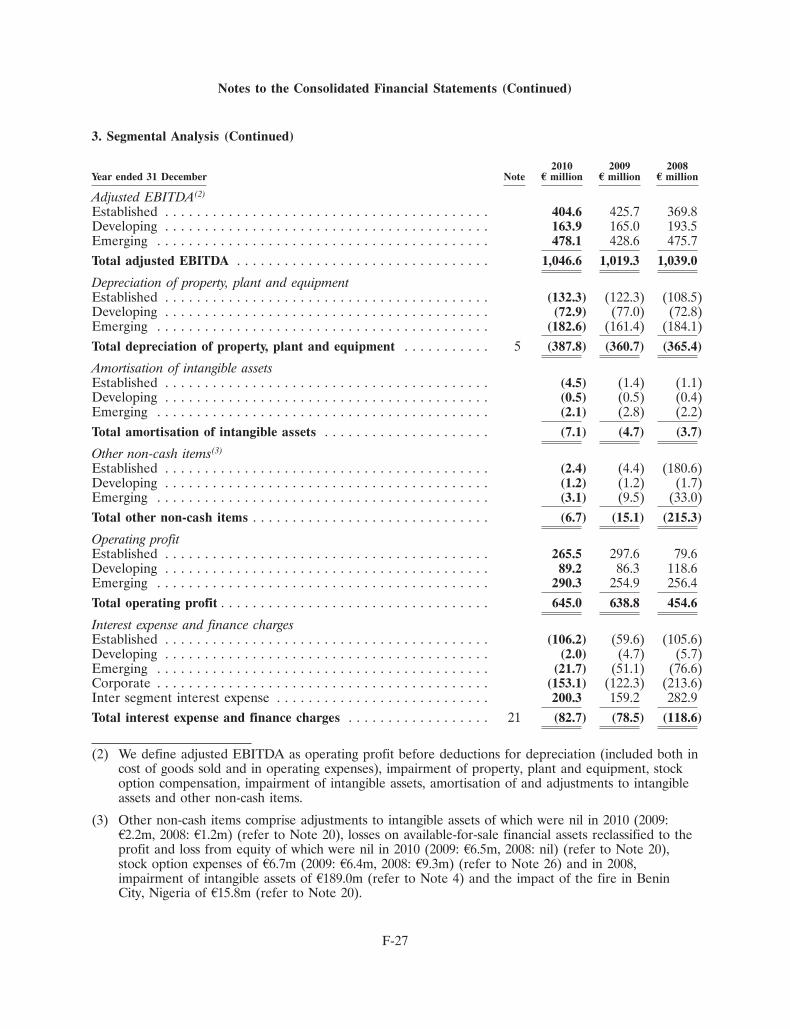
Notes to the Consolidated Financial Statements (Continued)
3. Segmental Analysis (Continued)
2010 2009 2008Year ended 31 December Note E million E million E million
Adjusted EBITDA(2)
Established . . . . . . . . . . . . . . . . . . . . . . . . . . . . . . . . . . . . . . . . . 404.6 425.7 369.8Developing . . . . . . . . . . . . . . . . . . . . . . . . . . . . . . . . . . . . . . . . . 163.9 165.0 193.5Emerging . . . . . . . . . . . . . . . . . . . . . . . . . . . . . . . . . . . . . . . . . . 478.1 428.6 475.7Total adjusted EBITDA . . . . . . . . . . . . . . . . . . . . . . . . . . . . . . . . 1,046.6 1,019.3 1,039.0
Depreciation of property, plant and equipmentEstablished . . . . . . . . . . . . . . . . . . . . . . . . . . . . . . . . . . . . . . . . . (132.3) (122.3) (108.5)Developing . . . . . . . . . . . . . . . . . . . . . . . . . . . . . . . . . . . . . . . . . (72.9) (77.0) (72.8)Emerging . . . . . . . . . . . . . . . . . . . . . . . . . . . . . . . . . . . . . . . . . . (182.6) (161.4) (184.1)Total depreciation of property, plant and equipment . . . . . . . . . . . 5 (387.8) (360.7) (365.4)
Amortisation of intangible assetsEstablished . . . . . . . . . . . . . . . . . . . . . . . . . . . . . . . . . . . . . . . . . (4.5) (1.4) (1.1)Developing . . . . . . . . . . . . . . . . . . . . . . . . . . . . . . . . . . . . . . . . . (0.5) (0.5) (0.4)Emerging . . . . . . . . . . . . . . . . . . . . . . . . . . . . . . . . . . . . . . . . . . (2.1) (2.8) (2.2)Total amortisation of intangible assets . . . . . . . . . . . . . . . . . . . . . (7.1) (4.7) (3.7)
Other non-cash items(3)
Established . . . . . . . . . . . . . . . . . . . . . . . . . . . . . . . . . . . . . . . . . (2.4) (4.4) (180.6)Developing . . . . . . . . . . . . . . . . . . . . . . . . . . . . . . . . . . . . . . . . . (1.2) (1.2) (1.7)Emerging . . . . . . . . . . . . . . . . . . . . . . . . . . . . . . . . . . . . . . . . . . (3.1) (9.5) (33.0)Total other non-cash items . . . . . . . . . . . . . . . . . . . . . . . . . . . . . . (6.7) (15.1) (215.3)
Operating profitEstablished . . . . . . . . . . . . . . . . . . . . . . . . . . . . . . . . . . . . . . . . . 265.5 297.6 79.6Developing . . . . . . . . . . . . . . . . . . . . . . . . . . . . . . . . . . . . . . . . . 89.2 86.3 118.6Emerging . . . . . . . . . . . . . . . . . . . . . . . . . . . . . . . . . . . . . . . . . . 290.3 254.9 256.4Total operating profit . . . . . . . . . . . . . . . . . . . . . . . . . . . . . . . . . . 645.0 638.8 454.6
Interest expense and finance chargesEstablished . . . . . . . . . . . . . . . . . . . . . . . . . . . . . . . . . . . . . . . . . (106.2) (59.6) (105.6)Developing . . . . . . . . . . . . . . . . . . . . . . . . . . . . . . . . . . . . . . . . . (2.0) (4.7) (5.7)Emerging . . . . . . . . . . . . . . . . . . . . . . . . . . . . . . . . . . . . . . . . . . (21.7) (51.1) (76.6)Corporate . . . . . . . . . . . . . . . . . . . . . . . . . . . . . . . . . . . . . . . . . . (153.1) (122.3) (213.6)Inter segment interest expense . . . . . . . . . . . . . . . . . . . . . . . . . . . 200.3 159.2 282.9Total interest expense and finance charges . . . . . . . . . . . . . . . . . . 21 (82.7) (78.5) (118.6)
(2) We define adjusted EBITDA as operating profit before deductions for depreciation (included both incost of goods sold and in operating expenses), impairment of property, plant and equipment, stockoption compensation, impairment of intangible assets, amortisation of and adjustments to intangibleassets and other non-cash items.
(3) Other non-cash items comprise adjustments to intangible assets of which were nil in 2010 (2009:A2.2m, 2008: A1.2m) (refer to Note 20), losses on available-for-sale financial assets reclassified to theprofit and loss from equity of which were nil in 2010 (2009: A6.5m, 2008: nil) (refer to Note 20),stock option expenses of A6.7m (2009: A6.4m, 2008: A9.3m) (refer to Note 26) and in 2008,impairment of intangible assets of A189.0m (refer to Note 4) and the impact of the fire in BeninCity, Nigeria of A15.8m (refer to Note 20).
F-27
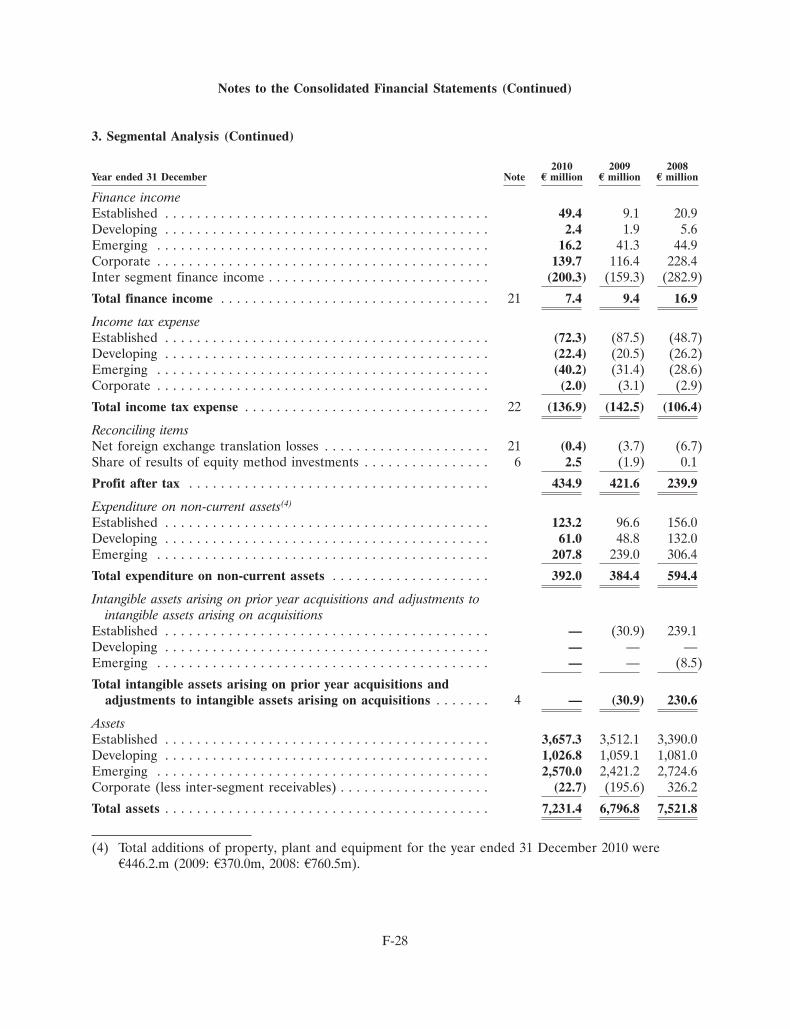
Notes to the Consolidated Financial Statements (Continued)
3. Segmental Analysis (Continued)
2010 2009 2008Year ended 31 December Note E million E million E million
Finance incomeEstablished . . . . . . . . . . . . . . . . . . . . . . . . . . . . . . . . . . . . . . . . . 49.4 9.1 20.9Developing . . . . . . . . . . . . . . . . . . . . . . . . . . . . . . . . . . . . . . . . . 2.4 1.9 5.6Emerging . . . . . . . . . . . . . . . . . . . . . . . . . . . . . . . . . . . . . . . . . . 16.2 41.3 44.9Corporate . . . . . . . . . . . . . . . . . . . . . . . . . . . . . . . . . . . . . . . . . . 139.7 116.4 228.4Inter segment finance income . . . . . . . . . . . . . . . . . . . . . . . . . . . . (200.3) (159.3) (282.9)
Total finance income . . . . . . . . . . . . . . . . . . . . . . . . . . . . . . . . . . 21 7.4 9.4 16.9
Income tax expenseEstablished . . . . . . . . . . . . . . . . . . . . . . . . . . . . . . . . . . . . . . . . . (72.3) (87.5) (48.7)Developing . . . . . . . . . . . . . . . . . . . . . . . . . . . . . . . . . . . . . . . . . (22.4) (20.5) (26.2)Emerging . . . . . . . . . . . . . . . . . . . . . . . . . . . . . . . . . . . . . . . . . . (40.2) (31.4) (28.6)Corporate . . . . . . . . . . . . . . . . . . . . . . . . . . . . . . . . . . . . . . . . . . (2.0) (3.1) (2.9)
Total income tax expense . . . . . . . . . . . . . . . . . . . . . . . . . . . . . . . 22 (136.9) (142.5) (106.4)
Reconciling itemsNet foreign exchange translation losses . . . . . . . . . . . . . . . . . . . . . 21 (0.4) (3.7) (6.7)Share of results of equity method investments . . . . . . . . . . . . . . . . 6 2.5 (1.9) 0.1
Profit after tax . . . . . . . . . . . . . . . . . . . . . . . . . . . . . . . . . . . . . . 434.9 421.6 239.9
Expenditure on non-current assets(4)
Established . . . . . . . . . . . . . . . . . . . . . . . . . . . . . . . . . . . . . . . . . 123.2 96.6 156.0Developing . . . . . . . . . . . . . . . . . . . . . . . . . . . . . . . . . . . . . . . . . 61.0 48.8 132.0Emerging . . . . . . . . . . . . . . . . . . . . . . . . . . . . . . . . . . . . . . . . . . 207.8 239.0 306.4
Total expenditure on non-current assets . . . . . . . . . . . . . . . . . . . . 392.0 384.4 594.4
Intangible assets arising on prior year acquisitions and adjustments tointangible assets arising on acquisitions
Established . . . . . . . . . . . . . . . . . . . . . . . . . . . . . . . . . . . . . . . . . — (30.9) 239.1Developing . . . . . . . . . . . . . . . . . . . . . . . . . . . . . . . . . . . . . . . . . — — —Emerging . . . . . . . . . . . . . . . . . . . . . . . . . . . . . . . . . . . . . . . . . . — — (8.5)
Total intangible assets arising on prior year acquisitions andadjustments to intangible assets arising on acquisitions . . . . . . . 4 — (30.9) 230.6
AssetsEstablished . . . . . . . . . . . . . . . . . . . . . . . . . . . . . . . . . . . . . . . . . 3,657.3 3,512.1 3,390.0Developing . . . . . . . . . . . . . . . . . . . . . . . . . . . . . . . . . . . . . . . . . 1,026.8 1,059.1 1,081.0Emerging . . . . . . . . . . . . . . . . . . . . . . . . . . . . . . . . . . . . . . . . . . 2,570.0 2,421.2 2,724.6Corporate (less inter-segment receivables) . . . . . . . . . . . . . . . . . . . (22.7) (195.6) 326.2
Total assets . . . . . . . . . . . . . . . . . . . . . . . . . . . . . . . . . . . . . . . . . 7,231.4 6,796.8 7,521.8
(4) Total additions of property, plant and equipment for the year ended 31 December 2010 wereA446.2.m (2009: A370.0m, 2008: A760.5m).
F-28
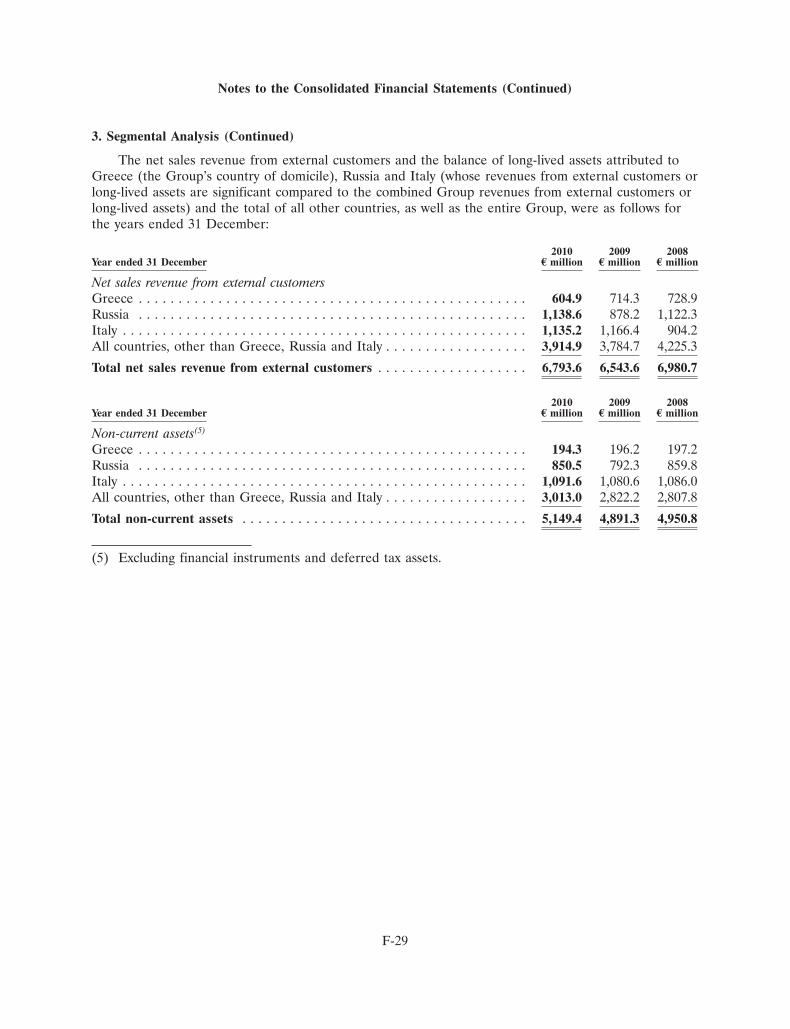
Notes to the Consolidated Financial Statements (Continued)
3. Segmental Analysis (Continued)
The net sales revenue from external customers and the balance of long-lived assets attributed toGreece (the Group’s country of domicile), Russia and Italy (whose revenues from external customers orlong-lived assets are significant compared to the combined Group revenues from external customers orlong-lived assets) and the total of all other countries, as well as the entire Group, were as follows forthe years ended 31 December:
2010 2009 2008Year ended 31 December E million E million E million
Net sales revenue from external customersGreece . . . . . . . . . . . . . . . . . . . . . . . . . . . . . . . . . . . . . . . . . . . . . . . . . 604.9 714.3 728.9Russia . . . . . . . . . . . . . . . . . . . . . . . . . . . . . . . . . . . . . . . . . . . . . . . . . 1,138.6 878.2 1,122.3Italy . . . . . . . . . . . . . . . . . . . . . . . . . . . . . . . . . . . . . . . . . . . . . . . . . . . 1,135.2 1,166.4 904.2All countries, other than Greece, Russia and Italy . . . . . . . . . . . . . . . . . . 3,914.9 3,784.7 4,225.3
Total net sales revenue from external customers . . . . . . . . . . . . . . . . . . . 6,793.6 6,543.6 6,980.7
2010 2009 2008Year ended 31 December E million E million E million
Non-current assets(5)
Greece . . . . . . . . . . . . . . . . . . . . . . . . . . . . . . . . . . . . . . . . . . . . . . . . . 194.3 196.2 197.2Russia . . . . . . . . . . . . . . . . . . . . . . . . . . . . . . . . . . . . . . . . . . . . . . . . . 850.5 792.3 859.8Italy . . . . . . . . . . . . . . . . . . . . . . . . . . . . . . . . . . . . . . . . . . . . . . . . . . . 1,091.6 1,080.6 1,086.0All countries, other than Greece, Russia and Italy . . . . . . . . . . . . . . . . . . 3,013.0 2,822.2 2,807.8
Total non-current assets . . . . . . . . . . . . . . . . . . . . . . . . . . . . . . . . . . . . 5,149.4 4,891.3 4,950.8
(5) Excluding financial instruments and deferred tax assets.
F-29
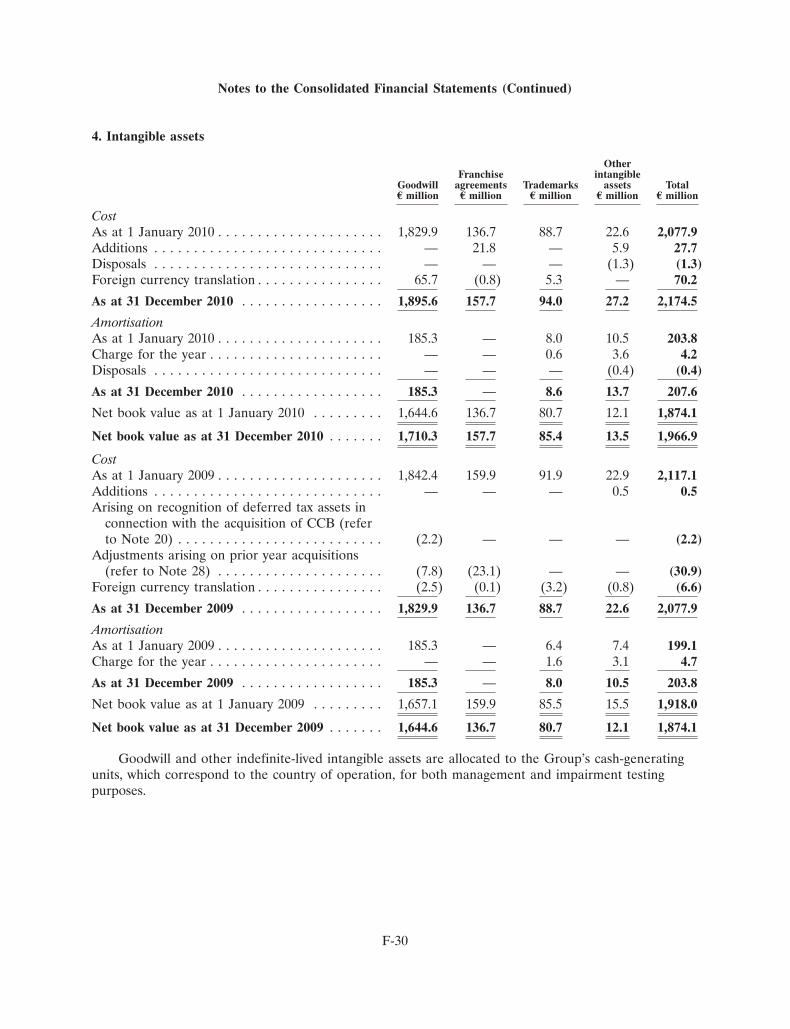
Notes to the Consolidated Financial Statements (Continued)
4. Intangible assets
OtherFranchise intangible
Goodwill agreements Trademarks assets TotalE million E million E million E million E million
CostAs at 1 January 2010 . . . . . . . . . . . . . . . . . . . . . 1,829.9 136.7 88.7 22.6 2,077.9Additions . . . . . . . . . . . . . . . . . . . . . . . . . . . . . — 21.8 — 5.9 27.7Disposals . . . . . . . . . . . . . . . . . . . . . . . . . . . . . — — — (1.3) (1.3)Foreign currency translation . . . . . . . . . . . . . . . . 65.7 (0.8) 5.3 — 70.2
As at 31 December 2010 . . . . . . . . . . . . . . . . . . 1,895.6 157.7 94.0 27.2 2,174.5
AmortisationAs at 1 January 2010 . . . . . . . . . . . . . . . . . . . . . 185.3 — 8.0 10.5 203.8Charge for the year . . . . . . . . . . . . . . . . . . . . . . — — 0.6 3.6 4.2Disposals . . . . . . . . . . . . . . . . . . . . . . . . . . . . . — — — (0.4) (0.4)
As at 31 December 2010 . . . . . . . . . . . . . . . . . . 185.3 — 8.6 13.7 207.6
Net book value as at 1 January 2010 . . . . . . . . . 1,644.6 136.7 80.7 12.1 1,874.1
Net book value as at 31 December 2010 . . . . . . . 1,710.3 157.7 85.4 13.5 1,966.9
CostAs at 1 January 2009 . . . . . . . . . . . . . . . . . . . . . 1,842.4 159.9 91.9 22.9 2,117.1Additions . . . . . . . . . . . . . . . . . . . . . . . . . . . . . — — — 0.5 0.5Arising on recognition of deferred tax assets in
connection with the acquisition of CCB (referto Note 20) . . . . . . . . . . . . . . . . . . . . . . . . . . (2.2) — — — (2.2)
Adjustments arising on prior year acquisitions(refer to Note 28) . . . . . . . . . . . . . . . . . . . . . (7.8) (23.1) — — (30.9)
Foreign currency translation . . . . . . . . . . . . . . . . (2.5) (0.1) (3.2) (0.8) (6.6)
As at 31 December 2009 . . . . . . . . . . . . . . . . . . 1,829.9 136.7 88.7 22.6 2,077.9
AmortisationAs at 1 January 2009 . . . . . . . . . . . . . . . . . . . . . 185.3 — 6.4 7.4 199.1Charge for the year . . . . . . . . . . . . . . . . . . . . . . — — 1.6 3.1 4.7
As at 31 December 2009 . . . . . . . . . . . . . . . . . . 185.3 — 8.0 10.5 203.8
Net book value as at 1 January 2009 . . . . . . . . . 1,657.1 159.9 85.5 15.5 1,918.0
Net book value as at 31 December 2009 . . . . . . . 1,644.6 136.7 80.7 12.1 1,874.1
Goodwill and other indefinite-lived intangible assets are allocated to the Group’s cash-generatingunits, which correspond to the country of operation, for both management and impairment testingpurposes.
F-30
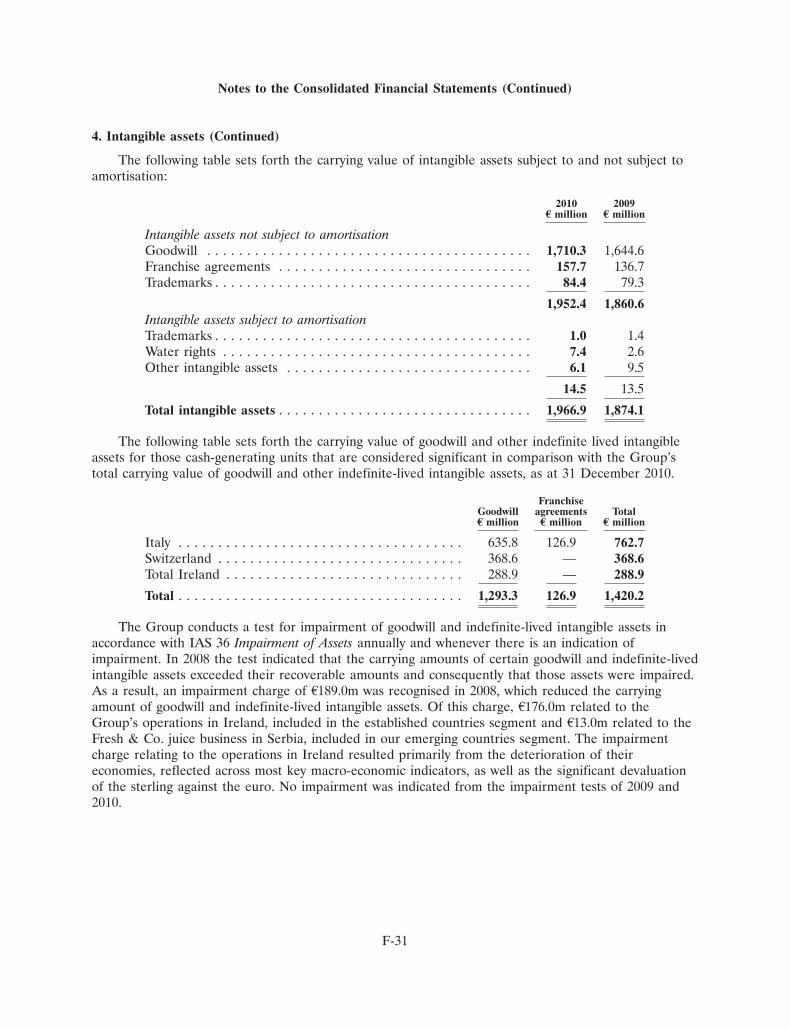
Notes to the Consolidated Financial Statements (Continued)
4. Intangible assets (Continued)
The following table sets forth the carrying value of intangible assets subject to and not subject toamortisation:
2010 2009E million E million
Intangible assets not subject to amortisationGoodwill . . . . . . . . . . . . . . . . . . . . . . . . . . . . . . . . . . . . . . . . . 1,710.3 1,644.6Franchise agreements . . . . . . . . . . . . . . . . . . . . . . . . . . . . . . . . 157.7 136.7Trademarks . . . . . . . . . . . . . . . . . . . . . . . . . . . . . . . . . . . . . . . . 84.4 79.3
1,952.4 1,860.6Intangible assets subject to amortisationTrademarks . . . . . . . . . . . . . . . . . . . . . . . . . . . . . . . . . . . . . . . . 1.0 1.4Water rights . . . . . . . . . . . . . . . . . . . . . . . . . . . . . . . . . . . . . . . 7.4 2.6Other intangible assets . . . . . . . . . . . . . . . . . . . . . . . . . . . . . . . 6.1 9.5
14.5 13.5
Total intangible assets . . . . . . . . . . . . . . . . . . . . . . . . . . . . . . . . 1,966.9 1,874.1
The following table sets forth the carrying value of goodwill and other indefinite lived intangibleassets for those cash-generating units that are considered significant in comparison with the Group’stotal carrying value of goodwill and other indefinite-lived intangible assets, as at 31 December 2010.
FranchiseGoodwill agreements TotalE million E million E million
Italy . . . . . . . . . . . . . . . . . . . . . . . . . . . . . . . . . . . . 635.8 126.9 762.7Switzerland . . . . . . . . . . . . . . . . . . . . . . . . . . . . . . . 368.6 — 368.6Total Ireland . . . . . . . . . . . . . . . . . . . . . . . . . . . . . . 288.9 — 288.9
Total . . . . . . . . . . . . . . . . . . . . . . . . . . . . . . . . . . . . 1,293.3 126.9 1,420.2
The Group conducts a test for impairment of goodwill and indefinite-lived intangible assets inaccordance with IAS 36 Impairment of Assets annually and whenever there is an indication ofimpairment. In 2008 the test indicated that the carrying amounts of certain goodwill and indefinite-livedintangible assets exceeded their recoverable amounts and consequently that those assets were impaired.As a result, an impairment charge of A189.0m was recognised in 2008, which reduced the carryingamount of goodwill and indefinite-lived intangible assets. Of this charge, A176.0m related to theGroup’s operations in Ireland, included in the established countries segment and A13.0m related to theFresh & Co. juice business in Serbia, included in our emerging countries segment. The impairmentcharge relating to the operations in Ireland resulted primarily from the deterioration of theireconomies, reflected across most key macro-economic indicators, as well as the significant devaluationof the sterling against the euro. No impairment was indicated from the impairment tests of 2009 and2010.
F-31
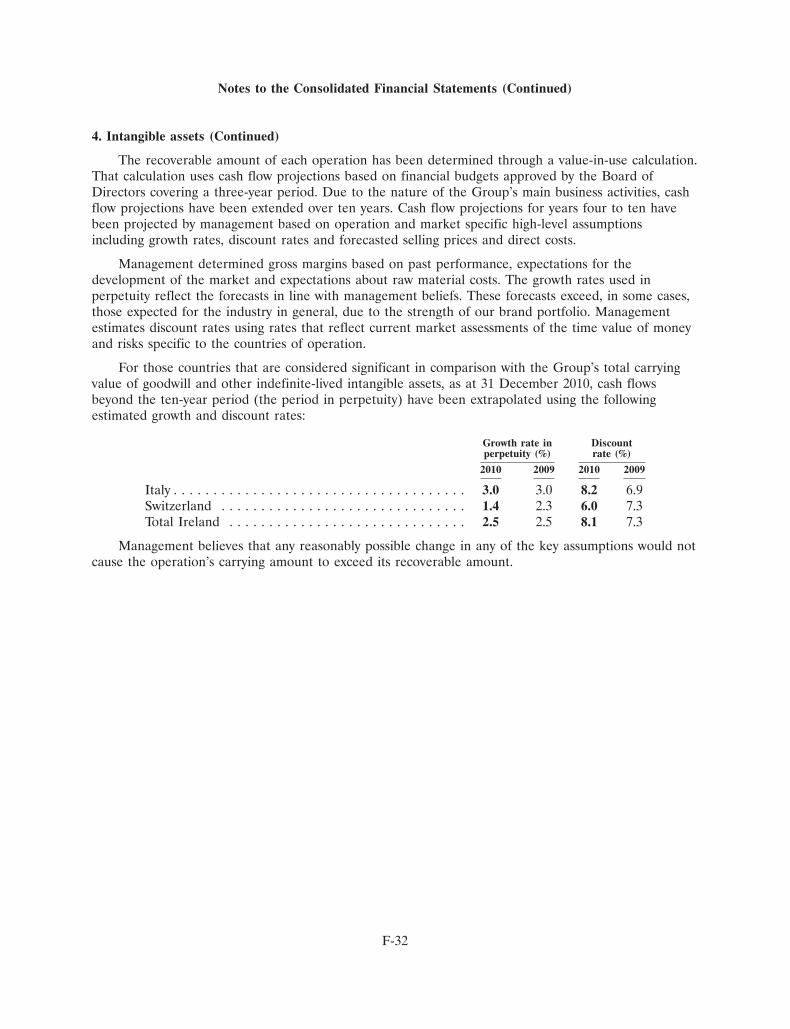
Notes to the Consolidated Financial Statements (Continued)
4. Intangible assets (Continued)
The recoverable amount of each operation has been determined through a value-in-use calculation.That calculation uses cash flow projections based on financial budgets approved by the Board ofDirectors covering a three-year period. Due to the nature of the Group’s main business activities, cashflow projections have been extended over ten years. Cash flow projections for years four to ten havebeen projected by management based on operation and market specific high-level assumptionsincluding growth rates, discount rates and forecasted selling prices and direct costs.
Management determined gross margins based on past performance, expectations for thedevelopment of the market and expectations about raw material costs. The growth rates used inperpetuity reflect the forecasts in line with management beliefs. These forecasts exceed, in some cases,those expected for the industry in general, due to the strength of our brand portfolio. Managementestimates discount rates using rates that reflect current market assessments of the time value of moneyand risks specific to the countries of operation.
For those countries that are considered significant in comparison with the Group’s total carryingvalue of goodwill and other indefinite-lived intangible assets, as at 31 December 2010, cash flowsbeyond the ten-year period (the period in perpetuity) have been extrapolated using the followingestimated growth and discount rates:
Growth rate in Discountperpetuity (%) rate (%)
2010 2009 2010 2009
Italy . . . . . . . . . . . . . . . . . . . . . . . . . . . . . . . . . . . . . 3.0 3.0 8.2 6.9Switzerland . . . . . . . . . . . . . . . . . . . . . . . . . . . . . . . 1.4 2.3 6.0 7.3Total Ireland . . . . . . . . . . . . . . . . . . . . . . . . . . . . . . 2.5 2.5 8.1 7.3
Management believes that any reasonably possible change in any of the key assumptions would notcause the operation’s carrying amount to exceed its recoverable amount.
F-32
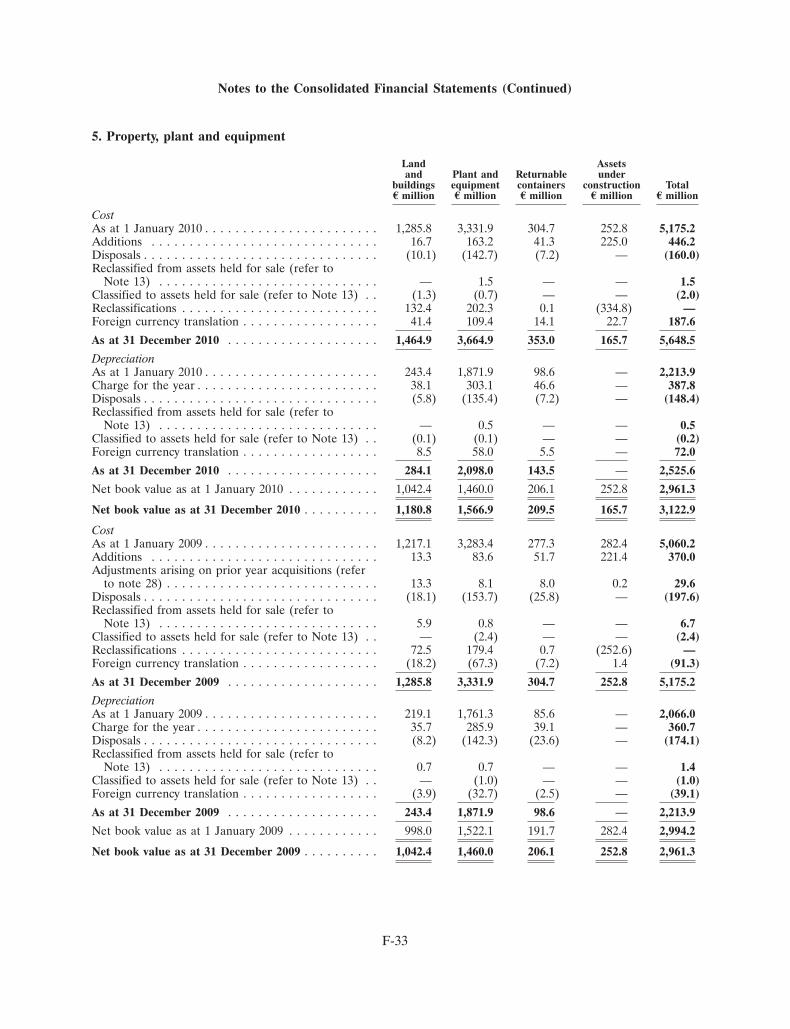
Notes to the Consolidated Financial Statements (Continued)
5. Property, plant and equipment
Land Assetsand Plant and Returnable under
buildings equipment containers construction TotalE million E million E million E million E million
CostAs at 1 January 2010 . . . . . . . . . . . . . . . . . . . . . . . 1,285.8 3,331.9 304.7 252.8 5,175.2Additions . . . . . . . . . . . . . . . . . . . . . . . . . . . . . . 16.7 163.2 41.3 225.0 446.2Disposals . . . . . . . . . . . . . . . . . . . . . . . . . . . . . . . (10.1) (142.7) (7.2) — (160.0)Reclassified from assets held for sale (refer to
Note 13) . . . . . . . . . . . . . . . . . . . . . . . . . . . . . — 1.5 — — 1.5Classified to assets held for sale (refer to Note 13) . . (1.3) (0.7) — — (2.0)Reclassifications . . . . . . . . . . . . . . . . . . . . . . . . . . 132.4 202.3 0.1 (334.8) —Foreign currency translation . . . . . . . . . . . . . . . . . . 41.4 109.4 14.1 22.7 187.6
As at 31 December 2010 . . . . . . . . . . . . . . . . . . . . 1,464.9 3,664.9 353.0 165.7 5,648.5
DepreciationAs at 1 January 2010 . . . . . . . . . . . . . . . . . . . . . . . 243.4 1,871.9 98.6 — 2,213.9Charge for the year . . . . . . . . . . . . . . . . . . . . . . . . 38.1 303.1 46.6 — 387.8Disposals . . . . . . . . . . . . . . . . . . . . . . . . . . . . . . . (5.8) (135.4) (7.2) — (148.4)Reclassified from assets held for sale (refer to
Note 13) . . . . . . . . . . . . . . . . . . . . . . . . . . . . . — 0.5 — — 0.5Classified to assets held for sale (refer to Note 13) . . (0.1) (0.1) — — (0.2)Foreign currency translation . . . . . . . . . . . . . . . . . . 8.5 58.0 5.5 — 72.0
As at 31 December 2010 . . . . . . . . . . . . . . . . . . . . 284.1 2,098.0 143.5 — 2,525.6
Net book value as at 1 January 2010 . . . . . . . . . . . . 1,042.4 1,460.0 206.1 252.8 2,961.3
Net book value as at 31 December 2010 . . . . . . . . . . 1,180.8 1,566.9 209.5 165.7 3,122.9
CostAs at 1 January 2009 . . . . . . . . . . . . . . . . . . . . . . . 1,217.1 3,283.4 277.3 282.4 5,060.2Additions . . . . . . . . . . . . . . . . . . . . . . . . . . . . . . 13.3 83.6 51.7 221.4 370.0Adjustments arising on prior year acquisitions (refer
to note 28) . . . . . . . . . . . . . . . . . . . . . . . . . . . . 13.3 8.1 8.0 0.2 29.6Disposals . . . . . . . . . . . . . . . . . . . . . . . . . . . . . . . (18.1) (153.7) (25.8) — (197.6)Reclassified from assets held for sale (refer to
Note 13) . . . . . . . . . . . . . . . . . . . . . . . . . . . . . 5.9 0.8 — — 6.7Classified to assets held for sale (refer to Note 13) . . — (2.4) — — (2.4)Reclassifications . . . . . . . . . . . . . . . . . . . . . . . . . . 72.5 179.4 0.7 (252.6) —Foreign currency translation . . . . . . . . . . . . . . . . . . (18.2) (67.3) (7.2) 1.4 (91.3)
As at 31 December 2009 . . . . . . . . . . . . . . . . . . . . 1,285.8 3,331.9 304.7 252.8 5,175.2
DepreciationAs at 1 January 2009 . . . . . . . . . . . . . . . . . . . . . . . 219.1 1,761.3 85.6 — 2,066.0Charge for the year . . . . . . . . . . . . . . . . . . . . . . . . 35.7 285.9 39.1 — 360.7Disposals . . . . . . . . . . . . . . . . . . . . . . . . . . . . . . . (8.2) (142.3) (23.6) — (174.1)Reclassified from assets held for sale (refer to
Note 13) . . . . . . . . . . . . . . . . . . . . . . . . . . . . . 0.7 0.7 — — 1.4Classified to assets held for sale (refer to Note 13) . . — (1.0) — — (1.0)Foreign currency translation . . . . . . . . . . . . . . . . . . (3.9) (32.7) (2.5) — (39.1)
As at 31 December 2009 . . . . . . . . . . . . . . . . . . . . 243.4 1,871.9 98.6 — 2,213.9
Net book value as at 1 January 2009 . . . . . . . . . . . . 998.0 1,522.1 191.7 282.4 2,994.2
Net book value as at 31 December 2009 . . . . . . . . . . 1,042.4 1,460.0 206.1 252.8 2,961.3
F-33
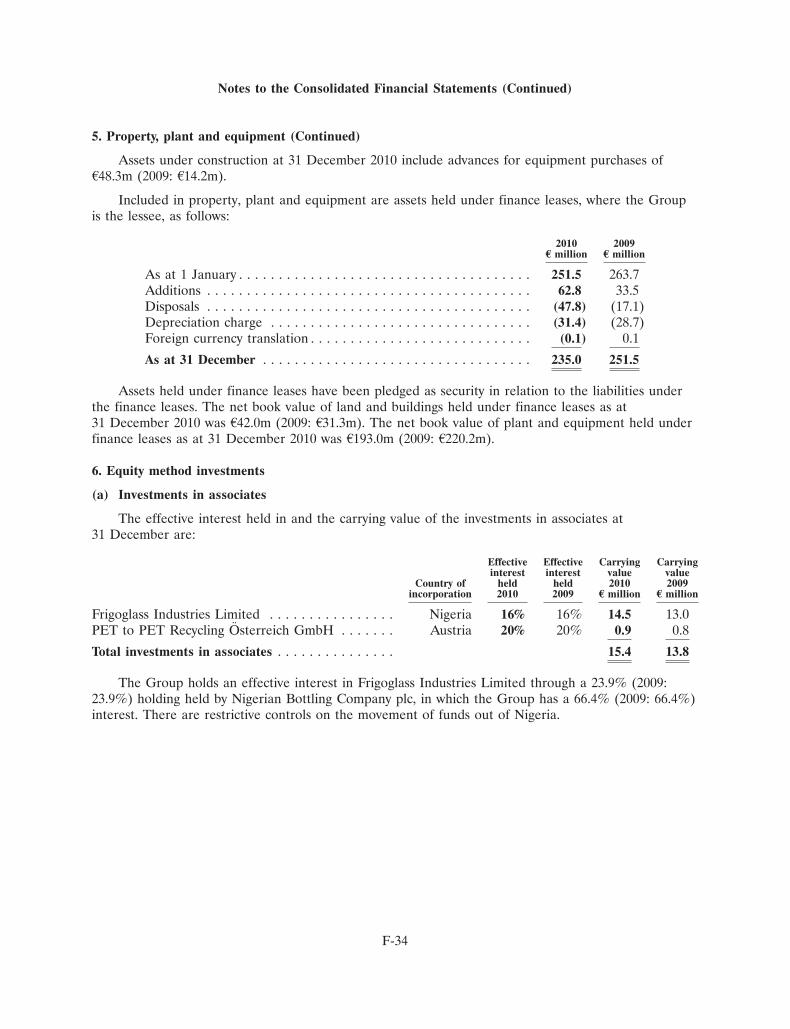
Notes to the Consolidated Financial Statements (Continued)
5. Property, plant and equipment (Continued)
Assets under construction at 31 December 2010 include advances for equipment purchases ofA48.3m (2009: A14.2m).
Included in property, plant and equipment are assets held under finance leases, where the Groupis the lessee, as follows:
2010 2009E million E million
As at 1 January . . . . . . . . . . . . . . . . . . . . . . . . . . . . . . . . . . . . . 251.5 263.7Additions . . . . . . . . . . . . . . . . . . . . . . . . . . . . . . . . . . . . . . . . . 62.8 33.5Disposals . . . . . . . . . . . . . . . . . . . . . . . . . . . . . . . . . . . . . . . . . (47.8) (17.1)Depreciation charge . . . . . . . . . . . . . . . . . . . . . . . . . . . . . . . . . (31.4) (28.7)Foreign currency translation . . . . . . . . . . . . . . . . . . . . . . . . . . . . (0.1) 0.1
As at 31 December . . . . . . . . . . . . . . . . . . . . . . . . . . . . . . . . . . 235.0 251.5
Assets held under finance leases have been pledged as security in relation to the liabilities underthe finance leases. The net book value of land and buildings held under finance leases as at31 December 2010 was A42.0m (2009: A31.3m). The net book value of plant and equipment held underfinance leases as at 31 December 2010 was A193.0m (2009: A220.2m).
6. Equity method investments
(a) Investments in associates
The effective interest held in and the carrying value of the investments in associates at31 December are:
Effective Effective Carrying Carryinginterest interest value value
Country of held held 2010 2009incorporation 2010 2009 E million E million
Frigoglass Industries Limited . . . . . . . . . . . . . . . . Nigeria 16% 16% 14.5 13.0PET to PET Recycling Osterreich GmbH . . . . . . . Austria 20% 20% 0.9 0.8
Total investments in associates . . . . . . . . . . . . . . . 15.4 13.8
The Group holds an effective interest in Frigoglass Industries Limited through a 23.9% (2009:23.9%) holding held by Nigerian Bottling Company plc, in which the Group has a 66.4% (2009: 66.4%)interest. There are restrictive controls on the movement of funds out of Nigeria.
F-34
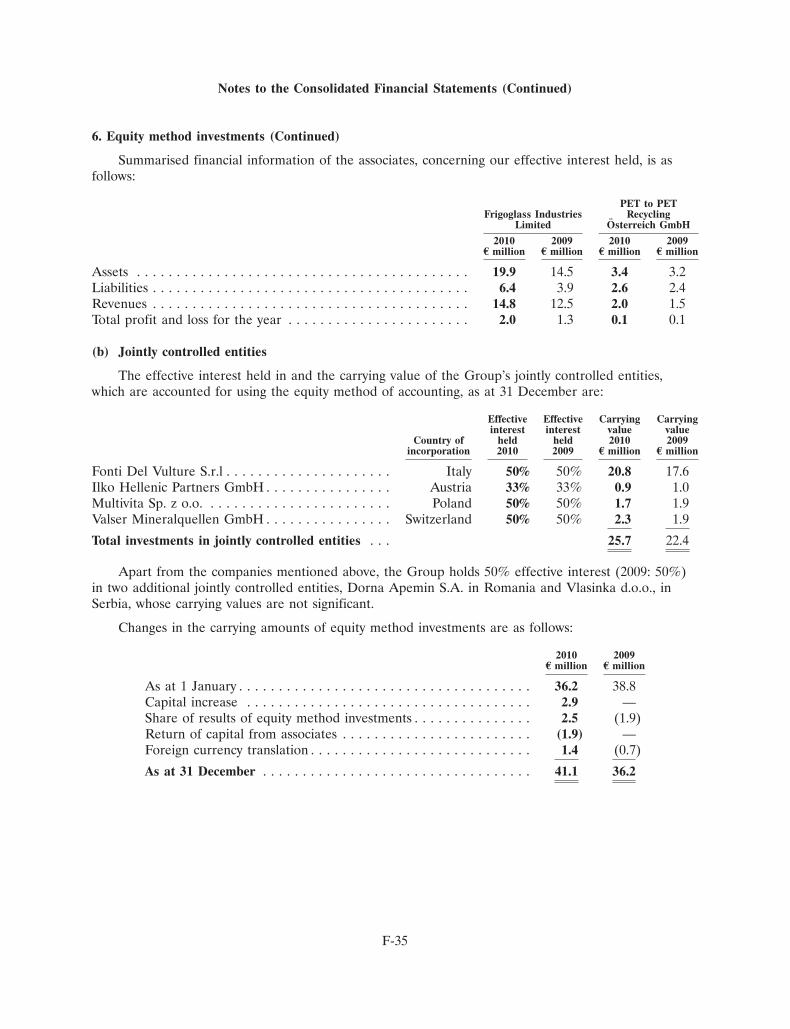
Notes to the Consolidated Financial Statements (Continued)
6. Equity method investments (Continued)
Summarised financial information of the associates, concerning our effective interest held, is asfollows:
PET to PETFrigoglass Industries Recycling
Limited Osterreich GmbH
2010 2009 2010 2009E million E million E million E million
Assets . . . . . . . . . . . . . . . . . . . . . . . . . . . . . . . . . . . . . . . . . . 19.9 14.5 3.4 3.2Liabilities . . . . . . . . . . . . . . . . . . . . . . . . . . . . . . . . . . . . . . . . 6.4 3.9 2.6 2.4Revenues . . . . . . . . . . . . . . . . . . . . . . . . . . . . . . . . . . . . . . . . 14.8 12.5 2.0 1.5Total profit and loss for the year . . . . . . . . . . . . . . . . . . . . . . . 2.0 1.3 0.1 0.1
(b) Jointly controlled entities
The effective interest held in and the carrying value of the Group’s jointly controlled entities,which are accounted for using the equity method of accounting, as at 31 December are:
Effective Effective Carrying Carryinginterest interest value value
Country of held held 2010 2009incorporation 2010 2009 E million E million
Fonti Del Vulture S.r.l . . . . . . . . . . . . . . . . . . . . . Italy 50% 50% 20.8 17.6Ilko Hellenic Partners GmbH . . . . . . . . . . . . . . . . Austria 33% 33% 0.9 1.0Multivita Sp. z o.o. . . . . . . . . . . . . . . . . . . . . . . . Poland 50% 50% 1.7 1.9Valser Mineralquellen GmbH . . . . . . . . . . . . . . . . Switzerland 50% 50% 2.3 1.9
Total investments in jointly controlled entities . . . 25.7 22.4
Apart from the companies mentioned above, the Group holds 50% effective interest (2009: 50%)in two additional jointly controlled entities, Dorna Apemin S.A. in Romania and Vlasinka d.o.o., inSerbia, whose carrying values are not significant.
Changes in the carrying amounts of equity method investments are as follows:
2010 2009E million E million
As at 1 January . . . . . . . . . . . . . . . . . . . . . . . . . . . . . . . . . . . . . 36.2 38.8Capital increase . . . . . . . . . . . . . . . . . . . . . . . . . . . . . . . . . . . . 2.9 —Share of results of equity method investments . . . . . . . . . . . . . . . 2.5 (1.9)Return of capital from associates . . . . . . . . . . . . . . . . . . . . . . . . (1.9) —Foreign currency translation . . . . . . . . . . . . . . . . . . . . . . . . . . . . 1.4 (0.7)
As at 31 December . . . . . . . . . . . . . . . . . . . . . . . . . . . . . . . . . . 41.1 36.2
F-35
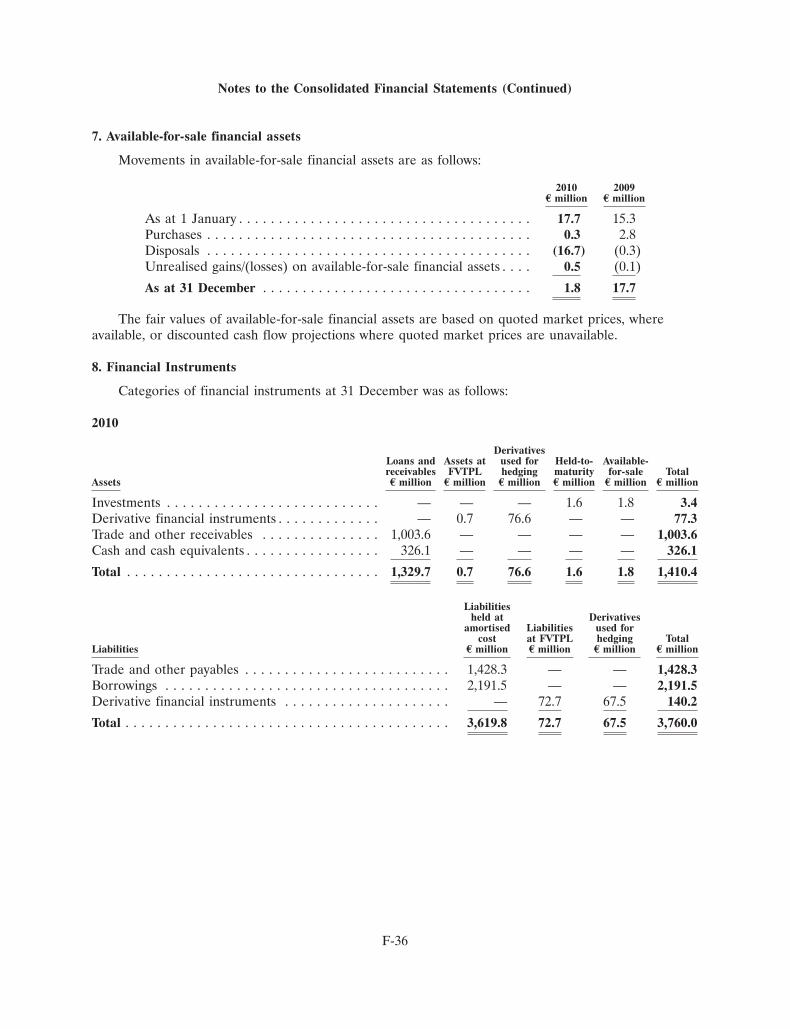
Notes to the Consolidated Financial Statements (Continued)
7. Available-for-sale financial assets
Movements in available-for-sale financial assets are as follows:
2010 2009E million E million
As at 1 January . . . . . . . . . . . . . . . . . . . . . . . . . . . . . . . . . . . . . 17.7 15.3Purchases . . . . . . . . . . . . . . . . . . . . . . . . . . . . . . . . . . . . . . . . . 0.3 2.8Disposals . . . . . . . . . . . . . . . . . . . . . . . . . . . . . . . . . . . . . . . . . (16.7) (0.3)Unrealised gains/(losses) on available-for-sale financial assets . . . . 0.5 (0.1)
As at 31 December . . . . . . . . . . . . . . . . . . . . . . . . . . . . . . . . . . 1.8 17.7
The fair values of available-for-sale financial assets are based on quoted market prices, whereavailable, or discounted cash flow projections where quoted market prices are unavailable.
8. Financial Instruments
Categories of financial instruments at 31 December was as follows:
2010
DerivativesLoans and Assets at used for Held-to- Available-receivables FVTPL hedging maturity for-sale Total
Assets E million E million E million E million E million E million
Investments . . . . . . . . . . . . . . . . . . . . . . . . . . . — — — 1.6 1.8 3.4Derivative financial instruments . . . . . . . . . . . . . — 0.7 76.6 — — 77.3Trade and other receivables . . . . . . . . . . . . . . . 1,003.6 — — — — 1,003.6Cash and cash equivalents . . . . . . . . . . . . . . . . . 326.1 — — — — 326.1
Total . . . . . . . . . . . . . . . . . . . . . . . . . . . . . . . . 1,329.7 0.7 76.6 1.6 1.8 1,410.4
Liabilitiesheld at Derivatives
amortised Liabilities used forcost at FVTPL hedging Total
Liabilities E million E million E million E million
Trade and other payables . . . . . . . . . . . . . . . . . . . . . . . . . . 1,428.3 — — 1,428.3Borrowings . . . . . . . . . . . . . . . . . . . . . . . . . . . . . . . . . . . . 2,191.5 — — 2,191.5Derivative financial instruments . . . . . . . . . . . . . . . . . . . . . — 72.7 67.5 140.2
Total . . . . . . . . . . . . . . . . . . . . . . . . . . . . . . . . . . . . . . . . . 3,619.8 72.7 67.5 3,760.0
F-36
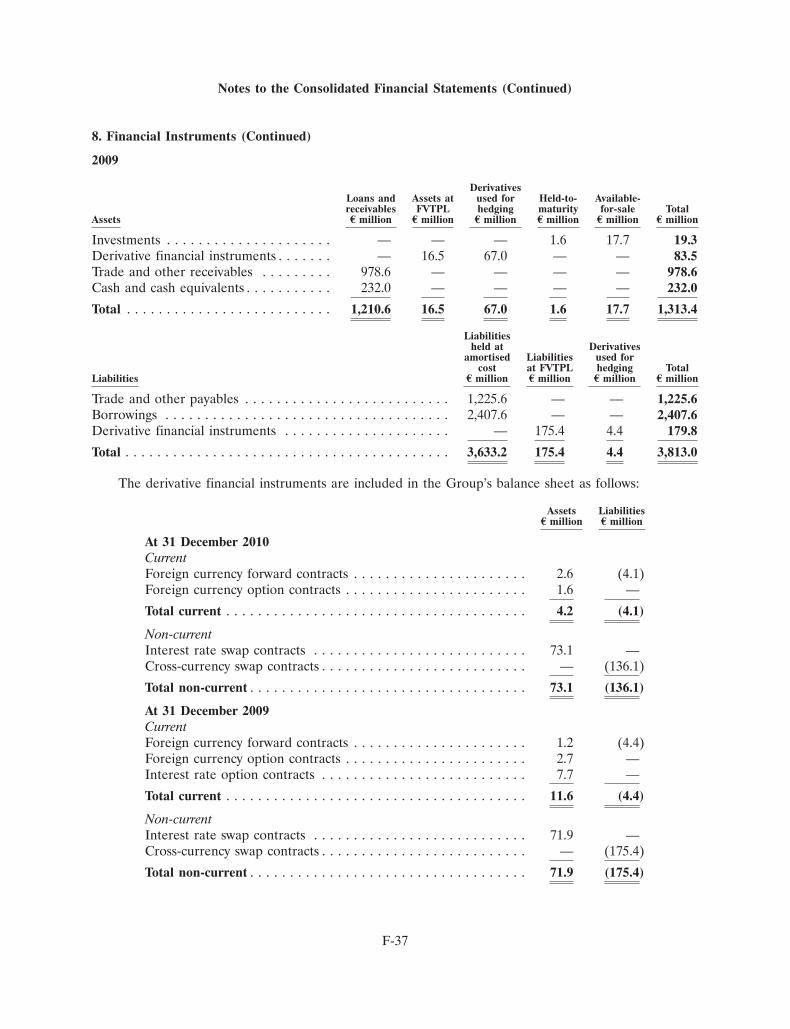
Notes to the Consolidated Financial Statements (Continued)
8. Financial Instruments (Continued)
2009
DerivativesLoans and Assets at used for Held-to- Available-receivables FVTPL hedging maturity for-sale Total
Assets E million E million E million E million E million E million
Investments . . . . . . . . . . . . . . . . . . . . . — — — 1.6 17.7 19.3Derivative financial instruments . . . . . . . — 16.5 67.0 — — 83.5Trade and other receivables . . . . . . . . . 978.6 — — — — 978.6Cash and cash equivalents . . . . . . . . . . . 232.0 — — — — 232.0
Total . . . . . . . . . . . . . . . . . . . . . . . . . . 1,210.6 16.5 67.0 1.6 17.7 1,313.4
Liabilitiesheld at Derivatives
amortised Liabilities used forcost at FVTPL hedging Total
Liabilities E million E million E million E million
Trade and other payables . . . . . . . . . . . . . . . . . . . . . . . . . . 1,225.6 — — 1,225.6Borrowings . . . . . . . . . . . . . . . . . . . . . . . . . . . . . . . . . . . . 2,407.6 — — 2,407.6Derivative financial instruments . . . . . . . . . . . . . . . . . . . . . — 175.4 4.4 179.8
Total . . . . . . . . . . . . . . . . . . . . . . . . . . . . . . . . . . . . . . . . . 3,633.2 175.4 4.4 3,813.0
The derivative financial instruments are included in the Group’s balance sheet as follows:
Assets LiabilitiesE million E million
At 31 December 2010CurrentForeign currency forward contracts . . . . . . . . . . . . . . . . . . . . . . 2.6 (4.1)Foreign currency option contracts . . . . . . . . . . . . . . . . . . . . . . . 1.6 —
Total current . . . . . . . . . . . . . . . . . . . . . . . . . . . . . . . . . . . . . . 4.2 (4.1)
Non-currentInterest rate swap contracts . . . . . . . . . . . . . . . . . . . . . . . . . . . 73.1 —Cross-currency swap contracts . . . . . . . . . . . . . . . . . . . . . . . . . . — (136.1)
Total non-current . . . . . . . . . . . . . . . . . . . . . . . . . . . . . . . . . . . 73.1 (136.1)
At 31 December 2009CurrentForeign currency forward contracts . . . . . . . . . . . . . . . . . . . . . . 1.2 (4.4)Foreign currency option contracts . . . . . . . . . . . . . . . . . . . . . . . 2.7 —Interest rate option contracts . . . . . . . . . . . . . . . . . . . . . . . . . . 7.7 —
Total current . . . . . . . . . . . . . . . . . . . . . . . . . . . . . . . . . . . . . . 11.6 (4.4)
Non-currentInterest rate swap contracts . . . . . . . . . . . . . . . . . . . . . . . . . . . 71.9 —Cross-currency swap contracts . . . . . . . . . . . . . . . . . . . . . . . . . . — (175.4)
Total non-current . . . . . . . . . . . . . . . . . . . . . . . . . . . . . . . . . . . 71.9 (175.4)
F-37
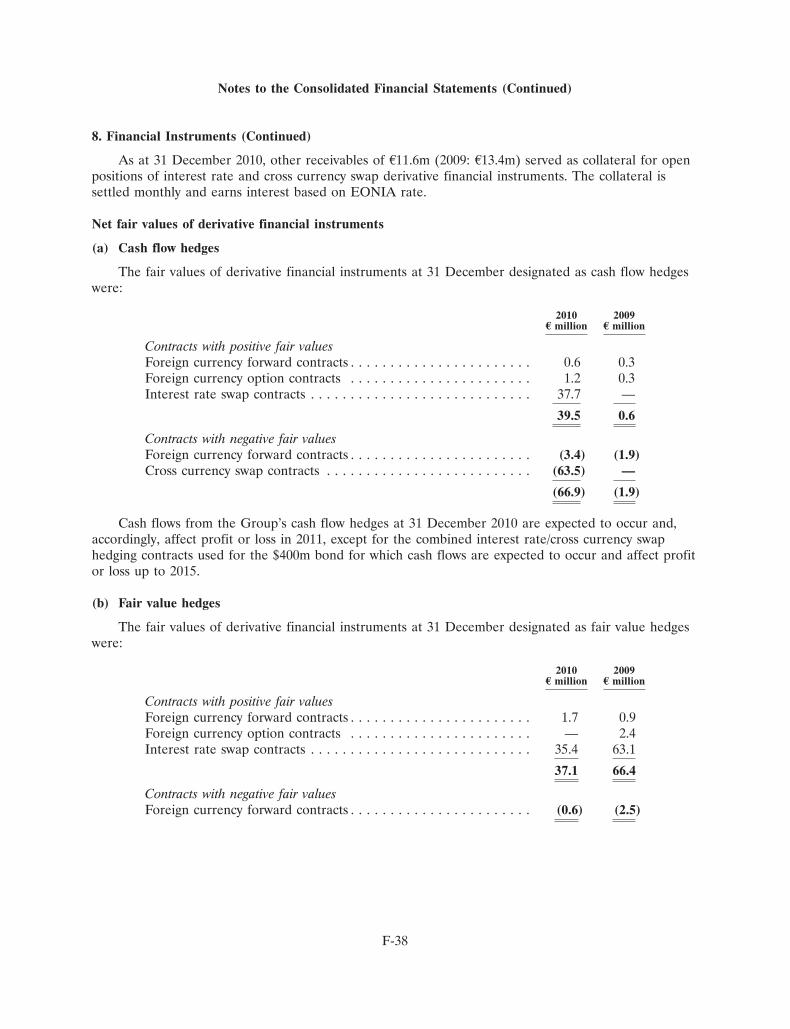
Notes to the Consolidated Financial Statements (Continued)
8. Financial Instruments (Continued)
As at 31 December 2010, other receivables of A11.6m (2009: A13.4m) served as collateral for openpositions of interest rate and cross currency swap derivative financial instruments. The collateral issettled monthly and earns interest based on EONIA rate.
Net fair values of derivative financial instruments
(a) Cash flow hedges
The fair values of derivative financial instruments at 31 December designated as cash flow hedgeswere:
2010 2009E million E million
Contracts with positive fair valuesForeign currency forward contracts . . . . . . . . . . . . . . . . . . . . . . . 0.6 0.3Foreign currency option contracts . . . . . . . . . . . . . . . . . . . . . . . 1.2 0.3Interest rate swap contracts . . . . . . . . . . . . . . . . . . . . . . . . . . . . 37.7 —
39.5 0.6
Contracts with negative fair valuesForeign currency forward contracts . . . . . . . . . . . . . . . . . . . . . . . (3.4) (1.9)Cross currency swap contracts . . . . . . . . . . . . . . . . . . . . . . . . . . (63.5) —
(66.9) (1.9)
Cash flows from the Group’s cash flow hedges at 31 December 2010 are expected to occur and,accordingly, affect profit or loss in 2011, except for the combined interest rate/cross currency swaphedging contracts used for the $400m bond for which cash flows are expected to occur and affect profitor loss up to 2015.
(b) Fair value hedges
The fair values of derivative financial instruments at 31 December designated as fair value hedgeswere:
2010 2009E million E million
Contracts with positive fair valuesForeign currency forward contracts . . . . . . . . . . . . . . . . . . . . . . . 1.7 0.9Foreign currency option contracts . . . . . . . . . . . . . . . . . . . . . . . — 2.4Interest rate swap contracts . . . . . . . . . . . . . . . . . . . . . . . . . . . . 35.4 63.1
37.1 66.4
Contracts with negative fair valuesForeign currency forward contracts . . . . . . . . . . . . . . . . . . . . . . . (0.6) (2.5)
F-38
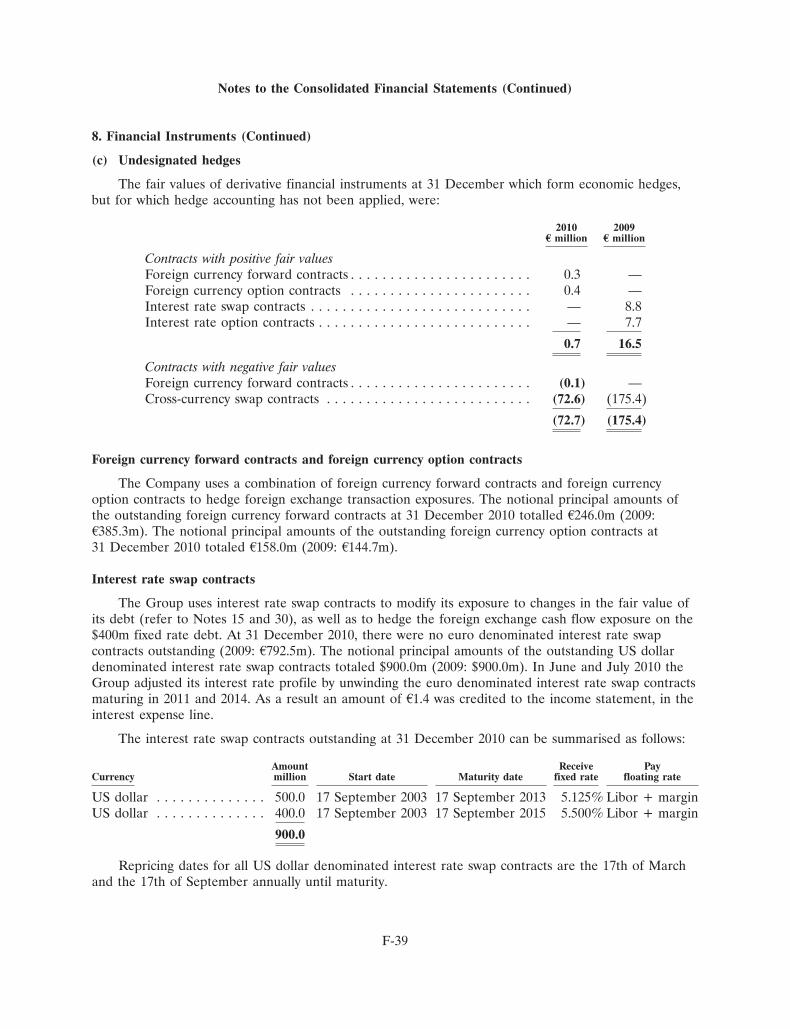
Notes to the Consolidated Financial Statements (Continued)
8. Financial Instruments (Continued)
(c) Undesignated hedges
The fair values of derivative financial instruments at 31 December which form economic hedges,but for which hedge accounting has not been applied, were:
2010 2009E million E million
Contracts with positive fair valuesForeign currency forward contracts . . . . . . . . . . . . . . . . . . . . . . . 0.3 —Foreign currency option contracts . . . . . . . . . . . . . . . . . . . . . . . 0.4 —Interest rate swap contracts . . . . . . . . . . . . . . . . . . . . . . . . . . . . — 8.8Interest rate option contracts . . . . . . . . . . . . . . . . . . . . . . . . . . . — 7.7
0.7 16.5
Contracts with negative fair valuesForeign currency forward contracts . . . . . . . . . . . . . . . . . . . . . . . (0.1) —Cross-currency swap contracts . . . . . . . . . . . . . . . . . . . . . . . . . . (72.6) (175.4)
(72.7) (175.4)
Foreign currency forward contracts and foreign currency option contracts
The Company uses a combination of foreign currency forward contracts and foreign currencyoption contracts to hedge foreign exchange transaction exposures. The notional principal amounts ofthe outstanding foreign currency forward contracts at 31 December 2010 totalled A246.0m (2009:A385.3m). The notional principal amounts of the outstanding foreign currency option contracts at31 December 2010 totaled A158.0m (2009: A144.7m).
Interest rate swap contracts
The Group uses interest rate swap contracts to modify its exposure to changes in the fair value ofits debt (refer to Notes 15 and 30), as well as to hedge the foreign exchange cash flow exposure on the$400m fixed rate debt. At 31 December 2010, there were no euro denominated interest rate swapcontracts outstanding (2009: A792.5m). The notional principal amounts of the outstanding US dollardenominated interest rate swap contracts totaled $900.0m (2009: $900.0m). In June and July 2010 theGroup adjusted its interest rate profile by unwinding the euro denominated interest rate swap contractsmaturing in 2011 and 2014. As a result an amount of A1.4 was credited to the income statement, in theinterest expense line.
The interest rate swap contracts outstanding at 31 December 2010 can be summarised as follows:
Amount Receive PayCurrency million Start date Maturity date fixed rate floating rate
US dollar . . . . . . . . . . . . . . 500.0 17 September 2003 17 September 2013 5.125% Libor + marginUS dollar . . . . . . . . . . . . . . 400.0 17 September 2003 17 September 2015 5.500% Libor + margin
900.0
Repricing dates for all US dollar denominated interest rate swap contracts are the 17th of Marchand the 17th of September annually until maturity.
F-39
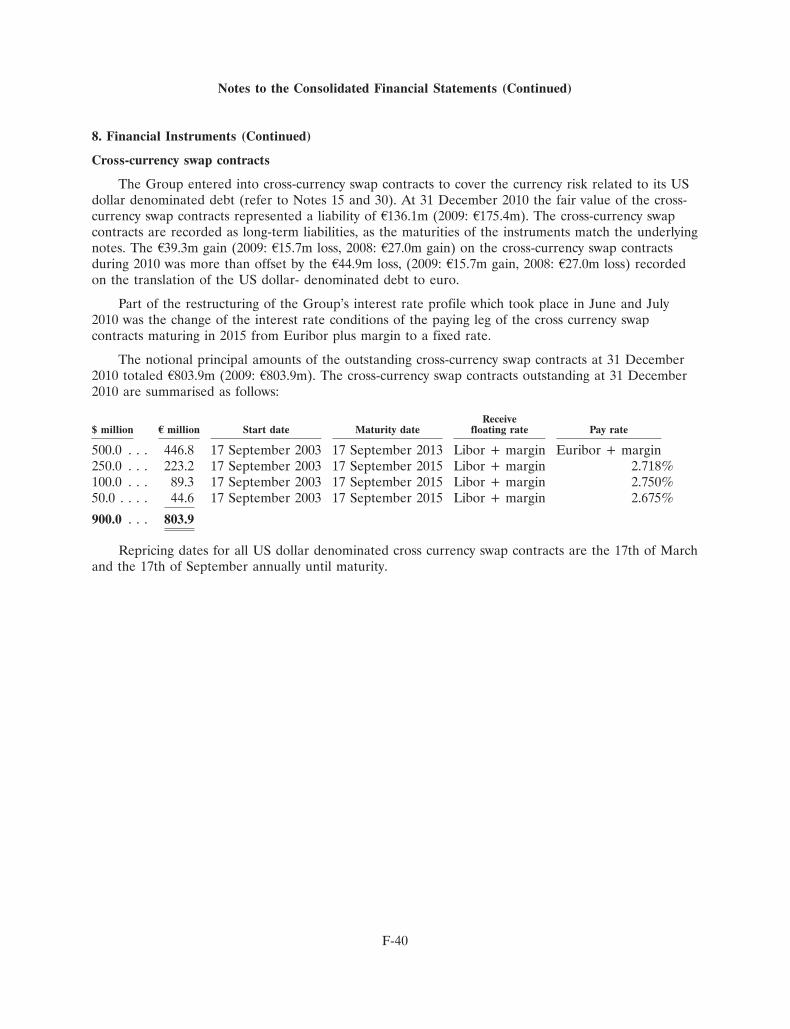
Notes to the Consolidated Financial Statements (Continued)
8. Financial Instruments (Continued)
Cross-currency swap contracts
The Group entered into cross-currency swap contracts to cover the currency risk related to its USdollar denominated debt (refer to Notes 15 and 30). At 31 December 2010 the fair value of the cross-currency swap contracts represented a liability of A136.1m (2009: A175.4m). The cross-currency swapcontracts are recorded as long-term liabilities, as the maturities of the instruments match the underlyingnotes. The A39.3m gain (2009: A15.7m loss, 2008: A27.0m gain) on the cross-currency swap contractsduring 2010 was more than offset by the A44.9m loss, (2009: A15.7m gain, 2008: A27.0m loss) recordedon the translation of the US dollar- denominated debt to euro.
Part of the restructuring of the Group’s interest rate profile which took place in June and July2010 was the change of the interest rate conditions of the paying leg of the cross currency swapcontracts maturing in 2015 from Euribor plus margin to a fixed rate.
The notional principal amounts of the outstanding cross-currency swap contracts at 31 December2010 totaled A803.9m (2009: A803.9m). The cross-currency swap contracts outstanding at 31 December2010 are summarised as follows:
Receive$ million E million Start date Maturity date floating rate Pay rate
500.0 . . . 446.8 17 September 2003 17 September 2013 Libor + margin Euribor + margin250.0 . . . 223.2 17 September 2003 17 September 2015 Libor + margin 2.718%100.0 . . . 89.3 17 September 2003 17 September 2015 Libor + margin 2.750%50.0 . . . . 44.6 17 September 2003 17 September 2015 Libor + margin 2.675%
900.0 . . . 803.9
Repricing dates for all US dollar denominated cross currency swap contracts are the 17th of Marchand the 17th of September annually until maturity.
F-40
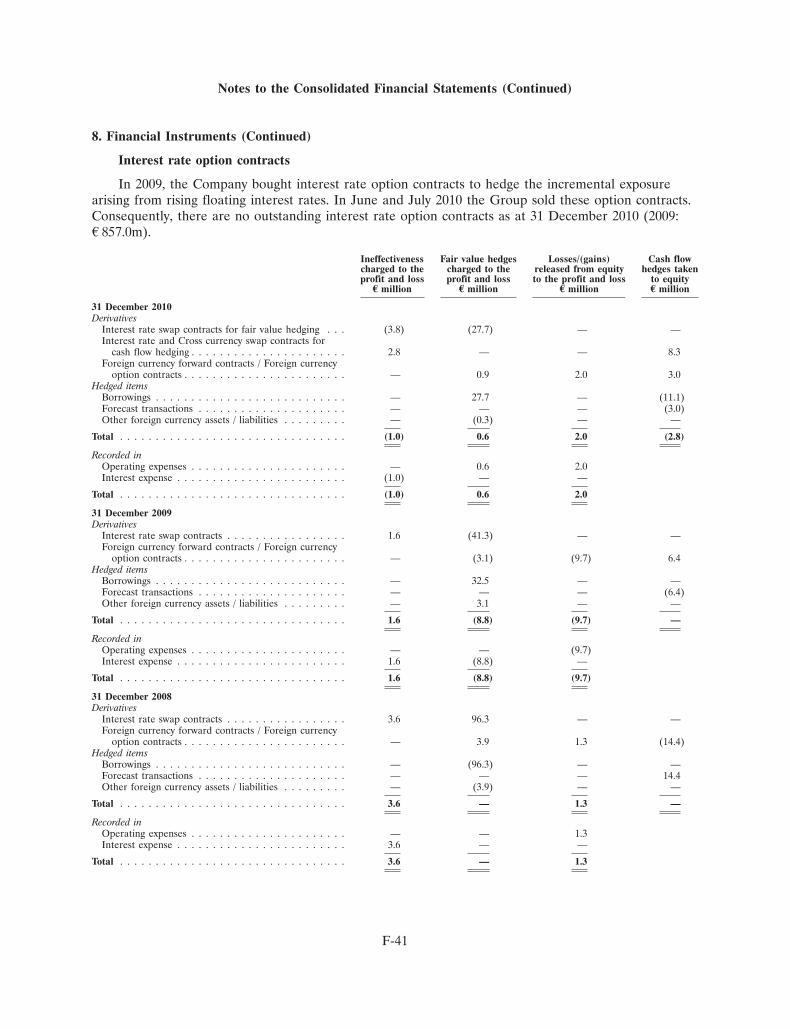
Notes to the Consolidated Financial Statements (Continued)
8. Financial Instruments (Continued)
Interest rate option contracts
In 2009, the Company bought interest rate option contracts to hedge the incremental exposurearising from rising floating interest rates. In June and July 2010 the Group sold these option contracts.Consequently, there are no outstanding interest rate option contracts as at 31 December 2010 (2009:A 857.0m).
Ineffectiveness Fair value hedges Losses/(gains) Cash flowcharged to the charged to the released from equity hedges takenprofit and loss profit and loss to the profit and loss to equityE million E million E million E million
31 December 2010Derivatives
Interest rate swap contracts for fair value hedging . . . (3.8) (27.7) — —Interest rate and Cross currency swap contracts for
cash flow hedging . . . . . . . . . . . . . . . . . . . . . . 2.8 — — 8.3Foreign currency forward contracts / Foreign currency
option contracts . . . . . . . . . . . . . . . . . . . . . . . — 0.9 2.0 3.0Hedged items
Borrowings . . . . . . . . . . . . . . . . . . . . . . . . . . . — 27.7 — (11.1)Forecast transactions . . . . . . . . . . . . . . . . . . . . . — — — (3.0)Other foreign currency assets / liabilities . . . . . . . . . — (0.3) — —
Total . . . . . . . . . . . . . . . . . . . . . . . . . . . . . . . . (1.0) 0.6 2.0 (2.8)
Recorded inOperating expenses . . . . . . . . . . . . . . . . . . . . . . — 0.6 2.0Interest expense . . . . . . . . . . . . . . . . . . . . . . . . (1.0) — —
Total . . . . . . . . . . . . . . . . . . . . . . . . . . . . . . . . (1.0) 0.6 2.0
31 December 2009Derivatives
Interest rate swap contracts . . . . . . . . . . . . . . . . . 1.6 (41.3) — —Foreign currency forward contracts / Foreign currency
option contracts . . . . . . . . . . . . . . . . . . . . . . . — (3.1) (9.7) 6.4Hedged items
Borrowings . . . . . . . . . . . . . . . . . . . . . . . . . . . — 32.5 — —Forecast transactions . . . . . . . . . . . . . . . . . . . . . — — — (6.4)Other foreign currency assets / liabilities . . . . . . . . . — 3.1 — —
Total . . . . . . . . . . . . . . . . . . . . . . . . . . . . . . . . 1.6 (8.8) (9.7) —
Recorded inOperating expenses . . . . . . . . . . . . . . . . . . . . . . — — (9.7)Interest expense . . . . . . . . . . . . . . . . . . . . . . . . 1.6 (8.8) —
Total . . . . . . . . . . . . . . . . . . . . . . . . . . . . . . . . 1.6 (8.8) (9.7)
31 December 2008Derivatives
Interest rate swap contracts . . . . . . . . . . . . . . . . . 3.6 96.3 — —Foreign currency forward contracts / Foreign currency
option contracts . . . . . . . . . . . . . . . . . . . . . . . — 3.9 1.3 (14.4)Hedged items
Borrowings . . . . . . . . . . . . . . . . . . . . . . . . . . . — (96.3) — —Forecast transactions . . . . . . . . . . . . . . . . . . . . . — — — 14.4Other foreign currency assets / liabilities . . . . . . . . . — (3.9) — —
Total . . . . . . . . . . . . . . . . . . . . . . . . . . . . . . . . 3.6 — 1.3 —
Recorded inOperating expenses . . . . . . . . . . . . . . . . . . . . . . — — 1.3Interest expense . . . . . . . . . . . . . . . . . . . . . . . . 3.6 — —
Total . . . . . . . . . . . . . . . . . . . . . . . . . . . . . . . . 3.6 — 1.3
F-41
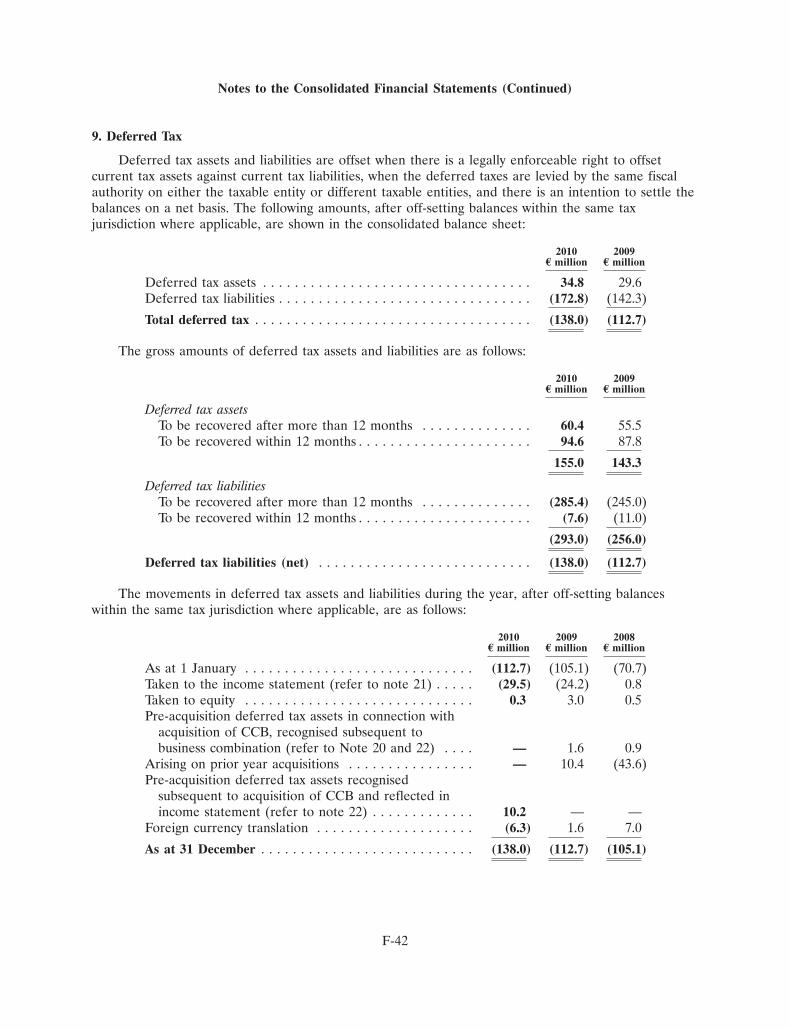
Notes to the Consolidated Financial Statements (Continued)
9. Deferred Tax
Deferred tax assets and liabilities are offset when there is a legally enforceable right to offsetcurrent tax assets against current tax liabilities, when the deferred taxes are levied by the same fiscalauthority on either the taxable entity or different taxable entities, and there is an intention to settle thebalances on a net basis. The following amounts, after off-setting balances within the same taxjurisdiction where applicable, are shown in the consolidated balance sheet:
2010 2009E million E million
Deferred tax assets . . . . . . . . . . . . . . . . . . . . . . . . . . . . . . . . . . 34.8 29.6Deferred tax liabilities . . . . . . . . . . . . . . . . . . . . . . . . . . . . . . . . (172.8) (142.3)
Total deferred tax . . . . . . . . . . . . . . . . . . . . . . . . . . . . . . . . . . . (138.0) (112.7)
The gross amounts of deferred tax assets and liabilities are as follows:
2010 2009E million E million
Deferred tax assetsTo be recovered after more than 12 months . . . . . . . . . . . . . . 60.4 55.5To be recovered within 12 months . . . . . . . . . . . . . . . . . . . . . . 94.6 87.8
155.0 143.3
Deferred tax liabilitiesTo be recovered after more than 12 months . . . . . . . . . . . . . . (285.4) (245.0)To be recovered within 12 months . . . . . . . . . . . . . . . . . . . . . . (7.6) (11.0)
(293.0) (256.0)
Deferred tax liabilities (net) . . . . . . . . . . . . . . . . . . . . . . . . . . . (138.0) (112.7)
The movements in deferred tax assets and liabilities during the year, after off-setting balanceswithin the same tax jurisdiction where applicable, are as follows:
2010 2009 2008E million E million E million
As at 1 January . . . . . . . . . . . . . . . . . . . . . . . . . . . . . (112.7) (105.1) (70.7)Taken to the income statement (refer to note 21) . . . . . (29.5) (24.2) 0.8Taken to equity . . . . . . . . . . . . . . . . . . . . . . . . . . . . . 0.3 3.0 0.5Pre-acquisition deferred tax assets in connection with
acquisition of CCB, recognised subsequent tobusiness combination (refer to Note 20 and 22) . . . . — 1.6 0.9
Arising on prior year acquisitions . . . . . . . . . . . . . . . . — 10.4 (43.6)Pre-acquisition deferred tax assets recognised
subsequent to acquisition of CCB and reflected inincome statement (refer to note 22) . . . . . . . . . . . . . 10.2 — —
Foreign currency translation . . . . . . . . . . . . . . . . . . . . (6.3) 1.6 7.0
As at 31 December . . . . . . . . . . . . . . . . . . . . . . . . . . . (138.0) (112.7) (105.1)
F-42
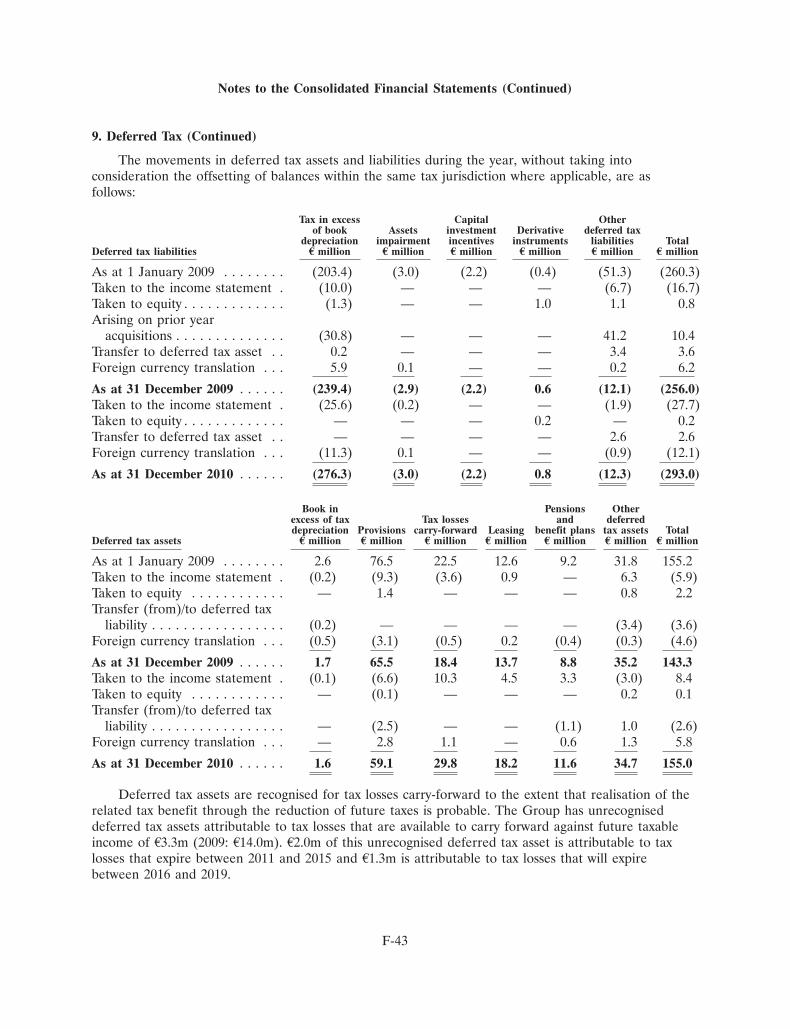
Notes to the Consolidated Financial Statements (Continued)
9. Deferred Tax (Continued)
The movements in deferred tax assets and liabilities during the year, without taking intoconsideration the offsetting of balances within the same tax jurisdiction where applicable, are asfollows:
Tax in excess Capital Otherof book Assets investment Derivative deferred tax
depreciation impairment incentives instruments liabilities TotalDeferred tax liabilities E million E million E million E million E million E million
As at 1 January 2009 . . . . . . . . (203.4) (3.0) (2.2) (0.4) (51.3) (260.3)Taken to the income statement . (10.0) — — — (6.7) (16.7)Taken to equity . . . . . . . . . . . . . (1.3) — — 1.0 1.1 0.8Arising on prior year
acquisitions . . . . . . . . . . . . . . (30.8) — — — 41.2 10.4Transfer to deferred tax asset . . 0.2 — — — 3.4 3.6Foreign currency translation . . . 5.9 0.1 — — 0.2 6.2
As at 31 December 2009 . . . . . . (239.4) (2.9) (2.2) 0.6 (12.1) (256.0)Taken to the income statement . (25.6) (0.2) — — (1.9) (27.7)Taken to equity . . . . . . . . . . . . . — — — 0.2 — 0.2Transfer to deferred tax asset . . — — — — 2.6 2.6Foreign currency translation . . . (11.3) 0.1 — — (0.9) (12.1)
As at 31 December 2010 . . . . . . (276.3) (3.0) (2.2) 0.8 (12.3) (293.0)
Book in Pensions Otherexcess of tax Tax losses and deferreddepreciation Provisions carry-forward Leasing benefit plans tax assets Total
Deferred tax assets E million E million E million E million E million E million E million
As at 1 January 2009 . . . . . . . . 2.6 76.5 22.5 12.6 9.2 31.8 155.2Taken to the income statement . (0.2) (9.3) (3.6) 0.9 — 6.3 (5.9)Taken to equity . . . . . . . . . . . . — 1.4 — — — 0.8 2.2Transfer (from)/to deferred tax
liability . . . . . . . . . . . . . . . . . (0.2) — — — — (3.4) (3.6)Foreign currency translation . . . (0.5) (3.1) (0.5) 0.2 (0.4) (0.3) (4.6)
As at 31 December 2009 . . . . . . 1.7 65.5 18.4 13.7 8.8 35.2 143.3Taken to the income statement . (0.1) (6.6) 10.3 4.5 3.3 (3.0) 8.4Taken to equity . . . . . . . . . . . . — (0.1) — — — 0.2 0.1Transfer (from)/to deferred tax
liability . . . . . . . . . . . . . . . . . — (2.5) — — (1.1) 1.0 (2.6)Foreign currency translation . . . — 2.8 1.1 — 0.6 1.3 5.8
As at 31 December 2010 . . . . . . 1.6 59.1 29.8 18.2 11.6 34.7 155.0
Deferred tax assets are recognised for tax losses carry-forward to the extent that realisation of therelated tax benefit through the reduction of future taxes is probable. The Group has unrecogniseddeferred tax assets attributable to tax losses that are available to carry forward against future taxableincome of A3.3m (2009: A14.0m). A2.0m of this unrecognised deferred tax asset is attributable to taxlosses that expire between 2011 and 2015 and A1.3m is attributable to tax losses that will expirebetween 2016 and 2019.
F-43
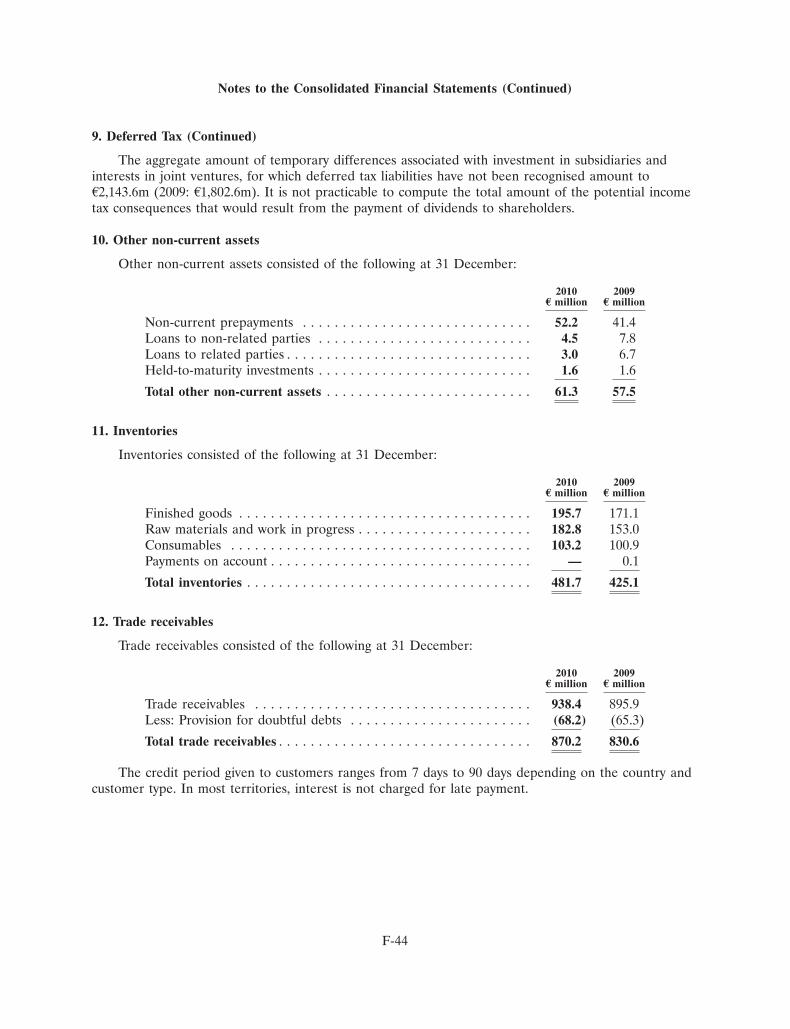
Notes to the Consolidated Financial Statements (Continued)
9. Deferred Tax (Continued)
The aggregate amount of temporary differences associated with investment in subsidiaries andinterests in joint ventures, for which deferred tax liabilities have not been recognised amount toA2,143.6m (2009: A1,802.6m). It is not practicable to compute the total amount of the potential incometax consequences that would result from the payment of dividends to shareholders.
10. Other non-current assets
Other non-current assets consisted of the following at 31 December:
2010 2009E million E million
Non-current prepayments . . . . . . . . . . . . . . . . . . . . . . . . . . . . . 52.2 41.4Loans to non-related parties . . . . . . . . . . . . . . . . . . . . . . . . . . . 4.5 7.8Loans to related parties . . . . . . . . . . . . . . . . . . . . . . . . . . . . . . . 3.0 6.7Held-to-maturity investments . . . . . . . . . . . . . . . . . . . . . . . . . . . 1.6 1.6
Total other non-current assets . . . . . . . . . . . . . . . . . . . . . . . . . . 61.3 57.5
11. Inventories
Inventories consisted of the following at 31 December:
2010 2009E million E million
Finished goods . . . . . . . . . . . . . . . . . . . . . . . . . . . . . . . . . . . . . 195.7 171.1Raw materials and work in progress . . . . . . . . . . . . . . . . . . . . . . 182.8 153.0Consumables . . . . . . . . . . . . . . . . . . . . . . . . . . . . . . . . . . . . . . 103.2 100.9Payments on account . . . . . . . . . . . . . . . . . . . . . . . . . . . . . . . . . — 0.1
Total inventories . . . . . . . . . . . . . . . . . . . . . . . . . . . . . . . . . . . . 481.7 425.1
12. Trade receivables
Trade receivables consisted of the following at 31 December:
2010 2009E million E million
Trade receivables . . . . . . . . . . . . . . . . . . . . . . . . . . . . . . . . . . . 938.4 895.9Less: Provision for doubtful debts . . . . . . . . . . . . . . . . . . . . . . . (68.2) (65.3)
Total trade receivables . . . . . . . . . . . . . . . . . . . . . . . . . . . . . . . . 870.2 830.6
The credit period given to customers ranges from 7 days to 90 days depending on the country andcustomer type. In most territories, interest is not charged for late payment.
F-44
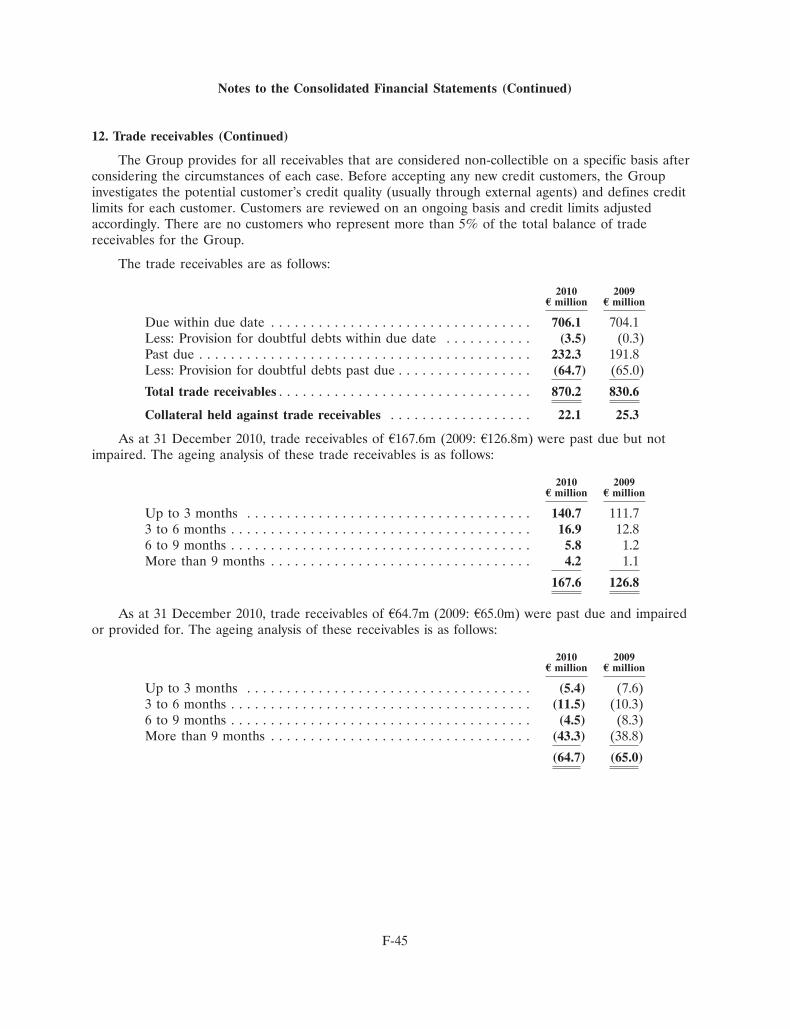
Notes to the Consolidated Financial Statements (Continued)
12. Trade receivables (Continued)
The Group provides for all receivables that are considered non-collectible on a specific basis afterconsidering the circumstances of each case. Before accepting any new credit customers, the Groupinvestigates the potential customer’s credit quality (usually through external agents) and defines creditlimits for each customer. Customers are reviewed on an ongoing basis and credit limits adjustedaccordingly. There are no customers who represent more than 5% of the total balance of tradereceivables for the Group.
The trade receivables are as follows:
2010 2009E million E million
Due within due date . . . . . . . . . . . . . . . . . . . . . . . . . . . . . . . . . 706.1 704.1Less: Provision for doubtful debts within due date . . . . . . . . . . . (3.5) (0.3)Past due . . . . . . . . . . . . . . . . . . . . . . . . . . . . . . . . . . . . . . . . . . 232.3 191.8Less: Provision for doubtful debts past due . . . . . . . . . . . . . . . . . (64.7) (65.0)
Total trade receivables . . . . . . . . . . . . . . . . . . . . . . . . . . . . . . . . 870.2 830.6
Collateral held against trade receivables . . . . . . . . . . . . . . . . . . 22.1 25.3
As at 31 December 2010, trade receivables of A167.6m (2009: A126.8m) were past due but notimpaired. The ageing analysis of these trade receivables is as follows:
2010 2009E million E million
Up to 3 months . . . . . . . . . . . . . . . . . . . . . . . . . . . . . . . . . . . . 140.7 111.73 to 6 months . . . . . . . . . . . . . . . . . . . . . . . . . . . . . . . . . . . . . . 16.9 12.86 to 9 months . . . . . . . . . . . . . . . . . . . . . . . . . . . . . . . . . . . . . . 5.8 1.2More than 9 months . . . . . . . . . . . . . . . . . . . . . . . . . . . . . . . . . 4.2 1.1
167.6 126.8
As at 31 December 2010, trade receivables of A64.7m (2009: A65.0m) were past due and impairedor provided for. The ageing analysis of these receivables is as follows:
2010 2009E million E million
Up to 3 months . . . . . . . . . . . . . . . . . . . . . . . . . . . . . . . . . . . . (5.4) (7.6)3 to 6 months . . . . . . . . . . . . . . . . . . . . . . . . . . . . . . . . . . . . . . (11.5) (10.3)6 to 9 months . . . . . . . . . . . . . . . . . . . . . . . . . . . . . . . . . . . . . . (4.5) (8.3)More than 9 months . . . . . . . . . . . . . . . . . . . . . . . . . . . . . . . . . (43.3) (38.8)
(64.7) (65.0)
F-45
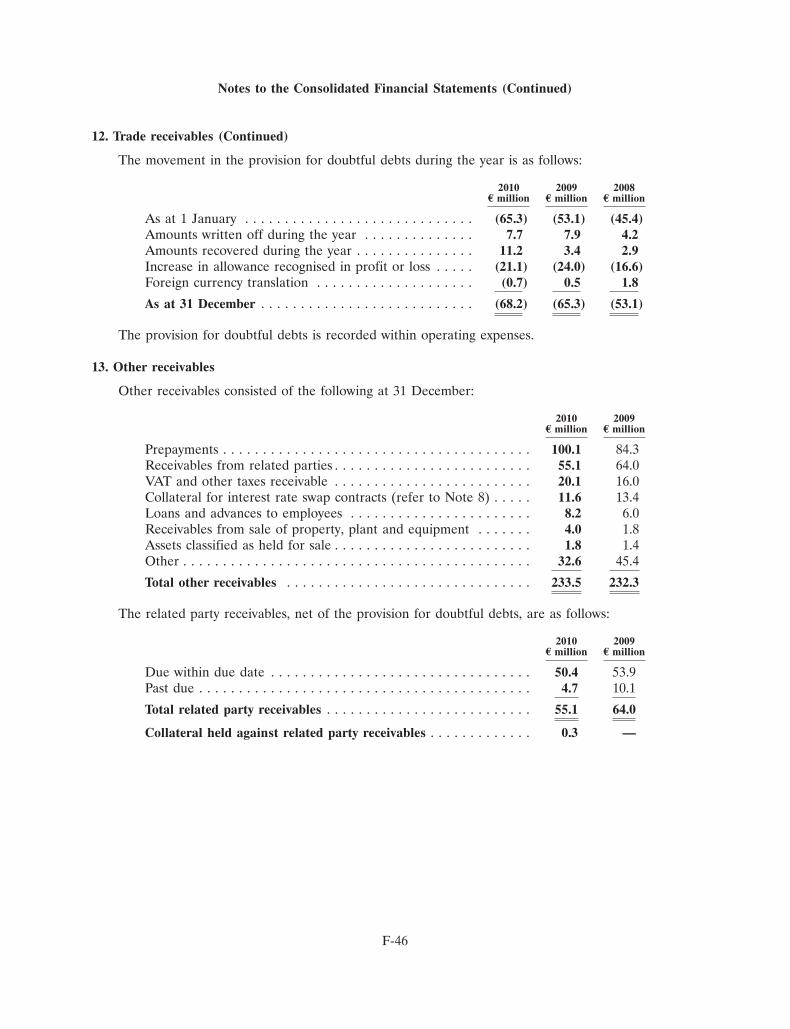
Notes to the Consolidated Financial Statements (Continued)
12. Trade receivables (Continued)
The movement in the provision for doubtful debts during the year is as follows:
2010 2009 2008E million E million E million
As at 1 January . . . . . . . . . . . . . . . . . . . . . . . . . . . . . (65.3) (53.1) (45.4)Amounts written off during the year . . . . . . . . . . . . . . 7.7 7.9 4.2Amounts recovered during the year . . . . . . . . . . . . . . . 11.2 3.4 2.9Increase in allowance recognised in profit or loss . . . . . (21.1) (24.0) (16.6)Foreign currency translation . . . . . . . . . . . . . . . . . . . . (0.7) 0.5 1.8
As at 31 December . . . . . . . . . . . . . . . . . . . . . . . . . . . (68.2) (65.3) (53.1)
The provision for doubtful debts is recorded within operating expenses.
13. Other receivables
Other receivables consisted of the following at 31 December:
2010 2009E million E million
Prepayments . . . . . . . . . . . . . . . . . . . . . . . . . . . . . . . . . . . . . . . 100.1 84.3Receivables from related parties . . . . . . . . . . . . . . . . . . . . . . . . . 55.1 64.0VAT and other taxes receivable . . . . . . . . . . . . . . . . . . . . . . . . . 20.1 16.0Collateral for interest rate swap contracts (refer to Note 8) . . . . . 11.6 13.4Loans and advances to employees . . . . . . . . . . . . . . . . . . . . . . . 8.2 6.0Receivables from sale of property, plant and equipment . . . . . . . 4.0 1.8Assets classified as held for sale . . . . . . . . . . . . . . . . . . . . . . . . . 1.8 1.4Other . . . . . . . . . . . . . . . . . . . . . . . . . . . . . . . . . . . . . . . . . . . . 32.6 45.4
Total other receivables . . . . . . . . . . . . . . . . . . . . . . . . . . . . . . . 233.5 232.3
The related party receivables, net of the provision for doubtful debts, are as follows:
2010 2009E million E million
Due within due date . . . . . . . . . . . . . . . . . . . . . . . . . . . . . . . . . 50.4 53.9Past due . . . . . . . . . . . . . . . . . . . . . . . . . . . . . . . . . . . . . . . . . . 4.7 10.1
Total related party receivables . . . . . . . . . . . . . . . . . . . . . . . . . . 55.1 64.0
Collateral held against related party receivables . . . . . . . . . . . . . 0.3 —
F-46
Notes to the Consolidated Financial Statements (Continued)
13. Other receivables (Continued)
As at 31 December 2010, related party receivables of A4.7m (2009: A10.1m) were past due but notimpaired. The ageing analysis of these related party receivables is as follows:
2010 2009E million E million
Up to 3 months . . . . . . . . . . . . . . . . . . . . . . . . . . . . . . . . . . . . 3.0 8.13 to 6 months . . . . . . . . . . . . . . . . . . . . . . . . . . . . . . . . . . . . . . 0.5 1.26 to 9 months . . . . . . . . . . . . . . . . . . . . . . . . . . . . . . . . . . . . . . 0.1 0.7More than 9 months . . . . . . . . . . . . . . . . . . . . . . . . . . . . . . . . . 1.1 0.1
Total . . . . . . . . . . . . . . . . . . . . . . . . . . . . . . . . . . . . . . . . . . . . 4.7 10.1
During 2008, non-current assets with net book value of A11.0m were reclassified from property,plant and equipment to assets held for sale in our established markets. Of this balance, A5.1m relatedto buildings and A5.9m related to computer software and hardware. As at 31 December 2008, buildingsand computer software with a net book value of A5.3m remained classified as held for sale, while thesale of computer hardware and software was made at their net book value. In 2009, these assets werereclassified to property, plant and equipment, after being adjusted for the depreciation that would havebeen recognised had the assets not been classified as held for sale, because the criteria for continuedclassification as held for sale were no longer met.
During 2009, non-current assets with net book value of A1.4m were reclassified from property,plant and equipment to assets held for sale in our developing markets. These assets relate to vehiclesand production equipment. As at 31 December 2009, plant and equipment with a net book value ofA1.4m remained classified as held for sale. In 2010, A1.0m were reclassified to property, plant andequipment, after being adjusted for the depreciation that would have been recognized had the assetsnot been classified as held for sale, because the criteria for continued classification as held for salewere no longer met and A0.4m remained classified as held for sale since we expect that these vehicleswill be sold during 2011.
During 2010, non-current assets with a net book value of A1.8m were classified from property,plant and equipment to assets held for sale. The amount of A1.2m concerns land and buildings in ourestablished markets of which A0.4m has been sold during 2010 and the amount of A0.6m concerns aplant in our emerging markets.
14. Cash and cash equivalents
Cash and cash equivalents at 31 December comprise the following:
2010 2009E million E million
Cash at bank, in transit and in hand . . . . . . . . . . . . . . . . . . . . . . 72.8 87.7Short-term deposits . . . . . . . . . . . . . . . . . . . . . . . . . . . . . . . . . . 253.3 144.3
Total cash and cash equivalents . . . . . . . . . . . . . . . . . . . . . . . . . 326.1 232.0
F-47
Notes to the Consolidated Financial Statements (Continued)
14. Cash and cash equivalents (Continued)
Cash and cash equivalents are held in the following currencies:
2010 2009E million E million
Euro . . . . . . . . . . . . . . . . . . . . . . . . . . . . . . . . . . . . . . . . . . . . 283.5 161.3Serbian dinar . . . . . . . . . . . . . . . . . . . . . . . . . . . . . . . . . . . . . . 10.7 4.9Belarusian rouble . . . . . . . . . . . . . . . . . . . . . . . . . . . . . . . . . . . 7.6 4.7FYROM dinar . . . . . . . . . . . . . . . . . . . . . . . . . . . . . . . . . . . . . 4.4 5.5Croatian kuna . . . . . . . . . . . . . . . . . . . . . . . . . . . . . . . . . . . . . . 4.0 16.7Russian rouble . . . . . . . . . . . . . . . . . . . . . . . . . . . . . . . . . . . . . 3.7 23.1Nigerian naira . . . . . . . . . . . . . . . . . . . . . . . . . . . . . . . . . . . . . . 3.0 4.1Bulgarian lev . . . . . . . . . . . . . . . . . . . . . . . . . . . . . . . . . . . . . . 2.0 2.0Ukrainian hryvnia . . . . . . . . . . . . . . . . . . . . . . . . . . . . . . . . . . . 1.6 0.3Romanian leu . . . . . . . . . . . . . . . . . . . . . . . . . . . . . . . . . . . . . . 1.3 2.2Swiss franc . . . . . . . . . . . . . . . . . . . . . . . . . . . . . . . . . . . . . . . . 1.2 1.4Bosnia and Herzegovina convertible mark . . . . . . . . . . . . . . . . . 0.9 1.3US dollar . . . . . . . . . . . . . . . . . . . . . . . . . . . . . . . . . . . . . . . . . 0.6 0.7Hungarian forint . . . . . . . . . . . . . . . . . . . . . . . . . . . . . . . . . . . . — 1.0Other . . . . . . . . . . . . . . . . . . . . . . . . . . . . . . . . . . . . . . . . . . . . 1.6 2.8
Total cash and cash equivalents . . . . . . . . . . . . . . . . . . . . . . . . . 326.1 232.0
The amount of dividends payable to the Company by its operating subsidiaries is subject to, amongother restrictions, general limitations imposed by the corporate laws and exchange control restrictionsof the respective jurisdictions where those subsidiaries are organized and operate. Also, there are fundtransfer restrictions in certain countries in which we operate, in particular Nigeria. These restrictions donot have a material impact on the Group’s liquidity, as the amounts of cash and cash equivalents heldin such countries are generally retained for capital expenditure and working capital purposes. Dividendspaid to us by certain of our subsidiaries are also subject to withholding taxes.
F-48
Notes to the Consolidated Financial Statements (Continued)
15. Borrowings
The Group held the following borrowings at 31 December:
2010 2009E million E million
Bank overdrafts . . . . . . . . . . . . . . . . . . . . . . . . . . . . . . . . . . . . 44.2 35.5Current portion of long-term bonds, bills and unsecured notes . . . 305.0 1.1Commercial paper . . . . . . . . . . . . . . . . . . . . . . . . . . . . . . . . . . . 127.0 189.5Loan payable to related parties (refer to Note 34) . . . . . . . . . . . 1.2 1.2Other . . . . . . . . . . . . . . . . . . . . . . . . . . . . . . . . . . . . . . . . . . . . 8.9 9.8
486.3 237.1Obligations under finance leases falling due within one year . . . . 48.8 69.9
Total borrowings falling due within one year . . . . . . . . . . . . . . . . 535.1 307.0
Borrowings falling due within one to two yearsBonds, bills and unsecured notes . . . . . . . . . . . . . . . . . . . . . . — 518.1Other borrowings . . . . . . . . . . . . . . . . . . . . . . . . . . . . . . . . . . — 0.1
Borrowings falling due within two to five yearsBonds, bills and unsecured notes . . . . . . . . . . . . . . . . . . . . . . 1,259.7 880.5Loan payable to related parties (refer to Note 34) . . . . . . . . . . 3.1 9.9
Borrowings falling due in more than five yearsBonds, bills and unsecured notes . . . . . . . . . . . . . . . . . . . . . . 298.4 601.7
1,561.2 2,010.3Obligations under finance leases falling due in more than one
year . . . . . . . . . . . . . . . . . . . . . . . . . . . . . . . . . . . . . . . . . . . 95.2 90.3
Total borrowings falling due after one year . . . . . . . . . . . . . . . . . 1,656.4 2,100.6
Total borrowings . . . . . . . . . . . . . . . . . . . . . . . . . . . . . . . . . . . . 2,191.5 2,407.6
Commercial paper programme and committed credit facilities
In March 2002, Coca-Cola Hellenic established a A1.0bn global commercial paper programme tofurther diversify its short-term funding sources. The programme consists of a euro commercial paperfacility and a US dollar-denominated US commercial paper facility, which is currently not active. Thecommercial paper notes may be issued either as non-interest bearing notes sold at a discount or asinterest bearing notes at a fixed or at a floating rate, or by reference to an index or formula. Allcommercial paper issued under the programme must be repaid within 1 to 365 days. The outstandingamount under the euro commercial paper facility at 31 December 2010 was A127.0m (2009: A189.5m).
As at 31 December 2010, Coca-Cola Hellenic had a A500.0m syndicated loan facility, issuedthrough various financial institutions, expiring on 17 December 2012. This facility can be used forgeneral corporate purposes and carries a floating interest rate over EURIBOR and LIBOR. Thefacility allows the Company to draw down, on three to five days notice, amounts in tranches and repaythem in periods ranging from one to six months, or any other period agreed between the financialinstitutions and Coca-Cola Hellenic. No amounts have been drawn under the syndicated loan facilitysince inception.
F-49
Notes to the Consolidated Financial Statements (Continued)
15. Borrowings (Continued)
Euro medium-term note programme (‘EMTN’)
In 2001, the Group has established a A2.0bn euro medium-term note programme which has beenrenewed annually since then. Bonds issued under the programme through the wholly-owned subsidiaryCoca-Cola HBC Finance B.V. are fully, unconditionally and irrevocably guaranteed by Coca-ColaHellenic, as well as Coca-Cola HBC Finance plc (for issues prior to 2009), and are not subject to anyfinancial covenants.
In July 2004, Coca-Cola Hellenic completed the issue of a A500.0m 7-year euro-denominated fixedrate bond. In December 2010 Coca-Cola Hellenic finalized a cash tender offer through its subsidiaryCoca-Cola HBC Finance B.V. for the repurchase of its existing A500m. 4.375% fixed rate notes due in2011. On 14 December 2010, Coca-Cola HBC Finance B.V. purchased an aggregate amount of A198.9mwhich is almost 40% of the total issued A500m euro-denominated bond. As a consequence, an amountof A1.7m was charged to the income statement, in the finance costs line.
In December 2008, Coca-Cola Hellenic completed the issue of a A500.0m 5-year euro-denominatedfixed rate bond. Proceeds from the bond offering were partly used to pay for the acquisition ofSocib S.p.A. (refer to Note 28) and partly to refinance a floating rate bond that matured in March2009.
In November 2009, Coca-Cola Hellenic completed the issue of a A300.0m 7-year euro-denominatedfixed rate bond. Proceeds from the bond offering were used to fund the capital return payment (referto Note 18) and it allowed Coca-Cola Hellenic to extend its debt maturity profile.
As at 31 December 2010, a total of A1.1bn in bonds issued under the A2.0bn EMTN programmewere outstanding. A further amount of A0.9bn is available for issuance.
Notes issued in the US market
On 17 September 2003, Coca-Cola Hellenic successfully completed, through its 100% ownedsubsidiary Coca-Cola HBC Finance B.V., a $900.0m (A673.4m at 31 December 2010 exchange rates)global offering of privately placed notes with registration rights. The first tranche consisted of anaggregate principal amount of $500.0m (A374.1m at 31 December 2010 exchange rates) due in 2013 andthe second tranche consisted of an aggregate principal amount of $400.0m (A299.3m at 31 December2010 exchange rates) due in 2015. The net proceeds of the offering were used to refinance certainoutstanding debt, the leveraged re-capitalisation of the Group and the acquisition ofRomerquelle GmbH. In December 2003, an exchange offer was made by Coca-Cola Hellenic in orderto effect the exchange of the privately placed notes for similar notes registered with the SEC.Acceptances under the offer, which was finalised in February 2004, were $898.1m. The notes are fully,unconditionally and irrevocably guaranteed by Coca-Cola Hellenic. These notes are not subject tofinancial covenants.
F-50
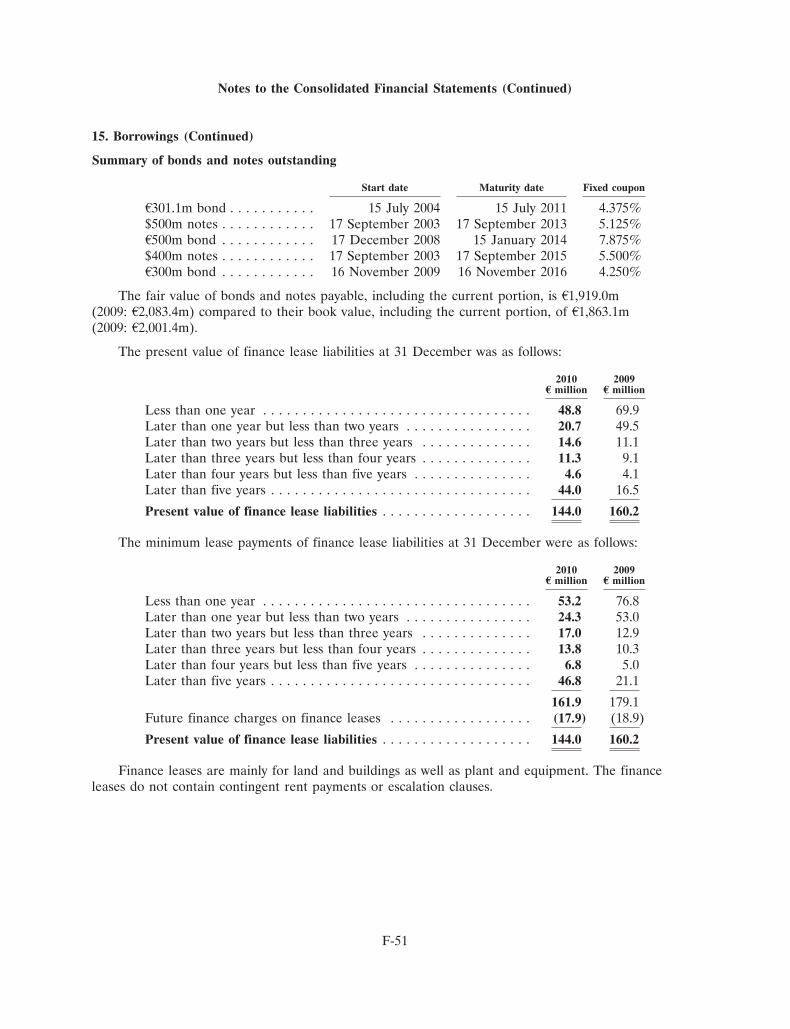
Notes to the Consolidated Financial Statements (Continued)
15. Borrowings (Continued)
Summary of bonds and notes outstanding
Start date Maturity date Fixed coupon
A301.1m bond . . . . . . . . . . . 15 July 2004 15 July 2011 4.375%$500m notes . . . . . . . . . . . . 17 September 2003 17 September 2013 5.125%A500m bond . . . . . . . . . . . . 17 December 2008 15 January 2014 7.875%$400m notes . . . . . . . . . . . . 17 September 2003 17 September 2015 5.500%A300m bond . . . . . . . . . . . . 16 November 2009 16 November 2016 4.250%
The fair value of bonds and notes payable, including the current portion, is A1,919.0m(2009: A2,083.4m) compared to their book value, including the current portion, of A1,863.1m(2009: A2,001.4m).
The present value of finance lease liabilities at 31 December was as follows:
2010 2009E million E million
Less than one year . . . . . . . . . . . . . . . . . . . . . . . . . . . . . . . . . . 48.8 69.9Later than one year but less than two years . . . . . . . . . . . . . . . . 20.7 49.5Later than two years but less than three years . . . . . . . . . . . . . . 14.6 11.1Later than three years but less than four years . . . . . . . . . . . . . . 11.3 9.1Later than four years but less than five years . . . . . . . . . . . . . . . 4.6 4.1Later than five years . . . . . . . . . . . . . . . . . . . . . . . . . . . . . . . . . 44.0 16.5
Present value of finance lease liabilities . . . . . . . . . . . . . . . . . . . 144.0 160.2
The minimum lease payments of finance lease liabilities at 31 December were as follows:
2010 2009E million E million
Less than one year . . . . . . . . . . . . . . . . . . . . . . . . . . . . . . . . . . 53.2 76.8Later than one year but less than two years . . . . . . . . . . . . . . . . 24.3 53.0Later than two years but less than three years . . . . . . . . . . . . . . 17.0 12.9Later than three years but less than four years . . . . . . . . . . . . . . 13.8 10.3Later than four years but less than five years . . . . . . . . . . . . . . . 6.8 5.0Later than five years . . . . . . . . . . . . . . . . . . . . . . . . . . . . . . . . . 46.8 21.1
161.9 179.1Future finance charges on finance leases . . . . . . . . . . . . . . . . . . (17.9) (18.9)
Present value of finance lease liabilities . . . . . . . . . . . . . . . . . . . 144.0 160.2
Finance leases are mainly for land and buildings as well as plant and equipment. The financeleases do not contain contingent rent payments or escalation clauses.
F-51
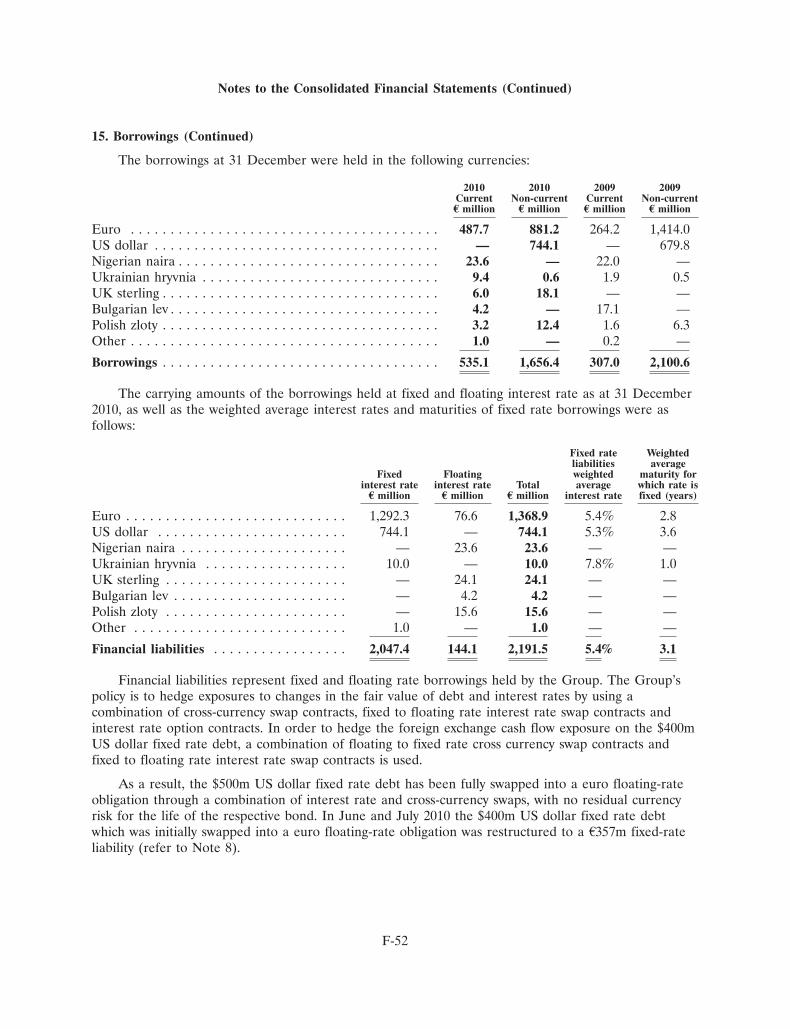
Notes to the Consolidated Financial Statements (Continued)
15. Borrowings (Continued)
The borrowings at 31 December were held in the following currencies:
2010 2010 2009 2009Current Non-current Current Non-currentE million E million E million E million
Euro . . . . . . . . . . . . . . . . . . . . . . . . . . . . . . . . . . . . . . . 487.7 881.2 264.2 1,414.0US dollar . . . . . . . . . . . . . . . . . . . . . . . . . . . . . . . . . . . . — 744.1 — 679.8Nigerian naira . . . . . . . . . . . . . . . . . . . . . . . . . . . . . . . . . 23.6 — 22.0 —Ukrainian hryvnia . . . . . . . . . . . . . . . . . . . . . . . . . . . . . . 9.4 0.6 1.9 0.5UK sterling . . . . . . . . . . . . . . . . . . . . . . . . . . . . . . . . . . . 6.0 18.1 — —Bulgarian lev . . . . . . . . . . . . . . . . . . . . . . . . . . . . . . . . . . 4.2 — 17.1 —Polish zloty . . . . . . . . . . . . . . . . . . . . . . . . . . . . . . . . . . . 3.2 12.4 1.6 6.3Other . . . . . . . . . . . . . . . . . . . . . . . . . . . . . . . . . . . . . . . 1.0 — 0.2 —
Borrowings . . . . . . . . . . . . . . . . . . . . . . . . . . . . . . . . . . . 535.1 1,656.4 307.0 2,100.6
The carrying amounts of the borrowings held at fixed and floating interest rate as at 31 December2010, as well as the weighted average interest rates and maturities of fixed rate borrowings were asfollows:
Fixed rate Weightedliabilities average
Fixed Floating weighted maturity forinterest rate interest rate Total average which rate isE million E million E million interest rate fixed (years)
Euro . . . . . . . . . . . . . . . . . . . . . . . . . . . . 1,292.3 76.6 1,368.9 5.4% 2.8US dollar . . . . . . . . . . . . . . . . . . . . . . . . 744.1 — 744.1 5.3% 3.6Nigerian naira . . . . . . . . . . . . . . . . . . . . . — 23.6 23.6 — —Ukrainian hryvnia . . . . . . . . . . . . . . . . . . 10.0 — 10.0 7.8% 1.0UK sterling . . . . . . . . . . . . . . . . . . . . . . . — 24.1 24.1 — —Bulgarian lev . . . . . . . . . . . . . . . . . . . . . . — 4.2 4.2 — —Polish zloty . . . . . . . . . . . . . . . . . . . . . . . — 15.6 15.6 — —Other . . . . . . . . . . . . . . . . . . . . . . . . . . . 1.0 — 1.0 — —
Financial liabilities . . . . . . . . . . . . . . . . . 2,047.4 144.1 2,191.5 5.4% 3.1
Financial liabilities represent fixed and floating rate borrowings held by the Group. The Group’spolicy is to hedge exposures to changes in the fair value of debt and interest rates by using acombination of cross-currency swap contracts, fixed to floating rate interest rate swap contracts andinterest rate option contracts. In order to hedge the foreign exchange cash flow exposure on the $400mUS dollar fixed rate debt, a combination of floating to fixed rate cross currency swap contracts andfixed to floating rate interest rate swap contracts is used.
As a result, the $500m US dollar fixed rate debt has been fully swapped into a euro floating-rateobligation through a combination of interest rate and cross-currency swaps, with no residual currencyrisk for the life of the respective bond. In June and July 2010 the $400m US dollar fixed rate debtwhich was initially swapped into a euro floating-rate obligation was restructured to a A357m fixed-rateliability (refer to Note 8).
F-52
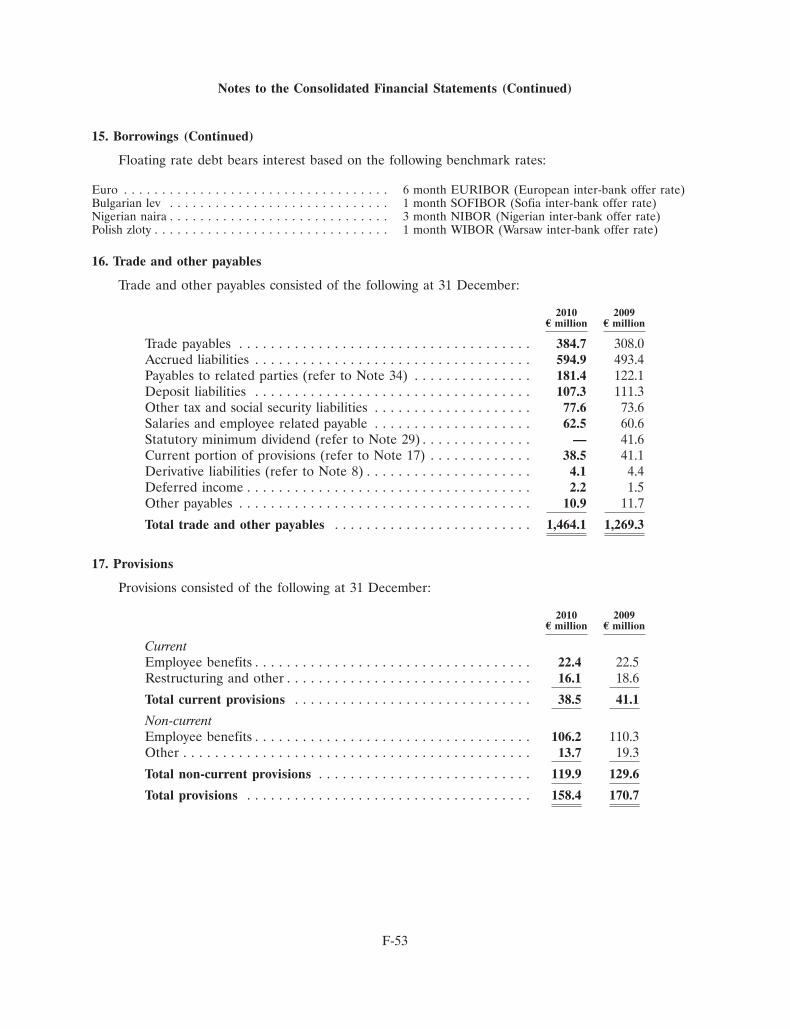
Notes to the Consolidated Financial Statements (Continued)
15. Borrowings (Continued)
Floating rate debt bears interest based on the following benchmark rates:
Euro . . . . . . . . . . . . . . . . . . . . . . . . . . . . . . . . . . . 6 month EURIBOR (European inter-bank offer rate)Bulgarian lev . . . . . . . . . . . . . . . . . . . . . . . . . . . . . 1 month SOFIBOR (Sofia inter-bank offer rate)Nigerian naira . . . . . . . . . . . . . . . . . . . . . . . . . . . . . 3 month NIBOR (Nigerian inter-bank offer rate)Polish zloty . . . . . . . . . . . . . . . . . . . . . . . . . . . . . . . 1 month WIBOR (Warsaw inter-bank offer rate)
16. Trade and other payables
Trade and other payables consisted of the following at 31 December:
2010 2009E million E million
Trade payables . . . . . . . . . . . . . . . . . . . . . . . . . . . . . . . . . . . . . 384.7 308.0Accrued liabilities . . . . . . . . . . . . . . . . . . . . . . . . . . . . . . . . . . . 594.9 493.4Payables to related parties (refer to Note 34) . . . . . . . . . . . . . . . 181.4 122.1Deposit liabilities . . . . . . . . . . . . . . . . . . . . . . . . . . . . . . . . . . . 107.3 111.3Other tax and social security liabilities . . . . . . . . . . . . . . . . . . . . 77.6 73.6Salaries and employee related payable . . . . . . . . . . . . . . . . . . . . 62.5 60.6Statutory minimum dividend (refer to Note 29) . . . . . . . . . . . . . . — 41.6Current portion of provisions (refer to Note 17) . . . . . . . . . . . . . 38.5 41.1Derivative liabilities (refer to Note 8) . . . . . . . . . . . . . . . . . . . . . 4.1 4.4Deferred income . . . . . . . . . . . . . . . . . . . . . . . . . . . . . . . . . . . . 2.2 1.5Other payables . . . . . . . . . . . . . . . . . . . . . . . . . . . . . . . . . . . . . 10.9 11.7
Total trade and other payables . . . . . . . . . . . . . . . . . . . . . . . . . 1,464.1 1,269.3
17. Provisions
Provisions consisted of the following at 31 December:
2010 2009E million E million
CurrentEmployee benefits . . . . . . . . . . . . . . . . . . . . . . . . . . . . . . . . . . . 22.4 22.5Restructuring and other . . . . . . . . . . . . . . . . . . . . . . . . . . . . . . . 16.1 18.6
Total current provisions . . . . . . . . . . . . . . . . . . . . . . . . . . . . . . 38.5 41.1
Non-currentEmployee benefits . . . . . . . . . . . . . . . . . . . . . . . . . . . . . . . . . . . 106.2 110.3Other . . . . . . . . . . . . . . . . . . . . . . . . . . . . . . . . . . . . . . . . . . . . 13.7 19.3
Total non-current provisions . . . . . . . . . . . . . . . . . . . . . . . . . . . 119.9 129.6
Total provisions . . . . . . . . . . . . . . . . . . . . . . . . . . . . . . . . . . . . 158.4 170.7
F-53
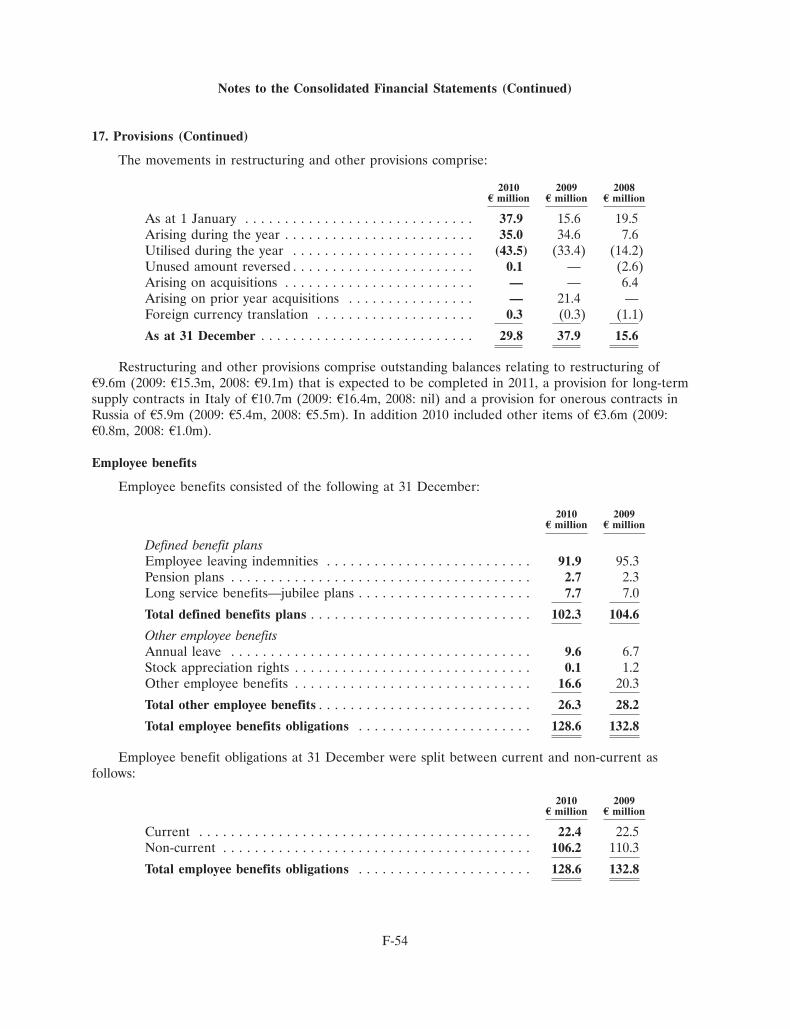
Notes to the Consolidated Financial Statements (Continued)
17. Provisions (Continued)
The movements in restructuring and other provisions comprise:
2010 2009 2008E million E million E million
As at 1 January . . . . . . . . . . . . . . . . . . . . . . . . . . . . . 37.9 15.6 19.5Arising during the year . . . . . . . . . . . . . . . . . . . . . . . . 35.0 34.6 7.6Utilised during the year . . . . . . . . . . . . . . . . . . . . . . . (43.5) (33.4) (14.2)Unused amount reversed . . . . . . . . . . . . . . . . . . . . . . . 0.1 — (2.6)Arising on acquisitions . . . . . . . . . . . . . . . . . . . . . . . . — — 6.4Arising on prior year acquisitions . . . . . . . . . . . . . . . . — 21.4 —Foreign currency translation . . . . . . . . . . . . . . . . . . . . 0.3 (0.3) (1.1)
As at 31 December . . . . . . . . . . . . . . . . . . . . . . . . . . . 29.8 37.9 15.6
Restructuring and other provisions comprise outstanding balances relating to restructuring ofA9.6m (2009: A15.3m, 2008: A9.1m) that is expected to be completed in 2011, a provision for long-termsupply contracts in Italy of A10.7m (2009: A16.4m, 2008: nil) and a provision for onerous contracts inRussia of A5.9m (2009: A5.4m, 2008: A5.5m). In addition 2010 included other items of A3.6m (2009:A0.8m, 2008: A1.0m).
Employee benefits
Employee benefits consisted of the following at 31 December:
2010 2009E million E million
Defined benefit plansEmployee leaving indemnities . . . . . . . . . . . . . . . . . . . . . . . . . . 91.9 95.3Pension plans . . . . . . . . . . . . . . . . . . . . . . . . . . . . . . . . . . . . . . 2.7 2.3Long service benefits—jubilee plans . . . . . . . . . . . . . . . . . . . . . . 7.7 7.0
Total defined benefits plans . . . . . . . . . . . . . . . . . . . . . . . . . . . . 102.3 104.6
Other employee benefitsAnnual leave . . . . . . . . . . . . . . . . . . . . . . . . . . . . . . . . . . . . . . 9.6 6.7Stock appreciation rights . . . . . . . . . . . . . . . . . . . . . . . . . . . . . . 0.1 1.2Other employee benefits . . . . . . . . . . . . . . . . . . . . . . . . . . . . . . 16.6 20.3
Total other employee benefits . . . . . . . . . . . . . . . . . . . . . . . . . . . 26.3 28.2
Total employee benefits obligations . . . . . . . . . . . . . . . . . . . . . . 128.6 132.8
Employee benefit obligations at 31 December were split between current and non-current asfollows:
2010 2009E million E million
Current . . . . . . . . . . . . . . . . . . . . . . . . . . . . . . . . . . . . . . . . . . 22.4 22.5Non-current . . . . . . . . . . . . . . . . . . . . . . . . . . . . . . . . . . . . . . . 106.2 110.3
Total employee benefits obligations . . . . . . . . . . . . . . . . . . . . . . 128.6 132.8
F-54
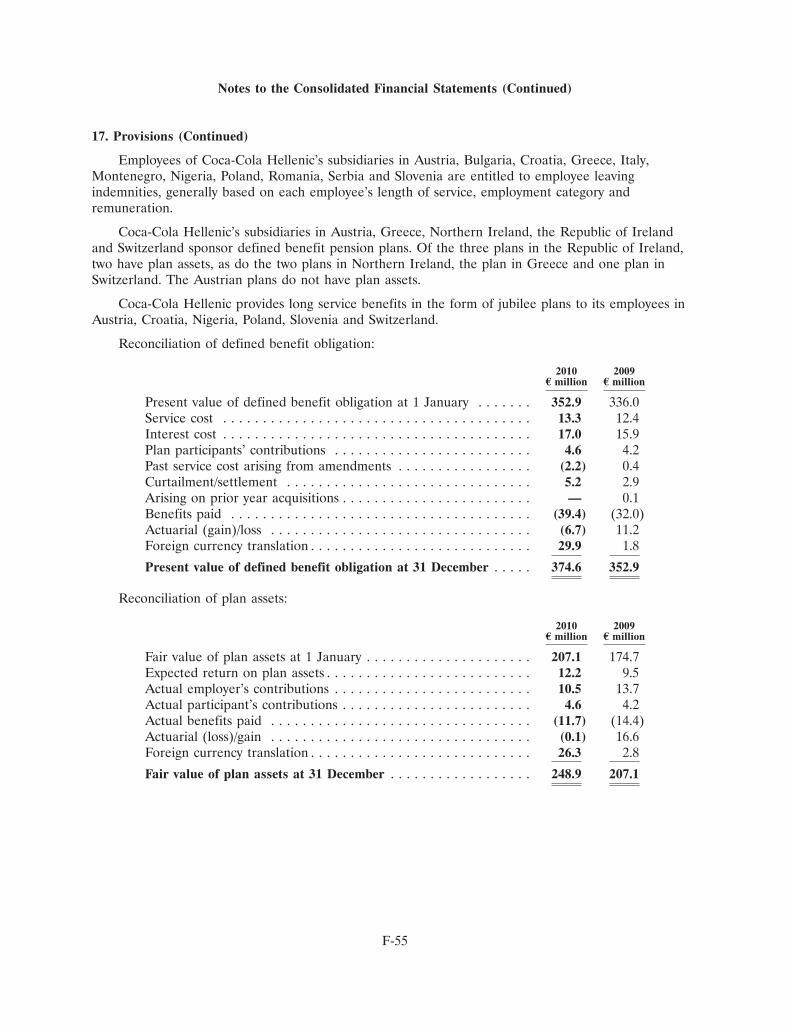
Notes to the Consolidated Financial Statements (Continued)
17. Provisions (Continued)
Employees of Coca-Cola Hellenic’s subsidiaries in Austria, Bulgaria, Croatia, Greece, Italy,Montenegro, Nigeria, Poland, Romania, Serbia and Slovenia are entitled to employee leavingindemnities, generally based on each employee’s length of service, employment category andremuneration.
Coca-Cola Hellenic’s subsidiaries in Austria, Greece, Northern Ireland, the Republic of Irelandand Switzerland sponsor defined benefit pension plans. Of the three plans in the Republic of Ireland,two have plan assets, as do the two plans in Northern Ireland, the plan in Greece and one plan inSwitzerland. The Austrian plans do not have plan assets.
Coca-Cola Hellenic provides long service benefits in the form of jubilee plans to its employees inAustria, Croatia, Nigeria, Poland, Slovenia and Switzerland.
Reconciliation of defined benefit obligation:
2010 2009E million E million
Present value of defined benefit obligation at 1 January . . . . . . . 352.9 336.0Service cost . . . . . . . . . . . . . . . . . . . . . . . . . . . . . . . . . . . . . . . 13.3 12.4Interest cost . . . . . . . . . . . . . . . . . . . . . . . . . . . . . . . . . . . . . . . 17.0 15.9Plan participants’ contributions . . . . . . . . . . . . . . . . . . . . . . . . . 4.6 4.2Past service cost arising from amendments . . . . . . . . . . . . . . . . . (2.2) 0.4Curtailment/settlement . . . . . . . . . . . . . . . . . . . . . . . . . . . . . . . 5.2 2.9Arising on prior year acquisitions . . . . . . . . . . . . . . . . . . . . . . . . — 0.1Benefits paid . . . . . . . . . . . . . . . . . . . . . . . . . . . . . . . . . . . . . . (39.4) (32.0)Actuarial (gain)/loss . . . . . . . . . . . . . . . . . . . . . . . . . . . . . . . . . (6.7) 11.2Foreign currency translation . . . . . . . . . . . . . . . . . . . . . . . . . . . . 29.9 1.8
Present value of defined benefit obligation at 31 December . . . . . 374.6 352.9
Reconciliation of plan assets:
2010 2009E million E million
Fair value of plan assets at 1 January . . . . . . . . . . . . . . . . . . . . . 207.1 174.7Expected return on plan assets . . . . . . . . . . . . . . . . . . . . . . . . . . 12.2 9.5Actual employer’s contributions . . . . . . . . . . . . . . . . . . . . . . . . . 10.5 13.7Actual participant’s contributions . . . . . . . . . . . . . . . . . . . . . . . . 4.6 4.2Actual benefits paid . . . . . . . . . . . . . . . . . . . . . . . . . . . . . . . . . (11.7) (14.4)Actuarial (loss)/gain . . . . . . . . . . . . . . . . . . . . . . . . . . . . . . . . . (0.1) 16.6Foreign currency translation . . . . . . . . . . . . . . . . . . . . . . . . . . . . 26.3 2.8
Fair value of plan assets at 31 December . . . . . . . . . . . . . . . . . . 248.9 207.1
F-55
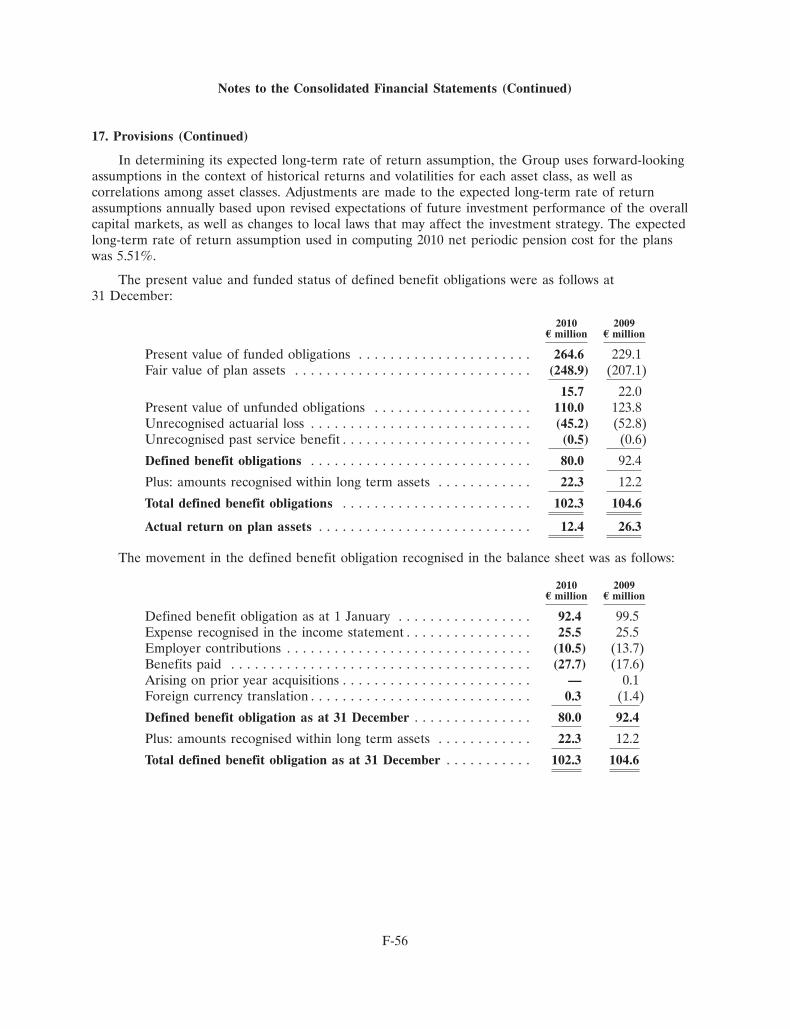
Notes to the Consolidated Financial Statements (Continued)
17. Provisions (Continued)
In determining its expected long-term rate of return assumption, the Group uses forward-lookingassumptions in the context of historical returns and volatilities for each asset class, as well ascorrelations among asset classes. Adjustments are made to the expected long-term rate of returnassumptions annually based upon revised expectations of future investment performance of the overallcapital markets, as well as changes to local laws that may affect the investment strategy. The expectedlong-term rate of return assumption used in computing 2010 net periodic pension cost for the planswas 5.51%.
The present value and funded status of defined benefit obligations were as follows at31 December:
2010 2009E million E million
Present value of funded obligations . . . . . . . . . . . . . . . . . . . . . . 264.6 229.1Fair value of plan assets . . . . . . . . . . . . . . . . . . . . . . . . . . . . . . (248.9) (207.1)
15.7 22.0Present value of unfunded obligations . . . . . . . . . . . . . . . . . . . . 110.0 123.8Unrecognised actuarial loss . . . . . . . . . . . . . . . . . . . . . . . . . . . . (45.2) (52.8)Unrecognised past service benefit . . . . . . . . . . . . . . . . . . . . . . . . (0.5) (0.6)
Defined benefit obligations . . . . . . . . . . . . . . . . . . . . . . . . . . . . 80.0 92.4
Plus: amounts recognised within long term assets . . . . . . . . . . . . 22.3 12.2
Total defined benefit obligations . . . . . . . . . . . . . . . . . . . . . . . . 102.3 104.6
Actual return on plan assets . . . . . . . . . . . . . . . . . . . . . . . . . . . 12.4 26.3
The movement in the defined benefit obligation recognised in the balance sheet was as follows:
2010 2009E million E million
Defined benefit obligation as at 1 January . . . . . . . . . . . . . . . . . 92.4 99.5Expense recognised in the income statement . . . . . . . . . . . . . . . . 25.5 25.5Employer contributions . . . . . . . . . . . . . . . . . . . . . . . . . . . . . . . (10.5) (13.7)Benefits paid . . . . . . . . . . . . . . . . . . . . . . . . . . . . . . . . . . . . . . (27.7) (17.6)Arising on prior year acquisitions . . . . . . . . . . . . . . . . . . . . . . . . — 0.1Foreign currency translation . . . . . . . . . . . . . . . . . . . . . . . . . . . . 0.3 (1.4)
Defined benefit obligation as at 31 December . . . . . . . . . . . . . . . 80.0 92.4
Plus: amounts recognised within long term assets . . . . . . . . . . . . 22.3 12.2
Total defined benefit obligation as at 31 December . . . . . . . . . . . 102.3 104.6
F-56
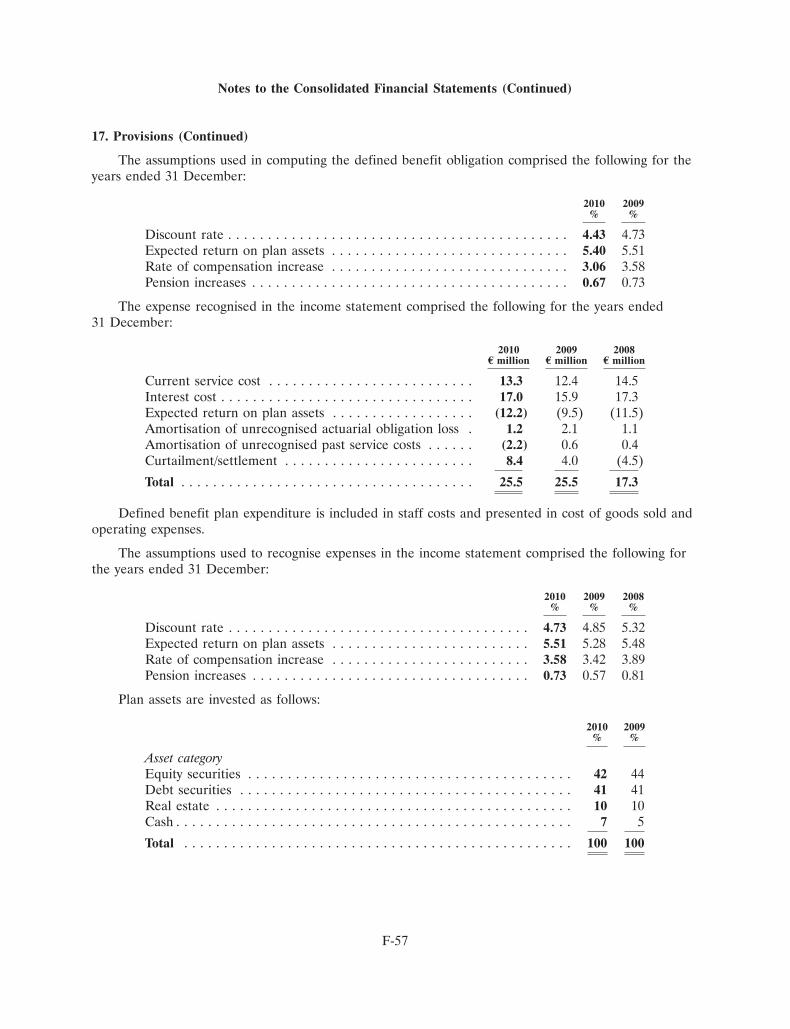
Notes to the Consolidated Financial Statements (Continued)
17. Provisions (Continued)
The assumptions used in computing the defined benefit obligation comprised the following for theyears ended 31 December:
2010 2009% %
Discount rate . . . . . . . . . . . . . . . . . . . . . . . . . . . . . . . . . . . . . . . . . . . 4.43 4.73Expected return on plan assets . . . . . . . . . . . . . . . . . . . . . . . . . . . . . . 5.40 5.51Rate of compensation increase . . . . . . . . . . . . . . . . . . . . . . . . . . . . . . 3.06 3.58Pension increases . . . . . . . . . . . . . . . . . . . . . . . . . . . . . . . . . . . . . . . . 0.67 0.73
The expense recognised in the income statement comprised the following for the years ended31 December:
2010 2009 2008E million E million E million
Current service cost . . . . . . . . . . . . . . . . . . . . . . . . . . 13.3 12.4 14.5Interest cost . . . . . . . . . . . . . . . . . . . . . . . . . . . . . . . . 17.0 15.9 17.3Expected return on plan assets . . . . . . . . . . . . . . . . . . (12.2) (9.5) (11.5)Amortisation of unrecognised actuarial obligation loss . 1.2 2.1 1.1Amortisation of unrecognised past service costs . . . . . . (2.2) 0.6 0.4Curtailment/settlement . . . . . . . . . . . . . . . . . . . . . . . . 8.4 4.0 (4.5)
Total . . . . . . . . . . . . . . . . . . . . . . . . . . . . . . . . . . . . . 25.5 25.5 17.3
Defined benefit plan expenditure is included in staff costs and presented in cost of goods sold andoperating expenses.
The assumptions used to recognise expenses in the income statement comprised the following forthe years ended 31 December:
2010 2009 2008% % %
Discount rate . . . . . . . . . . . . . . . . . . . . . . . . . . . . . . . . . . . . . . 4.73 4.85 5.32Expected return on plan assets . . . . . . . . . . . . . . . . . . . . . . . . . 5.51 5.28 5.48Rate of compensation increase . . . . . . . . . . . . . . . . . . . . . . . . . 3.58 3.42 3.89Pension increases . . . . . . . . . . . . . . . . . . . . . . . . . . . . . . . . . . . 0.73 0.57 0.81
Plan assets are invested as follows:
2010 2009% %
Asset categoryEquity securities . . . . . . . . . . . . . . . . . . . . . . . . . . . . . . . . . . . . . . . . . 42 44Debt securities . . . . . . . . . . . . . . . . . . . . . . . . . . . . . . . . . . . . . . . . . . 41 41Real estate . . . . . . . . . . . . . . . . . . . . . . . . . . . . . . . . . . . . . . . . . . . . . 10 10Cash . . . . . . . . . . . . . . . . . . . . . . . . . . . . . . . . . . . . . . . . . . . . . . . . . . 7 5
Total . . . . . . . . . . . . . . . . . . . . . . . . . . . . . . . . . . . . . . . . . . . . . . . . . 100 100
F-57
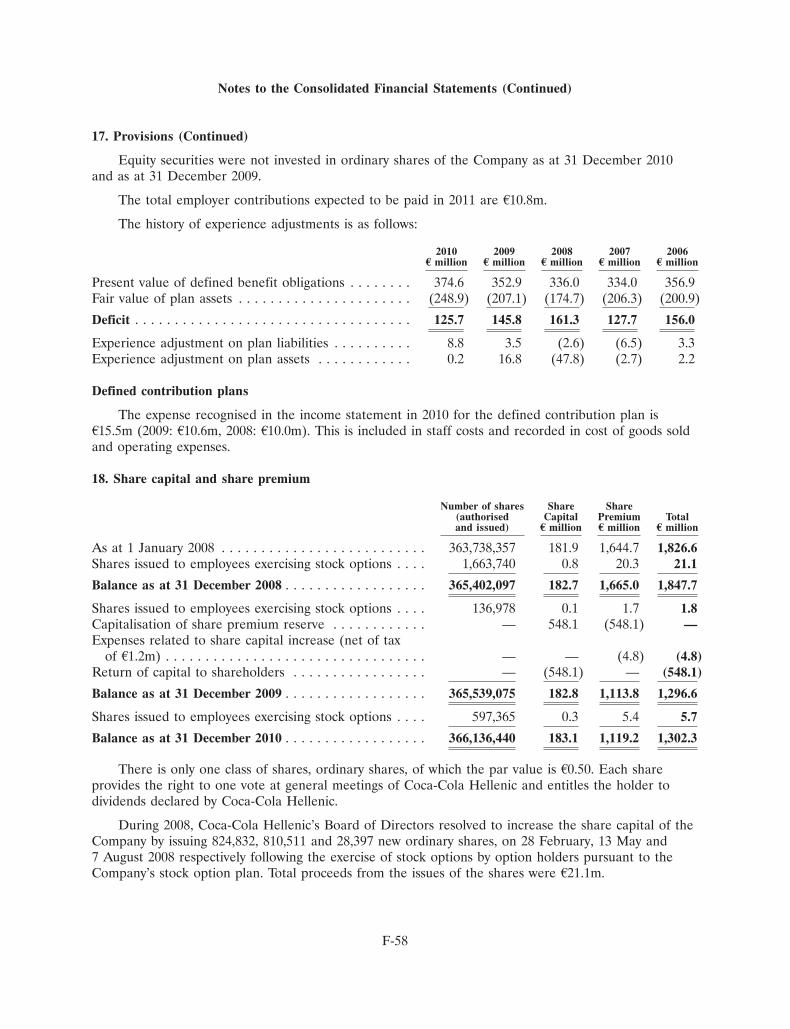
Notes to the Consolidated Financial Statements (Continued)
17. Provisions (Continued)
Equity securities were not invested in ordinary shares of the Company as at 31 December 2010and as at 31 December 2009.
The total employer contributions expected to be paid in 2011 are A10.8m.
The history of experience adjustments is as follows:
2010 2009 2008 2007 2006E million E million E million E million E million
Present value of defined benefit obligations . . . . . . . . 374.6 352.9 336.0 334.0 356.9Fair value of plan assets . . . . . . . . . . . . . . . . . . . . . . (248.9) (207.1) (174.7) (206.3) (200.9)
Deficit . . . . . . . . . . . . . . . . . . . . . . . . . . . . . . . . . . . 125.7 145.8 161.3 127.7 156.0
Experience adjustment on plan liabilities . . . . . . . . . . 8.8 3.5 (2.6) (6.5) 3.3Experience adjustment on plan assets . . . . . . . . . . . . 0.2 16.8 (47.8) (2.7) 2.2
Defined contribution plans
The expense recognised in the income statement in 2010 for the defined contribution plan isA15.5m (2009: A10.6m, 2008: A10.0m). This is included in staff costs and recorded in cost of goods soldand operating expenses.
18. Share capital and share premium
Number of shares Share Share(authorised Capital Premium Totaland issued) E million E million E million
As at 1 January 2008 . . . . . . . . . . . . . . . . . . . . . . . . . . 363,738,357 181.9 1,644.7 1,826.6Shares issued to employees exercising stock options . . . . 1,663,740 0.8 20.3 21.1
Balance as at 31 December 2008 . . . . . . . . . . . . . . . . . . 365,402,097 182.7 1,665.0 1,847.7
Shares issued to employees exercising stock options . . . . 136,978 0.1 1.7 1.8Capitalisation of share premium reserve . . . . . . . . . . . . — 548.1 (548.1) —Expenses related to share capital increase (net of tax
of A1.2m) . . . . . . . . . . . . . . . . . . . . . . . . . . . . . . . . . — — (4.8) (4.8)Return of capital to shareholders . . . . . . . . . . . . . . . . . — (548.1) — (548.1)
Balance as at 31 December 2009 . . . . . . . . . . . . . . . . . . 365,539,075 182.8 1,113.8 1,296.6
Shares issued to employees exercising stock options . . . . 597,365 0.3 5.4 5.7
Balance as at 31 December 2010 . . . . . . . . . . . . . . . . . . 366,136,440 183.1 1,119.2 1,302.3
There is only one class of shares, ordinary shares, of which the par value is A0.50. Each shareprovides the right to one vote at general meetings of Coca-Cola Hellenic and entitles the holder todividends declared by Coca-Cola Hellenic.
During 2008, Coca-Cola Hellenic’s Board of Directors resolved to increase the share capital of theCompany by issuing 824,832, 810,511 and 28,397 new ordinary shares, on 28 February, 13 May and7 August 2008 respectively following the exercise of stock options by option holders pursuant to theCompany’s stock option plan. Total proceeds from the issues of the shares were A21.1m.
F-58
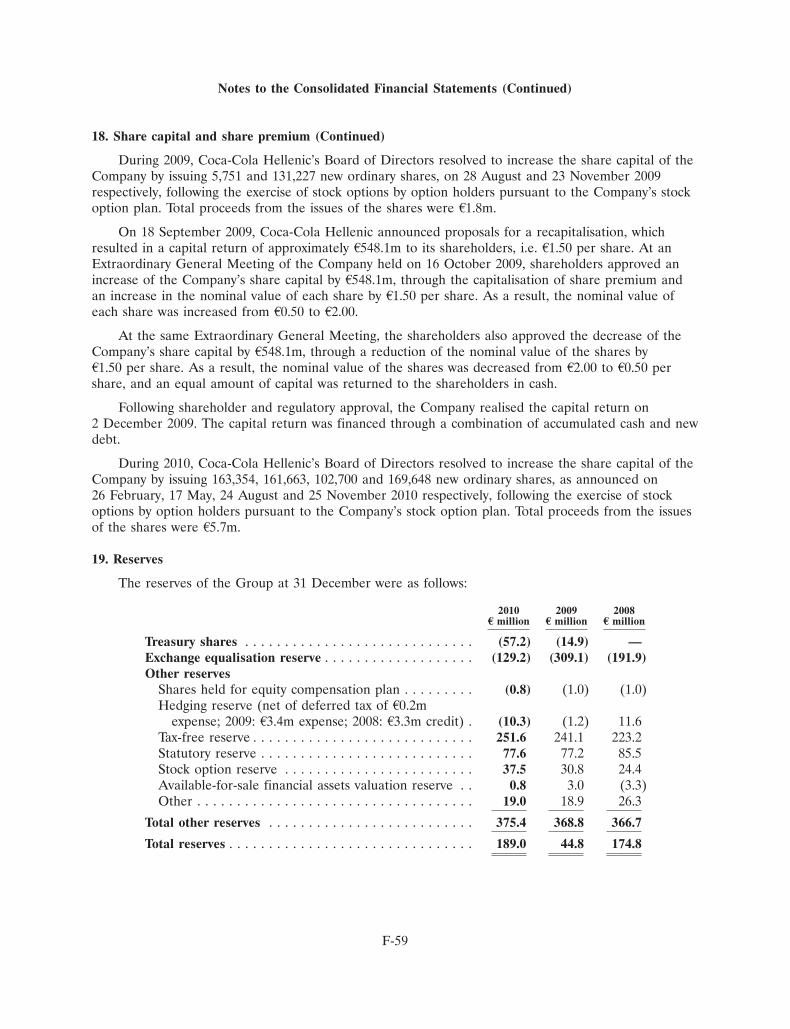
Notes to the Consolidated Financial Statements (Continued)
18. Share capital and share premium (Continued)
During 2009, Coca-Cola Hellenic’s Board of Directors resolved to increase the share capital of theCompany by issuing 5,751 and 131,227 new ordinary shares, on 28 August and 23 November 2009respectively, following the exercise of stock options by option holders pursuant to the Company’s stockoption plan. Total proceeds from the issues of the shares were A1.8m.
On 18 September 2009, Coca-Cola Hellenic announced proposals for a recapitalisation, whichresulted in a capital return of approximately A548.1m to its shareholders, i.e. A1.50 per share. At anExtraordinary General Meeting of the Company held on 16 October 2009, shareholders approved anincrease of the Company’s share capital by A548.1m, through the capitalisation of share premium andan increase in the nominal value of each share by A1.50 per share. As a result, the nominal value ofeach share was increased from A0.50 to A2.00.
At the same Extraordinary General Meeting, the shareholders also approved the decrease of theCompany’s share capital by A548.1m, through a reduction of the nominal value of the shares byA1.50 per share. As a result, the nominal value of the shares was decreased from A2.00 to A0.50 pershare, and an equal amount of capital was returned to the shareholders in cash.
Following shareholder and regulatory approval, the Company realised the capital return on2 December 2009. The capital return was financed through a combination of accumulated cash and newdebt.
During 2010, Coca-Cola Hellenic’s Board of Directors resolved to increase the share capital of theCompany by issuing 163,354, 161,663, 102,700 and 169,648 new ordinary shares, as announced on26 February, 17 May, 24 August and 25 November 2010 respectively, following the exercise of stockoptions by option holders pursuant to the Company’s stock option plan. Total proceeds from the issuesof the shares were A5.7m.
19. Reserves
The reserves of the Group at 31 December were as follows:
2010 2009 2008E million E million E million
Treasury shares . . . . . . . . . . . . . . . . . . . . . . . . . . . . . (57.2) (14.9) —Exchange equalisation reserve . . . . . . . . . . . . . . . . . . . (129.2) (309.1) (191.9)Other reserves
Shares held for equity compensation plan . . . . . . . . . (0.8) (1.0) (1.0)Hedging reserve (net of deferred tax of A0.2m
expense; 2009: A3.4m expense; 2008: A3.3m credit) . (10.3) (1.2) 11.6Tax-free reserve . . . . . . . . . . . . . . . . . . . . . . . . . . . . 251.6 241.1 223.2Statutory reserve . . . . . . . . . . . . . . . . . . . . . . . . . . . 77.6 77.2 85.5Stock option reserve . . . . . . . . . . . . . . . . . . . . . . . . 37.5 30.8 24.4Available-for-sale financial assets valuation reserve . . 0.8 3.0 (3.3)Other . . . . . . . . . . . . . . . . . . . . . . . . . . . . . . . . . . . 19.0 18.9 26.3
Total other reserves . . . . . . . . . . . . . . . . . . . . . . . . . . 375.4 368.8 366.7
Total reserves . . . . . . . . . . . . . . . . . . . . . . . . . . . . . . . 189.0 44.8 174.8
F-59
Notes to the Consolidated Financial Statements (Continued)
19. Reserves (Continued)
Treasury shares
On 30 April 2009, the Board of Directors of Coca-Cola Hellenic resolved to buy-back a maximumof 5% of its paid-in share capital during the period that is 24 months from the date of theExtraordinary General Meeting of 27 April 2009 which approved a share buy-back programme pursuantto Article 16 of Codified Law 2190/1920 (i.e. until 26 April 2011). Based on the Company’scapitalisation at that time, the maximum amount that may be bought back pursuant to the programmeis 18,270,104 shares. Purchases under the programme are subject to a minimum purchase price ofA1.00 per share and a maximum purchase price of A20.00 per share.
Applicable law does not require any actual use of such approved share buy-back programmes. TheCompany may therefore, in its sole discretion, decide not to buy back any shares or to buy fewer sharesthan the maximum permissible number approved under the programme. The purchase of sharespursuant to the share buy-back programme is dependent upon a number of factors including, withoutlimitation, the relative attractiveness of alternative investment opportunities and the availability offunds. During 2010, 2,318,354 shares had been purchased pursuant to the share buy-back programmefor a total value of A42.3m (2009: 1,111,781 shares purchased for a total value of A16.6m). As at31 December 2010, 3,430,135 shares had been held by the Group pursuant to the share buy-backprogramme for a total value of A57.2m, bringing the shares in circulation to 362,706,305.
Exchange equalisation reserve
The exchange equalisation reserve comprises all foreign exchange differences arising from thetranslation of the financial statements of entities with functional currencies other than the euro.
Other reserves
Shares held for equity compensation plan
Shares held for the Coca-Cola Hellenic Stock Purchase Plan, which is an equity compensation planin which eligible employees may participate.
Hedging reserve
The hedging reserve reflects changes in the fair values of derivatives accounted for as cash flowhedges, net of the deferred tax related to such balances.
Tax-free reserve
The tax-free reserve includes investment tax incentive and other tax-free or partially taxed reservesof the parent entity, Coca-Cola Hellenic. The tax-free reserve may be distributed if taxed, whereapplicable.
Statutory and other reserves
Statutory and other reserves are particular to the various countries in which the Group operates.The amount of statutory reserves of the parent entity, Coca-Cola Hellenic, with restrictions ondistribution is A55.7m (2009: A55.7m, 2008: A49.5m).
F-60
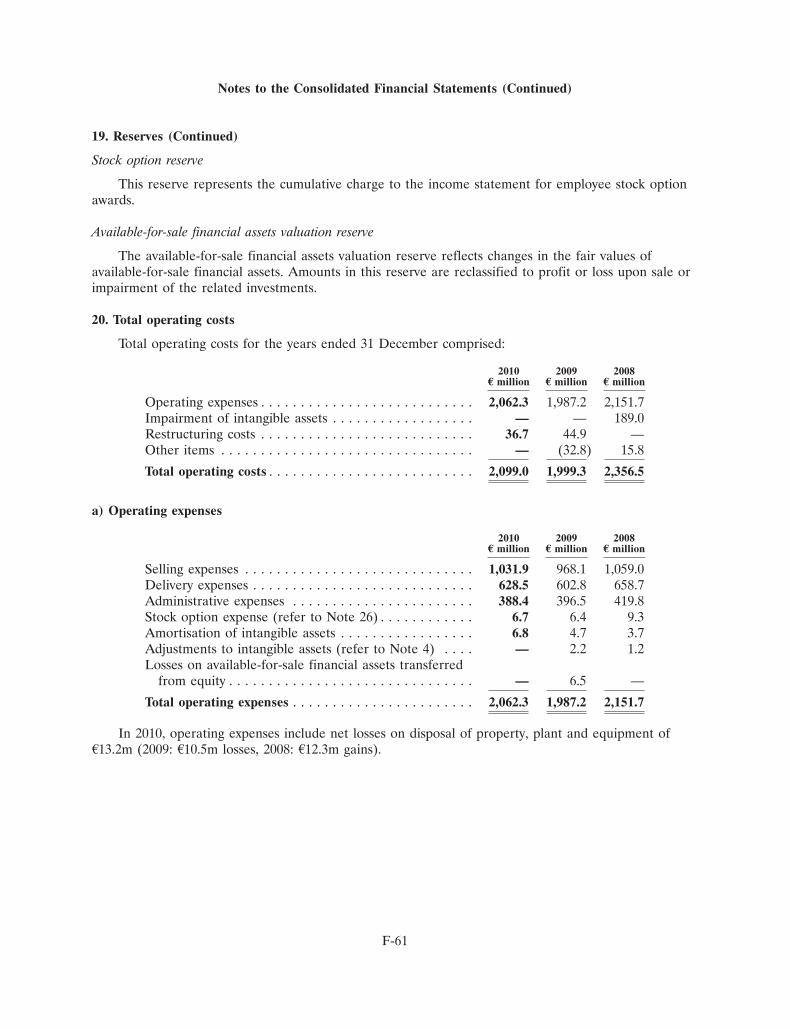
Notes to the Consolidated Financial Statements (Continued)
19. Reserves (Continued)
Stock option reserve
This reserve represents the cumulative charge to the income statement for employee stock optionawards.
Available-for-sale financial assets valuation reserve
The available-for-sale financial assets valuation reserve reflects changes in the fair values ofavailable-for-sale financial assets. Amounts in this reserve are reclassified to profit or loss upon sale orimpairment of the related investments.
20. Total operating costs
Total operating costs for the years ended 31 December comprised:
2010 2009 2008E million E million E million
Operating expenses . . . . . . . . . . . . . . . . . . . . . . . . . . . 2,062.3 1,987.2 2,151.7Impairment of intangible assets . . . . . . . . . . . . . . . . . . — — 189.0Restructuring costs . . . . . . . . . . . . . . . . . . . . . . . . . . . 36.7 44.9 —Other items . . . . . . . . . . . . . . . . . . . . . . . . . . . . . . . . — (32.8) 15.8
Total operating costs . . . . . . . . . . . . . . . . . . . . . . . . . . 2,099.0 1,999.3 2,356.5
a) Operating expenses
2010 2009 2008E million E million E million
Selling expenses . . . . . . . . . . . . . . . . . . . . . . . . . . . . . 1,031.9 968.1 1,059.0Delivery expenses . . . . . . . . . . . . . . . . . . . . . . . . . . . . 628.5 602.8 658.7Administrative expenses . . . . . . . . . . . . . . . . . . . . . . . 388.4 396.5 419.8Stock option expense (refer to Note 26) . . . . . . . . . . . . 6.7 6.4 9.3Amortisation of intangible assets . . . . . . . . . . . . . . . . . 6.8 4.7 3.7Adjustments to intangible assets (refer to Note 4) . . . . — 2.2 1.2Losses on available-for-sale financial assets transferred
from equity . . . . . . . . . . . . . . . . . . . . . . . . . . . . . . . — 6.5 —
Total operating expenses . . . . . . . . . . . . . . . . . . . . . . . 2,062.3 1,987.2 2,151.7
In 2010, operating expenses include net losses on disposal of property, plant and equipment ofA13.2m (2009: A10.5m losses, 2008: A12.3m gains).
F-61
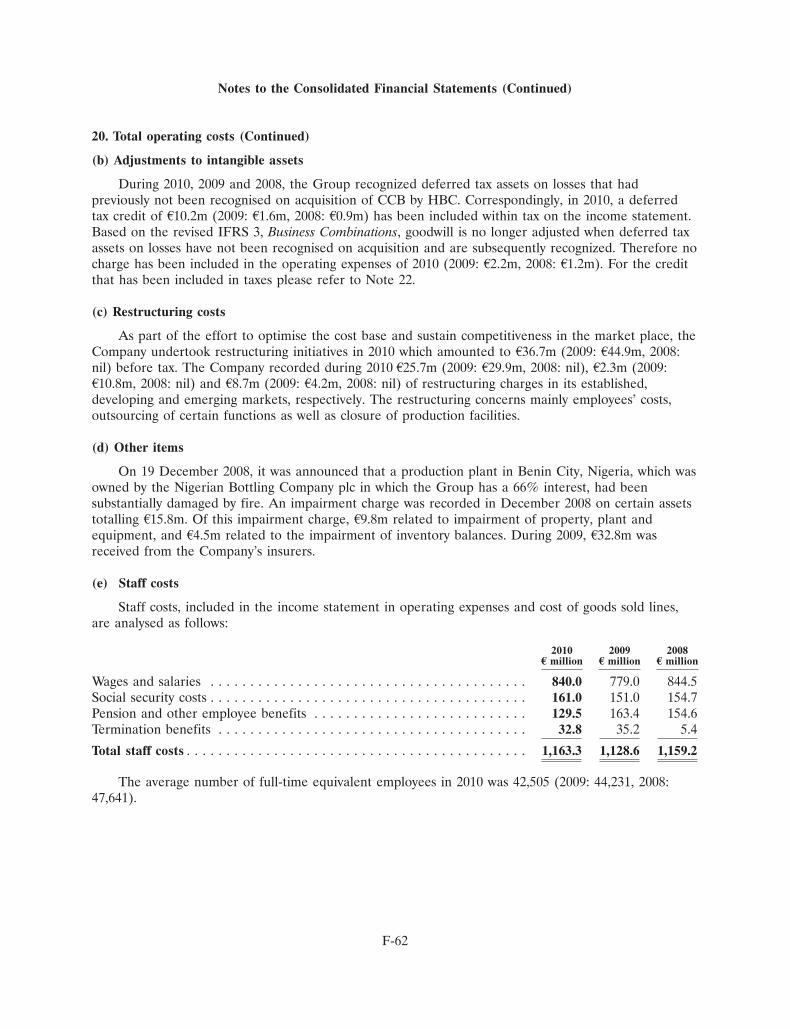
Notes to the Consolidated Financial Statements (Continued)
20. Total operating costs (Continued)
(b) Adjustments to intangible assets
During 2010, 2009 and 2008, the Group recognized deferred tax assets on losses that hadpreviously not been recognised on acquisition of CCB by HBC. Correspondingly, in 2010, a deferredtax credit of A10.2m (2009: A1.6m, 2008: A0.9m) has been included within tax on the income statement.Based on the revised IFRS 3, Business Combinations, goodwill is no longer adjusted when deferred taxassets on losses have not been recognised on acquisition and are subsequently recognized. Therefore nocharge has been included in the operating expenses of 2010 (2009: A2.2m, 2008: A1.2m). For the creditthat has been included in taxes please refer to Note 22.
(c) Restructuring costs
As part of the effort to optimise the cost base and sustain competitiveness in the market place, theCompany undertook restructuring initiatives in 2010 which amounted to A36.7m (2009: A44.9m, 2008:nil) before tax. The Company recorded during 2010 A25.7m (2009: A29.9m, 2008: nil), A2.3m (2009:A10.8m, 2008: nil) and A8.7m (2009: A4.2m, 2008: nil) of restructuring charges in its established,developing and emerging markets, respectively. The restructuring concerns mainly employees’ costs,outsourcing of certain functions as well as closure of production facilities.
(d) Other items
On 19 December 2008, it was announced that a production plant in Benin City, Nigeria, which wasowned by the Nigerian Bottling Company plc in which the Group has a 66% interest, had beensubstantially damaged by fire. An impairment charge was recorded in December 2008 on certain assetstotalling A15.8m. Of this impairment charge, A9.8m related to impairment of property, plant andequipment, and A4.5m related to the impairment of inventory balances. During 2009, A32.8m wasreceived from the Company’s insurers.
(e) Staff costs
Staff costs, included in the income statement in operating expenses and cost of goods sold lines,are analysed as follows:
2010 2009 2008E million E million E million
Wages and salaries . . . . . . . . . . . . . . . . . . . . . . . . . . . . . . . . . . . . . . . . 840.0 779.0 844.5Social security costs . . . . . . . . . . . . . . . . . . . . . . . . . . . . . . . . . . . . . . . . 161.0 151.0 154.7Pension and other employee benefits . . . . . . . . . . . . . . . . . . . . . . . . . . . 129.5 163.4 154.6Termination benefits . . . . . . . . . . . . . . . . . . . . . . . . . . . . . . . . . . . . . . . 32.8 35.2 5.4
Total staff costs . . . . . . . . . . . . . . . . . . . . . . . . . . . . . . . . . . . . . . . . . . . 1,163.3 1,128.6 1,159.2
The average number of full-time equivalent employees in 2010 was 42,505 (2009: 44,231, 2008:47,641).
F-62
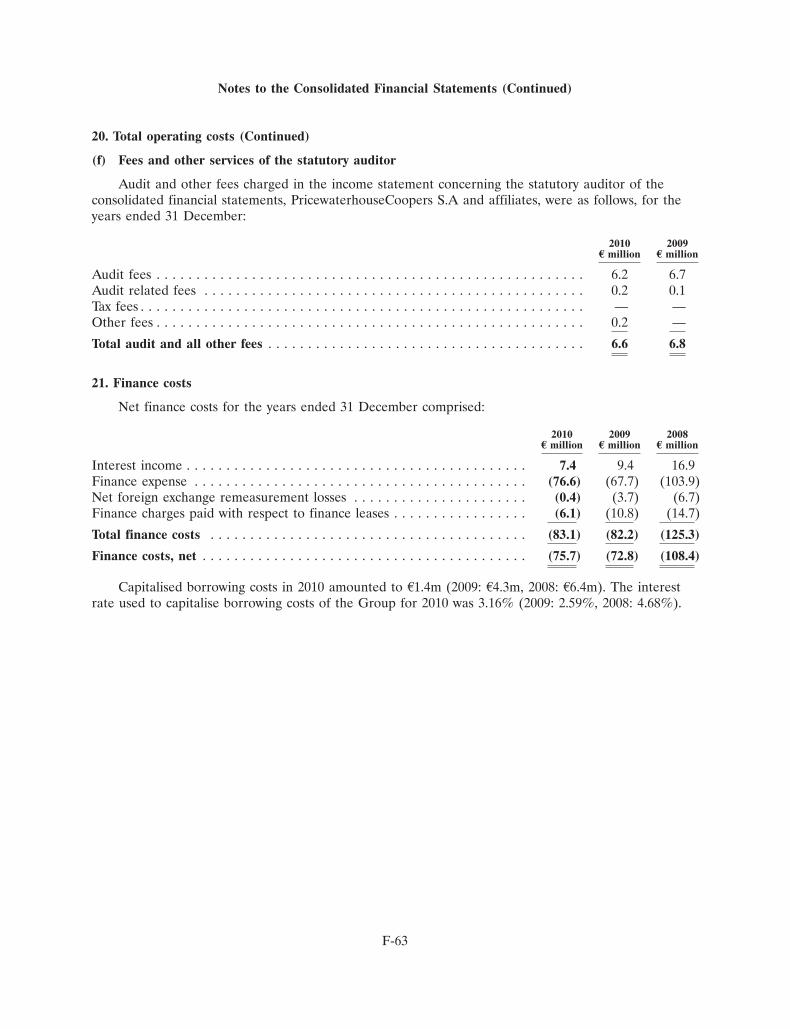
Notes to the Consolidated Financial Statements (Continued)
20. Total operating costs (Continued)
(f) Fees and other services of the statutory auditor
Audit and other fees charged in the income statement concerning the statutory auditor of theconsolidated financial statements, PricewaterhouseCoopers S.A and affiliates, were as follows, for theyears ended 31 December:
2010 2009E million E million
Audit fees . . . . . . . . . . . . . . . . . . . . . . . . . . . . . . . . . . . . . . . . . . . . . . . . . . . . . . 6.2 6.7Audit related fees . . . . . . . . . . . . . . . . . . . . . . . . . . . . . . . . . . . . . . . . . . . . . . . . 0.2 0.1Tax fees . . . . . . . . . . . . . . . . . . . . . . . . . . . . . . . . . . . . . . . . . . . . . . . . . . . . . . . . — —Other fees . . . . . . . . . . . . . . . . . . . . . . . . . . . . . . . . . . . . . . . . . . . . . . . . . . . . . . 0.2 —
Total audit and all other fees . . . . . . . . . . . . . . . . . . . . . . . . . . . . . . . . . . . . . . . . 6.6 6.8
21. Finance costs
Net finance costs for the years ended 31 December comprised:
2010 2009 2008E million E million E million
Interest income . . . . . . . . . . . . . . . . . . . . . . . . . . . . . . . . . . . . . . . . . . . 7.4 9.4 16.9Finance expense . . . . . . . . . . . . . . . . . . . . . . . . . . . . . . . . . . . . . . . . . . (76.6) (67.7) (103.9)Net foreign exchange remeasurement losses . . . . . . . . . . . . . . . . . . . . . . (0.4) (3.7) (6.7)Finance charges paid with respect to finance leases . . . . . . . . . . . . . . . . . (6.1) (10.8) (14.7)
Total finance costs . . . . . . . . . . . . . . . . . . . . . . . . . . . . . . . . . . . . . . . . (83.1) (82.2) (125.3)
Finance costs, net . . . . . . . . . . . . . . . . . . . . . . . . . . . . . . . . . . . . . . . . . (75.7) (72.8) (108.4)
Capitalised borrowing costs in 2010 amounted to A1.4m (2009: A4.3m, 2008: A6.4m). The interestrate used to capitalise borrowing costs of the Group for 2010 was 3.16% (2009: 2.59%, 2008: 4.68%).
F-63
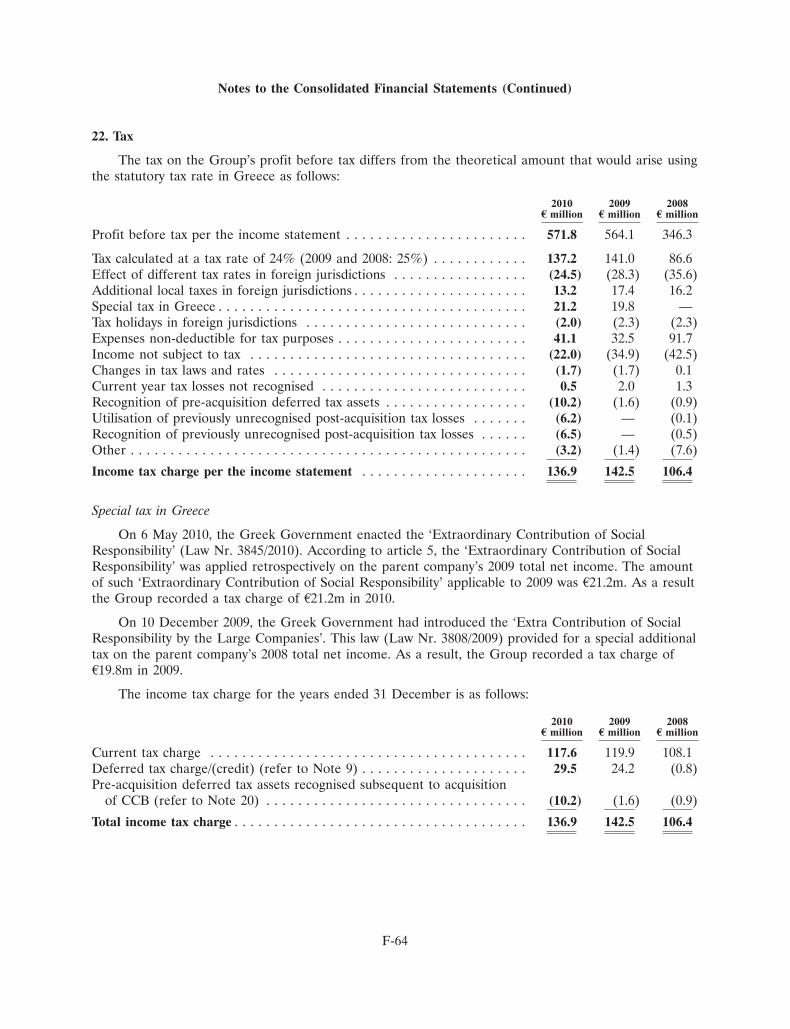
Notes to the Consolidated Financial Statements (Continued)
22. Tax
The tax on the Group’s profit before tax differs from the theoretical amount that would arise usingthe statutory tax rate in Greece as follows:
2010 2009 2008E million E million E million
Profit before tax per the income statement . . . . . . . . . . . . . . . . . . . . . . . 571.8 564.1 346.3
Tax calculated at a tax rate of 24% (2009 and 2008: 25%) . . . . . . . . . . . . 137.2 141.0 86.6Effect of different tax rates in foreign jurisdictions . . . . . . . . . . . . . . . . . (24.5) (28.3) (35.6)Additional local taxes in foreign jurisdictions . . . . . . . . . . . . . . . . . . . . . . 13.2 17.4 16.2Special tax in Greece . . . . . . . . . . . . . . . . . . . . . . . . . . . . . . . . . . . . . . . 21.2 19.8 —Tax holidays in foreign jurisdictions . . . . . . . . . . . . . . . . . . . . . . . . . . . . (2.0) (2.3) (2.3)Expenses non-deductible for tax purposes . . . . . . . . . . . . . . . . . . . . . . . . 41.1 32.5 91.7Income not subject to tax . . . . . . . . . . . . . . . . . . . . . . . . . . . . . . . . . . . (22.0) (34.9) (42.5)Changes in tax laws and rates . . . . . . . . . . . . . . . . . . . . . . . . . . . . . . . . (1.7) (1.7) 0.1Current year tax losses not recognised . . . . . . . . . . . . . . . . . . . . . . . . . . 0.5 2.0 1.3Recognition of pre-acquisition deferred tax assets . . . . . . . . . . . . . . . . . . (10.2) (1.6) (0.9)Utilisation of previously unrecognised post-acquisition tax losses . . . . . . . (6.2) — (0.1)Recognition of previously unrecognised post-acquisition tax losses . . . . . . (6.5) — (0.5)Other . . . . . . . . . . . . . . . . . . . . . . . . . . . . . . . . . . . . . . . . . . . . . . . . . . (3.2) (1.4) (7.6)
Income tax charge per the income statement . . . . . . . . . . . . . . . . . . . . . 136.9 142.5 106.4
Special tax in Greece
On 6 May 2010, the Greek Government enacted the ‘Extraordinary Contribution of SocialResponsibility’ (Law Nr. 3845/2010). According to article 5, the ‘Extraordinary Contribution of SocialResponsibility’ was applied retrospectively on the parent company’s 2009 total net income. The amountof such ‘Extraordinary Contribution of Social Responsibility’ applicable to 2009 was A21.2m. As a resultthe Group recorded a tax charge of A21.2m in 2010.
On 10 December 2009, the Greek Government had introduced the ‘Extra Contribution of SocialResponsibility by the Large Companies’. This law (Law Nr. 3808/2009) provided for a special additionaltax on the parent company’s 2008 total net income. As a result, the Group recorded a tax charge ofA19.8m in 2009.
The income tax charge for the years ended 31 December is as follows:
2010 2009 2008E million E million E million
Current tax charge . . . . . . . . . . . . . . . . . . . . . . . . . . . . . . . . . . . . . . . . 117.6 119.9 108.1Deferred tax charge/(credit) (refer to Note 9) . . . . . . . . . . . . . . . . . . . . . 29.5 24.2 (0.8)Pre-acquisition deferred tax assets recognised subsequent to acquisition
of CCB (refer to Note 20) . . . . . . . . . . . . . . . . . . . . . . . . . . . . . . . . . (10.2) (1.6) (0.9)
Total income tax charge . . . . . . . . . . . . . . . . . . . . . . . . . . . . . . . . . . . . . 136.9 142.5 106.4
F-64
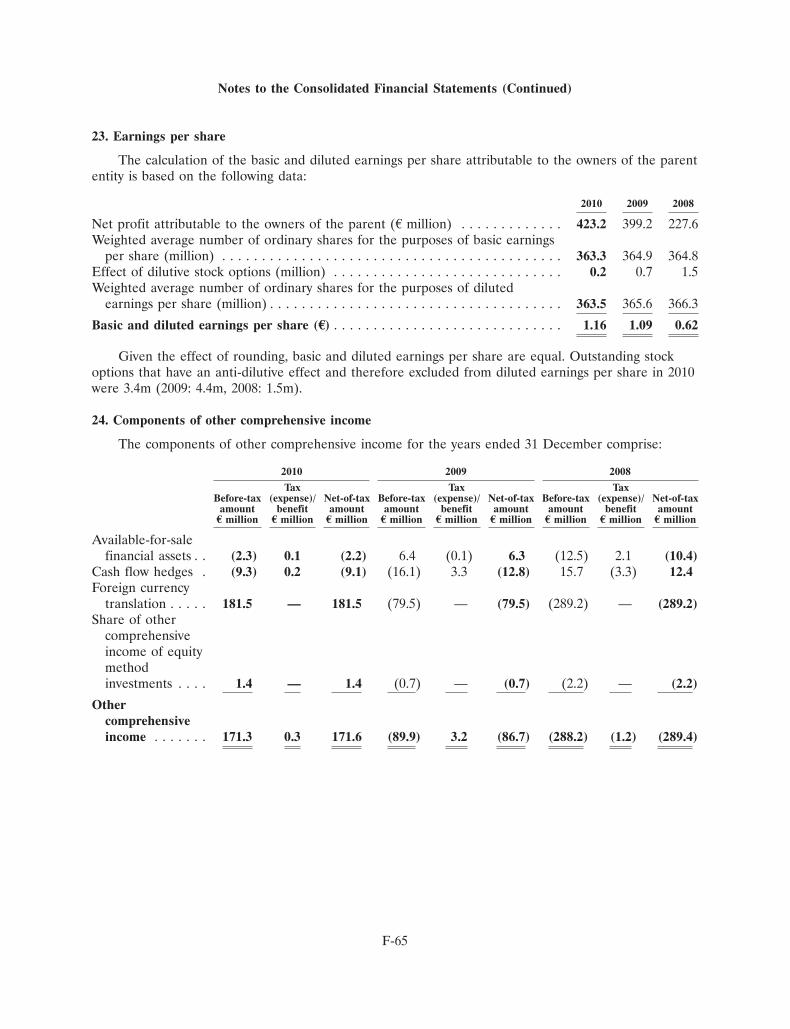
Notes to the Consolidated Financial Statements (Continued)
23. Earnings per share
The calculation of the basic and diluted earnings per share attributable to the owners of the parententity is based on the following data:
2010 2009 2008
Net profit attributable to the owners of the parent (A million) . . . . . . . . . . . . . 423.2 399.2 227.6Weighted average number of ordinary shares for the purposes of basic earnings
per share (million) . . . . . . . . . . . . . . . . . . . . . . . . . . . . . . . . . . . . . . . . . . . 363.3 364.9 364.8Effect of dilutive stock options (million) . . . . . . . . . . . . . . . . . . . . . . . . . . . . . 0.2 0.7 1.5Weighted average number of ordinary shares for the purposes of diluted
earnings per share (million) . . . . . . . . . . . . . . . . . . . . . . . . . . . . . . . . . . . . . 363.5 365.6 366.3
Basic and diluted earnings per share (E) . . . . . . . . . . . . . . . . . . . . . . . . . . . . . 1.16 1.09 0.62
Given the effect of rounding, basic and diluted earnings per share are equal. Outstanding stockoptions that have an anti-dilutive effect and therefore excluded from diluted earnings per share in 2010were 3.4m (2009: 4.4m, 2008: 1.5m).
24. Components of other comprehensive income
The components of other comprehensive income for the years ended 31 December comprise:
2010 2009 2008
Tax Tax TaxBefore-tax (expense)/ Net-of-tax Before-tax (expense)/ Net-of-tax Before-tax (expense)/ Net-of-tax
amount benefit amount amount benefit amount amount benefit amountE million E million E million E million E million E million E million E million E million
Available-for-salefinancial assets . . (2.3) 0.1 (2.2) 6.4 (0.1) 6.3 (12.5) 2.1 (10.4)
Cash flow hedges . (9.3) 0.2 (9.1) (16.1) 3.3 (12.8) 15.7 (3.3) 12.4Foreign currency
translation . . . . . 181.5 — 181.5 (79.5) — (79.5) (289.2) — (289.2)Share of other
comprehensiveincome of equitymethodinvestments . . . . 1.4 — 1.4 (0.7) — (0.7) (2.2) — (2.2)
Othercomprehensiveincome . . . . . . . 171.3 0.3 171.6 (89.9) 3.2 (86.7) (288.2) (1.2) (289.4)
F-65
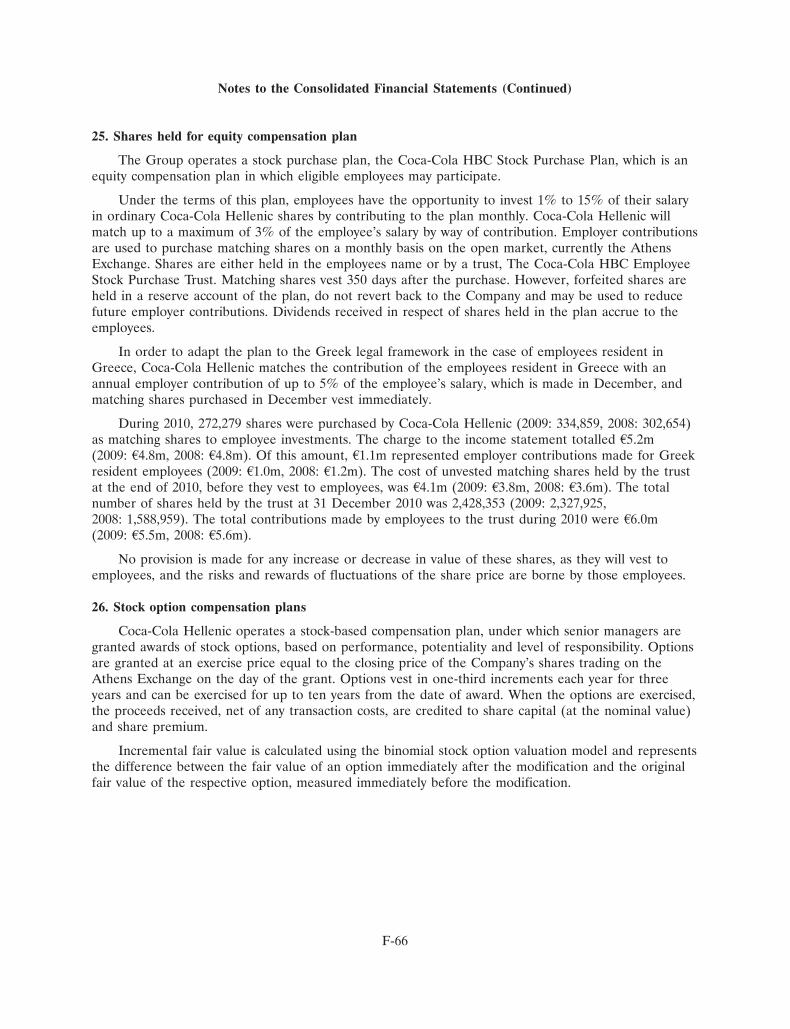
Notes to the Consolidated Financial Statements (Continued)
25. Shares held for equity compensation plan
The Group operates a stock purchase plan, the Coca-Cola HBC Stock Purchase Plan, which is anequity compensation plan in which eligible employees may participate.
Under the terms of this plan, employees have the opportunity to invest 1% to 15% of their salaryin ordinary Coca-Cola Hellenic shares by contributing to the plan monthly. Coca-Cola Hellenic willmatch up to a maximum of 3% of the employee’s salary by way of contribution. Employer contributionsare used to purchase matching shares on a monthly basis on the open market, currently the AthensExchange. Shares are either held in the employees name or by a trust, The Coca-Cola HBC EmployeeStock Purchase Trust. Matching shares vest 350 days after the purchase. However, forfeited shares areheld in a reserve account of the plan, do not revert back to the Company and may be used to reducefuture employer contributions. Dividends received in respect of shares held in the plan accrue to theemployees.
In order to adapt the plan to the Greek legal framework in the case of employees resident inGreece, Coca-Cola Hellenic matches the contribution of the employees resident in Greece with anannual employer contribution of up to 5% of the employee’s salary, which is made in December, andmatching shares purchased in December vest immediately.
During 2010, 272,279 shares were purchased by Coca-Cola Hellenic (2009: 334,859, 2008: 302,654)as matching shares to employee investments. The charge to the income statement totalled A5.2m(2009: A4.8m, 2008: A4.8m). Of this amount, A1.1m represented employer contributions made for Greekresident employees (2009: A1.0m, 2008: A1.2m). The cost of unvested matching shares held by the trustat the end of 2010, before they vest to employees, was A4.1m (2009: A3.8m, 2008: A3.6m). The totalnumber of shares held by the trust at 31 December 2010 was 2,428,353 (2009: 2,327,925,2008: 1,588,959). The total contributions made by employees to the trust during 2010 were A6.0m(2009: A5.5m, 2008: A5.6m).
No provision is made for any increase or decrease in value of these shares, as they will vest toemployees, and the risks and rewards of fluctuations of the share price are borne by those employees.
26. Stock option compensation plans
Coca-Cola Hellenic operates a stock-based compensation plan, under which senior managers aregranted awards of stock options, based on performance, potentiality and level of responsibility. Optionsare granted at an exercise price equal to the closing price of the Company’s shares trading on theAthens Exchange on the day of the grant. Options vest in one-third increments each year for threeyears and can be exercised for up to ten years from the date of award. When the options are exercised,the proceeds received, net of any transaction costs, are credited to share capital (at the nominal value)and share premium.
Incremental fair value is calculated using the binomial stock option valuation model and representsthe difference between the fair value of an option immediately after the modification and the originalfair value of the respective option, measured immediately before the modification.
F-66
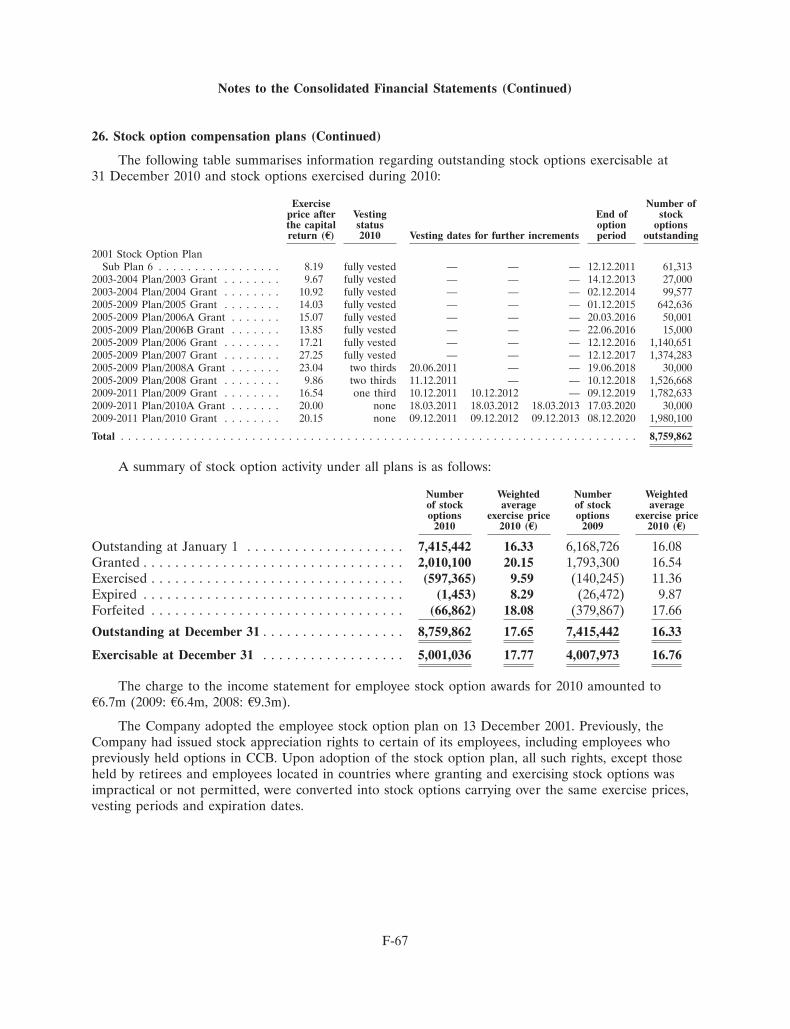
Notes to the Consolidated Financial Statements (Continued)
26. Stock option compensation plans (Continued)
The following table summarises information regarding outstanding stock options exercisable at31 December 2010 and stock options exercised during 2010:
Exercise Number ofprice after Vesting End of stockthe capital status option optionsreturn (E) 2010 Vesting dates for further increments period outstanding
2001 Stock Option PlanSub Plan 6 . . . . . . . . . . . . . . . . . 8.19 fully vested — — — 12.12.2011 61,313
2003-2004 Plan/2003 Grant . . . . . . . . 9.67 fully vested — — — 14.12.2013 27,0002003-2004 Plan/2004 Grant . . . . . . . . 10.92 fully vested — — — 02.12.2014 99,5772005-2009 Plan/2005 Grant . . . . . . . . 14.03 fully vested — — — 01.12.2015 642,6362005-2009 Plan/2006A Grant . . . . . . . 15.07 fully vested — — — 20.03.2016 50,0012005-2009 Plan/2006B Grant . . . . . . . 13.85 fully vested — — — 22.06.2016 15,0002005-2009 Plan/2006 Grant . . . . . . . . 17.21 fully vested — — — 12.12.2016 1,140,6512005-2009 Plan/2007 Grant . . . . . . . . 27.25 fully vested — — — 12.12.2017 1,374,2832005-2009 Plan/2008A Grant . . . . . . . 23.04 two thirds 20.06.2011 — — 19.06.2018 30,0002005-2009 Plan/2008 Grant . . . . . . . . 9.86 two thirds 11.12.2011 — — 10.12.2018 1,526,6682009-2011 Plan/2009 Grant . . . . . . . . 16.54 one third 10.12.2011 10.12.2012 — 09.12.2019 1,782,6332009-2011 Plan/2010A Grant . . . . . . . 20.00 none 18.03.2011 18.03.2012 18.03.2013 17.03.2020 30,0002009-2011 Plan/2010 Grant . . . . . . . . 20.15 none 09.12.2011 09.12.2012 09.12.2013 08.12.2020 1,980,100
Total . . . . . . . . . . . . . . . . . . . . . . . . . . . . . . . . . . . . . . . . . . . . . . . . . . . . . . . . . . . . . . . . . . . . . . . 8,759,862
A summary of stock option activity under all plans is as follows:
Number Weighted Number Weightedof stock average of stock averageoptions exercise price options exercise price
2010 2010 (E) 2009 2010 (E)
Outstanding at January 1 . . . . . . . . . . . . . . . . . . . . 7,415,442 16.33 6,168,726 16.08Granted . . . . . . . . . . . . . . . . . . . . . . . . . . . . . . . . . 2,010,100 20.15 1,793,300 16.54Exercised . . . . . . . . . . . . . . . . . . . . . . . . . . . . . . . . (597,365) 9.59 (140,245) 11.36Expired . . . . . . . . . . . . . . . . . . . . . . . . . . . . . . . . . (1,453) 8.29 (26,472) 9.87Forfeited . . . . . . . . . . . . . . . . . . . . . . . . . . . . . . . . (66,862) 18.08 (379,867) 17.66
Outstanding at December 31 . . . . . . . . . . . . . . . . . . 8,759,862 17.65 7,415,442 16.33
Exercisable at December 31 . . . . . . . . . . . . . . . . . . 5,001,036 17.77 4,007,973 16.76
The charge to the income statement for employee stock option awards for 2010 amounted toA6.7m (2009: A6.4m, 2008: A9.3m).
The Company adopted the employee stock option plan on 13 December 2001. Previously, theCompany had issued stock appreciation rights to certain of its employees, including employees whopreviously held options in CCB. Upon adoption of the stock option plan, all such rights, except thoseheld by retirees and employees located in countries where granting and exercising stock options wasimpractical or not permitted, were converted into stock options carrying over the same exercise prices,vesting periods and expiration dates.
F-67
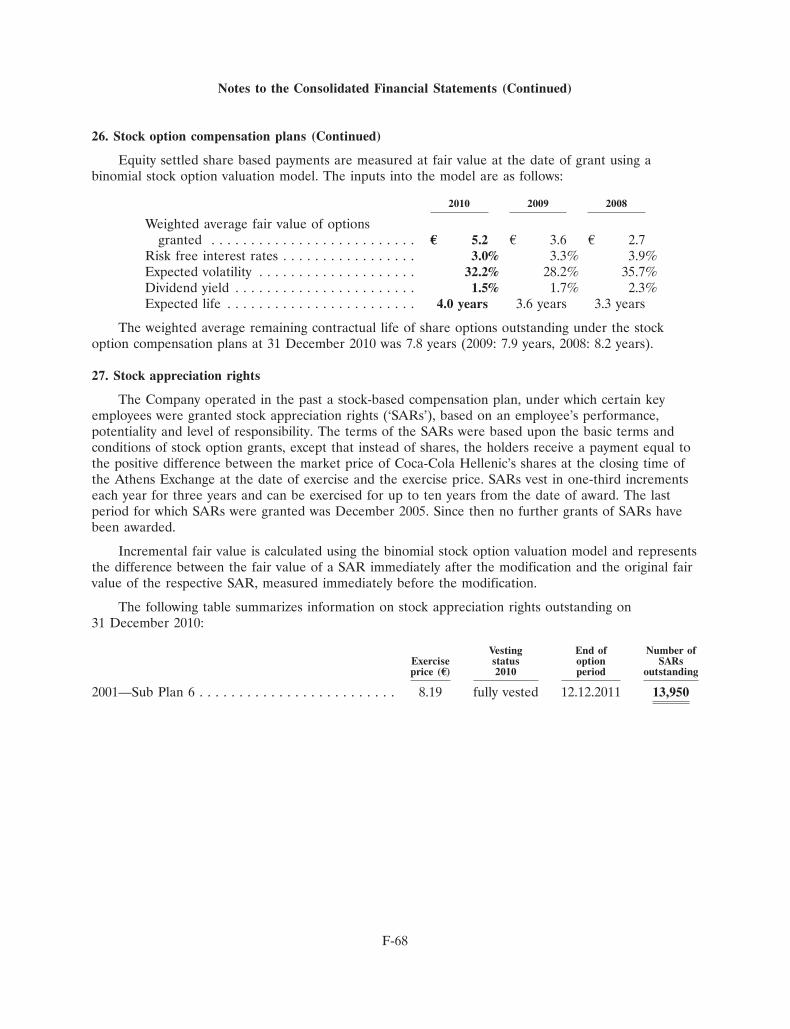
Notes to the Consolidated Financial Statements (Continued)
26. Stock option compensation plans (Continued)
Equity settled share based payments are measured at fair value at the date of grant using abinomial stock option valuation model. The inputs into the model are as follows:
2010 2009 2008
Weighted average fair value of optionsgranted . . . . . . . . . . . . . . . . . . . . . . . . . . E 5.2 A 3.6 A 2.7
Risk free interest rates . . . . . . . . . . . . . . . . . 3.0% 3.3% 3.9%Expected volatility . . . . . . . . . . . . . . . . . . . . 32.2% 28.2% 35.7%Dividend yield . . . . . . . . . . . . . . . . . . . . . . . 1.5% 1.7% 2.3%Expected life . . . . . . . . . . . . . . . . . . . . . . . . 4.0 years 3.6 years 3.3 years
The weighted average remaining contractual life of share options outstanding under the stockoption compensation plans at 31 December 2010 was 7.8 years (2009: 7.9 years, 2008: 8.2 years).
27. Stock appreciation rights
The Company operated in the past a stock-based compensation plan, under which certain keyemployees were granted stock appreciation rights (‘SARs’), based on an employee’s performance,potentiality and level of responsibility. The terms of the SARs were based upon the basic terms andconditions of stock option grants, except that instead of shares, the holders receive a payment equal tothe positive difference between the market price of Coca-Cola Hellenic’s shares at the closing time ofthe Athens Exchange at the date of exercise and the exercise price. SARs vest in one-third incrementseach year for three years and can be exercised for up to ten years from the date of award. The lastperiod for which SARs were granted was December 2005. Since then no further grants of SARs havebeen awarded.
Incremental fair value is calculated using the binomial stock option valuation model and representsthe difference between the fair value of a SAR immediately after the modification and the original fairvalue of the respective SAR, measured immediately before the modification.
The following table summarizes information on stock appreciation rights outstanding on31 December 2010:
Vesting End of Number ofExercise status option SARsprice (E) 2010 period outstanding
2001—Sub Plan 6 . . . . . . . . . . . . . . . . . . . . . . . . . 8.19 fully vested 12.12.2011 13,950
F-68
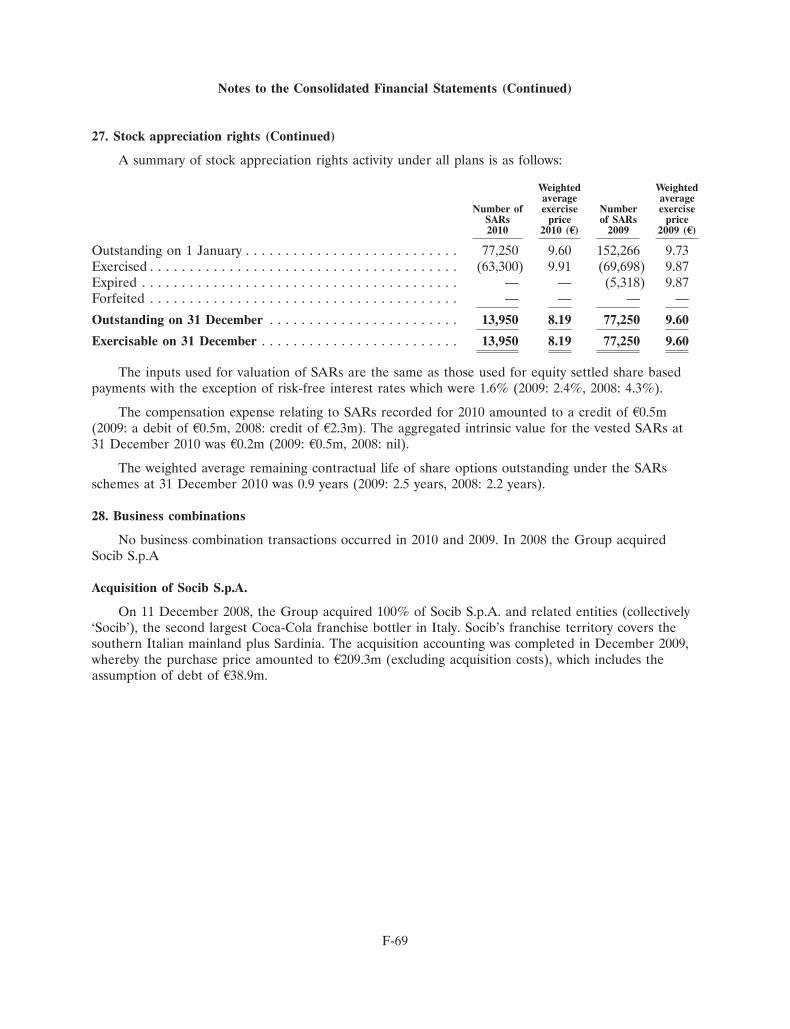
Notes to the Consolidated Financial Statements (Continued)
27. Stock appreciation rights (Continued)
A summary of stock appreciation rights activity under all plans is as follows:
Weighted Weightedaverage average
Number of exercise Number exerciseSARs price of SARs price2010 2010 (E) 2009 2009 (E)
Outstanding on 1 January . . . . . . . . . . . . . . . . . . . . . . . . . . . 77,250 9.60 152,266 9.73Exercised . . . . . . . . . . . . . . . . . . . . . . . . . . . . . . . . . . . . . . . (63,300) 9.91 (69,698) 9.87Expired . . . . . . . . . . . . . . . . . . . . . . . . . . . . . . . . . . . . . . . . — — (5,318) 9.87Forfeited . . . . . . . . . . . . . . . . . . . . . . . . . . . . . . . . . . . . . . . — — — —
Outstanding on 31 December . . . . . . . . . . . . . . . . . . . . . . . . 13,950 8.19 77,250 9.60
Exercisable on 31 December . . . . . . . . . . . . . . . . . . . . . . . . . 13,950 8.19 77,250 9.60
The inputs used for valuation of SARs are the same as those used for equity settled share basedpayments with the exception of risk-free interest rates which were 1.6% (2009: 2.4%, 2008: 4.3%).
The compensation expense relating to SARs recorded for 2010 amounted to a credit of A0.5m(2009: a debit of A0.5m, 2008: credit of A2.3m). The aggregated intrinsic value for the vested SARs at31 December 2010 was A0.2m (2009: A0.5m, 2008: nil).
The weighted average remaining contractual life of share options outstanding under the SARsschemes at 31 December 2010 was 0.9 years (2009: 2.5 years, 2008: 2.2 years).
28. Business combinations
No business combination transactions occurred in 2010 and 2009. In 2008 the Group acquiredSocib S.p.A
Acquisition of Socib S.p.A.
On 11 December 2008, the Group acquired 100% of Socib S.p.A. and related entities (collectively‘Socib’), the second largest Coca-Cola franchise bottler in Italy. Socib’s franchise territory covers thesouthern Italian mainland plus Sardinia. The acquisition accounting was completed in December 2009,whereby the purchase price amounted to A209.3m (excluding acquisition costs), which includes theassumption of debt of A38.9m.
F-69
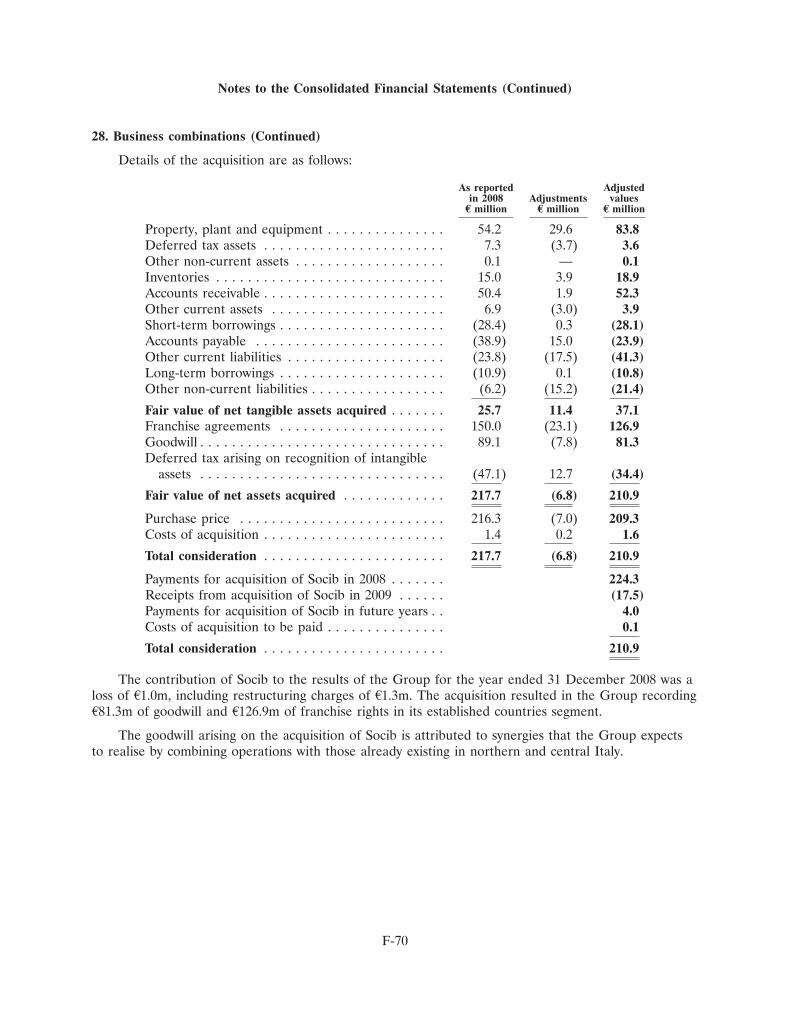
Notes to the Consolidated Financial Statements (Continued)
28. Business combinations (Continued)
Details of the acquisition are as follows:
As reported Adjustedin 2008 Adjustments valuesE million E million E million
Property, plant and equipment . . . . . . . . . . . . . . . 54.2 29.6 83.8Deferred tax assets . . . . . . . . . . . . . . . . . . . . . . . 7.3 (3.7) 3.6Other non-current assets . . . . . . . . . . . . . . . . . . . 0.1 — 0.1Inventories . . . . . . . . . . . . . . . . . . . . . . . . . . . . . 15.0 3.9 18.9Accounts receivable . . . . . . . . . . . . . . . . . . . . . . . 50.4 1.9 52.3Other current assets . . . . . . . . . . . . . . . . . . . . . . 6.9 (3.0) 3.9Short-term borrowings . . . . . . . . . . . . . . . . . . . . . (28.4) 0.3 (28.1)Accounts payable . . . . . . . . . . . . . . . . . . . . . . . . (38.9) 15.0 (23.9)Other current liabilities . . . . . . . . . . . . . . . . . . . . (23.8) (17.5) (41.3)Long-term borrowings . . . . . . . . . . . . . . . . . . . . . (10.9) 0.1 (10.8)Other non-current liabilities . . . . . . . . . . . . . . . . . (6.2) (15.2) (21.4)
Fair value of net tangible assets acquired . . . . . . . 25.7 11.4 37.1Franchise agreements . . . . . . . . . . . . . . . . . . . . . 150.0 (23.1) 126.9Goodwill . . . . . . . . . . . . . . . . . . . . . . . . . . . . . . . 89.1 (7.8) 81.3Deferred tax arising on recognition of intangible
assets . . . . . . . . . . . . . . . . . . . . . . . . . . . . . . . (47.1) 12.7 (34.4)
Fair value of net assets acquired . . . . . . . . . . . . . 217.7 (6.8) 210.9
Purchase price . . . . . . . . . . . . . . . . . . . . . . . . . . 216.3 (7.0) 209.3Costs of acquisition . . . . . . . . . . . . . . . . . . . . . . . 1.4 0.2 1.6
Total consideration . . . . . . . . . . . . . . . . . . . . . . . 217.7 (6.8) 210.9
Payments for acquisition of Socib in 2008 . . . . . . . 224.3Receipts from acquisition of Socib in 2009 . . . . . . (17.5)Payments for acquisition of Socib in future years . . 4.0Costs of acquisition to be paid . . . . . . . . . . . . . . . 0.1
Total consideration . . . . . . . . . . . . . . . . . . . . . . . 210.9
The contribution of Socib to the results of the Group for the year ended 31 December 2008 was aloss of A1.0m, including restructuring charges of A1.3m. The acquisition resulted in the Group recordingA81.3m of goodwill and A126.9m of franchise rights in its established countries segment.
The goodwill arising on the acquisition of Socib is attributed to synergies that the Group expectsto realise by combining operations with those already existing in northern and central Italy.
F-70
Notes to the Consolidated Financial Statements (Continued)
29. Dividends
The reported net results of the parent company’s statutory accounts do not require a 2010statutory minimum annual dividend payment. As a result the Group has not recorded a dividendliability in respect of 2010.
The statutory minimum dividend recognised for 2009 amounted to A41.6m and was recorded asliability under ‘Other payables’ in the consolidated balance sheet. The remaining dividend of A68.1mwas recorded in shareholders’ equity in the second quarter of 2010 as an appropriation of retainedearnings.
During 2010, a dividend of A0.30 per share totalling A102.0m was paid. During 2009, a dividend ofA0.28 per share totalling A102.3m was paid. During 2008, a dividend of A0.25 per share totalling A91.3mwas paid.
30. Financial risk management
Financial risk factors
The Group’s activities expose it to a variety of financial risks: market risk (including foreigncurrency risk, interest rate risk, commodity price risk), credit risk, liquidity risk and capital risk. TheGroup’s overall risk management programme focuses on the unpredictability of financial markets andseeks to minimise potential adverse effects on the Group’s financial performance. The Group usesderivative financial instruments to hedge certain risk exposures.
Risk management is carried out by the Group Treasury in a controlled manner, consistent with theBoard of Directors’ approved policies. Group Treasury identifies, evaluates and hedges financial risks inclose co-operation with the Group’s subsidiaries. The Board of Directors has approved the TreasuryPolicy and Chart of Authority, which together provide the control framework for all treasury andtreasury related transactions.
Market Risk
Foreign currency risk
The Group is exposed to the effect of foreign currency risk on future commercial transactions,recognised assets and liabilities that are denominated in currencies other than the local entity’sfunctional currency, as well as net investments in foreign operations. Foreign currency forward contractsand foreign currency option contracts are used to hedge a portion of the Group’s foreign currency risk.The majority of the foreign currency forward contracts and foreign currency option contracts havematurities of less than one year after the balance sheet date and consequently the net fair value of thegains or losses on these contracts will be transferred from the hedging reserve to the income statementat various dates during this period. The foreign currency risk arising from the investment in foreignoperations is not hedged.
Management has set up a policy that requires Group companies to manage their foreign exchangerisk against their functional currency. To manage their foreign exchange risk arising from futurecommercial transactions and recognised assets and liabilities, entities in the Group use Foreign currencyforward contracts and foreign currency option contracts transacted with Group Treasury. Foreignexchange risk arises when future commercial transactions or recognised assets or liabilities aredenominated in a currency that is not the entity’s functional currency. The Group Treasury’s riskmanagement policy is to hedge between 25% and 80% of anticipated cash flows in each major foreigncurrency for the subsequent twelve months. Each subsidiary designates contracts with Group Treasury asfair value hedges or cash flow hedges, as appropriate. External foreign exchange contracts are designatedat Group level as hedges of foreign exchange risk on specific assets, liabilities or future transactions on agross basis.
F-71
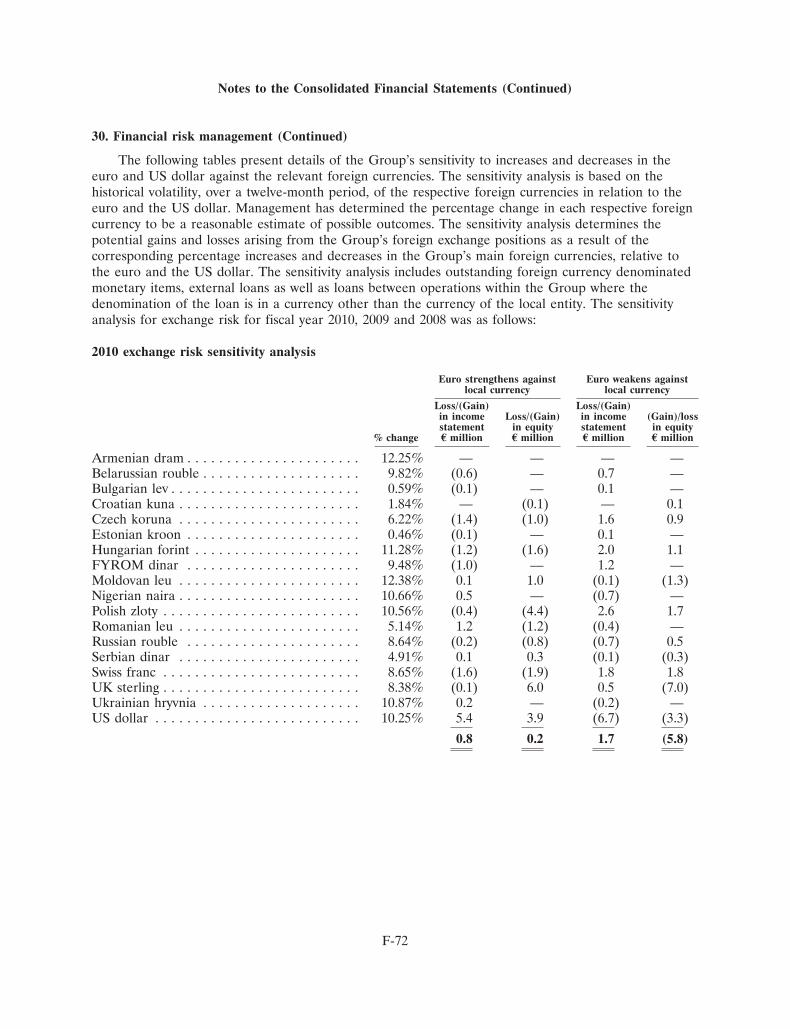
Notes to the Consolidated Financial Statements (Continued)
30. Financial risk management (Continued)
The following tables present details of the Group’s sensitivity to increases and decreases in theeuro and US dollar against the relevant foreign currencies. The sensitivity analysis is based on thehistorical volatility, over a twelve-month period, of the respective foreign currencies in relation to theeuro and the US dollar. Management has determined the percentage change in each respective foreigncurrency to be a reasonable estimate of possible outcomes. The sensitivity analysis determines thepotential gains and losses arising from the Group’s foreign exchange positions as a result of thecorresponding percentage increases and decreases in the Group’s main foreign currencies, relative tothe euro and the US dollar. The sensitivity analysis includes outstanding foreign currency denominatedmonetary items, external loans as well as loans between operations within the Group where thedenomination of the loan is in a currency other than the currency of the local entity. The sensitivityanalysis for exchange risk for fiscal year 2010, 2009 and 2008 was as follows:
2010 exchange risk sensitivity analysis
Euro strengthens against Euro weakens againstlocal currency local currency
Loss/(Gain) Loss/(Gain)in income Loss/(Gain) in income (Gain)/lossstatement in equity statement in equity
% change E million E million E million E million
Armenian dram . . . . . . . . . . . . . . . . . . . . . . 12.25% — — — —Belarussian rouble . . . . . . . . . . . . . . . . . . . . 9.82% (0.6) — 0.7 —Bulgarian lev . . . . . . . . . . . . . . . . . . . . . . . . 0.59% (0.1) — 0.1 —Croatian kuna . . . . . . . . . . . . . . . . . . . . . . . 1.84% — (0.1) — 0.1Czech koruna . . . . . . . . . . . . . . . . . . . . . . . 6.22% (1.4) (1.0) 1.6 0.9Estonian kroon . . . . . . . . . . . . . . . . . . . . . . 0.46% (0.1) — 0.1 —Hungarian forint . . . . . . . . . . . . . . . . . . . . . 11.28% (1.2) (1.6) 2.0 1.1FYROM dinar . . . . . . . . . . . . . . . . . . . . . . 9.48% (1.0) — 1.2 —Moldovan leu . . . . . . . . . . . . . . . . . . . . . . . 12.38% 0.1 1.0 (0.1) (1.3)Nigerian naira . . . . . . . . . . . . . . . . . . . . . . . 10.66% 0.5 — (0.7) —Polish zloty . . . . . . . . . . . . . . . . . . . . . . . . . 10.56% (0.4) (4.4) 2.6 1.7Romanian leu . . . . . . . . . . . . . . . . . . . . . . . 5.14% 1.2 (1.2) (0.4) —Russian rouble . . . . . . . . . . . . . . . . . . . . . . 8.64% (0.2) (0.8) (0.7) 0.5Serbian dinar . . . . . . . . . . . . . . . . . . . . . . . 4.91% 0.1 0.3 (0.1) (0.3)Swiss franc . . . . . . . . . . . . . . . . . . . . . . . . . 8.65% (1.6) (1.9) 1.8 1.8UK sterling . . . . . . . . . . . . . . . . . . . . . . . . . 8.38% (0.1) 6.0 0.5 (7.0)Ukrainian hryvnia . . . . . . . . . . . . . . . . . . . . 10.87% 0.2 — (0.2) —US dollar . . . . . . . . . . . . . . . . . . . . . . . . . . 10.25% 5.4 3.9 (6.7) (3.3)
0.8 0.2 1.7 (5.8)
F-72
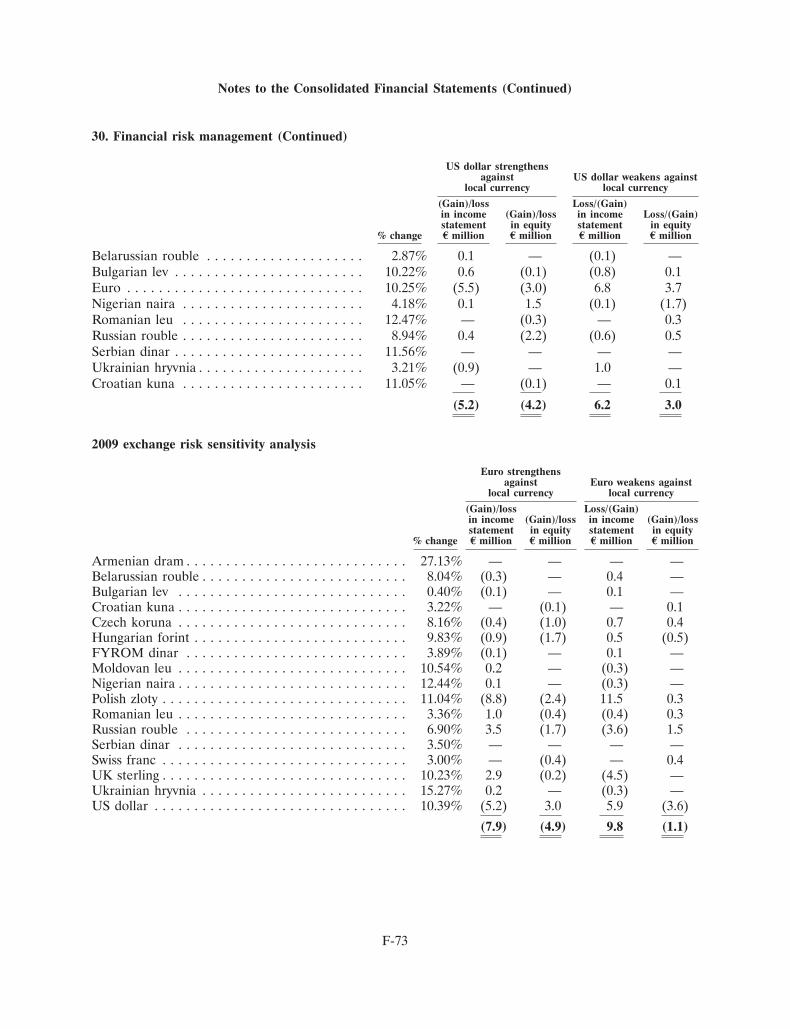
Notes to the Consolidated Financial Statements (Continued)
30. Financial risk management (Continued)
US dollar strengthensagainst US dollar weakens against
local currency local currency
(Gain)/loss Loss/(Gain)in income (Gain)/loss in income Loss/(Gain)statement in equity statement in equity
% change E million E million E million E million
Belarussian rouble . . . . . . . . . . . . . . . . . . . . 2.87% 0.1 — (0.1) —Bulgarian lev . . . . . . . . . . . . . . . . . . . . . . . . 10.22% 0.6 (0.1) (0.8) 0.1Euro . . . . . . . . . . . . . . . . . . . . . . . . . . . . . . 10.25% (5.5) (3.0) 6.8 3.7Nigerian naira . . . . . . . . . . . . . . . . . . . . . . . 4.18% 0.1 1.5 (0.1) (1.7)Romanian leu . . . . . . . . . . . . . . . . . . . . . . . 12.47% — (0.3) — 0.3Russian rouble . . . . . . . . . . . . . . . . . . . . . . . 8.94% 0.4 (2.2) (0.6) 0.5Serbian dinar . . . . . . . . . . . . . . . . . . . . . . . . 11.56% — — — —Ukrainian hryvnia . . . . . . . . . . . . . . . . . . . . . 3.21% (0.9) — 1.0 —Croatian kuna . . . . . . . . . . . . . . . . . . . . . . . 11.05% — (0.1) — 0.1
(5.2) (4.2) 6.2 3.0
2009 exchange risk sensitivity analysis
Euro strengthensagainst Euro weakens against
local currency local currency
(Gain)/loss Loss/(Gain)in income (Gain)/loss in income (Gain)/lossstatement in equity statement in equity
% change E million E million E million E million
Armenian dram . . . . . . . . . . . . . . . . . . . . . . . . . . . . 27.13% — — — —Belarussian rouble . . . . . . . . . . . . . . . . . . . . . . . . . . 8.04% (0.3) — 0.4 —Bulgarian lev . . . . . . . . . . . . . . . . . . . . . . . . . . . . . 0.40% (0.1) — 0.1 —Croatian kuna . . . . . . . . . . . . . . . . . . . . . . . . . . . . . 3.22% — (0.1) — 0.1Czech koruna . . . . . . . . . . . . . . . . . . . . . . . . . . . . . 8.16% (0.4) (1.0) 0.7 0.4Hungarian forint . . . . . . . . . . . . . . . . . . . . . . . . . . . 9.83% (0.9) (1.7) 0.5 (0.5)FYROM dinar . . . . . . . . . . . . . . . . . . . . . . . . . . . . 3.89% (0.1) — 0.1 —Moldovan leu . . . . . . . . . . . . . . . . . . . . . . . . . . . . . 10.54% 0.2 — (0.3) —Nigerian naira . . . . . . . . . . . . . . . . . . . . . . . . . . . . . 12.44% 0.1 — (0.3) —Polish zloty . . . . . . . . . . . . . . . . . . . . . . . . . . . . . . . 11.04% (8.8) (2.4) 11.5 0.3Romanian leu . . . . . . . . . . . . . . . . . . . . . . . . . . . . . 3.36% 1.0 (0.4) (0.4) 0.3Russian rouble . . . . . . . . . . . . . . . . . . . . . . . . . . . . 6.90% 3.5 (1.7) (3.6) 1.5Serbian dinar . . . . . . . . . . . . . . . . . . . . . . . . . . . . . 3.50% — — — —Swiss franc . . . . . . . . . . . . . . . . . . . . . . . . . . . . . . . 3.00% — (0.4) — 0.4UK sterling . . . . . . . . . . . . . . . . . . . . . . . . . . . . . . . 10.23% 2.9 (0.2) (4.5) —Ukrainian hryvnia . . . . . . . . . . . . . . . . . . . . . . . . . . 15.27% 0.2 — (0.3) —US dollar . . . . . . . . . . . . . . . . . . . . . . . . . . . . . . . . 10.39% (5.2) 3.0 5.9 (3.6)
(7.9) (4.9) 9.8 (1.1)
F-73
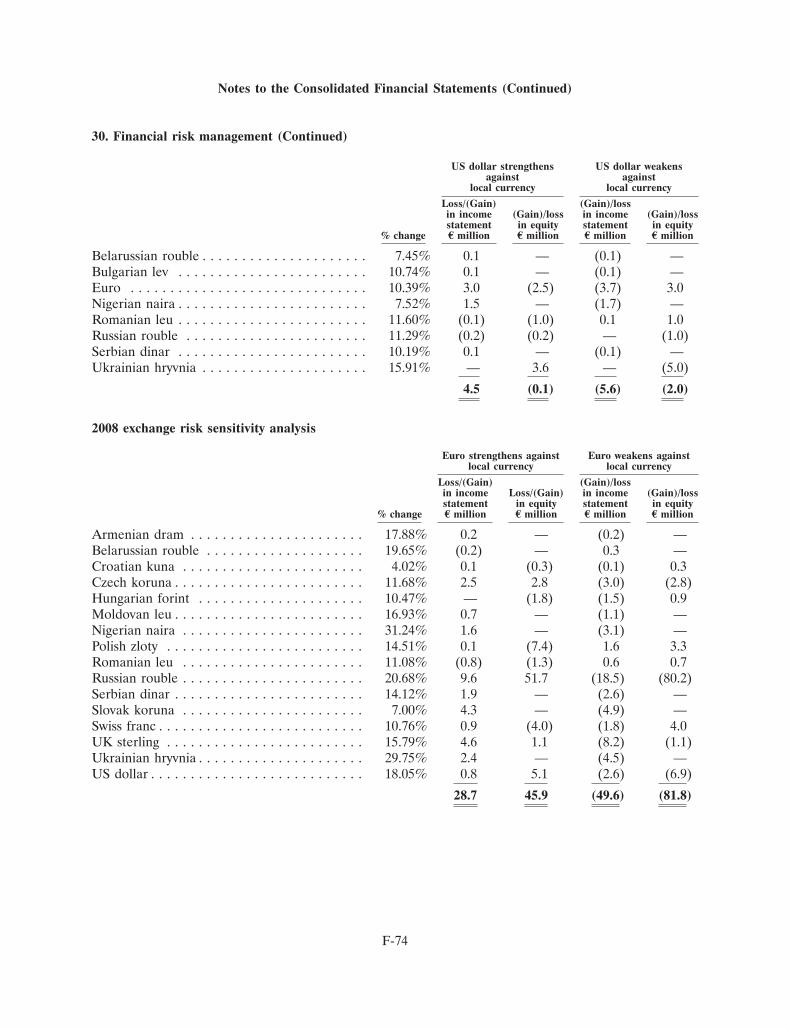
Notes to the Consolidated Financial Statements (Continued)
30. Financial risk management (Continued)
US dollar strengthens US dollar weakensagainst against
local currency local currency
Loss/(Gain) (Gain)/lossin income (Gain)/loss in income (Gain)/lossstatement in equity statement in equity
% change E million E million E million E million
Belarussian rouble . . . . . . . . . . . . . . . . . . . . . 7.45% 0.1 — (0.1) —Bulgarian lev . . . . . . . . . . . . . . . . . . . . . . . . 10.74% 0.1 — (0.1) —Euro . . . . . . . . . . . . . . . . . . . . . . . . . . . . . . 10.39% 3.0 (2.5) (3.7) 3.0Nigerian naira . . . . . . . . . . . . . . . . . . . . . . . . 7.52% 1.5 — (1.7) —Romanian leu . . . . . . . . . . . . . . . . . . . . . . . . 11.60% (0.1) (1.0) 0.1 1.0Russian rouble . . . . . . . . . . . . . . . . . . . . . . . 11.29% (0.2) (0.2) — (1.0)Serbian dinar . . . . . . . . . . . . . . . . . . . . . . . . 10.19% 0.1 — (0.1) —Ukrainian hryvnia . . . . . . . . . . . . . . . . . . . . . 15.91% — 3.6 — (5.0)
4.5 (0.1) (5.6) (2.0)
2008 exchange risk sensitivity analysis
Euro strengthens against Euro weakens againstlocal currency local currency
Loss/(Gain) (Gain)/lossin income Loss/(Gain) in income (Gain)/lossstatement in equity statement in equity
% change E million E million E million E million
Armenian dram . . . . . . . . . . . . . . . . . . . . . . 17.88% 0.2 — (0.2) —Belarussian rouble . . . . . . . . . . . . . . . . . . . . 19.65% (0.2) — 0.3 —Croatian kuna . . . . . . . . . . . . . . . . . . . . . . . 4.02% 0.1 (0.3) (0.1) 0.3Czech koruna . . . . . . . . . . . . . . . . . . . . . . . . 11.68% 2.5 2.8 (3.0) (2.8)Hungarian forint . . . . . . . . . . . . . . . . . . . . . 10.47% — (1.8) (1.5) 0.9Moldovan leu . . . . . . . . . . . . . . . . . . . . . . . . 16.93% 0.7 — (1.1) —Nigerian naira . . . . . . . . . . . . . . . . . . . . . . . 31.24% 1.6 — (3.1) —Polish zloty . . . . . . . . . . . . . . . . . . . . . . . . . 14.51% 0.1 (7.4) 1.6 3.3Romanian leu . . . . . . . . . . . . . . . . . . . . . . . 11.08% (0.8) (1.3) 0.6 0.7Russian rouble . . . . . . . . . . . . . . . . . . . . . . . 20.68% 9.6 51.7 (18.5) (80.2)Serbian dinar . . . . . . . . . . . . . . . . . . . . . . . . 14.12% 1.9 — (2.6) —Slovak koruna . . . . . . . . . . . . . . . . . . . . . . . 7.00% 4.3 — (4.9) —Swiss franc . . . . . . . . . . . . . . . . . . . . . . . . . . 10.76% 0.9 (4.0) (1.8) 4.0UK sterling . . . . . . . . . . . . . . . . . . . . . . . . . 15.79% 4.6 1.1 (8.2) (1.1)Ukrainian hryvnia . . . . . . . . . . . . . . . . . . . . . 29.75% 2.4 — (4.5) —US dollar . . . . . . . . . . . . . . . . . . . . . . . . . . . 18.05% 0.8 5.1 (2.6) (6.9)
28.7 45.9 (49.6) (81.8)
F-74
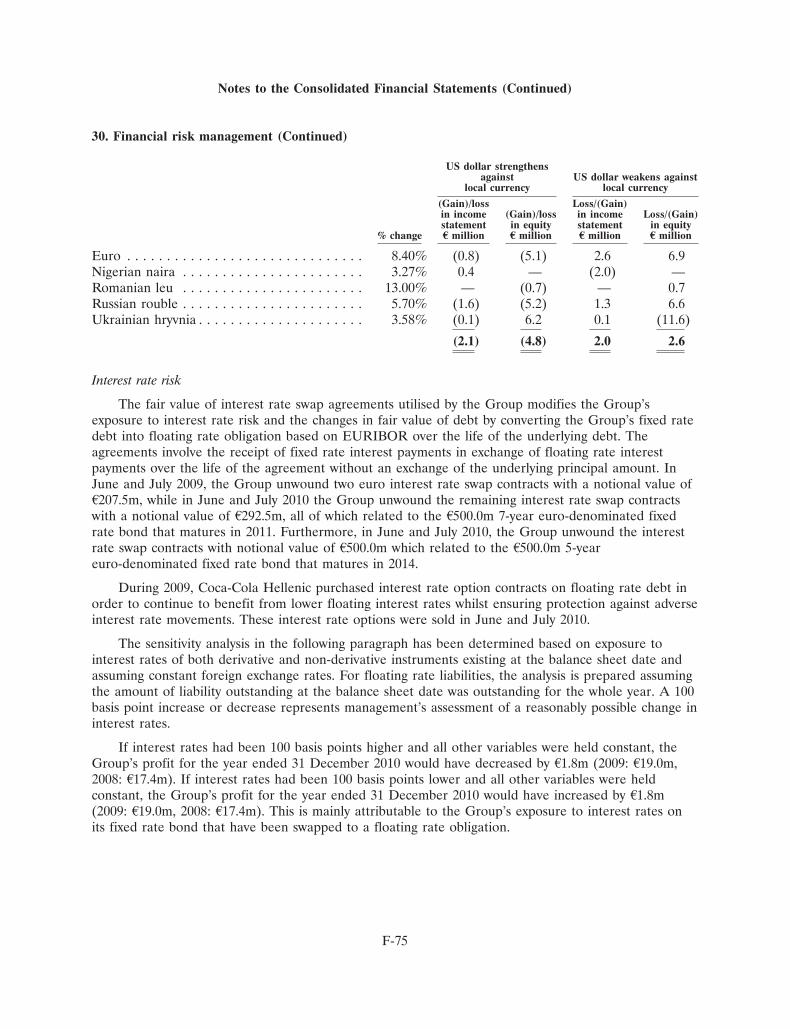
Notes to the Consolidated Financial Statements (Continued)
30. Financial risk management (Continued)
US dollar strengthensagainst US dollar weakens against
local currency local currency
(Gain)/loss Loss/(Gain)in income (Gain)/loss in income Loss/(Gain)statement in equity statement in equity
% change E million E million E million E million
Euro . . . . . . . . . . . . . . . . . . . . . . . . . . . . . . 8.40% (0.8) (5.1) 2.6 6.9Nigerian naira . . . . . . . . . . . . . . . . . . . . . . . 3.27% 0.4 — (2.0) —Romanian leu . . . . . . . . . . . . . . . . . . . . . . . 13.00% — (0.7) — 0.7Russian rouble . . . . . . . . . . . . . . . . . . . . . . . 5.70% (1.6) (5.2) 1.3 6.6Ukrainian hryvnia . . . . . . . . . . . . . . . . . . . . . 3.58% (0.1) 6.2 0.1 (11.6)
(2.1) (4.8) 2.0 2.6
Interest rate risk
The fair value of interest rate swap agreements utilised by the Group modifies the Group’sexposure to interest rate risk and the changes in fair value of debt by converting the Group’s fixed ratedebt into floating rate obligation based on EURIBOR over the life of the underlying debt. Theagreements involve the receipt of fixed rate interest payments in exchange of floating rate interestpayments over the life of the agreement without an exchange of the underlying principal amount. InJune and July 2009, the Group unwound two euro interest rate swap contracts with a notional value ofA207.5m, while in June and July 2010 the Group unwound the remaining interest rate swap contractswith a notional value of A292.5m, all of which related to the A500.0m 7-year euro-denominated fixedrate bond that matures in 2011. Furthermore, in June and July 2010, the Group unwound the interestrate swap contracts with notional value of A500.0m which related to the A500.0m 5-yeareuro-denominated fixed rate bond that matures in 2014.
During 2009, Coca-Cola Hellenic purchased interest rate option contracts on floating rate debt inorder to continue to benefit from lower floating interest rates whilst ensuring protection against adverseinterest rate movements. These interest rate options were sold in June and July 2010.
The sensitivity analysis in the following paragraph has been determined based on exposure tointerest rates of both derivative and non-derivative instruments existing at the balance sheet date andassuming constant foreign exchange rates. For floating rate liabilities, the analysis is prepared assumingthe amount of liability outstanding at the balance sheet date was outstanding for the whole year. A 100basis point increase or decrease represents management’s assessment of a reasonably possible change ininterest rates.
If interest rates had been 100 basis points higher and all other variables were held constant, theGroup’s profit for the year ended 31 December 2010 would have decreased by A1.8m (2009: A19.0m,2008: A17.4m). If interest rates had been 100 basis points lower and all other variables were heldconstant, the Group’s profit for the year ended 31 December 2010 would have increased by A1.8m(2009: A19.0m, 2008: A17.4m). This is mainly attributable to the Group’s exposure to interest rates onits fixed rate bond that have been swapped to a floating rate obligation.
F-75
Notes to the Consolidated Financial Statements (Continued)
30. Financial risk management (Continued)
Commodities price risk management
The Group has no material exposure to the effect of short-term changes in the price of sugar,fructose and aluminium as where possible it contracts prices with suppliers up to one year in advance.
Credit risk
The Group has limited concentration of credit risk across trade and financial counterparties.Policies are in place to ensure that credit sales of products and services are made to customers with anappropriate credit history. Derivative counterparties and cash transactions are limited to high creditquality financial institutions. The Group has policies that limit the amount of credit exposure to anysingle financial institution.
The Group’s maximum exposure to credit risk in the event that counterparties fail to perform theirobligations at 31 December 2010 in relation to each class of recognised financial asset, is the carryingamount of those assets as indicated in the balance sheet.
If credit is granted to customers, their credit quality is normally assessed using external agenciesand historic experience. Credit limits are set accordingly. Further information regarding credit riskexposure is shown within Notes 12 and 13.
With respect to derivative financial instruments, credit risk arises from the potential failure ofcounterparties to meet their obligations under the contract or arrangement. The Group’s maximumcredit risk exposure for each derivative instrument is the carrying amount of the derivative (refer toNote 8). In addition, the Group regularly makes use of money market funds to invest temporarilyexcess cash balances and to diversify its counterparty risk. These funds all have a minimum AAA ratingand strict investment limits are set, per fund, depending on the size of the fund.
The Group only undertakes investment transactions with banks and financial institutions that havea minimum independent credit rating of ‘A’ from Standard & Poor’s or ‘A2’ from Moody’s. In relationto derivative transactions, the financial institutions are required to have at least one long-term creditrating of ‘AA�’ or ‘Aa3’ from Standard & Poor’s or Moody’s Investors Service respectively.
Liquidity risk
The Group actively manages liquidity risk to ensure there are sufficient funds available for anyshort-term and long-term commitments. Bank overdrafts and bank facilities, both committed anduncommitted, are used to manage this risk.
Ultimate responsibility for liquidity risk management rests with the Board of Directors, which hasbuilt an appropriate liquidity risk management framework for the management of the Group’s short,medium and long-term funding and liquidity requirements. The Group manages liquidity risk bymaintaining adequate reserves and committed banking facilities, access to the debt capital markets, andby continuously monitoring forecasted and actual cash flows. Included in Note 15 is a listing of theundrawn facilities that the Group has at its disposal to manage liquidity risk.
F-76
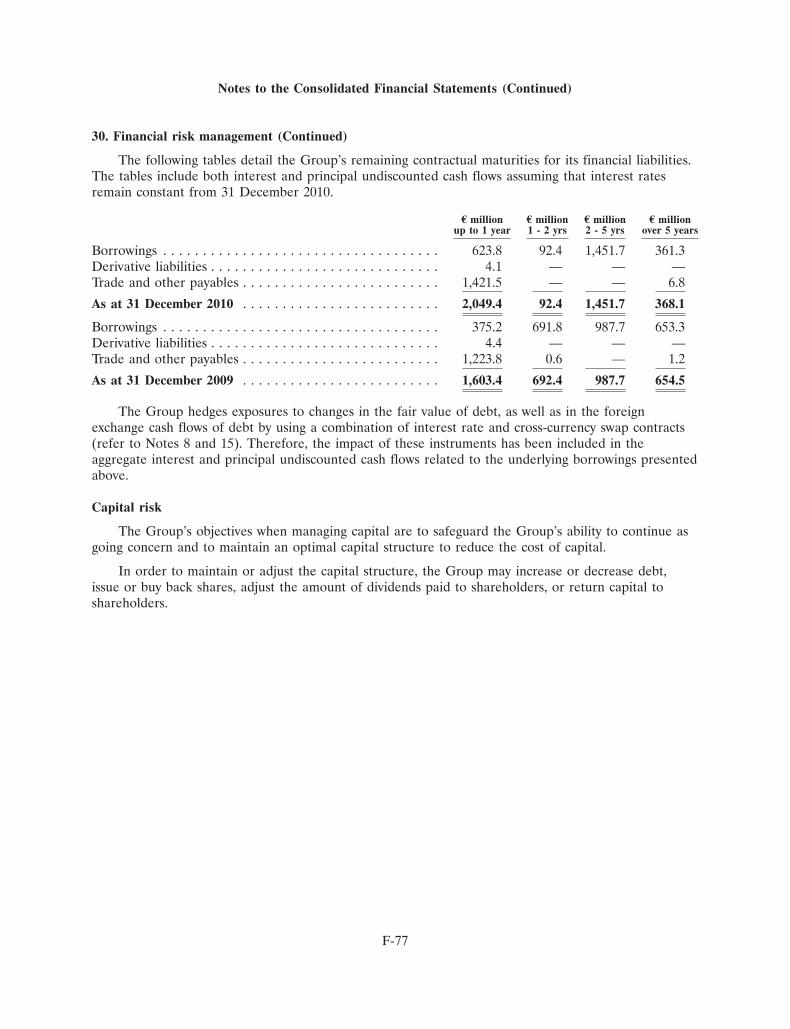
Notes to the Consolidated Financial Statements (Continued)
30. Financial risk management (Continued)
The following tables detail the Group’s remaining contractual maturities for its financial liabilities.The tables include both interest and principal undiscounted cash flows assuming that interest ratesremain constant from 31 December 2010.
E million E million E million E millionup to 1 year 1 - 2 yrs 2 - 5 yrs over 5 years
Borrowings . . . . . . . . . . . . . . . . . . . . . . . . . . . . . . . . . . . 623.8 92.4 1,451.7 361.3Derivative liabilities . . . . . . . . . . . . . . . . . . . . . . . . . . . . . 4.1 — — —Trade and other payables . . . . . . . . . . . . . . . . . . . . . . . . . 1,421.5 — — 6.8
As at 31 December 2010 . . . . . . . . . . . . . . . . . . . . . . . . . 2,049.4 92.4 1,451.7 368.1
Borrowings . . . . . . . . . . . . . . . . . . . . . . . . . . . . . . . . . . . 375.2 691.8 987.7 653.3Derivative liabilities . . . . . . . . . . . . . . . . . . . . . . . . . . . . . 4.4 — — —Trade and other payables . . . . . . . . . . . . . . . . . . . . . . . . . 1,223.8 0.6 — 1.2
As at 31 December 2009 . . . . . . . . . . . . . . . . . . . . . . . . . 1,603.4 692.4 987.7 654.5
The Group hedges exposures to changes in the fair value of debt, as well as in the foreignexchange cash flows of debt by using a combination of interest rate and cross-currency swap contracts(refer to Notes 8 and 15). Therefore, the impact of these instruments has been included in theaggregate interest and principal undiscounted cash flows related to the underlying borrowings presentedabove.
Capital risk
The Group’s objectives when managing capital are to safeguard the Group’s ability to continue asgoing concern and to maintain an optimal capital structure to reduce the cost of capital.
In order to maintain or adjust the capital structure, the Group may increase or decrease debt,issue or buy back shares, adjust the amount of dividends paid to shareholders, or return capital toshareholders.
F-77
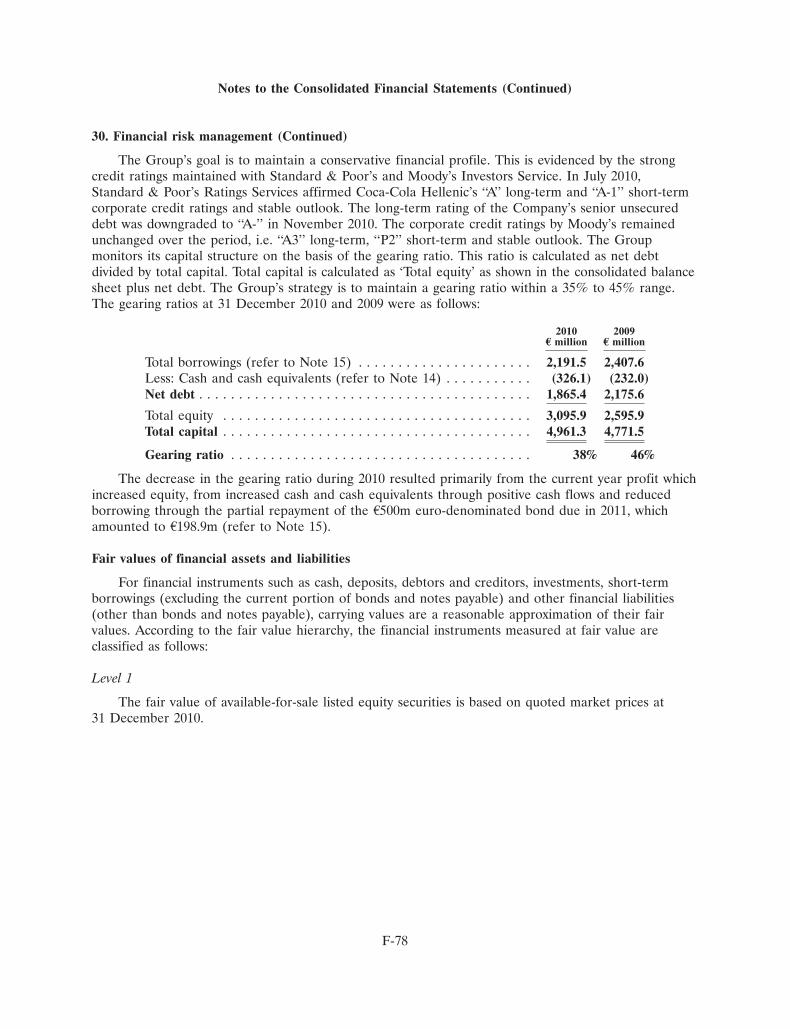
Notes to the Consolidated Financial Statements (Continued)
30. Financial risk management (Continued)
The Group’s goal is to maintain a conservative financial profile. This is evidenced by the strongcredit ratings maintained with Standard & Poor’s and Moody’s Investors Service. In July 2010,Standard & Poor’s Ratings Services affirmed Coca-Cola Hellenic’s ‘‘A’’ long-term and ‘‘A-1’’ short-termcorporate credit ratings and stable outlook. The long-term rating of the Company’s senior unsecureddebt was downgraded to ‘‘A-’’ in November 2010. The corporate credit ratings by Moody’s remainedunchanged over the period, i.e. ‘‘A3’’ long-term, ‘‘P2’’ short-term and stable outlook. The Groupmonitors its capital structure on the basis of the gearing ratio. This ratio is calculated as net debtdivided by total capital. Total capital is calculated as ‘Total equity’ as shown in the consolidated balancesheet plus net debt. The Group’s strategy is to maintain a gearing ratio within a 35% to 45% range.The gearing ratios at 31 December 2010 and 2009 were as follows:
2010 2009E million E million
Total borrowings (refer to Note 15) . . . . . . . . . . . . . . . . . . . . . . 2,191.5 2,407.6Less: Cash and cash equivalents (refer to Note 14) . . . . . . . . . . . (326.1) (232.0)Net debt . . . . . . . . . . . . . . . . . . . . . . . . . . . . . . . . . . . . . . . . . . 1,865.4 2,175.6
Total equity . . . . . . . . . . . . . . . . . . . . . . . . . . . . . . . . . . . . . . . 3,095.9 2,595.9Total capital . . . . . . . . . . . . . . . . . . . . . . . . . . . . . . . . . . . . . . . 4,961.3 4,771.5
Gearing ratio . . . . . . . . . . . . . . . . . . . . . . . . . . . . . . . . . . . . . . 38% 46%
The decrease in the gearing ratio during 2010 resulted primarily from the current year profit whichincreased equity, from increased cash and cash equivalents through positive cash flows and reducedborrowing through the partial repayment of the A500m euro-denominated bond due in 2011, whichamounted to A198.9m (refer to Note 15).
Fair values of financial assets and liabilities
For financial instruments such as cash, deposits, debtors and creditors, investments, short-termborrowings (excluding the current portion of bonds and notes payable) and other financial liabilities(other than bonds and notes payable), carrying values are a reasonable approximation of their fairvalues. According to the fair value hierarchy, the financial instruments measured at fair value areclassified as follows:
Level 1
The fair value of available-for-sale listed equity securities is based on quoted market prices at31 December 2010.
F-78
Notes to the Consolidated Financial Statements (Continued)
30. Financial risk management (Continued)
Level 2
The fair value of foreign currency forward contracts, foreign currency option contracts, bonds andnotes payable, interest rate swap contracts and cross-currency swap contracts is determined by usingvaluation techniques. These valuation techniques maximise the use of observable market data. The fairvalue of the foreign currency forward contracts, foreign currency option contracts and cross-currencyswap contracts is calculated by reference to quoted forward exchange and deposit rates at 31 December2010 for contracts with similar maturity dates. The fair value of interest rate option contracts iscalculated by reference to the Black and Scholes valuation model and implied volatilities. The fair valueof bonds and notes payable has been determined on the basis of the estimated present value of futurecash flows based on observable yield curves. The fair value of interest rate swap contracts is determinedas the difference in the present value of the future interest cash inflows and outflows based onobservable yield curves.
Level 3
The fair value of available-for-sale unlisted investments is determined through the use of estimateddiscounted cash flows.
The Group holds borrowings at both fixed and floating interest rates. Interest rate swap contractshave been used to manage the Group’s exposure to interest rates, in line with the Group’s fixed / floating rate strategy.
F-79
Notes to the Consolidated Financial Statements (Continued)
30. Financial risk management (Continued)
The following table provides the fair value hierarchy in which fair value measurements arecategorised for assets and liabilities at 31 December 2010:
Level 1 Level 2 Level 3 TotalE million E million E million E million
Financial assets at FVTPLForeign currency forward contracts . . . . . . . . . . . . . . . . . . — 0.3 — 0.3Foreign currency option contracts . . . . . . . . . . . . . . . . . . . — 0.4 — 0.4
Derivative financial assets used for hedgingFair value hedges
Foreign currency forward contracts . . . . . . . . . . . . . . . . . . — 1.7 — 1.7Interest rate swap contracts . . . . . . . . . . . . . . . . . . . . . . . — 35.4 — 35.4
Cash flow hedgesForeign currency forward contracts . . . . . . . . . . . . . . . . . . — 0.6 — 0.6Foreign currency option contracts . . . . . . . . . . . . . . . . . . . — 1.2 — 1.2Interest rate swap contracts . . . . . . . . . . . . . . . . . . . . . . . — 37.7 — 37.7
Available-for-sale financial assetsEquity securities . . . . . . . . . . . . . . . . . . . . . . . . . . . . . . . . 1.5 — 0.3 1.8
Total financial assets . . . . . . . . . . . . . . . . . . . . . . . . . . . . . . . 1.5 77.3 0.3 79.1
Financial liabilities at FVTPLForeign currency forward contracts . . . . . . . . . . . . . . . . . . — (0.1) — (0.1)Cross-currency swap contracts . . . . . . . . . . . . . . . . . . . . . . — (72.6) — (72.6)
Hedged financial liabilitiesBonds and notes payable . . . . . . . . . . . . . . . . . . . . . . . . . — (744.1) — (744.1)
Derivative financial liabilities used for hedgingFair value hedges
Foreign currency forward contracts . . . . . . . . . . . . . . . . . . — (0.6) — (0.6)Cash flow hedges
Foreign currency forward contracts . . . . . . . . . . . . . . . . . . — (3.4) — (3.4)Cross-currency swap contracts . . . . . . . . . . . . . . . . . . . . . . — (63.5) — (63.5)
Total financial liabilities . . . . . . . . . . . . . . . . . . . . . . . . . . . . . — (884.3) — (884.3)
The following table presents changes in fair value measurements for Level 3 items for the yearended 31 December 2010:
E million
As at 1 January 2010 . . . . . . . . . . . . . . . . . . . . . . . . . . . . . . . . . . . . . . . . 15.6Total gains/(losses) for the year . . . . . . . . . . . . . . . . . . . . . . . . . . . . . . . .
In profit and loss . . . . . . . . . . . . . . . . . . . . . . . . . . . . . . . . . . . . . . . . . 1.0Settlements . . . . . . . . . . . . . . . . . . . . . . . . . . . . . . . . . . . . . . . . . . . . . . . (16.3)
As at 31 December 2010 . . . . . . . . . . . . . . . . . . . . . . . . . . . . . . . . . . . . . 0.3
Total gains for the year included in profit or loss for assets held at31 December 2010 . . . . . . . . . . . . . . . . . . . . . . . . . . . . . . . . . . . . . . . . 1.0
F-80
Notes to the Consolidated Financial Statements (Continued)
30. Financial risk management (Continued)
Total gains for the year included in profit or loss for available-for-sale equity securities amountedto A1.0m, related to assets held at 31 December 2010 and were recorded within operating expenses.
The following table provides the fair value hierarchy in which fair value measurements arecategorised for assets and liabilities at 31 December 2009:
Level 1 Level 2 Level 3 TotalE million E million E million E million
Financial assets at FVTPLInterest rate swap contracts . . . . . . . . . . . . . . . . . . . . . . . — 8.8 — 8.8Interest rate option contracts . . . . . . . . . . . . . . . . . . . . . — 7.7 — 7.7
Derivative financial assets used for hedgingFair value hedges
Foreign currency forward contracts . . . . . . . . . . . . . . . . . — 0.9 — 0.9Foreign currency option contracts . . . . . . . . . . . . . . . . . . — 2.4 — 2.4Interest rate swap contracts . . . . . . . . . . . . . . . . . . . . . . . — 63.1 — 63.1
Cash flow hedgesForeign currency forward contracts . . . . . . . . . . . . . . . . . — 0.3 — 0.3Foreign currency option contracts . . . . . . . . . . . . . . . . . . — 0.3 — 0.3
Available-for-sale financial assetsEquity securities . . . . . . . . . . . . . . . . . . . . . . . . . . . . . . . 2.1 — 15.6 17.7
Total financial assets . . . . . . . . . . . . . . . . . . . . . . . . . . . . . . . 2.1 83.5 15.6 101.2
Financial liabilities at FVTPLCross-currency swap contracts . . . . . . . . . . . . . . . . . . . . . — (175.4) — (175.4)
Hedged financial liabilitiesBonds and notes payable . . . . . . . . . . . . . . . . . . . . . . . . . — (1,184.1) — (1,184.1)
Derivative financial liabilities used for hedgingFair value hedges
Foreign currency forward contracts . . . . . . . . . . . . . . . . . — (2.5) — (2.5)Cash flow hedges
Foreign currency forward contracts . . . . . . . . . . . . . . . . . — (1.9) — (1.9)
Total financial liabilities . . . . . . . . . . . . . . . . . . . . . . . . . . . . — (1,363.9) — (1,363.9)
The following table presents changes in fair value measurements for Level 3 items for the yearended 31 December 2009:
E million
As at 1 January 2009 . . . . . . . . . . . . . . . . . . . . . . . . . . . . . . . . . . . . . . . . 13.2Total gains/(losses) for the yearIn profit and loss . . . . . . . . . . . . . . . . . . . . . . . . . . . . . . . . . . . . . . . . . . . (0.2)In other comprehensive income . . . . . . . . . . . . . . . . . . . . . . . . . . . . . . . . (0.2)Purchases . . . . . . . . . . . . . . . . . . . . . . . . . . . . . . . . . . . . . . . . . . . . . . . . 2.8
As at 31 December 2009 . . . . . . . . . . . . . . . . . . . . . . . . . . . . . . . . . . . . . 15.6
Total losses for the year included in profit or loss for assets held at31 December 2009 . . . . . . . . . . . . . . . . . . . . . . . . . . . . . . . . . . . . . . . . (0.2)
F-81
Notes to the Consolidated Financial Statements (Continued)
30. Financial risk management (Continued)
Total losses for the year included in profit or loss for available-for-sale equity securities amountedto A0.2m, related to assets held at 31 December 2009 and were recorded within operating expenses.
31. Contingencies
The Greek Competition Authority issued a decision on 25 January 2002, imposing a fine on theCompany of approximately A2.9 million for certain discount and rebate practices and required changesto the Company’s commercial practices with respect to placing coolers in certain locations and lendingthese assets free of charge. On 16 June 2004, the fine was reduced on appeal to A1.8 million. On29 June 2005, the Greek Competition Authority requested that the Company provide information on itscommercial practices as a result of a complaint by certain third parties regarding the Company’scompliance with the decision of 25 January 2002. On 7 October 2005, the Company was served withnotice to appear before the Greek Competition Authority. On 14 June 2006, the Greek CompetitionAuthority issued a decision imposing a daily penalty of A5,869 for each day that the Company allegedlyfailed to comply with the decision of 25 January 2002. On 31 August 2006, the Company deposited anamount of A8.9 million, reflecting the amount of the fine and applicable tax, with the Greek authorities.As a result of this deposit, the Company increased the charge to its 2006 financial statements inconnection to this case. On 23 November 2007, the Court of Appeals partly reversed and partly upheldthe decision of the Greek Competition Authority reducing the amount of the fine to A5.9 million. Thereduction of the fine by A2.8 million was recognised in the Company’s 2007 income statement. TheCompany has appealed the decision of the Court of Appeals to the extent it upholds the fine, to theSupreme Administrative Court of Greece. The Company believes that it has substantial legal groundsfor its appeal against the judgment of the Court of Appeals. The Greek Competition Authority and oneof the Company’s competitors have also appealed the decision of the Court of Appeals. The cases arestill pending before the Supreme Administrative Court of Greece.
In relation to the Greek Competition Authority’s decision of 25 January 2002, one of theCompany’s competitors has filed a lawsuit claiming damages in an amount of A7.7 million. The court offirst instance heard the case on 21 January 2009 and subsequently rejected the lawsuit. The plaintiff hasappealed the judgment. At present, it is not possible to predict the final outcome of this lawsuit orquantify the likelihood or materiality of any potential liability arising from it. We have not provided forany losses related to this case.
In the second quarter of 2010, the Serbian Competition Authority opened an investigation into thecommercial practices of the Company’s Serbian subsidiary for potential abuse of dominance in themarket for distribution of alcoholic and non-alcoholic beverages. The authority published an invitationfor comments by third parties. At present, it is not possible to predict the final outcome of thisinvestigation or quantify the likelihood or materiality of any potential liability arising from it.
The Company is also involved in various other legal proceedings. Management believes that anyliability to the Company that may arise as a result of these pending legal proceedings will not have amaterial adverse effect on the results of operations, cash flows, or the financial condition of theCompany taken as a whole.
The tax filings of the Company and its subsidiaries are routinely subjected to audit by taxauthorities in most of the jurisdictions in which the Company conducts business. These audits mayresult in assessments of additional taxes. The Company provides additional tax in relation to theoutcome of such tax assessments, to the extent that a liability is probable and estimable.
F-82
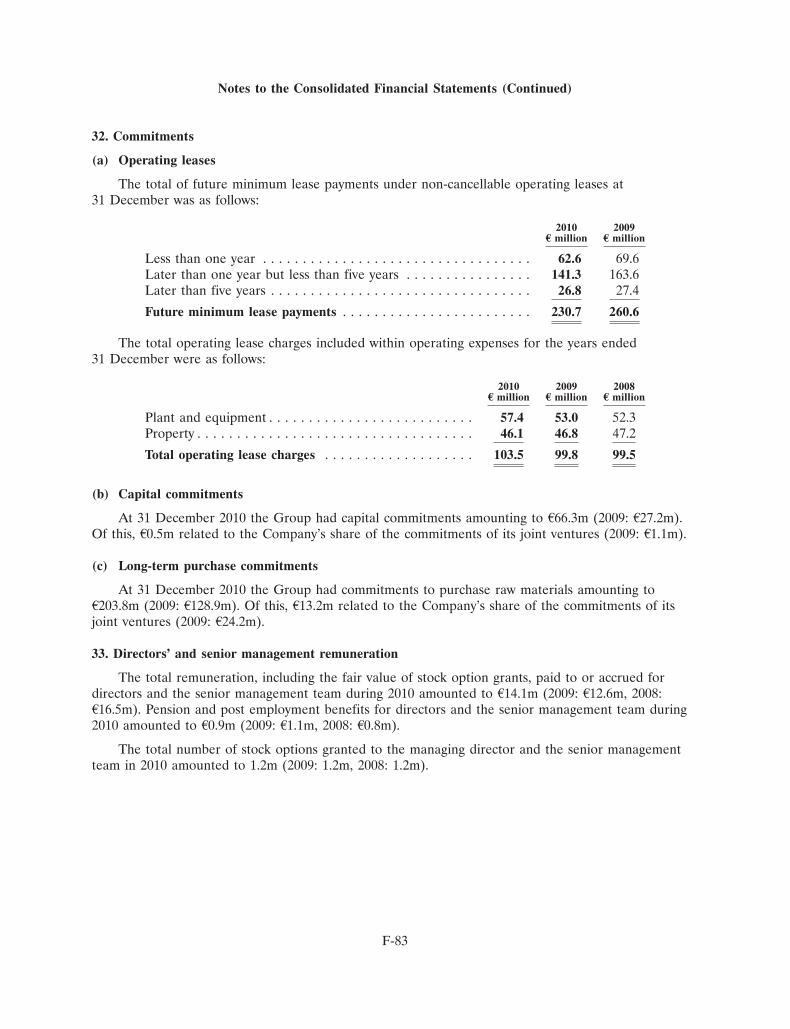
Notes to the Consolidated Financial Statements (Continued)
32. Commitments
(a) Operating leases
The total of future minimum lease payments under non-cancellable operating leases at31 December was as follows:
2010 2009E million E million
Less than one year . . . . . . . . . . . . . . . . . . . . . . . . . . . . . . . . . . 62.6 69.6Later than one year but less than five years . . . . . . . . . . . . . . . . 141.3 163.6Later than five years . . . . . . . . . . . . . . . . . . . . . . . . . . . . . . . . . 26.8 27.4
Future minimum lease payments . . . . . . . . . . . . . . . . . . . . . . . . 230.7 260.6
The total operating lease charges included within operating expenses for the years ended31 December were as follows:
2010 2009 2008E million E million E million
Plant and equipment . . . . . . . . . . . . . . . . . . . . . . . . . . 57.4 53.0 52.3Property . . . . . . . . . . . . . . . . . . . . . . . . . . . . . . . . . . . 46.1 46.8 47.2
Total operating lease charges . . . . . . . . . . . . . . . . . . . 103.5 99.8 99.5
(b) Capital commitments
At 31 December 2010 the Group had capital commitments amounting to A66.3m (2009: A27.2m).Of this, A0.5m related to the Company’s share of the commitments of its joint ventures (2009: A1.1m).
(c) Long-term purchase commitments
At 31 December 2010 the Group had commitments to purchase raw materials amounting toA203.8m (2009: A128.9m). Of this, A13.2m related to the Company’s share of the commitments of itsjoint ventures (2009: A24.2m).
33. Directors’ and senior management remuneration
The total remuneration, including the fair value of stock option grants, paid to or accrued fordirectors and the senior management team during 2010 amounted to A14.1m (2009: A12.6m, 2008:A16.5m). Pension and post employment benefits for directors and the senior management team during2010 amounted to A0.9m (2009: A1.1m, 2008: A0.8m).
The total number of stock options granted to the managing director and the senior managementteam in 2010 amounted to 1.2m (2009: 1.2m, 2008: 1.2m).
F-83
Notes to the Consolidated Financial Statements (Continued)
34. Related party transactions
a) The Coca-Cola Company
As at 31 December 2010, TCCC indirectly owned 23.2% (2009: 23.3%, 2008: 23.3%) of the issuedshare capital of Coca-Cola Hellenic. TCCC considers Coca-Cola Hellenic to be a ‘key bottler’ and hasentered into bottler’s agreements with Coca-Cola Hellenic in respect of each of Coca-Cola Hellenic’sterritories. All the bottler’s agreements entered into by TCCC and Coca-Cola Hellenic are StandardInternational Bottler’s (‘SIB’) agreements. The terms of the bottler’s agreements grant Coca-ColaHellenic the right to produce and the exclusive right to sell and distribute the beverages of TCCC ineach of the countries Coca-Cola Hellenic operates. Consequently, Coca-Cola Hellenic is obliged topurchase all concentrate for TCCC’s beverages from TCCC, or its designee, in the ordinary course ofbusiness. These agreements extend to 2013 and may be renewed at TCCC’s discretion until 2023. On29 December 2008, Kar-Tess Holding and TCCC agreed to extend their existing shareholders’agreement, whereby the combined shareholdings of Kar-Tess Holding and TCCC will not fall below44% for the period up to January 2014 and not below 40% for the period thereafter until 31 December2018.
TCCC owns or has applied for the trademarks that identify its beverages in each of the countriesCoca-Cola Hellenic operates. TCCC has authorised Coca-Cola Hellenic and certain of its subsidiariesto use the trademark ‘Coca-Cola’ in their corporate names.
Total purchases of concentrate, finished products and other materials from TCCC and itssubsidiaries during 2010 amounted to A1,372.9m (2009: A1,283.6m, 2008: A1,390.9m).
TCCC makes discretionary marketing contributions to Coca-Cola Hellenic’s operating subsidiaries.The participation in shared marketing agreements is at TCCC’s discretion and, where co-operativearrangements are entered into, marketing expenses are shared. Such arrangements include thedevelopment of marketing programmes to promote TCCC’s beverages. Total net contributions receivedfrom TCCC for marketing and promotional incentives during the year amounted to A60.8m (2009:A56.9m, 2008: A45.8m). Contributions for price support and marketing and promotional campaigns inrespect of specific customers are recorded in net sales revenue as an offset to promotional incentivespaid to customers. In 2010, such contributions totalled A48.8m (2009: A39.9m, 2008: A37.6m).Contributions for general marketing programmes are recorded as an offset to selling expenses. In 2010,such contributions made by TCCC to Coca-Cola Hellenic totalled A15.8m (2009: A22.5m, 2008: A15.2m)and the contributions of Coca-Cola Hellenic to TCCC totalled A3.8m (2009: A5.5m, 2008: A7.0m).TCCC has also customarily made additional payments for marketing and advertising directly tosuppliers as part of the shared marketing arrangements. The proportion of direct and indirectpayments, made at TCCC’s discretion, will not necessarily be the same from year to year.
In 2010, the Group did not record any gain from the sale of property, plant and equipment toTCCC (2009: A0.2m, 2008: A1.4m).
During the year, the Group sold A19.0m of finished goods and raw materials to TCCC (2009:A20.5m, 2008: A11.7m).
Other income primarily comprises rent, facility and other items of A14.3m (2009: A4.4m, 2008:A2.9m) and a toll-filling relationship in Poland of A17.6m (2009: A15.0m, 2008: A18.2m). There were noother expenses related to facility costs charged by TCCC and shared costs (2009: A1.5m, 2008: A2.5m)included in operating expenses.
F-84
Notes to the Consolidated Financial Statements (Continued)
34. Related party transactions (Continued)
During 2008 the Group recorded proceeds of A35.0m from the sale of the botaniQ, Romerquelleand Lanitis juice trademarks.
During 2010 the Group purchased A4.4m of franchise rights (nil in both 2009 and 2008) andreceived A4.9m (nil in both 2009 and 2008) from the sale of available-for-sale assets to TCCC.
As at 31 December 2010, the Group had a total amount due from TCCC of A53.8m (2009: A64.2m,2008: A106.8m), of which A3.0m (2009: A6.7m, 2008: A4.5m,) related to loans to joint ventures withTCCC, and a total amount due to TCCC of A166.0m (2009: A125.1m, 2008: A160.0m).
(b) Frigoglass S.A. (‘Frigoglass’)
Frigoglass, a company listed on the Athens Exchange, is a manufacturer of coolers, glass bottlesand crowns. Frigoglass is related to Coca-Cola Hellenic by way of 43.9% ownership by the parent ofKar-Tess Holding (see below). Frigoglass has a controlling interest in Frigoglass Industries Limited, acompany in which Coca-Cola Hellenic has a 16% effective interest, through its investment in NigerianBottling Company plc (refer to Note 6).
Coca-Cola Hellenic entered into a supply agreement with Frigoglass for the purchase of coolingequipment in 1999. The supply agreement was extended in 2004 and, most recently, in 2008, onsubstantially similar terms. Coca-Cola Hellenic has the status of most favoured customer of Frigoglass,on a non-exclusive basis, provided that it obtains at least 60% (at prices which are negotiated on anannual basis and which must be competitive) of its annual requirements for cooling equipment. Thecurrent agreement expires on 31 December 2013.
During 2010, the Group made purchases of A101.0m (2009: A58.8m, 2008: A117.5m) of coolers,glass bottles and crowns from Frigoglass and its subsidiaries and incurred maintenance and otherexpenses of A5.7m (2009: A5.3m, 2008: A5.8m). In addition the Group recorded other income of A0.5m(2009: A0.7m, 2008: nil). As at 31 December 2010, Coca-Cola Hellenic owed A13.9m (2009: A3.6m,2008: A12.2m) to, and was owed A1.2m (2009: A4.7m, 2008: A1.8m) by Frigoglass.
(c) Directors
Mr George A. David, Mr Haralambos K. Leventis, Mr Anastasios P. Leventis andMr Anastassis G. David have been nominated by Kar-Tess Holding to the board of Coca-Cola Hellenic.Mr Irial Finan and Mr John Hunter have been nominated by TCCC to the board of Coca-ColaHellenic. There have been no transactions between Coca-Cola Hellenic and the directors except forremuneration (refer to Note 33).
(d) Other
Beverage Partners Worldwide (‘BPW’)
BPW is a 50/50 joint venture between TCCC and Nestle. During 2010, the Group purchasedinventory from BPW amounting to A89.4m (2009: A70.0m, 2008: A104.0m) and recorded income ofA0.1m (2009: A0.1m, 2008: A0.1m). As at 31 December 2010, Coca-Cola Hellenic owed A4.4m (2009:A1.7m, 2008: A4.1m) to, and was not owed any amounts (2009: A0.3m, 2008: A0.6m) by BPW.
F-85
Notes to the Consolidated Financial Statements (Continued)
34. Related party transactions (Continued)
Kar-Tess Holding
As at 31 December 2010, Kar-Tess Holding owned 23.3% (2009: 29.5%, 2008: 29.5%) of the issuedshare capital of Coca-Cola Hellenic.
On 6 December, 2010 Kar-Tess Holding transferred 22,453,254 of Coca-Cola Hellenic shares andvoting rights representing 6.13% of the total number of shares and voting rights of Coca-Cola Hellenicby transferring its wholly owned subsidiaries under the trade names ‘‘Sammy LLC’’, ‘‘Lucky 70 LLC’’,‘‘Zoe 20 LLC’’, ‘‘Kooky LLC’’, ‘‘Utopia Business Company Ltd.’’, ‘‘Harmonia Commercial S.A.’’, ‘‘IceCold Holdings Limited’’ and ‘‘Red & White Holdings Limited’’ to entities and individuals, who wereeither ultimate beneficial owners of Kar-Tess Holding or have been nominated by them. None of theabove persons owns individually more than 2% of the outstanding shares and voting rights ofCoca-Cola Hellenic.
Leventis Overseas & AG Leventis (Nigeria) PLC (the ‘Leventis Companies’)
The Leventis Companies are related to Coca-Cola Hellenic by way of common directors, as aresult of which significant influence is considered to exist. During 2010, the Group purchased A10.8m(2009: A10.0m, 2008: A11.1m) of finished goods and other materials and had no purchases of fixedassets (2009: A0.4m, 2008: A2.6m) from the Leventis Companies. Furthermore the Group sold A0.1m offinished goods and raw materials to the Leventis Companies (2009: nil, 2008: A0.2m) and incurredrental expenses of A0.6m (2009: A2.9m, 2008: A0.4m) from the Leventis Companies. In addition during2010 the Group incurred other expenses of A0.4m (2009: nil, 2008: nil) and recorded other income ofA1.0m (2009: nil, 2008: nil) with the Leventis Companies. As at 31 December 2010, the Group owedA1.3m (2009: A2.2m, 2008: A1.1m) to, and was owed A0.8m (2009: A0.2m, 2008: nil) by the LeventisCompanies.
Plias S.A. and its subsidiaries (‘Plias’)
Plias is related to Coca-Cola Hellenic by way of some common shareholdings. During 2010, theGroup had no purchases (2009: nil, 2008: A0.2m) of finished goods and other materials from Plias andhad not recorded any income (2009: nil, 2008: A0.2m). At 31 December 2010, there were no payables toPlias S.A. (2009: A0.2m, 2008: nil) and no receivables from Plias S.A. (2009: nil, 2008: A0.6m).
Ilko Hellenic Partners GmbH (‘Ilko’)
On 27 March 2008 the Group together with TCCC and illycaffe S.p.A. formed a three-party jointventure for the manufacture, marketing, selling and distribution of premium ready-to-drink coffeeunder the ‘illy’ brand across Coca-Cola Hellenic’s territories. During 2010, the Group receivedreimbursement for direct marketing expenses incurred of A0.8m (2009: A0.5m, 2008: A0.8m) andrecorded other income of A0.3m (2009: A0.4m, 2008: nil). As at 31 December 2010, the receivablesfrom Ilko were A1.4m (2009: A1.3m, 2008: A2.6m).
F-86
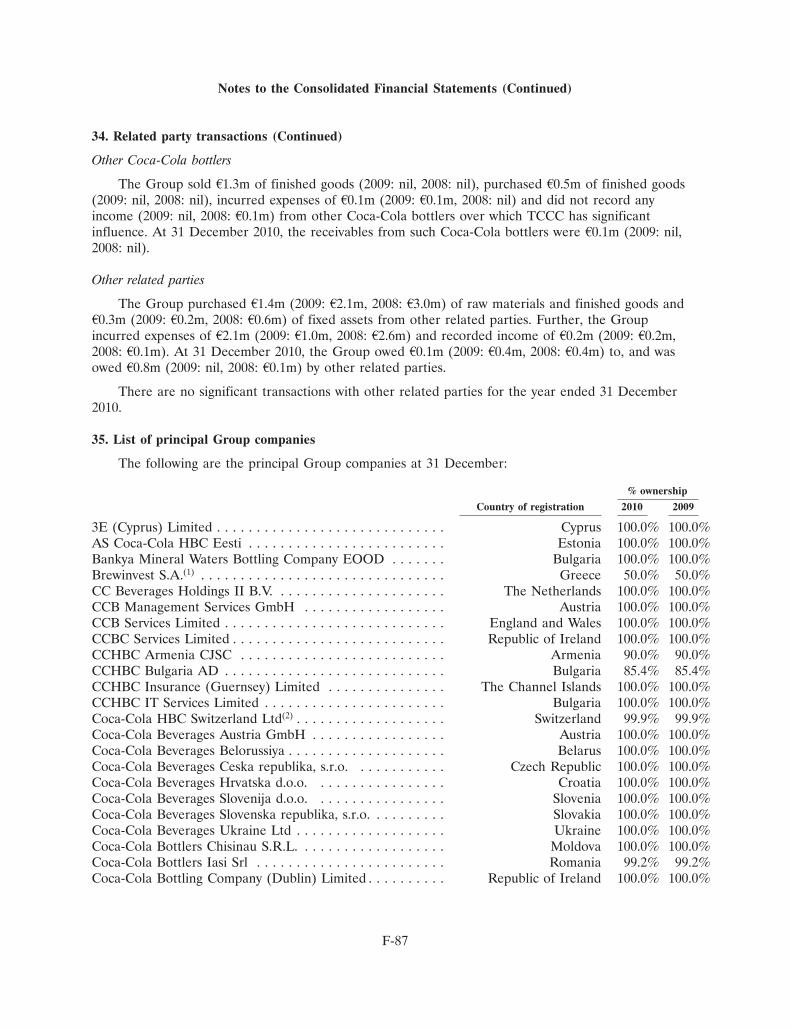
Notes to the Consolidated Financial Statements (Continued)
34. Related party transactions (Continued)
Other Coca-Cola bottlers
The Group sold A1.3m of finished goods (2009: nil, 2008: nil), purchased A0.5m of finished goods(2009: nil, 2008: nil), incurred expenses of A0.1m (2009: A0.1m, 2008: nil) and did not record anyincome (2009: nil, 2008: A0.1m) from other Coca-Cola bottlers over which TCCC has significantinfluence. At 31 December 2010, the receivables from such Coca-Cola bottlers were A0.1m (2009: nil,2008: nil).
Other related parties
The Group purchased A1.4m (2009: A2.1m, 2008: A3.0m) of raw materials and finished goods andA0.3m (2009: A0.2m, 2008: A0.6m) of fixed assets from other related parties. Further, the Groupincurred expenses of A2.1m (2009: A1.0m, 2008: A2.6m) and recorded income of A0.2m (2009: A0.2m,2008: A0.1m). At 31 December 2010, the Group owed A0.1m (2009: A0.4m, 2008: A0.4m) to, and wasowed A0.8m (2009: nil, 2008: A0.1m) by other related parties.
There are no significant transactions with other related parties for the year ended 31 December2010.
35. List of principal Group companies
The following are the principal Group companies at 31 December:
% ownership
Country of registration 2010 2009
3E (Cyprus) Limited . . . . . . . . . . . . . . . . . . . . . . . . . . . . . Cyprus 100.0% 100.0%AS Coca-Cola HBC Eesti . . . . . . . . . . . . . . . . . . . . . . . . . Estonia 100.0% 100.0%Bankya Mineral Waters Bottling Company EOOD . . . . . . . Bulgaria 100.0% 100.0%Brewinvest S.A.(1) . . . . . . . . . . . . . . . . . . . . . . . . . . . . . . . Greece 50.0% 50.0%CC Beverages Holdings II B.V. . . . . . . . . . . . . . . . . . . . . . The Netherlands 100.0% 100.0%CCB Management Services GmbH . . . . . . . . . . . . . . . . . . Austria 100.0% 100.0%CCB Services Limited . . . . . . . . . . . . . . . . . . . . . . . . . . . . England and Wales 100.0% 100.0%CCBC Services Limited . . . . . . . . . . . . . . . . . . . . . . . . . . . Republic of Ireland 100.0% 100.0%CCHBC Armenia CJSC . . . . . . . . . . . . . . . . . . . . . . . . . . Armenia 90.0% 90.0%CCHBC Bulgaria AD . . . . . . . . . . . . . . . . . . . . . . . . . . . . Bulgaria 85.4% 85.4%CCHBC Insurance (Guernsey) Limited . . . . . . . . . . . . . . . The Channel Islands 100.0% 100.0%CCHBC IT Services Limited . . . . . . . . . . . . . . . . . . . . . . . Bulgaria 100.0% 100.0%Coca-Cola HBC Switzerland Ltd(2) . . . . . . . . . . . . . . . . . . . Switzerland 99.9% 99.9%Coca-Cola Beverages Austria GmbH . . . . . . . . . . . . . . . . . Austria 100.0% 100.0%Coca-Cola Beverages Belorussiya . . . . . . . . . . . . . . . . . . . . Belarus 100.0% 100.0%Coca-Cola Beverages Ceska republika, s.r.o. . . . . . . . . . . . Czech Republic 100.0% 100.0%Coca-Cola Beverages Hrvatska d.o.o. . . . . . . . . . . . . . . . . Croatia 100.0% 100.0%Coca-Cola Beverages Slovenija d.o.o. . . . . . . . . . . . . . . . . Slovenia 100.0% 100.0%Coca-Cola Beverages Slovenska republika, s.r.o. . . . . . . . . . Slovakia 100.0% 100.0%Coca-Cola Beverages Ukraine Ltd . . . . . . . . . . . . . . . . . . . Ukraine 100.0% 100.0%Coca-Cola Bottlers Chisinau S.R.L. . . . . . . . . . . . . . . . . . . Moldova 100.0% 100.0%Coca-Cola Bottlers Iasi Srl . . . . . . . . . . . . . . . . . . . . . . . . Romania 99.2% 99.2%Coca-Cola Bottling Company (Dublin) Limited . . . . . . . . . . Republic of Ireland 100.0% 100.0%
F-87
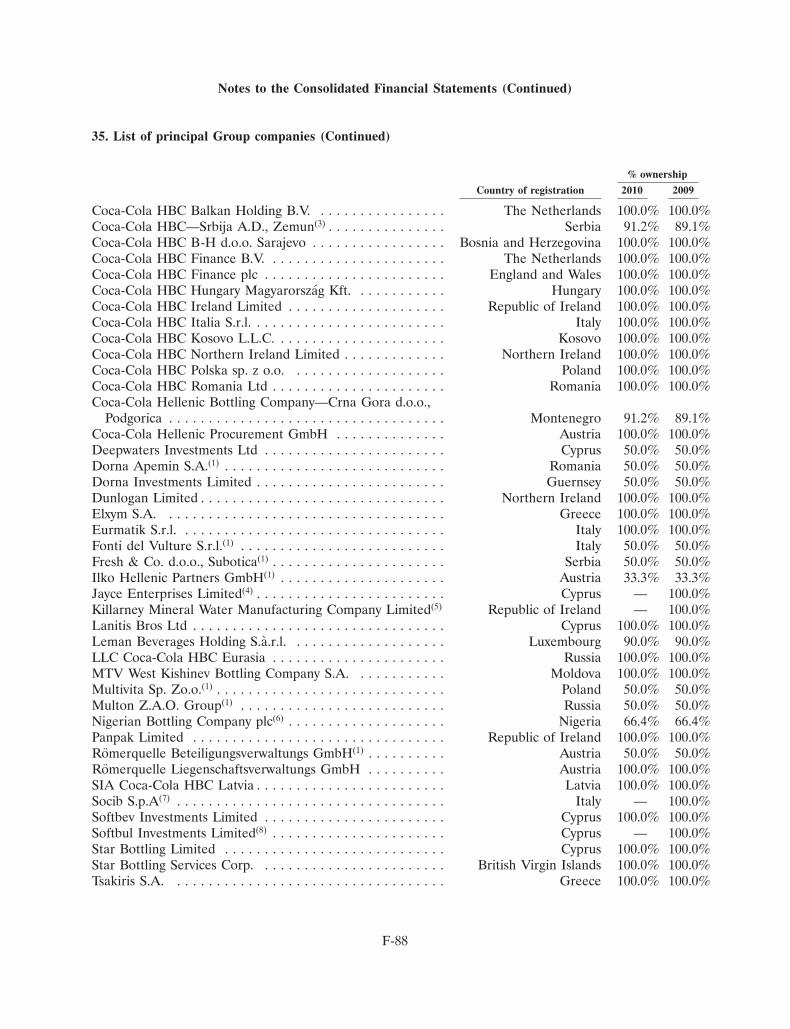
Notes to the Consolidated Financial Statements (Continued)
35. List of principal Group companies (Continued)
% ownership
Country of registration 2010 2009
Coca-Cola HBC Balkan Holding B.V. . . . . . . . . . . . . . . . . The Netherlands 100.0% 100.0%Coca-Cola HBC—Srbija A.D., Zemun(3) . . . . . . . . . . . . . . . Serbia 91.2% 89.1%Coca-Cola HBC B-H d.o.o. Sarajevo . . . . . . . . . . . . . . . . . Bosnia and Herzegovina 100.0% 100.0%Coca-Cola HBC Finance B.V. . . . . . . . . . . . . . . . . . . . . . . The Netherlands 100.0% 100.0%Coca-Cola HBC Finance plc . . . . . . . . . . . . . . . . . . . . . . . England and Wales 100.0% 100.0%Coca-Cola HBC Hungary Magyarorszag Kft. . . . . . . . . . . . Hungary 100.0% 100.0%Coca-Cola HBC Ireland Limited . . . . . . . . . . . . . . . . . . . . Republic of Ireland 100.0% 100.0%Coca-Cola HBC Italia S.r.l. . . . . . . . . . . . . . . . . . . . . . . . . Italy 100.0% 100.0%Coca-Cola HBC Kosovo L.L.C. . . . . . . . . . . . . . . . . . . . . . Kosovo 100.0% 100.0%Coca-Cola HBC Northern Ireland Limited . . . . . . . . . . . . . Northern Ireland 100.0% 100.0%Coca-Cola HBC Polska sp. z o.o. . . . . . . . . . . . . . . . . . . . Poland 100.0% 100.0%Coca-Cola HBC Romania Ltd . . . . . . . . . . . . . . . . . . . . . . Romania 100.0% 100.0%Coca-Cola Hellenic Bottling Company—Crna Gora d.o.o.,
Podgorica . . . . . . . . . . . . . . . . . . . . . . . . . . . . . . . . . . . Montenegro 91.2% 89.1%Coca-Cola Hellenic Procurement GmbH . . . . . . . . . . . . . . Austria 100.0% 100.0%Deepwaters Investments Ltd . . . . . . . . . . . . . . . . . . . . . . . Cyprus 50.0% 50.0%Dorna Apemin S.A.(1) . . . . . . . . . . . . . . . . . . . . . . . . . . . . Romania 50.0% 50.0%Dorna Investments Limited . . . . . . . . . . . . . . . . . . . . . . . . Guernsey 50.0% 50.0%Dunlogan Limited . . . . . . . . . . . . . . . . . . . . . . . . . . . . . . . Northern Ireland 100.0% 100.0%Elxym S.A. . . . . . . . . . . . . . . . . . . . . . . . . . . . . . . . . . . . Greece 100.0% 100.0%Eurmatik S.r.l. . . . . . . . . . . . . . . . . . . . . . . . . . . . . . . . . . Italy 100.0% 100.0%Fonti del Vulture S.r.l.(1) . . . . . . . . . . . . . . . . . . . . . . . . . . Italy 50.0% 50.0%Fresh & Co. d.o.o., Subotica(1) . . . . . . . . . . . . . . . . . . . . . . Serbia 50.0% 50.0%Ilko Hellenic Partners GmbH(1) . . . . . . . . . . . . . . . . . . . . . Austria 33.3% 33.3%Jayce Enterprises Limited(4) . . . . . . . . . . . . . . . . . . . . . . . . Cyprus — 100.0%Killarney Mineral Water Manufacturing Company Limited(5) Republic of Ireland — 100.0%Lanitis Bros Ltd . . . . . . . . . . . . . . . . . . . . . . . . . . . . . . . . Cyprus 100.0% 100.0%Leman Beverages Holding S.a.r.l. . . . . . . . . . . . . . . . . . . . Luxembourg 90.0% 90.0%LLC Coca-Cola HBC Eurasia . . . . . . . . . . . . . . . . . . . . . . Russia 100.0% 100.0%MTV West Kishinev Bottling Company S.A. . . . . . . . . . . . Moldova 100.0% 100.0%Multivita Sp. Zo.o.(1) . . . . . . . . . . . . . . . . . . . . . . . . . . . . . Poland 50.0% 50.0%Multon Z.A.O. Group(1) . . . . . . . . . . . . . . . . . . . . . . . . . . Russia 50.0% 50.0%Nigerian Bottling Company plc(6) . . . . . . . . . . . . . . . . . . . . Nigeria 66.4% 66.4%Panpak Limited . . . . . . . . . . . . . . . . . . . . . . . . . . . . . . . . Republic of Ireland 100.0% 100.0%Romerquelle Beteiligungsverwaltungs GmbH(1) . . . . . . . . . . Austria 50.0% 50.0%Romerquelle Liegenschaftsverwaltungs GmbH . . . . . . . . . . Austria 100.0% 100.0%SIA Coca-Cola HBC Latvia . . . . . . . . . . . . . . . . . . . . . . . . Latvia 100.0% 100.0%Socib S.p.A(7) . . . . . . . . . . . . . . . . . . . . . . . . . . . . . . . . . . Italy — 100.0%Softbev Investments Limited . . . . . . . . . . . . . . . . . . . . . . . Cyprus 100.0% 100.0%Softbul Investments Limited(8) . . . . . . . . . . . . . . . . . . . . . . Cyprus — 100.0%Star Bottling Limited . . . . . . . . . . . . . . . . . . . . . . . . . . . . Cyprus 100.0% 100.0%Star Bottling Services Corp. . . . . . . . . . . . . . . . . . . . . . . . British Virgin Islands 100.0% 100.0%Tsakiris S.A. . . . . . . . . . . . . . . . . . . . . . . . . . . . . . . . . . . Greece 100.0% 100.0%
F-88
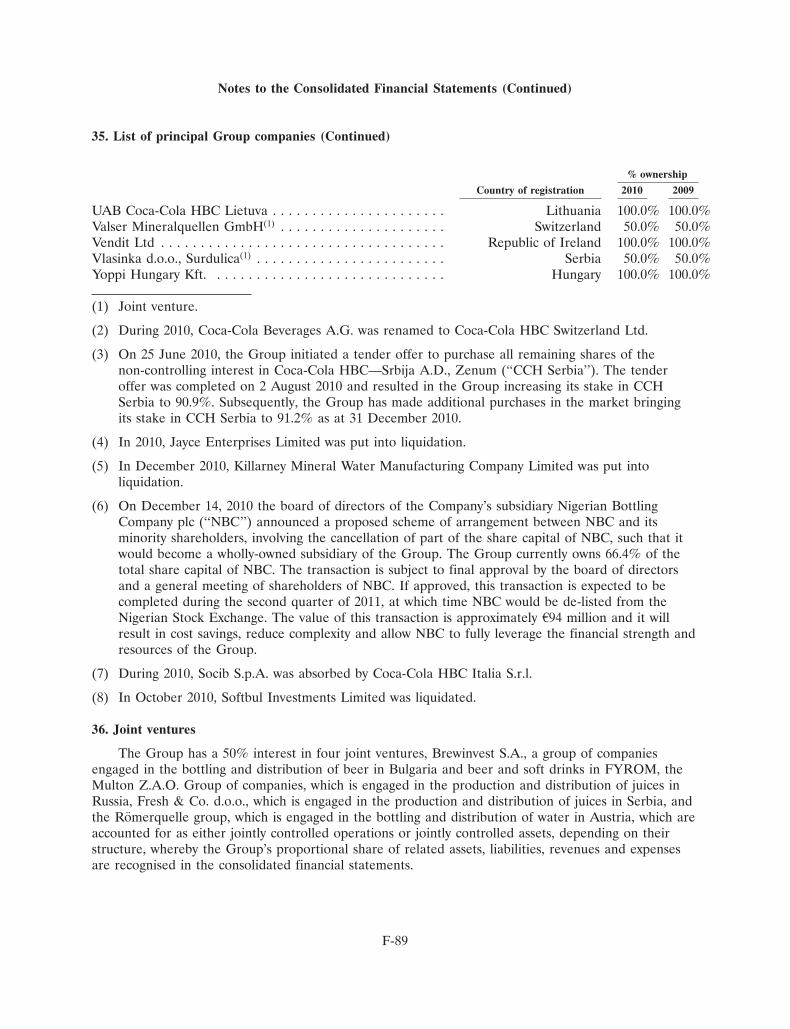
Notes to the Consolidated Financial Statements (Continued)
35. List of principal Group companies (Continued)
% ownership
Country of registration 2010 2009
UAB Coca-Cola HBC Lietuva . . . . . . . . . . . . . . . . . . . . . . Lithuania 100.0% 100.0%Valser Mineralquellen GmbH(1) . . . . . . . . . . . . . . . . . . . . . Switzerland 50.0% 50.0%Vendit Ltd . . . . . . . . . . . . . . . . . . . . . . . . . . . . . . . . . . . . Republic of Ireland 100.0% 100.0%Vlasinka d.o.o., Surdulica(1) . . . . . . . . . . . . . . . . . . . . . . . . Serbia 50.0% 50.0%Yoppi Hungary Kft. . . . . . . . . . . . . . . . . . . . . . . . . . . . . . Hungary 100.0% 100.0%
(1) Joint venture.
(2) During 2010, Coca-Cola Beverages A.G. was renamed to Coca-Cola HBC Switzerland Ltd.
(3) On 25 June 2010, the Group initiated a tender offer to purchase all remaining shares of thenon-controlling interest in Coca-Cola HBC—Srbija A.D., Zenum (‘‘CCH Serbia’’). The tenderoffer was completed on 2 August 2010 and resulted in the Group increasing its stake in CCHSerbia to 90.9%. Subsequently, the Group has made additional purchases in the market bringingits stake in CCH Serbia to 91.2% as at 31 December 2010.
(4) In 2010, Jayce Enterprises Limited was put into liquidation.
(5) In December 2010, Killarney Mineral Water Manufacturing Company Limited was put intoliquidation.
(6) On December 14, 2010 the board of directors of the Company’s subsidiary Nigerian BottlingCompany plc (‘‘NBC’’) announced a proposed scheme of arrangement between NBC and itsminority shareholders, involving the cancellation of part of the share capital of NBC, such that itwould become a wholly-owned subsidiary of the Group. The Group currently owns 66.4% of thetotal share capital of NBC. The transaction is subject to final approval by the board of directorsand a general meeting of shareholders of NBC. If approved, this transaction is expected to becompleted during the second quarter of 2011, at which time NBC would be de-listed from theNigerian Stock Exchange. The value of this transaction is approximately A94 million and it willresult in cost savings, reduce complexity and allow NBC to fully leverage the financial strength andresources of the Group.
(7) During 2010, Socib S.p.A. was absorbed by Coca-Cola HBC Italia S.r.l.
(8) In October 2010, Softbul Investments Limited was liquidated.
36. Joint ventures
The Group has a 50% interest in four joint ventures, Brewinvest S.A., a group of companiesengaged in the bottling and distribution of beer in Bulgaria and beer and soft drinks in FYROM, theMulton Z.A.O. Group of companies, which is engaged in the production and distribution of juices inRussia, Fresh & Co. d.o.o., which is engaged in the production and distribution of juices in Serbia, andthe Romerquelle group, which is engaged in the bottling and distribution of water in Austria, which areaccounted for as either jointly controlled operations or jointly controlled assets, depending on theirstructure, whereby the Group’s proportional share of related assets, liabilities, revenues and expensesare recognised in the consolidated financial statements.
F-89
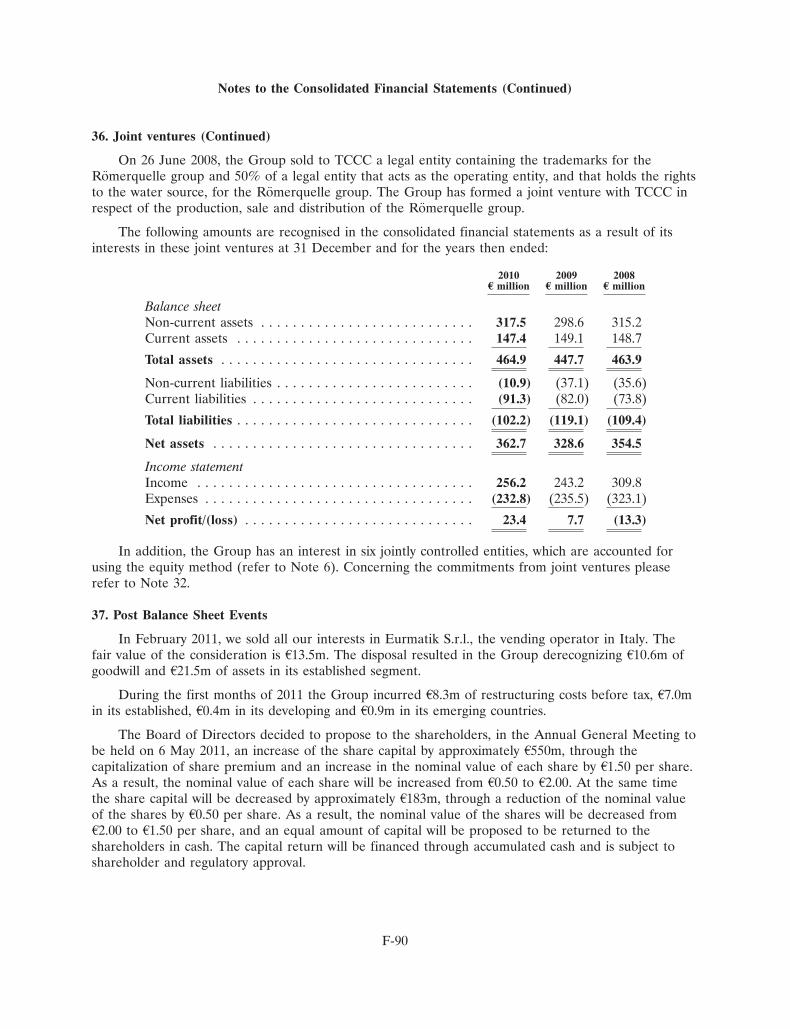
Notes to the Consolidated Financial Statements (Continued)
36. Joint ventures (Continued)
On 26 June 2008, the Group sold to TCCC a legal entity containing the trademarks for theRomerquelle group and 50% of a legal entity that acts as the operating entity, and that holds the rightsto the water source, for the Romerquelle group. The Group has formed a joint venture with TCCC inrespect of the production, sale and distribution of the Romerquelle group.
The following amounts are recognised in the consolidated financial statements as a result of itsinterests in these joint ventures at 31 December and for the years then ended:
2010 2009 2008E million E million E million
Balance sheetNon-current assets . . . . . . . . . . . . . . . . . . . . . . . . . . . 317.5 298.6 315.2Current assets . . . . . . . . . . . . . . . . . . . . . . . . . . . . . . 147.4 149.1 148.7
Total assets . . . . . . . . . . . . . . . . . . . . . . . . . . . . . . . . 464.9 447.7 463.9
Non-current liabilities . . . . . . . . . . . . . . . . . . . . . . . . . (10.9) (37.1) (35.6)Current liabilities . . . . . . . . . . . . . . . . . . . . . . . . . . . . (91.3) (82.0) (73.8)
Total liabilities . . . . . . . . . . . . . . . . . . . . . . . . . . . . . . (102.2) (119.1) (109.4)
Net assets . . . . . . . . . . . . . . . . . . . . . . . . . . . . . . . . . 362.7 328.6 354.5
Income statementIncome . . . . . . . . . . . . . . . . . . . . . . . . . . . . . . . . . . . 256.2 243.2 309.8Expenses . . . . . . . . . . . . . . . . . . . . . . . . . . . . . . . . . . (232.8) (235.5) (323.1)
Net profit/(loss) . . . . . . . . . . . . . . . . . . . . . . . . . . . . . 23.4 7.7 (13.3)
In addition, the Group has an interest in six jointly controlled entities, which are accounted forusing the equity method (refer to Note 6). Concerning the commitments from joint ventures pleaserefer to Note 32.
37. Post Balance Sheet Events
In February 2011, we sold all our interests in Eurmatik S.r.l., the vending operator in Italy. Thefair value of the consideration is A13.5m. The disposal resulted in the Group derecognizing A10.6m ofgoodwill and A21.5m of assets in its established segment.
During the first months of 2011 the Group incurred A8.3m of restructuring costs before tax, A7.0min its established, A0.4m in its developing and A0.9m in its emerging countries.
The Board of Directors decided to propose to the shareholders, in the Annual General Meeting tobe held on 6 May 2011, an increase of the share capital by approximately A550m, through thecapitalization of share premium and an increase in the nominal value of each share by A1.50 per share.As a result, the nominal value of each share will be increased from A0.50 to A2.00. At the same timethe share capital will be decreased by approximately A183m, through a reduction of the nominal valueof the shares by A0.50 per share. As a result, the nominal value of the shares will be decreased fromA2.00 to A1.50 per share, and an equal amount of capital will be proposed to be returned to theshareholders in cash. The capital return will be financed through accumulated cash and is subject toshareholder and regulatory approval.
F-90
Notes to the Consolidated Financial Statements (Continued)
37. Post Balance Sheet Events (Continued)
On 28 February 2011 the Group announced the successful offering by Coca-Cola HBCFinance B.V. (the ‘‘Issuer’’) of an additional A300m 4.25% fixed rate notes due 16 November 2016 andguaranteed by the Group (the ‘‘New Notes’’). The New Notes shall be consolidated and form a singleseries with the existing A300m 4.25% fixed rate notes due 16 November 2016 issued on 16 November2009. The proceeds of the issue will be used to repay the outstanding balance of the A500m 4.375%fixed rate guaranteed notes issued by the Issuer and guaranteed by the Group, which mature on 15 July2011, and thereby extend the Group’s overall debt maturity profile. The transaction was settled on2 March 2011.
F-91
Related Documents