April 2013 Foreign Exchange Risk Management: Perspectives From Financial Executives

Welcome message from author
This document is posted to help you gain knowledge. Please leave a comment to let me know what you think about it! Share it to your friends and learn new things together.
Transcript
April 2013
Foreign Exchange Risk Management:
Perspectives From Financial Executives

Defining and Understanding FX Risk

Defining and Understanding FX Risk – Survey results
Overview of Survey Results:
What is clear according to this study* by the Canadian Financial Executives Research Foundation (CFERF) is that foreign exchange risk is a major issue
In fact, 90% of organizations surveyed rated foreign exchange management as an important consideration in their business
Canadian businesses continue to adapt to an increasingly complex currency universe
For most organizations, foreign exchange risk – and its management are challenges for which there exists an emerging and ever-more sophisticated set of policies, procedures and tools
*The Foreign exchange risk management: Perspectives from financial executives report is based on the results of an online survey that took place between November 26, 2012 and January 3, 2013, during which time 109 respondents completed the survey.

Defining and Understanding FX risk: Survey Results
Overview of Survey Results: Three out of four respondents reported
some percentage of their revenue is denominated in foreign currency
17% reported that 76% to 100% of revenue is denominated in a foreign currency
Export credit agency Export Development Canada noted in a recent foreign exchange white paper that Canadian companies that are active in international markets view volatility in the Canadian dollar as the number one constraint to growing exports
The CFERF foreign exchange risk management study similarly found that organizations consider the management of FX risk to be a critical task
More than two-thirds of respondents (68%) rated foreign exchange management ‘extremely important’ or ‘important.’ Just 10% rated FX management ‘not at all important.’
However, only about half actually had a policy or procedure in place to manage risk
What Percentage of Revenue Comes From Foreign-Denominated Currency?
25%
18%
13%
10%
9%
8%
17%
0% 5% 10% 15% 20% 25% 30%
None
1-5%
6-15%
16-25%
26-50%
51-75%
76-100%
Defining and Understanding FX Risk
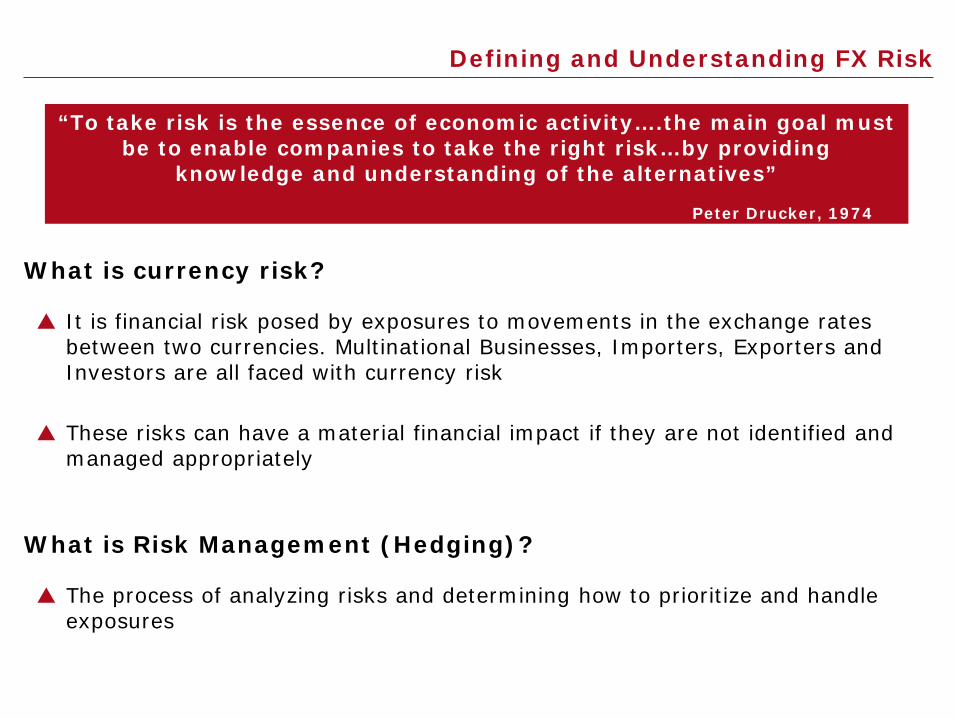
What is currency risk?
It is financial risk posed by exposures to movements in the exchange rates between two currencies. Multinational Businesses, Importers, Exporters and Investors are all faced with currency risk
These risks can have a material financial impact if they are not identified and managed appropriately
What is Risk Management (Hedging)?
The process of analyzing risks and determining how to prioritize and handle exposures
“To take risk is the essence of economic activity….the main goal must be to enable companies to take the right risk…by providing
knowledge and understanding of the alternatives”
Peter Drucker, 1974
Defining and Understanding FX Risk
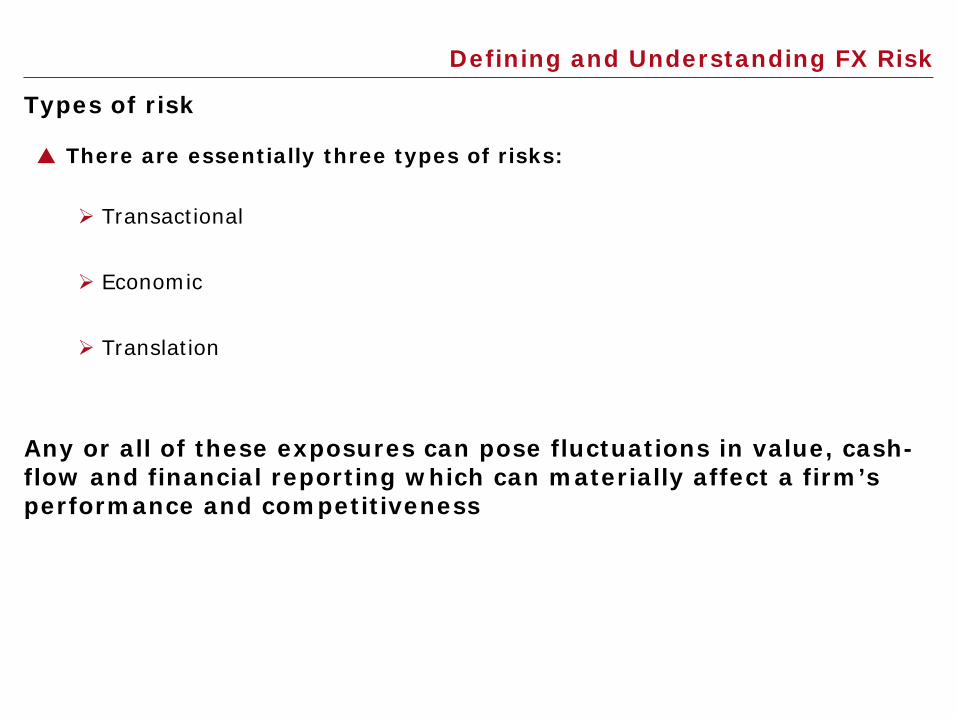
Types of risk
There are essentially three types of risks: Transactional
Economic
Translation
Any or all of these exposures can pose fluctuations in value, cash-flow and financial reporting which can materially affect a firm’s performance and competitiveness

Defining and Understanding FX Risk
Before market risk can be managed it must be understood
Identify: What market risks is the company exposed to, directly and
indirectly?
Where do the market risks impact the business?
What impacts the amount of exposure the company has?
Quantify:
What is the impact of unfavorable market moves on the company?
Expectations of the market risk impact depends upon:
The forecasted exposure
The expected/potential market rates
Defining and Understanding FX Risk: USD/CAD Market Conditions
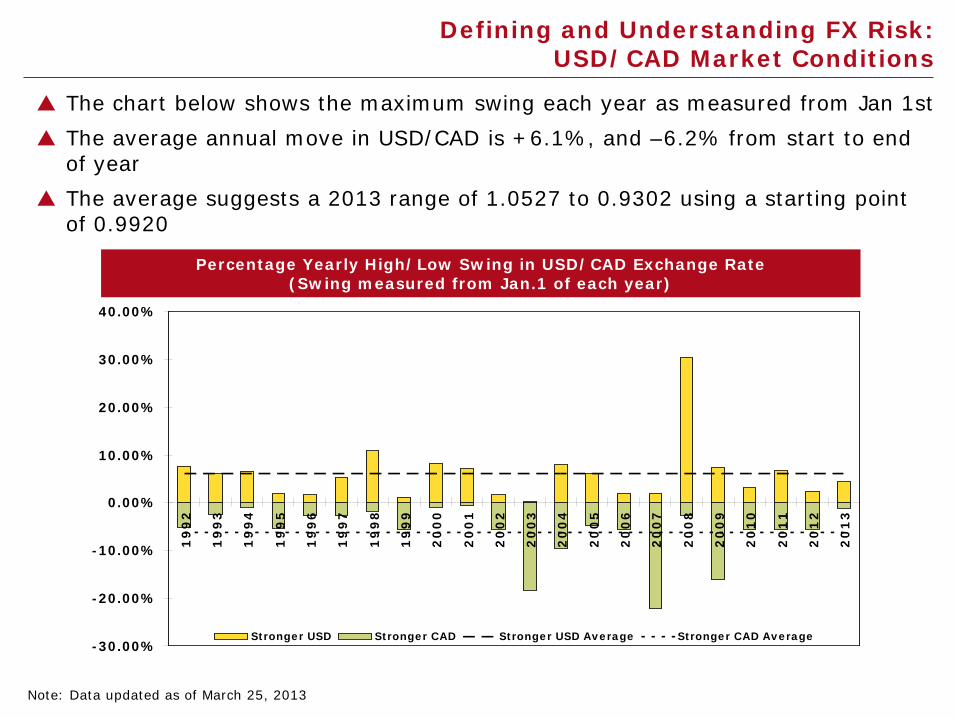
The chart below shows the maximum swing each year as measured from Jan 1st The average annual move in USD/CAD is +6.1%, and –6.2% from start to end
of year The average suggests a 2013 range of 1.0527 to 0.9302 using a starting point
of 0.9920
Percentage Yearly High/Low Swing in USD/CAD Exchange Rate(Swing measured from Jan. 1 of each year)
19
92
19
93
19
94
19
95
19
96
19
97
19
98
19
99
20
00
20
01
20
02
20
03
20
04
20
05
20
06
20
07
20
08
20
09
20
10
20
11
20
12
20
13
-30.00%
-20.00%
-10.00%
0.00%
10.00%
20.00%
30.00%
40.00%
Stronger USD Stronger CAD Stronger USD Average Stronger CAD Average
Percentage Yearly High/Low Swing in USD/CAD Exchange Rate (Swing measured from Jan.1 of each year)
Note: Data updated as of March 25, 2013

Defining and Understanding FX Risk: USD/CAD Market Conditions
Has the Canadian Dollar stabilized?
The “Risk on – Risk off” pattern is expected to continue with uncertainty in Europe and escalating risks of a global slowdown
Financial markets volatility is expected to continue
0.90
1.00
1.10
1.20
1.30
1.40
1.50
1.60
1.70
Mar
-75
Mar
-77
Mar
-79
Mar
-81
Mar
-83
Mar
-85
Mar
-87
Mar
-89
Mar
-91
Mar
-93
Mar
-95
Mar
-97
Mar
-99
Mar
-01
Mar
-03
Mar
-05
Mar
-07
Mar
-09
Mar
-11
Mar
-13
9 years
6 years
10.5 years
5.1 years
1 year
1.4 years
2.0 years
CAD per USD Historical Exchange Rate
0.00%
5.00%
10.00%
15.00%
20.00%
25.00%
Mar
-95
Mar
-96
Mar
-97
Mar
-98
Mar
-99
Mar
-00
Mar
-01
Mar
-02
Mar
-03
Mar
-04
Mar
-05
Mar
-06
Mar
-07
Mar
-08
Mar
-09
Mar
-10
Mar
-11
Mar
-12
Mar
-13
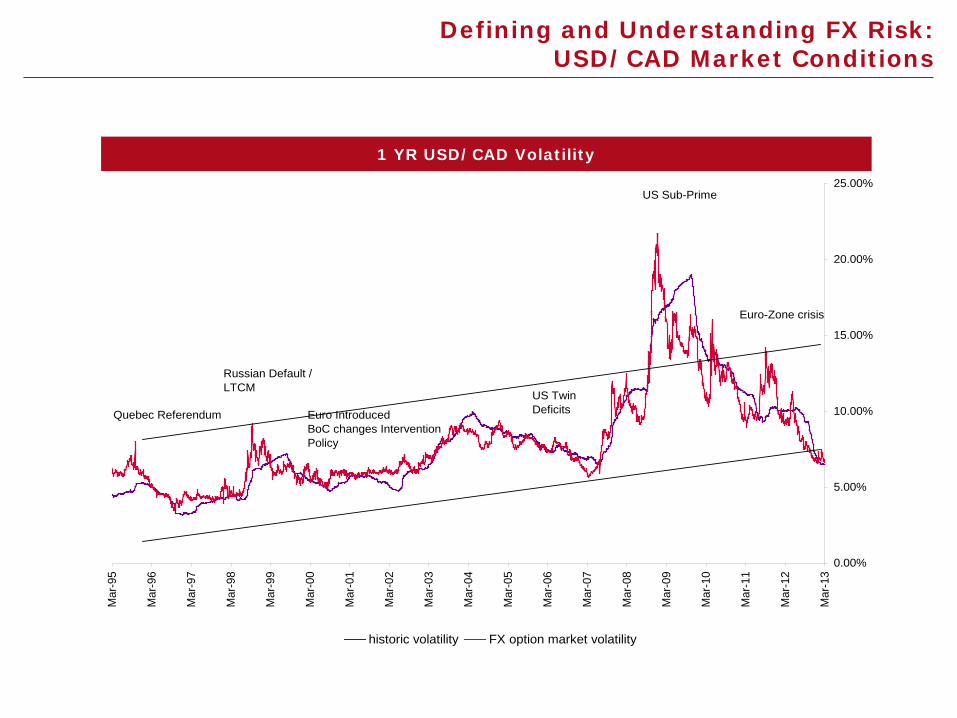
historic volatility FX option market volatility
Quebec Referendum
US Sub-Prime
US Twin DeficitsEuro Introduced
BoC changes Intervention Policy
Russian Default / LTCM
Euro-Zone crisis
Defining and Understanding FX Risk: USD/CAD Market Conditions
1 YR USD/CAD Volatility

Defining and Understanding FX Risk
Common ways to measure risk:
Notional (dollar) amount Forecasted exposure necessary for any risk measure
Simple
Doesn’t tell you about implications to financial results
Sensitivity to a static move (e.g. 10% or 1 cent move) Gives you a gauge
Doesn’t tell you what is likely
Market forecast/view (e.g. future expectations of economists) Directional prediction of what will happen
Someone’s opinion based on information currently available
Volatility measures (e.g. EBITDA at risk) Provides you with a probability based on market price of risk – view neutral
A little more complex to model and calculate

0.9500
0.9700
0.9900
1.0100
1.0300
1.0500
1.0700
3/4/2013 Q1 2013 Q2 2013 Q3 2013 Q4 2013 Q1 2014 Q2 2014 Q4 2013 Q4 2013
CIBC TD BNS Royal BMO AVG
Canadian Multi-Bank Economist Forecasts
Q1 2013 Q2 2013 Q3 2013 Q4 2013 Q1 2014 Q2 2014 Q4 2013 Q4 2013
CIBC 1.0300 1.0500 1.0400 1.0300 1.0100 0.9800 0.9600 0.9800TD 1.0000 1.0000 0.9900 0.9800 0.9800 0.9800 0.9700 0.9700
BNS 1.0400 1.0400 1.0200 1.0100 1.0100 1.0000 1.0000 0.9900Royal 1.0200 1.0400 1.0500 1.0400 1.0300 1.0200 1.0200 1.0200BMO 1.0090 1.0440 1.0290 1.0070 0.9970 0.9920 0.9870 0.9820AVG 1.0198 1.0348 1.0258 1.0134 1.0054 0.9944 0.9874 0.9884

Defining and Understanding FX Risk
Some key questions to address
What is the company’s appetite for uncertainty?
What outcomes/aspects of the business are we trying to protect?
What potential impact can the business withstand?
For how long does the business need to be protected? How long to adjust the business?
What are competitors doing?

Defining and Understanding FX Risk
How has your company’s focus on FX risk changed in the last five years?
Panel Discussion

Doing Business In Emerging Markets

Doing Business In Emerging Markets
Emerging Markets
Global FX market turnover grew 20% in 2010 vs 2007, with average daily volume of US$4.0 trillion. The increase was driven by a 48% jump in spot transactions, which represent 37% of total FX turnover. (Source: BIS)
USD (85%), EUR (39%), and JPY (19%) hold the dominant market share of daily turnover, although significant increases have been seen in the Chinese Renminbi, Turkish Lira, Brazilian Real, and Korean Won. Each hold around a 1% share (CAD accounts for 5.3%)
FX markets have become more global, with cross-border dealer transactions accounting for 65% of trading activity, while local dealer transactions represent 35%, it’s lowest share ever
The Canadian government and industry groups have encouraged Canadian companies to lessen their dependence on the US market to expand their trade opportunities into emerging markets. These countries continue to seek new sources of natural resources and goods to further their industrial and infrastructure development
FEI survey shows 42% of respondents are doing business in an emerging market country

Doing Business In Emerging Markets
Growth in Swift Payments
While the Euro has seen its share slip, it remains the dominant currency in international SWIFT payments
The US dollar has increased, partly due to its role in payments to emerging market countries
While still very small, the Chinese Yuan has risen to 13th place, with a 171% increase from Jan 2012 to Jan 2013. The growth is due to falling government trade restrictions and businesses growing in size where they are no longer reliant on the US dollar
Swift Payments
0 0.1 0.2 0.3 0.4 0.5
NZD – New Zealand Dollar
ZAR – South African Rand
RUB – Russian Rouble
DKK – Danish Krone
CNY – Chinese Yuan
NOK – Norwegian Krone
THB – Thai Baht
SEK – Swedish Krone
HKD – Hong Kong Dollar
SGD – Singapore Dollar
CAD – Canadian Dollar
CHF – Swiss Franc
AUD – Australian Dollar
JPY – Japanese Yen
GBP – British Pound
USD – US Dollar
EUR – Euro
0.6%
33.5%
39.9%
Jan 2013 Jan 2012

Doing Business In Emerging Markets
Chinese Renminbi (CNY vs. CNH)
CNY (onshore) is restricted to trading by entities registered in China. It is convertible under certain conditions and trades within a set trading range
CNH (offshore) is the same as CNY, but free floating and deliverable. CNH has gained in popularity as markets are more transparent, have less restrictive delivery and trading hours, and there are a greater number of investment products and growing bond market “Dim Sum Bonds”
As trading in CNH has grown and market acceptance increased, the spread between CNY and CNH has converged, moving spot spread close to zero
12 month Onshore vs Offshore Fwd vs NDF
6.25
6.30
6.35
6.40
6.45
6.50
6.55
Jan-11 Apr-11 Jul-11 Oct-11 Jan-12 Apr-12 Jul-12 Oct-12 Jan-13 Apr-13
NDFOnshoreOffshore

Source: BIS, Bloomberg. and CIBC World Markets
20
40
60
80
100
120
140
160
180
200
Dec-05 Dec-06 Dec-07 Dec-08 Jan-10 Jan-11 Jan-12 Feb-13
Real Exchange Rate Index Dec 2002 =100
Argentina
Brazil
Mexico
Colombia
Peru
Chile
Venezuela
LATAM Currencies: Brazil Strongest, Mexico Weakest

Source: BIS, Bloomberg. and CIBC World Markets
50
70
90
110
130
150
170
190
210
Dec-05 Jul-06 Mar-07 Oct-07 Jun-08 Jan-09 Sep-09 May-10 Dec-10 Aug-11 Mar-12
Real Exchange Rate Index2010=100
Argentina
Brazil
Mexico
Turkey
Hungary
Phillipines
EM Currency performance has been mixed

Doing Business in Emerging Markets
Managing EM FX Risk
Widely accepted practice of using a proxy currency which is more predictable and has no restrictions
Often use foreign currency accounts to manage flows in local currencies
How Do You Manage Exposure To Emerging Markets Currencies?
9%
15%
17%
22%
37%
0% 20% 40%
Other
Combination of dealing incurrency and using proxy
Deal directly in thecurrency
Products such as forwardcontracts, non-deliverableforward contracts, options
Use proxy e.g. USD, EURO, AUD
Doing Business In Emerging Markets
How does your FX Policy differ for G10 vs. EM currencies?
Is there pressure to deal in local currency vs. a proxy?
Panel Discussion
FX Risk in Action

FX Risk in Action: Who’s in Charge?
Who’s responsible for FX Risk Management?
Survey clearly shows that the Finance Dept. has the responsibility for recommending and implementing policies and procedures
In the majority of companies surveyed (54%) said the CFO was accountable; followed by the VP Finance/Director of Finance (24%) and Treasurer (19%) depending on the size and structure of the company
Most companies have multiple levels of monitoring and compliance within their organization
Risk Committee is responsible for evaluating the transactional elements of risk management in the firm
Senior Management is responsible for evaluating the performance of their policy, deciding when or when not to hedge and ensuring their policy is in line with the needs of the business
Ultimately the Board of Directors approves the overall direction of the policy and ensures management is in compliance
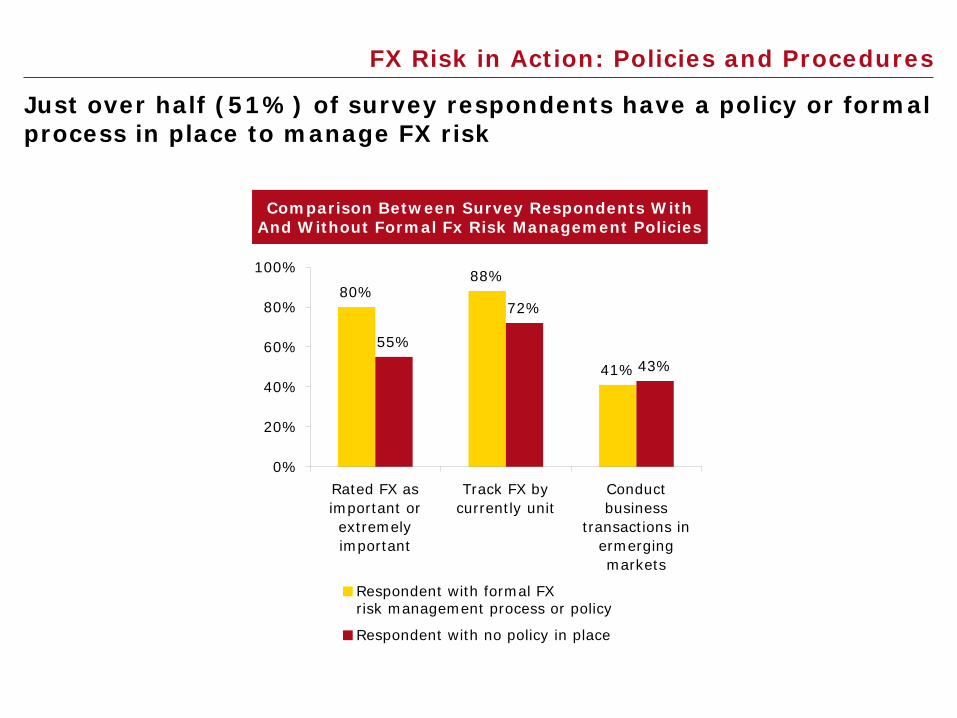
FX Risk in Action: Policies and Procedures
Just over half (51%) of survey respondents have a policy or formal process in place to manage FX risk
80%88%
41%
55%
72%
43%
0%
20%
40%
60%
80%
100%
Rated FX asimportant orextremelyimportant
Track FX bycurrently unit
Conductbusiness
transactions inermergingmarkets
Respondent with formal FX risk management process or policy
Respondent with no policy in place
Comparison Between Survey Respondents With And Without Formal Fx Risk Management Policies
FX Risk in Action: Why Establish a FX Hedging Policy?
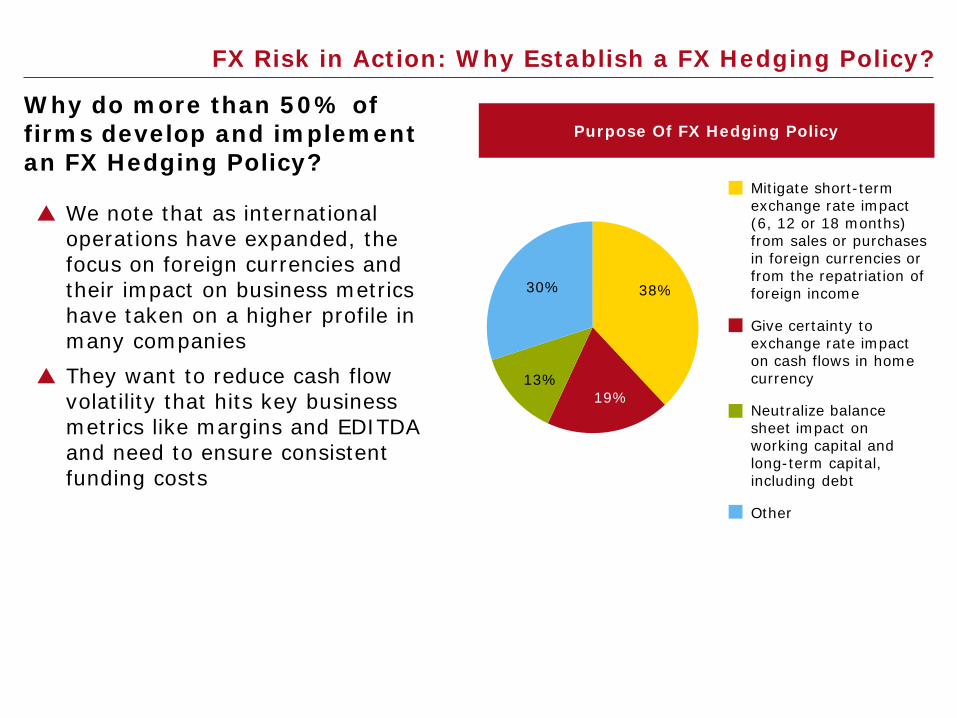
Why do more than 50% of firms develop and implement an FX Hedging Policy?
We note that as international operations have expanded, the focus on foreign currencies and their impact on business metrics have taken on a higher profile in many companies
They want to reduce cash flow volatility that hits key business metrics like margins and EDITDA and need to ensure consistent funding costs
19%13%
30% 38%
Purpose Of FX Hedging Policy
Mitigate short-term exchange rate impact (6, 12 or 18 months) from sales or purchases in foreign currencies or from the repatriation of foreign income
Give certainty to exchange rate impact on cash flows in home currency
Neutralize balance sheet impact on working capital and long-term capital, including debt
Other

FX Risk in Action: Instruments to Mitigate Risk
As confirmed by the study, the majority of firms hedge their exposures with the use of financial instruments
Companies recognize that any exposure not naturally hedged may need to be managed by way of a derivative instrument
Financial Instruments Used To Mitigate Risk
15%
8%
13%
23%
41%
0% 20% 40% 60%
Other
Foreign Exchange Swaps
Currency options (vanillaoptions or structures)
Futures contracts (exchangetraded contracts that allow youto buy or sell a currency at aset exchange rate in a given
month)
Forwards (OTC agreements tobuy or sell a given amount of a
currency at a set exchangerate on a specific future date)

FX Risk in Actions: Risk and Reward
Derivative Products change a company’s risk profile and have differing risk/reward characteristics Let it float
Exchange in the spot market Lock it in
Fixed price forward contract Insure it
Purchased option Combination of lock it in and insure – Option based strategies with different
risk/reward scenarios Collar Expandable Forward Ratio Collar Variable Rate Forward
Structured Hedging Solutions Structured solutions can be designed to provide either perfect or partial protection
while allowing for participation in a potentially favourable spot movement Certain strategies are designed to “boost” the forward rate available and can be
tailored to take into account the client’s risk appetite and/or market views. e.g. At-Maturity Variable Rate Forward, Conditional Forward, Fade-In Forward
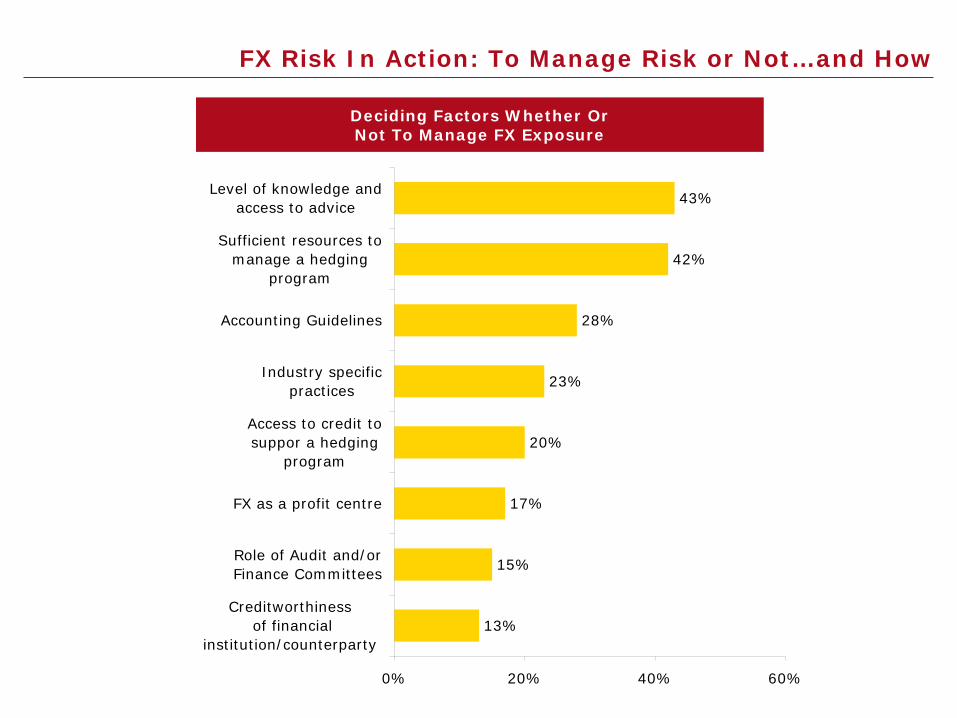
FX Risk In Action: To Manage Risk or Not…and How
Deciding Factors Whether Or Not To Manage FX Exposure
13%
15%
17%
20%
23%
28%
42%
43%
0% 20% 40% 60%
Creditworthiness of financial
institution/counterparty
Role of Audit and/orFinance Committees
FX as a profit centre
Access to credit tosuppor a hedging
program
Industry specificpractices
Accounting Guidelines
Sufficient resources tomanage a hedging
program
Level of knowledge andaccess to advice

FX Risk In Action: To Manage Risk or Not…and How
Observations:
Public companies are more concerned with accounting treatment/Income Statement volatility and therefore favour simple strategies like Forward Contracts. The FEI survey has 64% of companies using either OTC Forwards or Exchange traded futures contracts
Private companies are more open to alternative hedging strategies. Focus is more on economic performance than reducing Income Statement volatility
Lack of knowledge has kept some companies from using option based strategies
An increase in market volatility often attracts more companies to structured option hedges because of their relative attractiveness to simple forward contracts and futures
In the Emerging Markets space, companies with formal FX policies typically hedge more of their exposures but also shy away from the more volatile local currency in favour of proxy currencies such as the USD, EUR and AUD
Those without a formal policy are typically more risk accepting. This is demonstrated by the reduced use of hedging products (9% vs. 35% for those with a policy) and the likeliness of trading in the local currency (22% vs. 13%)
PERSPECTIVE Canadian Dollar Parity, Boon or Hindrance?
Benjamin Tal
Deputy Chief Economist, CIBC

Central Banks Diversify into Broader FX Reserves
0
100
200
300
400
500
600
2000 2002 2004 2006 2008 2010
Reserves of ReportingCentral Banks*Esimate: Global Reserves
Official FX Reserves excl. US$, sterling, Swiss franc, euro & yen (in bns of USD)
*covers roughly 60% of world official FX
Source: IMF, CIBC
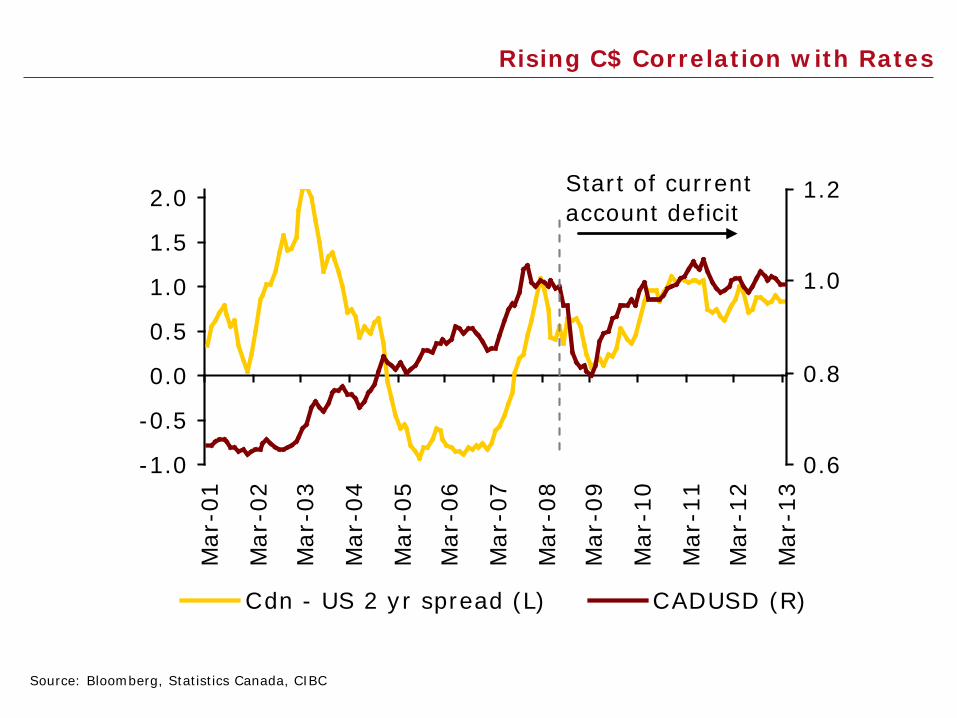
Rising C$ Correlation with Rates
Source: Bloomberg, Statistics Canada, CIBC
-1.0
-0.5
0.0
0.5
1.0
1.5
2.0M
ar-0
1
Mar
-02
Mar
-03
Mar
-04
Mar
-05
Mar
-06
Mar
-07
Mar
-08
Mar
-09
Mar
-10
Mar
-11
Mar
-12
Mar
-13
0.6
0.8
1.0
1.2
Cdn - US 2 yr spread (L) CADUSD (R)
Start of currentaccount deficit

Estimated Currency Over/Undervaluation*
-15%
-10%
-5%
0%
5%
10%
15%
Indo
nesi
a
Japa
n
Ger
man
y
Chin
a
Indi
a
Thai
land
S Af
rica
Kore
a
Mex
ico
Euro
Are
a
Braz
il
USA
Switz
erl. UK
Cana
da
Aust
ralia
Spai
n
Overvaluation/undervaluation (%)
*relative to each country's trading partners; midpoint of estimated
range
Source: IMF, BIS, CIBC

The Lost Decade
Source: Statistics Canada, CIBC
Canadian Export Vol. Index (2007=100)
6065707580859095
100105110
97 99 01 03 05 07 09 11
US$/C$ 11%
US$/C$ 35%
US$/C$ 5%

Exchange Rate Vulnerability Index
INDUSTRY Export Import Combined Ranked ByVulnerability Vulnerability Export-Import Total
(% of shpts. Exported (% of shpts. to Can. Mkt) x Vulnerability Vulnerabilityless Imported inputs) (import penetration of Can. Mkts.)
H Furniture 46.2 35.8 82.0 1I Machinery 60.4 12.2 72.6 2G Wood Products 62.1 5.9 68.0 3H Electrical Equipment 32.3 35.7 68.0 4
Paper Manufacturing 57.9 5.7 63.6 5M Computer & Electronics 45.5 11.1 56.6 6E Primary Metals 35.1 10.6 45.7 7D Transportation Equipment 36.6 6.5 43.1 8I Fabricated Metals 13.7 27.9 41.6 9U Printing & Allied -0.9 34.1 33.2 10M Clothing 13.5 18.6 32.1 11
Chemical Manufacturing 25.4 6.3 31.7 12L Food Manufacturing 11.8 15.3 27.1 13O Textiles 2.9 21.9 24.8 14W Beverages/Tobacco 4.0 11.9 15.9 15
Petroleum Refining & Coal Prod -12.1 5.3 -6.8 16

No Clear Correlation Between Dollar Sensitivity and GDP Performance
High vulnerability Low vulnerability
Source: Statistics Canada, CIBC
-7-6-5-4-3-2-10123
-20 0 20 40 60 80 100Index of $ vulnerability
furniture
machinery
wood products
electricalequip.
paper mfg
chemicalmfgtextiles
beverages/tobacco
food mfgpetroleum/
coal
Avg
ann
ual G
DP
% g
row
th (
07-1
2)
transp.equip.
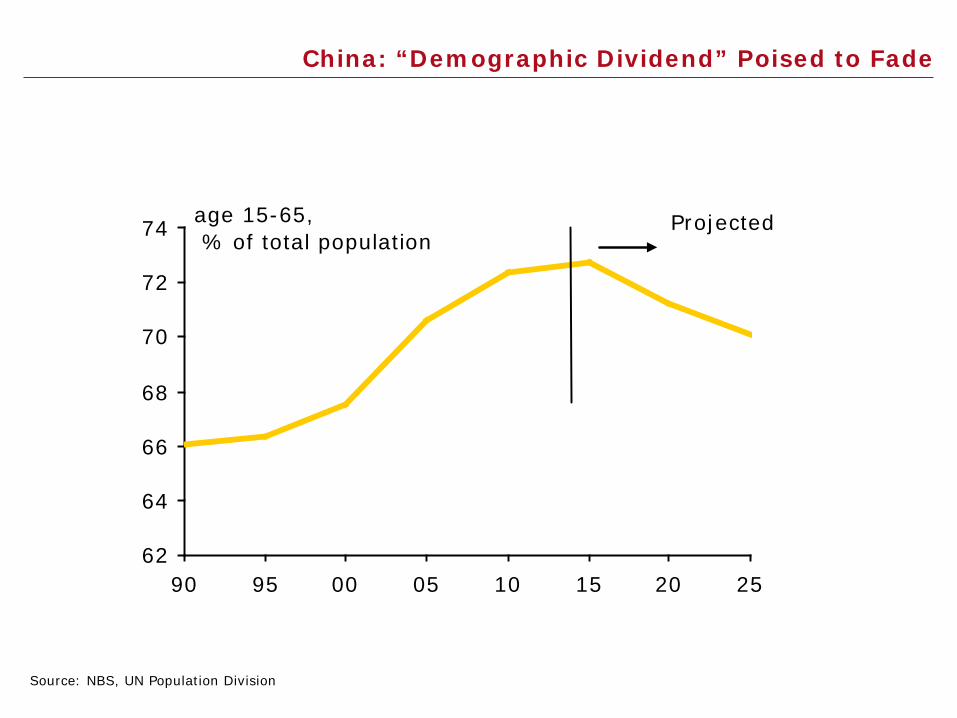
China: “Demographic Dividend” Poised to Fade
Source: NBS, UN Population Division
62
64
66
68
70
72
74
90 95 00 05 10 15 20 25
age 15-65, % of total population
Projected
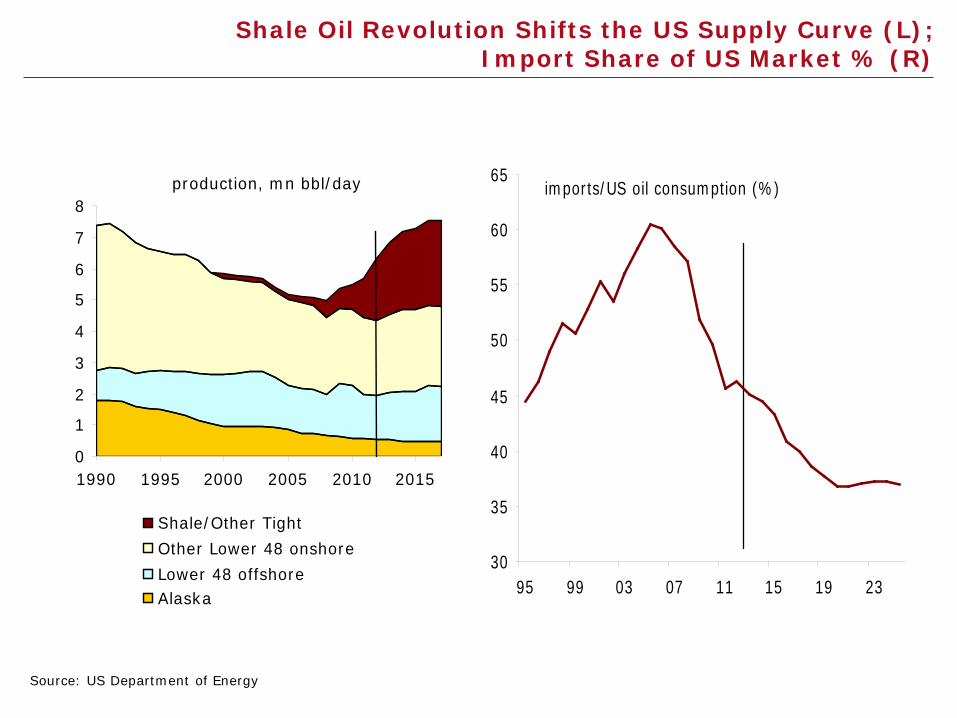
Source: US Department of Energy
Shale Oil Revolution Shifts the US Supply Curve (L); Import Share of US Market % (R)
0
1
2
3
4
5
6
7
8
1990 1995 2000 2005 2010 2015
Shale/Other TightOther Lower 48 onshoreLower 48 offshoreAlaska
production, mn bbl/day
30
35
40
45
50
55
60
65
95 99 03 07 11 15 19 23
imports/US oil consumption (%)
Conclusion

Conclusion
In conclusion, the research study shows that Canadian companies are embracing the need to expand their businesses beyond our borders and deal with the currency risks that come with that strategy. Therefore, Foreign Exchange risk management needs to be part of a Canadian company's international growth strategy.
Because only half of the organizations surveyed have a policy or formal process in place to manage FX risk, it appears there's a need for Canadian businesses to take a more comprehensive, pro-active approach to managing these material risks.
Related Documents


