Page 2 of 17 For The Cleta Harder Developmental School Address: 981 N. Euclid St., La Habra, CA 90631 Phone: 562-694-5655 Program Specialist: Christopher Beswick Grade Span: 1-Transition By February 1 of each year, every school in California is required by state law to publish a School Accountability Report Card (SARC). The SARC contains information about the condition and performance of each California public school. Under the Local Control Funding Formula (LCFF) all local educational agencies (LEAs) are required to prepare a Local Control and Accountability Plan (LCAP), which describes how they intend to meet annual school-specific goals for all pupils, with specific activities to address state and local priorities. Additionally, data reported in an LCAP is to be consistent with data reported in the SARC. ➢ For more information about SARC requirements, see the California Department of Education (CDE) SARC Web page at http://www.cde.ca.gov/ta/ac/sa/. ➢ For more information about the LCFF or LCAP, see the CDE LCFF Web page at http://www.cde.ca.gov/fg/aa/lc/. ➢ For additional information about the school, parents/guardians and community members should contact the school principal or the district office. DataQuest DataQuest is an online data tool located on the CDE DataQuest Web page at http://dq.cde.ca.gov/dataquest/ that contains additional information about this school and comparisons of the school to the district and the county. Specifically, DataQuest is a dynamic system that provides reports for accountability (e.g., test data, enrollment, high school graduates, dropouts, course enrollments, staffing, and data regarding English learners). Internet Access Internet access is available at public libraries and other locations that are publicly accessible (e.g., the California State Library). Access to the Internet at libraries and public locations is generally provided on a first-come, first-served basis. Other use restrictions may include the hours of operation, the length of time that a workstation may be used (depending on availability), the types of software programs available on a workstation, and the ability to print documents. Throughout this document the letters DPL mean data provided by the LEA, and the letters DPC mean data provided by the CDE. California Department of Education School Accountability Report Card Reported Using Data from the 2016–17 School Year

Welcome message from author
This document is posted to help you gain knowledge. Please leave a comment to let me know what you think about it! Share it to your friends and learn new things together.
Transcript

Page 2 of 17
For The Cleta Harder Developmental School Address: 981 N. Euclid St., La Habra, CA 90631 Phone: 562-694-5655 Program Specialist: Christopher Beswick Grade Span: 1-Transition
By February 1 of each year, every school in California is required by state law to publish a School Accountability Report Card (SARC). The SARC contains information about the condition and performance of each California public school. Under the Local Control Funding Formula (LCFF) all local educational agencies (LEAs) are required to prepare a Local Control and Accountability Plan (LCAP), which describes how they intend to meet annual school-specific goals for all pupils, with specific activities to address state and local priorities. Additionally, data reported in an LCAP is to be consistent with data reported in the SARC.
➢ For more information about SARC requirements, see the California Department of Education (CDE) SARC Web page at http://www.cde.ca.gov/ta/ac/sa/.
➢ For more information about the LCFF or LCAP, see the CDE LCFF Web page at http://www.cde.ca.gov/fg/aa/lc/.
➢ For additional information about the school, parents/guardians and community members should contact the school principal or the district office.
DataQuest
DataQuest is an online data tool located on the CDE DataQuest Web page at http://dq.cde.ca.gov/dataquest/ that contains additional information about this school and comparisons of the school to the district and the county. Specifically, DataQuest is a dynamic system that provides reports for accountability (e.g., test data, enrollment, high school graduates, dropouts, course enrollments, staffing, and data regarding English learners). Internet Access
Internet access is available at public libraries and other locations that are publicly accessible (e.g., the California State Library). Access to the Internet at libraries and public locations is generally provided on a first-come, first-served basis. Other use restrictions may include the hours of operation, the length of time that a workstation may be used (depending on availability), the types of software programs available on a workstation, and the ability to print documents. Throughout this document the letters DPL mean data provided by the LEA, and the letters DPC mean data provided by the CDE.
California Department of Education
School Accountability Report Card Reported Using Data from the 2016–17 School Year
Page 3 of 17
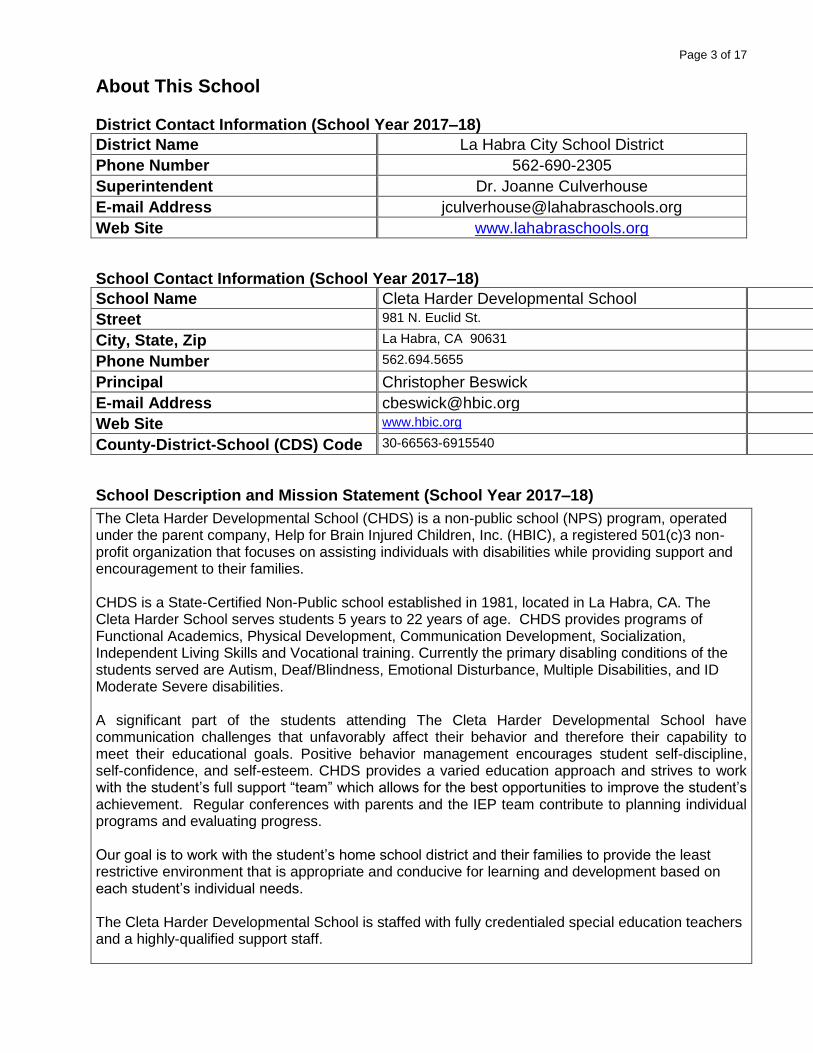
About This School District Contact Information (School Year 2017–18)
District Name La Habra City School District
Phone Number 562-690-2305
Superintendent Dr. Joanne Culverhouse
E-mail Address [email protected]
Web Site www.lahabraschools.org
School Contact Information (School Year 2017–18)
School Name Cleta Harder Developmental School DPC
Street 981 N. Euclid St. DPC
City, State, Zip La Habra, CA 90631 DPC
Phone Number 562.694.5655 DPC
Principal Christopher Beswick DPC
E-mail Address [email protected] DPC
Web Site www.hbic.org DPC
County-District-School (CDS) Code 30-66563-6915540 DPC
School Description and Mission Statement (School Year 2017–18)
The Cleta Harder Developmental School (CHDS) is a non-public school (NPS) program, operated under the parent company, Help for Brain Injured Children, Inc. (HBIC), a registered 501(c)3 non-profit organization that focuses on assisting individuals with disabilities while providing support and encouragement to their families. CHDS is a State-Certified Non-Public school established in 1981, located in La Habra, CA. The Cleta Harder School serves students 5 years to 22 years of age. CHDS provides programs of Functional Academics, Physical Development, Communication Development, Socialization, Independent Living Skills and Vocational training. Currently the primary disabling conditions of the students served are Autism, Deaf/Blindness, Emotional Disturbance, Multiple Disabilities, and ID Moderate Severe disabilities. A significant part of the students attending The Cleta Harder Developmental School have communication challenges that unfavorably affect their behavior and therefore their capability to meet their educational goals. Positive behavior management encourages student self-discipline, self-confidence, and self-esteem. CHDS provides a varied education approach and strives to work with the student’s full support “team” which allows for the best opportunities to improve the student’s achievement. Regular conferences with parents and the IEP team contribute to planning individual programs and evaluating progress. Our goal is to work with the student’s home school district and their families to provide the least restrictive environment that is appropriate and conducive for learning and development based on each student’s individual needs. The Cleta Harder Developmental School is staffed with fully credentialed special education teachers and a highly-qualified support staff.

Page 4 of 17
Student Enrollment by Grade Level (School Year 2016–17)
Grade Level Number of Students
Kindergarten 0
Grade 1 0
Grade 2 0
Grade 3 0
Grade 4 0
Grade 5 0
Grade 6 0
Grade 7 0
Grade 8 0
Ungraded Elementary 9
Grade 9 0
Grade 10 0
Grade 11 0
Grade 12 0
Ungraded Secondary 12
Total Enrollment 34
Student Enrollment by Student Group (School Year 2016–17)
Student Group Percent of
Total Enrollment
Black or African American 0%
American Indian or Alaska Native 0%
Asian 6%
Filipino 0%
Hispanic or Latino 48%
Native Hawaiian or Pacific Islander 0%
White 25%
Two or More Races 7%
Socioeconomically Disadvantaged 38%
English Learners 17%
Students with Disabilities 100%
Foster Youth 0%
A. Conditions of Learning
State Priority: Basic
The SARC provides the following information relevant to the State priority: Basic (Priority 1):
• Degree to which teachers are appropriately assigned and fully credentialed in the subject area and for the pupils they are teaching;
• Pupils have access to standards-aligned instructional materials; and

Page 5 of 17
• School facilities are maintained in good repair Teacher Credentials
Teachers School
2015–16 School
2016–17 School
2017–18
With Full Credential 4 3 5
Without Full Credential 0 1 0
Teaching Outside Subject Area of Competence (with full credential)
0 0 0
Teacher Misassignments and Vacant Teacher Positions
Indicator 2015–16 2016–17 2017–18
Misassignments of Teachers of English Learners
1 1 0
Total Teacher Misassignments* 0 0 0
Vacant Teacher Positions 0 0 0
Note: “Misassignments” refers to the number of positions filled by teachers who lack legal authorization to teach that grade level, subject area, student group, etc.
* Total Teacher Misassignments includes the number of Misassignments of Teachers of English Learners. Quality, Currency, Availability of Textbooks and Instructional Materials (School Year 2017–18) Year and month in which the data were collected: 02/2017 .
Subject
Textbooks and Instructional
Materials/year of Adoption
From Most Recent
Adoption?
Percent Students Lacking Own
Assigned Copy
Reading/Language Arts 2011 NO 100%
Mathematics 2015 YES 100%
Science 2013 NO 100%
History-Social Science 2015 NO 100%
Foreign Language N/A N/A 100%
Health N/A N/A 100%
Visual and Performing Arts N/A N/A 100%
Science Laboratory Equipment (grades 9-12)
N/A N/A 100%
Note: Cells with N/A values do not require data.

Page 6 of 17
School Facility Conditions and Planned Improvements
The Cleta Harder Developmental School’s La Habra campus is located at the northern most tip of Orange County. It is at the edge of the hills of La Habra Heights, just two blocks into a residential housing area. The site houses a conference room, 3 classrooms, 1 sensory/ “overflow” room, a Rest & Recovery room, a kitchen, laundry facilities, Administrative offices, and various DIS rooms. There is a playground, which is surrounded by a secure wrought iron fence to enclose the backyard. There is a medium sized public park and playground directly behind the building that our programs utilize for various activities, including weekly Pet Therapy. We strive to keep all areas in good condition, recently did a complete playground refurbish, adding needed shading, and will be building an addition to the main building during the coming year.
School Facility Good Repair Status
Using the most recently collected FIT data (or equivalent), provide the following:
• Determination of repair status for systems listed
• Description of any needed maintenance to ensure good repair
• The year and month in which the data were collected
• The overall rating Year and month of the most recent FIT report: NA
System Inspected
Repair Needed and Action Taken or Planned
Good Fair Poor
Systems: Gas Leaks, Mechanical/HVAC, Sewer
X
Interior: Interior Surfaces X
Cleanliness: Overall Cleanliness, Pest/ Vermin Infestation
X
Electrical: Electrical X
Restrooms/Fountains: Restrooms, Sinks/ Fountains
X
Safety: Fire Safety, Hazardous Materials
X
Structural: Structural Damage, Roofs
X
External: Playground/School Grounds, Windows/ Doors/Gates/Fences
X
Overall Facility Rate

Page 7 of 17
Year and month of the most recent FIT report: NA
Overall Rating Exemplary Good Fair Poor
X
B. Pupil Outcomes
State Priority: Pupil Achievement
The SARC provides the following information relevant to the State priority: Pupil Achievement (Priority 4):
• Statewide assessments (i.e., California Assessment of Student Performance and Progress [CAASPP] System, which includes the Smarter Balanced Summative Assessments for students in the general education population and the California Alternate Assessments [CAAs] for English language arts/literacy [ELA] and mathematics given in grades three through eight and grade eleven. Only eligible students may participate in the administration of the CAAs. CAAs items are aligned with alternate achievement standards, which are linked with the Common Core State Standards [CCSS] for students with the most significant cognitive disabilities); and
• The percentage of students who have successfully completed courses that satisfy the requirements for entrance to the University of California and the California State University, or career technical education sequences or programs of study.
CAASPP Test Results in ELA and Mathematics for All Students Grades Three through Eight and Grade Eleven
Subject
Percentage of Students Meeting or Exceeding the State Standards
School State
2015–16 2016–17 2015–16 2016–17
English Language Arts/Literacy (grades 3-8 and 11)
-- -- DPC DPC
Mathematics (grades 3-8 and 11)
-- -- DPC DPC
Note: Percentages are not calculated when the number of students tested is ten or less, either because the number of students in this category is too small for statistical accuracy or to protect student privacy.

Page 8 of 17
CAASPP Test Results in ELA by Student Group Grades Three through Eight and Grade Eleven (School Year 2016–17)
Student Group
Total
Enrollment Number Tested
Percent Tested
Percent Met or
Exceeded
All Students -- -- -- --
Male -- -- -- --
Female -- -- -- --
Black or African American
-- -- -- --
American Indian or Alaska Native
-- -- -- --
Asian -- -- -- --
Filipino -- -- -- --
Hispanic or Latino -- -- -- --
Native Hawaiian or Pacific Islander
-- -- -- --
White -- -- -- --
Two or More Races -- -- -- --
Socioeconomically Disadvantaged
-- -- -- --
English Learners -- -- -- --
Students with Disabilities
-- -- -- --
Students Receiving Migrant Education Services
-- -- -- --
Foster Youth -- -- -- --
Note: ELA test results include the Smarter Balanced Summative Assessment and the CAA. The “Percent Met or Exceeded” is calculated by taking the total number of students who met or exceeded the standard on the Smarter Balanced Summative Assessment plus the total number of students who met the standard (i.e., achieved Level 3–Alternate) on the CAAs divided by the total number of students who participated in both assessments. Note: Double dashes (--) appear in the table when the number of students is ten or less, either because the number of students in this category is too small for statistical accuracy or to protect student privacy. Note: The number of students tested includes all students who participated in the test whether they received a score or not; however, the number of students tested is not the number that was used to calculate the achievement level percentages. The achievement level percentages are calculated using only students who received scores.

Page 9 of 17
CAASPP Test Results in Mathematics by Student Group Grades Three through Eight and Grade Eleven (School Year 2016–17)
Student Group
Total
Enrollment Number Tested
Percent Tested
Percent Met or
Exceeded
All Students -- -- -- --
Male -- -- -- --
Female -- -- -- --
Black or African American
-- -- -- --
American Indian or Alaska Native
-- -- -- --
Asian -- -- -- --
Filipino -- -- -- --
Hispanic or Latino -- -- -- --
Native Hawaiian or Pacific Islander
-- -- -- --
White -- -- -- --
Two or More Races -- -- -- --
Socioeconomically Disadvantaged
-- -- -- --
English Learners -- -- -- --
Students with Disabilities
-- -- -- --
Students Receiving Migrant Education Services
-- -- -- --
Foster Youth -- -- -- --
Note: Mathematics test results include the Smarter Balanced Summative Assessment and the CAA. The “Percent Met or Exceeded” is calculated by taking the total number of students who met or exceeded the standard on the Smarter Balanced Summative Assessment plus the total number of students who met the standard (i.e., achieved Level 3–Alternate) on the CAAs divided by the total number of students who participated in both assessments. Note: Double dashes (--) appear in the table when the number of students is ten or less, either because the number of students in this category is too small for statistical accuracy or to protect student privacy. Note: The number of students tested includes all students who participated in the test whether they received a score or not; however, the number of students tested is not the number that was used to calculate the achievement level percentages. The achievement level percentages are calculated using only students who received scores.

Page 10 of 17
CAASPP Test Results in Science for All Students Grades Five, Eight, and Ten
Subject
Percentage of Students Scoring at Proficient or Advanced
School State
2014–15 2015–16 2014–15 2015–16
Science (grades 5, 8,and 10)
-- -- DPC DPC
Note: Science test results include California Standards Tests (CSTs), California Modified Assessment (CMA), and California Alternate Performance Assessment (CAPA) in grades five, eight, and ten. Note: Scores are not shown when the number of students tested is ten or less, either because the number of students in this category is too small for statistical accuracy or to protect student privacy. Note: The 2016-17 data are not available. The California Department of Education is developing a new science assessment based on the Next Generation Science Standards for California Public Schools (CA NGSS). The new California Science Test (CAST) was piloted in spring 2017. The CST and CMA for Science will no longer be administered. Career Technical Education Programs (School Year 2016–17)
Career Technical Education Participation (School Year 2016–17)
Measure CTE Program Participation
Number of Pupils Participating in CTE 0%
Percent of Pupils Completing a CTE Program and Earning a High School Diploma
0%
Percent of CTE Courses Sequenced or Articulated Between the School and Institutions of Postsecondary Education
0%
Courses for University of California (UC) and/or California State University (CSU) Admission
UC/CSU Course Measure Percent
2016–17 Pupils Enrolled in Courses Required for UC/CSU Admission
0
2015–16 Graduates Who Completed All Courses Required for UC/CSU Admission
0
State Priority: Other Pupil Outcomes

Page 11 of 17
The SARC provides the following information relevant to the State priority: Other Pupil Outcomes (Priority 8):
• Pupil outcomes in the subject area of physical education
California Physical Fitness Test Results (School Year 2016–17)
Grade Level
Percentage of Students Meeting
Four of Six Fitness Standards
Percentage of Students Meeting
Five of Six Fitness Standards
Percentage of Students Meeting Six
of Six Fitness Standards
5 0% 0% 0%
7 0% 0% 0%
9 0% 0% 0%
Note: Percentages are not calculated when the number of students tested is ten or less, either because the number of students in this category is too small for statistical accuracy or to protect student privacy.
C. Engagement
State Priority: Parental Involvement
The SARC provides the following information relevant to the State priority: Parental Involvement (Priority 3):
• Efforts the school district makes to seek parent input in making decisions for the school district and each schoolsite
Opportunities for Parental Involvement (School Year 2017–18)
Opportunities for parental participation and involvement are welcomed and encouraged. Parents are invited to attend our Back to School night to meet with administrators, teachers, and therapist. Parents have daily contact with our staff, whether in person, by phone, or by email. In addition, parents welcomed to volunteer/ participate in our various fundraising events. Parents interested in volunteering should contact our Interim Executive Director Mr. Jason Cecil for more information.
State Priority: Pupil Engagement
The SARC provides the following information relevant to the State priority: Pupil Engagement (Priority 5):
• High school dropout rates; and
• High school graduation rates

Page 12 of 17
Dropout Rate and Graduation Rate (Four-Year Cohort Rate)
Indicator
School State
2013–14
2014–15
2015–16
2013–
14 2014–
15 2015–
16
Dropout Rate 0 0 0 11.5 10.7 9.8
Graduation Rate
0 0 0 81 82.3 83.2
Completion of High School Graduation Requirements – Graduating Class of 2016 (One-Year Rate)
Student Group School State
All Students *0 83.2
Black or African American 0
American Indian or Alaska Native 0
Asian 0
Filipino 0
Hispanic or Latino 0
Native Hawaiian or Pacific Islander 0
White 0
Two or More Races 0
Socioeconomically Disadvantaged 0
English Learners 0
Students with Disabilities 0
Foster Youth 0
* not on a diploma track due to cognitive abilities. Certificate of Completion received upon turning 22yrs.
State Priority: School Climate
The SARC provides the following information relevant to the State priority: School Climate (Priority 6):
• Pupil suspension rates;
• Pupil expulsion rates; and
• Other local measures on the sense of safety Suspensions and Expulsions
Rate
School State
2014–15
2015–16
2016–17
2014–15
2015–16
2016–17
Suspensions 1 1 0 DPC DPC DPC
Expulsions 0 0 0 DPC DPC DPC

Page 13 of 17
School Safety Plan (School Year 2017–18) The Cleta Harder Developmental School reviews its school Safety Plan on a regular basis and revises the plan as needed. Fire drills (school wide evacuations) are practiced monthly and building safety inspections are done quarterly. CPR/First aid training is provided every two years. In addition, staff is trained in Crises Prevention Intervention and student Seizure protocols for those students who require them.
D. Other SARC Information The information in this section is required to be in the SARC but is not included in the state priorities for LCFF. Federal Intervention Program (School Year 2017–18)
Indicator School District
Program Improvement Status DPC DPC
First Year of Program Improvement DPC DPC
Year in Program Improvement DPC DPC
Number of Schools Currently in Program Improvement
N/A DPC
Percent of Schools Currently in Program Improvement
N/A DPC
Note: Cells with NA values do not require data. Average Class Size and Class Size Distribution (Elementary)
Grade Level
Avg. Class Size
2014–15 Number of Classes*
Avg. Class Size
2015–16 Number of Classes*
Avg. Class Size
2016–17 Number of Classes*
1-20 21-32 33+ 1-20 21-32 33+ 1-20 21-32 33+
K 0 0 0 0 0 0 0 0 0 0 0 0
1 0 0 0 0 0 0 0 0 0 0 0 0
2 0 0 0 0 0 0 0 0 0 0 0 0
3 0 0 0 0 0 0 0 0 0 0 0 0
4 0 0 0 0 0 0 0 0 0 0 0 0
5 0 0 0 0 0 0 0 0 0 0 0 0
6 0 0 0 0 0 0 0 0 0 0 0 0
Other 10 1 0 0 10 1 0 6 1 0 0
* Number of classes indicates how many classes fall into each size category (a range of total students per class).
** This is a single ELEMENTARY combination class that includes all elementary level grades.

Page 14 of 17
Average Class Size and Class Size Distribution (Secondary)
Subject Avg. Class Size
2014–15 Number of Classes*
Avg. Class Size
2015–16 Number of Classes*
Avg. Class Size
2016–17 Number of Classes*
1-22 23-32 33+ 1-22 23-32 33+ 1-22 23-32 33+
English 10 2 0 0 10 2 0 0 10 2 0 0
Mathematics
10 2 0 0 10 2 0 0 10 2 0 0
Science 10 2 0 0 10 2 0 0 10 2 0 0
Social Science
10 2 0 0 10 2 0 0 10 2 0 0
* Number of classes indicates how many classrooms fall into each size category (a range of total students per classroom). At the secondary school level, this information is reported by subject area rather than grade level.
** SECONDARY classes are separated into a single HIGH SCHOOL classroom, and a single MIDDLE SCHOOL classroom.
Academic Counselors and Other Support Staff (School Year 2016–17)
Title Number of FTE*
Assigned to School
Average Number of Students per
Academic Counselor
Academic Counselor 0 DPL
Counselor (Social/Behavioral or Career Development)
1 29
Library Media Teacher (Librarian) 0 N/A
Library Media Services Staff (Paraprofessional)
0 N/A
Psychologist 0 N/A
Social Worker 0 N/A
Nurse 1 29
Speech/Language/Hearing Specialist 1 29
Resource Specialist (non-teaching) 0 N/A
Other 5 6
Note: Cells with N/A values do not require data. * One Full Time Equivalent (FTE) equals one staff member working full time; one FTE could also represent two staff members who each work 50 percent of full time.

Page 15 of 17
Expenditures Per Pupil and School Site Teacher Salaries (Fiscal Year 2015–16)
Level Total
Expenditures Per Pupil
Expenditures Per Pupil
(Restricted)
Expenditures Per Pupil
(Unrestricted)
Average Teacher Salary
School Site DPL DPL DPL DPL
District N/A N/A DPL DPC
Percent Difference – School Site and District
N/A N/A DPL DPL
State N/A N/A DPC DPC
Percent Difference – School Site and State
N/A N/A DPL DPL
Note: Cells with N/A values do not require data. Types of Services Funded (Fiscal Year 2016–17)
Narrative provided by the LEA
Provide specific information about the types of programs and services available at the school that support and assist students.
Teacher and Administrative Salaries (Fiscal Year 2015–16)
Category School
Beginning Teacher Salary $40,000
Mid-Range Teacher Salary $50,230
Highest Teacher Salary $62,926
Average Principal Salary (Elementary) *
Average Principal Salary (Middle) *
Average Principal Salary (High) *
Superintendent Salary N/A
Percent of Budget for Teacher Salaries 12%
Percent of Budget for Administrative Salaries 13%
For detailed information on salaries, see the CDE Certificated Salaries & Benefits Web page at http://www.cde.ca.gov/ds/fd/cs/. * Sample size is too small to report data

Page 16 of 17
Advanced Placement (AP) Courses (School Year 2016–17)
Subject Number of
AP Courses Offered* Percent of Students
In AP Courses
Computer Science 0 N/A
English 0 N/A
Fine and Performing Arts 0 N/A
Foreign Language 0 N/A
Mathematics 0 N/A
Science 0 N/A
Social Science 0 N/A
All Courses 0
Note: Cells with N/A values do not require data. * Where there are student course enrollments of at least one student. Professional Development The Cleta Harder Developmental School reserves 2 to 3 calendar days specifically for staff In-Service Training. Training topics include behavior intervention, data collection, suspected child abuse reporting, communication, gender sensitivity, and occupational therapy. Supplementary training will be made available through local school districts and private seminars. Administration will establish the training needs and locate those services. Teachers are supported through weekly teacher meetings to discuss student concerns, strategies, and data reporting.
Related Documents