Mattilsynet – food supplements Page 1 FOOD SUPPLEMENTS IN THE NORDIC COUNTRIES Results from surveys among consumers in the Nordic countries

Welcome message from author
This document is posted to help you gain knowledge. Please leave a comment to let me know what you think about it! Share it to your friends and learn new things together.
Transcript
Mattilsynet – food supplements Page 1
FOOD SUPPLEMENTS IN THE NORDIC COUNTRIES
Results from surveys among consumers in the Nordic countries
Mattilsynet – food supplements Page 2
Prologue YouGov Norway AS has carried out this survey project among Nordic consumers on behalf of the Nordic Council and the Norwegian Food Authorities. The various parts of this project have been:
• Qualitative research in Norway and Sweden • Quantitative research in all 5 Nordic countries
The report was conducted by Silje Danielsen and Per Ståle Ekrol on behalf of YouGov in February 2009. The report was revised and updated by Per Ståle Ekrol and Gunnar Wingård in January 2010.
Mattilsynet – food supplements Page 3
EXECUTIVE SUMMARY Knowledge of food supplements The concept of food supplements proves to be ambiguous for Nordic consumers. The qualitative study performed among Norwegian and Swedish consumers indicate that consumers often mix the terms “food supplements” and “functional foods”. This was confirmed in the quantitative survey: The majority of the respondents in this part – 75 % - are of the opinion that they have little or no general knowledge of food supplements. However, although the general understanding of the concept is quite low, the Nordic consumers do have high knowledge regarding the individual substances. When shown a list of products, the respondents were able to recognize on average 15 substances, with various vitamins topping the list together with omega 3 and iron. Consumers show suspicion towards manufacturers of food supplements, not being able to document the effects of the products. In the quantitative research, only three out of ten Nordic consumers have a positive impression of the business of food supplements, and six out of ten have a negative impression. The negative impression may be explained by the low general knowledge of the food supplements. This theory is backed up by the fact that among persons with knowledge of food supplements, six out of ten consumers have a positive impression. The negative impression of the business of food supplements affects the actors themselves; only two out of ten agree that the business consists of serious actors, and six out of ten disagree. Once again, people with knowledge of food supplements have a more positive view towards the actors within the business. All other feedback to the business is more negative than positive. More than 50 % of the respondents in this study say that they are worried about the contents of food supplements. Thus, it seems that the challenge of the actors within the food supplements business is to reach out to the consumers with better information/proof in order to create a more positive image of themselves. Use of specific food supplements The survey reveals that the Nordic inhabitants do use food supplements. The respondents use in average 3,6 different products. The most common products used are omega 3, different types of vitamins, iron and multivitamin/mineral supplements. Consumers using various food supplements believe that the products have a positive effect. This is more the case for the more frequently used food supplements. For the food supplements infrequently used, as many as four out of ten consumers have no opinion whether the products they take have any effect or not.
Mattilsynet – food supplements Page 4
The views on the various sales channels for food supplements are regarded differently. The pharmacies are regarded with high esteem, as almost eight out of ten have a positive impression of pharmacies selling food supplements. The specialized stores are also regarded positively, as more than six out of ten consumers have a positive impression. Other sales channels however, such as internet, mail order companies and telemarketers, are almost unanimously regarded with a negative impression. In the extension of this, people are sceptical towards products sold in grocery stores; only 25 % believe that all food supplements sold in stores are safe to use. The verdict on products sold over the internet or through mail order is even harsher. Only 5 % find that these products are all safe to use. An interesting finding is that respondents with a good knowledge of food supplements regard all sales channels more positively than people with lesser knowledge. Information on food supplements Consumers seek information about food supplements in various channels: In pharmacies and health stores, through articles in magazines and searching the internet, in addition to gaining information from friends and colleagues. Information from the authorities and medical expertise are among the less used sources. When asked whether they trust in these sources, the respondents largely put their faith in the information from pharmacies, medical expertise and the authorities. Information from the authorities is regarded as highly trustworthy, and the consumers also regard it as the authorities’ role to determine and control the contents and safety of food supplements ingredients.
Mattilsynet – food supplements Page 5
Table of content 1. INTRODUCTION.........................................................................................................................................................9
1.1. BACKGROUND ........................................................................................................................................................9 1.2. THE OBJECT OF THIS REPORT ..................................................................................................................................9 1.3. MAIN QUESTIONS AND THIS SURVEY’S APPROACH................................................................................................10
1.3.1. Qualitative research - online focus groups.....................................................................................................11 1.3.2. Quantitative research .....................................................................................................................................12
2. QUALITATIVE RESEARCH ...................................................................................................................................13 2.1. METHODOLOGY....................................................................................................................................................13
2.1.1. Recruitment.....................................................................................................................................................13 2.1.2. Target groups..................................................................................................................................................13 2.1.3. Data collection period ....................................................................................................................................13
3. RESULTS FROM THE FOCUS GROUPS..............................................................................................................14 3.1. WHAT IS HEALTHY/UNHEALTHY FOOD TO YOU?...................................................................................................14 3.2. HOW PREOCCUPIED ARE YOU WITH THE CONTENTS OF THE FOOD? .......................................................................14 3.3. WHAT IS YOUR ATTITUDE TOWARDS A HEALTHY DIET?........................................................................................15 3.4. FOOD SUPPLEMENTS.............................................................................................................................................16
3.4.1. What are your spontaneous thoughts when we say food supplements? ..........................................................16 3.4.2. Motivation for taking food supplements..........................................................................................................16
ADVANTAGES AND DISADVANTAGES OF TAKING FOOD SUPPLEMENTS ...............................................................................18 3.4.3. Advantages......................................................................................................................................................18 3.4.4. Disadvantages.................................................................................................................................................18
3.5. DO YOU READ THE DECLARATION/INSTRUCTION ON THE PACKAGES, AND DO YOU FOLLOW THEM?.....................19 3.6. PURCHASE, USAGE AND KNOWLEDGE OF FOOD SUPPLEMENTS..............................................................................20
3.6.1. Who consumes food supplements?..................................................................................................................20 3.6.2. Purchasing pattern .........................................................................................................................................21
3.7. WHAT IS YOUR OPINION OF THE FOOD SUPPLEMENTS PRODUCERS? ......................................................................21 3.8. HOW DO YOU EVALUATE THE INFORMATION ABOUT FOOD SUPPLEMENTS? ..........................................................22
3.8.1. How do you come across the information?.....................................................................................................22 3.8.2. Discussion about food supplements among friends or colleagues..................................................................23
3.9. THOUGHTS ABOUT THE FUTURE............................................................................................................................23 3.10. THE ROLE OF THE FOOD AUTHORITIES ..................................................................................................................25
3.10.1. How should the authorities take control? ..................................................................................................26 4. QUANTITATIVE SURVEY ......................................................................................................................................27
4.1. METHODOLOGY....................................................................................................................................................27 4.1.1. Introduction ....................................................................................................................................................27 4.1.2. Challenges regarding online interviews .........................................................................................................27 4.1.3. Response and completion rates.......................................................................................................................28 4.1.4. The survey.......................................................................................................................................................28 4.1.5. Sample.............................................................................................................................................................28 4.1.6. Weighting of data............................................................................................................................................29 4.1.7. Survey period ..................................................................................................................................................30 4.1.8. Analysis information .......................................................................................................................................30 4.1.9. How to read the charts....................................................................................................................................31
5. THE RESULTS OF THE QUANTITATIVE SURVEY..........................................................................................32 5.1. EXERCISE IN THE NORDIC COUNTRIES ..................................................................................................................32 5.2. FOCUS ON DIET.....................................................................................................................................................33 5.3. GENERAL KNOWLEDGE OF FOOD SUPPLEMENTS ...................................................................................................35
5.3.1. Only 25 % have a general knowledge of available products ..........................................................................35 5.4. PRODUCT KNOWLEDGE.........................................................................................................................................36
5.4.1. Differences between the Nordic countries ......................................................................................................37 5.5. PRODUCT USAGE ..................................................................................................................................................41
Mattilsynet – food supplements Page 6
5.5.1. Usage in the Nordic countries ........................................................................................................................42 5.6. EXPERIENCED EFFECTS OF FOOD SUPPLEMENTS ...................................................................................................45
5.6.1. Purchase frequency.........................................................................................................................................47 5.6.2. Buying pattern.................................................................................................................................................49
5.7. SALES CHANNELS OF FOOD SUPPLEMENTS............................................................................................................52 5.7.1. Purchasing channels.......................................................................................................................................52
5.8. CONSUMERS’ IMPRESSION OF FOOD SUPPLEMENTS SALES CHANNELS...................................................................53 5.8.1. People have a very good impression of pharmacies .......................................................................................55 5.8.2. The respondents have a good impression of specialized health stores ...........................................................56 5.8.3. People are divided in their impression of grocery stores and supermarkets ..................................................57 5.8.4. People’s impression of mail order companies is negative ..............................................................................58 5.8.5. People are sceptical towards internet companies...........................................................................................59 5.8.6. Street sale is not looked upon positively. ........................................................................................................60 5.8.7. Most people have a negative impression of home parties...............................................................................61 5.8.8. Extremely low impression of telemarketers ....................................................................................................62 5.8.9. Cross country purchasing ...............................................................................................................................63
5.9. CONSUMERS’ ATTITUDES TOWARDS FOOD SUPPLEMENTS.....................................................................................64 5.9.1. Food supplements play an important role for 28 % of the population ...........................................................65 5.9.2. Concern about contents in food supplements..................................................................................................66 5.9.3. The consumers have little overall confidence in products sold in the stores ..................................................67 5.9.4. Low confidence in products purchased through mail order ...........................................................................68 5.9.5. Low confidence in food supplements bought over internet .............................................................................69 5.9.6. Food supplements are expensive in most people’s view .................................................................................70
5.10. THE RESPONDENTS’ VIEW ON THE FOOD SUPPLEMENTS INDUSTRY .......................................................................71 5.10.1. Negative impression of the food supplements business..............................................................................71 5.10.2. Consumers doubt the seriousness of the food supplements business .........................................................73 5.10.3. Little or no confidence in the industry’s own certification routines...........................................................73 5.10.4. Low confidence in the industry’s ability to control their products.............................................................73 5.10.5. No confidence in the industry’s maintenance of control routines ..............................................................74
5.11. INFORMATION ON FOOD SUPPLEMENTS.................................................................................................................75 5.11.1. Multi-use of information sources ...............................................................................................................75 5.11.2. Information from pharmacies, doctors and the authorities is trusted ........................................................78
5.12. USE OF INFORMATION AND WARNINGS ON PACKAGES FOR FOOD SUPPLEMENTS ..................................................80 5.12.1. People read and take the information into consideration ..........................................................................80 5.12.2. People read and follow the warnings on the packages ..............................................................................81
5.13. FUTURE OF THE FOOD SUPPLEMENTS BUSINESS ....................................................................................................82 5.13.1. Moderate increase in purchase of food supplements in the future.............................................................83 5.13.2. Only 23 % believe that their food supplements purchases will decrease in the future ..............................84 5.13.3. Food supplements will be an important part of the diet for three out of ten ..............................................86 5.13.4. 28 % believe that food supplements will be more important due to lower nutritional content in fruits and vegetables 87 5.13.5. 34% will use food supplements for treating bodily sufferings....................................................................88 5.13.6. 43 % will use food supplements to prevent illness .....................................................................................89
5.14. THE ROLE OF THE AUTHORITIES REGARDING FOOD SUPPLEMENTS........................................................................91 5.14.1. Most people have the opinion that the food authorities should control all aspects regarding food supplements...................................................................................................................................................................92
Appendices: A The Qualitative Online methodology 95 B Focus groups participants 99 C Quantitative questionnaire (Norwegian) 100 D Panel Information 108 E Table of weighting per country 109
Mattilsynet – food supplements Page 7
List of Figures FIGURE 1) NORDIC FOOD & HEALTH REPORT, YOUGOV, JANUARY 2009. PERCENTAGE OF THE NORDIC PEOPLE’S CONCERN OVER THE CONTENT IN FOOD PRODUCTS ...................................................11 FIGURE 2) NORWEGIAN HOUSEHOLD PRODUCT ..........................................................................................20 FIGURE 3) EXAMPLE OF GRAPHICS USED IN THIS REPORT ......................................................................31 FIGURE 4) EXERCISE IN THE NORDIC COUNTRIES.......................................................................................32 FIGURE 5) DIETARY FOCUS IN THE NORDIC COUNTRIES ..........................................................................33 FIGURE 6) KNOWLEDGE OF FOOD SUPPLEMENTS PRODUCTS IN THE NORDIC COUNTRIES........35 FIGURE 7) USE OF FOOD SUPPLEMENTS ..........................................................................................................36 FIGURE 8) USE OF FOOD SUPPLEMENTS ..........................................................................................................41 FIGURE 9) AVERAGE USAGE OF FOOD SUPPLEMENTS................................................................................42 FIGURE 10) EFFECT OF FOOD SUPPLEMENTS...................................................................................................45 FIGURE 11) EFFECT OF FOOD SUPPLEMENTS...................................................................................................46 FIGURE 12) PURCHASE FREQUENCY OF FOOD SUPPLEMENTS ..................................................................48 FIGURE 13) FOOD SUPPLEMENTS BOUGHT FOR MYSELF ............................................................................50 FIGURE 14) FOOD SUPPLEMENTS BOUGHT FOR MYSELF AND OTHERS IN MY HOUSEHOLD..........51 FIGURE 15) SALES CHANNELS FOR FOOD SUPPLEMENTS............................................................................52 FIGURE 16) VIEW OF SALES CHANNELS .............................................................................................................53 FIGURE 17) IMPRESSION OF PHARMACIES........................................................................................................55 FIGURE 18) IMPRESSIONS OF HEALTH STORES...............................................................................................56 FIGURE 19) IMPRESSIONS OF GROCERY STORES............................................................................................57 FIGURE 20) IMPRESSION OF MAIL ORDER COMPANIES ...............................................................................58 FIGURE 21) IMPRESSION OF INTERNET-BASED COMPANIES ......................................................................59 FIGURE 22) IMPRESSIONS OF STREET VENDORS.............................................................................................60 FIGURE 23) IMPRESSIONS OF HOME PARTIES..................................................................................................61 FIGURE 24) IMPRESSIONS OF TELEMARKETERS ............................................................................................62 FIGURE 25) PURCHASE OF FOOD SUPPLEMENTS ............................................................................................63 FIGURE 26) ATTITUDES TOWARDS FOOD SUPPLEMENTS ............................................................................64 FIGURE 27) FOOD SUPPLEMENTS’ PART OF CONSUMERS’ DIET................................................................65 FIGURE 28) CONCERN ABOUT CONTENT OF FOOD SUPPLEMENTS ..........................................................66 FIGURE 29) SAFETY OF FOOD SUPPLEMENTS IN STORES ............................................................................67 FIGURE 30) SAFETY OF FOOD SUPPLEMENTS BOUGHT VIA MAIL ORDER............................................68 FIGURE 31) SAFETY OF FOOD SUPPLEMENTS BOUGHT OVER THE INTERNET.....................................69 FIGURE 32) COST OF FOOD SUPPLEMENTS .......................................................................................................70 FIGURE 33) IMPRESSION OVER ALL ON FOOD SUPPLEMENTS...................................................................71 FIGURE 34) IMPRESSION OF FOOD SUPPLEMENTS .........................................................................................72 FIGURE 35) INFORMATION ON FOOD SUPPLEMENTS ....................................................................................75 FIGURE 36) AVERAGE USE OF INFORMATION SOURCES IN THE NORDIC COUNTRIES......................76
Mattilsynet – food supplements Page 8
FIGURE 37) EVALUATION OF INFORMATION SOURCES................................................................................78 FIGURE 38) INFORMATION ON PACKAGES........................................................................................................80 FIGURE 39) WARNING ON PACKAGES .................................................................................................................81 FIGURE 40) THOUGHTS ABOUT THE FUTURE...................................................................................................82 FIGURE 41) FUTURE PURCHASE OF FOOD SUPPLEMENTS- MORE ............................................................83 FIGURE 42) FUTURE PURCHASE OF FOOD SUPPLEMENTS - LESS ..............................................................84 FIGURE 43) FUTURE SIGNIFICANCE OF FOOD SUPPLEMENTS IN CONSUMERS’ DIETS......................86 FIGURE 44) FOOD SUPPLEMENTS VERSUS FRUITS AND VEGETABLES IN THE FUTURE....................87 FIGURE 45) FOOD SUPPLEMENTS AS MEDICAL TREATMENT.....................................................................88 FIGURE 46) FOOD SUPPLEMENTS AS MEANS OF PREVENTING ILLNESSES............................................89 FIGURE 47) CONTROL OF FOOD SUPPLEMENTS ..............................................................................................92 List of tables
TABLE 1. RESPONSE RATE IN ALL NORDIC COUNTRIES...............................................................................28 TABLE 2. THE TABLE BELOW SHOWS THE SAMPLE’S DEMOGRAPHIC VARIATION ...........................29 TABLE 3. TOP FIVE MOST KNOWN PRODUCT IN THE NORDIC COUNTRIES...........................................37 TABLE 4. TOP FIVE LEAST KNOWN PRODUCT IN THE NORDIC COUNTRIES .........................................37 TABLE 5. DIFFERENCE IN KNOWLEDGE BETWEEN MEN AND WOMEN...................................................40 TABLE 6. TOP FIVE PRODUCTS USED IN EACH COUNTRY (NAMES IN SHORT VERSION)...................42 TABLE 7. BOTTOM FIVE PRODUCTS USED IN EACH COUNTRY (NAMES IN SHORT VERSION) .........43 TABLE 8. EFFECT OF FOOD SUPPLEMENTS– TOP FIVE..................................................................................47 TABLE 9. TOP FIVE INFORMATION SOURCES IN THE NORDIC COUNTRIES...........................................76 TABLE 10. TOTAL PURCHASE OF FOOD SUPPLEMENTS IN THE FUTURE .............................................85 TABLE 11. MEDICAL USE OF FOOD SUPPLEMENTS ......................................................................................90
Mattilsynet – food supplements Page 9
1. Introduction
1.1. Background The Nordic Council of Ministers for Fisheries, Aquaculture, Agriculture, Foodstuffs and Forestry is funding this project on food supplements. The Norwegian Food Safety Authorities (Mattilsynet) heads the project regarding the Nordic consumers’ perspective on Food supplements.
1.2. The object of this report Nordic food safety authorities are seeking an optimal administration and management of the market for food supplements. The objective of the authorities is to contribute to ensuring safe products and good quality information to the consumers. One goal is that the regulations/framework should contribute to accomplishing these aims in the best possible way, and that they should have a high degree of functionality. To meet these goals the authorities need information about the market, the risks and the consumers’ attitudes towards these products. This report will explore the Nordic consumer’s knowledge, attitude and experience of food supplements. The main object of this report is to describe this market from the consumer’s point of view in all the Nordic countries. The total project consists of several reports and has been carried out by the market research institute YouGov Norway, with the aim of supplying “objective market description and information” for the Nordic Council and the Norwegian Food Authorities to use as input for their further work.
Mattilsynet – food supplements Page 10
1.3. Main questions and this survey’s approach The main questions put forward by the Nordic authorities are:
• Who purchases food supplements, and why do consumers purchase them? • How do Nordic consumers perceive and comply with information on food
supplements? o Attitudes towards various sources of information from advertising, specialized
shops, pharmacies, etc • Consumers’ level of knowledge and perception of food supplements, the market itself
and the producers of food supplements • Consumers’ expectation of the food supplements market in the future • Consumers’ expectation towards the role of the government in terms of the
administration of food supplements In order to answer all these questions, our approach was conducting both qualitative and quantitative research. The qualitative stage was conducted first, in order to gain insight in consumers’ knowledge and attitude towards food supplements.
Mattilsynet – food supplements Page 11
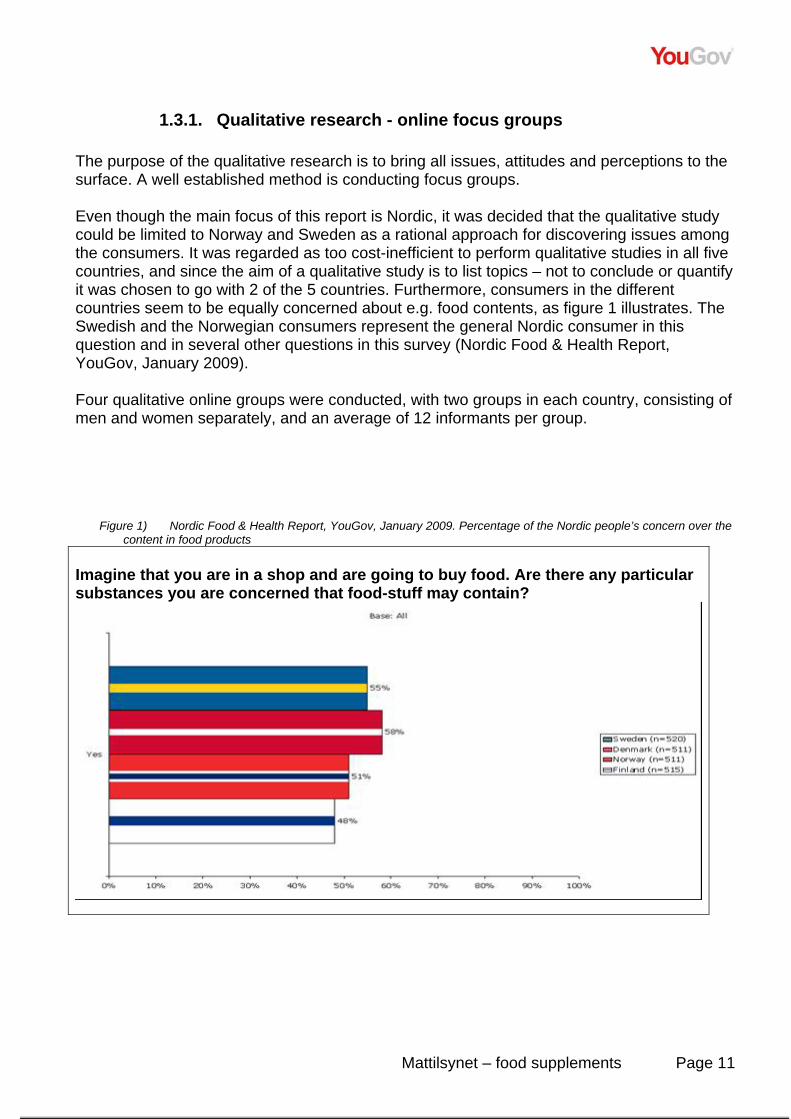
1.3.1. Qualitative research - online focus groups The purpose of the qualitative research is to bring all issues, attitudes and perceptions to the surface. A well established method is conducting focus groups. Even though the main focus of this report is Nordic, it was decided that the qualitative study could be limited to Norway and Sweden as a rational approach for discovering issues among the consumers. It was regarded as too cost-inefficient to perform qualitative studies in all five countries, and since the aim of a qualitative study is to list topics – not to conclude or quantify it was chosen to go with 2 of the 5 countries. Furthermore, consumers in the different countries seem to be equally concerned about e.g. food contents, as figure 1 illustrates. The Swedish and the Norwegian consumers represent the general Nordic consumer in this question and in several other questions in this survey (Nordic Food & Health Report, YouGov, January 2009). Four qualitative online groups were conducted, with two groups in each country, consisting of men and women separately, and an average of 12 informants per group.
Figure 1) Nordic Food & Health Report, YouGov, January 2009. Percentage of the Nordic people’s concern over the content in food products
Imagine that you are in a shop and are going to buy food. Are there any particular substances you are concerned that food-stuff may contain?
Mattilsynet – food supplements Page 12
1.3.2. Quantitative research Based on the findings of the qualitative part, various hypotheses were put into questions to be put forward to a representative sample in all the Nordic countries. A representative survey was conducted in all five Nordic countries, with 500 interviews in Norway, Sweden, Denmark and Finland, and 250 interviews in Iceland. For a closer look at the methodology, please see chapter 4.1 and appendices.
Mattilsynet – food supplements Page 13
2. Qualitative research The object of this phase is to provide in-depth knowledge as to how consumers think and react to the various forms of food supplements. The respondents are urged to express knowledge, perceptions and attitudes towards food supplements, the products, the producers and the role of the authorities.
2.1. Methodology This method is widely used in order to gain in-depth insight on various themes. It is important to be aware that the findings are an expression of attitudes that exist among the informants; however, these attitudes do not necessarily generalize to the entire market. The focus groups are performed according to traditional qualitative research, combined with benefits that follow conducting the focus groups on the internet:
• Respondents answer when it is convenient for them • No geographical barriers • Secures involvement from all persons in the group • Answers are often more honest and thorough
See appendix A regarding the set-up and procedure of qualitative online studies.
2.1.1. Recruitment The groups were recruited from members of YouGov’s nationally representative online panels in Norway and Sweden. A questionnaire was distributed to panel members in Norway and Sweden for recruitment purposes. Prior to being recruited, the respondents answered questions on their attitudes towards diet and exercise.
2.1.2. Target groups Men and women above 18 years were recruited for the qualitative survey. In order to achieve homogeneity in the groups, we divided the groups into male and female groups. This often ensures a better group dynamic, and thus more themes and more fruitful discussions arise. See Appendix B for details on group participants.
2.1.3. Data collection period The group sessions were conducted in Week 39, 2008.
Mattilsynet – food supplements Page 14
3. Results from the focus groups The first few questions are general issues regarding health and people’s diet.
3.1. What is healthy/unhealthy food to you? Interestingly, we find some differences between the opinions of the Norwegian and Swedish group participants; while almost all of the Norwegian women mention fruits and vegetables as healthy food, the Swedish female participants use words like “natural”, “balanced” and “home-made”. Men in both groups are not so homogenous; some are quite pragmatic (“You can eat everything as long as long as you don’t eat too much” and “healthy food is what is good for your body”). Others seem to be very conscious about what is healthy, and mention vegetarian food, organic food, unsaturated fats, fibers and carbohydrates. Most participants agree that the diet should be varied. Organic food is welcome, and some group participants feel this is a step in the right direction in protecting the environment - among other benefits. Furthermore the food has to be without artificial substances. This disqualifies pre-cooked products, which in some participants’ point of view, are filled with artificial substances. The groups look for products in season, (vegetables and fruit in summer), and fresh products, i.e. products with a shorter life span. It is important that the diet is balanced, and that it is good for both body and mind. Fast food, semi-prepared and ready-made food are examples of unhealthy food. Ingredients that are mentioned are saturated fat, sugar and salt. The informants are also suspicious of food with high level of additives and unnatural substances. These substances can be divided into two groups; they are either bad for you, or they are substances that your body doesn’t need. There seems to be a broad consensus about these attitudes in both countries.
3.2. How preoccupied are you with the contents of the food? Women have stronger focus on what the food contains than men have, and they are more likely to check the declaration on the packages. Most of them feel that they know what the food contains, and what it should contain. Some have an ambition to avoid food that provokes allergies, whereas others want to steer clear of food with a high level of calories. The men are more divided in their view; some check all products for fat, sugar and salt as well as place of origin, whereas others answer that they are not at all preoccupied with what the food contains. Some also look for organic products, and pay attention to whether a product is organically produced or not. Men are also more focused on checking for the e numbers– who some believe might be harmful. The e numbers are regarded with suspicion in general, but men mention them more than women.
Mattilsynet – food supplements Page 15
The challenge among many group participants is to understand the declaration of content which is written on the packages. Some people do not understand the abbreviations, or the amount of each substance. Some of the group participants check the ingredients list for substances that may cause allergic reactions. This is also the case if members in the family suffer from diabetes. “My son has diabetes 1, so I have to check the content carefully. I am shocked by the high level of sugar in groceries”
Male group participant, Norway However, informants in the male groups admit that they are inconsistent in their scrutiny of the contents in their purchased products. Women are more consistent in their control of what the food products contain. “It varies. Normally I am very interested, but sometimes I tend not to care (about what the food contains) since I am training – which is stupid
Male group participant, Sweden
3.3. What is your attitude towards a healthy diet? The male and female groups concur in their attitudes towards a healthy diet. A healthy diet gives energy, or more energy than a person would have without a healthy diet. According to the groups, the most important thing is perhaps that the diet is varied. Women become more focused on their diet after childbirth. In this way they can make sure that the children get the “building blocks” they need while growing up. Furthermore, they claim that they are responsible for their well-being through their diet. Weight problems are also mentioned as a reason for keeping an eye on their diet. Despite good intentions of always eating healthy, this seems easier said than done. The time squeeze is a challenge for many people, and this influences their choices in their daily routines. Most people claim to have basic knowledge of what is healthy or not. However, they do not always act accordingly. Sometimes they “cheat” by eating food that is not necessarily healthy. Several group participants reveal that it is difficult to maintain a healthy diet.
Mattilsynet – food supplements Page 16
3.4. Food supplements
3.4.1. What are your spontaneous thoughts when we say food supplements?
Spontaneous words are vitamins and minerals, and substances that the body needs – in addition to what the group participants get through food. Some mention pills, others mention powder, others again think of energy drinks. Swedish women mention food supplements for body builders, such as protein shakes and similar food supplements for training purposes. Some talk about pills that “will work wonders on your body”, which reveals a scepticism towards the products. In Norway, the groups mention tran (cod liver oil) in general terms. They mention both the original liquid form and cod liver oil in capsules. Omega-3 and anti-oxidants are also mentioned as examples of food supplements. Norwegian women, in particular, mention diet pills, or pills that reduces intake of fat, or increases the rate of metabolism. As the discussion proceeds, several participants reveal their suspicion towards certain products they refer to as “scam”, but they do not mention any particular products or brands. “You should be careful about your choices”, is an example of a quote from a participant. The first sign of confusion within the groups appears as some mix food supplements and functional foods. Brown cheese with iron and cheese with vitamin D are mentioned as food supplement products. Pills from specialized retailers (Vita, Sunkost etc.) are also mentioned as examples of food supplements. Another aspect that was rapidly brought forward is the price of food supplement products, which are regarded as expensive. When the group participants are asked about the spontaneous thoughts around food supplements, several participants mention that they are too expensive.
3.4.2. Motivation for taking food supplements Female participants take food supplements for various reasons. Many of the Swedish women take omega-3 on a daily basis in order to compensate for too little fat fish. None of the Norwegian women mention omega-3, and the majority of them do not take food supplements on a daily basis. Some of them think that food supplements are too expensive, some do not believe in the effects, and some just forget to take them. However, quite a few mention tran (cod liver oil), especially during winter time. A couple of the Swedish women mention
Mattilsynet – food supplements Page 17
“doctor’s orders”, they are recommended by their doctor to take certain products which their body needs (for instance vitamin-B12 prescribed by their GP). “A tomato and an orange contains just a fraction of the vitamins that they contained 5o years ago”
Female group participant, Sweden For a couple of the female participants, folic acid is a substance that is taken during pregnancy. Some take food supplements just to be on the safe side, as they are uncertain about what their daily diet contains. Others take food supplements to improve their appearance, such as better skin conditions etc. Usage and interest concerning food supplements among men is lower than among women. Some of the men used to take food supplements, but they have stopped for various reasons, usually because they do not notice any effect, or they simply forget to take the food supplements regularly. 50 % of the Norwegian men use tran and vitamin supplements on a daily basis; the rest of them do not use any supplements. The majority of the Swedish men do not take any food supplements; the ones who do, mention vitamin C and multi vitamin/vitamin supplements. Some of the informants say that they take food supplements just to be on the safe side, in order to ensure that the body gets what it needs when they do not eat properly. Food supplements may be the easy way out. Allergies are also a reason for taking supplements: One participant takes Vitamin C tablets (soluble in water) because of his allergies to fruits. One person mentions that he has bought food supplements at the pharmacy which are particularly “designed for men”. One participant takes calcium to compensate for not eating dairy products; another one uses omega 3 to obtain mental energy. He has introduced a little ceremony with his children every morning to make sure that all the family members get their food supplements.
Mattilsynet – food supplements Page 18
Advantages and disadvantages of taking food supplements The groups have formed an opinion about food supplements, and these are tied to advantages and disadvantages. These are based on general attitudes and on own experiences.
3.4.3. Advantages Most group participants claim that food supplements are not really necessary if the diet is well balanced. Some do not believe that there are any advantages at all. Others say that food supplements will provide the substances their bodies need if their diet is incomplete. Many of the group participants agree that food supplements are meant to compensate for an insufficient diet. By taking food supplements, they ensure they get the substances and vitamins they need. Some of the men mention convenience as an argument; taking food supplements is an easy way to get the vitamins they need. Others mention mental well-being as an argument to take food supplements
3.4.4. Disadvantages There is a certain scepticism among the group participants, and the disadvantages seem to outnumber the advantages. The first disadvantage mentioned is the risk for taking more than the advised quota. Due to lack of desired effect, people might “overdose”. Another aspect is that people do not read the instructions on the packages well enough, but take them without reflecting. None of the group members admit to this practice, but they do believe it to be a common problem. Furthermore there are some concerns about taking the wrong food supplements, which may lead to allergic shock or other reactions. The group members cannot point out any substances, but rather point at taking wrong products as a general problem. “Fat soluble vitamins and supplements are worse since they build up in the body and may give partly serious consequences over time”
Female group participant, Norway Food supplements are perceived as artificial among group participants, and some fear that they will “block” the body’s natural intake of the natural substances. The groups feel that they, and others, (also scientists) still know too little. There is not enough research to be certain about the positive effects of the substances. One example; water
Mattilsynet – food supplements Page 19
soluble vitamins are generally not regarded as a problem, but do the scientists know enough about the long-term effects? The use of food supplements may lead people to be less careful about their diet. It might be regarded as acceptable to skip a proper meal or two, as long as this is compensated by food supplements. Group participants also point out false security, and the element of placebo effects, often aided by advertisements. “There are so many unserious producers; nine out of ten products don’t have any effect at all”
Female group participant, Sweden One major problem of food supplements is the price of the products; this is mentioned in all four groups. Norwegians in particular complain about the high prices. Furthermore, they often claim that products purchased abroad have higher contents (higher volume, more units), and have higher doses (of for example vitamins). In addition, the price is lower. “One disadvantage is that food supplements are extremely expensive, and in Norway, the content of vitamins is ridiculously low, compared to other countries”
Female group participants, Norway
3.5. Do you read the declaration/instruction on the packages, and do you follow them?
Group participants who buy and use vitamins say they read the instructions, and they follow them. This is especially the case when trying new products. The instructions on the packages might however be discarded in order to follow the advices of experts: “I am using food supplements on orders from my nutritional physiologist, and I trust her more than I trust the information on the packages”
Female group participants They have respect for food supplements and worry about over-use. People who don’t consume food supplement products claim that they would have read the instructions if they were to buy them. However, they imagine that this is not the case for everyone taking food supplements.
Mattilsynet – food supplements Page 20
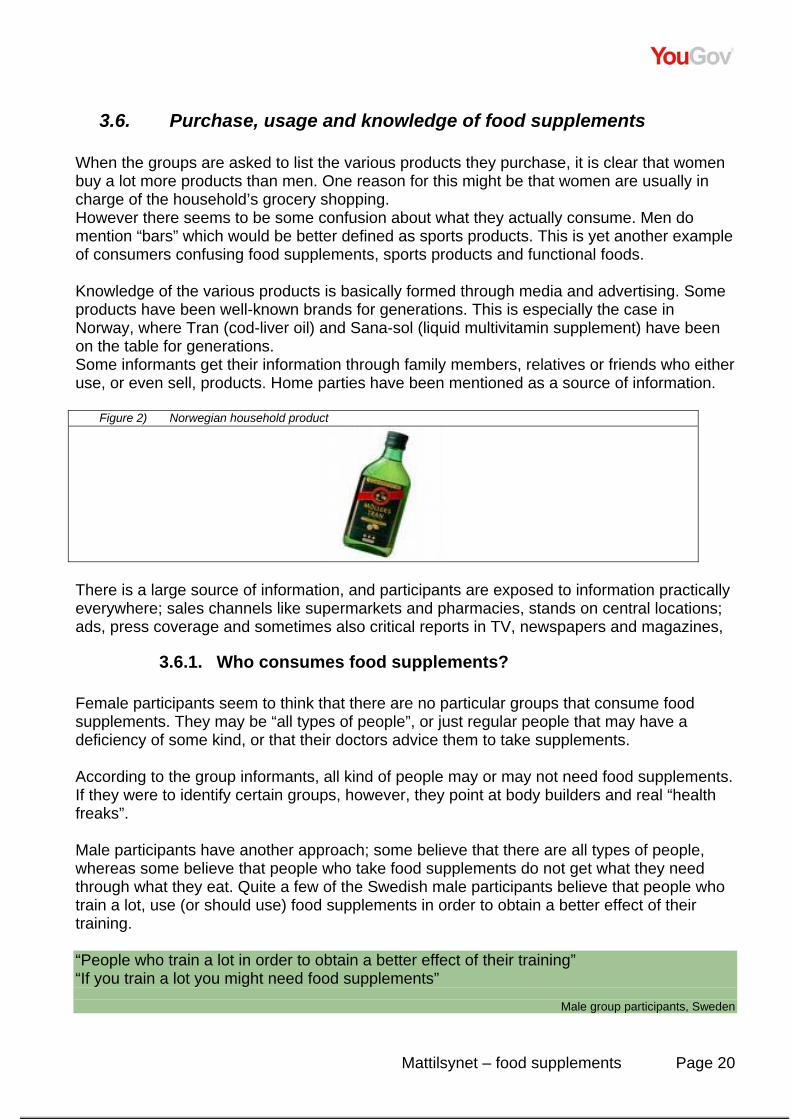
3.6. Purchase, usage and knowledge of food supplements When the groups are asked to list the various products they purchase, it is clear that women buy a lot more products than men. One reason for this might be that women are usually in charge of the household’s grocery shopping. However there seems to be some confusion about what they actually consume. Men do mention “bars” which would be better defined as sports products. This is yet another example of consumers confusing food supplements, sports products and functional foods. Knowledge of the various products is basically formed through media and advertising. Some products have been well-known brands for generations. This is especially the case in Norway, where Tran (cod-liver oil) and Sana-sol (liquid multivitamin supplement) have been on the table for generations. Some informants get their information through family members, relatives or friends who either use, or even sell, products. Home parties have been mentioned as a source of information.
Figure 2) Norwegian household product
There is a large source of information, and participants are exposed to information practically everywhere; sales channels like supermarkets and pharmacies, stands on central locations; ads, press coverage and sometimes also critical reports in TV, newspapers and magazines,
3.6.1. Who consumes food supplements? Female participants seem to think that there are no particular groups that consume food supplements. They may be “all types of people”, or just regular people that may have a deficiency of some kind, or that their doctors advice them to take supplements. According to the group informants, all kind of people may or may not need food supplements. If they were to identify certain groups, however, they point at body builders and real “health freaks”. Male participants have another approach; some believe that there are all types of people, whereas some believe that people who take food supplements do not get what they need through what they eat. Quite a few of the Swedish male participants believe that people who train a lot, use (or should use) food supplements in order to obtain a better effect of their training. “People who train a lot in order to obtain a better effect of their training” “If you train a lot you might need food supplements”
Male group participants, Sweden
Mattilsynet – food supplements Page 21
Others again regard people that take food supplements as “simple minded” and “easily fooled”. “Easily fooled persons with too little time on their hands, and no interest in the joy of culinary activities”.
Male group participant, Norway “People with money to spend, and people acting on doctor’s orders”.
Female group participants
3.6.2. Purchasing pattern Food supplement users re-purchase when they run out. Some purchase them when their doctors tell them to do so. Regular usage patterns are rarely present among the group participants. Some seem to forget to take the food supplements, and consequently it may take a while before they re-purchase. Some informants subscribe to mail deliveries of food supplements of different kinds. However, even if they want to, they find it hard to discontinue the subscription, as the producers/suppliers make it hard to stop the subscription. “I buy them when I am ordered to by my doctor or nutritionist. However, it is hard to remember taking the food supplements. Sometimes I top it off with a sports bar when I am stressed”.
Female group participants, Sweden There seems to be a process of searching until they find a product in which they have confidence. In this respect, confidence means that they feel that the product has the desired effect. Once they have found this, they try to take this product on a regular basis. Another usage pattern is to take food supplements during winter, the high season of colds and flu. The groups return to their theory of simple-minded people, stating that people (others than themselves) are influenced by advertising and thus buy more products than they really need.
3.7. What is your opinion of the food supplements producers? The feedback is almost unanimous; the impression is negative. Quite a few use strong expressions like “humbug” and “fraud” The group participants feel that the producers are taking advantage of the insecurity among many consumers. Naturally there are serious producers, but these are outnumbered by the amount of unserious actors in the market. “They make high profit on products with uncertain effects, and they are difficult to monitor”.
Male group participants, Sweden
Mattilsynet – food supplements Page 22
“Many players take advantage of people’s ignorance”.
Male group participants Questions are also raised about the experts within the trade. Are they speaking on behalf of someone, or are they driven by their professional integrity? The focus group participants feel that the experts (who publicly recommend or advertise for specific products) should be fully objective and without any financial interest, so that their statements and recommendations can be relied on.
3.8. How do you evaluate the information about food supplements?
From the female group participants’ view, the main part of the available information comes from the producers. Though appearing as information, it is perceived as “advertising in disguise”. They believe that it is important to be critical to the information, and take it all with a “pinch of salt”. The groups conclude that the only sources they can rely on are doctors and nutritional physiologists. Male groups find the information to be exaggerated and positively biased. Most participants don’t bother to read any of it, and try avoiding the information. They also point out that it has been an overflow of “nutritional experts”. One has to be aware of their agenda and to what they say and mean about certain products. “The leaflet from “Life” usually goes straight into the paper collection container”
Male group participant, Sweden
Sources of objective information are friends, family and colleagues, and neutral web sites.
3.8.1. How do you come across the information? The group participants prefer to read pamphlets obtained in the specialized stores, and to search on the internet. One man receives information from his nutritionist. Discussion forums on the internet are regarded as objective, as the other members are honest in their feedback. Some like to follow radio- or TV programs which try to expose dishonest companies. These sources are welcome, and the participants find them reliable. If the group participants were to rate their sources, the doctors are regarded as the most serious, above pharmacists. Information from the trade itself is ranked the lowest. “..those annoying people in shopping centers and spam e-mail”
Male group participant
Mattilsynet – food supplements Page 23
However, the main source of information comes through advertising (direct mail, TV, magazines etc.) Commercial information is usually not welcome. Many of the participants have reserved themselves from all kind of direct mail. They do not make any exception of any commercial information, whether it is supposed to be good for you or not.
3.8.2. Discussion about food supplements among friends or colleagues
Discussions about food supplements are more frequent among women than men. The participants tend to believe that these discussions are more frequent among older people (65+). Male participants may discuss at work or in a family situation, but never among friends; some view the subject as “feminine”, and food supplement is never a subject for discussion. The group participants believe that people who need food supplements, also tend to discuss the various products among themselves, exchange experiences, etc. Omega 3 is frequently discussed among female participants, and a question raised is whether or not it has any effect. In particular, they discuss how isolated fatty acids work compared to a meal of fish. Another subject discussed in the groups is stale fish oil in capsules. How does fish oil in capsules compare to liquid fish oil? Is there a risk for pollution in fish oil? Furthermore, the groups discussed remedies for colds, such as Noni, Rhodiola rosea, Enchinaforce, folic acid during pregnancies, etc.
3.9. Thoughts about the future The ones who do have any thoughts about food supplements in the future believe that the subject will be more present; in media, among producers, and among consumers. The large, more serious producers will prevail, whereas the smaller, less serious will become extinct; at least this is what some of the group members hope will happen. However, a quite large part of the participants do not engage in the problem, and do not have any opinion “I don’t know, and I don’t care”
Male group participant, Sweden There is a belief among the group participants that increased focus will lead to a higher degree of awareness about what you eat. Furthermore, it will lead to a higher demand of government control and regulation. The group participants expect the authorities to take responsibility to clean up the business and get rid of the unreliable products and scams. “I hope that the market will be subject for stricter regulations from the authorities because the business lacks seriousness”
Male group participant, Norway As seen earlier, the group participants have problems distinguishing between food supplements and functional foods. One participant says:
Mattilsynet – food supplements Page 24
“I believe that there will be more and more vitamin-added food, and I find this annoying, because I feel I will lose control over what kind of substances I eat, and what I give to my children. I like “pure” products that consist only of natural ingredients”
Female group participant Other participants concur with this quote. Some believe that the products will become more targeted, for instance towards pregnant women, people that exercise etc. In this discussion several participants mention enriched food. It is a sentiment among several group participants that functional foods and “smart food” will grow.
Mattilsynet – food supplements Page 25
3.10. The role of the food authorities As for the previous chapter, we find that quite a few of the group participants are not engaged in the subject. This is particularly the case among the Norwegian and Swedish men: “I have no opinion, I do not pay attention.”
Male group participant, Norway
Most of the others seem to be ignorant about what the authorities do: “I have no idea”
Male group participant, Sweden “I really don’t know. Do they do anything at all?” “I believe that the authorities hardly care about this business at all. Of course, occasionally they issue warnings about purchasing food supplements abroad, because the content in these products are unknown. Otherwise they simply wash their hands and rather look at what kind of income they get in terms of taxes”.
Female group participants, Norway. These quotes sum up the group participants’ knowledge and attitude towards what the authorities do. They are uncertain about what and how much the authorities do in controlling the business. They find that the situation is out of control, that foreign companies may participate in the Norwegian market, and yet be exempted from Norwegian regulation and Norwegian laws. They all agree that the authorities should be more visible, keep an eye on the manufacturers, and make sure that the companies and the products actually keep their promises of effects. They fear that the business falls between two chairs, or that no one takes real responsibility. The groups feel that this is the situation, especially in the internet market, where the offer is vast and impossible to control. The regulation should be on the same level as medicine in terms of declaration of ingredients. The effect of products should be well documented before the products are launched on the market. This is a proposal that would aid in controlling the less serious companies. The groups question the authorities’ knowledge on food supplements. What do they really know about the products, the business and the market players? Are they subjects to the manufacturers’ lobbying? “They are probably exposed to lobbying from those who control the money in the business and comply with what these people tell them to”
Male group participant, Norway
Mattilsynet – food supplements Page 26
Then again, Norwegian consumers demand a change in the level on vitamins in food supplements, which they find too low. The dosages should be increased to reach the levels of Sweden and Denmark.
3.10.1. How should the authorities take control? The groups regard it as the role of the authorities to regulate the market and to a larger extent control the companies. This should be done through: Documentation All effects of the food supplements should be documented and presented. This also includes long-time effects. Information on packages should be correct and controlled. Controls Control by a third party is mentioned. The third party should be an independent committee consisting of medical experts, for instance. Testing via random sampling is another. Sanctions Companies who don’t follow the regulations set by the authorities should be banned from the market.
Mattilsynet – food supplements Page 27
4. Quantitative survey The qualitative survey revealed interesting attitudes and perceptions as previously described. Based on the findings in the qualitative part, a questionnaire was outlined in order to quantify the findings. The questionnaire is found in the appendix C.
4.1. Methodology
4.1.1. Introduction The use of online questionnaires is a well accepted methodology in market research. The online methodology requires that the respondents have access to internet and e-mail in order to respond. The internet penetration in the Nordic countries exceeds 80 %, so only a small percentage of the population is omitted. An alternative would be to conduct the interviews by telephone. However, due to cost-benefit considerations and a rapidly increasing non-response rate in telephone surveys, fieldwork over the internet was chosen as the best alternative. The response rate in online surveys tends to be significantly higher – normally higher than 30 % - as opposed to 10 – 20 % for telephone surveys. The samples in the survey are representative on a national level among participants at the age of 15-64. For ages 65 and above, the internet penetration is rapidly growing, but still not on a satisfactory level. On the other side, younger target groups are more accessible through online surveys. Please see Appendix D for detailed information on the panel and YouGov’s active panel management.
4.1.2. Challenges regarding online interviews The main challenge regarding online interviews is to secure representativeness; although the age groups in the samples in this survey to a high extent correspond with the age groups in the population, there is a known fact that the internet penetration among older people, and, to a lesser extent, among people with low education, are under-represented. On the other side, representativeness among younger people and people with higher education is a challenge in telephone based interviews. As previously mentioned, the response rates have dropped among telephone based surveys. Obtaining a high enough response rate is a challenge also when it comes to online interviews. Higher response rates are seeked through YouGov’s active panel management (see appendix), as well as well-built questionnaires and interesting and relevant incentive programmes for the respondents. There is also a risk that some respondents drop out of the survey; the longer the questionnaire, the higher the drop-out-rate. Keeping questionnaires shorter – 10-15 minutes as a maximum – ensures higher completion rates.
Mattilsynet – food supplements Page 28
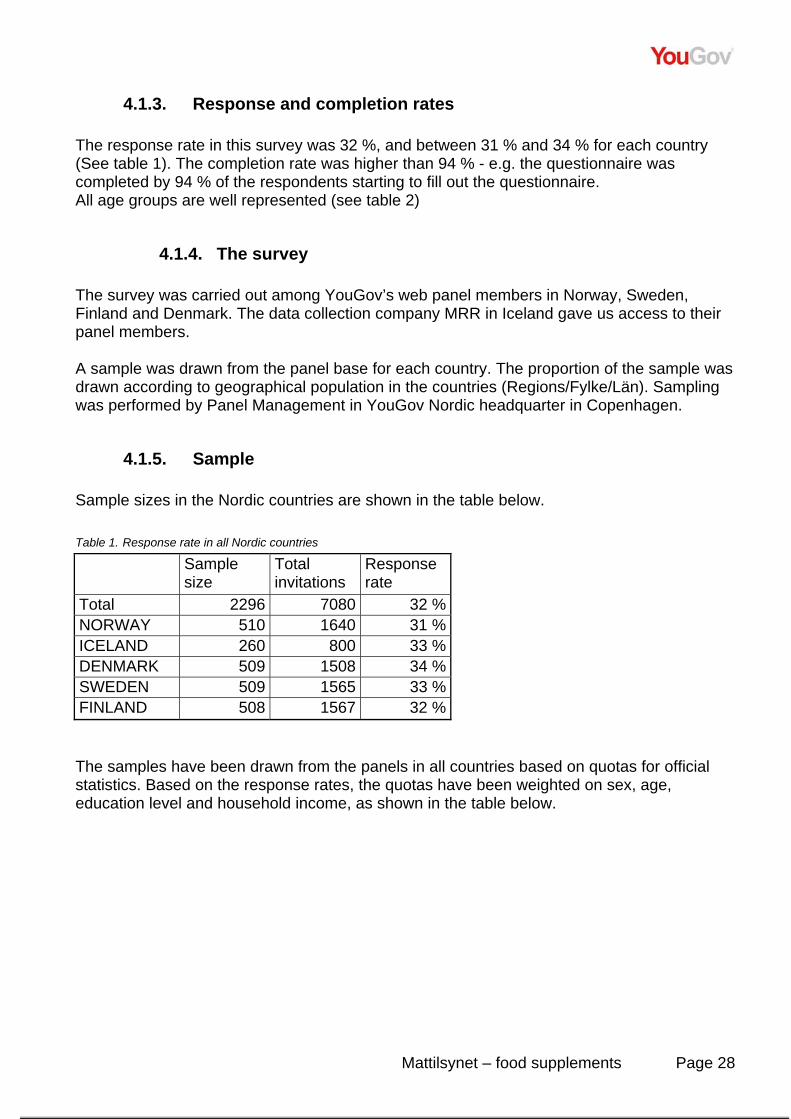
4.1.3. Response and completion rates The response rate in this survey was 32 %, and between 31 % and 34 % for each country (See table 1). The completion rate was higher than 94 % - e.g. the questionnaire was completed by 94 % of the respondents starting to fill out the questionnaire. All age groups are well represented (see table 2)
4.1.4. The survey The survey was carried out among YouGov’s web panel members in Norway, Sweden, Finland and Denmark. The data collection company MRR in Iceland gave us access to their panel members. A sample was drawn from the panel base for each country. The proportion of the sample was drawn according to geographical population in the countries (Regions/Fylke/Län). Sampling was performed by Panel Management in YouGov Nordic headquarter in Copenhagen.
4.1.5. Sample Sample sizes in the Nordic countries are shown in the table below. Table 1. Response rate in all Nordic countries
Sample size
Total invitations
Response rate
Total 2296 7080 32 %NORWAY 510 1640 31 %ICELAND 260 800 33 %DENMARK 509 1508 34 %SWEDEN 509 1565 33 %FINLAND 508 1567 32 % The samples have been drawn from the panels in all countries based on quotas for official statistics. Based on the response rates, the quotas have been weighted on sex, age, education level and household income, as shown in the table below.
Mattilsynet – food supplements Page 29
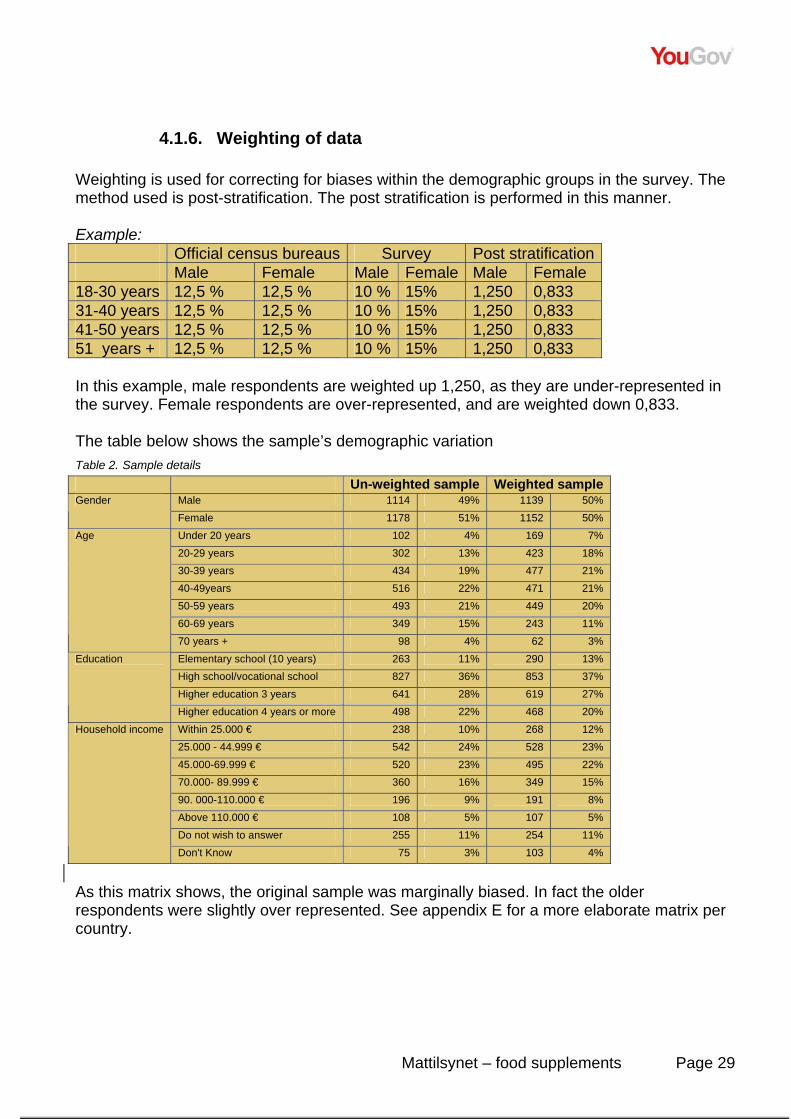
4.1.6. Weighting of data Weighting is used for correcting for biases within the demographic groups in the survey. The method used is post-stratification. The post stratification is performed in this manner. Example: Official census bureaus Survey Post stratification Male Female Male Female Male Female 18-30 years 12,5 % 12,5 % 10 % 15% 1,250 0,833 31-40 years 12,5 % 12,5 % 10 % 15% 1,250 0,833 41-50 years 12,5 % 12,5 % 10 % 15% 1,250 0,833 51 years + 12,5 % 12,5 % 10 % 15% 1,250 0,833 In this example, male respondents are weighted up 1,250, as they are under-represented in the survey. Female respondents are over-represented, and are weighted down 0,833. The table below shows the sample’s demographic variation Table 2. Sample details Un-weighted sample Weighted sample
Male 1114 49% 1139 50% Gender Female 1178 51% 1152 50% Under 20 years 102 4% 169 7% 20-29 years 302 13% 423 18% 30-39 years 434 19% 477 21% 40-49years 516 22% 471 21% 50-59 years 493 21% 449 20% 60-69 years 349 15% 243 11%
Age
70 years + 98 4% 62 3% Elementary school (10 years) 263 11% 290 13% High school/vocational school 827 36% 853 37% Higher education 3 years 641 28% 619 27%
Education
Higher education 4 years or more 498 22% 468 20% Within 25.000 € 238 10% 268 12% 25.000 - 44.999 € 542 24% 528 23% 45.000-69.999 € 520 23% 495 22% 70.000- 89.999 € 360 16% 349 15% 90. 000-110.000 € 196 9% 191 8% Above 110.000 € 108 5% 107 5% Do not wish to answer 255 11% 254 11%
Household income
Don't Know 75 3% 103 4%
As this matrix shows, the original sample was marginally biased. In fact the older respondents were slightly over represented. See appendix E for a more elaborate matrix per country.
Mattilsynet – food supplements Page 30
4.1.7. Survey period Surveys were conducted in week 42 – 43 - 2008. Two reminders were issued during this time before we reached the goal of 500 in Norway, Sweden, Denmark, Finland, and 250 in Iceland.
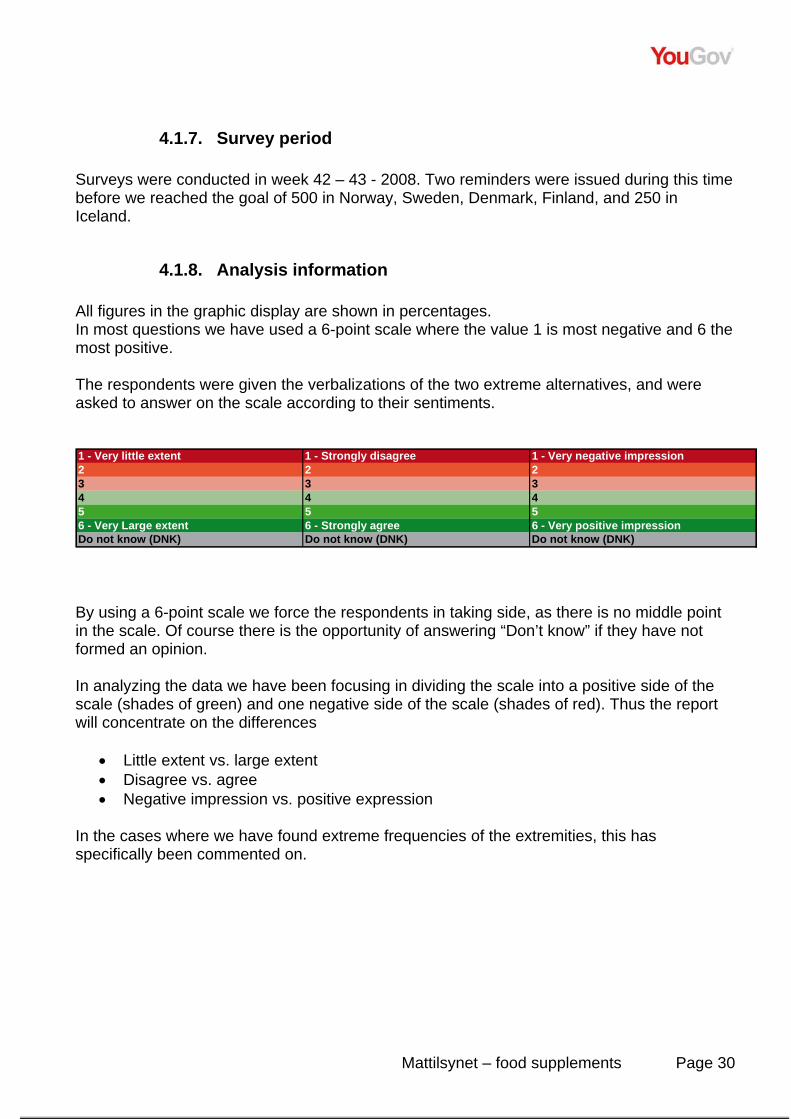
4.1.8. Analysis information All figures in the graphic display are shown in percentages. In most questions we have used a 6-point scale where the value 1 is most negative and 6 the most positive. The respondents were given the verbalizations of the two extreme alternatives, and were asked to answer on the scale according to their sentiments. 1 - Very little extent 1 - Strongly disagree 1 - Very negative impression2 2 23 3 34 4 45 5 56 - Very Large extent 6 - Strongly agree 6 - Very positive impressionDo not know (DNK) Do not know (DNK) Do not know (DNK) By using a 6-point scale we force the respondents in taking side, as there is no middle point in the scale. Of course there is the opportunity of answering “Don’t know” if they have not formed an opinion. In analyzing the data we have been focusing in dividing the scale into a positive side of the scale (shades of green) and one negative side of the scale (shades of red). Thus the report will concentrate on the differences
• Little extent vs. large extent • Disagree vs. agree • Negative impression vs. positive expression
In the cases where we have found extreme frequencies of the extremities, this has specifically been commented on.
Mattilsynet – food supplements Page 31
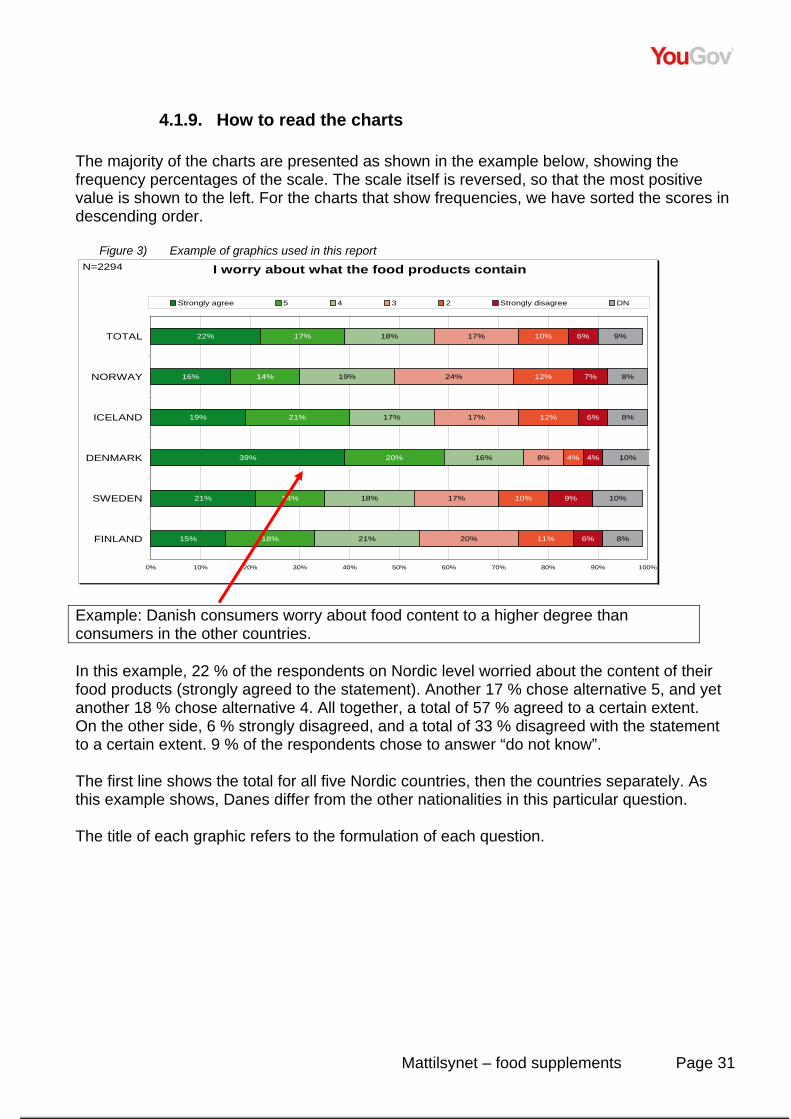
4.1.9. How to read the charts The majority of the charts are presented as shown in the example below, showing the frequency percentages of the scale. The scale itself is reversed, so that the most positive value is shown to the left. For the charts that show frequencies, we have sorted the scores in descending order.
Figure 3) Example of graphics used in this report I worry about what the food products contain
22%
16%
19%
39%
21%
15%
17%
14%
21%
20%
14%
18%
18%
19%
17%
16%
18%
21%
17%
24%
17%
8%
17%
20%
10%
12%
12%
4%
10%
11%
6%
7%
6%
4%
9%
6%
9%
8%
8%
10%
10%
8%
0% 10% 20% 30% 40% 50% 60% 70% 80% 90% 100%
TOTAL
NORWAY
ICELAND
DENMARK
SWEDEN
FINLAND
Strongly agree 5 4 3 2 Strongly disagree DN
N=2294
Example: Danish consumers worry about food content to a higher degree than consumers in the other countries. In this example, 22 % of the respondents on Nordic level worried about the content of their food products (strongly agreed to the statement). Another 17 % chose alternative 5, and yet another 18 % chose alternative 4. All together, a total of 57 % agreed to a certain extent. On the other side, 6 % strongly disagreed, and a total of 33 % disagreed with the statement to a certain extent. 9 % of the respondents chose to answer “do not know”. The first line shows the total for all five Nordic countries, then the countries separately. As this example shows, Danes differ from the other nationalities in this particular question. The title of each graphic refers to the formulation of each question.

Mattilsynet – food supplements Page 32
5. The results of the quantitative survey In the following we present the results from the quantitative survey
5.1. Exercise in the Nordic countries At first we put forward some questions about exercise and training in general terms. The question is included mainly for two reasons. Firstly, we wanted to map the activity level of the Nordic population. Secondly, we would like to understand the correlation between levels of exercising and usage and attitudes of food supplements. The Nordic people, as a group, are an active population. Only 4 % say that they never do any exercise. As many as 39 % say they exercise 3-4 times a week or more. On a country level, people in Iceland, Denmark and Finland seem to be more in motion than Norwegians and Swedes; 7 % of them say that they never exercise at all.
Figure 4) Exercise in the Nordic countries How often do you exercise?
14%
10%
17%
19%
10%
17%
25%
20%
26%
31%
20%
28%
29%
33%
29%
19%
31%
31%
14%
17%
10%
13%
16%
12%
12%
11%
11%
11%
16%
10%
4%
7%
5%
1%
7%
2%
2%
1%
1%
6%
0%
0% 10% 20% 30% 40% 50% 60% 70% 80% 90% 100%
TOTAL
NORWAY
ICELAND
DENMARK
SWEDEN
FINLAND
5 times or more a week 3-4 times a week 1-2 times a week less than once a week More seldom Never DN
N=2264
Further findings reveal that only 50 % of people under 20 years and people of 70 years and above exercise at least 3-4 times per week.
Mattilsynet – food supplements Page 33
5.2. Focus on diet
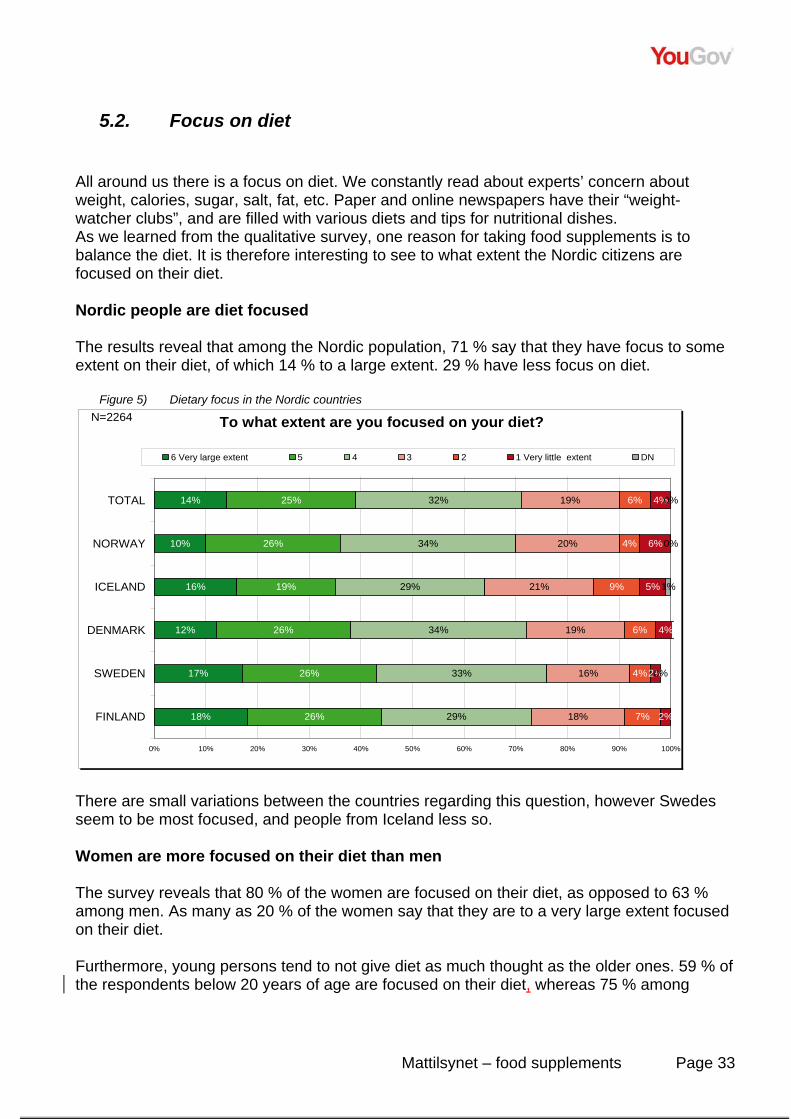
All around us there is a focus on diet. We constantly read about experts’ concern about weight, calories, sugar, salt, fat, etc. Paper and online newspapers have their “weight-watcher clubs”, and are filled with various diets and tips for nutritional dishes. As we learned from the qualitative survey, one reason for taking food supplements is to balance the diet. It is therefore interesting to see to what extent the Nordic citizens are focused on their diet. Nordic people are diet focused The results reveal that among the Nordic population, 71 % say that they have focus to some extent on their diet, of which 14 % to a large extent. 29 % have less focus on diet.
Figure 5) Dietary focus in the Nordic countries
To what extent are you focused on your diet?
14%
10%
16%
12%
17%
18%
25%
26%
19%
26%
26%
26%
32%
34%
29%
34%
33%
29%
19%
20%
21%
19%
16%
18%
6%
4%
9%
6%
4%
7%
4%
6%
5%
4%
2%
2%
0%
0%
1%
0%
0% 10% 20% 30% 40% 50% 60% 70% 80% 90% 100%
TOTAL
NORWAY
ICELAND
DENMARK
SWEDEN
FINLAND
6 Very large extent 5 4 3 2 1 Very little extent DN
N=2264
There are small variations between the countries regarding this question, however Swedes seem to be most focused, and people from Iceland less so. Women are more focused on their diet than men The survey reveals that 80 % of the women are focused on their diet, as opposed to 63 % among men. As many as 20 % of the women say that they are to a very large extent focused on their diet. Furthermore, young persons tend to not give diet as much thought as the older ones. 59 % of the respondents below 20 years of age are focused on their diet, whereas 75 % among
Mattilsynet – food supplements Page 34
people above 60 do have such focus. Consumers at the age of 20-60 years represent the average of the population. The survey also shows that people with high education are more diet focused than people with low education, 75% versus 61%. There are no larger differences between different income groups. Active people focus more on their diet There is a close correlation between diet focus and exercising. 89 % of people who exercise at least 3-4 times per week have focus on their diet. Corresponding figures for people who rarely or never exercise is 50 %.
Mattilsynet – food supplements Page 35
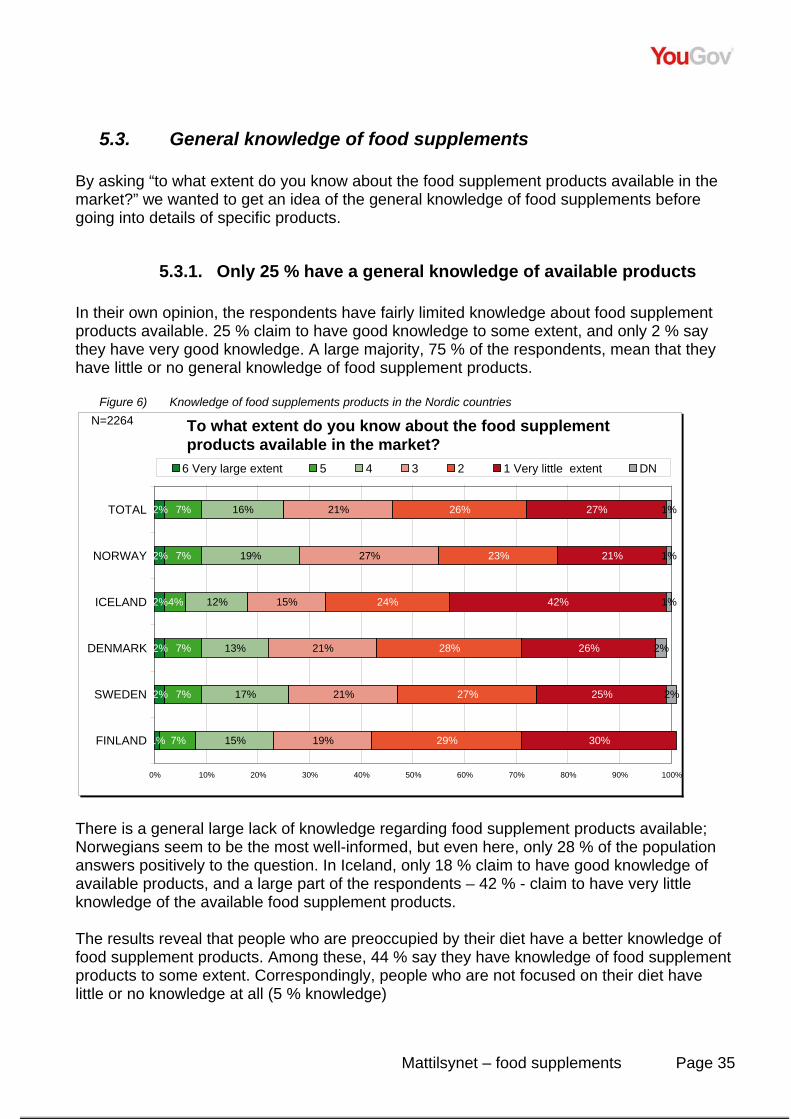
5.3. General knowledge of food supplements By asking “to what extent do you know about the food supplement products available in the market?” we wanted to get an idea of the general knowledge of food supplements before going into details of specific products.
5.3.1. Only 25 % have a general knowledge of available products In their own opinion, the respondents have fairly limited knowledge about food supplement products available. 25 % claim to have good knowledge to some extent, and only 2 % say they have very good knowledge. A large majority, 75 % of the respondents, mean that they have little or no general knowledge of food supplement products.
Figure 6) Knowledge of food supplements products in the Nordic countries
There is a general large lack of knowledge regarding food supplement products available; Norwegians seem to be the most well-informed, but even here, only 28 % of the population answers positively to the question. In Iceland, only 18 % claim to have good knowledge of available products, and a large part of the respondents – 42 % - claim to have very little knowledge of the available food supplement products. The results reveal that people who are preoccupied by their diet have a better knowledge of food supplement products. Among these, 44 % say they have knowledge of food supplement products to some extent. Correspondingly, people who are not focused on their diet have little or no knowledge at all (5 % knowledge)
To what extent do you know about the food supplement products available in the market?
2%
2%
2%
2%
2%
1%
7%
7%
4%
7%
7%
7%
16%
19%
12%
13%
17%
15%
21%
27%
15%
21%
21%
19%
26%
23%
24%
28%
27%
29%
27%
21%
42%
26%
25%
30%
1%
1%
1%
2%
2%
0% 10% 20% 30% 40% 50% 60% 70% 80% 90% 100%
TOTAL
NORWAY
ICELAND
DENMARK
SWEDEN
FINLAND
6 Very large extent 5 4 3 2 1 Very little extent DN
N=2264
Mattilsynet – food supplements Page 36
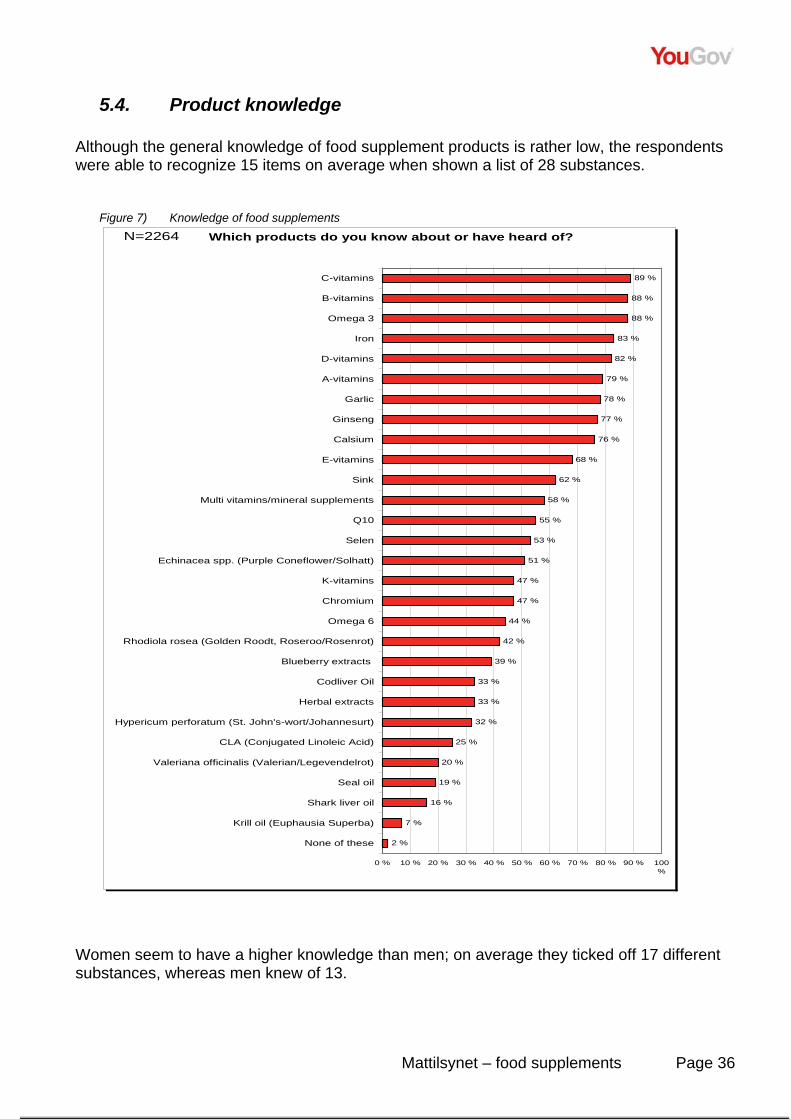
5.4. Product knowledge Although the general knowledge of food supplement products is rather low, the respondents were able to recognize 15 items on average when shown a list of 28 substances.
Figure 7) Knowledge of food supplements Which products do you know about or have heard of?
89 %
88 %
88 %
83 %
82 %
79 %
78 %
77 %
76 %
68 %
62 %
58 %
55 %
53 %
51 %
47 %
47 %
44 %
42 %
39 %
33 %
33 %
32 %
25 %
20 %
19 %
16 %
7 %
2 %
0 % 10 % 20 % 30 % 40 % 50 % 60 % 70 % 80 % 90 % 100%
C-vitamins
B-vitamins
Omega 3
Iron
D-vitamins
A-vitamins
Garlic
Ginseng
Calsium
E-vitamins
Sink
Multi vitamins/mineral supplements
Q10
Selen
Echinacea spp. (Purple Coneflower/Solhatt)
K-vitamins
Chromium
Omega 6
Rhodiola rosea (Golden Roodt, Roseroo/Rosenrot)
Blueberry extracts
Codliver Oil
Herbal extracts
Hypericum perforatum (St. John's-wort/Johannesurt)
CLA (Conjugated Linoleic Acid)
Valeriana officinalis (Valerian/Legevendelrot)
Seal oil
Shark liver oil
Krill oil (Euphausia Superba)
None of these
N=2264
Women seem to have a higher knowledge than men; on average they ticked off 17 different substances, whereas men knew of 13.
Mattilsynet – food supplements Page 37
Vitamins C and B top the list together with omega 3; all these substances were known to 88-89 % of the respondents. On the following places we find iron, vitamins D and A, and garlic, ginseng and calcium, all with a knowledge rate of more than 76 %. On the bottom of the list, we find oil from marine animals; krill oil was the least known product, with 7 % knowledge rate, behind shark liver oil and seal oil.
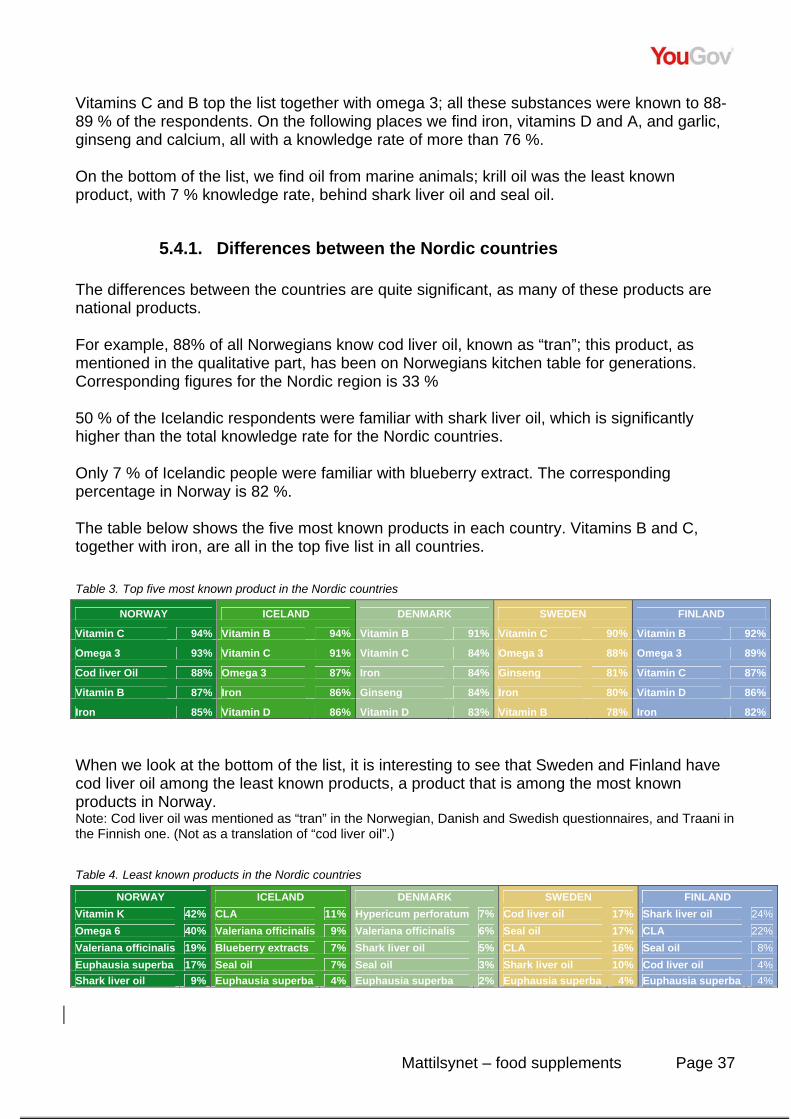
5.4.1. Differences between the Nordic countries The differences between the countries are quite significant, as many of these products are national products. For example, 88% of all Norwegians know cod liver oil, known as “tran”; this product, as mentioned in the qualitative part, has been on Norwegians kitchen table for generations. Corresponding figures for the Nordic region is 33 % 50 % of the Icelandic respondents were familiar with shark liver oil, which is significantly higher than the total knowledge rate for the Nordic countries. Only 7 % of Icelandic people were familiar with blueberry extract. The corresponding percentage in Norway is 82 %. The table below shows the five most known products in each country. Vitamins B and C, together with iron, are all in the top five list in all countries. Table 3. Top five most known product in the Nordic countries
NORWAY ICELAND DENMARK SWEDEN FINLAND
Vitamin C 94% Vitamin B 94% Vitamin B 91% Vitamin C 90% Vitamin B 92%
Omega 3 93% Vitamin C 91% Vitamin C 84% Omega 3 88% Omega 3 89%
Cod liver Oil 88% Omega 3 87% Iron 84% Ginseng 81% Vitamin C 87%
Vitamin B 87% Iron 86% Ginseng 84% Iron 80% Vitamin D 86%
Iron 85% Vitamin D 86% Vitamin D 83% Vitamin B 78% Iron 82% When we look at the bottom of the list, it is interesting to see that Sweden and Finland have cod liver oil among the least known products, a product that is among the most known products in Norway. Note: Cod liver oil was mentioned as “tran” in the Norwegian, Danish and Swedish questionnaires, and Traani in the Finnish one. (Not as a translation of “cod liver oil”.) Table 4. Least known products in the Nordic countries
NORWAY ICELAND DENMARK SWEDEN FINLAND Vitamin K 42% CLA 11% Hypericum perforatum 7% Cod liver oil 17% Shark liver oil 24%Omega 6 40% Valeriana officinalis 9% Valeriana officinalis 6% Seal oil 17% CLA 22%Valeriana officinalis 19% Blueberry extracts 7% Shark liver oil 5% CLA 16% Seal oil 8%Euphausia superba 17% Seal oil 7% Seal oil 3% Shark liver oil 10% Cod liver oil 4%Shark liver oil 9% Euphausia superba 4% Euphausia superba 2% Euphausia superba 4% Euphausia superba 4%
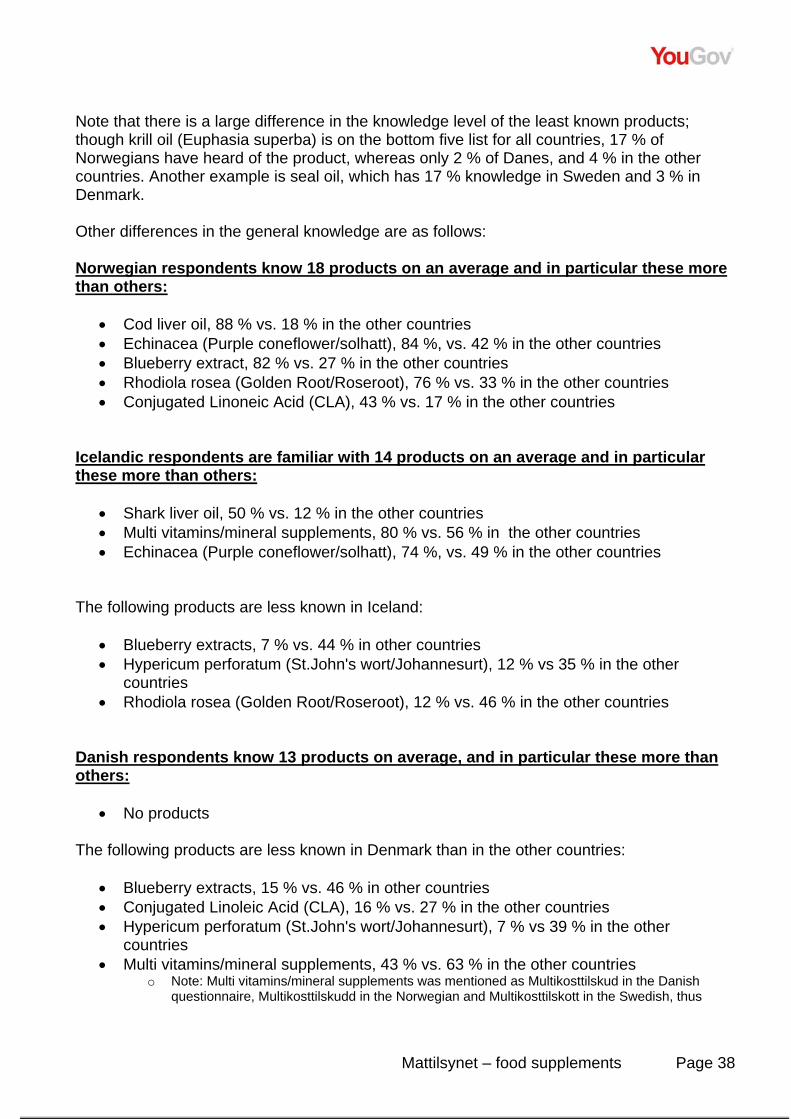
Mattilsynet – food supplements Page 38
Note that there is a large difference in the knowledge level of the least known products; though krill oil (Euphasia superba) is on the bottom five list for all countries, 17 % of Norwegians have heard of the product, whereas only 2 % of Danes, and 4 % in the other countries. Another example is seal oil, which has 17 % knowledge in Sweden and 3 % in Denmark. Other differences in the general knowledge are as follows: Norwegian respondents know 18 products on an average and in particular these more than others:
• Cod liver oil, 88 % vs. 18 % in the other countries • Echinacea (Purple coneflower/solhatt), 84 %, vs. 42 % in the other countries • Blueberry extract, 82 % vs. 27 % in the other countries • Rhodiola rosea (Golden Root/Roseroot), 76 % vs. 33 % in the other countries • Conjugated Linoneic Acid (CLA), 43 % vs. 17 % in the other countries
Icelandic respondents are familiar with 14 products on an average and in particular these more than others:
• Shark liver oil, 50 % vs. 12 % in the other countries • Multi vitamins/mineral supplements, 80 % vs. 56 % in the other countries • Echinacea (Purple coneflower/solhatt), 74 %, vs. 49 % in the other countries
The following products are less known in Iceland:
• Blueberry extracts, 7 % vs. 44 % in other countries • Hypericum perforatum (St.John's wort/Johannesurt), 12 % vs 35 % in the other
countries • Rhodiola rosea (Golden Root/Roseroot), 12 % vs. 46 % in the other countries
Danish respondents know 13 products on average, and in particular these more than others:
• No products The following products are less known in Denmark than in the other countries:
• Blueberry extracts, 15 % vs. 46 % in other countries • Conjugated Linoleic Acid (CLA), 16 % vs. 27 % in the other countries • Hypericum perforatum (St.John's wort/Johannesurt), 7 % vs 39 % in the other
countries • Multi vitamins/mineral supplements, 43 % vs. 63 % in the other countries
o Note: Multi vitamins/mineral supplements was mentioned as Multikosttilskud in the Danish questionnaire, Multikosttilskudd in the Norwegian and Multikosttilskott in the Swedish, thus
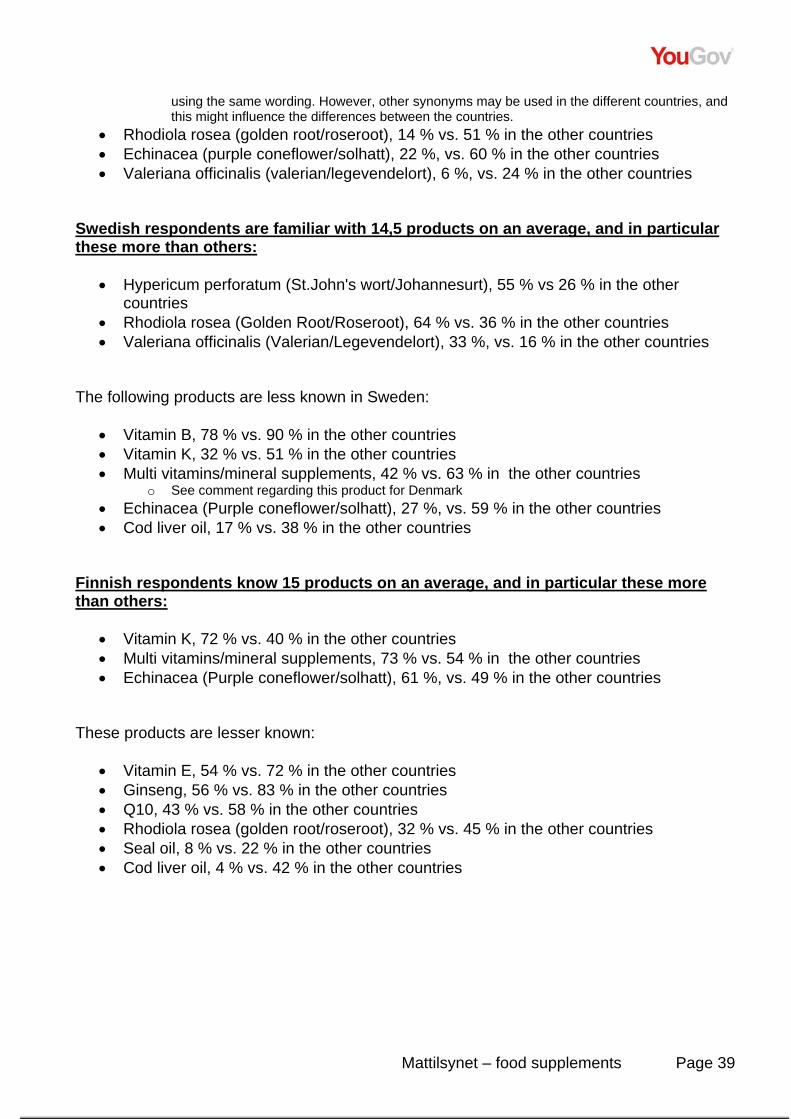
Mattilsynet – food supplements Page 39
using the same wording. However, other synonyms may be used in the different countries, and this might influence the differences between the countries.
• Rhodiola rosea (golden root/roseroot), 14 % vs. 51 % in the other countries • Echinacea (purple coneflower/solhatt), 22 %, vs. 60 % in the other countries • Valeriana officinalis (valerian/legevendelort), 6 %, vs. 24 % in the other countries
Swedish respondents are familiar with 14,5 products on an average, and in particular these more than others:
• Hypericum perforatum (St.John's wort/Johannesurt), 55 % vs 26 % in the other countries
• Rhodiola rosea (Golden Root/Roseroot), 64 % vs. 36 % in the other countries • Valeriana officinalis (Valerian/Legevendelort), 33 %, vs. 16 % in the other countries
The following products are less known in Sweden:
• Vitamin B, 78 % vs. 90 % in the other countries • Vitamin K, 32 % vs. 51 % in the other countries • Multi vitamins/mineral supplements, 42 % vs. 63 % in the other countries
o See comment regarding this product for Denmark • Echinacea (Purple coneflower/solhatt), 27 %, vs. 59 % in the other countries • Cod liver oil, 17 % vs. 38 % in the other countries
Finnish respondents know 15 products on an average, and in particular these more than others:
• Vitamin K, 72 % vs. 40 % in the other countries • Multi vitamins/mineral supplements, 73 % vs. 54 % in the other countries • Echinacea (Purple coneflower/solhatt), 61 %, vs. 49 % in the other countries
These products are lesser known:
• Vitamin E, 54 % vs. 72 % in the other countries • Ginseng, 56 % vs. 83 % in the other countries • Q10, 43 % vs. 58 % in the other countries • Rhodiola rosea (golden root/roseroot), 32 % vs. 45 % in the other countries • Seal oil, 8 % vs. 22 % in the other countries • Cod liver oil, 4 % vs. 42 % in the other countries
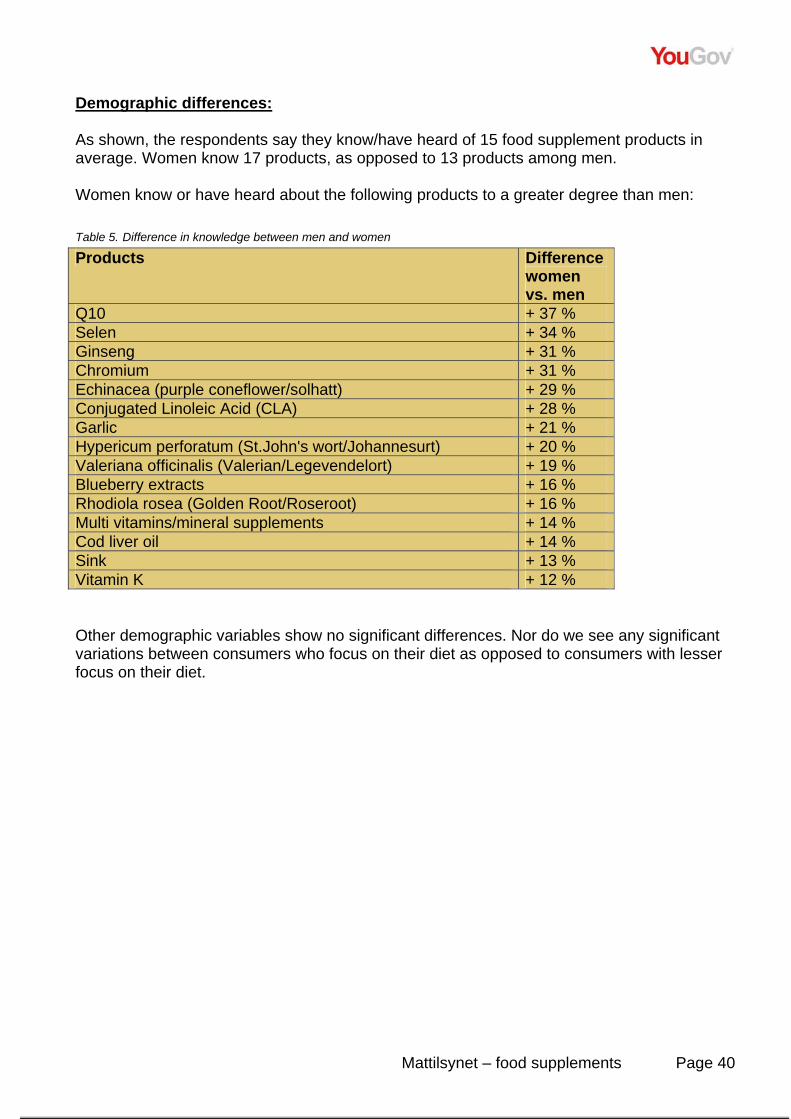
Mattilsynet – food supplements Page 40
Demographic differences: As shown, the respondents say they know/have heard of 15 food supplement products in average. Women know 17 products, as opposed to 13 products among men. Women know or have heard about the following products to a greater degree than men: Table 5. Difference in knowledge between men and women
Products Difference women vs. men
Q10 + 37 % Selen + 34 % Ginseng + 31 % Chromium + 31 % Echinacea (purple coneflower/solhatt) + 29 % Conjugated Linoleic Acid (CLA) + 28 % Garlic + 21 % Hypericum perforatum (St.John's wort/Johannesurt) + 20 % Valeriana officinalis (Valerian/Legevendelort) + 19 % Blueberry extracts + 16 % Rhodiola rosea (Golden Root/Roseroot) + 16 % Multi vitamins/mineral supplements + 14 % Cod liver oil + 14 % Sink + 13 % Vitamin K + 12 % Other demographic variables show no significant differences. Nor do we see any significant variations between consumers who focus on their diet as opposed to consumers with lesser focus on their diet.
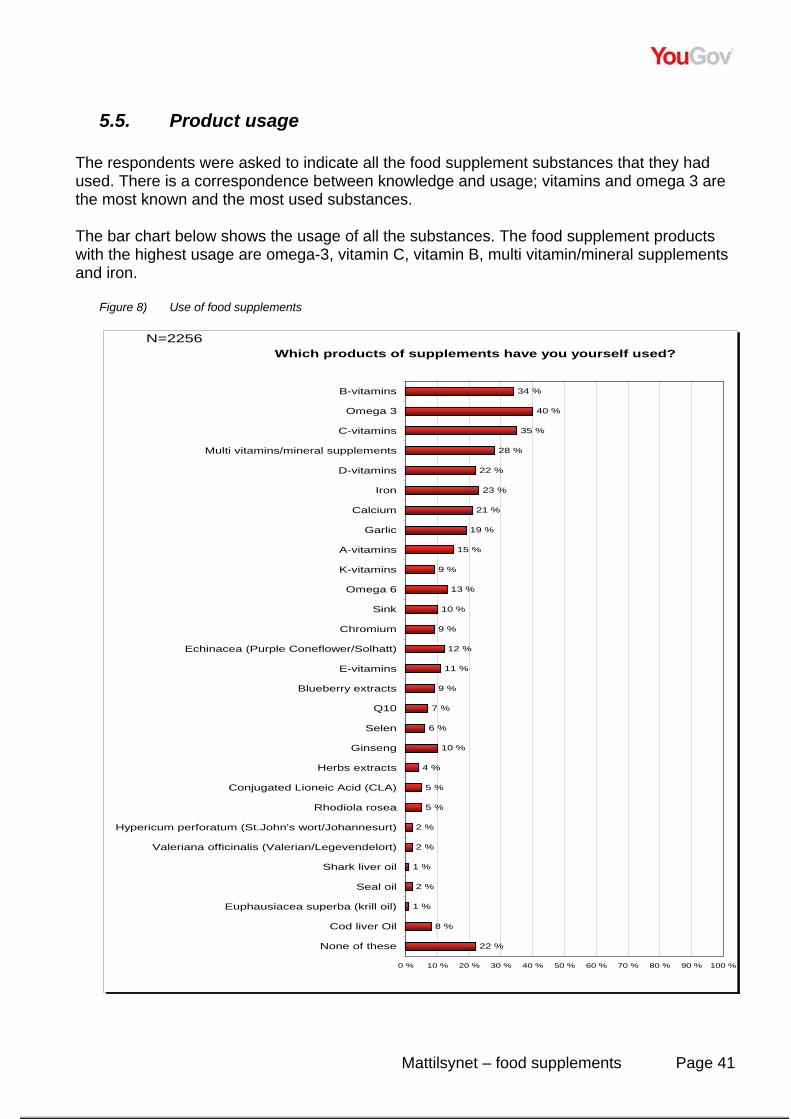
Mattilsynet – food supplements Page 41
5.5. Product usage The respondents were asked to indicate all the food supplement substances that they had used. There is a correspondence between knowledge and usage; vitamins and omega 3 are the most known and the most used substances. The bar chart below shows the usage of all the substances. The food supplement products with the highest usage are omega-3, vitamin C, vitamin B, multi vitamin/mineral supplements and iron.
Figure 8) Use of food supplements
Which products of supplements have you yourself used?
34 %
40 %
35 %
28 %
22 %
23 %
21 %
19 %
15 %
9 %
13 %
10 %
9 %
12 %
11 %
9 %
7 %
6 %
10 %
4 %
5 %
5 %
2 %
2 %
1 %
2 %
1 %
8 %
22 %
0 % 10 % 20 % 30 % 40 % 50 % 60 % 70 % 80 % 90 % 100 %
B-vitamins
Omega 3
C-vitamins
Multi vitamins/mineral supplements
D-vitamins
Iron
Calcium
Garlic
A-vitamins
K-vitamins
Omega 6
Sink
Chromium
Echinacea (Purple Coneflower/Solhatt)
E-vitamins
Blueberry extracts
Q10
Selen
Ginseng
Herbs extracts
Conjugated Lioneic Acid (CLA)
Rhodiola rosea
Hypericum perforatum (St.John's wort/Johannesurt)
Valeriana officinalis (Valerian/Legevendelort)
Shark liver oil
Seal oil
Euphausiacea superba (krill oil)
Cod liver Oil
None of these
N=2256
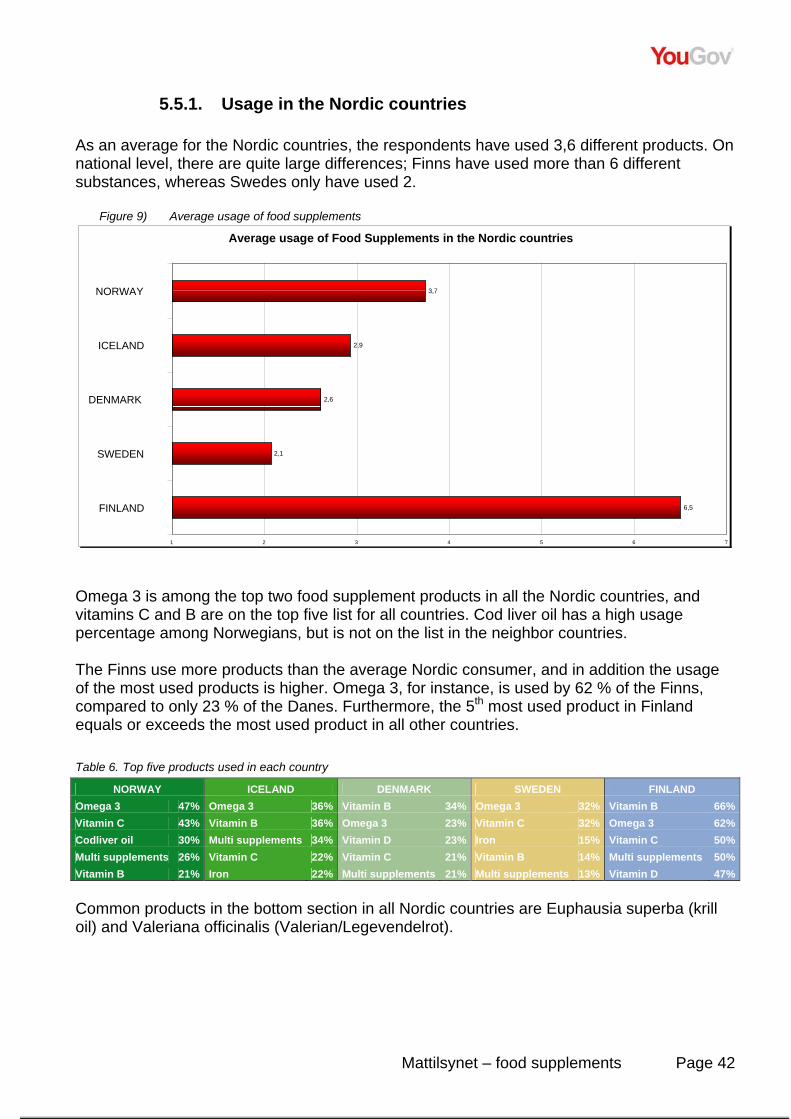
Mattilsynet – food supplements Page 42
5.5.1. Usage in the Nordic countries As an average for the Nordic countries, the respondents have used 3,6 different products. On national level, there are quite large differences; Finns have used more than 6 different substances, whereas Swedes only have used 2.
Figure 9) Average usage of food supplements
Omega 3 is among the top two food supplement products in all the Nordic countries, and vitamins C and B are on the top five list for all countries. Cod liver oil has a high usage percentage among Norwegians, but is not on the list in the neighbor countries. The Finns use more products than the average Nordic consumer, and in addition the usage of the most used products is higher. Omega 3, for instance, is used by 62 % of the Finns, compared to only 23 % of the Danes. Furthermore, the 5th most used product in Finland equals or exceeds the most used product in all other countries. Table 6. Top five products used in each country
NORWAY ICELAND DENMARK SWEDEN FINLAND Omega 3 47% Omega 3 36% Vitamin B 34% Omega 3 32% Vitamin B 66%Vitamin C 43% Vitamin B 36% Omega 3 23% Vitamin C 32% Omega 3 62%Codliver oil 30% Multi supplements 34% Vitamin D 23% Iron 15% Vitamin C 50%Multi supplements 26% Vitamin C 22% Vitamin C 21% Vitamin B 14% Multi supplements 50%Vitamin B 21% Iron 22% Multi supplements 21% Multi supplements 13% Vitamin D 47% Common products in the bottom section in all Nordic countries are Euphausia superba (krill oil) and Valeriana officinalis (Valerian/Legevendelrot).
Average usage of Food Supplements in the Nordic countries
3,7
2,9
2,6
2,1
6,5
1 2 3 4 5 6 7
NORWAY
ICELAND
DENMARK
SWEDEN
FINLAND
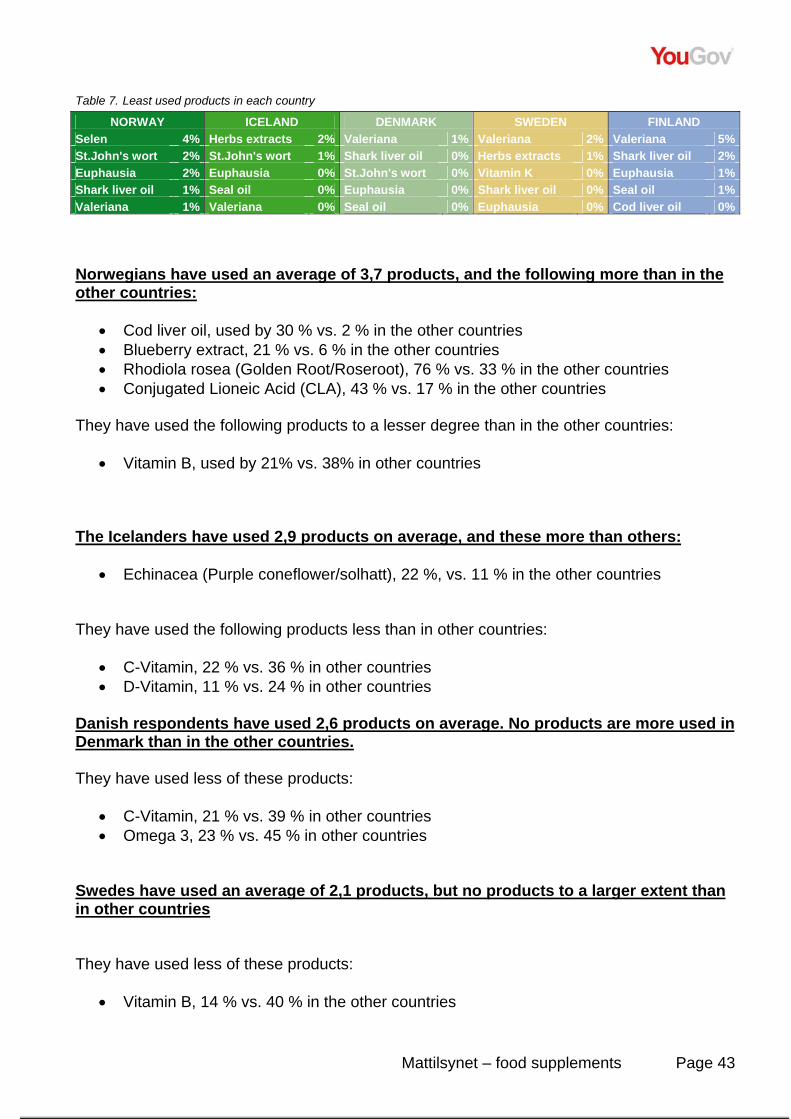
Mattilsynet – food supplements Page 43
Table 7. Least used products in each country
NORWAY ICELAND DENMARK SWEDEN FINLAND Selen 4% Herbs extracts 2% Valeriana 1% Valeriana 2% Valeriana 5%St.John's wort 2% St.John's wort 1% Shark liver oil 0% Herbs extracts 1% Shark liver oil 2%Euphausia 2% Euphausia 0% St.John's wort 0% Vitamin K 0% Euphausia 1%Shark liver oil 1% Seal oil 0% Euphausia 0% Shark liver oil 0% Seal oil 1%Valeriana 1% Valeriana 0% Seal oil 0% Euphausia 0% Cod liver oil 0% Norwegians have used an average of 3,7 products, and the following more than in the other countries:
• Cod liver oil, used by 30 % vs. 2 % in the other countries • Blueberry extract, 21 % vs. 6 % in the other countries • Rhodiola rosea (Golden Root/Roseroot), 76 % vs. 33 % in the other countries • Conjugated Lioneic Acid (CLA), 43 % vs. 17 % in the other countries
They have used the following products to a lesser degree than in the other countries:
• Vitamin B, used by 21% vs. 38% in other countries The Icelanders have used 2,9 products on average, and these more than others:
• Echinacea (Purple coneflower/solhatt), 22 %, vs. 11 % in the other countries
They have used the following products less than in other countries:
• C-Vitamin, 22 % vs. 36 % in other countries • D-Vitamin, 11 % vs. 24 % in other countries
Danish respondents have used 2,6 products on average. No products are more used in Denmark than in the other countries. They have used less of these products:
• C-Vitamin, 21 % vs. 39 % in other countries • Omega 3, 23 % vs. 45 % in other countries
Swedes have used an average of 2,1 products, but no products to a larger extent than in other countries
They have used less of these products:
• Vitamin B, 14 % vs. 40 % in the other countries
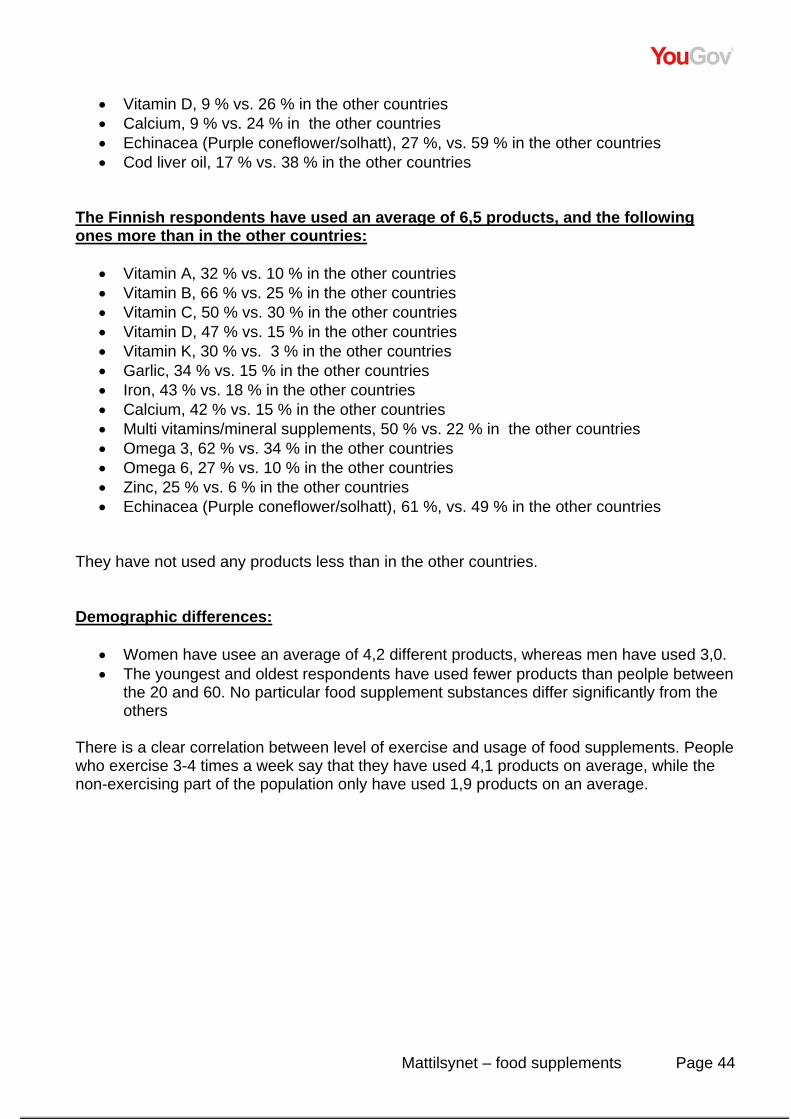
Mattilsynet – food supplements Page 44
• Vitamin D, 9 % vs. 26 % in the other countries • Calcium, 9 % vs. 24 % in the other countries • Echinacea (Purple coneflower/solhatt), 27 %, vs. 59 % in the other countries • Cod liver oil, 17 % vs. 38 % in the other countries
The Finnish respondents have used an average of 6,5 products, and the following ones more than in the other countries:
• Vitamin A, 32 % vs. 10 % in the other countries • Vitamin B, 66 % vs. 25 % in the other countries • Vitamin C, 50 % vs. 30 % in the other countries • Vitamin D, 47 % vs. 15 % in the other countries • Vitamin K, 30 % vs. 3 % in the other countries • Garlic, 34 % vs. 15 % in the other countries • Iron, 43 % vs. 18 % in the other countries • Calcium, 42 % vs. 15 % in the other countries • Multi vitamins/mineral supplements, 50 % vs. 22 % in the other countries • Omega 3, 62 % vs. 34 % in the other countries • Omega 6, 27 % vs. 10 % in the other countries • Zinc, 25 % vs. 6 % in the other countries • Echinacea (Purple coneflower/solhatt), 61 %, vs. 49 % in the other countries
They have not used any products less than in the other countries. Demographic differences:
• Women have usee an average of 4,2 different products, whereas men have used 3,0. • The youngest and oldest respondents have used fewer products than peolple between
the 20 and 60. No particular food supplement substances differ significantly from the others
There is a clear correlation between level of exercise and usage of food supplements. People who exercise 3-4 times a week say that they have used 4,1 products on average, while the non-exercising part of the population only have used 1,9 products on an average.
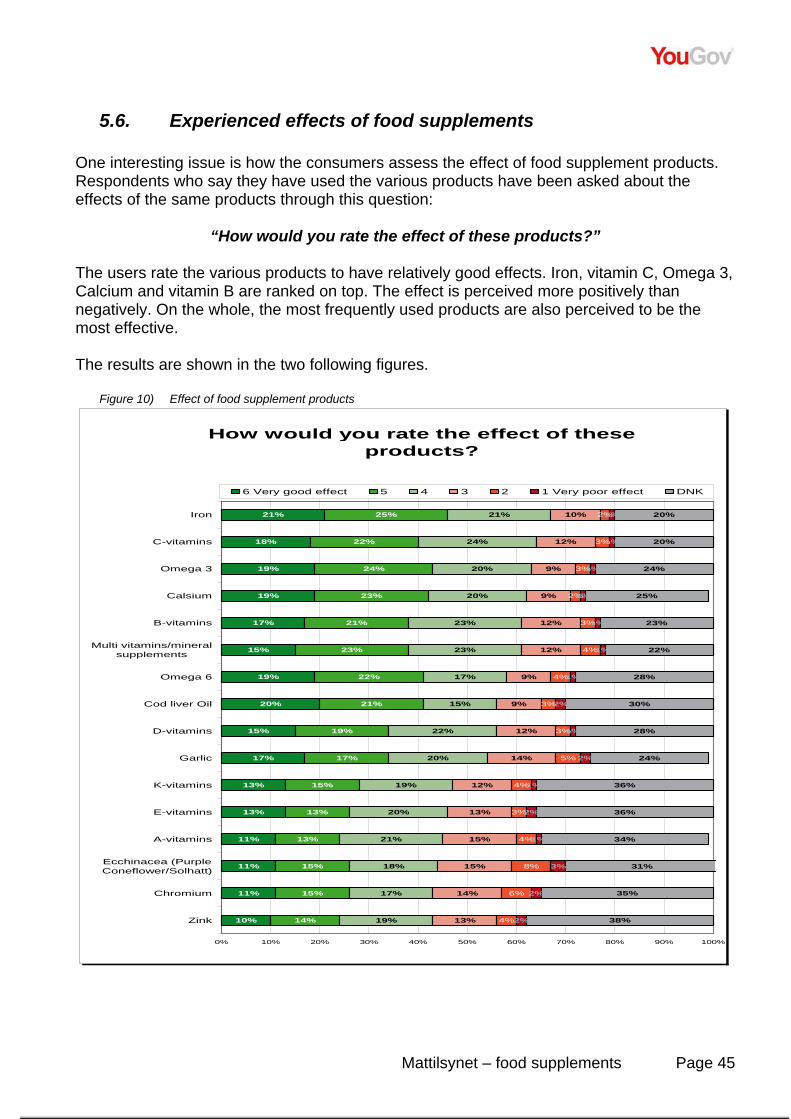
Mattilsynet – food supplements Page 45
5.6. Experienced effects of food supplements One interesting issue is how the consumers assess the effect of food supplement products. Respondents who say they have used the various products have been asked about the effects of the same products through this question:
“How would you rate the effect of these products?” The users rate the various products to have relatively good effects. Iron, vitamin C, Omega 3, Calcium and vitamin B are ranked on top. The effect is perceived more positively than negatively. On the whole, the most frequently used products are also perceived to be the most effective. The results are shown in the two following figures.
Figure 10) Effect of food supplement products
How would you rate the effect of these products?
21%
18%
19%
19%
17%
15%
19%
20%
15%
17%
13%
13%
11%
11%
11%
10%
25%
22%
24%
23%
21%
23%
22%
21%
19%
17%
15%
13%
13%
15%
15%
14%
21%
24%
20%
20%
23%
23%
17%
15%
22%
20%
19%
20%
21%
18%
17%
19%
10%
12%
9%
9%
12%
12%
9%
9%
12%
14%
12%
13%
15%
15%
14%
13%
2%
3%
3%
2%
3%
4%
4%
3%
3%
5%
4%
3%
4%
8%
6%
4%
1%
1%
1%
1%
1%
1%
1%
2%
1%
2%
1%
2%
1%
3%
2%
2%
20%
20%
24%
25%
23%
22%
28%
30%
28%
24%
36%
36%
34%
31%
35%
38%
0% 10% 20% 30% 40% 50% 60% 70% 80% 90% 100%
Iron
C-vitamins
Omega 3
Calsium
B-vitamins
Multi vitamins/mineralsupplements
Omega 6
Cod liver Oil
D-vitamins
Garlic
K-vitamins
E-vitamins
A-vitamins
Ecchinacea (PurpleConeflower/Solhatt)
Chromium
Zink
6 Very good effect 5 4 3 2 1 Very poor effect DNK
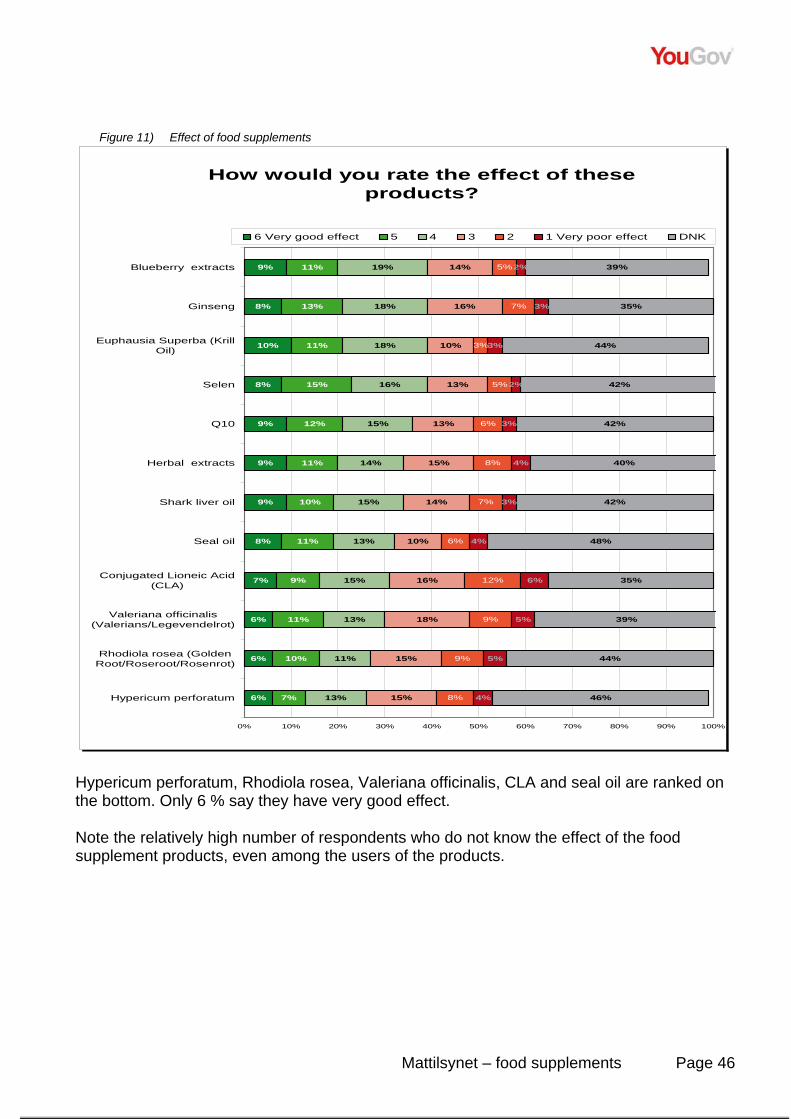
Mattilsynet – food supplements Page 46
Figure 11) Effect of food supplements
How would you rate the effect of these products?
9%
8%
10%
8%
9%
9%
9%
8%
7%
6%
6%
6%
11%
13%
11%
15%
12%
11%
10%
11%
9%
11%
10%
7%
19%
18%
18%
16%
15%
14%
15%
13%
15%
13%
11%
13%
14%
16%
10%
13%
13%
15%
14%
10%
16%
18%
15%
15%
5%
7%
3%
5%
6%
8%
7%
6%
12%
9%
9%
8%
2%
3%
3%
2%
3%
4%
3%
4%
6%
5%
5%
4%
39%
35%
44%
42%
42%
40%
42%
48%
35%
39%
44%
46%
0% 10% 20% 30% 40% 50% 60% 70% 80% 90% 100%
Blueberry extracts
Ginseng
Euphausia Superba (KrillOil)
Selen
Q10
Herbal extracts
Shark liver oil
Seal oil
Conjugated Lioneic Acid(CLA)
Valeriana officinalis(Valerians/Legevendelrot)
Rhodiola rosea (GoldenRoot/Roseroot/Rosenrot)
Hypericum perforatum
6 Very good effect 5 4 3 2 1 Very poor effect DNK
Hypericum perforatum, Rhodiola rosea, Valeriana officinalis, CLA and seal oil are ranked on the bottom. Only 6 % say they have very good effect. Note the relatively high number of respondents who do not know the effect of the food supplement products, even among the users of the products.
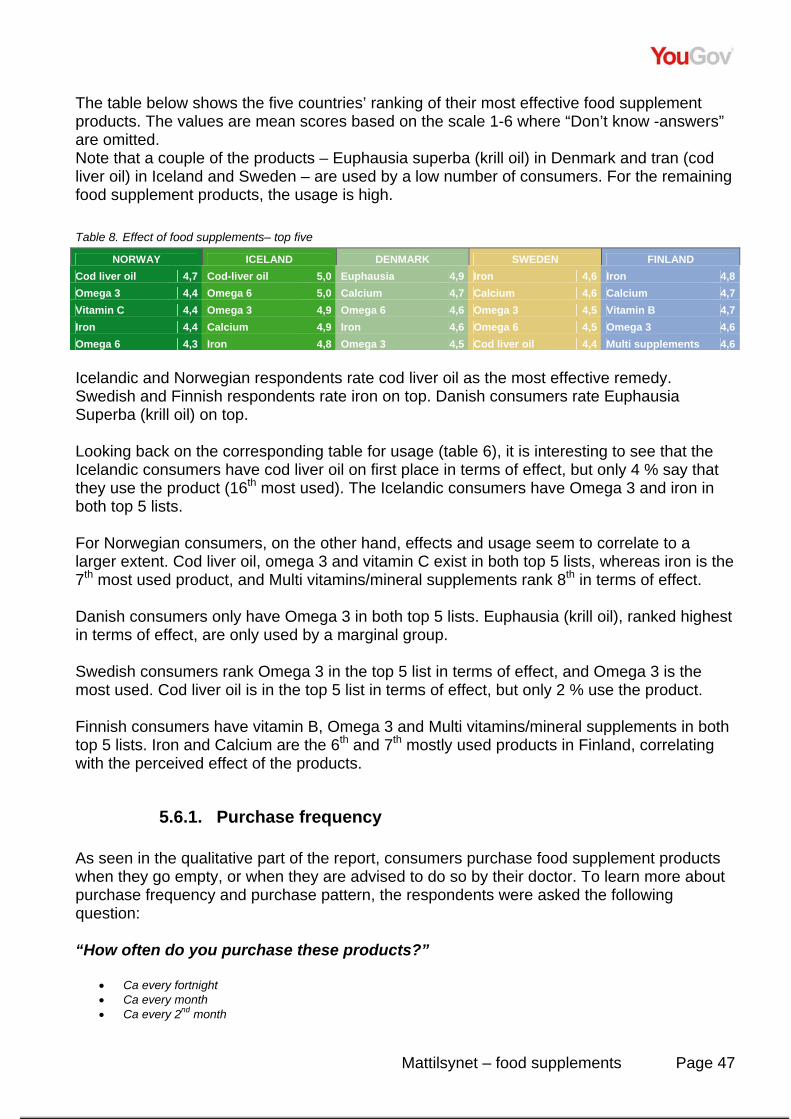
Mattilsynet – food supplements Page 47
The table below shows the five countries’ ranking of their most effective food supplement products. The values are mean scores based on the scale 1-6 where “Don’t know -answers” are omitted. Note that a couple of the products – Euphausia superba (krill oil) in Denmark and tran (cod liver oil) in Iceland and Sweden – are used by a low number of consumers. For the remaining food supplement products, the usage is high. Table 8. Effect of food supplements– top five
NORWAY ICELAND DENMARK SWEDEN FINLAND Cod liver oil 4,7 Cod-liver oil 5,0 Euphausia 4,9 Iron 4,6 Iron 4,8Omega 3 4,4 Omega 6 5,0 Calcium 4,7 Calcium 4,6 Calcium 4,7Vitamin C 4,4 Omega 3 4,9 Omega 6 4,6 Omega 3 4,5 Vitamin B 4,7Iron 4,4 Calcium 4,9 Iron 4,6 Omega 6 4,5 Omega 3 4,6Omega 6 4,3 Iron 4,8 Omega 3 4,5 Cod liver oil 4,4 Multi supplements 4,6 Icelandic and Norwegian respondents rate cod liver oil as the most effective remedy. Swedish and Finnish respondents rate iron on top. Danish consumers rate Euphausia Superba (krill oil) on top. Looking back on the corresponding table for usage (table 6), it is interesting to see that the Icelandic consumers have cod liver oil on first place in terms of effect, but only 4 % say that they use the product (16th most used). The Icelandic consumers have Omega 3 and iron in both top 5 lists. For Norwegian consumers, on the other hand, effects and usage seem to correlate to a larger extent. Cod liver oil, omega 3 and vitamin C exist in both top 5 lists, whereas iron is the 7th most used product, and Multi vitamins/mineral supplements rank 8th in terms of effect. Danish consumers only have Omega 3 in both top 5 lists. Euphausia (krill oil), ranked highest in terms of effect, are only used by a marginal group. Swedish consumers rank Omega 3 in the top 5 list in terms of effect, and Omega 3 is the most used. Cod liver oil is in the top 5 list in terms of effect, but only 2 % use the product. Finnish consumers have vitamin B, Omega 3 and Multi vitamins/mineral supplements in both top 5 lists. Iron and Calcium are the 6th and 7th mostly used products in Finland, correlating with the perceived effect of the products.
5.6.1. Purchase frequency As seen in the qualitative part of the report, consumers purchase food supplement products when they go empty, or when they are advised to do so by their doctor. To learn more about purchase frequency and purchase pattern, the respondents were asked the following question: “How often do you purchase these products?”
• Ca every fortnight • Ca every month • Ca every 2nd month
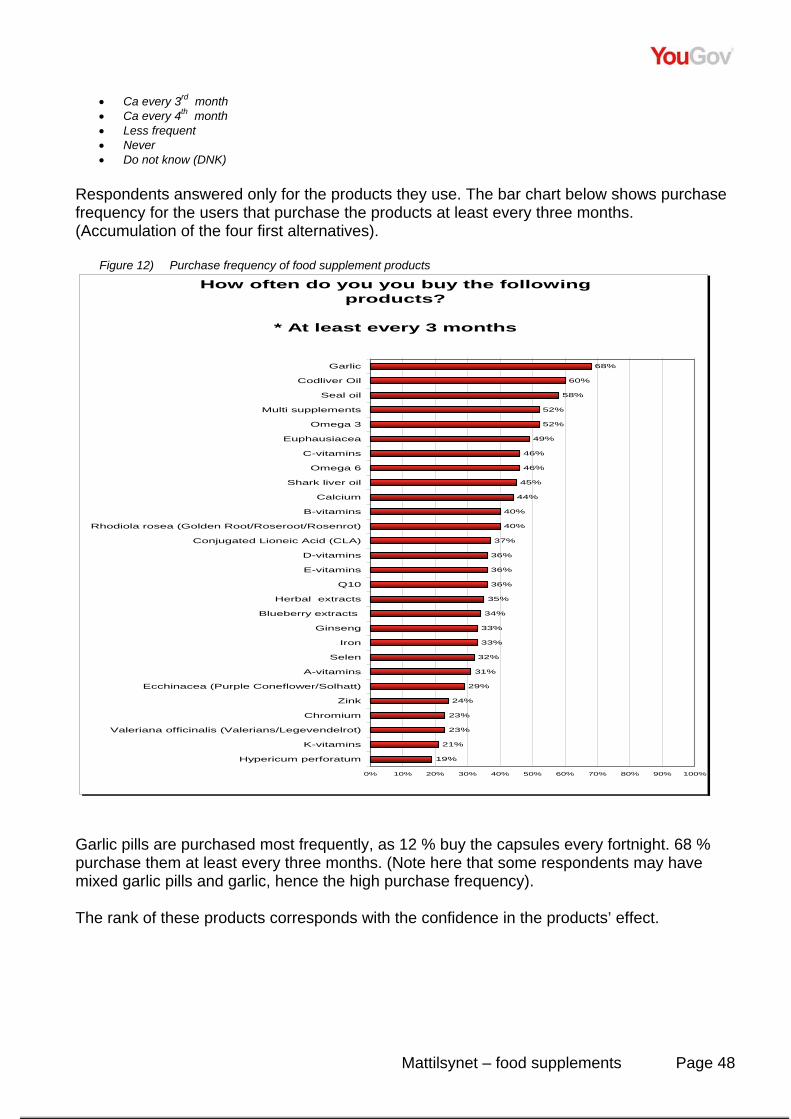
Mattilsynet – food supplements Page 48
• Ca every 3rd month • Ca every 4th month • Less frequent • Never • Do not know (DNK)
Respondents answered only for the products they use. The bar chart below shows purchase frequency for the users that purchase the products at least every three months. (Accumulation of the four first alternatives).
Figure 12) Purchase frequency of food supplement products How often do you you buy the following
products?
* At least every 3 months
68%
60%
58%
52%
52%
49%
46%
46%
45%
44%
40%
40%
37%
36%
36%
36%
35%
34%
33%
33%
32%
31%
29%
24%
23%
23%
21%
19%
0% 10% 20% 30% 40% 50% 60% 70% 80% 90% 100%
Garlic
Codliver Oil
Seal oil
Multi supplements
Omega 3
Euphausiacea
C-vitamins
Omega 6
Shark liver oil
Calcium
B-vitamins
Rhodiola rosea (Golden Root/Roseroot/Rosenrot)
Conjugated Lioneic Acid (CLA)
D-vitamins
E-vitamins
Q10
Herbal extracts
Blueberry extracts
Ginseng
Iron
Selen
A-vitamins
Ecchinacea (Purple Coneflower/Solhatt)
Zink
Chromium
Valeriana officinalis (Valerians/Legevendelrot)
K-vitamins
Hypericum perforatum
Garlic pills are purchased most frequently, as 12 % buy the capsules every fortnight. 68 % purchase them at least every three months. (Note here that some respondents may have mixed garlic pills and garlic, hence the high purchase frequency). The rank of these products corresponds with the confidence in the products’ effect.
Mattilsynet – food supplements Page 49
5.6.2. Buying pattern As many live in families, it is interesting to see what sort of products the consumers buy for themselves, and what products they buy for the household. The question asked was: “Do you purchase the following products for yourself or for others?
• For myself • For myself and other people in the household • For other people in the household”
Respondents answered only for the products that they have ticked off for product usage. Very few persons answered that they purchased the products only for others, (1 % on average), and this alternative is omitted in this report, as the frequencies based on the number of respondents only will show marginal differences. Most people either buy products for themselves, secondly for themselves and other household members.
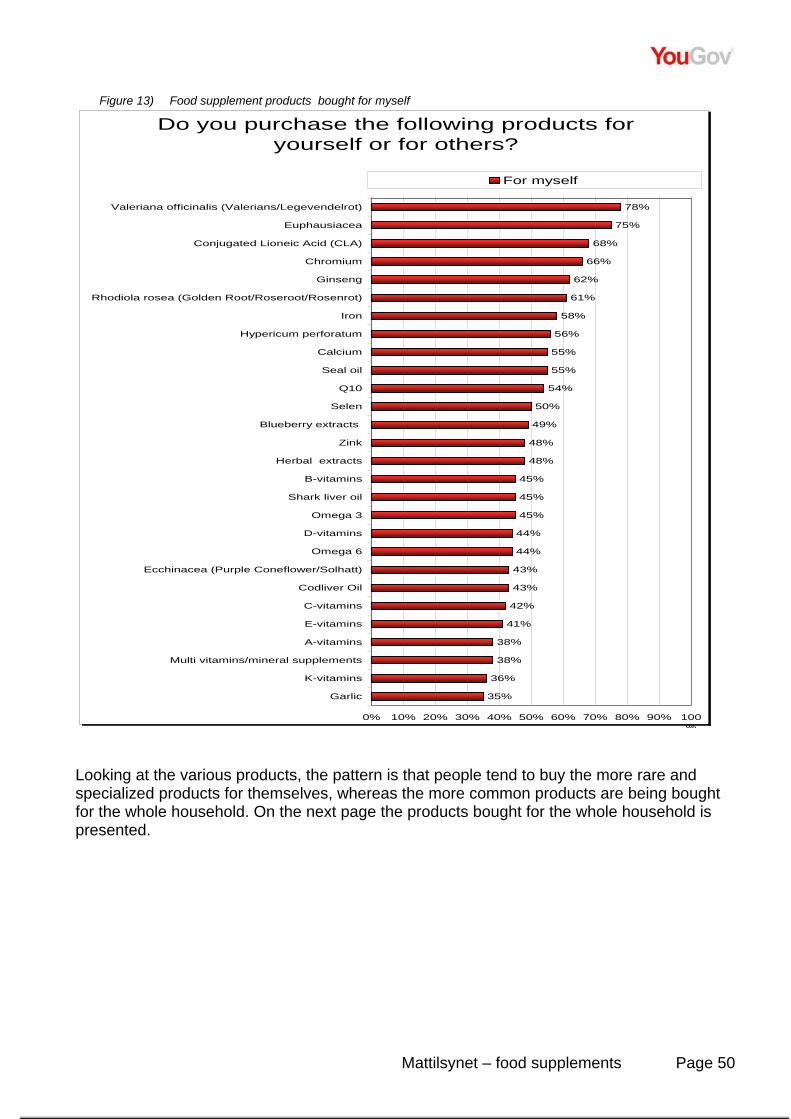
Mattilsynet – food supplements Page 50
Figure 13) Food supplement products bought for myself
Do you purchase the following products for yourself or for others?
78%
75%
68%
66%
62%
61%
58%
56%
55%
55%
54%
50%
49%
48%
48%
45%
45%
45%
44%
44%
43%
43%
42%
41%
38%
38%
36%
35%
0% 10% 20% 30% 40% 50% 60% 70% 80% 90% 100%
Valeriana officinalis (Valerians/Legevendelrot)
Euphausiacea
Conjugated Lioneic Acid (CLA)
Chromium
Ginseng
Rhodiola rosea (Golden Root/Roseroot/Rosenrot)
Iron
Hypericum perforatum
Calcium
Seal oil
Q10
Selen
Blueberry extracts
Zink
Herbal extracts
B-vitamins
Shark liver oil
Omega 3
D-vitamins
Omega 6
Ecchinacea (Purple Coneflower/Solhatt)
Codliver Oil
C-vitamins
E-vitamins
A-vitamins
Multi vitamins/mineral supplements
K-vitamins
Garlic
For myself
Looking at the various products, the pattern is that people tend to buy the more rare and specialized products for themselves, whereas the more common products are being bought for the whole household. On the next page the products bought for the whole household is presented.
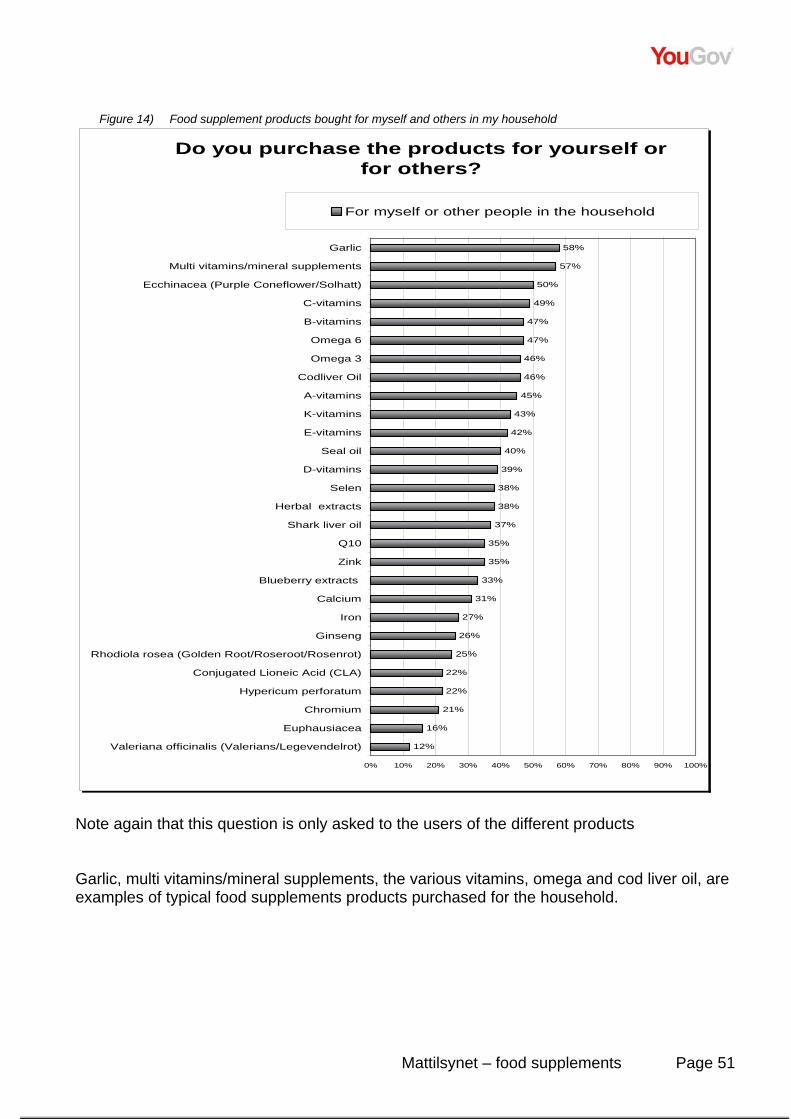
Mattilsynet – food supplements Page 51
Figure 14) Food supplement products bought for myself and others in my household
Do you purchase the products for yourself or for others?
58%
57%
50%
49%
47%
47%
46%
46%
45%
43%
42%
40%
39%
38%
38%
37%
35%
35%
33%
31%
27%
26%
25%
22%
22%
21%
16%
12%
0% 10% 20% 30% 40% 50% 60% 70% 80% 90% 100%
Garlic
Multi vitamins/mineral supplements
Ecchinacea (Purple Coneflower/Solhatt)
C-vitamins
B-vitamins
Omega 6
Omega 3
Codliver Oil
A-vitamins
K-vitamins
E-vitamins
Seal oil
D-vitamins
Selen
Herbal extracts
Shark liver oil
Q10
Zink
Blueberry extracts
Calcium
Iron
Ginseng
Rhodiola rosea (Golden Root/Roseroot/Rosenrot)
Conjugated Lioneic Acid (CLA)
Hypericum perforatum
Chromium
Euphausiacea
Valeriana officinalis (Valerians/Legevendelrot)
For myself or other people in the household
Note again that this question is only asked to the users of the different products Garlic, multi vitamins/mineral supplements, the various vitamins, omega and cod liver oil, are examples of typical food supplements products purchased for the household.
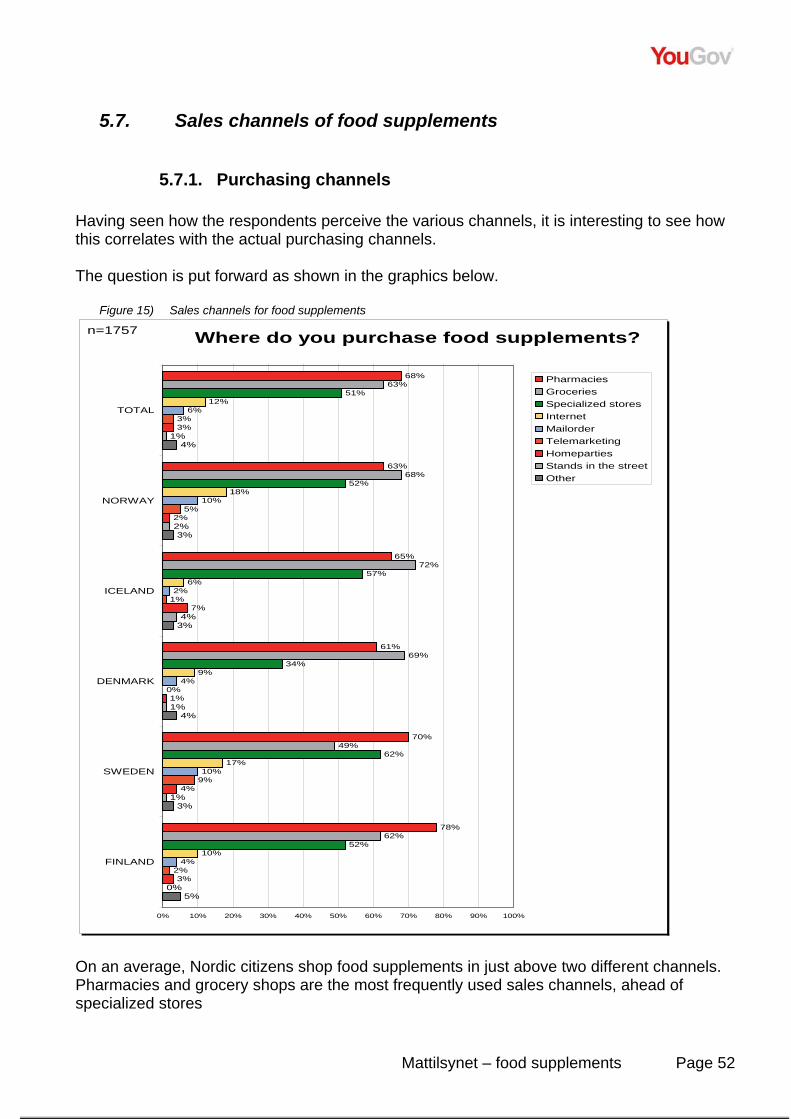
Mattilsynet – food supplements Page 52
5.7. Sales channels of food supplements
5.7.1. Purchasing channels Having seen how the respondents perceive the various channels, it is interesting to see how this correlates with the actual purchasing channels. The question is put forward as shown in the graphics below.
Figure 15) Sales channels for food supplements
Where do you purchase food supplements?
68%
63%
65%
61%
70%
78%
63%
68%
72%
69%
49%
62%
51%
52%
57%
34%
62%
52%
12%
18%
6%
9%
17%
10%
6%
10%
2%
4%
10%
4%
3%
5%
1%
0%
9%
2%
3%
2%
7%
1%
4%
3%
1%
2%
4%
1%
1%
0%
4%
3%
3%
4%
3%
5%
0% 10% 20% 30% 40% 50% 60% 70% 80% 90% 100%
TOTAL
NORWAY
ICELAND
DENMARK
SWEDEN
FINLAND
PharmaciesGroceriesSpecialized storesInternetMailorderTelemarketingHomepartiesStands in the streetOther
n=1757
On an average, Nordic citizens shop food supplements in just above two different channels. Pharmacies and grocery shops are the most frequently used sales channels, ahead of specialized stores
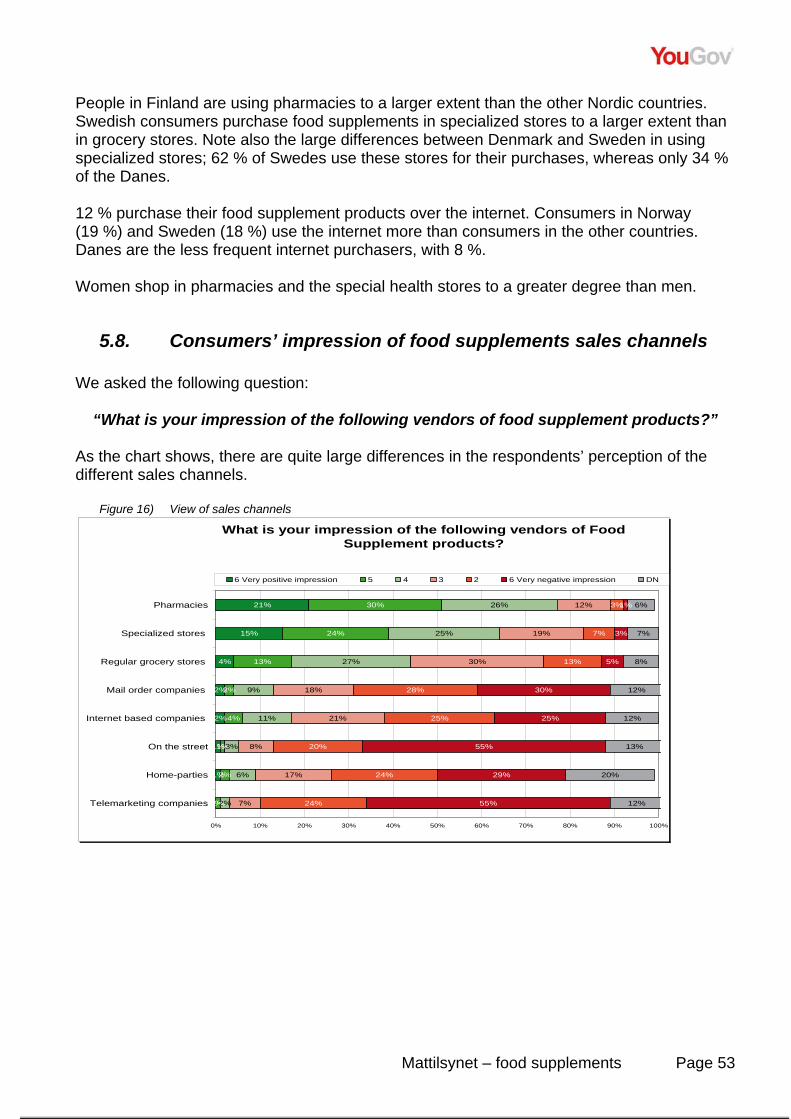
Mattilsynet – food supplements Page 53
People in Finland are using pharmacies to a larger extent than the other Nordic countries. Swedish consumers purchase food supplements in specialized stores to a larger extent than in grocery stores. Note also the large differences between Denmark and Sweden in using specialized stores; 62 % of Swedes use these stores for their purchases, whereas only 34 % of the Danes. 12 % purchase their food supplement products over the internet. Consumers in Norway (19 %) and Sweden (18 %) use the internet more than consumers in the other countries. Danes are the less frequent internet purchasers, with 8 %. Women shop in pharmacies and the special health stores to a greater degree than men.
5.8. Consumers’ impression of food supplements sales channels We asked the following question:
“What is your impression of the following vendors of food supplement products?” As the chart shows, there are quite large differences in the respondents’ perception of the different sales channels.
Figure 16) View of sales channels
What is your impression of the following vendors of Food Supplement products?
21%
15%
4%
2%
2%
1%
1%
0%
30%
24%
13%
2%
4%
1%
2%
1%
26%
25%
27%
9%
11%
3%
6%
2%
12%
19%
30%
18%
21%
8%
17%
7%
3%
7%
13%
28%
25%
20%
24%
24%
1%
3%
5%
30%
25%
55%
29%
55%
6%
7%
8%
12%
12%
13%
20%
12%
0% 10% 20% 30% 40% 50% 60% 70% 80% 90% 100%
Pharmacies
Specialized stores
Regular grocery stores
Mail order companies
Internet based companies
On the street
Home-parties
Telemarketing companies
6 Very positive impression 5 4 3 2 6 Very negative impression DN
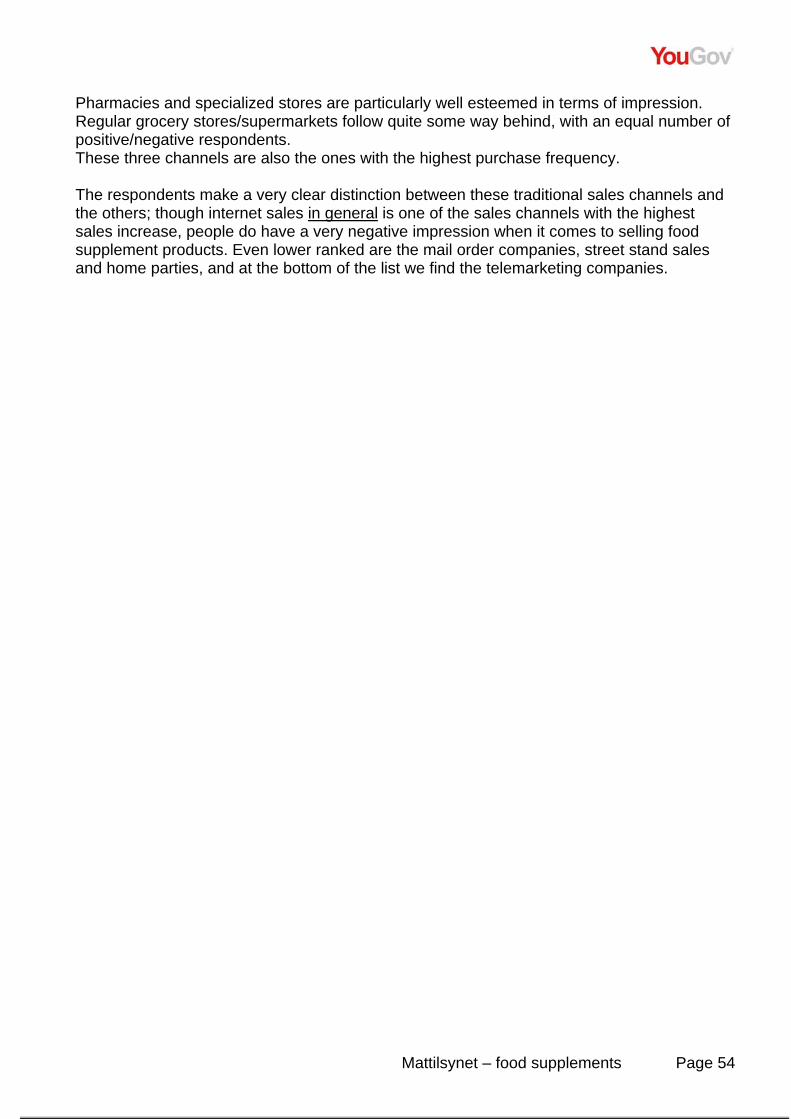
Mattilsynet – food supplements Page 54
Pharmacies and specialized stores are particularly well esteemed in terms of impression. Regular grocery stores/supermarkets follow quite some way behind, with an equal number of positive/negative respondents. These three channels are also the ones with the highest purchase frequency. The respondents make a very clear distinction between these traditional sales channels and the others; though internet sales in general is one of the sales channels with the highest sales increase, people do have a very negative impression when it comes to selling food supplement products. Even lower ranked are the mail order companies, street stand sales and home parties, and at the bottom of the list we find the telemarketing companies.
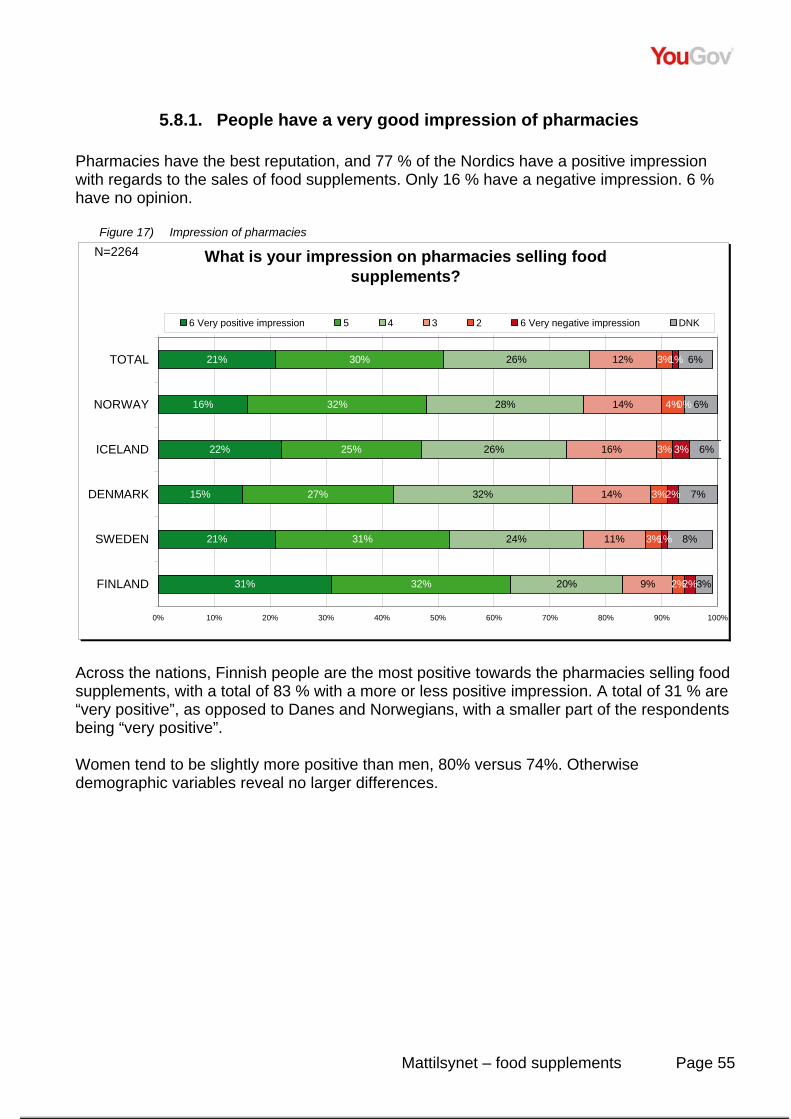
Mattilsynet – food supplements Page 55
5.8.1. People have a very good impression of pharmacies Pharmacies have the best reputation, and 77 % of the Nordics have a positive impression with regards to the sales of food supplements. Only 16 % have a negative impression. 6 % have no opinion.
Figure 17) Impression of pharmacies
What is your impression on pharmacies selling food supplements?
21%
16%
22%
15%
21%
31%
30%
32%
25%
27%
31%
32%
26%
28%
26%
32%
24%
20%
12%
14%
16%
14%
11%
9%
3%
4%
3%
3%
3%
2%
1%
0%
3%
2%
1%
2%
6%
6%
6%
7%
8%
3%
0% 10% 20% 30% 40% 50% 60% 70% 80% 90% 100%
TOTAL
NORWAY
ICELAND
DENMARK
SWEDEN
FINLAND
6 Very positive impression 5 4 3 2 6 Very negative impression DNK
N=2264
Across the nations, Finnish people are the most positive towards the pharmacies selling food supplements, with a total of 83 % with a more or less positive impression. A total of 31 % are “very positive”, as opposed to Danes and Norwegians, with a smaller part of the respondents being “very positive”. Women tend to be slightly more positive than men, 80% versus 74%. Otherwise demographic variables reveal no larger differences.
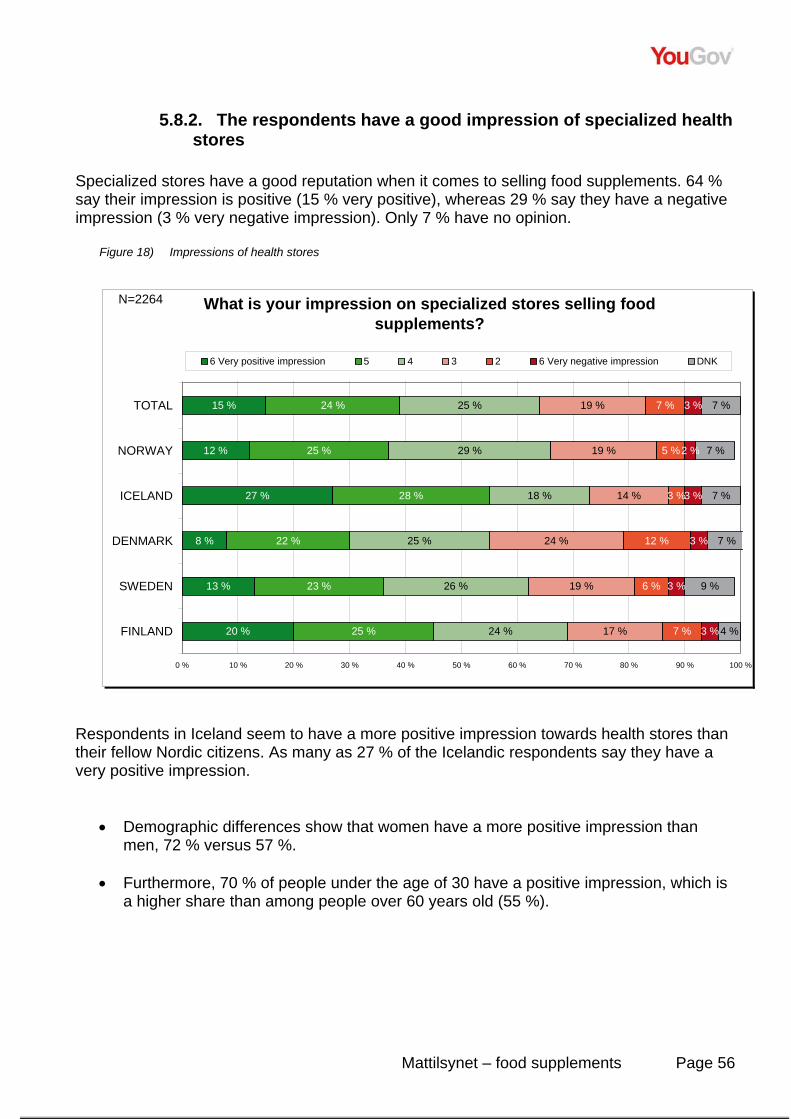
Mattilsynet – food supplements Page 56
5.8.2. The respondents have a good impression of specialized health stores
Specialized stores have a good reputation when it comes to selling food supplements. 64 % say their impression is positive (15 % very positive), whereas 29 % say they have a negative impression (3 % very negative impression). Only 7 % have no opinion.
Figure 18) Impressions of health stores
What is your impression on specialized stores selling food supplements?
15 %
12 %
27 %
8 %
13 %
20 %
24 %
25 %
28 %
22 %
23 %
25 %
25 %
29 %
18 %
25 %
26 %
24 %
19 %
19 %
14 %
24 %
19 %
17 %
7 %
5 %
3 %
12 %
6 %
7 %
3 %
2 %
3 %
3 %
3 %
3 %
7 %
7 %
7 %
7 %
9 %
4 %
0 % 10 % 20 % 30 % 40 % 50 % 60 % 70 % 80 % 90 % 100 %
TOTAL
NORWAY
ICELAND
DENMARK
SWEDEN
FINLAND
6 Very positive impression 5 4 3 2 6 Very negative impression DNK
N=2264
Respondents in Iceland seem to have a more positive impression towards health stores than their fellow Nordic citizens. As many as 27 % of the Icelandic respondents say they have a very positive impression.
• Demographic differences show that women have a more positive impression than men, 72 % versus 57 %.
• Furthermore, 70 % of people under the age of 30 have a positive impression, which is
a higher share than among people over 60 years old (55 %).
Mattilsynet – food supplements Page 57
5.8.3. People are divided in their impression of grocery stores and supermarkets
People’s impression on grocery stores selling food supplements is less positive than the specialized stores. 44 % answer that they have a positive impression, vs. 64 % for the specialized stores. 48 % say they have a negative impression, and 8 % answer “do not know”. In other words, for this sales channel, the respondents are divided in their view.
Figure 19) Impressions of grocery stores
What is your impression on regular grocery stores selling food supplements?
4%
1%
8%
2%
3%
8%
13%
13%
14%
9%
12%
19%
27%
29%
18%
30%
26%
29%
30%
33%
25%
34%
31%
26%
13%
13%
18%
13%
10%
11%
5%
4%
9%
5%
6%
3%
8%
7%
8%
8%
12%
4%
0% 10% 20% 30% 40% 50% 60% 70% 80% 90% 100%
TOTAL
NORWAY
ICELAND
DENMARK
SWEDEN
FINLAND
6 Very positive impression 5 4 3 2 6 Very negative impression DNK
N=2264
As for pharmacies, respondents in Finland are more positive towards supermarkets/grocery stores selling food supplements than people in the other countries. People from Iceland are the most negative. We see no or only small demographic differences within the various groups.
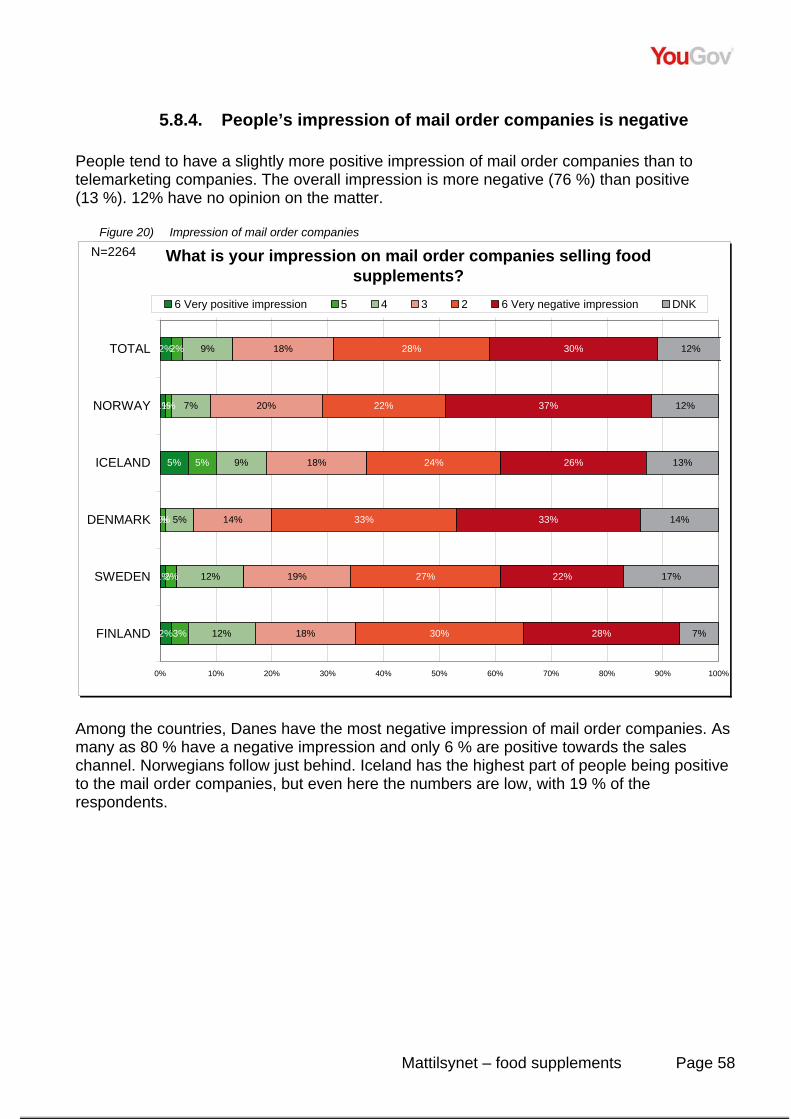
Mattilsynet – food supplements Page 58
5.8.4. People’s impression of mail order companies is negative People tend to have a slightly more positive impression of mail order companies than to telemarketing companies. The overall impression is more negative (76 %) than positive (13 %). 12% have no opinion on the matter.
Figure 20) Impression of mail order companies
What is your impression on mail order companies selling food supplements?
2%
1%
5%
0%
1%
2%
2%
1%
5%
1%
2%
3%
9%
7%
9%
5%
12%
12%
18%
20%
18%
14%
19%
18%
28%
22%
24%
33%
27%
30%
30%
37%
26%
33%
22%
28%
12%
12%
13%
14%
17%
7%
0% 10% 20% 30% 40% 50% 60% 70% 80% 90% 100%
TOTAL
NORWAY
ICELAND
DENMARK
SWEDEN
FINLAND
6 Very positive impression 5 4 3 2 6 Very negative impression DNK
N=2264
Among the countries, Danes have the most negative impression of mail order companies. As many as 80 % have a negative impression and only 6 % are positive towards the sales channel. Norwegians follow just behind. Iceland has the highest part of people being positive to the mail order companies, but even here the numbers are low, with 19 % of the respondents.
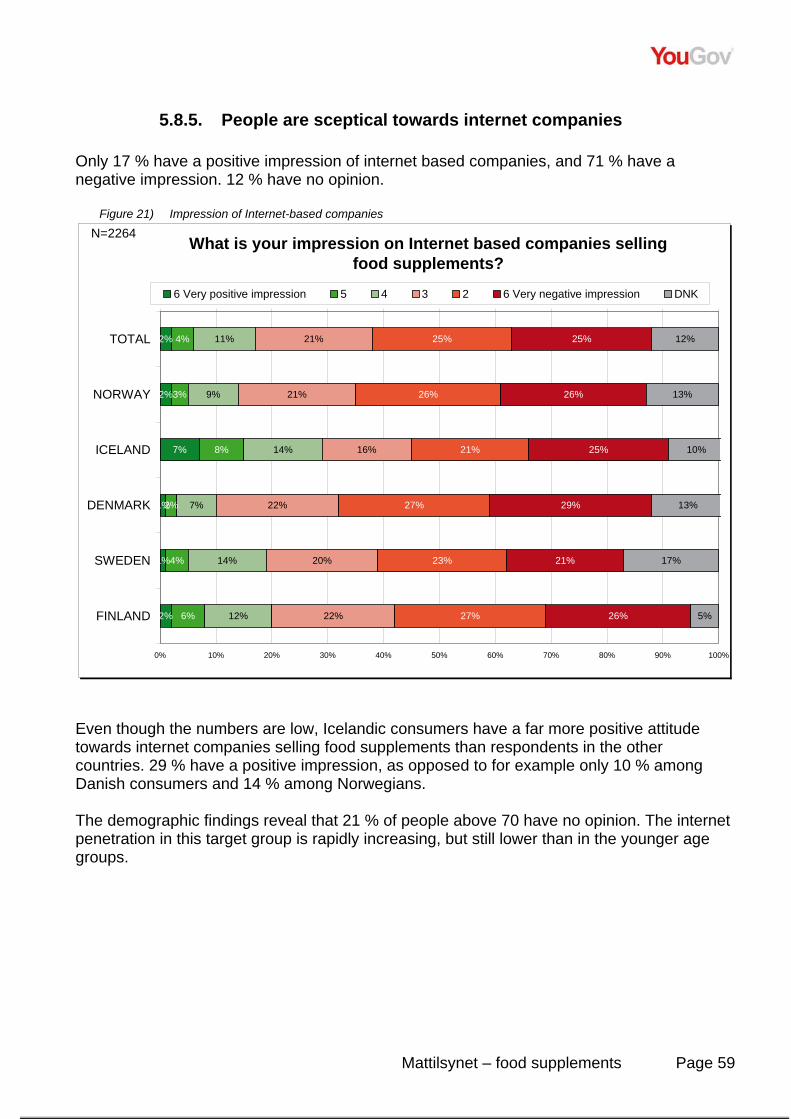
Mattilsynet – food supplements Page 59
5.8.5. People are sceptical towards internet companies Only 17 % have a positive impression of internet based companies, and 71 % have a negative impression. 12 % have no opinion.
Figure 21) Impression of Internet-based companies
What is your impression on Internet based companies selling food supplements?
2%
2%
7%
1%
1%
2%
4%
3%
8%
2%
4%
6%
11%
9%
14%
7%
14%
12%
21%
21%
16%
22%
20%
22%
25%
26%
21%
27%
23%
27%
25%
26%
25%
29%
21%
26%
12%
13%
10%
13%
17%
5%
0% 10% 20% 30% 40% 50% 60% 70% 80% 90% 100%
TOTAL
NORWAY
ICELAND
DENMARK
SWEDEN
FINLAND
6 Very positive impression 5 4 3 2 6 Very negative impression DNK
N=2264
Even though the numbers are low, Icelandic consumers have a far more positive attitude towards internet companies selling food supplements than respondents in the other countries. 29 % have a positive impression, as opposed to for example only 10 % among Danish consumers and 14 % among Norwegians. The demographic findings reveal that 21 % of people above 70 have no opinion. The internet penetration in this target group is rapidly increasing, but still lower than in the younger age groups.
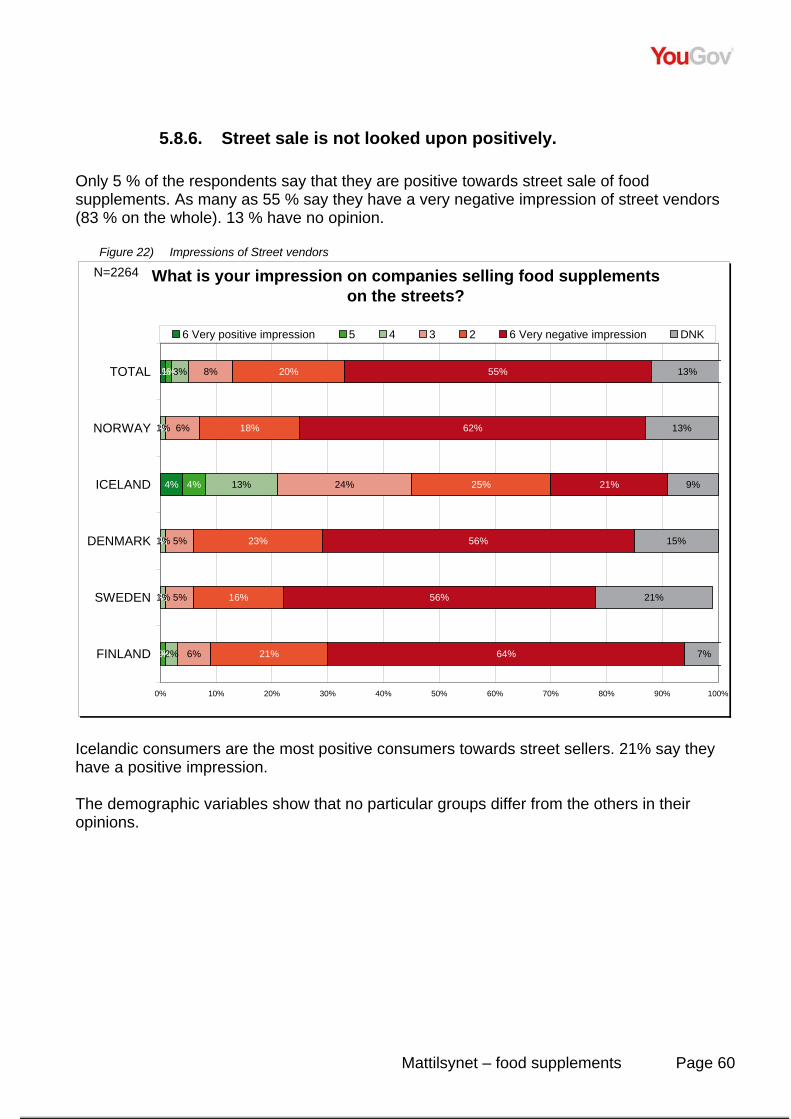
Mattilsynet – food supplements Page 60
5.8.6. Street sale is not looked upon positively. Only 5 % of the respondents say that they are positive towards street sale of food supplements. As many as 55 % say they have a very negative impression of street vendors (83 % on the whole). 13 % have no opinion.
Figure 22) Impressions of Street vendors
What is your impression on companies selling food supplements on the streets?
1%
0%
4%
0%
0%
0%
1%
0%
4%
0%
0%
1%
3%
1%
13%
1%
1%
2%
8%
6%
24%
5%
5%
6%
20%
18%
25%
23%
16%
21%
55%
62%
21%
56%
56%
64%
13%
13%
9%
15%
21%
7%
0% 10% 20% 30% 40% 50% 60% 70% 80% 90% 100%
TOTAL
NORWAY
ICELAND
DENMARK
SWEDEN
FINLAND
6 Very positive impression 5 4 3 2 6 Very negative impression DNK
N=2264
Icelandic consumers are the most positive consumers towards street sellers. 21% say they have a positive impression. The demographic variables show that no particular groups differ from the others in their opinions.
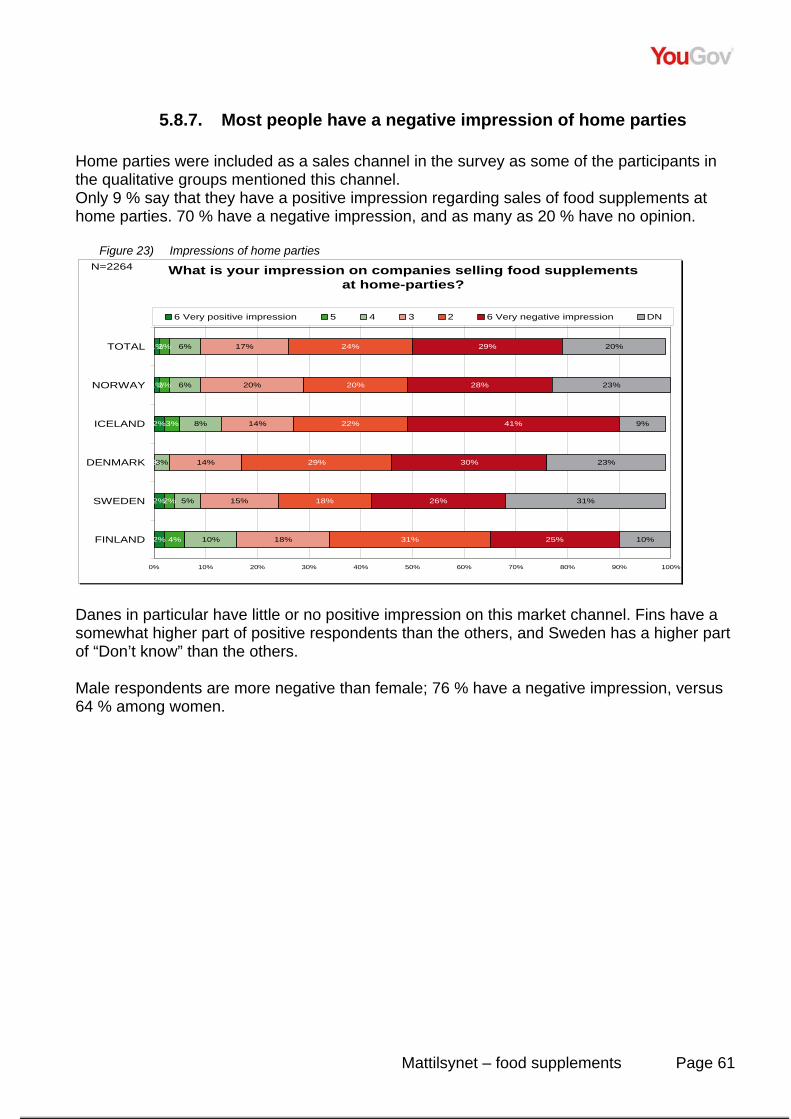
Mattilsynet – food supplements Page 61
5.8.7. Most people have a negative impression of home parties Home parties were included as a sales channel in the survey as some of the participants in the qualitative groups mentioned this channel. Only 9 % say that they have a positive impression regarding sales of food supplements at home parties. 70 % have a negative impression, and as many as 20 % have no opinion.
Figure 23) Impressions of home parties What is your impression on companies selling food supplements
at home-parties?
1%
1%
2%
0%
2%
2%
2%
2%
3%
0%
2%
4%
6%
6%
8%
3%
5%
10%
17%
20%
14%
14%
15%
18%
24%
20%
22%
29%
18%
31%
29%
28%
41%
30%
26%
25%
20%
23%
9%
23%
31%
10%
0% 10% 20% 30% 40% 50% 60% 70% 80% 90% 100%
TOTAL
NORWAY
ICELAND
DENMARK
SWEDEN
FINLAND
6 Very positive impression 5 4 3 2 6 Very negative impression DN
N=2264
Danes in particular have little or no positive impression on this market channel. Fins have a somewhat higher part of positive respondents than the others, and Sweden has a higher part of “Don’t know” than the others. Male respondents are more negative than female; 76 % have a negative impression, versus 64 % among women.
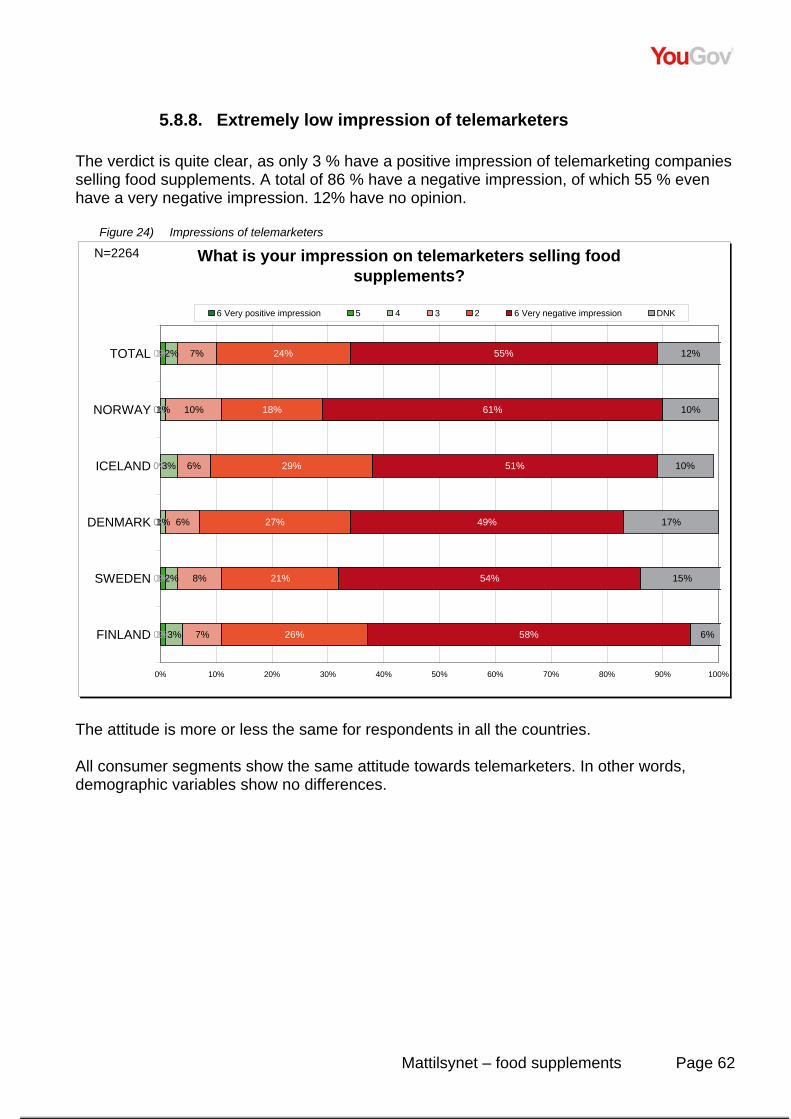
Mattilsynet – food supplements Page 62
5.8.8. Extremely low impression of telemarketers The verdict is quite clear, as only 3 % have a positive impression of telemarketing companies selling food supplements. A total of 86 % have a negative impression, of which 55 % even have a very negative impression. 12% have no opinion.
Figure 24) Impressions of telemarketers
What is your impression on telemarketers selling food supplements?
0%
0%
0%
0%
0%
0%
1%
0%
0%
0%
1%
1%
2%
1%
3%
1%
2%
3%
7%
10%
6%
6%
8%
7%
24%
18%
29%
27%
21%
26%
55%
61%
51%
49%
54%
58%
12%
10%
10%
17%
15%
6%
0% 10% 20% 30% 40% 50% 60% 70% 80% 90% 100%
TOTAL
NORWAY
ICELAND
DENMARK
SWEDEN
FINLAND
6 Very positive impression 5 4 3 2 6 Very negative impression DNK
N=2264
The attitude is more or less the same for respondents in all the countries. All consumer segments show the same attitude towards telemarketers. In other words, demographic variables show no differences.
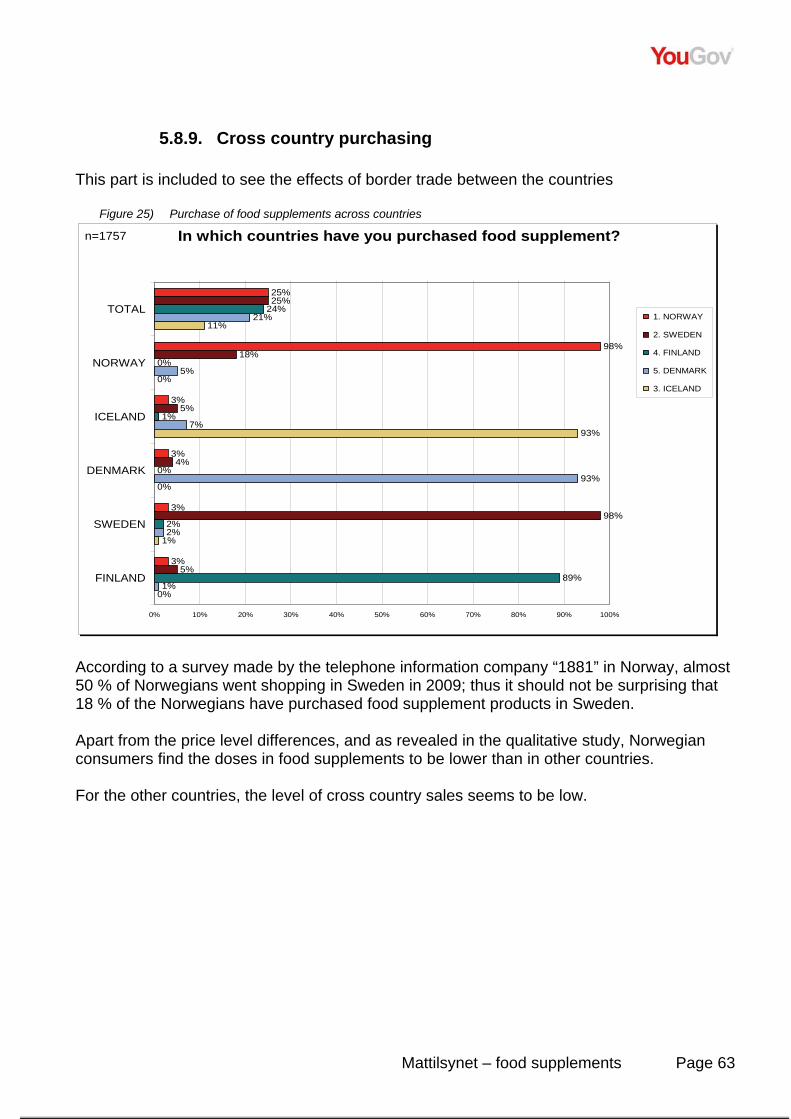
Mattilsynet – food supplements Page 63
5.8.9. Cross country purchasing This part is included to see the effects of border trade between the countries
Figure 25) Purchase of food supplements across countries
In which countries have you purchased food supplement?
25%
98%
3%
3%
3%
3%
25%
18%
5%
4%
98%
5%
24%
0%
1%
0%
2%
89%
21%
5%
7%
93%
2%
1%
11%
0%
93%
0%
1%
0%
0% 10% 20% 30% 40% 50% 60% 70% 80% 90% 100%
TOTAL
NORWAY
ICELAND
DENMARK
SWEDEN
FINLAND
1. NORWAY
2. SWEDEN
4. FINLAND
5. DENMARK
3. ICELAND
n=1757
According to a survey made by the telephone information company “1881” in Norway, almost 50 % of Norwegians went shopping in Sweden in 2009; thus it should not be surprising that 18 % of the Norwegians have purchased food supplement products in Sweden. Apart from the price level differences, and as revealed in the qualitative study, Norwegian consumers find the doses in food supplements to be lower than in other countries. For the other countries, the level of cross country sales seems to be low.
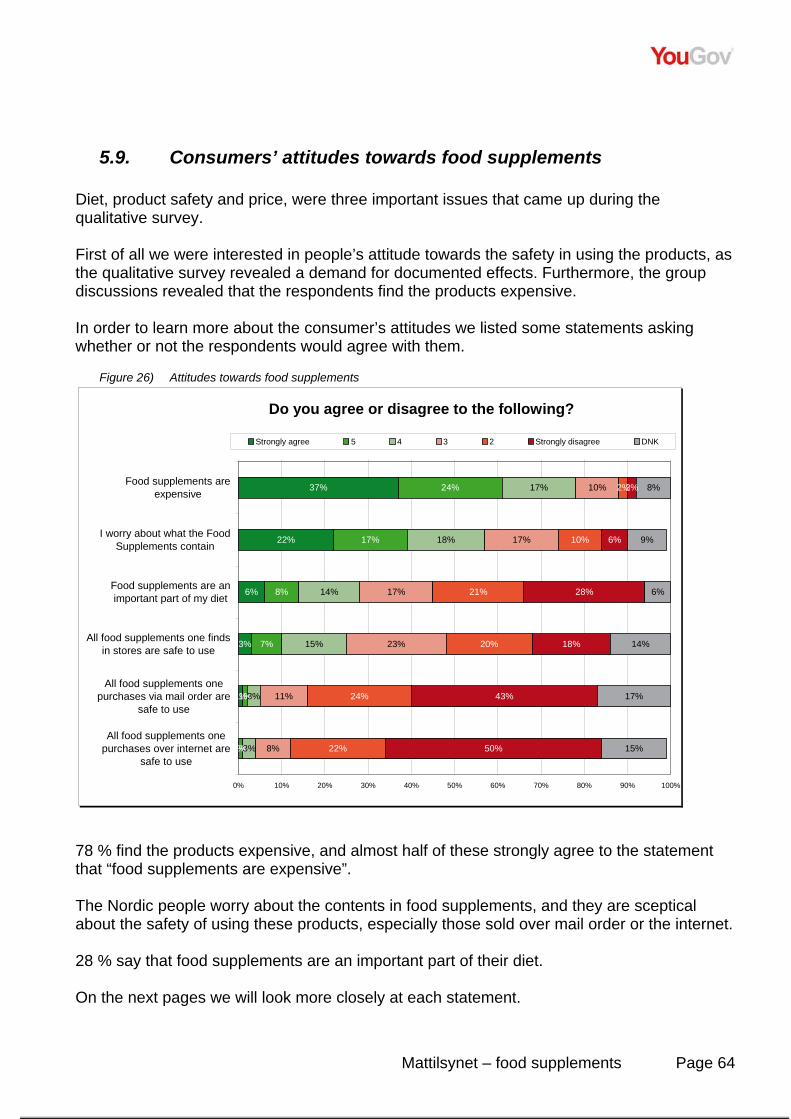
Mattilsynet – food supplements Page 64
5.9. Consumers’ attitudes towards food supplements Diet, product safety and price, were three important issues that came up during the qualitative survey. First of all we were interested in people’s attitude towards the safety in using the products, as the qualitative survey revealed a demand for documented effects. Furthermore, the group discussions revealed that the respondents find the products expensive. In order to learn more about the consumer’s attitudes we listed some statements asking whether or not the respondents would agree with them.
Figure 26) Attitudes towards food supplements
Do you agree or disagree to the following?
37%
22%
6%
3%
1%
0%
24%
17%
8%
7%
1%
1%
17%
18%
14%
15%
3%
3%
10%
17%
17%
23%
11%
8%
2%
10%
21%
20%
24%
22%
2%
6%
28%
18%
43%
50%
8%
9%
6%
14%
17%
15%
0% 10% 20% 30% 40% 50% 60% 70% 80% 90% 100%
Food supplements areexpensive
I worry about what the FoodSupplements contain
Food supplements are animportant part of my diet
All food supplements one findsin stores are safe to use
All food supplements onepurchases via mail order are
safe to use
All food supplements onepurchases over internet are
safe to use
Strongly agree 5 4 3 2 Strongly disagree DNK
78 % find the products expensive, and almost half of these strongly agree to the statement that “food supplements are expensive”. The Nordic people worry about the contents in food supplements, and they are sceptical about the safety of using these products, especially those sold over mail order or the internet. 28 % say that food supplements are an important part of their diet. On the next pages we will look more closely at each statement.
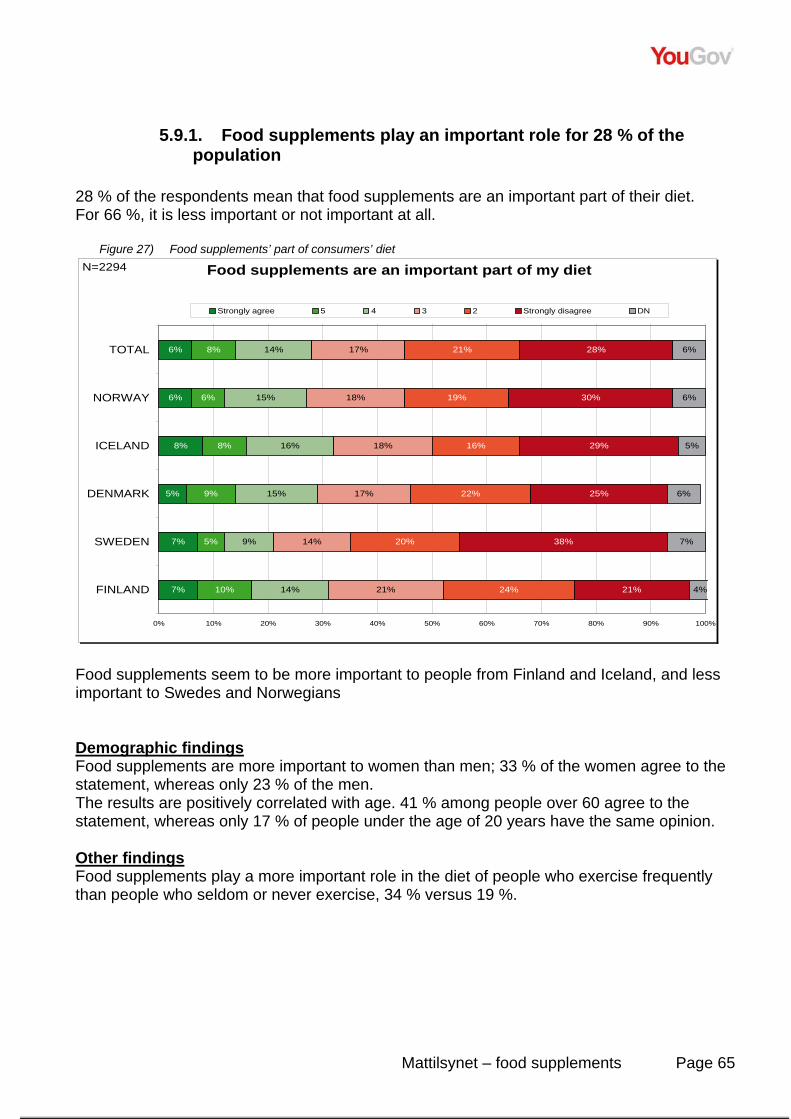
Mattilsynet – food supplements Page 65
5.9.1. Food supplements play an important role for 28 % of the population
28 % of the respondents mean that food supplements are an important part of their diet. For 66 %, it is less important or not important at all.
Figure 27) Food supplements’ part of consumers’ diet
Food supplements are an important part of my diet
6%
6%
8%
5%
7%
7%
8%
6%
8%
9%
5%
10%
14%
15%
16%
15%
9%
14%
17%
18%
18%
17%
14%
21%
21%
19%
16%
22%
20%
24%
28%
30%
29%
25%
38%
21%
6%
6%
5%
6%
7%
4%
0% 10% 20% 30% 40% 50% 60% 70% 80% 90% 100%
TOTAL
NORWAY
ICELAND
DENMARK
SWEDEN
FINLAND
Strongly agree 5 4 3 2 Strongly disagree DN
N=2294
Food supplements seem to be more important to people from Finland and Iceland, and less important to Swedes and Norwegians Demographic findings Food supplements are more important to women than men; 33 % of the women agree to the statement, whereas only 23 % of the men. The results are positively correlated with age. 41 % among people over 60 agree to the statement, whereas only 17 % of people under the age of 20 years have the same opinion. Other findings Food supplements play a more important role in the diet of people who exercise frequently than people who seldom or never exercise, 34 % versus 19 %.
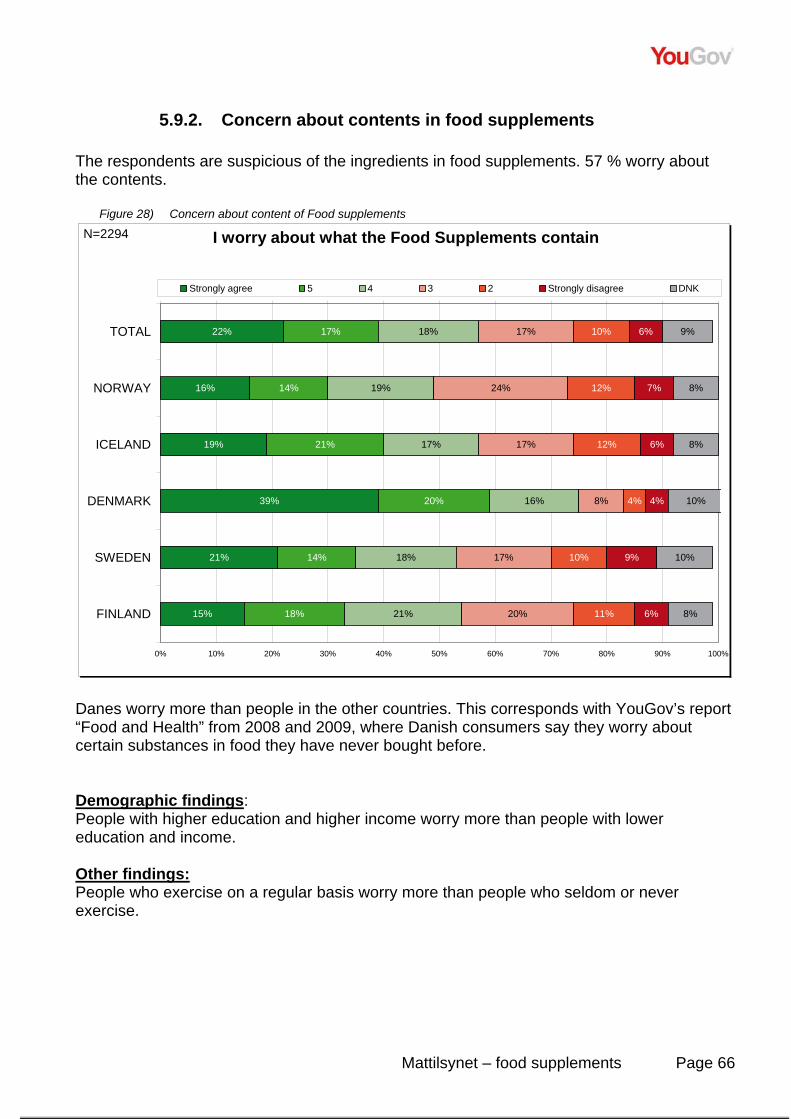
Mattilsynet – food supplements Page 66
5.9.2. Concern about contents in food supplements The respondents are suspicious of the ingredients in food supplements. 57 % worry about the contents.
Figure 28) Concern about content of Food supplements
I worry about what the Food Supplements contain
22%
16%
19%
39%
21%
15%
17%
14%
21%
20%
14%
18%
18%
19%
17%
16%
18%
21%
17%
24%
17%
8%
17%
20%
10%
12%
12%
4%
10%
11%
6%
7%
6%
4%
9%
6%
9%
8%
8%
10%
10%
8%
0% 10% 20% 30% 40% 50% 60% 70% 80% 90% 100%
TOTAL
NORWAY
ICELAND
DENMARK
SWEDEN
FINLAND
Strongly agree 5 4 3 2 Strongly disagree DNK
N=2294
Danes worry more than people in the other countries. This corresponds with YouGov’s report “Food and Health” from 2008 and 2009, where Danish consumers say they worry about certain substances in food they have never bought before. Demographic findings: People with higher education and higher income worry more than people with lower education and income. Other findings: People who exercise on a regular basis worry more than people who seldom or never exercise.
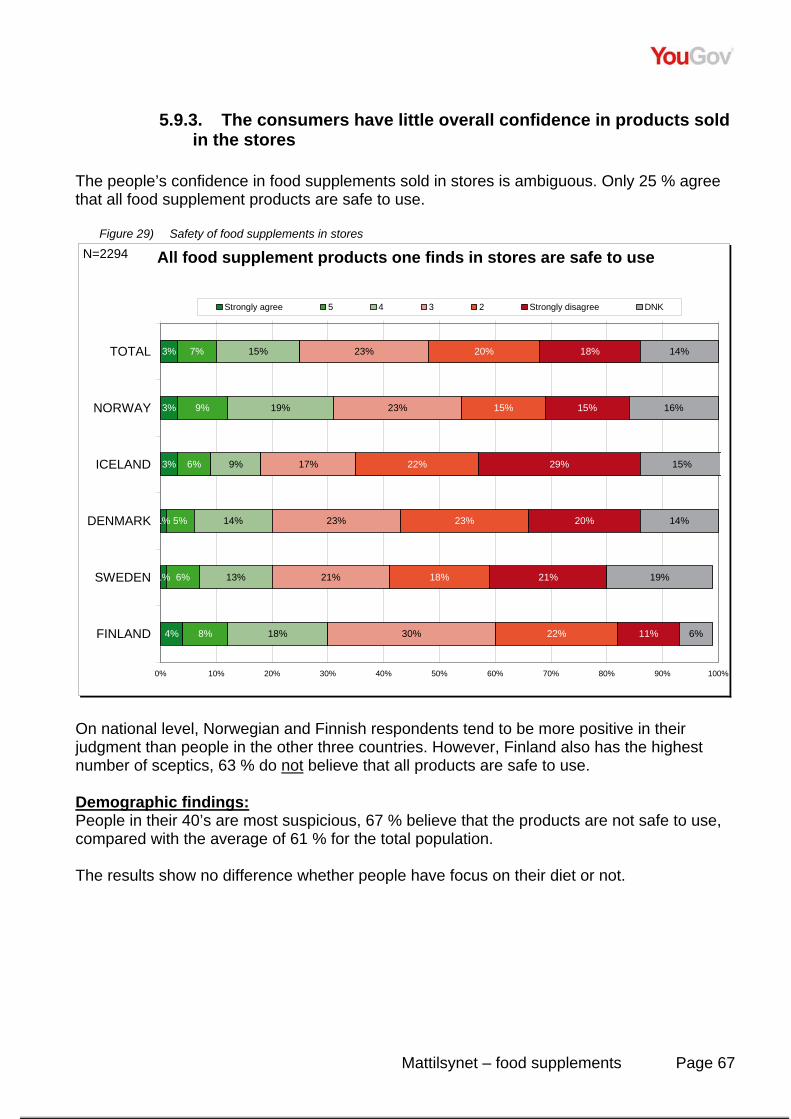
Mattilsynet – food supplements Page 67
5.9.3. The consumers have little overall confidence in products sold in the stores
The people’s confidence in food supplements sold in stores is ambiguous. Only 25 % agree that all food supplement products are safe to use.
Figure 29) Safety of food supplements in stores
All food supplement products one finds in stores are safe to use
3%
3%
3%
1%
1%
4%
7%
9%
6%
5%
6%
8%
15%
19%
9%
14%
13%
18%
23%
23%
17%
23%
21%
30%
20%
15%
22%
23%
18%
22%
18%
15%
29%
20%
21%
11%
14%
16%
15%
14%
19%
6%
0% 10% 20% 30% 40% 50% 60% 70% 80% 90% 100%
TOTAL
NORWAY
ICELAND
DENMARK
SWEDEN
FINLAND
Strongly agree 5 4 3 2 Strongly disagree DNK
N=2294
On national level, Norwegian and Finnish respondents tend to be more positive in their judgment than people in the other three countries. However, Finland also has the highest number of sceptics, 63 % do not believe that all products are safe to use. Demographic findings: People in their 40’s are most suspicious, 67 % believe that the products are not safe to use, compared with the average of 61 % for the total population. The results show no difference whether people have focus on their diet or not.
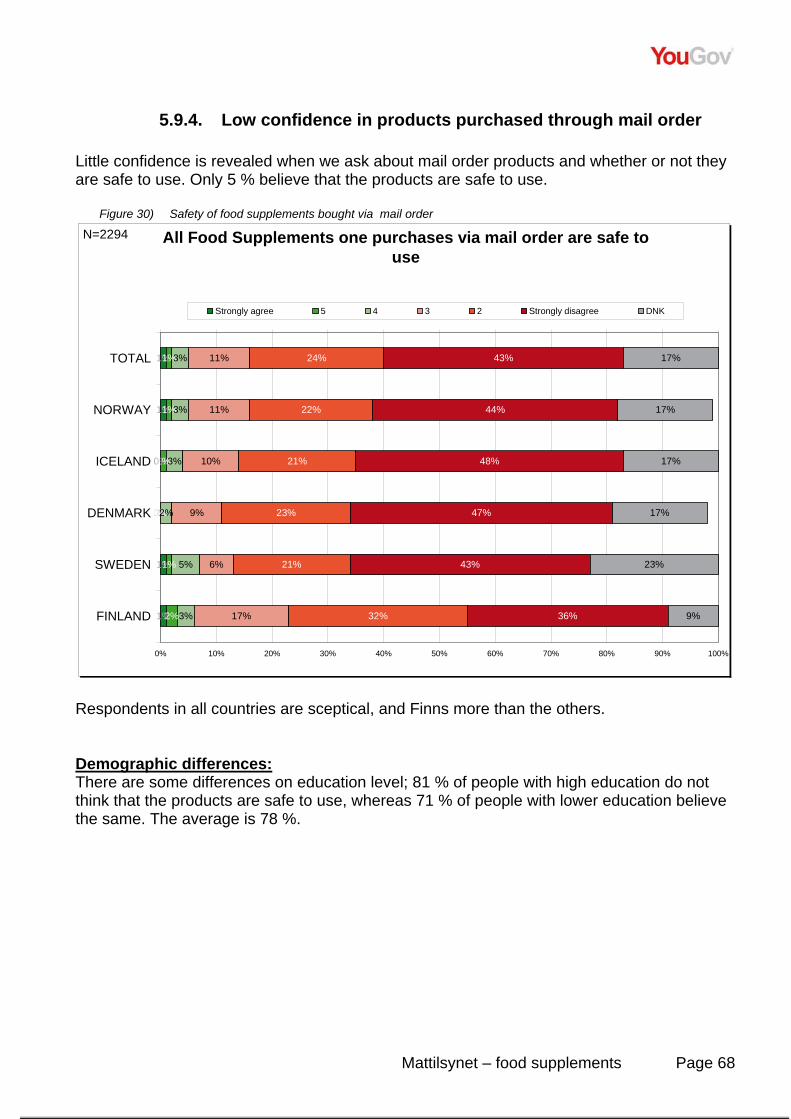
Mattilsynet – food supplements Page 68
5.9.4. Low confidence in products purchased through mail order Little confidence is revealed when we ask about mail order products and whether or not they are safe to use. Only 5 % believe that the products are safe to use.
Figure 30) Safety of food supplements bought via mail order
All Food Supplements one purchases via mail order are safe to use
1%
1%
0%
0%
1%
1%
1%
1%
1%
0%
1%
2%
3%
3%
3%
2%
5%
3%
11%
11%
10%
9%
6%
17%
24%
22%
21%
23%
21%
32%
43%
44%
48%
47%
43%
36%
17%
17%
17%
17%
23%
9%
0% 10% 20% 30% 40% 50% 60% 70% 80% 90% 100%
TOTAL
NORWAY
ICELAND
DENMARK
SWEDEN
FINLAND
Strongly agree 5 4 3 2 Strongly disagree DNK
N=2294
Respondents in all countries are sceptical, and Finns more than the others. Demographic differences: There are some differences on education level; 81 % of people with high education do not think that the products are safe to use, whereas 71 % of people with lower education believe the same. The average is 78 %.
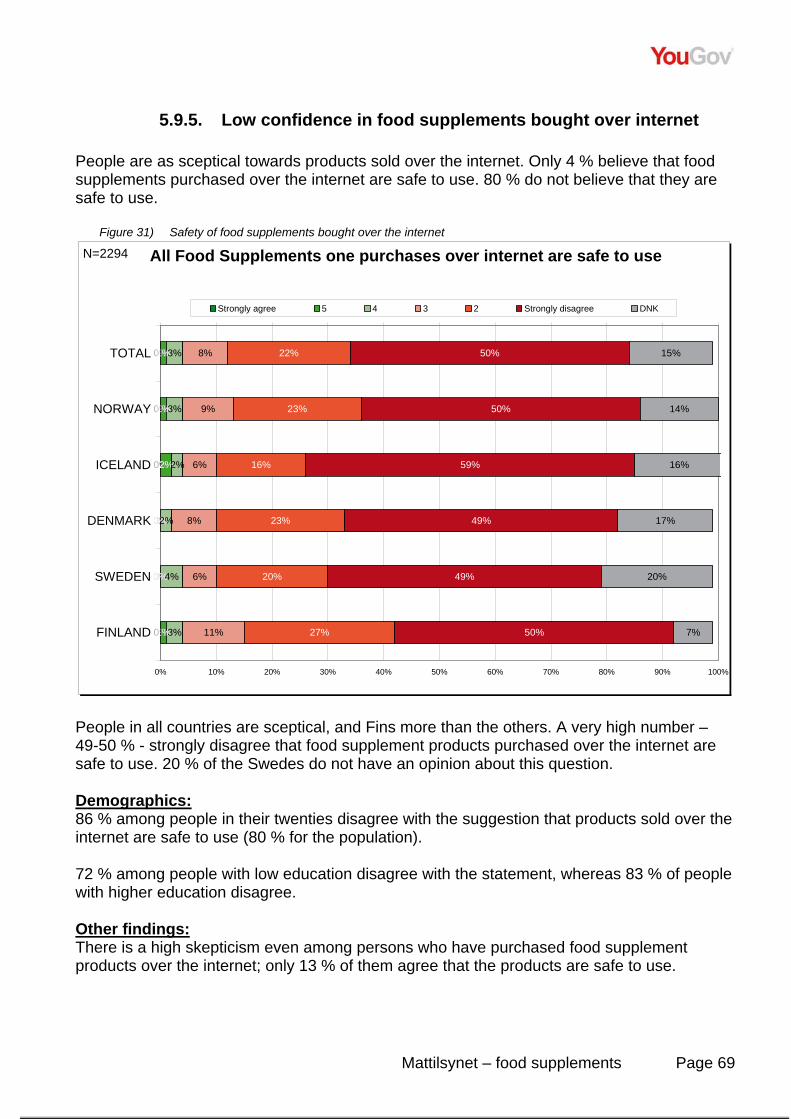
Mattilsynet – food supplements Page 69
5.9.5. Low confidence in food supplements bought over internet People are as sceptical towards products sold over the internet. Only 4 % believe that food supplements purchased over the internet are safe to use. 80 % do not believe that they are safe to use.
Figure 31) Safety of food supplements bought over the internet
All Food Supplements one purchases over internet are safe to use
0%
0%
0%
0%
0%
0%
1%
1%
2%
0%
0%
1%
3%
3%
2%
2%
4%
3%
8%
9%
6%
8%
6%
11%
22%
23%
16%
23%
20%
27%
50%
50%
59%
49%
49%
50%
15%
14%
16%
17%
20%
7%
0% 10% 20% 30% 40% 50% 60% 70% 80% 90% 100%
TOTAL
NORWAY
ICELAND
DENMARK
SWEDEN
FINLAND
Strongly agree 5 4 3 2 Strongly disagree DNK
N=2294
People in all countries are sceptical, and Fins more than the others. A very high number – 49-50 % - strongly disagree that food supplement products purchased over the internet are safe to use. 20 % of the Swedes do not have an opinion about this question. Demographics: 86 % among people in their twenties disagree with the suggestion that products sold over the internet are safe to use (80 % for the population). 72 % among people with low education disagree with the statement, whereas 83 % of people with higher education disagree. Other findings: There is a high skepticism even among persons who have purchased food supplement products over the internet; only 13 % of them agree that the products are safe to use.
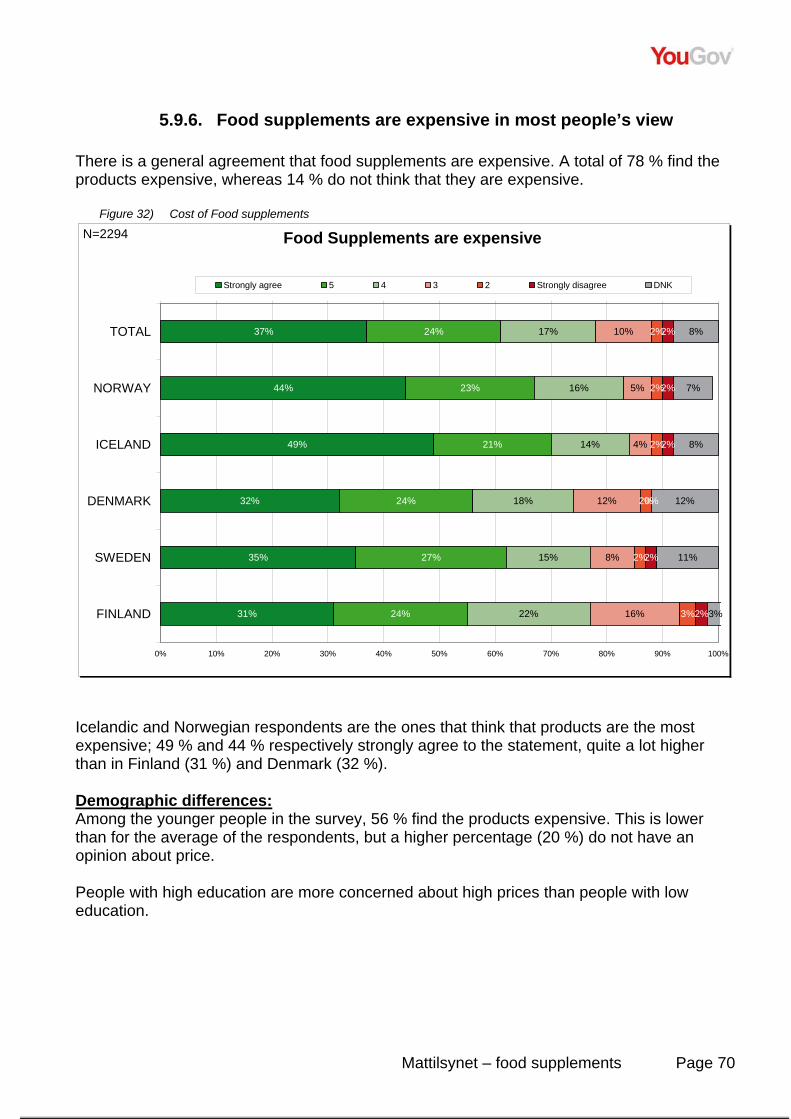
Mattilsynet – food supplements Page 70
5.9.6. Food supplements are expensive in most people’s view There is a general agreement that food supplements are expensive. A total of 78 % find the products expensive, whereas 14 % do not think that they are expensive.
Figure 32) Cost of Food supplements
Food Supplements are expensive
37%
44%
49%
32%
35%
31%
24%
23%
21%
24%
27%
24%
17%
16%
14%
18%
15%
22%
10%
5%
4%
12%
8%
16%
2%
2%
2%
2%
2%
3%
2%
2%
2%
0%
2%
2%
8%
7%
8%
12%
11%
3%
0% 10% 20% 30% 40% 50% 60% 70% 80% 90% 100%
TOTAL
NORWAY
ICELAND
DENMARK
SWEDEN
FINLAND
Strongly agree 5 4 3 2 Strongly disagree DNK
N=2294
Icelandic and Norwegian respondents are the ones that think that products are the most expensive; 49 % and 44 % respectively strongly agree to the statement, quite a lot higher than in Finland (31 %) and Denmark (32 %). Demographic differences: Among the younger people in the survey, 56 % find the products expensive. This is lower than for the average of the respondents, but a higher percentage (20 %) do not have an opinion about price. People with high education are more concerned about high prices than people with low education.
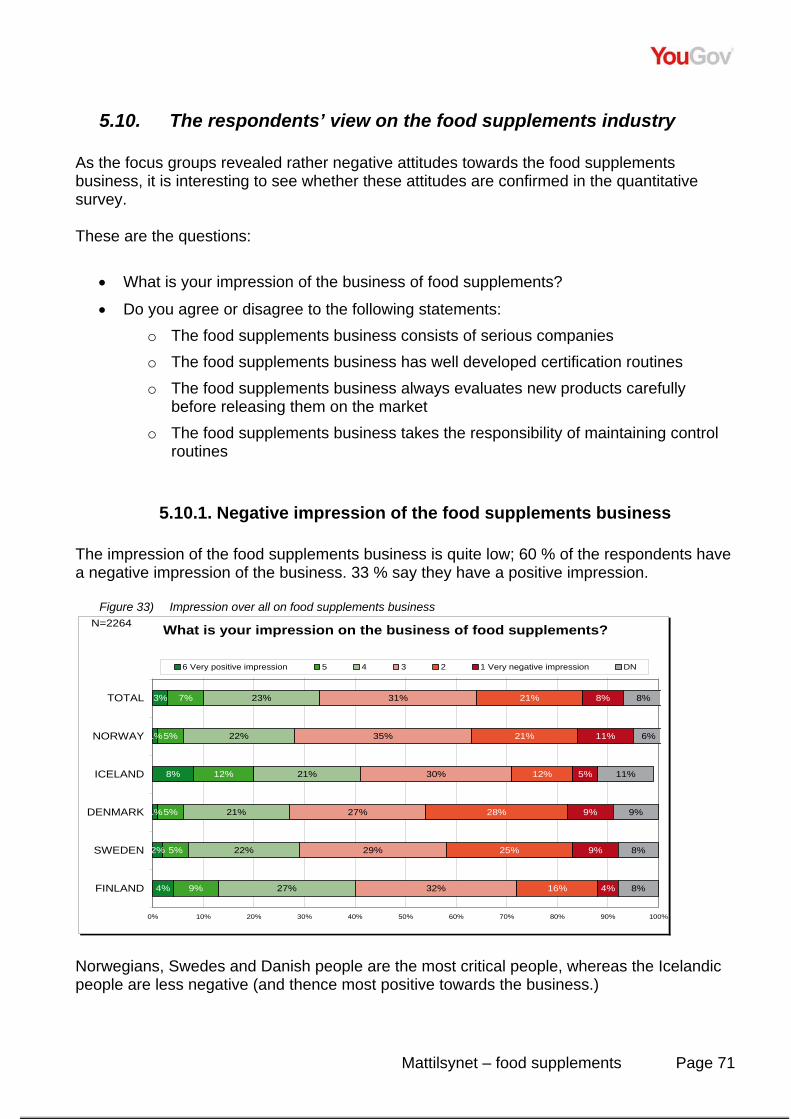
Mattilsynet – food supplements Page 71
5.10. The respondents’ view on the food supplements industry As the focus groups revealed rather negative attitudes towards the food supplements business, it is interesting to see whether these attitudes are confirmed in the quantitative survey. These are the questions:
• What is your impression of the business of food supplements?
• Do you agree or disagree to the following statements: o The food supplements business consists of serious companies o The food supplements business has well developed certification routines o The food supplements business always evaluates new products carefully
before releasing them on the market o The food supplements business takes the responsibility of maintaining control
routines
5.10.1. Negative impression of the food supplements business The impression of the food supplements business is quite low; 60 % of the respondents have a negative impression of the business. 33 % say they have a positive impression.
Figure 33) Impression over all on food supplements business
What is your impression on the business of food supplements?
3%
1%
8%
1%
2%
4%
7%
5%
12%
5%
5%
9%
23%
22%
21%
21%
22%
27%
31%
35%
30%
27%
29%
32%
21%
21%
12%
28%
25%
16%
8%
11%
5%
9%
9%
4%
8%
6%
11%
9%
8%
8%
0% 10% 20% 30% 40% 50% 60% 70% 80% 90% 100%
TOTAL
NORWAY
ICELAND
DENMARK
SWEDEN
FINLAND
6 Very positive impression 5 4 3 2 1 Very negative impression DN
N=2264
Norwegians, Swedes and Danish people are the most critical people, whereas the Icelandic people are less negative (and thence most positive towards the business.)
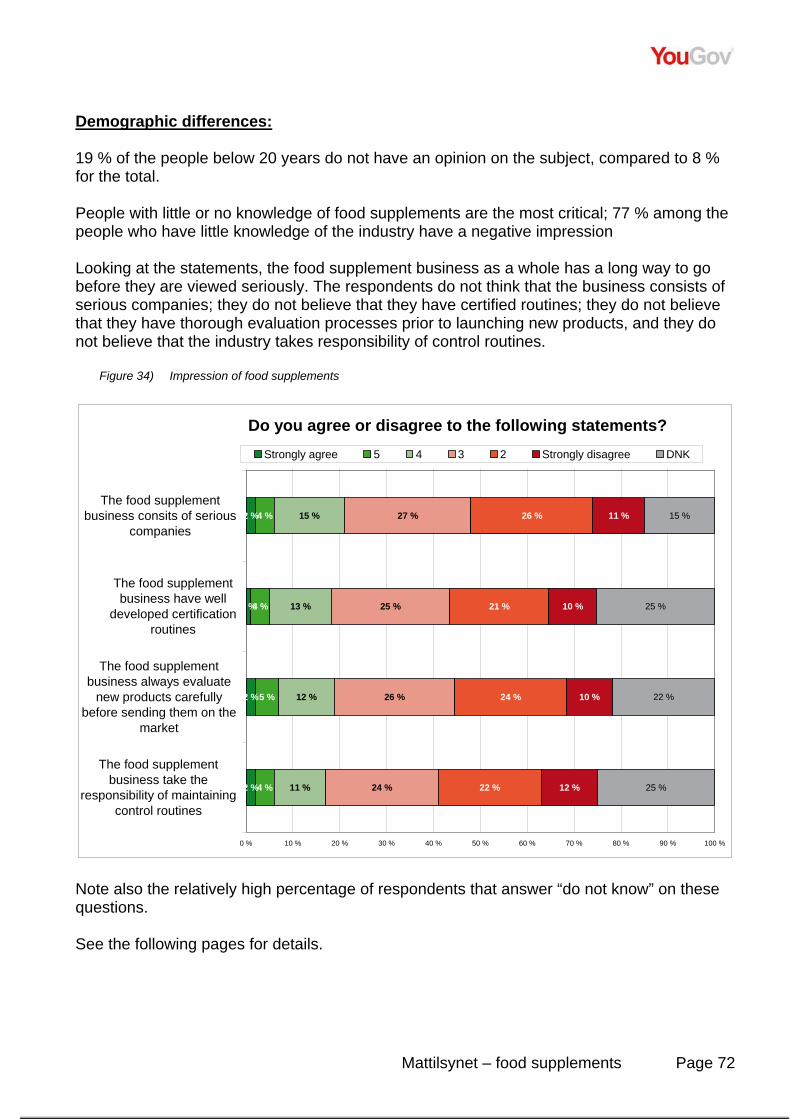
Mattilsynet – food supplements Page 72
Demographic differences: 19 % of the people below 20 years do not have an opinion on the subject, compared to 8 % for the total. People with little or no knowledge of food supplements are the most critical; 77 % among the people who have little knowledge of the industry have a negative impression Looking at the statements, the food supplement business as a whole has a long way to go before they are viewed seriously. The respondents do not think that the business consists of serious companies; they do not believe that they have certified routines; they do not believe that they have thorough evaluation processes prior to launching new products, and they do not believe that the industry takes responsibility of control routines.
Figure 34) Impression of food supplements
Do you agree or disagree to the following statements?
2 %
1 %
2 %
2 %
4 %
4 %
5 %
4 %
15 %
13 %
12 %
11 %
27 %
25 %
26 %
24 %
26 %
21 %
24 %
22 %
11 %
10 %
10 %
12 %
15 %
25 %
22 %
25 %
0 % 10 % 20 % 30 % 40 % 50 % 60 % 70 % 80 % 90 % 100 %
The food supplementbusiness consits of serious
companies
The food supplementbusiness have well
developed certificationroutines
The food supplementbusiness always evaluate
new products carefullybefore sending them on the
market
The food supplementbusiness take the
responsibility of maintainingcontrol routines
Strongly agree 5 4 3 2 Strongly disagree DNK
Note also the relatively high percentage of respondents that answer “do not know” on these questions. See the following pages for details.
Mattilsynet – food supplements Page 73
5.10.2. Consumers doubt the seriousness of the food supplements business
The survey reveals that only 21 % of the respondents believe that the business consists of serious companies.64 % of the respondents do not believe that they are serious. Among the countries it seems that Finnish people have a more positive view than the others. 31 % believe that the industry consists of serious companies. Furthermore: The higher income/education people have, the higher is the scepticism towards the companies.
5.10.3. Little or no confidence in the industry’s own certification routines
People seem to have little confidence in the industry’s own certification routines. Only 18 % of the respondents do believe that the routines are well carried through. 56 % are sceptical, and 25 % do not know. 35 % of the Swedish respondents do not have an opinion on the matter. No demographic groups differ in this opinion.
5.10.4. Low confidence in the industry’s ability to control their products
The results show that the respondents have a very low confidence in the industry’s ability to control their products prior to launch. Only 19 % believe that they evaluate the products carefully before sending them on the market. 60 % are critical.
• Danes have the lowest confidence; none of the Danish respondents strongly agree to this statement.
• There is a higher part of Icelandic and Finnish respondents who agree to the statement.
• People with higher education and income are more sceptical than people with lower income and education level.
Mattilsynet – food supplements Page 74
5.10.5. No confidence in the industry’s maintenance of control routines
Only 17 % agree to some extent to the statement that the industry provides and maintains control routines. 58 % disagree with this, and 25 % have no opinion on the matter.
• Again we see that consumers in Iceland and Finland tend to be less critical than consumers in the other countries
• The results reveal that people with a low level of education are less negative than people with higher income and education level
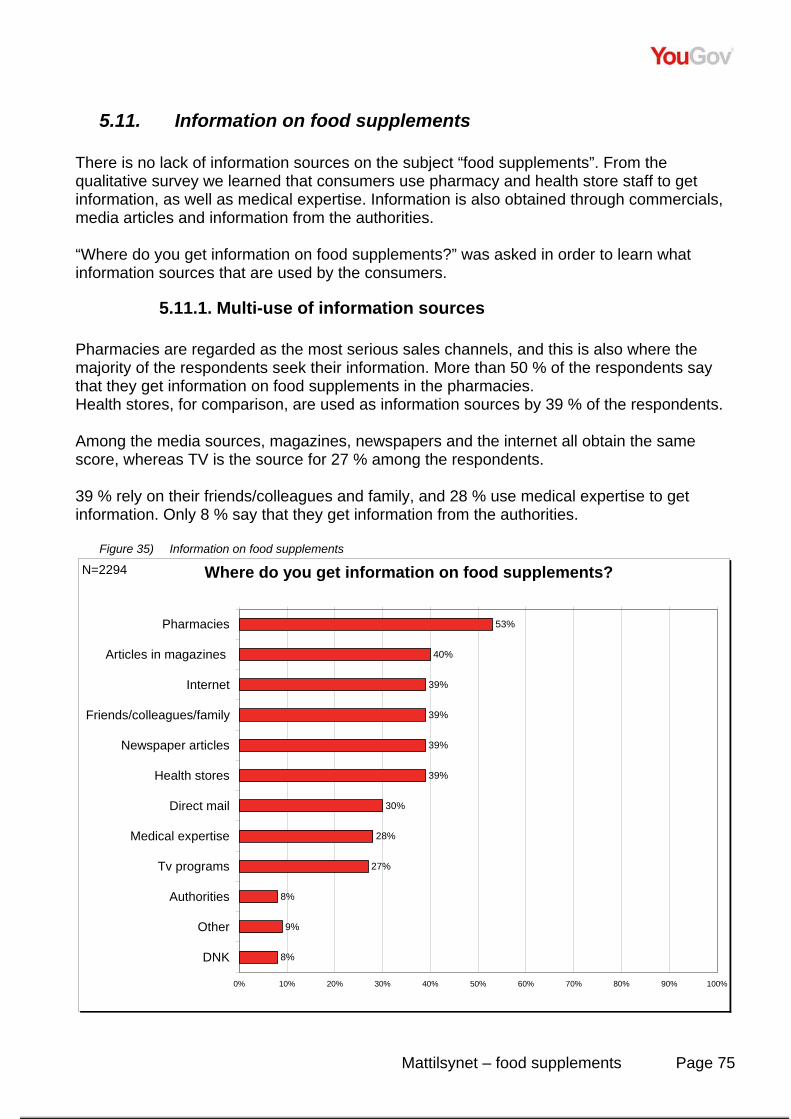
Mattilsynet – food supplements Page 75
5.11. Information on food supplements There is no lack of information sources on the subject “food supplements”. From the qualitative survey we learned that consumers use pharmacy and health store staff to get information, as well as medical expertise. Information is also obtained through commercials, media articles and information from the authorities. “Where do you get information on food supplements?” was asked in order to learn what information sources that are used by the consumers.
5.11.1. Multi-use of information sources Pharmacies are regarded as the most serious sales channels, and this is also where the majority of the respondents seek their information. More than 50 % of the respondents say that they get information on food supplements in the pharmacies. Health stores, for comparison, are used as information sources by 39 % of the respondents. Among the media sources, magazines, newspapers and the internet all obtain the same score, whereas TV is the source for 27 % among the respondents. 39 % rely on their friends/colleagues and family, and 28 % use medical expertise to get information. Only 8 % say that they get information from the authorities.
Figure 35) Information on food supplements
Where do you get information on food supplements?
53%
40%
39%
39%
39%
39%
30%
28%
27%
8%
9%
8%
0% 10% 20% 30% 40% 50% 60% 70% 80% 90% 100%
Pharmacies
Articles in magazines
Internet
Friends/colleagues/family
Newspaper articles
Health stores
Direct mail
Medical expertise
Tv programs
Authorities
Other
DNK
N=2294
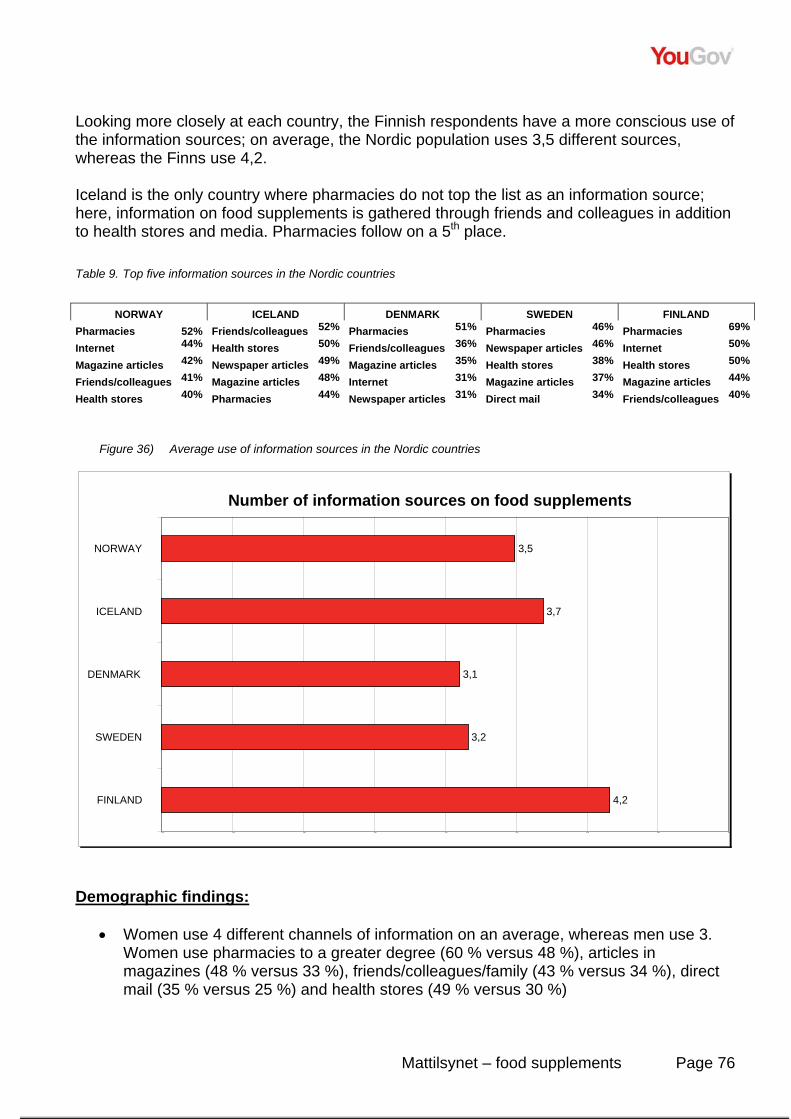
Mattilsynet – food supplements Page 76
Looking more closely at each country, the Finnish respondents have a more conscious use of the information sources; on average, the Nordic population uses 3,5 different sources, whereas the Finns use 4,2. Iceland is the only country where pharmacies do not top the list as an information source; here, information on food supplements is gathered through friends and colleagues in addition to health stores and media. Pharmacies follow on a 5th place. Table 9. Top five information sources in the Nordic countries
NORWAY ICELAND DENMARK SWEDEN FINLAND
Pharmacies 52% Friends/colleagues 52% Pharmacies 51% Pharmacies 46% Pharmacies 69%
Internet 44% Health stores 50% Friends/colleagues 36% Newspaper articles 46% Internet 50%
Magazine articles 42% Newspaper articles 49% Magazine articles 35% Health stores 38% Health stores 50%
Friends/colleagues 41% Magazine articles 48% Internet 31% Magazine articles 37% Magazine articles 44%
Health stores 40% Pharmacies 44% Newspaper articles 31% Direct mail 34% Friends/colleagues 40%
Figure 36) Average use of information sources in the Nordic countries
Demographic findings:
• Women use 4 different channels of information on an average, whereas men use 3. Women use pharmacies to a greater degree (60 % versus 48 %), articles in magazines (48 % versus 33 %), friends/colleagues/family (43 % versus 34 %), direct mail (35 % versus 25 %) and health stores (49 % versus 30 %)
Number of information sources on food supplements
3,5
3,7
3,1
3,2
4,2
1,00 1,50 2,00 2,50 3,00 3,50 4,00 4,50 5,00
NORWAY
ICELAND
DENMARK
SWEDEN
FINLAND
Mattilsynet – food supplements Page 77
• The use of pharmacies is lower among older people than among younger people, 46 % among people above 50 years and 56 % among people under 50 years. We find the same tendency when looking at health stores. (43 % versus 32 %)
• On the other side, older persons receive more information from reading the newspapers. The percentage rises from 30 % among teenagers, to 45 % among our senior citizens
• People in their twenties and thirties seek information among friends/colleagues/family to a larger extent than other age groups
• 39 % of teenagers find information on food supplements through TV programs, versus 27 % for the total group
• Looking at internet use, we find that the percentage diminishes with age, from 50 % among people below 30, and 22 % among people above 60
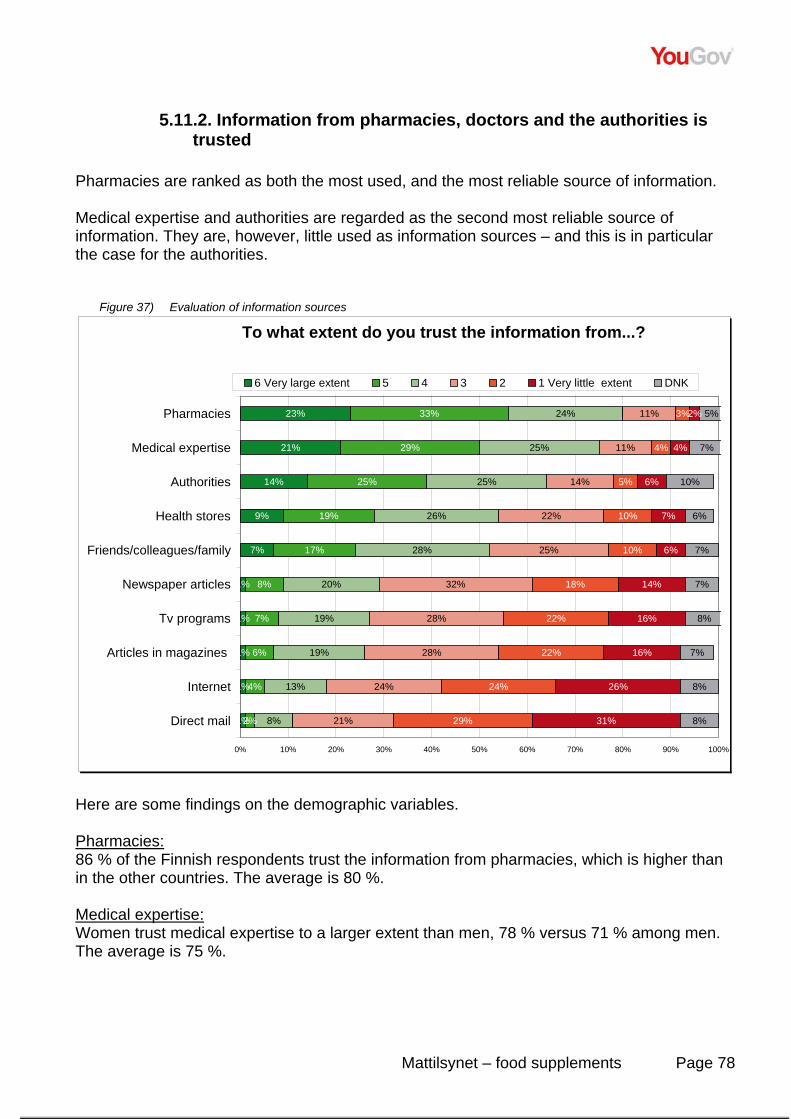
Mattilsynet – food supplements Page 78
5.11.2. Information from pharmacies, doctors and the authorities is trusted
Pharmacies are ranked as both the most used, and the most reliable source of information. Medical expertise and authorities are regarded as the second most reliable source of information. They are, however, little used as information sources – and this is in particular the case for the authorities.
Figure 37) Evaluation of information sources
To what extent do you trust the information from...?
23%
21%
14%
9%
7%
1%
1%
1%
1%
1%
33%
29%
25%
19%
17%
8%
7%
6%
4%
2%
24%
25%
25%
26%
28%
20%
19%
19%
13%
8%
11%
11%
14%
22%
25%
32%
28%
28%
24%
21%
3%
4%
5%
10%
10%
18%
22%
22%
24%
29%
2%
4%
6%
7%
6%
14%
16%
16%
26%
31%
5%
7%
10%
6%
7%
7%
8%
7%
8%
8%
0% 10% 20% 30% 40% 50% 60% 70% 80% 90% 100%
Pharmacies
Medical expertise
Authorities
Health stores
Friends/colleagues/family
Newspaper articles
Tv programs
Articles in magazines
Internet
Direct mail
6 Very large extent 5 4 3 2 1 Very little extent DNK
Here are some findings on the demographic variables. Pharmacies: 86 % of the Finnish respondents trust the information from pharmacies, which is higher than in the other countries. The average is 80 %. Medical expertise: Women trust medical expertise to a larger extent than men, 78 % versus 71 % among men. The average is 75 %.
Mattilsynet – food supplements Page 79
Authorities Norwegian and Swedish respondents seem to have the least confidence in the authorities (57 %, respectively 56 % trust the information) vs 64 % for the Nordics as a whole) Furthermore, people with higher education trust the information from authorities more than people with lower education (56 % vs 66 %), and people with higher income (62 % vs 74 %). Health stores Danish consumers are split in their view regarding the information coming from health stores. 48 % trust the information, and 47 % do not. Furthermore, women trust the information from health stores far more than men, 63 % versus 45 %. We also find a correlation between age and trust; the higher the age, the lower the trust: 61 % among people below 30 years regard the information from health stores positively, and 46 % in the group 60 years and above. Friends/colleagues/family. Women trust information from their nearest more than men do. 57 % trust their friends, colleagues and family, whereas the corresponding number for men is 46 %. Newspaper articles Finns trust information in newspapers to a larger extent than others. 43 % are positive as opposed to 29 % for the rest of the Nordic countries.
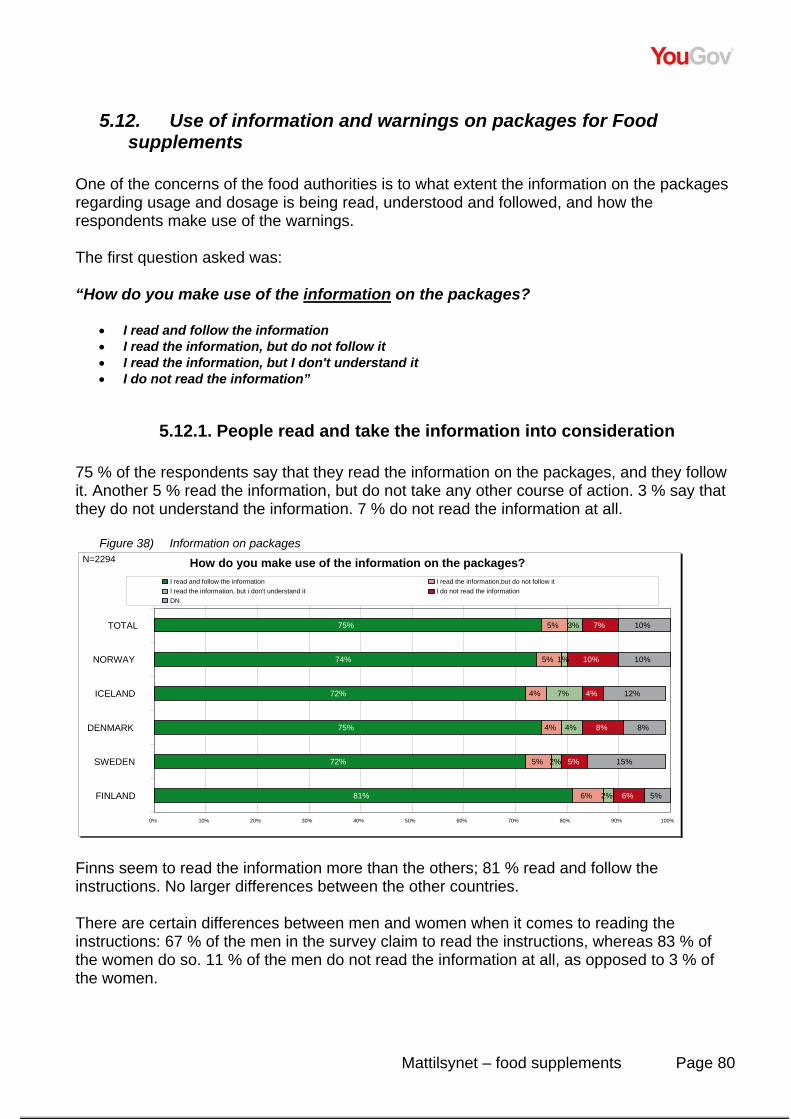
Mattilsynet – food supplements Page 80
5.12. Use of information and warnings on packages for Food supplements
One of the concerns of the food authorities is to what extent the information on the packages regarding usage and dosage is being read, understood and followed, and how the respondents make use of the warnings. The first question asked was: “How do you make use of the information on the packages?
• I read and follow the information • I read the information, but do not follow it • I read the information, but I don't understand it • I do not read the information”
5.12.1. People read and take the information into consideration 75 % of the respondents say that they read the information on the packages, and they follow it. Another 5 % read the information, but do not take any other course of action. 3 % say that they do not understand the information. 7 % do not read the information at all.
Figure 38) Information on packages
Finns seem to read the information more than the others; 81 % read and follow the instructions. No larger differences between the other countries. There are certain differences between men and women when it comes to reading the instructions: 67 % of the men in the survey claim to read the instructions, whereas 83 % of the women do so. 11 % of the men do not read the information at all, as opposed to 3 % of the women.
How do you make use of the information on the packages?
75%
74%
72%
75%
72%
81%
5%
5%
4%
4%
5%
6%
3%
1%
7%
4%
2%
2%
7%
10%
4%
8%
5%
6%
10%
10%
12%
8%
15%
5%
0% 10% 20% 30% 40% 50% 60% 70% 80% 90% 100%
TOTAL
NORWAY
ICELAND
DENMARK
SWEDEN
FINLAND
I read and follow the information I read the information,but do not follow itI read the information, but i don't understand it I do not read the informationDN
N=2294
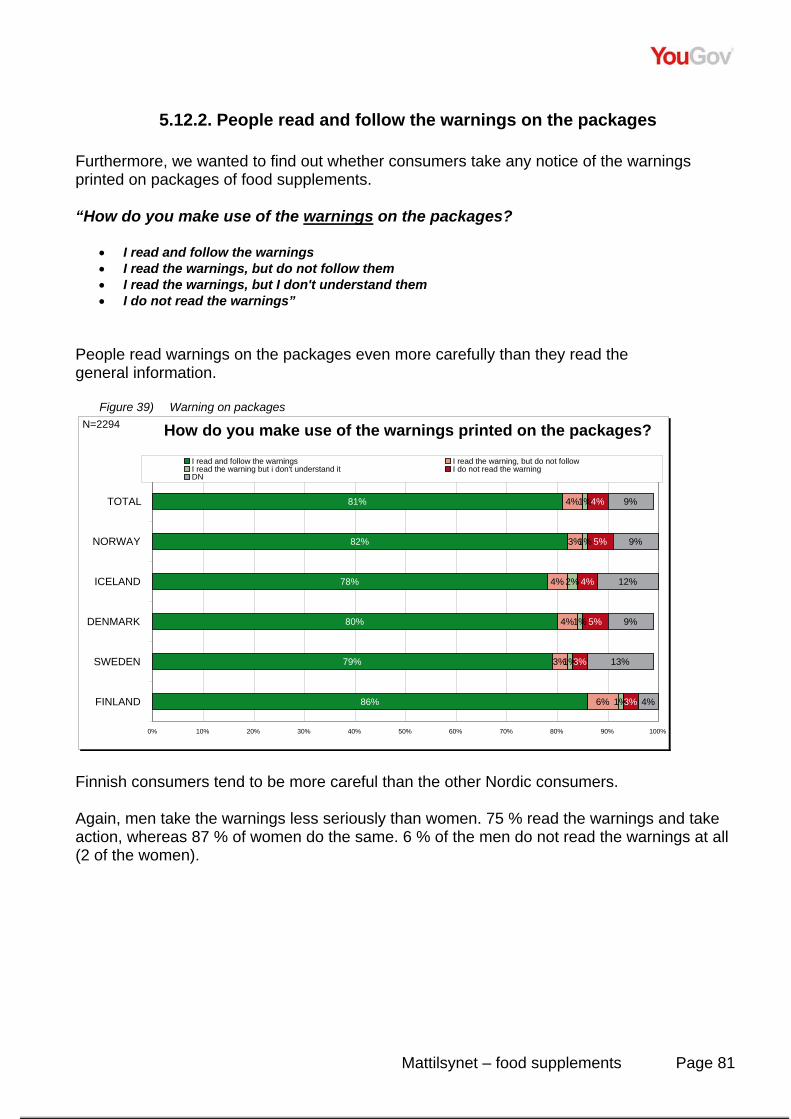
Mattilsynet – food supplements Page 81
5.12.2. People read and follow the warnings on the packages Furthermore, we wanted to find out whether consumers take any notice of the warnings printed on packages of food supplements. “How do you make use of the warnings on the packages?
• I read and follow the warnings • I read the warnings, but do not follow them • I read the warnings, but I don't understand them • I do not read the warnings”
People read warnings on the packages even more carefully than they read the general information.
Figure 39) Warning on packages
Finnish consumers tend to be more careful than the other Nordic consumers. Again, men take the warnings less seriously than women. 75 % read the warnings and take action, whereas 87 % of women do the same. 6 % of the men do not read the warnings at all (2 of the women).
How do you make use of the warnings printed on the packages?
81%
82%
78%
80%
79%
86%
4%
3%
4%
4%
3%
6%
1%
1%
2%
1%
1%
1%
4%
5%
4%
5%
3%
3%
9%
9%
12%
9%
13%
4%
0% 10% 20% 30% 40% 50% 60% 70% 80% 90% 100%
TOTAL
NORWAY
ICELAND
DENMARK
SWEDEN
FINLAND
I read and follow the warnings I read the warning, but do not follow I read the warning but i don't understand it I do not read the warningDN
N=2294
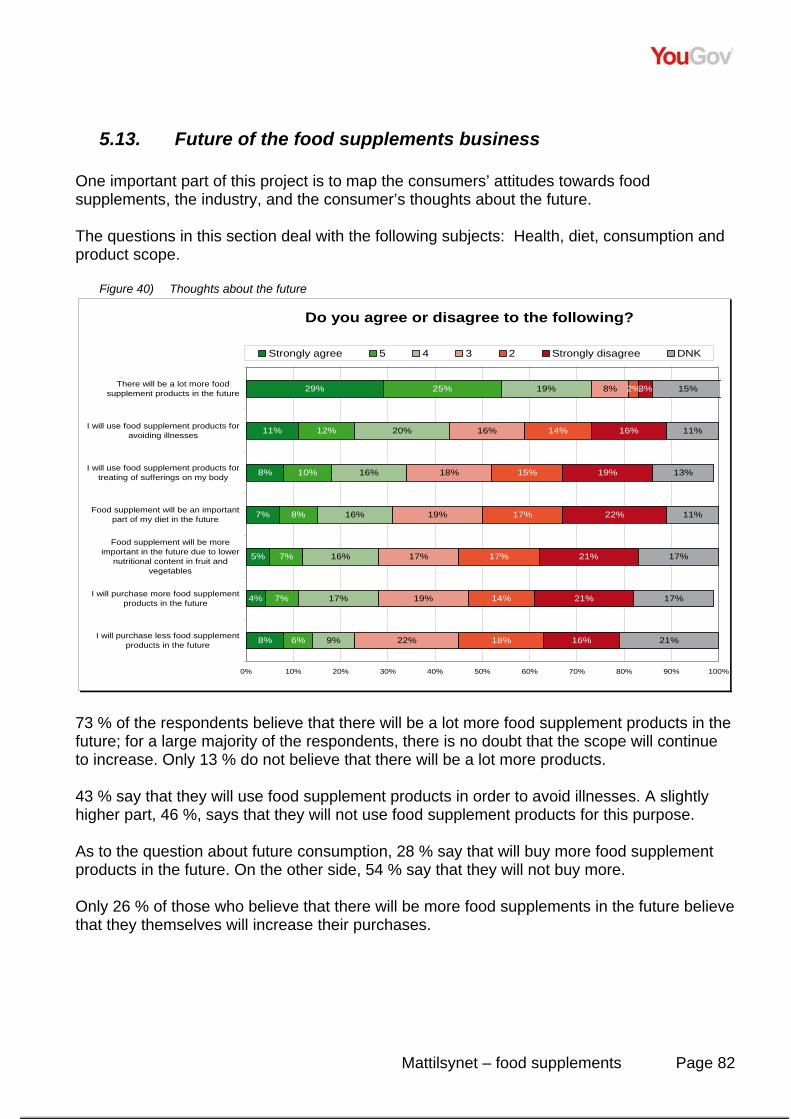
Mattilsynet – food supplements Page 82
5.13. Future of the food supplements business One important part of this project is to map the consumers’ attitudes towards food supplements, the industry, and the consumer’s thoughts about the future. The questions in this section deal with the following subjects: Health, diet, consumption and product scope.
Figure 40) Thoughts about the future
Do you agree or disagree to the following?
29%
11%
8%
7%
5%
4%
8%
25%
12%
10%
8%
7%
7%
6%
19%
20%
16%
16%
16%
17%
9%
8%
16%
18%
19%
17%
19%
22%
2%
14%
15%
17%
17%
14%
18%
3%
16%
19%
22%
21%
21%
16%
15%
11%
13%
11%
17%
17%
21%
0% 10% 20% 30% 40% 50% 60% 70% 80% 90% 100%
There will be a lot more foodsupplement products in the future
I will use food supplement products foravoiding illnesses
I will use food supplement products fortreating of sufferings on my body
Food supplement will be an importantpart of my diet in the future
Food supplement will be moreimportant in the future due to lower
nutritional content in fruit andvegetables
I will purchase more food supplementproducts in the future
I will purchase less food supplementproducts in the future
Strongly agree 5 4 3 2 Strongly disagree DNK
73 % of the respondents believe that there will be a lot more food supplement products in the future; for a large majority of the respondents, there is no doubt that the scope will continue to increase. Only 13 % do not believe that there will be a lot more products. 43 % say that they will use food supplement products in order to avoid illnesses. A slightly higher part, 46 %, says that they will not use food supplement products for this purpose. As to the question about future consumption, 28 % say that will buy more food supplement products in the future. On the other side, 54 % say that they will not buy more. Only 26 % of those who believe that there will be more food supplements in the future believe that they themselves will increase their purchases.
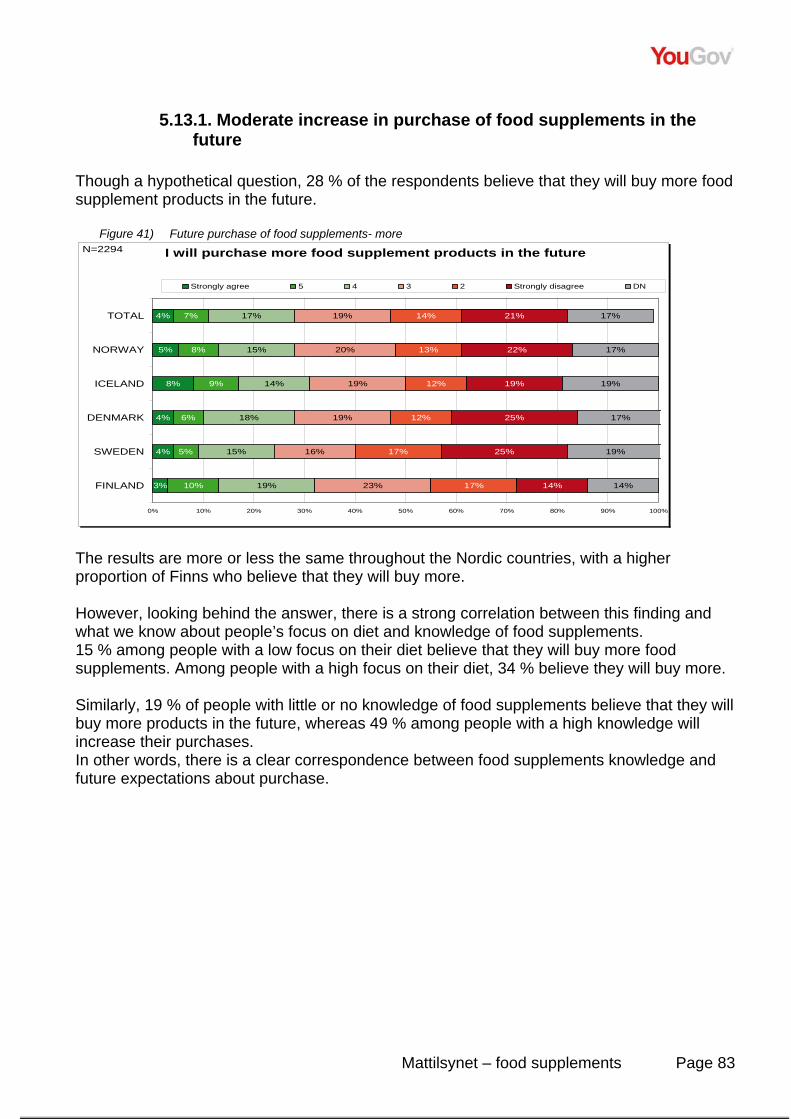
Mattilsynet – food supplements Page 83
5.13.1. Moderate increase in purchase of food supplements in the future
Though a hypothetical question, 28 % of the respondents believe that they will buy more food supplement products in the future.
Figure 41) Future purchase of food supplements- more I will purchase more food supplement products in the future
4%
5%
8%
4%
4%
3%
7%
8%
9%
6%
5%
10%
17%
15%
14%
18%
15%
19%
19%
20%
19%
19%
16%
23%
14%
13%
12%
12%
17%
17%
21%
22%
19%
25%
25%
14%
17%
17%
19%
17%
19%
14%
0% 10% 20% 30% 40% 50% 60% 70% 80% 90% 100%
TOTAL
NORWAY
ICELAND
DENMARK
SWEDEN
FINLAND
Strongly agree 5 4 3 2 Strongly disagree DN
N=2294
The results are more or less the same throughout the Nordic countries, with a higher proportion of Finns who believe that they will buy more. However, looking behind the answer, there is a strong correlation between this finding and what we know about people’s focus on diet and knowledge of food supplements. 15 % among people with a low focus on their diet believe that they will buy more food supplements. Among people with a high focus on their diet, 34 % believe they will buy more. Similarly, 19 % of people with little or no knowledge of food supplements believe that they will buy more products in the future, whereas 49 % among people with a high knowledge will increase their purchases. In other words, there is a clear correspondence between food supplements knowledge and future expectations about purchase.
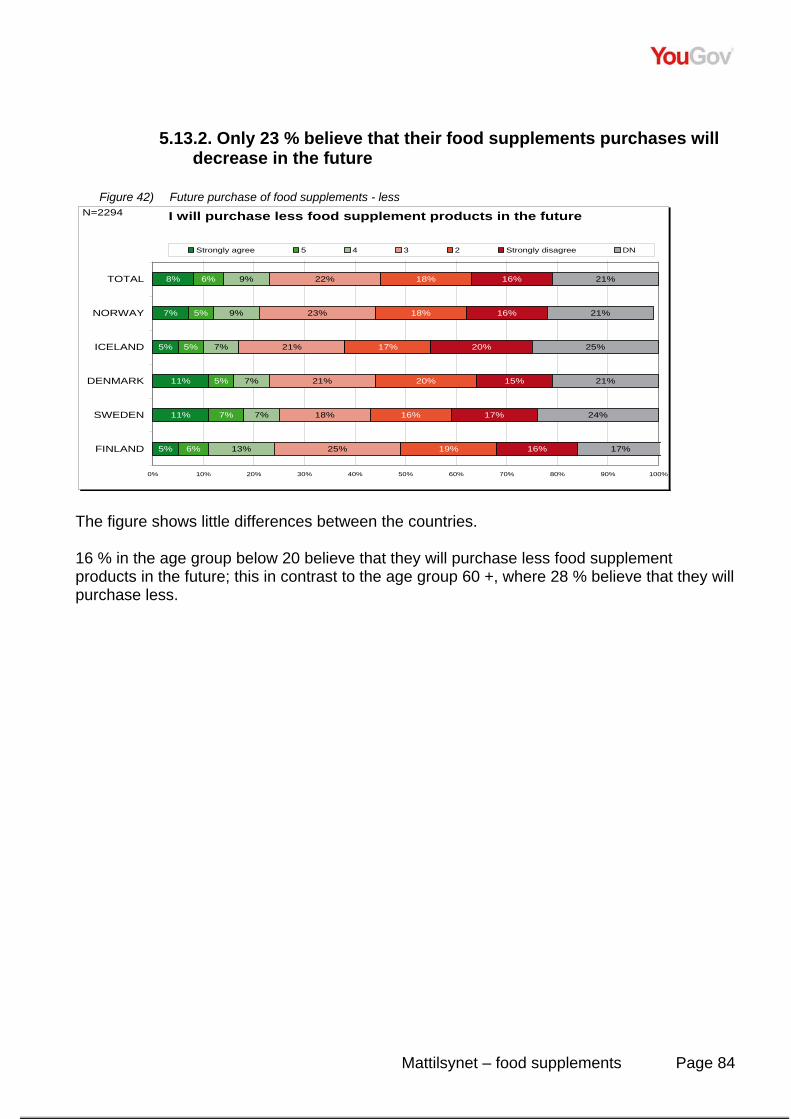
Mattilsynet – food supplements Page 84
5.13.2. Only 23 % believe that their food supplements purchases will decrease in the future
Figure 42) Future purchase of food supplements - less
I will purchase less food supplement products in the future
8%
7%
5%
11%
11%
5%
6%
5%
5%
5%
7%
6%
9%
9%
7%
7%
7%
13%
22%
23%
21%
21%
18%
25%
18%
18%
17%
20%
16%
19%
16%
16%
20%
15%
17%
16%
21%
21%
25%
21%
24%
17%
0% 10% 20% 30% 40% 50% 60% 70% 80% 90% 100%
TOTAL
NORWAY
ICELAND
DENMARK
SWEDEN
FINLAND
Strongly agree 5 4 3 2 Strongly disagree DN
N=2294
The figure shows little differences between the countries. 16 % in the age group below 20 believe that they will purchase less food supplement products in the future; this in contrast to the age group 60 +, where 28 % believe that they will purchase less.
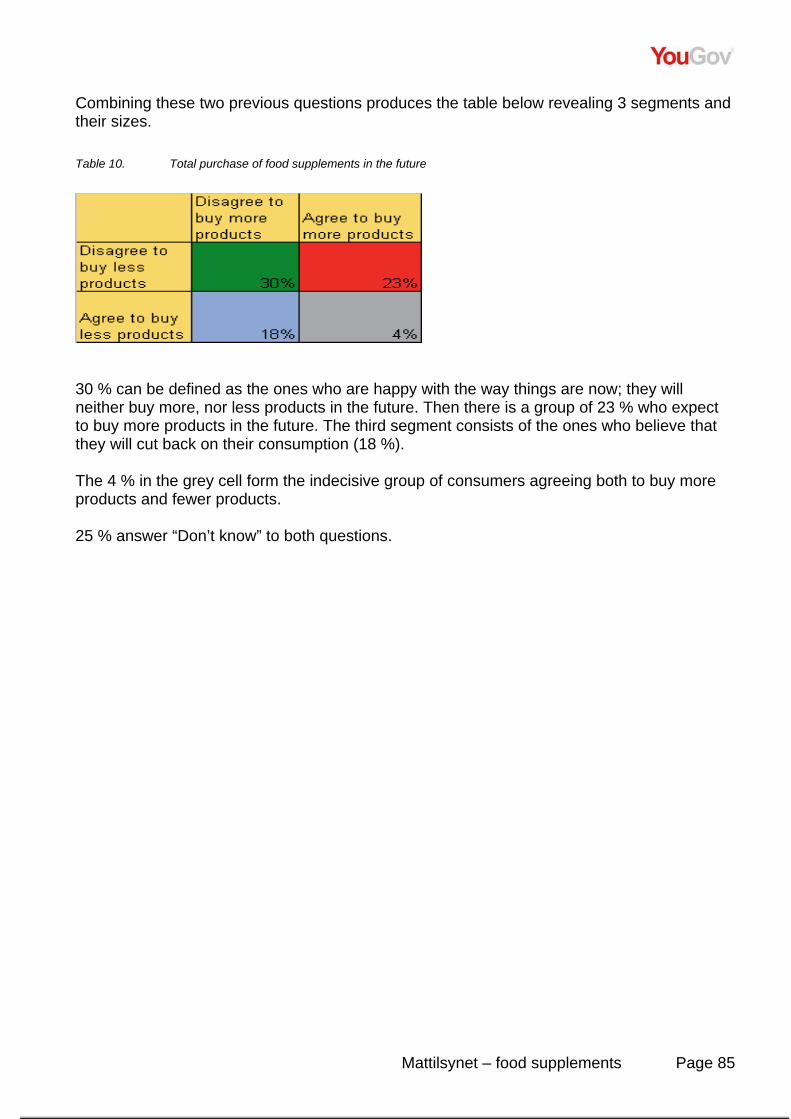
Mattilsynet – food supplements Page 85
Combining these two previous questions produces the table below revealing 3 segments and their sizes. Table 10. Total purchase of food supplements in the future
30 % can be defined as the ones who are happy with the way things are now; they will neither buy more, nor less products in the future. Then there is a group of 23 % who expect to buy more products in the future. The third segment consists of the ones who believe that they will cut back on their consumption (18 %). The 4 % in the grey cell form the indecisive group of consumers agreeing both to buy more products and fewer products. 25 % answer “Don’t know” to both questions.
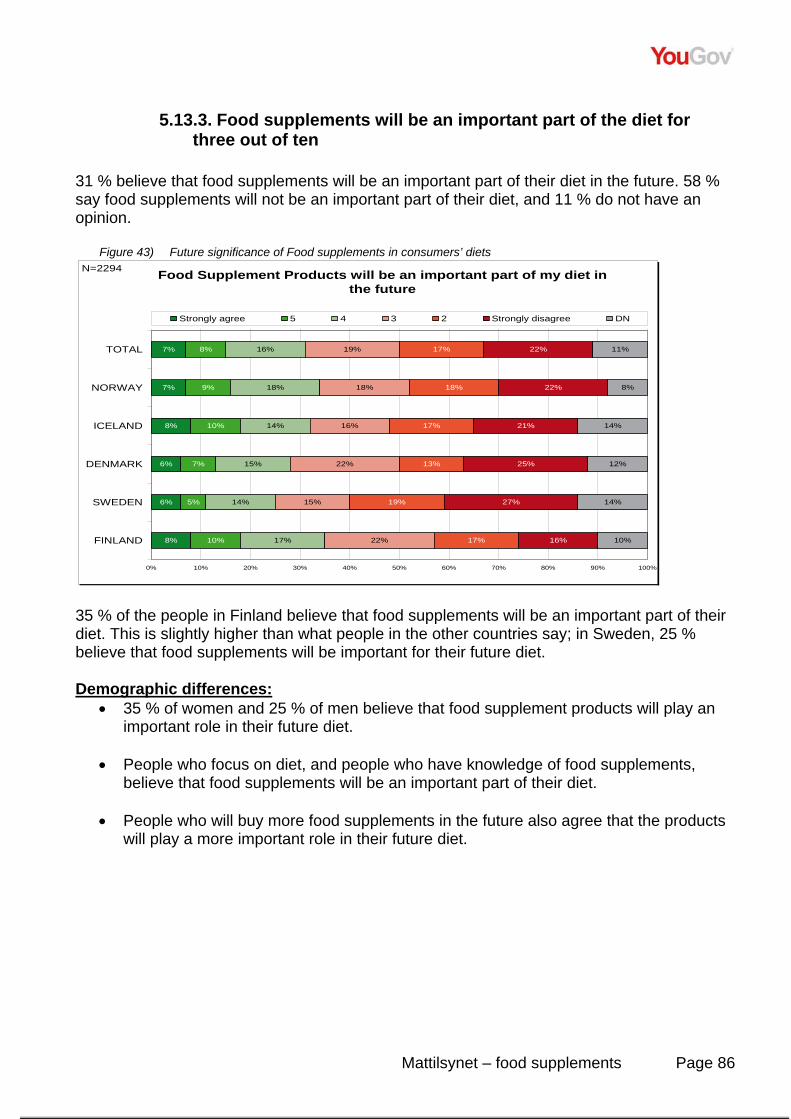
Mattilsynet – food supplements Page 86
5.13.3. Food supplements will be an important part of the diet for three out of ten
31 % believe that food supplements will be an important part of their diet in the future. 58 % say food supplements will not be an important part of their diet, and 11 % do not have an opinion.
Figure 43) Future significance of Food supplements in consumers’ diets
Food Supplement Products will be an important part of my diet in the future
7%
7%
8%
6%
6%
8%
8%
9%
10%
7%
5%
10%
16%
18%
14%
15%
14%
17%
19%
18%
16%
22%
15%
22%
17%
18%
17%
13%
19%
17%
22%
22%
21%
25%
27%
16%
11%
8%
14%
12%
14%
10%
0% 10% 20% 30% 40% 50% 60% 70% 80% 90% 100%
TOTAL
NORWAY
ICELAND
DENMARK
SWEDEN
FINLAND
Strongly agree 5 4 3 2 Strongly disagree DN
N=2294
35 % of the people in Finland believe that food supplements will be an important part of their diet. This is slightly higher than what people in the other countries say; in Sweden, 25 % believe that food supplements will be important for their future diet. Demographic differences:
• 35 % of women and 25 % of men believe that food supplement products will play an important role in their future diet.
• People who focus on diet, and people who have knowledge of food supplements,
believe that food supplements will be an important part of their diet.
• People who will buy more food supplements in the future also agree that the products will play a more important role in their future diet.
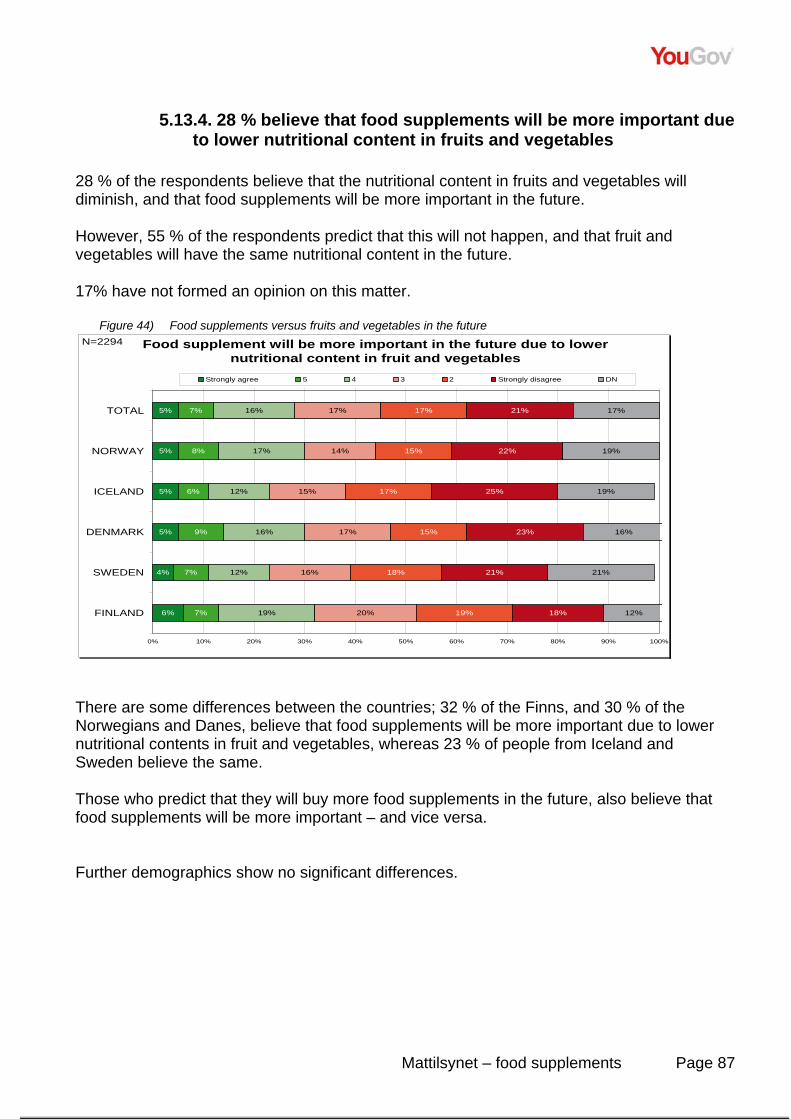
Mattilsynet – food supplements Page 87
5.13.4. 28 % believe that food supplements will be more important due to lower nutritional content in fruits and vegetables
28 % of the respondents believe that the nutritional content in fruits and vegetables will diminish, and that food supplements will be more important in the future. However, 55 % of the respondents predict that this will not happen, and that fruit and vegetables will have the same nutritional content in the future. 17% have not formed an opinion on this matter.
Figure 44) Food supplements versus fruits and vegetables in the future Food supplement will be more important in the future due to lower
nutritional content in fruit and vegetables
5%
5%
5%
5%
4%
6%
7%
8%
6%
9%
7%
7%
16%
17%
12%
16%
12%
19%
17%
14%
15%
17%
16%
20%
17%
15%
17%
15%
18%
19%
21%
22%
25%
23%
21%
18%
17%
19%
19%
16%
21%
12%
0% 10% 20% 30% 40% 50% 60% 70% 80% 90% 100%
TOTAL
NORWAY
ICELAND
DENMARK
SWEDEN
FINLAND
Strongly agree 5 4 3 2 Strongly disagree DN
N=2294
There are some differences between the countries; 32 % of the Finns, and 30 % of the Norwegians and Danes, believe that food supplements will be more important due to lower nutritional contents in fruit and vegetables, whereas 23 % of people from Iceland and Sweden believe the same. Those who predict that they will buy more food supplements in the future, also believe that food supplements will be more important – and vice versa. Further demographics show no significant differences.
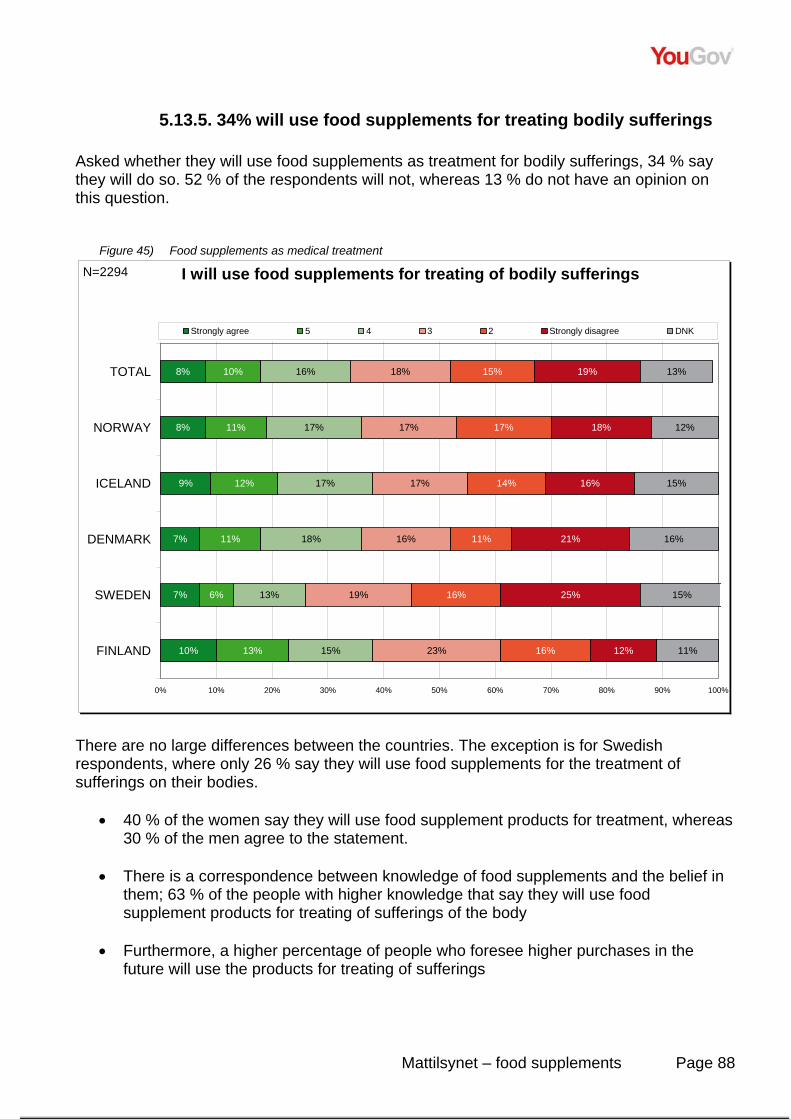
Mattilsynet – food supplements Page 88
5.13.5. 34% will use food supplements for treating bodily sufferings Asked whether they will use food supplements as treatment for bodily sufferings, 34 % say they will do so. 52 % of the respondents will not, whereas 13 % do not have an opinion on this question.
Figure 45) Food supplements as medical treatment
I will use food supplements for treating of bodily sufferings
8%
8%
9%
7%
7%
10%
10%
11%
12%
11%
6%
13%
16%
17%
17%
18%
13%
15%
18%
17%
17%
16%
19%
23%
15%
17%
14%
11%
16%
16%
19%
18%
16%
21%
25%
12%
13%
12%
15%
16%
15%
11%
0% 10% 20% 30% 40% 50% 60% 70% 80% 90% 100%
TOTAL
NORWAY
ICELAND
DENMARK
SWEDEN
FINLAND
Strongly agree 5 4 3 2 Strongly disagree DNK
N=2294
There are no large differences between the countries. The exception is for Swedish respondents, where only 26 % say they will use food supplements for the treatment of sufferings on their bodies.
• 40 % of the women say they will use food supplement products for treatment, whereas 30 % of the men agree to the statement.
• There is a correspondence between knowledge of food supplements and the belief in
them; 63 % of the people with higher knowledge that say they will use food supplement products for treating of sufferings of the body
• Furthermore, a higher percentage of people who foresee higher purchases in the
future will use the products for treating of sufferings
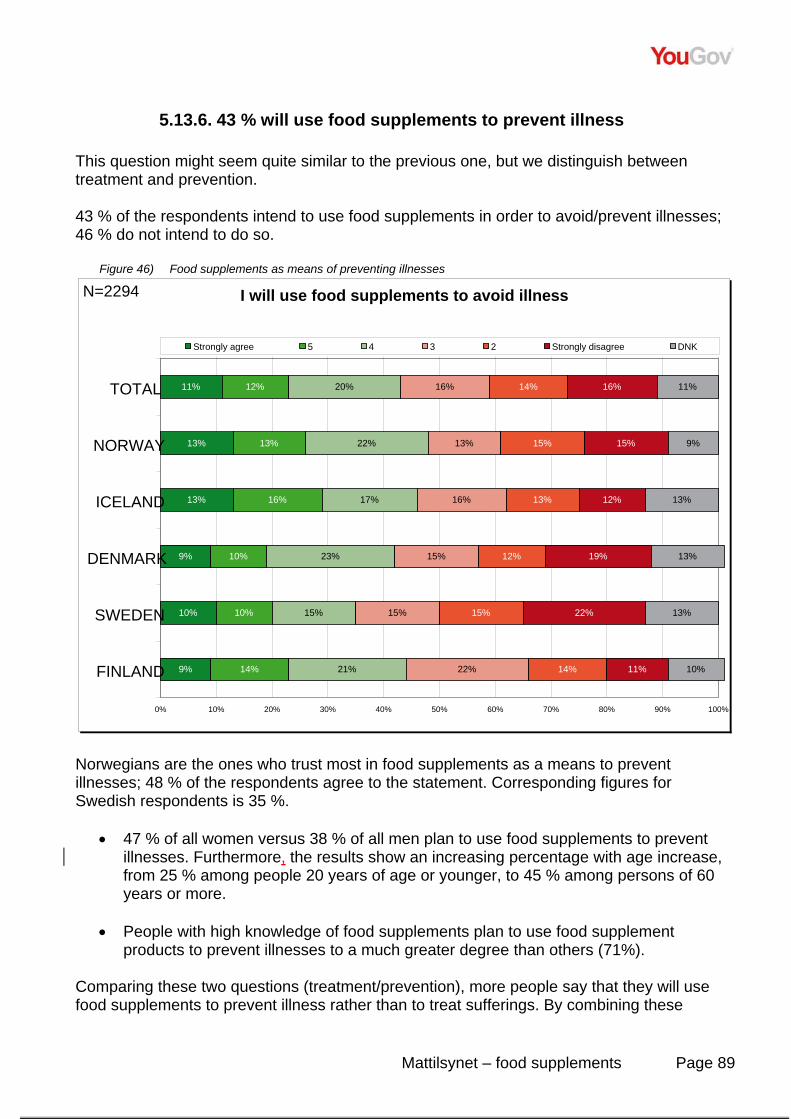
Mattilsynet – food supplements Page 89
5.13.6. 43 % will use food supplements to prevent illness This question might seem quite similar to the previous one, but we distinguish between treatment and prevention. 43 % of the respondents intend to use food supplements in order to avoid/prevent illnesses; 46 % do not intend to do so.
Figure 46) Food supplements as means of preventing illnesses
Norwegians are the ones who trust most in food supplements as a means to prevent illnesses; 48 % of the respondents agree to the statement. Corresponding figures for Swedish respondents is 35 %.
• 47 % of all women versus 38 % of all men plan to use food supplements to prevent illnesses. Furthermore, the results show an increasing percentage with age increase, from 25 % among people 20 years of age or younger, to 45 % among persons of 60 years or more.
• People with high knowledge of food supplements plan to use food supplement
products to prevent illnesses to a much greater degree than others (71%). Comparing these two questions (treatment/prevention), more people say that they will use food supplements to prevent illness rather than to treat sufferings. By combining these
I will use food supplements to avoid illness
11%
13%
13%
9%
10%
9%
12%
13%
16%
10%
10%
14%
20%
22%
17%
23%
15%
21%
16%
13%
16%
15%
15%
22%
14%
15%
13%
12%
15%
14%
16%
15%
12%
19%
22%
11%
11%
9%
13%
13%
13%
10%
0% 10% 20% 30% 40% 50% 60% 70% 80% 90% 100%
TOTAL
NORWAY
ICELAND
DENMARK
SWEDEN
FINLAND
Strongly agree 5 4 3 2 Strongly disagree DNK
N=2294
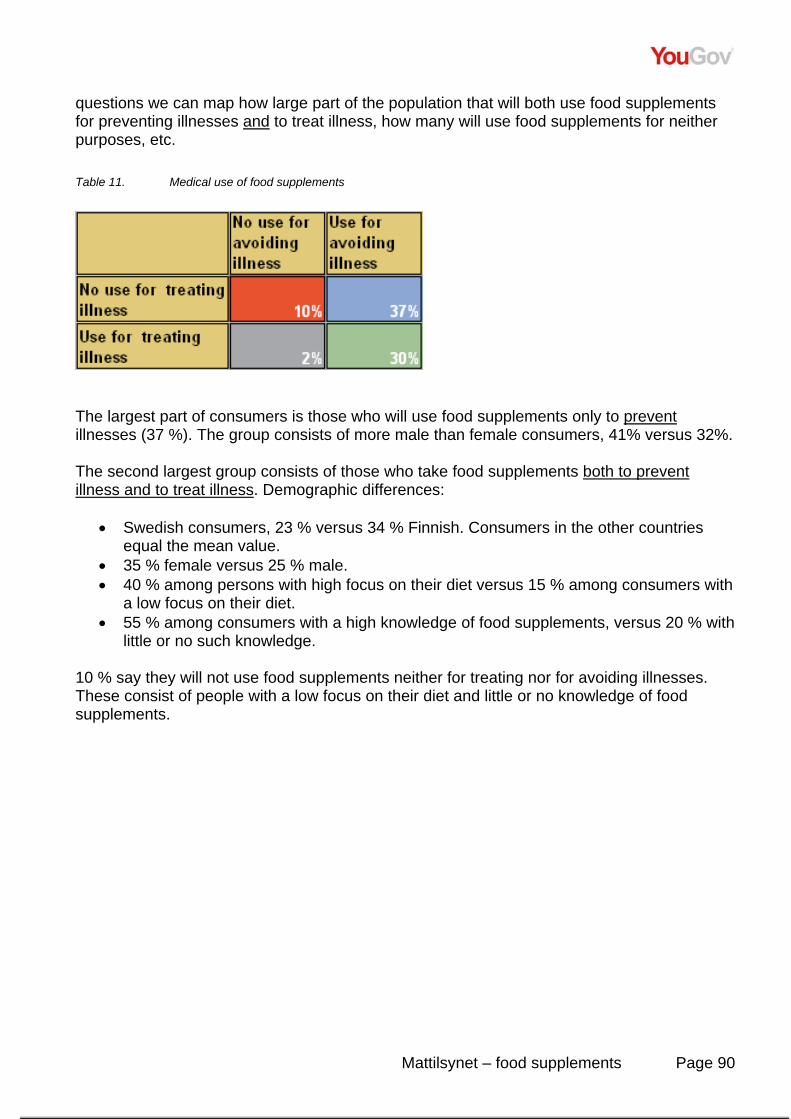
Mattilsynet – food supplements Page 90
questions we can map how large part of the population that will both use food supplements for preventing illnesses and to treat illness, how many will use food supplements for neither purposes, etc. Table 11. Medical use of food supplements
The largest part of consumers is those who will use food supplements only to prevent illnesses (37 %). The group consists of more male than female consumers, 41% versus 32%. The second largest group consists of those who take food supplements both to prevent illness and to treat illness. Demographic differences:
• Swedish consumers, 23 % versus 34 % Finnish. Consumers in the other countries equal the mean value.
• 35 % female versus 25 % male. • 40 % among persons with high focus on their diet versus 15 % among consumers with
a low focus on their diet. • 55 % among consumers with a high knowledge of food supplements, versus 20 % with
little or no such knowledge. 10 % say they will not use food supplements neither for treating nor for avoiding illnesses. These consist of people with a low focus on their diet and little or no knowledge of food supplements.
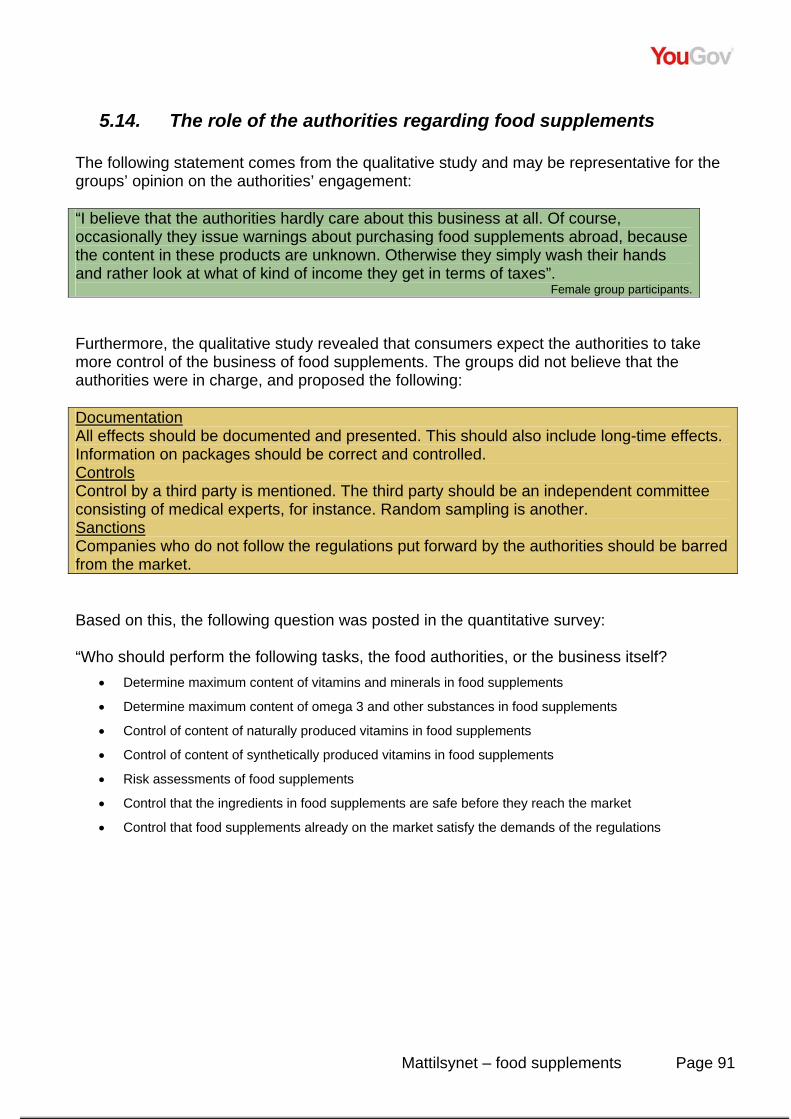
Mattilsynet – food supplements Page 91
5.14. The role of the authorities regarding food supplements The following statement comes from the qualitative study and may be representative for the groups’ opinion on the authorities’ engagement: “I believe that the authorities hardly care about this business at all. Of course, occasionally they issue warnings about purchasing food supplements abroad, because the content in these products are unknown. Otherwise they simply wash their hands and rather look at what of kind of income they get in terms of taxes”.
Female group participants. Furthermore, the qualitative study revealed that consumers expect the authorities to take more control of the business of food supplements. The groups did not believe that the authorities were in charge, and proposed the following: Documentation All effects should be documented and presented. This should also include long-time effects. Information on packages should be correct and controlled. Controls Control by a third party is mentioned. The third party should be an independent committee consisting of medical experts, for instance. Random sampling is another. Sanctions Companies who do not follow the regulations put forward by the authorities should be barred from the market. Based on this, the following question was posted in the quantitative survey: “Who should perform the following tasks, the food authorities, or the business itself?
• Determine maximum content of vitamins and minerals in food supplements
• Determine maximum content of omega 3 and other substances in food supplements
• Control of content of naturally produced vitamins in food supplements
• Control of content of synthetically produced vitamins in food supplements
• Risk assessments of food supplements
• Control that the ingredients in food supplements are safe before they reach the market
• Control that food supplements already on the market satisfy the demands of the regulations
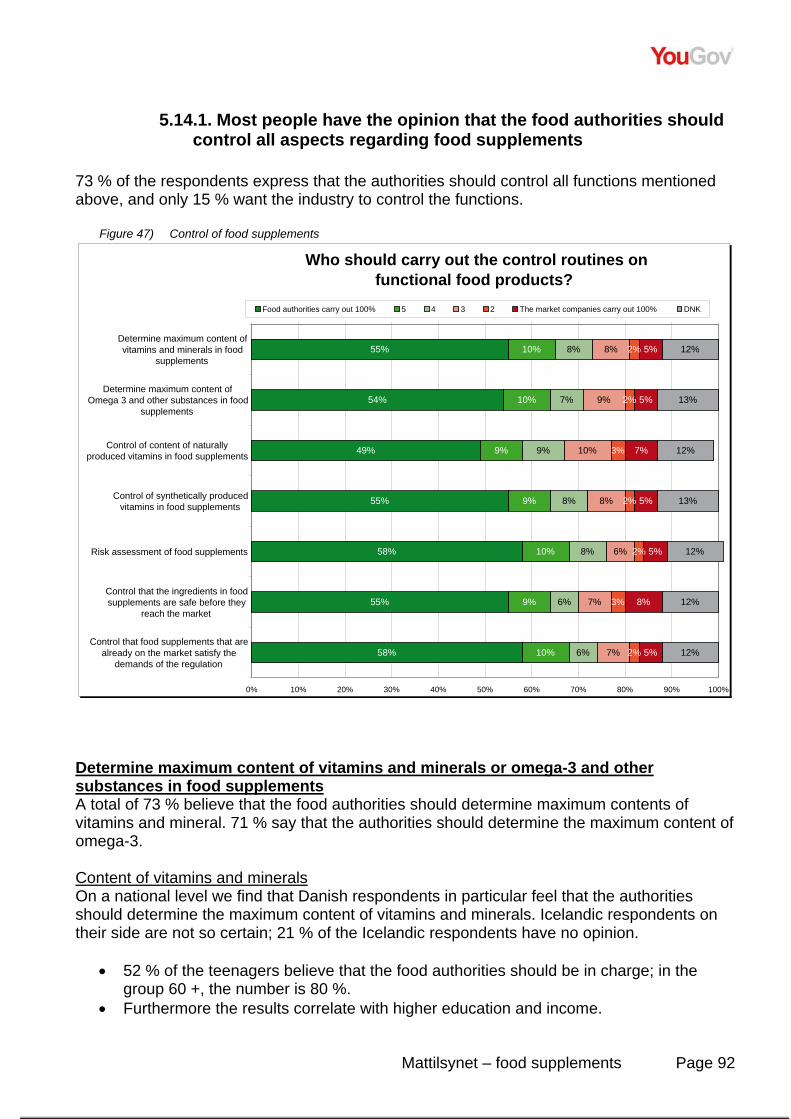
Mattilsynet – food supplements Page 92
5.14.1. Most people have the opinion that the food authorities should control all aspects regarding food supplements
73 % of the respondents express that the authorities should control all functions mentioned above, and only 15 % want the industry to control the functions.
Figure 47) Control of food supplements
Determine maximum content of vitamins and minerals or omega-3 and other substances in food supplements A total of 73 % believe that the food authorities should determine maximum contents of vitamins and mineral. 71 % say that the authorities should determine the maximum content of omega-3. Content of vitamins and minerals On a national level we find that Danish respondents in particular feel that the authorities should determine the maximum content of vitamins and minerals. Icelandic respondents on their side are not so certain; 21 % of the Icelandic respondents have no opinion.
• 52 % of the teenagers believe that the food authorities should be in charge; in the group 60 +, the number is 80 %.
• Furthermore the results correlate with higher education and income.
Who should carry out the control routines onfunctional food products?
55%
54%
49%
55%
58%
55%
58%
10%
10%
9%
9%
10%
9%
10%
8%
7%
9%
8%
8%
6%
6%
8%
9%
10%
8%
6%
7%
7%
2%
2%
3%
2%
2%
3%
2%
5%
5%
7%
5%
5%
8%
5%
12%
13%
12%
13%
12%
12%
12%
0% 10% 20% 30% 40% 50% 60% 70% 80% 90% 100%
Determine maximum content ofvitamins and minerals in food
supplements
Determine maximum content ofOmega 3 and other substances in food
supplements
Control of content of naturally produced vitamins in food supplements
Control of synthetically producedvitamins in food supplements
Risk assessment of food supplements
Control that the ingredients in foodsupplements are safe before they
reach the market
Control that food supplements that are already on the market satisfy the
demands of the regulation
Food authorities carry out 100% 5 4 3 2 The market companies carry out 100% DNK
Mattilsynet – food supplements Page 93
Content of omega- 3 80 % of the Danish respondents believe that the food authorities should carry out the control routines. Again, Icelandic people answer to a higher degree “Do not know”, (24%).
• Young people are more indecisive, 25 % answer “don’t know”. • The results reveal a correlation between education and income and views on control
routines.The higher income/education, the more one believes that the authorities should determine the content of omega 3.
Control of content of naturally produced vitamins in food supplements Control of content of synthetically produced vitamins in food supplements 67 % say that the authorities should control the naturally produced vitamins in food supplements. 20 % say that the business itself should perform this task, and 12 % answer “Don’t know”. 72 % of the Nordic consumers mean that the authorities should control the content of artificial vitamins. 15 % thinks the business should carry out the control, whereas 13 % have no opinion. Thus the consumers seem a little more suspicious towards synthetically produced vitamins. However, the difference in opinion is marginal. Naturally produced vitamins Danish respondents are in favor of government (77 %), whereas Finnish people seem to be to a higher extent in favor of the industry (30 %).
• There is a difference in opinions between the older and the younger groups. 3 out of 10 persons under 30 would want to leave the control in the hands of the food supplement industry. Only 10 % of the people over 60 years feel the same.
Synthetically produced vitamins On the national level, Danish consumers want the authorities to be in control to a larger extent than the other countries. Finnish and Icelandic people have a higher degree of faith in the industry, as 22 % say that the business should handle this. The opinion correlates with age. 24 % of ther persons below 30 believe that the industry itself should control synthetically produced vitamins. The corresponding percentage among people over 60 is 8 %. Risk assessment of food supplements 76 % believe that this is the responsibility of the authorities. 13 % say the industry should handle this.12 % have no opinion. The results reveal that the Danish respondents want the authorities to handle the risk evaluation (80 %). In Finland, 19 % of the respondents were in favor of the industry handling this. Icelandic people have to a greater degree not formed an opinion (21 % “Do not know”).
Mattilsynet – food supplements Page 94
Control that the ingredients in food supplements are safe before they reach the market 74 % mean that the authorities should control that the ingredients are safe to use. 14 % will allow the industry itself to carry out the control routines, 12 % answer “Don’t know”. 32 % of the Finnish respondents say that the industry itself may carry out these control routines. 59 % say the authorities should do it. Among Danes, on the other hand, 79 % say that authorities should be in control; only 13 % feel this should be left in the hands of the market players.
• Young people are more in favor of the market players than older people; 25 % among people below 30 believe that the industry should control the ingredients, whereas 10 % among the group 60 years and above have the same opinion. Furthermore, 23 % among people 20 years or younger answer “Don’t know”.
Control that food supplements already on the market satisfy the demands of the regulation 74 % mean that the authorities should control food supplements already on the market.14 % feel that the market itself should perform this routine. 12 % answer “Don’t know”. The results reveal little or no differences on background variables.
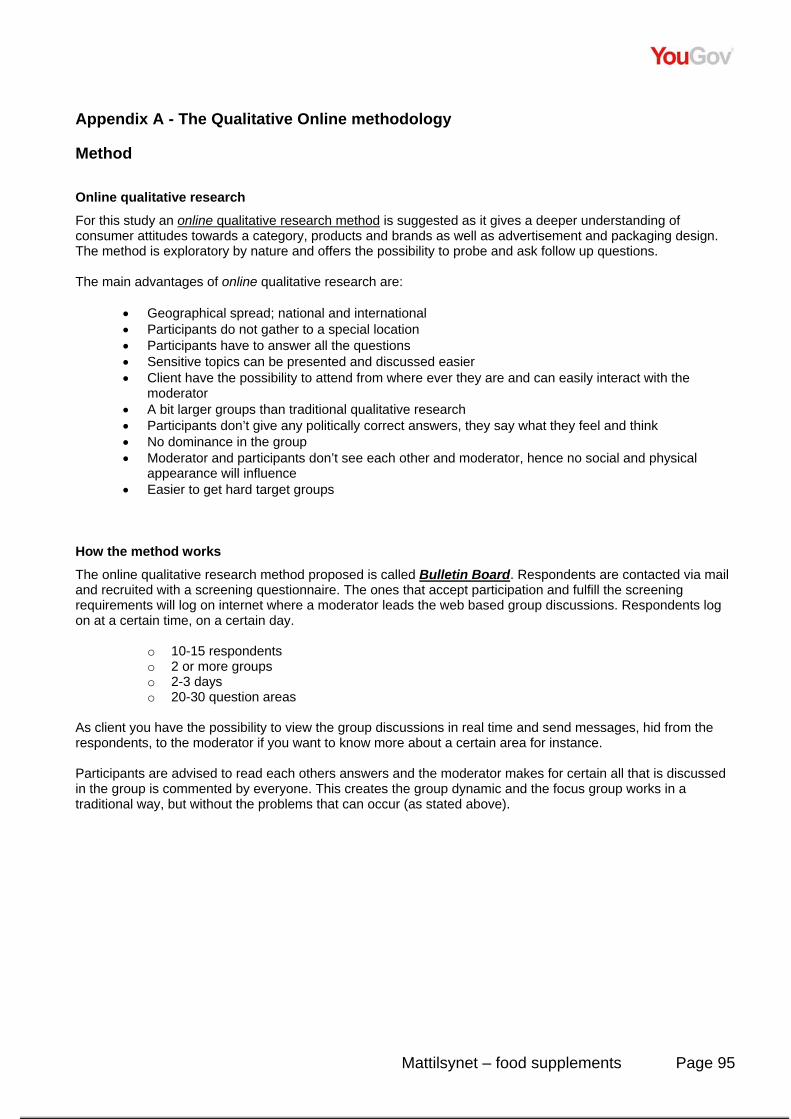
Mattilsynet – food supplements Page 95
Appendix A - The Qualitative Online methodology
Method
Online qualitative research
For this study an online qualitative research method is suggested as it gives a deeper understanding of consumer attitudes towards a category, products and brands as well as advertisement and packaging design. The method is exploratory by nature and offers the possibility to probe and ask follow up questions. The main advantages of online qualitative research are:
• Geographical spread; national and international • Participants do not gather to a special location • Participants have to answer all the questions • Sensitive topics can be presented and discussed easier • Client have the possibility to attend from where ever they are and can easily interact with the
moderator • A bit larger groups than traditional qualitative research • Participants don’t give any politically correct answers, they say what they feel and think • No dominance in the group • Moderator and participants don’t see each other and moderator, hence no social and physical
appearance will influence • Easier to get hard target groups
How the method works
The online qualitative research method proposed is called Bulletin Board. Respondents are contacted via mail and recruited with a screening questionnaire. The ones that accept participation and fulfill the screening requirements will log on internet where a moderator leads the web based group discussions. Respondents log on at a certain time, on a certain day.
o 10-15 respondents o 2 or more groups o 2-3 days o 20-30 question areas
As client you have the possibility to view the group discussions in real time and send messages, hid from the respondents, to the moderator if you want to know more about a certain area for instance. Participants are advised to read each others answers and the moderator makes for certain all that is discussed in the group is commented by everyone. This creates the group dynamic and the focus group works in a traditional way, but without the problems that can occur (as stated above).
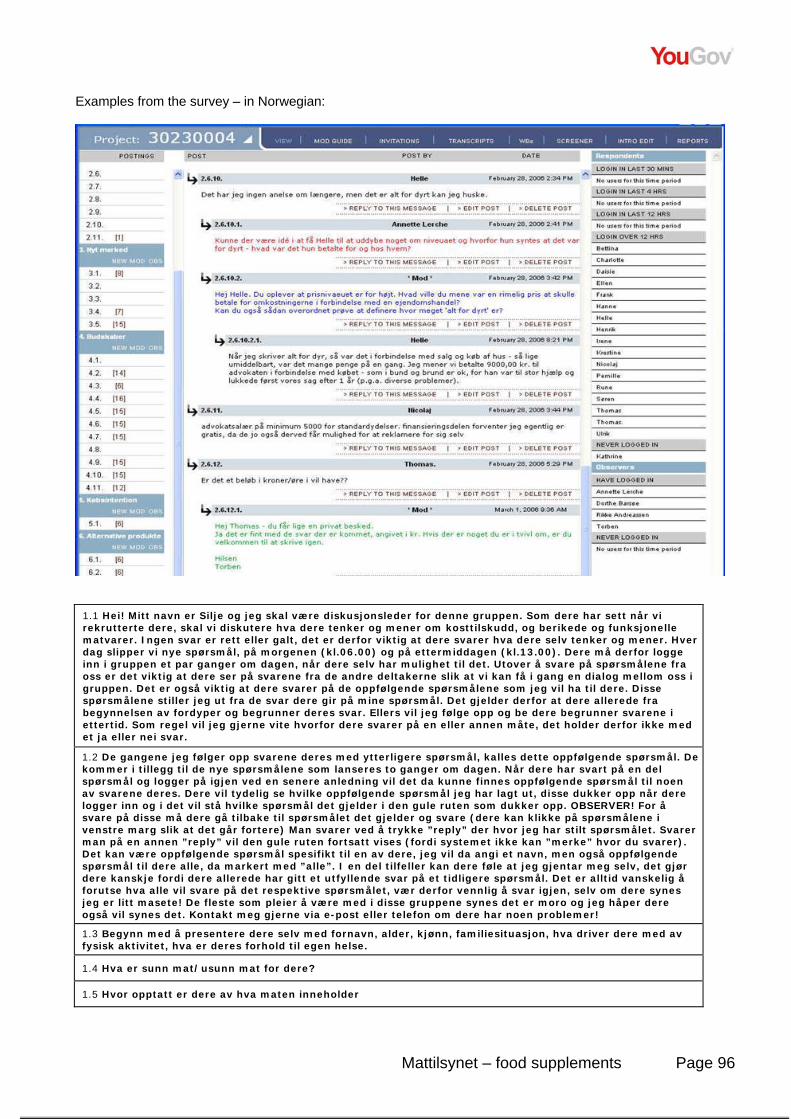
Mattilsynet – food supplements Page 96
Examples from the survey – in Norwegian:
1.1 Hei! Mitt navn er Silje og jeg skal være diskusjonsleder for denne gruppen. Som dere har sett når vi rekrutterte dere, skal vi diskutere hva dere tenker og mener om kosttilskudd, og berikede og funksjonelle matvarer. Ingen svar er rett eller galt, det er derfor viktig at dere svarer hva dere selv tenker og mener. Hver dag slipper vi nye spørsmål, på morgenen (kl.06.00) og på ettermiddagen (kl.13.00). Dere må derfor logge inn i gruppen et par ganger om dagen, når dere selv har mulighet til det. Utover å svare på spørsmålene fra oss er det viktig at dere ser på svarene fra de andre deltakerne slik at vi kan få i gang en dialog mellom oss i gruppen. Det er også viktig at dere svarer på de oppfølgende spørsmålene som jeg vil ha til dere. Disse spørsmålene stiller jeg ut fra de svar dere gir på mine spørsmål. Det gjelder derfor at dere allerede fra begynnelsen av fordyper og begrunner deres svar. Ellers vil jeg følge opp og be dere begrunner svarene i ettertid. Som regel vil jeg gjerne vite hvorfor dere svarer på en eller annen måte, det holder derfor ikke med et ja eller nei svar.
1.2 De gangene jeg følger opp svarene deres med ytterligere spørsmål, kalles dette oppfølgende spørsmål. De kommer i tillegg til de nye spørsmålene som lanseres to ganger om dagen. Når dere har svart på en del spørsmål og logger på igjen ved en senere anledning vil det da kunne finnes oppfølgende spørsmål til noen av svarene deres. Dere vil tydelig se hvilke oppfølgende spørsmål jeg har lagt ut, disse dukker opp når dere logger inn og i det vil stå hvilke spørsmål det gjelder i den gule ruten som dukker opp. OBSERVER! For å svare på disse må dere gå tilbake til spørsmålet det gjelder og svare (dere kan klikke på spørsmålene i venstre marg slik at det går fortere) Man svarer ved å trykke ”reply” der hvor jeg har stilt spørsmålet. Svarer man på en annen ”reply” vil den gule ruten fortsatt vises (fordi systemet ikke kan ”merke” hvor du svarer). Det kan være oppfølgende spørsmål spesifikt til en av dere, jeg vil da angi et navn, men også oppfølgende spørsmål til dere alle, da markert med ”alle”. I en del tilfeller kan dere føle at jeg gjentar meg selv, det gjør dere kanskje fordi dere allerede har gitt et utfyllende svar på et tidligere spørsmål. Det er alltid vanskelig å forutse hva alle vil svare på det respektive spørsmålet, vær derfor vennlig å svar igjen, selv om dere synes jeg er litt masete! De fleste som pleier å være med i disse gruppene synes det er moro og jeg håper dere også vil synes det. Kontakt meg gjerne via e-post eller telefon om dere har noen problemer!
1.3 Begynn med å presentere dere selv med fornavn, alder, kjønn, familiesituasjon, hva driver dere med av fysisk aktivitet, hva er deres forhold til egen helse.
1.4 Hva er sunn mat/usunn mat for dere?
1.5 Hvor opptatt er dere av hva maten inneholder
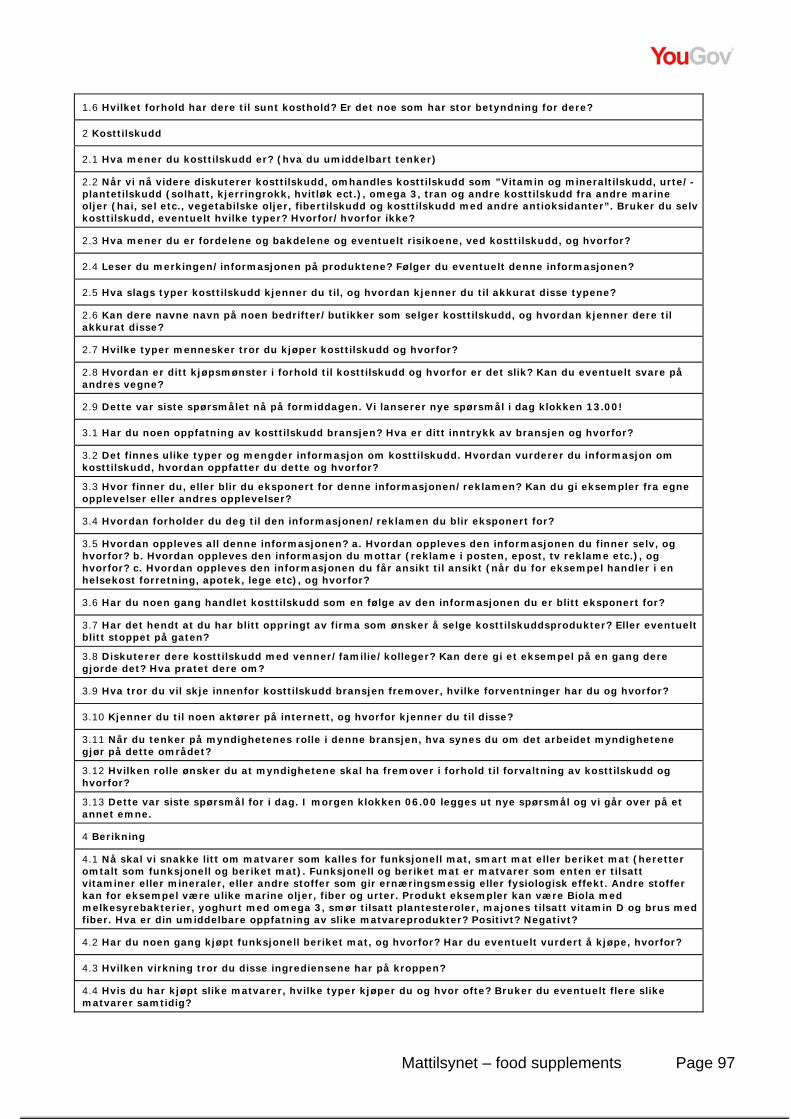
Mattilsynet – food supplements Page 97
1.6 Hvilket forhold har dere til sunt kosthold? Er det noe som har stor betyndning for dere?
2 Kosttilskudd
2.1 Hva mener du kosttilskudd er? (hva du umiddelbart tenker)
2.2 Når vi nå videre diskuterer kosttilskudd, omhandles kosttilskudd som ”Vitamin og mineraltilskudd, urte/-plantetilskudd (solhatt, kjerringrokk, hvitløk ect.), omega 3, tran og andre kosttilskudd fra andre marine oljer (hai, sel etc., vegetabilske oljer, fibertilskudd og kosttilskudd med andre antioksidanter”. Bruker du selv kosttilskudd, eventuelt hvilke typer? Hvorfor/hvorfor ikke?
2.3 Hva mener du er fordelene og bakdelene og eventuelt risikoene, ved kosttilskudd, og hvorfor?
2.4 Leser du merkingen/informasjonen på produktene? Følger du eventuelt denne informasjonen?
2.5 Hva slags typer kosttilskudd kjenner du til, og hvordan kjenner du til akkurat disse typene?
2.6 Kan dere navne navn på noen bedrifter/butikker som selger kosttilskudd, og hvordan kjenner dere til akkurat disse?
2.7 Hvilke typer mennesker tror du kjøper kosttilskudd og hvorfor?
2.8 Hvordan er ditt kjøpsmønster i forhold til kosttilskudd og hvorfor er det slik? Kan du eventuelt svare på andres vegne?
2.9 Dette var siste spørsmålet nå på formiddagen. Vi lanserer nye spørsmål i dag klokken 13.00!
3.1 Har du noen oppfatning av kosttilskudd bransjen? Hva er ditt inntrykk av bransjen og hvorfor?
3.2 Det finnes ulike typer og mengder informasjon om kosttilskudd. Hvordan vurderer du informasjon om kosttilskudd, hvordan oppfatter du dette og hvorfor?
3.3 Hvor finner du, eller blir du eksponert for denne informasjonen/reklamen? Kan du gi eksempler fra egne opplevelser eller andres opplevelser?
3.4 Hvordan forholder du deg til den informasjonen/reklamen du blir eksponert for?
3.5 Hvordan oppleves all denne informasjonen? a. Hvordan oppleves den informasjonen du finner selv, og hvorfor? b. Hvordan oppleves den informasjon du mottar (reklame i posten, epost, tv reklame etc.), og hvorfor? c. Hvordan oppleves den informasjonen du får ansikt til ansikt (når du for eksempel handler i en helsekost forretning, apotek, lege etc), og hvorfor?
3.6 Har du noen gang handlet kosttilskudd som en følge av den informasjonen du er blitt eksponert for?
3.7 Har det hendt at du har blitt oppringt av firma som ønsker å selge kosttilskuddsprodukter? Eller eventuelt blitt stoppet på gaten?
3.8 Diskuterer dere kosttilskudd med venner/familie/kolleger? Kan dere gi et eksempel på en gang dere gjorde det? Hva pratet dere om?
3.9 Hva tror du vil skje innenfor kosttilskudd bransjen fremover, hvilke forventninger har du og hvorfor?
3.10 Kjenner du til noen aktører på internett, og hvorfor kjenner du til disse?
3.11 Når du tenker på myndighetenes rolle i denne bransjen, hva synes du om det arbeidet myndighetene gjør på dette området?
3.12 Hvilken rolle ønsker du at myndighetene skal ha fremover i forhold til forvaltning av kosttilskudd og hvorfor?
3.13 Dette var siste spørsmål for i dag. I morgen klokken 06.00 legges ut nye spørsmål og vi går over på et annet emne.
4 Berikning
4.1 Nå skal vi snakke litt om matvarer som kalles for funksjonell mat, smart mat eller beriket mat (heretter omtalt som funksjonell og beriket mat). Funksjonell og beriket mat er matvarer som enten er tilsatt vitaminer eller mineraler, eller andre stoffer som gir ernæringsmessig eller fysiologisk effekt. Andre stoffer kan for eksempel være ulike marine oljer, fiber og urter. Produkt eksempler kan være Biola med melkesyrebakterier, yoghurt med omega 3, smør tilsatt plantesteroler, majones tilsatt vitamin D og brus med fiber. Hva er din umiddelbare oppfatning av slike matvareprodukter? Positivt? Negativt?
4.2 Har du noen gang kjøpt funksjonell beriket mat, og hvorfor? Har du eventuelt vurdert å kjøpe, hvorfor?
4.3 Hvilken virkning tror du disse ingrediensene har på kroppen?
4.4 Hvis du har kjøpt slike matvarer, hvilke typer kjøper du og hvor ofte? Bruker du eventuelt flere slike matvarer samtidig?
Mattilsynet – food supplements Page 98
4.5 Leser du merkingen/informasjonen på produktene? Følger du eventuelt denne informasjonen?
4.6 Hvilke typer næringsstoffer/ingredienser kjenner du til som blir tilsatt matvarer, og hvorfor nevner du disse ingrediensene?
4.7 Hvilke typer funksjonell og beriket mat kjenner du til, og hvorfor nevner du akkurat disse typene?
4.8 Hva mener du er fordelene og bakdelene og eventuelt risikoene, ved bruk av slike matvarer?
4.9 Hvilke typer mennesker tror du kjøper funksjonell og beriket mat, og hvorfor?
4.10 Hvordan tror dere kjøpsmønsteret til disse personene er og hvorfor er det slik? Kan du eventuelt svare på andres vegne?
4.11 Velkommen tilbake i ettermiddag, nye spørsmål lanseres klokken 13.00
5.1 Det finnes for ulike typer og mengder informasjon om funksjonelle og berikede matvarer. Hvor ser du, eller blir du eksponert for denne informasjonen/reklamen?
5.2 Hvordan oppfatter du denne informasjonen og hvordan forholder du deg til denne? Hvorfor?
5.3 Har du noen gang kjøpt funksjonelle og berikede matvarer som en følge av den informasjonen du er blitt eksponert for?
5.4 Diskuterer du funksjonelle og berikede matvarer med venner/familie/kolleger?
5.5 Hvilke produsenter kjenner du til som produserer funksjonell og beriket mat, og hvordan kjenner du til akkurat disse?
5.6 Hvordan tror du tilbudet av funksjonelle og berikede matvarer vil være i fremtiden, og hvorfor?
5.7 Vil funksjonelle og berikede matvarer kunne erstatte kosttilskudd i ditt daglige kosthold, og hvorfor
5.8 Når du tenker på myndighetenes rolle i denne bransjen, hva synes du om det arbeidet myndighetene gjør på dette området?
5.9 Hvilken rolle ønsker du at myndighetene vil ha fremover i forhold til forvaltning av funksjonelle og berikede matvarer og hvorfor?
5.10 Dette var siste spørsmålet for i dag torsdag! Imorgen Fredag kommer kun tre korte spørsmål. Glem ikke å svare på de oppfølgende spørsmålene dere ser i den gule ruten.
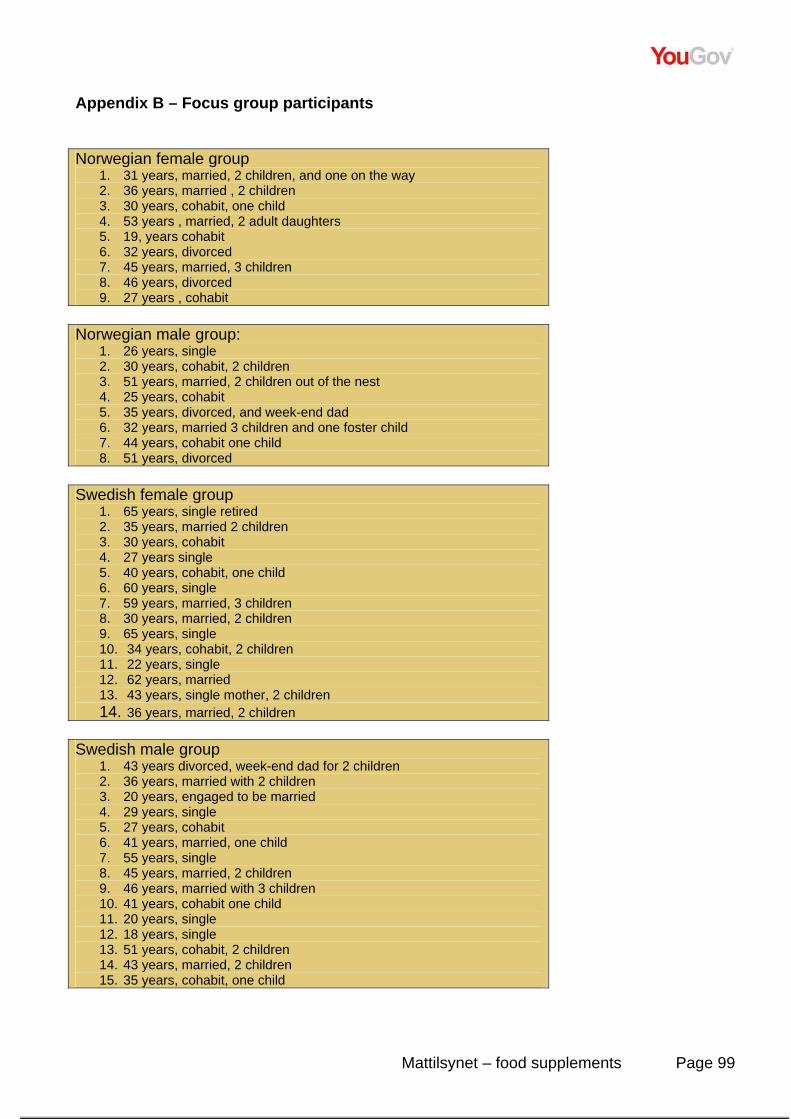
Mattilsynet – food supplements Page 99
Appendix B – Focus group participants Norwegian female group
1. 31 years, married, 2 children, and one on the way 2. 36 years, married , 2 children 3. 30 years, cohabit, one child 4. 53 years , married, 2 adult daughters 5. 19, years cohabit 6. 32 years, divorced 7. 45 years, married, 3 children 8. 46 years, divorced 9. 27 years , cohabit
Norwegian male group:
1. 26 years, single 2. 30 years, cohabit, 2 children 3. 51 years, married, 2 children out of the nest 4. 25 years, cohabit 5. 35 years, divorced, and week-end dad 6. 32 years, married 3 children and one foster child 7. 44 years, cohabit one child 8. 51 years, divorced
Swedish female group
1. 65 years, single retired 2. 35 years, married 2 children 3. 30 years, cohabit 4. 27 years single 5. 40 years, cohabit, one child 6. 60 years, single 7. 59 years, married, 3 children 8. 30 years, married, 2 children 9. 65 years, single 10. 34 years, cohabit, 2 children 11. 22 years, single 12. 62 years, married 13. 43 years, single mother, 2 children 14. 36 years, married, 2 children
Swedish male group
1. 43 years divorced, week-end dad for 2 children 2. 36 years, married with 2 children 3. 20 years, engaged to be married 4. 29 years, single 5. 27 years, cohabit 6. 41 years, married, one child 7. 55 years, single 8. 45 years, married, 2 children 9. 46 years, married with 3 children 10. 41 years, cohabit one child 11. 20 years, single 12. 18 years, single 13. 51 years, cohabit, 2 children 14. 43 years, married, 2 children 15. 35 years, cohabit, one child
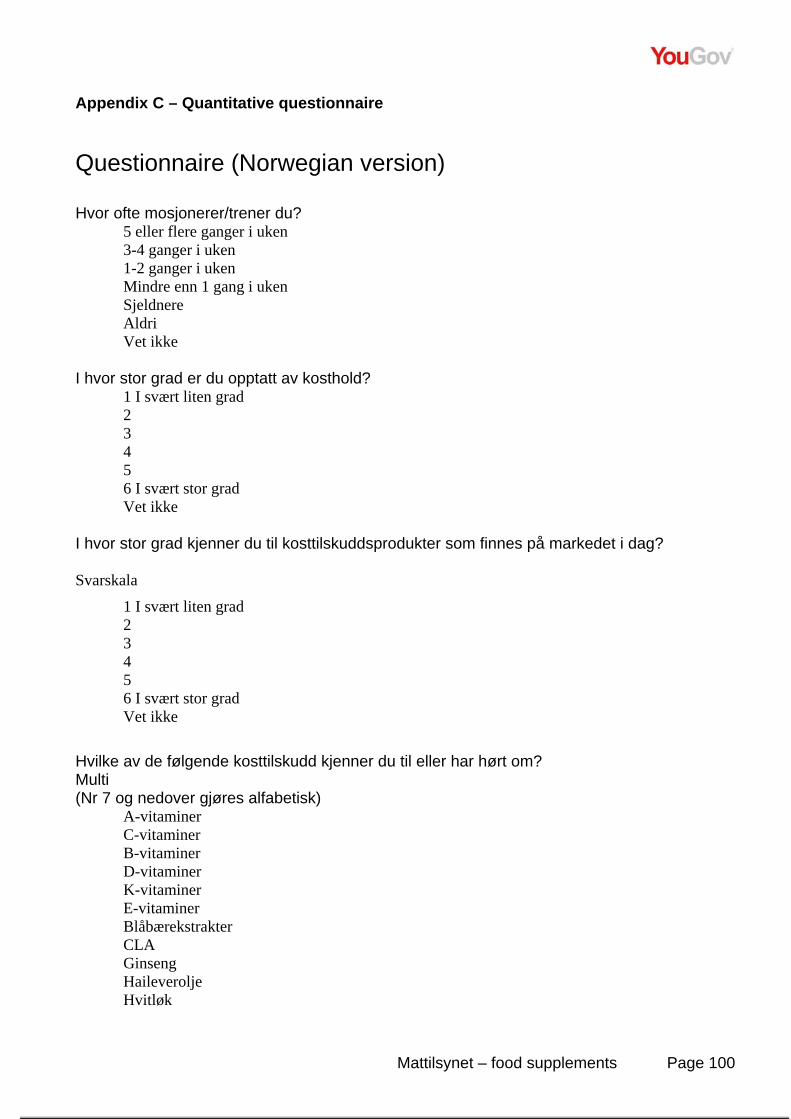
Mattilsynet – food supplements Page 100
Appendix C – Quantitative questionnaire Questionnaire (Norwegian version) Hvor ofte mosjonerer/trener du?
5 eller flere ganger i uken 3-4 ganger i uken 1-2 ganger i uken Mindre enn 1 gang i uken Sjeldnere Aldri Vet ikke
I hvor stor grad er du opptatt av kosthold?
1 I svært liten grad 2 3 4 5 6 I svært stor grad Vet ikke
I hvor stor grad kjenner du til kosttilskuddsprodukter som finnes på markedet i dag? Svarskala
1 I svært liten grad 2 3 4 5 6 I svært stor grad Vet ikke
Hvilke av de følgende kosttilskudd kjenner du til eller har hørt om? Multi (Nr 7 og nedover gjøres alfabetisk)
A-vitaminer C-vitaminer B-vitaminer D-vitaminer K-vitaminer E-vitaminer Blåbærekstrakter CLA Ginseng Haileverolje Hvitløk
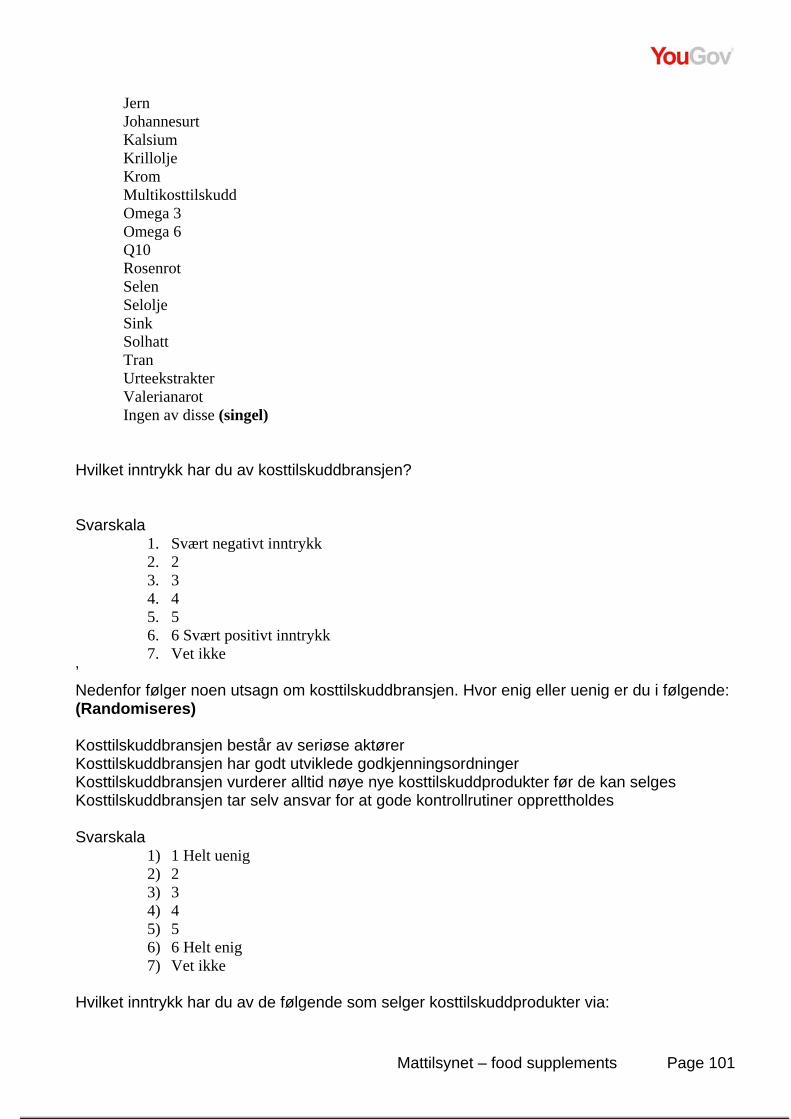
Mattilsynet – food supplements Page 101
Jern Johannesurt Kalsium Krillolje Krom Multikosttilskudd Omega 3 Omega 6 Q10 Rosenrot Selen Selolje Sink Solhatt Tran Urteekstrakter Valerianarot Ingen av disse (singel)
Hvilket inntrykk har du av kosttilskuddbransjen? Svarskala
1. Svært negativt inntrykk 2. 2 3. 3 4. 4 5. 5 6. 6 Svært positivt inntrykk 7. Vet ikke
’ Nedenfor følger noen utsagn om kosttilskuddbransjen. Hvor enig eller uenig er du i følgende: (Randomiseres) Kosttilskuddbransjen består av seriøse aktører Kosttilskuddbransjen har godt utviklede godkjenningsordninger Kosttilskuddbransjen vurderer alltid nøye nye kosttilskuddprodukter før de kan selges Kosttilskuddbransjen tar selv ansvar for at gode kontrollrutiner opprettholdes Svarskala
1) 1 Helt uenig 2) 2 3) 3 4) 4 5) 5 6) 6 Helt enig 7) Vet ikke
Hvilket inntrykk har du av de følgende som selger kosttilskuddprodukter via:
Mattilsynet – food supplements Page 102
(Randomiseres)
• Helsekostbutikk • Dagligvare • Telefonsalg • Postordre • Internett • Apotek • Salg på gaten • Homeparties
Svarskala
1. 1 Svært negativt inntrykk 2. 2 3. 3 4. 4 5. 5 6. 6 Svært positivt inntrykk 7. Vet ikke
Hvilket inntrykk har du av effekten av følgende produkter? Pluss filter fra Q4 Svarskala
1. 1 Svært dårlig effekt 2. 2 3. 3 4. 4 5. 5 6. 6 Svært god effekt 7. Vet ikke
Hvilke av følgende kosttilskuddsprodukter er aktuelle for deg å kjøpe? Produkter valgt Q4. Multi
Mattilsynet – food supplements Page 103
Hvor ofte kjøper du følgende produktene? Produkter valgt i Q9 Svarskala
1. Ca hver 14 dag 2. Ca hver måned 3. Ca hver 2. måned 4. Ca hver 3. måned 5. Ca hver 6. måned 6. Sjeldnere 7. Aldri 8. vet ikke
Hvem kjøper du de følgende produkter til? Produkter i Q9
Svarskala
1. Meg selv 2. Meg selv og andre i husstanden 3. Andre i husstanden 4. Vet ikke
Hvor har du kjøpt kosttilskuddprodukter? Multi
• Helsekostbutikk • Dagligvare • Telefonsalg • Postordre • Internett • Apotek • Salg på gaten • Homeparties • Andre steder
De som svarer kjøpt over internett, 11e: Du sa at du har kjøpt kosttilskuddprodukter over internett. Hvilke produkter var dette? Åpent I hvilke land har du kjøpt kosttilskuddprodukter?
• Norge • Sverige • Island • Finland
Mattilsynet – food supplements Page 104
• Danmark • Tyskland • England • Andre • Ingen av disse (singel)
.
Nedenfor følger noen utsagn om kosttilskuddprodukter. Hvor enig eller uenig er du i følgende: Randomiser
• Kosttilskudd er en viktig del av kostholdet mitt • Jeg bekymrer meg for hva produktene inneholder • Alle kosttilskuddprodukter som finnes i butikkene er trygge å bruke • Alle kosttilskuddprodukter som kan kjøpes over postordre er trygge å bruke • Alle kosttilskuddprodukter som kan kjøpes over internett er trygge å bruke • Kosttilskuddsprodukter er dyrt
Svarskala
1) 1 Helt uenig 2) 2 3) 3 4) 4 5) 5 6) 6 Helt enig 7) Vet ikke
Fra hvor får du informasjon om kosttilskudd? (Randomiseres)
• Artikler i ukeblader/magasiner • Internett • Venn/kollega/familie • Tv program • Avisartikler • Helsekostbutikk • Informasjon/reklame i posten • Apotek • Myndigheter • Helsepersonell • Andre • Vet ikke
I hvor stor grad stoler du på informasjonen om kosttilskudd som du mottar fra følgende kanaler: (Randomiseres)
Mattilsynet – food supplements Page 105
• Artikler i ukeblader/magasiner • Internett • Venn/kollega/familie • Tv program • Avisartikler • Helsekostbutikk • Helsepersonell • Informasjon/reklame posten • Apotek • Myndigheter
Svarskala
1. 1 Svært liten grad 2. 2 3. 3 4. 4 5. 5 6. 6 Svært stor grad 7. Vet ikke
Hvor enig eller uenig er du i følgende utsagn: (Randomiseres)
• Jeg kommer til å kjøpe mer kosttilskuddprodukter i fremtiden • Jeg kommer til å kjøpe mindre kosttilskuddprodukter i fremtiden • Kosttilskudd vil være en viktig del av mitt kosthold i fremtiden • Kosttilskudd vil bli viktigere i fremtiden grunnet lavere næringsinnhold i frukt og
grønnsaker • Jeg kommer til å bruke kosttilskuddprodukter for å behandle egne plager og lidelser • Jeg kommer til å bruke kosttilskuddprodukter for å forebygge egen sykdom • Det vil komme enda flere typer kosttilskudd på markedet i fremtiden
Svarskala
1. 1 Helt uenig 2. 2 3. 3 4. 4 5. 5 6. 6 Helt enig 7. Vet ikke
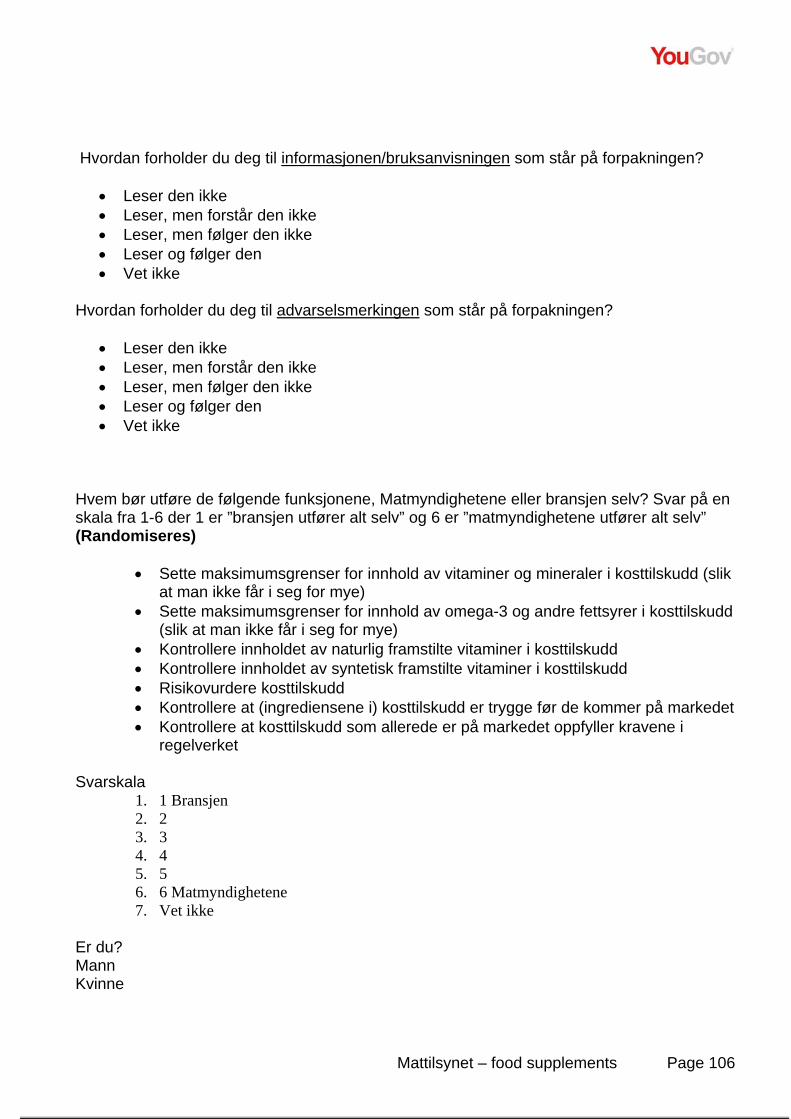
Mattilsynet – food supplements Page 106
Hvordan forholder du deg til informasjonen/bruksanvisningen som står på forpakningen?
• Leser den ikke • Leser, men forstår den ikke • Leser, men følger den ikke • Leser og følger den • Vet ikke
Hvordan forholder du deg til advarselsmerkingen som står på forpakningen?
• Leser den ikke • Leser, men forstår den ikke • Leser, men følger den ikke • Leser og følger den • Vet ikke
Hvem bør utføre de følgende funksjonene, Matmyndighetene eller bransjen selv? Svar på en skala fra 1-6 der 1 er ”bransjen utfører alt selv” og 6 er ”matmyndighetene utfører alt selv” (Randomiseres)
• Sette maksimumsgrenser for innhold av vitaminer og mineraler i kosttilskudd (slik
at man ikke får i seg for mye) • Sette maksimumsgrenser for innhold av omega-3 og andre fettsyrer i kosttilskudd
(slik at man ikke får i seg for mye) • Kontrollere innholdet av naturlig framstilte vitaminer i kosttilskudd • Kontrollere innholdet av syntetisk framstilte vitaminer i kosttilskudd • Risikovurdere kosttilskudd • Kontrollere at (ingrediensene i) kosttilskudd er trygge før de kommer på markedet • Kontrollere at kosttilskudd som allerede er på markedet oppfyller kravene i
regelverket Svarskala
1. 1 Bransjen 2. 2 3. 3 4. 4 5. 5 6. 6 Matmyndighetene 7. Vet ikke
Er du? Mann Kvinne
Mattilsynet – food supplements Page 107
Din alder? År Hva er din høyeste fullførte utdannelse? Grunnskole/Folkeskole Videregående skole Høyskole/Universitet inntil 3 år Høyskole/Universitet 4 år eller mer Ønsker ikke å oppgi Hva er husstandens totale bruttoinntekt pr år?? Inntil 200 000 kr 200 000 kr - 399 999 kr 400 000 kr - 599 999 kr 600 000 kr - 799 999 kr 800 000 kr - 1 million kr Over 1 million kr Ønsker ikke å oppgi Vet ikke I hvilket fylke bor du?
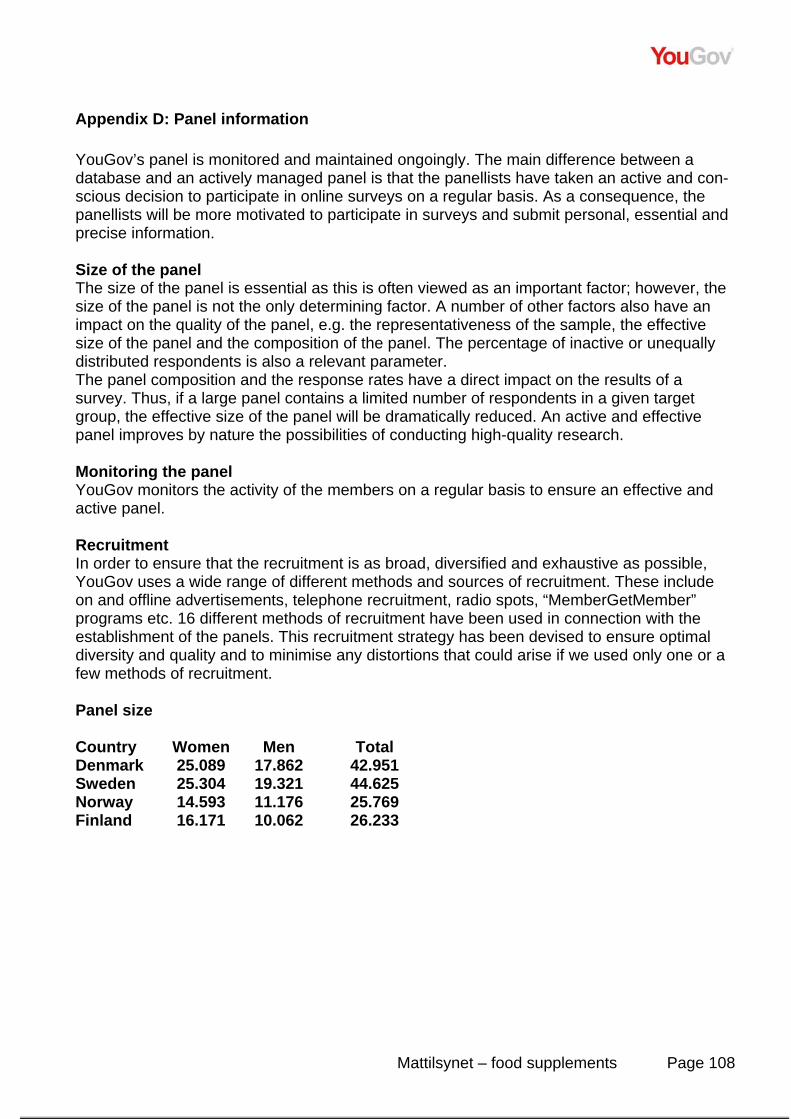
Mattilsynet – food supplements Page 108
Appendix D: Panel information YouGov’s panel is monitored and maintained ongoingly. The main difference between a database and an actively managed panel is that the panellists have taken an active and con-scious decision to participate in online surveys on a regular basis. As a consequence, the panellists will be more motivated to participate in surveys and submit personal, essential and precise information. Size of the panel The size of the panel is essential as this is often viewed as an important factor; however, the size of the panel is not the only determining factor. A number of other factors also have an impact on the quality of the panel, e.g. the representativeness of the sample, the effective size of the panel and the composition of the panel. The percentage of inactive or unequally distributed respondents is also a relevant parameter. The panel composition and the response rates have a direct impact on the results of a survey. Thus, if a large panel contains a limited number of respondents in a given target group, the effective size of the panel will be dramatically reduced. An active and effective panel improves by nature the possibilities of conducting high-quality research. Monitoring the panel YouGov monitors the activity of the members on a regular basis to ensure an effective and active panel. Recruitment In order to ensure that the recruitment is as broad, diversified and exhaustive as possible, YouGov uses a wide range of different methods and sources of recruitment. These include on and offline advertisements, telephone recruitment, radio spots, “MemberGetMember” programs etc. 16 different methods of recruitment have been used in connection with the establishment of the panels. This recruitment strategy has been devised to ensure optimal diversity and quality and to minimise any distortions that could arise if we used only one or a few methods of recruitment. Panel size Country Women Men Total Denmark 25.089 17.862 42.951 Sweden 25.304 19.321 44.625 Norway 14.593 11.176 25.769 Finland 16.171 10.062 26.233
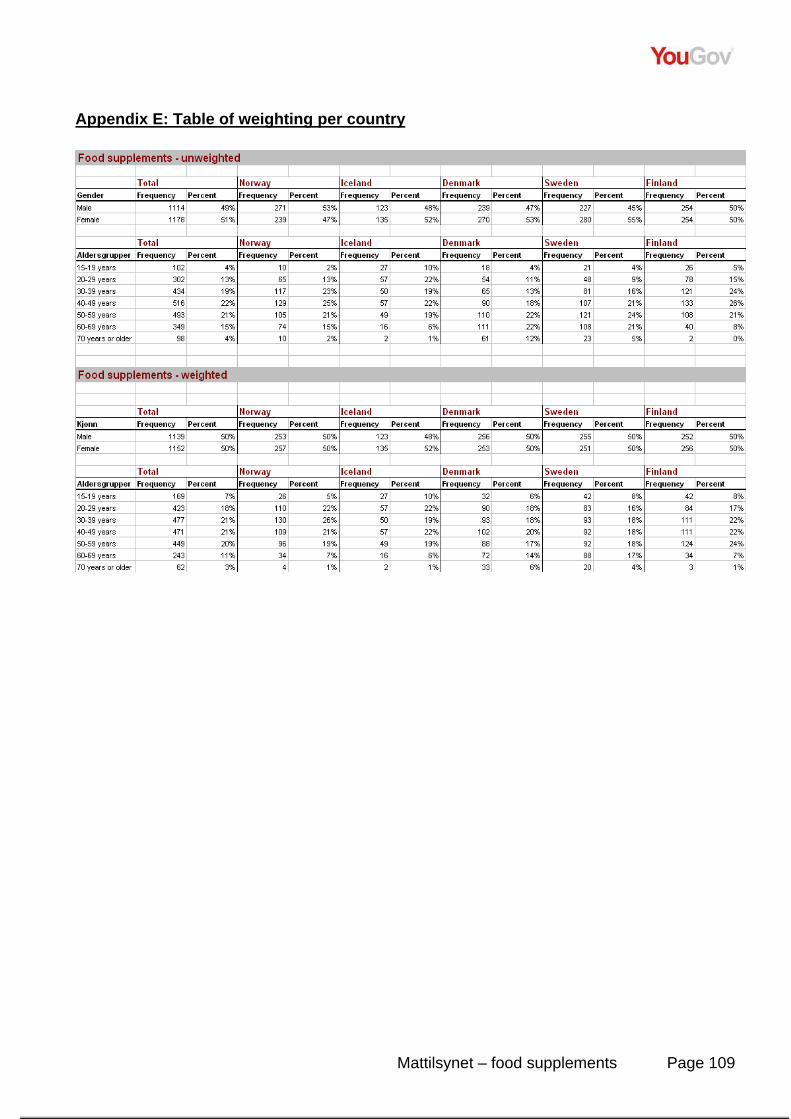
Mattilsynet – food supplements Page 109
Appendix E: Table of weighting per country
Related Documents