FOOD QUALITY IN MODIFIED ATOMOSPHERE HEAT PUMP DRYING TIAN MIN (B. Eng. HUST) A THESIS SUBMITTED FOR THE DEGREE OF MASTER OF ENGINEERING DEPARTMENT OF MECHANICAL ENGINEERING NATIONAL UNIVERSITY OF SINGAPORE 2005 brought to you by CORE View metadata, citation and similar papers at core.ac.uk provided by ScholarBank@NUS

Welcome message from author
This document is posted to help you gain knowledge. Please leave a comment to let me know what you think about it! Share it to your friends and learn new things together.
Transcript

FOOD QUALITY IN MODIFIED ATOMOSPHERE HEAT
PUMP DRYING
TIAN MIN
(B. Eng. HUST)
A THESIS SUBMITTED
FOR THE DEGREE OF MASTER OF ENGINEERING
DEPARTMENT OF MECHANICAL ENGINEERING
NATIONAL UNIVERSITY OF SINGAPORE
2005
brought to you by COREView metadata, citation and similar papers at core.ac.uk
provided by ScholarBank@NUS

Acknowledgement
i
ACKNOWLEDGEMENT
The author wishes to express her heartfelt appreciation to A/Prof. M. N. A.
Hawlader and A/Prof. Conrad O. Perera for sharing their expertise and deep
knowledge in their interesting field of work giving the fullest supervision and
continuous encouragement throughout all stages of this project.
I would like to thank Ms. B.A. Roslina, Mr. S. Anwar, Mr. K. H. Yeo, Mr. Y.L.
Chew of Thermal process lab, Mr. T. T. Tan of Energy Conservation Lab, Ms. Lee
Chooi Lan of the Food Science and Technology Lab, Ms. Zhong Xiang Li of
Materials Lab, Mr. Shang Zhenghua of Chemical Engineering Lab and those who
have helped me one way or another.
The thesis is dedicated to my parents for their encouragement and moral
support during the period of study.

Table of Contents
ii
TABLE OF CONTENTS
ACKNOWLEDGEMENTS ........................................................................................ I
TABLE OF CONTENTS ...........................................................................................II
SUMMARY ............................................................................................................... IV
LIST OF TABLES .................................................................................................... VI
LIST OF FIGURES .................................................................................................VII
NOMENCLATURE.................................................................................................. IX
CHAPTER 1 INTRODUCTION................................................................................1
1.1 BACKGROUND .....................................................................................................11.2 OBJECTIVE ..........................................................................................................31.3 SCOPE .................................................................................................................4
CHAPTER 2 LITERATURE REVIEW ...................................................................5
2.1 WORKING PRINCIPLE OF DIFFERENT DRYING METHODS ....................................52.2 PERFORMANCE OF HPD ......................................................................................82.3 QUALITY OF DRIED PRODUCTS .........................................................................10
2.3.1 Colour ......................................................................................................102.3.2 Shrinkage .................................................................................................132.3.3 Density and porosity ................................................................................152.3.4 Texture .....................................................................................................182.3.5 Nutrients...................................................................................................182.3.6 Ginger flavour..........................................................................................20
CHAPTER 3 MATERIAL AND METHODS ........................................................23
3.1 DRYING APPARATUS AND CONDITIONS ............................................................233.2 SAMPLE PREPARATION .....................................................................................25
3.2.1 Fruits........................................................................................................253.2.2 Ginger ......................................................................................................26
3.3 DRYING KINETICS & ENERGY PERFORMANCE OF HEAT PUMP DRYER .............283.4 QUALITY TESTS FOR FRUITS .............................................................................29
3.4.1 Colour measurements ..............................................................................293.4.2 Shrinkage, density and porosity...............................................................303.4.3 Texture analysis .......................................................................................313.4.4 Rehydration studies..................................................................................31

Table of Contents
iii
3.4.5 Vitamin C test...........................................................................................323.5 GINGEROL ANALYSIS ........................................................................................32
3.5.1 Reagents and materials............................................................................323.5.2 Instruments and Conditions .....................................................................323.5.3 Preparation of calibration curve for 6-gingerol ......................................323.5.4 Extraction of gingerol from dried ginger samples...................................33
CHAPTER 4 DRYING KINETICS AND ENERGY ANYLYSIS........................34
4.1 METHOD OF ANALYSIS .....................................................................................344.1.1 Analyses of drying process.......................................................................344.1.2 Evaluation of energy performance...........................................................37
4.2 DRYING KINETICS .............................................................................................404.3 COP, ENERGY EFFICIENCY & SMER ...............................................................50
CHAPTER 5 FOODS QUALITY ............................................................................55
5.1 COLOUR ............................................................................................................555.2 SHRINKAGE, DENSITY AND POROSITY ..............................................................605.3 REHYDRATION ..................................................................................................675.4 TEXTURE...........................................................................................................725.5 VITAMIN C........................................................................................................755.6 PUNGENT PRINCIPLES ANALYSIS ......................................................................76
CHAPTER 6 CONCLUSIONS ................................................................................80
CHAPTER 7 RECOMMENDATIONS...................................................................83
REFERENCES...........................................................................................................84
APPENDICES..........................................................................................................100
APPENDIX A: DETERMINATION OF VITAMIN C .......................................................100APPENDIX B: DATA OF HEAT PUMP DRYING EXPERIMENT .....................................102APPENDIX C: DATA OF COLOUR .............................................................................104APPENDIX D: DATA OF REHYDRATION ...................................................................106

Summary
iv
SUMMARY
Most fruits consist of water, carbohydrates, proteins and fraction of lipids.
These compounds are heat sensitive and tend to degrade easily under microbial attract.
In order to extend their shelf-life, drying is widely used to preserve them. Among a
good number of drying technologies, the unique advantage of heat pump drying make
it a technology of choice, where temperature and relative humidity can be controlled
independently. In order to make best use of heat pump dryer, inert gas was used to
improve the drying process in this work. The effect of nitrogen and carbon dioxide on
drying kinetics, energy efficiency and dried product quality of heat pump dried foods
were investigated extensively.
Apple, guava, potato, papaya and ginger were selected to conduct drying
experiments because of their particular characteristics. They were cut into 1cm cubes
or 3mm thick slices and dried under mild conditions: the drying temperature was set
at 45°C, circulating air velocity was 0.7m/s and relative humidity was around 20%.
Lemon juice and clean peel were used as natural inhibitors to prevent oxidation.
. Experimental results showed that inert gas did contribute to some
improvement on both dried food quality and drying kinetics. For the dried products,
there are less browning and less colour changes; lower shrinkage and more porous
structures were observed, which resulted in faster rehydration rate; vitamin C
retention of nitrogen dried guava was as high as 1.64 times that obtained in normal air
drying; and ginger flavour (6-gingerol) was even better than that obtained by freeze

Summary
v
drying. For drying kinetics, the effective diffusivity in nitrogen atmosphere drying of
guava was increased by 73% compared with that found for normal air drying.

List of Tables
vi
LIST OF TABLES
Table 1-1: Factors that influence food quality during drying ........................................1
Table 2-1: Empirical models of shrinkage related to moisture content .......................15
Table 2-2: Mathematical models of porosity for fruits and vegetables .......................17
Table 4-1: Page’s equation parameters ........................................................................44
Table 4-2: Diffusivity of Guava and Papaya in MAHPD............................................47
Table 4-3: The energy results of normal air drying processes. .................................51
Table 4-4: The energy results of nitrogen drying process ...........................................52
Table 4-5: The energy results of carbon dioxide drying process.................................53
Table 5-1: Colour values for dried apple, guava and potato samples ..........................56
Table 5-2: Colour values for pre-treated dried apples .................................................58
Table 5-3: Colour values of apples resulting from three drying methods ...................58
Table 5-4: Moisture Removal from samples dried in MAHPD over 18 hours ............61
Table 5-5: The density and porosity of guava and papaya ..........................................62
Table 5-6: Firmness of apples dried by different methods ..........................................73
Table 5-7: Firmness of dried papaya and guava ..........................................................74
Table 5-8: Retention of Vitamin C in dried products ..................................................75

List of Figures
vii
LIST OF FIGURES
Figure 2-1: The schematic diagram of basic heat pump dryer.......................................6
Figure 2-2: Browning mechanism ...............................................................................11
Figure 2-3: Typical variation of density/porosity with water content. ........................16
Figure 2-4: Vitamin C Chemical Structure, C6H8O6 ...................................................19
Figure 2-5: Structure of gingerol homologues.............................................................21
Figure 3-1: Schematic of heat pump dryer ..................................................................24
Figure 3-2: Flow chart of experiments procedure on fruits .........................................27
Figure 3-3: Schematic diagram of peeling the skin of ginger......................................28
Figure 4-1: Effect of inert gas on drying of papaya.....................................................41
Figure 4-2: Effect of inert gas on drying of guava.......................................................41
Figure 4-3: Effect of inert gas drying of ginger ...........................................................42
Figure 4-4: Drying rate of papaya................................................................................43
Figure 4-5: Drying rate of guava .................................................................................43
Figure 4-6: Drying rate of ginger.................................................................................44
Figure 4-7: Variation of ln(MR) with t/L2 of guava (a) N2 (b) CO2 ............................45
Figure 4-8: Variation of ln(MR) with t/L2 of papaya (a) N2 (b) CO2 ..........................47
Figure 4-9: Variation of ln(MR) with t/L2: (a) normal air; (b) N2; (c) CO2 for ginger 49
Figure 4-10: Comparison of COP for HPD and MAHPD ...........................................54
Figure 4-11: Comparison of energy efficiency of HPD and MAHPD ........................54
Figure 5-1: h* values of dried apple, guava, potato samples.......................................57
Figure 5-2: Total colour change: (a) Guava; (b) Papaya .............................................60
Figure 5-3: Structure of 8 hours normal air HPD dried material (SEM) .....................64

List of Figures
viii
Figure 5-4: SEM of dried papaya: ...............................................................................67
Figure 5-5: Rehydration behaviour of samples dried by MAHPD with 2N ................68
Figure 5-6: Rehydration behaviour of samples dried by MAHPD with 2CO .............69
Figure 5-7: Rehydration of nitrogen dried papaya.......................................................69
Figure 5-8: Rehydration capability of dried papaya ....................................................70
Figure 5-9: Rehydration behaviour of HPD and MAHPD dried papaya.....................71
Figure 5-10: Rehydration curve of freeze dried and vacuum dried papaya.................72
Figure 5-11: Chromatograms 6-gingerol: (a) Standard (b) Sample .............................77
Figure 5-12: The calibration graph of 6-gingerol determined by HPLC assay ...........77
Figure 5-13: Comparison of 6-gingerol content in different dried ginger samples .....78

Nomenclature
ix
NOMENCLATURE
a* Redness
A Availability
AA Ascorbic Acid
b* Yellowness
C* Chroma
CIE
COP
PCO
Commission international de l’Eclairage
Coefficient of performance
Maximum COP
Dr Shrinkage ration
h* Hue angle
H Specific enthalpy
HPD
HPLC
Heat pump dryer/ drying
High performance liquid chromograph
k Constant in shrinkage relationship
L* Ligteness
em The mass flow rate in external condenser (kg/s)
im The mass flow rate in internal condenser(kg/s)
om The total mass flow rate(kg/s)
M Moisture evaporation rate(kg/s)
M Moisture content(kg/kg)
eqM Equilibrium moisture content(kg/kg)
MAHPD Modified atmosphere heat pump dryer/drying

Nomenclature
x
MR
PPO
Moisture ratio(kg/kg)
Polyphonenol oxidase
iX
fX
Initial dry base moisture content of sample(kg/kg)
Final dry base moisture content of sample (kg/kg)
∆X fi XX (kg/kg)
RH
S
Relative humidity
Entropy(kJ/kg.K)
SEM Scanning electron microscopy
SMER Specific moisture extraction rate(kg/kWh)
V
0V
Volume of sample(m3)
Original volume of sample(m3)
W Total input power(kW)
cW Input power of compressor(kW)
FW Input power of internal fan(kW)
Constant in shrinkage relationship
Porosity
Second law energy efficiency

Chapter 1 Introduction
1
CHAPTER 1
INTRODUCTION
1.1 Background
Drying refers to a process in which moisture is removed from a solid using heat
as the energy input. In many agricultural countries, large quantities of food products
are dried to improve shelf-life, reduce packaging costs, lower shipping weights,
enhance appearance, retain original flavour and maintain nutritional value
(Sokhansanj and Jayas, 1987). Product loses its moisture content during drying, which
results in increased concentration of nutrients in the remaining mass. Hence, proteins,
fats and carbohydrates are present in larger amounts per unit weight in dried food than
in their fresh counterparts. However, the mechanism of drying is a complex
phenomenon involving combined heat and mass transfer and, in most cases, resulting
in products with modified properties. Depending on the drying conditions, food
products may undergo various degree of browning, shrinkage, loss of nutrients and so
on. According to Chou and Chua (2001), the degradation of food occurs mainly in
three areas, which is shown in Table 1-1.
Table 1-1: Factors that influence food quality during drying [Chou and Chua, 2001]
Chemical Physical NutritionalBrowning reactionLipid Oxidation
Colour lossGelatinization
RehydrationSolubilityTexture
Aroma loss
Vitamin lossProtein loss
Microbial survival

Chapter 1 Introduction
2
Foods like fruits and vegetables are especially high in water, carbohydrate and
vitamins. These compounds are easily altered in the high temperature drying
condition and result in degradation in food quality (Sokhansanj and Jayas, 1987).
Consequently, the products desirability for consumption is affected. Empirically, if
the type of applied drying method and conditions change, the same raw material may
end up as a completely different product. Physicochemical changes that occur during
drying seem to affect the quality properties of the dehydrated product very much. The
increasing need for producing high quality and convenient products at a competitive
cost in industry requires for a suitable employment of drying methods in practice
(Saravacos, 1993). In order to find a trade-off between quality and cost, much
research effort has been put into this area.
Usually, the goals set for a drying process are three-fold:
Product quality: To avoid the undesirable changes and yield the desired
quality.
Economic considerations: To balance the initial investment and running
cost, making it operate at optimum conditions
Environmental concerns: To minimize energy consumption during drying
and reduce the impact of industrial waste on environment.
So far, taking all the three considerations mentioned above into account, it is
generally agreed that heat pump drying (HPD) is one of the most promising
technologies. The ability of heat pump to convert the latent heat of vapour
condensation into the sensible heat of an air stream passing through the condenser
makes them attractive. HPD can be operated over a wide range of temperatures,

Chapter 1 Introduction
3
providing very good conditions for heat sensitive materials to dry, as it enables
independent control of temperature and RH. This technology requires far less energy,
as the system can recover the latent heat in a closed loop, and be conducted
independent of ambient weather conditions (Perera and Rahman, 1997; Hawlader et
al., 1998; Uddin et al., 2004). Strømmen et al. (2002) found that HPD consumes 60-
80% lower energy than other dryers operating at the same temperature. Further more,
it was reported that onion slices dried by HPD confirmed energy saving of the order
of 40% with better product quality (Rossi et al., 1992). For decades, it has been used
in wood kilns to dehumidify air and control lumber quality (Rosen, 1995). A great
number of heat pumps are installed in Finland, Norway and Canada for drying of
wood and fish (Strømmen and Kramer, 1994). The current trend is developing the
applications on heat sensitive food and biological material drying. When substituting
normal air with some inert gas, O’Neill et al. (1998) noted that dried apple cubes
resulted in porous products, leading to quick rehydration. Perera (2001) observed that
MAHPD dried apples showed excellent colour and retention of vitamin C, and the
overall quality of the dried product was very high. Hence, modified air heat pump
drying (MAHPD) seems to offer a great potential in this area.
1.2 Objective
From the previous literature review, there is obviously lack of detailed
information on modified atmosphere heat pump drying. In order to provide a better
understanding and have a clearer insight, the objective of this project is to investigate
the drying kinetics of modified atmosphere heat pump dryer and the quality of its
dried products.

Chapter 1 Introduction
4
This study undertakes to investigate various drying methods of preservation of
perishable fruits and vegetables. Apple, guava and potato are easily oxidized in the air
after being peeled off, and hence, require investigation on browning. Guava and
papaya are rich in vitamin C, which is an index of nutrient loss, were used to detect
the vitamin C retention. Ginger is widely used for cooking and it was chosen to
investigate flavour retention.
The focus was put upon heat pump drying for which the drying media were
normal air, carbon dioxide and nitrogen while other conditions were kept the same.
The differences between final products were compared with those resulting from
freeze drying and vacuum drying.
1.3 Scope
This thesis is divided into seven chapters. Chapter 1 includes an introduction to
the problem. Chapter 2 reviews previous literature on heat pump drying. Chapter 3
describes material and methods. Chapter 4 deals with the drying kinetics and energy
efficiency. Chapter 5 includes results and discussion on food quality. Conclusions
drawn from the study are stated in Chapter 6. Chapter 7 gives recommendations for
improvement of equipment and future research.

Chapter 2 Literature Review
5
CHAPTER 2
LITERATURE REVIEW
Drying is probably the oldest method of food preservation. From ancient time,
people used solar drying techniques to preserve fish, meat, fruit and vegetables
(Brennan, 1994). Dried foods were the main supply of troops and travellers for
centuries. However, heating and loss of water during drying cause stresses in the
internal structure and chemical reaction with oxygen, consequently, food materials
tend to change its colour, lose volume and sometimes increase hardness (Mayor and
Sereno, 2004). These lead to optical, sensory and nutrient characteristics different
from their fresh counterparts and may lose appeal to some consumers.
Generally, the examined properties of dried products are classified into two
major categories: the engineering side and the quality side (Krokida and Maroulis,
2000). In order to get a general idea and find a right direction to move on, a large
number of literatures have been reviewed in this section, which dealing with drying
methods, energy efficiency as well as the quality of dried food, which includes colour,
shrinkage, density, porosity, rehydration, nutrient and flavour.
2.1 Working Principle of Different Drying Methods
There is an increased demand for convenient foods, including ready to eat and
instant foods containing minimum concentration of synthetic chemicals. This creates

Chapter 2 Literature Review
6
challenges for the food industry and dryer manufactures with regard to development
of new technologies to process difficult or sensitive materials into final products with
high quality and improved properties. Three drying methods have been in use, such
as heat pump drying, freeze drying and vacuum drying, to maintain quality and retain
nutrients.
Figure 2-1: The schematic diagram of basic heat pump dryer
Figure 2-1 shows a simplified schematic diagram of a heat pump drying system.
The solid arrow line stands for the refrigerant cycle. The dashed arrow line stands for
air path. Basically, heat pump has four components: an evaporator, a condenser, a
compressor and an expansion valve. A refrigerant is compressed to relatively high
pressure and temperature before entering the condenser, where it rejects the heat to
the surrounding medium. It is then throttled by the expansion valve to a low pressure
and absorbs heat at the evaporator for vapourization. When associating heat pump to
drying process, air, the drying media, is heated at the condenser. Then, the hot air
flows into the drying chamber, where its humidity content increases and its
temperature decreases, because water is evaporated from the drying materials. Humid
air flowing out of the drying chamber abandons moisture at the evaporator due to
ExpansionValve
Air
Air
Condenser
Evaporator
Compressor
Drying
Chamber

Chapter 2 Literature Review
7
condensation and cools down. As heat supply and moisture removal take place at
different location, the drying temperature and relative humidity can be controlled
independently in a heat pump dryer. Currently, the maximum drying temperature in a
heat pump assisted drying is limited to 120°C ([online] available at:
http://tfe81.wtb.tue.nl/education/4P570/HP.pdf). This is due to the lack of proven high
temperature working fluids and the non-availability of suitable compressors.
Freeze drying removed water from a frozen sample by sublimation under
reduced pressure. To facilitate sublimation, the drying temperature is reduced to -
10°C and pressure below the triple poin, 4.58 mm/Hg. According to Pikal (1990), it
can be divided into three stages: freezing, primary drying (in which sublimation
occurs) and secondary drying (where unfrozen water is removed). The processing
time is usually long, typically 3 to 5 days.
Certain biological materials, such as pharmaceuticals and foodstuffs, which are
heat-sensitive, may be freeze dried. There is increasingly the trend in the
biotechnology and pharmaceutical industries for preparation and storage of many
therapeutic proteins and labile enzymes (Liapis, 1995; Carpenter et al., 1997). As a
rule, freeze dried products have the best quality among all dry products. The porous,
non-shrunken structure results in a quick rehydration, which is good for some food
products. However, the cost of freeze drying of food has been found to beat least one
order-of-magnitude higher than conventional drying system such as a spay dryer
(Chou and Chua, 2001).

Chapter 2 Literature Review
8
Vacuum drying is performed at a low pressure which is an advantage because
the boiling point of water is lower under reduced pressure. This enables the products
to be effectively dried at lower temperatures. During the process, the internal pressure
of the food was greater than the ambient pressure in the drying chamber and, hence,
managed to prevent shrinkage and maintained the puffy cubic shape. However, the
time and energy cost is intensive.
2.2 Performance of Heat Pump Drying
Ever since the dawn of civilization, energy consumption has been increasing.
Every indication shows that the energy consumption will continue its upward trend as
the world population increases. Drying is an industrial process requiring large
amounts energy, especially when drying of temperature-sensitive materials, because
of the low-temperature thermal energy use. A very low exergetics efficiency resultes,
when high-grade thermal energy source (fuel or electricity) is used to accomplish this
task.
Exergy is defined as the theoretical maximum amount of work that can be
obtained from the system at a prescribed state (P, T, h, s, u, v) when operating with a
reservoir at the constant pressure and temperature P0 and T0. Heat pumps are devices
that make the best use of the exergy of high-grade energy sources and offer the
possibility of providing a heating output which is several times the amount of high-
grade energy input. These advantages increase as the target temperature for heating
approaches the ambient temperature. Therefore, it is natural to consider heat pump

Chapter 2 Literature Review
9
dryers to be high efficiency devices compared with others, especially for low-
temperature drying.
The coefficient of performance (COP) is the most commonly used parameter to
evaluate the efficiency of a heat pump, which is defined as follow:
inputPoweroutputheatUsefulCOP (2-1)
The maximum theoretical heat pump efficiency is the efficiency when running on a
Carnot cycle:
evaporatorcondenser
condenser
TTT
PCO
(2-2)
For a heat pump, COP is large than 1, which means favourable performance.
When analyzing drying, a more appropriate efficiency parameter is the specific
moisture extraction rate (SMER), which means the mass of water evaporated per unit
of energy input:
)/(, kWhkginputEnergy
evaporatedwaterofAmountSMER (2-3)
The SMER varies as the maximum air temperature in the dryer, the relative
humidity of air, the evaporation and condensation temperatures, and the efficiency of
a refrigeration system. A typical SMER value achieved by a heat pump is 2.5 kg/kWh
in a range of 1 to 4 kg/kWh, much higher than conventional drying for which values
ranging from 0.5 to 1 kg/kWh (Perera and Rahman,1997). However, it is should be
noted that the energy a compressor consumed is electricity. It is higher grade energy

Chapter 2 Literature Review
10
than heat. Therefore, when comparing the economics, the relative costs of thermal
energy and electricity should be considered.
2.3 Quality of Dried Products
2.3.1 Colour
Some foods are easily-oxidized in the air, their colour changes a lot during
dehydration. It is not only due to evaporation of the surface water but also due to
certain reactions, such as enzymatic browning, non-enzymatic browning and
caramelization reactions (Kudra and Strumillo, 1998). If it is necessary to retain light
colour of products, enzymic browning is a problem in drying industry for a great
number of commodities, for example, fruits like apples, bananas and grapes,
vegetables like potatoes, mushrooms and lettuce (Shewfelt, 1986; Hall, 1989). These
reactions usually impair the sensory properties of products due to associated changes
in colour, flavour and texture, besides nutritional properties, which are undesirable
(Martinez and Whitaker, 1995). Hence, the regulation of colour is important for
improving quality of dried products.
Browning of foods results from both enzaymatic and non-enzymatic oxidation of
phenolic compounds as well as from Maillard reaction that occurs when mixtures of
amino acids and reducing sugars are heated (McEvily et al., 1992). However,
sometimes it is difficult to ascertain whether the mechanism has been enzymatic or
nonenzymatic unless the enzymes in the food that are responsible for the enzymatic
browning is inactivated. Some researchers thought that the colour developed non-

Chapter 2 Literature Review
11
enzymatically from intermediates formed through enzyme-mediated oxidations,
which took place before the enzymes were inactivated (Wedzicha, 1984).
Enzymatic browning requires four different components: oxygen, enzyme,
copper and a substrate (Langdon, 1987). The polyphonenol oxidase (PPO) group of
enzymes catalyzes the oxidation of phenolic compounds in the plants to o-quinones.
Immediately, the quinones condense and react nonenzymatically with other phenolic
compounds, amino acids, etc., to produce dark brown, black or red pigments of
indeterminate structures (Sapers and Hicks, 1989), which are better illustrated in
Figure 2-2. PPOs are found in almost all higher plants, including papaya, potato and
apple as well as seed such as cocoa (Martinez and Whitaker, 1995).
Figure 2-2: Browning mechanism
Maillard reaction limits the shelf life of various dehydrated fruits and vegetables,
citrus products, and juice (Handwerk and Coleman, 1988). This non-enzymatic
browning result from (Wedzicha, 1984; Namiki, 1988):
The reaction of carbonyl groups and amino compound.
Caramelization or pyrolysis of food carbohydrates
Ascorbic acid browning
Browning
QuinonePhenolics
OH O
PPOReaction Nonenzymic
Reaction
OH OO2
Chapter 2 Literature Review
12
Lipid browning
Some researchers found that low pH values helped to decrease the activity of
PPO due to less tight binding of Cu to activate the enzyme allowing the acid
molecules to remove the Cu and, hence, reduce browning (Martinez and Whitaker,
1995). Consequently, exclusion of oxygen and/or application of low pH environment
can ease browning. So far, sulfating agents are wildly used in drying industry, which
are good colour preservative of fresh fruits and vegetables, but they are considered
harmful for certain asthmatics and are, therefore, unacceptable to such consumers.
Many studies have shown Ascorbic Acid (AA) is able to reduce browning (Son et al.,
2001; Özoğlu and Bayındırlı, 2002; Choi et al., 2002). Lemon is such a kind of fruit
with plenty of ascorbic acid. According to Leong and Shui (2002), lemons were found
to have 49.6mg AA per 100g of fresh juice. They also found relatively high levels of
AA in lemon peels (129mg/100g). But limited reports on using it as natural inhibitors
were available.
Colour is the sensation experienced by an individual when energy in the form of
radiation within the visible spectrum falls upon the retina of the eye (Krokida and
Maroulis, 2000). It may be affected by several factors: the spectral energy distribution
of the light, the conditions under which the colour is being viewed, the spectral
characteristics of the object, the sensitivity of the eye. Thus, in order to measure the
colour of material objectively, CIE (Commission International de I’Eclairage)
(Wyszecki and Stiles, 2000) system is widely adopted.

Chapter 2 Literature Review
13
Many research works have been done on a number of products in the colour
development. The effect of various drying methods and conditions on colour
degradation has been measured. For example, Krokida and Maroulis (2000)
investigated the drying process of banana using five methods (conventional, vacuum,
microwave, osmotic and freeze drying) and various drying conditions extensively. By
changing drying methods, they found the lighteness parameter (L*) decreased
significantly during air, vacuum, osmotic and microwave drying, while increased
slightly in freeze drying; the redness (a*) value increased significantly during air
drying, followed by microwave and vacuum drying, then freeze drying, while keeping
constant for osmotic drying; the yellowness parameter (b*) showed a similar
behaviour to redness parameter (a*). When changing the conditions of conventional
and vacuum drying, L* is not affected by temperature and air relative humidity while
a* increases as drying temperature increases and relative humidity decreases, b*
increases as drying temperature decreases and relative humidity increase. Usually, the
increase of chroma parameters (a* and b*) means the samples experienced an
extensive browning. Freeze drying removes water by sublimation of ice and prevent
enzymatic browning reaction, resulting in relative stability of colour parameter (L*,
a*, b*). Hence, a conclusion that freeze drying yields the best colour preservative
method but conventional drying is the worst can be drawn.
2.3.2 Shrinkage
Solid and semi-solid food systems are highly heterogeneous materials. When
water is evaporated, segregation of components occurs, resulting in a network of cell
walls. A contracting stress may be developed in this process, leading to damage or

Chapter 2 Literature Review
14
disruption of the cellular walls, even collapse of the cellular tissue, which are
associated with the reduction of the external volume (Mattea et al., 1989). This
phenomenon is usually referred as shrinkage.
In case of food materials, two types of shrinkage are observed: isotropic
shrinkage and anisotropic shrinkage (Rahman, 1995). Most fruits and vegetables
undergo isotropic shrinkage. That means they shrink uniformly in all dimensions.
When shrinkage is not uniform, an unbalance stress is formed and the material cracks.
Several authors reported cracking of food materials: soybean (Mensah et al., 1984),
pasta (Akiyama and Hayakawa, 2000), corn (Fortes and Okos, 1980).
Shrinkage affects mass and heat transfer parameters, such as diffusivity and
permeability. White and Bell (1999) reported structural collapse decreased the
glucose loss rate constant in the food system composed by glucose and glycine.
Consequently, it decreases the rehydration capability of the dried products. Mcminn
and Magee (1997b) found lower rehydration capacity of air dried potatoes
corresponded to more shrunk samples. Shrinkage is also a relevant factor to be
accounted for establishing drying models. Lozano et al. (1980) explained shrinkage
on the basis of the ratio between the bulk volume of the product and the initial bulk
volume (bulk shrinkage coefficient). Reeve (1943) and Craft (1944) started pioneer
studies of shrinkage at microscopic level on carrots, potatoes and several fruits. Wang
and Brennan (1995) observed structural changes in potato by light microscopy. A
linear relationship between percentage change of volume and moisture content was
found. Ramos et al. (2002) studied grape microscopic shrinkage, quantifying several
parameters directly related to cellular dimensions. General empirical shrinkage model

Chapter 2 Literature Review
15
have been suggested for fruits and vegetables during drying (Suzuki et al., 1976;
Lozano et al., 1980; Madamba et al., 1994; Ratti, 1994; Zogzas et al., 1994; Rovedo et
al., 1997; Lou, 1997; Xiang, 2001) as a function of water content of products,
including linear models and non-linear models. Table 2-1 gives some examples of
these models.
The degree of shrinkage can be controlled by applied drying method and drying
conditions, subsequently, influence density and porosity of dried products (Krokida
and Maroulis, 1997). Choosing a proper drying method is very important for industry
to yield desired products. Using microscopy to observe macroscopic shrinkage and
relating microstructure to texture and physical properties is an interesting field of
research (Ramos et al., 2003).
Table 2-1: Empirical models of shrinkage related to moisture content
Model Food products
21 kXkDr Apple (Lozana et al., 1980)
XDr 1 Apple, carrot, potato (Zogzas et al., 1994)3
42
321 XkXkXkkDr Apple, carrot, potato (Ratti,1994)
)exp( 321 tkkkDr Potato and squash (Rovedo et al., 1997)q
r XX
D
0
Guava, mango, and honeydew (Xiang,2001)
2.3.3 Density and porosity
The density and porosity are important physical properties characterizing the
quality of dry and intermediate moisture foods (Schubert, 1987; Zogzas et al., 1994).
However, there are a number of density definitions of practical interest which need to

Chapter 2 Literature Review
16
be considered (Rahman, 1995; Rahman et al., 1996). In most case, the following
definitions are used:
Particle density: is defined as the current particle mass divided by the particle
volume, disregarding the volume of all pores (Lewis, 1987). Typically, the particle
density increases as the material loss water, as shown in Figure 2-3. Several
researchers observed this phenomenon in diversified fruits and vegetables: apple,
banana, grape, pear, carrot, potato and garlic (Lozano et al., 1980, 1983; Vagenas et
al., 1990; Zogzas et al., 1994; Krokida and Maroulis, 1997). Peculiarly, apples and
carrots have an inverted tendency for lower values of water content (Lozano et al.,
1980, 1983). Krokida and Maroulis (1997) reported that particle density was not
affected by drying method except osmotic dehydration.
Figure 2-3: Typical variation of density/porosity with water content.
Bulk density (or apparent density): is defined as the particle mass divided by
the particle volume, including the volume of all pores. It also increases as water
content decreases, as shown in Figure 2-3, but was strongly affected by dehydration
process. The bulk density of freeze drying samples is the lowest, while for
conventional air drying is the highest (Krokida and Maroulis, 1997). They also report
Den
sity
/Por
osity
Water content

Chapter 2 Literature Review
17
that it decreased significantly as the pressure was decreased in both vacuum drying
and freeze drying, and developed a model for vacuum drying.
Porosity: is defined as the ratio between volume of pores and the total volume
of product (Lewis, 1987). During drying, the product porosity increase as the water
and volatiles are removed (Figure 2-3). Krokida et al. (1997) stated that porosity
depends on initial water content, composition and volume, and compared with freeze,
microwave and vacuum drying, air-dried products have low porosity. Materials
influence porosity as well. Carrots and potatoes developed almost negligible porosity
while apples increased a lot in air drying (Zogzas et al., 1994). These authors correlate
porosity with water content and density at the same time to derive mathematical
models, which are presented in Table 2-2.
Table 2-2: Mathematical models of porosity for fruits and vegetables
Model Food Products
XbbXaaXaaa
2154
321
exp)exp()exp(
1
Apple, carrot and potato cubes
X<1.5g/g (Zogzas et al., 1994)
XX ws
b
1
)/()/1(1 0 Avocado, prune and strawberry slices
(Tsami and Katsioti, 2000): the volume-shrinkage coefficient
Banana, apple, carrot and potato cylinders(Krokida and Maroulis, 1997)
)exp()exp(
154
321
XaaXaaa
Apple, pear, carrot, potato, sweet potato and
garlic cylinders (Lozano et al., 1980)1.5<X<7.45g/g

Chapter 2 Literature Review
18
2.3.4 Texture
Texture is another important parameters connected to product quality, which is
related to the structure of foods (Ramana and Taylor, 1994). Textural characteristics
also depend on chemical and biophysical characteristics of the products (Moshenin,
1986; Bourne, 1992; Thiagu et al., 1993). The properties are usually related to
mechanical tests. By applying static or dynamic loading, the viscoelastic behaviour of
a material is investigated. The viscoelasticity is strongly related to complex quality
characteristics perceived by people as mouth feeling. The rheological behaviour of
dehydrated products has been studied through both compression and relaxation
stresses (Bagley, 1987; Mohan Rao, 1984; Katz and Labuza, 1981).
A compression test is one of the most common techniques for estimation of
the texture. The simplest approach is to measure the maximum applied force or stress
at fracture of the material. The quantification of difficult terms such as hardness and
chewness, has been made by a methodology called Texture Profile Analysis.
2.3.5 Nutrients
Fruits serve as indispensable sources of vitamins and minerals to human diet
and also provide some protein, fat and energy. The value of fruits in human diet is
increasingly being realized in recent years. Virtually, all human’s dietary vitamin C is
obtained from fruits and vegetables (Jayaraman and Das Gupta, 1999). They are also
important suppliers of calcium, phosphorus and iron.
Most fruits contain more that 80% water and are, therefore, easily perishable.
In order to extend their shelf period, several process technologies have been employed

Chapter 2 Literature Review
19
to preserve them. Drying is probably the oldest and most widely used method. As is
true in other food preservation methods, drying destroys certain nutrients.
Carbohydrates and fibre contents of food are not affected by drying. Vitamins A and
C could be degraded by exposure to air, and vitamin C is also degraded by heat.
Mineral losses may occur with soaking, but these losses are usually minimal,
compared with their fresh counterpart. However, loss of moisture content results an
increase in the concentration of nutrients in the remaining mass. Hence, it is quite
understandable that to determine the efficacy of different dehydration techniques and
compare the effect such techniques have on these nutrients.
Among all the nutrients in fruits, vitamin C (L-threo-2-hexenono-l, 4-lactone) is
one of the most vulnerable to chemical degradation. It can easily be oxidized to
dehydroascorbic. Fennema (1985) suggested that if vitamin C, being the most
unstable among the nutrients, is retained well, the other nutrients are generally
assumed to be well retained. Thus, vitamin C may be used as a quality index for the
degradation of vitamin C rich product (Uddin et al, 2002).
Figure 2-4: Vitamin C Chemical Structure, C6H8O6
CH2OH
HO
HOO
OH
O

Chapter 2 Literature Review
20
Vitamin C is a water soluble vitamin. Also known as Ascorbic acid (3-oxo-L-
gulofuranolactone), Anti-scorbutic Acid, Hexuronic Acid, Cevitannic Acid, L-
xyloascorbic Acid, Ascorbyl Palmitate, Ascorbyl Nicotinate. It was isolated from
fruits, paprika and adrenal glands in 1922 by Albert Szent-Gyorgi (Availabe at
http://www.pdrhealth.com/drug_info/nmdrugprofiles/nutsupdrugs/vit_0264.shtml). It
can be prepared by synthesis from glucose, or extracted from plant sources such as
rose hips, blackcurrants or citrus fruits. It is easily oxidized in air. Man is one of the
few mammals unable to manufacture AA in his liver. The chemical structure is shown
in Figure 2-4.
Vitamin C has many functions in human body. It accumulates iron in bone
marrow, spleen and liver; control blood cholesterol levels; fights bacterial and viral
infection; helps healing and so on.
2.3.6 Ginger flavour
Ginger is the rhizome of Zingiber officinale Roscoe (Zingiberaceae). Although
ginger is technically a rhizome rather than a root (which means it is a tuber that grows
horizontally under the ground), its name comes from the Sanskrit word for ‘horned
root’. Ancient Greek, Roman, Indian, Persian and Chinese cultures had a fondness for
its culinary and medicinal properties. They have used it to add flavour, tenderize meat,
stimulate the appetite and to calm the stomach. In Europe, ginger has been studied for
its antibacterial, antifungal, pain relieving, anti-ulcer, anti-tumour and other properties.
Recently, clinical trials showed that ginger rhizome could relieve appetite loss,

Chapter 2 Literature Review
21
motion sickness and prevent vomiting, even tend to boost the pumping action of heart
(Stewart et al. 1991)
Pungency is an important quality characteristic of ginger. The rhizome has
been valued for this since antiquity (Denniff and Whiting, 1976). Purseglove (1972)
noted that the main pungent principles of ginger rhizome are gingerol homologues
and their dehydrated products –shogaol homologues, which may result from thermal
process or long term storage. The structure of gingerol is shown in Figure 2-5.
Balladin et al. (1996; 1998) found the quantities of the main pungent principles
(gingerol and shogaol) extracted from fresh, non-steam-distilled solar-dried and
steam-distilled solar dried ginger rhizomes increased but the oleoresin quality
decreased. The reason they explained it was that some gingerols dehydrated and
produced shogaols.
Figure 2-5: Structure of gingerol homologuesNote: when n=4 is 6-gingerol.
From the literature review, it is noted that a great number of works have been
done on drying, both energy engineering side and quality side. However, limited
research on modified air drying is found. In order to provide a better understanding
and have a clearer insight, both the drying kinetics and quality of several foods dried
32 CHCH n
HOO
HO
OCH 3

Chapter 2 Literature Review
22
in different gases were studied extensively in this project. The results of quality tests
were also compared with those of freeze drying and vacuum drying samples.

Chapter 3 Material and Methods
23
CHAPTER 3
MATERIAL AND METHODS
This chapter provides details about the test set-ups, experimental procedures
and materials used in the drying experiments. Except drying processes, the other
procedure for apple, guava and papaya were far different from that of ginger. Hence,
they were described in separated sections.
3.1 Drying Apparatus and Conditions
A heat pump dryer, shown in Figure 3-1, was used in the experiment, which
operates in a closed loop. There were two condensers. One was external, the other
was internal. According to the desired temperature, different amount of refrigerant
was piped into the internal one. Status of refrigerant is monitored at several key points
by thermocouples and pressure gauges. The blower circulated the air/inert gas flow,
enabling it condensed water vapour at internal evaporator and heated at the condenser.
A two-story rotating tray was placed inside the drying chamber, which makes the
every sample get uniform heat. A vacuum pump and a gas cylinder were connected to
the chamber, which are needed when modifying the atmosphere.
In this project, about 100 grams of samples were fed in each batch. When
using inert gas, the chamber was evacuated first before nitrogen or carbon dioxide
was pumped in. This procedure was repeated three times at the beginning of each
experiment, making sure that the normal air was substituted as completely as possible.

Chapter 3 Material and Methods
24
Figure 3-1: Schematic of heat pump dryerNote: air/ inert gas path; refrigerant path
The drying temperature inside the chamber was measured by T type
thermocouple with the accuracy of ±0.1°C, which was inserted in the middle position
of the inlet cross section. The flow velocity was measured in advance and set at a
particular value. A humidity sensor was placed inside to measure the relative
humidity. The weight of the samples was continuously monitored by a load cell. All
Sight Glass
Evap
orat
or
Inte
rnal
Con
dens
er
RH1, T1
Drying ChamberN2/C
O2
Cyl
inde
rBlower
Vacuum Pump
FilterDryer
ExternalCondenser
Liquid Receiver
CompressorExpansion Valve
Check Valve
Sight Glass
P6 T6
P10
T10
P12
T12
T7
P7
Chapter 3 Material and Methods
25
the data were collected by HP 34970A data logger and downloaded to a personal
computer. In the stable stage, a relative humidity (RH) of around 10%, air velocity of
0.7m/s and a temperature slightly fluctuating by about 0.5°C at 45°C was maintained
in the drying chamber. The drying time was varied according to different goals set for
this study.
For freeze drying, the basic principle is the removal of water from a specimen
frozen during the process, shrinkage is eliminated or minimized, and near perfect
preservation will result . Samples were first placed in a freezer at a temperature of -
50°C for 24 hours. All the moisture inside were frozen to ice during this period. Virtis
BT4K XL freeze dryer was used. A full vacuum was applied and pressure in the
drying chamber was maintained below 4.6mm Hg. Under this condition, ice will
begin to sublimate into water vapour without going through a liquid state.
Vacuum drying is a very efficient way. Unlike drying at atmospheric pressure,
it lowers the vapour pressure of the water and provides a greater temperature
difference between the heating medium and product. This results in fast drying and
more efficient heat recovery. The drying process for samples was applied at a pressure
of 0.15 bar and at a temperature of 45ºC for 24 hours. A vacuum dryer, model She
Lab 1430D, was used in this experiment,
3.2 Sample Preparation
3.2.1 Fruits
Fuji Apples from China, large white Guavas from Thailand, solo papaya from
Malaysia and Russet Burbank Potatoes from USA were purchased from a local

Chapter 3 Material and Methods
26
supermarket. The materials were cut into 1±0.1cm cubes (only those without skin
were used in experiments, others were discarded), then immediately immersed to
distilled water at room temperature to prevent contact with oxygen, and wash away
phenolic compounds and free enzymes from the cut surfaces, avoiding rapid oxidation.
The preparation was done as soon as possible, which was no longer than 10 minutes.
Lemon juice used as a natural inhibitor of browning was only applied on
normal air drying of apples. When squeezing juice, the seeds were removed, because
some seeds themselves have good antioxidant properties (Guo, Yang, Wei, Li, Xu and
Jiang, 2003). The squeezed lemon juice was diluted with distilled water to
concentrations of 10%, 30%, and 50%. A second soaking-agent was prepared by
blending 10g of lemon peel with 150 ml of distilled water, then filtering. The filtrate
was used as the soaking agent. Approximate 100 grams of sample used for air-drying
were immersed in 150ml of the soaking solution for 30 minutes before air drying. No
pre-treatment with inhibitors was used when drying with inert gases ( 2CO , 2N ). The
whole procedure is summarized in Figure 3-2.
3.2.2 Ginger
Fresh ginger was purchased from Shop N Save supermarket, Singapore.
Because mechanical methods cannot be controlled properly to maintain a uniform
peeling, a chemical method was adopted. About 200 grams fresh ginger was
immersed in 1 litre of 1.5% sodium hydroxide solution, in a 2 litre beaker and
maintained at 90oC by a hot plate, for 5 minutes. A magnetic stirrer keeps the solution
homogeneous. The schematic of the whole device could be seen clearly in Figure 3-3.

Chapter 3 Material and Methods
27
Figure 3-2: Flow chart of experiments procedure on fruits
Apple/ Guava/Potato/Papaya
Cut into 1cm cubes
Put samples into water, washing awayphenolic compounds and free enzymes
(less than 10 mins)
HPD
Vacuum dryer
Freeze dryer
2CO 2N
Only apple soakedwith lemon juiceor peel
4 hours / 8 hours / 18 hours drying
Normal Air
Frozen at-50°C for
24 hrs
24 hours’drying
24 hrs’dryingReduce to bone dry mass in desiccator
Quality Test
Colour Porosity Texture Rehydration

Chapter 3 Material and Methods
28
After the chemical treatment of removing skin, the ginger pieces were rinsed
five times with distilled water. The loose skin was gently washed away. In order to
make sure that traces of alkali were neutralized, the rinsed ginger pieces were dipped
in 0.5% citric acid (w/v) solution for two minutes, then rinsed again in distilled water
five times. The peeled ginger pieces were immediately sliced longitudinally into 3mm
flakes.
Figure 3-3: Schematic diagram of peeling the skin of ginger
3.3 Drying Kinetics and Energy Performance of Heat Pump Dryer
As the weight of all kind of samples was continuously monitored and stored in a
computer during drying by HPD and MAHPD, drying curves can be obtained from
these data. Dried samples were stored in vacuum desiccators with silica gels at the
bottom to reach bone dry mass. It took about 10 days. During this period, the weight
was monitored regularly until the difference between recent 2 recordings was not
larger than 0.1 gram. With bone dry mass, moisture content (dry base) can be
calculated. By plotting this against time or other item, important parameter such as
drying constant, effective diffusivity can be found.
Heater
Stirrer
Ginger
Beaker
NaOH (15%)

Chapter 3 Material and Methods
29
Only papaya cubes were used for energy test. Power input of compressor and
internal fan were measured manually by digital multi-meter (HIOKI). The feed load
of 100 gram, 150gram and 200gram were tested. Pressure values were recorded when
the system reached stable stage.
3.4 Quality Tests for Fruits
3.4.1 Colour measurements
CIE colour values were measured using a Minolta CM-3500d
Spectrophotometer (Tokyo, Japan). For each cube of sample, the lighteness (L*),
redness (a*), and yellowness (b*) were captured. Five randomly selected samples of
each batch were analyzed and the mean and standard deviation (SD) were recorded.
Chroma or strength of colour (C*) and hue angle (h*) were also calculated, and these
values are related to a* and b* in the following form:
C* = 22 (b*)(a*) (3-1)
h* = tan-1(a*/b*) (3-2)
High values of hue angle with lower values of chroma indicate less browning. The
mean values and standard deviations were also calculated. Total colour change DE*
as defined by the following equation, was calculated and compared with their fresh
counterpart:
222* *** baLDE (3-3)

Chapter 3 Material and Methods
30
3.4.2 Shrinkage, density and porosity
Shrinkage was related to moisture content in this experiment. Moisture content
based on bone dry mass is defined as:
massdryBonemassdryBonemassTotal
X
(3-4)
Bone dry mass was obtained by putting it in vacuum desiccator. Initial moisture
content ( iX ) and final moisture content ( fX ) were calculated. Their moisture
changes were compared.
A Scanning Electron Microscope (SEM),model Joel JSM 5800-LV, was
used to investigate the surface porosity of the dried food samples. The SEM captures
detailed 3-dimensional images at magnifications ranging from 15 to 200,000 with a
resolution of 5 nanometers. In this study, low vacuum condition was used and the
magnification was restricted to 70 or 100. Five samples were examined for each
drying method, but only clear pictures were selected to show the surface porosity.
Mercury porosimeter (Micromeritics, AutoPore) can detect a capillary
diameter range from 0.003 m to 360 m . Its working principle based on Washburn’s
equation, assumes the pore is cylindrical and the opening is circular in cross-section
(Webb, 2001). As mercury is non-wetting to most solids, the pore diameter could be
determined once the pressure applied is known. Both low pressure and high pressure
analysis were used for pore information.

Chapter 3 Material and Methods
31
3.4.3 Texture analysis
A stable Micro System texture analyzer (TA.XT2i, Stable Micro System,
Godalming, Surry, UK) was used to test the hardness of the samples. Due to the size
of samples, a 2mm diameter stainless steel cylinderial probe was chosen. Only
compression tests were conducted in this study. Load size is 2kg. According to the
recommendation in the software, pre-test speed is set at 4m/s, test speed is 5m/s and
after-test speed is 5m/s. Perforating distance is 2mm. The resistance that the sample
exerted was recorded. The three surfaces in coordinate axes of each sample cube were
tested and the average for one cube was recorded. Ten samples from each batch were
tested. The mean value and standard deviation of 5 readings were reported.
3.4.4 Rehydration studies
Water bath which can maintain the water temperature at a certain value was
used in rehydration experiments. Sixty and eighty degree C water were used in this
study. Each bone dried sample was weighed first, placed in a tea drainer and then
immersed in the water bath for various lengths of time. At certain intervals, the
samples were removed from water; excess water from their surfaces was gently wiped
off using tissues and weighed. The accuracy of balance is 0.0001 gram. Each
experimental run was performed triple times. Their mean values were recorded as the
weight of absorbed water for a given rehydration period.

Chapter 3 Material and Methods
32
3.4.5 Vitamin C test
Vitamin C test adopted indophenol method (using Tillman’s reagent-titration
or photometric): titrate indophenol solution (16.2mg/L), monitoring colour changes
due to 2, 6-dichloroindophenol reduction, which is recommended by AOAC (1984).
The detail information could be found in Appendix A. The concentration in fresh
fruits was set to 100 percent compared with that in their dried counterparts.
3.5 Gingerol Analysis
3.5.1 Reagents and materials
6-gingerol, lot No.PKH3775, was purchased from Wako Pure Chemical
Industries (Osaka, Japan). The purity was 99.6%. Methanol, HPLC grade, was used.
All other reagents were of analytical grade and were used without further purification.
3.5.2 Instruments and Conditions
Hewlett-Packard series 1100 HPLC system was used. The column was
Hewlett-Packard 799160D-574 Hypersil 0DS 5 UM 200×4.6mm. For the mobile
phase system: methanol and water were used in this study (60:40, v/v).
3.5.3 Preparation of calibration curve for 6-gingerol
6-gingerol aqueous solutions were prepared in concentrations of 82.8, 62.1,
41.4 and 20.7 mLg / for the calibration curve. The mobile phase system used in this

Chapter 3 Material and Methods
33
study was composed of methanol: water (60:40, v/v). The flow rate was 1.0mL/min.
The eluted substances were detected at 281nm using a UV detector.
3.5.4 Extraction of gingerol from dried ginger samples
All the samples were reduced to bone dry mass before use, because the
insufficiently dried ginger would result in extracting undesirable water-soluble
components such as starches and sugars (Balladin et al., 1996). According to the
analytical procedure introduced by Yong et al. (2002), a sample of 0.1 gram each of
bone dried materials resulting from freeze drying, vacuum drying, normal air HPD,
nitrogen HPD and carbon dioxide HPD were grounded in a mortar then adjusted to
50mL volume with pH 4.0 acetate buffer solution, because it was reported that the
gingerol solutions had better physical and chemical stability between pH 4.0~5.0
(Young et al., 2002). This solution was shaken first to make sure that all the soluble
components were dissolved, then filtered by HPLC filter unit (FP Point 45, Schleicher
and Schuell) and 10 L was injected into the column.

Chapter 4 Drying kinetics and energy analysis
34
CHAPTER 4
DRYING KINETICS AND ENERGY ANYLYSIS
Methods of analyzing drying kinetics and energy performance of heat pump
dryer were introduced first. Raw data were fitted into mathematical models to obtain
drying constant and effective diffusivity. Parameters of refrigerant were used to
calculate the COP, energy efficiency and SMER of heat pump dryer.
4.1 Method of Analysis
4.1.1 Analyses of drying process
Drying commonly refers to the process of thermally removing volatile
substances (moisture) to yield a solid product. It includes a combination of heat and
mass transfer: energy transfer from the surrounding environment to evaporate the
surface moisture (Process 1) and internal moisture transfer to the surface then
subsequently evaporated (Process 2). Hence, in Process 1, it depends much on the
external conditions, such as temperature, air humidity and flow, area of exposed
surface and pressure. While in Process 2, it is governed by the movement of internal
moisture, which is a function of the physical nature the material.
In existing literature, a generalized drying rate curve usually includes a
constant drying rate followed by falling rate regions (Mujumdar and Menson 1995;
van Arsdel and Copley 1963). However, not all materials have this pattern. When the
surface contains free moisture, the drying rate is constant. As the free moisture

Chapter 4 Drying kinetics and energy analysis
35
depletes, some shrinkage might occur and dry spots appear on the surface. The first
falling rate period begin. After the surface is totally dried, it is the second falling rate
stage. Moisture concentration gradients between the deeper parts and the surface are
the main controlling force.
Crank (1975) thought if only radial diffusion is considered and neglect the
effects of temperature and total pressure gradients, Fick’s second law of the unsteady
state diffusion could describe the transport of water during food dehydration process.
In this chapter, a simple diffusion model based on it is considered for the transport
mechanisms of the falling rate region and can be given by the following equation:
2
2
xX
DtX
(4-1)
where X= dry base free moisture content (g water/g dry mass); t=times(s); x=length
(m); D=diffusion coefficient for moisture in solid (m2/s).
Considering sample cube as a flat plate of thickness L drying on both sides
and under the given boundary conditions of
1. Uniform initial amount moisture content at the beginning:
0)(;0;0 XtXLxt (4-2)
2. Equilibrium content at the surface:

Chapter 4 Drying kinetics and energy analysis
36
eqXtXLxt )(;,0;0 (4-3)
The following solution exists in the absence of any external resistances (Rao and
Rizvi, 1986):
2
22
122
0
)12(exp)12(
18)(
L
tDn
nXX
XtXMR eff
neq
eq
(4-4)
where MR is moisture ratio of free water still to be removed at time t to the total free
water initially available; eqX and X0 represent the equilibrium and initial moisture
content respectively; effD is the effective diffusivity of water (m2/s), n is the number
of terms in the series, L is the sample thickness. In Eq. (4-4), it is assumed that the
sample temperature is constant during drying.
This solution is applied to thin-layer drying of different foods by a great
number of researchers (Jayas et al., 1991; Vaccarezza and Chirife, 1978). Equilibrium
moisture content of a sample being dried is decided by the structure and type of
material, and the moisture content of the air. For a long time drying, where t is large
and L is small, the higher order terms are neglected by setting n=1. Hence, the Eq. (4-
4) could be further simplified to a linear equation:
)()8ln()(
ln)ln( 2
2
20 L
tDXX
XtXMR
eq
eq
(4-5)

Chapter 4 Drying kinetics and energy analysis
37
Shrinkage of the material is also neglected in this model, so L is a constant
during the whole process. As a consequence, the effective diffusivity, which
incorporates factors that were not considered separately but would affect the drying
characteristics, can be determined by plotting experimental drying data in light of
ln(MR) versus time. In this chapter, the drying kinetics of guava, papaya and ginger is
investigated under controlled laboratory conditions. This simple equation (4-5) was
applied to fit the drying data by non-linear regression to evaluate the influence of inert
gas on the diffusivity quantitatively.
Another most useful empirical models is Page’s equation (Page, 1949), which
is an empirical modification of simple exponential model. It is written in the form:
)exp()(
0
B
eq
eq KtXX
XtXMR
(4-5)
where K is the drying constant, B is the Page’s parameter and t is the process time (s).
It may be linearized as:
)ln(ln)]ln(ln[ tBKMR (4-6)
4.1.2 Evaluation of energy performance
All energy conversion processes are governed by the first and second laws of
thermodynamics. In a process, the energy usually changes from one form to another.
The first law involves the conservation of energy. It indicates that there will be no
energy neither created nor destroyed in any conversion process. In other words, all

Chapter 4 Drying kinetics and energy analysis
38
energy can be accounted for during the energy conversion process. Hence, it deals
with the quantity of energy. While the second law of thermodynamics deals with the
quality of energy. Quality of energy is defined by its utility, or its ability to cause a
change. Not all energy has the same quality. The work-producing potential of the
substance is defined as availability. Availability is consumed in the conversion
process. The availability output of the process is always less than the availability input
because of the irreversibility. The ratio of these two is usually referred to as the
second law efficiency.
As shown in the schematic figure, the heat pump dryer consists of two
condensers: one is used as internal heat source; the other one is placed out of drying
chamber to adjust desirable temperature. The refrigerant is HCFC-22 (R22). In this
study, only internal condenser was considered to provide useful energy and taken into
account in COP and energy efficiency computation. All the numbers in the following
analysis refer to the point label in Figure 3-1.
As both internal and external condensers are used to control drying temperature,
so there are two paths to flow after the refrigerant discharged from compressor. The
compression process is assumed to be adiabatic, hence,
)( 6100 hhmWc (4-7)
Then, the total mass flow rate from the discharge line can be calculated as:

Chapter 4 Drying kinetics and energy analysis
39
6100 hh
Wm c
(4-8)
However, only the internal condenser provides the useful heat input in this drying
system, therefore, the mass flow rate to internal condenser should be known.
Applying mass balance equation and energy balance, the following array is obtained:
0
01267
mmmmTmTmT
ei
ei
(4-9)
im can be obtained by solving this set of equations.
As R22 passes through the condenser, it loses a substantial amount of energy.
Applying the first law of thermodynamics,
)( 76 hhmQ ic (4-10)
Associated with this heat transfer, the substance will reduce its flow availability (also
called exergy, the maximum work can be perform) by
)]()[()( 7607676ssThhmaamA iffic (4-11)
Finally, for the heat pump system, the coefficiency of performance is calculated as

Chapter 4 Drying kinetics and energy analysis
40
c
c
WQ
COP (4-12)
The second law efficiency of this system is:
WAc (4-13)
where Fc WWW and FW is the input power of internal fan.
And specific moisture evaporating rate is defined as:
WM
SMER
(4-14)
where Mis the moisture evaporating rate.
4.2 Drying Kinetics
The results obtained from experiments and analyses are presented in this
section. Figure 4-1 shows the dimensionless drying curves of papaya resulting from
different drying media. By using the inert gas, either nitrogen or carbon dioxide, it
was found that the moisture evaporated faster than in normal air. The same
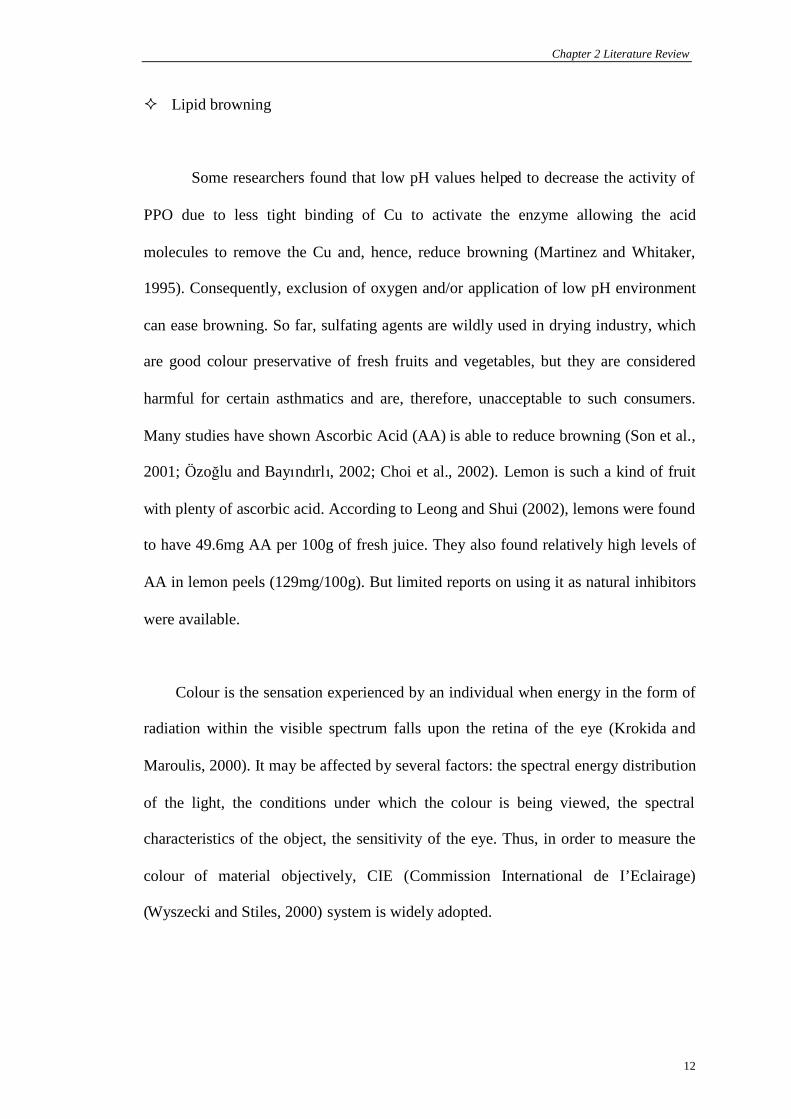
phenomena were observed in drying of guava and ginger, which are shown in Figure
4-2 and Figure 4-3. The difference is much clearer in Figure 4-2. Material structure
may contribute to it.
Chapter 4 Drying kinetics and energy analysis
41
00.10.20.30.40.50.60.70.80.9
1
0 100 200 300 400 500
Drying time (min)
Dim
ensi
onle
ssm
ois
ture
rati
o
NitrogenCarbon DioxideNormal Air
Figure 4-1: Effect of inert gas on drying of papaya
00.1
0.20.30.40.5
0.60.70.8
0.91
0 100 200 300 400 500
Drying time (min)
Dim
ensi
onle
ssm
oist
ure
rati
o
Carbon DioxideNitrogenNormal Air
Figure 4-2: Effect of inert gas on drying of guava

Chapter 4 Drying kinetics and energy analysis
42
00.10.20.30.40.50.60.70.80.9
1
0 100 200 300 400 500
Drying time(min)
Dim
ensi
onle
ssm
oist
ure
rati
o
Normal AirCarbon DioxideNitrogen
Figure 4-3: Effect of inert gas drying of ginger
By plotting the drying rate against moisture content in Figure 4-4, Figure 4-5
and Figure 4-6, the difference can be seen more clearly. The drying rates were found
to the highest at the beginning of drying when moisture content was the highest, with
nitrogen displaying the highest drying rate. In the early period, the drying rates
declined not so rapidly as in the final period. The moisture content influenced the
drying rate. High moisture content resulted in fast drying rate while high gradient of
depleting moisture content led to a slow declined gradient of drying rate.
Table 4-1 shows Page’s parameters for papaya, guava and ginger. As expected,
nitrogen yeilded the highest drying constant, which represents the water diffusion
velocity in the material. It consists with the following analyzing part.

Chapter 4 Drying kinetics and energy analysis
43
-0.005
0
0.005
0.01
0.015
0.02
0.025
0.03
0.035
0 2 4 6 8 10
Moisture content(g/g dry)
Dry
ing
rate
(g/g
dry
min
)
NitrogenCarbon DioxideNormal Air
Figure 4-4: Drying rate of papaya
0
0.005
0.01
0.015
0.02
0.025
0.03
0.035
0 2 4 6 8 10
Moisture content(g/g dry)
Dry
ing
rate
(g/g
dry
min
)
Normal AirCarbon DioxideNitrogen
Figure 4-5: Drying rate of guava

Chapter 4 Drying kinetics and energy analysis
44
0
0.005
0.01
0.015
0.02
0.025
0.03
0.035
0 2 4 6 8 10
Moisture content (g/g dry)
Dry
ing
rate
(g/g
dry
min
)Normal AirNitrogenCarbon Dioxide
Figure 4-6: Drying rate of ginger
Table 4-1: Page’s equation parameters
Material Method K BNormal Air 0.0077 0.8977
Nitrogen 0.0166 0.7656PapayaCarbon Dioxide 0.0117 0.8303
Normal Air 0.0022 1.1373Nitrogen 0.0046 0.9555Guava
Carbon Dioxide 0.0036 1.0496Normal Air 0.0023 1.0714
Nitrogen 0.0031 0.9720GingerCarbon Dioxide 0.0027 1.0574
Effective diffusivity of guava, papaya and ginger were also analysed in this
work by plotting data. For guava and papaya, only falling rate periods were observed
in the drying curve, as the drying of heat sensitive material was considered a slow
process. The diffusivity of guava and papaya in MAHPD using different gas were
calculated according to equation (4-4), assuming the thickness L was constant
throughout the drying process.

Chapter 4 Drying kinetics and energy analysis
45
Nitrogen Drying
y = -0.6247x + 0.1677R2 = 0.9892
-3-2.5
-2-1.5
-1-0.5
00.5
0 0.5 1 1.5 2 2.5 3 3.5 4 4.5t/L^2 (min/mm^2)
ln(M
R)
(a)
Carbon Dioxide Drying
y = -0.5209x + 0.082
R2 = 0.9932-3
-2
-1
0
1
0 0.5 1 1.5 2 2.5 3 3.5 4 4.5t/L^2 (min/mm^2)
ln(X
/X0)
(b)
Figure 4-7: Variation of ln(MR) with t/L2 of guava (a) N2 (b) CO2
In Figure 4-7 and Figure 4-8, the experimental values of ln(MR) were plotted
against 2/ Lt . The slope of the curve is a measure of the effective diffusivity. It was
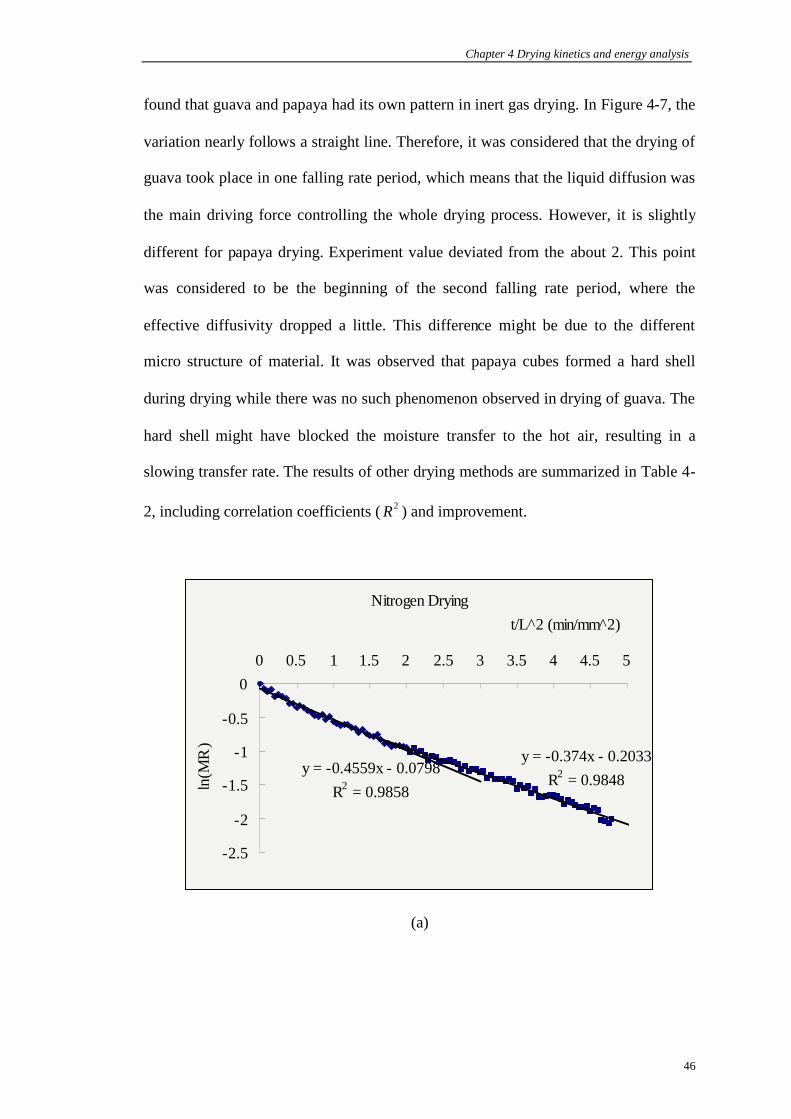
Chapter 4 Drying kinetics and energy analysis
46
found that guava and papaya had its own pattern in inert gas drying. In Figure 4-7, the
variation nearly follows a straight line. Therefore, it was considered that the drying of
guava took place in one falling rate period, which means that the liquid diffusion was
the main driving force controlling the whole drying process. However, it is slightly
different for papaya drying. Experiment value deviated from the about 2. This point
was considered to be the beginning of the second falling rate period, where the
effective diffusivity dropped a little. This difference might be due to the different
micro structure of material. It was observed that papaya cubes formed a hard shell
during drying while there was no such phenomenon observed in drying of guava. The
hard shell might have blocked the moisture transfer to the hot air, resulting in a
slowing transfer rate. The results of other drying methods are summarized in Table 4-
2, including correlation coefficients ( 2R ) and improvement.
Nitrogen Drying
y = -0.4559x - 0.0798R2 = 0.9858
y = -0.374x - 0.2033R2 = 0.9848
-2.5
-2
-1.5
-1
-0.5
00 0.5 1 1.5 2 2.5 3 3.5 4 4.5 5
t/L^2 (min/mm^2)
ln(M
R)
(a)

Chapter 4 Drying kinetics and energy analysis
47
Carbon Dioxide Drying
y = -0.4457x - 0.0361
R2 = 0.9936
y = -0.3829x - 0.1146
R2 = 0.9851
-2.5
-2
-1.5
-1
-0.5
0
0.5
0 0.5 1 1.5 2 2.5 3 3.5 4 4.5 5 5.5t/L^2(min/mm^2)
ln(M
R)
(b)
Figure 4-8: Variation of ln(MR) with t/L2 of papaya (a) N2 (b) CO2
Table 4-2: Diffusivity of Guava and Papaya in MAHPD
Material Drying MediumEffective Diffusivity
(First/Second)( sm /10 210 )
R2IncreasedPercentage
(First Stage)
Normal Air 6.09 0.9926 0Nitrogen 10.55 0.9892 73.20%Guava
Carbon Dioxide 8.79 0.9932 44.33%Normal Air 6.61 0.9943 0
Nitrogen 7.69/6.32 0.9858/0.9848 16.34%PapayaCarbon Dioxide 7.53/6.47 0.9936/0.9851 13.92%
The diffusivity of water in ginger slices under MAHPD was evaluated (Figure
4-9). Correlation coefficients ( 2R ) is included. The effect of inert gas on ginger was
similar to that of guava. The variation nearly followed a straight line. Therefore, it
was considered that the liquid diffusion was the main driving force controlling the
whole drying process of ginger, with a constant diffusivity.

Chapter 4 Drying kinetics and energy analysis
48
Normal Air Drying
y = -0.0467x + 0.1717
R2 = 0.987D=7.892e-11
-3
-2.5
-2
-1.5
-1
-0.5
0
0.5
0 10 20 30 40 50 60
t/L^2(min/mm^2)ln
(MR
)
(a)
Nitrogen Drying
y = -0.0681x + 0.1464
R2 = 0.9847D=11.512e-11
-3.5
-3
-2.5
-2
-1.5
-1
-0.5
0
0.5
0 10 20 30 40 50
t/L^2(min/mm^2)
ln(M
R)
(b)

Chapter 4 Drying kinetics and energy analysis
49
Carbon Dioxide Drying
y = -0.0538x + 0.1157R2 = 0.9847
D=9.085e-11-3
-2.5
-2
-1.5
-1
-0.5
0
0.5
0 10 20 30 40 50
t/L^2(min/mm^2)
ln(M
R)
(c)
Figure 4-9: Variation of ln(MR) with t/L2: (a) normal air; (b) N2; (c) CO2 for gingerNote: D is measure in m2/s
Although the method described here was a simplified one and the diffusivity
measured was a lumped value, it would affect the drying characteristics. From these
data, it can be found that nitrogen drying had the highest effective diffusivity,
followed by carbon dioxide drying, while normal air drying yielded the lowest. The
possible reason is probably due to the different physical properties of different gas.
For nitrogen, the specific heat (1.04kJ/kg.ºC) is higher than that of normal air (1.00
kJ/kg·ºC) while their densities were nearly the same (0.9737:1). Hence, their masses
were the same at the same volume. Therefore, in a fixed volume system, nitrogen
would absorb more heat from the heat exchanger and release more when passing over
the samples in the chamber. For carbon dioxide, though the specific heat (0.85
kJ/kg.ºC) is lower than that of air, its density is much higher (1.539) than air.

Chapter 4 Drying kinetics and energy analysis
50
Therefore, CO2 had a larger mass at fixed volume compared to air. It also had a larger
heat transfer capacity than air.
4.3 COP, Energy Efficiency & SMER
Table 4-3, Table 4-4 and Table 4-5 indicate the energy parameters of different
drying processes in heat pump dryer. Taking the data of normal air (100 gram) as a
sample, the calculation procedure is as following:
1. The input power of compressor: 0.6kW;
2. The total mass flow rate of compressor discharge line is:
skghh
Wm c
o /06.04454356.0
610
3. The mass flow rate to internal condenser is:
skgm
mmmm
i
ei
ei
/052.0
06.006.05.310.698.25
4. The useful heat input is:
kWhhmQ ic 82.1)410445(052.0)( 76
5. Availability:
kWssThhmA ic 43.0)]70.179.1(297)410445[(052.0)]()[( 76076
6. COP of heat pump:
03.36.0
82.1
c
c
WQ
COP
7. The input power of internal fan: 0.1kW
8. The total input power is:
kWWWW Fc 7.01.06.0

Chapter 4 Drying kinetics and energy analysis
51
9. Energy efficiency:
%4.617.0
43.0
WAc
10. Average moisture evaporating rate:
hkgM /015.0
11. SMER:
hkWkgSMER ./021.07.0
015.0
Table 4-3: The energy results of normal air drying processes.
Feed Load(g)/ M(kg/s)
Status T(°C) P(Mpa) h(kJ/kg) s(kJ/kg.K) Results
6 69.0 1.62 445 1.79 im=0.052kg/s7 25.8 1.76 410 1.69 COP=3.0310 32.0 0.14 435 - =39.4%
100M=0.015
12 31.5 1.57 - - SMER=0.0216 68.1 1.62 445 1.79 im=0.053kg/s7 26.5 1.76 410 1.69 COP=3.0910 32.0 0.14 435 - =40.1%
150M=0.016
12 31.4 1.58 - - SMER=0.0236 67.2 1.62 444 1.79 im=0.055kg/s7 28.1 1.76 411 1.70 COP=3.0210 32.0 0.14 435 - =49.3%
200M=0.010
12 31.2 1.58 - - SMER=0.014
In each drying method, it was noted that the enthalpy and entropy of
refrigerant did not vary much. The only changed parameter was the mass flow rate in
internal condenser, which increased as feed load increased. Since there was more
moisture needed to be evaporated and the refrigerant temperature was nearly the same,
there was certainly more amount of refrigerant flowing to the internal condenser in to

Chapter 4 Drying kinetics and energy analysis
52
supply the decreased quantity of heat. Hence, it is the most important factor that
influences COP and energy efficiency.
Table 4-4: The energy results of nitrogen drying process
Feed Load(g)/ M(kg/s)
Status T(°C) P(Mpa) h(kJ/kg) s(kJ/kg.K) Results
6 68.1 1.62 445 1.79 im=0.051
7 25.0 1.76 410 1.69 COP=2.9810 32.0 0.14 435 - =38.6%
100M=0.015
12 31.2 1.57 - - SMER=0.0226 67.3 1.62 445 1.79 im=0.0527 26.0 1.76 410 1.69 COP=3.0310 32.0 0.14 435 - =39.4%
150M=0.016
12 31.5 1.57 - - SMER=0.0236 67.5 1.59 443 1.79 im=0.0557 27.0 1.76 411 1.70 COP=2.9310 33.5 0.14 437 - =41.4%
200M=0.011
12 30.5 1.57 - - SMER=0.015
It was also found that the imin nitrogen drying and carbon dioxide drying
were lower than normal air drying at the same feed load. This phenomenon could be
linked to effective diffusivity. The effective diffusivity in inert gas is higher than in
normal air, so less heat is needed, subsequently, lower mass flow rate to internal
condenser.
Note that the energy efficiency increased with im, but it was not true for
SMER and COP. SMER values were nearly the same in different drying media. It
was observed that the evaporated moisture could not be condensed properly by the
system when the feed load reached 200 gram. Much of it condensed on the internal
surface of the drying chamber. The RH inside increased significantly, which was
about 78%. Therefore, it slowed down the drying rate and resulted in a decreased

Chapter 4 Drying kinetics and energy analysis
53
SMER. The feed load of 150 gram seemed to be a suitable value. In this case, COP
was also the highest, no matter in HPD or MAHPD. And in this experiment, the
value of SMER was extremely low, which was not consistent with the data in
literature review. The possible reason was that there was no collection and discharge
device in this lab dryer. Hence, it is only suitable for low feed load.
Table 4-5: The energy results of carbon dioxide drying process
Feed Load(g)/ M(kg/s)
Status T(°C) P(Mpa) h(kJ/kg) s(kJ/kg.K) Results
6 67.0 1.62 444 1.79 im=0.0537 26.0 1.76 410 1.69 COP=3.0010 31.8 0.14 435 - =32.6%
100M=0.015
12 30.8 1.58 - - SMER=0.0226 67.5 1.62 444 1.79 im=0.0547 26.6 1.76 410 1.69 COP=3.0610 31.8 0.14 435 - =33.2%
50M=0.017
12 30.6 1.58 - - SMER=0.0246 68.0 1.59 443 1.79 im=0.0557 27.0 1.76 411 1.70 COP=2.9310 33.2 0.14 437 - =41.4%
200M=0.010
12 30.3 1.57 - - SMER=0.014
Comparison of COP for HPD and MAHPD is made in Figure 4-11. It is found
that COP decreases when inert gas is used. The same trend was also observed in
energy efficiency, referring to Figure 4-12. This was because there was less
refrigerant flowing to the internal condenser when using inert gas. Therefore, the
useful energy amount reduced but the total input power was not changed.
Although COP and energy efficiency of MAHPD was lower than HPD, the
difference was not significant. This was due to the design deficiency of the dryer. If
the heat of external condenser can be fully used, it should not be a limitation.

Chapter 4 Drying kinetics and energy analysis
54
Comparison of COP
2.85
2.9
2.95
3
3.05
3.1
3.15
100 150 200
Feed Load
CO
P
Normal AirCarbon DioxideNitrogen
Figure 4-10: Comparison of COP for HPD and MAHPD
Comparison of Energy Efficiency
0.00%
10.00%
20.00%
30.00%
40.00%
50.00%
60.00%
100 150 200
Feed Load
Ener
gyEf
fici
ency
Normal Air
Carbon DioxideNitrogen
Figure 4-11: Comparison of energy efficiency of HPD and MAHPD

Chapter 5 Foods quality
55
CHAPTER 5
FOOD QUALITY
Food quality is an important criterion to judge the performance of dryers. In this
study, the quality tests were conducted in colour, density, porosity, rehydration,
texture, nutrient and flavour, and the results are presented in this chapter.
5.1 Colour
The L*, a*, b*, C*, h* values of samples (apple, guava and potato) dried in N2,
CO2 and normal air for different lengths of time are given in Table 5-1.
Comparing the data, it is possible to deduce that there is an improvement in
colour with longer drying time, e.g. 18 hours compared to 8 and 4 hours. L* and h*
were selected to be the index of browning. Samples dried for longer times, had
increased L* and h* values, and generally decreased a*, b* and C* values. As it was
reviewed in Chapter 2, the main cause of browning is PPO, which is heat-sensitive. It
is suggested that longer time drying deactivate this enzyme group more effectively.
Hence, there more lightness and less browning products resulted.
The h* values of samples dried for 18hrs in MAHPD using nitrogen and
carbon dioxide showed no significant difference at a confidence level of 95%.
However, comparing these samples dried using normal air drying, there was a
significant difference in h* values for guava and potato, as shown in Figure 5-1. For
apple, although h* values were not significant different, L* value was increased much

Chapter 5 Foods quality
56
and C* value was decreased much in MAHPD. Introducing carbon dioxide or
nitrogen into the drying chamber reduces the level of oxygen in the atmosphere, thus
modifying its composition. This can positively affect the colour and, hence,
improving the appearance.
Table 5-1: Colour values for dried apple, guava and potato samples
Drying Method Test Apple Guava PotatoL* 52.211.88 50.361.37 40.203.62a* 10.331.00 7.110.53 3.88 0.38b* 33.660.63 38.541.95 11.181.81C* 35.220.85 39.191.97 11.841.82
Nitrogen(4h)
h* 72.951.33 (a) 79.550.63 70.681.73L* 57.343.95 53.982.72 55.863.30a* 8.13 2.67 7.25 1.16 2.76 0.34b* 30.642.59 26.871.40 16.900.34C* 31.753.16 27.851.50 17.130.67
Nitrogen(8h)
h* 75.403.49(a) 74.922.11 80.720.95L* 64.932.00 64.061.79 70.942.62a* 2.93 0.27 0.100.36 -0.250.10b* 26.370.61 20.752.24 16.970.62C* 26.540.64 20.752.24 16.970.62
Nitrogen(18h)
h* 83.670.47(b) 89.760.97(c) 90.870.34(d)L* 66.231.35 62.371.62 66.232.38a* 3.55 0.92 0.25 0.29 -0.140.34b* 26.011.80 21.612.63 16.700.87C* 26.261.88 21.612.62 16.700.87
CO2(18h)
h* 82.311.65(b) 89.250.81(c) 90.501.15 (d)L* 60.580.85 61.571.29 63.541.74a* 5.59 0.96 2.48 0.88 0.850.18b* 31.750.99 27.192.74 14.900.56C* 32.251.10 27.312.71 14.930.57
Normal Air(18h)
h* 80.031.46(b) 84.681.96 86.760.64Note: Values following ±sign are standard deviation of 5 replicates
Means followed by the same letter in a column are not significantly different(p<0.05)
The L*, a*, b*, C*, h* values of apples treated with lemon juice or peel as
natural inhibitors are presented in Table 5-2. From the data, it can be seen that there is
less browning with increasing concentration of lemon juice, as shown by h* value

Chapter 5 Foods quality
57
increasing significantly. This could be attributed to its ability to reduce quinones,
generated by PPO-catalysed oxidation of polyphenols, back to phenolic compounds
before they undergo further reaction to form pigments. The optimum pH for PPO
activity is between pH 5 and 7 (Özdemir, 2003). Adjusting the pH to 4 or below has
been reported to effectively reduce browning (Martinez and Whitaker, 1995). That is
why higher concentration of lemon juice results in better colour. Comparing the use of
lemon juice with the use of inert gas, 30% lemon juice pre-treatment gave similar
results. And the peel of lemon could be used in place of 30% or 50% lemon juice,
little difference was observed.
7476
788082848688
9092
Apple Guava Potato
hva
lue
Nitrogen
CarbonDioxide
NormalAir
Figure 5-1: h* values of dried apple, guava, potato samples
A colour comparison between the MAHPD and vacuum dried samples is shown
in Table 5-3. Freeze drying yielded the highest h* and L* value, lowest a*, b* and C*
values, which gave a nice appearance. It removes water from a frozen sample by
sublimation under reduced pressure. Hence, it also reduced the oxygen content. Most
freeze-drying is done at -10°C, or lower, at absolute pressures of about 2 mm Hg or

Chapter 5 Foods quality
58
less. It is generally agreed that freeze drying yields the best products in terms of
quality such as colour (Liapis and Bruttini, 1995). However, it is also a very
expensive way of drying.
Table 5-2: Colour values for pre-treated dried apples
Gas Conc.(v/v)
L* a* b* C* h*
--- 40.61 ±4.83 11.44±0.81 28.76±1.90 30.96±1.91 68.29±1.48(a)
10% 46.64 ±2.89 12.02±1.00 31.29±1.74 33.52 ±1.96 69.01±0.74(a)30% 51.18±3.6 8.75±1.48 29.74±1.54 31.36±1.87 73.60±1.81(b)50% 52.80±1.22 7.40 ±0.72 24.42±1.34 25.52±1.49 73.17±0.74(b)
Normal Air
peel 62.23 ±4.63 9.32±3.12 32.96±3.17 34.30±3.88 74.51±3.21(b)N2 --- 54.05 ±4.17 10.78±1.75 32.40±1.66 34.17±1.95 71.64±2.34
CO2 --- 57.92±4.08 10.26 ±2.07 30.89±3.13 32.56±3.59 71.77±1.88Note: Values following sign are standard deviation of 5 replicates
Means followed by same letter are not significantly different (p<0.05)
Table 5-3: Colour values of apples resulting from three drying methods
Methods L* a* b* C* h*Freeze drying 67.23±1.40 0.4±0.23 16.94±1.84 16.95±1.84 88.64±0.69
Vacuum drying 60.02±2.37 6.93±0.86 26.17±0.81 27.08±0.95 75.19±1.45CO2(18Hrs) 66.23±1.35 3.55±0.92 26.01±1.80 26.26±1.88 82.31±1.65N2(18Hrs) 64.93±2.00 2.93±0.27 26.37±0.61 26.54±0.64 83.67±0.47
Note: Values followed sign are standard deviation of 5 replicates
Although the degree of browning can be expressed by the absolute values of
L*, a*, b*, C*, it is more reasonable to compare the colour of dried products with the
fresh food, since people prefer its appearance can be kept as much the same as its
original. Therefore, the total colour changes of dried guava and papaya resulting from
5 drying methods are compared in Figure 5-2. From both Figure 5-2(a) and 5-2(b), it
is clear that inert gas have a smaller colour change than normal air. It is known that
enzymic browning requires four different components: oxygen, enzyme, copper and a
substrate (Langdon, 1987). Hence, a reduction of oxygen content in the drying

Chapter 5 Foods quality
59
chamber could improve the colour. Normal air consists of approximate 20% oxygen
in volume while that in inert gas for this experiment is much lower. This result is
consistent with the previous study (Hawlader et al., 2004). It is also noted that, for
guava, the nitrogen dried products are even better than vacuum dried. Freeze drying
gave the smallest change. In contrast, for papaya, the DE* of freeze drying is the
largest. The possible reason is that freeze drying increased the lightness (L*) too
much, subsequently affected the DE* value. And papaya is dark colour fruit; while
guava is light colour one. Hence, compared with their original colour, freeze dried
papaya seemed far too light, which was not desirable.
Total color difference (DE*) of guava
05
1015202530354045
Freeze N2 Vacuum CO2 Normalair
DE*
valu
e
(a)

Chapter 5 Foods quality
60
Total Color difference (DE*) of Papaya
05
10152025303540
Nitrogen CO2 Normalair
Vacuum Freeze
DE*
valu
e
(b)
Figure 5-2: Total colour change: (a) Guava; (b) Papaya
5.2 Shrinkage, Density and Porosity
During drying, shrinkage of the samples was observed visually. It is noted that
different material lead to different degrees of shrinkage under the same drying
conditions. Among the samples of apple, guava and potato, the latter shrunk much
less. This can be related to the moisture removal from each food.
It has been reported by several researchers that shrinkage bears a simple
relation to moisture removed as stated in the literature review. In this study, it was
observed that potatoes had much less moisture removed than apple and guava, as
shown in Table 5-4. In general, potato has higher percentage of solid, 35% to 40%,
compared to fruits which have about 15%. Therefore, when it was dried, there
certainly less water was removed, which resulted in lower degree of shrinkage.

Chapter 5 Foods quality
61
Another important fact influencing shrinkage is case-hardening. This
phenomenon was observed in drying of papaya, which has been stated in the previous
chapter. When the external RH is lower, the surface moisture is removed very fast that
and, once surface moisture disappears, the transport of internal moisture to the surface
is controlled by diffusion coefficient often leading to case hardening of a material.
Since the shell formed, it supports the original shape of dried product, preventing its
further distortion, even when the internal structure collapses.
Table 5-4: Moisture Removal from samples dried in MAHPD over 18 hours
Method Moisture content Apple Guava PotatoXi 9.00 8.92 4.06Xf 0.25 0.27 0.05
NitrogenHPD
∆X 8.75 8.65 4.01Xi 9.00 8.92 4.06Xf 0.35 0.36 0.08
Carbon DioxideHPD
∆X 8.65 8.56 3.98Xi 9.00 8.92 4.06Xf 0.28 0.32 0.12
Normal AirHPD
∆X 8.72 8.60 3.94Note: M expresses moisture per g of dry matter
The initial mass for each material is around 100g
Shrinkage influences the product porosity, as it alters the air space of the
internal structure. The density and porosity are important physical properties
characterizing the quality of dry and intermediate moisture foods (Schubert, 1987;
Zogzas et al., 1994).
Porosity characterizes the open structure of a dehydrated material and is
strongly affected by the material moisture content, drying method and conditions
(Krokida and Maroulis, 2000). In addition, internal porosity development is

Chapter 5 Foods quality
62
dependent upon the type of product (Zogzas, Maroulis, and Marinos-Kouris, 1995).
Usually, porosity is linked to density.
However, there are a number of definitions of density of practical interest
which need to be considered (Rahman, 1995; Rahman et al., 1996). In this paper, the
definition is followed as stated in the literature review. Hence, the relationship
between density and porosity can be expressed as:
densityParticledensityBulk
Porosity 1 (5-1)
Table 5-5: The density and porosity of guava and papaya
Material Drying Methods Bulk Density Particle Density PorosityNormal Air 0.9953 1.1832 15.88%
Nitrogen 0.9414 1.2121 22.33%Carbon Dioxide 0.8801 1.2392 28.98%
Vacuum 0.7589 1.0914 30.46%
Guava
Freeze 0.3543 0.5400 34.39%Normal Air 1.0460 1.5583 32.88%
Nitrogen 0.6915 1.2613 45.18%Carbon Dioxide 0.7259 1.2715 42.91%
Vacuum 0.6254 1.2593 48.19%
Papaya
Freeze 0.1098 0.1631 32.69%
Table 5-5 summarizes the results for guava and papaya. For guava, the
porosity increased in the sequence of normal air drying, nitrogen drying, carbon
dioxide drying, vacuum drying and freeze drying. On the contrary, the porosity of
freeze dried papaya is smaller than that of normal air, and the vacuum dried samples
have the largest porosity. For vacuum dried papaya, a puff effect was observed
visually: there were bubbles under a hard shell. Reduced pressure may contribute to it.
It is the possible reason that the vacuum dried papaya had the largest porosity. For

Chapter 5 Foods quality
63
freeze dried papaya, some pore diameters may be smaller than 0.003 m , which is out
of the measuring capability of mercury porosimeter, so they can not be detected and
taken into account. With the help of SEM, more information was found.
(a)
(b)

Chapter 5 Foods quality
64
(c)
Figure 5-3: Structure of 8 hours normal air HPD dried material (SEM)(a) Potato, (b) Guava, (c) Apple
SEM measures the surface porosity. Figure 5-3(a) shows the oval starch
granules that distinctively characterize the potato cell structure. This indicates that
potato contains a higher percentage of solid, which may be hindrance to moisture
transfer. In guava structure, Figure 5-3(b), two types of pores can be identified,
namely open pore and closed pores. For better rehydrability, more open pores are
desired because closed pore have no capillary action, which means an inability to
imbibe sufficient water. As these are soft tissues and structures, careful material
handling was needed while cutting the sample. A more desirable structure is seen in
the top right hand corner of Figure 5-3(c); a regular honeycomb shape. The darkened
areas are the pores that have shrunk and their water content removed. If a material
undergoes different drying methods, it has a different porosity. This can be seen in

Chapter 5 Foods quality
65
Figure 5-4 (a) to (e), which is papaya dried by normal air HPD, MAHPD, freeze dryer
and vacuum dryer, respectively.
(a)
(b)

Chapter 5 Foods quality
66
(c)
(d)

Chapter 5 Foods quality
67
(e)
Figure 5-4: SEM of dried papaya:(a) freeze drying; (b) normal air drying; (c) vacuum drying; (d) Carbon dioxide drying;
(e) Nitrogen drying
5.3 Rehydration
Rehydration ability interconnects closely with porosity. Usually, the more
porous the products are, the faster the products rehydrate. The rehydration rate
changes with water temperature. The rates of rehydration of MAHPD dried apple,
guava and potato at 60°C and 80 °C were investigated and compared. These resultls
are shown in Figures 5-5 and 5-6.
Theoretically, if there are no adverse effects on the tissue structure, the
product will absorb water to the same extent as its initial state (Senadeera et al., 2000).
However, rehydration ability is reduced as the product gets drier, possibly because of
the increased loss of porosity and the collapse of cellular structure. As shown in

Chapter 5 Foods quality
68
Figure 5-5, it is found that all samples rehydrating at 80°C absorbed water at a higher
rate as compared to those rehydrating at 60°C. This may due to the water molecules
have higher kinetic energy at higher temperature. They could move quicker into the
capillary paths through the pores of the dried products.
0
0.1
0.2
0.3
0.4
0.5
0.6
0.7
0.8
1 2 3 4 5 6 7 8 9 10
Time (mins)
Wei
ghto
fwat
erab
sorb
ed(g
ram
) Apple 60°C
Apple 80°C
Guava 60°C
Guava 80°C
Potato 60°C
Potato 80°C
Figure 5-5: Rehydration behaviour of samples dried by MAHPD with 2N
It was also noted that the rehydration patterns for apple and guava samples
followed a nonlinear curve, in which the rate of rehydration decreased after 4 minutes.
However, the behaviour for potato was linear. This may be due to a more uniform
distribution of pores in the potato which leads to rehydration at a constant rate. On the
other hand, apple and guava, having bigger pores may initially rehydrate more easily,
and thus a steeper gradient is observed during the first 4 minutes of rehydration.

Chapter 5 Foods quality
69
00.10.20.30.40.50.6
0.70.80.9
1 2 3 4 5 6 7 8 9 10
Time (mins)
Wei
ghto
fabs
orbe
dw
ater
(gra
ms) Apple
80℃Apple60℃Guava80℃Guava60℃Potato80℃Potato60℃
Figure 5-6: Rehydration behaviour of samples dried by MAHPD with 2CO
0.0000
1.0000
2.0000
3.0000
4.0000
5.0000
6.0000
0 2 4 6 8 10
Time (mins)
Moi
stur
eco
nte
nt(d
.b)
40
60
80\
Figure 5-7: Rehydration of nitrogen dried papaya

Chapter 5 Foods quality
70
The same phenomena were observed in papaya. Three rehydrating
temperatures: 40°C, 60°C and 80°C were tried. In Figure 5-7, the rehydration of
nitrogen dried papaya at different temperatures for the first 10 minutes were shown. It
is noted that it had a faster rehydration rate at higher temperature as well.
However, the rehydration capability seems not to be affected by temperature.
In Figure 5-8, the rehydration capability of dried products resulting from all the
drying methods only increased slightly at higher temperature; porosity may have
contributed to this. Although the temperature was different, the space to contain water
is nearly the same for the samples resulting from each drying method. And the
capability of dried samples increased in the sequence of their porosity. The higher
porosity one resulted in a slightly higher rehydration capability.
Rehydration Capability of dried Papaya
0.0000
1.0000
2.0000
3.0000
4.0000
5.0000
6.0000
7.0000
Normal Air Carbon Dioxide Nitrogen
4060
80
Figure 5-8: Rehydration capability of dried papaya

Chapter 5 Foods quality
71
Rehydration of dried papaya at 40 degree
0.0000
1.0000
2.0000
3.0000
4.0000
5.0000
6.0000
7.0000
0 20 40 60 80 100
Time (mins)
Moi
stur
eco
nten
t(d.
b)
Carbon DioxideNitrogenNormal Air
Figure 5-9: Rehydration behaviour of HPD and MAHPD dried papaya
The same effect that porosity plays on rehydration can be also observed in
Figure 5-9. During the whole process, nitrogen dried samples has the highest
rehydration rate and the sequence among these three samples never changed.
Therefore, it can be concluded that the more porous samples absorb more water at a
faster rate.
However, this conclusion can not be applied to vacuum dried samples. Figure
5-10 shows the rehydration behaviour of papaya from vacuum dryer and freeze dryer.
It is found that the vacuum dried samples rehydrated slower than freeze dried samples
for the first 10 minutes, while it is faster after that period. This may be due to the puff
effect on the vacuum dried papaya, which enables it to possess a higher porosity than
freeze dried samples. But its open pores are not as many as in freeze dried papaya.

Chapter 5 Foods quality
72
That can be seen from their SEM. Hence, although it absorbed less water at the
beginning, it had large space to hold them.
Comparison of Freeze dried and Vacuum dried papaya rehydrationat 40 degree
0.0000
1.0000
2.0000
3.0000
4.0000
5.0000
6.0000
0 50 100 150 200
Time (min)
Moi
stur
eco
nten
t(d.
b)
FreezeVacuum
Figure 5-10: Rehydration curve of freeze dried and vacuum dried papaya.
5.4 Texture
Texture is the response of the tactile senses to physical stimuli that result from
contact, between some parts of the body and food products (Bourne, 2002). The
sensory acceptability factors of foods are extremely important because people like to
attain great enjoyment from eating food. For dried foods, firmness is one of the main
considerations of consumers, neither a too hard nor too soft, being satisfying.
Generally, samples dried over a longer period are harder than those dried over a
shorter period because of greater loss of moisture. Hence, the drying time was fixed in
order to consider the influence of other factors on texture.

Chapter 5 Foods quality
73
Table 5-6: Firmness of apples dried by different methods
Methods Concentration (v/v) Firmness--- 210.15±30.35
10% 351.90±55.5130% 484.81±96.9850% 576.35±60.78
Normal Air(4 hrs)
Peel 295.04±58.04--- 117.78±19.94(ad)
10% 136.57±13.75(ab)30% 140.28±33.15(ab)50% 213.18±27.95
CO2(4 hrs)
Peel 117.47±19.62--- 116.16±21.11(cd)
10% 136.45±26.99(cd)30% 136.70±31.22(cd)50% 352.68±113.08
N2(4 hrs)
Peel 121.31±21.89Vacuum (18 hrs) --- 365.68±52.43Freeze (18 hrs) --- 75.62±18.08
Note: Values following sign are standard deviation of 10 replicatesMeans followed by same letter are not significantly different (p<0.05)
Table 5-6 shows the results for apples dried in HPD for 4 hours using normal
air and inert gas. Freeze dried and vacuum dried samples are also included. It is worth
mentioning that, in the same batch, sample firmness varied a lot due to samples being
taken from different parts of the apple. The part near the core was the firmest.
Therefore, it resulted in a large standard deviation. As freeze dried samples is most
porous, its firmness was the lowest. In vacuum drying, the main mode of heat transfer
form is conduction, which is different from HPD and MAHPD. This may contribute
to the relatively high firmness. It was also observed that the firmness of normal air-
dried samples was much higher than that of nitrogen or carbon dioxide dried samples.
The inert gas may have contributed to this change. As stated in last section, the
samples dried by MAHPD were more porous in structure, which means more air
space in the solid. It could bear less force and resulted in less firm products.

Chapter 5 Foods quality
74
Another interesting phenomenon is that when using normal air, firmness
increased as the concentration of lemon juice increased. Similar results were observed
in fresh-cut pear slices (Gorny et al., 2001). A possible reason for this observation is
that the citric acid has changed the structure of the fruits. This conclusion may require
further study.
The firmness value for papaya and guava are summarized in Table 5-7. It also
has a large variance. Secondly, compared with normal air dried papaya or guava
cubes, it is found that all other drying methods increased the firmness of dried
products, which is contradictory to the results for apple. Different factors may
contribute to this. For vacuum drying, conduction may increase firmness. It was
observed that the contact area was harder than the other sides. For freeze drying, some
researcher thought the freeze-thaw process causes the demethylation which results
firming (Main et al., 1986). Inert gases also increase firmness a lot, especially for
nitrogen dried guava. It is suggested there may be some reactions between the
chemicals inside these fruits and inert gas. However, it needs further research.
Table 5-7: Firmness of dried papaya and guava
Drying Methods
MaterialNormal Air Nitrogen Carbon Dioxide Freeze Vacuum
Papaya 169.66±19.03 317.69±42.63 360.30±18.9 266.26±30.84 1073.48±137.84Guava 302.21±21.32 3436.39±194.87 981.36±81.68 669.87±69.53 1525.77±91.40Note: Values following sign are standard deviation of 10 replicates

Chapter 5 Foods quality
75
5.5 Vitamin C
Fresh fruits are rich sources of vitamin A and C besides minerals, which are
considered important for human body. Because of their perishable characteristic, it is
desired to store a long time with minimum loss of nutrients (Jayaraman and Das
Gupta, 1995). The present study showed that, as indicated in Table 5-8, freeze drying
retained the most vitamin C in both papaya and guava (88% and 63%, respectively),
and then vacuum drying is the second. Compared with normal air, carbon dioxide and
nitrogen have better retention. The improvements are considerably greater, though
they are different in guava and papaya. It is because the retention of vitamins depends
on the nature of foods (Jayaraman and Das Gupta, 1995).
As vitamin C is easy to deteriorate in oxidative atmosphere, the first reason for
the improvement in inert gas is that it reduced oxidation. Temperature also affects
vitamin C. Hence, freeze drying has the best results since it is a low-temperature
drying process. However, products retained slightly more vitamin C resulting from
carbon dioxide drying, 82% versus 80% in papaya and 41% versus 39% in guava.
The possible reason is that nitrogen drying has a higher drying rate than carbon
dioxide drying. Hence, the more heat presented the more vitamin C lost.
Table 5-8: Retention of Vitamin C in dried products
Drying methodsMaterialNormal Air CO2 N2 Freeze Vacuum
Papaya 75% 82% 80% 88% 86%Guava 25% 41% 39% 63% 58%

Chapter 5 Foods quality
76
5.6 Pungent Principles Analysis
According to Leverington (1975), and Connell and Sutherland (1969), the
main pungent principles extracted from the rhizomes were 6-gingerol, 8-gingerol, and
10-gingerol, and in terms of pungency 6-gingerol was the most pungent compounds
(Govindarajan, 1979; 1982). Hence, 6-gingerol was chosen to be the index of dried
ginger quality.
Figure 5-11 show the chromatograms of 6-gingerol standard and sample. The
retention time was found to be 16 minutes in standard. Therefore, the area of peak
appeared around 16 minutes in each sample profile were taken to calculate
concentration of samples. The calibration graph for 6-gingerol (Figure 5-12) was
obtained over the range of 20.7 - 82.8 mLg / . The result, by linear regression
analysis, showed a very good linear relationship between peak area and concentration.
(a)

Chapter 5 Foods quality
77
(b)
Figure 5-11: Chromatograms 6-gingerol: (a) Standard (b) Sample
Calibration Graph
y = 5.4562x + 8.41
R2 = 0.99790
100
200
300
400
500
0 20 40 60 80 100
Conc.(μg/mL)
Peak
Are
a
Figure 5-12: The calibration graph of 6-gingerol determined by HPLC assay
Results of ginger sample dried under different conditions are shown in Figure
5-13. It is observed that the amount of 6-gingerol used as an index of retention of

Chapter 5 Foods quality
78
volatiles in ginger dried under different methods of drying increased in the order of
normal air HPD, freeze drying, nitrogen HPD, carbon dioxide HPD and vacuum
drying. However, the difference between nitrogen HPD and carbon dioxide HPD was
not significant at p<0.05. As all other condition were kept the same for heat pump
drying, it is clear that inert atmospheres contributed to greater retention of 6-gingerol
compared to normal HPD drying in air. This may be because of the nature of the
complex mixture of relatively unstable phenolic compounds in ginger, which
undergoes oxidation in air (Denniff et al., 1981). In normal air, oxygen content is
about 20% in volume. Modified environment reduced the oxygen level during drying
periods, which prohibited possible destruction of gingerols. Moreover, gingerol has
acidic methylene protons and are easily dehydrated to produce shogaols (Balladin et
al., 1998; Denniff et al, 1981).
Figure 5-13: Comparison of 6-gingerol content in different dried ginger samples(6-gingerol content is based on mg/g of dry matter)
Note: The values in the graph are the mean values of 3 replicates.The same superscripts over bars means the values are not significantlydifferent (p<0.05).
c cd
0
2
4
6
8
10
12
Normalair
drying
Freezedrying
Nitrogendrying
Carbondioxidedrying
Vacuumdrying
Con
tent
(mg/
g) ab

Chapter 5 Foods quality
79
Gingerols and shogaols undergo the retro-aldol cleavages to form zingerone
and corresponding aldehydes; Zingerone and aldehydes under acidic condition are
condensed to form corresponding gingerols (Young et al., 2002). The reactions are
very complex and pH affects stability of gingerol. Therefore, aside from preventing
oxidation of phenolics, it is assumed that inert gas such as carbon dioxide may form
an acidic environment with the presence of moisture, which helps to reform gingerols,
so the retention of gingerol is slightly higher than in nitrogen HPD dried samples.
Vacuum drying showed the highest retention of 6-gingerol. The chamber of
vacuum dryer, which is made of aluminium, may contribute to this. It eliminated all
the light from ginger slices during drying. Whereas, the chambers of other dryers used
were made of glass, and allowed light to fall on the samples directly. As 6-gingerol is
sensitive to light, this probably accounted for the lower retention of gingerol in dried
products.
Freeze drying is said to be the best way to retain flavour (Liapis and Bruttini,
1995). However, it was not proven in this experiment. The result obtained was only
better than normal air drying, while worse than inert gas drying. Comparing its drying
conditions with those of other methods, freeze drying also reduced oxygen content
and pressure. In particular, for freeze drying, an absolute pressure of less than 4.6
mm of Hg had to be reached, and at such low pressures, perhaps the gingerols were
very volatile and were lost into the vacuum pump. However, the real reason is
uncertain, which needs further research.

Chapter 6 Conclusions
80
CHAPTER 6
CONCLUSIONS
This study focused on modified atmosphere heat pump dryer. Dried product
quality and energy efficiency were investigated. The materials tested include apple,
guava, potato, papaya and ginger. Results were compared with normal air drying,
freeze drying and vacuum drying.
For quality tests, the investigations covered colour, shrinkage, density, porosity,
rehydration, texture, nutrient and flavour. Experimental results showed that the use of
inert gas led to an improvement of product quality. The important findings of this
work are listed as follows:
In terms of optical property, for long time HPD drying of apple, guava and potato
resulted in higher value of h* and L*, which means less browning and more
lighteness. Compared with normal air drying, the improvement in carbon dioxide
and nitrogen atmosphere drying was significant. When using lemon juice as
natural inhibitor of oxidation, 30% (v/v) solution has similar effect as inert gas.
And this could be substituted by lemon peel. Total colour difference of dried
papaya and guava from fresh counterpart was calculated. Nitrogen dried products
had a smaller change than carbon dioxide. For papaya, the colour is even better
than freeze drying.

Chapter 6 Conclusions
81
In structural properties, food such as potato containing less moisture shrunk less
during drying. This led to higher porosity, which also links to particle and bulk
densities. Lower shrinkage and more porous structure were also observed in
MAHPD products. The improvement of porosity is as high as 82.5%. SEMs were
also taken to identify the surface properties. From the picture, it is clearer to see
the difference.
In rehydration study, the more porous products had better rehydration ability. It
absorbed water faster. Higher temperature led to a faster rehydration, but it has
little effect on rehydration capacity.
In textural properties, the results are complex. Apple dried in MAHPD was not so
firm as HPD dried one, whereas, for guava and papaya, inert gas increased
firmness. This may be attributed to the properties of the materials.
In nutritional characteristics, vitamin C retention is generally considered to be an
index of nutrient preservation. If vitamin C was better retained, it is suggested
that the other nutrients will also be preserved. MAHPD provided a better
retention of vitamin C. The vitamin C content in CO2 dried guava is 41% of fresh
one, while only 25% remained in normal air dried guava.
In sensory properties, by using inert gases, ginger flavour (6-gingerol) retention is
much higher than normal air drying. Compared to normal air drying, nitrogen and
carbon dioxide drying led to an increase of flavour by 43.5% and 45.4%,
respectively, even better than freeze drying.

Chapter 6 Conclusions
82
From the energy analysis, it was found that the drying constant, effective
diffusivity increased while COP and energy efficiency decreased a bit when using
inert gas. If the heat rejected by the external condenser could be utilized, it is
probably that the energy efficiency and COP would be increased. SMER did not
change much in this work because the system is very small.
All the analysis justifies an unshakable view that MAHPD did improve the
quality of dried food while not affect energy efficiency much. By using it, the
products owned less browning colour, lower shrinkage, more porosity, different
texture, better retention of nutrients and increased flavour, which are considered
desirable attributes that food industry would like to pursue.

Chapter7 Recommendations
83
CHAPTER 7
RECOMMENDATIONS
This work investigated the differences in final products dried by MAHPD and
suggested some possible improvements.
Further improvements can be made on the heat pump dryer. The current one is
small and manual controlled. A big size and computer controlled one is desired. As
the COP was not satisfactory, the rejected heat of the external condenser can be made
use of in certain way.
Shrinkage here was only visually observed because of the closed system of
MAHPD. It is difficult to measure the parameters needed. If an automatic measuring
tool can be fixed into this system, a model of shrinkage to moisture content can be
established for materials considered in this study.
.

References
84
REFERENCES
Aceves-Saborio, S. Analysis of Energy Consumption in Heat Pump and Conventional
Driers, Heat Recovery System and CHP, Vol. 13, No. 5, pp. 419-428. 1993.
Achanta S. and M.R. Okos. Developments in Drying, ed by A.S. Mujumdar, and
Sirikalaya Suvachittanont, pp.195-203, Thailand: Kasetsart University Press. 2000.
Akiyama, T. and K. Hayakawa. Heat and moisture transfer and hygrophysical
changes in elastoplastic hollow cylinder-food during drying, Journal of Food Science,
Vol. 65, No. 2, pp. 315-323. 2000.
Allen, J.R. Application of Grain Drying Theory to the Drying of Maize and Rice.
Journal of Agriculture Engineering Research, Vol. 5, pp. 363-385. 1960.
Alves-Fiho, O. Combined Innovative Heat Pump Drying Technologies and New Cold
Extrusion Techniques for Production of Instant Food, Drying Technology, Vol. 20,
No. 8, pp. 1541-1557. 2002.
AOAC, Vitamins and Other Nutrients, Official Methods of Analysis of the
Association of Official Analytical Chemists, 14th Edition, ed by Willim S., pp. 838-
841, Virginia: AOAC. 1984.

References
85
Ballandin, D.A., Chang-Yen, I., McGAW, D.R. and O. Headley. Solar Drying of
West Indian Ginger (Zingiber Officinale Roscoe) Rhizome Using a Wire Basket
Dryer. Renewable Energy, Vol. 7, No. 4, pp. 409-418. 1996.
Balladin, D.A., Headley, O., Chang-Yen, I. and D.R. Mcgaw. High Pressure Liquid
Chromatographic Analysis of the Main Pungent Principles of Solar Dried West Indian
Ginger. Renewable Energy, Vol. 13, No. 4, pp. 531-536. 1998.
Bannister, P., Chen, G., Grey, A., Carrington, C. G. and Z. F. Sun. Economic
Reduction of Greenhouse Gas Emissions through Enhanced Dehumidifier Timer
Drying, In proceedings, 19th International Congress of Refrigeration, 1997,
International Institute of Refrigeration, Linz, Austria, pp. 241-249.
Bourne M.C. Food Texture and Viscosity: Concept and Measurement, 2nd Ed. New
York: Academic Press, pp. 400. 2002.
Bourne, M.C. and S.H. Comstock Effect of Temperature on Firmness of Thermally
Processed Fruits and Vegetables. Journal of Food Science, Vol. 51, No. 2, pp. 531-
533. 1986.
Brennan, J.G. Food Dehydrations: a Dictionary and Guide. Oxford: Butterworth-
Heinemann Ltd. 1994.

References
86
Brenndorfer B., Kennedy, L., Oswin Bateman C.O., Trim, D.S., Mrema, G.C. and C.
Wereko-Brobby. Solar Dryers – Their Role in Post-harvesting Processing, London:
Commonwealth Science Council, pp. 4-7. 1985.
Carpenter, J. F., Pikal, M. J., Chang, B. S. and T. W. Tandolph. Rational Design of
Stable Lyophilized Protein Formulations: Some Practical Advice, Pharm. Res., Vol.
14, pp. 969-975. 1997.
Carlson S. Effects of Freeze Drying on Paper, [online] available:
http://palimpsest.stanford.edu/iada/ta99_115.pdf
Chen, W.S. Drying of Materials under Low Pressure Inert Environmental Conditions,
Bachelor Thesis, Thermal Process Lab, Mechanical Engineering, National University
of Singapore. 2002.
Choi, M.H., Lee H.S. and G.H. Kim. Effects of Ascorbic Acid Retention on Juice
Colour and Pigment Stability in Blood Orange (Citrus sinensis) Juice during
Refrigerated Storage. Food Research International, Vol. 35, No. 8, pp. 753-759. 2002.
Chou, S.K. and K.J. Chua. New Hybrid Drying Technologies for Heat Sensitive
Foodstuffs, Trends in Food Science and Technology, Vol. 12, pp. 359-369. 2001.
Chua, K.J., Chou, S.K., Ho, J.C., Mujumdar, A.S. and M. N. A. Hawlader. Cyclic Air
Temperature Drying of Guava Pieces: Effects on Moisture and Ascorbic Acid

References
87
Contents, Transactions of the Institution of Chemical Engineers, Vol. 78, pp. 28-72.
2000.
Chua, K. J., Mujumdar, A. S., Chou, S. K., Hawlader, M. N. A. and J. C. Ho.
Convective Drying of Banana, Guava and Potato Pieces: Effect of Cyclical Variations
of Air Temperature on Drying Kinetics and Colour Change, Drying Technology, Vol.
18, No.4 and 5, pp.907-936. 2000.
Connell, D.W. and M.D. Sugherland. A Re-examination of Gingerol, Shogaol and
Zingerone: the Pungent Principles of Ginger (Zingiber Officinatle Roscoe). Australia
Journal of Chemistry, Vol. 22, pp. 1033-1043. 1969.
Crafts, A.S. Cellular Changes in Certain Fruits and Vegetables during Blanching and
Dehydration, Food Research, Vol. 9, pp. 442-452. 1944.
Crank J. Mathematics of diffusion, 2nd Ed. London: Oxford University Press. 1975.
Denniff, P. and D. Whiting. Biosynthesis of [6]-gingerol, Pungent Principle of
Zingiber officinal Roscoe, Journal of the Chemical Society, pp. 711-713. 1976.
Denniff, P., Macleod, I. and D. Whiting Synthesis of [n]-gingerol, Pungent Principle
of Ginger and Related Compounds through Regioselective Aldol Condensation.
Journal of Chemistry Science, Pekin I, pp. 82-87. 1981.

References
88
Drouzas, A. E. and H. Schubert Microwave Application in Vacuum Drying of Fruits,
Journal of Food Engineering, Vol. 28, No. 2, pp. 203-209. 1996.
Farkas, B. E. and R. P. Singh Physical Properties of Air Dried and Freeze-dried
Chicken White Meat, Journal of Food Science, Vol. 56, pp.611-615. 1991.
Fortes, M. and M.R. Okos, Change in physical properties of corn during drying,
Transactions of ASAE, pp. 1004-1008. 1980.
Govindarajan, V.S. Food Taste Chemistry, ACS Symposium Series 115, pp. 53,
Washington, DC: American Chemical Society. 1979.
Govindarajan, V.S. Ginger –Chemistry, Technology and Quality Evaluation: Part 1,
Crit. Rev. Food Sci. Nutr., Vol. 17, pp. 1-96. 1982.
Handwerk, R.L and R.L. Coleman, Approaches to the Citrus Browning Problem: A
Review. J. Agric. Food. Che., Vol.36, pp. 231-236. 1988.
Hawlader M.N.A., Perera C.O., Tian M. and K. J. Chng. The Properties of Modified
Atmosphere Heat Pump Dried Foods Drying, In Proc of the 14th International Drying
Symposium, Aug 2004, Sao Paulo, Brazil, Vol . A, pp. 309-316.
Hironao Ogura, Tetsuya Yamamoto, Hiroyuki Kage, Yoshizo Matsuno and Arun S.
Mujumdar, Effects of Heat Exchange Condition on Hot Air Production by a Chemical

References
89
Heat Pump Dryer Using CaO/H2O/Ca(OH)2 Reaction, Chemical Engineering Journal,
Vol. 86, pp. 3-10. 2002.
Jayaraman K.S. and D.K. Das Gupta. Drying of Fruits and Vegetables. In Handbook
of Industrial Drying, 2nd Ed., ed by A. S. Mujumdar, New York: Marcel Dekker, Vol.
1, pp. 643-690. 1995.
Jayas D. S., Cenkowski S., Pabis S. and W.E. Muir. Review of the Thin-layer Drying
and Wetting Equations, Drying Technology, Vol.15, pp.183-199. 1991.
Karathanos, V. T., Kanellopoulos, N. K. and V. G. Belessiotis. Development of
Porous Structure during Air Drying of Agricultural Plant Products, Journal of Food
Engineering, Vol. 29, pp. 167-183. 1996.
Kiiskinen, H. T. and K. E. Edelmann. Superheated Steam Drying of Paper Web, Dev.
Chem. Eng. Mineral Process, Vol. 10, No. 3 and 4, pp. 349-365. 2002.
Krokida M.K. and Z.B. Maroulis. Effect of Drying Method on Shrinkage and Porosity,
Drying Technology, Vol. 15, pp. 2441-2458. 1997.
Krokida, M.K., Zogzas, N.P. and Z.B. Maroulis. Modelling Shrinkage and Porosity
during Vacuum Dehydration, International Journal of Food Science and Technology,
Vol. 32, pp. 445-458. 1997.
References
90
Krokida, M. and Z. Maroulis. Chapter 6 Quality Changes during Drying of Food
Materials. In Developments in Drying, Volume II, Drying of Food and Agro-Products,
ed by A. S Mujumdar and S. Suvachittanont, Bangkok, Thailand: Kasetsart
University Press. 2000.
Kudra, T. and C. Strumillo (eds.) Thermal Processing of Bio-materials, pp. 669, The
Netherlands, Amsterdam: Gordon and Breach Sci Publ. 1998.
Langdon T.T. Preventing Browning in Fresh Prepared Potatoes Without the Use of
Sulfiting Agents, Food Technology, Vol. 41, pp. 64-72. 1987.
Leong, L.P. and G. Shui. An Investigation of Antioxidant Capacity of Fruit in
Singapore Markets, Food Chemistry, Vol. 76, pp. 69-75. 2002.
Leverington, R.E. Ginger Technology, Journal of Food Technology in Australia,
August, pp. 309-313. 1975.
Lewis, M.J. Physical Properties of Foods and Food Processing Systems, pp. 51-68,
Chichester: Ellis Horwood. 1987.
Li, K. W. Applied Thermodynamics: Availability Method And Energy Conversion,
pp.245-250, Washington, D.C: Taylor & Francis. 1996.
Liapis, A. I. Freeze-drying, In Handbook of Industrial Drying, ed by A. S. Mujumdar,
New York and Basel: Marcel Dekker, pp.295-326. 1995.

References
91
Luo, D. Moisture Transfer and Nutrient Retention in Guava during Drying and
Storage, MEng Thesis, National University of Singapore. 1997.
Lozano, J.E., Rotstein, E. and M.J. Urbicain. Total Porosity and Open Porosity in the
Drying of Fruits, Journal of Food Science, Vol. 45, pp. 1403-1407. 1980.
Madamba, P.S., Driscoll R.H and K.A. Buckle. Shrinkage, Density and Porosity of
Garlic during Drying, Journal of Food Engineering, Vol. 23, pp. 309-319. 1994.
Main, G.L., Morris, J.R. and E.J. Wehunt. Effect of Preprocessing Treatments on the
Firmness and Quality Characteristics of Whole and Sliced Strawberries after Freezing
and Thermal Processing. Journal of Food Science, Vol. 51, No. 2, pp. 391-394. 1986.
Martinez, M.V. and J.R. Whitaker. The Biochemistry and Control of Enzymatic
Browning, Trends in Food Science and Technology, Vol. 6, pp. 195-200. 1995.
Mason, R., Britnell, P., Young, G., Birchall, S., Fitz-Payne, S. and B. J. Hesse.
Development and Application of Heat Pump Dryers to the Australian Food Industry,
Food Australia, Vol. 46, pp. 319. 1994.
Mayor, L. and A.M. Sereno. Modelling Shrinkage during Convective Drying of Food
Materials: a Review, Journal of Food Engineering, Vol. 61, pp. 373-386. 2004.

References
92
Mattea, M., Urbicain, M.J. and E. Rotstein. Computer Model of Shrinkage and
Deformation of Cellular Tissue during Dehydration, Chemical Engineering Science,
Vol. 44, pp. 2853-2859. 1989.
McEvily, A.J., Iyengar, R. and W.S. Otwell. Inhibition of Enzymatic Browning in
Foods and Beverages, Crit. Rev. Food Sci. Nutr., Vol. 32, pp. 53-237. 1992.
Mcminn, W.A.M., and T.R.A. Magee. Physical Characteristics and Dehydrated
Potatoes— Part I. Journal of Food Engineering, Vol.33, pp. 37-48. 1997a.
Mcminn, W.A.M., and T.R.A. Magee. Physical Characteristics and Dehydrated
Potatoes— Part II, Journal of Food Engineering, Vol.33, pp. 49-55. 1997b.
Mensah, J.K., Nelson, G.L., Herum, F.L., and T.G. Richard. Mechanical Properties
Related to Soybean Seedcoat Cracking during Drying, Transactions of the ASAE, Vol.
27, pp. 550. 1984.
Mujumdar A. S. and O. Alves-Filho. Drying Research- Current State and Future
Trends, Proceedings of the 13th International Drying Symposium, Aug. 2002, Beijing,
China.
Mujumdar A. S. and A. S. Menon. Drying of Solids: Principles, Classifications and
Selection of Dryers. In Handbook of Industrial Drying, 2nd Ed.; ed by A. S. Mujumdar,
Vol. 1, 899-920, New York: Marcel Dekker. 1995.

References
93
Namiki, M. Chemistry of Maillard Reactions: Recent Studies on the Browning
Reaction Mechanism and the Development of Antioxidant and Mutagens. Advances
in Food Research, Vol. 32, pp. 116-170. 1988.
Nijhuis, N. N., Torringa, E., Luyten, H., Rene, F., Jones, P., Funebo, T. and T.
Ohlsson. Research Needs and Opportunities in the Dry Conservation of Fruits and
Vegetables, Drying Technology, Vol. 14, pp. 1429-1457. 1996.
O’Neill, M. B., Rahman, M. S., Perera, C. O., Smith, B. and L. D. Melton. Colour
and Density of Apple Cubes Dried in Air and Modified Atmosphere, International
Journal of Food Properties, Vol. 1, No. 3, pp.197-205. 1998.
O’Neill, M. B. Physicochemical Properties of Dehydrated Apple Pieces, PhD Thesis,
University of Auckland, New Zealand. 2001.
Ong, B.K. Modified atmosphere heat pump drying, Bachelor Thesis, Thermal Process
Lab, Mechanical Engineering, National University of Singapore. 2003.
Özoğlu, H. and A. Bayındırlı. Inhibition of Enzymic Browning in Cloudy Apple Juice
with Selected Antibrowning Agents. Food Control, Vol. 13, pp. 213-221. 2002.
Page, G.E., Factors influencing the maximum rates of air drying shelled corn in thin
layers. M. Sc. Thesis, USA. Purdue University, Iniana. 2003.

References
94
Pappas C., Tsami E. and K. D. Marinos. The Effect of Process Conditions on the
Drying Kinetics and Rehydration Characteristics of Some Mw-Vacuum Dehydrated
Fruit, Drying Technology, Vol. 17, No. 1 and 2, pp.157-174. 1999.
Pendyala, V.R., Devotta, S. and V.S. Patwardhan. The Economics of Heat Pump
Assisted Drying Systems, Heat Recovery Systems, Vol. 6, No. 6, pp.433-442. 1986.
Perera, C.O. Modified Atmosphere Heat Pump Drying of Food Products, In Proc. 2nd
Asia-Oceania Drying Conference, ed by Daud et al., pp.469-476. 2001.
Perera, C.O. and M.S. Rahman. Heat Pump Dehumidifier Drying, Trends of Food
Science and Technology, Vol. 8, pp. 75. 1997.
Pikal, M.J. Freeze-drying of Proteins, Part 1: Process Design, BioPharm, Vol. 3,
pp.18-27. 1990.
Plztzer, B., Polt, A.W. and G. Maurer Thermophysical Properties of Refrigerant, pp.
173-206, Berlin Heidelberg New York: Springer-Verlag. 1990.
Prasertsan, S. and P. Saen-saby. Heat Pump Drying of Agricultural Materials, Drying
Technology, Vol. 16, No.1 and 2, pp. 235-250. 1998.
Purseglove, J.W. Tropical Crops-Monocotyledons 2, London: Longman. 1972.

References
95
Rahman S. Chapter 3. Physical Properties of Food. In Food Properties Handbook, pp.
179-224, Boca Raton: CRC Press. 1995.
Rahman, M.S., Perera, C.O., Chen, X.D., Driscoll, R.H., and P.L. Potluri. Density,
Shrinkage and Porosity of Calamari Mantle Meat during Air Drying in a Cabinet
Dryer as a Function of Water Content, Journal of Food Engineering, Vol. 30, pp. 135-
145. 1996.
Ramos, I.N., Silva, C.L.M, Sereno A. M. and J.M. Aguilera. Kinetic Study on
Microstural Changes during Convective Air Drying of Grapes. In Proceedings of the
13th International Drying Symposium. August 2002, Beijing, China.
Rao, M. A. and S. S. H. Rizvi. Engineering Properties of Foods. pp. 133-214, New
York: Marcel Dekker. 1986.
Reeve, R.M. A Microscopic Study of the Physical Changes in Carrots and Potatoes
during Dehydration, Food Research, Vol. 8, pp.128-136. 1943.
Rosen, H.N. Drying of Wood and Wood Products, In Handbook of Industrial Drying,
ed by A. S. Mujumdar, , pp.683-710, New York: Marcel Dekker. 1995
Rossi, S.J., Neues, I.C., and T.G. Kicokbusch. Thermodynamics and Energetic
Evaluation of a Heat Pump Applied to Drying of Vegetables. In Drying 92, ed by A. S.
Mujumdar, pp.1475-1483, Amsterdam: Elsevier Science. 1992.

References
96
Sapers, G.M., and K.B. Hicks. Inhibition of Enzymatic Browning in Fruits and
Vegetables, In Quality Factors of Fruits and Vegetables: Chemistry and Technology,
ed by J. J. Jen, ACC Symp., Series 405, pp. 29-43. Washington, DC: Chemistry
Society. 1989
Saravacos, G.D. Technological Developments in Fruit and Vegetable Dehydration. In:
Food Flavour, Ingredients and Composition, ed by G. Charalambous. pp. 389 404.
London: Elsevier Science. 1993.
Saravacos, G.D., Tsami, E. and D. Marinos-Kouris. Effect of Water Activity on the
Volatile Components of Dried Fruits, In Mechanisms of Action of Food Preservation
Procedures, ed by G. W. Gould, pp. 347-356, New York: Elsevier. 1988.
Schubert, H. Food Particle Technology, Part I: Properties of Particles and Particulate
Food Systems, Journal of Food Science, Vol. 41, pp. 1189-1193. 1987.
Sokhansanj, S. and D.S. Jayas. Drying of Foodstuffs. In Handbook of Industrial
Drying, ed by A.S. Mujumdar, pp. 517-554. New York: Marcel Dekker. 1987.
Son, S.M., Moon, K.D. and C.Y. Lee. Inhibitory Effects of Various Antibrowning
Agents on Apple Slices, Food Chemistry, Vol. 73, pp. 23-30. 2001.
Stewart, J.J., Wood, M.J., Wood, C.D. and M.E. Mims. Effect of Ginger on Motion
Sickness Susceptibility and Gastric Function. Pharmacology, Vol. 42, No. 2, pp. 111-
120. 1991.
References
97
Strømmen, I. and K. Kramer. New Applications of Heat Pumps in Drying Processes,
Drying Technology, Vol. 12, No. 4, pp.889-901. 1994.
Strømmen I., Eikevik T. M., Alves-Filho O., Syverud K. and O. Jonassen. Low
Temperature Drying with Heat Pumps - New Generations of High Quality Dried
Products, In 13th International Drying Symposium, Aug. 2002, Beijing, China. KNL-
02.
Suzuki, K., Kubota, K. Hasegawa, T. and H. Hosaka. Shrinkage in Dehydration of
Root Vegetables, Journal of Food Science, Vol. 41, pp. 1189-1193. 1976.
Taechapairoj, C., Dhuchakallaya, I., Soponronnarit, S., Wetchacama, S. and S.
Prachayawarakorn. Superheated steam fluidized bed paddy drying, Journal of Food
Engineering, Vol. 58, pp.67-73. 2003.
Tang, Z., Cenkowski, S. and W. E. Muir. Dehydration of sugar beet pulp in
superheated steam and hot air, Trans. ASAE, Vol. 43, No. 3, pp. 685-689. 2000.
Tang, Z. and S. Cenkowski. Dehydration Dynamics of Potatoes in Superheated Steam
and Hot Air, Canadian Agricultural Engineering, Vol. 42, No.1, pp.43-39. 2000.
Teeboonma, U., Tiansuwan, J. and S. Soponronnarit. Optimization of Heat Pump
Fruit Dryers, Journal of Food Engineering, Vol. 59, pp.369-377. 2003.

References
98
Uddin, M.S., Hawlader, M.N.A., Luo, D. and A.S. Mujumdar. Degradation of
Ascorbic Acid in Dried Guava during Storgae, Journal of Food Engineering, Vol. 51,
pp. 21-26. 2002.
Uddin, M.S., Hawlader, M.N.A. and H. Xiang. A Comparative Study of Heat Pump,
Microwave and Freeze Drying of Fruits, In Proc of the 14th International Drying
Symposium, Aug 2004, Sao Paulo, Brazil, Vol . A, pp.22 -24.
Vaccarezza L.M. and J. Chirife. On the Application of Fick’s Law for the Kinetic
Analysis of Air Drying of Food, Journal of Food Science, Vol. 43, pp. 236-238. 1978.
Van Arsdel W.B. and M. J. Copley. Food Dehydration. Westport, Connecticut: AVI
Pulishing. 1963.
Vagenas, G.K. Marinos-Kouris D. and G.D. Saravacos. Thermal properties of raisins,
Journal of Food Engineering, Vol. 11, pp. 147-158. 1990.
Wang, N. and J.G. Brennan. Changes in Structure, Density and Porosity of Potato
during Dehydration, Journal of Food Engineering, Vol. 24, pp. 61-76. 1995.
Webb, P.A. An Introduction to the Physical Characterization of Materials by Mercury
Intrusion Porosimetery with Emphasis on Reduction and Presentation of Experimental
Data. Micromeritics Instrument Corp. Norcross, Georgia, 2000.

References
99
White, K.L. and L.N. Bell. Glucose Loss and Maillard Browning in Solids as
Affected by Porosity and Collapse, Journal of Food science, Vol. 64, No. 6, pp. 1010-
1014. 1999.
Wyszecki, G and W.S. Stiles. The CIE Colorimetric System. In Colour Science:
Concepts and Methods, Quantitative Data, and Formulae. New York: John Wiley &
Sons. 2000.
Xiang, H. Heat Pump, Microwave and Freeze Drying of Fruits. MEng Thesis,
National University of Singapore. 2001.
Young, H.Y., Chiang, C.T., Huang, Y.L., Pan, F.P. and G.L. Chen. Analytical and
Stability Studies of Ginger Preparations, Journal of Food and Drug Analysis, Vol. 10,
No. 3, pp. 149-153. 2002.
Zhong, T. and M. Lima. The Effect of Ohmic Heating on Vacuum Drying Rate of
Sweet Potato Tissue, Bioresource Technology, Vol. 87, pp.215-220. 2003.
Zogzas, N.P., Maroulis Z.B. and D. Marinos-Kouris. Density, Shrinkage and Porosity
of Some Vegetables during Air Drying, Drying Technology, Vol. 12, pp. 1653-1666.
1994.

Appendices
100
Appendices
Appendix A: Determination of Vitamin C
Introduction
This method again relies on the reduction of the dye 2, 6-dichlorophenol-indophenol
in aqueous solution by the vitamin C (ascorbic acid). Indophenol is blue in neutral and
alkaline solutions but pink in acid. Vitamin C is a reducing agent and will decolorize
the dye. Thus, taking a standard amount of the dye and measuring the vitamin C
content of the solution.
Materials
Indophenol solution (already prepared): This contains 0.0162g in 1L of water. Acetic
Acid (10%) (already prepared from 100ml of glacial acetic acid in 1L of water).
Standard vitamin C solution (already prepared): This contain 0.015g of vitamin C in
1L of acetic acid.
Method
Standardisation of the dye solution
Pipette 25ml of the dye solution into 250ml conical flask. Fill a burette with the
standard vitamin C solution and run into the dye solution. At first the dye will go
pink and then decolorize. Note the volume of vitamin C to decolourise the dye.
You are advised to do a rough titration first and then repeat at least twice until you
obtain two readings that are no more than 0.1ml different from each other.

Appendices
101
Determination of Vitamin C in samples
Get some juice from the sample and filter it. Take 2.0ml of juice and dilute to
50ml with the 10% acetic acid. Place this solution in the burette. Now take a 25ml
portion of the dye solution and titrate against the solution in the burette. Calculate
the value of vitamin C in the lemon.
Repeat the above but using the vitamin C supplement, take 25ml of stock provided
and dilute to 250ml accurately with 10% of acetic acid. Place this solution in the
burette and titrate with the dye as above.

Appendices
102
Appendix B: Data of Heat Pump Drying Experiment
Table B - 1: Heat pump drying of guava
Time (min) Normal Air(g) Nitrogen(g) Carbon Dioxide(g)0 100.00 100.20 99.8530 87.85 92.63 88.2160 84.68 80.85 79.2090 74.66 71.09 70.02120 67.57 61.49 63.82150 61.64 55.77 56.94180 61.89 48.45 51.07210 52.63 42.31 45.89240 50.04 35.83 38.41270 44.61 31.20 35.61300 41.27 29.26 31.62330 38.35 25.73 27.56360 36.27 23.63 26.87390 33.43 20.34 24.20420 30.51 17.90 20.74450 26.33 13.34 19.26480 24.33 11.32 17.34
Table B - 2: Heat pump drying of papaya
Time (min) Normal Air(g) Nitrogen(g) Carbon Dioxide(g)0 116.45 118.18 105.4930 92.61 99.94 91.2860 82.69 86.29 80.9790 77.00 74.48 71.80120 69.36 69.67 64.00150 60.31 60.81 56.96180 55.17 53.74 52.90210 53.42 52.24 47.08240 49.23 47.24 44.59270 42.63 43.84 41.28300 41.28 40.16 37.12330 38.38 37.50 34.99360 34.16 34.48 31.53390 32.77 31.91 30.52420 29.97 30.69 27.97450 26.15 27.94 25.76480 24.74 25.94 21.39

Appendices
103
Table B - 3: Heat pump drying of ginger
Time (min) Normal Air (g) Nitrogen (g) Carbon Dioxide (g)0 98.57 94.86 99.7530 90.05 82.32 90.1260 80.80 76.61 81.2190 72.89 68.11 68.23120 67.75 64.04 63.23150 61.47 60.31 59.35180 55.30 52.44 51.46210 49.87 47.28 45.34240 43.18 42.08 41.35270 38.29 37.56 35.35300 33.98 32.08 30.35330 28.98 27.57 27.04360 26.71 24.47 24.35390 23.81 23.26 23.21420 21.36 20.35 21.37450 19.35 18.33 17.65480 16.80 14.32 15.23
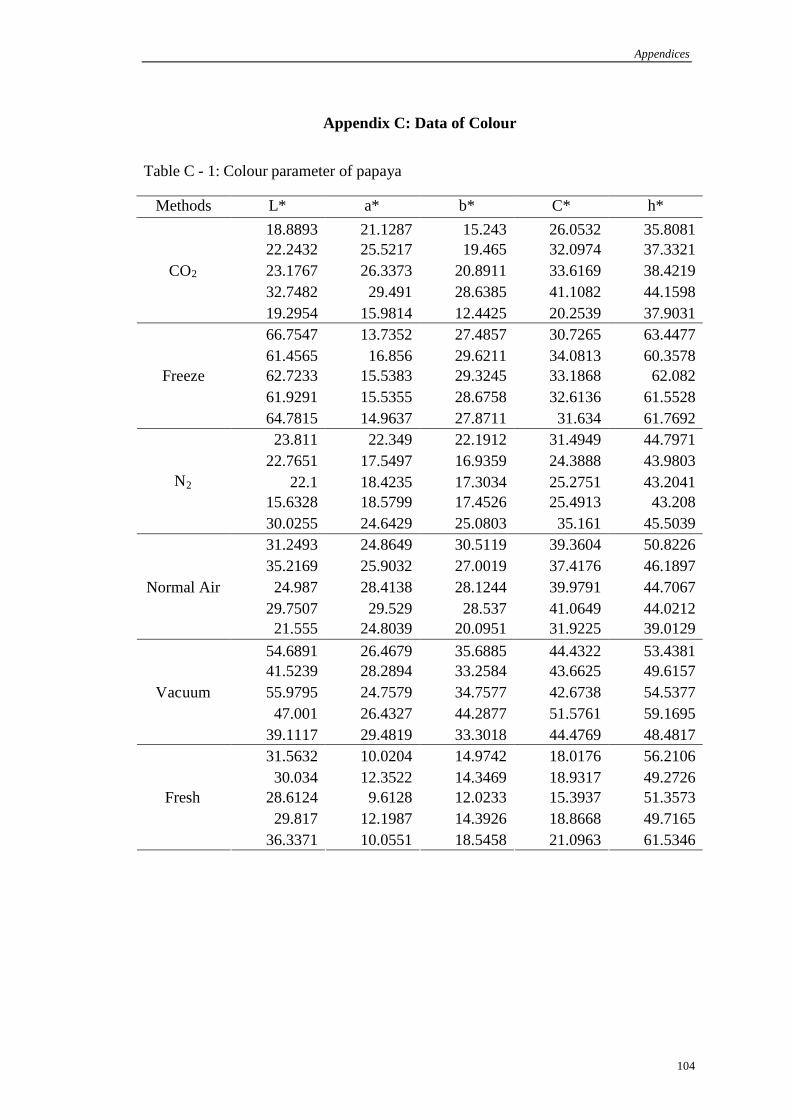
Appendices
104
Appendix C: Data of Colour
Table C - 1: Colour parameter of papaya
Methods L* a* b* C* h*18.8893 21.1287 15.243 26.0532 35.808122.2432 25.5217 19.465 32.0974 37.332123.1767 26.3373 20.8911 33.6169 38.421932.7482 29.491 28.6385 41.1082 44.1598
CO2
19.2954 15.9814 12.4425 20.2539 37.903166.7547 13.7352 27.4857 30.7265 63.447761.4565 16.856 29.6211 34.0813 60.357862.7233 15.5383 29.3245 33.1868 62.08261.9291 15.5355 28.6758 32.6136 61.5528
Freeze
64.7815 14.9637 27.8711 31.634 61.769223.811 22.349 22.1912 31.4949 44.7971
22.7651 17.5497 16.9359 24.3888 43.980322.1 18.4235 17.3034 25.2751 43.2041
15.6328 18.5799 17.4526 25.4913 43.208N2
30.0255 24.6429 25.0803 35.161 45.503931.2493 24.8649 30.5119 39.3604 50.822635.2169 25.9032 27.0019 37.4176 46.189724.987 28.4138 28.1244 39.9791 44.7067
29.7507 29.529 28.537 41.0649 44.0212Normal Air
21.555 24.8039 20.0951 31.9225 39.012954.6891 26.4679 35.6885 44.4322 53.438141.5239 28.2894 33.2584 43.6625 49.615755.9795 24.7579 34.7577 42.6738 54.537747.001 26.4327 44.2877 51.5761 59.1695
Vacuum
39.1117 29.4819 33.3018 44.4769 48.481731.5632 10.0204 14.9742 18.0176 56.210630.034 12.3522 14.3469 18.9317 49.2726
28.6124 9.6128 12.0233 15.3937 51.357329.817 12.1987 14.3926 18.8668 49.7165
Fresh
36.3371 10.0551 18.5458 21.0963 61.5346

Appendices
105
Table C - 2: Colour parameter of guava
Method L* a* b* c* h*53.8 10.46 35.07 36.59 73.3958.99 3.83 26.86 27.13 81.8953.24 7.46 31.67 32.53 76.7457.82 10.06 35.99 37.37 74.39
Normal Air
59.47 10.54 33.53 35.15 72.5551.93 8.24 33.36 34.36 76.1249.87 7.2 25.94 26.92 74.4956.31 5.16 25.43 25.95 78.5362.15 3.53 19.08 19.4 79.51
CO2
66.08 4.42 28.91 29.25 81.362.29 3.36 20.68 20.95 80.7653.63 3.9 24.08 24.4 80.7962.09 3.67 22.39 22.69 80.751.7 3.86 22.21 22.55 80.15
N2
58.72 4.96 24.7 25.19 78.6581.68 -0.17 8.62 8.62 91.1479.72 -0.37 7.06 7.07 92.9682.96 -0.43 8.88 8.89 92.7982.36 -0.34 7.92 7.93 92.42
Freeze
79.49 -0.52 9.44 9.45 93.1663.94 6.16 31.17 31.77 78.8357.04 7.64 31.14 32.07 76.2258.75 7.41 32.99 33.81 77.3556.86 7.75 32.51 33.42 76.6
Vacuum
53.45 6.69 29.39 30.14 77.1867.22 -1.13 6.19 6.29 100.3563.24 -0.64 5.03 5.07 97.2467.13 -0.86 5.64 5.7 98.6568.88 -0.57 4.38 4.42 97.42
Fresh
64.42 -0.71 5.46 5.51 97.43

Appendix
106
Appendix D: Data of Rehydration
Rehydration of dried papaya at 40 degree
0.0000
1.0000
2.0000
3.0000
4.0000
5.0000
6.0000
7.0000
0 20 40 60 80 100
Time (mins)
Moi
stur
eco
nten
t(d.
b)
Carbon DioxideNitrogenNormal Air
Figure D - 1: Rehydration of dried Papaya at 40°C
Rehydration of dried papaya at 60 degree
0.0000
1.0000
2.0000
3.0000
4.0000
5.0000
6.0000
7.0000
0 20 40 60 80
Time (mins)
Moi
stur
e(d
.b)
Carbon DioxideNitrogenNormal Air
Figure D - 2: Rehydration of dried papaya at 60 °C

Appendix
107
Rehydration of dried papaya at 80 Degree
0.0000
1.0000
2.0000
3.0000
4.0000
5.0000
6.0000
7.0000
0 20 40 60
Time (mins)
Moi
sture
cont
ent(
d.b)
Carbon DioxideNitrogenNormal Air
Figure D - 3: Rehydration of dried papaya at 80 °C
Rehydration of vacuum dried papaya
0
1
2
3
4
5
6
0 50 100 150 200
Time(mins)
Moi
sture
cont
ent(
d.b)
40 Degree
60 Degree80 Degree
Figure D - 4: Rehydration of vacuum dried papaya

Appendix
108
Rehydration of freeze dried papaya
0
1
2
3
4
5
0 50 100 150 200
Time(mins)
Moi
stur
eco
nten
t(d.b
)
40 Degree60 Degree80 Degree
Figure D - 5: Rehydration of freeze dried papaya
Rehydration curve for vacuum-dried guava
00.5
11.5
22.5
33.5
4
0 50 100 150
Time of rehydration (min)
Moi
sture
cont
ent(
g/g
dry)
40°C 60°C 80°C
Figure D - 6: Rehydration curve for vacuum-dried guava

Appendix
109
Rehydration curve for normal air-dried guava
00.5
11.5
22.5
33.5
4
0 50 100 150
Time of rehydration (min)
Moi
sture
cont
ent(
g/g
db)
40°C 60°C 80°C
Figure D - 7: Rehydration curve for normal air-dried guava
Rehydration curve for nitrogen-dried guava
0
0.51
1.5
2
2.53
3.5
0 50 100 150 200
Time of rehydration (min)
Moi
stur
eco
nten
t(g/g
db)
40°C 60°C 80°C
Figure D - 8: Rehydration curve for nitrogen-dried guava

Appendix
110
Rehydration curve for carbon dioxide-dried guava
00.5
11.5
22.5
33.5
0 50 100 150 200
Time of rehydration (min)
Moi
stur
eco
nten
t(g/
gdb
)
40°C 60°C 80°C
Figure D - 9: Rehydration curve for carbon dioxide-dried guava
Related Documents