BUILDING RESILIENCE FOR PEACE AND FOOD SECURITY THE STATE OF FOOD SECURITY AND NUTRITION IN THE WORLD 2017

Welcome message from author
This document is posted to help you gain knowledge. Please leave a comment to let me know what you think about it! Share it to your friends and learn new things together.
Transcript

BUILDING RESILIENCE FOR PEACE AND FOOD SECURITY
THE STATE OF FOOD SECURITY
AND NUTRITION IN THE WORLD
2017
GAFATI, NIGERA mother and her son cultivating the family farmland and planting groundnuts. ©FAO/Andrew Esiebo
COVER PHOTOGRAPH
The designations employed and the presentation of material in this information product do not imply the expression of any opinion whatsoever on the part of the Food and Agriculture Organization of the United Nations (FAO), the International Fund for Agricultural Development (IFAD), the United Nations Children’s Fund (UNICEF), the World Food Programme (WFP) or the World Health Organization (WHO) concerning the legal or development status of any country, territory, city or area or of its authorities, or concerning the delimitation of its frontiers or boundaries. The mention of specific companies or products of manufacturers, whether or not these have been patented, does not imply that these have been endorsed or recommended by FAO, IFAD, UNICEF, WFP or WHO in preference to others of a similar nature that are not mentioned.
The designations employed and the presentation of material in the maps do not imply the expression of any opinion whatsoever on the part of FAO, IFAD, UNICEF, WFP or WHO concerning the legal or constitutional status of any country, territory or sea area, or concerning the delimitation of frontiers.
All reasonable precautions have been taken by FAO, IFAD, UNICEF, WFP and WHO to verify the information contained in this publication. However, the published material is being distributed without warranty of any kind, either expressed or implied. The responsibility for the interpretation and use of the material lies with the reader. In no event shall FAO, IFAD, UNICEF, WFP and WHO be liable for damages arising from its use.
ISBN 978-92-5-109888-2
FAO, IFAD, UNICEF, WFP and WHO encourage the use, reproduction and dissemination of material in this information product. Except where otherwise indicated, material may be copied, downloaded and printed for private study, research and teaching purposes, or for use in non-commercial products or services, provided that appropriate acknowledgement of FAO as the source and copyright holder is given and that FAO’s, IFAD’s, UNICEF’s, WFP’s or WHO’s endorsement of users’ views, products or services is not implied in any way.
All requests for translation and adaptation rights, and for resale and other commercial use rights should be made via www.fao.org/contact-us/licence-request or addressed to [email protected].
FAO information products are available on the FAO website (www.fao.org/publications) and can be purchased through [email protected].
© FAO 2017
REQUIRED CITATION:FAO, IFAD, UNICEF, WFP and WHO. 2017. The State of Food Security and Nutrition in the World 2017. Building resilience for peace and food security. Rome, FAO.

Food and Agriculture Organization of the United NationsRome, 2017
2017THE STATE OF FOOD SECURITY
AND NUTRITION IN THE WORLD
BUILDING RESILIENCE FOR PEACE ANDFOOD SECURITY

| ii |
KEY MESSAGES
The 2030 Agenda for Sustainable Development and the UN Decade of Action on Nutrition 2016–2025 call on all countries and stakeholders to act together to end hunger and prevent all forms of malnutrition by 2030.
This year’s edition of The State of Food Security and Nutrition in the World marks the beginning of a regular monitoring of progress towards achieving the food security and nutrition targets set by the 2030 Agenda.
In 2016 the number of chronically undernourished people in the world is estimated to have increased to 815 million, up from 777 million in 2015 although still down from about 900 million in 2000.
After a prolonged decline, this recent increase could signal a reversal of trends. The food security situation has worsened in particular in parts of sub-Saharan Africa, South-Eastern Asia and Western Asia, and deteriorations have been observed most notably in situations of conflict and conflict combined with droughts or floods.
The apparent halt to declining hunger numbers is not yet reflected in the prevalence of child stunting, which continues to fall, though the pace of improvement is slower in some regions.
Globally, the prevalence of stunting fell from 29.5 percent to 22.9 percent between 2005 and 2016, although 155 million children under five years of age across the world still suffer from stunted growth.
Wasting affected one in twelve (52 million) of all children under five years of age in 2016, more than half of whom (27.6 million) live in Southern Asia.
Multiple forms of malnutrition coexist, with countries experiencing simultaneously high rates of child undernutrition, anaemia among women, and adult obesity. Rising rates of overweight and obesity add to these concerns. Childhood overweight and obesity are increasing in most regions, and in all regions for adults. In 2016, 41 million children under five years of age were overweight.
The number of conflicts is also on the rise. Exacerbated by climate-related shocks, conflicts seriously affect food security and are a cause of much of the recent increase in food insecurity.
Conflict is a key driver of situations of severe food crisis and recently re-emerged famines, while hunger and undernutrition are significantly worse where conflicts are prolonged and institutional capacities weak.
Addressing food insecurity and malnutrition in conflict-affected situations cannot be “business as usual”. It requires a conflict-sensitive approach that aligns actions for immediate humanitarian assistance, long-term development and sustaining peace.
This report sends a clear warning signal that the ambition of a world without hunger and malnutrition by 2030 will be challenging – achieving it will require renewed efforts through new ways of working.
| iii |
CONTENTS
KEY MESSAGES iiFOREWORD viACKNOWLEDGEMENTS viii
PART 1FOOD SECURITY AND NUTRITION AROUND THE WORLD IN 2017 1After a prolonged decline, world hunger appears to be on the rise again 2
Child undernutrition continues to decline, but levels of overweight are increasing 2A new era: food security and nutrition in the 2030 Agenda for Sustainable Development 3
Recent trends in hunger and food insecurity 4Prevalence of severe food insecurity in the population, based on the FIES 9
Trends in all forms of malnutrition 13Towards an integrated understanding of food security and nutrition 21
Strengthening the evidence base to monitor food security and nutrition 25
Progress has slowed, new concerns have emerged 27
PART 2CONFLICT, FOOD SECURITY AND NUTRITION: THE IMPERATIVE OF SUSTAINABLE PEACE 29Why focus on the nexus between conflict, food security and nutrition? 30How does conflict affect food security and nutrition? 39Can food insecurity and undernutrition trigger conflict? 52The role of food security and nutrition in sustaining peace 60Overall recommendations 73
ANNEX 1 76Methodological notes 95
ANNEX 2 102Definitions and lists of country groups 102
ANNEX 3 107Glossary 107
NOTES 109
| iv |
TABLES, FIGURES AND BOXES
TABLES
1. Prevalence of undernourishment in the world by region, 2000–2016 6
2. Percentage and number of people affected by severe food insecurity, measured using the FIES (2014–16) 9
3. Relationship between prevalence of undernourishment (PoU) and malnutrition indicators 25
4. Conflict and climate-related shocks associated with food crisis situations in 2016 40
A1.1. Progress towards the Sustainable Development Goals (SDGs): prevalence of undernourishment, severe food insecurity, selected forms of malnutrition, and exclusive breastfeeding 76
A1.2. Progress towards the Sustainable Development Goals (SDGs): number of people who are affected by undernourishment, severe food insecurity and selected forms of malnutrition, and number of infants exclusively breastfed 86
A2.1. Countries and territories affected by conflict and/or protracted crisis 103
A2.2. Countries with protracted crises, by conflict type, intensity, duration and frequency of natural disasters 105
A2.3. Low- and middle-income countries and territories affected by conflict 106
FIGURES
1. The number of undernourished people has been on the rise since 2014, reaching an estimated 815 million in 2016 5
2. The prevalence of undernourishment is highest in Africa; the absolute number of undernourished people is largest in Asia 7
3. Women are slightly more likely to be food insecure than men in every region of the world 11
4. Rates of stunting among children are on the decline worldwide, but remain very high in most parts of Africa 15
5. Rates of child wasting remain inordinately high in some regions, especially in Southern Asia 16
6. Childhood overweight is on the rise in virtually all regions 18
7. Adult obesity is rising everywhere at an accelerating pace 20
8. Anaemia among women of reproductive age is a persistent problem 20
9. Exclusive breastfeeding has increased dramatically in many countries, yet remains below desired levels 22
10. Most countries experience multiple forms of malnutrition 24
11. Among high- and upper-middle-income countries, adult obesity rates are higher where the prevalence of severe food insecurity is comparatively higher 26
12. Marked increase in the number of conflicts since 2010 32
13. Most conflicts cross borders and are regional in nature 34
14. The majority of chronically food-insecure people live in countries affected by conflict 36
15. The majority of stunted children under five years live in countries affected by conflict 36

| v |
16. Food insecurity is higher when conflict is compounded by fragility and protracted crisis 37
17. The group of countries affected by conflict did not meet the MDG target of halving the rate of undernourishment 38
18. Conflict and the consequent food crises led to widespread displacement of more than 15 million people in 2016 47
19. Countries affected by conflict have lower socio-economic status 53
20. Sudden food price surges have triggered food riots and protests in more than 40 countries 55
21. The likelihood of conflict increases with the length of drought periods 58
22. Sectors of importance to building resilience are underfunded in protracted crisis contexts 71
BOXES
1. Revision of prevalence of undernourishment (PoU) estimates and projections for 2016 4
2. Additional evidence on where food insecurity is on the rise 8
3. The Food Insecurity Experience Scale: origins and indicators 10
4. Comparison of estimates for PoU and severe food insecurity based on the FIES 12
5. United Nations Decade of Action on Nutrition 14
6. Complex, multidimensional and prolonged conflicts and extreme fragility: the case of protracted crises 31
7. South Sudan – crisis in agriculture, food systems and public health 42
8. Yemen – conflict, economic collapse, and the destruction of rural and urban livelihoods 45
9. Syrian refugees – stories of lost livelihoods and desperation 48
10. Lebanon – economic strain and public health challenges in countries hosting Syrian refugees 49
11. Pastoralism in East Africa – breakdown of traditional systems and environmental degradation 51
12. The Arab Spring and sharp increases in food prices 56
13. Severe drought contributed to a worsening of the conflict in the Syrian Arab Republic 57
14. Eviction and dispossession of natural resources and land in Colombia 59
15. Building resilience to conflict 63
16. Northern Uganda – investing in peace, improved food security and nutrition 72
17. The need for more and better research and analysis 75
FOREWORDFOREWORD
The transformational v ision of the 2030 Agenda for Sustainable Development calls on all countries and stakeholders to work together to end hunger and prevent all forms of malnutrition by 2030. This ambition can only be fulf il led if agriculture and food systems become sustainable, so that food supplies are stable and all people have access to adequate nutrition and health. The start of the 2030 Agenda coincided with the launch of the United Nations Decade of Action on Nutrition (2016–2025), adding impetus to these commitments by providing a time-bound, cohesive framework for action.
This year’s edition of The State of Food Security and Nutrition in the World marks the beginning of a new era in monitoring the progress made towards achieving a world without hunger and malnutrition, within the framework of the Sustainable Development Goals (SDGs). Specifically, the report will henceforth monitor progress towards both the targets of ending hunger (SDG Target 2.1) and all forms of malnutrition (SDG Target 2.2). It will also include thematic analyses of how food security and nutrition are related to progress on other SDG targets. Given the broadened scope to include a focus on nutrition, UNICEF and the World Health Organization (WHO) have joined the traditional partnership of FAO, IFAD and WFP in preparing this annual report. We hope our expanded partnership will result in a more comprehensive and integral understanding of what it will take to end hunger and all forms of malnutrition, and in more-integrated actions to achieve this critical goal.
The challenges we face are significant. As shown in Part 1 of the report, a key
worrisome finding is that after a prolonged decline, the most recent estimates indicate that global hunger increased in 2016 and now affects 815 million people. Moreover, although still well below levels of a decade ago, the percentage of the global population estimated to be suffering from hunger also increased in 2016. In parts of the world, this recent surge in hunger reached an extreme level, with a famine declared in areas of South Sudan in early 2017 and alerts of high risk of famine issued for three other contexts (northeast Nigeria, Somalia and Yemen).
In 2016, the food security situation deteriorated sharply in parts of sub-Saharan Africa, South-Eastern Asia and Western Asia. This was most notable in situations of conf lict, in particular where the food security impacts of conf lict were compounded by droughts or f loods, linked in part to the El Niño phenomenon. However, worsening food security conditions have also been observed in more peaceful settings, especially where economic slowdown has drained foreign-exchange and fiscal revenues, affecting both food availability through reduced import capacity and food access through reduced fiscal space to protect poor households against rising domestic food prices.
The rising trend in undernourishment has not yet been reflected in rates of child stunting, which continue to fall. Nonetheless, the world is still home to 155 million stunted children. Levels of child stunting are still unacceptably high in some regions, and if current trends continue, the SDG target on reducing child stunting by 2030 will not be reached. Wasting also continues to threaten the lives of almost 52 million children (8 percent of children under five years of age), while childhood overweight
| vi |

and obesity rates are on the rise in most regions and in all regions for adults – all of which highlights the multiple burden of malnutrition as a cause for serious concern.
The failure to reduce world hunger is closely associated with the increase in conflict and violence in several parts of the world. Part 2 of this year’s report attempts to provide a clearer understanding of the nexus between conflict and food security and nutrition, and to demonstrate why efforts at fighting hunger must go hand-in-hand with those to sustain peace. Over the past decade, conflicts have risen dramatically in number and become more complex and intractable in nature. Some of the highest proportions of food-insecure and malnourished children are found in countries affected by conflict, a situation that is even more alarming in countries characterized by prolonged conflicts and fragile institutions. This has set off alarm bells we cannot afford to ignore: we will not end hunger and all forms of
malnutrition by 2030 unless we address all the factors that undermine food security and nutrition. Securing peaceful and inclusive societies (SDG 16) is a necessary condition to that end.
We are more determined and committed than ever to step up concerted action to fulfil the ambitions of the 2030 Agenda and achieve a world free from hunger, malnutrition and poverty. Ending hunger and all forms of malnutrition is an ambitious goal, but it is one we strongly believe can be reached if we strengthen our common efforts and work to tackle the underlying causes that leave so many people food-insecure, jeopardizing their lives, futures, and the futures of their societies. It is clear that conflict is a significant challenge to meeting this goal and will require multisector humanitarian, development and peace strategies that address immediate needs while making the necessary investments to build resilience for lasting peace and food security and nutrition for all.
José Graziano da SilvaFAO Director-General
David BeasleyWFP Executive Director
Gilbert F. HoungboIFAD President
Anthony LakeUNICEF Executive Director
Tedros Adhanom GhebreyesusWHO Director-General
| vii |
ACKNOWLEDGEMENTS
The State of Food Security and Nutrition in the World 2017 was jointly prepared by the Food and Agriculture Organization of the United Nations (FAO), the International Fund for Agricultural Development (IFAD), the United Nations Children’s Fund (UNICEF), the World Food Programme (WFP) and the World Health Organization (WHO).
Under the overall leadership of Kostas Stamoulis, the technical coordination of the publication was carried out by Rob Vos and José Rosero of FAO’s Economic and Social Development Department (ES), in collaboration with Ashwani Muthoo and Paul Winters (IFAD), Victor Aguayo (UNICEF), Francesco Branca (WHO) and Arif Husain (WFP). Carlo Cafiero and Cindy Holleman (FAO), Constanza Di Nucci (IFAD), Chika Hayashi (UNICEF), Yvonne Forsén (WFP) and Marzella Wüstefeld (WHO) contributed as technical editors. Valuable comments and final approval of the report were provided by the executive heads and senior staff of the five co-authoring agencies.
Par t 1 of the repor t was prepared with the additional technical expertise of: Juan Feng, Filippo Gheri, Klaus Grunberger, Anne Kepple, Nathalie Troubat and Sara Viviani (FAO); Maaike Arts, Yarlini Balarajan, France Begin, Julia Krasevec and Roland Kupka (UNICEF); Jean-Baptiste Pasquier and Gaurav Singhal (WFP); and Elaine Borghi, Diana Estevez, Laurence Grummer-Strawn and Lisa Rogers (WHO).
Par t 2 of the repor t was prepared with additional technical support from Ellen Andresen, Julius Jackson, Domitille Kauffmann, Marco Sánchez Cantillo and Trudy Wijnhoven (FAO); Marian Odenigbo (IFAD); Maureen Louise Gallagher, Diane Holland and Ruth Situma (UNICEF); James Feeney (WFP); and Margaret Orunya Lamunu, Adelheid Marschang and Zita Weise Prinzo (WHO). Background papers were prepared by Tilman Brück, Marco D’Ericco, Negar Habibi, Charles Martin-Shields, Alex Segovia, Astrid Sneyers, Wolfgang Stojetz and Stijn van Weezel.
| viii |
Valuable comments and inputs on the report were provided by Asha Bradley, Dominique Burgeon, Günter Hemrich, Michelle Kendrick, Josef Schmidhuber, Andreas Thulstrup, and Natalia Winder-Rossi (FAO); Rui Benfica, Juliane Friedrich, Shantanu Mathur and Abdelkarim Sma (IFAD); Monika Blössner, Juliet Maina, Stefan Savin, and Julius Wekesa (WHO).
Filippo Gheri and Sara Viviani were responsible for preparing undernourishment and food security data, with inputs from Klaus Grunberger, Chiamaka Nwosu and Marinella Cirillo. Supporting data were provided by Salar Tayyib and the Food Balance Sheets team of the FAO Statistics Division (ESS). The statistics on child anthropometry (wasting, stunting, overweight) were prepared by the UNICEF-WHO-the World Bank Group Joint Child Malnutrition Estimates group. Diana Estevez was responsible for consolidating the nutrition data with inputs from Elaine Borghi, Leanne Riley, Lisa Rogers, Gretchen Stevens and Laurence Grummer-Strawn (WHO); and Julia Krasevec, Nona Reuter and Chika Hayashi (UNICEF). Aurélien Mellin was responsible for preparing Annex 2 and the related data processing, with inputs from Stefania Di Giuseppe (FAO). Areej Jafari provided valuable support and coordination during the final production stage of this report.
Translation services were coordinated by the Meeting Programming and Documentation Service of FAO’s Conference, Council and Protocol Affairs Division.
The Publishing Group in FAO’s Office for Corporate Communication provided editorial support, design and layout for all six official languages.
| ix |
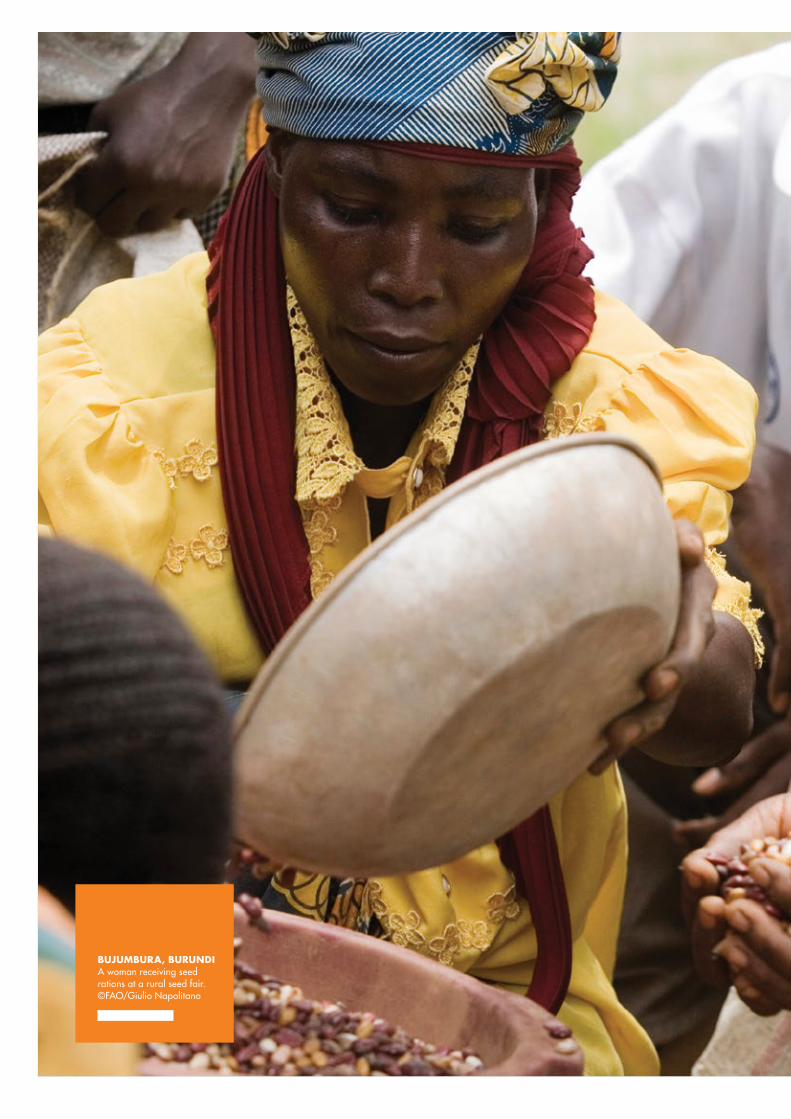
BUJUMBURA, BURUNDIA woman receiving seed rations at a rural seed fair.©FAO/Giulio Napolitano
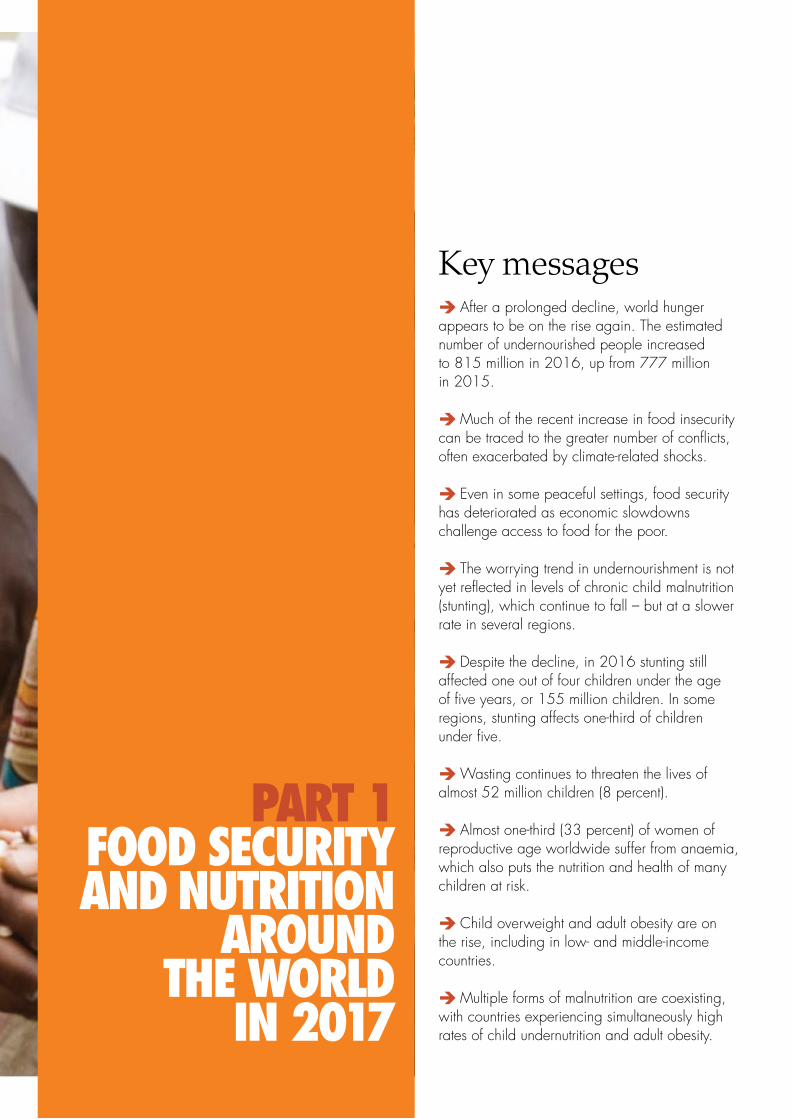
Key messagesè After a prolonged decline, world hunger appears to be on the rise again. The estimated number of undernourished people increased to 815 million in 2016, up from 777 million in 2015.
è Much of the recent increase in food insecurity can be traced to the greater number of conflicts, often exacerbated by climate-related shocks.
è Even in some peaceful settings, food security has deteriorated as economic slowdowns challenge access to food for the poor.
è The worrying trend in undernourishment is not yet reflected in levels of chronic child malnutrition (stunting), which continue to fall – but at a slower rate in several regions.
è Despite the decline, in 2016 stunting still affected one out of four children under the age of five years, or 155 million children. In some regions, stunting affects one-third of children under five.
è Wasting continues to threaten the lives of almost 52 million children (8 percent).
è Almost one-third (33 percent) of women of reproductive age worldwide suffer from anaemia, which also puts the nutrition and health of many children at risk.
è Child overweight and adult obesity are on the rise, including in low- and middle-income countries.
è Multiple forms of malnutrition are coexisting, with countries experiencing simultaneously high rates of child undernutrition and adult obesity.
PART 1 FOOD SECURITY AND NUTRITION
AROUND THE WORLD
IN 2017

AFTER A PROLONGED DECLINE, WORLD HUNGER APPEARS TO BE ON THE RISE AGAINIn 2016, the number of undernourished people in the world increased to an estimated 815 million, up from 777 million in 2015 but still down from about 900 million in the year 2000. Similarly, while the prevalence of undernourishment is projected to have increased to an estimated 11 percent in 2016, this is still well below the level of a decade ago. Nonetheless, the recent increase is cause for great concern and poses a significant challenge for international commitments to end hunger by 2030.
It is not yet clear whether this recent uptick in hunger and food-insecurity levels signals the beginning of an upward trend, or whether it ref lects an acute transient situation. However, reductions in the levels and degree of undernourishment have slowed significantly since 2010. This sobering news comes in a year in which famine was declared in one country (South Sudan) and crisis-level food insecurity situations at risk of turning into famines were identified in several others (including Nigeria, Somalia and Yemen).
The food security situation has visibly worsened in parts of sub-Saharan Africa and South-Eastern and Western Asia, as detailed in Part 1 of this report. Deteriorations have been observed most notably in situations of conflict, often compounded by droughts or f loods (linked in part to the El Niño phenomenon). Part 2 of this report analyses in depth how conflict affects food security and how food insecurity itself can become a trigger for conflict. Over the past ten years, the
number of violent conflicts around the world has increased significantly, hitting rural communities the hardest. More conflict is thus driving greater food insecurity, fuelling hotbeds of violence and creating new ones. The situation has also deteriorated in some peaceful settings, particularly those affected by economic slowdowns. A number of countries heavily dependent on commodity exports have suffered dramatically reduced export and fiscal revenues in recent years, which has affected both food availability through reduced import capacity and food access through reduced fiscal potential to protect poor households against rising domestic food prices. n
CHILD UNDERNUTRITION CONTINUES TO DECLINE, BUT LEVELS OF OVERWEIGHT ARE INCREASINGThe worrisome trend in undernourishment indicators is, however, not reflected in nutritional outcomes. Evidence on various forms of malnutrition (outlined further below) points to continued decreases in the prevalence of child stunting, as reflected in global and regional averages. However, stunting still affects almost one in four children under the age of five years, increasing their risk of impaired cognitive ability, weakened performance at school and work, and dying from infections. At the same time, overweight among children under five is becoming more of a problem in most regions, and adult obesity continues to rise in all regions. Multiple forms of malnutrition therefore coexist, with countries experiencing simultaneously high rates of child undernutrition and adult obesity.
PART 1
FOOD SECURITY AND NUTRITION AROUND THE WORLD IN 2017
| 2 |
THE STATE OF FOOD SECURITY AND NUTRITION IN THE WORLD 2017
It may be diff icult to make sense of a situation in which food security in terms of the estimated adequacy of dietary energy intake is deteriorating globally, though child undernutrition (stunting) is falling and adult obesity is rising. However, food security is but one determinant of nutritional outcomes, especially for children. Other factors include: women’s educational level; resources allocated to national policies and programmes for maternal, infant and young child nutrition; access to clean water, basic sanitation and quality health services; l ifestyle; food environment; and culture. More context-specific assessments are needed to identify the links between household food security and nutrition and the causes underlying the apparent divergence in the most recent food security and nutritional trends. However, overall, these recent estimates are a warning signal that achieving the goal of a world without hunger and malnutrition by 2030 will be challenging. Accomplishing it will require sustained commitment and efforts to promote adequate availability of and access to nutritious food. n
A NEW ERA: FOOD SECURITY AND NUTRITION IN THE 2030 AGENDA FOR SUSTAINABLE DEVELOPMENTThe State of Food Security and Nutrition in the World 2017 marks the start of a new era in monitoring progress towards achieving a world without hunger and malnutrition – an
aim set by the 2030 Agenda for Sustainable Development (2030 Agenda). The second Sustainable Development Goal (SDG 2) calls on countries to “end hunger, achieve food security and improved nutrition and promote sustainable agriculture” by 2030. Composed of eight targets, SDG 2 unites hunger, food security, nutrition and sustainable agriculture under a single objective, compelling the international community to move towards an understanding of how they are interrelated and promoting integrated policy approaches and actions. The start of the 2030 Agenda coincided with the launch of the United Nations Decade of Action on Nutrition (2016–2025), adding impetus to joint efforts at eradicating hunger and preventing all forms of malnutrition worldwide.
Part 1 of this report monitors progress towards ensuring access to food for all (SDG Target 2.1), and putting an end to all forms of malnutrition (SDG Target 2.2). For the first time, this year’s report provides two measures of food insecurity. FAO’s traditional indicator of the extent of hunger, the prevalence of undernourishment (PoU), is complemented by the prevalence of severe food insecurity, which is estimated based on data collected from adult individuals worldwide using the Food Insecurity Experience Scale (FIES). The FIES is a new tool, based on direct interviews, to measure people’s ability to access food. In addition, the report assesses the trends for six nutrition indicators, including three SDG 2 indicators of child malnutrition (stunting, wasting and overweight). The assessment further aims to generate a better understanding of the connections between the first two SDG 2 targets and the action needed to achieve them. Given its enhanced scope, the traditional
| 3 |
PART 1 FOOD SECURITY AND NUTRITION AROUND THE WORLD IN 2017
partnership of FAO, IFAD and WFP in preparing this report has been expanded to bring in the knowledge and expertise of UNICEF and WHO as well.
Part 2 of the report links progress towards improved food security and nutrition to other SDGs. Given recent global trends, this year’s focus is on the nexus between SDG 2 and SDG 16 – that is, between conf lict, food security and peace. This shows not only how conf lict affects food security and nutrition, but also how improved food security and more-resilient rural livelihoods can prevent conf lict and contribute to lasting peace. n
RECENT TRENDS IN HUNGER AND FOOD INSECURITY TARGET 2.1 “By 2030, end hunger and ensure access by all people, in particular the poor and people in vulnerable situations, including infants, to safe, nutritious and sufficient food all year round.”
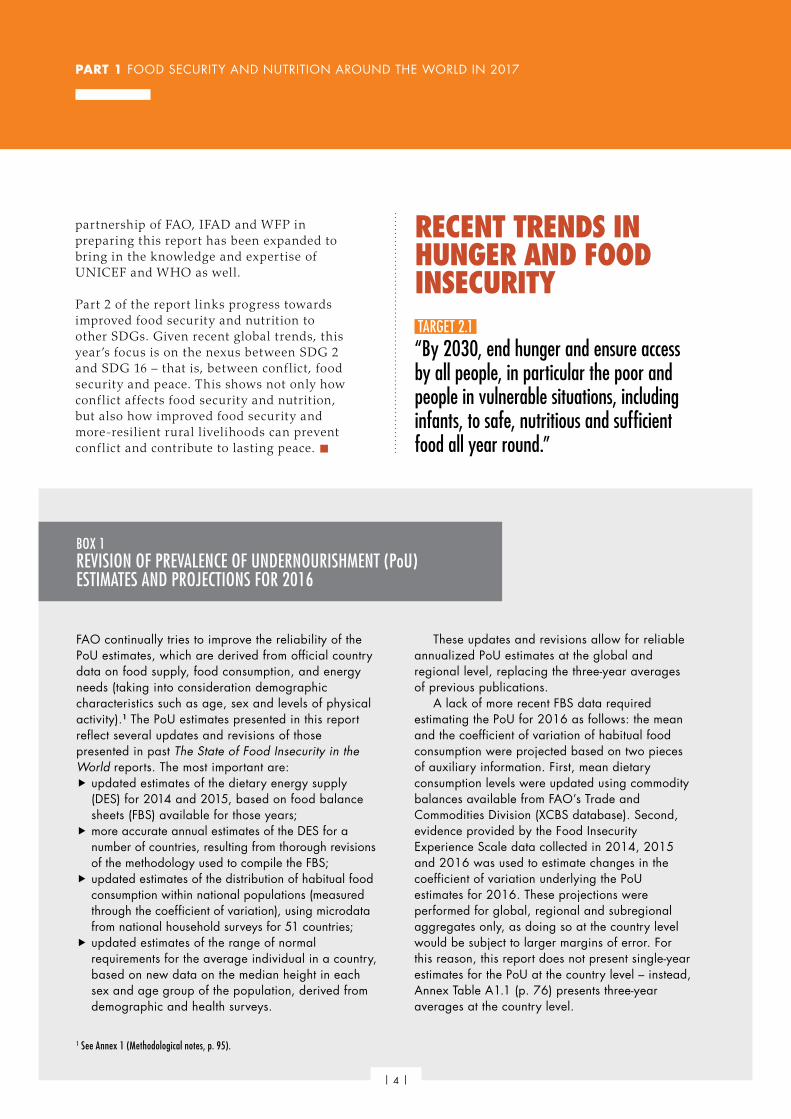
FAO continually tries to improve the reliability of the PoU estimates, which are derived from official country data on food supply, food consumption, and energy needs (taking into consideration demographic characteristics such as age, sex and levels of physical activity).1 The PoU estimates presented in this report reflect several updates and revisions of those presented in past The State of Food Insecurity in the World reports. The most important are:
� updated estimates of the dietary energy supply (DES) for 2014 and 2015, based on food balance sheets (FBS) available for those years;
� more accurate annual estimates of the DES for a number of countries, resulting from thorough revisions of the methodology used to compile the FBS;
� updated estimates of the distribution of habitual food consumption within national populations (measured through the coefficient of variation), using microdata from national household surveys for 51 countries;
� updated estimates of the range of normal requirements for the average individual in a country, based on new data on the median height in each sex and age group of the population, derived from demographic and health surveys.
These updates and revisions allow for reliable annualized PoU estimates at the global and regional level, replacing the three-year averages of previous publications.
A lack of more recent FBS data required estimating the PoU for 2016 as follows: the mean and the coefficient of variation of habitual food consumption were projected based on two pieces of auxiliary information. First, mean dietary consumption levels were updated using commodity balances available from FAO’s Trade and Commodities Division (XCBS database). Second, evidence provided by the Food Insecurity Experience Scale data collected in 2014, 2015 and 2016 was used to estimate changes in the coefficient of variation underlying the PoU estimates for 2016. These projections were performed for global, regional and subregional aggregates only, as doing so at the country level would be subject to larger margins of error. For this reason, this report does not present single-year estimates for the PoU at the country level – instead, Annex Table A1.1 (p. 76) presents three-year averages at the country level.
BOX 1REVISION OF PREVALENCE OF UNDERNOURISHMENT (PoU) ESTIMATES AND PROJECTIONS FOR 2016
1 See Annex 1 (Methodological notes, p. 95).
| 4 |

THE STATE OF FOOD SECURITY AND NUTRITION IN THE WORLD 2017
Published since 1974, the PoU is the internationally established indicator to measure hunger and food insecurity (see Box 1). As such, the PoU has been endorsed by the United Nations Economic and Social Council as an indicator for monitoring SDG Target 2.1 at the global level.
FAO has recently developed a new tool to complement the information provided by the PoU: the FIES. Based on data collected directly from representative samples of individuals in almost 150 countries across the world, this tool measures people’s ability to obtain adequate food. For the first time, therefore, this year’s report publishes an indicator of severe food insecurity. This measure approximates the PoU, as both indicators reflect the extent of severe food deprivation; however, they are based on different sources of data and methodologies. The FIES estimates are more up-to-
date – with the latest observed estimates available for 2016 – while the PoU is derived from data typically available only after a delay of several years.
Prevalence of undernourishment (PoU)The most recent PoU estimates (see Table 1) show that, despite significant population growth, the share of undernourished people in the world decreased from 14.7 percent in 2000 to 10.8 percent in 2013 (Figure 1). However, this rate of reduction has slowed significantly recently, coming to a virtual halt between 2013 and 2015. Most worryingly, FAO estimates for 2016 indicate that the global prevalence of undernourishment in 2016 may have actually risen to 11 percent, implying a return to the level reached in 2012 and suggesting a possible reversal of the downward trend sustained over recent decades.
400
500
600
700
800
900
1 000
10
11
12
13
14
15
16Prevalence of undernourishment (left axis) Number of people undernourished (right axis)
2000
2005
2010
2011
2012
2013
2014
2015
2016
14.7 14.2
11.510.8
10.6
11.0
900
926
795775 777
815
MIL
LION
S
PERC
ENTA
GE
NOTE: Prevalence and number of undernourished people in the world, 2000–2016. Figures for 2016 are projected estimates (see Box 1 on p. 4 and Methodological notes in Annex 1, p. 95).SOURCE: FAO.
FIGURE 1THE NUMBER OF UNDERNOURISHED PEOPLE HAS BEEN ON THE RISE SINCE 2014, REACHING AN ESTIMATED 815 MILLION IN 2016
| 5 |
PART 1 FOOD SECURITY AND NUTRITION AROUND THE WORLD IN 2017
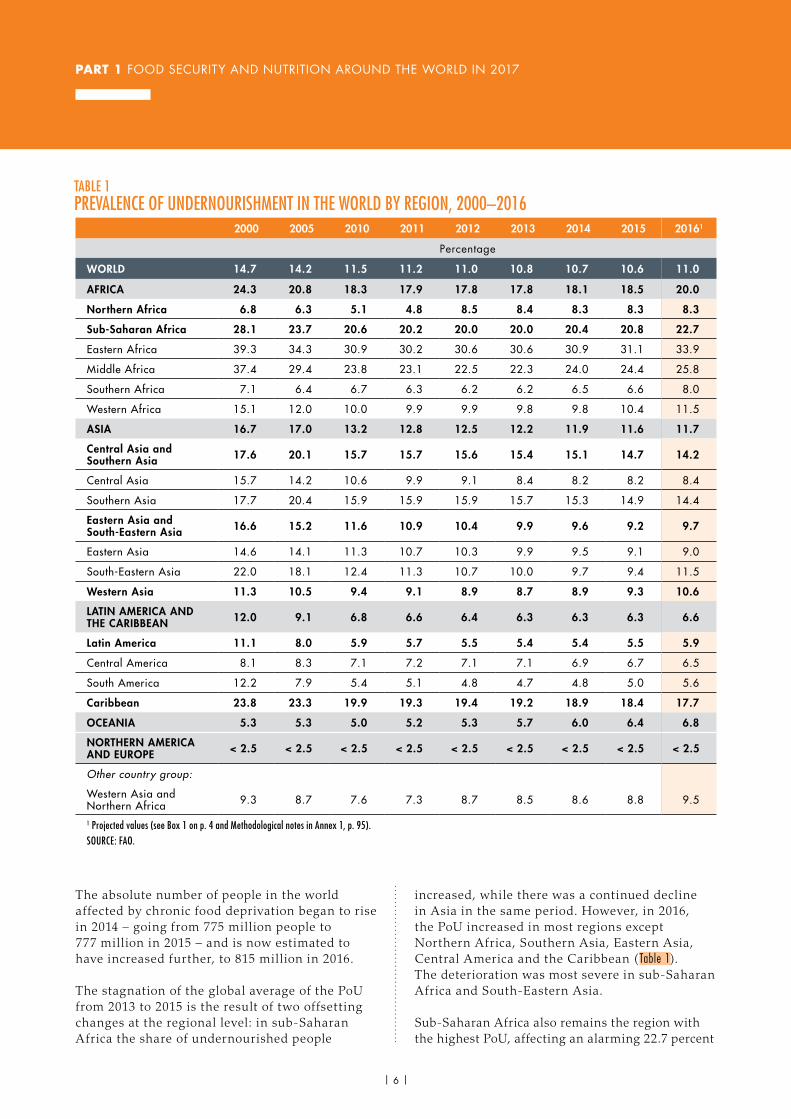
The absolute number of people in the world affected by chronic food deprivation began to rise in 2014 – going from 775 million people to 777 million in 2015 – and is now estimated to have increased further, to 815 million in 2016.
The stagnation of the global average of the PoU from 2013 to 2015 is the result of two offsetting changes at the regional level: in sub-Saharan Africa the share of undernourished people
increased, while there was a continued decline in Asia in the same period. However, in 2016, the PoU increased in most regions except Northern Africa, Southern Asia, Eastern Asia, Central America and the Caribbean ( Table 1). The deterioration was most severe in sub-Saharan Africa and South-Eastern Asia.
Sub-Saharan Africa also remains the region with the highest PoU, affecting an alarming 22.7 percent
TABLE 1 PREVALENCE OF UNDERNOURISHMENT IN THE WORLD BY REGION, 2000–2016
2000 2005 2010 2011 2012 2013 2014 2015 20161
Percentage
WORLD 14.7 14.2 11.5 11.2 11.0 10.8 10.7 10.6 11.0
AFRICA 24.3 20.8 18.3 17.9 17.8 17.8 18.1 18.5 20.0
Northern Africa 6.8 6.3 5.1 4.8 8.5 8.4 8.3 8.3 8.3
Sub-Saharan Africa 28.1 23.7 20.6 20.2 20.0 20.0 20.4 20.8 22.7
Eastern Africa 39.3 34.3 30.9 30.2 30.6 30.6 30.9 31.1 33.9
Middle Africa 37.4 29.4 23.8 23.1 22.5 22.3 24.0 24.4 25.8
Southern Africa 7.1 6.4 6.7 6.3 6.2 6.2 6.5 6.6 8.0
Western Africa 15.1 12.0 10.0 9.9 9.9 9.8 9.8 10.4 11.5
ASIA 16.7 17.0 13.2 12.8 12.5 12.2 11.9 11.6 11.7
Central Asia and Southern Asia 17.6 20.1 15.7 15.7 15.6 15.4 15.1 14.7 14.2
Central Asia 15.7 14.2 10.6 9.9 9.1 8.4 8.2 8.2 8.4
Southern Asia 17.7 20.4 15.9 15.9 15.9 15.7 15.3 14.9 14.4
Eastern Asia and South-Eastern Asia 16.6 15.2 11.6 10.9 10.4 9.9 9.6 9.2 9.7
Eastern Asia 14.6 14.1 11.3 10.7 10.3 9.9 9.5 9.1 9.0
South-Eastern Asia 22.0 18.1 12.4 11.3 10.7 10.0 9.7 9.4 11.5
Western Asia 11.3 10.5 9.4 9.1 8.9 8.7 8.9 9.3 10.6
LATIN AMERICA AND THE CARIBBEAN 12.0 9.1 6.8 6.6 6.4 6.3 6.3 6.3 6.6
Latin America 11.1 8.0 5.9 5.7 5.5 5.4 5.4 5.5 5.9
Central America 8.1 8.3 7.1 7.2 7.1 7.1 6.9 6.7 6.5
South America 12.2 7.9 5.4 5.1 4.8 4.7 4.8 5.0 5.6
Caribbean 23.8 23.3 19.9 19.3 19.4 19.2 18.9 18.4 17.7
OCEANIA 5.3 5.3 5.0 5.2 5.3 5.7 6.0 6.4 6.8
NORTHERN AMERICA AND EUROPE < 2.5 < 2.5 < 2.5 < 2.5 < 2.5 < 2.5 < 2.5 < 2.5 < 2.5
Other country group:
Western Asia and Northern Africa 9.3 8.7 7.6 7.3 8.7 8.5 8.6 8.8 9.5
1 Projected values (see Box 1 on p. 4 and Methodological notes in Annex 1, p. 95).SOURCE: FAO.
| 6 |

THE STATE OF FOOD SECURITY AND NUTRITION IN THE WORLD 2017
of the population in 2016. The situation is especially urgent in Eastern Africa, where one-third of the population is estimated to be undernourished – the subregion’s PoU increased from 31.1 percent in 2015 to 33.9 percent in 2016. The Caribbean (17.7 percent) and Asia (11.7 percent overall, with peaks of 14.4 percent in Southern Asia) also continue to show a high PoU. In Asia, the most visible uptick in undernourishment was in South-Eastern Asia, increasing from 9.4 percent to 11.5 percent from 2015 to 2016, to return near levels reached in 2011. In contrast, levels remain low in Latin America, although there are signs that the situation may be deteriorating, especially in South America, where the PoU climbed from 5 percent in 2015 to 5.6 percent in 2016.
Owing in part to the size of its population, the highest number of undernourished people is in Asia.
FAO estimates that in 2016 almost 520 million people in Asia, more than 243 million in Africa, and more than 42 million in Latin America and the Caribbean did not have access to sufficient food energy (Figure 2).
The recent increase in the prevalence of undernourishment is also confirmed by other data sources (see Box 2). It can be attributed to a variety of factors. New information from food commodity balances for many countries points to recent reductions in food availability and increases in food prices in regions affected by El Niño / La Niña-related phenomena – most notably in Eastern and Southern Africa and in South-Eastern Asia. In addition, the number of conf licts has increased in the past decade, in particular in countries already facing high food insecurity and with much of the related violence
191.1200.4
218.7
243.2
552.4526.1
508.3 519.6
40.8 39.1 40.1 42.5
1.82.1 2.5 2.7
0
5
10
15
20
25
2009 2010 2011 2012 2013 2014 2015 2016 2017
PREV
ALEN
CE O
F UN
DERN
OURI
SHM
ENT
(PER
CENT
AGE)
North America and EuropeLatin America and the Caribbean OceaniaAsiaAfrica
NOTE: Comparison of prevalence and number of undernourished people by region. The size of the circles represents the number of undernourished people in millions, as labelled. Figures for 2016 are projected values (see Box 1 on p. 4 and Methodological notes in Annex 1, p. 95).SOURCE: FAO.
FIGURE 2THE PREVALENCE OF UNDERNOURISHMENT IS HIGHEST IN AFRICA; THE ABSOLUTE NUMBER OF UNDERNOURISHED PEOPLE IS LARGEST IN ASIA
»
| 7 |
PART 1 FOOD SECURITY AND NUTRITION AROUND THE WORLD IN 2017
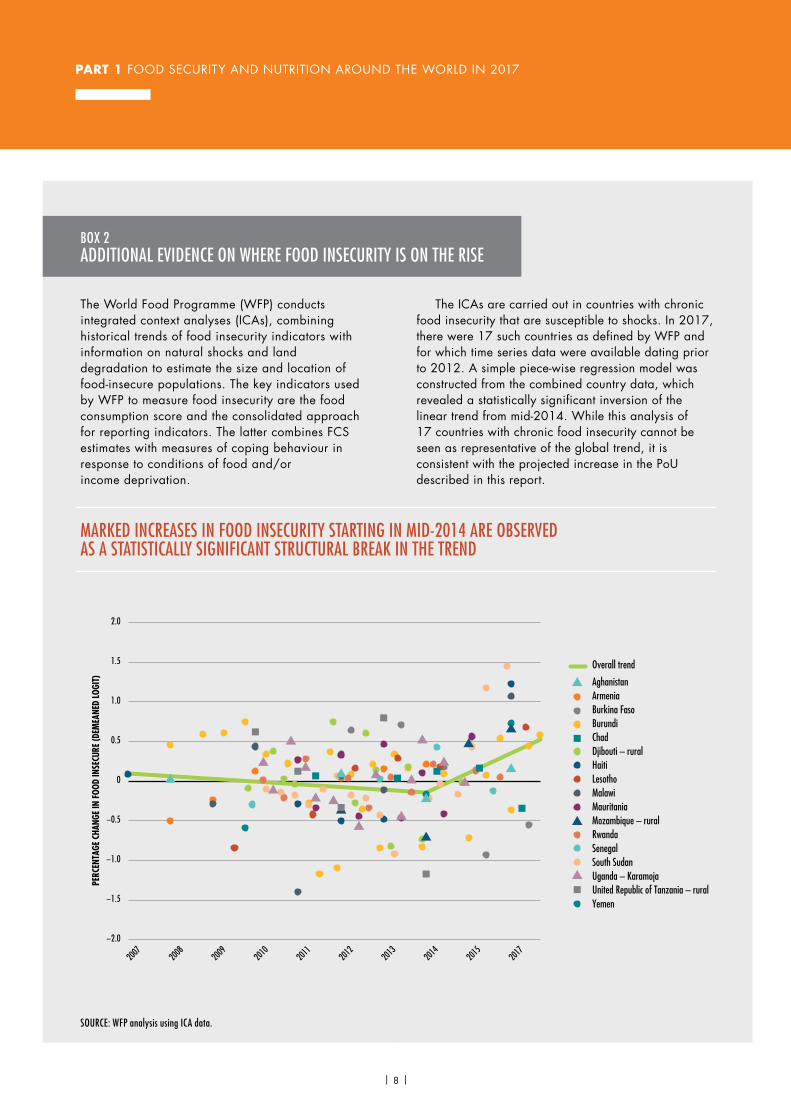
The World Food Programme (WFP) conducts integrated context analyses (ICAs), combining historical trends of food insecurity indicators with information on natural shocks and land degradation to estimate the size and location of food-insecure populations. The key indicators used by WFP to measure food insecurity are the food consumption score and the consolidated approach for reporting indicators. The latter combines FCS estimates with measures of coping behaviour in response to conditions of food and/or income deprivation.
The ICAs are carried out in countries with chronic food insecurity that are susceptible to shocks. In 2017, there were 17 such countries as defined by WFP and for which time series data were available dating prior to 2012. A simple piece-wise regression model was constructed from the combined country data, which revealed a statistically significant inversion of the linear trend from mid-2014. While this analysis of 17 countries with chronic food insecurity cannot be seen as representative of the global trend, it is consistent with the projected increase in the PoU described in this report.
SOURCE: WFP analysis using ICA data.
BOX 2ADDITIONAL EVIDENCE ON WHERE FOOD INSECURITY IS ON THE RISE
MARKED INCREASES IN FOOD INSECURITY STARTING IN MID-2014 ARE OBSERVED AS A STATISTICALLY SIGNIFICANT STRUCTURAL BREAK IN THE TREND
−2.0
−1.5
2007
2008
2009
2010
2011
2012
2013
2014
2015
2017
−1.0
−0.5
0
0.5
1.0
1.5
2.0
PERC
ENTA
GE C
HANG
E IN
FOO
D IN
SECU
RE (D
EMEA
NED
LOGI
T)
Overall trend
AghanistanArmeniaBurkina FasoBurundiChadDjibouti – ruralHaitiLesothoMalawiMauritaniaMozambique – rural RwandaSenegalSouth Sudan
YemenUnited Republic of Tanzania – ruralUganda – Karamoja
| 8 |

THE STATE OF FOOD SECURITY AND NUTRITION IN THE WORLD 2017
affecting rural areas and having a negative impact on food production and availability. This surge in conflicts has affected African and Near East nations the most and led to food-crisis situations, especially where compounded by droughts or other weather-related events and fragile response capacities (see Part 2 of this report).
Worsening food security conditions have also been observed in more peaceful settings, particularly where economic slowdowns have drained foreign exchange and fiscal revenues. This has affected both food availability by reducing import capacity, and food access owing to more limited fiscal space to protect poor households against rising domestic food prices, as seen for example in parts of Latin America and Western Asia. Costs have risen significantly in countries that typically rely on revenues from oil and other primary commodity exports to finance food imports and subsidies. Lower oil and mineral prices have limited
governments’ spending capacity, contributing to slowdowns, stagnation or outright recessions in the real sector of some economies, leading to increased unemployment and declines in incomes. In addition, such economic downturns have reduced fiscal revenue and eroded resources available to sustain subsidies on basic needs and support through social protection programmes. n
PREVALENCE OF SEVERE FOOD INSECURITY IN THE POPULATION, BASED ON THE FIESThe FIES is a new source of additional evidence on the state of food security (see Box 3). Data collected by FAO in 2014, 2015 and 2016 in almost 150 countries1 reveal that nearly one in ten
TABLE 2 PERCENTAGE AND NUMBER OF PEOPLE AFFECTED BY SEVERE FOOD INSECURITY, MEASURED USING THE FIES (2014–16)
Severe food insecurity – prevalence Severe food insecurity – number of people
2014 2015 2016 2014 2015 2016
Percentage Millions
WORLD 9.2 (±0.5) 8.8 (±0.4) 9.3 (±0.4) 665.9 (±35.7) 645.1(±31.7) 688.5 (±27.6)
AFRICA 25.0 (±0.8) 25.1 (±0.7) 27.4 (±0.7) 289.5 (±9.6) 298.0 (±8.7) 333.2 (±8.6)
Of which:
Sub-Saharan Africa 28.3 (±1.0) 28.7 (±0.9) 31.0 (±0.8) 265.0 (±9.5) 275.7 (±8.6) 306.7 (±8.3)
ASIA 7.7 (±0.1) 7.0 (±0.7) 7.0 (±0.6) 337.0 (±34.1) 306.7(±30.1) 309.9 (±26)
Of which:
Central Asia and Southern Asia 14.4 (±0.5) 12.3 (±1.6) 11.1 (±1.3) 268.7 (±36.2) 233.1(±31.1) 211.9 (±24.4)
Eastern Asia and South-Eastern Asia 2.0 (±0.2) 2.1 (±0.3) 3.1 (±0.5) 44.7 (±5.1) 48.1 (±7.6) 70.5 (±11.8)
LATIN AMERICA 4.7 (±0.3) 4.8 (±0.3) 6.4 (±0.3) 27.7 (±1.8) 28.1 (±1.6) 38.3 (±2.0)
NORTHERN AMERICA AND EUROPE
1.4 (±0.1) 1.6 (±0.1) 1.2 (±0.1) 15.6 (±1.6) 17.1 (±1.6) 13.0 (±1.3)
Other country group:
Western Asia and Northern Africa 10.7 (±0.6) 10.5 (±0.6) 11.8 (±0.7) 50.3 (±2.9) 50.7 (±2.9) 57.9 (±3.2)
NOTES: Prevalence is calculated as the number of people living in households where at least one adult has been found to be severely food insecure, as a percentage of the total population. Margins of error are in parentheses.SOURCE: FAO, Voices of the Hungry project.
»
»
| 9 |
PART 1 FOOD SECURITY AND NUTRITION AROUND THE WORLD IN 2017
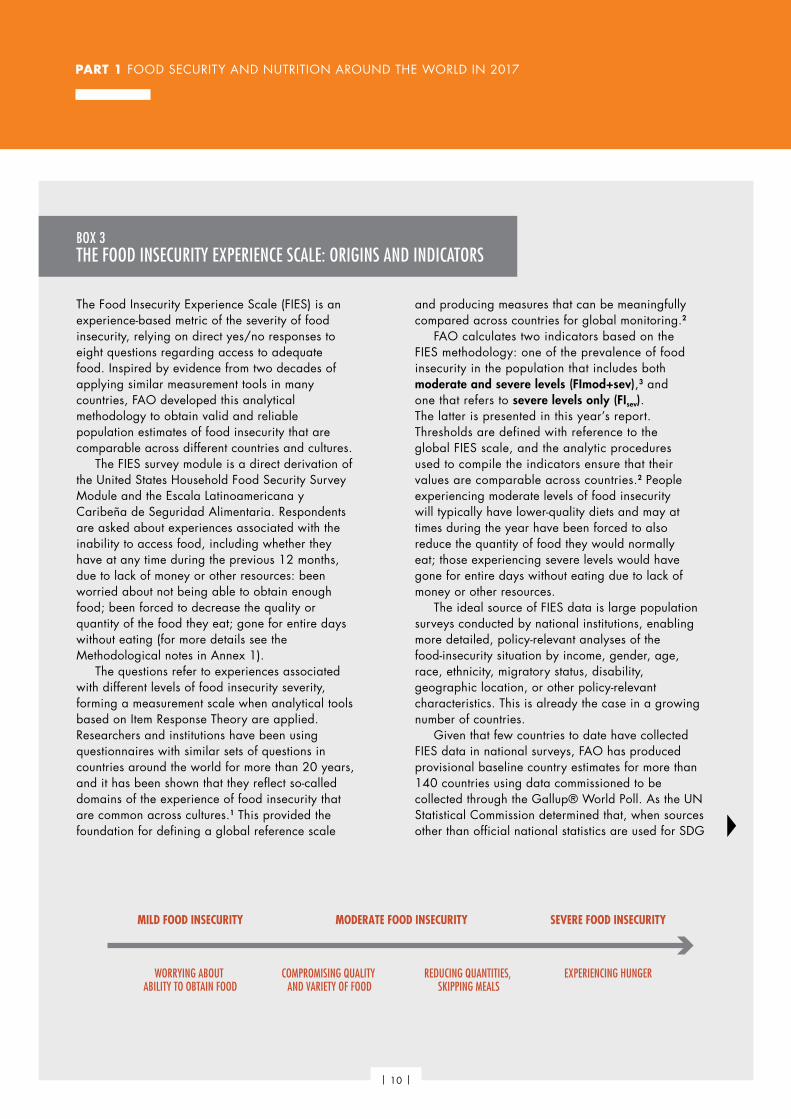
The Food Insecurity Experience Scale (FIES) is an experience-based metric of the severity of food insecurity, relying on direct yes/no responses to eight questions regarding access to adequate food. Inspired by evidence from two decades of applying similar measurement tools in many countries, FAO developed this analytical methodology to obtain valid and reliable population estimates of food insecurity that are comparable across different countries and cultures.
The FIES survey module is a direct derivation of the United States Household Food Security Survey Module and the Escala Latinoamericana y Caribeña de Seguridad Alimentaria. Respondents are asked about experiences associated with the inability to access food, including whether they have at any time during the previous 12 months, due to lack of money or other resources: been worried about not being able to obtain enough food; been forced to decrease the quality or quantity of the food they eat; gone for entire days without eating (for more details see the Methodological notes in Annex 1).
The questions refer to experiences associated with different levels of food insecurity severity, forming a measurement scale when analytical tools based on Item Response Theory are applied. Researchers and institutions have been using questionnaires with similar sets of questions in countries around the world for more than 20 years, and it has been shown that they reflect so-called domains of the experience of food insecurity that are common across cultures.1 This provided the foundation for defining a global reference scale
and producing measures that can be meaningfully compared across countries for global monitoring.2
FAO calculates two indicators based on the FIES methodology: one of the prevalence of food insecurity in the population that includes both moderate and severe levels (FImod+sev),3 and one that refers to severe levels only (FIsev). The latter is presented in this year’s report. Thresholds are defined with reference to the global FIES scale, and the analytic procedures used to compile the indicators ensure that their values are comparable across countries.2 People experiencing moderate levels of food insecurity will typically have lower-quality diets and may at times during the year have been forced to also reduce the quantity of food they would normally eat; those experiencing severe levels would have gone for entire days without eating due to lack of money or other resources.
The ideal source of FIES data is large population surveys conducted by national institutions, enabling more detailed, policy-relevant analyses of the food-insecurity situation by income, gender, age, race, ethnicity, migratory status, disability, geographic location, or other policy-relevant characteristics. This is already the case in a growing number of countries.
Given that few countries to date have collected FIES data in national surveys, FAO has produced provisional baseline country estimates for more than 140 countries using data commissioned to be collected through the Gallup® World Poll. As the UN Statistical Commission determined that, when sources other than official national statistics are used for SDG
BOX 3THE FOOD INSECURITY EXPERIENCE SCALE: ORIGINS AND INDICATORS
MILD FOOD INSECURITY MODERATE FOOD INSECURITY SEVERE FOOD INSECURITY
WORRYING ABOUT ABILITY TO OBTAIN FOOD
COMPROMISING QUALITY AND VARIETY OF FOOD
REDUCING QUANTITIES, SKIPPING MEALS
EXPERIENCING HUNGER
| 10 |
THE STATE OF FOOD SECURITY AND NUTRITION IN THE WORLD 2017
BOX 3(CONTINUED)
1 J. Coates, E.A. Frongillo, B. Lorge Rogers, P. Webb, P.E. Wilde and R. Houser. 2006. Commonalities in the experience of household food insecurity across cultures: what are measures missing? Journal of Nutrition, 136: 1420S-1430S.
² FAO. 2016. Methods for estimating comparable rates of food insecurity experienced by adults throughout the world. Rome.
3 The reason the percentage of moderate food insecurity only is not used as an indicator for global monitoring is because a change in this percentage would be prone to ambiguous interpretation; a reduction in moderate food insecurity could be due to the movement of some of those who were suffering from moderate food insecurity into the severe category. Combining the moderate and severe food insecurity categories avoids such ambiguity.
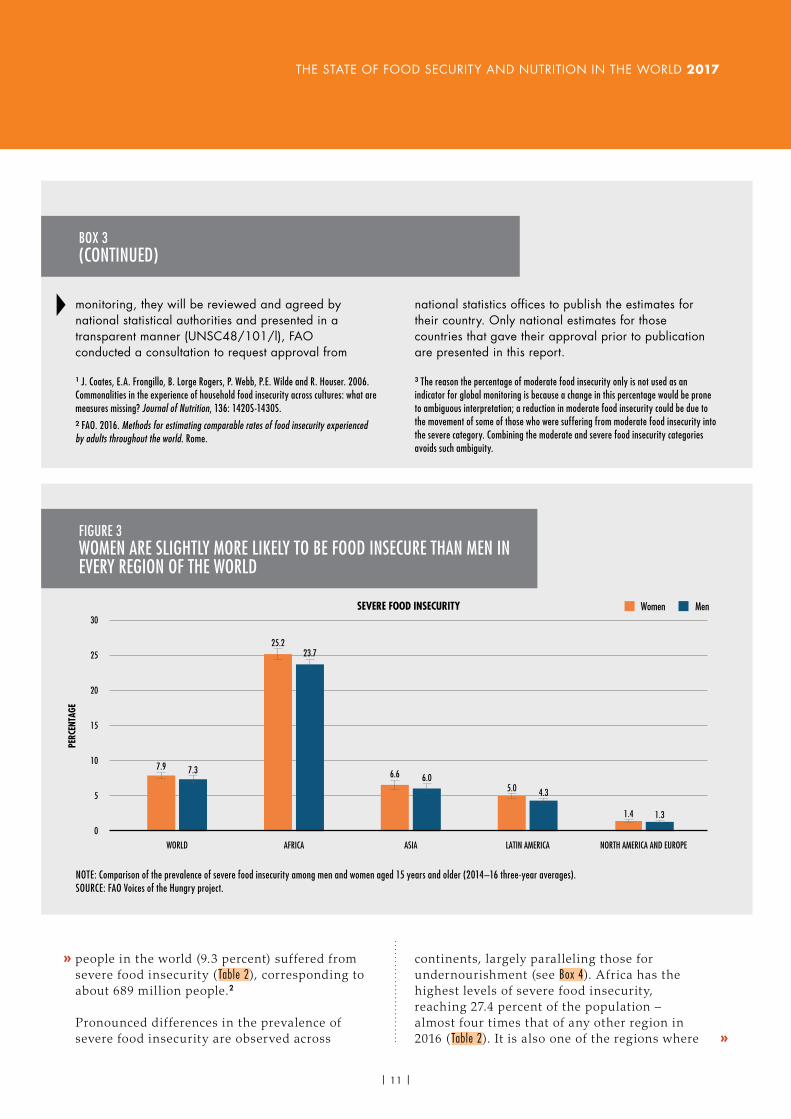
continents, largely paralleling those for undernourishment (see Box 4). Africa has the highest levels of severe food insecurity, reaching 27.4 percent of the population – almost four times that of any other region in 2016 ( Table 2). It is also one of the regions where
people in the world (9.3 percent) suffered from severe food insecurity ( Table 2), corresponding to about 689 million people.2
Pronounced differences in the prevalence of severe food insecurity are observed across
Women Men
WORLD AFRICA ASIA LATIN AMERICA NORTH AMERICA AND EUROPE
0
5
10
15
20
25
30
PERC
ENTA
GE
SEVERE FOOD INSECURITY
25.2
6.6
1.4 1.3
7.3
23.7
6.05.0 4.3
7.9
NOTE: Comparison of the prevalence of severe food insecurity among men and women aged 15 years and older (2014–16 three-year averages).SOURCE: FAO Voices of the Hungry project.
FIGURE 3WOMEN ARE SLIGHTLY MORE LIKELY TO BE FOOD INSECURE THAN MEN IN EVERY REGION OF THE WORLD
monitoring, they will be reviewed and agreed by national statistical authorities and presented in a transparent manner (UNSC48/101/l), FAO conducted a consultation to request approval from
national statistics offices to publish the estimates for their country. Only national estimates for those countries that gave their approval prior to publication are presented in this report.
»
»
| 11 |
PART 1 FOOD SECURITY AND NUTRITION AROUND THE WORLD IN 2017
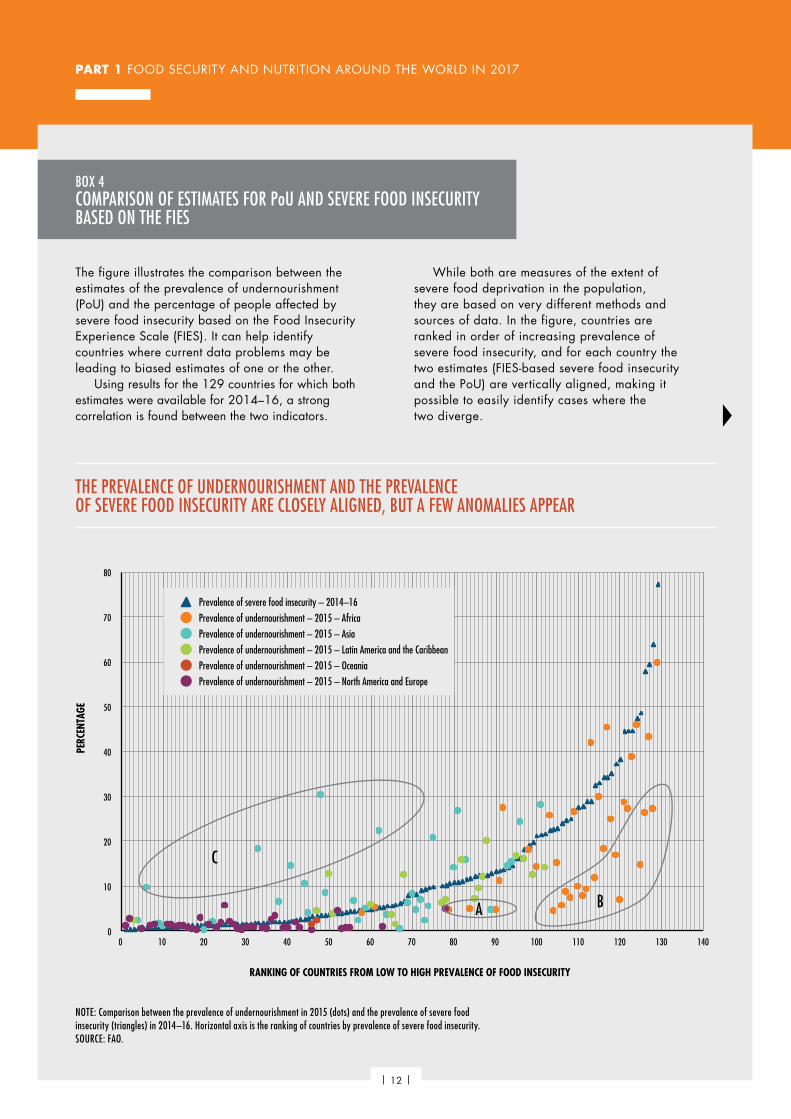
The figure illustrates the comparison between the estimates of the prevalence of undernourishment (PoU) and the percentage of people affected by severe food insecurity based on the Food Insecurity Experience Scale (FIES). It can help identify countries where current data problems may be leading to biased estimates of one or the other.
Using results for the 129 countries for which both estimates were available for 2014–16, a strong correlation is found between the two indicators.
While both are measures of the extent of severe food deprivation in the population, they are based on very different methods and sources of data. In the figure, countries are ranked in order of increasing prevalence of severe food insecurity, and for each country the two estimates (FIES-based severe food insecurity and the PoU) are vertically aligned, making it possible to easily identify cases where the two diverge.
BOX 4COMPARISON OF ESTIMATES FOR PoU AND SEVERE FOOD INSECURITY BASED ON THE FIES
THE PREVALENCE OF UNDERNOURISHMENT AND THE PREVALENCE OF SEVERE FOOD INSECURITY ARE CLOSELY ALIGNED, BUT A FEW ANOMALIES APPEAR
PERC
ENTA
GE
RANKING OF COUNTRIES FROM LOW TO HIGH PREVALENCE OF FOOD INSECURITY
0
10
20
30
40
50
60
70
80
0 10 20 30 40 50 60 70 80 90 100 110 120 130 140
A B
C
Prevalence of severe food insecurity – 2014–16
Prevalence of undernourishment – 2015 – Africa
Prevalence of undernourishment – 2015 – Asia
Prevalence of undernourishment – 2015 – Latin America and the Caribbean
Prevalence of undernourishment – 2015 – Oceania
Prevalence of undernourishment – 2015 – North America and Europe
NOTE: Comparison between the prevalence of undernourishment in 2015 (dots) and the prevalence of severe food insecurity (triangles) in 2014–16. Horizontal axis is the ranking of countries by prevalence of severe food insecurity.SOURCE: FAO.
| 12 |
THE STATE OF FOOD SECURITY AND NUTRITION IN THE WORLD 2017
food insecurity is on the rise, particularly in sub-Saharan Africa, with an increase of almost three percentage points from 2014 to 2016. Higher food insecurity was also observed in Latin America over the three-year period, rising from 4.7 percent to 6.4 percent.
In Asia, the prevalence of severe food insecurity decreased slightly between 2014 and 2016, from 7.7 percent to 7.0 percent overall, driven mainly by the reduction observed in Central Asia and Southern Asia.
As the FIES survey was administered to individual respondents, one important feature is that the results can be analysed at the individual level. This makes it possible to compare food-insecurity levels among men and women, inter alia, with three-year averages showing that the prevalence of food insecurity was slightly higher among women at the global level as well as in every region of the world (Figure 3). n
TRENDS IN ALL FORMS OF MALNUTRITION TARGET 2.2 “By 2030, end all forms of malnutrition, including achieving, by 2025, the internationally agreed targets on stunting and wasting in children under five years of age, and address the nutritional needs of adolescent girls, pregnant and lactating women and older persons.”
Sustainable Development Goal 2, Target 2.2, calls for an end to “all forms of malnutrition” by 2030, as does the UN Decade of Action on Nutrition (Box 5). Malnutrition ranges from severe undernutrition to overweight and obesity. It affects populations throughout the lifecycle, from conception through childhood, into adolescence, adulthood and older age. Malnutrition may be a reflection of deficiencies in macronutrients
Analysing the comparison in greater detail by region, the PoU (coloured dots) is found to be significantly lower than the prevalence of severe food insecurity (blue triangles) for a number of countries in Africa (areas A and B), and significantly higher for a few countries in Asia (area C). Area A includes countries in Northern Africa. For the countries in Eastern and Southern Africa (area B), the higher estimates of the prevalence of severe food insecurity for 2014–16 may reflect an improved ability of the FIES-based indicator to reflect the impact of three consecutive years of drought in these countries. These impacts might not yet be fully captured in current PoU estimates, and will probably only be reflected in these countries’ food balance sheets that will be available in the coming years.
As FIES-based estimates are a direct measure of food access, discrepancies may also emerge that in fact reflect short-term fluctuations in countries’ economic and social conditions. Meanwhile, owing to a lack of recent household survey data for many countries, PoU estimates might not reflect recent changes in access to food. This could explain the differences noted in countries in Northern Africa and the Near East, for example. For some countries in Asia (area C) where there is a large difference, the prevalence of food insecurity as measured by the FIES may be underestimated owing to a possible under-reporting of food hardship in some Asian countries – an issue that will deserve close attention in future research aimed at improving the reliability of FIES-based estimates.
BOX 4(CONTINUED)
»
| 13 |
PART 1 FOOD SECURITY AND NUTRITION AROUND THE WORLD IN 2017
(carbohydrates, fats or proteins) or micronutrients (vitamins and minerals). It can be acute – resulting from an immediate crisis in food accessibility, inadequate nutrient intake and/or infection – or chronic, with cumulative deleterious effects over sustained periods. On the other hand, an excessive intake of food and calories and/or limited energy expenditure results in increased body weight and fat accumulation, which can lead to diet-related non-communicable diseases and other health problems. Undernutrition, overweight and their associated non-communicable diseases now coexist in many regions, countries and even households. Six nutrition indicators – three that form part of the SDG monitoring framework, and three that refer to global nutrition targets agreed by the World Health Assembly (WHA) – are described below to better understand the multiple burden of malnutrition, which affects all regions in the world.
Stunting among children under five years of age Children’s linear growth in the first f ive years of life is assessed by the stunting indicator. Stunting is evidence that children are too short for their age, which in turn is a ref lection of a chronic state of undernutrition. When children are stunted before the age of two, they are at higher risk of il lness and more likely than adequately nourished children to develop poor cognitive skills and learning abilities in later childhood and adolescence. This will affect labour productivity, income-earning potential and social skills later in life, with consequences beyond the individual level. If widespread, stunting also drags down the economic development of entire communities and nations.
In April 2016, the UN General Assembly endorsed the outcome documents of the Second International Conference on Nutrition (ICN2), aimed at achieving the global nutrition targets set by the World Health Assembly, and declared the period 2016–2025 as the United Nations Decade of Action on Nutrition. The UN General Assembly also called on FAO and WHO to lead its implementation, in collaboration with the World Food Programme, the International Fund for Agricultural Development and the United Nations Children’s Fund, using already-established coordination mechanisms such as the United Nations System Standing Committee on Nutrition and multistakeholder platforms such as the Committee on World Food Security. The Decade of Action on Nutrition marks a new ambition and direction with a view to eradicating hunger and ending all forms of malnutrition, providing a clearly defined, time-bound, cohesive framework to implement the ICN2 commitments, along with the Sustainable Development Goals (SDGs). Moreover, it provides an enabling environment for national,
regional and international policies and programmes to respect, protect and fulfil “the right of everyone to have access to safe, sufficient, and nutritious food, consistent with the right to adequate food and the fundamental right of everyone to be free from hunger”, in line with the International Covenant on Economic, Social and Cultural Rights and other relevant United Nations instruments.
The primary objective of the Decade of Action on Nutrition is to increase nutrition investments and implement policies and programmes to improve food security and nutrition within the ICN2 framework.1 The achievement of other SDGs depends on improved nutritional outcomes, as improved nutrition is essential for people’s health, learning and income-earning abilities, as well as other social and economic capacities. The Decade of Action on Nutrition provides an opportunity for all partners to work together, mobilize action and accelerate efforts towards eliminating hunger, food insecurity and all forms of malnutrition, meeting the SDGs by 2030.
BOX 5UNITED NATIONS DECADE OF ACTION ON NUTRITION
1 FAO/WHO Work Programme of the UN Decade of Action on Nutrition (2016–2025).
| 14 |
THE STATE OF FOOD SECURITY AND NUTRITION IN THE WORLD 2017
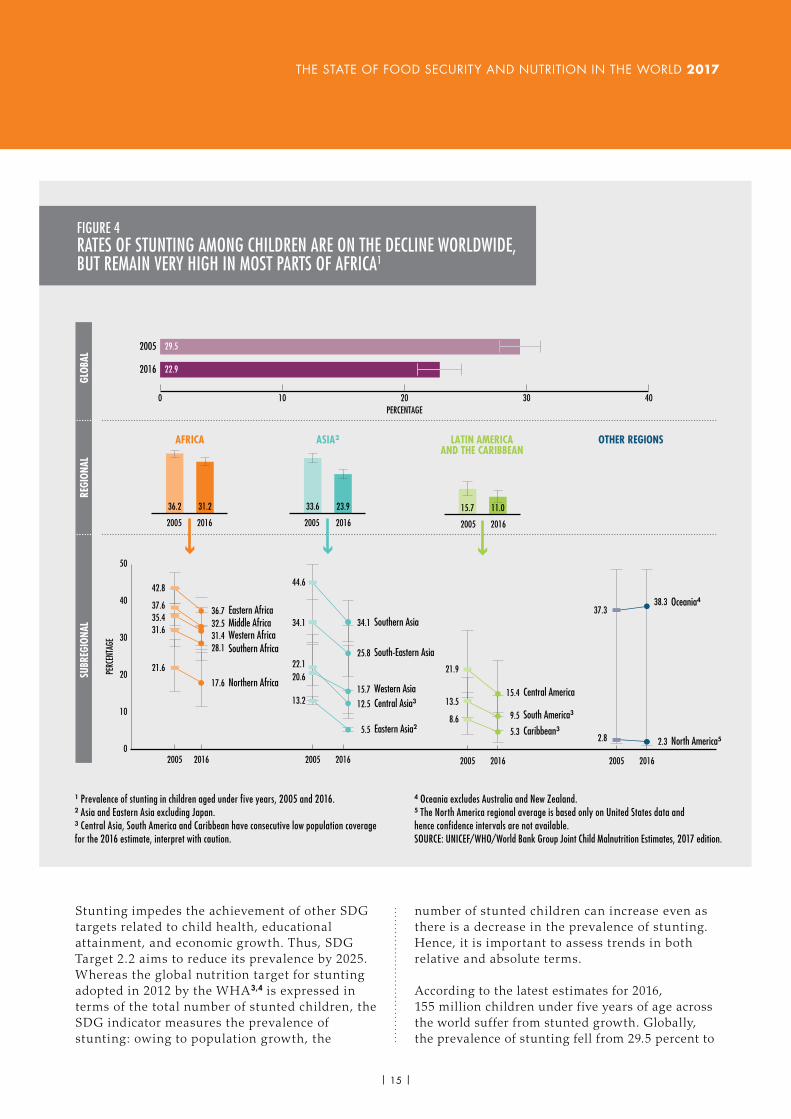
Stunting impedes the achievement of other SDG targets related to child health, educational attainment, and economic growth. Thus, SDG Target 2.2 aims to reduce its prevalence by 2025. Whereas the global nutrition target for stunting adopted in 2012 by the WHA3,4 is expressed in terms of the total number of stunted children, the SDG indicator measures the prevalence of stunting: owing to population growth, the
number of stunted children can increase even as there is a decrease in the prevalence of stunting. Hence, it is important to assess trends in both relative and absolute terms.
According to the latest estimates for 2016, 155 million children under five years of age across the world suffer from stunted growth. Globally, the prevalence of stunting fell from 29.5 percent to
2016
2005
0 10 20 30 40
0
10
20
30
40
50
20162005
29.5
22.9
20162005
36.2 31.2
20162005
20162005
33.6 23.9
REGI
ONAL
GLOB
ALSU
BREG
IONA
L
Eastern AfricaMiddle Africa
Northern Africa
Western AfricaSouthern Africa
42.8
37.6
21.6
31.635.4
36.732.5
17.6
28.131.4
20162005
20162005
LATIN AMERICAAND THE CARIBBEAN
15.7 11.0
OTHER REGIONS
21.9
13.515.4
9.5
5.38.6
Caribbean3
Central America
South America3
North America5
Oceania4
37.338.3
22.1
Central Asia3
Eastern Asia2
South-Eastern Asia
Southern Asia
Western Asia13.2
44.6
34.1
20.6
5.5
12.5
15.7
25.8
34.1
PERCENTAGE
PERC
ENTA
GE
2.32.8
20162005
AFRICA ASIA2
1 Prevalence of stunting in children aged under five years, 2005 and 2016. 2 Asia and Eastern Asia excluding Japan. 3 Central Asia, South America and Caribbean have consecutive low population coverage for the 2016 estimate, interpret with caution.
4 Oceania excludes Australia and New Zealand. 5 The North America regional average is based only on United States data and hence confidence intervals are not available.SOURCE: UNICEF/WHO/World Bank Group Joint Child Malnutrition Estimates, 2017 edition.
FIGURE 4RATES OF STUNTING AMONG CHILDREN ARE ON THE DECLINE WORLDWIDE, BUT REMAIN VERY HIGH IN MOST PARTS OF AFRICA1
| 15 |
PART 1 FOOD SECURITY AND NUTRITION AROUND THE WORLD IN 2017
22.9 percent between 2005 and 2016 (Figure 4). However, at current trends, there would be 130 million stunted children by 2025, which would be 30 million above the global WHA target and despite a 40 percent reduction from 2012 levels.
The prevalence of stunting is currently highest in Eastern Africa, Middle Africa, Western Africa, Southern Asia and Oceania (excluding Australia and New Zealand), where more than 30 percent of children under five are too short
for their age. From 2005 to 2016, most regions achieved reductions in stunting, with the rate of improvement fastest in Asia (particularly Eastern and Central Asia) and Latin America and the Caribbean. The prevalence of stunting also declined in all subregions in Africa, but at a much slower rate. In fact, the rate of decline in stunting in Africa has not kept pace with population increases, resulting in a higher number of stunted children overall. In absolute terms, Africa is the only region where
Middle A
frica
Easter
n Afric
a
Norther
n Afric
a
Southe
rn Afr
ica
Western
Africa
7.3 6.57.9 5.58.5
Centra
l Asia3
Easter
n Asia2
Southe
rn Asi
a
South-
Easter
n Asia
Western
Asia
3.8 1.915.4 8.9 3.9
Caribb
ean3
Centra
l Americ
a
South A
merica3
3.00.9
1.3
North A
merica5
Oceania
4
0.59.4
2 4 6 8 10
2016
0
7.7
0
5
10
15
20
REGI
ONAL
GLOB
ALSU
BREG
IONA
L
2016
ASIA2
9.9
2016
LATIN AMERICAAND THE CARIBBEAN
2016
AFRICA
7.4
PERCENTAGE
PERC
ENTA
GE
OTHER REGIONS
1.3
1 Prevalence of wasting in children aged under five years, 2016. 2 Asia and Eastern Asia excluding Japan. 3 Central Asia, South America and Caribbean have consecutive low population coverage for the 2016 estimate, interpret with caution.
FIGURE 5RATES OF CHILD WASTING REMAIN INORDINATELY HIGH IN SOME SUBREGIONS, ESPECIALLY IN SOUTHERN ASIA1
4 Oceania excludes Australia and New Zealand. 5 The North America regional average is based only on United States data and hence confidence intervals are not available.SOURCE: UNICEF/WHO/World Bank Group Joint Child Malnutrition Estimates, 2017 edition.
| 16 |
THE STATE OF FOOD SECURITY AND NUTRITION IN THE WORLD 2017
the number of stunted children has risen, with Western Africa accounting for half of this increase. The vast majority of stunted children live in Asia (87 million) and Africa (59 million) (Figure 4).
Among the key determinants of stunting are: compromised maternal health and nutrition before and during pregnancy and lactation, inadequate breastfeeding, poor feeding practices for infants and young children, and unhealthy environments for children, including poor hygiene and sanitation.
Accordingly, stunting (as well as wasting, overweight and micronutrient deficiencies) can be addressed through preventive actions, including by ensuring that pregnant and lactating mothers are adequately nourished, that infants receive exclusive breastfeeding during the first six months of life, and that complementary foods are available in adequate quantities, quality, and variety for children aged 6–23 months. To reduce stunting, it is essential to focus nutrition interventions on the first 1 000 days of life – from conception to the age of two years – and improve access to quality health services for maternal and child health. Other steps may be needed to prevent infections and illnesses from negatively affecting nutritional status, such as improving access to safe water, awareness of safe disposal of child faeces, and basic hygiene (e.g. access to soap).
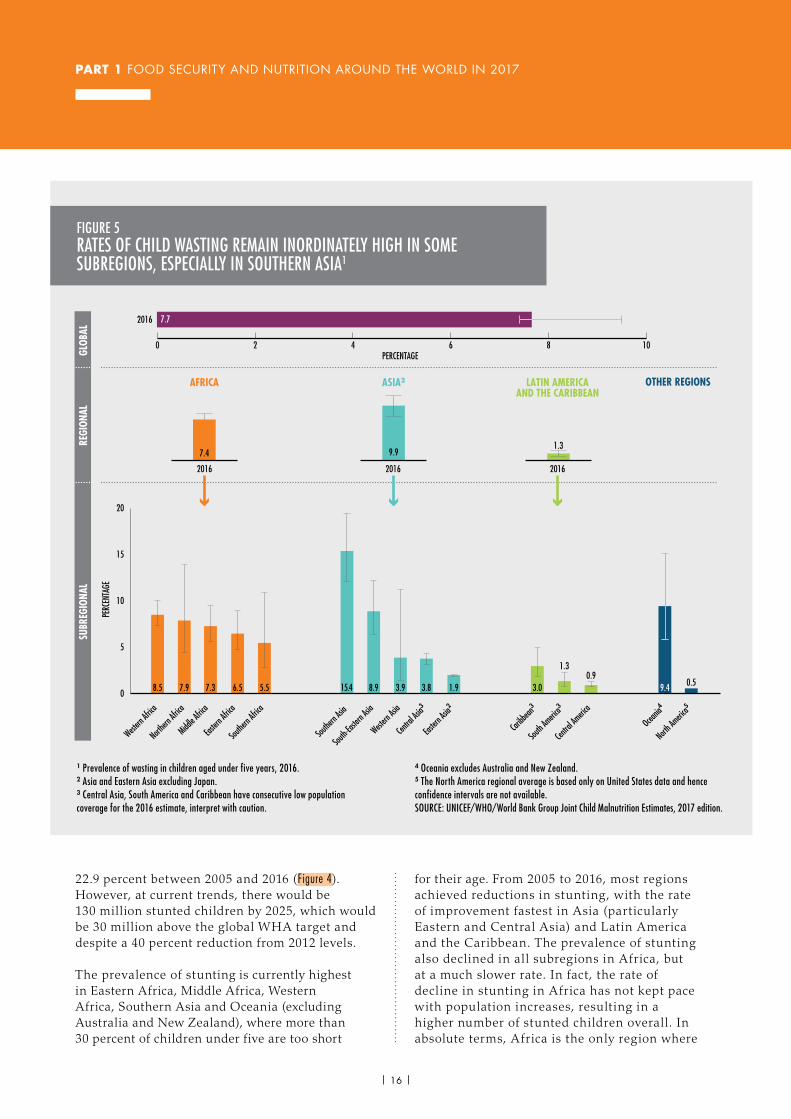
Wasting among children under five years of age Childhood wasting, or being too thin for one’s height, ref lects a recent and acute process that leads to weight loss and/or poor weight gain. Wasting usually results from low birth weight, inadequate diet, poor care practices and infections. It is of critical importance due to the consequent heightened risk of disease and death. It will be diff icult to continue improving child survival without investing in preventive interventions to reduce the number of children suffering from wasting, while ensuring timely and appropriate life-saving treatment for children affected by severe wasting.
The internationally agreed global nutrition target is to reduce and maintain childhood wasting to below 5 percent by 2025. In 2016, wasting affected 7.7 percent (51.7 million) of children under f ive years of age worldwide. About 17 million children suffered from severe wasting. Southern Asia stands out with a high prevalence of 15.4 percent – well above that of any other subregion. At 8.9 percent, South-Eastern Asia is also far off target. While the prevalence is somewhat lower in Africa, it stil l stands above the global nutrition target (Figure 5).
Overweight among children under five years of ageChildhood overweight, or being too heavy for one’s height, ref lects a chronic process of excessive weight gain. Overweight children are at a higher risk of developing serious health problems, including type 2 diabetes, high blood pressure, asthma and other respiratory problems, sleep disorders and liver disease. Childhood overweight also increases the risk of obesity, diet-related non-communicable diseases, premature death, and disability in adulthood. The economic costs of the rising epidemics of childhood overweight and obesity are considerable, both in terms of the enormous financial strains on healthcare systems and of lost productivity. Reversing obesity and overweight is a serious challenge: the emphasis must be on prevention.
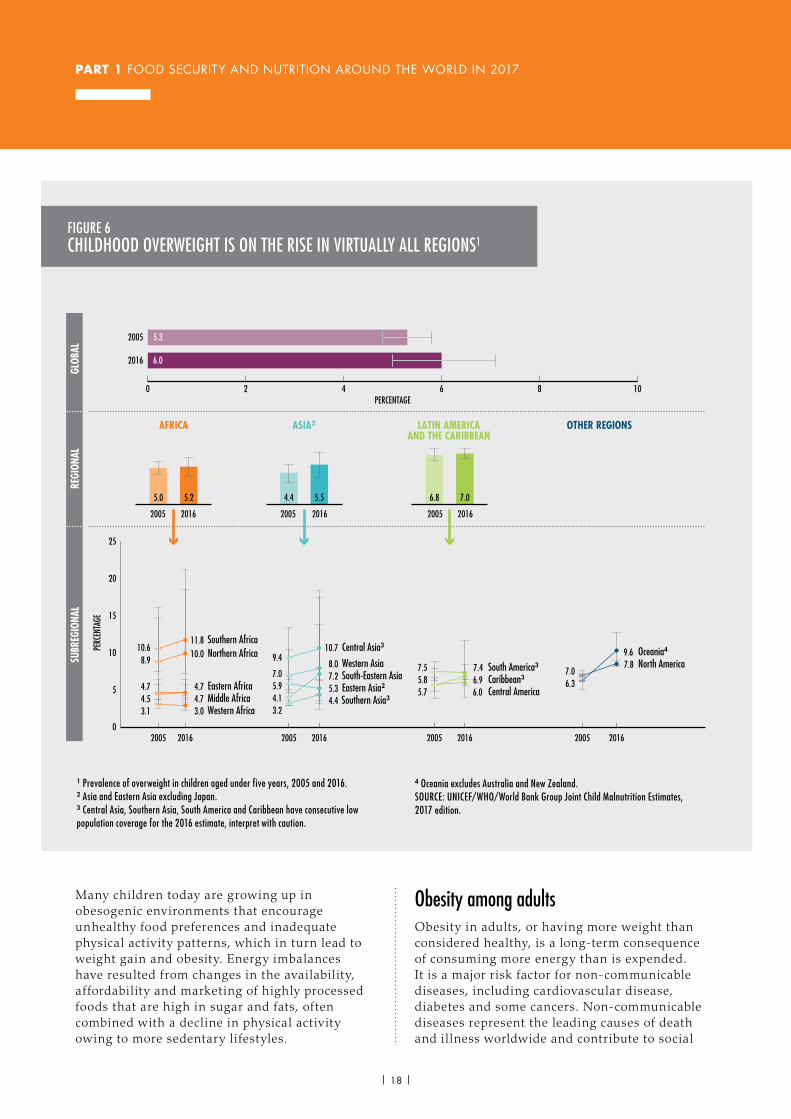
Worldwide, an estimated 41 million children (about 6 percent) under f ive were considered overweight in 2016, up from 5 percent in 2005 (Figure 6). While this may seem a small increase, most subregions show an upward trend. In 2016, the prevalence of childhood overweight reached almost 12 percent in Southern Africa, 11 percent in Central Asia, 10 percent in Northern Africa, 8 percent in Northern America, and 7 percent in South-Eastern Asia and South America. Only Western Africa, South America and Eastern Asia recorded slight declines between 2005 and 2016. In Eastern Africa, the prevalence remained constant at 4.7 percent. All other regions registered increases in the prevalence of childhood overweight, the fastest-rising being in South-Eastern Asia and Oceania.
| 17 |
PART 1 FOOD SECURITY AND NUTRITION AROUND THE WORLD IN 2017
Many children today are growing up in obesogenic environments that encourage unhealthy food preferences and inadequate physical activ ity patterns, which in turn lead to weight gain and obesity. Energy imbalances have resulted from changes in the availability, affordability and marketing of highly processed foods that are high in sugar and fats, often combined with a decline in physical activ ity owing to more sedentary lifestyles.
Obesity among adults Obesity in adults, or having more weight than considered healthy, is a long-term consequence of consuming more energy than is expended. It is a major risk factor for non-communicable diseases, including cardiovascular disease, diabetes and some cancers. Non-communicable diseases represent the leading causes of death and illness worldwide and contribute to social
2016
2005
0 2 4 6 8 10
0
5
10
15
20
25
Oceania4
North America
Eastern AfricaMiddle Africa
Northern AfricaSouthern Africa
Western Africa
Central Asia3
Caribbean3
Central America
South America3
10.69.4
10.7
Western Asia8.0South-Eastern Asia7.2Eastern Asia25.3Southern Asia34.4
7.5
9.6
7.06.3
7.46.96.0
5.85.7
7.05.94.13.2
11.810.0
4.74.73.0
8.9
4.74.53.1
20162005 20162005 20162005 20162005
5.3
6.0
20162005
AFRICA
5.0 5.2
20162005
LATIN AMERICAAND THE CARIBBEAN
6.8 7.0
20162005
ASIA2
4.4 5.5
7.8
REGI
ONAL
GLOB
ALSU
BREG
IONA
L
PERCENTAGE
PERC
ENTA
GE
OTHER REGIONS
FIGURE 6CHILDHOOD OVERWEIGHT IS ON THE RISE IN VIRTUALLY ALL REGIONS1
1 Prevalence of overweight in children aged under five years, 2005 and 2016. 2 Asia and Eastern Asia excluding Japan. 3 Central Asia, Southern Asia, South America and Caribbean have consecutive low population coverage for the 2016 estimate, interpret with caution.
4 Oceania excludes Australia and New Zealand.SOURCE: UNICEF/WHO/World Bank Group Joint Child Malnutrition Estimates, 2017 edition.
| 18 |
THE STATE OF FOOD SECURITY AND NUTRITION IN THE WORLD 2017
inequities. Available cost estimates also indicate overweight and obesity pose increasing burdens on individuals, families, and societies.5
While the SDG framework does not include a specific indicator for adult obesity, eliminating it is included in the target to end all forms of malnutrition. Reducing obesity will be important for achieving other SDG targets – such as ensuring healthy lives and promoting well-being for all (Target 3.4) – as well as for reducing death rates from non-communicable diseases through prevention and treatment.6
The global prevalence of obesity more than doubled between 1980 and 2014. In 2014, more than 600 million adults were obese, equal to about 13 percent of the world’s adult population. The prevalence is higher on average among women (15 percent) than men (11 percent). While it varies widely across regions of the world (Figure 7), the problem is most severe in Northern America, Europe and Oceania, where 28 percent of adults are classif ied as obese, compared with 7 percent in Asia and 11 percent in Africa. In Latin America and the Caribbean, roughly one-quarter of the adult population is currently considered obese.
Obesity has steadily increased in all regions since 1975, and the pace has accelerated in the past ten years. Global adult obesity rates increased by an average of one percentage point every three years between 2004 and 2014. Historically, the prevalence of adult obesity has been much lower in Africa and Asia, where only moderate increases were observed in the 1980s and 1990s. More recently, however, obesity has spread rapidly among larger parts of the population in these regions as well. Hence, while many low- and middle-income countries still face high levels of undernutrition and prevalence of infectious, communicable diseases, they are now also experiencing an increasing burden of people suffering from overweight and obesity and an associated rise in certain non-communicable diseases such as diabetes.
Changes in dietary patterns and food systems have led to increasing consumption of highly processed foods across the world. While
processed foods are not necessarily unhealthy, many contain high levels of saturated fats, salt and sugars, and tend to be low in vitamins and minerals. As a result, diets have become less healthy. At the same time, income growth and urbanization have led to more sedentary lifestyles, exacerbating imbalances in food energy intake and energy use. Poor nutrition in this sense of the word is now considered the major risk factor for the global burden of disease.7
Anaemia in women of reproductive ageAnaemia occurs when red blood cells are low in number and size, resulting in a state of haemoglobin concentration that limits the blood’s ability to transport oxygen around the body. This can be due to eating a diet that is low in micronutrient content (e.g. iron, folate, ribof lavin, and vitamins A and B12), acute and/or chronic infections (e.g. malaria, tuberculosis and HIV), other chronic diseases and cancer, or inherited genetic disorders that affect haemoglobin synthesis, red blood-cell production or red blood-cell survival. Anaemia is thus an indicator of both poor nutrition and poor health. Children and women are particularly vulnerable to anaemia.
Sustainable Development Goal Target 2.2 explicitly calls for the nutritional needs of adolescent girls and pregnant and lactating women to be addressed, as anaemia in women of reproductive age is a public health concern. The condition not only has significant adverse health consequences for women and their offspring, it can also affect social and economic development.8 When anaemia occurs during pregnancy, it causes fatigue, lowered productivity, increased risk of maternal and perinatal mortality, low birth weight, and anaemia and poor growth and development in young children. Anaemia is therefore closely linked to other SDG targets – lowering its prevalence will help to reduce maternal mortality (Target 3.1) and improve levels of economic productivity (Target 8.2). Meanwhile, achieving universal health coverage (Target 3.8) and increasing access to sexual and reproductive healthcare (Target 5.6) would also contribute to reducing the prevalence of anaemia. »
| 19 |

PART 1 FOOD SECURITY AND NUTRITION AROUND THE WORLD IN 2017
PREV
ALEN
CE O
F AN
AEM
IA (P
ERCE
NTAG
E)
0
5
10
15
20
25
30
35
40
45
2005 2016
Africa
Asia
Latin America and the Caribbean
North America and Europe
Oceania
World
NOTES: Prevalence of anaemia in women of reproductive age, 2005–2016. For country coverage for each region see Notes for Annex 1 (back cover fold-out).SOURCE: WHO Global Health Observatory, 2017.
FIGURE 8ANAEMIA AMONG WOMEN OF REPRODUCTIVE AGE IS A PERSISTENT PROBLEM
0
5
10
15
20
25
30
1975 1980 1985 1990 1995 2000 2005 2010 2014
Africa
Asia
Latin America and the Caribbean
North America and Europe
Oceania
World
PREV
ALEN
CE O
F OB
ESIT
Y IN
ADU
LTS
(PER
CENT
AGE)
NOTES: Prevalence of obesity in adults 18 years and over, 1975–2014.SOURCE: WHO/NCD-RisC and WHO Global Health Observatory Data Repository, 2017.
FIGURE 7ADULT OBESITY IS RISING EVERYWHERE AT AN ACCELERATING PACE
| 20 |
THE STATE OF FOOD SECURITY AND NUTRITION IN THE WORLD 2017
The most recent estimates for 2016 indicate that anaemia affects 33 percent of women of reproductive age globally (about 613 million women between 15 and 49 years of age). In Africa and Asia, the prevalence is highest at over 35 percent (Figure 8). It is lowest in Northern America and Europe, and Oceania (below 20 percent).
The global average of the prevalence of anaemia in women of reproductive age increased slightly between 2005 and 2016, although the increase was not statistically significant. It declined from 42 percent to 38 percent in Africa and from 25 percent to 22 percent in Latin America and the Caribbean, although this was offset by slight increases in all other regions. In 2012, the WHA set the target of halving the prevalence of anaemia in women of reproductive age by 2025. Progress so far has clearly been off track.
Exclusive breastfeeding for infants under six months of ageImproved rates of breastfeeding directly contribute to ending hunger and child malnutrition,9 and increasing the rate of exclusive breastfeeding by up to 50 percent in the first six months of life is one of the global nutrition targets endorsed by the WHA. Exclusive breastfeeding is part of optimal breastfeeding practices, which also include initiation within the first hour of life and continued breastfeeding up to two years old or beyond. Breastfeeding is a cornerstone of child survival and development as it provides essential irreplaceable nutrition for a child’s physical and cognitive growth. Breastfeeding helps to reduce child mortality, improve nutritional status, prevent common childhood illnesses and non-communicable diseases, and improve development and learning. It is considered to be the preventive intervention with the single largest impact on child survival.10 Breastfeeding also benefits mothers as it promotes uterine contraction, helps prevent postpartum haemorrhage, decreases the likelihood of developing iron-deficiency anaemia, and reduces the risk of various types of cancer.
According to a recent estimate, improving breastfeeding rates could prevent 820 000 child deaths and an additional 20 000 maternal cancer-
related deaths each year.11 Moreover, there is increasing evidence that breastfeeding decreases the risk of overweight and obesity later in life.12
Globally, 43 percent of infants younger than six months were exclusively breastfed in 2016, up from 36 percent in 2005.13 The prevalence of exclusive breastfeeding was highest in Southern Asia (59 percent) and Eastern Africa (57 percent). It is much lower in Latin America and the Caribbean (33 percent), Eastern Asia (28 percent), Western Africa (25 percent), and Western Asia (21 percent). Too few countries provided data on exclusive breastfeeding to report a regional average for Europe, North America or Oceania.
Between 2005 and 2015, the practice of exclusive breastfeeding increased by at least 10 percentage points in 36 out of 82 countries for which comparable data were available (Figure 9). In some countries (e.g. Burkina Faso, Guinea-Bissau, Kenya and Turkmenistan), the prevalence increased by more than 35 percentage points, providing evidence that it is feasible to achieve significant gains in exclusive breastfeeding in a short period of time. Overall, half of all countries in Africa with trend data exhibited an increase of 10 percentage points or more, and a greater proportion of countries in that region made increases in excess of 20 percentage points when compared to Europe or Latin America and the Caribbean. However, in many countries, more still needs to be done to improve breastfeeding practices. n
TOWARDS AN INTEGRATED UNDERSTANDING OF FOOD SECURITY AND NUTRITIONSo far, this report has provided an assessment of the state of food security and nutrition in the world based on an examination of two indicators of food security and six indicators on nutrition. However, fulf il l ing the ambitions of the the 2030 Agenda requires a proper understanding of the interrelationships among these indicators. Balanced diets are essential for improved
»
| 21 |

PART 1 FOOD SECURITY AND NUTRITION AROUND THE WORLD IN 2017
nutrition, health and well-being. The success of efforts to improve diets will depend on a better understanding of the complex relationships between food security and nutrition, the food systems in which they are embedded and the social, political and economic forces shaping them. The preliminary analyses in this section are intended to promote more integrated and critical thinking on these issues.
There is ample evidence that food insecurity and malnutrition in all its forms have multiple and diverse negative effects on health and well-being.14 Adverse impacts on mental health and cognitive and behavioural effects in children are also well documented. The nutrition indicators discussed in the previous section refer to different moments in the human life cycle, helping to shed light on the consequences
0
10
20
30
40
50
60
70
80
90
100
0
10
20
30
40
50
60
70
80
90
100
0
10
20
30
40
50
60
70
80
90
100
AFRICA ASIA
0
10
20
30
40
50
60
70
80
90
100EUROPELATIN AMERICA AND THE CARIBBEAN
PERC
ENTA
GE EX
CLUS
IVEL
Y BR
EAST
FED
(< 6
MON
THS)
PERC
ENTA
GE EX
CLUS
IVEL
Y BR
EAST
FED
(< 6
MON
THS)
PERC
ENTA
GE EX
CLUS
IVEL
Y BR
EAST
FED
(< 6
MON
THS)
PERC
ENTA
GE EX
CLUS
IVEL
Y BR
EAST
FED
(< 6
MON
THS)
Some increase (10–19 percentage-point increase)Large increase (≥ 20 percentage-point increase)No/minimal change (percentage point
change between −9 and +9)
Decline (> 10 percentage point decrease)2015
2005
1 Changes in prevalence of exclusive breastfeeding (< 6 months), by country and region, 2005–2015. NOTES: Analysis is based on a subset of 82 countries, with trend points around 2005 (2002–08) and around 2015 (2010–15). The number (percentage) of countries missing trend data by region is: Africa, 16 (32 percent); Asia, 26 (54 percent);
Latin America and the Caribbean, 20 (59 percent); Europe, 33 (80 percent); and Oceania, 17 (94 percent). A graph for Oceania is not shown as only one country had trend data in that region. No trend data exist for North America, Australia or New Zealand. SOURCE: UNICEF global databases 2016.
FIGURE 9EXCLUSIVE BREASTFEEDING HAS INCREASED DRAMATICALLY IN MANY COUNTRIES, YET REMAINS BELOW DESIRED LEVELS1
| 22 |
THE STATE OF FOOD SECURITY AND NUTRITION IN THE WORLD 2017
of food insecurity and malnutrition for health and development before birth, into infancy and on to adulthood.
The coexistence of food insecurity and obesity – even in the same household – is often seen as paradoxical, but there are many explanations for this. As resources for food become scarce, people often choose to eat lower-cost, less-healthy, more energy-dense foods, choices that can lead to people becoming overweight and obese as their means to access healthy food diminish.
Periodic episodes of food insecurity and deprivation can also lead to eating disorders and stress-related metabolic responses. This can in turn increase the risk of obesity and non-communicable chronic diseases such as cancer, diabetes, hypertension and heart disease. Food insecurity and poor nutrition during pregnancy and childhood are also associated with metabolic adaptations that increase the risk of obesity and associated non-communicable chronic diseases in adulthood. Readily available and accessible highly processed foods that are high in fat, sugar and salt, and shifts away from traditional diets toward convenience foods, further help explain the coexistence of multiple forms of malnutrition within the same communities and households.
While food insecurity at the household or individual level increases the risk of developing various forms of malnutrition, there are many mediating factors. All of the nutritional outcomes analysed here are affected in important ways by other elements, such as educational level, l ifestyle, food environment and habits, and access to clean water, basic sanitation and quality health services. In turn, undernutrition negatively affects cognitive development and child growth, leading to reduced levels of productivity and economic development.
As more and improved data become available in the years ahead, it will be possible to enhance knowledge of the links between the food security and nutrition indicators analysed below, the factors that mediate these links, and the actions needed to simultaneously promote both food security and better nutrition.
The multiple burden of malnutritionNo country is free from malnutrition, and most countries experience multiple burdens of malnutrition. Typically, data on child undernutrition, micronutrient deficiencies, child overweight and adult obesity are presented separately. This section aims to shed some light on the overlaps, as they ref lect the numerous issues that countries are facing.
Out of 119 countries with comparable data for at least 3 of the 6 nutrition indicators, only 2 (Japan and the Republic of Korea) experienced just one single form of malnutrition.15 Rates of prevalence of childhood stunting are positively correlated with childhood wasting and anaemia among women (Figures 10A–B). Similarly, countries with a high prevalence of childhood overweight also tend to have a high prevalence of adult obesity, while in countries that still have high rates of child stunting, adult obesity tends to be lower (Figures 10C–D)16.
Although this cross-country analysis indicates that lower prevalence of childhood stunting tends to be found in countries with a higher rate of adult obesity, many countries have high rates of both. For example, of the 107 countries with data on both stunting in under-five year olds and adult obesity, 35 have a prevalence of more than 10 percent in under-five stunting as well as more than 10 percent in adult obesity. In three countries (Egypt, Iraq and Vanuatu), more than 20 percent of the under-five population is stunted and more than 20 percent of adults are obese.
Therefore, tackling malnutrition in all its forms requires a country-specific combination of measures that leverage multiple sectors to address the underlying determinants of malnutrition, and target nutrition interventions to prevent or treat the direct determinants of malnutrition. Countries make progress when initiatives from multiple levels and sectors converge and reinforce each other.
Food insecurity and the multiple burden of malnutritionFood insecurity, or the inability of households and individuals to access food of adequate quantity and quality, is an important determinant
| 23 |
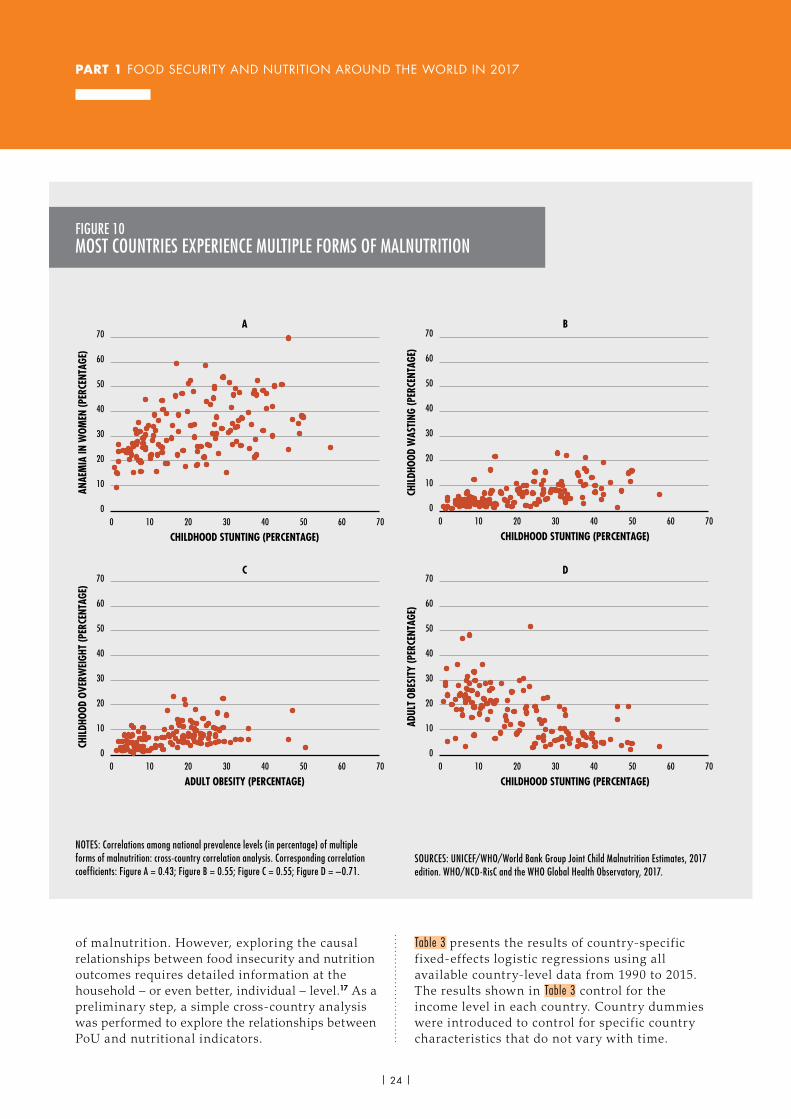
PART 1 FOOD SECURITY AND NUTRITION AROUND THE WORLD IN 2017
of malnutrition. However, exploring the causal relationships between food insecurity and nutrition outcomes requires detailed information at the household – or even better, individual – level.17 As a preliminary step, a simple cross-country analysis was performed to explore the relationships between PoU and nutritional indicators.
Table 3 presents the results of country-specific f ixed-effects logistic regressions using all available country-level data from 1990 to 2015. The results shown in Table 3 control for the income level in each country. Country dummies were introduced to control for specif ic country characteristics that do not vary with time.
0 10 20 30 40 50 60 70
ANAE
MIA
IN W
OMEN
(PER
CENT
AGE)
CHILDHOOD STUNTING (PERCENTAGE)
0
10
20
30
40
50
60
70
0 10 20 30 40 50 60 70
CHIL
DHOO
D OV
ERW
EIGH
T (P
ERCE
NTAG
E)
ADULT OBESITY (PERCENTAGE)
0
10
20
30
40
50
60
70
0 10 20 30 40 50 60 70
CHIL
DHOO
D W
ASTI
NG (P
ERCE
NTAG
E)
CHILDHOOD STUNTING (PERCENTAGE)
0
10
20
30
40
50
60
70
0
10
20
30
40
50
60
70
0 10 20 30 40 50 60 70
ADUL
T OB
ESIT
Y (P
ERCE
NTAG
E)
CHILDHOOD STUNTING (PERCENTAGE)
A B
C D
NOTES: Correlations among national prevalence levels (in percentage) of multiple forms of malnutrition: cross-country correlation analysis. Corresponding correlation coefficients: Figure A = 0.43; Figure B = 0.55; Figure C = 0.55; Figure D = –0.71.
SOURCES: UNICEF/WHO/World Bank Group Joint Child Malnutrition Estimates, 2017 edition. WHO/NCD-RisC and the WHO Global Health Observatory, 2017.
FIGURE 10MOST COUNTRIES EXPERIENCE MULTIPLE FORMS OF MALNUTRITION
| 24 |

THE STATE OF FOOD SECURITY AND NUTRITION IN THE WORLD 2017
The results show that countries with higher levels of undernourishment also show higher levels of stunting and wasting. In contrast, higher levels of undernourishment are associated with lower levels of child overweight and adult obesity.
The results in Table 3 suggest that adult obesity is more prevalent in countries with a low PoU. Many Pacific Island countries and territories are outliers, showing much higher adult obesity rates (in the range of 40–50 percent) than those of other countries with a similar prevalence of undernourishment.
The negative association between food insecurity and obesity is confirmed when using cross-country data for the prevalence of severe food insecurity in the population as measured with the FIES. However, the findings differ when countries are grouped by income level. This is consistent with the growing body of literature showing that food insecurity at the household level is associated with obesity.18 Among high- and upper-middle-income countries, the adult obesity rates are higher in countries where the prevalence of severe food insecurity (measured by the FIES) is also comparatively higher (Figure 11). Understanding the reasons for this requires an analysis of the association between food security and obesity at the household and individual level, as well as of the multiple mediating factors. This is possible when the FIES survey module is included in national health and nutrition surveys or in household consumption and expenditure surveys. Existing evidence from higher-income countries suggests that food-insecure people rely on lower-cost, less-healthy, energy-dense
foods, and are also at higher risk of eating disorders and stress-related metabolic responses, all of which can lead to obesity. n
STRENGTHENING THE EVIDENCE BASE TO MONITOR FOOD SECURITY AND NUTRITIONBringing food security and nutrition under one single goal in the 2030 Agenda has catalysed efforts at coming to an integral understanding of these fundamental ingredients of human well-being. While ample data are already available, many more are needed in order to come to a fuller understanding. In particular, improved coordination is needed at the national, regional and global levels to produce data capable of shedding more light on the links between food insecurity and malnutrition and their determinants.
The simple correlates presented in the previous section suggest that when people face food insecurity, they are also likely to be at risk for various forms of malnutrition. However, nutritional outcomes are inf luenced by many other factors as well, such as physical activ ity, l ifestyle, food preferences, food environments, women’s education, and access to clean water, basic sanitation and quality health services.
Incongruent timing in data collection is one of the limitations of such country-level analysis of food insecurity and nutrition indicators. For
TABLE 3RELATIONSHIP BETWEEN PREVALENCE OF UNDERNOURISHMENT (PoU) AND MALNUTRITION INDICATORS
Nutritional variable Log-odds of PoU (p-value in parentheses)
Stunting (in log-odds) (Adjusted R-squared=0.66) 0.254 (<0.001)
Child overweight (in log-odds) (Adjusted R-squared=0.16) –0.233 (0.02)
Wasting (in log-odds) (Adjusted R-squared=0.34) 0.174 (0.01)
Adult obesity (in logs) (Adjusted R-squared=0.51) –0.224 (<0.001)
NOTES: The table reports standardized coefficients; p-values in parentheses. Fixed-effect logit regression based on panel country data from 1990 to 2015. Estimates are controlled for the level of GDP per capita. SOURCE: FAO.
| 25 |
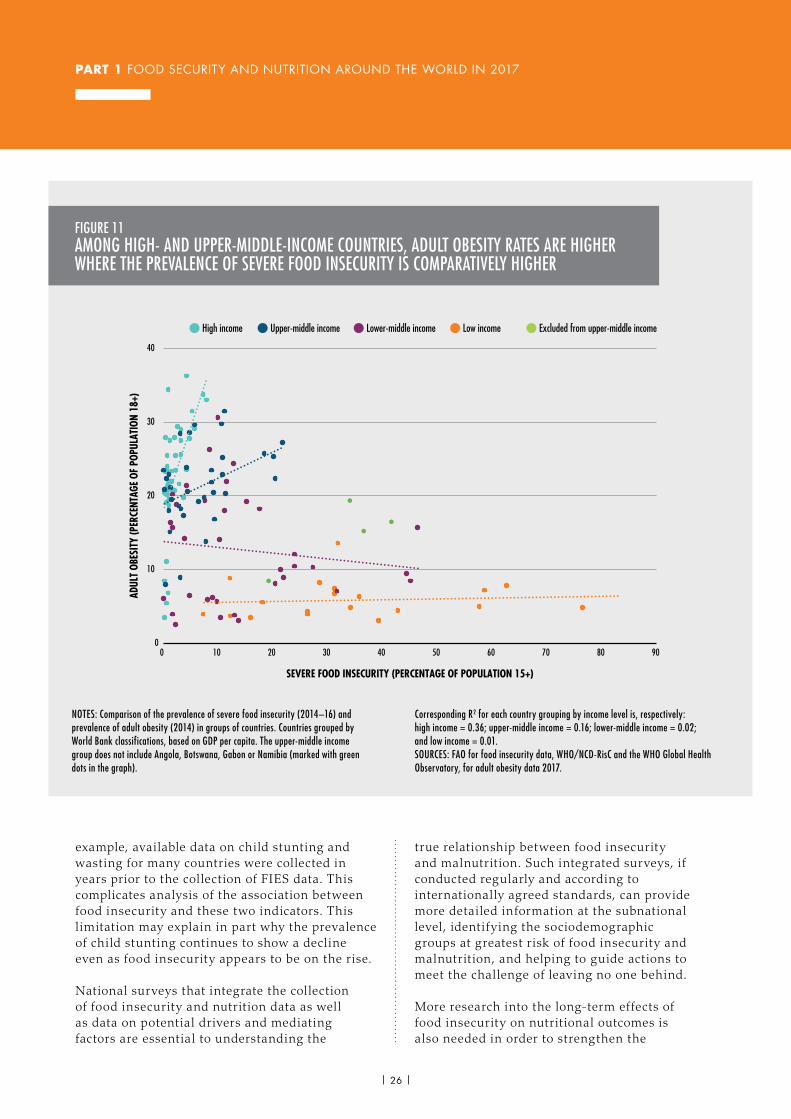
PART 1 FOOD SECURITY AND NUTRITION AROUND THE WORLD IN 2017
example, available data on child stunting and wasting for many countries were collected in years prior to the collection of FIES data. This complicates analysis of the association between food insecurity and these two indicators. This limitation may explain in part why the prevalence of child stunting continues to show a decline even as food insecurity appears to be on the rise.
National surveys that integrate the collection of food insecurity and nutrition data as well as data on potential drivers and mediating factors are essential to understanding the
true relationship between food insecurity and malnutrition. Such integrated surveys, if conducted regularly and according to internationally agreed standards, can provide more detailed information at the subnational level, identifying the sociodemographic groups at greatest risk of food insecurity and malnutrition, and helping to guide actions to meet the challenge of leaving no one behind.
More research into the long-term effects of food insecurity on nutritional outcomes is also needed in order to strengthen the
ADUL
T OB
ESIT
Y (P
ERCE
NTAG
E OF
POP
ULAT
ION
18+)
SEVERE FOOD INSECURITY (PERCENTAGE OF POPULATION 15+)
Excluded from upper-middle incomeUpper-middle income Lower-middle income Low incomeHigh income
0
10
20
30
40
0 10 20 30 40 50 60 70 80 90
NOTES: Comparison of the prevalence of severe food insecurity (2014–16) and prevalence of adult obesity (2014) in groups of countries. Countries grouped by World Bank classifications, based on GDP per capita. The upper-middle income group does not include Angola, Botswana, Gabon or Namibia (marked with green dots in the graph).
Corresponding R2 for each country grouping by income level is, respectively: high income = 0.36; upper-middle income = 0.16; lower-middle income = 0.02; and low income = 0.01.SOURCES: FAO for food insecurity data, WHO/NCD-RisC and the WHO Global Health Observatory, for adult obesity data 2017.
FIGURE 11AMONG HIGH- AND UPPER-MIDDLE-INCOME COUNTRIES, ADULT OBESITY RATES ARE HIGHER WHERE THE PREVALENCE OF SEVERE FOOD INSECURITY IS COMPARATIVELY HIGHER
| 26 |
THE STATE OF FOOD SECURITY AND NUTRITION IN THE WORLD 2017
evidence base. The hope is that including food insecurity and nutrition indicators in the SDG monitoring framework will provide the necessary impetus for national governments, international donors and development partners to prioritize such data-collection efforts to build a stronger evidence base. n
PROGRESS HAS SLOWED, NEW CONCERNS HAVE EMERGEDIn summary, the evidence presented in Part 1 reveals a global scenario of a possible recent uptick in hunger. Child undernutrition has continued to decline, but rates are still unacceptably high in some regions. The increasing prevalence of overweight among children and the accelerated rise in obesity among adults are of major concern. Almost all countries in the world are experiencing multiple forms of malnutrition simultaneously, and food insecurity often coexists with obesity.
Globally, cross-country analysis shows that rates of adult obesity are lower in countries with higher rates of food insecurity. However, within the group of upper-middle-and high-income countries, where more than one-quarter of the adult population are obese, the highest rates of obesity are associated with relatively higher rates of severe food insecurity. Childhood overweight is highest in Central Asia and Northern Africa, suggesting future problems with adult obesity in these regions as well. The regions most affected by nutritional deficiencies are Africa and Asia, where more than one in three women suffer from anaemia and almost one-quarter of the population of children under f ive are stunted.
The drivers behind these trends in food insecurity and malnutrition differ from country to country and even within countries. Food systems and diets are changing. As large companies increasingly dominate markets, highly processed foods become more readily available, and traditional foods and eating habits are displaced. Weather-related events – in part
linked to climate change – have affected food availability in many countries and contributed to the rise in food insecurity. Economic slowdowns in countries highly dependent on oil and other primary-commodity export revenues have also had an impact on food availability and/or reduced people’s ability to access food.
Malnutrition is not only the result of a lack of access to sufficient, nutritious and safe food. It also derives from a series of interlinked factors related to inadequate access to resources and services, such as quality healthcare, education, drinking-water, sanitation and hygiene. Poor women often face additional hurdles to access resources and services. Compelling evidence shows that improving women’s education and status within their households and communities has a direct positive impact on food nutrition and security, in particular child nutrition.
Another increasingly important cause of food insecurity and malnutrition is conf lict. People liv ing in countries affected by conf lict and violence are more likely to be food insecure and malnourished, particularly in those countries characterized by protracted conf lict and fragile institutions.
Part 2 of this report takes a closer look at the specific challenges facing these countries, and the relationship between hunger, conf lict and peace. It highlights the need for conf lict-sensitive approaches to improving food security and nutrition, based on a deeper understanding of the dynamics of conf lict in each context. More fundamentally, it points to a need to f ind lasting solutions to conf lict if the world is to end hunger and achieve food security and improved nutrition for all. n
| 27 |
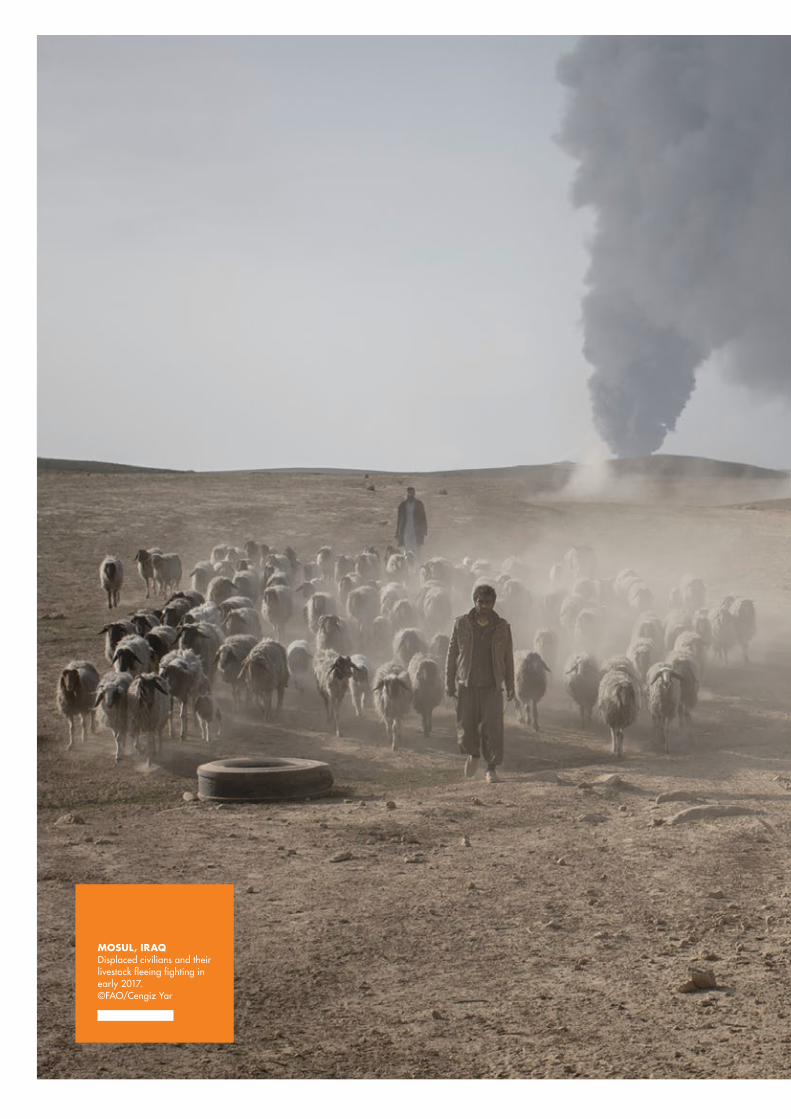
MOSUL, IRAQDisplaced civilians and their livestock fleeing fighting in early 2017.©FAO/Cengiz Yar
Key messagesè With the increasing concentration of hunger and undernutrition in countries affected by conflict, it is imperative to have a clearer understanding of the relationship between hunger, conflict and peace.
è The vast majority of the chronically food insecure and malnourished live in countries affected by conflict: an estimated 489 million of 815 million undernourished people and an estimated 122 million of 155 million stunted children.
è Hunger and undernutrition are significantly worse where conflicts are prolonged and compounded by weak institutional capacity and/or adverse climate-related events.
è While most countries have achieved significant 25-year gains in reducing hunger and undernutrition, progress in the majority of countries affected by conflict has stagnated or deteriorated.
è Conflict is a common denominator in situations of severe food crisis and recent famine.
è In the past decade, conflicts have increased in number and complexity, hampering efforts to end hunger by 2030.
PART 2 CONFLICT, FOOD SECURITY AND
NUTRITION: THE IMPERATIVE OF SUSTAINABLE
PEACE
PART 2
Part 2 of this year’s The State of Food Security and Nutrition in the World provides a review of the evidence on how conflict affects food security and nutrition, and how deteriorations in food security conditions can exacerbate conflict, particularly when combined with other factors. In addition, it explores how conflict-sensitive approaches to food security and nutrition can make a vital contribution to sustaining peace and preventing conflict.
WHY FOCUS ON THE NEXUS BETWEEN CONFLICT, FOOD SECURITY AND NUTRITION? In 2016, more than 100 million people were reported as facing crisis-level food insecurity, up from 80 million the preceding year.19 In early 2017, a famine was declared in South Sudan and alerts were issued for high risk of famine-like conditions in northeast Nigeria, in Somalia and in Yemen. Conflict and civil war are common denominators in all these cases, as they are in most other countries facing food crises. Moreover, FAO currently classifies 19 countries with a protracted crisis (see Box 6). All 19 countries are also currently affected by conflict and violence, which is typically compounded by adverse climatic events, such as prolonged droughts, that severely affect food production and livelihoods.
Conflict and violence have led to the displacement of millions of people, causing and protracting food insecurity in host communities. For example, the civil war in the Syrian Arab Republic has caused more than 6 million people to f lee their homes to other locations within the country and another
5 million to neighbouring countries.20 Displaced people today spend an average of more than 17 years in camps or with host communities.21
In 2016, more than 2 billion people were living in countries affected by conflict, violence and fragility. When the state, socio-economic systems and/or local communities do not have the capacities to prevent, cope with or manage situations of conflict, the worst affected are generally the poorest and most vulnerable sectors of society. The World Bank and Organisation for Economic Co-operation and Development (OECD) estimate that by 2030 high population growth rates and weak economic development could mean the poor will come to represent half or more of the total population living in fragile and conflict-affected situations.22
People living in countries affected by conflict are more likely to be food insecure and undernourished. The latest FAO estimates for 2016, as reported in Part 1, indicate that 815 million people in the world – or just over one in nine – are undernourished. The majority of these (489 million) live in countries struggling with conflict, violence and fragility, where the prevalence of undernourishment is higher than in countries not affected by conflict. More strikingly, while most countries have achieved significant 25-year gains in reducing hunger and undernutrition, such progress has stagnated or deteriorated in most countries experiencing conflict. Conflict is a key factor explaining the apparent reversal in the long-term declining trend in global hunger, thereby posing a major challenge to ending hunger and malnutrition. The number of conflicts is increasing and the world is becoming more violent, in increasingly intractable ways.23 The 2016 Global Peace Index Report concluded that the world is less peaceful now than it was in 2008, with year-on-year levels of peace having declined in five out of the last eight years.24
CONFLICT, FOOD SECURITY AND NUTRITION: THE IMPERATIVE OF SUSTAINABLE PEACE
| 30 |

THE STATE OF FOOD SECURITY AND NUTRITION IN THE WORLD 2017
With the increasing concentration of hunger and undernutrition in countries in fragile situations and those affected by conf lict, it is imperative to have a clearer understanding of the relationship between hunger, conf lict and peace. This understanding should then inform conf lict-sensitive approaches25 in designing interventions and policies that address hunger and undernutrition in such environments, while providing incentives for sustaining peace.
The 2030 Agenda: advancing progress through conflict-sensitive approachesThe 2030 Agenda for Sustainable Development makes an explicit link between sustainable development and peace and calls for a transformative approach, with improved collaboration on conflict prevention, mitigation, resolution and recovery. The 2030 Agenda
recognizes peace as a vital condition for development, as well as a development outcome in its own right. As conflicts can inhibit sustainable development, food security and nutrition, SDG 16 specifically aims to significantly reduce all forms of violence, including by working with countries and communities to find lasting solutions to conflict and insecurity.
The universality, breadth and indivisibility of the SDGs have important implications for work on food security and nutrition in conflict-affected settings. SDGs 1 and 2 focus on the eradication of extreme poverty and hunger, achieving food and nutrition security, and making agriculture sustainable. Achieving these goals is critical for achieving SDG 16 and ensuring peaceful and inclusive societies, leaving no one behind. Correspondingly, achieving SDG 16 will be crucial to meeting SDGs 1 and 2, as well as other SDGs.
FAO currently identifies 19 countries with a protracted crisis situation. Of these, 14 have been in this category since 2010, 11 of which are in Africa. Protracted crises are contexts in which a significant proportion of the population is acutely vulnerable to hunger, disease and disruptions to livelihoods over prolonged periods.1 The 2010 and 2015 editions of The State of Food Insecurity in the World identified countries with a protracted crisis as deserving special attention, given the extreme severity and persistence of food insecurity and undernutrition they suffer.
Conflict and violence are key determinants of most protracted crises. Almost all countries with a protracted crisis have experienced some form of violent conflict over prolonged periods (see Annex Table A2.2, p. 105). These countries have suffered from conflict for 10.5 years on average over the last
two decades. In six contexts, conflict has been ongoing for at least 18 of the last 20 years.
Most of these countries have witnessed multiple types of conflict over time, with many experiencing different forms simultaneously and/or overlapping but in varying geographical locations. Almost all have experienced periods of low-intensity conflict, often combined with periods of higher-intensity violent conflict (i.e. war or limited war). These conflicts cause higher deaths rates, greater numbers of refugees / internally displaced populations and more destruction of infrastructure, housing, economy and culture.
However, conflict is not the only common characteristic of protracted crisis situations. Most are also characterized by very weak governance, breakdown of local institutions, poor health of the affected populations, and high prevalence of natural disasters.
BOX 6COMPLEX, MULTIDIMENSIONAL AND PROLONGED CONFLICTS AND EXTREME FRAGILITY: THE CASE OF PROTRACTED CRISES
1 A. Harmer and J. Macrae, eds. 2004. Beyond the continuum: aid policy in protracted crises. HPG Report No. 18. London, Overseas Development Institute.
| 31 |
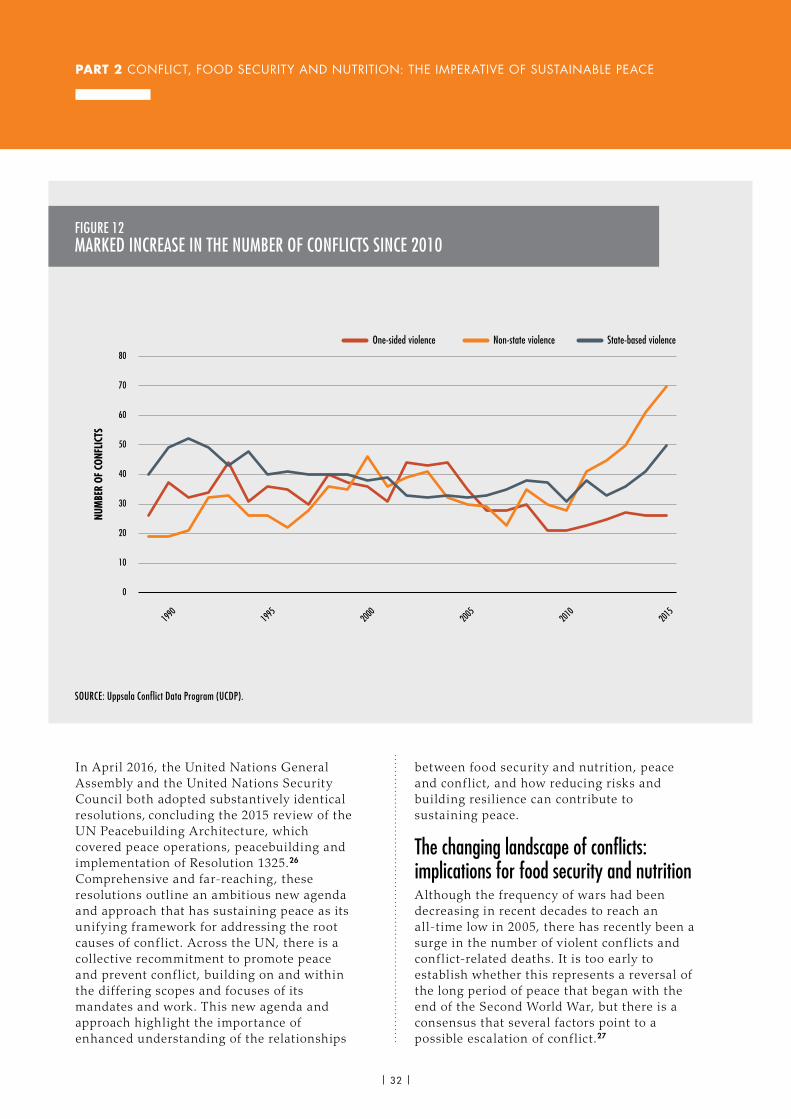
PART 2 CONFLICT, FOOD SECURITY AND NUTRITION: THE IMPERATIVE OF SUSTAINABLE PEACE
In April 2016, the United Nations General Assembly and the United Nations Security Council both adopted substantively identical resolutions, concluding the 2015 review of the UN Peacebuilding Architecture, which covered peace operations, peacebuilding and implementation of Resolution 1325.26 Comprehensive and far-reaching, these resolutions outline an ambitious new agenda and approach that has sustaining peace as its unifying framework for addressing the root causes of conf lict. Across the UN, there is a collective recommitment to promote peace and prevent conf lict, building on and within the differing scopes and focuses of its mandates and work. This new agenda and approach highlight the importance of enhanced understanding of the relationships
between food security and nutrition, peace and conf lict, and how reducing risks and building resilience can contribute to sustaining peace.
The changing landscape of conflicts: implications for food security and nutrition Although the frequency of wars had been decreasing in recent decades to reach an all-time low in 2005, there has recently been a surge in the number of v iolent conf licts and conf lict-related deaths. It is too early to establish whether this represents a reversal of the long period of peace that began with the end of the Second World War, but there is a consensus that several factors point to a possible escalation of conf lict.27
One-sided violence Non-state violence State-based violence
0
10
20
30
40
50
60
70
80
1990
1995
2000
2005
2010
2015
NUM
BER
OF C
ONFL
ICTS
SOURCE: Uppsala Conflict Data Program (UCDP).
FIGURE 12MARKED INCREASE IN THE NUMBER OF CONFLICTS SINCE 2010
| 32 |
THE STATE OF FOOD SECURITY AND NUTRITION IN THE WORLD 2017
The number of conf licts and of displaced populations caused by internal or intrastate conf lict are two worrying signs that current trends are likely to continue over the coming years. Violent conf licts have increased dramatically since 2010 and are currently at an all-time high (Figure 12). Of these, non-state conf licts – between two organized armed groups of which neither is the government or a state – have increased by 125 percent since 2010, surpassing all other types of conf lict. State-based conf lict also rose by over 60 percent in the same period.28
Civil wars or internal conf licts have now surpassed the number of interstate or external conf licts between states. In other words, there has been a shift away from conf lict between nations to conf licts within nations. However, this trend is matched by a clear and significant rise in the number of internationalized internal conf licts. In 1991, internationalized internal conf licts amounted to just 3 percent of total conf licts, a number that soared to 32.5 percent in 2014.29 As internal conf licts become more prominent, external parties are increasingly likely to become involved or to suffer the consequences of v iolence; thus, local conf licts evolve into regional or even continental crises.
Coupled with large outflows of displaced people, the entanglement of external international actors in state conflicts shows that even internal conflicts cannot be quarantined, with their repercussions being felt across borders and even continents. Similarly, the implications of conflict-induced food insecurity are no longer limited to specific countries or regions – they are now global. The number of refugees and internally displaced persons (IDPs) has increased significantly with the greater number of conflicts, doubling from 2007 to 2016 to total about 64 million people. There are now nine countries with more than 10 percent of their population classified as refugees or displaced persons, with Somalia and South Sudan having more than 20 percent of their population displaced, and the Syrian Arab Republic more than 60 percent displaced.30
Violence and conf lict are unevenly distributed across continents, with most concentrated in four regions: the Near East and North Africa, northern sub-Saharan Africa, Central America, and Eastern Europe, particularly Ukraine. However, v iolence and conf lict are spilling across borders, and cross-border networks of armed actors are enabling collaboration. Many of the most protracted conf licts f low across borders and are regional in nature, including in the Horn of Africa, the Great Lakes region of Africa, between Afghanistan, India and Pakistan, and from Cameroon, Chad and northern Nigeria across the Sahel. Conflicts in Africa mapped over time and by magnitude give a startling picture of their cross-border and regional nature (Figure 13).31
The nature and dynamics of conf licts and violence are often changeable. Even in seemingly calm post-conf lict contexts, v iolence can resurge in a different form, in another setting or with other actors involved. Development outcomes, including food security and nutrition, continue to deteriorate in such contexts, particularly if the drivers remain unaddressed, as this can prolong conf licts and make them recurrent.32
Experience shows that in some contexts the perpetrators of v iolence can reappear in the post-conf lict period to take economic and political advantage of continued fragile and vulnerable environments. The Central African Republic is an example of the complexity and intractability of so-called conf lict and violence traps and the impact these have on food security and nutrition: half of the population currently faces hunger, which poses a threat not only to those suffering but also to the stabilization process in the entire country.
Many of today’s conf licts are localized, in that they affect only certain areas or regions of a country and thereby affect livelihoods on a local scale. The ongoing low-intensity insurgency in the Casamance region in Senegal, for example, is a highly localized conf lict that affects only a very small portion of the country and the intensity of which varies from year to year.33 »
| 33 |

PART 2 CONFLICT, FOOD SECURITY AND NUTRITION: THE IMPERATIVE OF SUSTAINABLE PEACE
Communal militiasCONFLICT AGENT TYPE: Government forces Rebels Political militias
(unit = reported conflict events)
800
600
400
200
1
NOTES: Conflict events in Africa, 1997–2015. The final boundary between the Republic of the Sudan and the Republic of South Sudan has not yet been determined.SOURCE: Armed Conflict Location and Event Data Project (ACLED).
FIGURE 13MOST CONFLICTS CROSS BORDERS AND ARE REGIONAL IN NATURE
| 34 |
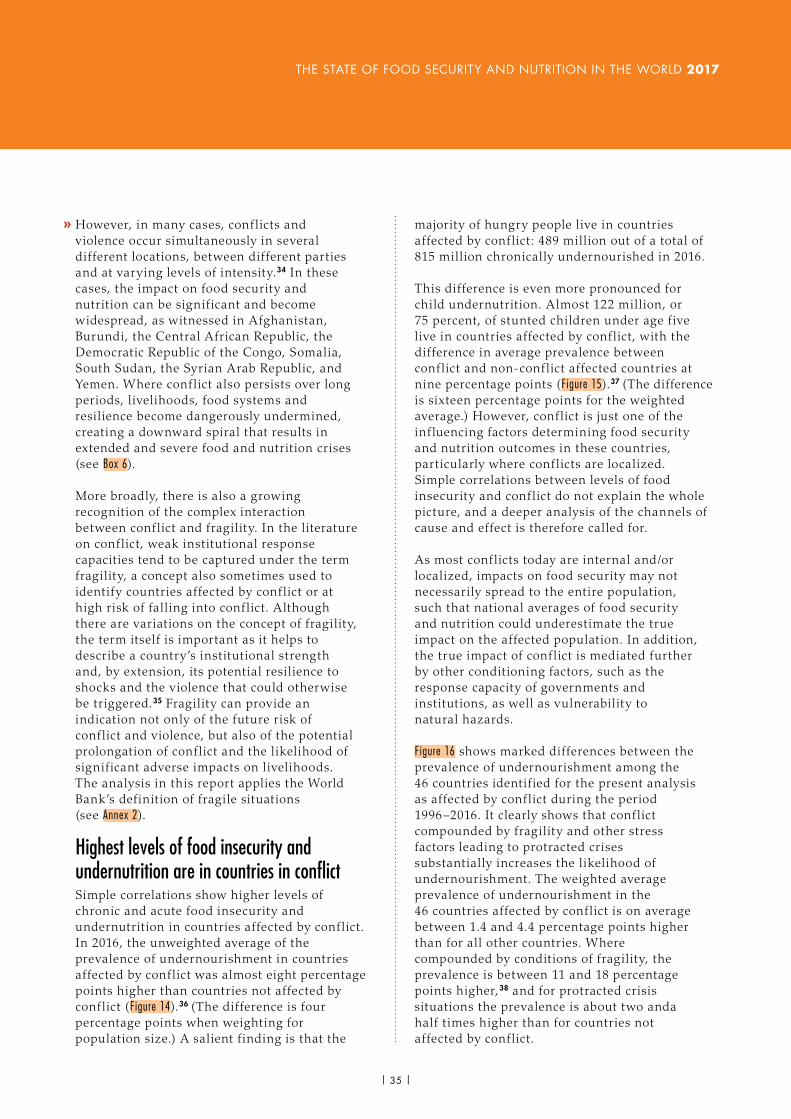
THE STATE OF FOOD SECURITY AND NUTRITION IN THE WORLD 2017
However, in many cases, conf licts and violence occur simultaneously in several different locations, between different parties and at varying levels of intensity.34 In these cases, the impact on food security and nutrition can be significant and become widespread, as witnessed in Afghanistan, Burundi, the Central African Republic, the Democratic Republic of the Congo, Somalia, South Sudan, the Syrian Arab Republic, and Yemen. Where conf lict also persists over long periods, livelihoods, food systems and resilience become dangerously undermined, creating a downward spiral that results in extended and severe food and nutrition crises (see Box 6).
More broadly, there is also a growing recognition of the complex interaction between conf lict and fragility. In the literature on conf lict, weak institutional response capacities tend to be captured under the term fragility, a concept also sometimes used to identify countries affected by conf lict or at high risk of falling into conf lict. Although there are variations on the concept of fragility, the term itself is important as it helps to describe a country’s institutional strength and, by extension, its potential resilience to shocks and the violence that could otherwise be triggered.35 Fragility can provide an indication not only of the future risk of conf lict and violence, but also of the potential prolongation of conf lict and the likelihood of significant adverse impacts on livelihoods. The analysis in this report applies the World Bank’s definition of fragile situations (see Annex 2).
Highest levels of food insecurity and undernutrition are in countries in conflictSimple correlations show higher levels of chronic and acute food insecurity and undernutrition in countries affected by conf lict. In 2016, the unweighted average of the prevalence of undernourishment in countries affected by conf lict was almost eight percentage points higher than countries not affected by conf lict (Figure 14).36 (The difference is four percentage points when weighting for population size.) A salient f inding is that the
majority of hungry people live in countries affected by conf lict: 489 million out of a total of 815 million chronically undernourished in 2016.
This difference is even more pronounced for child undernutrition. Almost 122 million, or 75 percent, of stunted children under age five live in countries affected by conf lict, with the difference in average prevalence between conf lict and non-conf lict affected countries at nine percentage points (Figure 15).37 (The difference is sixteen percentage points for the weighted average.) However, conf lict is just one of the inf luencing factors determining food security and nutrition outcomes in these countries, particularly where conf licts are localized. Simple correlations between levels of food insecurity and conf lict do not explain the whole picture, and a deeper analysis of the channels of cause and effect is therefore called for.
As most conf licts today are internal and/or localized, impacts on food security may not necessarily spread to the entire population, such that national averages of food security and nutrition could underestimate the true impact on the affected population. In addition, the true impact of conf lict is mediated further by other conditioning factors, such as the response capacity of governments and institutions, as well as vulnerability to natural hazards.
Figure 16 shows marked differences between the prevalence of undernourishment among the 46 countries identif ied for the present analysis as affected by conf lict during the period 1996–2016. It clearly shows that conf lict compounded by fragility and other stress factors leading to protracted crises substantially increases the likelihood of undernourishment. The weighted average prevalence of undernourishment in the 46 countries affected by conf lict is on average between 1.4 and 4.4 percentage points higher than for all other countries. Where compounded by conditions of fragility, the prevalence is between 11 and 18 percentage points higher,38 and for protracted crisis situations the prevalence is about two anda half times higher than for countries not affected by conf lict.
»
| 35 |

PART 2 CONFLICT, FOOD SECURITY AND NUTRITION: THE IMPERATIVE OF SUSTAINABLE PEACE
Number of undernourished people 2016 Prevalence of undernourishment (unweighted)Prevalence of undernourishment (weighted)
PREV
ALEN
CE O
F UN
DERN
OURI
SHM
ENT
(PER
CENT
AGE)
NUM
BER
OF U
NDER
NOUR
ISHE
D PE
OPLE
(MIL
LION
S)
COUNTRIES AFFECTED BY CONFLICT COUNTRIES NOT AFFECTED BY CONFLICT
0
5
10
15
20
25
0
100
200
300
400
500
0
5
10
15
20
25
30
40
35
0
20
40
60
80
100
120
140
160
PREV
ALEN
CE O
F ST
UNTI
NG (P
ERCE
NTAG
E)
NUM
BER
OF S
TUNT
ED C
HILD
REN
(MIL
LION
S)
COUNTRIES AFFECTED BY CONFLICT COUNTRIES NOT AFFECTED BY CONFLICT
Prevalence of stunted children (unweighted)Prevalence of stunted children (weighted)Number of stunted children 2016
NOTES: Prevalence and number of undernourished people in low- and middle-income countries with and without conflict, 2016. See Annex 2 (p. 102) for the list of countries affected by conflict, and for definitions.SOURCE: UCDP for classification of countries affected and not affected by conflict; FAO for data on prevalence of undernourishment.
NOTES: Prevalence and number of stunted children in low- and middle-income countries with and without conflict, 2016. See Annex 2 (p. 102) for the list of countries affected by conflict, and for definitions. Region aggregates were calculated by population-weighting the latest available survey data (from 2010 to 2016); data were available for more than 50 percent of population in each region.SOURCES: UCDP for classification of countries affected and not affected by conflict; WHO, UNICEF and World Bank Group Joint Child Malnutrition Estimates data set, 2017 edition, for prevalence of child stunting; UNDESA Population Division for population of children under five years in 2016.
FIGURE 14THE MAJORITY OF CHRONICALLY FOOD-INSECURE PEOPLE LIVE IN COUNTRIES AFFECTED BY CONFLICT
FIGURE 15THE MAJORITY OF STUNTED CHILDREN UNDER FIVE YEARS LIVE IN COUNTRIES AFFECTED BY CONFLICT
| 36 |

THE STATE OF FOOD SECURITY AND NUTRITION IN THE WORLD 2017
Achieving zero hunger and ending undernutrition could be out of reach for many countries affected by conflictWhile most countries have made significant gains in reducing food insecurity and undernutrition, many have either stagnated or deteriorated, most of them being affected by conf lict, v iolence and high levels of fragility. The year 2015 marked the end of the monitoring period for the Millennium Development Goal (MDG) target of reducing by half the proportion of people who suffer from hunger (MDG 1c). On the whole, countries affected by conf lict – and to a larger extent those with protracted crisis and fragile situations – made the least progress in reducing
hunger among their populations, as compared with countries not affected by conf lict and that achieved the MDG 1c goal (Figure 17).
From 1990 to 2015, countries with a protracted crisis only managed to reduce the share of their undernourished populations by 26 percent (from 37.6 percent to 28.0 percent). Of the 19 countries with a protracted crisis situation, only Djibouti, Ethiopia and Niger – which have been relatively free of civ il conf lict in recent years – reached the MDG 1c target.39 Countries with fragile situations also performed poorly, reducing by 32.5 percent the share of their nourished population during the same period (from an estimated 38.2 percent in 1990 to 25.8 percent in 2015). Of the 35 countries and territories identif ied as fragile, only f ive
Countries affected by conflict Countries not affected by conflictCountries with a protracted crisis affected by conflict Countries in fragile situations affected by conflict
0
10
20
30
40
50
1996
2001
2006
2011
2016
PREV
ALEN
CE O
F UN
DERN
OURI
SHM
ENT
(PER
CENT
AGE)
NOTES: The estimates in the graph refer to the population-weighted average of the prevalence of undernourishment in countries affected by conflict, for all countries, for countries with a protracted crisis or for those on the Harmonized List of Fragile Situations, 1996–2016. See Annex 2 (p. 102) for the list of countries affected by conflict, and for definitions.
FIGURE 16FOOD INSECURITY IS HIGHER WHEN CONFLICT IS COMPOUNDED BY FRAGILITY AND PROTRACTED CRISIS
| 37 |
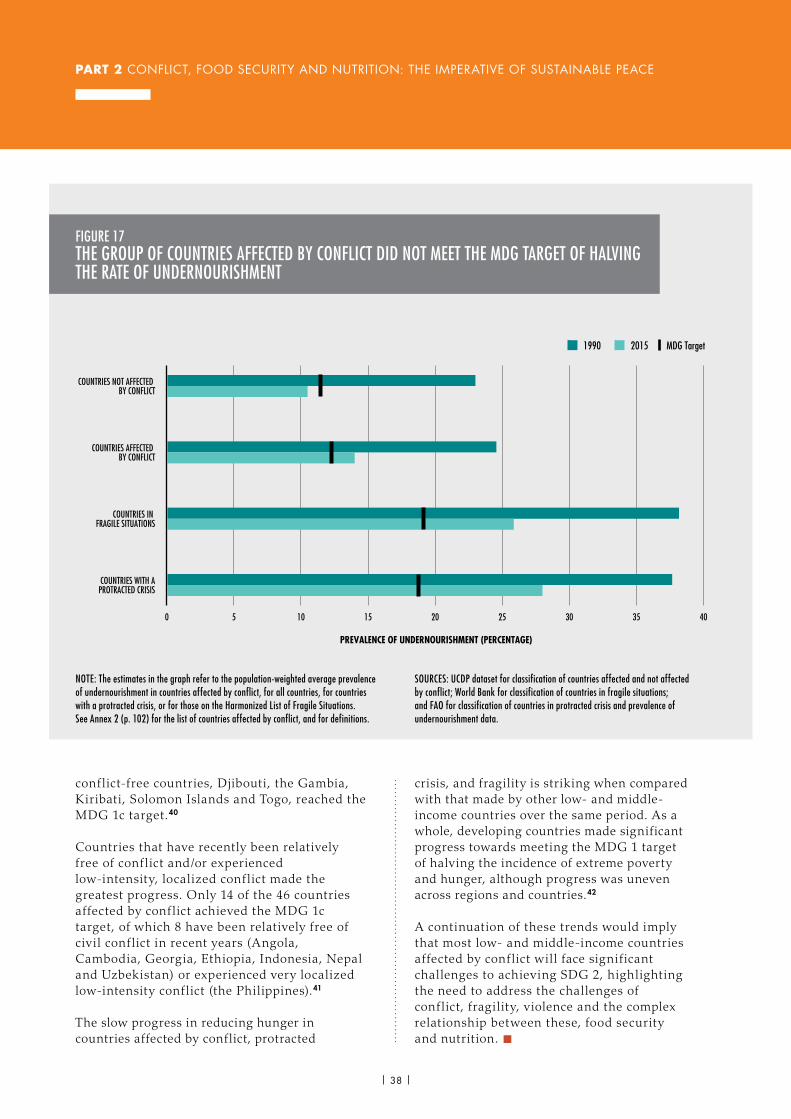
PART 2 CONFLICT, FOOD SECURITY AND NUTRITION: THE IMPERATIVE OF SUSTAINABLE PEACE
conf lict-free countries, Djibouti, the Gambia, Kiribati, Solomon Islands and Togo, reached the MDG 1c target.40
Countries that have recently been relatively free of conf lict and/or experienced low-intensity, localized conf lict made the greatest progress. Only 14 of the 46 countries affected by conf lict achieved the MDG 1c target, of which 8 have been relatively free of civ il conf lict in recent years (Angola, Cambodia, Georgia, Ethiopia, Indonesia, Nepal and Uzbekistan) or experienced very localized low-intensity conf lict (the Philippines).41
The slow progress in reducing hunger in countries affected by conflict, protracted
crisis, and fragility is striking when compared with that made by other low- and middle-income countries over the same period. As a whole, developing countries made significant progress towards meeting the MDG 1 target of halving the incidence of extreme poverty and hunger, although progress was uneven across regions and countries.42
A continuation of these trends would imply that most low- and middle-income countries affected by conf lict will face significant challenges to achieving SDG 2, highlighting the need to address the challenges of conf lict, fragility, v iolence and the complex relationship between these, food security and nutrition. n
COUNTRIES NOT AFFECTED BY CONFLICT
COUNTRIES AFFECTED BY CONFLICT
COUNTRIES IN FRAGILE SITUATIONS
COUNTRIES WITH APROTRACTED CRISIS
0 5 10 15 20 25 30 35 40
1990 2015 MDG Target
PREVALENCE OF UNDERNOURISHMENT (PERCENTAGE)
NOTE: The estimates in the graph refer to the population-weighted average prevalence of undernourishment in countries affected by conflict, for all countries, for countries with a protracted crisis, or for those on the Harmonized List of Fragile Situations. See Annex 2 (p. 102) for the list of countries affected by conflict, and for definitions.
SOURCES: UCDP dataset for classification of countries affected and not affected by conflict; World Bank for classification of countries in fragile situations; and FAO for classification of countries in protracted crisis and prevalence of undernourishment data.
FIGURE 17THE GROUP OF COUNTRIES AFFECTED BY CONFLICT DID NOT MEET THE MDG TARGET OF HALVING THE RATE OF UNDERNOURISHMENT
| 38 |
THE STATE OF FOOD SECURITY AND NUTRITION IN THE WORLD 2017
HOW DOES CONFLICT AFFECT FOOD SECURITY AND NUTRITION? KEY MESSAGES:
è The adverse impacts of conflict on food security and nutrition are unambiguous and well-documented.
è How conflict affects food security and nutrition is highly dependent on context.
è Conflict tends to create multiple compounding impacts, direct and indirect, which flow through a variety of channels.
è Conflict can cause deep economic recessions, drive up inflation, disrupt employment and erode finances for social protection and health care, to the detriment of the availability and access of food in markets and so damaging health and nutrition.
è The impact on food systems can be severe if the economy and people’s livelihoods rely significantly on agriculture, as the effects can be felt across the food-value chain, including production, harvesting, processing, transportation, financing and marketing.
è Conflict undermines resilience and often forces individuals and households to engage in increasingly destructive and irreversible coping strategies that threaten their future livelihoods, food security and nutrition.
The previous section showed that countries affected by conf lict have higher average rates of undernourishment and undernutrition than those not affected by conf lict. However, v iolent conf licts can also lead to short-term impacts on food security and nutrition, which can have devastating lifelong effects on health, well-being, productivity, and physical and cognitive development.43
Conf lict is often a leading cause of famine and food crises. The Global Food Crisis Report 2017 states that, in 2016 alone, the far-reaching effects of v iolent conf lict and civil insecurity left more than 63 million people in 13 countries facing
severe levels of acute food insecurity and in need of urgent humanitarian assistance.44
Problems of acute food insecurity and malnutrition tend to be magnified where natural hazards such as droughts and f loods compound the consequences of conflicts (see Table 4). The concurrence of conflict and climate-related natural disasters is likely to increase with climate change, as climate change not only magnifies problems of food insecurity and nutrition, but can also contribute to a further downward spiral into conflict, protracted crisis and continued fragility.
The degree to which conflict leads to acute and chronic food insecurity is largely determined by how it affects the lives and livelihoods of individuals, households and communities at different times, together with how it affects the immediate and underlying determinants of individual and household food security and nutrition.
Conflict can also have devastating negative impacts on food consumption and health (morbidity and mortality patterns), including the four dimensions of food insecurity (availability, access, utilization and stability), individual caring practices, health services and a healthy living environment.45 Moreover, there can be immediate effects and subsequent implications for human life and nutrition.
How exactly conflict affects food security can be difficult to ascertain, and impacts can occur simultaneously and/or with a time lag such that there are compounding effects on food consumption, caring practices and health environments. Conflict impacts can be direct (such as, forced population movements, the destruction of food stocks and productive assets and increased health complications including death) and/or indirect (for example, economic, social and institutional changes).46 Indirect impacts can also include disruptions to food systems and markets, leading to increased food prices or decreased household purchasing power, or access to water and fuel for cooking can be reduced, which negatively affects food preparation, feeding practices and food allocation within the household. Owing to this complexity and the specific contexts, any analysis of the impact of conflict on food security and nutrition and associated health complications necessarily relies on concrete case studies.47
| 39 |
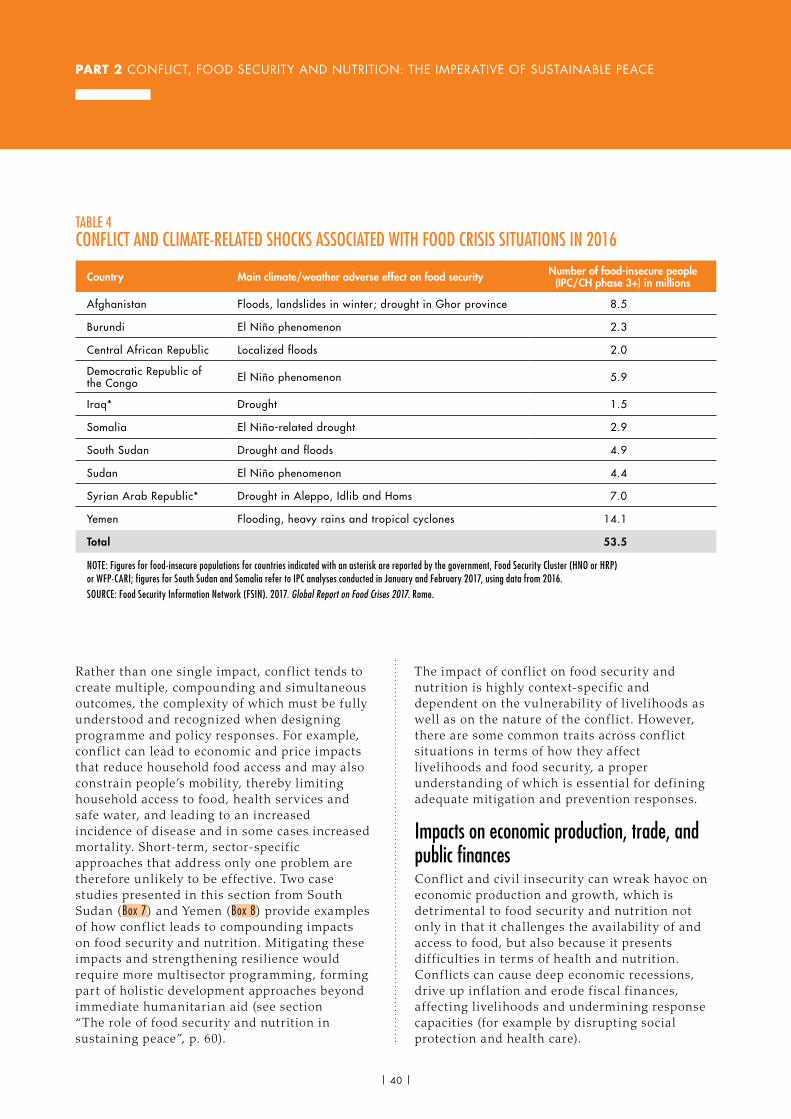
PART 2 CONFLICT, FOOD SECURITY AND NUTRITION: THE IMPERATIVE OF SUSTAINABLE PEACE
Rather than one single impact, conf lict tends to create multiple, compounding and simultaneous outcomes, the complexity of which must be fully understood and recognized when designing programme and policy responses. For example, conf lict can lead to economic and price impacts that reduce household food access and may also constrain people’s mobility, thereby limiting household access to food, health services and safe water, and leading to an increased incidence of disease and in some cases increased mortality. Short-term, sector-specific approaches that address only one problem are therefore unlikely to be effective. Two case studies presented in this section from South Sudan (Box 7) and Yemen (Box 8) provide examples of how conf lict leads to compounding impacts on food security and nutrition. Mitigating these impacts and strengthening resilience would require more multisector programming, forming part of holistic development approaches beyond immediate humanitarian aid (see section “The role of food security and nutrition in sustaining peace”, p. 60).
The impact of conf lict on food security and nutrition is highly context-specific and dependent on the vulnerability of livelihoods as well as on the nature of the conf lict. However, there are some common traits across conf lict situations in terms of how they affect livelihoods and food security, a proper understanding of which is essential for defining adequate mitigation and prevention responses.
Impacts on economic production, trade, and public finances Conflict and civil insecurity can wreak havoc on economic production and growth, which is detrimental to food security and nutrition not only in that it challenges the availability of and access to food, but also because it presents diff iculties in terms of health and nutrition. Conflicts can cause deep economic recessions, drive up inf lation and erode fiscal f inances, affecting livelihoods and undermining response capacities (for example by disrupting social protection and health care).
TABLE 4CONFLICT AND CLIMATE-RELATED SHOCKS ASSOCIATED WITH FOOD CRISIS SITUATIONS IN 2016
Country Main climate/weather adverse effect on food security Number of food-insecure people (IPC/CH phase 3+) in millions
Afghanistan Floods, landslides in winter; drought in Ghor province 8.5
Burundi El Niño phenomenon 2.3
Central African Republic Localized floods 2.0
Democratic Republic of the Congo El Niño phenomenon 5.9
Iraq* Drought 1.5
Somalia El Niño-related drought 2.9
South Sudan Drought and floods 4.9
Sudan El Niño phenomenon 4.4
Syrian Arab Republic* Drought in Aleppo, Idlib and Homs 7.0
Yemen Flooding, heavy rains and tropical cyclones 14.1
Total 53.5
NOTE: Figures for food-insecure populations for countries indicated with an asterisk are reported by the government, Food Security Cluster (HNO or HRP) or WFP-CARI; figures for South Sudan and Somalia refer to IPC analyses conducted in January and February 2017, using data from 2016.SOURCE: Food Security Information Network (FSIN). 2017. Global Report on Food Crises 2017. Rome.
| 40 |
THE STATE OF FOOD SECURITY AND NUTRITION IN THE WORLD 2017
A recent study across 20 countries shows that armed conf lict reduces the level of GDP per capita by 17.5 percent on average.48 Impacts vary widely, however: the GDP of the Syrian Arab Republic fell by more than 50 percent between 2010 and 2015, Libya’s by 24 percent in 2014 after violence picked up, and in Yemen there was a decline of an estimated 25–35 percent in 2015 alone.
Conflict duration and intensity are important determinants of economic impact. A recent study that analysed annual data for 179 countries from 1970 to 2014 not only found that conf lict significantly impacted economic growth, but also that the impact increased with the intensity and duration of the conf lict.49 In countries affected by high-intensity conf licts, GDP decreased by 8.4 percentage points per year on average, while the decline averaged 1.2 percentage points in countries with less-intense conf licts.50 Accounting for the duration of conf lict, after three years, countries suffered GDP losses of between four and nine percentage points on average per year. For countries in conf lict in the Near East and North Africa region, the impact was greater, at an estimated GDP loss of between six and fifteen percentage points per year. The study also found further spillover effects on neighbouring economies.
The analysis below shows that, in most instances, economic impacts hit agricultural sectors disproportionally hard, as many conf licts are fought in rural areas and target agricultural assets such as land and livestock. In South Sudan, for example, livestock has been a direct target of insurgency and counterinsurgency warfare (see Box 7).
Conflict-induced economic contractions reduce employment and income opportunities, which in turn can increase poverty and reduce the ability of households to meet their food and health-care needs. Available evidence shows more substantial reductions in poverty are made in peaceful and stable countries than in those affected by conflict. The former have managed to reduce poverty at a steady pace, while the latter have poverty rates that are stagnant or even increase. Poverty rates in countries affected
by repeated cycles of violence in the last three decades are on average 20 percentage points higher than in non-conflict countries. Every year of violence can slow poverty reduction by almost one percentage point.51
Economic contractions tend to erode public f inances, which in turn may diminish, or in extreme cases fully disrupt, social protection mechanisms. They can also negatively affect basic social services that are critical to nutrition outcomes, including the availability of health care and clean and safe water (for the case of Yemen, see Box 8).
Conflict can also disrupt export channels and drain foreign exchange resources, limiting import capacity and causing shortages of commodity supplies and inf lationary pressure. For net food-importing countries, import disruptions can lead to reduced food availability in markets as well as reduced availability or affordability of non-food items necessary for food preparation (such as cooking fuel). Inf lation can also have significant negative impacts on households’ ability to access food, as price hikes hamper the ability of households to purchase what they need.
Although it tends to halt social progress, conf lict does not always lead to economic collapse. For example, despite the upsurge in armed conf lict in the Democratic Republic of the Congo since 2012, the country’s economy grew by 7.1 percent in 2012, 8.5 percent in 2013, 8.9 percent in 2014, and 6.9 percent in 2015, driven mainly by a thriving mining sector.52 However, this rapid growth has not led to improvements in social indicators.53 In 2013, 6.7 million people (almost 10 percent of the population) were facing severe levels of acute food insecurity (IPC Phase 3 Crisis and IPC Phase 4 Emergency) and were unable to access enough food to meet their basic needs. In 2017, an estimated 5.9 million people are still considered acutely food insecure, and an estimated 3.9 million children are suffering from acute malnutrition, of which 1.9 million are severely malnourished.54 Poor governance and insecurity have kept public expenditures and investments in economic development, road construction, drinking-water systems, and health care at low levels. »
| 41 |
PART 2 CONFLICT, FOOD SECURITY AND NUTRITION: THE IMPERATIVE OF SUSTAINABLE PEACE
South Sudan is an example of how conflict can affect the lives and livelihoods of the population in multiple ways, resulting in a humanitarian catastrophe on an enormous scale and with destructive longer-term impacts on livelihoods, as well as on the agriculture and food systems upon which these depend. In December 2013, two and half years after South Sudan gained its independence, large-scale violence erupted in the Greater Upper Nile Region and by 2016 had spread to Greater Equatoria and Western Bahr el Ghazal.
The ongoing conflict caused acute food insecurity to increase dramatically, with famine declared in parts of Greater Upper Unity State in February 2017 (see figure). More than 4.9 million people (over 42 percent of the population) are currently severely food insecure (IPC Phases 3–5), a number that is projected to increase to 5.5 million in 2017 if the situation is left unaddressed.1
Widespread acute malnutrition is giving rise to a major public health emergency: one in three children is acutely malnourished in the southern part of Unity State, and out of 23 counties, 14 have global acute malnutrition (GAM) at or above the emergency threshold of 15 percent. Rates of GAM of more than 30 percent were observed in Leer and Panyijiar and of 27.3 percent in Mayendit. These high levels are caused by reduced food access and by child, maternal and public health factors. The situation is exacerbated by a number of factors, including inadequate diets, low quality and coverage of water and sanitation facilities, as well as poor access to and levels of basic health services.
Armed conflict and communal violence are destroying rural livelihoods, decimating assets, deepening poverty and increasing the vulnerability of millions of people. Agricultural production and food systems have been disrupted, livestock production has declined significantly, and the spread of violence to cereal surplus-producing areas in Equatoria is severely affecting crop production. Violence is limiting market access and disrupting trade flows, affecting livestock
producers, consumers and traders alike. The economic impact of the current conflict on the livestock sector – which constitutes 15 percent of GDP – has been extensive, as livestock have been direct targets of insurgency and counterinsurgency warfare. It is estimated that the loss of GDP attributed to the livestock sector is between US$1.4 billion and US$2 billion (2014–16).2
Food access has been hampered by sharp increases in prices, with inflation driven by shortages, currency devaluation and high transport costs owing to insecurity along major trading routes. The year-on-year inflation rate peaked at 836 percent in October 2016: the value of the South Sudanese pound (SSP) depreciated from SSP16 to the US dollar in August 2015 to SSP74 in November 2016. The conflict in Juba in July 2016 restricted inflows of imported food through the main southern supply corridor from Uganda, reducing food supplies and further driving up prices. In July 2016, cereal prices were more than double those of June and almost ten times higher than 2015 levels.3
A lack of financial and physical access to food is limiting individual and household food consumption, with real labour incomes and the relative price of livestock falling dramatically. Meanwhile, violence and insecurity have led to the depletion and loss of assets such as livestock and key household food sources such as standing crops and grain stocks.
In the worst-affected areas, food is being used as a weapon of war, with trade blockades and security threats leaving people marooned in swamps with no access to food or health care. Humanitarian access to the worst-hit areas is limited, as warring factions are intentionally blocking emergency food, hijacking aid trucks and killing relief workers. A lack of protection of civilians against violence has led to 1.9 million internally displaced persons and more than 1.26 million refugees, who have lost their livelihoods and are dependent on support for their survival.3
BOX 7SOUTH SUDAN – CRISIS IN AGRICULTURE, FOOD SYSTEMS AND PUBLIC HEALTH
1 IPC. 2017. Key IPC findings: January-July 2017. The Republic of South Sudan.2 Y.A. Gebreyes. 2016. The impact of the conflict on the livestock sector in South Sudan. FAO.3 FSIN. 2017. Global Report on Food Crises 2017.
SOURCES: IPC. 2013. Acute food insecurity overview. Republic of South Sudan; IPC. 2015. Food security and nutrition analysis – key messages; IPC. 2016. Communication summary. The Republic of South Sudan; and IPC. 2017. Key IPC findings: January-July 2017. The Republic of South Sudan.
| 42 |

THE STATE OF FOOD SECURITY AND NUTRITION IN THE WORLD 2017
BOX 7(CONTINUED)
SOUTH SUDAN – MARKED INCREASE IN ACUTE FOOD INSECURITY AFTER THE CRISIS
Ilemi Triangle
Baliet
Manyo
Renk
Melut
Fashoda
MalakalPanyikang
Canal/PigiFangak
Pariang
GuitRubkona
Abiemnhom
MayomTwicAweil East
Aweil North
Aweil West
Aweil Centre
Aweil SouthGogrial West
Gogrial EastTonj North
LeerMayendit
Panyijiar
Tonj East
Tonj South
Rumbek North
Rumbek CentreCueibet
Wulu
Yirol West
Awerial
Mvolo
Terekeka
Lopa/LafonKapoeta North
Kapoeta South
Budi
Ikotos
Torit
MagwiKajo-keji
Juba
Lainya
Morobo
Yei
Mundri East
Mundri WestMaridiIbba
Yambio
Nzara
Ezo
Tambura
Nagero
Kapoeta East
Rumbek EastYirol East
Jur RiverWau
Raga
Maban
Longochuck
MaiwutLuakpiny/Nasir
UlangNyirol
Ayod
Duk
Twic East
UrorAkobo
Pochalla
Pibor
Bor South
Koch
UPPERNILE
UNITY
JONGLEI
WARRAP
NORTHERNBAHR ELGHAZAL
WESTERNBAHR ELGHAZAL
WESTERNEQUATORIA
CENTRALEQUATORIA
EASTERNEQUATORIA
LAKES
AbyeiAbyei
!
!
!
5°N
35°E30°E25°E
35°E30°E25°E
10°N
5°N
10°N
PRE-CRISIS: JULY 2013
CURRENT SITUATION: FEBRUARY – APRIL 2017
Ilemi Triangle
Baliet
Manyo
Renk
Melut
Fashoda
MalakalPanyikang
Canal/PigiFangak
Pariang
GuitRubkona
Abiemnhom
MayomTwicAweil East
Aweil North
Aweil West
Aweil Centre
Aweil SouthGogrial West
Gogrial EastTonj North
LeerMayendit
Panyijiar
Tonj East
Tonj South
Rumbek North
Rumbek CentreCueibet
Wulu
Yirol West
Awerial
Mvolo
Terekeka
Lopa/LafonKapoeta North
Kapoeta South
Budi
Ikotos
Torit
MagwiKajo-keji
Juba
Lainya
Morobo
Yei
Mundri East
Mundri WestMaridiIbba
Yambio
Nzara
Ezo
Tambura
Nagero
Kapoeta East
Rumbek EastYirol East
Jur RiverWau
Raga
Maban
Longochuck
MaiwutLuakpiny/Nasir
UlangNyirol
Ayod
Duk
Twic East
UrorAkobo
Pochalla
Pibor
Bor South
Koch
UPPERNILE
UNITY
JONGLEI
WARRAP
NORTHERNBAHR ELGHAZAL
WESTERNBAHR ELGHAZAL
WESTERNEQUATORIA
CENTRALEQUATORIA
EASTERNEQUATORIA
LAKES
AbyeiAbyei
!
!!
!
!
!
!!
!
!
!!
!!
!
5°N
35°E30°E25°E
35°E30°E25°E
10°N
5°N
10°N
FAMINE DECLARATION
IPC PHASE CLASSIFICATION
Minimal
Stressed
Crisis
Emergency
Famine
No data
Displaced population in camps
Area would likely be at least 1 phase higher without humanitarian assistance.
FAMINE DECLARATION
IPC PHASE CLASSIFICATION
Minimal
Stressed
Crisis
Emergency
Famine
No data
Displaced population in camps
Area would likely be at least 1 phase higher without humanitarian assistance.
NOTE: The final boundary between the Republic of the Sudan and the Republic of South Sudan has not yet been determined. Final status of the Abyei area has not yet been determined.SOURCE: South Sudan IPC Technical Working Group (TWG), IPC Analysis 2013, 2017.
| 43 |
PART 2 CONFLICT, FOOD SECURITY AND NUTRITION: THE IMPERATIVE OF SUSTAINABLE PEACE
Conflicts among armed groups in the east of the country, intercommunal violence in other areas, and instability in neighbouring countries have led to recurrent, large-scale movements of refugees into the Democratic Republic of the Congo, further complicating the food security situation.55
Impacts on agriculture, food systems and rural livelihoods On average, 56 percent of the population in countries affected by conf lict l ive in rural areas, where livelihoods largely depend on agriculture. For protracted crisis contexts, the proportion of populations liv ing in rural areas is 62 percent on average, but can exceed 80 percent in cases such as Burundi, Ethiopia and Niger. Most conf licts mainly affect rural areas and their populations, heavily and negatively affecting agriculture,56 food systems and livelihoods. In many countries affected by conf lict, subsistence agriculture is still central to food security for much of the population.
In 2014, agricultural activ ity accounted for more than 37 percent of GDP in countries characterized by extremely fragile contexts, compared with about 23 percent in fragile contexts and 8 percent in the rest of the world.57 In 2015, agriculture accounted for 23 percent of the economy in countries affected by conf lict, and an average of 35 percent of GDP for countries with a protracted crisis.58
Conflict negatively affects almost every aspect of agriculture and food systems, from production, harvesting, processing and transport to input supply, f inancing, and marketing. Although there are no recent, comprehensive global estimates of the impact of conf lict on agriculture and food systems,59 a number of food security and nutrition assessments and analyses for countries affected by conf lict demonstrate the significant impacts of conf lict on agriculture production, food systems and rural livelihoods at national and subnational levels.
These impacts can be direct and indirect, and felt immediately as well as in the longer-term. Direct impacts can be significant, particularly in regard to the destruction of agricultural assets (such as
land, livestock, crops, seed stocks or irrigation infrastructure), the forced or corrupt seizure of natural resources, and displacement from land, livestock grazing areas, and fishing grounds. Indirect impacts include macroeconomic shocks (as highlighted in the previous subsection).
Not only is the duration of a conf lict important for determining its impacts, there can also be persistent lagged effects after the conf lict has subsided and in post-conf lict situations. For example, the agriculture sector in the Central African Republic – including crop production, livestock rearing and fishing – has been severely affected by the long-running and cyclical waves of v iolence and conf lict in the country.60 Despite a peace agreement in 2015 reached among various armed groups and a decline in the conf lict level from the most intense periods in 2013 and 2014, the agriculture sector is struggling to recover. Many areas are still insecure and armed groups continue to block and control trade routes. In 2015, cereal production was 70 percent lower than the pre-conf lict average (2008–2012), while significant declines have also been noted in cotton and coffee production, the country’s two most valuable cash crops.61
Six years of civ il war in the Syrian Arab Republic have led to massive losses in the agriculture sector, estimated at US$16 billion for the period of 2011–16, including destroyed assets and infrastructure.62 Despite this, agriculture is still an important sector in the Syrian Arab Republic, as it accounts for an estimated 26 percent of GDP and remains a source of livelihood for 6.7 million Syrians, including the internally displaced who remain in rural areas. Today, agriculture production is at a record low in the country, with about half the population unable to meet their daily food needs.
Another example is Iraq, where in 2016 production levels continued to fall as a large part of the cereal production belt was directly under the control of rebel forces, affecting access to agriculture inputs, cereal harvest and post-harvesting activ ities.63 Before the conf lict, the Ninewa and Salah al-Din Districts produced almost 33 percent of the country’s wheat and 38 percent of its barley. »
»
| 44 |
THE STATE OF FOOD SECURITY AND NUTRITION IN THE WORLD 2017
The most recent outbreak of conflict in Yemen (beginning in March 2015) has had devastating effects on livelihoods and nutrition. One of the main channels of impact has been the conflict-induced, economy-wide crisis that is affecting the entire population.
Yemen’s economic crisis is driving unprecedented levels of food insecurity and undernutrition. Its GDP dropped by 34.6 percent between 2014 and 2015, the public budget deficit almost doubled between the first half of 2015 and the first half of 2016, and the currency exchange rate in the parallel market repeatedly fluctuates and diverges from the official rate (YER250 per US dollar), reaching a record high of YER315 per US dollar in September 2016.1
In July 2016, the Central Bank of Yemen suspended public budget expenditures and domestic debt servicing. As a consequence, civil servants – who make up 31 percent of the workforce in the country – have experienced irregular salary payments or complete salary cuts. The entire social protection system has collapsed, with a suspension of safety nets2 to 1.5 million beneficiaries through the Social Welfare Fund since the beginning of the crisis in 2015.
The conflict-driven public-sector crisis continues to escalate, creating a host of uncertainties and threatening a possible breakdown of the banking system. The Government’s inability to pay salaries is accelerating the economic collapse and tipping large parts of the country into a destructive downward spiral of extreme food insecurity and increasing poverty. The liquidity crisis has directly affected more than 7 million people who depend on government salaries, thereby reducing not only their food purchasing power, but also their access to basic goods and services such as health care.
Yemen relies on imports for more than 90 percent of its staple foods; restrictions coupled with fuel shortages have reduced the availability of essential commodities, causing prices to soar since the conflict escalated in March 2015.
The annual inflation rate has increased to over 30 percent, pushing average consumer prices 70 percent above pre-crisis levels and heavily reducing purchasing power for many. With both urban and rural communities relying on markets on a daily basis (70 percent of people in the case of rural communities), increases in the cost of food, cooking fuel, water and medicine all heavily undermine food access and utilization. People have reduced and lost income due to the poor performance of the agriculture and fishery sectors, job losses and suspensions of salaries. The economic crisis has been further aggravated by natural hazards, including plagues of locusts and flooding caused by unusual high rains and tropical cyclones in 2016.
The nutrition situation has been aggravated by the dramatic breakdown of the health care system and its infrastructure; an outbreak of cholera and other epidemics3 that affected several governorates in 2016 and that is continuing into 2017; depletion of savings caused by loss of safety nets and government salaries; distressed livelihood coping strategies; and reduced ability to access food both physically and economically.
As of March 2017, an estimated 17 million people are experiencing severe food insecurity (IPC Phases 3 and 4) and require urgent humanitarian assistance. This represents 60 percent of the entire population – a 20 percent increase from June 2016 and a 47 percent increase from June 2015.4 Chronic child undernutrition (stunting) has been a serious problem for a long time, but acute undernutrition (wasting) has peaked in the last three years. Out of 22 governorates, four have levels of global acute malnutrition (GAM) above the emergency threshold of 15 percent, while seven record acute malnutrition prevalence at “serious” (GAM between 10 percent and 14.9 percent) and eight at “poor” levels (GAM between 5 percent and 9.9 percent).
BOX 8YEMEN – CONFLICT, ECONOMIC COLLAPSE, AND THE DESTRUCTION OF RURAL AND URBAN LIVELIHOODS
1 WFP. 2016. Special Focus – Yemen: What does the conflict-induced public sector crisis mean for food security in Yemen? Fighting Hunger Worldwide. VAM Food Security Analysis. Rome.2 Safety nets are schemes designed to support the most vulnerable populations to meet a basic minimum living standard and can include income transfers, food assistance or other forms of basic needs assistance.
3 Epidemics include malaria and dengue. See WHO. 2015. Health system in Yemen close to collapse. News. Bulletin of the World Health Organization. [Cited 28 June 2017] (available at www.who.int/bulletin/volumes/93/10/15-021015/en/).4 IPC. 2017. IPC Analysis – Summary of findings. Yemen. March; and IPC. 2016. IPC Analysis – Summary of findings. Yemen. June.
| 45 |
PART 2 CONFLICT, FOOD SECURITY AND NUTRITION: THE IMPERATIVE OF SUSTAINABLE PEACE
An assessment in February 2016 found that 70–80 percent of corn, wheat and barley cultivations were damaged or destroyed in Salah al-Din, while in Ninewa 32–68 percent of land normally used for wheat cultivation was either compromised or destroyed, as was 43–57 percent of the barley cultivation.
When conf lict and civil insecurity severely disrupt and restrict trade and movements of goods and services, there can also be a negative effect on the availability of food and upward pressure on prices of traded goods, which negatively affects food access. Conflict disrupts the f low of food and other essential items through markets, creates shortages, and contributes to price hikes, thereby damaging market functionality. People’s physical security is also affected by conf lict – even those not directly engaged as combatants or victims of v iolence64 – as it prevents consumers from going to the market or traders from selling their wares. Moreover, intentional blockades of trade routes or the inaccessibility of besieged areas can result in market collapse or reduced functionality.
Conflict may also compromise food storage, as facilities can become unsafe or at risk of destruction or looting. However, new market structures can also evolve. The absence of functioning government institutions provides fertile ground for informal markets to f lourish, but there is the risk of some groups gaining huge benefits at the expense of others. For example, certain groups can control all parts of the food chain and charge inflated prices to different sectors of the population, or there can be a fully open black market through informal value chains.
South Sudan provides an illustrative example of conf lict ’s destructive impact on agriculture and food systems and how this can combine with other factors, including public health, to undermine livelihoods and create a downward spiral of increased food insecurity and malnutrition as conf lict intensifies (see Box 7). Conflict and the risk of conf lict impede public and private investment in agricultural production and marketing activ ities.65 Faced with conf lict-induced economic contractions and public-finance stresses, governments often reduce investment in agricultural development
or divert f inances to conf lict-related expenditures (such as military operations).
Domestic and foreign private investment in agriculture and in regions with agricultural potential also becomes discouraged, even after conf lict and violence diminish. This is especially the case where the root cause of the conf lict is competition over natural resources, including productive land or water resources.
Impact through displacement of people Conflict is also a main driver of population displacement, and displaced populations are among the most vulnerable in the world, experiencing high levels of food insecurity and undernutrition.
According to the Office of the United Nations High Commissioner for Refugees (UNHCR), there were an estimated 64 million displaced people worldwide in 2016, of which 16 million were refugees and 36.4 million IDPs. The majority of the forcibly displaced are concentrated in developing countries in Africa, the Near East and South Asia. Over half of the world’s refugees originate from countries affected by conf lict. Displaced persons from Afghanistan, Somalia and the Syrian Arab Republic, are hosted mainly in neighbouring countries, including, respectively: Pakistan and Iran (Islamic Republic of ); Ethiopia and Kenya; and Jordan, Lebanon and Turkey. Most of the world’s IDPs are concentrated in the Syrian Arab Republic, Colombia, Iraq, the Sudan, the Democratic Republic of the Congo, and Pakistan. Developing countries such as Ethiopia, Jordan, Kenya and Lebanon are now hosting more than 80 percent of all refugees in the world.66
The number of displaced people worldwide is at an all-time high, as war and persecution continue to rise. Currently, one in every 113 people is now either a refugee, internally displaced, or seeking asylum. In the past f ive years, at least 15 conf licts have erupted or re-ignited, 8 of which have been in Africa (Burundi, the Central African Republic, Côte d’Ivoire, the Democratic Republic of the Congo, Libya, Mali, northeast Nigeria, and South Sudan).67
»
| 46 |
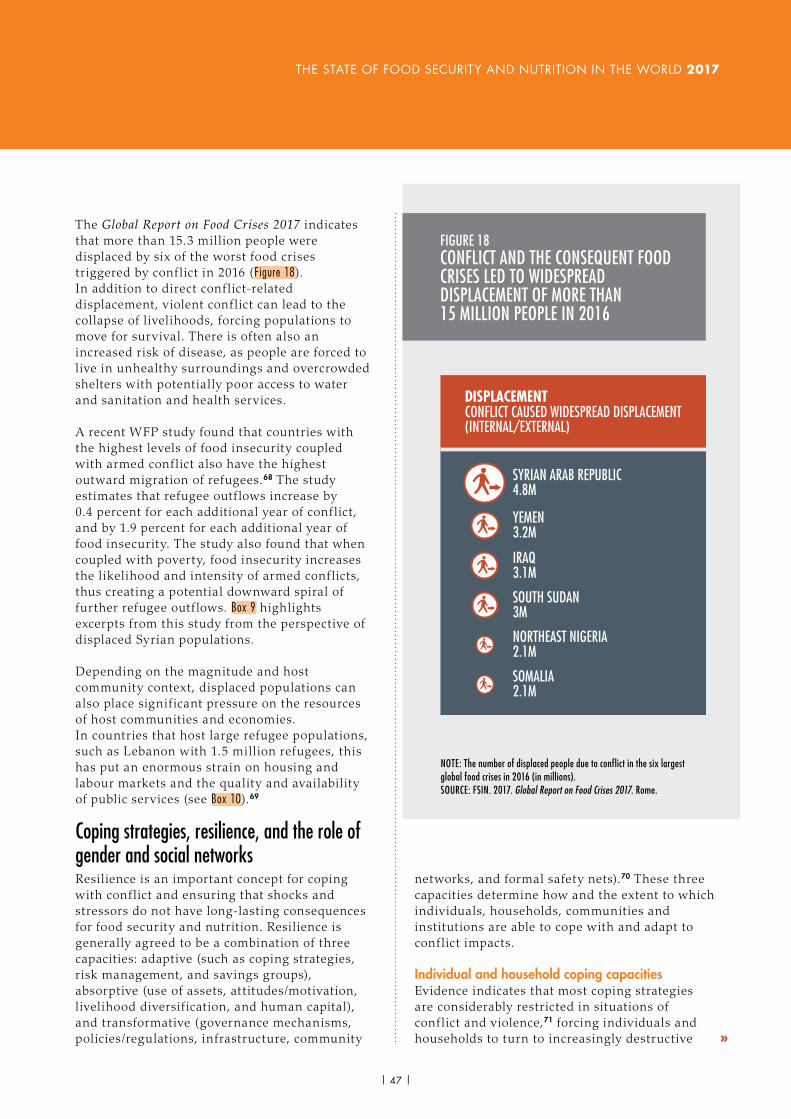
THE STATE OF FOOD SECURITY AND NUTRITION IN THE WORLD 2017
The Global Report on Food Crises 2017 indicates that more than 15.3 million people were displaced by six of the worst food crises triggered by conf lict in 2016 (Figure 18). In addition to direct conf lict-related displacement, v iolent conf lict can lead to the collapse of livelihoods, forcing populations to move for survival. There is often also an increased risk of disease, as people are forced to live in unhealthy surroundings and overcrowded shelters with potentially poor access to water and sanitation and health services.
A recent WFP study found that countries with the highest levels of food insecurity coupled with armed conf lict also have the highest outward migration of refugees.68 The study estimates that refugee outf lows increase by 0.4 percent for each additional year of conf lict, and by 1.9 percent for each additional year of food insecurity. The study also found that when coupled with poverty, food insecurity increases the likelihood and intensity of armed conf licts, thus creating a potential downward spiral of further refugee outf lows. Box 9 highlights excerpts from this study from the perspective of displaced Syrian populations.
Depending on the magnitude and host community context, displaced populations can also place significant pressure on the resources of host communities and economies. In countries that host large refugee populations, such as Lebanon with 1.5 million refugees, this has put an enormous strain on housing and labour markets and the quality and availability of public services (see Box 10).69
Coping strategies, resilience, and the role of gender and social networksResilience is an important concept for coping with conf lict and ensuring that shocks and stressors do not have long-lasting consequences for food security and nutrition. Resilience is generally agreed to be a combination of three capacities: adaptive (such as coping strategies, risk management, and savings groups), absorptive (use of assets, attitudes/motivation, livelihood diversif ication, and human capital), and transformative (governance mechanisms, policies/regulations, infrastructure, community
networks, and formal safety nets).70 These three capacities determine how and the extent to which individuals, households, communities and institutions are able to cope with and adapt to conf lict impacts.
Individual and household coping capacitiesEvidence indicates that most coping strategies are considerably restricted in situations of conf lict and violence,71 forcing individuals and households to turn to increasingly destructive
NOTE: The number of displaced people due to conflict in the six largest global food crises in 2016 (in millions).SOURCE: FSIN. 2017. Global Report on Food Crises 2017. Rome.
FIGURE 18CONFLICT AND THE CONSEQUENT FOOD CRISES LED TO WIDESPREAD DISPLACEMENT OF MORE THAN 15 MILLION PEOPLE IN 2016
DISPLACEMENTCONFLICT CAUSED WIDESPREAD DISPLACEMENT (INTERNAL/EXTERNAL)
SYRIAN ARAB REPUBLIC4.8M
YEMEN3.2M
SOUTH SUDAN3M
NORTHEAST NIGERIA2.1M
SOMALIA2.1M
DISPLACEMENTCONFLICT CAUSED WIDESPREAD DISPLACEMENT (INTERNAL/EXTERNAL)
SYRIAN ARAB REPUBLIC4.8M
YEMEN3.2M
SOUTH SUDAN3M
NORTHEAST NIGERIA2.1M
SOMALIA2.1M
DISPLACEMENTCONFLICT CAUSED WIDESPREAD DISPLACEMENT (INTERNAL/EXTERNAL)
SYRIAN ARAB REPUBLIC4.8M
YEMEN3.2M
SOUTH SUDAN3M
NORTHEAST NIGERIA2.1M
SOMALIA2.1M
IRAQ3.1M
»
| 47 |
PART 2 CONFLICT, FOOD SECURITY AND NUTRITION: THE IMPERATIVE OF SUSTAINABLE PEACE
The devastating civil war in the Syrian Arab Republic entered its seventh year in 2017. It is a complex, internationalized conflict, with various armed groups in control of much of the country. Formerly a vibrant middle-income economy, 85 percent of the population now live in poverty, of which 69 percent live in extreme poverty, meaning they are unable to cover their basic needs, including food.1 In 2016, an estimated 6.7 million people were acutely food insecure and in need of urgent humanitarian assistance, while the prevalence of acute malnutrition was at increased levels in most areas (7 percent GAM). Anaemia affects about one-quarter of both children under the age of five and adult women.2
Years of conflict have not only had a cumulative destructive effect on the economy, infrastructure, agricultural production, food systems and social institutions, but also more generally on people’s ability to cope. Since 2011, there has been a continuous exodus of Syrians seeking to escape the conflict, mostly into neighbouring countries. By 2016, an estimated 4.8 million refugees had fled to Turkey (58 percent), Lebanon (21 percent), Jordan (14 percent), Iraq (5 percent), and Egypt (2 percent).
A recent WFP study of the Syrian refugee crisis provides insights from the perspective of displaced Syrian populations on the impact conflict has had on their livelihoods and food security, documenting their internal migration journeys and triggers for leaving their homes. The following are some excerpts:
� For many of the refugees, the constant bombing and the presence of armed forces in their villages and towns were the main reason for leaving their homes, many of which were being destroyed along with their businesses.
� The food security situation deteriorated as livelihoods and markets were disrupted. Many food
markets were controlled by powerful groups, leading to steadily increasing prices: in the besieged city of Deir Ezzur, one participant said a bag of sugar cost 100 000 Syrian pounds (over US$450). People were forced to sell belongings such as furniture and gold in order to buy food.
� Families were forced to cut out protein-rich and dairy products from their diets, and most had to reduce portion sizes, eating only one or two meals a day. Some said they were living off starchy foods such as bread, pasta, rice or potatoes, as meat, butter, tomatoes, oil and sugar were all too expensive.
� With the proliferation of armed groups and religious sects, participants described increasing mistrust among neighbours and friends. The armed forces were abducting people at random and forcibly conscripting young men. Women were particularly concerned about the long-lasting psychological effects of the conflict on their children.
� Almost all the families interviewed in Jordan and Turkey and some in Lebanon were internally displaced multiple times before they crossed the border. Overall, nearly eight in ten households were internally displaced within the Syrian Arab Republic at least once, and 65 percent twice or more.
� The situation was particularly dire during the most recent phase of internal displacement. Participants described constant fear, life in collective shelters with limited access to even basic services and struggling to find food. In many cases, the immediate trigger point to leave was injury or death. Some participants did not leave because of the immediate conflict, but rather were forced to move due to lack of livelihood and food.
BOX 9SYRIAN REFUGEES – STORIES OF LOST LIVELIHOODS AND DESPERATION
1 UN OCHA. 2016. Humanitarian needs overview 2017. Syrian Arab Republic. (available at http://reliefweb.int/sites/reliefweb.int/files/resources/2017_Syria_hno_161205.pdf).2 WFP. 2017. Nutrition interventions: Syria 2017. Damascus (available at http://documents.wfp.org/stellent/groups/public/documents/communications/wfp290774.pdf).
SOURCE: WFP. 2017. At the root of exodus: food security, conflict and international migration. Rome.
| 48 |
THE STATE OF FOOD SECURITY AND NUTRITION IN THE WORLD 2017
and irreversible options. People typically f irst engage in reversible coping strategies with short-term effects, such as making modest dietary adjustments and skipping meals. However, as coping options are exhausted or disappear and food insecurity worsens, households are more likely to employ more extreme and damaging strategies that are less reversible and therefore represent a more severe form of coping, such as distress selling of livestock or productive assets such as farm tools. Severe and/or persistent conf lict can ultimately lead to the collapse of coping mechanisms, prompting migration, destitution and, in extreme cases, death and starvation. Coping mechanisms and loss of livelihoods can in turn undermine local and national economies.
However, there are many examples of individuals and households liv ing in conf lict areas and surviving the impacts of v iolence.72 Households in risky environments generally
respond with a mix of ex ante r isk management and ex post r isk-coping strategies.73 Common strategies include: diversif ication of land holdings and crop cultivation, storage of grain from one year to the next, resorting to sales of assets such as cattle and land that could have been accumulated as a precaution against the occurrence of a shock, borrowing from village lenders or other money loaners, and receiving gifts and transfers from informal mutual support networks (such as family, friends, neighbours and funeral societies).
Although there is evidence that in some contexts households appear to learn to live amid conf lict, this is often at a lower income level.74 For example, where non-state armed factions remained in Colombia, farming households shifted to activ ities with short-term yields and lower profitability. However, as violence intensified, farmers focused more on subsistence activ ities to provide basic food security.
The crisis in the Syrian Arab Republic has had an immense impact on Lebanon, which has experienced an economic slowdown and is having to deal with the arrival of more than 1.5 million refugees. The economic slowdown, manifested by a sharp decrease in annual growth rates from almost 10 percent in the immediate pre-crisis years to 1–2 percent in 2011–14, is a result of increased insecurity, disrupted trade routes, and declining confidence among investors and consumers. Exports and foreign direct investments fell by 25 percent between 2013 and 2014, and tourism has dropped by 60 percent since the start of the crisis.
Public debt reached 141 percent of GDP in mid-2014. The influx of refugees has been particularly felt in the housing and labour markets
and in the quality and availability of public services. Labour supply has increased by up to 50 percent and the number of state-school students has risen by 30–35 percent. There has also been a surge in demand for public health-care services.
The crisis is having a disproportionate impact on already vulnerable households, not only because of increased competition for unskilled labour and overloaded public services, but also because half of the refugees live in the poorest one-third of districts. The World Bank estimates that the poverty rate will have increased by 3.9 percent by the end of 2014 because of the Syrian conflict. Those who were already poor will become poorer and adverse impacts on food security and nutrition are to be expected.
BOX 10LEBANON – ECONOMIC STRAIN AND PUBLIC HEALTH CHALLENGES IN COUNTRIES HOSTING SYRIAN REFUGEES
SOURCE: WFP. 2014. Special Focus Lebanon. Is the Syrian crisis jeopardizing the economy and food security in Lebanon? Fighting Hunger Worldwide. VAM Food Security Analysis. Rome.
»
| 49 |
PART 2 CONFLICT, FOOD SECURITY AND NUTRITION: THE IMPERATIVE OF SUSTAINABLE PEACE
The reasons may be related to issues over access to productive land, to a switching away from income-generating activities that are more sensitive to conf lict, or to an attempt to avoid accumulating assets that may become liabilities or targets.75 Other coping strategies may also include fighting, looting, supporting armed groups and participating in illegal activ ities in order to survive the loss of livelihoods.
Gender dimensions in food security and nutrition in conflicts Gender is important in assessing how conf lict affects food security and nutrition, as men and women often have different roles and responsibilities in securing adequate food and nutrition at the household level. Conflicts tend to alter gender roles and social norms. Men and boys are more likely to be engaged in the fighting and are at greater risk of being forcibly recruited into military groups and socialized into adopting violent concepts of masculinity.76 Together with the normalization of v iolence, especially in prolonged conf lict settings, this not only exposes them to a greater risk to loss of life, or life-long disabilities, but can hinder efforts to sustain peace.
The engagement of men in conf lict puts greater responsibility in the hands of women in sustaining the livelihood of the household, including for the access to food, nutrition and health care of household members. Conflict situations often are characterized by increased sexual v iolence, mostly targeted at women. Such violence and trauma not only cause direct harm to women, but also tend to affect their ability to support their families.
Rural women often have less access to resources and income, which makes them more vulnerable and hence more likely to resort to riskier coping strategies. These strategies may affect their health, which in turn is detrimental to the food security of the entire household as food production and the ability to prepare food decreases with illness.77 In crisis situations and among refugees, one in every f ive women of childbearing age is likely to be pregnant. Conflicts put these women and their babies at increased risk if health-care systems falter and their food security situation deteriorates.78
Available evidence further shows that conf lict leads to increased female labour participation. This can be due either to the death or disappearance of male workers or to the loss of income-generating assets that male household members relied on before the conf lict, such as land or livestock that may have since been stolen or destroyed.79 Children’s roles in the household and community can also be severely affected, as many are at risk of being pulled into child labour in its worst forms during times of conf lict.80
Shifting gender roles can also have beneficial effects on household welfare. Where women gain more control of resources, household food consumption tends to increase and child nutrition improve. Their economic empowerment may further give them greater voice in household and community decision-making. For example, the experience in Somalia shows that – during the conf lict – women’s contribution to household income generation increased along with their inf luence on decision-making.81 Similarly, comparative case studies in Bosnia and Herzegovina, Colombia, Nepal, Tajikistan and Timor-Leste found that armed conf lict led to an increase in female labour participation, albeit mainly in low-paid unskilled work and often exposing women to unsafe and insecure labour conditions.82 Also when self-employed as farmers, women often see income opportunities limited where they do not have rights to own or inherit land and to access input or credit markets.In these circumstances, and where conf lict affects economic conditions more in general, it is unlikely that increased female labour market participation will improve household welfare and food security.83
Conflict impacts on traditional social networks Conflicts can undermine the effectiveness of traditional institutions with social networks, both within and across neighbouring communities. In many contexts, it is these support mechanisms that provide important safety nets and coping mechanisms to protect populations against shocks, and their collapse can be a critical causal pathway towards increased food insecurity.
For example, in Ethiopia, Kenya and Uganda, pastoral communities have traditionally
| 50 |

THE STATE OF FOOD SECURITY AND NUTRITION IN THE WORLD 2017
facilitated negotiated access to strategic natural resources, especially in times of ecological stress. This is done primarily by restricting mobility, which in turn is critical for sustainable rangeland and livestock management. However, conf lict is
leading to a breakdown of these traditional systems of social exchange and mediation, undermining pastoralists’ coping mechanisms and degrading the rangelands upon which their livelihoods depend (see Box 11).84 n
Long-lasting and recurrent conflicts have altered the grazing patterns of affected pastoralists in Ethiopia, Kenya and Uganda, reducing both their resilience and their coping strategies.
Mobility is limited with increased insecurity, as it forces the community to concentrate livestock on reduced territory. The sustainable use of pastoral rangelands depends in large measure on mobility, which allows for rotational use of wet- and dry-season grazing areas. Loss of access to land and water sources puts the pastoral system under pressure and gradually reduces its self-sufficiency. This means that the existing land-use system is no longer able to respond to ecological and climatic variability, resulting in ecological degradation.
FAO has documented the impact of conflict on the breakdown of traditional systems and how this has affected environmental degradation, undermining the long-term viability of pastoral livelihoods.
In Kenya, key informants in Kula Mawe (Borana) indicated that even in times of peace livestock grazing is restricted to a radius of 15 kilometres for fear of raids orchestrated by either the Somali or Samburu. Concentrating livestock in limited areas results in overgrazing and general degradation of the environment.
In Uganda, pastoralists have been forced to settle in concentrated areas, leading to overgrazing and ecological degradation, which is undermining their livelihoods and the community’s ability to cope with droughts and other climate-related disasters.
The congested settlements are causing loss of soil cover due to erosion. Communities also suffer from scarcity and overuse of water because of the larger numbers of people and livestock. Overcultivation and excessive pressure on soils have resulted in loss of soil fertility, deforestation, and depletion of biomass. This environmental degradation is exacerbated by cutting down trees and grass for construction, fuelwood, charcoal burning for domestic use and sale for income generation.
In Ethiopia, on-and-off violent conflicts between the Borana, Garre, Guji and Konso have become commonplace. Although occurring at local levels, these conflicts have involved complex legal, political and economic dynamics that extend to national and even regional dimensions, encompassing the communities and their allies elsewhere in Ethiopia and across the border in Kenya. Loss of access to grazing land and water sources puts the pastoral system under pressure and gradually reduces its self-sufficiency. This means that the land-use system is no longer able to respond to ecological and climatic variability, resulting in degradation that is evident in the level of bush encroachment. This in turn changes the structure and composition of the herbaceous vegetation, with undesired thorny and woody species encroaching on grazing areas. The result is an imbalance in the grass–bush ratio and a decrease in biodiversity and carrying capacity, which causes severe economic and ecological losses to pastoral communities.
BOX 11PASTORALISM IN EAST AFRICA – BREAKDOWN OF TRADITIONAL SYSTEMS AND ENVIRONMENTAL DEGRADATION
SOURCE: M.O. Odhiambo. 2012. Impact of conflict on pastoral communities’ resilience in the Horn of Africa. Case studies from Ethiopia, Kenya and Uganda. Nakuru, Kenya, RECONCILE, FAO.
| 51 |
PART 2 CONFLICT, FOOD SECURITY AND NUTRITION: THE IMPERATIVE OF SUSTAINABLE PEACE
CAN FOOD INSECURITY AND UNDERNUTRITION TRIGGER CONFLICT?KEY MESSAGES:
è Food insecurity itself can become a trigger for violence and instability, particularly in contexts marked by pervasive inequalities and fragile institutions.
è Sudden spikes in food prices tend to exacerbate the risk of political unrest and conflict, as witnessed in 2007–08 when food riots broke out in more than 40 countries.
è Climate-related events, especially droughts, tend to jeopardize food security in terms of availability and access, which has been found to increase the risk of conflict. This is particularly the case where deep divisions exist between population groups or where coping mechanisms are lacking.
è Competition for natural resources can be detrimental to the food security of vulnerable rural households, potentially culminating in conflict.
While it is well established that conf lict causes food insecurity and undernutrition, the reverse causal link is much less clear. Food insecurity and undernutrition as such have not been found to be the sole causes of conf lict, but they may compound other grievances or political, social or economic factors that trigger conf lict. A vicious circle can emerge when conf lict leads to a worsening of the food security and nutrition situation, which in turn enhances the risk of deepening and prolonging the conf lict.85
This section looks at the available evidence and case studies that help identify the contributing factors to food insecurity and undernutrition that can trigger, fuel or sustain conf lict, especially rising food prices, extreme weather events, and competition over land or resources. The effects, however, are always played out in combination with other conf lict-promoting factors that are highly context-specific.
Drivers and conditioning factors determining changes in food insecurity that trigger conflictsMeasuring the impact of variations in food security on the likelihood of violent conf lict is complex, owing to data limitations and the specific nature of conf lict contexts. However, some studies have suggested that food insecurity, when coupled with other factors, increases the likelihood of conf lict. For example, a recent study by WFP that assessed a 25-year time span suggests that undernourishment is one of the more important determinants of the incidences of armed conf lict, and that when coupled with poverty, food insecurity increases the likelihood and intensity of armed conf lict.86
Another study that analysed socio-economic conditions prior to the outbreak of conf lict found that in countries with low socio-economic indicators – such as higher rates of child mortality, poverty, food insecurity and undernutrition – there is a higher risk of conf lict (Figure 19).87 In contrast, the same study found that levels of per capita income, GDP growth, and having access to a safe water source would not increase the likelihood of conf lict. While this comparison across countries does not imply causality, it does indicate that the probability of armed conf lict onset appears to be higher in countries with low socio-economic status. When combined with income poverty, nutritional status and poor health were found to be more strongly associated with conf lict outbreaks than were per capita GDP, annual GDP growth, or the ratio of primary commodity exports over GDP.88 Moreover, according to this evidence, post-conf lict countries with high levels of food insecurity are 40 percent more likely to relapse into conf lict within a ten-year time span than those with low levels.
Cross-country comparisons using nation-wide averages for measures of both conf lict and food insecurity tend to overlook subnational inequalities and the more localized nature of many of today’s conf licts (see section “Why focus on the nexus between conf lict, food
| 52 |

THE STATE OF FOOD SECURITY AND NUTRITION IN THE WORLD 2017
security and nutrition?”, p. 30). However, more detailed case study-based analyses confirm that poverty, hunger and food insecurity, together with a highly unequal distribution of income, land and other material goods, can create feelings of anger, hopelessness, unfairness and a lack of social justice among sectors of the population.
Such grievances can then be exploited by individuals and groups with a desire to foment violence.89 As noted above (see section "Why focus on the nexus between conf lict, food security and nutrition?", p. 30), conf lict significantly affects food security and nutrition, especially when protracted and compounded by weak institutional response capacities (fragility). Fragile institutions and poor governance help explain why similar external shocks can produce violence in one country but not in another. Studies have shown that, during the 2007–08 food price crises, the likelihood of the outbreak of protests was much higher in developing countries categorized as in fragile situations.90
Food insecurity, or the threat thereof, is a distressing condition that can activate grievances and cause frustration and anger, leading individuals to engage in antisocial behaviour.91 People can resort to violence when their human security, including food security, is threatened, especially when there is a lack of formal and informal institutions that are able and willing to mediate such risks. These grievances can be compounded by mistrust in the government, often originating from a feeling of a lack of state support when facing food insecurity.92
At the individual level, studies have shown that people might choose to participate in and support armed groups in the hope of gaining financially, particularly if they have lost trust in state support mechanisms.93 In Mozambique, Peru and Sierra Leone, for example, rebel f ighters were remunerated via looting of civ ilian property. Other evidence suggests deprivation, such as the inability to meet their basic nutritional requirements, is among the reasons for joining rebel groups. In the north of Mali where poverty
0.0
1.0
2.0
CHILD MORTALITY POVERTY GAPINDEX
CHILD MALNUTRITION(WAZ)1
UNDERNUTRITIONRATE
HEADCOUNTPOVERTY INDEX
ACCESS TOSAFE WATER
ANNUAL GDPGROWTH RATE
PER CAPITA GDP
2.02
1.57 1.50 1.451.31
0.57 0.530.38
1 Weight-for-age z-score.NOTE: The ratio of selected socio-economic indicators between non-conflict countries and countries where armed conflict started for the first time during the next five years in the period 1980–2005.SOURCE: P. Pinstrup-Andersen and S. Shimokawa. 2008. Do poverty and poor health and nutrition increase the risk of armed conflict onset? Food Policy, 33(6): 513–520.
FIGURE 19COUNTRIES AFFECTED BY CONFLICT HAVE LOWER SOCIO-ECONOMIC STATUS
| 53 |
PART 2 CONFLICT, FOOD SECURITY AND NUTRITION: THE IMPERATIVE OF SUSTAINABLE PEACE
is high, one study found that a pervasive sense of marginalization and a lack of livelihood opportunities for young men have fed into the region’s recurrent conf licts.94
However, caution is needed when drawing conclusions about any one driver that might motivate behaviour and conf lict.95 In most cases, multiple factors are at play, with three of the most commonly studied discussed below: sharp and increased food prices, extreme climate impacts, and competition over natural resources.
Sharp increases in food pricesIn 2013, 767 million people in the world lived in extreme poverty.96 As most poor people spend more than 50 percent of their income on food, even a slight increase in prices can severely affect their well-being. There is a growing body of empirical evidence that points to food price hikes as an important contributing trigger of social unrest such as protests, riots, v iolence and war.97 Most evidence stems from studies of such conditions in Africa,98 including those that identif ied international food price shocks as one of the factors that may have contributed to the so-called Arab Spring uprisings of 2010–11 (Box 12).99 More recent studies suggest the association may apply more widely.100 Little is known about the extent to which food prices alone drive violent conf lict, especially as historical events show sharp and increased food prices interplay with other economic and political adversities in violent conf lict contexts.
The dominant explanation for the food-price–conf lict l ink is consumer grievances: higher prices create or increase economic constraints and/or sentiments of (perceived) relative deprivation, which activates grievances that in turn lead to conf lict. A second explanation emphasizes the breakdown of authority and legitimacy when the state fails to provide food security, leading people to act out grievances against the state.101 A number of recent analyses have found that the cohesiveness of political institutions in low-income countries deteriorates significantly when international food prices increase,102 while rising food prices and riots in Africa have also been associated with greater levels of political repression.103
Historical evidence confirms that sudden spikes in food prices exacerbate the risk of political unrest and conf lict,104 as witnessed for example in Egypt (1977), Morocco (1981), Tunisia (1984), and Jordan (1996). In October 1988, youth riots and demonstrations are said to have indirectly contributed to the fall of Algeria’s one-party system and the introduction of democratic reforms, which culminated in the country’s civ il war of 1991. Rising food prices, high youth unemployment, and fiscal austerity measures were identif ied as key factors triggering the protests and social unrest.
More recently, the global food price crises of 2007–08 and 2011 triggered riots in more than 40 countries, where the cost of imported basic goods increased, thereby eroding real incomes (see Figure 20).105
Other examples of severe political consequences of food riots include the resignation of Haiti’s Prime Minister Jacques-Edouard Alexis in 2008 and the coup against President Marc Ravalomanana of Madagascar in 2009.106 In Venezuela (Bolivarian Republic of ), political tensions have escalated with increasing shortages of food and other essential items, as the economy has plummeted with declining oil prices and oil revenues, and foreign-exchange shortages have limited imports of food and basic goods.107
Food riots often erupt first in urban areas, where households depend primarily on markets for accessing food and are extremely vulnerable to price changes. However, price shocks may not necessarily result in a marked increase in food insecurity before triggering a conflict. It is rather the perceived risk of a deteriorating food security situation that can increase affected groups’ willingness to fight to protect their livelihoods,108 and hence changes in food security – rather than levels of food insecurity – are probably the most influential factors.109 Incentives to join or support conflicts and rebellions stem from a number of causes, of which the protection of food security is just one. Food insecurity may also help to sustain conflict. If post-conflict recovery proves difficult and food insecurity remains high, this can strengthen incentives for reigniting conflict.110
| 54 |
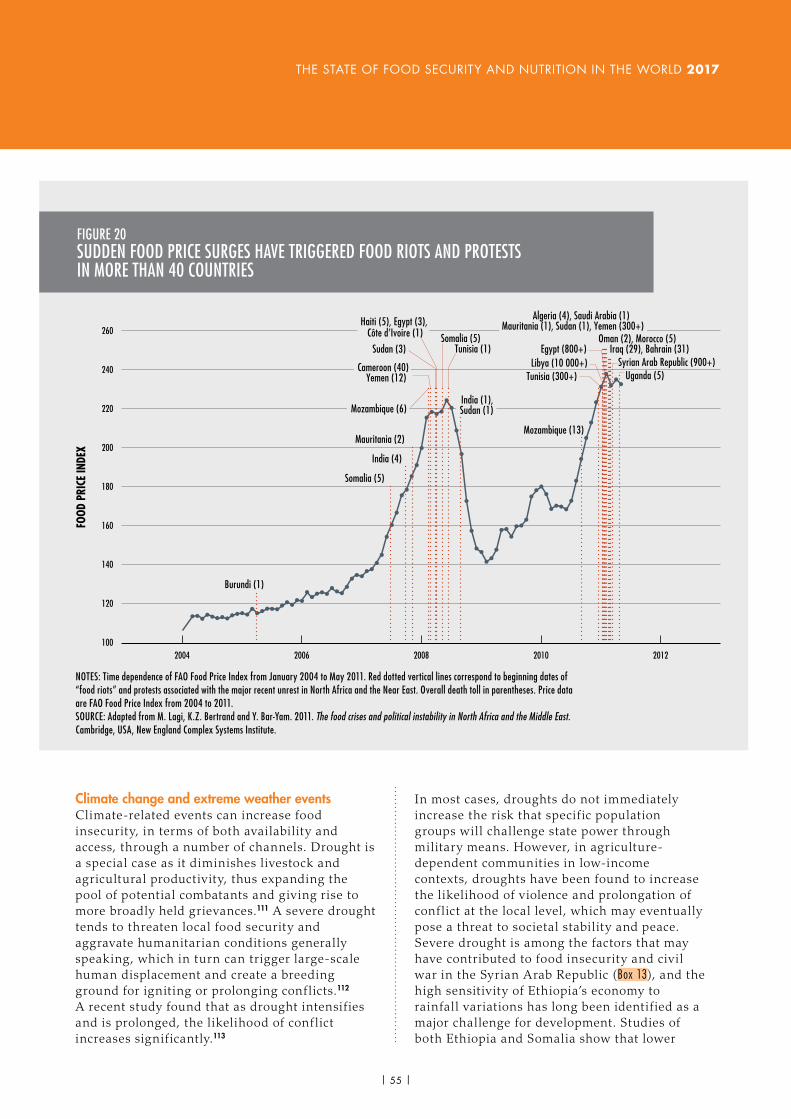
THE STATE OF FOOD SECURITY AND NUTRITION IN THE WORLD 2017
Climate change and extreme weather eventsClimate-related events can increase food insecurity, in terms of both availability and access, through a number of channels. Drought is a special case as it diminishes livestock and agricultural productivity, thus expanding the pool of potential combatants and giving rise to more broadly held grievances.111 A severe drought tends to threaten local food security and aggravate humanitarian conditions generally speaking, which in turn can trigger large-scale human displacement and create a breeding ground for igniting or prolonging conf licts.112 A recent study found that as drought intensifies and is prolonged, the likelihood of conf lict increases significantly.113
In most cases, droughts do not immediately increase the risk that specif ic population groups will challenge state power through military means. However, in agriculture-dependent communities in low-income contexts, droughts have been found to increase the likelihood of v iolence and prolongation of conf lict at the local level, which may eventually pose a threat to societal stability and peace. Severe drought is among the factors that may have contributed to food insecurity and civil war in the Syrian Arab Republic (Box 13), and the high sensitiv ity of Ethiopia’s economy to rainfall variations has long been identif ied as a major challenge for development. Studies of both Ethiopia and Somalia show that lower
FIGURE 20SUDDEN FOOD PRICE SURGES HAVE TRIGGERED FOOD RIOTS AND PROTESTS IN MORE THAN 40 COUNTRIES
260
240
220
200
180
160
140
120
100
FOOD
PRI
CE IN
DEX
2004 2006 2008 2010 2012
Tunisia (300+)Libya (10 000+)
Egypt (800+)
Mozambique (6)
Cameroon (40)Yemen (12)
Somalia (5)
Somalia (5)
India (4)
Mauritania (2)
Sudan (3) Tunisia (1)
India (1),Sudan (1)
Mozambique (13)
Algeria (4), Saudi Arabia (1)Mauritania (1), Sudan (1), Yemen (300+)
Oman (2), Morocco (5)Iraq (29), Bahrain (31)
Syrian Arab Republic (900+)Uganda (5)
Burundi (1)
Haiti (5), Egypt (3), Côte d’Ivoire (1)
NOTES: Time dependence of FAO Food Price Index from January 2004 to May 2011. Red dotted vertical lines correspond to beginning dates of “food riots” and protests associated with the major recent unrest in North Africa and the Near East. Overall death toll in parentheses. Price data are FAO Food Price Index from 2004 to 2011. SOURCE: Adapted from M. Lagi, K.Z. Bertrand and Y. Bar-Yam. 2011. The food crises and political instability in North Africa and the Middle East. Cambridge, USA, New England Complex Systems Institute.
| 55 |

PART 2 CONFLICT, FOOD SECURITY AND NUTRITION: THE IMPERATIVE OF SUSTAINABLE PEACE
precipitation levels are associated with a higher probability of conf lict onset.114
A study in Asia and Africa from 1989 to 2014 shows that the risk of conf lict increases for each additional year of growing-season drought and is even more pronounced for low-development countries (Figure 21). For the average politically excluded group, going from zero to f ive consecutive years of drought during the local growing season increases the estimated likelihood of conf lict incidence from 12 percent to 15 percent, other things being equal. With climate change, the risk of extreme weather-related events increases as does the variability in rainfall. If left unaddressed, climate change should therefore be expected to have an increasing impact on the risk of conf lict outbreaks.
The risk of conf lict related to weather shocks increases where people – in particular
discriminated and marginalized groups – lack coping mechanisms to avoid the harmful effects of events such as drought on their food security and livelihoods. Central factors that restrict coping capacity in such contexts include a low level of socio-economic development, history of conf lict, and limited access to economic and social capital that could facilitate alternative livelihoods. Climate-induced crop failure or loss of pasture can mean a dramatic drop in income, and limited material and human capital can aggravate the situation by narrowing the range of outside options. However, this process alone does not explain how violent conf lict might erupt or be sustained. Ethnicity is the predominant common divide around which social identity and political preferences are formed and play out. Most modern civil conf licts are fought along ethnic lines, and ethnic conf licts have increased markedly since the end of the Cold War.115
Several studies have identified high food prices as a possible contributing factor that added to grievances that triggered the protests of late 2010 and early 2011, first in Tunisia and then in other Near East and North African countries.1 All of the Arab Spring countries are net importers of food, which meant their inhabitants were highly vulnerable to the global food price spikes of 2008 and 2011. Combined with high levels of unemployment, this resulted in a steady increase in the cost of living and an erosion of living standards, which has been perceived as exacerbating food insecurity in the region.
Sharp rises in domestic food prices from 2007 onwards also contributed to an unravelling
of a social system whereby governments had offered subsidized food, housing, utilities and fuel, often along with employment in a large public sector – all of which they could no longer afford.
However, this interpretation of the sequence of events has been contested and may not apply in all cases. In the case of Tunisia, FAO’s GIEWS – its on-the-ground early warning system – reported relatively stable domestic food prices despite high international prices during the winter months of 2010 to 2011. Hence, based on this evidence, it seems unlikely that food price spikes triggered the beginnings of the Arab Spring in Tunisia.2
BOX 12THE ARAB SPRING AND SHARP INCREASES IN FOOD PRICES
1 J.F. Maystadt, J.F. Trinh Tan and C. Breisinger. 2012. Does food security matter for transition in Arab countries? IFPRI Discussion Paper 01196. Washington, DC, International Food Policy Research Institute.2 FAO. 2017. Sowing the Seeds of Peace for Food Security: Disentangling the nexus between conflict, food security and peace, edited by C. Holleman, J. Jackson, M.V. Sánchez & R. Vos. FAO Agricultural Development Economics Technical Study 2. Rome.
| 56 |

THE STATE OF FOOD SECURITY AND NUTRITION IN THE WORLD 2017
Competition for natural resourcesThe link between natural resources – particularly high-value ones such as oil and minerals – and conf lict is well documented. This is especially true of cases in which poor governance leads to resources only benefiting a handful of corrupt politicians or certain ethnic or political groups, rather than the population at large. Such a situation impedes the development of the country, curtails investment in common services such as health and education, and leads to the further marginalization of vulnerable households while increasing levels of inequality.
Competition over land and water has been identif ied as a potential trigger for conf lict, as loss of land and livelihood resources, worsening labour conditions and environmental degradation negatively affect
and threaten household and community livelihoods. Some sources estimate that over the past 60 years, 40 percent of civ il wars have been associated with natural resources. Since 2000, some 48 percent of civ il conf licts have taken place in Africa, in contexts where access to rural land is essential to the livelihoods of many and where land issues have played a significant role in 27 out of 30 conf licts.116 In other contexts it was not so much competition for land but the dispossession of farmers from their land by armed groups: in Colombia for example, farmers have suffered systematic strategies of eviction that have led to significant displacements of people (Box 14).
The conf lict in Darfur is often referred to as having been caused in part by climate variability, and more specifically by drought. It is argued that declining rainfall and land
The current civil war in the Syrian Arab Republic and the rise of rebel groups provides a stark example of the potential impacts of food insecurity, although some question this link.1 A severe drought across the Syrian Arab Republic in 2006–07 led to the collapse of the country’s agricultural system, with most small- and medium-scale farmers and herders having lost most, if not all, production and livestock herds in 2008. As safety nets were not provided for these farmers, the only recourse for most became migration to urban areas.
As a result, an estimated 1.5 million Syrians joined the swelling Iraqi refugee population in the Syrian Arab Republic’s largest cities, including Damascus, Aleppo, Homs and Latakia.2 Comprising as much as
20 percent of the population in these urban areas, the refugee and newly migrated communities lived in substandard housing, faced rampant unemployment and received little if any governmental support, driving rebellion within some of these same communities.
While half the population once worked in agriculture, livestock herds today have been reduced by 50 percent and wheat production is down by 40 percent.3 However, the description of food insecurity as leading to conflict through migration is not the whole story, and there were other, more important political factors at play. Nonetheless, hunger can often be a critical element, and rebel groups can offer an alternative livelihood to protect household food security through incentives and promises of improved conditions.
BOX 13SEVERE DROUGHT CONTRIBUTED TO A WORSENING OF THE CONFLICT IN THE SYRIAN ARAB REPUBLIC
1 C.P. Kelley, S. Mohtadi, M.A. Cane, R. Seager and Y. Kushnir. 2015. Climate change in the Fertile Crescent and implications of the recent Syrian drought. Proceedings of the National Academy of Science of the United States of America, 112(11): 3241–3246.2 M. Ali. 2010. Years of drought: a report on the effects of drought on the Syrian Peninsula. Beirut, Heinrich Böll-Stiftung.3 FAO In Action.
| 57 |
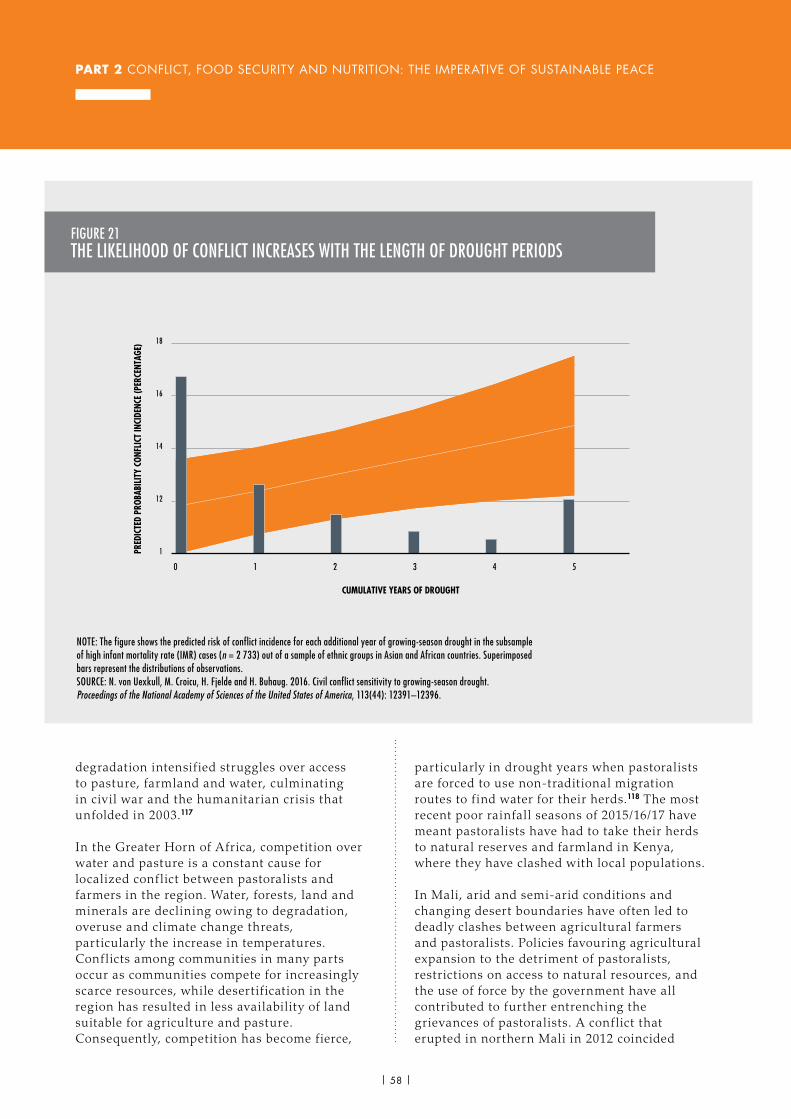
PART 2 CONFLICT, FOOD SECURITY AND NUTRITION: THE IMPERATIVE OF SUSTAINABLE PEACE
degradation intensified struggles over access to pasture, farmland and water, culminating in civil war and the humanitarian crisis that unfolded in 2003.117
In the Greater Horn of Africa, competition over water and pasture is a constant cause for localized conf lict between pastoralists and farmers in the region. Water, forests, land and minerals are declining owing to degradation, overuse and climate change threats, particularly the increase in temperatures. Conflicts among communities in many parts occur as communities compete for increasingly scarce resources, while desertif ication in the region has resulted in less availability of land suitable for agriculture and pasture. Consequently, competition has become fierce,
particularly in drought years when pastoralists are forced to use non-traditional migration routes to f ind water for their herds.118 The most recent poor rainfall seasons of 2015/16/17 have meant pastoralists have had to take their herds to natural reserves and farmland in Kenya, where they have clashed with local populations.
In Mali, arid and semi-arid conditions and changing desert boundaries have often led to deadly clashes between agricultural farmers and pastoralists. Policies favouring agricultural expansion to the detriment of pastoralists, restrictions on access to natural resources, and the use of force by the government have all contributed to further entrenching the grievances of pastoralists. A conf lict that erupted in northern Mali in 2012 coincided
CUMULATIVE YEARS OF DROUGHT
PRED
ICTE
D PR
OBAB
ILIT
Y CO
NFLI
CT IN
CIDE
NCE
(PER
CENT
AGE)
1
12
14
16
18
1 2 3 4 50
NOTE: The figure shows the predicted risk of conflict incidence for each additional year of growing-season drought in the subsample of high infant mortality rate (IMR) cases (n = 2 733) out of a sample of ethnic groups in Asian and African countries. Superimposed bars represent the distributions of observations.SOURCE: N. von Uexkull, M. Croicu, H. Fjelde and H. Buhaug. 2016. Civil conflict sensitivity to growing-season drought. Proceedings of the National Academy of Sciences of the United States of America, 113(44): 12391–12396.
FIGURE 21THE LIKELIHOOD OF CONFLICT INCREASES WITH THE LENGTH OF DROUGHT PERIODS
| 58 |
THE STATE OF FOOD SECURITY AND NUTRITION IN THE WORLD 2017
with a region-wide drought. Some 3.5 million people were affected. Combined with political turmoil, this eventually led to the displacement of almost 300 000 people, including more than 160 000 who f led to neighbouring Burkina Faso, Mauritania and Niger.119 With tens of thousands of cows and sheep wiped out by the
drought and in the absence of any governmental relief for pastoralists, the livelihoods of many Tuaregs were devastated, leaving large numbers liv ing in extreme poverty and food insecurity, which in turn swelled the ranks of armed rebel factions and coerced others to steal and loot. n
Colombia witnessed a five-decade-long conflict that left up to six million people internally displaced – equivalent to 14 percent of the total population. This was the result of systematic strategies of eviction and dispossession by armed groups in their quest to seize rural territories, control valuable natural resources and land, and appropriate the rents associated with these resources. Strategies of forced displacement have also been associated with the economy of drug trafficking, the growth of which requires control over routes and land to cultivate illegal crops. The scale and magnitude of forced displacement is not only the main effect of armed conflict, but also the main source of food insecurity. The impact has been most keenly felt by the poorest and most vulnerable populations, including ethnic communities.
The economic and social repercussions of Colombia’s conflict were both short- and long-term in impact. Rebel strategies of eviction and dispossession led first to the displacement of farmers and rural households, while concentrating land ownership in fewer hands and inducing lasting changes in land-use and agricultural production (from staple food crops to crops for industrial use, including palm oil and coca leaves). This affected poverty and inequality as well as food production and access. For the period from 1980 to 2010, it is estimated that 6.6 million hectares of land were abandoned as a result of displacement. This figure
would be even higher if the territories of ethnic communities were included. Dispossession revolved mostly around smallholdings and farms, which particularly affected the poorest and most vulnerable rural families. It became critical for Colombia to make up for the material losses experienced by displaced and rural populations as a result of conflict, including by instigating land and housing restitution and improving access to working capital and capital goods.
Colombia is the only country in the world that has implemented a land restitution policy amid conflict. Valuable lessons can be drawn from this, in particular regarding how to ensure the safe and sustainable return of land, beyond just securing the victims’ land titles. Colombia possesses a solid legal framework to support the populations displaced as a result of conflict, helping to sustain peace by restoring not only land to people, but also their dignity. The land restitution and territorial rights policy for ethnic peoples and communities is not isolated from the country’s other current or planned social and political processes related to rural areas. The implementation of the peace agreement with Revolutionary Armed Forces of Colombia – People’s Army (FARC) – which includes an integrated rural reform programme – represents a unique opportunity to achieve long-lasting peace and address the important social challenges faced by rural populations.
BOX 14EVICTION AND DISPOSSESSION OF NATURAL RESOURCES AND LAND IN COLOMBIA
SOURCE: A. Segovia. 2017. Las relaciones entre conflictos y seguridad alimentaria: el caso de Colombia. Background paper prepared for FAO.
| 59 |
PART 2 CONFLICT, FOOD SECURITY AND NUTRITION: THE IMPERATIVE OF SUSTAINABLE PEACE
THE ROLE OF FOOD SECURITY AND NUTRITION IN SUSTAINING PEACEKEY MESSAGES:
è Conflict-sensitive and timely interventions aimed at improving food security and nutrition can contribute to sustaining peace.
è Building and strengthening resilience to conflict requires helping countries and households prevent, anticipate, prepare for, cope with, and recover from conflicts.
è A sustainable impact on peace is more likely when food security and nutrition initiatives are implemented as part of a broader set of multisectoral, humanitarian, developmental and peace-related interventions.
è Much official development assistance (ODA) to countries affected by conflict is provided in the form of humanitarian assistance, focused on short-term responses, and leaving insufficient support for investments in longer-term resilience building and preparedness.
The earlier section “How does conf lict affect food security and nutrition?” (see p. 39) showed that conf lict strongly affects food insecurity and undernutrition. While the evidence is more limited regarding the opposite causal relationship, the section “Can food insecurity and undernutrition trigger conf lict?” (see p. 52) indicated food insecurity may also trigger and perpetuate conf lict under certain circumstances. This section examines how investments in food security and nutrition, including building and strengthening more-resilient livelihoods and risk-informed programmes, may help to prevent and mitigate conf licts and potentially contribute to sustaining peace. The same measures will also serve to mitigate the impacts of conf lict on food security and nutrition.
If food security and nutrition matter for resilience, can interventions and associated
processes that enable food security and nutrition also affect conf lict and peace processes? Are there specific pathways that can contribute to sustaining peace?
Harvesting peace by improving food security and nutritionBuilding resilience by promoting sustainable peace is critical to improving food security and nutrition outcomes in areas with recurrent crises.120 However, knowledge is more limited in regard to the role that food security and nutrition can play in preventing or mitigating conf licts and in potentially contributing to sustaining peace. Studies on how conf lict affects food security and nutrition, and the channels through which chronic poverty, deprivation and dispossession could trigger or perpetuate conf lict, suggest there could be potential interventions that might support peace processes and help prevent conf licts from emerging.
First, interventions to improve food security could help weaken some of the causes of conf lict, including motives that may lead individuals to support or join armed groups or engage in illegal activ ities. Second, greater food price stability and the recovery of local agricultural and food markets could help vulnerable individuals and households mitigate the impacts of conf lict, including by supporting people affected by conf lict in regaining access to markets.
More work is needed to better understand these pathways. Nonetheless, as agriculture is the dominant form of livelihood for the majority of households in countries affected by conf lict (see section “How does conf lict affect food security and nutrition?”, p. 39), efforts to revive the sector, foster economic growth, increase food security and improve the nutritional status of the population may also have positive effects on sustaining peace. It is important to rapidly re-engage smallholder farmers – men and women – in productive activ ities in the aftermath of shocks, particularly in fragile settings. Policies that strengthen local participation in decision-
| 60 |
THE STATE OF FOOD SECURITY AND NUTRITION IN THE WORLD 2017
making processes on agriculture and food security are vital.121 Social protection, including in-kind and cash assistance, can offer valuable peace dividends and contribute to restoring trust in government and rebuilding social capital.122
Findings from a review of case studies indicate that social protection has the potential to directly address some of the underlying causes of conf lict in affected communities.123 Social protection through cash-for-work (CFW) programmes can help create productive infrastructure and improve the technical capacity of governments and other local counterparts, which when combined create an enabling environment for nutrition and health. There are substantial challenges to ensuring effective assistance in conf lict and post-conf lict settings, on which UN agencies including FAO and WFP are working to identify how UN-wide efforts could help to reinforce peace.124
In 2006, the UN Secretary-General’s progress report on the prevention of armed conf lict stated that, “… tackling food insecurity and related problems of agricultural underproduction and resource scarcity can do much to stabilize a fragile situation. A hungry person is an angry person”.125 This perspective was more recently reinforced in the April 2016 Security Council and General Assembly resolutions on peacebuilding, where the concept of sustaining peace was introduced as a unifying framework to address the root causes of conf lict.126
Recognizing that policies and actions should contribute to resolving and preventing the underlying challenges, in 2015 the Committee on World Food Security endorsed a Framework for Action for Food Security and Nutrition in Protracted Crises. The framework included a specific principle for addressing food insecurity and undernutrition in a conf lict-sensitive manner and for contributing to peace objectives through food security and nutrition-related interventions.127
The concept of sustaining peace has gained further traction in recent international
dialogues and policy discussions. It encompasses activ ities aimed at preventing the outbreak, escalation, continuation and recurrence of conf lict, including by addressing root causes and moving towards recovery, reconstruction and development. While economic revitalization and resilient and sustainable livelihoods should be key elements of a coordinated and coherent approach to sustaining peace, they need to be combined with establishing political processes, improving safety and security, re-establishing the rule of law and respect for human rights, restoring social services and supporting core government functions.128 Opportunities thus exist for interventions in support of food security, nutrition and agricultural livelihoods to contribute to conf lict prevention and sustaining peace, in order to address not only the symptoms but also the root causes of conf lict.
Pathways to building resilience to conflict and sustaining peaceThere are a number of food security and nutrition-related interventions and measures that can be put in place to prevent and mitigate the risk of conf licts recurring. Preventive interventions that can break the link between food insecurity and conf lict include shielding consumers and producers from food price shocks, for example, through price stabilization measures and social protection interventions. A different approach, rooted in social anthropology, is to drive recovery through agriculture, thereby bringing new life to shattered homes and communities, and motivating people to come together after a conf lict has destroyed social networks.129
Post-conf lict situations are typically fragile, with 40 percent reverting to conf lict within ten years.130 The international community should pay special attention to post-conf lict situations when seeking to sustain peace. However, there is increasing recognition that sustaining peace is no longer just a post-conf lict activ ity, but should be a priority during all stages of the conf lict cycle – before, during and after. Conflicts are rarely if ever linear and sequential processes, but rather escalate and de-escalate in
| 61 |

PART 2 CONFLICT, FOOD SECURITY AND NUTRITION: THE IMPERATIVE OF SUSTAINABLE PEACE
intensity and are often cyclical in nature, with periods and geographic pockets of relative peace and stability.
Acknowledging these complexities, a range of pathways can be identif ied through which support to livelihoods, food security and nutrition can also help build resilience against conf lict and contribute to sustaining peace:
� livelihood support that addresses the root causes of conf licts and conf lict stressors, and that promotes re-engagement in productive economic activ ities, including cash transfers and social protection;
� facilitated community-based approaches that help build relationships and social cohesion, improving aspirations, confidence and trust;
� interventions that contribute to building the capacity of institutions and local actors, improving governance to deliver equitable services.
Some of these pathways interact and overlap, and in most instances combinations will probably need to be considered (see Box 15). Moreover, these interventions will need to f it local conditions as well the context and nature of the conf lict.
As conf lict typically coincides with other shocks, it is also essential to enhance resilience to these.131 For example, efforts to strengthen resilience to droughts may include the introduction of drought-resistant crops, water harvesting, livelihood diversif ication and increased access to risk-based insurance. Resilience to economic shocks can be enhanced through social protection and livelihood interventions to increase purchasing power. Efforts to improve resilience to multiple food security shocks must also include national-level interventions, to enhance government capacity in critical areas such as food security, emergency preparedness and response and delivery of basic services such as health, nutrition, education, water and sanitation.
Food security and agriculture-based livelihood supportWhen designing food security interventions, it is helpful to identify and address possible causes of conf lict, such as natural-resource
management, land and water access and use, low income and high unemployment. Interventions can include support for livelihoods, repair of infrastructure damaged by conf lict or cash transfers and food assistance to help households avoid resorting to violence. It is equally vital to invest in strengthening existing systems and capacities to reduce the need for long-term emergency assistance. A recent review by the UN Peacebuilding Support Office recognizes the potential of improved basic service delivery to help sustain peace, including through education, food security, health, and water and sanitation.132
Livelihood-based peace dividends The WFP Livelihood Asset Recovery Programme in Liberia (2009–2012), supported by FAO, enabled rural communities to build and restore irrigation systems, roads and agroprocessing facilities. This raised farm productivity and food availability, improving household income and access to food and thereby addressing some of the root causes of conf lict. In the short term, the project provided work for unemployed rural youth, helping to defuse an impending cause of conf lict during a critical period of post-conf lict recovery;133 with about 90 percent of surveyed participants saying they believed these short-term jobs helped to promote peace and reconciliation.134
In another context, in response to the 2011 famine in Somalia, FAO significantly scaled up its support to existing CFW interventions in the central and southern regions. Since then, the Organization has continued to support thousands of families through a range of activ ities designed to improve the resilience of vulnerable communities, rather than merely offering short-term support for food security. In the absence of a functioning government, FAO provided basic services (such as livestock vaccinations) along with an ambitious programme to build and rehabilitate rural infrastructure (such as water catchments, irrigation canals) through CFW schemes. These rural assets were chosen for their potential to increase the resilience of farmers and pastoralists to shocks.135
| 62 |
THE STATE OF FOOD SECURITY AND NUTRITION IN THE WORLD 2017
“Resilience to conflict” can be understood as assisting countries and households to prevent, anticipate, prepare for, cope with, and recover from conflicts in order to “bounce forwards”.1 Below are some examples of practical measures that can address each of the five elements of resilience. Interventions should aim to support communities in their own strategies and be complemented by broader efforts to improve livelihoods.
� Preventing conflict: This will typically require undertaking a range of efforts to address both root and proximate causes of conflict, such as economic exclusion, extractive or predatory institutions, inequitable social services, access to and use of natural resources, food insecurity, and climatic disasters.
� Anticipating and preparing for conflict: Preliminary efforts are under way to develop conflict early-warning systems.2 These systems are intended to help governments and humanitarian organizations to plan and mobilize resources for timely responses, such as humanitarian assistance or shock-responsive social protection. At community level, helping households to anticipate conflict may also facilitate their own planning and preparation, for example, through savings, livelihood adjustments, or managed migration options. In addition, in contexts where there is a high risk of conflict, governments can be supported in preparing relief responses or designing shock-responsive social protection mechanisms, as well as in contingency planning to maintain delivery of services and social protection during a conflict. Again, communities can be supported, for example, by facilitating saving cash or food or developing skills in alternative livelihoods that are likely to be less sensitive to conflict.
� Coping with conflict: Conflicts often reduce household access to food, for example, owing to displacement, disruption of livelihoods and markets, food price inflation, or loss of household wage earners. It is critical to support vulnerable households in order to prevent them resorting to negative coping strategies that further undermine food security and nutrition or being incentivized to participate in violence. Doing so requires timely, well-targeted humanitarian action and shock-responsive, scaled-up social protection to enable
continued access to food during a conflict. Cash-for-work and food-for-assets programmes can also provide temporary work opportunities while at the same time creating or rehabilitating critical productive infrastructure, such as roads or irrigation systems. Farmers displaced by conflict can be trained in new livelihood skills, with which they can earn an income in camp settings. Communities affected by violent cattle raiding can be trained in switching partially or entirely to livelihoods that are less exposed to conflict risks. In pastoralist regions, watering points can be built in safe areas to avoid the risk of leading livestock into conflict zones.
� Recovering after conflict: Post-conflict situations offer a critical window of opportunity to support governments and communities in restoring food security and nutrition to build back better. Participation in decision-making is particularly important for vulnerable groups that have been systematically excluded and marginalized. Support can be provided to internally displaced people, refugees and ex-combatants for returning home and resuming productive agricultural activities, for example, by providing seeds, tools, livestock, or skills training. Such interventions can be an important element of national peace and recovery plans or disarmament, demobilization and reintegration programmes. Land tenure issues and access to natural resources may also need to be addressed. Support could also be provided in restoring conflict-damaged infrastructure, including roads and irrigation canals that are vital for food production and marketing. Opportunities may also arise to use food security and nutrition interventions as a platform for sustaining peace and mitigating relapses into conflict, for example, by bringing communities together to rebuild productive assets. Communities can be empowered when provided with knowledge and skills to improve their members’ health and nutritional situation. Progress towards peace is often fragile and easily reversible, and the impacts of conflict on food security may persist well beyond the end of active fighting. It will often be necessary to sustain investments in many of the measures outlined under “preventing”, “anticipating”, “preparing” and “coping” above.
BOX 15BUILDING RESILIENCE TO CONFLICT
1 C. Breisinger, O. Ecker, J.F. Maystadt, J.F. Trinh Tan, P. Al-Riffai, K. Bouzar, A. Sma and M. Abdelgadir. 2014. How to build resilience to conflict. The role of food security. IFPRI Food Policy Report. Washington, DC, International Food Policy Research Institute.
2 For example, Uppsala University is developing, testing and improving a pilot political Violence Early Warning System (ViEWS). See: www.pcr.uu.se/research/views/
| 63 |
PART 2 CONFLICT, FOOD SECURITY AND NUTRITION: THE IMPERATIVE OF SUSTAINABLE PEACE
The WFP programme Food Assistance for Conflict-Affected Populations in Nepal (2007–2010) supported interventions that helped to restore damaged productive agricultural infrastructure, as well as training farmers in agricultural skills. FAO contributed to this programme, which was launched at the end of the civil war in 2006. The interventions raised the incomes of affected rural households and reduced income inequality, thereby addressing what were considered root causes of support for the conf lict.136
The Western Sudan Resources Management Programme (WSRMP), f inanced by IFAD, promotes the development of a natural-resources governance system in the states of North, West and South Kordofan. In western Sudan, conf lict between different ethnic and livelihood groups over scarce natural resources continues to erupt, claiming dozens of lives every year. The programme is developing a governance structure for natural resources that is eff icient, equitable and environmentally sustainable, thereby reducing disputes over natural resources between nomadic and settled communities and farmers in f ive target areas in the country. A range of activ ities have been implemented to improve livelihoods and promote peaceful coexistence between different groups liv ing along livestock migration routes, including the creation of conf lict resolution centres, with 92 percent of reported cases resolved in 2015. This is coupled with major investments in land demarcation (more than 4 000 km of stock routes), restoration of grazing routes and rangeland, water harvesting, community adaptation plans, savings groups, and support for small businesses to promote diversif ication.137
The UN Peacebuilding Fund (PBF) has supported interventions in multiple contexts to address conf lict drivers, rehabilitate agriculture and restore productive assets,138 while the Safe Access to Fuel and Energy programme has helped reduce tensions arising from competition over natural resources, by building more resilient livelihoods and connecting displaced and host communities.139
People-centred, negotiated approaches can also address issues of land access, use and
management. For example, FAO’s provision of community-based animal health services and livestock vaccinations to the Dinka Ngok and Misseriya communities in the contested Abyei area of South Sudan and Sudan, working with local government bodies, UN peacekeepers and other UN entities,140 has been an effective entry point for re-establishing intercommunity dialogue, leading to a local-level peace agreement.141 Different groups often blame one another as the source of animal disease outbreaks, which can reignite violence. Enhancing mutual trust and basic stability is therefore essential for sustainable recovery and development programming, as recognized in the Security Risk Management Process for the Abyei area.142 Interaction between groups to address mutual problems is often a good starting point for building trust and establishing cooperation, thereby facilitating further collaboration between conf licting parties on more sensitive topics.
Social protection When properly designed, social protection systems can contribute to overcoming the frequent divide in responses between emergency humanitarian assistance and development support.143 Access to predictable, sizeable and regular cash transfers can protect poor households from the impacts of shocks in the short term, thereby minimizing negative coping practices that have lasting consequences. Over time, by helping vulnerable households manage risks better, social protection can induce investments in livelihoods that enhance people’s resilience to future threats and crises.144 In several countries, school meal programmes have contributed to sustaining peace, especially in the post-conf lict phase. Social protection can help create a sense of structure and normality, as well as enhance equity and cohesion among conf lict-affected populations.145
Non-formal and community-based support structures are often the first resort in times of conf lict, but are also weakened by such crises. Impact evaluations in sub-Saharan countries show that national cash transfer programmes can strengthen community-based reciprocity structures. Cash transfers enable beneficiaries
| 64 |
THE STATE OF FOOD SECURITY AND NUTRITION IN THE WORLD 2017
to join or re-enter the circles of their extended families and communities, decreasing the social distance between poor and wealthier households and local institutions.146
A recent study in the Philippines offers experimental evidence of conditional cash transfers147 leading to a substantial decrease in conf lict-related incidents in treatment villages relative to control v illages. The Pantawid Pamilyang Pilipino programme was also found to have reduced insurgent inf luence in the villages involved, although it cannot be excluded that this could also have been the result of insurgents shifting their focus of activ ity to controlling villages.
The delivery and design of social protection needs to be carefully considered and tailored to the specific context, incorporating well-designed information campaigns, awareness raising, grievance mechanisms and transparency of targeting, as well as building on any existing social protection structures.
Reducing price volatility and strengthening risk management capacitiesMeasures to stem agricultural and food price instability can help build resilience against human and climatic shocks to livelihoods, while mitigating the risk of food price spikes becoming a trigger of conf lict.
At the macro level, this might involve stricter rules on food commodity speculation and the institutionalization of grain reserves to stabilize prices in times of crisis. It also includes investment in creating price information systems, as well as expanding credit and insurance markets.148
Given the link between climatic shocks, crop and livestock price collapse and conf lict outbreaks, adopting agricultural practices and livelihood strategies for climate change adaptation should be promoted as an integral part of conf lict prevention – with pastoralist and semi-pastoralist livelihoods deserving special attention. Introducing and expanding credit and insurance markets may help herders to better cope with droughts by avoiding loss of their herds, and more importantly by
making it easier to restock herds where appropriate. Herders may also need financial and technical support to render their animals more drought-resistant and marketable, and thereby be better prepared for more frequent and intense droughts in the future.
FAO, UNICEF and WFP have identif ied three interlinked groups of strategies that promote resilience in the Horn of Africa: (i) strengthening productive sectors; (ii) improving basic social services; and (iii) establishing productive safety nets.149 Evidence from the Sudan shows that providing services such as health, education and physical security in remote areas characterized by chronic vulnerability to food insecurity, and to inter-ethnic and cross-border violence, can contribute to sustaining peace and longer-term resilience.
Gender-sensitive approaches and the role of women in securing peace and food securityAs analysed in the section “How does conf lict affect food security and nutrition?” (see p. 39), v iolent conf licts affect men and women differently. The different impacts in terms of shifted roles and responsibilities should be recognized when designing policies for economic recovery and peaceable transition of countries affected by conf lict.
Interventions that include specific measures for gender equality programming not only strengthen women’s empowerment but are also more effective in food and nutrition security outcomes. As well as helping them and their communities to complete harvests, targeting women as beneficiaries of food assistance and social protection can contribute significantly to improving household resilience and sustaining peace, as their roles are often undervalued and their needs marginalized.
Promoting women’s economic empowerment and challenging discriminatory social norms that constrain their access to resources, services or decision-making power can help to close the gender gap in agriculture, with long-term positive gains towards building peaceful and inclusive societies.
| 65 |
PART 2 CONFLICT, FOOD SECURITY AND NUTRITION: THE IMPERATIVE OF SUSTAINABLE PEACE
For example, Burundi continues to experience cycles of v iolence and political crisis that contribute to food insecurity and disrupt agriculture. This is taking place in a context where 75 percent of the population are food-insecure and 90 percent rely on subsistence farming as a livelihood source. IFAD’s country programme promotes nutrition-sensitive agriculture activ ities as a means to break out of the cycle, including nutritional education for mothers, vegetable production, livestock development, and creation of savings and loan schemes among community self-help groups. The programme targets households severely disrupted by conf lict, also promoting literacy for women and providing access to legal advice on how to increase their economic engagement.150
The landmark United Nations Security Council Resolution 1325151 addresses not only the inordinate impact of conf lict on women, but also the pivotal role they should, and do, play in conf lict management, resolution and sustainable peace. A study of the impacts of implementation of this resolution found significant progress in supporting women’s participation in electoral processes, the security sector, and gender mainstreaming in policies. However, only modest impacts were found in other areas including protection for women against conf lict-related sexual v iolence and for women serving in peacekeeping forces.152
It is often assumed that women are f irst and foremost victims of war. However, this is a limited perspective as women also undertake daily activ ities that contribute to peace. A recent study found that women’s contributions to peace were most notable when they worked together to bridge differences in religion, ethnicity, class and between urban and rural divides. Working across divides has allowed more-robust organizations and networks to emerge, as well as preparing the ground for peace within the larger population. In Burundi, after the peace agreement was signed in 2000, women’s organizations were supported in developing radio programmes to share concerns and information. They also received training on conf lict resolution which facilitated the creation of mutual-aid and
conf lict-resolution networks and female-run production cooperatives.153
Community-based approaches to build trust and social cohesionTraditional post-conf lict policies and actions are generally focused on reconstruction efforts, which are important for increasing agricultural production in short periods. However, recent analysis suggests that policies should also aim to create favourable conditions for reducing uncertainty (see the section “How does conf lict affect food security and nutrition?”, p. 39).
Re-establishing the rule of law and reducing insecurity are essential for improving confidence and trust in communities and between households. Paired with increased access to formal credit and social protection, reducing uncertainty may also help households to avoid selling productive assets or taking suboptimal planting decisions, and instead invest more in improving incomes and food security.
Reinforcing positive aspirations, improving well-beingConfidence, hope and dignity are all factors that shape people’s aspirations about their future lives and relations with others – including perceptions and attitudes towards social cooperation and cohesion, both of which are arguably key to sustaining peace.154 Recent research building on behavioural economics has shown that aspirations are crucial in shaping economic development and social interactions.155 Some of these findings have informed social and individual skills training programmes aimed at young people who were involved in violent conf licts, helping them to reset and improve their aspirations.
As many ex-combatants are young men and women from rural areas, enhancing skills and providing capital for agricultural livelihoods is as important for food security and income as it is for a more positive outlook. The agriculture-based Ex-Combatant Reintegration in Liberia programme provided participants with meals, clothing, basic medical care and personal items, as well as
| 66 |

THE STATE OF FOOD SECURITY AND NUTRITION IN THE WORLD 2017
training and agricultural tools and supplies. An evaluation showed the programme led to the increased engagement of youth in agriculture and reduced involvement in ill icit mining. Participants were also much less likely to have joined local armed groups involved in an outbreak of v iolence in Côte d’Ivoire.156
Jobs can compensate for the loss of identity, status and income associated with the dissolution of armed forces and militias, as well as counteracting stress factors that could reignite conf lict. Central to the PBF–FAO–ILO Jobs for Peace programme implemented in the insurgency-affected areas of Nepal in the period 2009–2012 was the creation of rural youth employment. It played an important role in enhancing social cohesion during the post-conf lict process of reintegration and sustaining peace, providing remunerative alternatives and discouraging re-engagement in violence. Similarly, an FAO-supported agricultural livelihoods programme in the North Caucasus stimulated economic recovery, contributed to social regeneration and enhanced individuals’ sense of well-being.157
Cash transfer programmes can also improve mental health and reduce stress and anxiety among beneficiary populations, as seen in refugee groups in Jordan. In this case, the regular transfer, receipt and consequent ability to pay for critical expenditures increased their sense of self-esteem, with one-third of respondents reporting lower levels of stress and anxiety.158
Joint community planning and dialogue, supporting social cohesionFood security and nutrition interventions can be rendered more effective by facilitating dialogue between groups from different sides of a conf lict and engaging them in the planning and implementation of programmes. Training and awareness raising for sustaining peace can be equally critical for successful interventions.
For example, in many conf lict-affected contexts, WFP conducts seasonal livelihood programming consultations involving representatives of civ il society organizations,
communities and other stakeholders. In areas where tensions exist between displaced populations and host communities, such consultations engage participants from both sides of the conf lict in joint assessments of the food security situation and identify possible means of improving resilience to shocks.
The FAO-supported Dimitra Clubs improve rural people’s livelihoods and gender equality in communities in Burundi, the Democratic Republic of the Congo, Ghana, Mali, Niger and Senegal. Empowering rural women and men – both adults and young people – the clubs provide spaces for community-level dialogue and action to address common challenges. Qualitative assessments ref lect changes in behaviour, practices and perceptions of men and women in rural communities, including: improved access to information and knowledge, new agricultural practices, improved self-confidence and leadership of women, community mobilization and improved social cohesion. The discussions and achievements of the clubs are broadcast on community radio to inspire others. After years of civ il war and continuing insecurity in the eastern part of the Democratic Republic of the Congo, the clubs have created new dynamics through information-sharing on food security, agricultural practices, HIV/AIDS, and domestic v iolence. The clubs have given a voice to women, helping to bring communities together to invest in improving their livelihoods.159
An ongoing PBF-funded programme in Kyrgyzstan to improve cross-border cooperation brings ethnic Kyrgyz and Tajik groups together to restore irrigation canals through WFP’s Food Assistance for Assets programme. The canals benefit both ethnic groups, while the process of jointly managing and physically working together on the project provides space for interaction, dialogue, cooperation and building trust, particularly through regular intercommunity meetings.160 Other agencies including FAO, UNDP, UNICEF, and UN Women are involved in activ ities within this programme, all promoting intercommunity dialogue and engagement.
| 67 |

PART 2 CONFLICT, FOOD SECURITY AND NUTRITION: THE IMPERATIVE OF SUSTAINABLE PEACE
Effectiveness and legitimacy of institutionsPoor governance is often a factor in conflict, undermining the state–society compact and creating or exacerbating the perception of discrimination as well as actual inequalities. The impact of conflict on food insecurity and undernutrition is also stronger when compounded by weak capacity of government and non-governmental institutions to respond to crises and mitigate the risks of affected and vulnerable populations (see the sections “Why focus on the nexus between conflict, food security and nutrition?”, p. 30, and “How does conflict affect food security and nutrition?”, p. 39).
Food security and nutrition interventions that strengthen institutionsFood security interventions that build the capacity of institutions to deliver equitable access to services may help to restore confidence in state effectiveness and legitimacy, while increasing incentives for the population to maintain peace and stability. This could be equally true for building the capacity of non-state-level institutions (such as farmer cooperatives, water user associations, women’s groups, and community grain banking groups) to provide better services for local communities. Many see functioning and effective institutions as essential for building resilience to conf lict.161
Poor basic service delivery can undermine state legitimacy and perpetuate conf lict. However, contrary to conventional wisdom, improved service delivery does not necessarily enhance state legitimacy.162 Research by the Secure Livelihoods Research Consortium in the Democratic Republic of the Congo, Nepal, Pakistan and Uganda found that poor experiences of service quality indeed led to less-favourable perceptions of the state. At the same time, it concluded that enhanced service delivery only improved such perceptions if accompanied by improvements in other forms of societal trust, including through community participation in voicing grievances. This more nuanced relationship between service delivery and state legitimacy was also identif ied elsewhere, such as in the provision of water services in Iraq.163 At the same time, improved service delivery should not exacerbate inequalities in fragile situations, as this could risk re-igniting conf lict.
Strengthening regional and national institutions is critical for the effective design and implementation of food security and nutrition information systems and disaster risk prevention and reduction mechanisms. Within the framework of the Global Alliance for Resilience Initiative and the United Nations Integrated Strategy for the Sahel, FAO, WFP and other partners support the Cadre Harmonisé, an information and early warning system for food security and nutrition in the Sahel. Established in 2008–09 by the Permanent Interstate Committee for Drought Control in the Sahel, the Cadre Harmonisé is now present in 17 countries in the region and yields regular food security situation reports with timely warnings for decision-makers. As a result, governments and humanitarian actors in the region have access to reliable data to take informed decisions as to how to prevent, mitigate, anticipate and respond to recurrent food crises. For example, the Cadre Harmonisé provides regular updates on the food security crisis that resulted from the Boko Haram-related violence in northeast Nigeria.
Recently, FAO has supported Côte d’Ivoire in the development and adoption of a policy for land tenure security in rural areas. The policy is considered essential in the country’s post-conf lict context, where tensions over land tenure continue to pose risks to social stability and could spark conf licts between communities. Developed through a participatory and inclusive approach that involved communities, traditional and administrative authorities, non-governmental organizations, development partners and the Government, an autonomous agency was created to implement the policy, and a communications strategy on rural land tenure security was rolled out. Collective land ownership certif icates have been agreed, encouraging agro-enterprises to return to business, as disputes over land are no longer a major issue.164
Official development assistance supporting food security and sustaining peaceFrom humanitarian to development support?Many of the examples of interventions contributing to resilience and sustaining peace cited above are supported by both official
| 68 |
THE STATE OF FOOD SECURITY AND NUTRITION IN THE WORLD 2017
development assistance (ODA) and national efforts. Yet, ODA support for efforts to prevent conf lict and sustain peace remains limited.
Much of the ODA f lowing to countries in conf lict or with a protracted crisis takes the form of humanitarian assistance. Seven protracted crisis contexts received on average more than 30 percent of ODA in the form of humanitarian assistance in the period 2012–14, while four received more than 45 percent of ODA in that form, rising to 79 percent in the case of the Syrian Arab Republic; these shares are almost 20 percent higher when protracted crises are f iltered for conf lict. Compared with countries not affected by conf lict, humanitarian assistance to countries affected by conf lict is three and a half times higher as a proportion of total ODA.165
About 80 percent of humanitarian appeals are related to conf lict situations, most of which are now protracted in nature. There have been calls in recent years for longer-term and more predictable funding in protracted crises in order to enable a sustained response to chronic or recurrent needs and help boost the resilience of crisis-affected communities.166 However, the data cited above indicate that integrating humanitarian and development assistance in the context of long-term policy and planning frameworks may not have changed substantially in the past decade – despite continued increases in overall levels of humanitarian assistance. In fact, the highest-ever amount of international humanitarian assistance recorded was in 2015: estimated at US$28 billion, this was the third consecutive annual increase in overall spending. In the past decade, the total volume of humanitarian assistance has increased steadily, particularly in protracted crisis contexts (almost 60 percent) and in countries affected by conf lict (almost 50 percent).
Towards multiyear planning and financingBetter integration of humanitarian and development support to conf lict contexts requires longer-term donor commitments. Such a shift towards multiyear planning is already a reality in a number of protracted crisis and conf lict contexts. By 2015, some 15 consolidated
appeals or humanitarian action plans had been adopted for more than the traditional one-year duration. Cameroon, the Central African Republic, Chad, the Democratic Republic of the Congo, Somalia and the Sudan now all engage in multiyear planning, in some cases for a second three-year cycle. The Syrian Regional Refugee and Resilience Response Plan also includes appeals for 2017 and 2018.
While the argument about whether to plan over multiyear cycles appears to be prevailing, the issue at stake is to do so more effectively. Concerns remain as to how much ODA-funded support is indeed now subject to actual multiyear programming and financing. For example, in 2015, the United Nations Office for the Coordination of Humanitarian Affairs (OCHA) estimated that only 9 percent of the 527 projects under the Sahel 2014–2016 Humanitarian Response Plan could legitimately be considered part of a multiyear cycle.167 Yet other evidence is more encouraging: in 2014, multiyear contributions to WFP increased to over US$600 million, representing almost 11 percent of total contributions received. This is a three-fold increase since 2010–11, building on an expanding base of multiyear agreements with donors.168
ODA support for agriculture in conflict and protracted crisis contextsAgriculture is the mainstay of livelihoods of most people liv ing in situations of fragility, protracted crisis, and/or conf lict (see the section “Why focus on the nexus between conf lict, food security and nutrition?”, p. 30). This highlights the importance of increasing the priority of and support for agricultural development in these contexts in terms of contributing to recovery, building resilient livelihoods and improving food security and nutrition as a cornerstone for peaceful and inclusive societies.
It is not feasible to analyse existing ODA data to assess in detail the amount of international support for specif ic interventions towards resilience building in conf lict-affected contexts. Painting with a broader brush, in contexts of protracted crisis, the sectors of direct importance to food security and nutrition
| 69 |
PART 2 CONFLICT, FOOD SECURITY AND NUTRITION: THE IMPERATIVE OF SUSTAINABLE PEACE
received relatively small shares of total developmental ODA between 2012 and 2015: 5.8 percent for agriculture; 3.8 percent for water, sanitation, and hygiene, 7.4 percent for basic health, and 2.1 percent for education. Notably, the share for agricultural development in conf lict-affected and protracted crisis contexts was on average well below that for other least-developed countries, which stood at 8.1 percent.169
On the humanitarian side, despite huge increases in levels of funding, there remains a large gap in terms of increasing funding requirements. Analysis of the OCHA Financial Tracking System shows that the percentage of support versus requirements under the Consolidated Appeals Process for the agriculture sector in 2016 was 27 percent, a dramatic decline from 2011 when support was at 58 percent of requirements. Funding levels for countries with a protracted crisis did marginally better at 31 percent (Figure 22). A similar trend can be seen in the food sector,170 where funding declined from 77 percent of requirements in 2011 to 51 percent in 2016, with the same level both globally and just in protracted crisis contexts. A fall in the percentage of requirements met was also seen in the health sector between 2011 and 2016. Other key sectors such as water and sanitation and education globally received less than 50 percent of assessed needs.171 Given the myriad factors underlying conf licts and the multiple interventions required to sustain peace, all sectors require adequate funding, including support to governance and peacekeeping.
Numerous studies have demonstrated that UN peacekeeping expenditures help to reduce the risk of renewed conf lict after it has ended. While recognizing that economic recovery is the best way to achieve stable peace, doubling peacekeeping expenditure can reduce the risk of conf lict recurrence from 40 to 31 percent.172
An analysis of post-conf lict northern Uganda (see Box 16) i l lustrates how a combination of peace processes and investments in peace and recovery led to significant gains in food security and nutrition within a relatively short period.
Implications for ODA contributions to sustaining peaceDespite recent initiatives and positive moves toward multiyear planning and financing in humanitarian appeals, this limited analysis of development and humanitarian aid f lows suggests there is still a need to better “layer” different f inancing tools and resources. Individual protracted crisis and conf lict-affected contexts need to receive enough of the right mix of support to respond to the challenges of ensuring food security and nutrition, strengthening resilience and sustaining peace. This should be ref lected across the humanitarian, development and peace pillars and could include risk f inance, peace operations, multilateral, bilateral, the private sector, technical cooperation, loans, and domestic tax revenue, among others.
Donors do not seem to give the highest priority to addressing the root causes of conflict. That is to say, an examination of sector allocations of ODA shows that countries with conf lict and protracted crisis situations receive less ODA for agricultural sector development than do other developing countries with comparable shares of agriculture to GDP. The international community has a responsibility to help address the root causes of conf lict, which may also relate in part to disputes over agricultural and other natural resources, as well as deteriorating food insecurity and malnutrition. Measures aimed at strengthening resilience and sustaining peace can also support a sustainable shift from providing humanitarian assistance to those in need, to reducing those needs and the related humanitarian costs.
This will also mean working together more effectively across the humanitarian–development–peace nexus in pursuit of collective outcomes. Recently termed the “New Way of Working”,173 this collective method is being adopted as a priority across the UN system, within (and between) both the Inter-Agency Standing Committee and the United Nations Development Group. Representing a huge challenge both in terms of operations and policy, this will be a gradual process, but one that is essential to achieving improved food
| 70 |
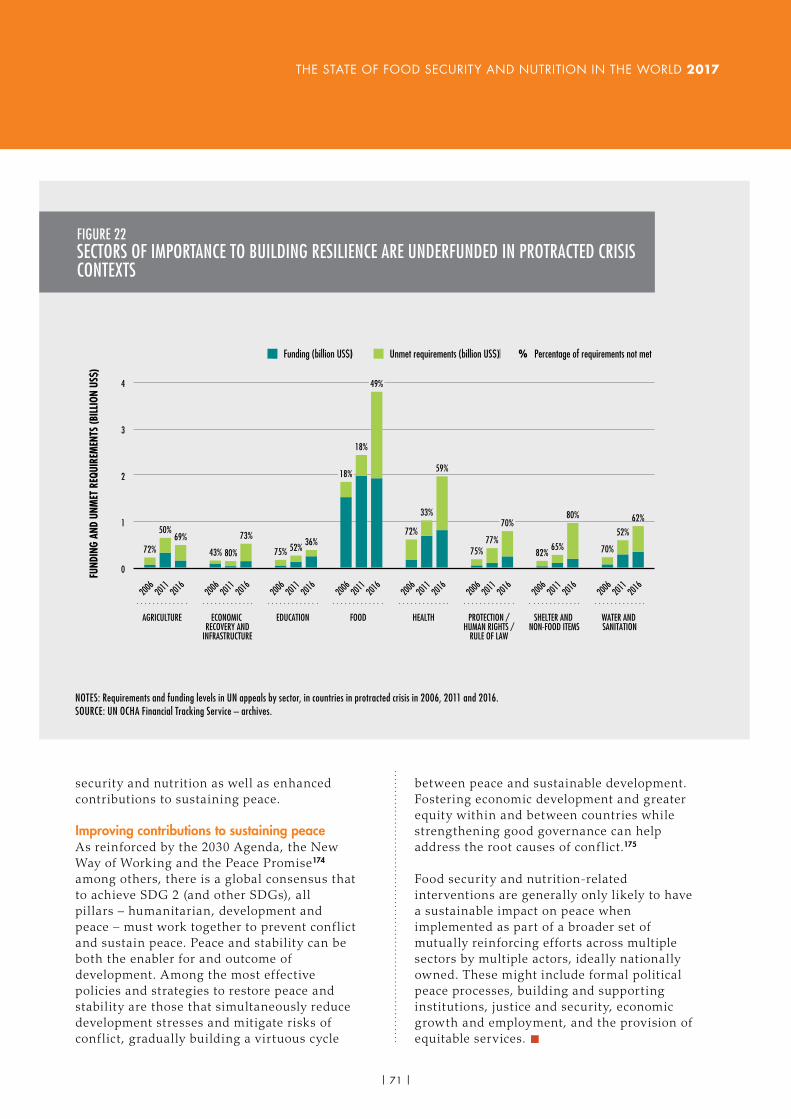
THE STATE OF FOOD SECURITY AND NUTRITION IN THE WORLD 2017
security and nutrition as well as enhanced contributions to sustaining peace.
Improving contributions to sustaining peaceAs reinforced by the 2030 Agenda, the New Way of Working and the Peace Promise174 among others, there is a global consensus that to achieve SDG 2 (and other SDGs), all pillars – humanitarian, development and peace – must work together to prevent conf lict and sustain peace. Peace and stability can be both the enabler for and outcome of development. Among the most effective policies and strategies to restore peace and stability are those that simultaneously reduce development stresses and mitigate risks of conf lict, gradually building a virtuous cycle
between peace and sustainable development. Fostering economic development and greater equity within and between countries while strengthening good governance can help address the root causes of conf lict.175
Food security and nutrition-related interventions are generally only likely to have a sustainable impact on peace when implemented as part of a broader set of mutually reinforcing efforts across multiple sectors by multiple actors, ideally nationally owned. These might include formal political peace processes, building and supporting institutions, justice and security, economic growth and employment, and the provision of equitable services. n
0
72%
50%69%
43% 80%
73%
75% 52%36%
72%
33%
59%
75%77%
18%
1
2
3
4
2006
2011
2016
2006
2011
2016
2006
2011
2016
2006
2011
2016
2006
2011
2016
2006
2011
2016
2006
2011
2016
2006
2011
2016
FUND
ING
AND
UNM
ET R
EQUI
REM
ENTS
(BIL
LION
US$
)
AGRICULTURE ECONOMIC RECOVERY AND
INFRASTRUCTURE
EDUCATION FOOD HEALTH PROTECTION /HUMAN RIGHTS /
RULE OF LAW
SHELTER AND NON-FOOD ITEMS
WATER AND SANITATION
18%
49%
70%
82%65%
80%
70%
52%
62%
%Unmet requirements (billion US$)Funding (billion US$) Percentage of requirements not met
NOTES: Requirements and funding levels in UN appeals by sector, in countries in protracted crisis in 2006, 2011 and 2016.SOURCE: UN OCHA Financial Tracking Service – archives.
FIGURE 22SECTORS OF IMPORTANCE TO BUILDING RESILIENCE ARE UNDERFUNDED IN PROTRACTED CRISIS CONTEXTS
| 71 |
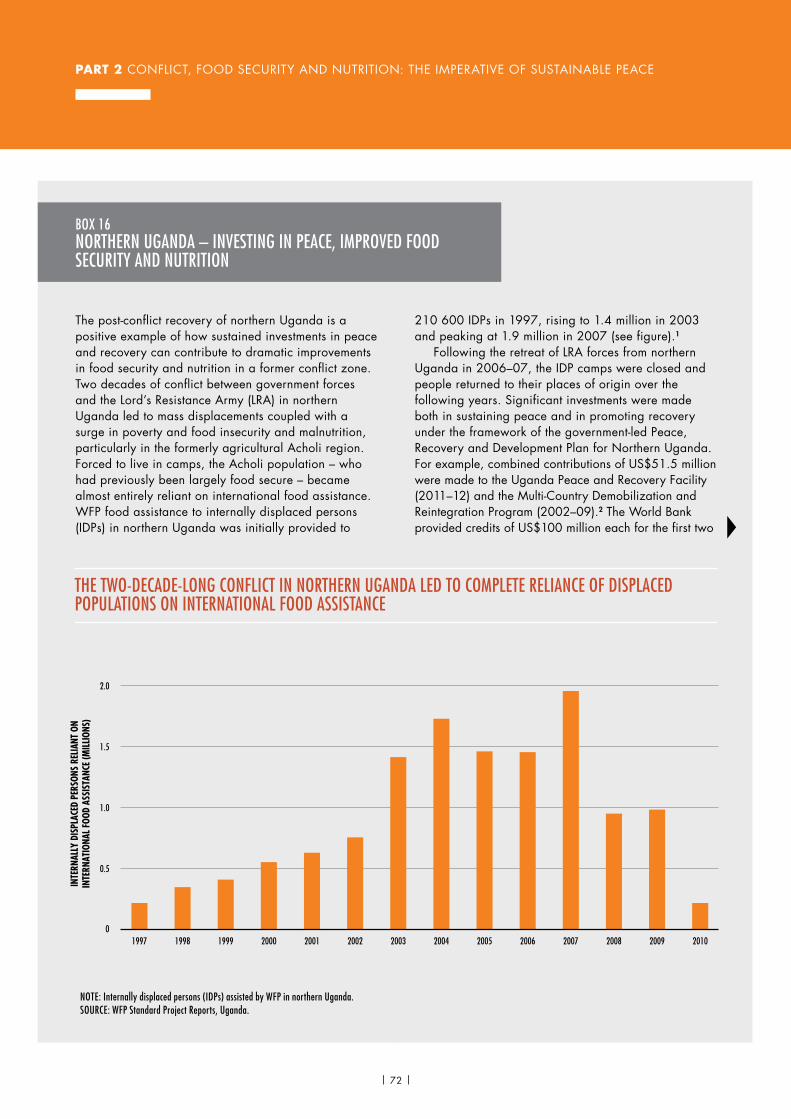
PART 2 CONFLICT, FOOD SECURITY AND NUTRITION: THE IMPERATIVE OF SUSTAINABLE PEACE
BOX 16NORTHERN UGANDA – INVESTING IN PEACE, IMPROVED FOOD SECURITY AND NUTRITION
0.5
1.0
01997 1998 1999 2000 2001 2002 2003 2004 2005 2006 2007 2008 2009 2010
1.5
2.0
INTE
RNAL
LY D
ISPL
ACED
PER
SONS
REL
IANT
ON
INTE
RNAT
IONA
L FOO
D AS
SIST
ANCE
(MIL
LION
S)
The post-conflict recovery of northern Uganda is a positive example of how sustained investments in peace and recovery can contribute to dramatic improvements in food security and nutrition in a former conflict zone. Two decades of conflict between government forces and the Lord’s Resistance Army (LRA) in northern Uganda led to mass displacements coupled with a surge in poverty and food insecurity and malnutrition, particularly in the formerly agricultural Acholi region. Forced to live in camps, the Acholi population – who had previously been largely food secure – became almost entirely reliant on international food assistance. WFP food assistance to internally displaced persons (IDPs) in northern Uganda was initially provided to
210 600 IDPs in 1997, rising to 1.4 million in 2003 and peaking at 1.9 million in 2007 (see figure).1
Following the retreat of LRA forces from northern Uganda in 2006–07, the IDP camps were closed and people returned to their places of origin over the following years. Significant investments were made both in sustaining peace and in promoting recovery under the framework of the government-led Peace, Recovery and Development Plan for Northern Uganda. For example, combined contributions of US$51.5 million were made to the Uganda Peace and Recovery Facility (2011–12) and the Multi-Country Demobilization and Reintegration Program (2002–09).2 The World Bank provided credits of US$100 million each for the first two
NOTE: Internally displaced persons (IDPs) assisted by WFP in northern Uganda.SOURCE: WFP Standard Project Reports, Uganda.
THE TWO-DECADE-LONG CONFLICT IN NORTHERN UGANDA LED TO COMPLETE RELIANCE OF DISPLACED POPULATIONS ON INTERNATIONAL FOOD ASSISTANCE
| 72 |
THE STATE OF FOOD SECURITY AND NUTRITION IN THE WORLD 2017
OVERALL RECOMMENDATIONSConflict can have significant negative and destructive impacts on the immediate and underlying determinants of individual and household food security and nutrition including nutrition-related morbidity and mortality. When considering appropriate responses, it is critical to understand the complex, direct and indirect channels and the multiple compounding impacts. This in turn requires an understanding not only of the nature of the conflict, but also of context-specific factors and the vulnerability of people’s livelihoods.
To effectively address conf lict-related causes of food insecurity and undernutrition as well as reduce the risks of conf lict, it is necessary to invest in multisectoral causal analyses and interventions that address both chronic and acute food insecurity and undernutrition. Policy and programme coherence is needed in addressing these impacts, along the following lines:
� Economic policy responses are necessary where conf lict and civil insecurity create economic crises that wreak havoc on production and growth and endanger food security and nutrition. Social policies are also needed to address the challenges to
BOX 16(CONTINUED)
1 WFP. 1997. Uganda Standard Project Reports. Rome; WFP. 2003. Uganda Standard Project Reports. Rome; and WFP. 2007. Uganda Standard Project Reports. Rome.2 B. Rohwerder. 2014. Costs of peace processes. GSDRC Helpdesk Research Report 1112. Birmingham, UK, GSDRC, University of Birmingham.3 World Bank. 2009. Implementation completion and results report (IDA-36970 IDA-3697A IDA-46260 TF-20972 TF-50522) on a credit in the amount of SDR 80.1 million to the Republic of Uganda for a Northern Uganda Social Action Fund. Washington, DC.4 R. Birner, M.J. Cohen and J. Ilukor. 2011. Rebuilding agricultural livelihoods in post-conflict situations: what are the governance challenges? The case of northern
Uganda. Uganda Strategy Support Program (USSP) Working Paper 07. Kampala, International Food Policy Research Institute.5 WFP. 2010. Uganda Standard Project Report. Rome.6 Data from UNICEF/WHO/World Bank Group Joint Child Malnutrition Estimates, 2017 edition.7 World Bank. 2017. Poverty headcount ratio at national poverty lines (percentage of the population). In: Data [online]. Washington, DC. [Cited 30 June 2017] http://data.worldbank.org/country/uganda?view=chart8 USAID. 2017. Working in crises and conflict. In: Uganda [online]. Washington, DC. [Cited 30 June 2017]. www.usaid.gov/uganda/working-crises-and-conflict
phases of the Northern Uganda Social Action Fund (NUSAF I and II).3
The Government of Uganda identified agriculture as a priority for post-conflict recovery. Multiple organizations supported IDPs and ex-combatants in repairing their livelihoods through the provisioning of inputs, such as seeds and tools, as well as livestock restocking, cash- and food-for-work programmes, all complemented by national-level efforts to enhance food security and nutrition governance. An estimated 32 percent of funding for NUSAF I went to agriculture.4
Food security and nutrition in northern Uganda have improved substantially since the end of the conflict: no further food assistance has been required by the Acholi population since the end of 2011, and WFP phased it out in that region in 2010.5 In Uganda
as a whole, the prevalence of wasting in children declined by almost one-third, from a high of 6.3 percent in 2006 to 4.3 percent in 2012.6 Meanwhile, the percentage of the country’s population living below the national poverty line declined from 31.1 percent in 2005 to 19.5 percent in 2012.7
The case of northern Uganda demonstrates how timely and substantial post-conflict investments in peace and recovery, with a strong emphasis on agriculture, can contribute to significantly improving food security and nutrition. Despite the emergence of relative peace, recent advice suggests that continued support is still required to address underlying conflict stressors in northern Uganda, such as grievances over land and ethnic divisions, to avoid a relapse into conflict.8
| 73 |
PART 2 CONFLICT, FOOD SECURITY AND NUTRITION: THE IMPERATIVE OF SUSTAINABLE PEACE
health and nutrition that result from reduced access to and availability of food.
� Policies and investments are needed for agriculture and food systems in particular. Deep economic crises can unfold where the root cause of the conf lict is competition over natural resources, including productive land or water resources. Policies should address these root causes and aim to mitigate – and if possible prevent – their impact on food systems, food security and the economy at large. As agriculture is the mainstay of people’s livelihoods in many countries affected by conf lict, interventions should prioritize investment in improving the resilience of the sector.
� Effective support to populations displaced by conf lict needs to be an integral part of the policy agenda, considering that more than half of the world’s refugees originate in countries affected by conf lict and IDPs are concentrated in these same areas. Adequate livelihood and social support needs to be provided to both the displaced and the host populations, as they too experience added stress on their resources, and to address enhanced risk of disease due to poor access to water, sanitation and health services.
� There is a need for polices and scaled-up programmes aimed at building and strengthening resilience to shocks and stressors in order to prevent long-lasting consequences on food security and nutrition. Strengthening social policies and protection systems will be critical, as households’ own coping capacities tend to be considerably reduced in situations of v iolent conf lict. Unless these programmes are in place, individuals and households may engage in increasingly destructive and irreversible coping strategies that threaten future livelihoods, food security and nutrition.
� Food security and nutrition policies and programmes must take into consideration the specific needs and priorities of men, women, boys and girls, and target interventions in a gender-responsive way that leaves no one behind. This will require interventions being developed based on a sound gender analysis and that existing vulnerabilities and capacities be fully recognized, providing both men and women with the opportunity to be engaged in the whole process.
To inform coherent policy responses as described above, it will be essential to improve the evidence base on cause and effect in the nexus between conflict, food insecurity, and sustaining peace (see Box 17). Moreover, the shifting nature and complexity of conflict has significant implications for efforts and interventions aimed at reducing hunger and undernutrition. Working in conflict-affected contexts cannot be “business as usual”, but requires a conflict-sensitive approach if the challenges of hunger and undernutrition are to be addressed.
As shocks to food security and nutrition may also be a trigger or compounding factor of conf licts, building more-resilient rural livelihoods and measures to improve food security and nutrition will l ikely be instrumental to both mitigating the impacts of conf lict and reducing the likelihood of conf lict occurring. Regardless of the triggers, there are three principles to consider when identifying possible responses to conf lict. In all situations, responses should be supportive of wider peace processes and contribute to sustaining peace, demanding conf lict-sensitive approaches and ensuring that the role of women is sufficiently recognized:
� In situations of ongoing conflict, it is essential that assistance be provided in ways that do not exacerbate tensions, that avoid causing harm and that adhere to humanitarian principles, while ensuring that efforts aim to build resilience as well as address immediate needs.
� In areas of greater stability, the focus should be on supporting local reconciliation and normality, for example, by supporting livelihoods, securing assets and re-establishing infrastructure and providing basic services (i.e. health, nutrition and social) in ways that help bring communities together, build social cohesion, and offer a platform for peace-related lessons learned.
� In areas with peace accords in place, support must be geared at local and national peace and development plans in a coherent and integrated manner.
No blueprints can be provided on the best course of action to take in any given conf lict-affected situation, but some general recommendations on better ways of working are as follows:
| 74 |
THE STATE OF FOOD SECURITY AND NUTRITION IN THE WORLD 2017
� Sustaining peace is a long-term engagement. In order to generate positive pathways, it is important to think, invest and act long-term. The interaction of food security and nutrition interventions with complex processes of social change both shape and are shaped by individual and household behaviours, social norms, institutions, the operation of markets, and collective action.
� Closer partnerships between humanitarian, development and peace actors and international f inancial institutions will be important to support conf lict and protracted crisis-affected communities in addressing root causes, building resilience and finding durable solutions.
Substantially improving the evidence base to better inform the design, targeting and implementation of interventions will require the following efforts:
� Strengthen collaboration with research institutions and academia in measuring outcomes related to peace in order to explore pathways such as building resilience to conflict, improving social cohesion, the role of institutions, or reducing the opportunity costs for violence and conflict.
� Conduct further research around the role of individual aspirations and perceptions and how people make choices and decisions in conflict and protracted crisis contexts. This could include using perceptions to measure household resilience1 or exploring how to enhance individuals’ positive aspirations and perceptions through food security and nutrition interventions.
� Better align databases and conceptual frameworks that measure food security and conflict, enabling the improvement of local contexts where conflict and food insecurity interact.2
� Most existing conflict early warning systems fall short in terms of transparency, public availability and replicability, which greatly hampers their usefulness. Uppsala University3 is working on a political Violence Early Warning System (ViEWS) to assess the risk that conflicts will erupt, continue, or spread to new locations, involve new actors, or start targeting civilians and whether fragile peace will hold. Such systems could provide forecasts on the timing and location of different forms of political conflict, bringing together the underlying structural risks of violence (including food security drivers), and could be usefully integrated into food security, nutrition, and early warning systems.4
BOX 17THE NEED FOR MORE AND BETTER RESEARCH AND ANALYSIS
1 Cross-country evidence is emerging from the FAO-led Resilience Index Measurement Analysis methodology on the relationship between resilience and subjective perceptions of well-being and social inclusion in Matam (Senegal) and the Triangle of Hope (Mauritania).2 FAO. 2017. Sowing the Seeds of Peace for Food Security: Disentangling the nexus between conflict, food security and peace, edited by C. Holleman, J. Jackson, M.V. Sánchez & R. Vos. FAO Agricultural Development Economics Technical Study 2. Rome.
3 M. Colaresi, H. Hegre and J. Nordkvelle. 2016. Early ViEWS: a prototype for a political Violence Early-Warning System. Paper presented to the American Political Science Association annual meeting 2016, Philadelphia, USA.4 For example, the Global Early Warning – Early Action system that FAO has developed to highlight major disaster risks to food security and agriculture (www.fao.org/3/a-i7149e.pdf).
� Contributing to improved food security, nutrition and sustainable peace will require a change in mind-set to a more deliberate, preventive approach, and from short-term and output-based interventions to longer-term sustainable and collective outcomes linked to a strategic focus on resilience building.
� In conf lict-affected and protracted crisis contexts, a boost in development action to help people become self-reliant as quickly as possible and build resilience to future shocks (including conf lict) is v ital. This will require more risk tolerance, earlier engagement, more f lexible f inancing and context-adaptable, conf lict-sensitive programming. n
| 75 |

ANNEX 1
REGIONS/SUBREGIONS/COUNTRIES/TERRITORIES
PREV
ALE
NCE
OF
UN
DER
NO
URI
SHM
ENT
IN
THE
TOTA
L PO
PULA
TIO
N2
PREV
ALE
NCE
OF
SEV
ERE
FOO
D IN
SECU
RITY
IN T
HE
TOTA
L PO
PULA
TIO
N3
PREV
ALE
NCE
OF
WA
STIN
G
IN C
HIL
DRE
N
(UN
DER
5 Y
EARS
OF
AG
E)
PREV
ALE
NCE
OF
STU
NTI
NG
IN C
HIL
DRE
N
(UN
DER
5 Y
EARS
OF
AG
E)
PREV
ALE
NCE
OF
OV
ERW
EIG
HT
IN
CHIL
DRE
N
(UN
DER
5 Y
EARS
OF
AG
E)
PREV
ALE
NCE
OF
OBE
SITY
IN
TH
E A
DU
LT
POPU
LATI
ON
(1
8 YE
ARS
AN
D O
LDER
)
PREV
ALE
NCE
OF
AN
AEM
IA A
MO
NG
W
OM
EN O
F RE
PRO
DU
CTIV
E A
GE
(15–
49 Y
EARS
)4
PREV
ALE
NCE
OF
EXCL
USI
VE
BREA
STFE
EDIN
G
AM
ON
G IN
FAN
TS
0–5
MO
NTH
S O
F A
GE
YEARS OF DATA
2004–06 2014–16 2014–16 20166 20055 20166 20055 20166 2005 2014 2005 2016 20057 20158
CH
ILD
A
NTH
ROPO
MET
RY
EXC
LUSI
VE
BREA
STFE
EDIN
G
PERCENTAGE
WORLD 14.1 10.7 9.1 7.7 29.5 22.9 5.3 6.0 9.6 12.8 30.6 32.8 35.2 43.0
Least-developed countries
28.1 24.4 23.3 8.8 41.8 34.8 2.7 4.2 2.6 4.4 43.4 39.6 39.8 47.9
Landlocked developing countries
27.2 23.2 23.2 n.a. n.a. n.a. n.a. n.a. 5.6 7.9 36.0 33.1 40.1 49.4
Small island developing states
21.1 17.7 n.a. n.a. n.a. n.a. n.a. n.a. 13.9 18.4 32.2 31.5 30.7 29.9
Low-income economies 31.8 28.6 n.a. 7.7 43.7 36.2 3.4 3.4 2.8 4.4 42.1 37.3 40.0 48.1
Lower-middle-income economies
18.7 13.6 n.a. 11.8 41.1 32.0 3.9 4.8 4.3 6.5 44.5 43.1 37.4 48.1
Low-income food-deficit countries
22.0 18.0 n.a. n.a. n.a. n.a. n.a. n.a. 2.9 4.8 48.9 46.3 39.0 49.9
AFRICA 20.8 18.9 25.9 7.4 36.2 31.2 5.0 5.2 8.1 11.1 41.6 37.7 30.9 40.5
Northern Africa 6.3 8.3 12.2 7.9 21.6 17.6 8.9 10.0 17.0 21.9 33.8 31.8 28.8 38.5
Algeria 8.8 4.6 4.1 15.9 11.7 12.9 12.4 16.4 21.6 34.9 35.7 6.9 25.7 2005/2012 2006/2013
Egypt 5.4 4.5 9.5 23.8 22.3 14.1 15.7 23.2 29.3 34.1 28.5 38.3 39.7 2005/2014 2005/2014
Libya n.a. n.a. n.a. 21.0 n.a. 22.4 n.a. 23.1 28.5 32.4 32.5 n.a. n.a. 2007/...
TABLE A1.1 PROGRESS TOWARDS THE SUSTAINABLE DEVELOPMENT GOALS (SDGs): PREVALENCE OF UNDERNOURISHMENT, SEVERE FOOD INSECURITY, SELECTED FORMS OF MALNUTRITION, AND EXCLUSIVE BREASTFEEDING1
TABLE NOTE: See end of table for numbered notes. See also the section Notes for Annex 1 (back cover fold-out).
| 76 |
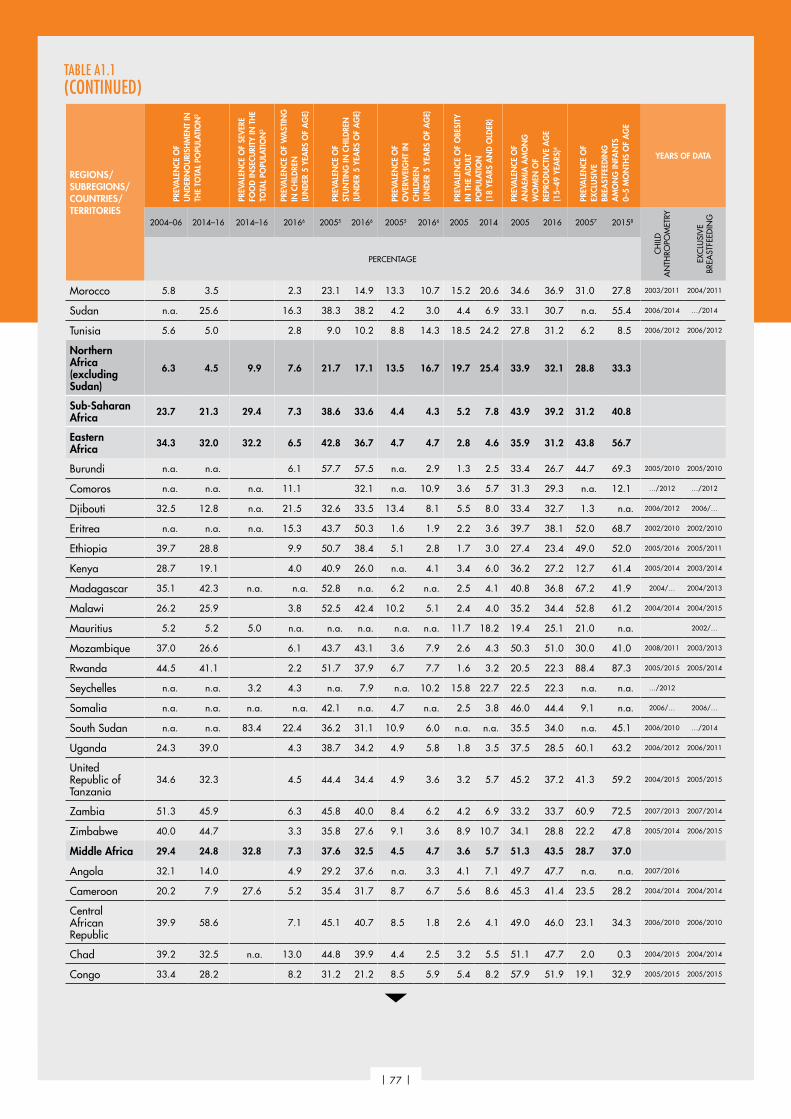
REGIONS/SUBREGIONS/COUNTRIES/TERRITORIES
PREV
ALE
NCE
OF
UN
DER
NO
URI
SHM
ENT
IN
THE
TOTA
L PO
PULA
TIO
N2
PREV
ALE
NCE
OF
SEV
ERE
FOO
D IN
SECU
RITY
IN T
HE
TOTA
L PO
PULA
TIO
N3
PREV
ALE
NCE
OF
WA
STIN
G
IN C
HIL
DRE
N
(UN
DER
5 Y
EARS
OF
AG
E)
PREV
ALE
NCE
OF
STU
NTI
NG
IN C
HIL
DRE
N
(UN
DER
5 Y
EARS
OF
AG
E)
PREV
ALE
NCE
OF
OV
ERW
EIG
HT
IN
CHIL
DRE
N
(UN
DER
5 Y
EARS
OF
AG
E)
PREV
ALE
NCE
OF
OBE
SITY
IN
TH
E A
DU
LT
POPU
LATI
ON
(1
8 YE
ARS
AN
D O
LDER
)
PREV
ALE
NCE
OF
AN
AEM
IA A
MO
NG
W
OM
EN O
F RE
PRO
DU
CTIV
E A
GE
(15–
49 Y
EARS
)4
PREV
ALE
NCE
OF
EXCL
USI
VE
BREA
STFE
EDIN
G
AM
ON
G IN
FAN
TS
0–5
MO
NTH
S O
F A
GE
YEARS OF DATA
2004–06 2014–16 2014–16 20166 20055 20166 20055 20166 2005 2014 2005 2016 20057 20158
CH
ILD
A
NTH
ROPO
MET
RY
EXC
LUSI
VE
BREA
STFE
EDIN
G
PERCENTAGE
Morocco 5.8 3.5 2.3 23.1 14.9 13.3 10.7 15.2 20.6 34.6 36.9 31.0 27.8 2003/2011 2004/2011
Sudan n.a. 25.6 16.3 38.3 38.2 4.2 3.0 4.4 6.9 33.1 30.7 n.a. 55.4 2006/2014 …/2014
Tunisia 5.6 5.0 2.8 9.0 10.2 8.8 14.3 18.5 24.2 27.8 31.2 6.2 8.5 2006/2012 2006/2012
Northern Africa (excluding Sudan)
6.3 4.5 9.9 7.6 21.7 17.1 13.5 16.7 19.7 25.4 33.9 32.1 28.8 33.3
Sub-Saharan Africa 23.7 21.3 29.4 7.3 38.6 33.6 4.4 4.3 5.2 7.8 43.9 39.2 31.2 40.8
Eastern Africa 34.3 32.0 32.2 6.5 42.8 36.7 4.7 4.7 2.8 4.6 35.9 31.2 43.8 56.7
Burundi n.a. n.a. 6.1 57.7 57.5 n.a. 2.9 1.3 2.5 33.4 26.7 44.7 69.3 2005/2010 2005/2010
Comoros n.a. n.a. n.a. 11.1 32.1 n.a. 10.9 3.6 5.7 31.3 29.3 n.a. 12.1 …/2012 …/2012
Djibouti 32.5 12.8 n.a. 21.5 32.6 33.5 13.4 8.1 5.5 8.0 33.4 32.7 1.3 n.a. 2006/2012 2006/…
Eritrea n.a. n.a. n.a. 15.3 43.7 50.3 1.6 1.9 2.2 3.6 39.7 38.1 52.0 68.7 2002/2010 2002/2010
Ethiopia 39.7 28.8 9.9 50.7 38.4 5.1 2.8 1.7 3.0 27.4 23.4 49.0 52.0 2005/2016 2005/2011
Kenya 28.7 19.1 4.0 40.9 26.0 n.a. 4.1 3.4 6.0 36.2 27.2 12.7 61.4 2005/2014 2003/2014
Madagascar 35.1 42.3 n.a. n.a. 52.8 n.a. 6.2 n.a. 2.5 4.1 40.8 36.8 67.2 41.9 2004/… 2004/2013
Malawi 26.2 25.9 3.8 52.5 42.4 10.2 5.1 2.4 4.0 35.2 34.4 52.8 61.2 2004/2014 2004/2015
Mauritius 5.2 5.2 5.0 n.a. n.a. n.a. n.a. n.a. 11.7 18.2 19.4 25.1 21.0 n.a. 2002/…
Mozambique 37.0 26.6 6.1 43.7 43.1 3.6 7.9 2.6 4.3 50.3 51.0 30.0 41.0 2008/2011 2003/2013
Rwanda 44.5 41.1 2.2 51.7 37.9 6.7 7.7 1.6 3.2 20.5 22.3 88.4 87.3 2005/2015 2005/2014
Seychelles n.a. n.a. 3.2 4.3 n.a. 7.9 n.a. 10.2 15.8 22.7 22.5 22.3 n.a. n.a. …/2012
Somalia n.a. n.a. n.a. n.a. 42.1 n.a. 4.7 n.a. 2.5 3.8 46.0 44.4 9.1 n.a. 2006/… 2006/…
South Sudan n.a. n.a. 83.4 22.4 36.2 31.1 10.9 6.0 n.a. n.a. 35.5 34.0 n.a. 45.1 2006/2010 …/2014
Uganda 24.3 39.0 4.3 38.7 34.2 4.9 5.8 1.8 3.5 37.5 28.5 60.1 63.2 2006/2012 2006/2011
United Republic of Tanzania
34.6 32.3 4.5 44.4 34.4 4.9 3.6 3.2 5.7 45.2 37.2 41.3 59.2 2004/2015 2005/2015
Zambia 51.3 45.9 6.3 45.8 40.0 8.4 6.2 4.2 6.9 33.2 33.7 60.9 72.5 2007/2013 2007/2014
Zimbabwe 40.0 44.7 3.3 35.8 27.6 9.1 3.6 8.9 10.7 34.1 28.8 22.2 47.8 2005/2014 2006/2015
Middle Africa 29.4 24.8 32.8 7.3 37.6 32.5 4.5 4.7 3.6 5.7 51.3 43.5 28.7 37.0
Angola 32.1 14.0 4.9 29.2 37.6 n.a. 3.3 4.1 7.1 49.7 47.7 n.a. n.a. 2007/2016
Cameroon 20.2 7.9 27.6 5.2 35.4 31.7 8.7 6.7 5.6 8.6 45.3 41.4 23.5 28.2 2004/2014 2004/2014
Central African Republic
39.9 58.6 7.1 45.1 40.7 8.5 1.8 2.6 4.1 49.0 46.0 23.1 34.3 2006/2010 2006/2010
Chad 39.2 32.5 n.a. 13.0 44.8 39.9 4.4 2.5 3.2 5.5 51.1 47.7 2.0 0.3 2004/2015 2004/2014
Congo 33.4 28.2 8.2 31.2 21.2 8.5 5.9 5.4 8.2 57.9 51.9 19.1 32.9 2005/2015 2005/2015
TABLE A1.1 (CONTINUED)
| 77 |
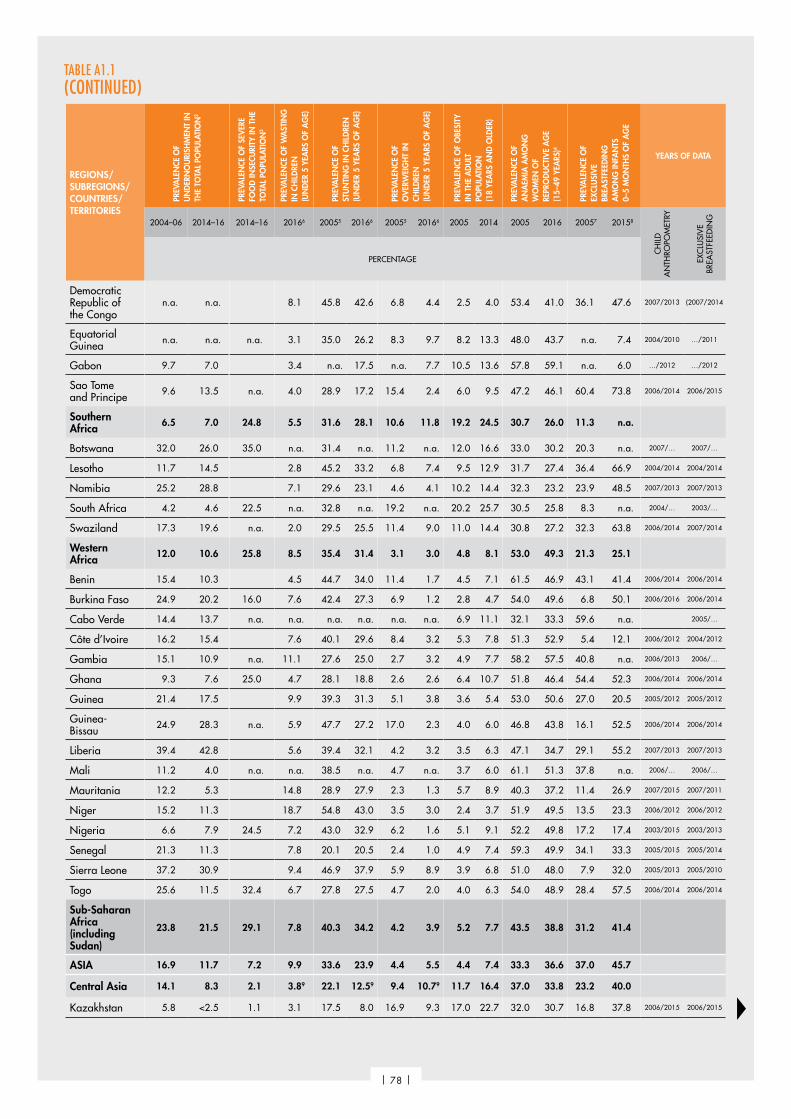
REGIONS/SUBREGIONS/COUNTRIES/TERRITORIES
PREV
ALE
NCE
OF
UN
DER
NO
URI
SHM
ENT
IN
THE
TOTA
L PO
PULA
TIO
N2
PREV
ALE
NCE
OF
SEV
ERE
FOO
D IN
SECU
RITY
IN T
HE
TOTA
L PO
PULA
TIO
N3
PREV
ALE
NCE
OF
WA
STIN
G
IN C
HIL
DRE
N
(UN
DER
5 Y
EARS
OF
AG
E)
PREV
ALE
NCE
OF
STU
NTI
NG
IN C
HIL
DRE
N
(UN
DER
5 Y
EARS
OF
AG
E)
PREV
ALE
NCE
OF
OV
ERW
EIG
HT
IN
CHIL
DRE
N
(UN
DER
5 Y
EARS
OF
AG
E)
PREV
ALE
NCE
OF
OBE
SITY
IN
TH
E A
DU
LT
POPU
LATI
ON
(1
8 YE
ARS
AN
D O
LDER
)
PREV
ALE
NCE
OF
AN
AEM
IA A
MO
NG
W
OM
EN O
F RE
PRO
DU
CTIV
E A
GE
(15–
49 Y
EARS
)4
PREV
ALE
NCE
OF
EXCL
USI
VE
BREA
STFE
EDIN
G
AM
ON
G IN
FAN
TS
0–5
MO
NTH
S O
F A
GE
YEARS OF DATA
2004–06 2014–16 2014–16 20166 20055 20166 20055 20166 2005 2014 2005 2016 20057 20158
CH
ILD
A
NTH
ROPO
MET
RY
EXC
LUSI
VE
BREA
STFE
EDIN
G
PERCENTAGE
Democratic Republic of the Congo
n.a. n.a. 8.1 45.8 42.6 6.8 4.4 2.5 4.0 53.4 41.0 36.1 47.6 2007/2013 (2007/2014
Equatorial Guinea n.a. n.a. n.a. 3.1 35.0 26.2 8.3 9.7 8.2 13.3 48.0 43.7 n.a. 7.4 2004/2010 …/2011
Gabon 9.7 7.0 3.4 n.a. 17.5 n.a. 7.7 10.5 13.6 57.8 59.1 n.a. 6.0 …/2012 …/2012
Sao Tome and Principe 9.6 13.5 n.a. 4.0 28.9 17.2 15.4 2.4 6.0 9.5 47.2 46.1 60.4 73.8 2006/2014 2006/2015
Southern Africa 6.5 7.0 24.8 5.5 31.6 28.1 10.6 11.8 19.2 24.5 30.7 26.0 11.3 n.a.
Botswana 32.0 26.0 35.0 n.a. 31.4 n.a. 11.2 n.a. 12.0 16.6 33.0 30.2 20.3 n.a. 2007/… 2007/…
Lesotho 11.7 14.5 2.8 45.2 33.2 6.8 7.4 9.5 12.9 31.7 27.4 36.4 66.9 2004/2014 2004/2014
Namibia 25.2 28.8 7.1 29.6 23.1 4.6 4.1 10.2 14.4 32.3 23.2 23.9 48.5 2007/2013 2007/2013
South Africa 4.2 4.6 22.5 n.a. 32.8 n.a. 19.2 n.a. 20.2 25.7 30.5 25.8 8.3 n.a. 2004/… 2003/…
Swaziland 17.3 19.6 n.a. 2.0 29.5 25.5 11.4 9.0 11.0 14.4 30.8 27.2 32.3 63.8 2006/2014 2007/2014
Western Africa 12.0 10.6 25.8 8.5 35.4 31.4 3.1 3.0 4.8 8.1 53.0 49.3 21.3 25.1
Benin 15.4 10.3 4.5 44.7 34.0 11.4 1.7 4.5 7.1 61.5 46.9 43.1 41.4 2006/2014 2006/2014
Burkina Faso 24.9 20.2 16.0 7.6 42.4 27.3 6.9 1.2 2.8 4.7 54.0 49.6 6.8 50.1 2006/2016 2006/2014
Cabo Verde 14.4 13.7 n.a. n.a. n.a. n.a. n.a. n.a. 6.9 11.1 32.1 33.3 59.6 n.a. 2005/…
Côte d’Ivoire 16.2 15.4 7.6 40.1 29.6 8.4 3.2 5.3 7.8 51.3 52.9 5.4 12.1 2006/2012 2004/2012
Gambia 15.1 10.9 n.a. 11.1 27.6 25.0 2.7 3.2 4.9 7.7 58.2 57.5 40.8 n.a. 2006/2013 2006/…
Ghana 9.3 7.6 25.0 4.7 28.1 18.8 2.6 2.6 6.4 10.7 51.8 46.4 54.4 52.3 2006/2014 2006/2014
Guinea 21.4 17.5 9.9 39.3 31.3 5.1 3.8 3.6 5.4 53.0 50.6 27.0 20.5 2005/2012 2005/2012
Guinea-Bissau 24.9 28.3 n.a. 5.9 47.7 27.2 17.0 2.3 4.0 6.0 46.8 43.8 16.1 52.5 2006/2014 2006/2014
Liberia 39.4 42.8 5.6 39.4 32.1 4.2 3.2 3.5 6.3 47.1 34.7 29.1 55.2 2007/2013 2007/2013
Mali 11.2 4.0 n.a. n.a. 38.5 n.a. 4.7 n.a. 3.7 6.0 61.1 51.3 37.8 n.a. 2006/… 2006/…
Mauritania 12.2 5.3 14.8 28.9 27.9 2.3 1.3 5.7 8.9 40.3 37.2 11.4 26.9 2007/2015 2007/2011
Niger 15.2 11.3 18.7 54.8 43.0 3.5 3.0 2.4 3.7 51.9 49.5 13.5 23.3 2006/2012 2006/2012
Nigeria 6.6 7.9 24.5 7.2 43.0 32.9 6.2 1.6 5.1 9.1 52.2 49.8 17.2 17.4 2003/2015 2003/2013
Senegal 21.3 11.3 7.8 20.1 20.5 2.4 1.0 4.9 7.4 59.3 49.9 34.1 33.3 2005/2015 2005/2014
Sierra Leone 37.2 30.9 9.4 46.9 37.9 5.9 8.9 3.9 6.8 51.0 48.0 7.9 32.0 2005/2013 2005/2010
Togo 25.6 11.5 32.4 6.7 27.8 27.5 4.7 2.0 4.0 6.3 54.0 48.9 28.4 57.5 2006/2014 2006/2014
Sub-Saharan Africa (including Sudan)
23.8 21.5 29.1 7.8 40.3 34.2 4.2 3.9 5.2 7.7 43.5 38.8 31.2 41.4
ASIA 16.9 11.7 7.2 9.9 33.6 23.9 4.4 5.5 4.4 7.4 33.3 36.6 37.0 45.7
Central Asia 14.1 8.3 2.1 3.89 22.1 12.59 9.4 10.79 11.7 16.4 37.0 33.8 23.2 40.0
Kazakhstan 5.8 <2.5 1.1 3.1 17.5 8.0 16.9 9.3 17.0 22.7 32.0 30.7 16.8 37.8 2006/2015 2006/2015
TABLE A1.1 (CONTINUED)
| 78 |

REGIONS/SUBREGIONS/COUNTRIES/TERRITORIES
PREV
ALE
NCE
OF
UN
DER
NO
URI
SHM
ENT
IN
THE
TOTA
L PO
PULA
TIO
N2
PREV
ALE
NCE
OF
SEV
ERE
FOO
D IN
SECU
RITY
IN T
HE
TOTA
L PO
PULA
TIO
N3
PREV
ALE
NCE
OF
WA
STIN
G
IN C
HIL
DRE
N
(UN
DER
5 Y
EARS
OF
AG
E)
PREV
ALE
NCE
OF
STU
NTI
NG
IN C
HIL
DRE
N
(UN
DER
5 Y
EARS
OF
AG
E)
PREV
ALE
NCE
OF
OV
ERW
EIG
HT
IN
CHIL
DRE
N
(UN
DER
5 Y
EARS
OF
AG
E)
PREV
ALE
NCE
OF
OBE
SITY
IN
TH
E A
DU
LT
POPU
LATI
ON
(1
8 YE
ARS
AN
D O
LDER
)
PREV
ALE
NCE
OF
AN
AEM
IA A
MO
NG
W
OM
EN O
F RE
PRO
DU
CTIV
E A
GE
(15–
49 Y
EARS
)4
PREV
ALE
NCE
OF
EXCL
USI
VE
BREA
STFE
EDIN
G
AM
ON
G IN
FAN
TS
0–5
MO
NTH
S O
F A
GE
YEARS OF DATA
2004–06 2014–16 2014–16 20166 20055 20166 20055 20166 2005 2014 2005 2016 20057 20158
CH
ILD
A
NTH
ROPO
MET
RY
EXC
LUSI
VE
BREA
STFE
EDIN
G
PERCENTAGE
Kyrgyzstan 9.7 6.4 2.8 18.1 12.9 10.7 7.0 9.3 13.0 31.9 36.2 31.5 41.1 2006/2014 2006/2014
Tajikistan 41.5 30.1 3.3 9.9 33.1 26.8 6.7 6.6 7.2 10.9 34.9 30.5 25.4 34.3 2005/2012 2005/2012
Turkmenistan 4.8 5.5 n.a. 4.2 18.9 11.5 4.5 5.9 12.0 17.9 33.5 32.6 10.9 58.9 2006/2015 2006/2016
Uzbekistan 14.5 6.3 n.a. 19.6 n.a. 12.8 n.a. 9.7 14.4 42.3 36.2 26.4 n.a. 2006/… 2006/…
Eastern Asia 14.1 9.2 0.6 1.9 13.2 5.5 5.9 5.3 4.0 7.7 18.8 26.1 28.5 27.7
China 15.3 9.6 2.3 11.7 9.4 5.9 6.6 4.2 8.2 18.4 26.4 27.6 27.6 2005/2010 2008/2008
China, mainland 15.5 9.7 n.a. n.a. n.a. n.a. n.a. n.a. n.a. n.a. n.a. n.a. n.a. n.a.
Taiwan Province of China
6.0 5.2 n.a. n.a. n.a. n.a. n.a. n.a. n.a. n.a. n.a. n.a. n.a.
China, Hong Kong SAR <2.5 <2.5 n.a. n.a. n.a. n.a. n.a. n.a. n.a. n.a. n.a. n.a. n.a.
China, Macao SAR 14.2 6.3 n.a. n.a. n.a. n.a. n.a. n.a. n.a. n.a. n.a. n.a. n.a. n.a.
Democratic People’s Republic of Korea
35.4 40.8 n.a. 4.0 43.1 27.9 n.a. n.a. 2.5 3.1 31.2 32.5 65.1 n.a. 2004/…
Japan <2.5 <2.5 0.4 2.3 n.a. 7.1 n.a. 1.5 2.7 3.5 20.4 21.5 n.a. n.a. …/2010
Mongolia 31.0 19.6 1.0 27.5 10.8 14.2 10.5 10.1 15.2 16.2 19.5 57.2 47.1 2005/2013 2005/2014
Republic of Korea <2.5 <2.5 1.2 2.5 2.5 6.2 7.3 3.4 5.8 16.0 22.7 n.a. n.a. 2003/2010
Eastern Asia (excluding China, mainland)
5.8 6.5 0.5 n.a. n.a. n.a. n.a. n.a. n.a. n.a. 21.3 24.0 n.a. n.a.
South-Eastern Asia 18.1 10.2 7.1 8.9 34.1 25.8 4.1 7.2 3.2 5.8 28.8 28.3 28.4 35.2
Brunei Darussalam <2.5 <2.5 n.a. n.a. n.a. n.a. n.a. n.a. 12.4 17.4 12.5 16.9 n.a. n.a.
Cambodia 20.0 15.3 14.6 9.6 43.7 32.4 1.7 2.0 1.3 2.7 50.0 46.8 60.0 65.2 2005/2014 2005/2014
Indonesia 18.6 7.9 13.5 n.a. 36.4 n.a. 11.5 3.1 5.8 28.9 28.8 32.4 41.5 …/2013 2007/2012
Lao People’s Democratic Republic
26.8 17.1 n.a. 6.4 47.6 43.8 1.3 2.0 1.5 2.9 38.5 39.7 26.4 40.4 2006/2011 2006/2012
Malaysia 3.9 <2.5 8.0 17.2 17.7 n.a. 7.1 8.2 13.3 24.1 24.9 n.a. n.a. 2006/2015
Myanmar 32.1 16.9 2.1 7.0 40.6 29.2 2.4 1.3 1.6 3.8 41.5 46.3 n.a. 23.6 2003/2016 …/2010
Philippines 16.3 13.8 7.9 33.8 30.3 2.4 5.0 3.2 5.2 29.3 15.7 33.5 n.a. 2003/2013 2003/…
Singapore n.a. n.a. n.a. n.a. n.a. n.a. n.a. 5.2 7.2 17.9 22.2 n.a. n.a.
Thailand 12.3 9.5 6.7 15.7 16.3 8.0 10.9 5.3 9.5 23.1 31.8 5.4 12.3 2006/2012 2006/2012
Timor-Leste 31.9 26.9 n.a. 11.0 54.8 50.2 n.a. 1.5 0.9 1.6 30.3 41.3 30.7 62.3 2003/2013 2003/2013
Viet Nam 18.2 10.7 2.6 6.4 33.2 24.6 2.6 5.3 1.1 2.5 23.4 24.2 12.2 24.3 2005/2015 2005/2014
TABLE A1.1 (CONTINUED)
| 79 |

REGIONS/SUBREGIONS/COUNTRIES/TERRITORIES
PREV
ALE
NCE
OF
UN
DER
NO
URI
SHM
ENT
IN
THE
TOTA
L PO
PULA
TIO
N2
PREV
ALE
NCE
OF
SEV
ERE
FOO
D IN
SECU
RITY
IN T
HE
TOTA
L PO
PULA
TIO
N3
PREV
ALE
NCE
OF
WA
STIN
G
IN C
HIL
DRE
N
(UN
DER
5 Y
EARS
OF
AG
E)
PREV
ALE
NCE
OF
STU
NTI
NG
IN C
HIL
DRE
N
(UN
DER
5 Y
EARS
OF
AG
E)
PREV
ALE
NCE
OF
OV
ERW
EIG
HT
IN
CHIL
DRE
N
(UN
DER
5 Y
EARS
OF
AG
E)
PREV
ALE
NCE
OF
OBE
SITY
IN
TH
E A
DU
LT
POPU
LATI
ON
(1
8 YE
ARS
AN
D O
LDER
)
PREV
ALE
NCE
OF
AN
AEM
IA A
MO
NG
W
OM
EN O
F RE
PRO
DU
CTIV
E A
GE
(15–
49 Y
EARS
)4
PREV
ALE
NCE
OF
EXCL
USI
VE
BREA
STFE
EDIN
G
AM
ON
G IN
FAN
TS
0–5
MO
NTH
S O
F A
GE
YEARS OF DATA
2004–06 2014–16 2014–16 20166 20055 20166 20055 20166 2005 2014 2005 2016 20057 20158
CH
ILD
A
NTH
ROPO
MET
RY
EXC
LUSI
VE
BREA
STFE
EDIN
G
PERCENTAGE
Southern Asia 20.0 14.9 12.9 15.4 44.6 34.1 3.2 4.49 2.9 4.7 50.1 48.7 45.2 58.9
Afghanistan 33.2 23.0 16.1 9.5 59.3 40.9 4.6 5.4 1.6 2.8 34.4 42.0 n.a. 43.3 2004/2013 …/2015
Bangladesh 16.6 15.1 14.3 45.9 36.1 1.0 1.4 1.7 3.0 44.9 39.9 42.0 55.3 2005/2014 2004/2014
Bhutan 5.9 34.9 33.6 4.4 7.6 3.0 5.3 48.2 35.6 n.a. 51.4 2008/2010 …/2015
India 20.5 14.5 21.0 47.9 38.4 1.9 n.a. 2.1 3.6 53.2 51.4 46.4 64.9 2006/2015 2006/2014
Iran (Islamic Republic of) 6.1 5.5 4.0 7.1 6.8 n.a. n.a. 16.1 22.4 28.9 30.5 n.a. 53.1 2004/2011 …/2011
Maldives 16.9 8.5 n.a. n.a. n.a. n.a. n.a. n.a. 4.2 7.3 44.4 42.6 n.a. n.a.
Nepal 15.9 8.1 11.3 49.3 37.1 0.6 2.1 2.1 3.5 42.5 35.1 53.0 56.9 2006/2014 2006/2014
Pakistan 23.3 19.9 10.5 n.a. 45.0 n.a. 4.8 3.6 5.4 49.0 52.1 37.1 37.7 …/2012 2007/2013
Sri Lanka 29.4 22.1 21.4 17.3 14.7 1.6 0.6 3.3 6.6 32.0 32.6 75.8 n.a. 2007/2012 2007/…
Southern Asia (excluding India)
18.7 15.8 10.4 n.a. n.a. n.a. n.a. n.a. n.a. n.a. 42.1 42.1 n.a. n.a.
Western Asia 10.5 9.6 9.8 3.9 20.6 15.7 7.0 8.0 20.3 25.8 34.8 36.1 20.7 21.3
Armenia 8.0 4.4 2.7 4.2 18.2 9.4 11.7 13.6 14.0 19.1 21.4 29.4 32.5 34.6 2005/2016 2005/2010
Azerbaijan 5.7 <2.5 n.a. 3.1 26.8 18.0 13.9 13.0 13.7 21.3 37.1 38.5 11.8 12.1 2006/2013 2006/2013
Bahrain n.a. n.a. n.a. n.a. n.a. n.a. n.a. 23.7 28.0 43.5 42.0 n.a. n.a.
Cyprus 5.7 4.7 n.a. n.a. n.a. n.a. n.a. 20.1 24.2 20.1 25.2 n.a. n.a.
Georgia 7.4 7.0 n.a. 14.7 n.a. 21.0 n.a. 15.4 20.9 28.5 27.5 10.9 n.a. 2005/… 2005/…
Iraq 28.2 27.8 6.5 20.0 22.1 n.a. 11.4 17.4 22.4 34.6 29.1 25.1 19.6 2004/2011 2006/2011
Israel <2.5 <2.5 1.1 n.a. n.a. n.a. n.a. n.a. 22.1 25.9 12.3 15.7 n.a. n.a.
Jordan 3.4 4.2 12.7 2.4 12.0 7.8 4.7 4.7 23.0 29.0 28.9 34.7 21.8 22.7 2002/2012 2007/2012
Kuwait <2.5 <2.5 3.1 4.5 4.9 7.5 6.0 30.6 34.9 21.3 23.8 n.a. n.a. 2005/2015 2006/2014
Lebanon 3.5 5.4 n.a. n.a. 16.5 n.a. 16.7 n.a. 23.0 27.3 27.3 31.2 n.a. n.a. …/2004
Oman 10.0 6.2 n.a. 7.5 n.a. 14.1 n.a. 4.4 19.1 22.0 37.9 38.2 n.a. 32.8 …/2014 …/2014
Palestine n.a. n.a. 9.5 1.2 11.8 7.4 11.4 8.2 n.a. n.a. 28.6 29.4 24.8 38.6 2007/2014 2006/2013
Qatar n.a. n.a. n.a. n.a. n.a. n.a. n.a. n.a. 31.4 34.6 27.0 27.7 n.a. 29.3 …/2012
Saudi Arabia 8.0 4.4 n.a. 9.3 n.a. 6.1 n.a. 25.3 32.2 43.6 42.9 n.a. n.a. …/2005
Syrian Arab Republic n.a. n.a. n.a. n.a. 28.6 n.a. 18.7 n.a. 15.8 20.6 33.7 33.6 28.7 n.a. 2006/… 2006/…
Turkey <2.5 <2.5 1.7 15.6 9.5 9.1 10.9 23.1 29.3 30.8 30.9 20.8 30.1 2004/2013 2003/2014
United Arab Emirates 4.2 3.8 n.a. n.a. n.a. n.a. n.a. 26.8 28.6 26.3 27.8 n.a. n.a.
Yemen 30.1 28.8 12.6 16.3 57.7 46.5 5.0 2.0 9.0 11.4 60.2 69.6 11.5 10.3 2003/2013 2003/2013
TABLE A1.1 (CONTINUED)
| 80 |
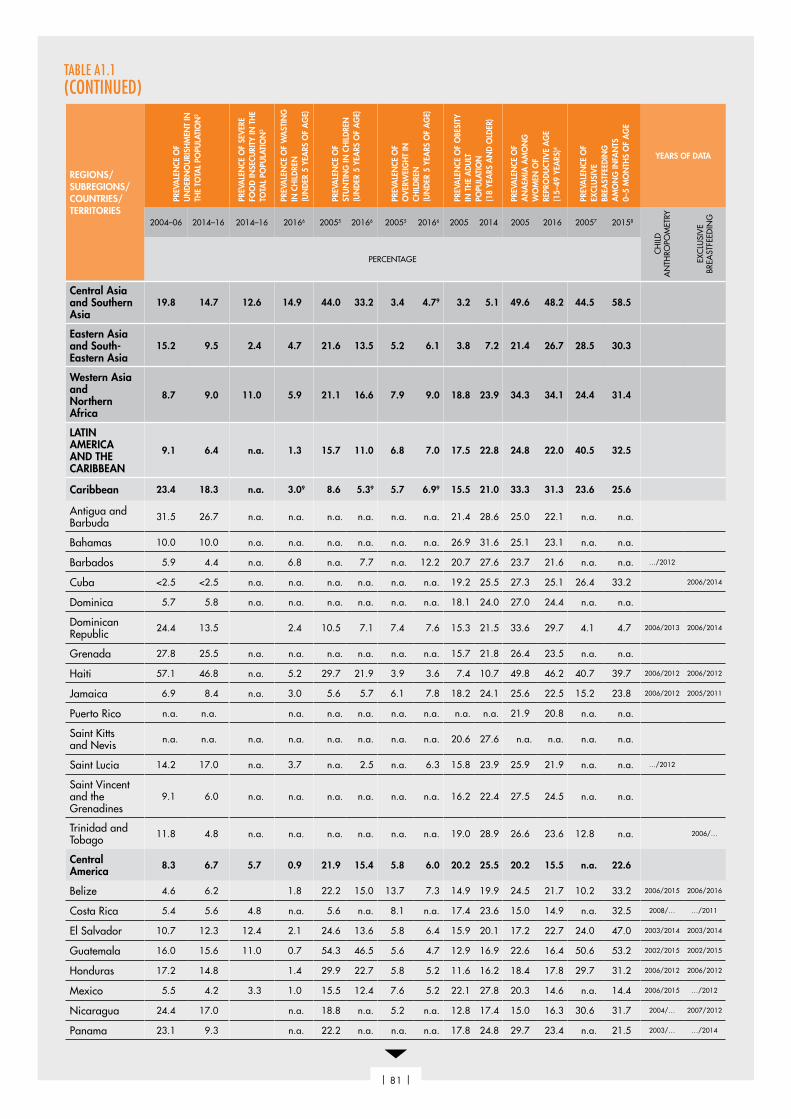
REGIONS/SUBREGIONS/COUNTRIES/TERRITORIES
PREV
ALE
NCE
OF
UN
DER
NO
URI
SHM
ENT
IN
THE
TOTA
L PO
PULA
TIO
N2
PREV
ALE
NCE
OF
SEV
ERE
FOO
D IN
SECU
RITY
IN T
HE
TOTA
L PO
PULA
TIO
N3
PREV
ALE
NCE
OF
WA
STIN
G
IN C
HIL
DRE
N
(UN
DER
5 Y
EARS
OF
AG
E)
PREV
ALE
NCE
OF
STU
NTI
NG
IN C
HIL
DRE
N
(UN
DER
5 Y
EARS
OF
AG
E)
PREV
ALE
NCE
OF
OV
ERW
EIG
HT
IN
CHIL
DRE
N
(UN
DER
5 Y
EARS
OF
AG
E)
PREV
ALE
NCE
OF
OBE
SITY
IN
TH
E A
DU
LT
POPU
LATI
ON
(1
8 YE
ARS
AN
D O
LDER
)
PREV
ALE
NCE
OF
AN
AEM
IA A
MO
NG
W
OM
EN O
F RE
PRO
DU
CTIV
E A
GE
(15–
49 Y
EARS
)4
PREV
ALE
NCE
OF
EXCL
USI
VE
BREA
STFE
EDIN
G
AM
ON
G IN
FAN
TS
0–5
MO
NTH
S O
F A
GE
YEARS OF DATA
2004–06 2014–16 2014–16 20166 20055 20166 20055 20166 2005 2014 2005 2016 20057 20158
CH
ILD
A
NTH
ROPO
MET
RY
EXC
LUSI
VE
BREA
STFE
EDIN
G
PERCENTAGE
Central Asia and Southern Asia
19.8 14.7 12.6 14.9 44.0 33.2 3.4 4.79 3.2 5.1 49.6 48.2 44.5 58.5
Eastern Asia and South-Eastern Asia
15.2 9.5 2.4 4.7 21.6 13.5 5.2 6.1 3.8 7.2 21.4 26.7 28.5 30.3
Western Asia and Northern Africa
8.7 9.0 11.0 5.9 21.1 16.6 7.9 9.0 18.8 23.9 34.3 34.1 24.4 31.4
LATIN AMERICA AND THE CARIBBEAN
9.1 6.4 n.a. 1.3 15.7 11.0 6.8 7.0 17.5 22.8 24.8 22.0 40.5 32.5
Caribbean 23.4 18.3 n.a. 3.09 8.6 5.39 5.7 6.99 15.5 21.0 33.3 31.3 23.6 25.6
Antigua and Barbuda 31.5 26.7 n.a. n.a. n.a. n.a. n.a. n.a. 21.4 28.6 25.0 22.1 n.a. n.a.
Bahamas 10.0 10.0 n.a. n.a. n.a. n.a. n.a. n.a. 26.9 31.6 25.1 23.1 n.a. n.a.
Barbados 5.9 4.4 n.a. 6.8 n.a. 7.7 n.a. 12.2 20.7 27.6 23.7 21.6 n.a. n.a. …/2012
Cuba <2.5 <2.5 n.a. n.a. n.a. n.a. n.a. n.a. 19.2 25.5 27.3 25.1 26.4 33.2 2006/2014
Dominica 5.7 5.8 n.a. n.a. n.a. n.a. n.a. n.a. 18.1 24.0 27.0 24.4 n.a. n.a.
Dominican Republic 24.4 13.5 2.4 10.5 7.1 7.4 7.6 15.3 21.5 33.6 29.7 4.1 4.7 2006/2013 2006/2014
Grenada 27.8 25.5 n.a. n.a. n.a. n.a. n.a. n.a. 15.7 21.8 26.4 23.5 n.a. n.a.
Haiti 57.1 46.8 n.a. 5.2 29.7 21.9 3.9 3.6 7.4 10.7 49.8 46.2 40.7 39.7 2006/2012 2006/2012
Jamaica 6.9 8.4 n.a. 3.0 5.6 5.7 6.1 7.8 18.2 24.1 25.6 22.5 15.2 23.8 2006/2012 2005/2011
Puerto Rico n.a. n.a. n.a. n.a. n.a. n.a. n.a. n.a. n.a. 21.9 20.8 n.a. n.a.
Saint Kitts and Nevis n.a. n.a. n.a. n.a. n.a. n.a. n.a. n.a. 20.6 27.6 n.a. n.a. n.a. n.a.
Saint Lucia 14.2 17.0 n.a. 3.7 n.a. 2.5 n.a. 6.3 15.8 23.9 25.9 21.9 n.a. n.a. …/2012
Saint Vincent and the Grenadines
9.1 6.0 n.a. n.a. n.a. n.a. n.a. n.a. 16.2 22.4 27.5 24.5 n.a. n.a.
Trinidad and Tobago 11.8 4.8 n.a. n.a. n.a. n.a. n.a. n.a. 19.0 28.9 26.6 23.6 12.8 n.a. 2006/…
Central America 8.3 6.7 5.7 0.9 21.9 15.4 5.8 6.0 20.2 25.5 20.2 15.5 n.a. 22.6
Belize 4.6 6.2 1.8 22.2 15.0 13.7 7.3 14.9 19.9 24.5 21.7 10.2 33.2 2006/2015 2006/2016
Costa Rica 5.4 5.6 4.8 n.a. 5.6 n.a. 8.1 n.a. 17.4 23.6 15.0 14.9 n.a. 32.5 2008/… …/2011
El Salvador 10.7 12.3 12.4 2.1 24.6 13.6 5.8 6.4 15.9 20.1 17.2 22.7 24.0 47.0 2003/2014 2003/2014
Guatemala 16.0 15.6 11.0 0.7 54.3 46.5 5.6 4.7 12.9 16.9 22.6 16.4 50.6 53.2 2002/2015 2002/2015
Honduras 17.2 14.8 1.4 29.9 22.7 5.8 5.2 11.6 16.2 18.4 17.8 29.7 31.2 2006/2012 2006/2012
Mexico 5.5 4.2 3.3 1.0 15.5 12.4 7.6 5.2 22.1 27.8 20.3 14.6 n.a. 14.4 2006/2015 …/2012
Nicaragua 24.4 17.0 n.a. 18.8 n.a. 5.2 n.a. 12.8 17.4 15.0 16.3 30.6 31.7 2004/… 2007/2012
Panama 23.1 9.3 n.a. 22.2 n.a. n.a. n.a. 17.8 24.8 29.7 23.4 n.a. 21.5 2003/… …/2014
TABLE A1.1 (CONTINUED)
| 81 |
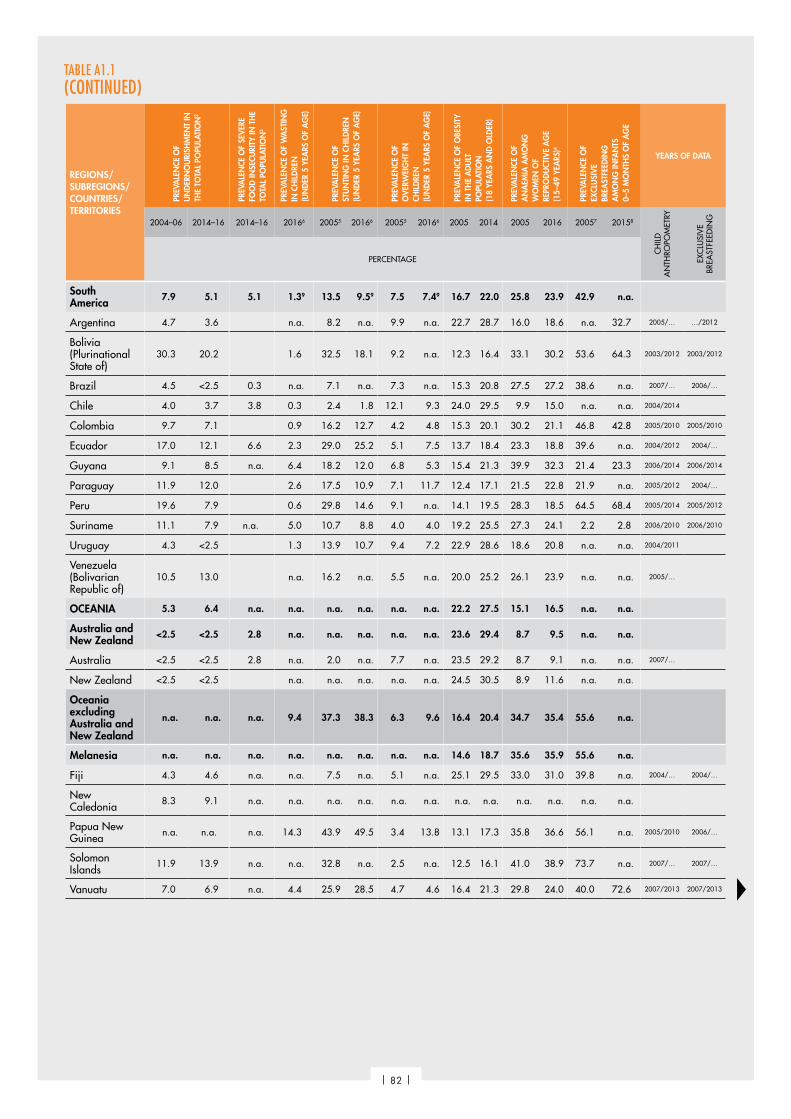
REGIONS/SUBREGIONS/COUNTRIES/TERRITORIES
PREV
ALE
NCE
OF
UN
DER
NO
URI
SHM
ENT
IN
THE
TOTA
L PO
PULA
TIO
N2
PREV
ALE
NCE
OF
SEV
ERE
FOO
D IN
SECU
RITY
IN T
HE
TOTA
L PO
PULA
TIO
N3
PREV
ALE
NCE
OF
WA
STIN
G
IN C
HIL
DRE
N
(UN
DER
5 Y
EARS
OF
AG
E)
PREV
ALE
NCE
OF
STU
NTI
NG
IN C
HIL
DRE
N
(UN
DER
5 Y
EARS
OF
AG
E)
PREV
ALE
NCE
OF
OV
ERW
EIG
HT
IN
CHIL
DRE
N
(UN
DER
5 Y
EARS
OF
AG
E)
PREV
ALE
NCE
OF
OBE
SITY
IN
TH
E A
DU
LT
POPU
LATI
ON
(1
8 YE
ARS
AN
D O
LDER
)
PREV
ALE
NCE
OF
AN
AEM
IA A
MO
NG
W
OM
EN O
F RE
PRO
DU
CTIV
E A
GE
(15–
49 Y
EARS
)4
PREV
ALE
NCE
OF
EXCL
USI
VE
BREA
STFE
EDIN
G
AM
ON
G IN
FAN
TS
0–5
MO
NTH
S O
F A
GE
YEARS OF DATA
2004–06 2014–16 2014–16 20166 20055 20166 20055 20166 2005 2014 2005 2016 20057 20158
CH
ILD
A
NTH
ROPO
MET
RY
EXC
LUSI
VE
BREA
STFE
EDIN
G
PERCENTAGE
South America 7.9 5.1 5.1 1.39 13.5 9.59 7.5 7.49 16.7 22.0 25.8 23.9 42.9 n.a.
Argentina 4.7 3.6 n.a. 8.2 n.a. 9.9 n.a. 22.7 28.7 16.0 18.6 n.a. 32.7 2005/… …/2012
Bolivia (Plurinational State of)
30.3 20.2 1.6 32.5 18.1 9.2 n.a. 12.3 16.4 33.1 30.2 53.6 64.3 2003/2012 2003/2012
Brazil 4.5 <2.5 0.3 n.a. 7.1 n.a. 7.3 n.a. 15.3 20.8 27.5 27.2 38.6 n.a. 2007/… 2006/…
Chile 4.0 3.7 3.8 0.3 2.4 1.8 12.1 9.3 24.0 29.5 9.9 15.0 n.a. n.a. 2004/2014
Colombia 9.7 7.1 0.9 16.2 12.7 4.2 4.8 15.3 20.1 30.2 21.1 46.8 42.8 2005/2010 2005/2010
Ecuador 17.0 12.1 6.6 2.3 29.0 25.2 5.1 7.5 13.7 18.4 23.3 18.8 39.6 n.a. 2004/2012 2004/…
Guyana 9.1 8.5 n.a. 6.4 18.2 12.0 6.8 5.3 15.4 21.3 39.9 32.3 21.4 23.3 2006/2014 2006/2014
Paraguay 11.9 12.0 2.6 17.5 10.9 7.1 11.7 12.4 17.1 21.5 22.8 21.9 n.a. 2005/2012 2004/…
Peru 19.6 7.9 0.6 29.8 14.6 9.1 n.a. 14.1 19.5 28.3 18.5 64.5 68.4 2005/2014 2005/2012
Suriname 11.1 7.9 n.a. 5.0 10.7 8.8 4.0 4.0 19.2 25.5 27.3 24.1 2.2 2.8 2006/2010 2006/2010
Uruguay 4.3 <2.5 1.3 13.9 10.7 9.4 7.2 22.9 28.6 18.6 20.8 n.a. n.a. 2004/2011
Venezuela (Bolivarian Republic of)
10.5 13.0 n.a. 16.2 n.a. 5.5 n.a. 20.0 25.2 26.1 23.9 n.a. n.a. 2005/…
OCEANIA 5.3 6.4 n.a. n.a. n.a. n.a. n.a. n.a. 22.2 27.5 15.1 16.5 n.a. n.a.
Australia and New Zealand <2.5 <2.5 2.8 n.a. n.a. n.a. n.a. n.a. 23.6 29.4 8.7 9.5 n.a. n.a.
Australia <2.5 <2.5 2.8 n.a. 2.0 n.a. 7.7 n.a. 23.5 29.2 8.7 9.1 n.a. n.a. 2007/…
New Zealand <2.5 <2.5 n.a. n.a. n.a. n.a. n.a. 24.5 30.5 8.9 11.6 n.a. n.a.
Oceania excluding Australia and New Zealand
n.a. n.a. n.a. 9.4 37.3 38.3 6.3 9.6 16.4 20.4 34.7 35.4 55.6 n.a.
Melanesia n.a. n.a. n.a. n.a. n.a. n.a. n.a. n.a. 14.6 18.7 35.6 35.9 55.6 n.a.
Fiji 4.3 4.6 n.a. n.a. 7.5 n.a. 5.1 n.a. 25.1 29.5 33.0 31.0 39.8 n.a. 2004/… 2004/…
New Caledonia 8.3 9.1 n.a. n.a. n.a. n.a. n.a. n.a. n.a. n.a. n.a. n.a. n.a. n.a.
Papua New Guinea n.a. n.a. n.a. 14.3 43.9 49.5 3.4 13.8 13.1 17.3 35.8 36.6 56.1 n.a. 2005/2010 2006/…
Solomon Islands 11.9 13.9 n.a. n.a. 32.8 n.a. 2.5 n.a. 12.5 16.1 41.0 38.9 73.7 n.a. 2007/… 2007/…
Vanuatu 7.0 6.9 n.a. 4.4 25.9 28.5 4.7 4.6 16.4 21.3 29.8 24.0 40.0 72.6 2007/2013 2007/2013
TABLE A1.1 (CONTINUED)
| 82 |

REGIONS/SUBREGIONS/COUNTRIES/TERRITORIES
PREV
ALE
NCE
OF
UN
DER
NO
URI
SHM
ENT
IN
THE
TOTA
L PO
PULA
TIO
N2
PREV
ALE
NCE
OF
SEV
ERE
FOO
D IN
SECU
RITY
IN T
HE
TOTA
L PO
PULA
TIO
N3
PREV
ALE
NCE
OF
WA
STIN
G
IN C
HIL
DRE
N
(UN
DER
5 Y
EARS
OF
AG
E)
PREV
ALE
NCE
OF
STU
NTI
NG
IN C
HIL
DRE
N
(UN
DER
5 Y
EARS
OF
AG
E)
PREV
ALE
NCE
OF
OV
ERW
EIG
HT
IN
CHIL
DRE
N
(UN
DER
5 Y
EARS
OF
AG
E)
PREV
ALE
NCE
OF
OBE
SITY
IN
TH
E A
DU
LT
POPU
LATI
ON
(1
8 YE
ARS
AN
D O
LDER
)
PREV
ALE
NCE
OF
AN
AEM
IA A
MO
NG
W
OM
EN O
F RE
PRO
DU
CTIV
E A
GE
(15–
49 Y
EARS
)4
PREV
ALE
NCE
OF
EXCL
USI
VE
BREA
STFE
EDIN
G
AM
ON
G IN
FAN
TS
0–5
MO
NTH
S O
F A
GE
YEARS OF DATA
2004–06 2014–16 2014–16 20166 20055 20166 20055 20166 2005 2014 2005 2016 20057 20158
CH
ILD
A
NTH
ROPO
MET
RY
EXC
LUSI
VE
BREA
STFE
EDIN
G
PERCENTAGE
Micronesia n.a. n.a. n.a. n.a. n.a. n.a. n.a. n.a. 36.7 40.9 22.0 25.1 n.a. n.a.
Kiribati 4.6 3.3 n.a. n.a. n.a. n.a. n.a. n.a. 35.0 39.5 25.0 26.1 n.a. n.a.
Marshall Islands n.a. n.a. n.a. n.a. n.a. n.a. n.a. n.a. 40.3 44.2 24.7 26.6 31.3 n.a. 2007/…
Micronesia (Federated States of)
n.a. n.a. n.a. n.a. n.a. n.a. n.a. n.a. 32.9 37.6 17.8 23.3 n.a. n.a.
Nauru n.a. n.a. n.a. n.a. 24.0 n.a. 2.8 n.a. 49.1 50.7 n.a. n.a. 67.2 n.a. 2007/… 2007/…
Palau n.a. n.a. n.a. n.a. n.a. n.a. n.a. n.a. 46.3 49.8 n.a. n.a. n.a. n.a.
Polynesia 3.7 4.2 n.a. n.a. n.a. n.a. n.a. n.a. 40.0 45.5 21.3 27.6 n.a. n.a.
American Samoa n.a. n.a. n.a. n.a. n.a. n.a. n.a. n.a. 50.6 52.8 n.a. n.a. n.a. n.a.
Cook Islands n.a. n.a. n.a. n.a. n.a. n.a. n.a. n.a. 47.4 52.5 n.a. n.a. n.a. n.a.
French Polynesia 3.9 4.9 n.a. n.a. n.a. n.a. n.a. n.a. n.a. n.a. n.a. n.a. n.a. n.a.
Niue n.a. n.a. n.a. n.a. n.a. n.a. n.a. n.a. 43.2 50.7 n.a. n.a. n.a. n.a.
Samoa 3.5 3.2 n.a. n.a. n.a. n.a. n.a. n.a. 39.2 44.8 22.3 31.3 n.a. n.a.
Tokelau (Associate Member)
n.a. n.a. n.a. n.a. n.a. n.a. n.a. n.a. n.a. n.a. n.a. n.a. n.a. n.a.
Tonga n.a. n.a. n.a. 5.2 n.a. 8.1 n.a. 17.3 40.0 45.3 19.6 21.3 n.a. 52.2 …/2012 …/2012
Tuvalu n.a. n.a. n.a. n.a. 10.0 n.a. 6.3 n.a. 38.6 43.8 n.a. n.a. 34.7 n.a. 2007/… 2007/…
NORTHERN AMERICA AND EUROPE
<2.5 <2.5 1.4 n.a. n.a. n.a. n.a. n.a. 23.0 27.7 14.5 17.8 n.a. n.a.
Northern America <2.5 <2.5 1.0 0.5 2.8 2.3 7.0 7.8 29.4 34.9 8.4 12.9 n.a. n.a.
Bermuda 16.6 12.8 n.a. n.a. n.a. n.a. n.a. n.a. n.a. n.a. n.a. n.a. n.a. n.a.
Canada <2.5 <2.5 0.6 n.a. n.a. n.a. 10.4 n.a. 24.9 30.0 8.5 9.5 n.a. n.a. 2004/…
Greenland n.a. n.a. n.a. n.a. n.a. n.a. n.a. n.a. n.a. n.a. n.a. n.a. n.a. n.a.
United States of America <2.5 <2.5 1.1 0.5 3.2 2.1 8.1 6.0 30.0 35.5 8.4 13.3 n.a. n.a. 2005/2012
Europe <2.5 <2.5 1.6 n.a. n.a. n.a. n.a. n.a. 20.2 24.5 17.1 20.2 n.a. n.a.
Eastern Europe <2.5 <2.5 1.2 n.a. n.a. n.a. n.a. n.a. 20.4 24.4 22.1 24.2 n.a. n.a.
Belarus 3.0 <2.5 0.6 n.a. 4.5 n.a. 9.7 n.a. 19.1 24.0 20.7 22.6 9.0 19.0 2005/… 2005/2012
Bulgaria 6.5 3.4 n.a. 8.8 n.a. 13.6 n.a. 19.6 23.3 24.5 26.4 n.a. n.a. 2004/…
Czechia <2.5 <2.5 0.9 n.a. n.a. n.a. n.a. n.a. 23.5 26.1 22.9 25.7 n.a. n.a.
Hungary <2.5 <2.5 1.2 n.a. n.a. n.a. n.a. n.a. 21.1 24.0 23.6 25.8 n.a. n.a.
Poland <2.5 <2.5 n.a. n.a. n.a. n.a. n.a. 21.3 25.3 23.3 25.7 n.a. n.a.
TABLE A1.1 (CONTINUED)
| 83 |
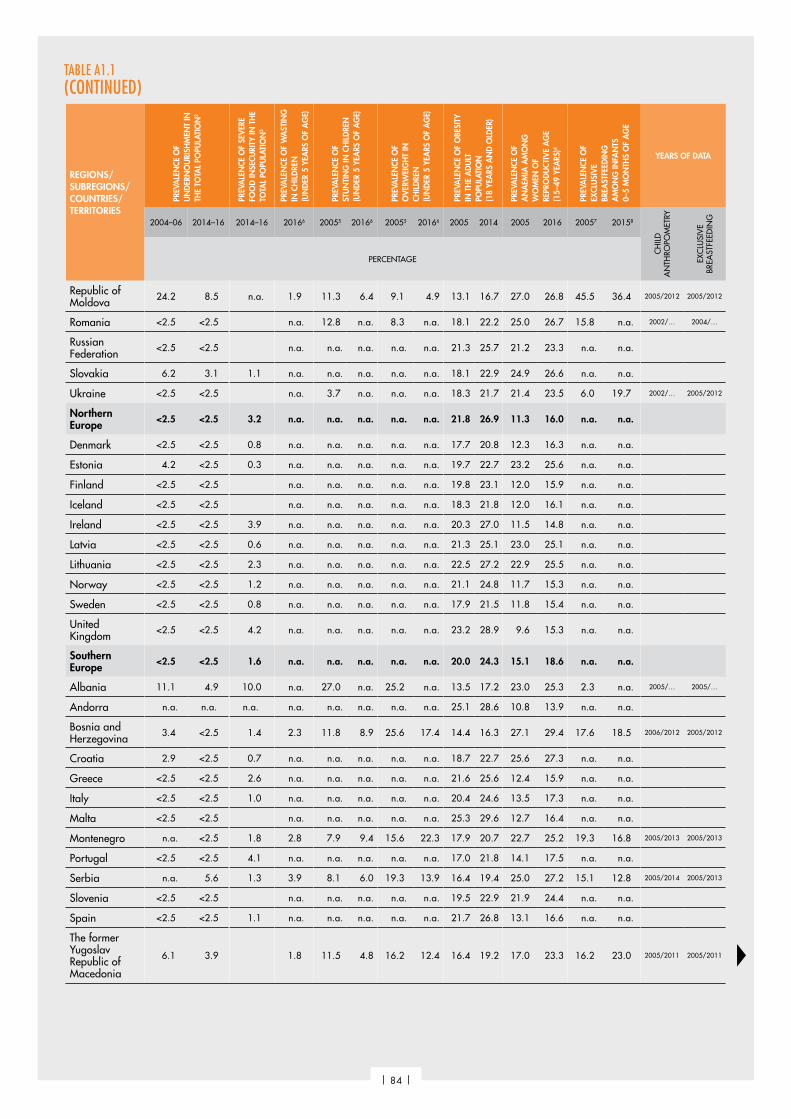
REGIONS/SUBREGIONS/COUNTRIES/TERRITORIES
PREV
ALE
NCE
OF
UN
DER
NO
URI
SHM
ENT
IN
THE
TOTA
L PO
PULA
TIO
N2
PREV
ALE
NCE
OF
SEV
ERE
FOO
D IN
SECU
RITY
IN T
HE
TOTA
L PO
PULA
TIO
N3
PREV
ALE
NCE
OF
WA
STIN
G
IN C
HIL
DRE
N
(UN
DER
5 Y
EARS
OF
AG
E)
PREV
ALE
NCE
OF
STU
NTI
NG
IN C
HIL
DRE
N
(UN
DER
5 Y
EARS
OF
AG
E)
PREV
ALE
NCE
OF
OV
ERW
EIG
HT
IN
CHIL
DRE
N
(UN
DER
5 Y
EARS
OF
AG
E)
PREV
ALE
NCE
OF
OBE
SITY
IN
TH
E A
DU
LT
POPU
LATI
ON
(1
8 YE
ARS
AN
D O
LDER
)
PREV
ALE
NCE
OF
AN
AEM
IA A
MO
NG
W
OM
EN O
F RE
PRO
DU
CTIV
E A
GE
(15–
49 Y
EARS
)4
PREV
ALE
NCE
OF
EXCL
USI
VE
BREA
STFE
EDIN
G
AM
ON
G IN
FAN
TS
0–5
MO
NTH
S O
F A
GE
YEARS OF DATA
2004–06 2014–16 2014–16 20166 20055 20166 20055 20166 2005 2014 2005 2016 20057 20158
CH
ILD
A
NTH
ROPO
MET
RY
EXC
LUSI
VE
BREA
STFE
EDIN
G
PERCENTAGE
Republic of Moldova 24.2 8.5 n.a. 1.9 11.3 6.4 9.1 4.9 13.1 16.7 27.0 26.8 45.5 36.4 2005/2012 2005/2012
Romania <2.5 <2.5 n.a. 12.8 n.a. 8.3 n.a. 18.1 22.2 25.0 26.7 15.8 n.a. 2002/… 2004/…
Russian Federation <2.5 <2.5 n.a. n.a. n.a. n.a. n.a. 21.3 25.7 21.2 23.3 n.a. n.a.
Slovakia 6.2 3.1 1.1 n.a. n.a. n.a. n.a. n.a. 18.1 22.9 24.9 26.6 n.a. n.a.
Ukraine <2.5 <2.5 n.a. 3.7 n.a. n.a. n.a. 18.3 21.7 21.4 23.5 6.0 19.7 2002/… 2005/2012
Northern Europe <2.5 <2.5 3.2 n.a. n.a. n.a. n.a. n.a. 21.8 26.9 11.3 16.0 n.a. n.a.
Denmark <2.5 <2.5 0.8 n.a. n.a. n.a. n.a. n.a. 17.7 20.8 12.3 16.3 n.a. n.a.
Estonia 4.2 <2.5 0.3 n.a. n.a. n.a. n.a. n.a. 19.7 22.7 23.2 25.6 n.a. n.a.
Finland <2.5 <2.5 n.a. n.a. n.a. n.a. n.a. 19.8 23.1 12.0 15.9 n.a. n.a.
Iceland <2.5 <2.5 n.a. n.a. n.a. n.a. n.a. 18.3 21.8 12.0 16.1 n.a. n.a.
Ireland <2.5 <2.5 3.9 n.a. n.a. n.a. n.a. n.a. 20.3 27.0 11.5 14.8 n.a. n.a.
Latvia <2.5 <2.5 0.6 n.a. n.a. n.a. n.a. n.a. 21.3 25.1 23.0 25.1 n.a. n.a.
Lithuania <2.5 <2.5 2.3 n.a. n.a. n.a. n.a. n.a. 22.5 27.2 22.9 25.5 n.a. n.a.
Norway <2.5 <2.5 1.2 n.a. n.a. n.a. n.a. n.a. 21.1 24.8 11.7 15.3 n.a. n.a.
Sweden <2.5 <2.5 0.8 n.a. n.a. n.a. n.a. n.a. 17.9 21.5 11.8 15.4 n.a. n.a.
United Kingdom <2.5 <2.5 4.2 n.a. n.a. n.a. n.a. n.a. 23.2 28.9 9.6 15.3 n.a. n.a.
Southern Europe <2.5 <2.5 1.6 n.a. n.a. n.a. n.a. n.a. 20.0 24.3 15.1 18.6 n.a. n.a.
Albania 11.1 4.9 10.0 n.a. 27.0 n.a. 25.2 n.a. 13.5 17.2 23.0 25.3 2.3 n.a. 2005/… 2005/…
Andorra n.a. n.a. n.a. n.a. n.a. n.a. n.a. n.a. 25.1 28.6 10.8 13.9 n.a. n.a.
Bosnia and Herzegovina 3.4 <2.5 1.4 2.3 11.8 8.9 25.6 17.4 14.4 16.3 27.1 29.4 17.6 18.5 2006/2012 2005/2012
Croatia 2.9 <2.5 0.7 n.a. n.a. n.a. n.a. n.a. 18.7 22.7 25.6 27.3 n.a. n.a.
Greece <2.5 <2.5 2.6 n.a. n.a. n.a. n.a. n.a. 21.6 25.6 12.4 15.9 n.a. n.a.
Italy <2.5 <2.5 1.0 n.a. n.a. n.a. n.a. n.a. 20.4 24.6 13.5 17.3 n.a. n.a.
Malta <2.5 <2.5 n.a. n.a. n.a. n.a. n.a. 25.3 29.6 12.7 16.4 n.a. n.a.
Montenegro n.a. <2.5 1.8 2.8 7.9 9.4 15.6 22.3 17.9 20.7 22.7 25.2 19.3 16.8 2005/2013 2005/2013
Portugal <2.5 <2.5 4.1 n.a. n.a. n.a. n.a. n.a. 17.0 21.8 14.1 17.5 n.a. n.a.
Serbia n.a. 5.6 1.3 3.9 8.1 6.0 19.3 13.9 16.4 19.4 25.0 27.2 15.1 12.8 2005/2014 2005/2013
Slovenia <2.5 <2.5 n.a. n.a. n.a. n.a. n.a. 19.5 22.9 21.9 24.4 n.a. n.a.
Spain <2.5 <2.5 1.1 n.a. n.a. n.a. n.a. n.a. 21.7 26.8 13.1 16.6 n.a. n.a.
The former Yugoslav Republic of Macedonia
6.1 3.9 1.8 11.5 4.8 16.2 12.4 16.4 19.2 17.0 23.3 16.2 23.0 2005/2011 2005/2011
TABLE A1.1 (CONTINUED)
| 84 |
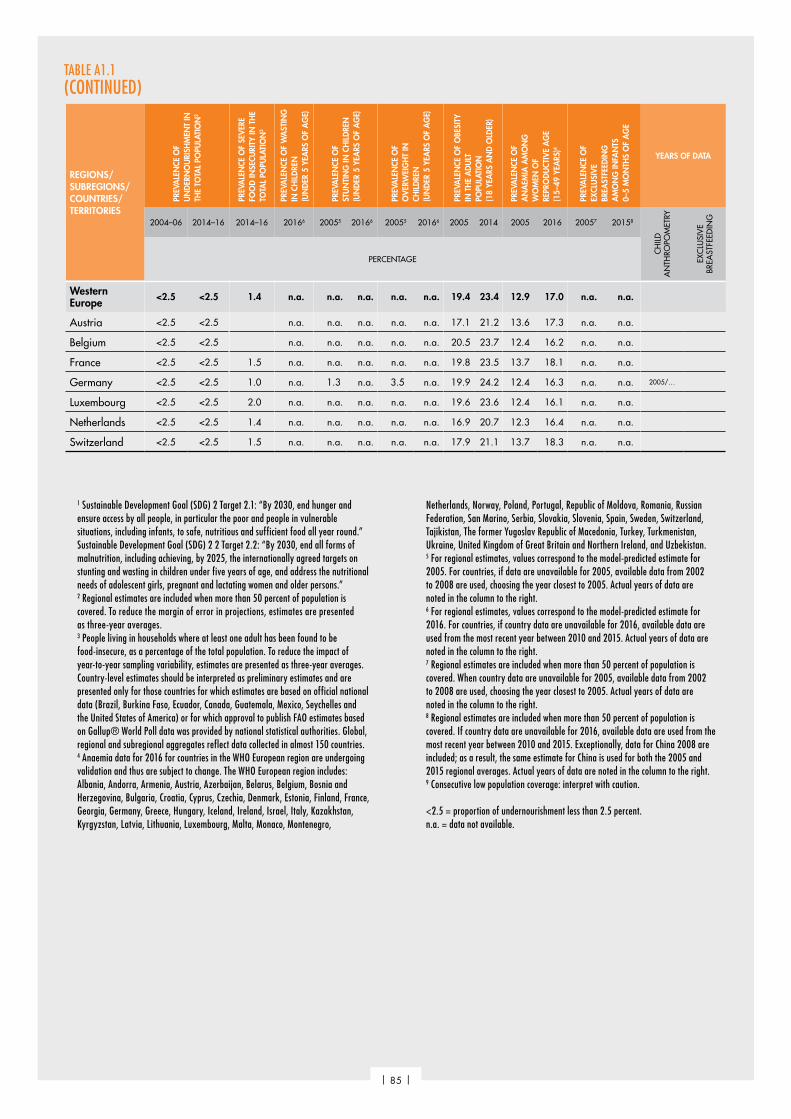
REGIONS/SUBREGIONS/COUNTRIES/TERRITORIES
PREV
ALE
NCE
OF
UN
DER
NO
URI
SHM
ENT
IN
THE
TOTA
L PO
PULA
TIO
N2
PREV
ALE
NCE
OF
SEV
ERE
FOO
D IN
SECU
RITY
IN T
HE
TOTA
L PO
PULA
TIO
N3
PREV
ALE
NCE
OF
WA
STIN
G
IN C
HIL
DRE
N
(UN
DER
5 Y
EARS
OF
AG
E)
PREV
ALE
NCE
OF
STU
NTI
NG
IN C
HIL
DRE
N
(UN
DER
5 Y
EARS
OF
AG
E)
PREV
ALE
NCE
OF
OV
ERW
EIG
HT
IN
CHIL
DRE
N
(UN
DER
5 Y
EARS
OF
AG
E)
PREV
ALE
NCE
OF
OBE
SITY
IN
TH
E A
DU
LT
POPU
LATI
ON
(1
8 YE
ARS
AN
D O
LDER
)
PREV
ALE
NCE
OF
AN
AEM
IA A
MO
NG
W
OM
EN O
F RE
PRO
DU
CTIV
E A
GE
(15–
49 Y
EARS
)4
PREV
ALE
NCE
OF
EXCL
USI
VE
BREA
STFE
EDIN
G
AM
ON
G IN
FAN
TS
0–5
MO
NTH
S O
F A
GE
YEARS OF DATA
2004–06 2014–16 2014–16 20166 20055 20166 20055 20166 2005 2014 2005 2016 20057 20158
CH
ILD
A
NTH
ROPO
MET
RY
EXC
LUSI
VE
BREA
STFE
EDIN
G
PERCENTAGE
Western Europe <2.5 <2.5 1.4 n.a. n.a. n.a. n.a. n.a. 19.4 23.4 12.9 17.0 n.a. n.a.
Austria <2.5 <2.5 n.a. n.a. n.a. n.a. n.a. 17.1 21.2 13.6 17.3 n.a. n.a.
Belgium <2.5 <2.5 n.a. n.a. n.a. n.a. n.a. 20.5 23.7 12.4 16.2 n.a. n.a.
France <2.5 <2.5 1.5 n.a. n.a. n.a. n.a. n.a. 19.8 23.5 13.7 18.1 n.a. n.a.
Germany <2.5 <2.5 1.0 n.a. 1.3 n.a. 3.5 n.a. 19.9 24.2 12.4 16.3 n.a. n.a. 2005/…
Luxembourg <2.5 <2.5 2.0 n.a. n.a. n.a. n.a. n.a. 19.6 23.6 12.4 16.1 n.a. n.a.
Netherlands <2.5 <2.5 1.4 n.a. n.a. n.a. n.a. n.a. 16.9 20.7 12.3 16.4 n.a. n.a.
Switzerland <2.5 <2.5 1.5 n.a. n.a. n.a. n.a. n.a. 17.9 21.1 13.7 18.3 n.a. n.a.
1 Sustainable Development Goal (SDG) 2 Target 2.1: “By 2030, end hunger and ensure access by all people, in particular the poor and people in vulnerable situations, including infants, to safe, nutritious and sufficient food all year round.” Sustainable Development Goal (SDG) 2 2 Target 2.2: “By 2030, end all forms of malnutrition, including achieving, by 2025, the internationally agreed targets on stunting and wasting in children under five years of age, and address the nutritional needs of adolescent girls, pregnant and lactating women and older persons.”2 Regional estimates are included when more than 50 percent of population is covered. To reduce the margin of error in projections, estimates are presented as three-year averages.3 People living in households where at least one adult has been found to be food-insecure, as a percentage of the total population. To reduce the impact of year-to-year sampling variability, estimates are presented as three-year averages. Country-level estimates should be interpreted as preliminary estimates and are presented only for those countries for which estimates are based on official national data (Brazil, Burkina Faso, Ecuador, Canada, Guatemala, Mexico, Seychelles and the United States of America) or for which approval to publish FAO estimates based on Gallup® World Poll data was provided by national statistical authorities. Global, regional and subregional aggregates reflect data collected in almost 150 countries. 4 Anaemia data for 2016 for countries in the WHO European region are undergoing validation and thus are subject to change. The WHO European region includes: Albania, Andorra, Armenia, Austria, Azerbaijan, Belarus, Belgium, Bosnia and Herzegovina, Bulgaria, Croatia, Cyprus, Czechia, Denmark, Estonia, Finland, France, Georgia, Germany, Greece, Hungary, Iceland, Ireland, Israel, Italy, Kazakhstan, Kyrgyzstan, Latvia, Lithuania, Luxembourg, Malta, Monaco, Montenegro,
Netherlands, Norway, Poland, Portugal, Republic of Moldova, Romania, Russian Federation, San Marino, Serbia, Slovakia, Slovenia, Spain, Sweden, Switzerland, Tajikistan, The former Yugoslav Republic of Macedonia, Turkey, Turkmenistan, Ukraine, United Kingdom of Great Britain and Northern Ireland, and Uzbekistan.5 For regional estimates, values correspond to the model-predicted estimate for 2005. For countries, if data are unavailable for 2005, available data from 2002 to 2008 are used, choosing the year closest to 2005. Actual years of data are noted in the column to the right.6 For regional estimates, values correspond to the model-predicted estimate for 2016. For countries, if country data are unavailable for 2016, available data are used from the most recent year between 2010 and 2015. Actual years of data are noted in the column to the right.7 Regional estimates are included when more than 50 percent of population is covered. When country data are unavailable for 2005, available data from 2002 to 2008 are used, choosing the year closest to 2005. Actual years of data are noted in the column to the right.8 Regional estimates are included when more than 50 percent of population is covered. If country data are unavailable for 2016, available data are used from the most recent year between 2010 and 2015. Exceptionally, data for China 2008 are included; as a result, the same estimate for China is used for both the 2005 and 2015 regional averages. Actual years of data are noted in the column to the right.9 Consecutive low population coverage: interpret with caution.
<2.5 = proportion of undernourishment less than 2.5 percent.n.a. = data not available.
TABLE A1.1 (CONTINUED)
| 85 |
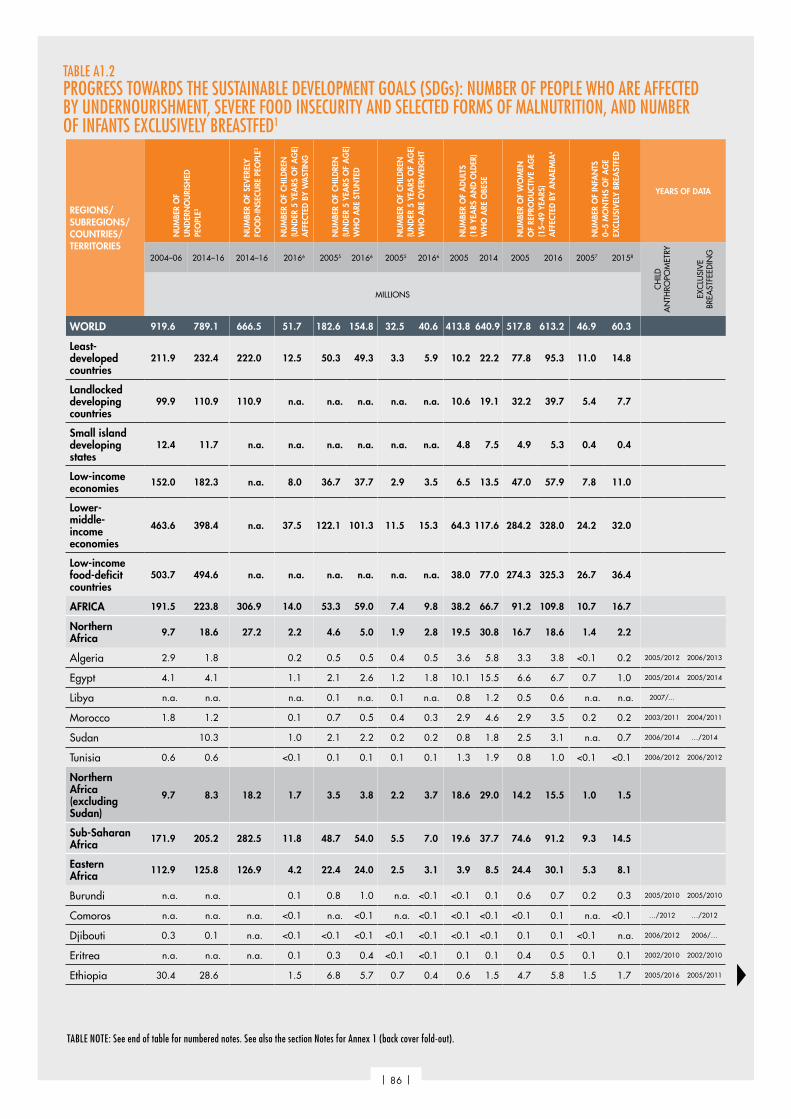
REGIONS/SUBREGIONS/COUNTRIES/TERRITORIES
NU
MBE
R O
F U
ND
ERN
OU
RISH
ED
PEO
PLE2
NU
MBE
R O
F SE
VER
ELY
FOO
D-IN
SECU
RE P
EOPL
E3
NU
MBE
R O
F CH
ILD
REN
(U
ND
ER 5
YEA
RS O
F A
GE)
A
FFEC
TED
BY
WA
STIN
G
NU
MBE
R O
F CH
ILD
REN
(U
ND
ER 5
YEA
RS O
F A
GE)
W
HO
ARE
STU
NTE
D
NU
MBE
R O
F CH
ILD
REN
(U
ND
ER 5
YEA
RS O
F A
GE)
W
HO
ARE
OV
ERW
EIG
HT
NU
MBE
R O
F A
DU
LTS
(18
YEA
RS A
ND
OLD
ER)
WH
O A
RE O
BESE
NU
MBE
R O
F W
OM
EN
OF
REPR
OD
UCT
IVE
AG
E (1
5–49
YEA
RS)
AFF
ECTE
D B
Y A
NA
EMIA
4
NU
MBE
R O
F IN
FAN
TS
0–5
MO
NTH
S O
F A
GE
EXCL
USI
VEL
Y BR
EAST
FED
YEARS OF DATA
2004–06 2014–16 2014–16 20166 20055 20166 20055 20166 2005 2014 2005 2016 20057 20158
CH
ILD
A
NTH
ROPO
MET
RY
EXC
LUSI
VE
BREA
STFE
EDIN
G
MILLIONS
WORLD 919.6 789.1 666.5 51.7 182.6 154.8 32.5 40.6 413.8 640.9 517.8 613.2 46.9 60.3
Least-developed countries
211.9 232.4 222.0 12.5 50.3 49.3 3.3 5.9 10.2 22.2 77.8 95.3 11.0 14.8
Landlocked developing countries
99.9 110.9 110.9 n.a. n.a. n.a. n.a. n.a. 10.6 19.1 32.2 39.7 5.4 7.7
Small island developing states
12.4 11.7 n.a. n.a. n.a. n.a. n.a. n.a. 4.8 7.5 4.9 5.3 0.4 0.4
Low-income economies 152.0 182.3 n.a. 8.0 36.7 37.7 2.9 3.5 6.5 13.5 47.0 57.9 7.8 11.0
Lower-middle-income economies
463.6 398.4 n.a. 37.5 122.1 101.3 11.5 15.3 64.3 117.6 284.2 328.0 24.2 32.0
Low-income food-deficit countries
503.7 494.6 n.a. n.a. n.a. n.a. n.a. n.a. 38.0 77.0 274.3 325.3 26.7 36.4
AFRICA 191.5 223.8 306.9 14.0 53.3 59.0 7.4 9.8 38.2 66.7 91.2 109.8 10.7 16.7
Northern Africa 9.7 18.6 27.2 2.2 4.6 5.0 1.9 2.8 19.5 30.8 16.7 18.6 1.4 2.2
Algeria 2.9 1.8 0.2 0.5 0.5 0.4 0.5 3.6 5.8 3.3 3.8 <0.1 0.2 2005/2012 2006/2013
Egypt 4.1 4.1 1.1 2.1 2.6 1.2 1.8 10.1 15.5 6.6 6.7 0.7 1.0 2005/2014 2005/2014
Libya n.a. n.a. n.a. 0.1 n.a. 0.1 n.a. 0.8 1.2 0.5 0.6 n.a. n.a. 2007/...
Morocco 1.8 1.2 0.1 0.7 0.5 0.4 0.3 2.9 4.6 2.9 3.5 0.2 0.2 2003/2011 2004/2011
Sudan 10.3 1.0 2.1 2.2 0.2 0.2 0.8 1.8 2.5 3.1 n.a. 0.7 2006/2014 …/2014
Tunisia 0.6 0.6 <0.1 0.1 0.1 0.1 0.1 1.3 1.9 0.8 1.0 <0.1 <0.1 2006/2012 2006/2012
Northern Africa (excluding Sudan)
9.7 8.3 18.2 1.7 3.5 3.8 2.2 3.7 18.6 29.0 14.2 15.5 1.0 1.5
Sub-Saharan Africa 171.9 205.2 282.5 11.8 48.7 54.0 5.5 7.0 19.6 37.7 74.6 91.2 9.3 14.5
Eastern Africa 112.9 125.8 126.9 4.2 22.4 24.0 2.5 3.1 3.9 8.5 24.4 30.1 5.3 8.1
Burundi n.a. n.a. 0.1 0.8 1.0 n.a. <0.1 <0.1 0.1 0.6 0.7 0.2 0.3 2005/2010 2005/2010
Comoros n.a. n.a. n.a. <0.1 n.a. <0.1 n.a. <0.1 <0.1 <0.1 <0.1 0.1 n.a. <0.1 …/2012 …/2012
Djibouti 0.3 0.1 n.a. <0.1 <0.1 <0.1 <0.1 <0.1 <0.1 <0.1 0.1 0.1 <0.1 n.a. 2006/2012 2006/…
Eritrea n.a. n.a. n.a. 0.1 0.3 0.4 <0.1 <0.1 0.1 0.1 0.4 0.5 0.1 0.1 2002/2010 2002/2010
Ethiopia 30.4 28.6 1.5 6.8 5.7 0.7 0.4 0.6 1.5 4.7 5.8 1.5 1.7 2005/2016 2005/2011
TABLE A1.2 PROGRESS TOWARDS THE SUSTAINABLE DEVELOPMENT GOALS (SDGs): NUMBER OF PEOPLE WHO ARE AFFECTED BY UNDERNOURISHMENT, SEVERE FOOD INSECURITY AND SELECTED FORMS OF MALNUTRITION, AND NUMBER OF INFANTS EXCLUSIVELY BREASTFED1
TABLE NOTE: See end of table for numbered notes. See also the section Notes for Annex 1 (back cover fold-out).
| 86 |

REGIONS/SUBREGIONS/COUNTRIES/TERRITORIES
NU
MBE
R O
F U
ND
ERN
OU
RISH
ED
PEO
PLE2
NU
MBE
R O
F SE
VER
ELY
FOO
D-IN
SECU
RE P
EOPL
E3
NU
MBE
R O
F CH
ILD
REN
(U
ND
ER 5
YEA
RS O
F A
GE)
A
FFEC
TED
BY
WA
STIN
G
NU
MBE
R O
F CH
ILD
REN
(U
ND
ER 5
YEA
RS O
F A
GE)
W
HO
ARE
STU
NTE
D
NU
MBE
R O
F CH
ILD
REN
(U
ND
ER 5
YEA
RS O
F A
GE)
W
HO
ARE
OV
ERW
EIG
HT
NU
MBE
R O
F A
DU
LTS
(18
YEA
RS A
ND
OLD
ER)
WH
O A
RE O
BESE
NU
MBE
R O
F W
OM
EN
OF
REPR
OD
UCT
IVE
AG
E (1
5–49
YEA
RS)
AFF
ECTE
D B
Y A
NA
EMIA
4
NU
MBE
R O
F IN
FAN
TS
0–5
MO
NTH
S O
F A
GE
EXCL
USI
VEL
Y BR
EAST
FED
YEARS OF DATA
2004–06 2014–16 2014–16 20166 20055 20166 20055 20166 2005 2014 2005 2016 20057 20158
CH
ILD
A
NTH
ROPO
MET
RY
EXC
LUSI
VE
BREA
STFE
EDIN
G
MILLIONS
Kenya 10.2 8.8 0.3 2.4 1.8 n.a. 0.3 0.6 1.4 3.1 3.1 0.2 1.0 2005/2014 2003/2014
Madagascar 6.4 10.3 n.a. n.a. 1.6 n.a. 0.2 n.a. 0.2 0.5 1.7 2.2 0.5 0.3 2004/… 2004/2013
Malawi 3.3 4.5 0.1 1.2 1.2 0.2 0.1 0.1 0.3 1.0 1.4 0.3 0.4 2004/2014 2004/2015
Mauritius <0.1 <0.1 0.1 n.a. n.a. n.a. n.a. n.a. 0.1 0.2 0.1 0.1 <0.1 n.a. 2002/…
Mozambique 7.8 7.4 0.3 1.8 1.9 0.1 0.4 0.3 0.5 2.5 3.4 0.3 0.4 2008/2011 2003/2013
Rwanda 4.0 4.8 <0.1 0.8 0.6 0.1 0.1 0.1 0.2 0.5 0.7 0.3 0.3 2005/2015 2005/2014
Seychelles n.a. n.a. <0.1 <0.1 n.a. <0.1 n.a. <0.1 <0.1 <0.1 <0.1 <0.1 n.a. n.a. …/2012
Somalia n.a. n.a. n.a. n.a. 0.7 n.a. 0.1 n.a. 0.1 0.2 0.8 1.1 <0.1 n.a. 2006/… 2006/…
South Sudan n.a. n.a. 10.3 0.4 0.5 0.5 0.2 0.1 n.a. n.a. 0.7 1.0 n.a. 0.2 2006/2010 …/2014
Uganda 6.8 15.2 0.3 2.2 2.3 0.3 0.4 0.2 0.6 2.2 2.6 0.8 1.1 2006/2012 2006/2011
United Republic of Tanzania
13.5 17.3 0.4 3.0 3.2 0.3 0.3 0.6 1.4 4.1 4.7 0.7 1.2 2004/2015 2005/2015
Zambia 6.2 7.4 0.2 1.1 1.1 0.2 0.2 0.2 0.5 0.9 1.3 0.3 0.5 2007/2013 2007/2014
Zimbabwe 5.2 7.0 0.1 0.7 0.7 0.2 0.1 0.6 0.8 1.1 1.2 0.1 0.3 2005/2014 2006/2015
Middle Africa 32.9 37.6 49.8 2.0 7.8 8.9 0.9 1.3 1.8 3.9 12.8 15.5 1.5 2.3
Angola 5.8 3.5 0.2 1.1 1.8 n.a. 0.2 0.3 0.7 2.0 2.7 n.a. n.a. 2007/2016
Cameroon 3.7 1.9 6.4 0.2 1.1 1.2 0.3 0.2 0.5 1.0 1.9 2.4 0.2 0.2 2004/2014 2004/2014
Central African Republic
1.6 2.9 <0.1 0.3 0.3 0.1 <0.1 0.1 0.1 0.5 0.6 <0.1 0.1 2006/2010 2006/2010
Chad 3.9 4.6 n.a. 0.3 0.9 1.1 0.1 0.1 0.1 0.3 1.1 1.5 <0.1 <0.1 2004/2015 2004/2014
Congo 1.2 1.3 0.1 0.2 0.2 <0.1 <0.1 0.1 0.2 0.5 0.6 <0.1 0.1 2005/2015 2005/2015
Democratic Republic of the Congo
n.a. n.a. 1.1 5.2 5.6 0.8 0.6 0.6 1.4 6.6 7.4 0.9 1.5 2007/2013 2007/2014
Equatorial Guinea n.a. n.a. n.a. <0.1 <0.1 <0.1 <0.1 <0.1 <0.1 0.1 0.1 0.1 n.a. <0.1 2004/2010 …/2011
Gabon 0.1 0.1 <0.1 n.a. <0.1 n.a. <0.1 0.1 0.1 0.2 0.3 n.a. <0.1 …/2012 …/2012
Sao Tome and Principe <0.1 <0.1 n.a. <0.1 <0.1 <0.1 <0.1 <0.1 <0.1 <0.1 <0.1 <0.1 <0.1 <0.1 2006/2014 2006/2015
Southern Africa 3.6 4.4 15.5 0.3 1.9 1.8 0.6 0.7 6.5 9.6 4.6 4.4 0.1 n.a.
Botswana 0.6 0.6 0.8 n.a. 0.1 n.a. <0.1 n.a. 0.1 0.2 0.2 0.2 <0.1 n.a. 2007/… 2007/…
Lesotho 0.2 0.3 <0.1 0.1 0.1 <0.1 <0.1 0.1 0.2 0.2 0.2 <0.1 <0.1 2004/2014 2004/2014
Namibia 0.5 0.7 <0.1 0.1 0.1 <0.1 <0.1 0.1 0.2 0.2 0.2 <0.1 <0.1 2007/2013 2007/2013
South Africa 2.0 2.5 12.3 n.a. 1.7 n.a. 1.0 n.a. 6.1 8.9 4.0 3.8 0.1 n.a. 2004/… 2003/…
Swaziland 0.2 0.3 n.a. <0.1 <0.1 <0.1 <0.1 <0.1 0.1 0.1 0.1 0.1 <0.1 <0.1 2006/2014 2007/2014
TABLE A1.2 (CONTINUED)
| 87 |
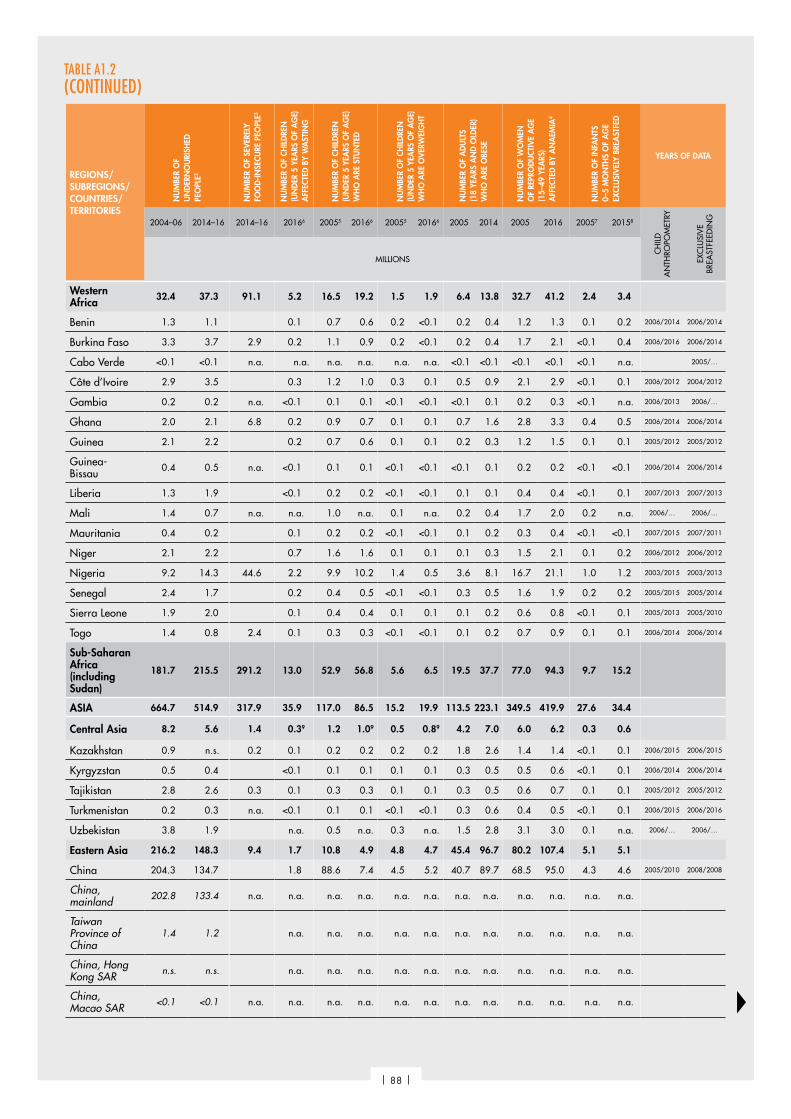
REGIONS/SUBREGIONS/COUNTRIES/TERRITORIES
NU
MBE
R O
F U
ND
ERN
OU
RISH
ED
PEO
PLE2
NU
MBE
R O
F SE
VER
ELY
FOO
D-IN
SECU
RE P
EOPL
E3
NU
MBE
R O
F CH
ILD
REN
(U
ND
ER 5
YEA
RS O
F A
GE)
A
FFEC
TED
BY
WA
STIN
G
NU
MBE
R O
F CH
ILD
REN
(U
ND
ER 5
YEA
RS O
F A
GE)
W
HO
ARE
STU
NTE
D
NU
MBE
R O
F CH
ILD
REN
(U
ND
ER 5
YEA
RS O
F A
GE)
W
HO
ARE
OV
ERW
EIG
HT
NU
MBE
R O
F A
DU
LTS
(18
YEA
RS A
ND
OLD
ER)
WH
O A
RE O
BESE
NU
MBE
R O
F W
OM
EN
OF
REPR
OD
UCT
IVE
AG
E (1
5–49
YEA
RS)
AFF
ECTE
D B
Y A
NA
EMIA
4
NU
MBE
R O
F IN
FAN
TS
0–5
MO
NTH
S O
F A
GE
EXCL
USI
VEL
Y BR
EAST
FED
YEARS OF DATA
2004–06 2014–16 2014–16 20166 20055 20166 20055 20166 2005 2014 2005 2016 20057 20158
CH
ILD
A
NTH
ROPO
MET
RY
EXC
LUSI
VE
BREA
STFE
EDIN
G
MILLIONS
Western Africa 32.4 37.3 91.1 5.2 16.5 19.2 1.5 1.9 6.4 13.8 32.7 41.2 2.4 3.4
Benin 1.3 1.1 0.1 0.7 0.6 0.2 <0.1 0.2 0.4 1.2 1.3 0.1 0.2 2006/2014 2006/2014
Burkina Faso 3.3 3.7 2.9 0.2 1.1 0.9 0.2 <0.1 0.2 0.4 1.7 2.1 <0.1 0.4 2006/2016 2006/2014
Cabo Verde <0.1 <0.1 n.a. n.a. n.a. n.a. n.a. n.a. <0.1 <0.1 <0.1 <0.1 <0.1 n.a. 2005/…
Côte d’Ivoire 2.9 3.5 0.3 1.2 1.0 0.3 0.1 0.5 0.9 2.1 2.9 <0.1 0.1 2006/2012 2004/2012
Gambia 0.2 0.2 n.a. <0.1 0.1 0.1 <0.1 <0.1 <0.1 0.1 0.2 0.3 <0.1 n.a. 2006/2013 2006/…
Ghana 2.0 2.1 6.8 0.2 0.9 0.7 0.1 0.1 0.7 1.6 2.8 3.3 0.4 0.5 2006/2014 2006/2014
Guinea 2.1 2.2 0.2 0.7 0.6 0.1 0.1 0.2 0.3 1.2 1.5 0.1 0.1 2005/2012 2005/2012
Guinea-Bissau 0.4 0.5 n.a. <0.1 0.1 0.1 <0.1 <0.1 <0.1 0.1 0.2 0.2 <0.1 <0.1 2006/2014 2006/2014
Liberia 1.3 1.9 <0.1 0.2 0.2 <0.1 <0.1 0.1 0.1 0.4 0.4 <0.1 0.1 2007/2013 2007/2013
Mali 1.4 0.7 n.a. n.a. 1.0 n.a. 0.1 n.a. 0.2 0.4 1.7 2.0 0.2 n.a. 2006/… 2006/…
Mauritania 0.4 0.2 0.1 0.2 0.2 <0.1 <0.1 0.1 0.2 0.3 0.4 <0.1 <0.1 2007/2015 2007/2011
Niger 2.1 2.2 0.7 1.6 1.6 0.1 0.1 0.1 0.3 1.5 2.1 0.1 0.2 2006/2012 2006/2012
Nigeria 9.2 14.3 44.6 2.2 9.9 10.2 1.4 0.5 3.6 8.1 16.7 21.1 1.0 1.2 2003/2015 2003/2013
Senegal 2.4 1.7 0.2 0.4 0.5 <0.1 <0.1 0.3 0.5 1.6 1.9 0.2 0.2 2005/2015 2005/2014
Sierra Leone 1.9 2.0 0.1 0.4 0.4 0.1 0.1 0.1 0.2 0.6 0.8 <0.1 0.1 2005/2013 2005/2010
Togo 1.4 0.8 2.4 0.1 0.3 0.3 <0.1 <0.1 0.1 0.2 0.7 0.9 0.1 0.1 2006/2014 2006/2014
Sub-Saharan Africa (including Sudan)
181.7 215.5 291.2 13.0 52.9 56.8 5.6 6.5 19.5 37.7 77.0 94.3 9.7 15.2
ASIA 664.7 514.9 317.9 35.9 117.0 86.5 15.2 19.9 113.5 223.1 349.5 419.9 27.6 34.4
Central Asia 8.2 5.6 1.4 0.39 1.2 1.09 0.5 0.89 4.2 7.0 6.0 6.2 0.3 0.6
Kazakhstan 0.9 n.s. 0.2 0.1 0.2 0.2 0.2 0.2 1.8 2.6 1.4 1.4 <0.1 0.1 2006/2015 2006/2015
Kyrgyzstan 0.5 0.4 <0.1 0.1 0.1 0.1 0.1 0.3 0.5 0.5 0.6 <0.1 0.1 2006/2014 2006/2014
Tajikistan 2.8 2.6 0.3 0.1 0.3 0.3 0.1 0.1 0.3 0.5 0.6 0.7 0.1 0.1 2005/2012 2005/2012
Turkmenistan 0.2 0.3 n.a. <0.1 0.1 0.1 <0.1 <0.1 0.3 0.6 0.4 0.5 <0.1 0.1 2006/2015 2006/2016
Uzbekistan 3.8 1.9 n.a. 0.5 n.a. 0.3 n.a. 1.5 2.8 3.1 3.0 0.1 n.a. 2006/… 2006/…
Eastern Asia 216.2 148.3 9.4 1.7 10.8 4.9 4.8 4.7 45.4 96.7 80.2 107.4 5.1 5.1
China 204.3 134.7 1.8 88.6 7.4 4.5 5.2 40.7 89.7 68.5 95.0 4.3 4.6 2005/2010 2008/2008
China, mainland 202.8 133.4 n.a. n.a. n.a. n.a. n.a. n.a. n.a. n.a. n.a. n.a. n.a. n.a.
Taiwan Province of China
1.4 1.2 n.a. n.a. n.a. n.a. n.a. n.a. n.a. n.a. n.a. n.a. n.a.
China, Hong Kong SAR n.s. n.s. n.a. n.a. n.a. n.a. n.a. n.a. n.a. n.a. n.a. n.a. n.a.
China, Macao SAR <0.1 <0.1 n.a. n.a. n.a. n.a. n.a. n.a. n.a. n.a. n.a. n.a. n.a. n.a.
TABLE A1.2 (CONTINUED)
| 88 |

REGIONS/SUBREGIONS/COUNTRIES/TERRITORIES
NU
MBE
R O
F U
ND
ERN
OU
RISH
ED
PEO
PLE2
NU
MBE
R O
F SE
VER
ELY
FOO
D-IN
SECU
RE P
EOPL
E3
NU
MBE
R O
F CH
ILD
REN
(U
ND
ER 5
YEA
RS O
F A
GE)
A
FFEC
TED
BY
WA
STIN
G
NU
MBE
R O
F CH
ILD
REN
(U
ND
ER 5
YEA
RS O
F A
GE)
W
HO
ARE
STU
NTE
D
NU
MBE
R O
F CH
ILD
REN
(U
ND
ER 5
YEA
RS O
F A
GE)
W
HO
ARE
OV
ERW
EIG
HT
NU
MBE
R O
F A
DU
LTS
(18
YEA
RS A
ND
OLD
ER)
WH
O A
RE O
BESE
NU
MBE
R O
F W
OM
EN
OF
REPR
OD
UCT
IVE
AG
E (1
5–49
YEA
RS)
AFF
ECTE
D B
Y A
NA
EMIA
4
NU
MBE
R O
F IN
FAN
TS
0–5
MO
NTH
S O
F A
GE
EXCL
USI
VEL
Y BR
EAST
FED
YEARS OF DATA
2004–06 2014–16 2014–16 20166 20055 20166 20055 20166 2005 2014 2005 2016 20057 20158
CH
ILD
A
NTH
ROPO
MET
RY
EXC
LUSI
VE
BREA
STFE
EDIN
G
MILLIONS
Democratic People’s Republic of Korea
8.4 10.3 n.a. 0.1 0.8 0.5 n.a. n.a. 0.4 0.6 2.0 2.2 0.2 n.a. 2004/…
Japan n.s. n.s. 0.5 0.1 n.a. 0.4 n.a. 0.1 2.9 3.8 5.7 5.6 n.a. n.a. …/2010
Mongolia 0.8 0.6 <0.1 0.1 <0.1 <0.1 <0.1 0.2 0.3 0.1 0.2 <0.1 <0.1 2005/2013 2005/2014
Republic of Korea n.s. n.s. <0.1 0.1 0.1 0.2 0.2 1.2 2.3 2.1 2.8 n.a. n.a. 2003/2010
Eastern Asia (excluding China, mainland)
12.1 13.8 1.2 n.a. n.a. n.a. n.a. n.a. n.a. n.a. 11.7 12.4 n.a. n.a.
South-Eastern Asia 102.0 64.8 45.0 5.2 18.9 15.1 2.3 4.2 11.4 24.5 44.4 48.5 3.3 4.2
Brunei Darussalam n.s. n.s. n.a. n.a. n.a. n.a. n.a. n.a. <0.1 0.1 <0.1 <0.1 n.a. n.a.
Cambodia 2.7 2.4 2.3 0.2 0.7 0.6 <0.1 <0.1 0.1 0.3 1.8 2.0 0.2 0.2 2005/2014 2005/2014
Indonesia 42.1 20.3 3.3 n.a. 8.8 n.a. 2.8 4.5 9.8 18.0 20.2 1.6 2.1 …/2013 2007/2012
Lao People’s Democratic Republic
1.5 1.2 n.a. 0.1 0.4 0.4 <0.1 <0.1 <0.1 0.1 0.5 0.7 <0.1 0.1 2006/2011 2006/2012
Malaysia 1.0 n.s. 0.2 0.4 0.4 n.a. 0.2 1.4 2.8 1.7 2.1 n.a. n.a. 2006/2015
Myanmar 16.1 9.1 1.1 0.3 2.2 1.3 0.1 0.1 0.5 1.4 5.8 6.9 n.a. 0.2 2003/2016 …/2010
Philippines 14.1 13.9 0.9 3.8 3.3 0.3 0.6 1.5 3.1 6.4 4.2 0.8 n.a. 2003/2013 2003/…
Singapore n.a. n.a. n.a. n.a. n.a. n.a. n.a. 0.2 0.3 0.2 0.3 n.a. n.a.
Thailand 8.1 6.5 0.3 0.7 0.6 0.3 0.4 2.5 5.0 4.3 5.6 <0.1 0.1 2006/2012 2006/2012
Timor-Leste 0.3 0.3 n.a. <0.1 0.1 0.1 n.a. <0.1 <0.1 <0.1 0.1 0.1 <0.1 <0.1 2003/2013 2003/2013
Viet Nam 15.3 10.0 2.4 0.5 2.2 1.9 0.2 0.4 0.6 1.7 5.6 6.3 0.2 0.4 2005/2015 2005/2014
Southern Asia 316.7 271.6 235.9 27.6 81.1 61.2 5.9 7.99 27.6 53.6 200.8 234.2 17.7 22.2
Afghanistan 8.1 7.5 5.2 0.5 2.7 2.0 0.2 0.3 0.2 0.4 1.8 3.2 n.a. 0.5 2004/2013 …/2015
Bangladesh 23.7 24.4 2.2 7.7 5.5 0.2 0.2 1.4 3.1 16.9 18.2 1.4 1.7 2005/2014 2004/2014
Bhutan n.a. n.a. <0.1 <0.1 <0.1 <0.1 <0.1 <0.1 <0.1 0.1 0.1 n.a. <0.1 2008/2010 …/2015
India 234.9 190.7 26.0 62.2 47.5 2.5 n.a. 14.6 29.8 153.4 175.6 12.8 16.7 2006/2015 2006/2014
Iran (Islamic Republic of) 4.3 4.3 0.3 0.4 0.4 n.a. n.a. 7.5 12.6 6.0 7.2 n.a. 0.7 2004/2011 …/2011
Maldives <0.1 <0.1 n.a. n.a. n.a. n.a. n.a. n.a. <0.1 <0.1 <0.1 <0.1 n.a. n.a.
Nepal 4.1 2.3 0.3 1.7 1.1 <0.1 0.1 0.3 0.6 2.6 2.8 0.4 0.3 2006/2014 2006/2014
Pakistan 35.7 37.6 2.5 n.a. 10.7 n.a. 1.1 3.1 6.0 18.2 25.3 1.7 2.1 …/2012 2007/2013
Sri Lanka 5.7 4.6 0.4 0.3 0.3 <0.1 <0.1 0.4 1.0 1.7 1.7 0.3 n.a. 2007/2012 2007/…
Southern Asia (excluding India)
81.8 80.9 53.1 n.a. n.a. n.a. n.a. n.a. n.a. n.a. 47.4 58.6 n.a. n.a.
TABLE A1.2 (CONTINUED)
| 89 |
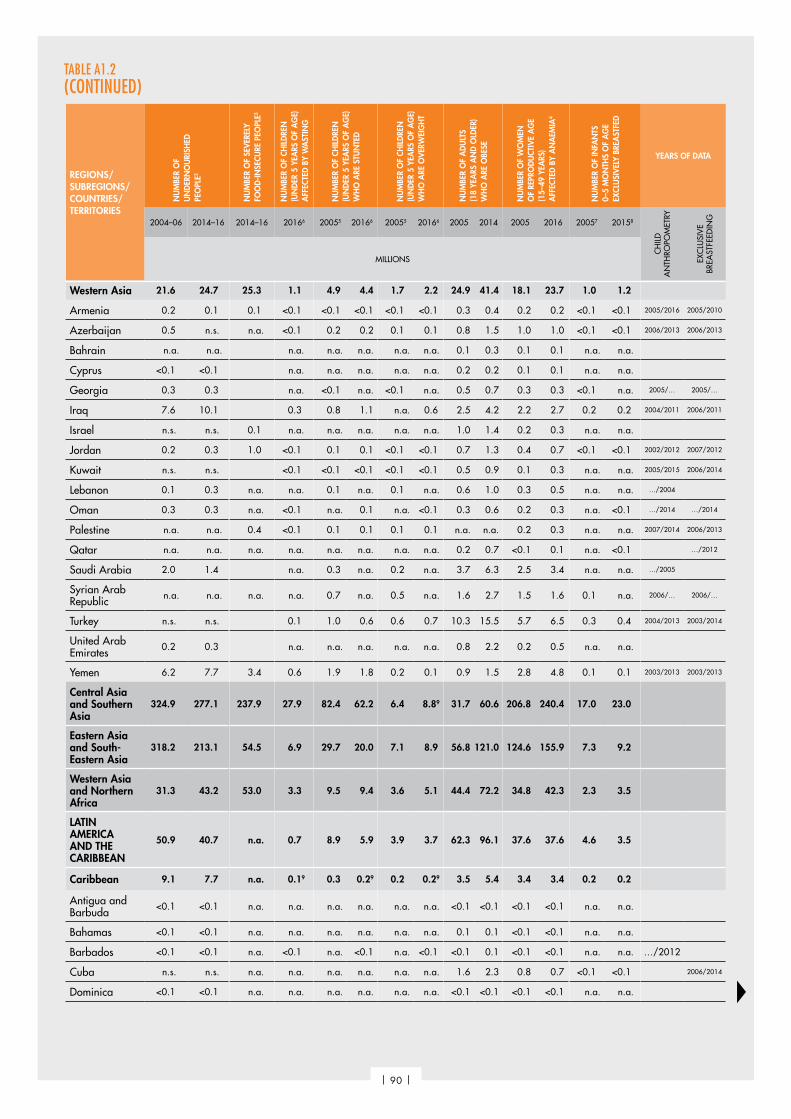
REGIONS/SUBREGIONS/COUNTRIES/TERRITORIES
NU
MBE
R O
F U
ND
ERN
OU
RISH
ED
PEO
PLE2
NU
MBE
R O
F SE
VER
ELY
FOO
D-IN
SECU
RE P
EOPL
E3
NU
MBE
R O
F CH
ILD
REN
(U
ND
ER 5
YEA
RS O
F A
GE)
A
FFEC
TED
BY
WA
STIN
G
NU
MBE
R O
F CH
ILD
REN
(U
ND
ER 5
YEA
RS O
F A
GE)
W
HO
ARE
STU
NTE
D
NU
MBE
R O
F CH
ILD
REN
(U
ND
ER 5
YEA
RS O
F A
GE)
W
HO
ARE
OV
ERW
EIG
HT
NU
MBE
R O
F A
DU
LTS
(18
YEA
RS A
ND
OLD
ER)
WH
O A
RE O
BESE
NU
MBE
R O
F W
OM
EN
OF
REPR
OD
UCT
IVE
AG
E (1
5–49
YEA
RS)
AFF
ECTE
D B
Y A
NA
EMIA
4
NU
MBE
R O
F IN
FAN
TS
0–5
MO
NTH
S O
F A
GE
EXCL
USI
VEL
Y BR
EAST
FED
YEARS OF DATA
2004–06 2014–16 2014–16 20166 20055 20166 20055 20166 2005 2014 2005 2016 20057 20158
CH
ILD
A
NTH
ROPO
MET
RY
EXC
LUSI
VE
BREA
STFE
EDIN
G
MILLIONS
Western Asia 21.6 24.7 25.3 1.1 4.9 4.4 1.7 2.2 24.9 41.4 18.1 23.7 1.0 1.2
Armenia 0.2 0.1 0.1 <0.1 <0.1 <0.1 <0.1 <0.1 0.3 0.4 0.2 0.2 <0.1 <0.1 2005/2016 2005/2010
Azerbaijan 0.5 n.s. n.a. <0.1 0.2 0.2 0.1 0.1 0.8 1.5 1.0 1.0 <0.1 <0.1 2006/2013 2006/2013
Bahrain n.a. n.a. n.a. n.a. n.a. n.a. n.a. 0.1 0.3 0.1 0.1 n.a. n.a.
Cyprus <0.1 <0.1 n.a. n.a. n.a. n.a. n.a. 0.2 0.2 0.1 0.1 n.a. n.a.
Georgia 0.3 0.3 n.a. <0.1 n.a. <0.1 n.a. 0.5 0.7 0.3 0.3 <0.1 n.a. 2005/… 2005/…
Iraq 7.6 10.1 0.3 0.8 1.1 n.a. 0.6 2.5 4.2 2.2 2.7 0.2 0.2 2004/2011 2006/2011
Israel n.s. n.s. 0.1 n.a. n.a. n.a. n.a. n.a. 1.0 1.4 0.2 0.3 n.a. n.a.
Jordan 0.2 0.3 1.0 <0.1 0.1 0.1 <0.1 <0.1 0.7 1.3 0.4 0.7 <0.1 <0.1 2002/2012 2007/2012
Kuwait n.s. n.s. <0.1 <0.1 <0.1 <0.1 <0.1 0.5 0.9 0.1 0.3 n.a. n.a. 2005/2015 2006/2014
Lebanon 0.1 0.3 n.a. n.a. 0.1 n.a. 0.1 n.a. 0.6 1.0 0.3 0.5 n.a. n.a. …/2004
Oman 0.3 0.3 n.a. <0.1 n.a. 0.1 n.a. <0.1 0.3 0.6 0.2 0.3 n.a. <0.1 …/2014 …/2014
Palestine n.a. n.a. 0.4 <0.1 0.1 0.1 0.1 0.1 n.a. n.a. 0.2 0.3 n.a. n.a. 2007/2014 2006/2013
Qatar n.a. n.a. n.a. n.a. n.a. n.a. n.a. n.a. 0.2 0.7 <0.1 0.1 n.a. <0.1 …/2012
Saudi Arabia 2.0 1.4 n.a. 0.3 n.a. 0.2 n.a. 3.7 6.3 2.5 3.4 n.a. n.a. …/2005
Syrian Arab Republic n.a. n.a. n.a. n.a. 0.7 n.a. 0.5 n.a. 1.6 2.7 1.5 1.6 0.1 n.a. 2006/… 2006/…
Turkey n.s. n.s. 0.1 1.0 0.6 0.6 0.7 10.3 15.5 5.7 6.5 0.3 0.4 2004/2013 2003/2014
United Arab Emirates 0.2 0.3 n.a. n.a. n.a. n.a. n.a. 0.8 2.2 0.2 0.5 n.a. n.a.
Yemen 6.2 7.7 3.4 0.6 1.9 1.8 0.2 0.1 0.9 1.5 2.8 4.8 0.1 0.1 2003/2013 2003/2013
Central Asia and Southern Asia
324.9 277.1 237.9 27.9 82.4 62.2 6.4 8.89 31.7 60.6 206.8 240.4 17.0 23.0
Eastern Asia and South-Eastern Asia
318.2 213.1 54.5 6.9 29.7 20.0 7.1 8.9 56.8 121.0 124.6 155.9 7.3 9.2
Western Asia and Northern Africa
31.3 43.2 53.0 3.3 9.5 9.4 3.6 5.1 44.4 72.2 34.8 42.3 2.3 3.5
LATIN AMERICA AND THE CARIBBEAN
50.9 40.7 n.a. 0.7 8.9 5.9 3.9 3.7 62.3 96.1 37.6 37.6 4.6 3.5
Caribbean 9.1 7.7 n.a. 0.19 0.3 0.29 0.2 0.29 3.5 5.4 3.4 3.4 0.2 0.2
Antigua and Barbuda <0.1 <0.1 n.a. n.a. n.a. n.a. n.a. n.a. <0.1 <0.1 <0.1 <0.1 n.a. n.a.
Bahamas <0.1 <0.1 n.a. n.a. n.a. n.a. n.a. n.a. 0.1 0.1 <0.1 <0.1 n.a. n.a.
Barbados <0.1 <0.1 n.a. <0.1 n.a. <0.1 n.a. <0.1 <0.1 0.1 <0.1 <0.1 n.a. n.a. …/2012
Cuba n.s. n.s. n.a. n.a. n.a. n.a. n.a. n.a. 1.6 2.3 0.8 0.7 <0.1 <0.1 2006/2014
Dominica <0.1 <0.1 n.a. n.a. n.a. n.a. n.a. n.a. <0.1 <0.1 <0.1 <0.1 n.a. n.a.
TABLE A1.2 (CONTINUED)
| 90 |
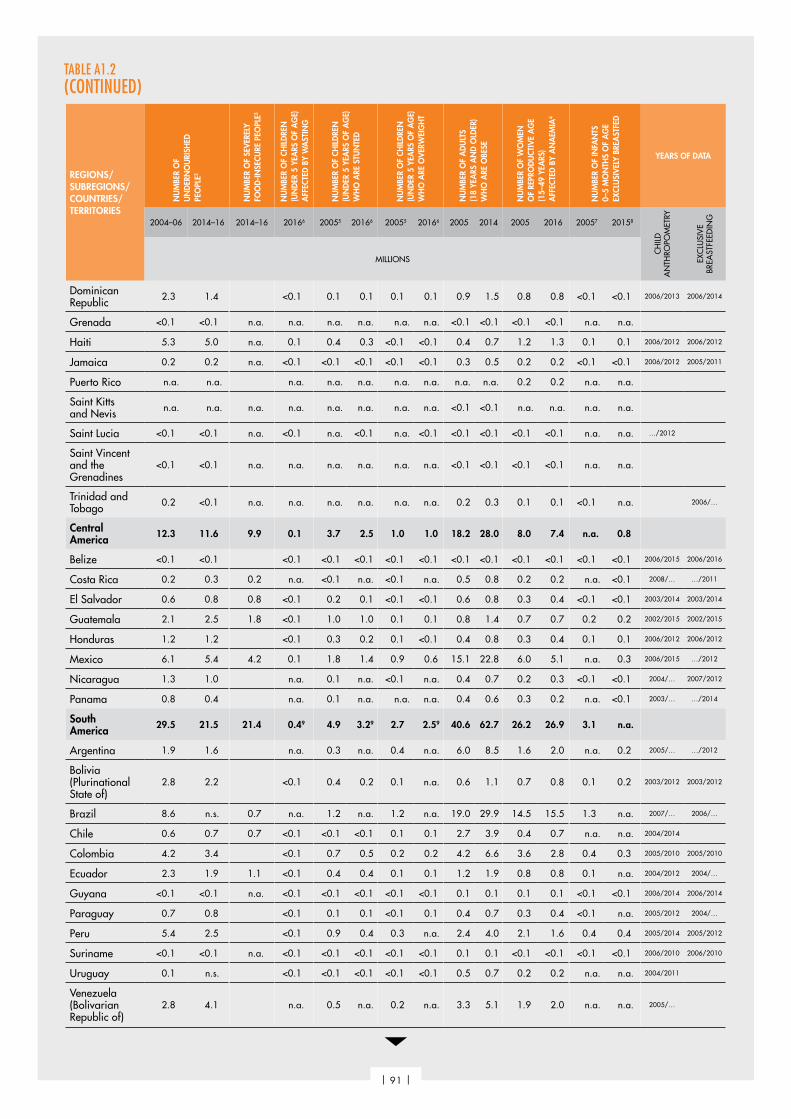
REGIONS/SUBREGIONS/COUNTRIES/TERRITORIES
NU
MBE
R O
F U
ND
ERN
OU
RISH
ED
PEO
PLE2
NU
MBE
R O
F SE
VER
ELY
FOO
D-IN
SECU
RE P
EOPL
E3
NU
MBE
R O
F CH
ILD
REN
(U
ND
ER 5
YEA
RS O
F A
GE)
A
FFEC
TED
BY
WA
STIN
G
NU
MBE
R O
F CH
ILD
REN
(U
ND
ER 5
YEA
RS O
F A
GE)
W
HO
ARE
STU
NTE
D
NU
MBE
R O
F CH
ILD
REN
(U
ND
ER 5
YEA
RS O
F A
GE)
W
HO
ARE
OV
ERW
EIG
HT
NU
MBE
R O
F A
DU
LTS
(18
YEA
RS A
ND
OLD
ER)
WH
O A
RE O
BESE
NU
MBE
R O
F W
OM
EN
OF
REPR
OD
UCT
IVE
AG
E (1
5–49
YEA
RS)
AFF
ECTE
D B
Y A
NA
EMIA
4
NU
MBE
R O
F IN
FAN
TS
0–5
MO
NTH
S O
F A
GE
EXCL
USI
VEL
Y BR
EAST
FED
YEARS OF DATA
2004–06 2014–16 2014–16 20166 20055 20166 20055 20166 2005 2014 2005 2016 20057 20158
CH
ILD
A
NTH
ROPO
MET
RY
EXC
LUSI
VE
BREA
STFE
EDIN
G
MILLIONS
Dominican Republic 2.3 1.4 <0.1 0.1 0.1 0.1 0.1 0.9 1.5 0.8 0.8 <0.1 <0.1 2006/2013 2006/2014
Grenada <0.1 <0.1 n.a. n.a. n.a. n.a. n.a. n.a. <0.1 <0.1 <0.1 <0.1 n.a. n.a.
Haiti 5.3 5.0 n.a. 0.1 0.4 0.3 <0.1 <0.1 0.4 0.7 1.2 1.3 0.1 0.1 2006/2012 2006/2012
Jamaica 0.2 0.2 n.a. <0.1 <0.1 <0.1 <0.1 <0.1 0.3 0.5 0.2 0.2 <0.1 <0.1 2006/2012 2005/2011
Puerto Rico n.a. n.a. n.a. n.a. n.a. n.a. n.a. n.a. n.a. 0.2 0.2 n.a. n.a.
Saint Kitts and Nevis n.a. n.a. n.a. n.a. n.a. n.a. n.a. n.a. <0.1 <0.1 n.a. n.a. n.a. n.a.
Saint Lucia <0.1 <0.1 n.a. <0.1 n.a. <0.1 n.a. <0.1 <0.1 <0.1 <0.1 <0.1 n.a. n.a. …/2012
Saint Vincent and the Grenadines
<0.1 <0.1 n.a. n.a. n.a. n.a. n.a. n.a. <0.1 <0.1 <0.1 <0.1 n.a. n.a.
Trinidad and Tobago 0.2 <0.1 n.a. n.a. n.a. n.a. n.a. n.a. 0.2 0.3 0.1 0.1 <0.1 n.a. 2006/…
Central America 12.3 11.6 9.9 0.1 3.7 2.5 1.0 1.0 18.2 28.0 8.0 7.4 n.a. 0.8
Belize <0.1 <0.1 <0.1 <0.1 <0.1 <0.1 <0.1 <0.1 <0.1 <0.1 <0.1 <0.1 <0.1 2006/2015 2006/2016
Costa Rica 0.2 0.3 0.2 n.a. <0.1 n.a. <0.1 n.a. 0.5 0.8 0.2 0.2 n.a. <0.1 2008/… …/2011
El Salvador 0.6 0.8 0.8 <0.1 0.2 0.1 <0.1 <0.1 0.6 0.8 0.3 0.4 <0.1 <0.1 2003/2014 2003/2014
Guatemala 2.1 2.5 1.8 <0.1 1.0 1.0 0.1 0.1 0.8 1.4 0.7 0.7 0.2 0.2 2002/2015 2002/2015
Honduras 1.2 1.2 <0.1 0.3 0.2 0.1 <0.1 0.4 0.8 0.3 0.4 0.1 0.1 2006/2012 2006/2012
Mexico 6.1 5.4 4.2 0.1 1.8 1.4 0.9 0.6 15.1 22.8 6.0 5.1 n.a. 0.3 2006/2015 …/2012
Nicaragua 1.3 1.0 n.a. 0.1 n.a. <0.1 n.a. 0.4 0.7 0.2 0.3 <0.1 <0.1 2004/… 2007/2012
Panama 0.8 0.4 n.a. 0.1 n.a. n.a. n.a. 0.4 0.6 0.3 0.2 n.a. <0.1 2003/… …/2014
South America 29.5 21.5 21.4 0.49 4.9 3.29 2.7 2.59 40.6 62.7 26.2 26.9 3.1 n.a.
Argentina 1.9 1.6 n.a. 0.3 n.a. 0.4 n.a. 6.0 8.5 1.6 2.0 n.a. 0.2 2005/… …/2012
Bolivia (Plurinational State of)
2.8 2.2 <0.1 0.4 0.2 0.1 n.a. 0.6 1.1 0.7 0.8 0.1 0.2 2003/2012 2003/2012
Brazil 8.6 n.s. 0.7 n.a. 1.2 n.a. 1.2 n.a. 19.0 29.9 14.5 15.5 1.3 n.a. 2007/… 2006/…
Chile 0.6 0.7 0.7 <0.1 <0.1 <0.1 0.1 0.1 2.7 3.9 0.4 0.7 n.a. n.a. 2004/2014
Colombia 4.2 3.4 <0.1 0.7 0.5 0.2 0.2 4.2 6.6 3.6 2.8 0.4 0.3 2005/2010 2005/2010
Ecuador 2.3 1.9 1.1 <0.1 0.4 0.4 0.1 0.1 1.2 1.9 0.8 0.8 0.1 n.a. 2004/2012 2004/…
Guyana <0.1 <0.1 n.a. <0.1 <0.1 <0.1 <0.1 <0.1 0.1 0.1 0.1 0.1 <0.1 <0.1 2006/2014 2006/2014
Paraguay 0.7 0.8 <0.1 0.1 0.1 <0.1 0.1 0.4 0.7 0.3 0.4 <0.1 n.a. 2005/2012 2004/…
Peru 5.4 2.5 <0.1 0.9 0.4 0.3 n.a. 2.4 4.0 2.1 1.6 0.4 0.4 2005/2014 2005/2012
Suriname <0.1 <0.1 n.a. <0.1 <0.1 <0.1 <0.1 <0.1 0.1 0.1 <0.1 <0.1 <0.1 <0.1 2006/2010 2006/2010
Uruguay 0.1 n.s. <0.1 <0.1 <0.1 <0.1 <0.1 0.5 0.7 0.2 0.2 n.a. n.a. 2004/2011
Venezuela (Bolivarian Republic of)
2.8 4.1 n.a. 0.5 n.a. 0.2 n.a. 3.3 5.1 1.9 2.0 n.a. n.a. 2005/…
TABLE A1.2 (CONTINUED)
| 91 |

REGIONS/SUBREGIONS/COUNTRIES/TERRITORIES
NU
MBE
R O
F U
ND
ERN
OU
RISH
ED
PEO
PLE2
NU
MBE
R O
F SE
VER
ELY
FOO
D-IN
SECU
RE P
EOPL
E3
NU
MBE
R O
F CH
ILD
REN
(U
ND
ER 5
YEA
RS O
F A
GE)
A
FFEC
TED
BY
WA
STIN
G
NU
MBE
R O
F CH
ILD
REN
(U
ND
ER 5
YEA
RS O
F A
GE)
W
HO
ARE
STU
NTE
D
NU
MBE
R O
F CH
ILD
REN
(U
ND
ER 5
YEA
RS O
F A
GE)
W
HO
ARE
OV
ERW
EIG
HT
NU
MBE
R O
F A
DU
LTS
(18
YEA
RS A
ND
OLD
ER)
WH
O A
RE O
BESE
NU
MBE
R O
F W
OM
EN
OF
REPR
OD
UCT
IVE
AG
E (1
5–49
YEA
RS)
AFF
ECTE
D B
Y A
NA
EMIA
4
NU
MBE
R O
F IN
FAN
TS
0–5
MO
NTH
S O
F A
GE
EXCL
USI
VEL
Y BR
EAST
FED
YEARS OF DATA
2004–06 2014–16 2014–16 20166 20055 20166 20055 20166 2005 2014 2005 2016 20057 20158
CH
ILD
A
NTH
ROPO
MET
RY
EXC
LUSI
VE
BREA
STFE
EDIN
G
MILLIONS
OCEANIA 1.8 2.5 n.a. n.a. n.a. n.a. n.a. n.a. 5.2 7.5 1.2 1.5 n.a. n.a.
Australia and New Zealand n.s. n.s. 0.8 n.a. n.a. n.a. n.a. n.a. 4.4 6.4 0.5 0.6 n.a. n.a.
Australia n.s. n.s. 0.7 n.a. <0.1 n.a. 0.1 n.a. 3.7 5.3 0.4 0.5 n.a. n.a. 2007/…
New Zealand n.s. n.s. n.a. n.a. n.a. n.a. n.a. 0.7 1.0 0.1 0.1 n.a. n.a.
Oceania excluding Australia and New Zealand
n.a. n.a. n.a. 0.1 0.5 0.5 0.1 0.1 0.7 1.1 0.7 0.9 n.a. n.a.
Melanesia n.a. n.a. n.a. n.a. n.a. n.a. n.a. n.a. 0.6 1.0 0.7 0.9 0.1 n.a.
Fiji <0.1 <0.1 n.a. n.a. <0.1 n.a. <0.1 n.a. 0.1 0.2 0.1 0.1 <0.1 n.a. 2004/… 2004/…
New Caledonia <0.1 <0.1 n.a. n.a. n.a. n.a. n.a. n.a. n.a. n.a. n.a. n.a. n.a. n.a.
Papua New Guinea n.a. n.a. n.a. 0.1 0.4 0.5 <0.1 0.1 0.4 0.7 0.5 0.7 0.1 n.a. 2005/2010 2006/…
Solomon Islands <0.1 <0.1 n.a. n.a. <0.1 n.a. <0.1 n.a. <0.1 <0.1 <0.1 0.1 <0.1 n.a. 2007/… 2007/…
Vanuatu <0.1 <0.1 n.a. <0.1 <0.1 <0.1 <0.1 <0.1 <0.1 <0.1 <0.1 <0.1 <0.1 <0.1 2007/2013 2007/2013
Micronesia n.a. n.a. n.a. n.a. n.a. n.a. n.a. n.a. 0.1 0.1 <0.1 <0.1 n.a. n.a.
Kiribati <0.1 <0.1 n.a. n.a. n.a. n.a. n.a. n.a. <0.1 <0.1 <0.1 <0.1 n.a. n.a.
Marshall Islands n.a. n.a. n.a. n.a. n.a. n.a. n.a. n.a. <0.1 <0.1 <0.1 <0.1 n.a. n.a. 2007/…
Micronesia (Federated States of)
n.a. n.a. n.a. n.a. n.a. n.a. n.a. n.a. <0.1 <0.1 <0.1 <0.1 n.a. n.a.
Nauru n.a. n.a. n.a. n.a. <0.1 n.a. n.a. n.a. <0.1 <0.1 n.a. n.a. n.a. n.a. 2007/… 2007/…
Palau n.a. n.a. n.a. n.a. n.a. n.a. n.a. n.a. <0.1 <0.1 n.a. n.a. n.a. n.a.
Polynesia <0.1 <0.1 n.a. n.a. n.a. n.a. n.a. n.a. 0.1 0.1 <0.1 <0.1 n.a. n.a.
American Samoa n.a. n.a. n.a. n.a. n.a. n.a. n.a. n.a. n.a. n.a. n.a. n.a. n.a. n.a.
Cook Islands n.a. n.a. n.a. n.a. n.a. n.a. n.a. n.a. <0.1 <0.1 n.a. n.a. n.a. n.a.
French Polynesia <0.1 <0.1 n.a. n.a. n.a. n.a. n.a. n.a. n.a. n.a. n.a. n.a. n.a. n.a.
Niue n.a. n.a. n.a. n.a. n.a. n.a. n.a. n.a. <0.1 <0.1 n.a. n.a. n.a. n.a.
Samoa <0.1 <0.1 n.a. n.a. n.a. n.a. n.a. n.a. <0.1 <0.1 <0.1 <0.1 n.a. n.a.
Tokelau (Associate Member)
n.a. n.a. n.a. n.a. n.a. n.a. n.a. n.a. n.a. n.a. n.a. n.a. n.a. n.a.
Tonga n.a. n.a. n.a. <0.1 n.a. <0.1 n.a. <0.1 <0.1 <0.1 <0.1 <0.1 n.a. <0.1 …/2012 …/2012
Tuvalu n.a. n.a. n.a. n.a. <0.1 n.a. <0.1 n.a. <0.1 <0.1 n.a. n.a. n.a. n.a. 2007/… 2007/…
NORTHERN AMERICA AND EUROPE
n.s. n.s. 15.2 n.a. n.a. n.a. n.a. n.a. 191.8 243.6 38.2 44.3 n.a. n.a.
Northern America n.s. n.s. 3.6 0.1 0.6 0.5 1.5 1.7 73.1 96.2 6.9 10.6 n.a. n.a.
TABLE A1.2 (CONTINUED)
| 92 |
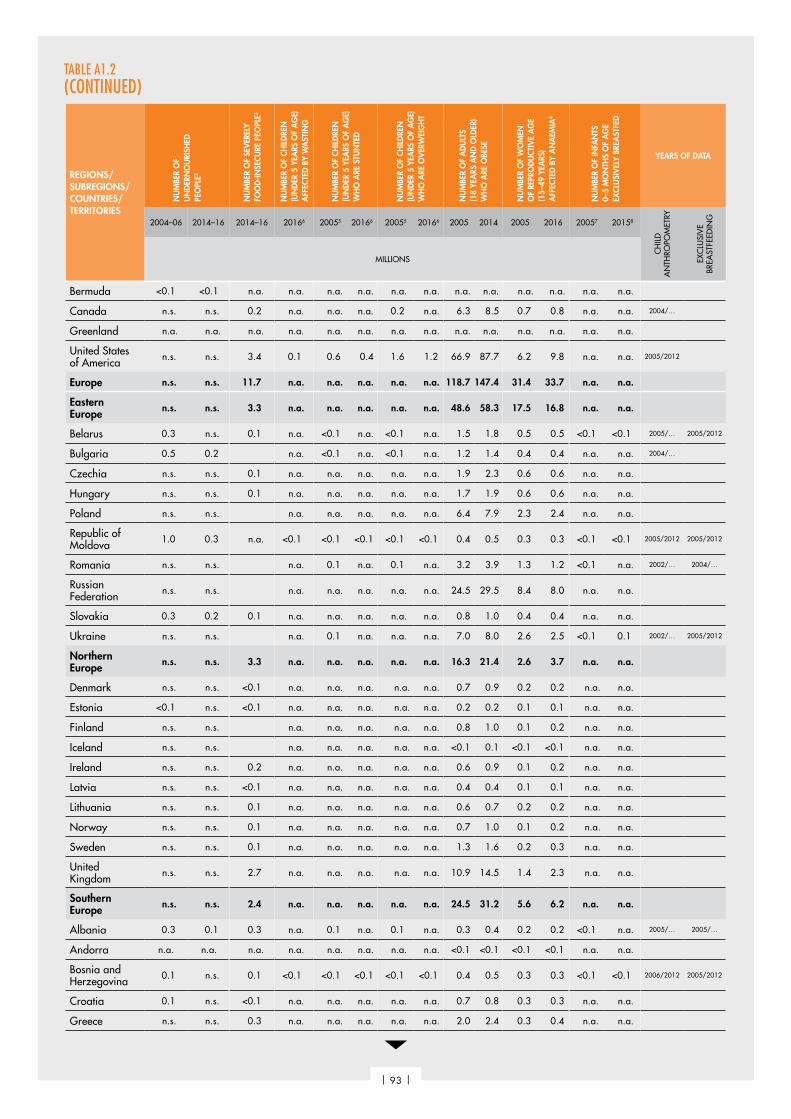
REGIONS/SUBREGIONS/COUNTRIES/TERRITORIES
NU
MBE
R O
F U
ND
ERN
OU
RISH
ED
PEO
PLE2
NU
MBE
R O
F SE
VER
ELY
FOO
D-IN
SECU
RE P
EOPL
E3
NU
MBE
R O
F CH
ILD
REN
(U
ND
ER 5
YEA
RS O
F A
GE)
A
FFEC
TED
BY
WA
STIN
G
NU
MBE
R O
F CH
ILD
REN
(U
ND
ER 5
YEA
RS O
F A
GE)
W
HO
ARE
STU
NTE
D
NU
MBE
R O
F CH
ILD
REN
(U
ND
ER 5
YEA
RS O
F A
GE)
W
HO
ARE
OV
ERW
EIG
HT
NU
MBE
R O
F A
DU
LTS
(18
YEA
RS A
ND
OLD
ER)
WH
O A
RE O
BESE
NU
MBE
R O
F W
OM
EN
OF
REPR
OD
UCT
IVE
AG
E (1
5–49
YEA
RS)
AFF
ECTE
D B
Y A
NA
EMIA
4
NU
MBE
R O
F IN
FAN
TS
0–5
MO
NTH
S O
F A
GE
EXCL
USI
VEL
Y BR
EAST
FED
YEARS OF DATA
2004–06 2014–16 2014–16 20166 20055 20166 20055 20166 2005 2014 2005 2016 20057 20158
CH
ILD
A
NTH
ROPO
MET
RY
EXC
LUSI
VE
BREA
STFE
EDIN
G
MILLIONS
Bermuda <0.1 <0.1 n.a. n.a. n.a. n.a. n.a. n.a. n.a. n.a. n.a. n.a. n.a. n.a.
Canada n.s. n.s. 0.2 n.a. n.a. n.a. 0.2 n.a. 6.3 8.5 0.7 0.8 n.a. n.a. 2004/…
Greenland n.a. n.a. n.a. n.a. n.a. n.a. n.a. n.a. n.a. n.a. n.a. n.a. n.a. n.a.
United States of America n.s. n.s. 3.4 0.1 0.6 0.4 1.6 1.2 66.9 87.7 6.2 9.8 n.a. n.a. 2005/2012
Europe n.s. n.s. 11.7 n.a. n.a. n.a. n.a. n.a. 118.7 147.4 31.4 33.7 n.a. n.a.
Eastern Europe n.s. n.s. 3.3 n.a. n.a. n.a. n.a. n.a. 48.6 58.3 17.5 16.8 n.a. n.a.
Belarus 0.3 n.s. 0.1 n.a. <0.1 n.a. <0.1 n.a. 1.5 1.8 0.5 0.5 <0.1 <0.1 2005/… 2005/2012
Bulgaria 0.5 0.2 n.a. <0.1 n.a. <0.1 n.a. 1.2 1.4 0.4 0.4 n.a. n.a. 2004/…
Czechia n.s. n.s. 0.1 n.a. n.a. n.a. n.a. n.a. 1.9 2.3 0.6 0.6 n.a. n.a.
Hungary n.s. n.s. 0.1 n.a. n.a. n.a. n.a. n.a. 1.7 1.9 0.6 0.6 n.a. n.a.
Poland n.s. n.s. n.a. n.a. n.a. n.a. n.a. 6.4 7.9 2.3 2.4 n.a. n.a.
Republic of Moldova 1.0 0.3 n.a. <0.1 <0.1 <0.1 <0.1 <0.1 0.4 0.5 0.3 0.3 <0.1 <0.1 2005/2012 2005/2012
Romania n.s. n.s. n.a. 0.1 n.a. 0.1 n.a. 3.2 3.9 1.3 1.2 <0.1 n.a. 2002/… 2004/…
Russian Federation n.s. n.s. n.a. n.a. n.a. n.a. n.a. 24.5 29.5 8.4 8.0 n.a. n.a.
Slovakia 0.3 0.2 0.1 n.a. n.a. n.a. n.a. n.a. 0.8 1.0 0.4 0.4 n.a. n.a.
Ukraine n.s. n.s. n.a. 0.1 n.a. n.a. n.a. 7.0 8.0 2.6 2.5 <0.1 0.1 2002/… 2005/2012
Northern Europe n.s. n.s. 3.3 n.a. n.a. n.a. n.a. n.a. 16.3 21.4 2.6 3.7 n.a. n.a.
Denmark n.s. n.s. <0.1 n.a. n.a. n.a. n.a. n.a. 0.7 0.9 0.2 0.2 n.a. n.a.
Estonia <0.1 n.s. <0.1 n.a. n.a. n.a. n.a. n.a. 0.2 0.2 0.1 0.1 n.a. n.a.
Finland n.s. n.s. n.a. n.a. n.a. n.a. n.a. 0.8 1.0 0.1 0.2 n.a. n.a.
Iceland n.s. n.s. n.a. n.a. n.a. n.a. n.a. <0.1 0.1 <0.1 <0.1 n.a. n.a.
Ireland n.s. n.s. 0.2 n.a. n.a. n.a. n.a. n.a. 0.6 0.9 0.1 0.2 n.a. n.a.
Latvia n.s. n.s. <0.1 n.a. n.a. n.a. n.a. n.a. 0.4 0.4 0.1 0.1 n.a. n.a.
Lithuania n.s. n.s. 0.1 n.a. n.a. n.a. n.a. n.a. 0.6 0.7 0.2 0.2 n.a. n.a.
Norway n.s. n.s. 0.1 n.a. n.a. n.a. n.a. n.a. 0.7 1.0 0.1 0.2 n.a. n.a.
Sweden n.s. n.s. 0.1 n.a. n.a. n.a. n.a. n.a. 1.3 1.6 0.2 0.3 n.a. n.a.
United Kingdom n.s. n.s. 2.7 n.a. n.a. n.a. n.a. n.a. 10.9 14.5 1.4 2.3 n.a. n.a.
Southern Europe n.s. n.s. 2.4 n.a. n.a. n.a. n.a. n.a. 24.5 31.2 5.6 6.2 n.a. n.a.
Albania 0.3 0.1 0.3 n.a. 0.1 n.a. 0.1 n.a. 0.3 0.4 0.2 0.2 <0.1 n.a. 2005/… 2005/…
Andorra n.a. n.a. n.a. n.a. n.a. n.a. n.a. n.a. <0.1 <0.1 <0.1 <0.1 n.a. n.a.
Bosnia and Herzegovina 0.1 n.s. 0.1 <0.1 <0.1 <0.1 <0.1 <0.1 0.4 0.5 0.3 0.3 <0.1 <0.1 2006/2012 2005/2012
Croatia 0.1 n.s. <0.1 n.a. n.a. n.a. n.a. n.a. 0.7 0.8 0.3 0.3 n.a. n.a.
Greece n.s. n.s. 0.3 n.a. n.a. n.a. n.a. n.a. 2.0 2.4 0.3 0.4 n.a. n.a.
TABLE A1.2 (CONTINUED)
| 93 |
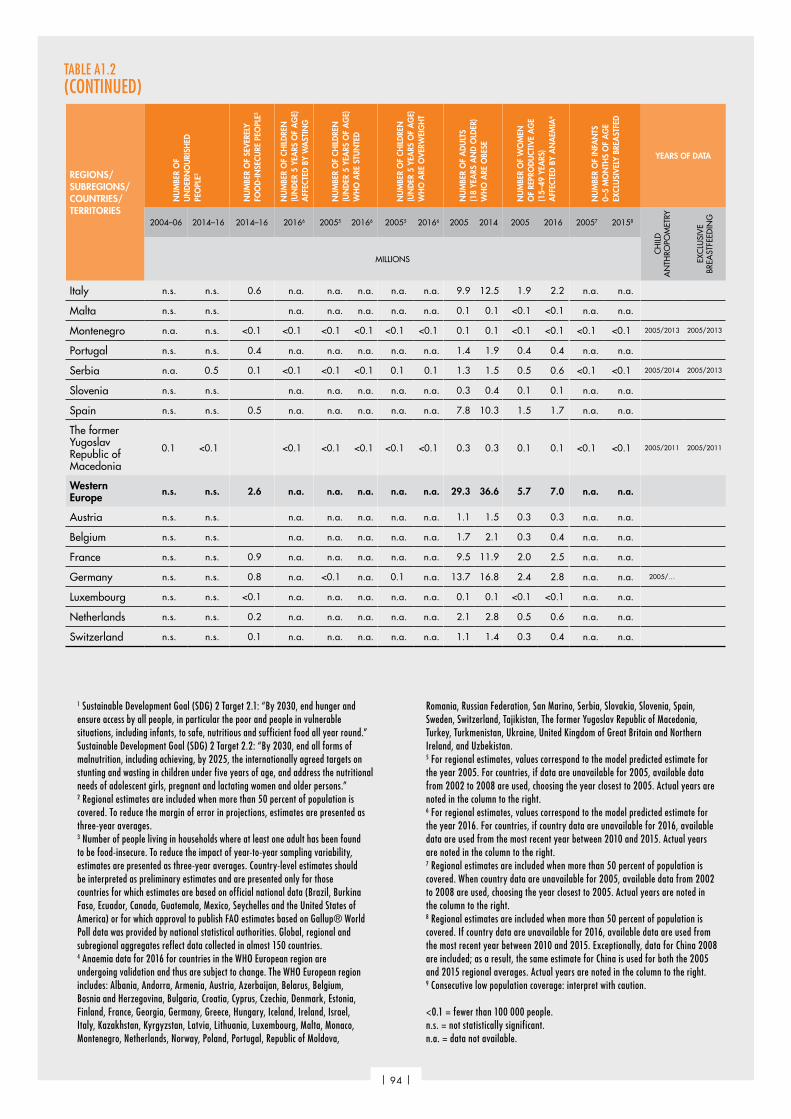
REGIONS/SUBREGIONS/COUNTRIES/TERRITORIES
NU
MBE
R O
F U
ND
ERN
OU
RISH
ED
PEO
PLE2
NU
MBE
R O
F SE
VER
ELY
FOO
D-IN
SECU
RE P
EOPL
E3
NU
MBE
R O
F CH
ILD
REN
(U
ND
ER 5
YEA
RS O
F A
GE)
A
FFEC
TED
BY
WA
STIN
G
NU
MBE
R O
F CH
ILD
REN
(U
ND
ER 5
YEA
RS O
F A
GE)
W
HO
ARE
STU
NTE
D
NU
MBE
R O
F CH
ILD
REN
(U
ND
ER 5
YEA
RS O
F A
GE)
W
HO
ARE
OV
ERW
EIG
HT
NU
MBE
R O
F A
DU
LTS
(18
YEA
RS A
ND
OLD
ER)
WH
O A
RE O
BESE
NU
MBE
R O
F W
OM
EN
OF
REPR
OD
UCT
IVE
AG
E (1
5–49
YEA
RS)
AFF
ECTE
D B
Y A
NA
EMIA
4
NU
MBE
R O
F IN
FAN
TS
0–5
MO
NTH
S O
F A
GE
EXCL
USI
VEL
Y BR
EAST
FED
YEARS OF DATA
2004–06 2014–16 2014–16 20166 20055 20166 20055 20166 2005 2014 2005 2016 20057 20158
CH
ILD
A
NTH
ROPO
MET
RY
EXC
LUSI
VE
BREA
STFE
EDIN
G
MILLIONS
Italy n.s. n.s. 0.6 n.a. n.a. n.a. n.a. n.a. 9.9 12.5 1.9 2.2 n.a. n.a.
Malta n.s. n.s. n.a. n.a. n.a. n.a. n.a. 0.1 0.1 <0.1 <0.1 n.a. n.a.
Montenegro n.a. n.s. <0.1 <0.1 <0.1 <0.1 <0.1 <0.1 0.1 0.1 <0.1 <0.1 <0.1 <0.1 2005/2013 2005/2013
Portugal n.s. n.s. 0.4 n.a. n.a. n.a. n.a. n.a. 1.4 1.9 0.4 0.4 n.a. n.a.
Serbia n.a. 0.5 0.1 <0.1 <0.1 <0.1 0.1 0.1 1.3 1.5 0.5 0.6 <0.1 <0.1 2005/2014 2005/2013
Slovenia n.s. n.s. n.a. n.a. n.a. n.a. n.a. 0.3 0.4 0.1 0.1 n.a. n.a.
Spain n.s. n.s. 0.5 n.a. n.a. n.a. n.a. n.a. 7.8 10.3 1.5 1.7 n.a. n.a.
The former Yugoslav Republic of Macedonia
0.1 <0.1 <0.1 <0.1 <0.1 <0.1 <0.1 0.3 0.3 0.1 0.1 <0.1 <0.1 2005/2011 2005/2011
Western Europe n.s. n.s. 2.6 n.a. n.a. n.a. n.a. n.a. 29.3 36.6 5.7 7.0 n.a. n.a.
Austria n.s. n.s. n.a. n.a. n.a. n.a. n.a. 1.1 1.5 0.3 0.3 n.a. n.a.
Belgium n.s. n.s. n.a. n.a. n.a. n.a. n.a. 1.7 2.1 0.3 0.4 n.a. n.a.
France n.s. n.s. 0.9 n.a. n.a. n.a. n.a. n.a. 9.5 11.9 2.0 2.5 n.a. n.a.
Germany n.s. n.s. 0.8 n.a. <0.1 n.a. 0.1 n.a. 13.7 16.8 2.4 2.8 n.a. n.a. 2005/…
Luxembourg n.s. n.s. <0.1 n.a. n.a. n.a. n.a. n.a. 0.1 0.1 <0.1 <0.1 n.a. n.a.
Netherlands n.s. n.s. 0.2 n.a. n.a. n.a. n.a. n.a. 2.1 2.8 0.5 0.6 n.a. n.a.
Switzerland n.s. n.s. 0.1 n.a. n.a. n.a. n.a. n.a. 1.1 1.4 0.3 0.4 n.a. n.a.
1 Sustainable Development Goal (SDG) 2 Target 2.1: “By 2030, end hunger and ensure access by all people, in particular the poor and people in vulnerable situations, including infants, to safe, nutritious and sufficient food all year round.” Sustainable Development Goal (SDG) 2 Target 2.2: “By 2030, end all forms of malnutrition, including achieving, by 2025, the internationally agreed targets on stunting and wasting in children under five years of age, and address the nutritional needs of adolescent girls, pregnant and lactating women and older persons.”2 Regional estimates are included when more than 50 percent of population is covered. To reduce the margin of error in projections, estimates are presented as three-year averages.3 Number of people living in households where at least one adult has been found to be food-insecure. To reduce the impact of year-to-year sampling variability, estimates are presented as three-year averages. Country-level estimates should be interpreted as preliminary estimates and are presented only for those countries for which estimates are based on official national data (Brazil, Burkina Faso, Ecuador, Canada, Guatemala, Mexico, Seychelles and the United States of America) or for which approval to publish FAO estimates based on Gallup® World Poll data was provided by national statistical authorities. Global, regional and subregional aggregates reflect data collected in almost 150 countries. 4 Anaemia data for 2016 for countries in the WHO European region are undergoing validation and thus are subject to change. The WHO European region includes: Albania, Andorra, Armenia, Austria, Azerbaijan, Belarus, Belgium, Bosnia and Herzegovina, Bulgaria, Croatia, Cyprus, Czechia, Denmark, Estonia, Finland, France, Georgia, Germany, Greece, Hungary, Iceland, Ireland, Israel, Italy, Kazakhstan, Kyrgyzstan, Latvia, Lithuania, Luxembourg, Malta, Monaco, Montenegro, Netherlands, Norway, Poland, Portugal, Republic of Moldova,
Romania, Russian Federation, San Marino, Serbia, Slovakia, Slovenia, Spain, Sweden, Switzerland, Tajikistan, The former Yugoslav Republic of Macedonia, Turkey, Turkmenistan, Ukraine, United Kingdom of Great Britain and Northern Ireland, and Uzbekistan.5 For regional estimates, values correspond to the model predicted estimate for the year 2005. For countries, if data are unavailable for 2005, available data from 2002 to 2008 are used, choosing the year closest to 2005. Actual years are noted in the column to the right.6 For regional estimates, values correspond to the model predicted estimate for the year 2016. For countries, if country data are unavailable for 2016, available data are used from the most recent year between 2010 and 2015. Actual years are noted in the column to the right.7 Regional estimates are included when more than 50 percent of population is covered. When country data are unavailable for 2005, available data from 2002 to 2008 are used, choosing the year closest to 2005. Actual years are noted in the column to the right.8 Regional estimates are included when more than 50 percent of population is covered. If country data are unavailable for 2016, available data are used from the most recent year between 2010 and 2015. Exceptionally, data for China 2008 are included; as a result, the same estimate for China is used for both the 2005 and 2015 regional averages. Actual years are noted in the column to the right.9 Consecutive low population coverage: interpret with caution.
<0.1 = fewer than 100 000 people.n.s. = not statistically significant.n.a. = data not available.
TABLE A1.2 (CONTINUED)
| 94 |
THE STATE OF FOOD SECURITY AND NUTRITION IN THE WORLD 2017
METHODOLOGICAL NOTESUNDERNOURISHMENTDefinition: Undernourishment is defined as the condition in which an individual’s habitual food consumption is insufficient to provide the amount of dietary energy required to maintain a normal, active, healthy life.
How it is reported: The indicator is reported as the prevalence of undernourishment (PoU), which is an estimate of the proportion of the population that has been in a condition of undernourishment over the reference period (usually one year).
Methodology: To compute an estimate of the prevalence of undernourishment in a population, a probability distribution of habitual daily dietary energy intake levels (expressed in kcal) for an average individual is modelled through a parametric probability density function (pdf), f(x). Once the pdf has been characterized, the indicator is obtained as the cumulative probability that daily habitual dietary energy intakes (x) are below minimum dietary energy requirements (MDER) (i.e. below the lowest acceptable range in the distribution of energy requirements) for a representative average individual, as in the formula below:
PoU = ∫x<MDER f(x|DEC; CV; Skew)dx
where DEC (mean dietary energy consumption), CV (coefficient of variation, which reflects the spread of the distribution, or inequality in access to food) and Skew (skewness, which determines the asymmetry in the distribution) characterize the distribution of habitual dietary energy consumption levels in the population (see www.fao.org/3/a-i4046e.pdf for a detailed description).
Data source: Different data sources can be used to estimate the different parameters of the model.
Dietary energy consumption (DEC). The mean of the distribution of DEC levels for the average individual in a population corresponds to the average daily per capita food consumption level
in the population. DEC can be estimated from data on food consumption obtained through surveys that are representative of the population. DEC can also be estimated from accounts of the total supply and utilization of all food commodities in a given country, where the contribution of each commodity to the availability of food for human consumption is expressed through its dietary energy content and the total divided by the size of the population. The major source of data on national food balances are the Food Balance Sheets (FBS) maintained by FAO for most countries in the world (see www.fao.org/economic/ess/fbs/en/).
The coefficient of variation (CV) and skewness (Skew). The most common sources of data to estimate CV and Skew are multipurpose household surveys, such as Living Standard Measurement Surveys or Household Incomes and Expenditure Surveys (Household Budget Surveys), which also collect information on food consumption.
Minimum dietary energy requirement (MDER). Human energy requirements are computed by multiplying normative requirements for basic metabolic rate (BMR, expressed per kilogram of body mass) by the ideal weight of a healthy person of given height, and then multiplied by a coefficient of physical activ ity level. Ranges of normal energy requirements are thus computed for each sex and age group of the population. The MDER for a given population group, including for the national population, is obtained as the weighted average of the minimums of the energy requirement ranges for each sex and age, using the population size in each group as weights.
PoU projections for 2016: The PoU estimates for 2016 were obtained by projecting each of the model’s parameters and applying the formula above to the projected parameters. While each country’s PoU value for 2016 was projected separately, only the aggregate subregional, regional and global values are reported in order to limit the impact of possible projection bias.
Projection of the DEC. The latest available data from national food balance sheets for most countries refer to a year between 2013 and 2015. To estimate a value of DEC for up to 2016, data on
| 95 |

the per capita availability of major commodities – cereals, meats, oilseeds, and sugar, available from the Trade and Market Division (EST) of FAO,1 is used to estimate the likely rates of change in total food availability from 2013, 2014 or 2015 (depending on the country) to 2016. Such rates of change are then applied to the latest available DEC values to project them up to 2016.
Projection of the CV. Estimates of the CV are obtained from analysing food consumption data collected in household surveys. For years in between survey periods, the CV values are interpolated. Results of the analysis of the Food Insecurity Experience Scale data collected in 2014, 2015 and 2016 have been used to estimate the likely changes in the CV during those years and applied to the latest available estimate based on survey data.
Projection of the MDER. The MDER is computed using the United Nations Population Division data on total population and population structure, the median height in each sex and age group of the population, and other international reference statistics. As a result, the projected MDER is based on the projected UNPD data (2015 revision) and on the most updated information on the median height derived from demographic and health surveys.
Challenges and limitations: While the state of being undernourished applies to individuals, due to conceptual and data-related considerations, the indicator can only refer to a population or group of individuals. The prevalence of undernourishment is thus an estimate of the percentage of individuals in a group that are in that condition; it is not based on identif ication of which individuals in the population are undernourished.
Due to the probabilistic nature of the inference and the margins of uncertainty associated with estimates of each of the parameters in the model, the precision of the PoU estimates is generally low. While it is not possible to calculate margins of error around PoU estimates, these would
likely exceed 5 percent in most cases. For this reason, FAO does not consider national level PoU estimates lower than 2.5 percent as sufficiently reliable to be reported.
References:
1. FAO. 1996. The Sixth World Food Survey. Appendix 3. Rome. (also available at www.fao.org/docrep/012/w0931e/w0931e16.pdf).
2. L. Naiken. 2003. Keynote paper: FAO methodology for estimating the prevalence of undernourishment. In: FAO. Proceedings Measurement and Assessment of Food Deprivation and Undernutrition International Scientific Symposium, Rome, 26–28 June 2002. Rome. (also available at www.fao.org/docrep/005/Y4249E/y4249e06.htm).
3. C. Cafiero. 2014. Advances in hunger measurement: traditional FAO methods and recent innovations. ESS Working Paper No. 14-04. Rome, FAO. (also available at www.fao.org/3/ a-i4060e.pdf).
4. N. Wanner, C. Cafiero, N. Troubat and P. Conforti. 2014. Refinements to the FAO methodology for estimating the prevalence of undernourishment indicator. ESS Working Paper No. 14-05. Rome, FAO. (also available at www.fao.org/3/a-i4046e.p).
FOOD INSECURITY AS MEASURED BY THE FOOD INSECURITY EXPERIENCE SCALE (FIES)Definition: Food insecurity as measured by this indicator refers to limited access to food, at the level of individuals or households, due to lack of money or other resources. The severity of food insecurity is measured using the Food Insecurity Experience Scale (FIES), a global measurement standard established by FAO.
How it is reported: In this report, FAO provides two different estimates of severe food insecurity (FIsev):
1 The EST division has developed and maintained a commodity balance database (XCBS) that provides with elementary information for analysis of the food situation of a country or a group of countries. The XCBS provides balance sheet structured data for the major commodities in the following groups: cereals, dairy, meat, oil-bearing crops,
sugar, tropical beverages, bananas and citrus. The data from the XCBS is used in a number of FAO publications and associated databases such as the Global Information and Early Warning System (GIEWS), food outlook and crop prospects and food situation. XCBS provides with up to date information on agriculture markets.
METHODOLOGICAL NOTES
| 96 |

THE STATE OF FOOD SECURITY AND NUTRITION IN THE WORLD 2017
� the prevalence (%) of individuals in the population liv ing in households where at least one adult was found to be severely food insecure
� the estimated number of individuals in the population living in households where at least one adult was found to be severely food insecure
Data source: Since 2014, the 8-question FIES survey module has been applied in nationally representative samples of the adult population (defined as aged 15 or older) in more than 140 countries included in the Gallup® World Poll (GWP), covering 90 percent of the world population. In most countries, samples include about 1 000 individuals, with larger samples of 3 000 individuals in India and 5 000 in mainland China.
For Canada, Brazil, Burkina Faso, Ecuador, Guatemala, Mexico, Seychelles and the United States of America, national government survey data were used to calculate the prevalence estimates of food insecurity by applying FAO’s statistical methods to adjust national results to the same global reference standard.
Methodology: The data were validated and used to construct a scale of food-insecurity severity using the Rasch model, which postulates that the probability of observing an affirmative answer by respondent i to question j is a logistic function of the distance, on an underlying scale of severity, between the position of the respondent, ai, and that of the item, bj.
By applying the Rasch model to the FIES data, it is possible to estimate the probability of being severely food insecure (psev) for each respondent, with 0 ≤ psev ≤ 1.
The prevalence of food insecurity at severe levels (FIsev) in the population is computed as the weighted sum of the probability of being severely food insecure for all respondents (i) in a sample:
FIsev = ∑pi,sevwi
where wi are post-stratif ication weights that indicate the proportion of individuals or households in the national population represented by each element in the sample.
Prob(Xi,j = Yes) = exp(ai – bj)
1 + exp(ai – bj)
As only adults are sampled in the GWP, the prevalence estimates directly produced from this data refer to the population 15 years and older. In order to arrive at the prevalence and number of individuals (of all ages) in the population, an estimate is required of the number of people liv ing in households where at least one adult is food insecure. This involves a multistep procedure detailed in Annex II of the Voices of the Hungry Technical Report (see link below).
Regional and global aggregates of FIsev are computed as:
where r indicates the region and FI c is the value of FI estimated for country c in the region and Nc is the corresponding population size. Missing values for individual countries are imputed to be equal to the population-weighted average of the estimated values of the countries in the same region.
Universal thresholds are defined on the FIES global standard scale (a set of item parameter values based on results from all countries covered by the GWP in 2014–16) and converted into corresponding values on local scales. The process of calibrating each country’s scale against the FIES global standard can be referred to as equating, and permits the production of internationally comparable measures of food insecurity severity for individual respondents, as well as comparable national prevalence rates.
Challenges and limitations: When food-insecurity prevalence estimates are based on FIES data collected in the GWP, with national sample sizes of about 1 000 in most countries, confidence intervals rarely exceed 20 percent of the measured prevalence (that is, prevalence rates of about 50 percent have margins of error of plus or minus 5 percent). Confidence intervals are likely to be much smaller, however, when national prevalence rates are estimated using larger samples and for estimates referring to subregional and regional aggregates of countries. To reduce the impact of year-to-year sampling variability, country-level estimates are presented as three-year averages.
FI r = ∑c FI c × Nc
∑c Nc
| 97 |
METHODOLOGICAL NOTES
References:
1. FAO. 2017. Voices of the Hungry. In: FAO [online]. [Cited 24 July 2017]. www.fao.org/in-action/Voices-of-the-Hungry/
2. FAO. 2016. Methods for estimating comparable rates of food insecurity experienced by adults throughout the world. Rome. (also available at www.fao.org/3/a-i4830e.pdf).
STUNTING, WASTING AND OVERWEIGHT IN CHILDREN UNDER FIVE YEARS OF AGE
Definition of stunting: Height (cm) for age (months) < –2 SD of the WHO Child Growth Standards median. Stunting is the result of long-term nutritional deprivation and may affect mental development, school performance and intellectual capacity. The percentage of children with low height for age reflects the cumulative effects of undernutrition and infections since and even before birth.
How stunting is reported: The national prevalence of stunting is the percentage of children aged 0–59 months who are below –2 standard deviation (SD) from the median height for age of the WHO Child Growth Standards.
Definition of wasting: Weight (kg) for height (cm) < –2 SD of the WHO Child Growth Standards median. Low weight for height is an indicator of acute weight loss and ref lects nutritional imbalance, usually as a consequence of insufficient food intake and/or infectious diseases.
How wasting is reported: Wasting is the percentage of children aged 0–59 months who are below –2 SD from the median weight-for-height of the WHO Child Growth Standards.
Definition of childhood overweight: Weight (kg) for height (cm) > +2 SD of the WHO Child Growth Standards median. Overweight is an indicator of excessive weight for height and generally reflects an imbalance between food intake and energy expenditure.
How childhood overweight is reported: Child overweight is the percentage of children aged 0–59 months who are over +2 SD from the median weight for height of the WHO Child Growth Standards.
Data source: UNICEF, WHO and World Bank Group. 2017. Joint child malnutrition estimates – Levels and trends (2017 edition) [online]. WHO. [Cited 24 July 2017]. uni.cf/jme ; www.who.int/nutgrowthdb/estimates2016/en/ ; http://datatopics.worldbank.org/child-malnutrition/
Methodology: Nationally representative household surveys (MICS, DHS national nutrition surveys, etc.) and nutrition surveillance systems are the preferred primary data sources for child nutrition indicators. For entry in the database, they must be nationally representative, population-based surveys with a sample size of at least 400 children and present results based on WHO standards, or provide access to the raw data, enabling re-analysis.
A weighted analysis was carried out to account for the different country populations and ensure that the inf luence in the regional trend analysis of countries’ survey estimates was proportional to their population. The population weights were derived from the UN Population Prospects, revision 2015. For each data point, the respective under-five population estimate for the specific survey year was obtained. If a survey was performed over an extended period, for example, November 2013 to April 2014, the year in which most of the fieldwork was completed (in this case 2014) was used as the year from which to choose the respective population estimate. Weights of countries with single data points were derived by dividing the under-five population at the time of the survey by the sum of the countries’ mean population in the whole region. For countries with multiple data points, the weights were calculated by dividing the mean of the country’s under-five population (over the observed years) by the sum of the countries’ mean population in the whole region.
A linear mixed-effect model was applied for each region or income group, using the logistic transformation of prevalence. The final models were then used to project the trend of malnutrition in children from 2000 to 2016. Using the resulting prevalence estimates (after back-transformation), the total numbers affected were calculated by multiplying the prevalence and lower and upper limits of the CI
| 98 |
THE STATE OF FOOD SECURITY AND NUTRITION IN THE WORLD 2017
by the subregional population derived from the UN population estimates.
Variables: region, subregion, country, survey year, prevalence of stunting, prevalence of overweight, prevalence of wasting, country population of children under f ive years of age.
Challenges and limitations: The recommended periodicity of reporting on stunting, overweight and wasting is every three to f ive years; however, for some countries data are available less frequently. While every effort has been made to maximize the comparability of statistics across countries and over time, country data may differ in terms of data collection methods, population coverage and estimation methods used. Survey estimates come with levels of uncertainty due to both sampling errors and non-sampling errors (technical measurement errors, recording errors, etc.). Neither of the two sources of error has been fully taken into account for deriving estimates at country or regional and global levels.
For the prevalence of wasting, as surveys are generally carried out during a specific period of the year, the estimates can be affected by seasonality. Seasonal factors related to wasting include food availability (e.g. pre-harvest periods) and disease (rainy season and diarrhoea, malaria, etc.), while natural disasters and conf licts can also show real shifts in trends that would need to be treated differently than a seasonal variation. Hence, country-year estimates for wasting may not necessarily be comparable over time. Consequently, only the most recent estimates are provided.
References: 1. UNICEF, WHO and World Bank Group. 2017.
Joint child malnutrition estimates – Levels and trends (2017 edition) [online]. WHO. [Cited 24 July 2017]. uni.cf/jme ; www.who.int/nutgrowthdb/estimates2016/en/ ; http://datatopics.worldbank.org/child-malnutrition/
2. WHO. 2014. Comprehensive Implementation Plan on Maternal, Infant and Young Child Nutrition. Geneva, Switzerland. (available at http://apps.who.int/iris/bitstream/10665/ 113048/1/WHO_NMH_NHD_14.1_eng.pdf).
3. WHO. 2010. Nutrition Landscape Information System, Country Profile Indicators Interpretation guide. Geneva, Switzerland. (available at http://apps.who.int/iris/bitstream/10665/44397/1/ 9789241599955_eng.pdf).
EXCLUSIVE BREASTFEEDINGDefinition: Exclusive breastfeeding children < 6 months of age. Exclusive breastfeeding is a cornerstone of child survival and is the best feeding for newborns, as breast milk shapes the baby’s microbiome, strengthens the immune system, and reduces the risk of developing chronic diseases.
Breastfeeding also benefits mothers by preventing postpartum haemorrhage and promoting uterine involution, decreasing the risk of iron-deficiency anaemia, reducing the risk of various types of cancer and providing psychological benefits.
How it is reported: Percentage of infants aged 0–5 months who are fed exclusively on breast milk with no additional food or drink, not even water.
Data source: UNICEF Infant and Young Child Feeding Database, available as of July 2016 at: https://data.unicef.org/topic/nutrition/infant-and-young-child-feeding/
Methodology:
Infants 0–5 months of age who received only breastmilk during the previous day
Infants 0–5 months of age
This indicator includes breastfeeding by a wet nurse and feeding by expressed breastmilk.
The indicator is based on recall of the previous day’s feeding to a cross-section of infants 0–5 months of age.
Regional and global averages were calculated as a weighted average of the prevalence of exclusive breastfeeding in each country, using the total number of births from the World Population Prospects, 2015 revision (2005 and 2015 respectively) as weights. Estimates are presented only where the available data are representative of at least 50 percent of corresponding regions’
| 99 |

METHODOLOGICAL NOTES
population, unless otherwise noted. For 2005 data, where country data were unavailable, data from 2002 to 2008 were used, choosing the closest year to 2005. For 2016, where country data were unavailable, available data were used from the most recent year between 2010 and 2015. Exceptionally, the same estimate for China 2008 was used for both the 2005 and 2015 regional averages.
Challenges and limitations: While a high proportion of countries collect data for exclusive breastfeeding, data are lacking in high-income countries in particular. The recommended periodicity of reporting on exclusive breastfeeding is every three to f ive years. However, for some countries, data are reported less frequently, meaning changes in feeding patterns are often not detected for several years after the change occurs.
Regional and global averages may be affected depending on which countries had data available for the periods considered in this report.
Using the previous day’s feeding as a basis may cause the proportion of exclusively breastfed infants to be overestimated, as some given other liquids irregularly may not have received these the day before the survey.
References: 1. UNICEF. 2016. From the first hour of life:
making the case for improved infant and young child feeding everywhere. New York, USA. (available at https://data.unicef.org/wp-content/uploads/2016/10/From-the-first-hour-of-life-1.pdf).
2. WHO. 2014. Comprehensive Implementation Plan on Maternal, Infant and Young Child Nutrition. Geneva, Switzerland. (available at http://apps.who.int/iris/itstream/10665/113048/ 1/WHO_NMH_NHD_14.1_eng.pdf).
3. WHO. 2010. Nutrition Landscape Information System, Country Profile Indicators Interpretation guide. Geneva, Switzerland. (available at http://apps.who.int/iris/bitstream/10665/44397/1/ 9789241599955_eng.pdf).
4. WHO. 2008. Indicators for assessing infant and young child feeding practices, Part 1: Definitions. Geneva, Switzerland. (available at www.unicef.org/nutrition/files/IYCF_updated_indicators_2008_part_1_definitions.pdf).
ADULT OBESITYDefinition: BMI ≥ 30.0 kg/m2. The body–mass index (BMI) is the ratio of weight to height commonly used to classify the nutritional status of adults. It is calculated as the body weight in kilograms divided by the square of the body height in metres (kg/m2). Obesity includes individuals with a BMI equal to or higher than 30 kg/m2.
How it is reported: Percentage of the population over 18 years of age with BMI ≥ 30.0 kg/m2
standardized by age and weighted by sex.
Data source: WHO/NCD-RisC and WHO Global Health Observatory Data Repository. Available at: http://apps.who.int/gho/data/node.main.A900A?lang=en. (1 698 population-based studies with more than 19.2 million participants aged 18 years or older, measured in 186 countries).
Methodology: A Bayesian hierarchical model was applied to selected population-based studies that had measured height and weight in adults aged 18 years and older, to estimate trends from 1975 to 2014 in mean BMI and in the prevalence of BMI categories (underweight, overweight and obesity). The model incorporated non-linear time trends and age patterns; national versus subnational and community representativeness; and whether data covered both rural and urban areas versus only one of them. The model also included covariates that help predict BMI, including national income, proportion of the population liv ing in urban areas, mean number of years of education, and summary measures of availability of different food types for human consumption.
Challenges and limitations: Some countr ies had few data sources and only 42 percent of sources inc luded had repor ted data for people over 70 years of age.
| 100 |

THE STATE OF FOOD SECURITY AND NUTRITION IN THE WORLD 2017
References: 1. NCD-Risk Factor Collaboration. 2016.
Trends in adult body-mass index in 200 countries from 1975 to 2014: a pooled analysis of 1698 population-based measurement studies with 19.2 million participants. The Lancet, 387(10026): 1377–1396. (available at www.thelancet.com/pdfs/journals/lancet/PIIS0140-6736(16)30054-X.pdf).
2. WHO. 2010. Nutrition Landscape Information System, Country Profile Indicators Interpretation guide. Geneva, Switzerland. (available at http://apps.who.int/iris/bitstream/10665/44397/ 1/9789241599955_eng.pdf).
ANAEMIA IN WOMEN OF REPRODUCTIVE AGE
Definition: [Haemoglobin] < 110 g/litre for pregnant women; [Haemoglobin] < 120 g/litre for non-pregnant women. Anaemia is defined as a haemoglobin concentration below a specified cut-off point, which can change according to the age, sex, physiological status, smoking habits and altitude at which the population being assessed lives.
How it is reported: Percentage of women of reproductive age (15–49 years old) with haemoglobin concentration below 110 g/litre for pregnant women and below 120 g/litre for non-pregnant women.
Data source: WHO, Global Health Observatory, 2017.
Methodology: National representative surveys, summary statistics from WHO’s Vitamin and Mineral Nutrition Information Systems, and summary statistics reported by other national and international agencies.
Data for non-pregnant and pregnant women were summed and weighted by the prevalence of pregnancy to generate one value for all women of reproductive age. Data were adjusted by altitude and, when available, smoking status.
Trends were modelled over time as a linear trend plus a smooth nonlinear trend, at national, regional and global levels. The model used a weighted average of various bell-shaped densities
to estimate full haemoglobin distributions, which might themselves be skewed.
The estimates are also informed by covariates that help predict haemoglobin concentrations, including maternal education, proportion of the population in urban areas, mean latitude, prevalence of sickle-cell disorders and thalassaemia and mean BMI. All covariates were available for every country and year, except the prevalence of sickle-cell disorders and thalassaemia, which was assumed as constant over time during the analysis period for each country.
Challenges and limitations: Despite a high proportion of countries having nationally representative survey data available for anaemia, there is still a lack of reporting on this indicator, especially in high-income countries. As a result, estimates may not capture the full variation across countries and regions, tending to shrink towards global means when data are sparse.
References:
1. G.A. Stevens, M.M. Finucane, L.M. De-Regil, C.J. Paciorek, S.R. Flaxman, F. Branca, J.P. Peña-Rosas, Z.A. Bhutta and M. Ezzati. 2013. Nutrition Impact Model Study Group (Anaemia). Global, regional, and national trends in haemoglobin concentration and prevalence of total and severe anaemia in children and pregnant and non-pregnant women for 1995–2011: a systematic analysis of population-representative data. Lancet Global Health 1(1): e16–25. (available at www.ncbi.nlm.nih.gov/pmc/articles/PMC4547326/?report=printable).
2. WHO. 2014. Comprehensive Implementation Plan on Maternal, Infant and Young Child Nutrition. Geneva, Switzerland. (available at http://apps.who.int/iris/bitstream/10665/ 113048/1/WHO_NMH_NHD_14.1_eng.pdf).
3. WHO. 2010. Nutrition Landscape Information System, Country Profile Indicators Interpretation guide. Geneva, Switzerland. (available at http://apps.who.int/iris/bitstream/10665/44397/1/ 9789241599955_eng.pdf).
| 101 |

ANNEX 2
DEFINITIONS AND LISTS OF COUNTRY GROUPSA. Countries with a protracted crisis
SOFI 2010 defines protracted crisis situations as “characterized by recurrent natural disasters and/or conf lict, longevity of food crises, breakdown of livelihoods and insufficient institutional capacity to react to the crises.” There are three criteria used to define a country with a protracted crisis: (i) longevity of the crisis; (ii) humanitarian aid f low to the country; and (iii) the country’s economic and food security status.
Specifically, the list of countries identif ied in situations of protracted crisis includes those that meet the following three criteria:
1. The country is among the Low-Income Food-Deficit Countries (LIFDC), as defined by FAO in 2015.
2. The country has faced a shock – either natural or human-induced – for four consecutive years between 2013 and 2016, or for eight out of ten years between 2007 and 2016, and is reported in the list of countries requiring external assistance for food (source: FAO Global Information and Early Warning System (GIEWS).
3. The country received more than ten percent of total ODA in the form of humanitarian assistance between 2006 and 2014 (source: Development Initiatives: http://devinit.org).
In 2017, there are 19 countries that meet the above criteria of protracted crisis (see Table A2.1, column A, below). Although not part of the definition or criteria for selection, out of the 19 countries with a protracted crisis, all have experienced some form of conf lict of varied type, duration and intensity between 1996 and 2015 (see Table A2.2 below). However, there are 13 countries that have experienced conf lict resulting in a high level of battle deaths and that therefore meet both the criteria of protracted crisis and countries affected by conf lict (see definition and criteria in B below), these are referred to as countries with a protracted crisis affected by conf lict (see Table A2.2, column C, below).
B. Countries affected by conflictDefined as low- and middle-income countries and territories affected by conf lict for at least one sub-period of f ive consecutive years and having suffered 500 or more battle deaths during that sub-period. The timeframe spans from 1996 to 2015, with four periods of f ive years: 1996–2000; 2001–2005; 2006–2010; 2011–2015. Table A2.3 below presents the number of sub-periods where these criteria are met, by country. The Uppsala Conflict Data Program (UCDP) dataset is used to establish battle deaths and country lists (see http://ucdp.uu.se/). There are 45 low- and middle-income countries and one territory (total 46) that meet these criteria. For a complete list, see Table A2.1, column B, below.
| 102 |
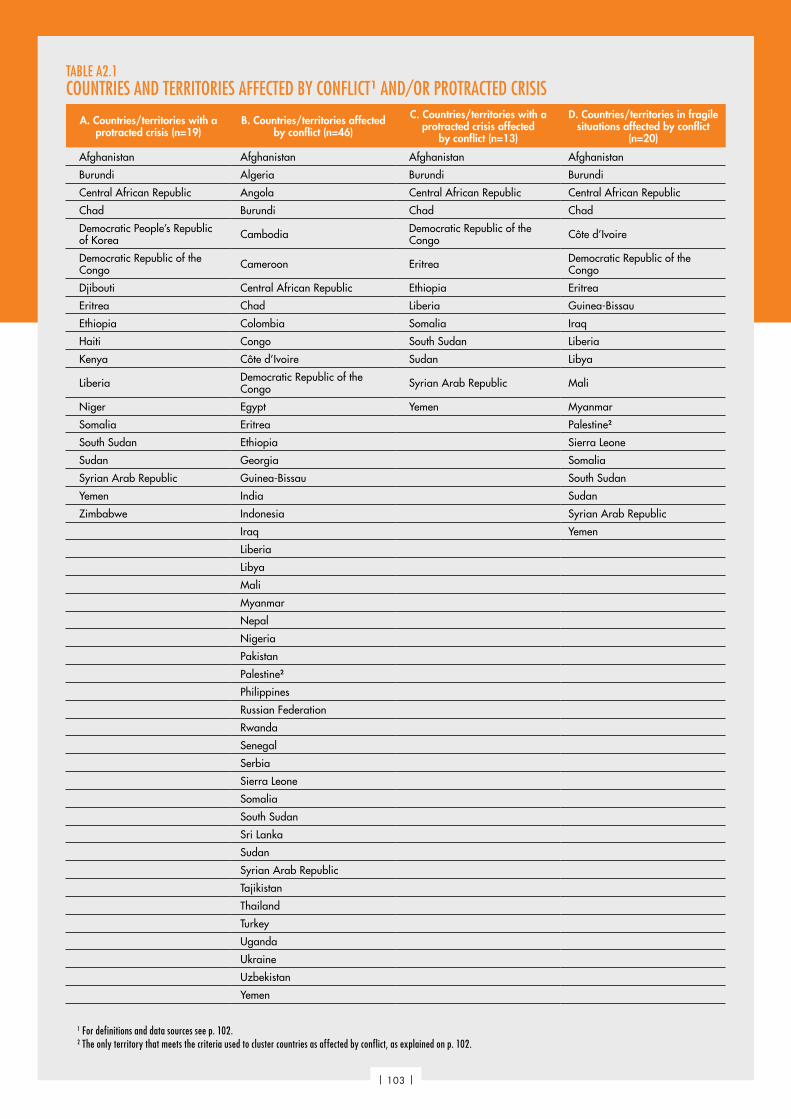
TABLE A2.1COUNTRIES AND TERRITORIES AFFECTED BY CONFLICT1 AND/OR PROTRACTED CRISIS
A. Countries/territories with a protracted crisis (n=19)
B. Countries/territories affected by conflict (n=46)
C. Countries/territories with a protracted crisis affected
by conflict (n=13)
D. Countries/territories in fragile situations affected by conflict
(n=20)
Afghanistan Afghanistan Afghanistan Afghanistan
Burundi Algeria Burundi Burundi
Central African Republic Angola Central African Republic Central African Republic
Chad Burundi Chad Chad
Democratic People’s Republic of Korea Cambodia Democratic Republic of the
Congo Côte d’Ivoire
Democratic Republic of the Congo Cameroon Eritrea Democratic Republic of the
Congo
Djibouti Central African Republic Ethiopia Eritrea
Eritrea Chad Liberia Guinea-Bissau
Ethiopia Colombia Somalia Iraq
Haiti Congo South Sudan Liberia
Kenya Côte d’Ivoire Sudan Libya
Liberia Democratic Republic of the Congo Syrian Arab Republic Mali
Niger Egypt Yemen Myanmar
Somalia Eritrea Palestine2
South Sudan Ethiopia Sierra Leone
Sudan Georgia Somalia
Syrian Arab Republic Guinea-Bissau South Sudan
Yemen India Sudan
Zimbabwe Indonesia Syrian Arab Republic
Iraq Yemen
Liberia
Libya
Mali
Myanmar
Nepal
Nigeria
Pakistan
Palestine2
Philippines
Russian Federation
Rwanda
Senegal
Serbia
Sierra Leone
Somalia
South Sudan
Sri Lanka
Sudan
Syrian Arab Republic
Tajikistan
Thailand
Turkey
Uganda
Ukraine
Uzbekistan
Yemen
1 For definitions and data sources see p. 102. 2 The only territory that meets the criteria used to cluster countries as affected by conflict, as explained on p. 102.
| 103 |
ANNEX 2
C. Countries in fragile situationsThis report uses the World Bank Group’s 2017 Harmonized List of Fragile Situations, unless specified that another definition of the state of fragility is being used. The World Bank methodology on “Fragile situations” includes countries or territories that meet three criteria: (i) a harmonized CPIA – i.e. Country Policy and Institutional Assessment – rating of 3.2 or less; and/or (ii) the presence of a UN and/or regional peacekeeping or political/peacebuilding mission during the last three years; and (iii) the list includes only IDA eligible countries and non-member or inactive territories/countries without CPIA data. The list excludes IBRD
countries (for which the CPIA scores are not publicly disclosed) unless there is the presence of a peacekeeping or political/peacebuilding mission, in which case the country will be included on the harmonized list with the exclusion of its CPIA score. In 2017, the Harmonized List of Fragile Situations registers 34 countries and 1 territory. For a list of these countries see http://pubdocs.worldbank.org/en/154851467143896227/FY17HLFS-Final-6272016.pdf. The 20 countries that are on both the Harmonized List of Fragile Situations and that meet the conf lict-affected criteria as defined in B above are referred to as countries in fragile situations affected by conf lict. For a list of these countries, see Table A2.1, column D, above.
| 104 |
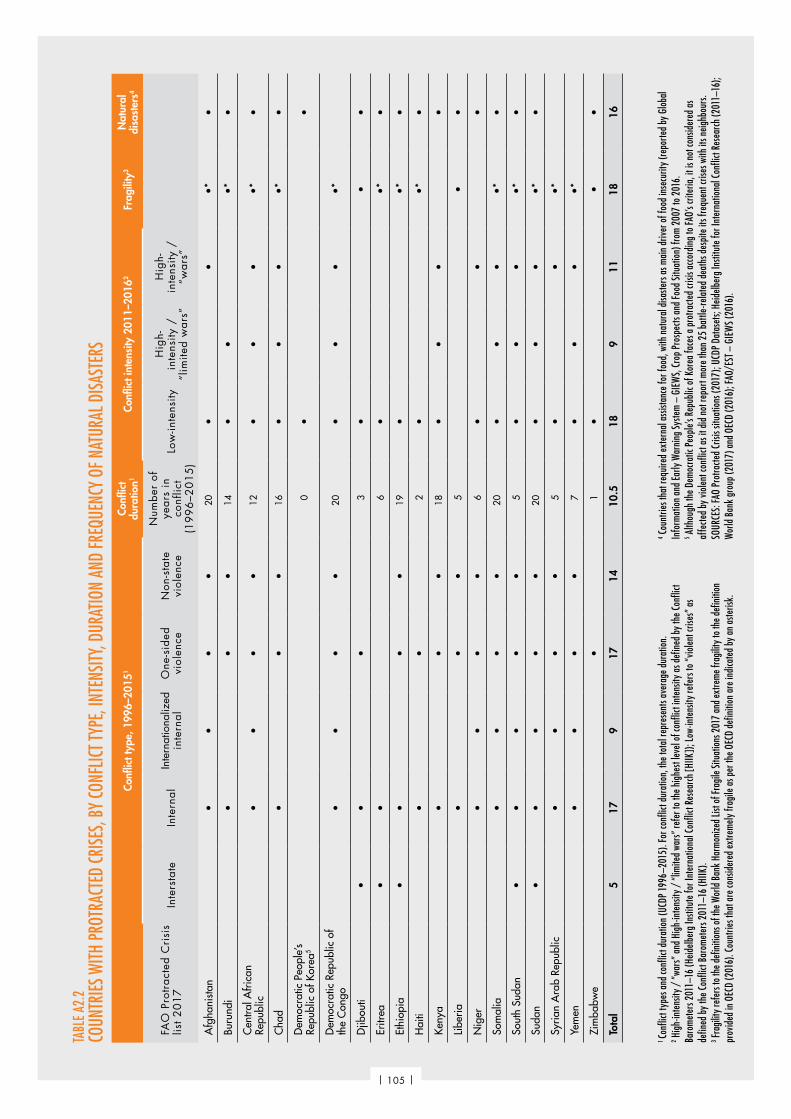
TABL
E A2.
2CO
UNTR
IES W
ITH P
ROTR
ACTE
D CR
ISES,
BY CO
NFLIC
T TYP
E, IN
TENS
ITY, D
URAT
ION
AND
FREQ
UENC
Y OF
NAT
URAL
DISA
STER
S
Co
nflic
t typ
e, 1
996–
2015
1Co
nflic
t du
ratio
n1Co
nflic
t int
ensi
ty 2
011–
2016
2Fr
agili
ty3
Nat
ural
di
sast
ers4
FAO
Pro
trac
ted
Cri
sis
list 2
01
7In
ters
tate
Inte
rnal
Inte
rnat
iona
lized
in
tern
alO
ne-s
ided
vi
olen
ceN
on-s
tate
vi
olen
ce
Num
ber
of
year
s in
co
nflic
t (1
99
6–2
01
5)
Low
-inte
nsity
Hig
h-
inte
nsity
/
“lim
ited
war
s”
Hig
h-
inte
nsity
/
“war
s”
Afg
hani
stan
••
••
20•
••*
•
Buru
ndi
••
•14
••
•*•
Cen
tral A
fric
an
Repu
blic
••
••
12•
••
•*•
Cha
d•
••
16•
••
•*•
Dem
ocra
tic P
eopl
e’s
Repu
blic
of K
orea
50
••
Dem
ocra
tic R
epub
lic o
f th
e C
ongo
••
••
20•
••
•*
Djib
outi
••
•3
••
•
Eritr
ea•
•6
••*
•
Ethi
opia
••
••
19•
•*•
Hai
ti•
•2
••*
•
Keny
a•
••
18•
••
•
Libe
ria•
••
5•
•
Nig
er•
••
•6
••
•
Som
alia
••
••
20•
••
•*•
Sout
h Su
dan
••
••
•5
••
••*
•
Suda
n•
••
••
20•
••
•*•
Syria
n A
rab
Repu
blic
••
••
5•
••*
Yem
en•
••
•7
••
••*
Zim
babw
e•
1•
••
Tota
l 5
179
1714
10.5
189
1118
16
1 Co
nflic
t typ
es a
nd co
nflic
t dur
atio
n (U
CDP
1996
–201
5). F
or co
nflic
t dur
atio
n, th
e tot
al re
pres
ents
aver
age d
urat
ion.
2 Hig
h-in
tens
ity /
”war
s” a
nd H
igh-
inte
nsity
/ “l
imite
d wa
rs” r
efer
to th
e hig
hest
level
of co
nflic
t int
ensit
y as
def
ined
by
the C
onfli
ct Ba
rom
eter
s 201
1–16
(Heid
elber
g In
stitu
te fo
r Int
erna
tiona
l Con
flict
Rese
arch
[HIIK
]); L
ow-in
tens
ity re
fers
to “v
iolen
t cris
es” a
s de
fined
by
the C
onfli
ct Ba
rom
eter
s 201
1–16
(HIIK
).3 Fr
agili
ty re
fers
to th
e def
initi
ons o
f the
Wor
ld Ba
nk H
arm
onize
d Lis
t of F
ragi
le Sit
uatio
ns 2
017
and
extre
me f
ragi
lity t
o the
def
initi
on
prov
ided
in O
ECD
(201
6). C
ount
ries t
hat a
re co
nsid
ered
extre
mel
y fra
gile
as p
er th
e OEC
D de
finiti
on a
re in
dica
ted
by a
n as
teris
k.
4 Cou
ntrie
s tha
t req
uire
d ex
tern
al a
ssist
ance
for f
ood,
with
nat
ural
disa
sters
as m
ain
drive
r of f
ood
inse
curit
y (re
porte
d by
Glo
bal
Info
rmat
ion
and
Early
War
ning
Syste
m –
GIE
WS,
Crop
Pro
spec
ts an
d Fo
od S
ituat
ion)
from
200
7 to
201
6.5 A
lthou
gh th
e Dem
ocra
tic P
eopl
e’s R
epub
lic o
f Kor
ea fa
ces a
pro
tracte
d cri
sis a
ccor
ding
to FA
O’s c
riter
ia, i
t is n
ot co
nsid
ered
as
affe
cted
by v
iolen
t con
flict
as it
did
not
repo
rt m
ore t
han
25 b
attle
-rela
ted
deat
hs d
espi
te it
s fre
quen
t cris
es w
ith it
s neig
hbou
rs.
SOUR
CES:
FAO
Prot
racte
d Cr
isis s
ituat
ions
(201
7); U
CDP
Data
sets;
Heid
elber
g In
stitu
te fo
r Int
erna
tiona
l Con
flict
Rese
arch
(201
1–16
); W
orld
Ban
k gr
oup
(201
7) a
nd O
ECD
(201
6); F
AO/E
ST –
GIE
WS (
2016
).
| 105 |
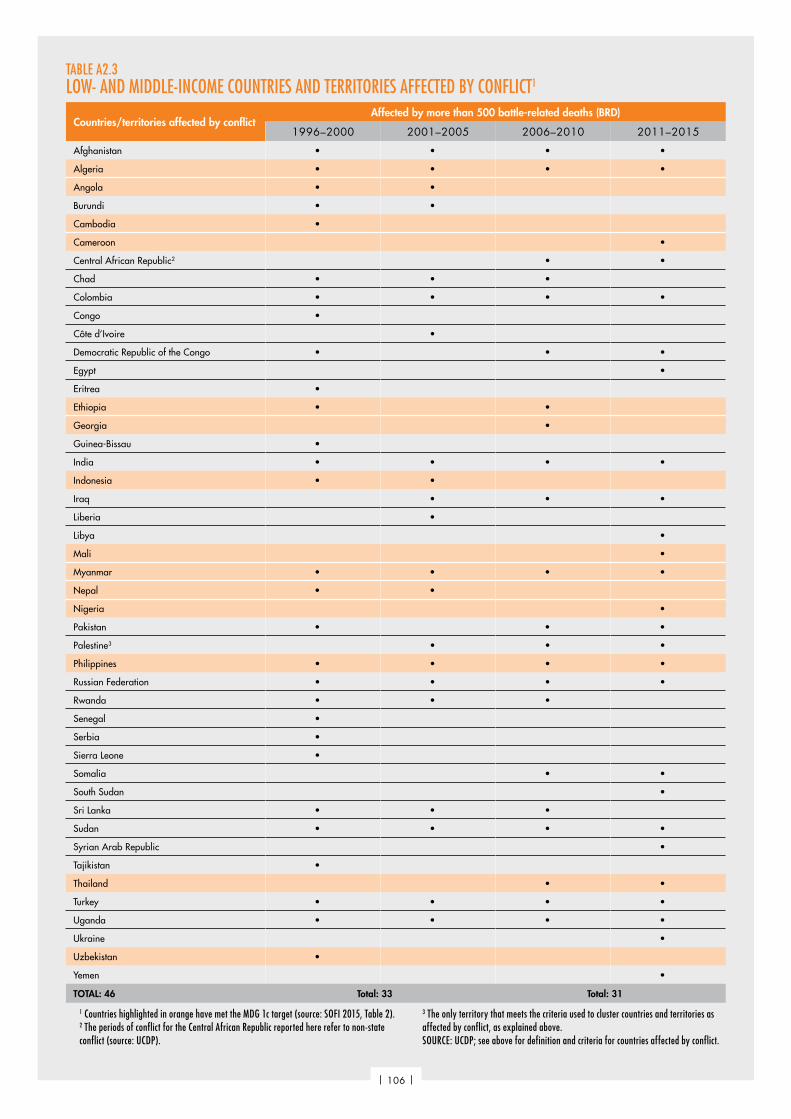
TABLE A2.3LOW- AND MIDDLE-INCOME COUNTRIES AND TERRITORIES AFFECTED BY CONFLICT1
Countries/territories affected by conflictAffected by more than 500 battle-related deaths (BRD)
1996–2000 2001–2005 2006–2010 2011–2015
Afghanistan • • • •
Algeria • • • •
Angola • •
Burundi • •
Cambodia •
Cameroon •
Central African Republic2 • •
Chad • • •
Colombia • • • •
Congo •
Côte d’Ivoire •
Democratic Republic of the Congo • • •
Egypt •
Eritrea •
Ethiopia • •
Georgia •
Guinea-Bissau •
India • • • •
Indonesia • •
Iraq • • •
Liberia •
Libya •
Mali •
Myanmar • • • •
Nepal • •
Nigeria •
Pakistan • • •
Palestine3 • • •
Philippines • • • •
Russian Federation • • • •
Rwanda • • •
Senegal •
Serbia •
Sierra Leone •
Somalia • •
South Sudan •
Sri Lanka • • •
Sudan • • • •
Syrian Arab Republic •
Tajikistan •
Thailand • •
Turkey • • • •
Uganda • • • •
Ukraine •
Uzbekistan •
Yemen •
TOTAL: 46 Total: 33 Total: 31
1 Countries highlighted in orange have met the MDG 1c target (source: SOFI 2015, Table 2). 2 The periods of conflict for the Central African Republic reported here refer to non-state conflict (source: UCDP).
3 The only territory that meets the criteria used to cluster countries and territories as affected by conflict, as explained above.SOURCE: UCDP; see above for definition and criteria for countries affected by conflict.
| 106 |

ANNEX 3GLOSSARY Anthropometry. Use of human body measurements to obtain information about nutritional status.
Body mass index (BMI). The ratio of weight for height, measured as the weight in kilograms divided by the square of height in metres.
Conflict. Conflict as used in this report is defined as struggles between interdependent groups that have either actual or perceived incompatibilities with respect to needs, values, goals, resources or intentions. This definition includes (but is broader than) armed conf lict – that is organized collective violent confrontations between at least two groups, either state or non-state actors. This report focuses on conf licts that threaten or entail v iolence or destruction, including where fragility raises the risk of damaging conf licts and where protracted crises persist.
Conflict sensitivity. Conflict sensitivity means to study the profile, causes, actors and dynamics of conflict and the interaction between these and the proposed intervention. In the context of sustaining peace, this means maximizing positive impacts toward peace while minimizing negative impacts, including potentially creating so-called future hazards.
Dietary energy intake. The energy content of food consumed.
Dietary energy supply (DES). Food available for human consumption, expressed in kilocalories per person per day (kcal/person/day). At country level, it is calculated as the food remaining for human use after deduction of all non-food utilizations (i.e. food = production + imports + stock withdrawals − exports − industrial use − animal feed – seed – wastage − additions to stock). Wastage includes loss of usable products
occurring along distribution chains from farmgate (or port of import) up to retail level.
Food insecurity. A situation that exists when people lack secure access to sufficient amounts of safe and nutritious food for normal growth and development and an active and healthy life. It may be caused by unavailability of food, insufficient purchasing power, inappropriate distribution or inadequate use of food at the household level. Food insecurity, poor conditions of health and sanitation and inappropriate care and feeding practices are the major causes of poor nutritional status. Food insecurity may be chronic, seasonal or transitory.
Food security. A situation that exists when all people, at all t imes, have physical, social and economic access to sufficient, safe and nutritious food that meets their dietary needs and food preferences for an active and healthy life. Based on this definition, four food security dimensions can be identif ied: food availability, economic and physical access to food, food utilization and stability over time.
Fragility. Fragility is defined as the combination of exposure to risk and insufficient coping capacities of the state, system and/or communities to manage, absorb or mitigate those risks. The new OECD fragility framework is built on five dimensions of fragility – economic, environmental, political, societal, and security – and measures each through the accumulation and combination of risks and capacity. See OECD. 2016. States of Fragility 2016: Understanding Violence. Paris. Available at www.oecd.org/dac/states-of-fragility-2016-9789264267213-en.htm
Hunger. In this report, the term hunger is synonymous with chronic undernourishment.
| 107 |
ANNEX 3
Kilocalorie (kcal). A unit of measurement of energy. One kilocalorie equals 1 000 calories. In the International System of Units (SI), the universal unit of energy is the joule ( J). One kilocalorie =4.184 kilojoules (kJ).
Macronutrients. Here refers to the proteins, carbohydrates and fats available to be used for energy; measured in grams.
Malnutrition. An abnormal physiological condition caused by inadequate, unbalanced or excessive consumption of macronutrients and/or micronutrients. Malnutrition includes undernutrition and overnutrition as well as micronutrient deficiencies.
Micronutrients. Vitamins, minerals and other substances that are required by the body in small amounts; measured in milligrams or micrograms.
Nutrition security. A situation that exists when secure access to an appropriately nutritious diet is coupled with a sanitary environment, adequate health services and care, in order to ensure a healthy and active life for all household members. Nutrition security differs from food security in that it also considers the aspects of adequate caring practices, health and hygiene in addition to dietary adequacy.
Nutrition-sensitive intervention. Interventions designed to address the underlying determinants of nutrition (which include household food security, care for mothers and children and primary health-care services and sanitation) but not necessarily having nutrition as the predominant goal.
Nutritional status. The physiological state of an individual that results from the relationship between nutrient intake and requirements and from the body’s ability to digest, absorb and use these nutrients.
Overnutrition. A result of excessive food intake relative to dietary nutrient requirements.
Overweight and obesity. Body weight that is above normal for height as a result of an excessive accumulation of fat. It is usually a manifestation of expending fewer calories than are consumed.
In adults, overweight is defined as a BMI of more than 25 but less than 30, and obesity as a BMI of 30 or more. In children under f ive years of age, overweight is defined weight-for-height greater than 2 standard deviations above the WHO Child Growth Standards median, and obesity as weight-for-height greater than 3 standard deviations above the WHO Child Growth Standards median.
Stunting. Low height for age, ref lecting a past episode or episodes of sustained undernutrition. In children under f ive years of age, stunting is defined height-for-age less than –2 standard deviations below the WHO Child Growth Standards median.
Undernourishment. A state, lasting for at least one year, of inability to acquire enough food, defined as a level of food intake insufficient to meet dietary energy requirements. For the purposes of this report, hunger was defined as being synonymous with chronic undernourishment.
Undernutrition. The outcome of poor nutritional intake in terms of quantity and/or quality and/or poor absorption and/or poor biological use of nutrients consumed as a result of repeated disease. It includes being underweight for one’s age, too short for one’s age (stunted), dangerously thin for one’s height (wasted) and deficient in vitamins and minerals (micronutrient malnutrition).
Underweight. In adults, underweight is defined as a BMI of less than 18.5, ref lecting a current condition resulting from inadequate food intake, past episodes of undernutrition or poor health conditions. In children under f ive years of age, underweight is defined as weight-for-age less than –2 standard deviations below the WHO Child Growth Standards median, and is thus a manifestation of low height for age and/or low weight for height.
Wasting. Low weight for height, generally the result of weight loss associated with a recent period of inadequate caloric intake and/or disease. In children under f ive years of age, wasting is defined as weight-for-height less than –2 standard deviations below the WHO Child Growth Standards median.
| 108 |

NOTES
1 Estimates are based on data collected through the Gallup® World Poll, except for countries where experience-based food-insecurity data are available from population surveys conducted by national institutions: Brazil, Burkina Faso, Canada, Ecuador, Guatemala, Mexico, Seychelles and the United States of America. FAO promotes the inclusion of the FIES survey module in national surveys to gradually phase out data collection through the Gallup® World Poll.
2 The number of people affected by food insecurity includes all those living in households where one adult has experienced, at times during the year, food insecurity as detected by the FIES questions. This is consistent with the definition according to which food security exists when “all people at all times have […] access to food […]” and includes cases where food insecurity might have been of a transitory nature. See Glossary, p. 107.
3 World Health Organization. 2014. Global targets 2025. To improve maternal, infant and young child nutrition (available at www.who.int/nutrition/topics/nutrition_globaltargets2025/en/).
4 Resolution WHA65.6. World Health Assembly resolution 65.6, Comprehensive implementation plan on maternal, infant and young child nutrition. WHA65.6 (26 May 2012).
5 McKinsey Global Institute. 2014. Overcoming obesity: An initial economic analysis. Discussion paper. November 2014.
6 WHO. 2013. Global Action Plan for the Prevention and Control of Noncommunicable Diseases 2013-2020. Geneva, Switzerland.
7 Global Burden of Disease Study 2013 Collaborators. 2015. Global, regional, and national incidence, prevalence, and years lived with disability for 301 acute and chronic diseases and injuries in 188 countries, 1990-2013: a systematic analysis for the Global Burden of Disease Study 2013. The Lancet, 386(9995): 743–800.
8 G.A. Stevens, M.M. Finucane, L.M. De-Regil, C.J. Paciorek, S.R. Flaxman, F. Branca, J.P. Peña-Rosas, Z.A. Bhutta and M. Ezzati. 2013. Global, regional, and national trends in haemoglobin concentration and prevalence of total and severe anaemia in children and pregnant and non-pregnant women for 1995–2011: a systematic analysis of population-representative data. Lancet Global Health, 1(1): E16–E25; L. Alcázar. 2013. The economic impact of anaemia in Peru. Lima, Group for the Analysis of Development and Action Against Hunger; S. Horton
and C. Levin. 2001. Commentary on “evidence that iron deficiency anemia causes reduced work capacity”. The Journal of Nutrition, 131: 691S–696S; and S. Horton and J. Ross. 2003. The economics of iron deficiency. Food Policy, 28: 51–75.
9 W. Schultink. 2015. Why nutrition and breastfeeding are crucial to sustainable development. In: UNICEF Connect [online]. New York, USA. [Cited 19 June 2017]. https://blogs.unicef.org/blog/why-nutrition-and- breastfeeding-are-crucial-to-sustainable-development/
10 G. Jones, R.W. Steketee, R.E. Black, Z.A. Bhutta, S.S. Morris and the Bellagio Child Survival Study Group. 2003. How many child deaths can we prevent this year? The Lancet, 362(9377): 65–71.
11 C.G. Victora, R. Bahl, A.J.D. Barros, G.V.A. França, S. Horton, J. Krasevec, S. Murch, M.J. Sankar, N. Walker and N.C. Rollins. 2016. Breastfeeding in the 21st century: epidemiology, mechanisms, and lifelong effects. The Lancet, 387(10017): 475–490.
12 See B.L. Horta, C. Loret de Mola and C.G. Victora. 2015. Long-term consequences of breastfeeding on cholesterol, obesity, systolic blood pressure and type 2 diabetes: as systematic review and meta-analysis. Acta Paediatrica, 104(467): 30–37. In addition, some studies estimate that the economic losses from suboptimal breastfeeding, operating through loss of IQ and productivity could, amount to as much as US$302 billion per year. For more details, see N.C. Rollins, N. Bhandari, N. Hajeebhoy, S. Horton, C. Lutter, J.C. Martines, E.G. Piwoz, L.M. Richter and C.G. Victora. 2016. Why invest, and what it will take to improve breastfeeding practices? The Lancet, 387(10017): 491–504.
13 Country coverage to calculate the global average differs between the years of observation. Hence, the two estimates are not strictly comparable. However, they are considered to be sufficiently comparable to be indicative of the trend.
14 H. Ghattas. 2014. Food security and nutrition in the context of the nutrition transition. Technical Paper. Rome, FAO. [Cited 1 July 2017]. www.fao.org/economic/ess/ess-fs/voices/en/; and B.A. Laraia. 2013. Food insecurity and chronic disease. Advances in Nutrition, 4: 203–212.
15 A threshold was used of a prevalence of at least 10 percent on any of the malnutrition indicators.
16 Correlations among other health and nutrition indicators were also examined, but the results are not presented here as they lack either a conceptual basis or statistical significance.
| 109 |
NOTES
17 While there is a large body of academic literature exploring the food security–nutrition nexus, most of the analyses are based on ad hoc, small-sample surveys. There is a need for more large-scale population surveys that integrate household- or individual-level food security and nutrition indicators.
18 B. Franklin, A. Jones, D. Love, S. Puckett, J. Macklin and S. White-Means. 2012. Exploring mediators of food insecurity and obesity: a review of recent literature. Journal of Community Health, 37(1): 253–264; C. Burns. 2004. A review of the literature describing the link between poverty, food insecurity and obesity with specific reference to Australia. Melbourne, Australia, Victorian Health Promotion Foundation; E.J. Adams, L. Grummer-Strawn and G. Chavez. 2003. Food insecurity is associated with increased risk of obesity in California women. The Journal of Nutrition, 133(4): 1070–1074; L.M. Dinour, D. Bergen and M.C. Yeh. 2007. The food insecurity- obesity paradox: a review of the literature and the role food stamps may play. Journal of the American Dietetic Association, 107(11): 1952–1961; and Ghattas (2014) (see note 14).
19 See Food Security Information Network (FSIN). 2017. Global Report on Food Crises 2017 (available at www.fao.org/3/a-br323e.pdf). The reported food insecurity crisis-level population estimates are derived from a selection of countries and/or population groups that faced a high severity and magnitude of acute food insecurity in the period from January to December 2016. The key information source is the Integrated Food Security Phase Classification (IPC)/Cadre Harmonisé (CH), which considers: countries with any segment of the population in IPC/CH Phase 4 Emergency or Phase 5 Catastrophe; countries with at least 1 million people in IPC/CH Phase 3 Crisis; and countries for which an Inter-Agency Standing Committee (IASC) Humanitarian System-Wide Emergency Response was declared. These numbers represent emergency-level food insecurity that requires immediate humanitarian action. They differ from the prevalence of undernourishment estimates presented in previous sections, which are more globally comprehensive and measure chronic food deprivation.
20 Office of the United Nations High Commissioner for Refugees (UNHCR). 2017. Syria Regional Refugee Response. Inter-agency Information Sharing Portal. In: Regional Overview [online]. Geneva, Switzerland. [Cited on 27 June 2017]. http://data.unhcr.org/syrianrefugees/regional.php
21 K. von Grebmer, J. Bernstein, A. de Waal, N. Prasai, S. Yin and Y. Yohannes. 2015. 2015 Global Hunger Index: Armed conflict and the challenge of hunger. Bonn, Germany; Washington, DC, USA and Dublin, Ireland: WeltHungerHilfe; International Food Policy Research Institute (IFPRI) and Concern Worldwide.
22 The World Bank Group estimates that, by 2030, the share of the poor in the global population living in fragile and conflict- affected situations will be 46 percent, while OECD’s estimate is 60 percent. Estimates are different because both sources use different definitions of fragility and violence. For the World Bank estimates see, World Bank. 2017. Fragility, conflict and violence. In: The World Bank [online]. Washington, DC. [Cited 27 June 2017] www.worldbank.org/en/topic/fragilityconflictviolence/overview. For the OECD estimates, see OECD. 2016. States of Fragility 2016: Understanding Violence. Paris. [Cited 27 June 2017]. www.oecd.org/dac/states-of-fragility-2016-9789264267213-en.htm
23 OECD, 2016 (see note 22).
24 Institute for Economics and Peace (IEP). 2016. Global Peace Index 2016. Sydney, Australia. [Cited 27 June 2017]. http://visionofhumanity.org/app/uploads/2017/02/GPI-2016-Report_2.pdf
25 Conflict sensitivity refers to engagements based on understanding of the contexts in which it works (including the systematic study of the profile, causes, actors and dynamics of conflict) and the interaction between its interventions and each context. In the context of sustaining peace, it refers to maximizing positive impacts towards peace while minimizing negative impacts (in line with best practice and minimum standards), including the potential for creating “future hazards”. Conflict sensitivity involves both gaining a sound understanding of the two-way interaction between activities and context, and acting on this analysis. A conflict-sensitive approach is necessary in all contexts (even in situations where underlying tensions have not resulted in violence).
26 General Assembly Resolution 70/262, Review of the United Nations peacebuilding architecture, A/RES/70/262; and Security Council Resolution 2282 (2016) [on post-conflict peacebuilding], S/RES/2282 (2016). Both adopted on 27 April 2016. Security Council resolution 1325 (2000) [on women and peace and security], S/RES/1325 (2000). Adopted on 31 October 2000.
27 IEP, 2016 (see note 24).
| 110 |
28 E. Melander, T. Petterson and L. Themnér. 2016. Organized violence, 1989–2015. Version 5.0-2015. Journal of Peace Research, 53(5): 727–742; R. Sundberg, K. Eck and J. Kreutz. 2012. Introducing the UCDP non-state conflict dataset. Version 2.5-2016. Journal of Peace Research, 49(2): 351–362; and K. Eck and L. Hultman. 2007. One-sided violence against civilians in war: insights from new fatality data. Version 1.4-2016. Journal of Peace Research, 44(2): 233–246. The Uppsala Conflict Data Program definitions of the three types of conflict are: state-based conflict is the use of armed force by the government of a state, where a state is either an internationally recognized sovereign government controlling a specified territory, or an internationally unrecognized government controlling a specified territory whose sovereignty is not disputed by another internationally recognized sovereign government previously controlling the same territory; non-state conflict occurs where there is use of armed force between two organized armed groups, neither of which is the government of a state, which results in at least 25 battle-related deaths in a year; one-sided violence is characterized by the use of armed force by the government of a state or by a formally organized group against civilians which results in at least 25 deaths in a year.
29 IEP, 2016 (see note 24).
30 Ibid.
31 See C. Raleigh, A. Linke, H. Hegre and J. Karlsen. 2010. Introducing ACLED: an armed conflict location and event dataset. Journal of Peace Research, 47(5): 651–660. ACLED defines a conflict event as “a single altercation where often force is used by one or more groups for a political end, although some instances – including protests and non-violent activity – are included in the dataset to capture the potential pre-cursors or critical junctures of a conflict.”
32 OECD, 2016 (see note 22).
33 FAO. 2017a. Sowing the Seeds of Peace for Food Security: Disentangling the nexus between conflict, food security and peace, edited by C. Holleman, J. Jackson, M.V. Sánchez & R. Vos. FAO Agricultural Development Economics Technical Study 2. Rome.
34 For more details on national and subnational conflict monitoring data and analysis by country and year, see Heidelberg Institute for International Conflict Research (HIIK). 2017. Conflict Barometer 2016. Heidelberg, Germany.
35 See for example C. Breisinger, O. Ecker, J.F. Maystadt, J.F. Trinh Tan, P. Al-Riffai, K. Bouzar, A. Sma and M. Abdelgadir.
2014. How to build resilience to conflict. The role of food security. IFPRI Food Policy Report. Washington, DC, International Food Policy Research Institute; T. Brück, N. Habibi, C. Martin-Shields, A. Sneyers, W. Stojetz and S. van Weezel. 2016. The relationship between food security and violent conflict: report to FAO. ISC – International Security and Development Center, Berlin, 22 December; M. d’Errico, F. Grazioli and A. Mellin. 2017. The 2012 crisis in Mali and its implications on resilience and food security. FAO Agricultural Development Economics Working Paper 17-04. Rome, FAO; and T. Brück, M. d’Errico and R. Pietrelli. 2017. The effects of violent conflict on household resilience and food security: evidence from the 2014 Gaza conflict. Forthcoming in World Development Special Issue “Food Security and Conflict”.
36 The difference between the two country groups is statistically significant at 99 percent level of confidence. The difference refers to unweighted estimates of the prevalence of undernourishment (that is, not weighted for differences in population size across countries) between conflict and non-conflict countries.
37 Similarly the difference for the unweighted prevalence is statistically significant at 99 percent level of confidence.
38 See FAO, 2017a (see note 33). A recent study confirms the strong correlation between the degree of fragility and the prevalence of undernourishment and stunting.
39 See FAO, IFAD and WFP. 2015. The State of Food Insecurity in the World. Meeting the 2015 international hunger targets: taking stock of uneven progress. Rome, FAO. (available at www.fao.org/3/a-i4646e.pdf).
40 Ibid.
41 Ibid. See Annex 2 of this report.
42 See FAO, IFAD and WFP, 2015 (see note 39).
43 See for example J.L. Arcand, A.S. Rodella and M. Rieger. 2015. The impact of land mines on child health: evidence from Angola. Economic Development and Cultural Change, 63(2): 249–279; V. Duque. 2016. Early-life conditions and child development: evidence from a violent conflict. SSM-Population Health, 3: 121–131.; C. Minoiu and O.N. Shemyakina. 2014. Armed conflict, household victimization, and child health in Côte d’Ivoire. Journal of Development Economics, 108(C): 237–255; R. Akresh, L. Lucchetti and H. Thirumurthy. 2012. Wars and child health: evidence from the Eritrean-Ethiopian conflict. Journal of Development Economics, 99(2):
| 111 |
NOTES
330–340; R. Akresh, G.D. Caruso and H. Thirumurthy. 2016. Detailed geographic information, conflict exposure, and health impacts. HICN Working Paper 238, Household in Conflict Network. Brighton, UK, Institute of Development Studies; J.P. Tranchant, P. Justino and C. Müller. 2014. Political violence, drought and child malnutrition: empirical evidence from Andhra Pradesh, India. HICN Working Paper 173, Household in Conflict Network. Brighton, UK, Institute of Development Studies; G. Guerrero-Serdán. 2009. The effects of the war in Iraq on nutrition and health: an analysis using anthropometric outcomes of children. HICN Working Paper 55, Household in Conflict Network. Brighton, UK, Institute of Development Studies; M. Nasir. 2016. Violence and child health outcomes: evidence from Mexican drug war. HICN Working Paper 208, Household in Conflict Network. Brighton, UK, Institute of Development Studies; and T. Bundervoet, P. Verwimp and R. Akesh. 2009. Health and civil war in rural Burundi. Journal of Human Resources, 44(2): 536–563.
44 See FSIN, 2017 (see note 19).
45 A healthy living environment refers to the health services and environment, including health system delivery and sanitation.
46 See P. Justino. 2012. Resilience in protracted crises: exploring coping mechanisms and resilience in households, communities and local institutions. High Level Expert Forum on Food Security in Protracted Crises, Rome, 13–14 September 2012. (available at www.fao.org/fileadmin/templates/cfs_high_level_forum/documents/Resilience_in_protracted_crises_PJustino_01.pdf).
47 There is no existing study that convincingly disentangles or quantifies such impacts of conflict, in part owing to the complexity and limitations of data that would be required. This would require detailed household-level data on crop production and assets, as these are affected by conflict (including the timing and extent of theft); information about the extent and duration of displacement (including changes in food security, nutrition and exposure to disease or time spent in resettlement camps); detailed conflict event data at the household and village level to measure war exposure; and individual food consumption data and child anthropometrics at multiple points in time to capture changes in short- and long-term indicators. The lack of data in conflict- affected situations is a major challenge.
48 See S. Costalli, L. Moretti and C. Pischedda. 2017. The economic costs of civil war: synthetic counterfactual evidence and the effects of ethnic fractionalization. Journal of Peace Research, 54(1): 80–98.
49 B. Rother, G. Pierre, D. Lombardo, R. Herrala, P. Toffano, E. Roos, G. Auclair and K. Manasseh. 2016. The economic impact of conflicts and the refugee crisis in Middle East and North Africa. IMF Staff Discussion Note 16/08. Washington, DC, International Monetary Fund.
50 Rother et al., 2016 (see note 49).
51 World Bank. 2011. World Development Report 2011. Facts and figures. [Cited 28 June 2017]. http://web.worldbank.org/archive/website01306/web/pdf/english_wdr2011_facts_figures%20no%20embarg o.pdf; and P. Hong. 2015. Peace and stability as enablers for and outcome of development.
52 World Bank. 2017. The World Bank in Democratic Republic of Congo. In: Where we work [online]. Washington, DC. [Cited 28 June 2017]. www.worldbank.org/en/country/drc
53 WFP. 2014. Democratic Republic of Congo: is economic recovery benefiting the vulnerable? Special focus DRC. VAM Food Security Analysis.
54 FSIN, 2017 (see note 19).
55 Ibid.
56 The report uses the FAO definition of agriculture, which is inclusive of forestry and fisheries.
57 OECD, 2016 (see note 22).
58 See FAO. 2000. The State of Food and Agriculture. Rome. (also available at www.fao.org/docrep/017/x4400e/x4400e.pdf).
59 Agriculture losses for all developing countries due to conflict between 1970 and 1997 averaged US$4.3 billion annually, far exceeding the value of development assistance to those countries.
60 The Central African Republic is an example of the complexity and intractability of so-called conflict and violence traps and their impact on food security and nutrition.
61 FAO and WFP. 2016. Crop and Food Security Assessment Mission (CFSAM): Central African Republic. Special Report. Rome.
62 See FAO. 2017b. Counting the cost: agriculture in Syria after six years of crisis. Rome. (also available at www.fao.org/fileadmin/user_upload/emergencies/docs/FAO_SYRIADamageandLossReport.pdf).
| 112 |

63 See FAO. 2016a. GIEWS Country Brief: Iraq. Rome.
64 See E. Simmons. 2013. Harvesting peace: food security, conflict and cooperation. Environmental Change and Security Program Report Vol. 14, Issue 3. Washington, DC, Woodrow Wilson International Center for Scholars.
65 Ibid.
66 UNHCR. 2016. Mid-year trends 2016. Geneva, Switzerland.
67 A. Sanghi, H. Onder and V. Vemuru. 2016. “Yes” in my backyard? The economics of refugees and their social dynamics in Kakuma, Kenya. Washington, DC, World Bank Group and UNHCR.
68 WFP. 2017. At the root of exodus: food security, conflict and international migration. Rome.
69 United Nations Office for the Coordination of Humanitarian Affairs (OCHA). 2017. Humanitarian Bulletin Lebanon [online]. Issue 26. 15 December – 31 January 2017. Figures of registered refugees in Lebanon, estimate as of 31 December 2016. [Cited 29 June 2017]. http://data.unhcr.org/syrianrefugees/download.php?id=12837
70 FAO, 2017a (see note 33).
71 Justino, 2012 (see note 46).
72 For example, see E.J. Wood. 2003. Insurgent collective action and civil war in El Salvador. Cambridge Studies in Comparative Politics. New York, USA, Cambridge University Press; and A. Steele. 2007. Massive civilian displacement in civil war: assessing variation in Colombia. HICN Working Paper 29, Household in Conflict Network. Brighton, UK, Institute of Development Studies.
73 P. Justino. 2009. The impact of armed civil conflict on household welfare and policy responses. HICN Working Paper 61, Household in Conflict Network. Brighton, UK, Institute of Development Studies.
74 M.A. Arias, A.M. Ibáñez and A. Zambrano. 2017. Agricultural production amid conflict: separating the effects of conflict into shocks and uncertainty. HICN Working Paper 245, Household in Conflict Network. Brighton, UK, Institute of Development Studies.
75 A. Segovia. 2017. Las relaciones entre conflictos y seguridad alimentaria: el caso de Colombia. Background paper elaborated for FAO. (unpublished).
76 H.J. Brinkman, L. Attree and S. Hezir. 2013. Addressing horizontal inequalities as drivers of conflict in the post-2015 development agenda. Global thematic consultation on addressing inequalities: the heart of the post- 2015 development agenda and the future we want for all. UNPBSO, Saferworld.
77 Ibid.
78 United Nations Population Fund (UNFPA). 2017. Humanitarian emergencies. In: Emergencies [online]. New York, USA. [Cited 29 June 2017]. http://www.unfpa.org/emergencies
79 Justino, 2012 (see note 46).
80 FAO. 2017c. Guidance Note: Child labour in protracted crises, fragile and humanitarian contexts. Rome. (available at www.fao.org/3/a-i7403e.pdf).
81 Food Security and Nutrition Analysis Unit Somalia (FSNAU). 2012. Gender in emergency food security, livelihoods and nutrition in Somalia. A compendium of what we know, and recommendations on what we need to know for enhanced gender analysis. Baseline. November 2012.
82 P. Justino, I. Cardona, R. Mitchell and C. Müller. 2012. Quantifying the impact of women’s participation in post-conflict economic recovery. HICN Working Paper 131, Household in Conflict Network. Brighton, UK, Institute of Development Studies.
83 Ibid.
84 M.O. Odhiambo. 2012. Impact of conflict on pastoral communities’ resilience in the Horn of Africa. Case studies from Ethiopia, Kenya and Uganda. Nakuru, Kenya, RECONCILE, FAO.
85 Simmons, 2013 (see note 64).
86 WFP, 2017 (see note 68).
87 P. Pinstrup-Andersen and S. Shimokawa. 2008. Do poverty and poor health and nutrition increase the risk of armed conflict onset? Food Policy, 33(6): 513–520.
88 J.F. Maystadt, J.F. Trinh Tan and C. Breisinger. 2012. Does food security matter for transition in Arab countries? IFPRI Discussion Paper 01196. Washington, DC, Institute Food Policy Research Institute.
89 Pinstrup-Andersen and Shimokawa, 2008 (see note 87).
| 113 |

NOTES
90 World Bank. 2011. World Development Report 2011. Conflict, security, and development. Washington, DC.
91 See for example C. Blattman and E. Miguel. 2010. Civil war. Journal of Economic Literature, 48(1): 3–57.
92 Ibid.
93 D. Keen. 1998. The economic functions of violence and civil wars. Adelphi Paper 320. International Institute of Strategic Studies. Oxford, UK, Oxford University Press; and, J. Hirshleifer. 2001. The dark side of the force: economic foundations of conflict theory. Cambridge, USA, Cambridge University Press.
94 S. Haysom. 2014. Security and humanitarian crisis in Mali: the role of regional organizations. HPG Working Paper. London, Overseas Development Institute.
95 von Grebmer et al., 2014 (see note 21).
96 World Bank Group. 2016. Poverty and shared prosperity 2016: taking on inequality. Washington, DC.
97 See for example C. Hendrix, S. Haggard and B. Magaloni. 2009. Grievance and opportunity: food prices, political regime and protest.
98 J. Berazneva and D.R. Lee. 2013. Explaining the African food riots of 2007–2008: an empirical analysis. Food Policy, 39(C): 28–39; T.G. Smith. 2014. Feeding unrest: Disentangling the causal relationship between food price shocks and sociopolitical conflict in urban Africa. Journal of Peace Research, 51(6): 679–695; and M.F. Bellemare. 2015. Rising food prices, food price volatility, and social unrest. American Journal of Agricultural Economics, 97(1): 1–21.
99 S. Johnstone and J. Mazo. 2011. Global warming and the Arab spring. Survival: Global Politics and Strategy, 53(2): 11–17; and Maystadt et al., 2012 (see note 88).
100 I. Cadoret, M.H. Hubert and V. Thelen. 2015. Civil conflicts and food price spikes. Rennes, France, University of Rennes.
101 M. Lagi, K.Z. Bertrand and Y. Bar-Yam. 2011. The food crises and political instability in North Africa and the Middle East. Cambridge, USA, New England Complex Systems Institute.
102 R. Arezki and M. Brueckner. 2014. Effects of international food price shocks on political institutions in low-income countries: Evidence from an international food net-export price index. World Development, 61(C): 142–153.
103 Berazneva and Lee, 2013 (see note 98).
104 Breisinger et al., 2014 (see note 35).
105 T.J. Besley and T. Persson. 2008. The incidence of civil war: theory and evidence. Working Paper.
106 H.J. Brinkman and C.S. Hendrix. 2011. Food insecurity and violent conflict: causes, consequences, and addressing the challenges. Occasional Paper 24. Rome, WFP.
107 The Economist. 2017. How Chávez and Maduro have impoverished Venezuela. The Economist, 6 April 2017. (available at www.economist.com/news/finance-and-economics/21720289-over-past-year-74-venezuelans-lost-average-87kg-weight-how?zid=305&ah=417bd5664dc76da5d98af4f7a640fd8a).
108 Brinkman and Hendrix, 2011 (see note 106).
109 Ibid.
110 Pinstrup-Andersen and Shimokawa, 2008 (see note 87).
111 FAO, 2017a (see note 33).
112 N. von Uexkull, M. Croicu, H. Fjelde and H. Buhaug. 2016. Civil conflict sensitivity to growing-season drought. Proceedings of the National Academy of Sciences of the United States of America, 113(44): 12391–12396.
113 J.F. Maystadt and O. Ecker. 2014. Extreme weather and civil war: does drought fuel conflict in Somalia through livestock price shocks? American Journal of Agricultural Economics, 96(4): 1157–1182.
114 See Brück et al., 2016 (see note 35).
115 E.K. Denny and B.F. Walter. 2014. Ethnicity and civil war. Journal of Peace Research, 51(2): 199–212.
116 Le Monde Diplomatique. 2016. Peace and food security supplement by FAO. Le Monde Diplomatique, 1 May 2016.
117 United Nations Environment Programme (UNEP). 2007. Sudan post-conflict environmental assessment. Nairobi.
118 African Development Bank Group (AfDB). 2010. Regional study on sustainable livestock development in the Greater Horn of Africa. Nairobi.
| 114 |

119 C. Breisinger, O. Ecker and J.F. Trinh Tan. 2015. Conflict and food insecurity: How do we break the links? In IFPRI, eds. Global Food Policy Report 2014-2015, pp. 51–59. Washington, DC.
120 J. Kurtz and K. McMahon. 2015. Pathways from peace to resilience: evidence from the Greater Horn of Africa on the links between conflict management and resilience to food security shocks. Washington, DC, Mercy Corps.
121 A rights-based perspective requires decision-making processes (from policy formulation to law-making, down to administrative acts) to comply with the seven important PANTHER principles, developed by FAO in 2006: participation, accountability, non-discrimination, transparency, human dignity, empowerment and rule of law. See: www.fao.org/righttofood/about-right-to-food/human-right-principles-panther/en/
122 Brinkman and Hendrix, 2011 (see note 106).
123 T.R. Frankenberger. 2012. Can food assistance promoting food security and livelihood programs contribute to peace and stability in specific countries? Paper for high-level expert forum on food insecurity in protracted crises, FAO, Rome, 13–14 September 2012.
124 WFP’s Executive Board approved a policy on WFP’s role in peacebuilding in transition settings (see: WFP. 2013. WFP’s role in peacebuilding in transition settings. WFP/EB.2/2013/4-ARev.1. Rome). The Director-General of FAO approved a “Corporate framework to support sustainable peace in the context of Agenda 2030” on 22 May 2017 (see FAO. [forthcoming]. Corporate framework to support sustainable peace in the context of Agenda 2030. Rome).
125 United Nations, General Assembly. 2006. Progress report on the prevention of armed conflict: report of the Secretary General. A/60/891(18 July 2006).
126 General Assembly resolution 70/262, Review of the United Nations peacebuilding architecture, A/RES/70/262; and Security Council Resolution 2282 (2016) [on post-conflict peacebuilding], S/RES/2282 (2016). Both resolutions were adopted on 27 April 2016.
127 See Principle 9, Committee on World Food Security (CFS). 2015. Framework for Action for Food Security in Protracted Crises (FFA). Rome.
128 United Nations Peacebuilding Support Office (PBSO). 2017. Guidance note: Sustaining peace. New York, USA.
129 J. Parker, L.J. Tiberi, J. Akhilgova, F. Toirov and A.M. Almedom. 2013. “Hope is the engine of life”; “Hope dies with the person”: Analysis of meaning making in FAO-supported North Caucasus communities using the “Sense and Sensibilities of Coherence” (SSOC) methodology. Journal of Loss and Trauma: International Perspectives on Stress & Coping, 18(2): 140–151.
130 P. Collier, A. Hoeffler and M. Söderbom. 2008. Post-conflict risks. Journal of Peace Research, 45(4): 461–478.
131 Breisinger et al., 2015 (see note 119).
132 United Nations PBSO. 2012. Peace dividends and beyond: contributions of administrative and social services to peacebuilding. New York, USA.
133 Ibid.
134 Brinkman and Hendrix, 2011 (see note 106).
135 FAO. 2016b. Guidance Note: The role of social protection in protracted crises. Enhancing the resilience of the most vulnerable. Rome. (available at www.fao.org/3/a-i6636e.pdf).
136 United Nations PBSO, 2012 (see note 132).
137 See IFAD. 2016. Western Sudan resources management programme. In: Where we work [online]. Rome. [Cited 29 June 2017]. https://operations.ifad.org/web/ifad/operations/country/project/tags/sudan/1277/project_overview
138 FAO, Field Programme Management Information System (FPMIS) website (available at https://extranet.fao.org/fpmis/); and UN Multi-partner Trust Fund Office website (available at http://mptf.undp.org).
139 See FAO Climate and Environment Division website (available at www.fao.org/land-water/en/); and FAO. 2016c. Guidance Note: Meeting fuel and energy needs in protracted crises. The SAFE approach. Rome. (available at www.fao.org/3/a-i6633e.pdf).
| 115 |
NOTES
140 The Secretariat of Agriculture, Animal Resources and Fishery (SAARF), the Abyei Joint Oversight Committee (AJOC Sudan), the United Nations Resident Coordinator’s Office (UNRCO), the United Nations Office for the Coordination of Humanitarian Affairs (UNOCHA) and the United Nations Interim Security Force for Abyei (UNISFA).
141 FAO. (forthcoming). Linking animal health veterinary services with natural resources conflict mitigation in the Abyei region. Resilience Promising Practice. Rome.
142 United Nations Department of Safety and Security (UNDSS). 2017. Security risk management process. Abyei area of operations. October 2016–September 2017. Internal UN document.
143 International law and human rights principles provide a guiding normative framework for the design of social protection programmes following a human-rights based approach. See for example FAO. 2017d. FAO Social Protection Framework: promoting rural development for all. Rome. (available at www.fao.org/3/a- i7016e.pdf).
144 Evidence from Latin America and sub-Saharan Africa shows the clear positive impact of social protection programmes in terms of food security, nutrition and human capital development. Social protection impacts have also been seen as enhancing the economic and productive capacity of even the poorest and most marginalized communities. FAO, 2017d (see note 143).
145 Brinkman and Hendrix, 2011 (see note 106).
146 FAO. 2015. The impact of social cash transfer programmes on community dynamics in sub-Saharan Africa. From Protection to Production Research Brief. Rome. (also available at www.fao.org/3/a-i4374e.pdf).
147 B. Crost, J.H. Felter and P.B. Johnston. 2016. Conditional cash transfers, civil conflict and insurgent influence: experimental evidence from the Philippines. Journal of Development Economics, 118(2016): 171–182.
148 World Bank, FAO and IFAD. 2009. Improving food security in Arab countries. Washington, DC, World Bank; S. Fan, M. Torero and D. Headey. 2011. Urgent actions needed to prevent recurring food crises. Policy Brief 16. Washington, DC, International Food Policy Research Institute; and O. Ecker and C. Breisinger. 2012. The food security system: a new conceptual framework. Discussion paper 1166. Washington, DC, International Food Policy Research Institute.
149 FAO, UNICEF and WFP. 2012. Promoting resiliency for at-risk populations: Lessons learned from recent experience in Somalia. Presentation at High-level expert forum on food insecurity in protracted crises, FAO, Rome, 13–14 September 2012.
150 See IFAD. 2015. Le Burundi et le FIDA conjuguent leurs efforts pour lutter contre l’insécurité alimentaire locale et la malnutrition, et valoriser les produits des petits exploitants [online]. In: Newsroom. [Cited 29 June 2017]. www.ifad.org/fr/newsroom/press_release/tags/p72/y2015/7983915
151 See Security Council resolution 1325 (2000) [on women and peace and security], S/RES/1325 (2000). Adopted on 31 October 2000.
152 United Nations Department of Peacekeeping Operations (DPKO). 2010. Ten-year impact study on implementation of UN Security Council Resolution 1325 (2000) on women, peace and security in peacebuilding. Final report to the United Nations Department of Peacekeeping Operations, Department of Field Support. New York, USA.
153 See for example CDA Collaborative Learning Projects (CDA). 2012. Women, gender and peacebuilding: Do contributions add up? Understanding cumulative impacts of peacebuilding. Issue paper. The Reflection on Peace Practice Program. Cambridge, USA.
154 P. Justino, T. Brück and P. Verwimp, eds. 2013. A micro-level perspective on the dynamics of conflict, violence and development. Oxford University Press.
155 See for example T. Bernard, S. Dercon and A.S. Taffesse. 2011. Beyond fatalism: an empirical exploration of self-efficacy and aspirations failure in Ethiopia. Working Paper 2011-03. Oxford, UK, Centre for the Study of African Economies, University of Oxford; J. Parker et al., 2013 (see note 129); and D. Ray. 2006. Aspirations, poverty and economic change. In A. Banerjee, R. Benabou and D. Mookherjee, eds. Understanding poverty, pp. 409–421.
156 C. Blattman and J. Annan. 2011. Reintegrating and employing high risk youth in Liberia: Lessons from a randomized evaluation of a landmine action agriculture training programme for ex-combatants. Evidence from randomized evaluations of peacebuilding in Liberia. Policy Report 2001.1. New Haven, USA, Innovations for Poverty Action, Yale University.
157 Parker et al., 2013 (see note 129).
| 116 |
158 J. Hagen-Zanker, M. Ulrichs, R. Holmes and Z. Nimeh. 2017. Cash transfers for refugees: the economic and social effects of a programme in Jordan. London, Overseas Development Institute and Aya Consultancy.
159 FAO. 2016d. Guidance Note: Gender, food security and nutrition in protracted crises: women and girls as agents of resilience. Rome. (available at www.fao.org/3/a-i6630e.pdf).
160 WFP. 2016. UN PBSO/PBF cross-border cooperation for sustainable peace and development mid-term progress report (Dec 2015-Oct 2016). WFP Country Office in the Kyrgyz Republic.
161 Breisinger et al., 2015 (see note 119).
162 C. McLoughlin. 2015. When does service delivery improve the legitimacy of a fragile or conflict-affected state? Governance: An International Journal of Policy, Administration, and Institutions, 28(3): 341–356.
163 L. Denney, R. Mallett and D. Mazurana. 2015. Thematic paper on peacebuilding and service delivery. United Nations University, Centre for Policy Research.
164 FAO. 2017e. Renforcement de la prévention et de la gestion pacifique des conflits fonciers en République de Côte d’Ivoire. In: FAO in action [online] Rome. [Cited 30 June 2017]. www.fao.org/emergencies/fao-in- action/projects/detail/en/c/381885/
165 FAO calculations based on raw data collected from the OECD-CRS database, downloaded on 29 July 2016. (https://stats.oecd.org/Index.aspx?DataSetCode=CRS1).
166 For example, in the context of the World Humanitarian Summit in 2016, agreement around the Grand Bargain, and in the Committee on World Food Security’s Framework for Action for Food Security and Nutrition in Protracted Crises (CFS-FFA).
167 OCHA. 2015. Fit for the Future Series. An end in sight: multi-year planning to meet and reduce humanitarian needs in protracted crises. Think Brief. OCHA policy and studies series 015.
168 See WFP. 2015. Multi-year funding. Rome. As of 2014, WFP had 12 multiyear agreements with Australia, Canada, Finland, Germany, Ireland, Nepal, New Zealand, Norway, the Netherlands, the Republic of Korea, the Russian Federation and the United Kingdom of Great Britain and Northern Ireland.
169 FAO calculations based on data collected from the OECD-CRS database, downloaded on 13 March 2017. (https://stats.oecd.org/Index.aspx?DataSetCode=CRS1).
170 In the OCHA Financial Tracking System, the food sector includes emergency food assistance, asset creation and related livelihoods support.
171 FAO calculations based on data collected from the OCHA Financial Tracking System, downloaded on 15 March 2017 (see https://ftsarchive.unocha.org/pageloader.aspx?page= AboutFTS-Introduction).
172 See, for example, Collier et al., 2008 (see note 130).
173 The New Way of Working was adopted in May 2016 in a Commitment to Action signed by the former UN Secretary-General Ban Ki-Moon and eight UN humanitarian and development entities (FAO, OCHA, UNHCR, UNDP, UNFPA, UNICEF, WFP, WHO) and endorsed by the World Bank and IOM. It is framed as enabling humanitarian, development and peace actors to engage meaningfully to support people affected by conflict and protracted crisis through collective outcomes that reduce risk, need and vulnerability, based on context and thereby contributing to sustainable development, including as it relates to sustaining peace.
174 The Peace Promise consists of five commitments as a framework for new ways of working together: (a) coherent objectives; (b) analysis; (c) develop capacities, tools, partnerships, learning; (d) conflict sensitivity; and (e) financing. It states that the international community has a responsibility to work together across silos and at the peace–humanitarian-development nexus in addressing the drivers of violent conflict, delivering humanitarian assistance and developing institutions, resilience and capacities simultaneously in a complementary and synergetic way in order to end humanitarian needs, in a context-specific manner that safeguards humanitarian principles.
175 von Grebmer et al., 2015 (see note 21).
| 117 |

METHODOLOGYThe State of Food Security and Nutrition in the World 2017 has been prepared by the FAO Agriculture Development Economics Division in collaboration with the Statistics Division of the Economic and Social Development Department, and a team of technical experts from FAO, IFAD, UNICEF, WFP and WHO.
Production of the report was guided by a senior advisory team, consisting of designated senior managers of the five UN publishing partners. Led by FAO, this team decided on the outline of the report and defined its thematic focus. It further gave oversight to the technical writing team comprised of experts from each of the five co-publishing agencies. The technical writing team involved external experts in preparing background papers to complement the research and data analysis undertaken by the members of the writing team.
The writing team produced a number of interim outputs, including an annotated outline, first draft and final draft of the report. These were reviewed, validated and cleared by the senior advisory team at each step in the preparation process. The final report underwent a rigorous technical review by senior management and technical experts from different divisions and departments within each of the five UN agencies, both at headquarters and decentralized offices. Finally, the report then underwent executive review and clearance by the heads of agency of the five co-publishing partners.
NOTES FOR ANNEX 1Countries revise their off icial statistics regularly for past as well as the latest reported periods. The same holds for the population data of the United Nations. Whenever this happens, estimates are revised accordingly. Users are therefore advised to refer to changes in estimates over time only within the same edition of The State of Food Security and Nutrition in the World, and refrain from comparing data published in editions for different years.
Geographic regionsThis publication follows the composition of geographical regions as presented by the Statistics Division of the United Nations Secretariat, primarily for use in its publications and databases (https://unstats.un.org/unsd/methodology/m49/). The assignment of countries or areas to specif ic groupings is for statistical convenience and does not imply any assumption by the United Nations regarding political or other aff il iation of countries or territories. Countries, areas and territories for which there were insufficient or not reliable data to conduct the assessment are not reported or included in the aggregates. Specif ically:
� Northern Africa: In addition to the countries and territories listed in the table, PoU and the prevalence of severe food insecurity based on the FIES include an estimate for Western Sahara. Wasting, stunting, childhood overweight, adult obesity, exclusive breastfeeding and anaemia estimates exclude Western Sahara.
� Eastern Africa: With respect to the M49 classif ication, this excludes British Indian Ocean Territory, French Southern Territories, Mayotte and Réunion.
� Western Africa: With respect to the M49 classif ication, this excludes Saint Helena.
� Asia and Eastern Asia: with respect to the M49 classif ication, wasting, stunting and childhood overweight aggregates exclude Japan.
� Caribbean: With respect to the M49 classif ication, this excludes Anguilla, Aruba, Bonaire, Sint Eustatius and Saba, British Virgin Islands, Cayman Islands, Curaçao, Guadeloupe, Martinique, Montserrat, Saint Barthélemy, Saint-Martin (French part), Sint Maarten (Dutch part), Turks and Caicos Islands, United States Virgin Islands. In addition to these, anaemia estimates exclude Saint Kitts and Nevis. Adult obesity and exclusive breastfeeding exclude Puerto Rico; this is also the case for childhood wasting, stunting and overweight.
� South America: with respect to the M49 classif ication, this excludes Bouvet Island, Falkland Islands (Malvinas), French Guyana, South Georgia and the South Sandwich Islands.
� Oceania: with respect to the M49 classif ication, wasting, stunting, childhood overweight and exclusive breastfeeding exclude Australia and New Zealand.
� Australia and New Zealand: with respect to the M49 classif ication, this excludes Christmas Island, Cocos (Keeling) Islands, Heard Island and McDonald Islands, and Norfolk Island.
� Melanesia: with respect to the M49 classif ication, anaemia estimates exclude New Caledonia.
� Micronesia: with respect to the M49 classif ication, this excludes Guam, Northern Mariana Islands and
US Minor Outlying Islands. In addition to these, anaemia estimates exclude Nauru and Palau.
� Polynesia: with respect to the M49 classif ication, this excludes Pitcairn Islands and Wallis and Futuna Islands. Adult obesity and exclusive breastfeeding estimates exclude American Samoa, French Polynesia and Tokelau. In addition to these, anaemia aggregates also exclude Cook Islands, Niue and Tuvalu.
� Northern America: with respect to the M49 classification, this excludes Saint Pierre and Miquelon. Adult obesity, anaemia, exclusive breastfeeding, childhood stunting, wasting and overweight aggregates also exclude Bermuda and Greenland. For wasting and stunting, this aggregate is based only on data for the United States of America.
� Northern Europe: with respect to the M49 classification, this excludes Åland Islands, Channel Islands, Faroe Islands, Isle of Man, Svalbard and Jan Mayen Islands.
� Southern Europe: with respect to the M49 classif ication, this excludes Gibraltar, Holy See and San Marino. Anaemia estimates include San Marino.
� Western Europe: with respect to the M49 classif ication, this excludes Liechtenstein and Monaco.
All the geographic regions include an estimate for all the countries listed in the table for which no value is reported.
Other groupingsLeast-developed countries, landlocked developing countries and small island developing states groupings include the countries as presented by the Statistics Division of the United Nations (https://unstats.un.org/unsd/methodology/m49/).
� Small island developing states: Adult obesity and exclusive breastfeeding aggregates exclude American Samoa, French Polynesia and Puerto Rico. In addition to these, anaemia aggregates exclude Anguilla, Aruba, Bonaire, Sint Eustatius and Saba, British Virgin Islands, Cook Islands, Curaçao, Guam, Montserrat, Nauru, New Caledonia, Niue, Northern Mariana Islands, Palau, Saint Kitts and Nevis, Sint Maarten (Dutch part), Tuvalu and United States Virgin Islands, and include Puerto Rico.
Low-income economies and lower-middle-income economies include the countries as presented by the World Bank classif ication (https://datahelpdesk.worldbank.org/knowledgebase/articles/906519-world-bank-country-and-lending-groups).
Low-income food-deficit countries include: Afghanistan, Bangladesh, Benin, Burkina Faso, Burundi, Cameroon, Central African Republic, Chad, Comoros, Côte d’Ivoire, Democratic People’s Republic of Korea, the Democratic Republic of the Congo, Djibouti, Eritrea, Ethiopia, the Gambia, Ghana, Guinea, Guinea-Bissau, Haiti, India, Kenya, Kyrgyzstan, Lesotho, Liberia, Madagascar, Malawi, Mali, Mauritania, Mozambique, Nepal, Nicaragua, the Niger, Nigeria, Pakistan, Papua New Guinea, Rwanda, Sao Tome and Principe, Senegal, Sierra Leone, Solomon Islands, Somalia, South Sudan, the Sudan, the Syrian Arab Republic, Tajikistan, Togo, Uganda, the United Republic of Tanzania, Uzbekistan, Yemen and Zimbabwe.

2017
The international community is committed to ending hunger and all forms of malnutrition worldwide by 2030. While much progress has been made, conflict and human-induced and natural disasters are causing setbacks. This year’s The State of Food Security and Nutrition in the World warns that the long-term declining trend in undernourishment seems to have come to a halt and may have reversed, largely on account of the above-mentioned factors. Meanwhile, though progress continues to be made in reducing child malnutrition, rising overweight and obesity are a concern in most parts of the world.These and other findings are detailed in the 2017 edition of The State of Food Security and Nutrition in the World (formerly, The State of Food Insecurity in the World). For the first time, this year’s report is published by an expanded partnership, with UNICEF and WHO now joining FAO, IFAD and WFP.The report also marks a new era in the monitoring of food security and nutrition in the context of the 2030 Agenda for Sustainable Development and the UN Decade of Action on Nutrition. To assess progress made towards the goal of ending hunger, the report uses both the traditional measure of the prevalence of undernourishment and a new indicator, the prevalence of severe food insecurity, based on the Food Insecurity Experience Scale. The report further looks at various forms of malnutrition, including trends and situations for child stunting, wasting and overweight and for adult obesity, breastfeeding and anaemia in women. The thematic part of the report sheds light on how the increasing incidence of conflict in the world is affecting food security and nutrition. It also explores how, by improving food security and nutrition and by making rural livelihoods more resilient, it is possible to help prevent conflicts and sustain peace.
THE STATE OF FOOD SECURITY AND NUTRITION IN THE WORLDBUILDING RESILIENCE FOR PEACE
AND FOOD SECURITY
Related Documents


