Project Number: BME-JMS-0704 I A Major Qualifying Report Submitted to the Faculty Of the WORCESTER POLYTCHNIC INSTITUTE In partial fulfillment of the requirements for the Degree of Bachelor of Science By ___________________________________ Amid Zand ___________________________________ Endri Angjeli Date: Approved: ___________________________________ Professor John Sullivan, Major Advisor ___________________________________ Dr. Jean King, Co-Advisor fMRI Analysis of Brain Refractory Period Activity in Nicotine-Addicted Rat Models I. Brain Activity Level II. fMRI III. Nicotine Refractory Period

Welcome message from author
This document is posted to help you gain knowledge. Please leave a comment to let me know what you think about it! Share it to your friends and learn new things together.
Transcript
Project Number: BME-JMS-0704
I
A Major Qualifying Report
Submitted to the Faculty
Of the
WORCESTER POLYTCHNIC INSTITUTE
In partial fulfillment of the requirements for the
Degree of Bachelor of Science
By
___________________________________
Amid Zand
___________________________________
Endri Angjeli
Date:
Approved:
___________________________________
Professor John Sullivan, Major Advisor
___________________________________
Dr. Jean King, Co-Advisor
fMRI Analysis of Brain Refractory Period
Activity in Nicotine-Addicted Rat Models
I. Brain Activity Level
II. fMRI
III. Nicotine Refractory Period

Project Number: BME-JMS-0704
II
AUTHORSHIP PAGE
This project was completed in a group of two by Endri Angjeli and Amid Zand. The team
members collaborated equally during various stages of the project. Amid Zand wrote
chapters 1, 2 and 5. Endri Angjeli wrote Chapters 3, 4 and 6. Chapters 7, 8 and 9 were
written in collaboration between the two authors.
Project Number: BME-JMS-0704
III
ACKNOWLEDGEMENTS
We would like to thank Professor John Sullivan for his continuous guidance,
advice and support through this project. We would also like to thank all the members of
the Center for Comparative Neuroimaging (CCNI) at University of Massachusetts
Medical School, specially Dr. Jean King and Dr. Wei Huang for their valuable inputs and
contributions and Jessica Shields for her help in conducting the fMRI experiment. This
work has been partially funded by NIH Grant NIH- R01 MH067096-01.

Project Number: BME-JMS-0704
IV
ABSTRACT
The objective of this study was to use functional Magnetic Resonance Imaging to
investigate the brain activity of nicotine-addicted rats when the stimulus was introduced
during the refractory period. The results confirmed that regions of the brain normally
activated by nicotine are relatively inactive during the refractory period. These results
coupled with other studies of drug reaction can be used in the development of
pharmaceuticals aimed at specific regions of the brain or at determining targeted drug
delivery schedules.
Project Number: BME-JMS-0704
V
TABLE OF CONTENTS
AUTHORSHIP PAGE..................................................................................................................................II
ACKNOWLEDGEMENTS.........................................................................................................................III
ABSTRACT..................................................................................................................................................IV
TABLE OF FIGURES.................................................................................................................................VI
CHAPTER 1- INTRODUCTION................................................................................................................ 1
CHAPTER 2 - LITERATURE REVIEW................................................................................................... 3
CHAPTER 3 - PROJECT APPROACH................................................................................................... 29
CHAPTER 4 - DESIGN.............................................................................................................................. 33
CHAPTER 5 - METHODS......................................................................................................................... 37
CHAPTER 6 - RESULTS........................................................................................................................... 41
CHAPTER 7 - ANALYSIS AND DISCUSSION...................................................................................... 48
CHAPTER 8 - CONCLUSIONS................................................................................................................ 50
CHAPTER 9 - RECOMMENDATIONS................................................................................................... 51
BIBLIOGRAPHY........................................................................................................................................ 52
Project Number: BME-JMS-0704
VI
TABLE OF FIGURES
Figure 1 - Nicotine receptor activation promotes the release of neurotransmitters, which
may then mediate various effects of nicotine use [Benowitz, 2008]. ...................................4 Figure 2 - Without a magnetic field the magnetic moments of the nuclei are distributed at
random directions and therefore the net magnetization factor is zero. With the presence fo
a strong external magnetic field (B0), the spinning nuclei align parallel or antiparallel to
the external field (B0) with a few more parallel than antiparallel. This results in a net
magnetization vector (Mz) parallel to the external magnetic field [van Geuns et al., 1999].
...................................................................................................................................................8 Figure 3 – (A) The individual nuclei spin around their own axes and precess around the
direction of the external field (B0) with an angle. (B) The phase of the precession around
the axis of the external magnetic field is for each individual nucleus [van Geuns et al.,
1999]..........................................................................................................................................9 Figure 4 - The net magnetization exited with the RF pulse with the same Larmor
frequency, flips 90° and the spins are ‗‗whipped‘‘ to precess in phase. The rotating net
magnetization vector induces an AC in a receiver coil [van Geuns et al., 1999]. ..............10 Figure 5 – The receiver coil detects the signal. The FID signal decreases over time when
the net magnetization vector returns to its original orientation [van Geuns et al., 1999]. .11
Figure 6 - Longitudinal relaxation (upper row) is the realignment of the net magnetization
to the external magnetic field. Transverse relaxation (lower row) is the dephasing of the
precessing spins [van Geuns et al., 1999]. ............................................................................12
Figure 7- T1 and T2 values of different tissues at 1.5T [van Geuns et al., 1999] ...............13 Figure 8 - By superimposing a small magnetic gradient on the main magnetic field in
cranial-caudal direction, a single thin slice through the body is selected [van Geuns et al.,
1999]........................................................................................................................................13 Figure 9 - During phase encoding a temporary gradient is applied. After the gradient is
switched off, the spins will precess with the original frequency, but a small change in the
phase of precessing will remain. The process has to be repeated to acquire multiple AC
signals [van Geuns et al., 1999]. ............................................................................................14 Figure 10 – To differentiate pixels with the same phase encoding, a Frequency encoding,
with a gradient is used [van Geuns et al., 1999]. ..................................................................15 Figure 11 – An AC signal of a single image with two pixels with different proton
densities will result in an AC signal echo with interference pattern of 2 sinusoidal AC
currents [van Geuns et al., 1999]. ..........................................................................................16 Figure 12 - The FID signal rapidly decreases before the longitudinal magnetization
returns to zero. A second RF pulse flips the spins by 180° and reverses the dephasing
process. When the spins are in phase again, a second AC signal is generated. Time of
echo (TE) is the interval between the second RF pulse and the echo signal [van Geuns et
al., 1999] .................................................................................................................................17
Figure 13 – The constraint system used in the fMRI study is shown above [Insight
Neuroimaging Systems (Worcester, MA, USA)] .................................................................20 Figure 14 – Compared with day 1, the head movement in horizontal and vertical planes is
significantly reduced by day 5 [King et al. 2005]. ...............................................................21 Figure 15 – The above steps are applied in a Genetic Algorithm (GA) approach [Chow et
al. 2001]. .................................................................................................................................25

Project Number: BME-JMS-0704
VII
Figure 16 - image alignment before registration was performed using manual registration
is shown above........................................................................................................................26
Figure 17 - image alignment after registration was performed using manual registration is
shown above. ..........................................................................................................................26 Figure 18 - The above objective tree was used in the design process .................................36
Figure 19 - each animal was placed in a black open field. Immediately following each
injection, the distance traveled was tracked..........................................................................38 Figure 20 - A dual coil rat restrainer system used for fMRI study .....................................39
Figure 21 - After 6 daily injection of nicotine, the rats were sensitized. After the injection
on day 6, each rat was given an extra dose of drug and the refractory period was
observed. .................................................................................................................................41
Figure 22 - Composite brain activation in the nicotine (experimental) group ...................42 Figure 23 - Composite brain activation in the saline (control) group .................................42 Figure 24 – Composite result of brain activation in the nicotine group .............................43
Figure 25 – Composite result of brain activation in control group .....................................43 Figure 26 – Percent Activation in Hippocampus .................................................................44 Figure 27 – Percent Activation in Substantia Nigra .............................................................44
Figure 28 – Percent Activation is Septum ............................................................................45 Figure 29 – Percent Activation in Accumbens .....................................................................45 Figure 30– Percent Activation in Cingulate Cortex .............................................................46
Figure 31 – Percent Activation in Prefrontal Cortex............................................................46 Figure 32 – Percent Activation in Visual Cortex .................................................................47
Project Number: BME-JMS-0704
1
CHAPTER 1 - INTRODUCTION
Cigarette smoking, hereafter referred to as ―smoking,‖ is the largest single risk
factor for premature death in developed countries. Approximately one fifth of the deaths
in the United States can be attributable to smoking with 28% of the smoking-attributable
deaths involve lung cancer, 37% involve vascular disease, and 26% involve other
respiratory diseases. More than 400,000 deaths per year and 30% of all cancers in the
United States are attributable to smoking. If reduction in smoking prevalence were to be
observed, morbidity and mortality attributable to smoking would decline in the future. A
substantial decline in adult male smoking in the United States was observed from the
1960s through the 1990s. However, that decline has since slowed. The prevalence of
current smoking among adults in the United States, defined as smoking daily or smoking
on some days, is now about 23% in women and 27% in men [Bergen et al.,1999].
Addiction to nicotine has been established as the psychopharmacologic
mechanism that maintains cigarette-smoking behavior. Nicotine activates the brain‘s
mesolimbic dopaminergic reward system. This produces dependence resulting in physical
and neurobiological withdrawal symptoms on abrupt cessation [Bergen et al., 1999].
In order to understand the underlying mechanism of addiction and provide
therapeutic treatment to smokers, the neural activities of the brain in nicotine-addicted
subjects need to be investigated.
The goal of this project was to analyze and quantify the brain activity level in
nicotine-addicted subjects when a dose of stimulus is given during the refractory period.
The refractory period of a drug is a period of time after stimulation during which the
brain does not fully respond to a second stimulus.

Project Number: BME-JMS-0704
2
Functional Magnetic Resonance Imaging (fMRI) was used to observe the patterns
of neuronal activity across different regions of the brain in the animal subjects. The data
was acquired and the images were registered, segmented and analyzed using the Medical
Image Visualization and Analysis software (MIVA) and MATLAB. These results
coupled with the studies of drug reactions beyond the refractory period can be used in the
development of pharmaceuticals aimed at specific regions of the brain or at determining
targeted drug deliveries schedules which can improve control efforts.
Project Number: BME-JMS-0704
3
CHAPTER 2 - LITERATURE REVIEW
Smoking and nicotine
Interestingly, although smokers report that smoking cigarettes improve their
mood, anxiety and concentration, they fail to recognize that they may be using tobacco as
a means to prevent or treat the unpleasant symptoms of withdrawal such as increased
anxiety, sadness, agitation, and worsening concentration. Smoking temporarily alleviates
these symptoms but reinforces the cycle of repeated use. The symptoms are best
addressed through pharmacological treatments for tobacco dependence. Research studies
of cognitive functioning has demonstrated that nonsmokers outperform smokers in nearly
all tasks and the ‗‗benefits‘‘ of smoking seem be restricted only to a modest increase in
attention during simple, repetitive tasks [Williams et al. 2004].
Nicotine sustains addictive tobacco use. The essence of drug addiction is loss of
control of drug use. Molecular biology suggests that the 42 nicotinic acetylcholine
receptor subtype is the main receptor mediating nicotine dependence. Nicotine acts on
these brain nicotinic cholinergic receptors and facilitates release of dopamine and other
neurotransmitters. These neurotransmitters produce pleasure, stimulation, and mood
modulation and reduce anxiety and tension. When a smoker stops smoking, a nicotine
withdrawal syndrome ensues, characterized by irritability, anxiety, increased eating,
dysphoria, and hedonic dysregulation, among other symptoms. Smoking is also
reinforced by psychological conditions that urge a smoker to smoke. These include the
taste and smell of tobacco, as well as particular moods, situations, and environmental
cues [Benowitz 2008].

Project Number: BME-JMS-0704
4
Figure 1 - Nicotine receptor activation promotes the release of neurotransmitters, which may then
mediate various effects of nicotine use [Benowitz, 2008].
Nicotine influences the dopamine (DA) release within the mesolimbic system.
After nicotine activates the brain‘s mesolimbic dopaminergic reward system, it produces
dependence, which is thought to be the primary neural substrate of motivation and
reinforcement associated with both natural reinforces and drugs of abuse. Nicotine acts as
an agonist for neuronal nicotinic acetylcholine receptors (nAChRs)—pentameric
ionotropic (Na+ and Ca
2+) receptors found presynaptically throughout the central nervous
system (CNS) and postsynaptically in the autonomic nervous system that modulate the
release of neurotransmitters and ganglionic potentials [Bergen et al. 1999].
The mesolimbic pathway originates with dopaminergic (DAergic) neurons in the
ventral midbrain or VTA. The neurons project primarily to limbic sites including the
Nucleus Accumbens (NAcc), Hippocampus (HP) and Prefrontal Cortex (PFC). The NAcc
receives projections from the amygdala, HP and PFC and sends projections to the ventral
palladium (VP) and VTA. The HP exchanges reciprocal connections with the PFC. The
mesolimbic system and associated brain regions are thought to mediate reward through
the action of several neurotransmitters [King, NIH- R01 MH067096-01].
Project Number: BME-JMS-0704
5
Sensitization
Like other addictive drugs, nicotine induces sensitization in subjects; this means
that subsequent doses of this drug produces greater locomotor activity than the initial
dose where locomotor activity is defined as the distance moved in time. Current data
suggest that the neurological adaptations underlying sensitization begin with the first
dose. Following its induction, sensitization persists as a latent state. The activity is
normal when nicotine is absent, but when nicotine is re-administered, sensitization is
expressed as augmented locomotion. In an animal model of addiction, the distance
traveled by the animals in time increases after subjection to each dose of stimulus [Li et
al. 2008].
It is important to initially determine whether nicotine sensitization is subject to a
refractory period. It is crucial to our understanding of the role of sensitization in nicotine
addiction to know it is subject to a refractory period. However, no study has directly
evaluated this question. Assuming that sensitization is something a smoker can
experience and sensitized responses are blocked within a refractory period, a novice
smoker who smokes only a few cigarettes per week might experience sensitization with
every cigarette. However, a typical smoker who lights up every 45 minutes might not
experience sensitization unless a cigarette was smoked after a period of abstinence, such
as overnight. Smokers do report more effect from the first cigarette of the day than the
second, even though the second cigarette produces higher nicotine level [King, NIH- R01
MH067096-01].
In previous studies [Li et al.], sensitization to nicotine was assessed in animal models
using functional magnetic resonance imaging (fMRI). However after the animals were
Project Number: BME-JMS-0704
6
fully sensitized to nicotine, the neural activity of the brain within the refractory period
was not assessed. The refractory period of a drug is defined as a period of time
immediately after a stimulation during which the brain does not fully respond to a second
stimulus. After it is determined whether nicotine sensitization is subject to a refractory
period, the brain neural activity can be analyzed. To determine whether nicotine
sensitization is subject to a refractory period and to analyze the brain neural activity, a
behavioral study and an fMRI study need to be performed. It is hypothesized that during
the refractory period of the sensitized rat, the areas of the brain will not fully respond to a
challenge dose of nicotine. This hypothesis is based on the fact that the nicotine
receptors are saturated with neurotransmitters and need time to recover before they can
react to more nicotine.
The expanding use of fMRI in this project demands an understanding of the
underlying MR principles to glean the most out of the modality. In the next section, we
review briefly the basic principles of fMRI.
Magnetic Resonance Imaging (MRI)
Understanding the underlying mechanism of addiction requires an understanding
of the mysteries of the brain. Functional magnetic resonance imaging (fMRI) is entirely
non-invasive method with the spatial and temporal resolution to resolve patterns of
neuronal activity across the entire brain in the order of 30 seconds [Kulkarni, 2005].
Functional MRI is based on increases in blood flow to the local vasculature that
accompanies neural activity in the specific brain regions. It indirectly detects neural
activity in different parts of the brain by comparing contrast in MR signal intensity prior
to and following stimulation. When an area of the brain has an increased synaptic and

Project Number: BME-JMS-0704
7
neuronal activity, it requires increased levels of oxygen to sustain its activity. Enhanced
brain activity is accompanied by an increase in blood flow and blood volume to this area.
The enhanced blood flow usually exceeds the metabolic demand and exposes the active
brain area to high level of oxygenated hemoglobin. The Magnetic Resonance (MR) signal
is sensitive to the level of oxygen within the tissue. Oxygenated hemoglobin increases the
MR signal intensity that can be detected in MR scanner [Ogawa et al. 1990].
The changes in MR signal induced by changes in blood flow, volume, and
oxygenation are the basis for fMRI methods. The main functional imaging method used
in this study is the Blood Oxygen Level Dependent (BOLD) Technique [Ogawa et al.
1990]. The goal of BOLD fMRI studies is to map patterns of local changes in MR signal
in the brain as an indicator of neural activity associated with a particular stimulus such as
nicotine [Ogawa et al. 1990].
The Source of the MR Signal
A correct description of what happens when tissue is subjected to a magnetic field
relies on quantum mechanics. However, all the theory necessary for MRI can be based on
a simple classical model in which certain nuclei that spin around their own axes behave
like small magnets [van Geuns et al., 1999].
For clinical imaging, hydrogen is the most frequently used nucleus [Van Geuns et al.,
1999]. The vertebrate body is primarily fat and water. Fat and water that make the tissue
have many hydrogen atoms and thus approximately 63% of the body is made of hydrogen
atoms. [Hornak,1996].
Under normal circumstances, the hydrogen nuclei, the tiny magnets, are randomly
distributed in space and their magnetic moments cancel each other out, and thus the net

Project Number: BME-JMS-0704
8
magnetic vector is zero. However, when the patient is submitted to a strong external
magnetic field (B0) the nuclei adopt one of two possible orientations: parallel or
antiparallel to the external field (Figure 2). The energy difference between the parallel
and antiparallel energy states is very small; the population ratio is approximately 100,000
to 100,006. A net magnetization vector (Mz) aligned to the external magnet results from
the difference between the two populations of nuclei [van Geuns et al., 1999].
Figure 2 - Without a magnetic field the magnetic moments of the nuclei are distributed at random directions and therefore the net magnetization factor is zero. With the presence fo a strong external
magnetic field (B0), the spinning nuclei align parallel or antiparallel to the external field (B 0) with a
few more parallel than antiparallel. This results in a net magnetization vector (Mz) parallel to the
external magnetic field [van Geuns et al., 1999].
Individual nuclei do not completely line up with the magnetic field but wobble or
precess around the direction of the external field (Figure 3). The frequency of this
precession is given by the Larmor equation,
F= γ B0 /2
Where F is the precessional or Larmor frequency, B0 is the strength of magnetic field,
Project Number: BME-JMS-0704
9
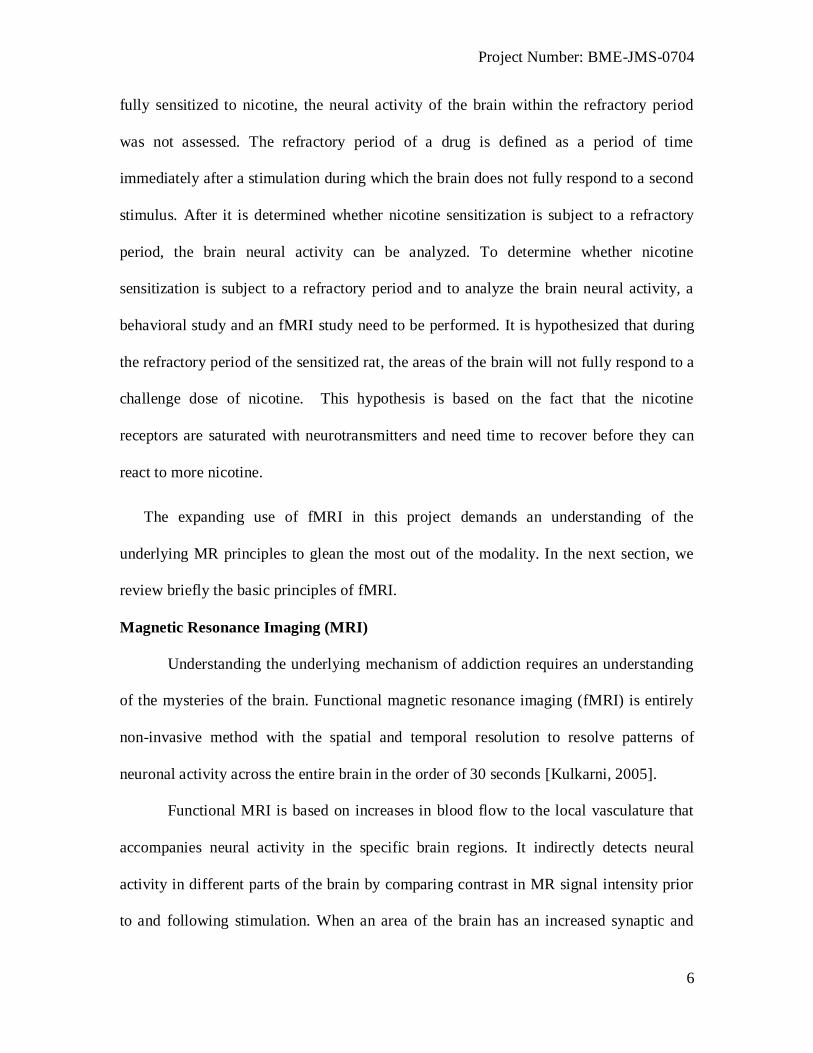
and γ is the gyromagnetic ratio of the nucleus. It is of note that the phase of precession
around the axis of the magnetic field is different for each individual nucleus [van Geuns
et al., 1999].
Figure 3 – (A) The individual nuclei spin around their own axes and precess around the direction of
the external field (B0) with an angle. (B) The phase of the precession around the axis of the external
magnetic field is for each individual nucleus [van Geuns et al., 1999].
Excitation
The net magnetization vector from the nuclei inside the magnet in its equilibrium
state, Mz is static and does not produce a measurable signal. To obtain information from
the spins, the precessing spins are excited by applying energy, in the form of
radiofrequency (RF) energy pulses with a frequency equal to the Larmor frequency. This
frequency is called the resonance frequency. When an RF signal is given at the resonance
frequency the protons absorb energy to jump from the parallel state to the higher level of
the antiparallel state and the spins are ‗‗whipped‘‘ to precess in phase. The effect of all
this is that the net magnetization (Mz) flips 90° from the positive, longitudinal z-axis to
transverse plane (Figure 4) [van Geuns et al., 1999] .

Project Number: BME-JMS-0704
10
Figure 4 - The net magnetization exited with the RF pulse with the same Larmor frequency, flips 90° and the spins are ‘‘whipped’’ to precess in phase. The rotating net magnetization vector induces an
AC in a receiver coil [van Geuns et al., 1999].
The net magnetization in the transverse plane rotates around B0 at the Larmor
frequency. This rotating transverse magnetization can be measured as it induces an
alternating current (AC) in the receiver coil placed around the subject [van Geuns et al.,
1999].
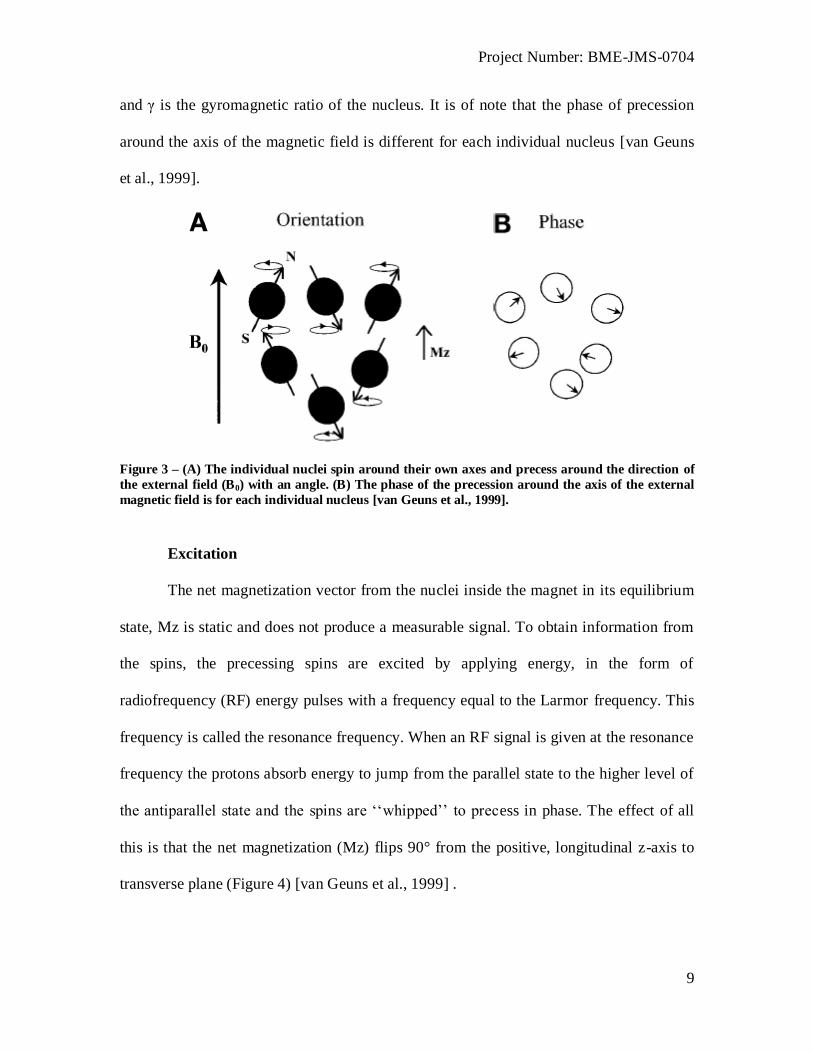
Return to equilibrium
After excitation, the RF frequency transmitter is switched off and the equilibrium state
will be sought. The magnetization therefore decays over time, which is represented by a
decreasing magnitude of Mz in the transverse plane. Consequently, the induced signal in
the receiver coil will decrease in time as shown in figure 5. This decreasing signal is
called the free induction decay (FID) [van Geuns et al., 1999].
Project Number: BME-JMS-0704
11
Figure 5 – The receiver coil detects the signal. The FID signal decreases over time when the net
magnetization vector returns to its original orientation [van Geuns et al., 1999].
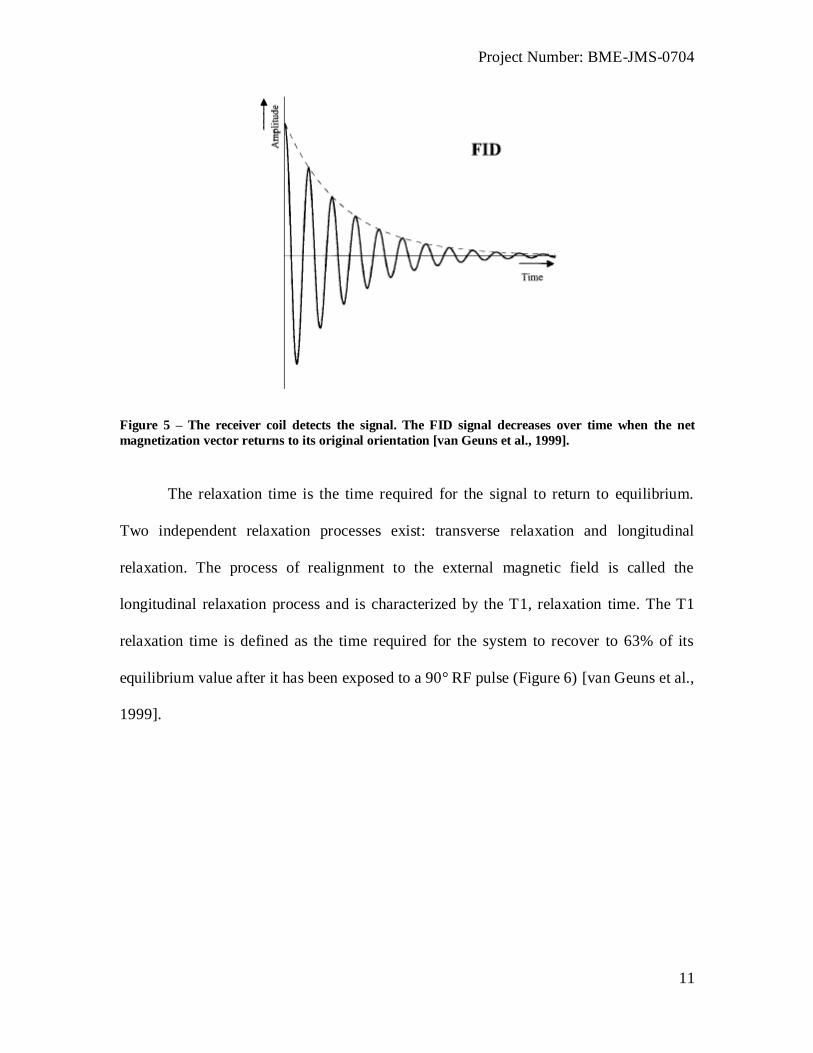
The relaxation time is the time required for the signal to return to equilibrium.
Two independent relaxation processes exist: transverse relaxation and longitudinal
relaxation. The process of realignment to the external magnetic field is called the
longitudinal relaxation process and is characterized by the T1, relaxation time. The T1
relaxation time is defined as the time required for the system to recover to 63% of its
equilibrium value after it has been exposed to a 90° RF pulse (Figure 6) [van Geuns et al.,
1999].
Project Number: BME-JMS-0704
12
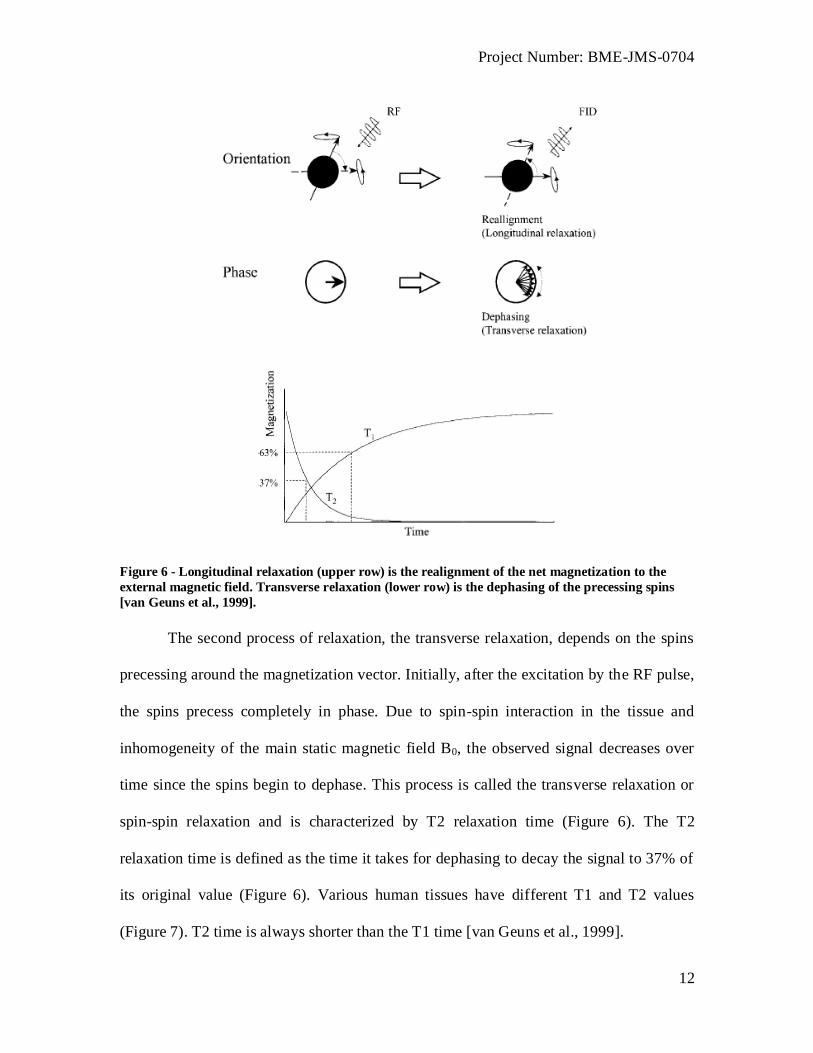
Figure 6 - Longitudinal relaxation (upper row) is the realignment of the net magnetization to the
external magnetic field. Transverse relaxation (lower row) is the dephasing of the precessing spins
[van Geuns et al., 1999].
The second process of relaxation, the transverse relaxation, depends on the spins
precessing around the magnetization vector. Initially, after the excitation by the RF pulse,
the spins precess completely in phase. Due to spin-spin interaction in the tissue and
inhomogeneity of the main static magnetic field B0, the observed signal decreases over
time since the spins begin to dephase. This process is called the transverse relaxation or
spin-spin relaxation and is characterized by T2 relaxation time (Figure 6). The T2
relaxation time is defined as the time it takes for dephasing to decay the signal to 37% of
its original value (Figure 6). Various human tissues have different T1 and T2 values
(Figure 7). T2 time is always shorter than the T1 time [van Geuns et al., 1999].
Project Number: BME-JMS-0704
13
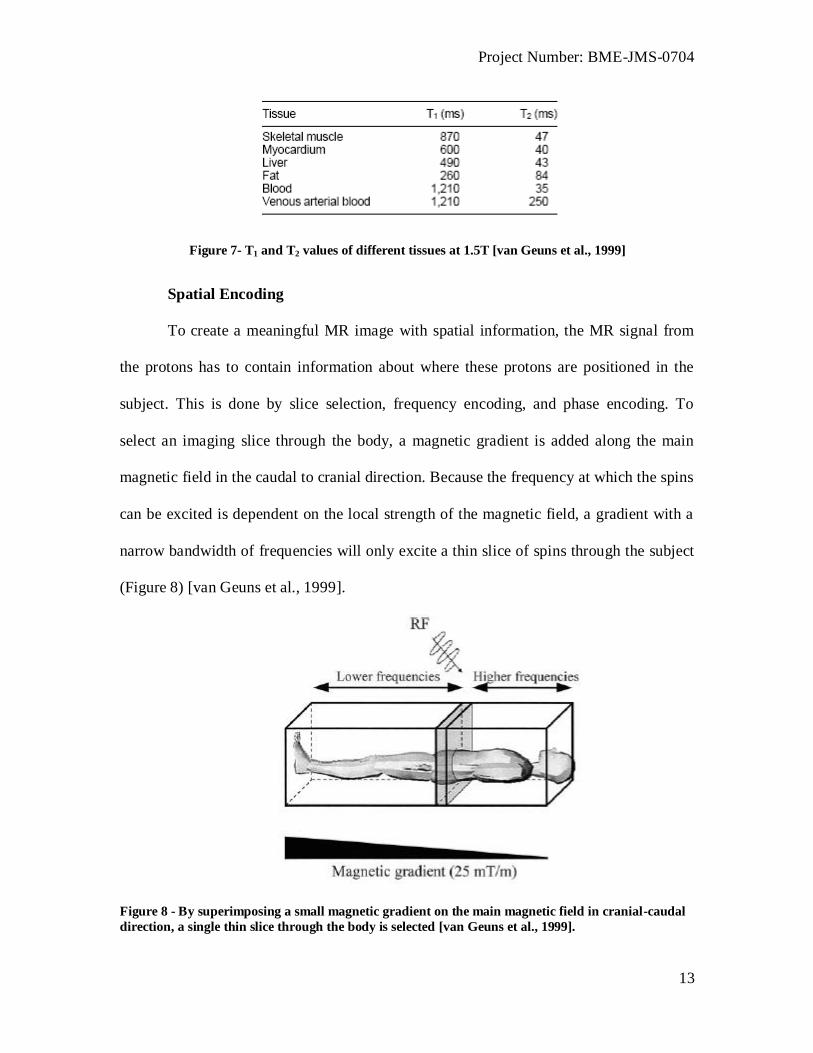
Figure 7- T1 and T2 values of different tissues at 1.5T [van Geuns et al., 1999]
Spatial Encoding
To create a meaningful MR image with spatial information, the MR signal from
the protons has to contain information about where these protons are positioned in the
subject. This is done by slice selection, frequency encoding, and phase encoding. To
select an imaging slice through the body, a magnetic gradient is added along the main
magnetic field in the caudal to cranial direction. Because the frequency at which the spins
can be excited is dependent on the local strength of the magnetic field, a gradient with a
narrow bandwidth of frequencies will only excite a thin slice of spins through the subject
(Figure 8) [van Geuns et al., 1999].
Figure 8 - By superimposing a small magnetic gradient on the main magnetic field in cranial-caudal
direction, a single thin slice through the body is selected [van Geuns et al., 1999].

Project Number: BME-JMS-0704
14
With a change in the excitation frequency another parallel slice can be acquired
later. To obtain slices in other directions, the direction of gradients for the slice encoding
is altered to an anterior-posterior gradient. A slice in any arbitrary direction through the
subject can be acquired by using combinations of gradients in all three directions [van
Geuns et al., 1999].
The frequency and phase encoding are also used to obtain information for the
individual points within a slice and the picture elements or pixels. In the phase encoding
process, a short change in the magnetic field is applied between the RF excitation pulse
and the readout of the signal that will influence the frequency of precessing and results in
a shift in the phase of precessing of the spins depending on the duration of this gradient
switch. By repeating this process with different duration of the temporary gradients,
signals with a different phase encoding are acquired [van Geuns et al., 1999].
Figure 9 - During phase encoding a temporary gradient is applied. After the gradient is switched off,
the spins will precess with the original frequency, but a small change in the phase of precessing will
remain. The process has to be repeated to acquire multiple AC signals [van Geuns et al., 1999].
The pixels with the same phase encoding are differentiated using the frequency
encoding. A magnetic gradient during readout of the signal results in a specific shift of
Project Number: BME-JMS-0704
15
the resonance frequency, likewise the effect of the slice-encoding gradient, for pixels
with the same phase shift (Figure 9) [van Geuns et al., 1999].
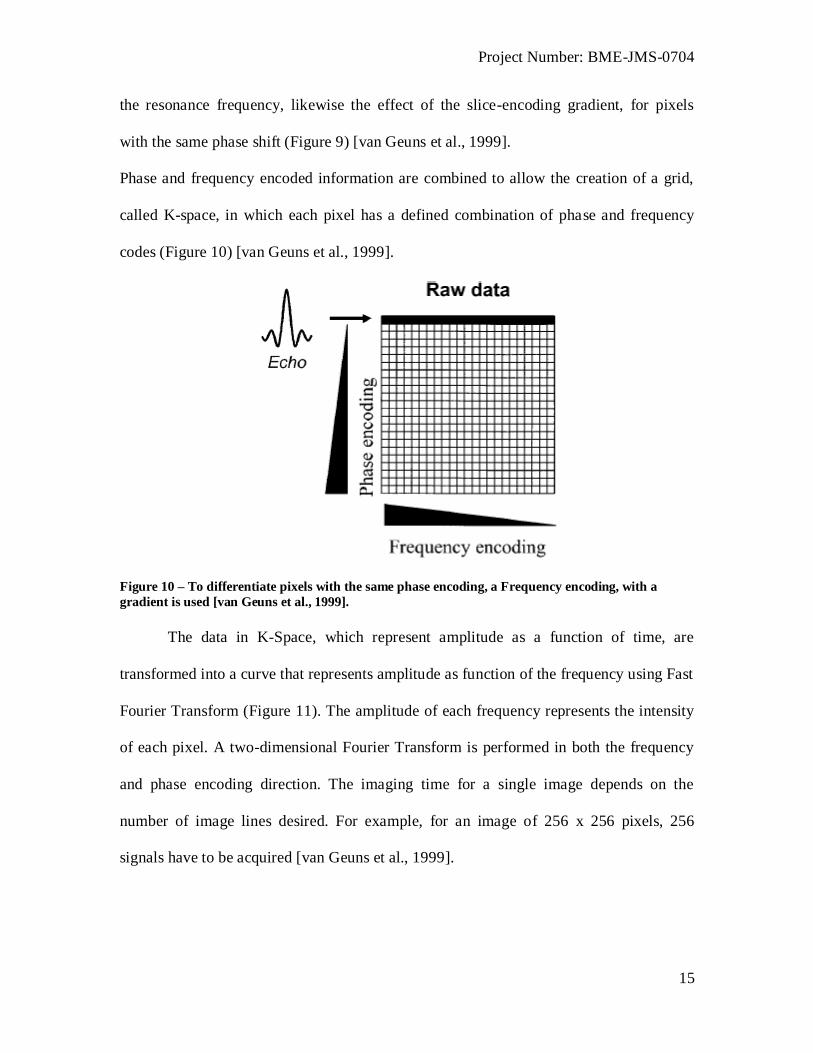
Phase and frequency encoded information are combined to allow the creation of a grid,
called K-space, in which each pixel has a defined combination of phase and frequency
codes (Figure 10) [van Geuns et al., 1999].
Figure 10 – To differentiate pixels with the same phase encoding, a Frequency encoding, with a
gradient is used [van Geuns et al., 1999].
The data in K-Space, which represent amplitude as a function of time, are
transformed into a curve that represents amplitude as function of the frequency using Fast
Fourier Transform (Figure 11). The amplitude of each frequency represents the intensity
of each pixel. A two-dimensional Fourier Transform is performed in both the frequency
and phase encoding direction. The imaging time for a single image depends on the
number of image lines desired. For example, for an image of 256 x 256 pixels, 256
signals have to be acquired [van Geuns et al., 1999].
Project Number: BME-JMS-0704
16
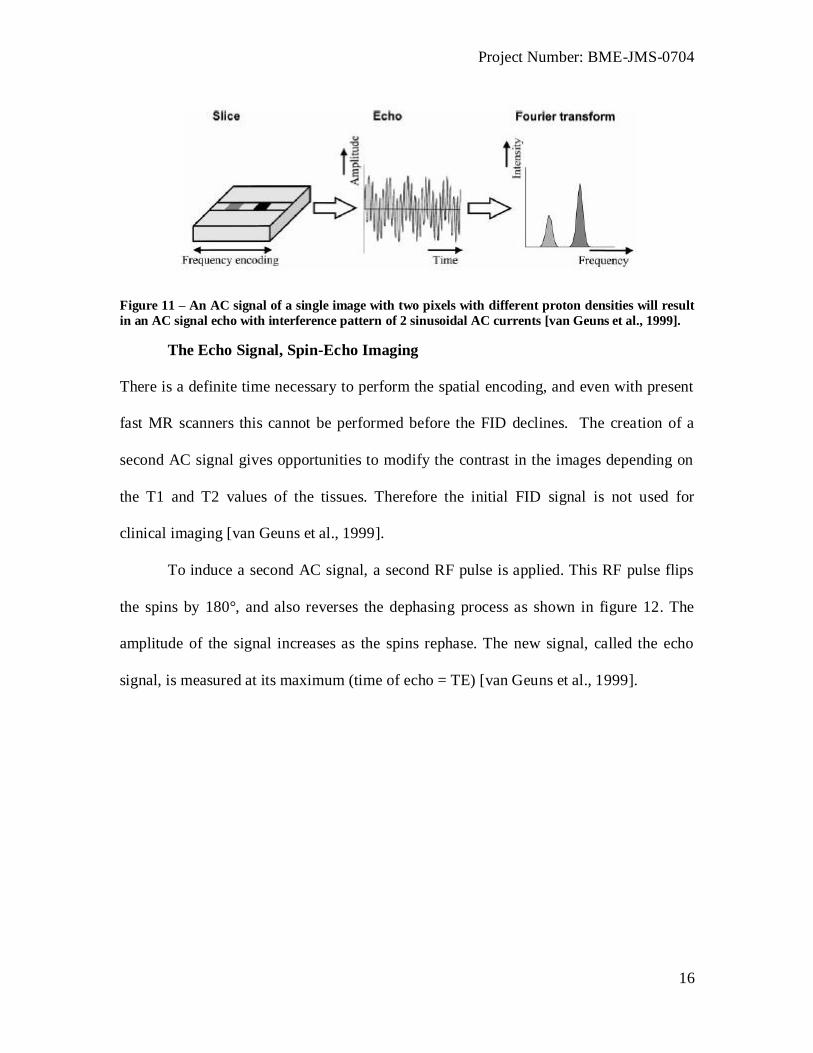
Figure 11 – An AC signal of a single image with two pixels with different proton densities will result
in an AC signal echo with interference pattern of 2 sinusoidal AC currents [van Geuns et al., 1999].
The Echo Signal, Spin-Echo Imaging
There is a definite time necessary to perform the spatial encoding, and even with present
fast MR scanners this cannot be performed before the FID declines. The creation of a
second AC signal gives opportunities to modify the contrast in the images depending on
the T1 and T2 values of the tissues. Therefore the initial FID signal is not used for
clinical imaging [van Geuns et al., 1999].
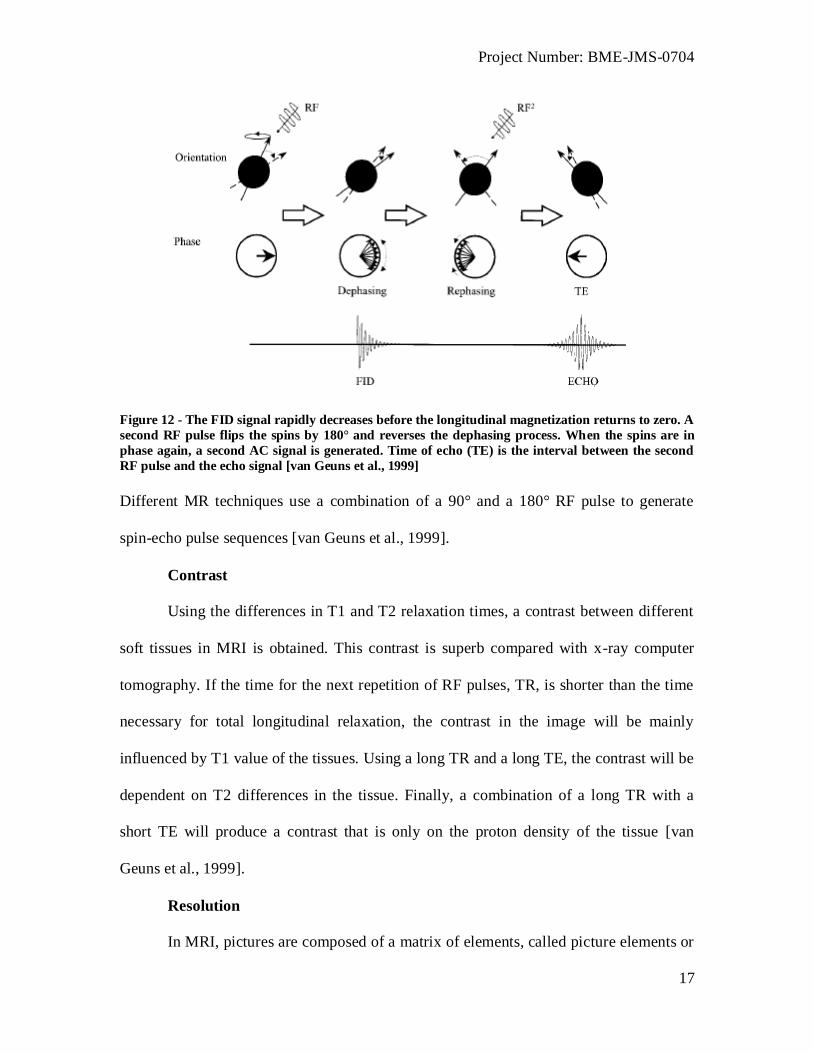
To induce a second AC signal, a second RF pulse is applied. This RF pulse flips
the spins by 180°, and also reverses the dephasing process as shown in figure 12. The
amplitude of the signal increases as the spins rephase. The new signal, called the echo
signal, is measured at its maximum (time of echo = TE) [van Geuns et al., 1999].
Project Number: BME-JMS-0704
17
Figure 12 - The FID signal rapidly decreases before the longitudinal magnetization returns to zero. A
second RF pulse flips the spins by 180° and reverses the dephasing process. When the spins are in
phase again, a second AC signal is generated. Time of echo (TE) is the interval between the second
RF pulse and the echo signal [van Geuns et al., 1999]
Different MR techniques use a combination of a 90° and a 180° RF pulse to generate
spin-echo pulse sequences [van Geuns et al., 1999].
Contrast
Using the differences in T1 and T2 relaxation times, a contrast between different
soft tissues in MRI is obtained. This contrast is superb compared with x-ray computer
tomography. If the time for the next repetition of RF pulses, TR, is shorter than the time
necessary for total longitudinal relaxation, the contrast in the image will be mainly
influenced by T1 value of the tissues. Using a long TR and a long TE, the contrast will be
dependent on T2 differences in the tissue. Finally, a combination of a long TR with a
short TE will produce a contrast that is only on the proton density of the tissue [van
Geuns et al., 1999].
Resolution
In MRI, pictures are composed of a matrix of elements, called picture elements or
Project Number: BME-JMS-0704
18
pixels. The image represents the field of view (FOV). The image matrix defines the
number of pixels used to create an image. The number of pixels is determined by the
number of frequency encodings (e.g. 256 on the x-axis) and the number of phase-
encodings (e.g. 256 on the y-axis) for a certain FOV. Therefore, the volume of each pixel
is determined by the FOV, the matrix size used, and the slice thickness [van Geuns et al.,
1999].
Resolution can be increased by changing the pixel size (the smaller, the higher the
resolution), but the signal-to-noise ratio (SNR) is the limiting factor. When the pixels
become too small, they do not contain enough spinning protons to produce a measurable
signal [van Geuns et al., 1999].
Functional MRI (fMRI)
It was established, as long ago as 1890 that physiological functions in the brain
correspond to regional brain activity. Magnetic resonance has the capability to measure
the brain activity due to physiological functions. The most common current technique
uses blood oxygen level dependent (BOLD) contrast, which is based on the magnetic
susceptibility of hemoglobin (Hb). Deoxygenated Hb is paramagnetic, while oxygenated
Hb is diamagnetic. The presence of the paramagnetic deoxygenated Hb distorts the static
magnetic field. Therefore, changes in blood oxygenation can cause changes in the MR
decay parameters [Noll et al. 2001].
Since the deoxygenated-Hb effect is quite small relative to the noise of the system
it is typically not visible in a single experimental condition or time slice, but a composite
effect can be identified after statistical tests [Kulkarni,2005].
A critical step after image acquisition in any functional MRI study is data analysis
Project Number: BME-JMS-0704
19
and result compilation. In this project, a quantitative analysis strategy optimized for the
rat brain was used. In this strategy, each subject is registered to a complete volume
segmented atlas, a reference rat brain. All registered images are then segmented based on
atlas into several regions of interst (ROIs). Statistical tests are performed on each subject
and a statistical composite is created for each ROI by summing up individual analyses
within ROIs. The detailed description of the strategy and algorithm is described in next
chapters.
Controlling for motion
Motion artifact is a considerable problem in fMRI studies. In this study, the fMRI
experiment is performed on fully conscious rats and high quality images of brain are
acquired. Any head movement distorts the image and may also create a change in signal
intensity that can be mistaken for stimulus-associated changes in brain activity. Motion
artifact can be reduced by the use of general anesthesia; however, since we like to study
the neurobiology, this is not a feasible solution as it precludes the study of brain activity
involving cognition and emotion. Furthermore, anesthetics depress neuronal activity
reducing MR signal [King et al., 2005].
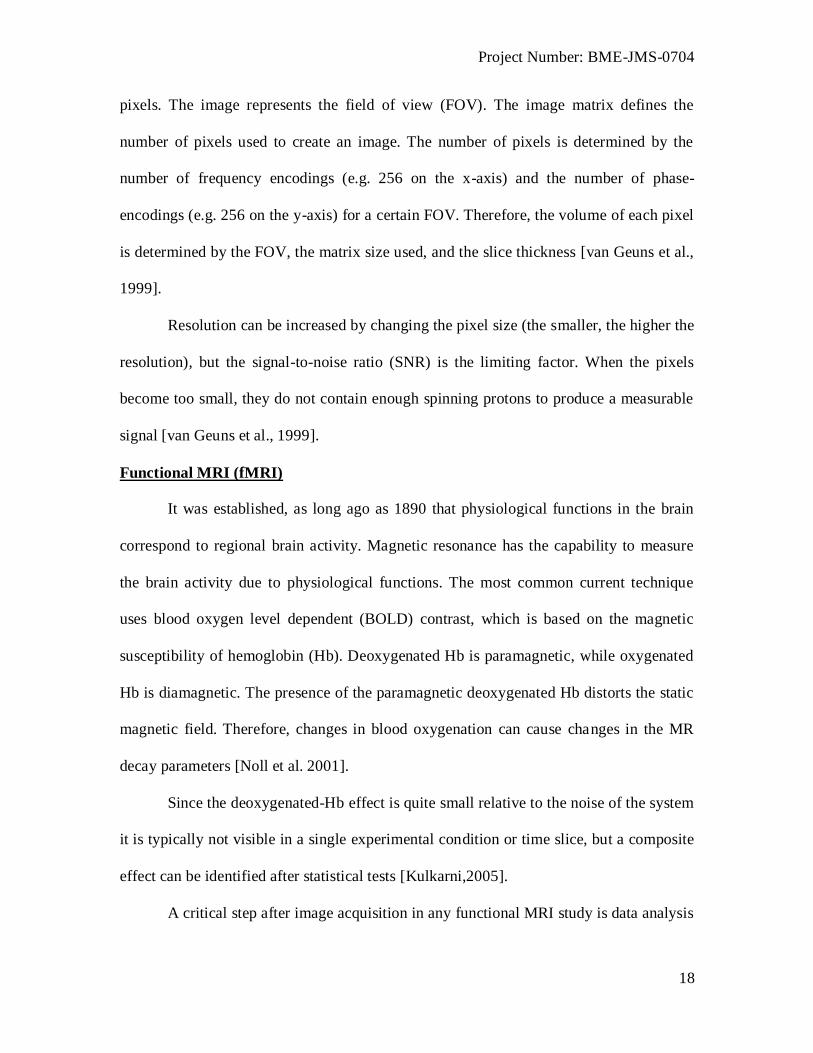
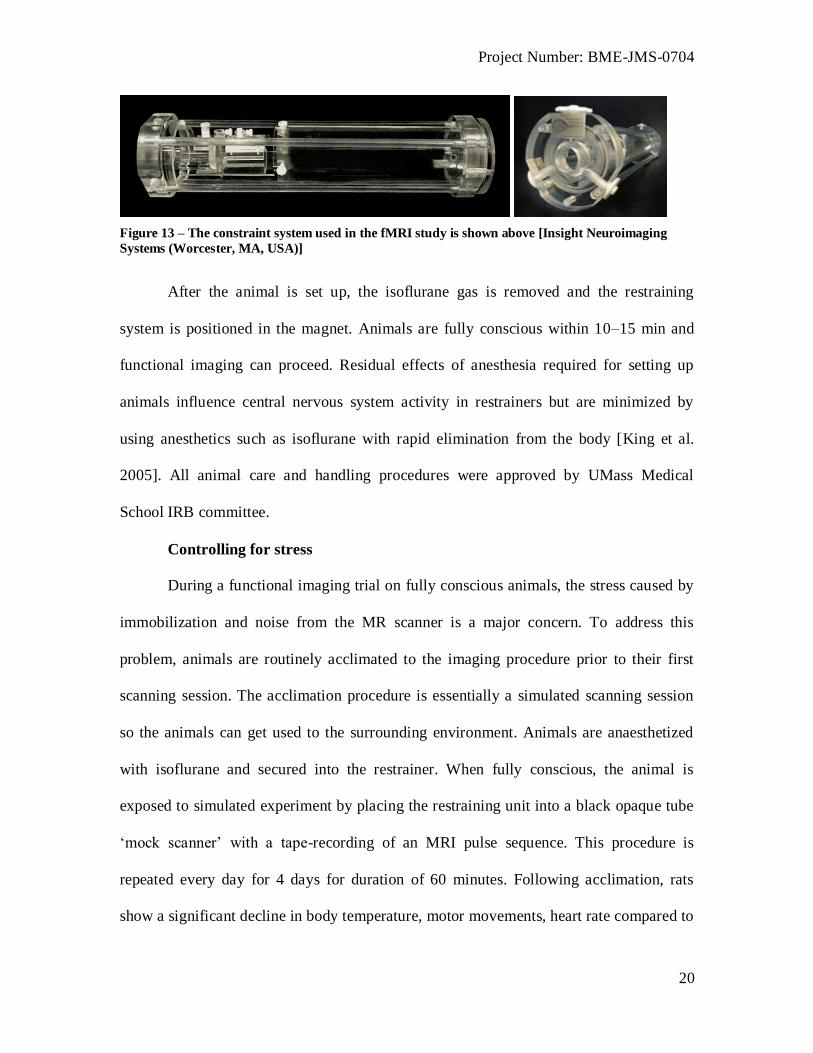
One entirely noninvasive system developed by Insight Neuroimaging Systems
(Worcester, MA, USA) was used in this study to set up an animal in just a few minutes.
Just prior to the imaging session, animals are lightly anaesthetized with isoflurane gas.
The head is then secured into a stereotaxic-like support system with ear bars and nose
clamp. The body of the animal is placed into a body. This design isolates all of the body
movements from the head restrainer and minimizes motion artifact. The restraint system
is shown in figure 13 [King et al., 2005].
Project Number: BME-JMS-0704
20
Figure 13 – The constraint system used in the fMRI study is shown above [Insight Neuroimaging
Systems (Worcester, MA, USA)]
After the animal is set up, the isoflurane gas is removed and the restraining
system is positioned in the magnet. Animals are fully conscious within 10–15 min and
functional imaging can proceed. Residual effects of anesthesia required for setting up
animals influence central nervous system activity in restrainers but are minimized by
using anesthetics such as isoflurane with rapid elimination from the body [King et al.
2005]. All animal care and handling procedures were approved by UMass Medical
School IRB committee.
Controlling for stress
During a functional imaging trial on fully conscious animals, the stress caused by
immobilization and noise from the MR scanner is a major concern. To address this
problem, animals are routinely acclimated to the imaging procedure prior to their first
scanning session. The acclimation procedure is essentially a simulated scanning session
so the animals can get used to the surrounding environment. Animals are anaesthetized
with isoflurane and secured into the restrainer. When fully conscious, the animal is
exposed to simulated experiment by placing the restraining unit into a black opaque tube
‗mock scanner‘ with a tape-recording of an MRI pulse sequence. This procedure is
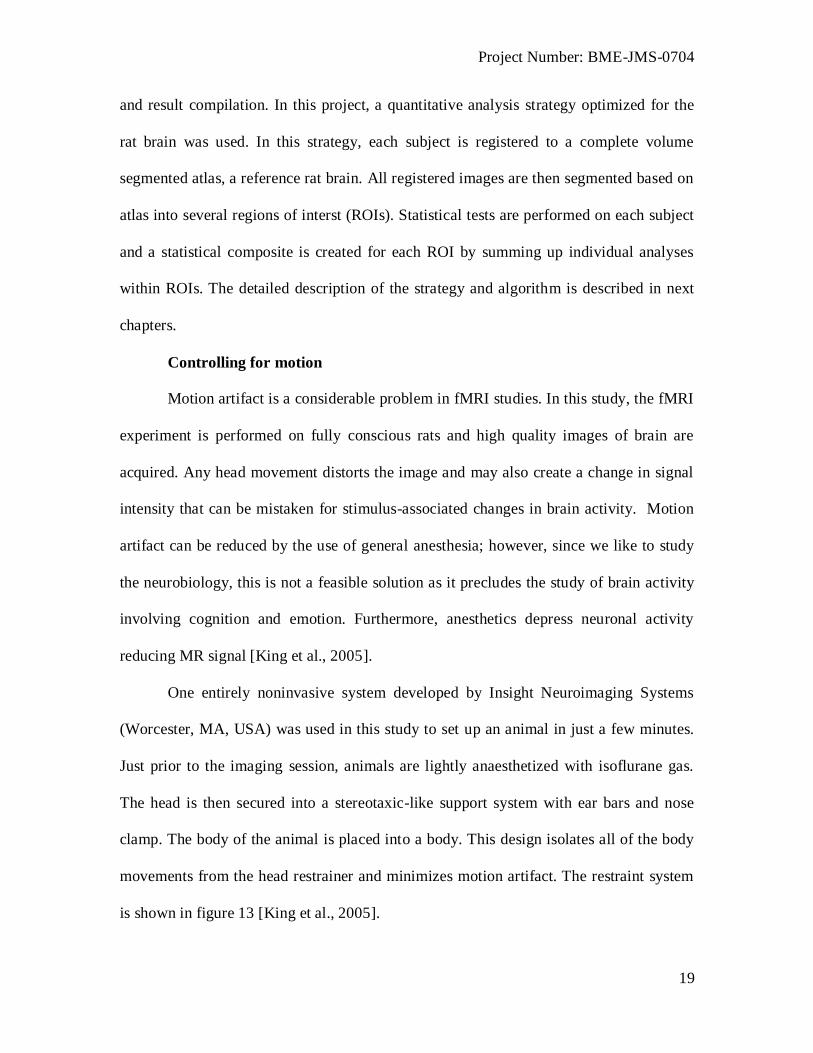
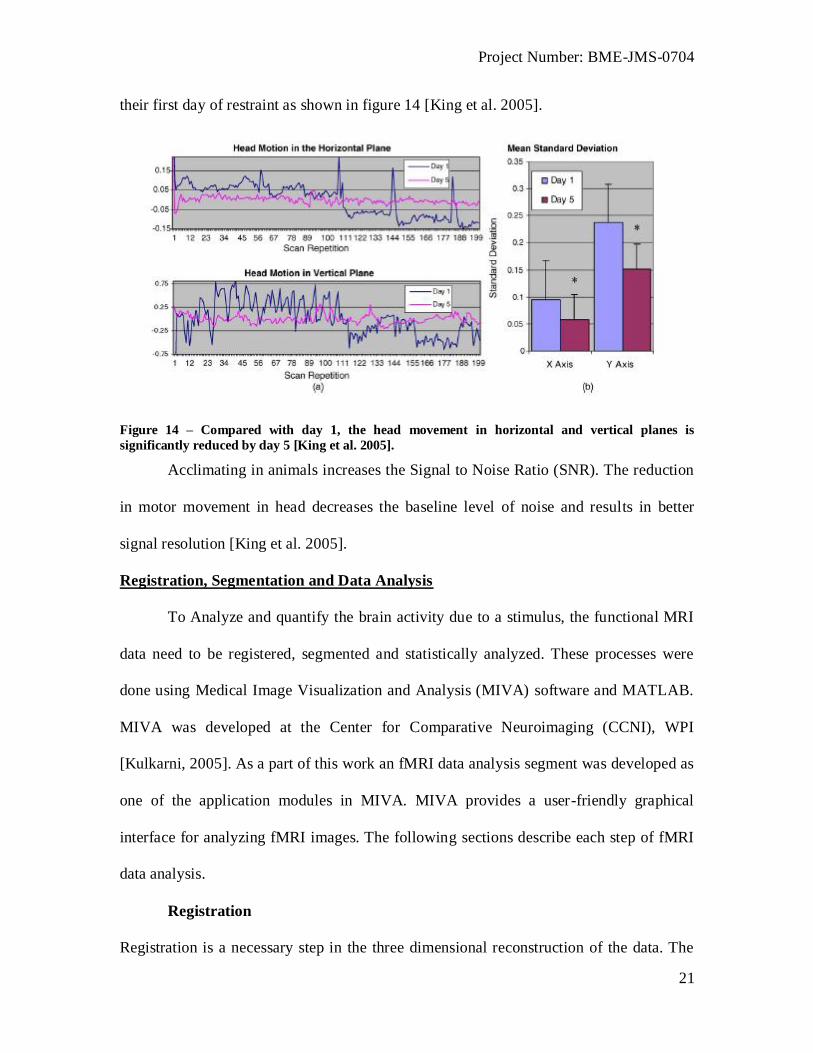
repeated every day for 4 days for duration of 60 minutes. Following acclimation, rats
show a significant decline in body temperature, motor movements, heart rate compared to
Project Number: BME-JMS-0704
21
their first day of restraint as shown in figure 14 [King et al. 2005].
Figure 14 – Compared with day 1, the head movement in horizontal and vertical planes is
significantly reduced by day 5 [King et al. 2005].
Acclimating in animals increases the Signal to Noise Ratio (SNR). The reduction
in motor movement in head decreases the baseline level of noise and results in better
signal resolution [King et al. 2005].
Registration, Segmentation and Data Analysis
To Analyze and quantify the brain activity due to a stimulus, the functional MRI
data need to be registered, segmented and statistically analyzed. These processes were
done using Medical Image Visualization and Analysis (MIVA) software and MATLAB.
MIVA was developed at the Center for Comparative Neuroimaging (CCNI), WPI
[Kulkarni, 2005]. As a part of this work an fMRI data analysis segment was developed as
one of the application modules in MIVA. MIVA provides a user-friendly graphical
interface for analyzing fMRI images. The following sections describe each step of fMRI
data analysis.
Registration
Registration is a necessary step in the three dimensional reconstruction of the data. The
Project Number: BME-JMS-0704
22
objective of this step is to map MRI anatomy images of all subjects to a fully segmented
rat atlas using minimal user intervention. When the images acquired from all subject are
registered or aligned to each other, a composite image is obtained which can then be
segmented and statistically analyzed. In MIVA, the ‗Swanson‘ rat brain atlas is used as a
reference brain anatomical map in MIVA [Kulkarni, 2005].
Consider the following matrices,
[S] = Global co-ordinates of a Subject
[A] = Global co-ordinates of the Atlas or Reference
In the registration process, we seek the co-ordinate transformation matrix [T] that
aligns the subject with the Atlas space. In other words,
[A] = [T][S]
In this equation, [T] is a 4x4 matrix that provides complete linear transformation
(rotation, translation, scaling) [Kulkarni, 2005].
In the registration process, the subject images are first aligned to each other, intra
registration, and then registered to the rat atlas, inter registration. In intra registration,
the objective is to align all subjects to one standard subject. One of the N subjects is
arbitrarily chosen as the standard subject and all other (N-1) subjects are aligned to this
standard subject. In other words,
{Standard}=[TSubject-to-Standard]j{Subject}j
where j=1 to N-1.
In inter registration, the standard subject is aligned to the segmented reference
atlas; in other words,
Project Number: BME-JMS-0704
23
{Atlas}= [TStandard-to-Atlas]{Standard}
When the subject-to-standard transformation matrix is multiplied by standard-to-
atlas transformation matrix, all subject are registered to the atlas.
{Atlas}=[TStandard-to-Atlas][TSubject-to-Standard]{Subject}j
{Atlas}=[TSubject-to-Atlas]j {Subject}j
There are several registration methods used in this study [Kulkarni, 2005].
Manual registration
Manual registration is based on the visual feedback from the user‘s computer
visualization system. In this method the user is required to do the registration process and
manipulate images through 3 orthogonal views of the brain, axial, coronal and sagittal
based on a real-time visual feedback. The registration is performed by translation,
rotation and scaling factors in x,y and z direction until good alignment is achieved
[Kulkarni, 2005].
4-point Fiducial Registration
The 4-point fiducial registration is a faster method of registration compared to the
manual registration. In this method, the ideal 4 points from an equilateral tetrahedron on
one subject (the Standard subject) is mapped to another subject equilateral tetrahedron.
First, a triangle (the base of the tetrahedron) is created on one slice and a single point on a
distant slice (the tip of the tetrahedron) in the standard subject. The same 4 points is
chosen in the other subject. MIVA has the ability to align these 4-points onto each other
and therefore register the subject to the standard subject [Kulkarni, 2005].
The same procedure can be applied to align all subjects to the standard subject
(intra registration) and finally applied to align the standard subject to the atlas (inter
Project Number: BME-JMS-0704
24
registration) [Kulkarni, 2005].
Genetic Algorithm
The sequential Genetic Algorithm (GA) mimics the pathway of an expert
manually doing registration [Huang, 2007]. Huang demonstrated that genetic algorithm
registration provides high alignment accuracy reliability for brain tissues. The genetic
algorithm avoids local minima and maxima traps of conventional optimization
techniques. GA does not require any preprocessing of conventional registration methods
such as threshold, smoothing, segmentation, or definition of base points or edges.
The Genetic Algorithm uses a finite element method to get the displacement of
each element node by applying a boundary mapping. This method provides an accurate
image registration with excellent boundary alignment of each pair of slices with minimal
user involvement and finally aligns the entire volume automatically [Huang, 2007]. We
used the proposed registration strategies to align multiple subjects to the standard rat
atlas, which is aligned to a segmented reference atlas. All subjects were aligned to the
segmented atlas and a full fMRI analysis was possible.
Genetic algorithm is a search algorithm based on the mechanics of natural
selection and natural genetics that can be used as a registration method. A possible
registration solution is presented as a chromosome in a string structure with each element
representing one parameter in the solution. Several chromosomes are then form a
population, which then produces another generation through a search process. The search
process uses a ‗fittest survivors‘ rule after a structured yet randomized information
exchange within the existing generation to produce a new generation. After the new set of
Project Number: BME-JMS-0704
25
chromosomes is produced with the mutation operation, we then select some of them,
together with the original chromosomes, to be the new generation with the aid of the
fitness function. After these steps are applied multiple times, the chromosomes will
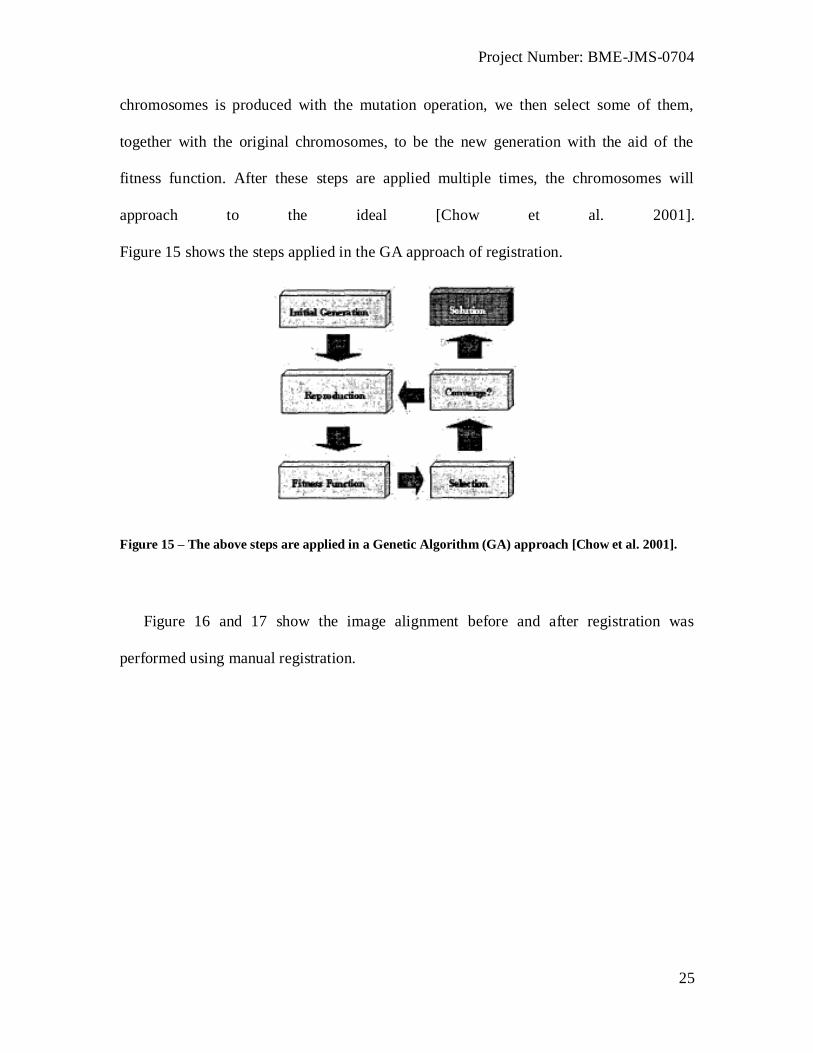
approach to the ideal [Chow et al. 2001].
Figure 15 shows the steps applied in the GA approach of registration.
Figure 15 – The above steps are applied in a Genetic Algorithm (GA) approach [Chow et al. 2001].
Figure 16 and 17 show the image alignment before and after registration was
performed using manual registration.

Project Number: BME-JMS-0704
26
Figure 16 - image alignment before registration was performed using manual registration is shown
above.
Figure 17 - image alignment after registration was performed using manual registration is shown above.
Segmentation
The purpose of segmentation is to divide an image into meaningful sub-regions
and label those regions for further analysis. This step is critical in fMRI studies. The
Project Number: BME-JMS-0704
27
brain can be segmented into different regions of interest (ROI) and activation level can be
reported. In this study, we define different anatomical regions within the brain by
superimposing the image onto Atlas and then extracting the segmented boundaries. For
this purpose, a completely segmented 3D Rat Brain Atlas was developed in MIVA
[Kulkarni 2005].
Mapping MRI image
In functional Magnetic Resonance Imaging (fMRI), an anatomy volume image is
collected from each subject with a 256 x 256 with 14 slices through the brain. After the
anatomy volume image is obtained, a temporal sequence of functional images are
collected at a lower resolution of 64 x 64 while retaining the same 14 slices through the
brain.. Although this method reduces the spatial resolution, it allows a more rapid cycle
frequency and enhances transient data associated with the control and stimulation time
dynamics of the MRI study [Kulkarni 2005].
Since the anatomy volume image has a higher resolution, it is used for registration
and segmentation. Also since atlas resolution [512x512x300] is much higher than subject
functional image resolution [64x64x14], results in multiple atlas voxels taking up a single
subject voxel. In this study, the subject voxel was classified based on the centroid atlas
voxel information where the type of material in the center of the subject voxel was
chosen for the whole voxel [Kulkarni 2005].
Statistical Analysis
Statistical t-tests need to be performed on each subject with a 95% confidence
level, one-tailed distributions, and heteroscedastic variance assumptions. Since multiple
t-test analyses are performed, a false-positive detection controlling mechanism need to be

Project Number: BME-JMS-0704
28
introduced. This subsequent filter guarantees a false-positive detection rate of 0.05. Those
pixels deemed statistically significant retain their percentage change values (stimulation
mean minus control mean) relative to control mean and all other pixel values are set to
zero. The t-test tab in MIVA displays the various test parameters. The user needs to
specify these parameters based on the design of the experiment. The same test can also be
performed using MATLAB [Kulkarni 2005].
Results Summary
The result of the analysis MIVA is presented as an image for visualization as well
as numerical summary used for statistical validation.
Project Number: BME-JMS-0704
29
CHAPTER 3 - PROJECT APPROACH
After initial stimulation from a drug such as nicotine, the brain responds
primordially to the influx of neurotransmitters. This stimulation causes an array of
responses. The brain creates memory of its physical reaction and chemical reaction.
This memory is involved in sensitization of the rat brain to nicotine [Li et al. 2008].
Previous studies have explored the rat brain during full response after
sensitization and prior to sensitization [Li et al. 2008]. During these regular daily
injections the rats have elevated locomotor activity and overstimulation within the
areas of interest within the brain. However the refractory period of nicotine has not
been explored. In order to explore this refractory period experimentation will be
conducted in the period of time between regular doses of nicotine. The length of the
refractory period of nicotine in the Spraque-Dawley rat model is not known. The
refractory period will thus be explored with a number of experiments followed by
extensive analysis.
Hypothesis
It is hypothesized that during the refractory period of the sensitized rat, the areas
of the brain will not fully respond to a challenge dose of nicotine. This hypothesis is
based on the fact that the nicotine receptors are saturated with neurotransmitters and
need time to recover before they can react to more nicotine.
Assumptions
The refractory process was assessed behaviorally through a black box observation
and neurologically though fMRI imaging. Both of these techniques are trying to gage the
Project Number: BME-JMS-0704
30
rats‘ reaction to the stimulus. The rat should not be exposed to any other kind of sensory
stimulation or it may influence the results. All steps were taken to minimize any outside
influences however, they cannot be completely eliminated.
In the black box observation, the rats are given an injection subcutaneously and
then placed in the box. Red lights were placed around the box and the rat was placed in.
The tracking system was placed in the room and the operators (students and lab
technician) were present throughout the procedure. It is assumed that the presence of
people did not incite stress within the rats and since these rats have been handled by
people throughout their life.
During image acquisition the animals are placed in the restraints and then in the
MRI magnet. The bore of the magnet is open on both sides. After the rat is placed in the
machine a baseline imaging of 5 minutes is done, at which point an operator goes into the
magnet room and injects the stimulation though the syringe that has been already placed
on the tail vain. This is a 30 second process after which the operator leaves the room
once more. It is assumed that the rat does not respond to the visual and auditory
stimulation of seeing and hearing the operator. Furthermore, while analysis is conducted,
the data taken during and 2 minutes after the injection are discarded in order to minimize
stimulation that may have been caused by the operator.
The sensitization of the behavior study and fMRI study occur at different times
for practical purposes. The assumption is that this will not change the way the rats go
through the sensitization process and the rat activity is compared with its own baseline,
so the assumption is that the change that the stimulation will cause will be the same.
However rats are much more active during the night then during the day period.

Project Number: BME-JMS-0704
31
The ROIs were chosen based on the hypothesis that the mesolimibic system is involved
in the response of drug abuse.
Project Number: BME-JMS-0704
32
CHAPTER 4 - DESIGN
Problem Definition
The goal of this project was to identify the brain activity during the refractory
period of nicotine. In order to accomplish this goal, an experimental procedure was
created to test the hypothesis. This experiment must verify the hypothesis within
established constraints. The experiment must identify the presence and time frame of the
refractory period, it must provide functional MRI images during the refractory period,
and it must produce data that compares the brain activity of nicotine to a control group.
These goals created consecutive steps which determined the design of experimentation
for each successive step. As such, an overall approach was first developed and then was
revised after the results of each step.
Brainstorming of Experimental Components
It is known that nicotine stimulation causes increased locomotor activity. To find the
refractory period of nicotine an animal model is required. The animals should be first
sensitized to nicotine, and then given challenge doses of nicotine. Their movements
should be quantified in reaction to nicotine throughout the sensitization process as well as
during the challenge dose. These should then be compared to the control group. A
number of considerations must be taken in the design of the experimental study.
The animal model to be used. Previous studies of nicotine addiction have been
conducted on animal models such as pig [Zhu at al., 2005], squirrel monkey
[Stolerman 1994], rat [King et al., 2008], and mouse [Picciotto et al. 2007].
Project Number: BME-JMS-0704
33
Once the refractory period is identified, the fMRI study can use the middle of the
refractory period, the beginning of the refractory period, or the end of the
refractory period for stimulation and imaging.
The fMRI study can be conducted on the same group of rats as the behavior study
or another group of rats.
Imaging should be taken for half an hour [King at al. 2008]
Injection can be given subcutaneously, intravenously, same for both studies, or
different for both studies based on practicality.
Images should be taken using the BOLD sequence since we want to see
functionality.
The threshold of activation should be placed at 0.01 to determine activation
significance.
Analysis software for fMRI include AFNI, Stimulate, MIVA, MATLAB and
other commercial software.
After the data was acquired the images were registered to each other and then
segmented to the brain map. There are various methods of registration. After registration
testing with each one, the manual technique was adopted as the gold standard and used
for further manipulation of the data.
Constraints
The MRI magnet at the CCNI center has a 40cm bore diameter. This physical
limitation allows only small animals to be imaged. This constrains our choice of animal
model for experimentation of nicotine addiction. Furthermore as of now the facility only
Project Number: BME-JMS-0704
34
has approval for work with rats and mice. Rats have been used in past studies to analyze
nicotine addiction and were the animal model used for this study.
The initial experiment performed to identify and locate the refractory period was a
locomotor activity experiment. This experiment is relatively cheaper and easier to
conduct compared to an MRI study. For this experiment, 8 rats were provided. This
confines the number of subjects for the experimental and control group.
After the behavior study was done, it was found that the refractory period was
within 12 hours after the regular drug administration. This determines the stimulus time
period for the imaging study. This means that after addiction is reached the challenge
dose will be given 12 hours after regular doses, and this is the time at which imaging
would take place. Due to magnet usage times and drug administration times, the 8
animals would have to be sensitized at a time beginning at 4 different days. This is
because an hour needs to be allocated for the imaging of each subject and the evening are
relatively free for magnet usage.
The operators of the experimental procedure (MQP students/ authors of this
paper) needed to become familiar with animal handling procedures, good clinical
practices, MRI functionality, usage and understanding, as well as data acquisition and
analysis software usage . This places a time constraint of 7 weeks for experiment design
and execution and 7 weeks of analysis.
The Software available for analysis were excel, MIVA and MATLAB.
Final Design
The hypothesis to be tested first requires the identification of the refractory
period. Past studies have shown that reaction to nicotine stimulation causes an increase
Project Number: BME-JMS-0704
35
in locomotor activity in rats for at least 30 minutes after stimulation is administered [Li,
2008]. The rat was chosen as the model because it is easily available, cheap, easier to
work with than the mouse, which is smaller, and the facility has AICUC permission for
mouse and rat work. It is also practical for the available restraint and MRI magnet.
After the consideration of the project constraints and comparison of choices from
the brainstorming ideas a final procedural study was established. It was determined that
the rats would be given the injection subcutaneously in the behavioral study since this is a
proven method of stimulus administration. For the fMRI study the rats would be given
the injection intravenously though the tail. This was because the tail was easily
accessible on the animal and giving the stimulus into the blood would ensure immediate
delivery to the brain which would create a more immediate response, ideal for imaging.
To test this hypothesis and find whether nicotine does have a refractory period
and when it exists in this model, a behavior experiment was established. Eight rats were
divided randomly into an experiment group and a control group. The experimental group
was sensitized to nicotine and the control group was given saline. In this manner both
groups would be used to the injections. The rats would then be observed in a relatively
dark and quiet environment such that their stress level remained at a minimum.
From this point the fMRI study would be conducted. The rats would be sensitized
as in the behavioral study, and then acclimated to eliminate stress as described in the
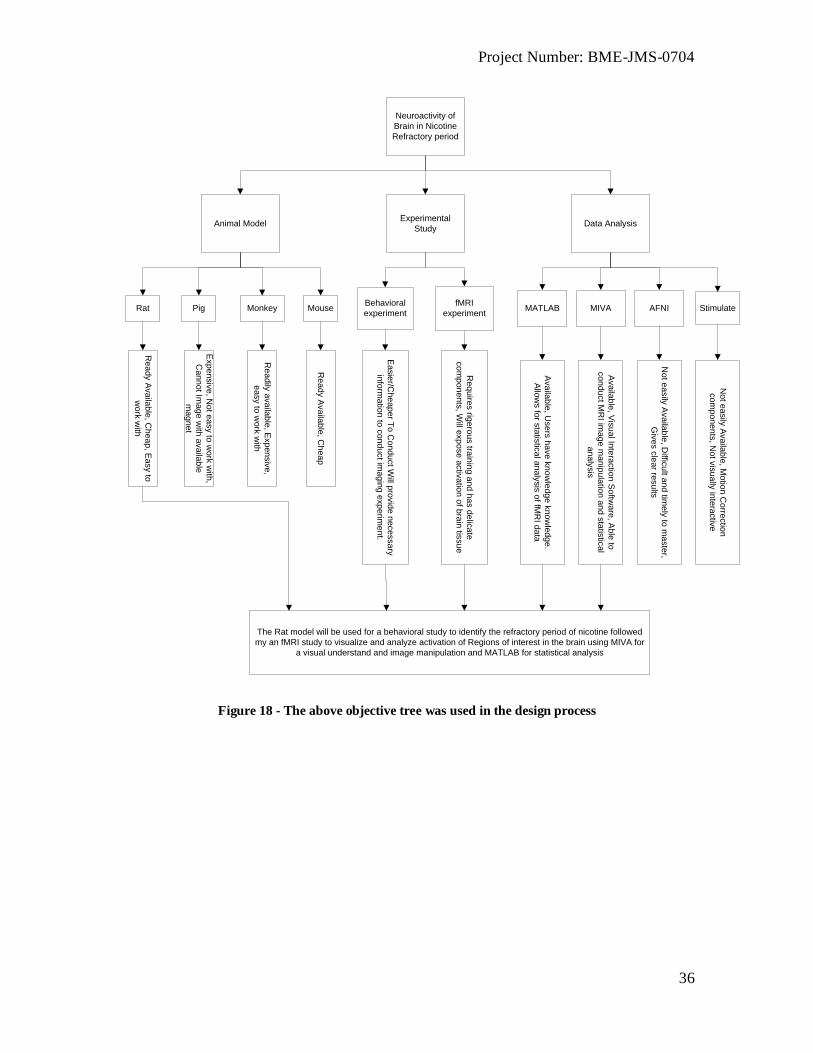
literature review. The data would be gathered from the MRI and analyzed. Figure 18
shows the flow of the though process of the experimental design.
Project Number: BME-JMS-0704
36
Neuroactivity of
Brain in Nicotine
Refractory period
Experimental
StudyAnimal Model Data Analysis
Rat Behavioral
experimentMIVAPig Monkey Mouse
fMRI
experimentMATLAB AFNI Stimulate
Re
ad
y A
va
ilab
le, C
he
ap
, Ea
sy to
wo
rk w
ith
Re
ad
y A
va
ilab
le, C
he
ap
Re
ad
ily a
va
ilab
le, E
xp
en
siv
e,
ea
sy to
wo
rk w
ith
Exp
en
siv
e, N
ot e
asy to
wo
rk w
ith,
Ca
nn
ot Im
ag
e w
ith a
va
ilab
le
ma
gn
et
Ea
sie
r/Ch
ea
pe
r To
Co
nd
uct W
ill pro
vid
e n
ece
ssa
ry
info
rma
tion
to c
on
du
ct im
ag
ing
exp
erim
en
t.
Re
qu
ires rig
ero
us tra
inin
g a
nd
ha
s d
elic
ate
co
mp
on
en
ts, W
ill exp
ose
activ
atio
n o
f bra
in tis
su
e
Ava
ilab
le, U
se
rs h
ave
kn
ow
led
ge
kn
ow
led
ge
.
Allo
ws fo
r sta
tistic
al a
na
lysis
of fM
RI d
ata
Ava
ilab
le, V
isu
al In
tera
ctio
n S
oftw
are
, Ab
le to
co
nd
uct M
RI im
ag
e m
an
ipu
latio
n a
nd
sta
tistic
al
an
aly
sis
No
t ea
sily
Ava
ilab
le, D
ifficu
lt an
d tim
ely
to m
aste
r,
Giv
es c
lea
r resu
lts
No
t ea
sily
Ava
ilab
le, M
otio
n C
orre
ctio
n
co
mp
on
en
ts, N
ot v
isu
ally
inte
ractiv
e
The Rat model will be used for a behavioral study to identify the refractory period of nicotine followed
my an fMRI study to visualize and analyze activation of Regions of interest in the brain using MIVA for
a visual understand and image manipulation and MATLAB for statistical analysis
Figure 18 - The above objective tree was used in the design process
Project Number: BME-JMS-0704
37
CHAPTER 5 - METHODS
Animal Care
Subjects were male Sprague–Dawley rats (275–300 g) obtained from Charles
River Laboratories (Wilmington, MA) and were housed in Plexiglas cages (two in a
cage). Animals were maintained in ambient temperature (22–24 ◦C) on a 12-hour light,
12-hour dark schedule with lights on at 09:00h. Food and water were provided ad libitum.
The procedures were approved and monitored by the University of Massachusetts
Medical School Institutional Animal Care and Use Committee (IACUC).
Drug Administration
The experimental and the control group were injected with nicotine and saline
respectively. For the experimental group, Nicotine tartrate was dissolved in distilled
water at a concentration of 0.4 mg/kg, measured as the base, and the solution was
adjusted with Na2PO4 to a physiologic pH. For the control group, sodium chloride was
dissolved in de-ionized water to a final concentration of 0.9%. All injections were in
volumes of 1 ml/kg body weight. Both drugs were purchased from Sigma Chemical, St.
Louis, MO.
Experiment #1 - Behavioral Study
To sensitize animals to nicotine a dose of 0.4mg/kg was injected subcutaneously
(SC) on a daily basis. Adult male Sprague–Dawley rats were matched for body weight
and randomly assigned to nicotine or saline treatment groups (n=4 per group). On each
day, each animal was placed in a non-reflective black open field of 121 cm by 121 cm for
5 minutes to habituate to the environment and. The animals were the injected with a dose
of saline or nicotine according to their group. Immediately following each injection, the
distance traveled was tracked using Ethovision® XT video tracking system (Noldus

Project Number: BME-JMS-0704
38
Information Technology, Waginingen, Netherlands) for a duration of 10 minutes.
Figure 19 - each animal was placed in a black open field. Immediately following each injection, the
distance traveled was tracked.
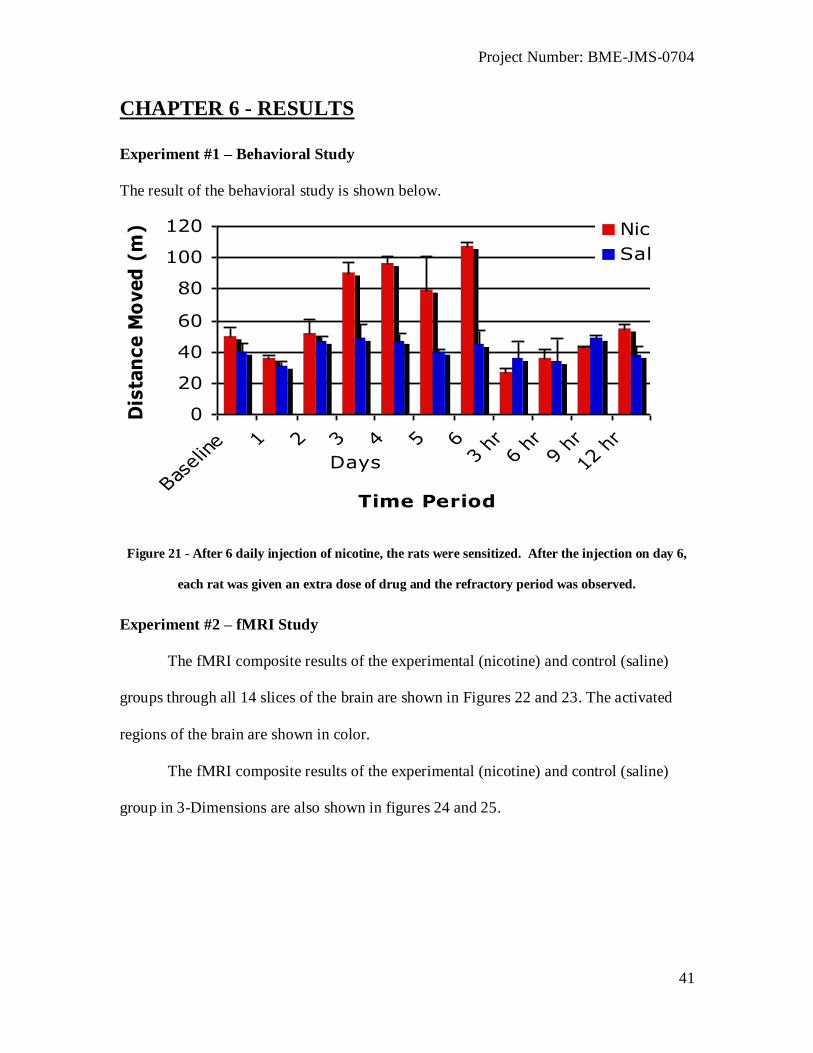
Animals received daily SC injections for 6 consecutive days. Sensitization was
achieved circa day 3 [See results]. On day 6 the locomotor activities were also measured
after 3 hours, 6 hours, 9 hours or 12 hours immediately after the last injection. The
locomotor activity was documented and employed to confirm that the nicotine is subject
to a refractory period and thus fMRI analysis can be performed.
Experiment #2 – fMRI study
fMRI study
All animals were first acclimated and then randomly separated into two groups
(n=4). The experimental group received a dose of nicotine for 6 days followed by a final
dose of nicotine after 12 hours of last injection. The second group received saline in the
same manner. Each animal was imaged once during this last injection. The doses of
nicotine and saline were administered via the lateral tail vein while the animal was in the
magnet.
fMRI Imaging procedure
The acclimated rats were restrained in a multi-concentric, dual-coil, animal
restrainer (Insight Neuroimaging Systems, LLC, Worcester, MA). They were lightly

Project Number: BME-JMS-0704
39
anesthetized with 2.5% isoflurane. A plastic semicircular headpiece with blunt supports
was fitted into the ear canals. The animal's canines were secured over the bite bar of a
head holder and the earpieces were secured with adjustable screws and fitted into lateral
sleeves. The adjustable surface coil built into the head holder was pressed firmly on the
head and locked in place. The body was then placed in a sleeve that was suspended down
the center of the cylindrical chassis and fitted with rubber gaskets to dampen motion. The
headpiece locked into an immobile mounting post on the front of the chassis. The flow of
isoflurane gas was terminated once the animal was secured in the head holder. A volume
coil was then placed over the head restrainer and locked in position. The setup procedure
took about 10 minutes, by which time the animals were fully conscious. Figure 20 shows
the final outcome of the procedure.
Figure 20 - A dual coil rat restrainer system used for fMRI study
Animals were then placed in a Bruker Biospec 4.7T scanner (Oxford Instrument,
Oxford, UK) equipped with a Biospec Bruker console (Bruker, Billerica, MA). Once the
animal was secured in the magnet, high-resolution anatomical images were obtained
using fast spin echo pulse sequences (echo time, 48 ms; repetition time, 2000 ms; field of
view, 30 mm; 1.2 mm slice thickness; 256°—256 data matrix; RARE (rapid acquisition
relaxation enhanced) factor, 8). After the anatomical images were obtained, BOLD fMRI
images were continuously acquired over a 30 min period to include a 5 min baseline and
Project Number: BME-JMS-0704
40
a 25 min period after administration of the challenge dose.
fMRI Data Analysis
The percent change in BOLD activation was calculated on a pixel-by-pixel basis
by comparing the average values obtained during the 5min before and 25min after the
injection of stimulate. Regions of interest (ROIs) used for analysis included the prefrontal
cortex, anterior cingulated cortex, nucleus accumbens, ventral pallidum, hippocampus,
ventral tegmental area, visual cortex and septum. To generate an activation map for each
subject, voxels whose BOLD percent change was significant at p<0.05 were overlaid on
individual specimen atlases created using the anatomical images co-registered with fMRI
data using MIVA software and MATLAB. The t-test statistics use a 95% confidence
level, one-tailed distributions and heteroscedastic variance assumptions. The pixels
considered statistically significant, were identified and statistically averaged within their
respective anatomical regions.
Project Number: BME-JMS-0704
41
CHAPTER 6 - RESULTS
Experiment #1 – Behavioral Study
The result of the behavioral study is shown below.
0
20
40
60
80
100
120
Baseline 1 2 3 4 5 6
3 hr
6 hr
9 hr
12 h
r
Time Period
Dis
tan
ce M
oved
(m
) Nic
Sal
Days
Figure 21 - After 6 daily injection of nicotine, the rats were sensitized. After the injection on day 6,
each rat was given an extra dose of drug and the refractory period was observed.
Experiment #2 – fMRI Study
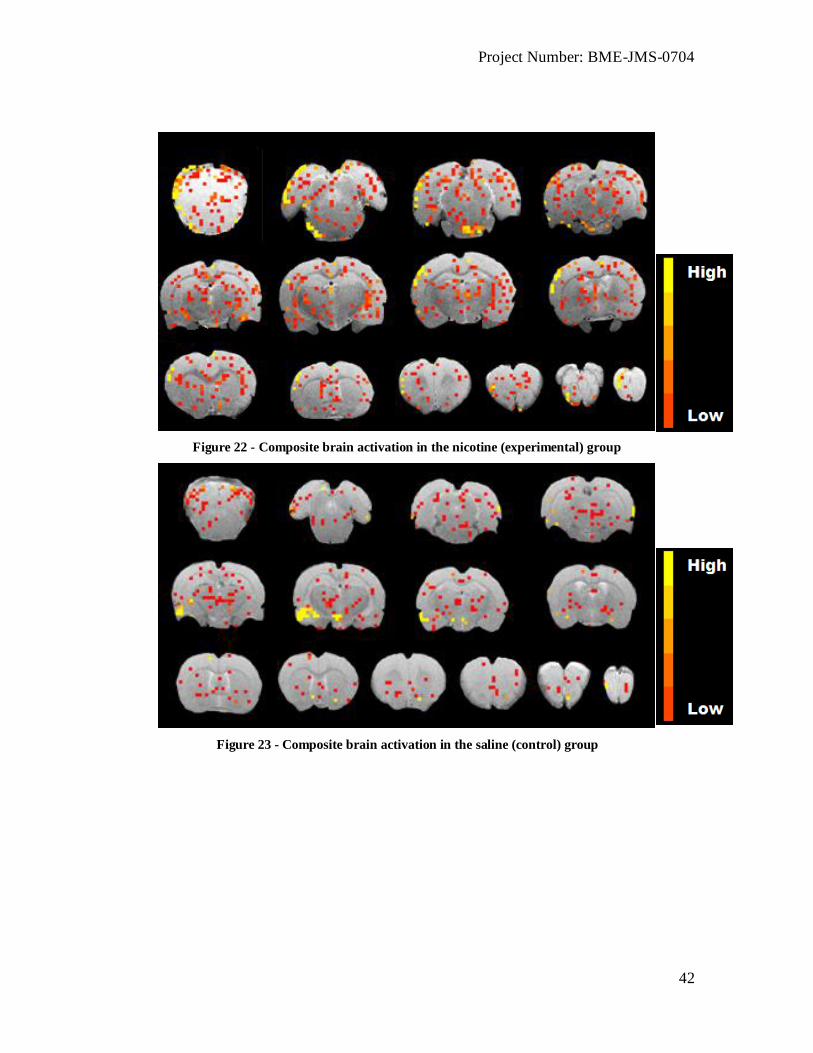
The fMRI composite results of the experimental (nicotine) and control (saline)
groups through all 14 slices of the brain are shown in Figures 22 and 23. The activated
regions of the brain are shown in color.
The fMRI composite results of the experimental (nicotine) and control (saline)
group in 3-Dimensions are also shown in figures 24 and 25.
Project Number: BME-JMS-0704
42
Figure 22 - Composite brain activation in the nicotine (experimental) group
Figure 23 - Composite brain activation in the saline (control) group
Project Number: BME-JMS-0704
43
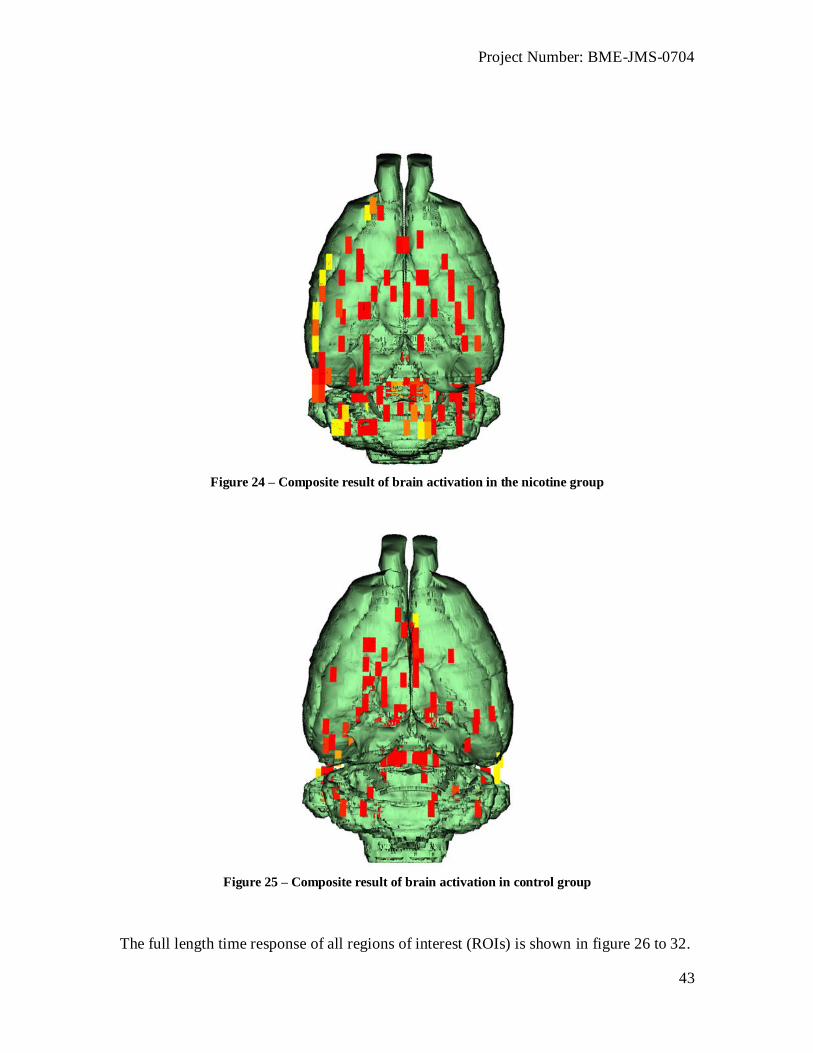
Figure 24 – Composite result of brain activation in the nicotine group
Figure 25 – Composite result of brain activation in control group
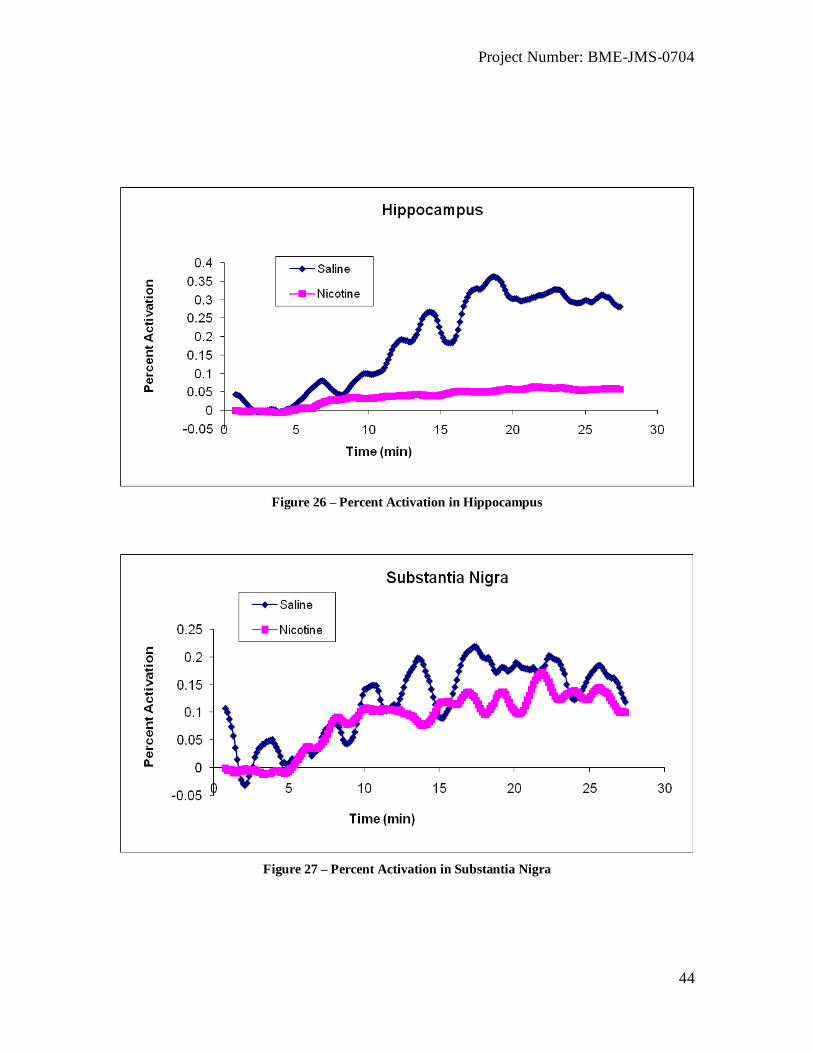
The full length time response of all regions of interest (ROIs) is shown in figure 26 to 32.
Project Number: BME-JMS-0704
44
Figure 26 – Percent Activation in Hippocampus
Figure 27 – Percent Activation in Substantia Nigra
Project Number: BME-JMS-0704
45
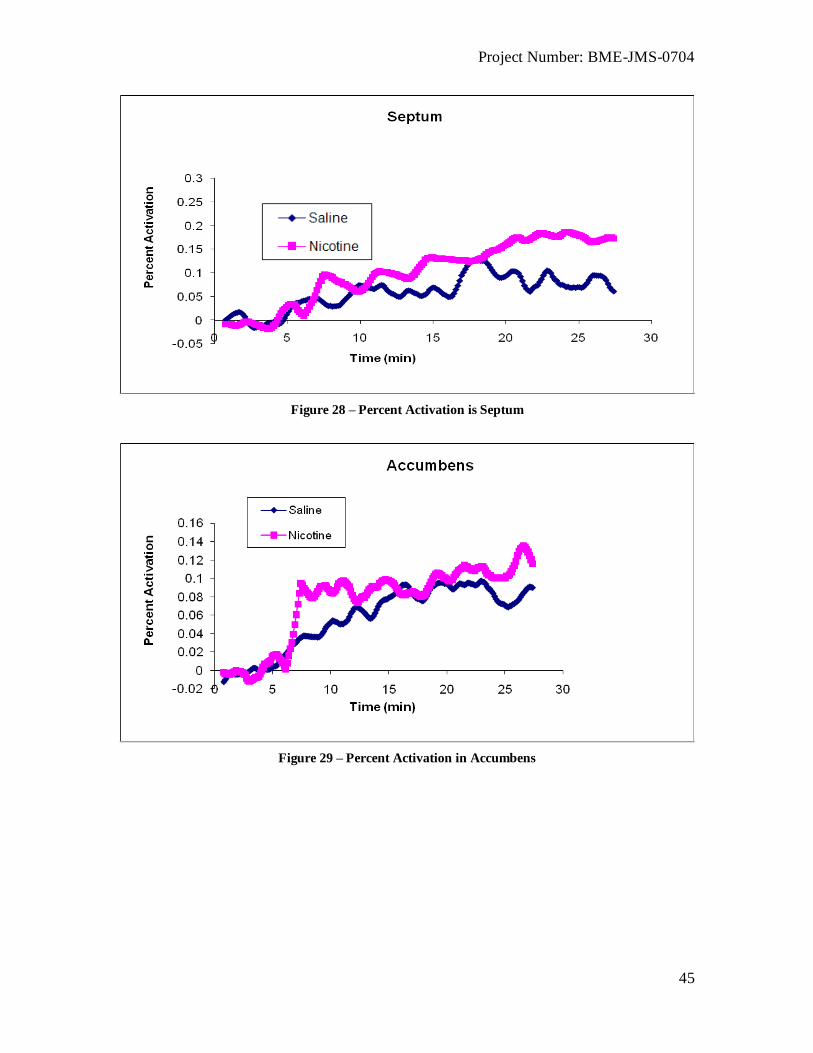
Figure 28 – Percent Activation is Septum
Figure 29 – Percent Activation in Accumbens
Project Number: BME-JMS-0704
46
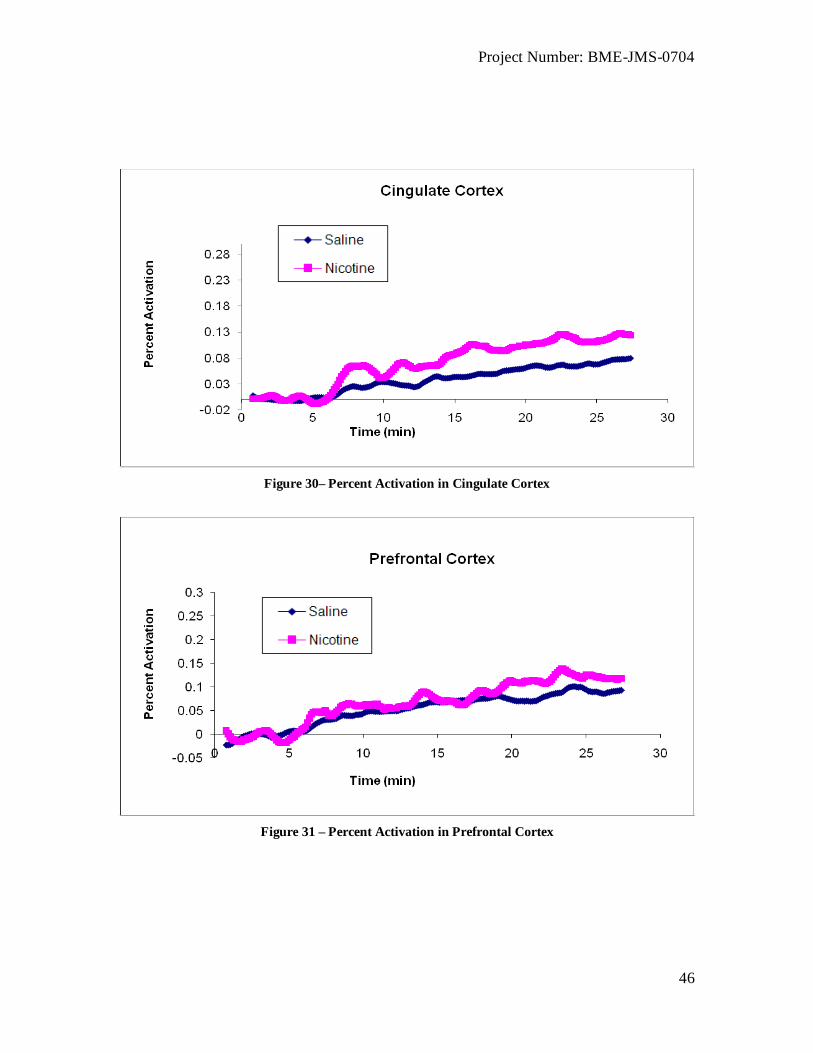
Figure 30– Percent Activation in Cingulate Cortex
Figure 31 – Percent Activation in Prefrontal Cortex
Project Number: BME-JMS-0704
47
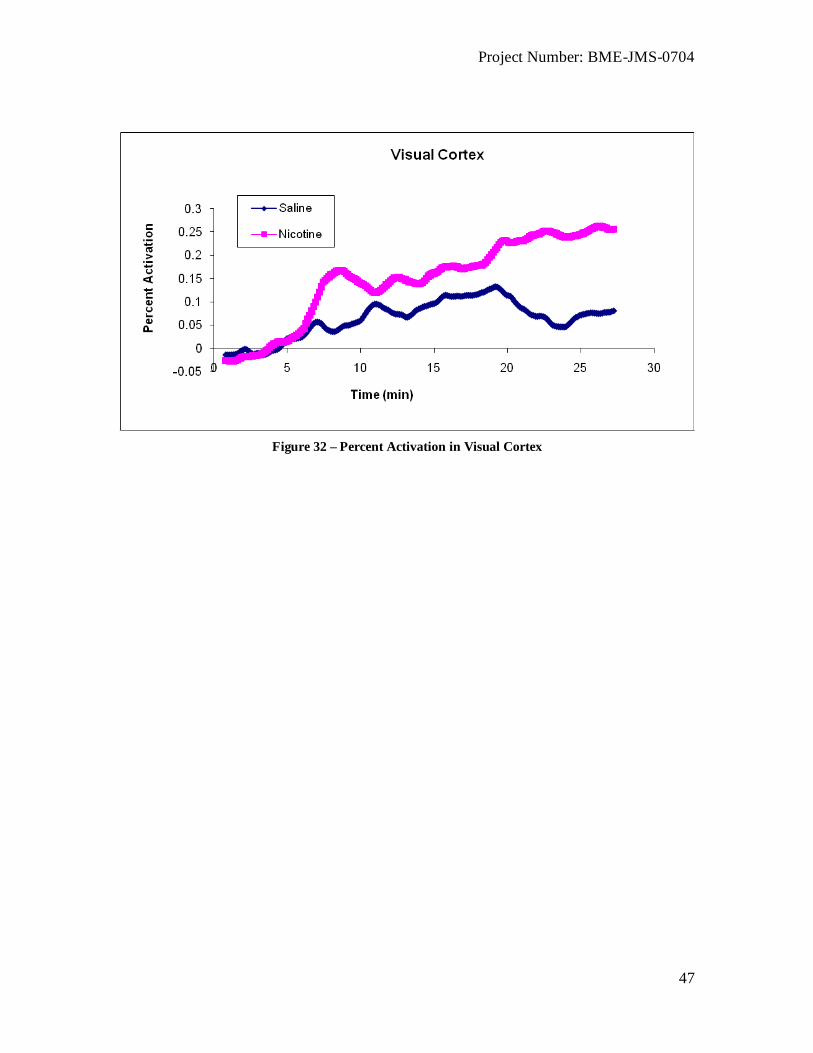
Figure 32 – Percent Activation in Visual Cortex
Project Number: BME-JMS-0704
48
CHAPTER 7 - ANALYSIS AND DISCUSSION
Behavioral Study
The data show that the distance traveled by the subjects in the experimental group
showed a gradual increase during the first three days followed by a steady plateau
achieved through day 6th
. The data demonstrates that nicotine sensitization is achieved by
day 6th
. The control group on the other hand does not follow this trend.
Looking at the refractory period results, we can also observe that the locomotion
activities of the saline and nicotine groups are not significantly different during the 12
hour period immediately after injection on day 6. The locomotor activity in the
experimental group is still inhibited and lower than the response on day 6. Since the rats
are not fully responding to the stimulus, we can conclude that they are within the
refractory period of nicotine. The 12-hour point within the refractory period was chosen
for the fMRI study.
fMRI Study
The functional data show a close overall correlation between the nicotine and
saline activation over the 30 minutes of stimulation period. Most of the data falls within
0.4% activation for both saline and nicotine. Zhixhin et al. 2008, reported activation
between -0.077% and 0.431% in the ROIs of control subjects receiving saline during
regular sensitization. Activation levels of 3.03% to 4.23% were recorded in ROIs of
nicotine sensitized rats during regular dose.
When these fMRI results are compared with this previous study, it is clear that the
regions of brain that have response in the past show a significantly lower activation
reaction to the stimuli. While figure 21 and 22 show visual representation of the
Project Number: BME-JMS-0704
49
activation in the brain to be greater in the nicotine rats, the statistical analysis
demonstrates that this activation is not significantly different.
However there are areas, such as the visual cortex in figure 32 where the nicotine
activation is clearly greater than the saline activation. Areas like the prefrontal cortex,
accumbens and cingulated cortex seem to have a very tight activation for both groups,
showing that there is no difference in activation. The hippocampus however seems to
have relatively large response activation from the saline rats and the lowest response
from the nicotine group. This result is not expected and overall not in agreement with the
rest of the ROIs sensitive to nicotine addiction.

Project Number: BME-JMS-0704
50
CHAPTER 8 - CONCLUSIONS
The Activation from nicotine and saline were not significantly different during the
refractory period. The fMRI study is consistent with the behavioral results. The areas that
are normally exited by nicotine are relatively dormant during the refractory period and
have the same response as saline. These results coupled with the studies of drug
reactions beyond the refractory period can be used in the development of pharmaceuticals
that are aimed at specific regions of the brain or at determining targeted drug delivery
schedules.
Project Number: BME-JMS-0704
51
CHAPTER 9 - RECOMMENDATIONS
In order to improve this study, to further analyze the refractory period of nicotine
within the normal rat model, and to produce data that will aid in the exploration of
nicotine addiction a few measures must be taken.
The behavioral study tested for the presence of the refractory period within the
first 12 hours after the regular sensitization does. This was half way between two
consecutive regular doses. This provided us a window into the refractory period but did
not fully uncover the duration of the refractory period. By exposing the subjects to
challenge does throughout the 24 hour period a more precise duration of the refractory
period can be observed.
Once the refractory period is identified in full, fMRI imaging should be conducted
at the very beginning and the end of the refractory period. This will provide a greater
window to the recovery of the receptors within the brain tissue. This will result in a
greater understanding of different levels of addiction and can give greater insight to time
schedules of pharmaceuticals.
Lastly, if the resources allow, using a larger sample size will result in more
significant and precise data. This will also allow further testing of the refractory period
in the behavioral study. It is also recommended that in future analysis, motion and drift
compensation softwares be used along with MIVA and MATLAB.
Project Number: BME-JMS-0704
52
BIBLIOGRAPHY
Benowitz N.L. Neurobiology of Nicotine Addiction: Implications for Smoking Cessation Treatment. The
American Journal of Medicine (2008), Vol 121 (4A), S3-S10.
Bergen A.W., Caporaso N. Cigarette Smoking. J Natl Cancer Inst 1999; 91:1365-75.
Chow C.K., Tsui H.T., Lee T., Lau T.K. Medical Image Registration and Model Construction using
Genetic Algorithms. IEEE (2001) 0-7695-1113-9/01
Hornak J.P. ―The basics of MRI‖
http://www.cis.rit.edu/htbooks/mri/index.html
Huang, W. Automatic affine and elastic registration strategies for multi-dimensional medical images. A
Dissertation (PhD) submitted to the faculty of Worcester polytechnic Institute (WPI) (2007).
King J.A., Garelick T.S., Brevard M.E., Chen W., Messenger T.L., Duong, T.Q., Ferris C.F. Procedure for
minimizing stress for fMRI studies in conscious rats. Journal of Neuroscience Methods 148 (2005), 154-
160.
Kulkarni P.P., Functional MRI Data Analysis Techniques and Strategies to Map the Olfactory System of a
Rat Brain. A Dissertation submitted to the faculty of Worcester Polytechnic Institute (WPI) (2005).
Li Z., DiFranza J.R., Wellman R.J.,Kulkarni P., King J.A. Imaging brain activation in nicotine-sensitized
rats. Brain Research 1199 (2008), 91-99.
Noll D.C. A Primer on MRI and Functional MRI (version 2.1, 6/21/01) Department of Biomedical
Engineering and Radiology, University of Michigan, Ann Arbor, MI 48109-2125
Ogawa S., Lee T.M., Nayak, A.S., Glynn P. Oxygenation-sensitive contrast in magnetic resonance image
of rodent brain at high magnetic fields. Magn Reson Med 1990; 14:68-78
Ogawa S., Tank D.W., Menon R., et al. Intrinsic signal changes accompanying sensory stimulation:
Functional brain mapping with magnetic resonance imaging. Proc. Natl. Acad. Sci., USA 1992. 89: p.
5951-5955.
Picciotto M.R., Addy N.A., Mineur, Y.S., Brunzell D.H. It is not "either/or": Activation and desensitization
of nicotinic acetylcholine receptors both contribute to behaviors related to nicotine addiction and mood.
Journal of Prog. Neurobiology, Vol. 84, Issue 4, (2008), 329-342.
Stolerman I.P., Jarvis M.J., The scientific case that nicotine is addictive. Journal of Psychopharmacology,
Vol. 117, Issue 1, (1995), 2-10.
Van Geuns R.M., Wielopolski P.A., de Bruin H.G., Rensing B.J., van Ooijen, P.M.A, Hulshoff M.,
Oudkerk M., de Feyter P.J. Basic Principles of Magnetic Resonance Imaging. Progress in Cardiovascular
Diseases, Vol. 42, No. 2 (September/October), 1999: pp 149-156.
Williams J.M., Ziedonid D. Addressing tobacco among individuals with a mental illness or an addiction.
Addictive Behaviors 29 (2004); 1067-1083.
Zhu W., Mantione, K. J.,Shen L., Lee B., Stefano G.B. Norlaudanosoline and Nicotine Increase
Endogenous Ganglionic Morphine Levels: Nicotine Addiction. Journal of Cell Molecular Neurobiology,
Vol. 576, Pt 2 (2006), 533-546.
Related Documents