Dear Students of FIN4211 MTE1 will held on Thursd in #301 of N/B during your regular clas Rules for Exams: 1. Place your bags and clothes on the de 2. Come to Exam Room on time. If you com 3. Switch off mobile phones, car alarms. 4. Use own calculator, not mobile phone. 6. Don’t talk, look at others’ paper (-1 7. Raise your hand if you have a questio 8. You must not to leave classroom until NOTE: Please bring with you: Sessions and Chapters covered in MT Valuation the Cost of equity Valuation the cost of Debt CAPM Financial Statement Modeling: Sensitivity Analysis. 5. The exam is closed book, closed-notes 1. The ID card 2. One pen (only blue or black) SB: Financial Modeling, 2 th or 3d e Session s 1-4 Basic financial calculations: Present value, Future value, NPV and IRR, Short Cuts, Loan amortization Tables, Excel Session 5 Calculating the cost of capital : Session 6 Building a pro forma model in Doing a discounted cash flow Session s 7-8 Using Financial Statement Models for Valuation : Valuing the Firm as an unlevered The Effect of Leverage on the

Welcome message from author
This document is posted to help you gain knowledge. Please leave a comment to let me know what you think about it! Share it to your friends and learn new things together.
Transcript
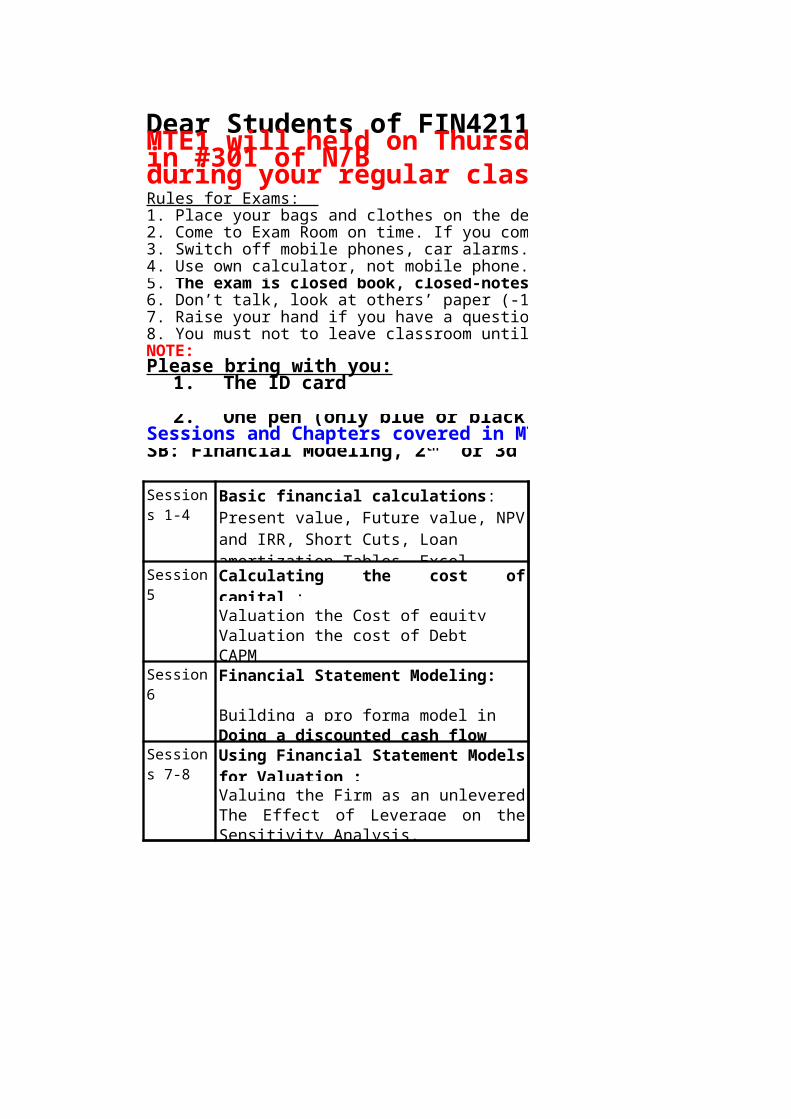
Dear Students of FIN4211- Financial Modeling,MTE1 will held on Thursday, 28 February, 2013 in #301 of N/Bduring your regular classes from 10:00 to 13:00 Rules for Exams: 1. Place your bags and clothes on the designated area – my desk.2. Come to Exam Room on time. If you come 10 minutes late – 0 point for the exam.3. Switch off mobile phones, car alarms.4. Use own calculator, not mobile phone.
6. Don’t talk, look at others’ paper (-10%.) 7. Raise your hand if you have a question.8. You must not to leave classroom until exam ends.NOTE:Please bring with you:
Sessions and Chapters covered in MTE 1:
Reading: BMA8e: Ch:2-5;
SB3e: Ch.. 1, Problems 1-14
Session 5
Valuation the Cost of equityValuation the cost of DebtCAPM
Session 6 Financial Statement Modeling:
Building a pro forma model in Excel.
Valuing the Firm as an unlevered EntityThe Effect of Leverage on the ValuationSensitivity Analysis.
5. The exam is closed book, closed-notes.
1. The ID card
2. One pen (only blue or black)
SB: Financial Modeling, 2th or 3d ed., 2008, Ch:1,2,3,4
Sessions 1-4
Basic financial calculations: Present value, Future value, NPV and IRR, Short Cuts, Loan amortization Tables, Excel Functions: FV, PV, IRR, NPV, PMT
Calculating the cost of capital : Reading: SB3e: Ch. 2, Problems 1-10, Appendixes1,2
Reading: SB3e: Ch.3, Problems 1-10
Doing a discounted cash flow (DCF) valuation using a pro forma modelSessions
7-8Using Financial Statement Models for Valuation :
Reading: SB3e: Ch. 3, Problems 1-6
Dear Students of FIN4211- Financial Modeling,MTE1 will held on Thursday, 28 February, 2013 during your regular classes from 10:00 to 13:00
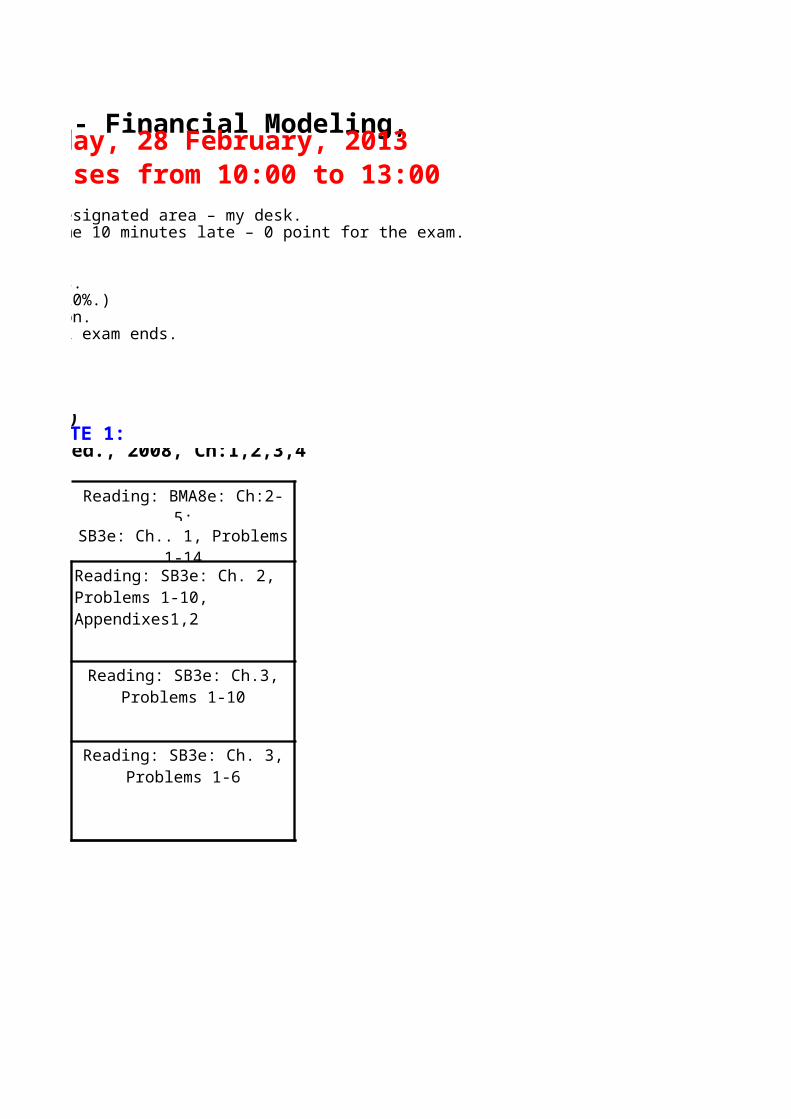
Discount rate 11%NPV 183.38IRR 16.95%
Year Cash flow0 -7001 1502 1503 1504 1505 1506 1507 1508 1509 150
10 150
Answers:a) Decision: The NPV > 0 and hence you should purchase the asset.b) Note that the IRR > discount rate, which leads to the same decision.
Problem 1You are offered an asset costing $700 that has cash flows of $150 at the end of each of the next 10 years.a. If the appropriate discount rate for the asset is 11percent, should you purchase it?b. What is the IRR of the asset?
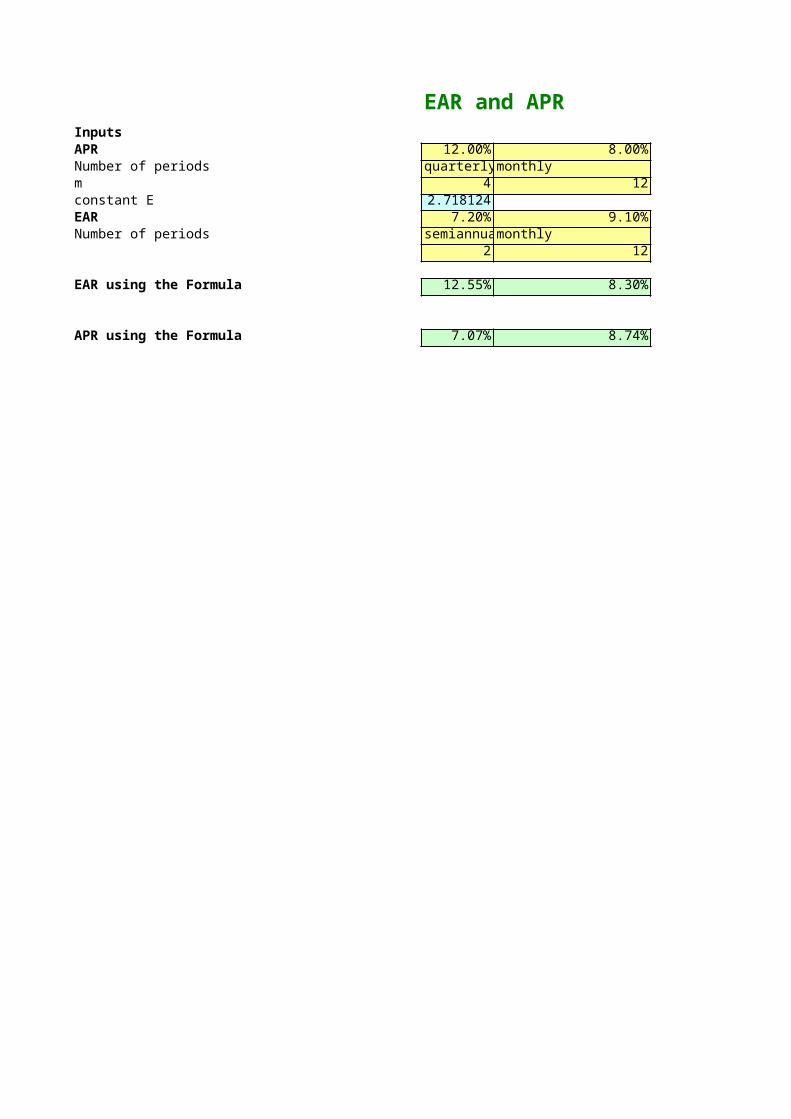
EAR and APRInputsAPR 12.00% 8.00% 7.00%Number of periods quarterly monthly dailym 4 12 365constant E 2.718124EAR 7.20% 9.10% 18.50%Number of periods semiannualmonthly weekly
2 12 52
EAR using the Formula 12.55% 8.30% 7.25%
APR using the Formula 7.07% 8.74% 17.00%
Calculating interest
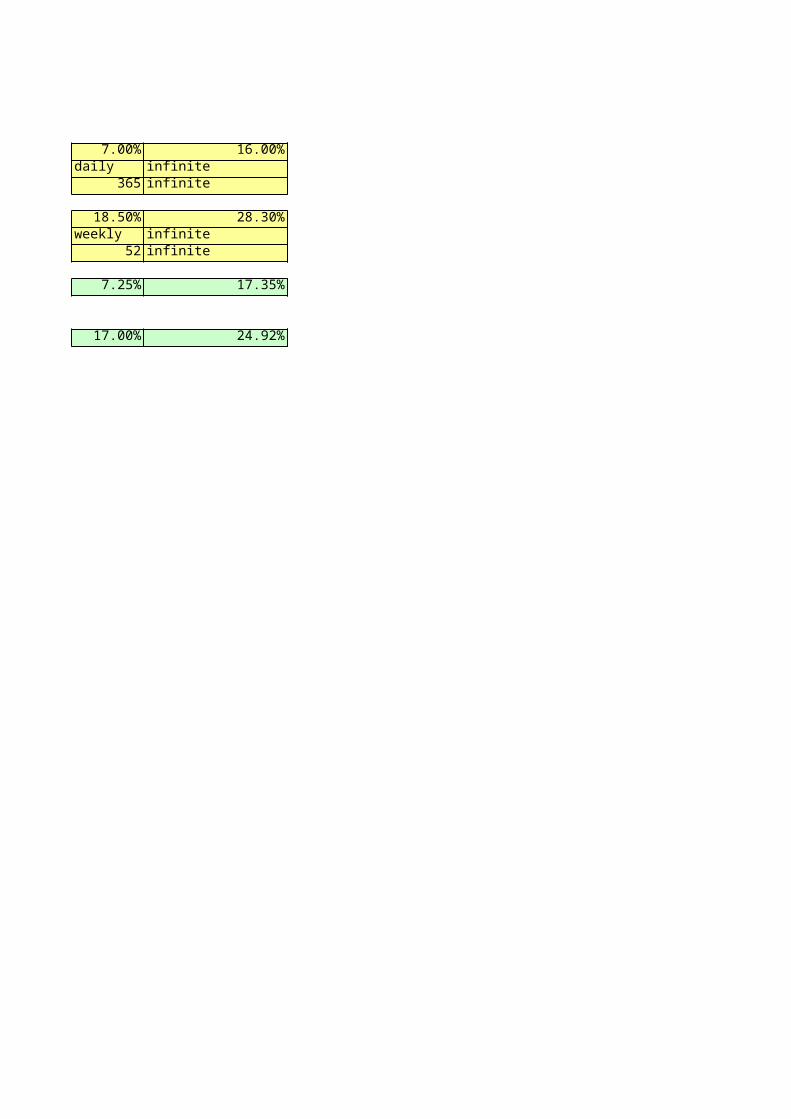
16.00%infiniteinfinite
28.30%infiniteinfinite
17.35%
24.92%
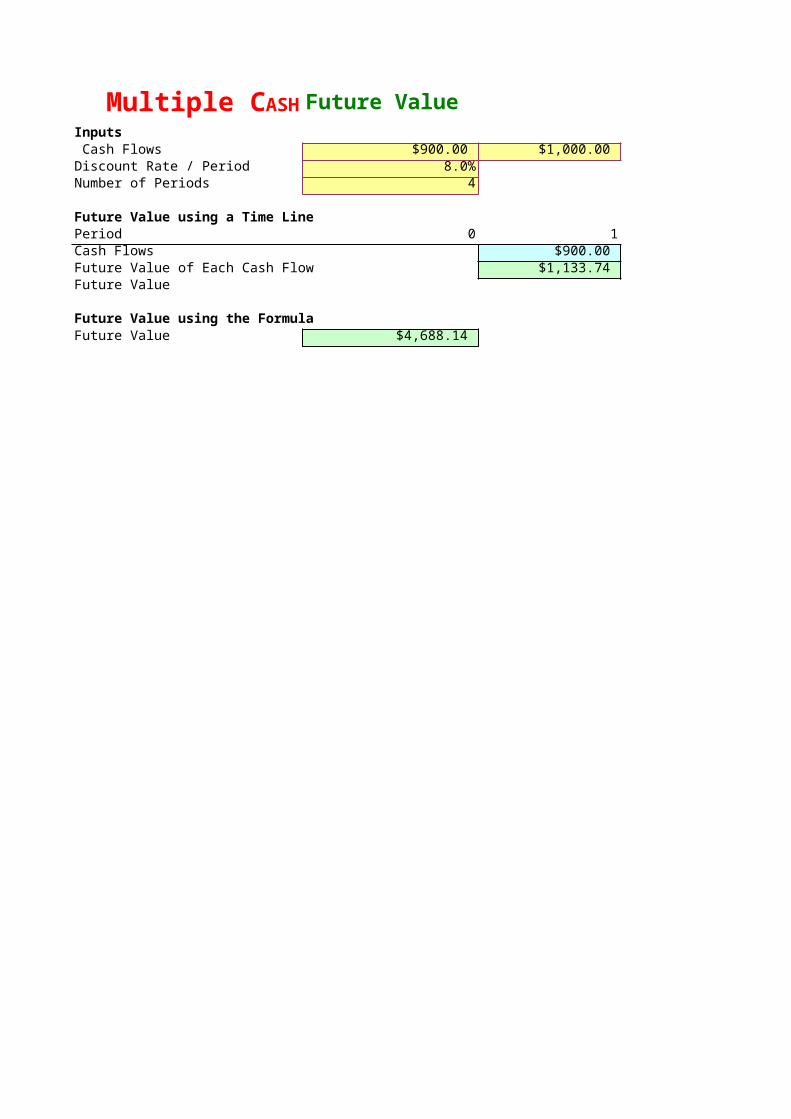
Future ValueInputs Cash Flows $900.00 $1,000.00 $1,100.00 Discount Rate / Period 8.0%Number of Periods 4
Future Value using a Time LinePeriod 0 1 2Cash Flows $900.00 $1,000.00 Future Value of Each Cash Flow $1,133.74 $1,166.40 Future Value
Future Value using the FormulaFuture Value $4,688.14
Multiple CASH
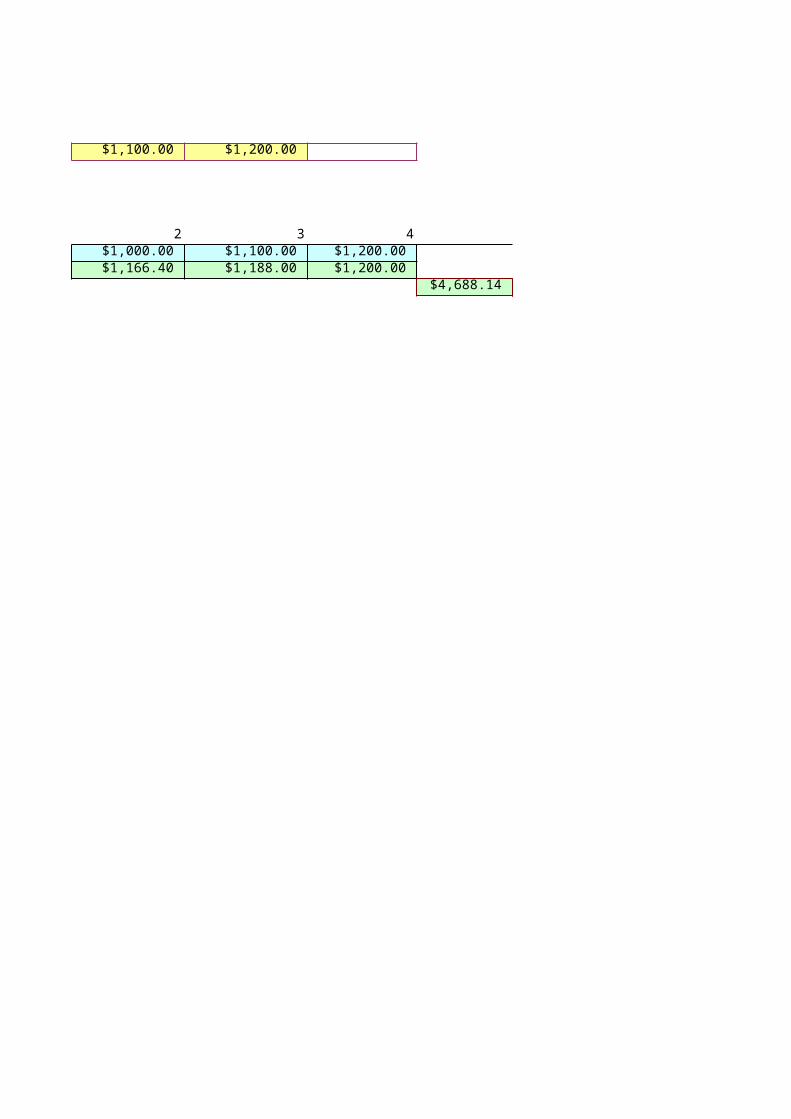
$1,200.00
3 4$1,100.00 $1,200.00 $1,188.00 $1,200.00
$4,688.14
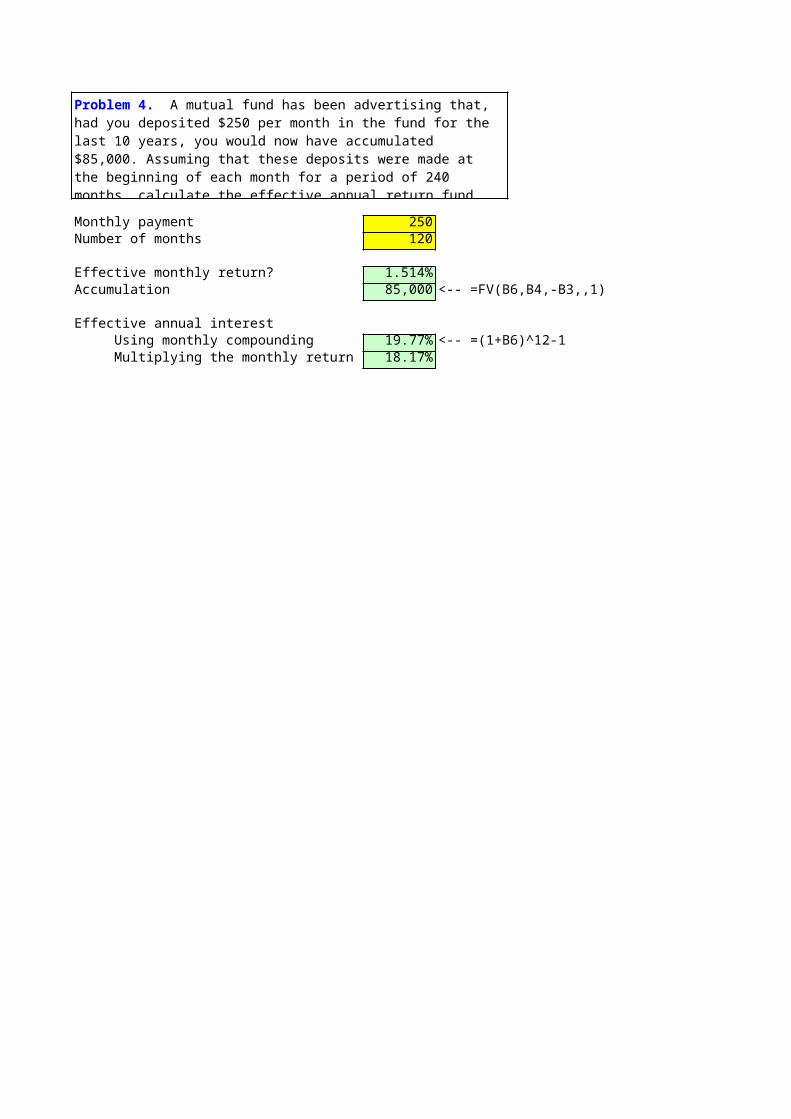
Monthly payment 250Number of months 120
Effective monthly return? 1.514%Accumulation 85,000 <-- =FV(B6,B4,-B3,,1)
Effective annual interest Using monthly compounding 19.77% <-- =(1+B6)^12-1 Multiplying the monthly return by 12 18.17%
Problem 4. A mutual fund has been advertising that, had you deposited $250 per month in the fund for the last 10 years, you would now have accumulated $85,000. Assuming that these deposits were made at the beginning of each month for a period of 240 months, calculate the effective annual return fund investors got.

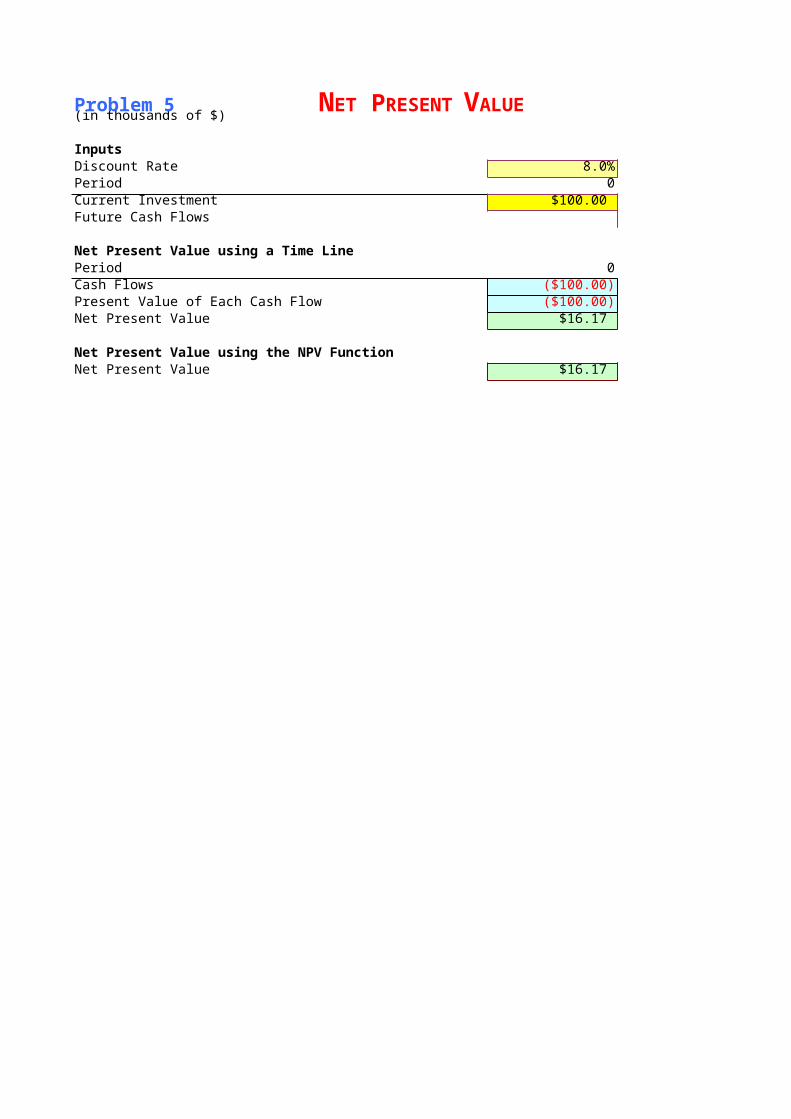
Constant Discount Rate(in thousands of $)
InputsDiscount Rate 8.0%Period 0 1Current Investment $100.00 Future Cash Flows $21.00
Net Present Value using a Time LinePeriod 0 1Cash Flows ($100.00) $21.00 Present Value of Each Cash Flow ($100.00) $19.44 Net Present Value $16.17
Net Present Value using the NPV FunctionNet Present Value $16.17
Problem 5 NET PRESENT VALUE
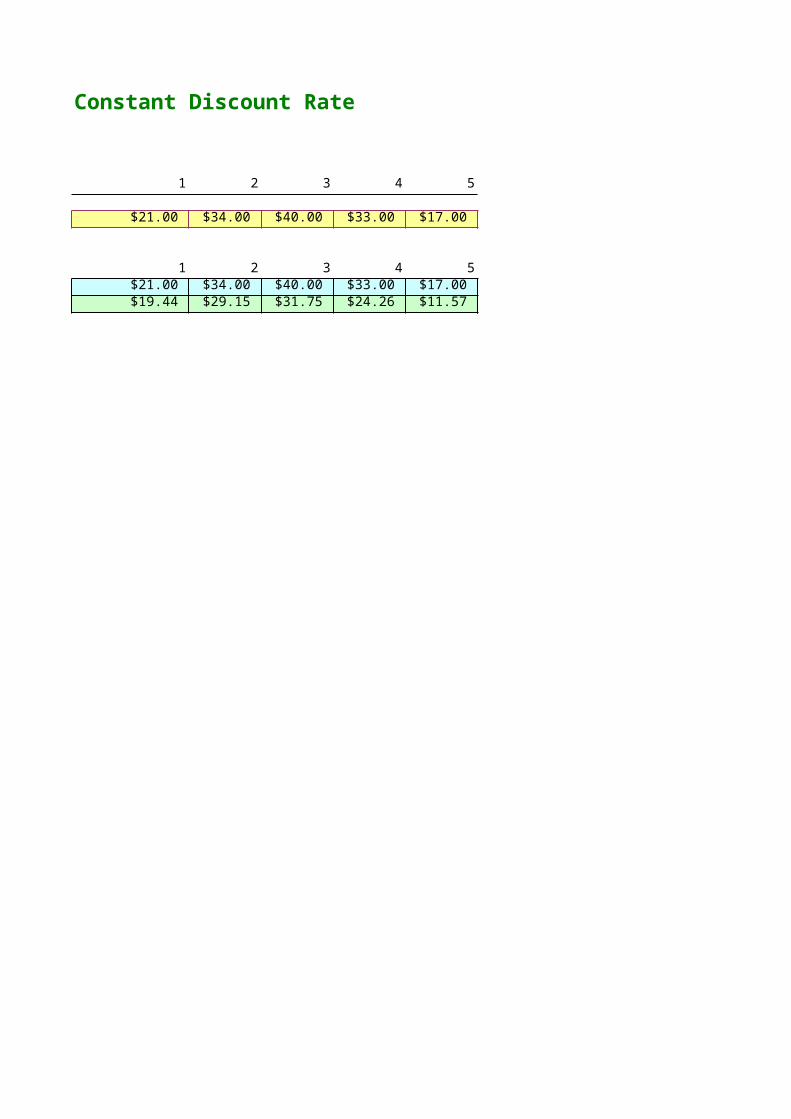
Constant Discount Rate
2 3 4 5
$34.00 $40.00 $33.00 $17.00
2 3 4 5$34.00 $40.00 $33.00 $17.00 $29.15 $31.75 $24.26 $11.57
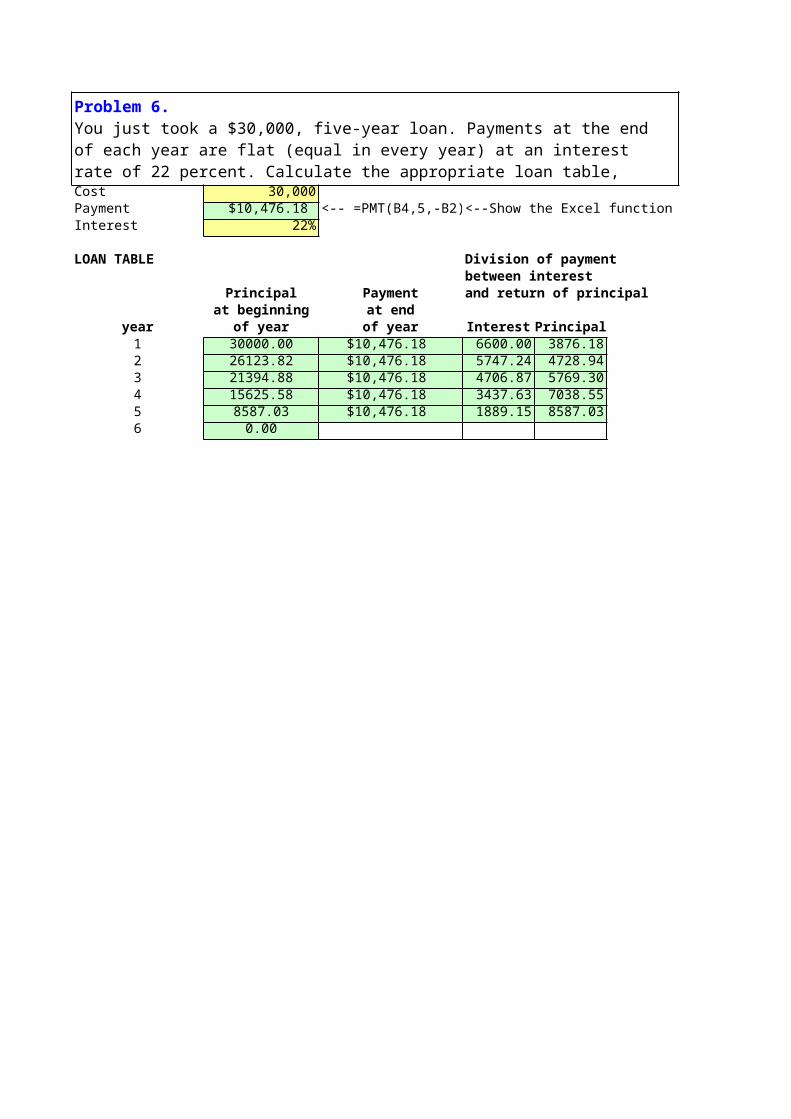
Cost 30,000Payment $10,476.18 <-- =PMT(B4,5,-B2) <--Show the Excel functionInterest 22%
LOAN TABLE Division of payment between interest
Principal Payment and return of principalat beginning at end
year of year of year Interest Principal1 30000.00 $10,476.18 6600.00 3876.182 26123.82 $10,476.18 5747.24 4728.943 21394.88 $10,476.18 4706.87 5769.304 15625.58 $10,476.18 3437.63 7038.555 8587.03 $10,476.18 1889.15 8587.036 0.00
Problem 6.You just took a $30,000, five-year loan. Payments at the end of each year are flat (equal in every year) at an interest rate of 22 percent. Calculate the appropriate loan table, showing the breakdown in each year between principal and interest.
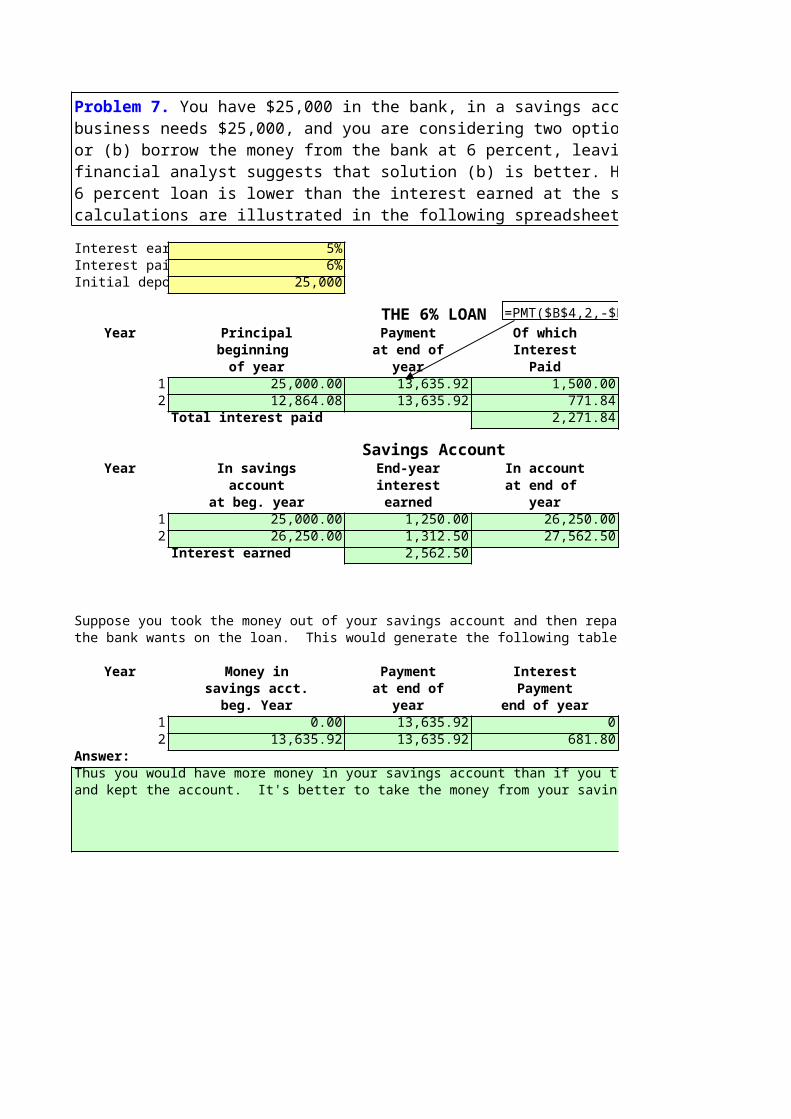
Interest earned 5%Interest paid 6%Initial deposit 25,000
THE 6% LOANYear Principal Payment Of which
beginning at end of Interestof year year Paid
1 25,000.00 13,635.92 1,500.002 12,864.08 13,635.92 771.84
Total interest paid 2,271.84
Savings AccountYear In savings End-year In account
account interest at end of at beg. year earned year
1 25,000.00 1,250.00 26,250.002 26,250.00 1,312.50 27,562.50
Interest earned 2,562.50
Suppose you took the money out of your savings account and then repaid the account with the paymentsthe bank wants on the loan. This would generate the following table:
Year Money in Payment Interestsavings acct. at end of Payment
beg. Year year end of year1 0.00 13,635.92 02 13,635.92 13,635.92 681.80
Answer:Thus you would have more money in your savings account than if you took the loan from the bankand kept the account. It's better to take the money from your savings account!
Problem 7. You have $25,000 in the bank, in a savings account that draws 5 percent interest. Your business needs $25,000, and you are considering two options: (a) Use the money in your savings account or (b) borrow the money from the bank at 6 percent, leaving the money in your savings account. Your financial analyst suggests that solution (b) is better. His logic: The sum of the interest paid on the 6 percent loan is lower than the interest earned at the same time on the $25,000 deposit. His calculations are illustrated in the following spreadsheet. Show that this logic is wrong. (If you think about it, it couldn't be preferable to take a 6 percent loan when you are getting 5 percent interest from the bank. However, the explanation for this may not be trivial.)
=PMT($B$4,2,-$B$5)
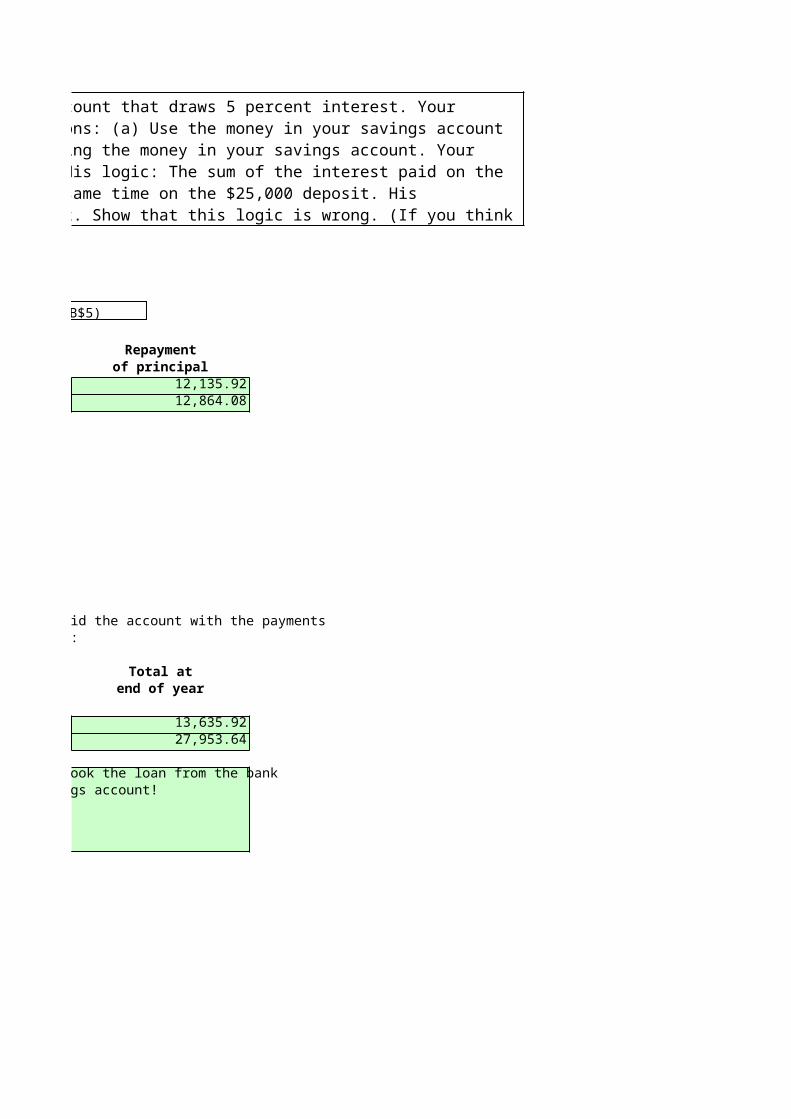
THE 6% LOAN
Repaymentof principal
12,135.9212,864.08
Savings Account
Suppose you took the money out of your savings account and then repaid the account with the payments
Total atend of year
13,635.9227,953.64
Thus you would have more money in your savings account than if you took the loan from the bank
You have $25,000 in the bank, in a savings account that draws 5 percent interest. Your business needs $25,000, and you are considering two options: (a) Use the money in your savings account or (b) borrow the money from the bank at 6 percent, leaving the money in your savings account. Your financial analyst suggests that solution (b) is better. His logic: The sum of the interest paid on the 6 percent loan is lower than the interest earned at the same time on the $25,000 deposit. His calculations are illustrated in the following spreadsheet. Show that this logic is wrong. (If you think about it, it couldn't be preferable to take a 6 percent loan when you are getting 5 percent interest from the bank.
=PMT($B$4,2,-$B$5)
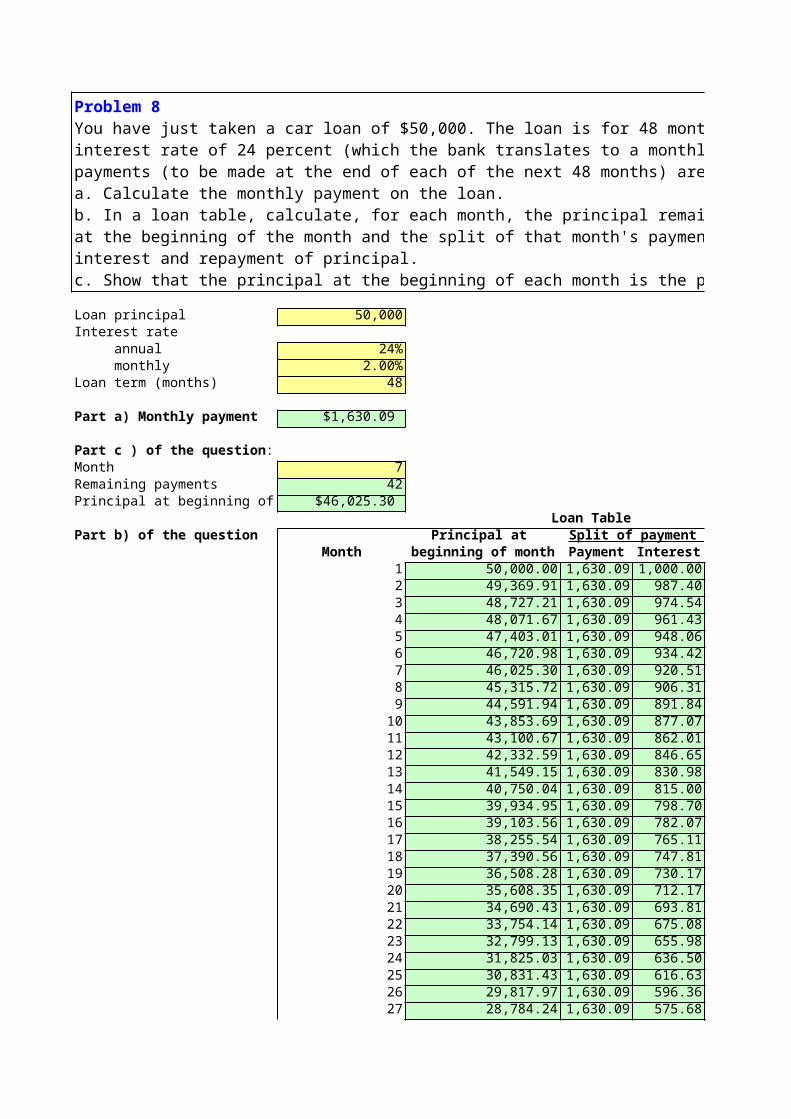
Loan principal 50,000Interest rate annual 24% monthly 2.00%Loan term (months) 48
Part a) Monthly payment $1,630.09
Month 7Remaining payments 42Principal at beginning of month $46,025.30
Loan TablePart b) of the question Principal at Split of payment between:
Month beginning of month Payment Interest1 50,000.00 1,630.09 1,000.002 49,369.91 1,630.09 987.403 48,727.21 1,630.09 974.544 48,071.67 1,630.09 961.435 47,403.01 1,630.09 948.066 46,720.98 1,630.09 934.427 46,025.30 1,630.09 920.518 45,315.72 1,630.09 906.319 44,591.94 1,630.09 891.84
10 43,853.69 1,630.09 877.0711 43,100.67 1,630.09 862.0112 42,332.59 1,630.09 846.6513 41,549.15 1,630.09 830.9814 40,750.04 1,630.09 815.0015 39,934.95 1,630.09 798.7016 39,103.56 1,630.09 782.0717 38,255.54 1,630.09 765.1118 37,390.56 1,630.09 747.8119 36,508.28 1,630.09 730.1720 35,608.35 1,630.09 712.1721 34,690.43 1,630.09 693.8122 33,754.14 1,630.09 675.0823 32,799.13 1,630.09 655.9824 31,825.03 1,630.09 636.5025 30,831.43 1,630.09 616.6326 29,817.97 1,630.09 596.3627 28,784.24 1,630.09 575.68
Problem 8You have just taken a car loan of $50,000. The loan is for 48 months at an annual interest rate of 24 percent (which the bank translates to a monthly rate . The 48 payments (to be made at the end of each of the next 48 months) are all equal.a. Calculate the monthly payment on the loan.b. In a loan table, calculate, for each month, the principal remaining on the loan at the beginning of the month and the split of that month's payment between interest and repayment of principal.c. Show that the principal at the beginning of each month is the present value of the remaining loan payments at the loan interest rate (use the PV function) in seventh month.
Part c ) of the question:
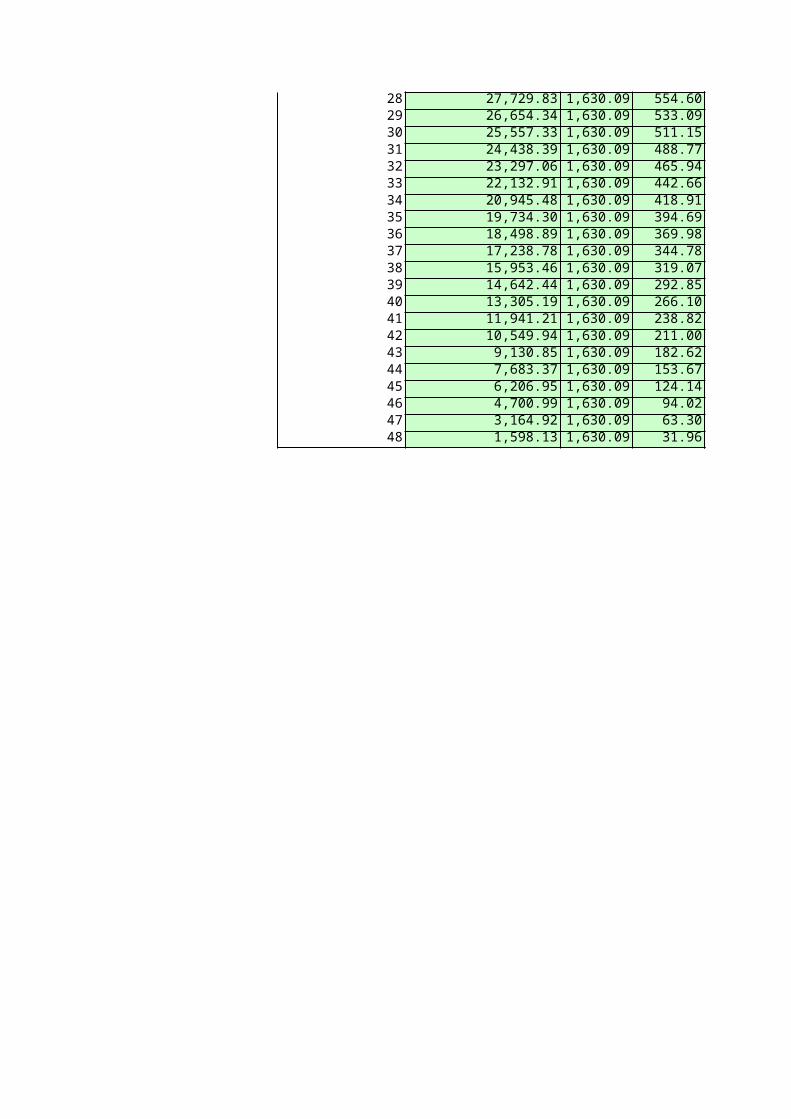
28 27,729.83 1,630.09 554.6029 26,654.34 1,630.09 533.0930 25,557.33 1,630.09 511.1531 24,438.39 1,630.09 488.7732 23,297.06 1,630.09 465.9433 22,132.91 1,630.09 442.6634 20,945.48 1,630.09 418.9135 19,734.30 1,630.09 394.6936 18,498.89 1,630.09 369.9837 17,238.78 1,630.09 344.7838 15,953.46 1,630.09 319.0739 14,642.44 1,630.09 292.8540 13,305.19 1,630.09 266.1041 11,941.21 1,630.09 238.8242 10,549.94 1,630.09 211.0043 9,130.85 1,630.09 182.6244 7,683.37 1,630.09 153.6745 6,206.95 1,630.09 124.1446 4,700.99 1,630.09 94.0247 3,164.92 1,630.09 63.3048 1,598.13 1,630.09 31.96
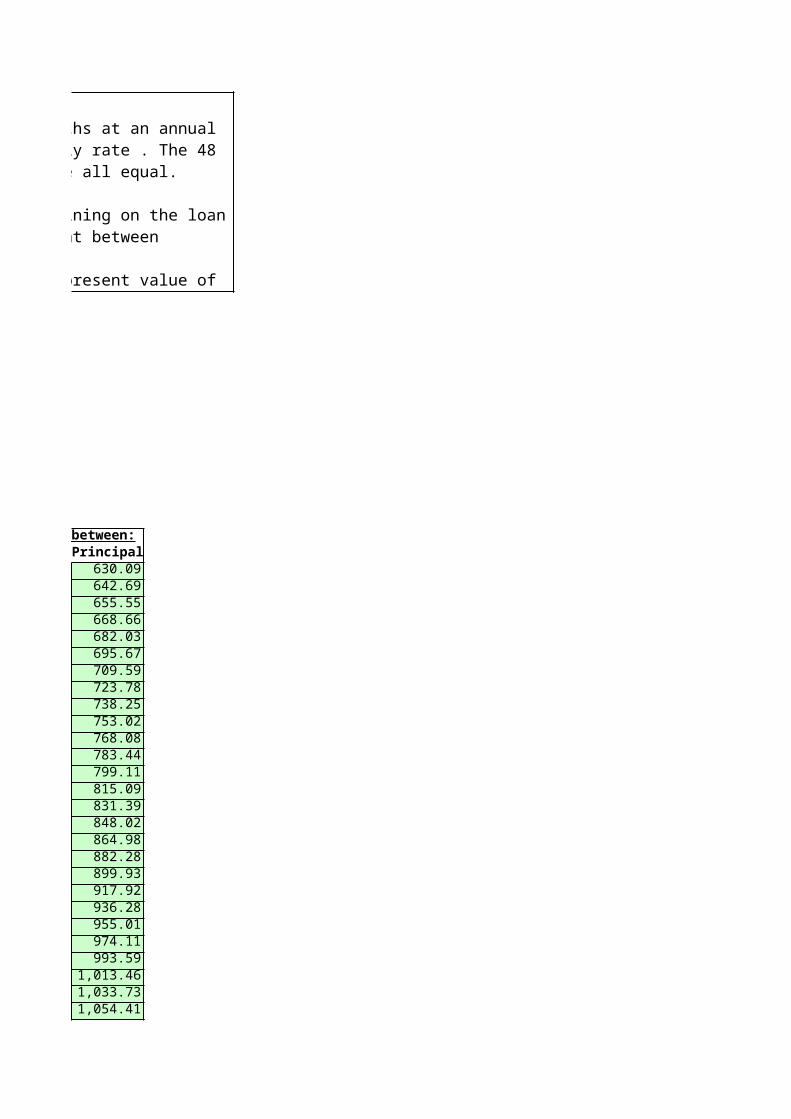
Loan TableSplit of payment between:
Principal630.09642.69655.55668.66682.03695.67709.59723.78738.25753.02768.08783.44799.11815.09831.39848.02864.98882.28899.93917.92936.28955.01974.11993.59
1,013.461,033.731,054.41
You have just taken a car loan of $50,000. The loan is for 48 months at an annual interest rate of 24 percent (which the bank translates to a monthly rate . The 48 payments (to be made at the end of each of the next 48
b. In a loan table, calculate, for each month, the principal remaining on the loan at the beginning of the month and
c. Show that the principal at the beginning of each month is the present value of the remaining loan payments at
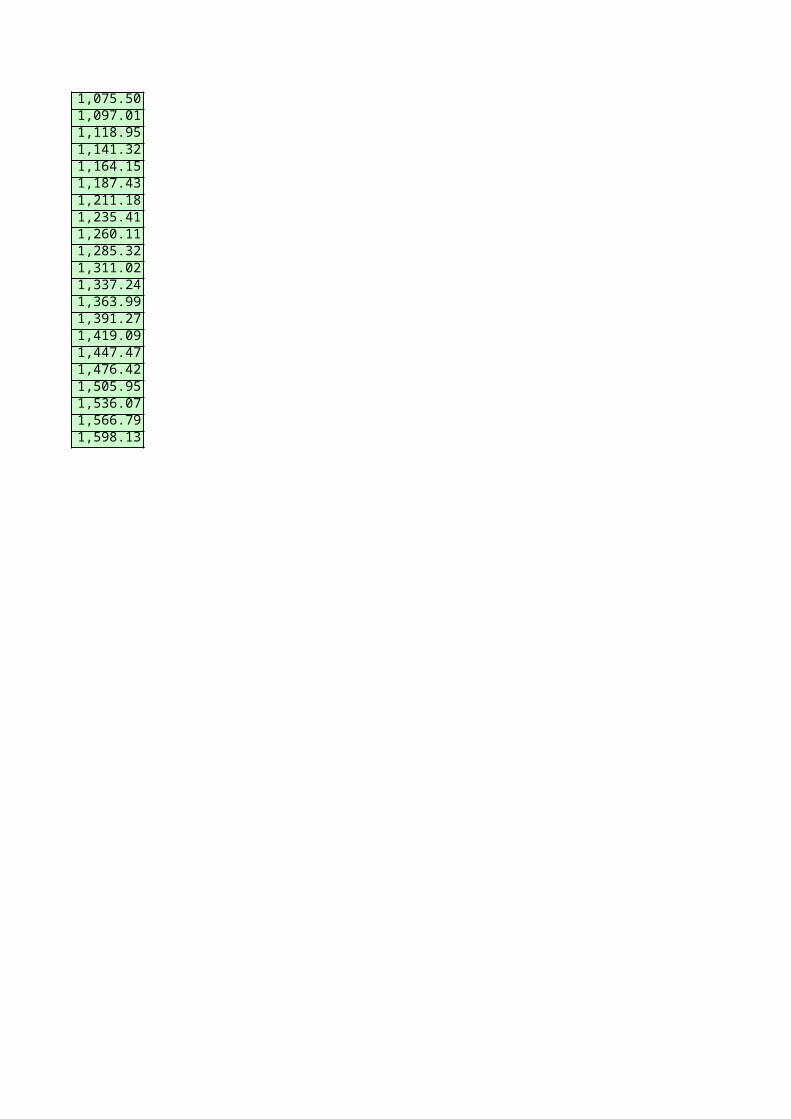
1,075.501,097.011,118.951,141.321,164.151,187.431,211.181,235.411,260.111,285.321,311.021,337.241,363.991,391.271,419.091,447.471,476.421,505.951,536.071,566.791,598.13
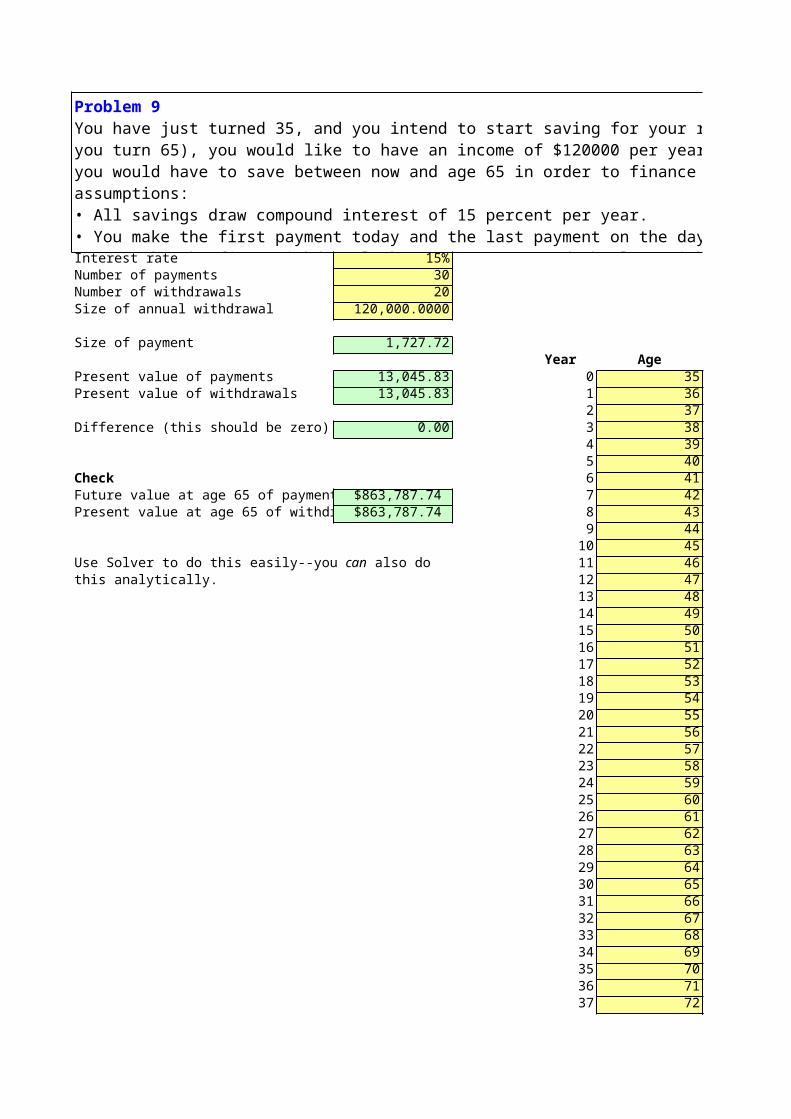
Interest rate 15%Number of payments 30Number of withdrawals 20Size of annual withdrawal 120,000.0000
Size of payment 1,727.72Year Age
Present value of payments 13,045.83 0 35Present value of withdrawals 13,045.83 1 36
2 37Difference (this should be zero) 0.00 3 38
4 395 40
Check 6 41Future value at age 65 of payments $863,787.74 7 42Present value at age 65 of withdrawals $863,787.74 8 43
9 4410 4511 46
this analytically. 12 4713 4814 4915 5016 5117 5218 5319 5420 5521 5622 5723 5824 5925 6026 6127 6228 6329 6430 6531 6632 6733 6834 6935 7036 7137 72
Problem 9You have just turned 35, and you intend to start saving for your retirement. Once you retire in 30 years (when you turn 65), you would like to have an income of $120000 per year for the next 20 years. Calculate how much you would have to save between now and age 65 in order to finance your retirement income. Make the following assumptions:• All savings draw compound interest of 15 percent per year.• You make the first payment today and the last payment on the day you turn 64 (30 payments).• You make the first withdrawal when you turn 65 and the last withdrawal when you turn 84 (20 payments).
Use Solver to do this easily--you can also do
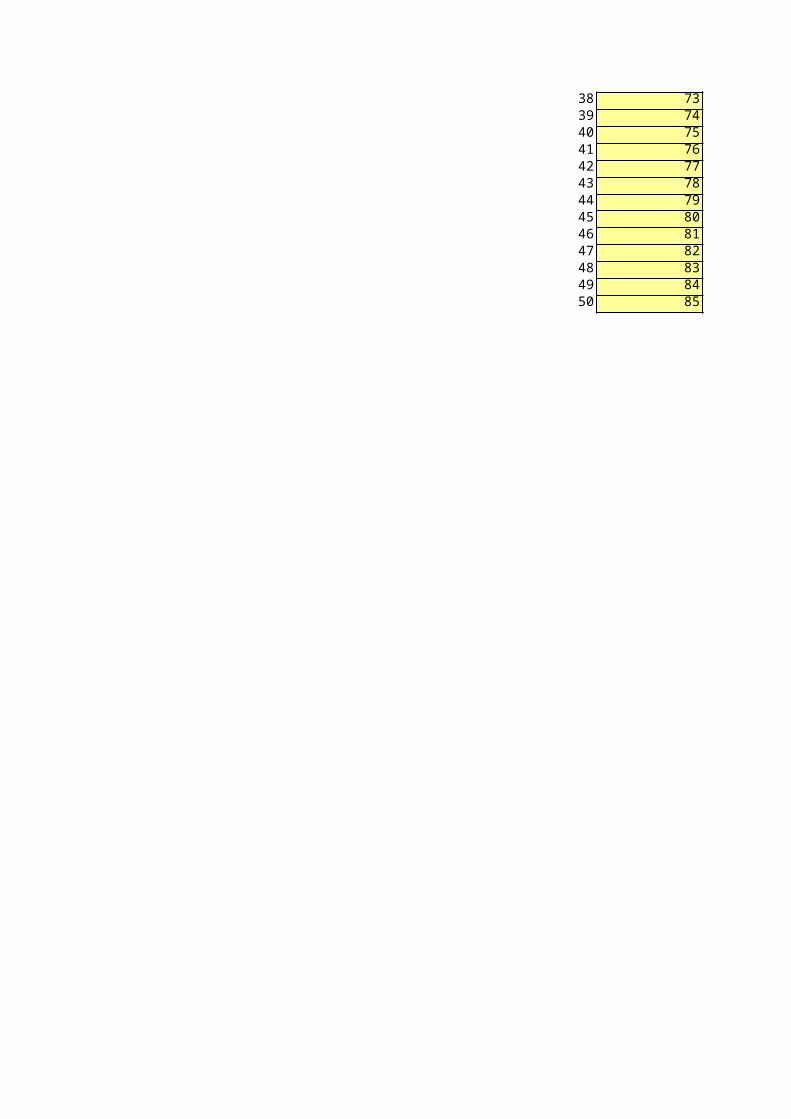
38 7339 7440 7541 7642 7743 7844 7945 8046 8147 8248 8349 8450 85
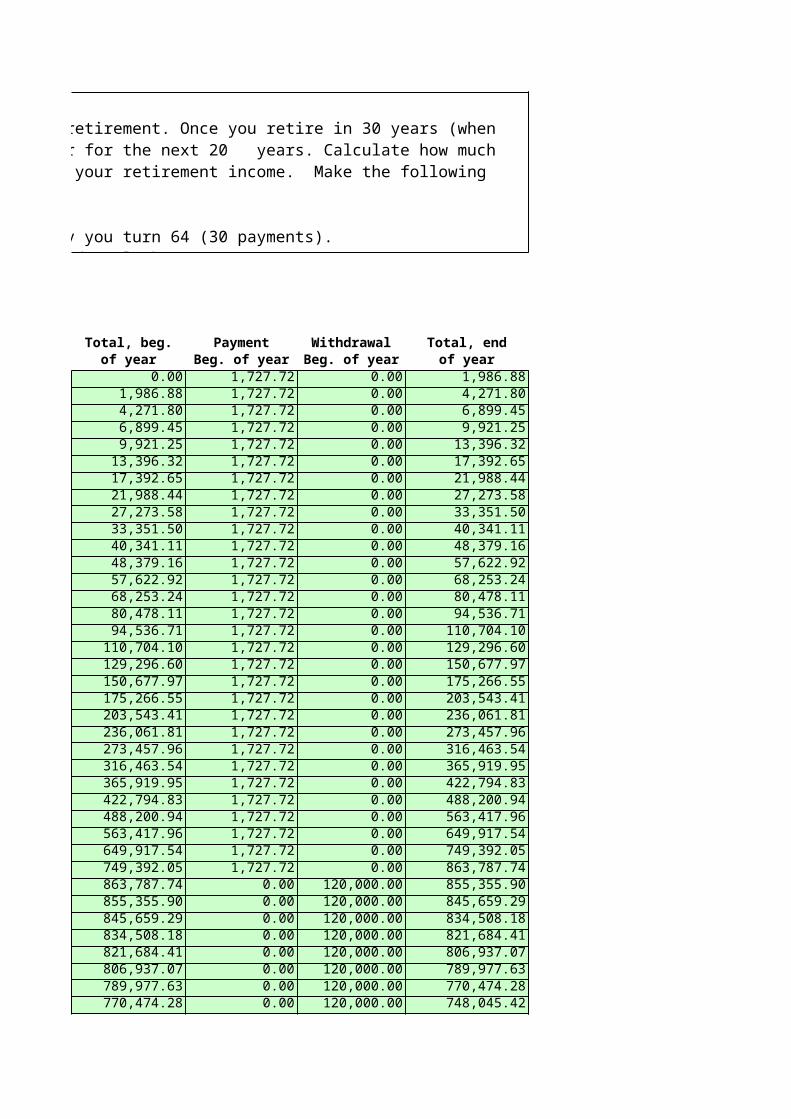
Total, beg. Payment Withdrawal Total, endof year Beg. of year Beg. of year of year
0.00 1,727.72 0.00 1,986.881,986.88 1,727.72 0.00 4,271.804,271.80 1,727.72 0.00 6,899.456,899.45 1,727.72 0.00 9,921.259,921.25 1,727.72 0.00 13,396.32
13,396.32 1,727.72 0.00 17,392.6517,392.65 1,727.72 0.00 21,988.4421,988.44 1,727.72 0.00 27,273.5827,273.58 1,727.72 0.00 33,351.5033,351.50 1,727.72 0.00 40,341.1140,341.11 1,727.72 0.00 48,379.1648,379.16 1,727.72 0.00 57,622.9257,622.92 1,727.72 0.00 68,253.2468,253.24 1,727.72 0.00 80,478.1180,478.11 1,727.72 0.00 94,536.7194,536.71 1,727.72 0.00 110,704.10
110,704.10 1,727.72 0.00 129,296.60129,296.60 1,727.72 0.00 150,677.97150,677.97 1,727.72 0.00 175,266.55175,266.55 1,727.72 0.00 203,543.41203,543.41 1,727.72 0.00 236,061.81236,061.81 1,727.72 0.00 273,457.96273,457.96 1,727.72 0.00 316,463.54316,463.54 1,727.72 0.00 365,919.95365,919.95 1,727.72 0.00 422,794.83422,794.83 1,727.72 0.00 488,200.94488,200.94 1,727.72 0.00 563,417.96563,417.96 1,727.72 0.00 649,917.54649,917.54 1,727.72 0.00 749,392.05749,392.05 1,727.72 0.00 863,787.74863,787.74 0.00 120,000.00 855,355.90855,355.90 0.00 120,000.00 845,659.29845,659.29 0.00 120,000.00 834,508.18834,508.18 0.00 120,000.00 821,684.41821,684.41 0.00 120,000.00 806,937.07806,937.07 0.00 120,000.00 789,977.63789,977.63 0.00 120,000.00 770,474.28770,474.28 0.00 120,000.00 748,045.42
You have just turned 35, and you intend to start saving for your retirement. Once you retire in 30 years (when you turn 65), you would like to have an income of $120000 per year for the next 20 years. Calculate how much you would have to save between now and age 65 in order to finance your
You make the first payment today and the last payment on the day you turn 64 (30 payments).You make the first withdrawal when you turn 65 and the last withdrawal when you turn 84 (20 payments).
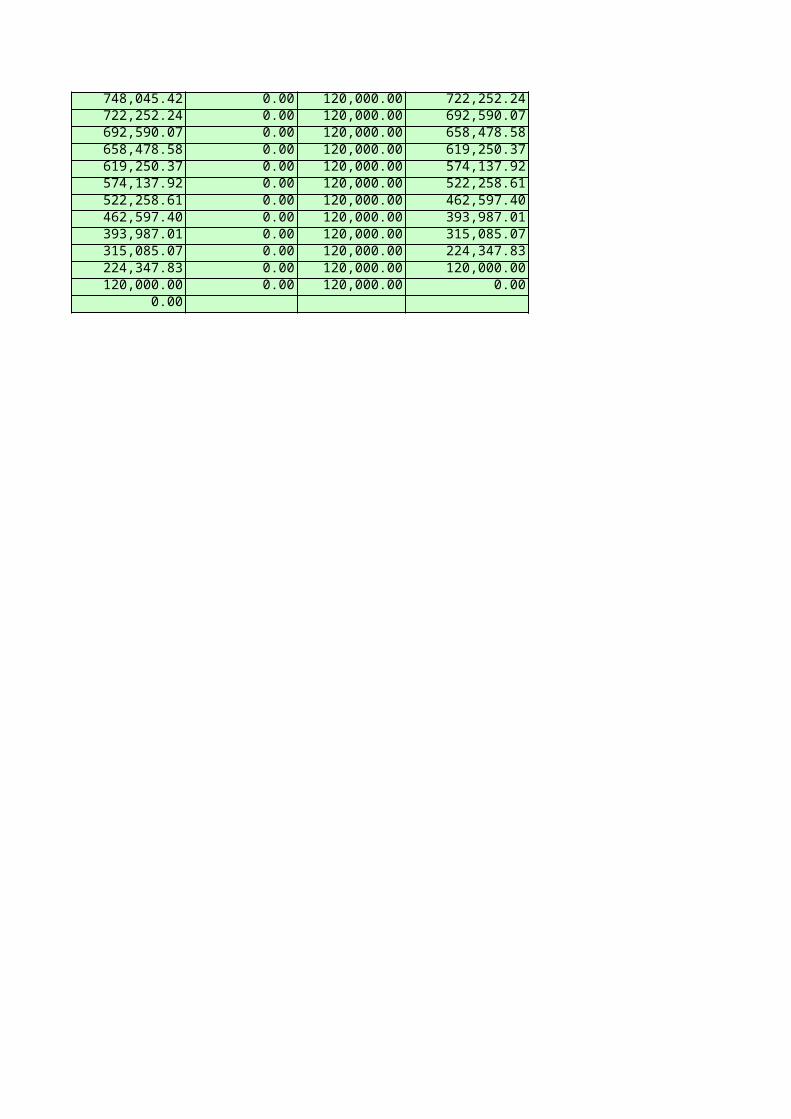
748,045.42 0.00 120,000.00 722,252.24722,252.24 0.00 120,000.00 692,590.07692,590.07 0.00 120,000.00 658,478.58658,478.58 0.00 120,000.00 619,250.37619,250.37 0.00 120,000.00 574,137.92574,137.92 0.00 120,000.00 522,258.61522,258.61 0.00 120,000.00 462,597.40462,597.40 0.00 120,000.00 393,987.01393,987.01 0.00 120,000.00 315,085.07315,085.07 0.00 120,000.00 224,347.83224,347.83 0.00 120,000.00 120,000.00120,000.00 0.00 120,000.00 0.00
0.00
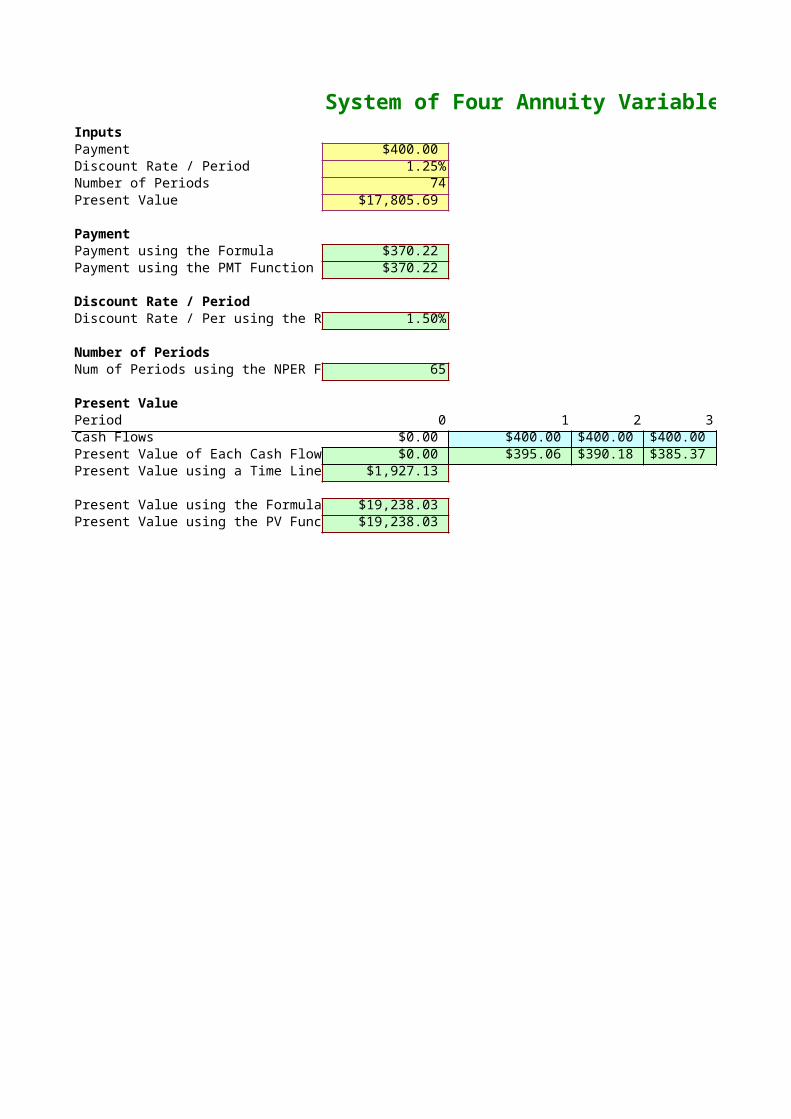
System of Four Annuity VariablesInputsPayment $400.00 Discount Rate / Period 1.25%Number of Periods 74Present Value $17,805.69
PaymentPayment using the Formula $370.22 Payment using the PMT Function $370.22
Discount Rate / PeriodDiscount Rate / Per using the RATE F 1.50%
Number of PeriodsNum of Periods using the NPER Functi 65
Present ValuePeriod 0 1 2 3Cash Flows $0.00 $400.00 $400.00 $400.00 Present Value of Each Cash Flow $0.00 $395.06 $390.18 $385.37 Present Value using a Time Line $1,927.13
Present Value using the Formula $19,238.03 Present Value using the PV Function $19,238.03
Problem 10 ANNUITY
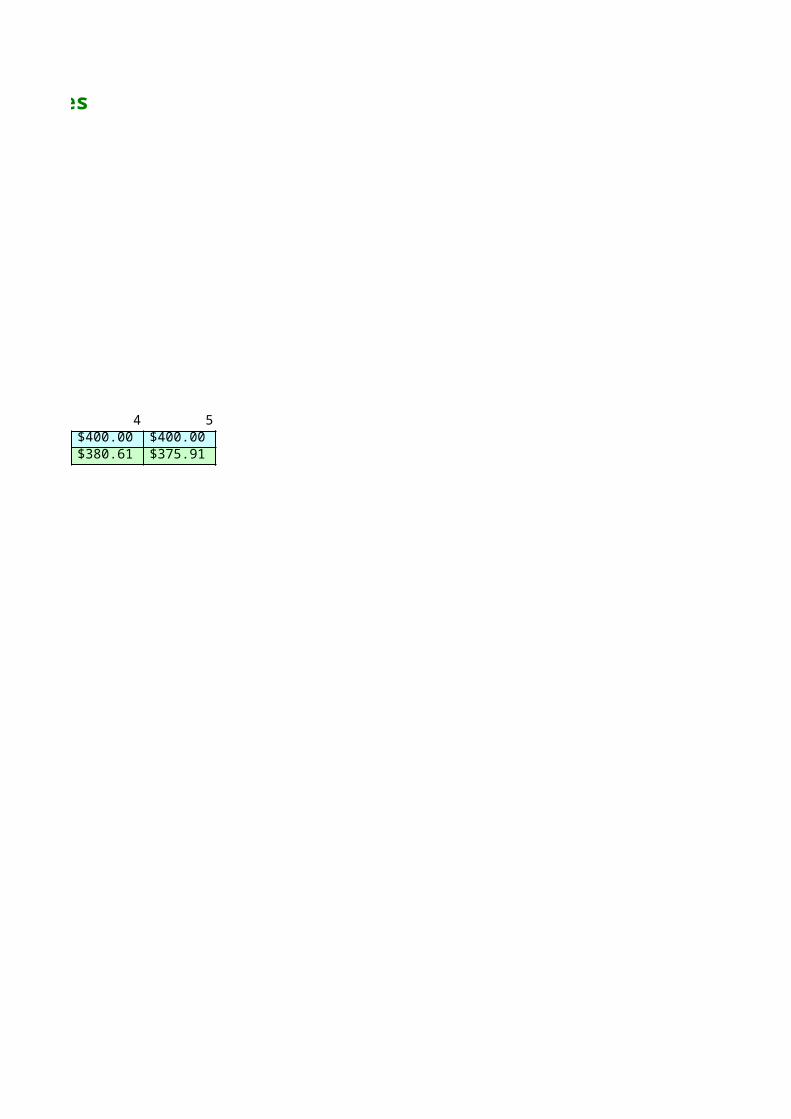
4 5$400.00 $400.00 $380.61 $375.91
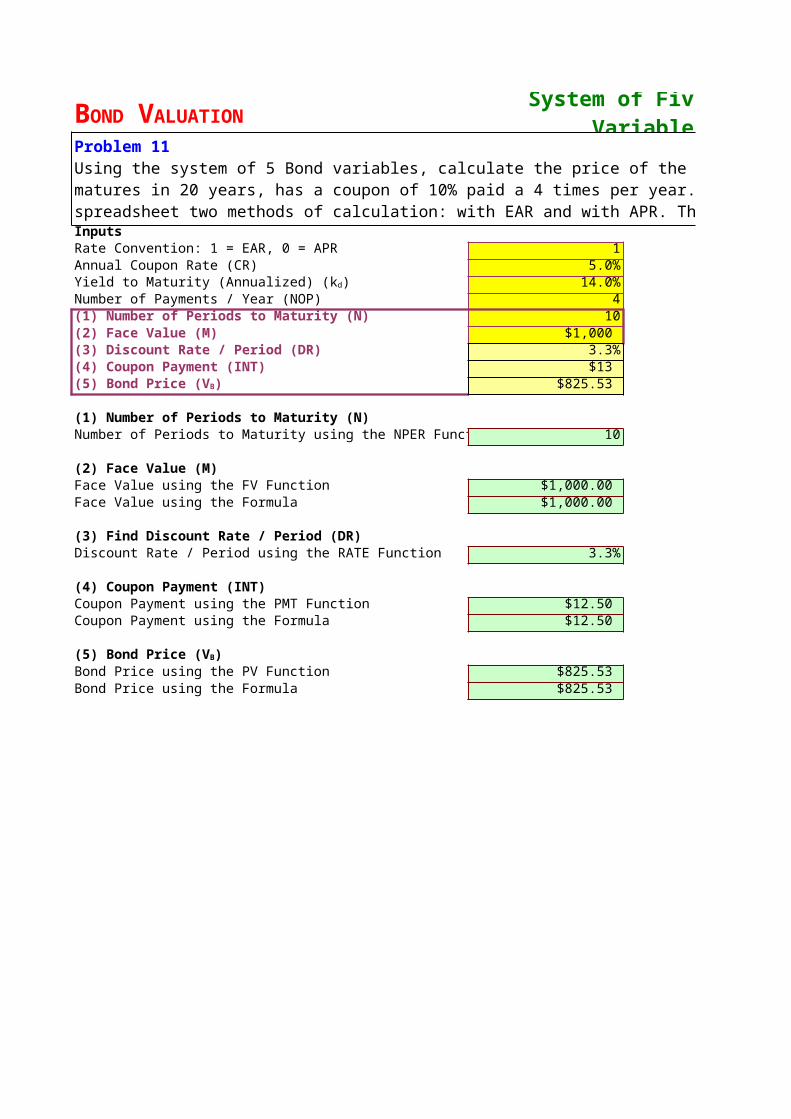
System of Five Bond Variables
InputsRate Convention: 1 = EAR, 0 = APR 1Annual Coupon Rate (CR) 5.0%
14.0%Number of Payments / Year (NOP) 4(1) Number of Periods to Maturity (N) 10(2) Face Value (M) $1,000 (3) Discount Rate / Period (DR) 3.3%(4) Coupon Payment (INT) $13
$825.53
(1) Number of Periods to Maturity (N)Number of Periods to Maturity using the NPER Function 9.99999999999999
(2) Face Value (M)Face Value using the FV Function $1,000.00 Face Value using the Formula $1,000.00
(3) Find Discount Rate / Period (DR)Discount Rate / Period using the RATE Function 3.3%
(4) Coupon Payment (INT)Coupon Payment using the PMT Function $12.50 Coupon Payment using the Formula $12.50
Bond Price using the PV Function $825.53 Bond Price using the Formula $825.53
BOND VALUATION
Problem 11Using the system of 5 Bond variables, calculate the price of the bond, which matures in 20 years, has a coupon of 10% paid a 4 times per year. Show in one spreadsheet two methods of calculation: with EAR and with APR. The Par Value of a bond is $ 1000.
Yield to Maturity (Annualized) (kd)
(5) Bond Price (VB)
(5) Bond Price (VB)
System of Five Bond Variables Effective Annual Rate
Using the system of 5 Bond variables, calculate the price of the bond, which matures in 20 years, has a coupon of 10% paid a 4 times per year. Show in one spreadsheet two methods of calculation: with EAR and
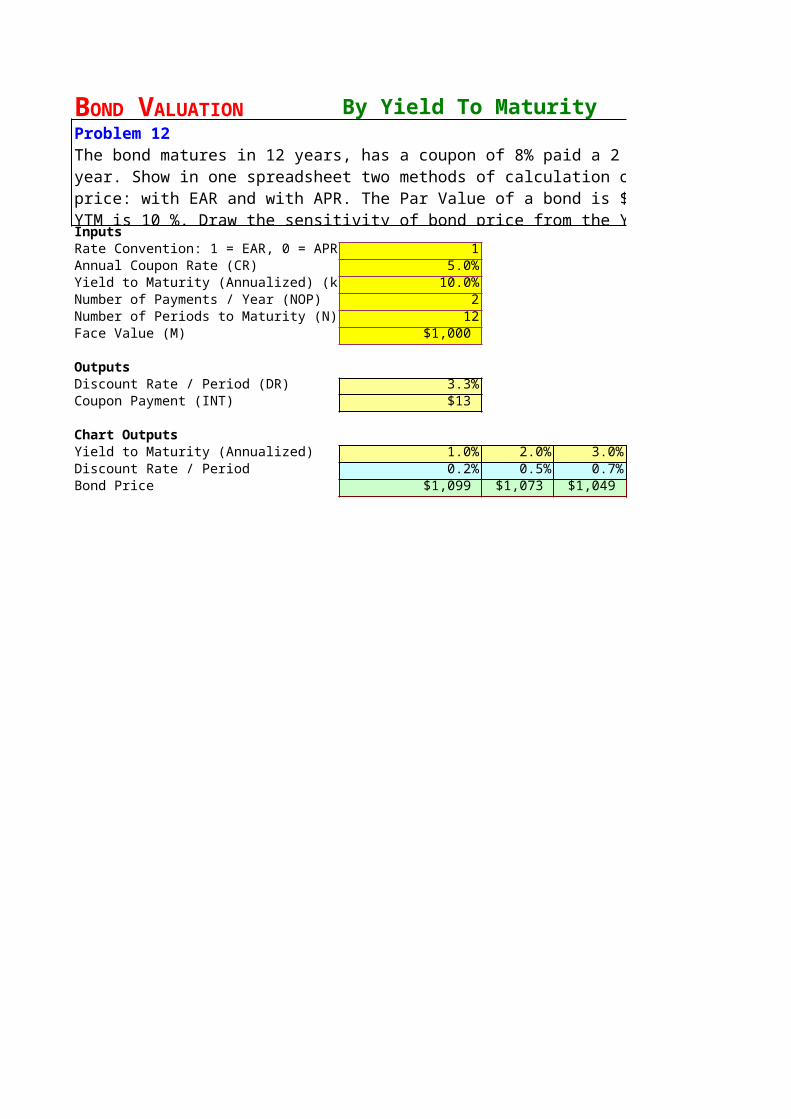
By Yield To Maturity
InputsRate Convention: 1 = EAR, 0 = APR 1Annual Coupon Rate (CR) 5.0%Yield to Maturity (Annualized) (kd) 10.0%Number of Payments / Year (NOP) 2Number of Periods to Maturity (N) 12Face Value (M) $1,000
OutputsDiscount Rate / Period (DR) 3.3%Coupon Payment (INT) $13
Chart OutputsYield to Maturity (Annualized) 1.0% 2.0% 3.0% 4.0%Discount Rate / Period 0.2% 0.5% 0.7% 1.0%Bond Price $1,099 $1,073 $1,049 $1,025
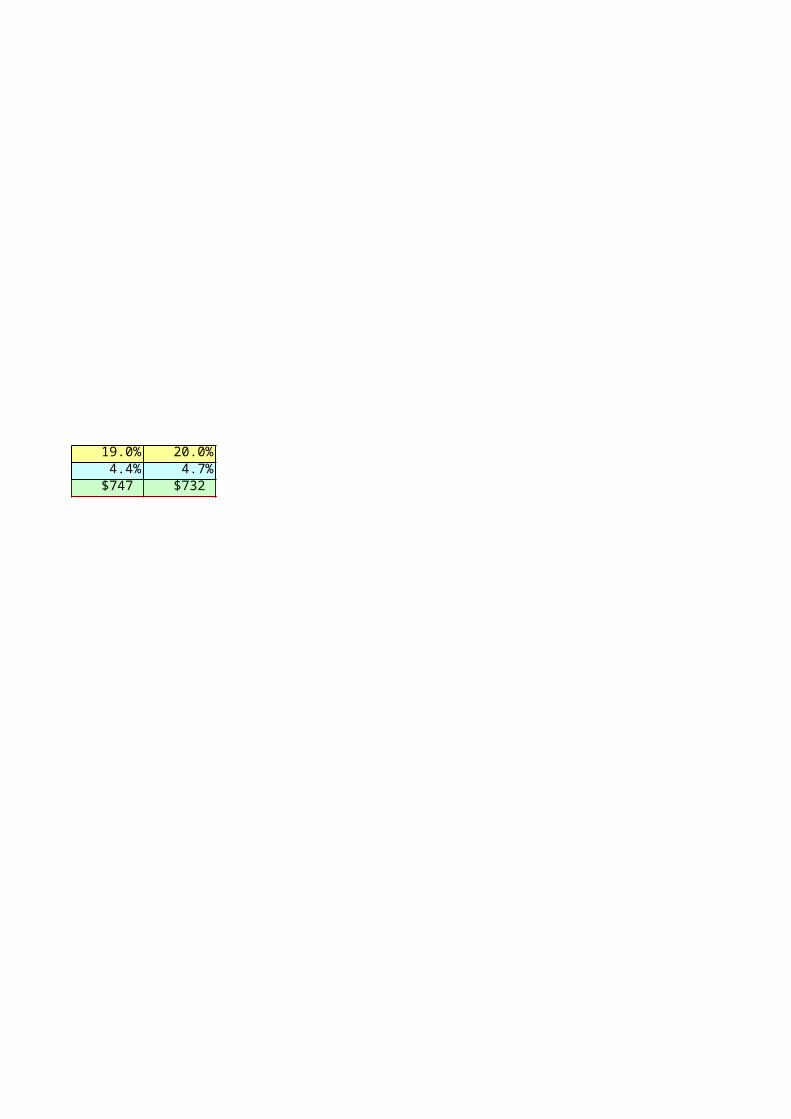
BOND VALUATIONProblem 12The bond matures in 12 years, has a coupon of 8% paid a 2 times per year. Show in one spreadsheet two methods of calculation of the bond price: with EAR and with APR. The Par Value of a bond is $ 1000 and YTM is 10 %. Draw the sensitivity of bond price from the YTM graph using the APR.
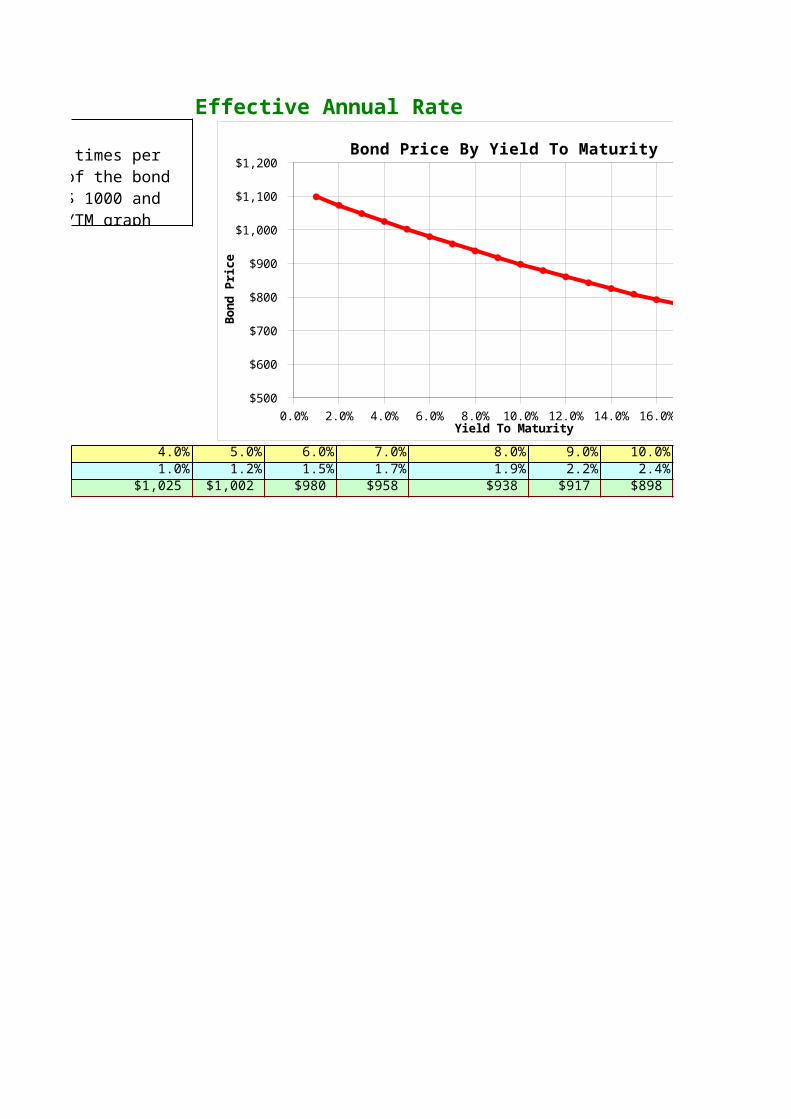
Effective Annual Rate
5.0% 6.0% 7.0% 8.0% 9.0% 10.0% 11.0% 12.0% 13.0%1.2% 1.5% 1.7% 1.9% 2.2% 2.4% 2.6% 2.9% 3.1%
$1,002 $980 $958 $938 $917 $898 $879 $861 $843
0.0% 2.0% 4.0% 6.0% 8.0% 10.0% 12.0% 14.0% 16.0% 18.0% 20.0%$500
$600
$700
$800
$900
$1,000
$1,100
$1,200 Bond Price By Yield To Maturity
Yield To Maturity
Bo
nd
Pri
ce
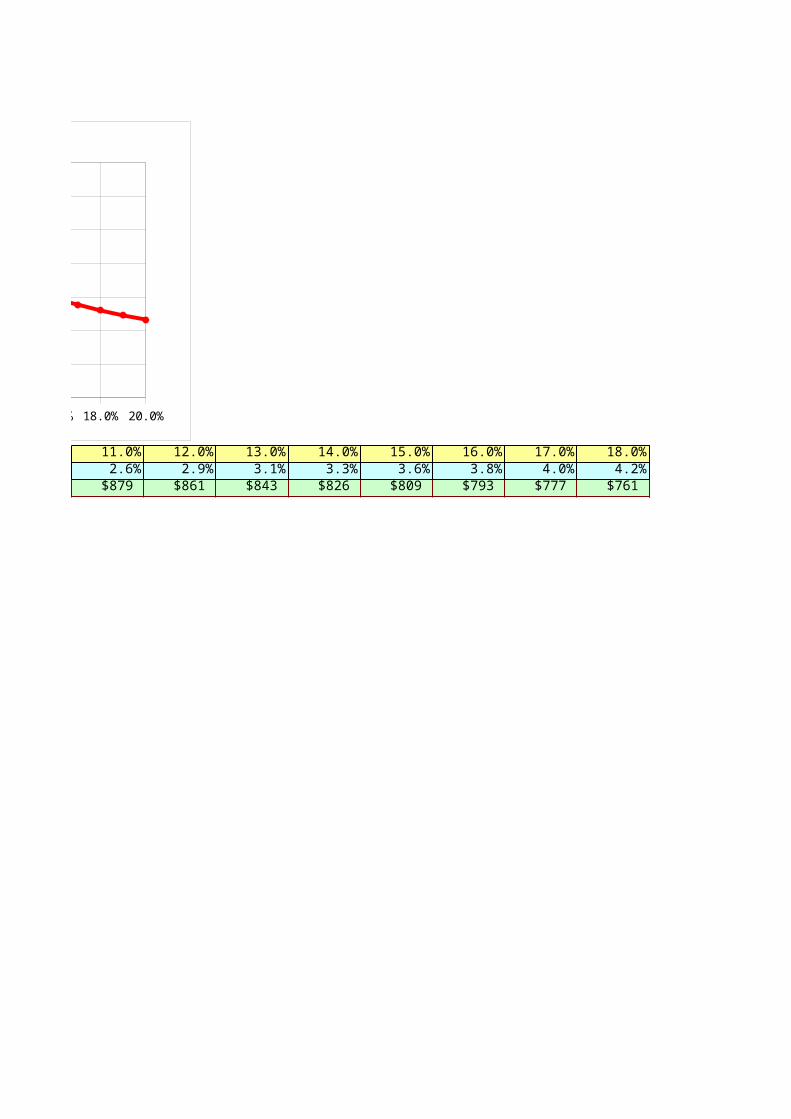
14.0% 15.0% 16.0% 17.0% 18.0% 19.0% 20.0%3.3% 3.6% 3.8% 4.0% 4.2% 4.4% 4.7%$826 $809 $793 $777 $761 $747 $732
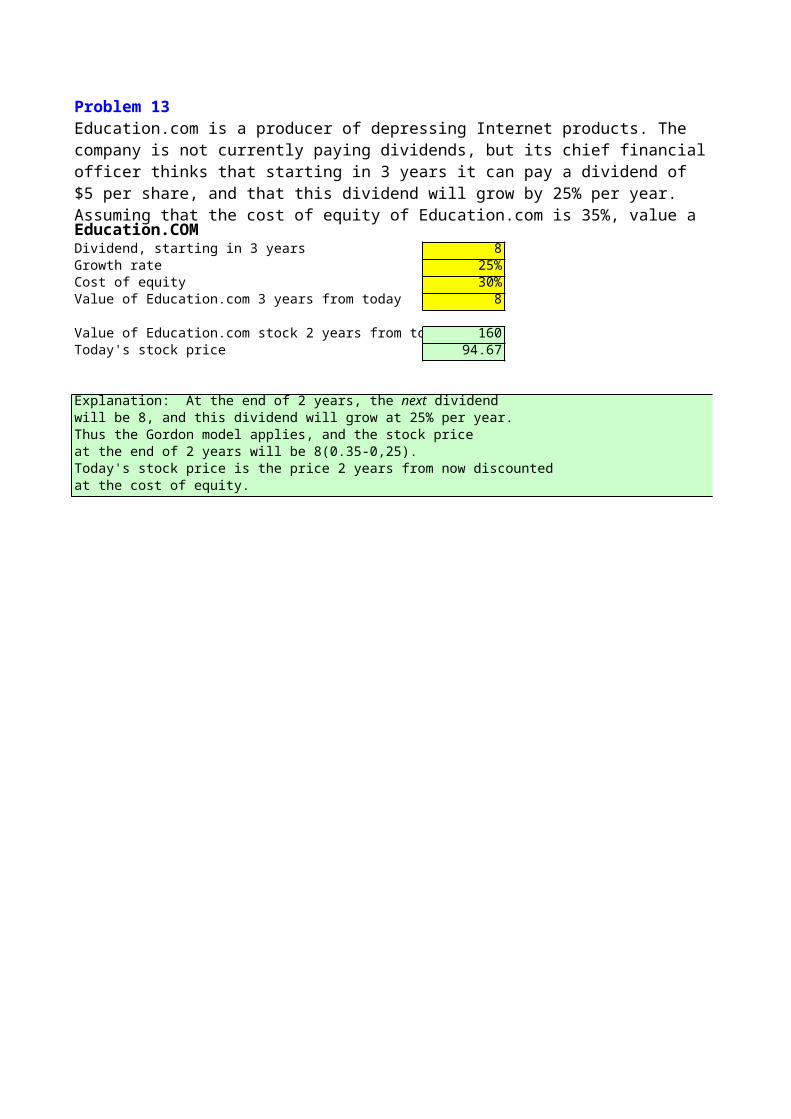
Education.COMDividend, starting in 3 years 8Growth rate 25%Cost of equity 30%Value of Education.com 3 years from today 8
Value of Education.com stock 2 years from today 160Today's stock price 94.67
will be 8, and this dividend will grow at 25% per year.Thus the Gordon model applies, and the stock priceat the end of 2 years will be 8(0.35-0,25).Today's stock price is the price 2 years from now discountedat the cost of equity.
Problem 13Education.com is a producer of depressing Internet products. The company is not currently paying dividends, but its chief financial officer thinks that starting in 3 years it can pay a dividend of $5 per share, and that this dividend will grow by 25% per year. Assuming that the cost of equity of Education.com is 35%, value a share based on the discounted dividends.
Explanation: At the end of 2 years, the next dividend

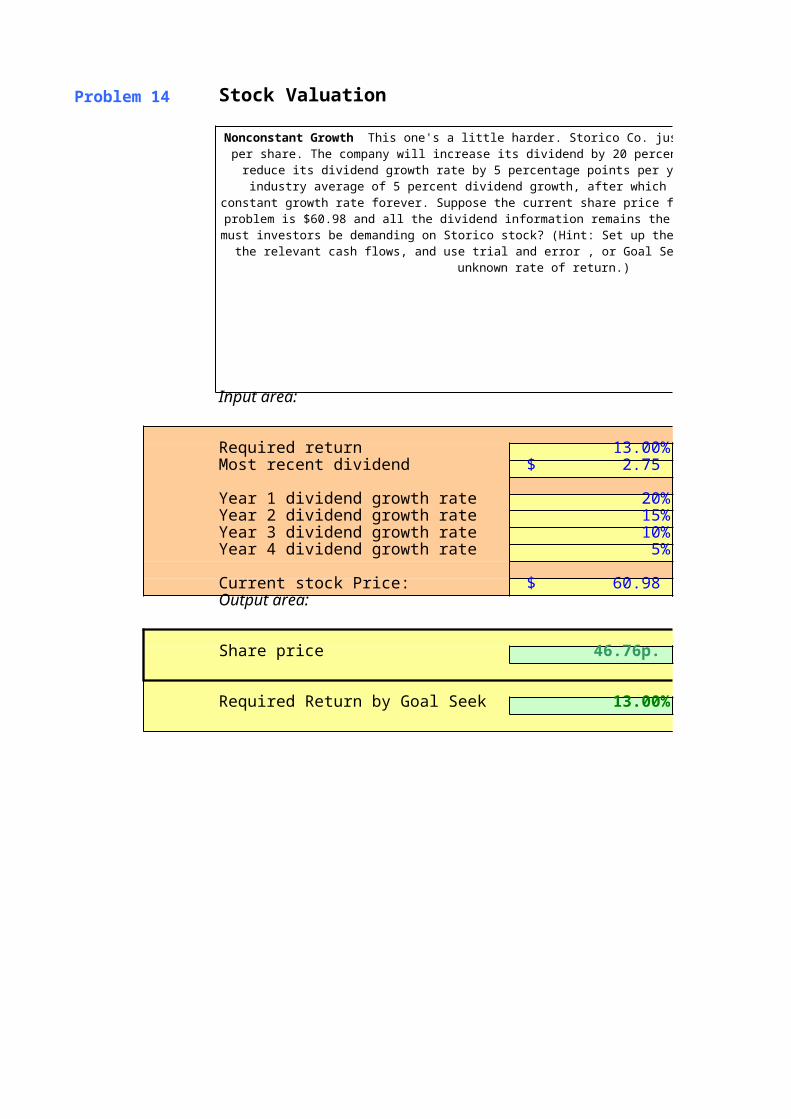
Problem 14 Stock Valuation
Input area:
Required return 13.00%Most recent dividend $ 2.75
Year 1 dividend growth rate 20%Year 2 dividend growth rate 15%Year 3 dividend growth rate 10%Year 4 dividend growth rate 5%
Current stock Price: $ 60.98 Output area:
Share price 46.76р.
Required Return by Goal Seek 13.00%
Nonconstant Growth This one's a little harder. Storico Co. just paid a dividend of $2.75 per share. The company will increase its dividend by 20 percent next year and will then reduce its dividend growth rate by 5 percentage points per year until it reaches the industry average of 5
percent dividend growth, after which the company will keep a constant growth rate forever. Suppose the current share price for the firm in the previous problem is $60.98 and all the dividend
information remains the same. What required return must investors be demanding on Storico stock? (Hint: Set up the valuation formula with all the relevant cash flows, and use trial and error ,
or Goal Seek, or SOLVER to find the unknown rate of return.)
This one's a little harder. Storico Co. just paid a dividend of $2.75 per share. The company will increase its dividend by 20 percent next year and will then reduce its dividend growth rate by 5 percentage points per year until it reaches the industry average of 5
percent dividend growth, after which the company will keep a constant growth rate forever. Suppose the current share price for the firm in the previous problem is $60.98 and all the dividend
information remains the same. What required return must investors be demanding on Storico stock? (Hint: Set up the valuation formula with all the relevant cash flows, and use trial and error ,
or Goal Seek, or SOLVER to find the unknown rate of return.)
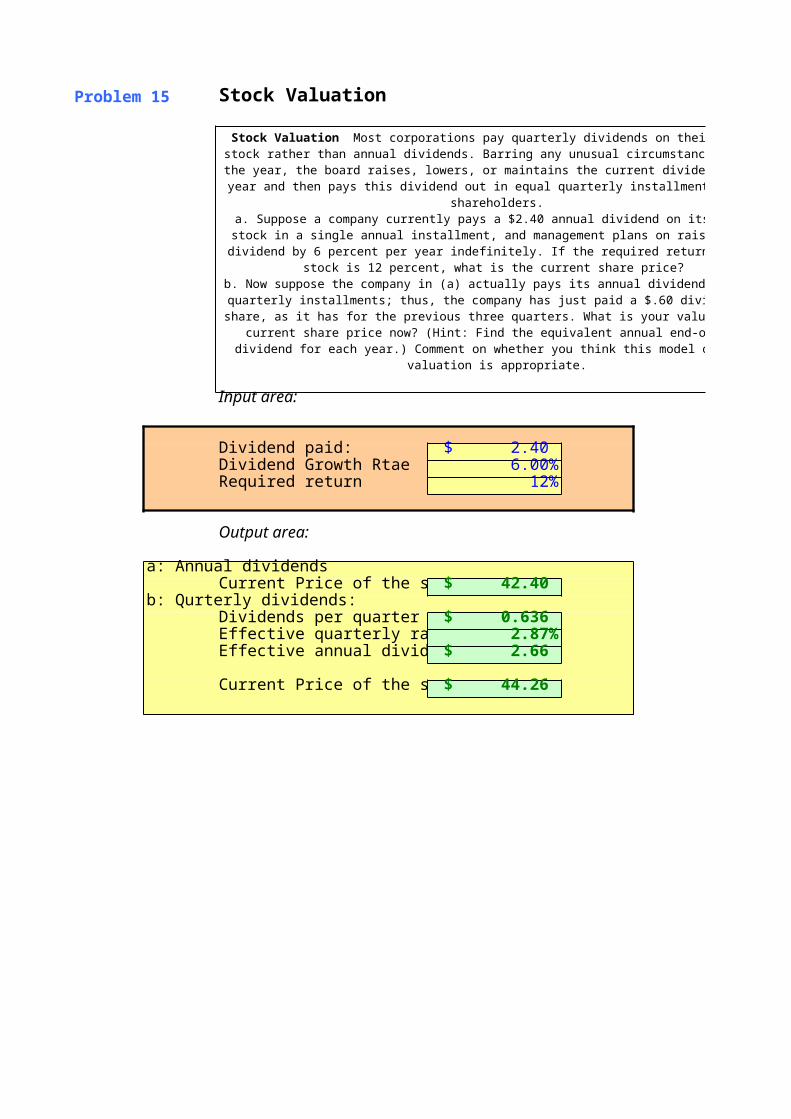
Problem 15 Stock Valuation
Input area:
Dividend paid: $ 2.40 Dividend Growth Rtae 6.00%Required return 12%
Output area:
a: Annual dividendsCurrent Price of the stock $ 42.40
b: Qurterly dividends:Dividends per quarter $ 0.636 Effective quarterly rate: 2.87%Effective annual dividend: $ 2.66
Current Price of the stock: $ 44.26
Stock Valuation Most corporations pay quarterly dividends on their common stock rather than annual dividends. Barring any unusual circumstances during the year, the board raises, lowers, or maintains the current dividend once a year and then
pays this dividend out in equal quarterly installments to its shareholders.a. Suppose a company currently pays a $2.40 annual dividend on its common stock in a single annual installment, and management plans on raising this dividend by 6 percent per year indefinitely. If the required return on this stock is 12 percent, what
is the current share price? b. Now suppose the company in (a) actually pays its annual dividend in equal
quarterly installments; thus, the company has just paid a $.60 dividend per share, as it has for the previous three quarters. What is your value for the current share price
now? (Hint: Find the equivalent annual end-of-year dividend for each year.) Comment on whether you think this model of stock valuation is appropriate.
Most corporations pay quarterly dividends on their common stock rather than annual dividends. Barring any unusual circumstances during the year, the board raises, lowers, or maintains the current dividend once a year and then
pays this dividend out in equal quarterly installments to its shareholders.a. Suppose a company currently pays a $2.40 annual dividend on its common stock in a single annual installment, and management plans on raising this dividend by 6 percent per year indefinitely. If the required return on this stock is 12 percent, what
b. Now suppose the company in (a) actually pays its annual dividend in equal quarterly installments; thus, the company has just paid a $.60 dividend per share, as it has for the previous three quarters. What is your value for the current share price
now? (Hint: Find the equivalent annual end-of-year dividend for each year.) Comment on whether you think this model of stock valuation is appropriate.
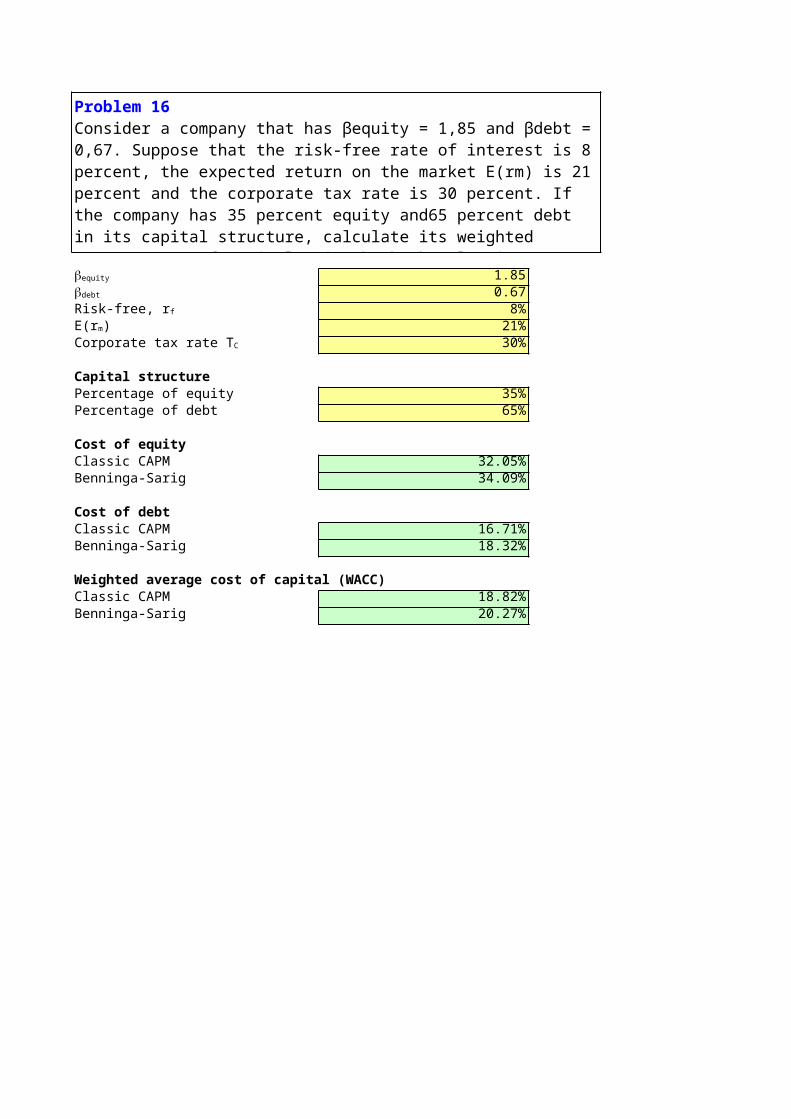
1.850.678%
21%30%
Capital structurePercentage of equity 35%Percentage of debt 65%
Cost of equityClassic CAPM 32.05%Benninga-Sarig 34.09%
Cost of debtClassic CAPM 16.71%Benninga-Sarig 18.32%
Weighted average cost of capital (WACC)Classic CAPM 18.82%Benninga-Sarig 20.27%
Problem 16Consider a company that has βequity = 1,85 and βdebt = 0,67. Suppose that the risk-free rate of interest is 8 percent, the expected return on the market E(rm) is 21 percent and the corporate tax rate is 30 percent. If the company has 35 percent equity and65 percent debt in its capital structure, calculate its weighted average cost of capital using both the classic CAPM and the Benninga-Sarig tax-adjusted CAPM.
bequity
bdebt
Risk-free, rf
E(rm)Corporate tax rate TC
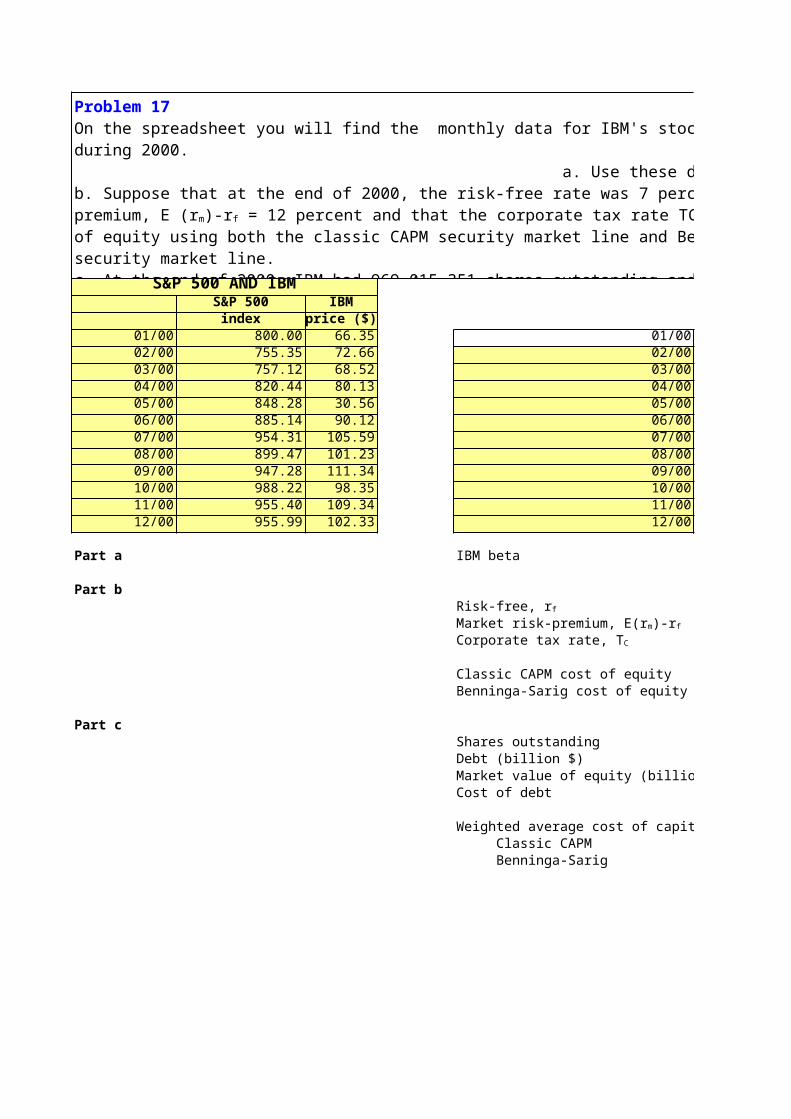
S&P 500 AND IBMS&P 500 IBM
index price ($)01/00 800.00 66.35 01/0002/00 755.35 72.66 02/0003/00 757.12 68.52 03/0004/00 820.44 80.13 04/0005/00 848.28 30.56 05/0006/00 885.14 90.12 06/0007/00 954.31 105.59 07/0008/00 899.47 101.23 08/0009/00 947.28 111.34 09/0010/00 988.22 98.35 10/0011/00 955.40 109.34 11/0012/00 955.99 102.33 12/00
Part a IBM beta
Part b
Classic CAPM cost of equityBenninga-Sarig cost of equity
Part cShares outstandingDebt (billion $)Market value of equity (billion $)Cost of debt
Weighted average cost of capital (WACC) Classic CAPM Benninga-Sarig
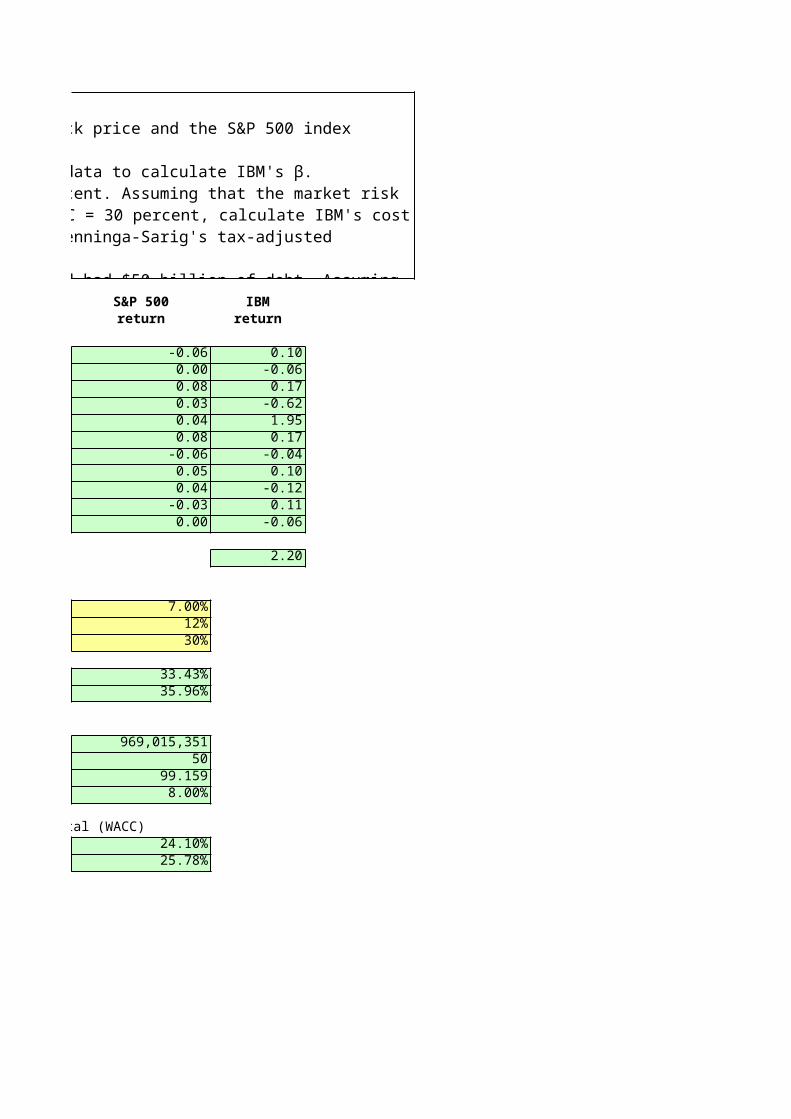
Problem 17On the spreadsheet you will find the monthly data for IBM's stock price and the S&P 500 index during 2000. a. Use these data to calculate IBM's β.b. Suppose that at the end of 2000, the risk-free rate was 7 percent. Assuming that the market risk premium, E (rm)-rf = 12 percent and that the corporate tax rate TC = 30 percent, calculate IBM's cost of equity using both the classic CAPM security market line and Benninga-Sarig's tax-adjusted security market line.c. At the end of 2000, IBM had 969,015,351 shares outstanding and had $50 billion of debt. Assuming that IBM's cost of debt is 8 percent, use your calculations for the cost of equity in part b to arrive at two estimates of IBM's weighted average cost of capital.
Risk-free, rf
Market risk-premium, E(rm)-rf
Corporate tax rate, TC
S&P 500 IBMreturn return
-0.06 0.100.00 -0.060.08 0.170.03 -0.620.04 1.950.08 0.17
-0.06 -0.040.05 0.100.04 -0.12
-0.03 0.110.00 -0.06
2.20
7.00%12%30%
33.43%35.96%
969,015,35150
99.1598.00%
Weighted average cost of capital (WACC)24.10%25.78%
On the spreadsheet you will find the monthly data for IBM's stock price and the S&P 500 index during 2000. a. Use these data to calculate IBM's β.b. Suppose that at the end of 2000, the risk-free rate was 7 percent. Assuming that the market risk premium, E (rm)-rf = 12 percent and that the corporate tax rate TC = 30 percent, calculate IBM's cost of equity using both the classic CAPM security market line and Benninga-
c. At the end of 2000, IBM had 969,015,351 shares outstanding and had $50 billion of debt. Assuming that IBM's cost of debt is 8 percent, use your calculations for the cost of equity in part b to arrive at two estimates of IBM's weighted average cost of capital.
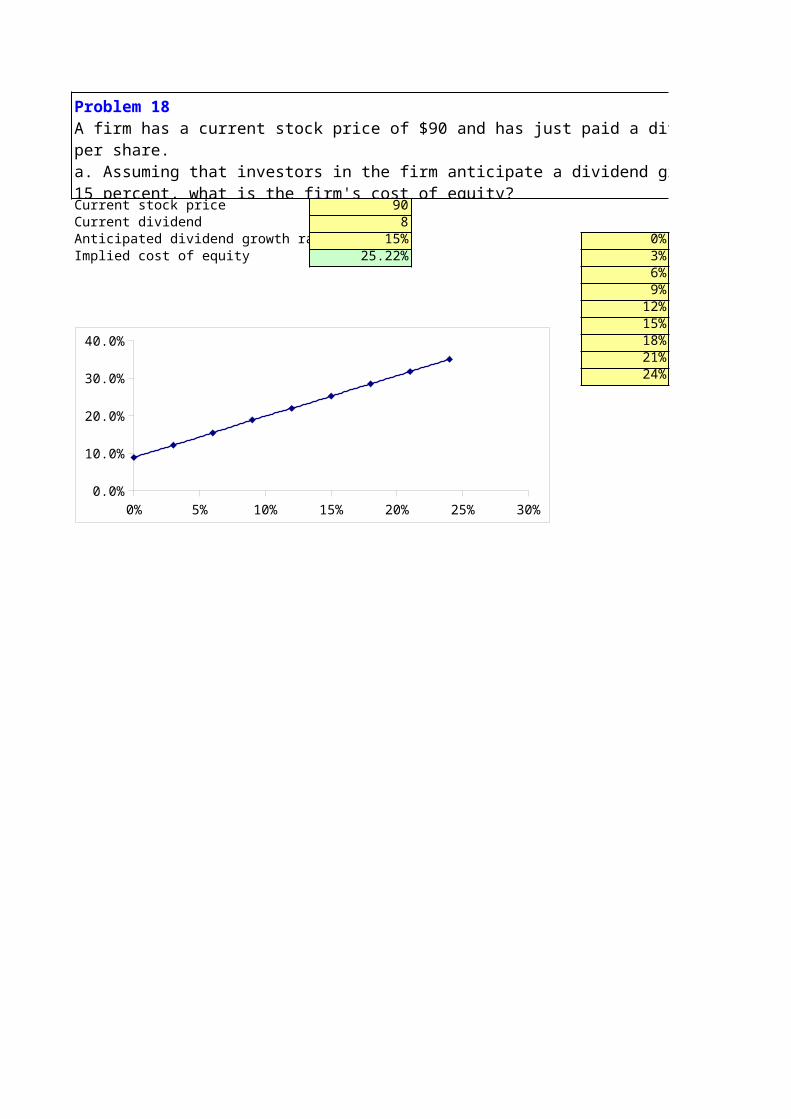
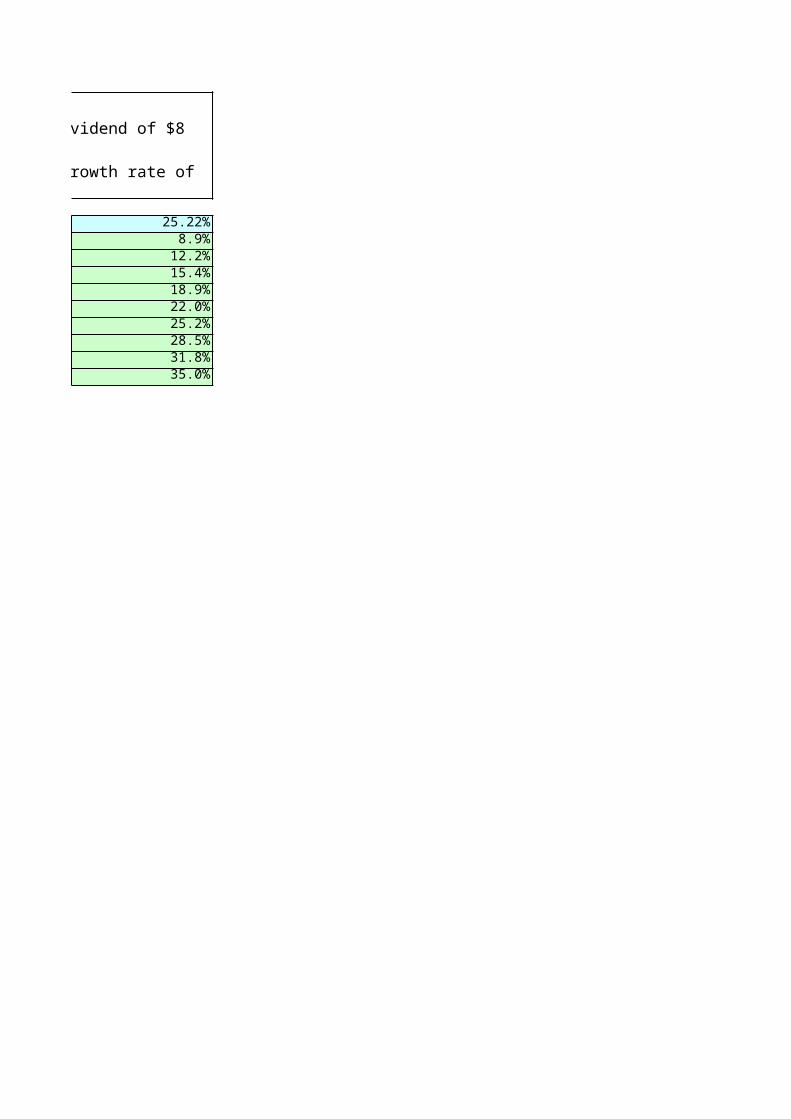
Current stock price 90Current dividend 8Anticipated dividend growth rate 15% 0%Implied cost of equity 25.22% 3%
6%9%
12%15%18%21%24%
Problem 18A firm has a current stock price of $90 and has just paid a dividend of $8 per share.a. Assuming that investors in the firm anticipate a dividend growth rate of 15 percent, what is the firm's cost of equity?b. Draw a graph showing the relation between the cost of equity and the anticipated dividend growth rate.
0% 5% 10% 15% 20% 25% 30%0.0%
5.0%
10.0%
15.0%
20.0%
25.0%
30.0%
35.0%
40.0%
25.22%8.9%
12.2%15.4%18.9%22.0%25.2%28.5%31.8%35.0%
A firm has a current stock price of $90 and has just paid a dividend of $8 per share.a. Assuming that investors in the firm anticipate a dividend growth rate of 15 percent, what is the firm's
b. Draw a graph showing the relation between the cost of equity and the anticipated dividend growth rate.
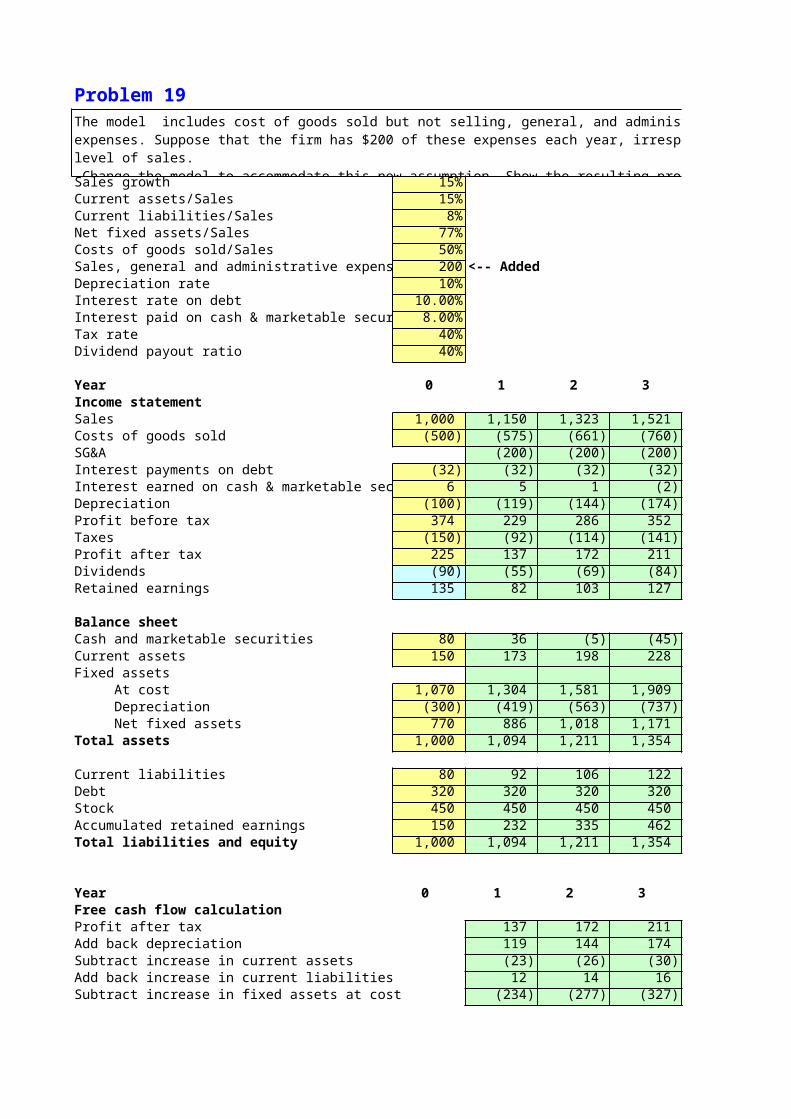
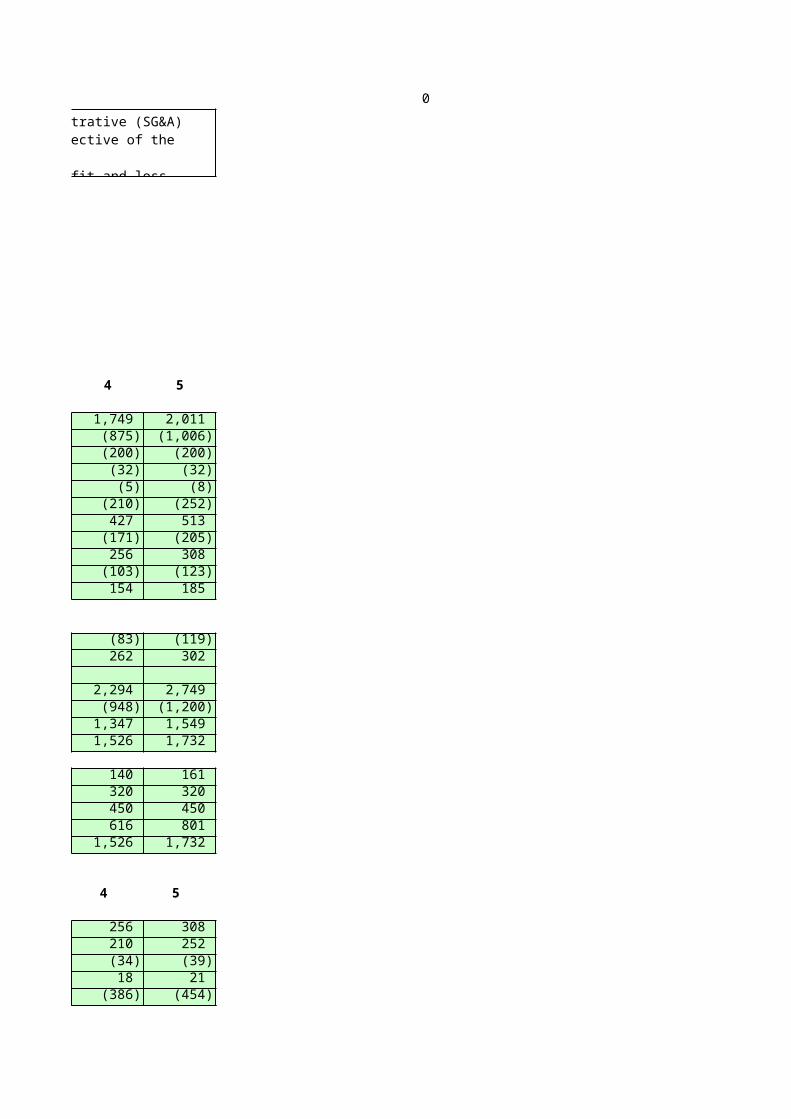
Problem 19
Sales growth 15%Current assets/Sales 15%Current liabilities/Sales 8%Net fixed assets/Sales 77%Costs of goods sold/Sales 50%Sales, general and administrative expenses 200 <-- AddedDepreciation rate 10%Interest rate on debt 10.00%Interest paid on cash & marketable securities 8.00%Tax rate 40%Dividend payout ratio 40%
Year 0 1 2 3 4Income statementSales 1,000 1,150 1,323 1,521 1,749 Costs of goods sold (500) (575) (661) (760) (875)SG&A (200) (200) (200) (200)Interest payments on debt (32) (32) (32) (32) (32)Interest earned on cash & marketable securities 6 5 1 (2) (5)Depreciation (100) (119) (144) (174) (210)Profit before tax 374 229 286 352 427 Taxes (150) (92) (114) (141) (171)Profit after tax 225 137 172 211 256 Dividends (90) (55) (69) (84) (103)Retained earnings 135 82 103 127 154
Balance sheetCash and marketable securities 80 36 (5) (45) (83)Current assets 150 173 198 228 262 Fixed assets At cost 1,070 1,304 1,581 1,909 2,294 Depreciation (300) (419) (563) (737) (948) Net fixed assets 770 886 1,018 1,171 1,347 Total assets 1,000 1,094 1,211 1,354 1,526
Current liabilities 80 92 106 122 140 Debt 320 320 320 320 320 Stock 450 450 450 450 450 Accumulated retained earnings 150 232 335 462 616 Total liabilities and equity 1,000 1,094 1,211 1,354 1,526
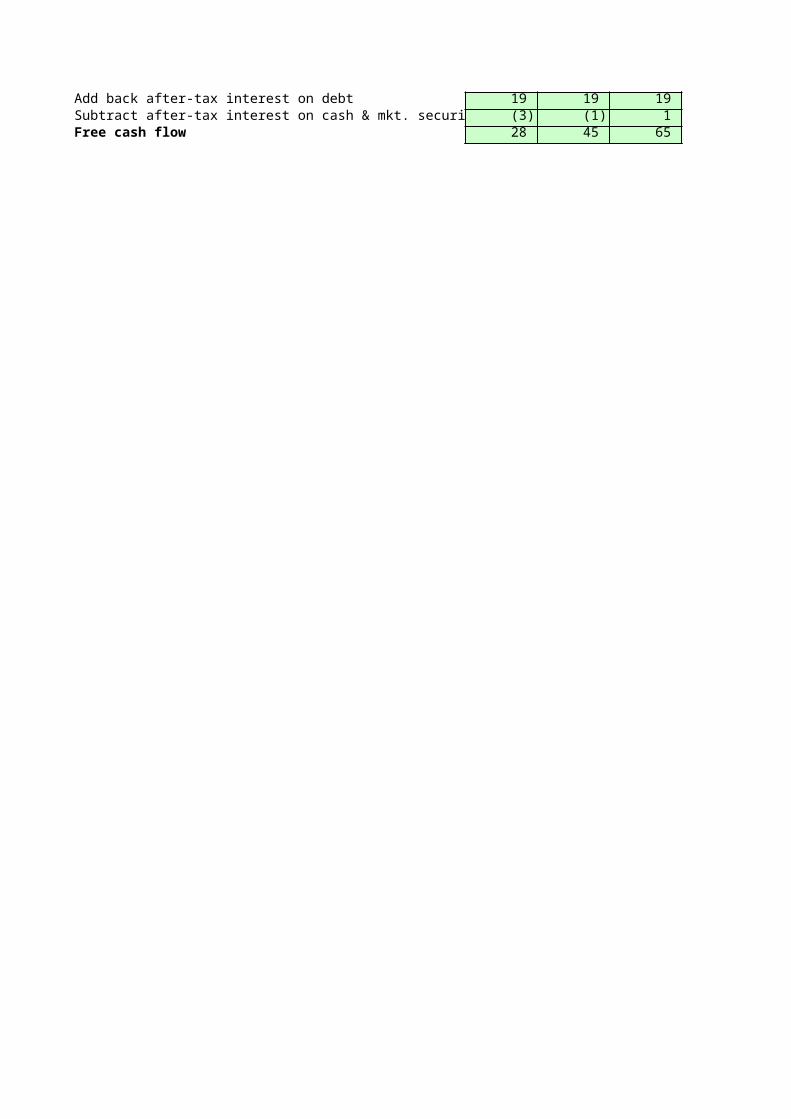
Year 0 1 2 3 4 Free cash flow calculationProfit after tax 137 172 211 256 Add back depreciation 119 144 174 210 Subtract increase in current assets (23) (26) (30) (34)Add back increase in current liabilities 12 14 16 18 Subtract increase in fixed assets at cost (234) (277) (327) (386)
The model includes cost of goods sold but not selling, general, and administrative (SG&A)expenses. Suppose that the firm has $200 of these expenses each year, irrespective of the level of sales. Change the model to accommodate this new assumption. Show the resulting profit and lossstatements, balance sheets, free cash flows, and valuation.
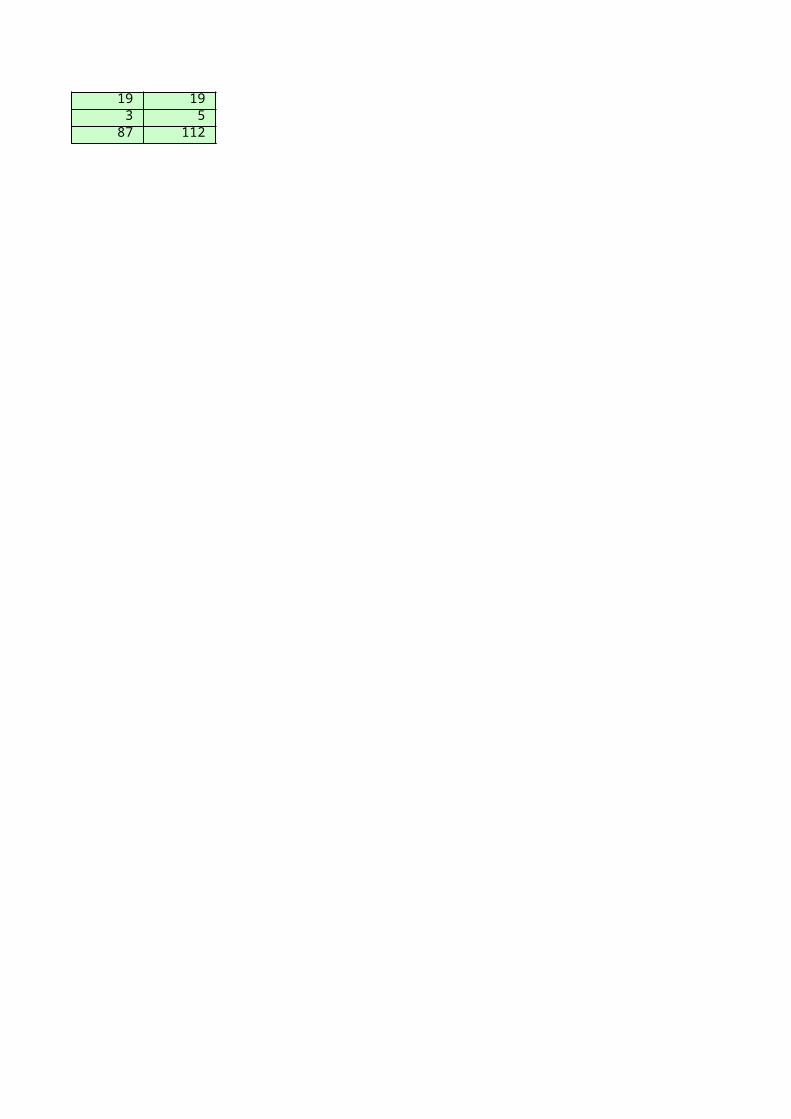
Add back after-tax interest on debt 19 19 19 19 Subtract after-tax interest on cash & mkt. securities (3) (1) 1 3 Free cash flow 28 45 65 87
0
5
2,011 (1,006) (200) (32) (8) (252) 513 (205) 308 (123) 185
(119) 302
2,749 (1,200) 1,549 1,732
161 320 450 801 1,732
5
308 252 (39)21
(454)
expenses. Suppose that the firm has $200 of these expenses each year, irrespective of the level of sales.
19 5
112
Problem 20
Sales growth 15%Current assets/Sales 15%Current liabilities/Sales 8%Net fixed assets/Sales 77%Costs of goods sold/Sales 50%Sales, general and administrative expenses 200 <-- AddedDepreciation rate 10%Interest rate on debt 10.00%Interest paid on cash & marketable securities 8.00%Tax rate 40%Dividend payout ratio 40%
Year 0 1 2 3 4Income statementSales 1,000 1,150 1,323 1,521 1,749 Costs of goods sold (500) (575) (661) (760) (875)SG&A (200) (200) (200) (200)Interest payments on debt (32) (32) (32) (32) (32)Interest earned on cash & marketable securities 6 5 1 (2) (5)Depreciation (100) (119) (144) (174) (210)Profit before tax 374 229 286 352 427 Taxes (150) (92) (114) (141) (171)Profit after tax 225 137 172 211 256 Dividends (90) (55) (69) (84) (103)Retained earnings 135 82 103 127 154
Balance sheetCash and marketable securities 80 36 (5) (45) (83)Current assets 150 173 198 228 262 Fixed assets At cost 1,070 1,304 1,581 1,909 2,294 Depreciation (300) (419) (563) (737) (948) Net fixed assets 770 886 1,018 1,171 1,347 Total assets 1,000 1,094 1,211 1,354 1,526
Current liabilities 80 92 106 122 140 Debt 320 320 320 320 320 Stock 450 450 450 450 450 Accumulated retained earnings 150 232 335 462 616 Total liabilities and equity 1,000 1,094 1,211 1,354 1,526
Year 0 1 2 3 4 Free cash flow calculationProfit after tax 137 172 211 256 Add back depreciation 119 144 174 210 Subtract increase in current assets (23) (26) (30) (34)Add back increase in current liabilities 12 14 16 18 Subtract increase in fixed assets at cost (234) (277) (327) (386)
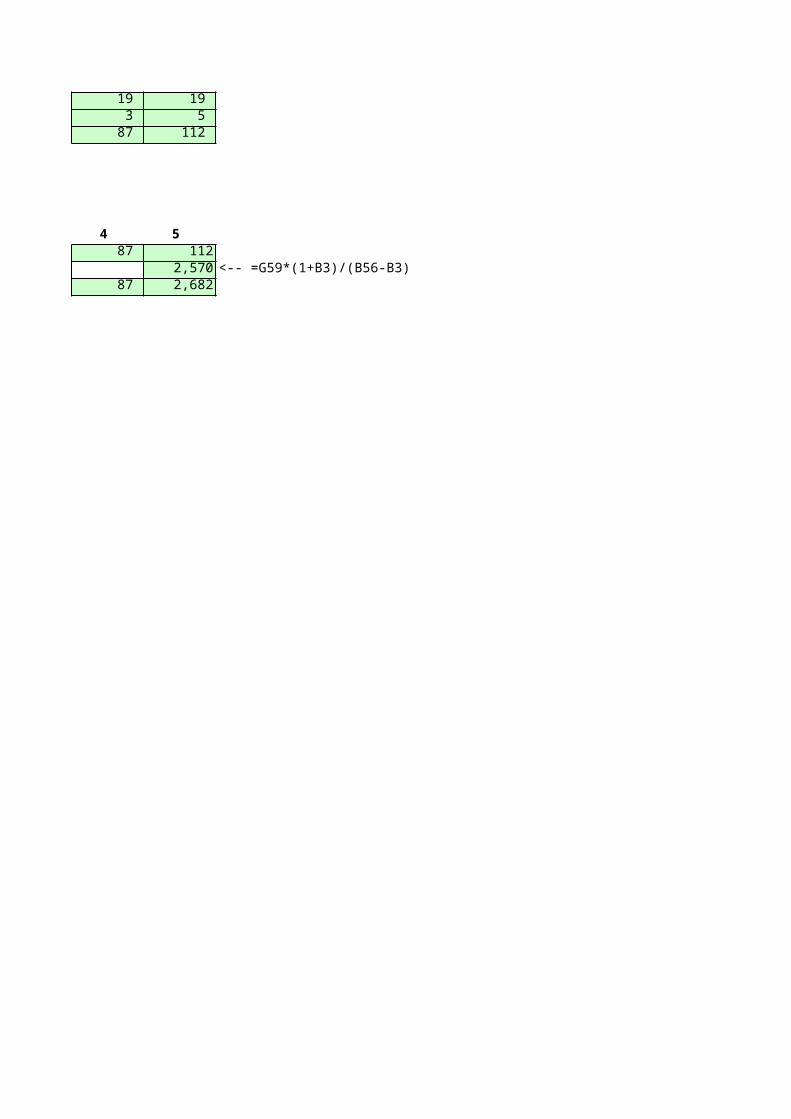
The model includes cost of goods sold but not selling, general, and administrative (SG&A)expenses. Suppose that the firm has $200 of these expenses each year, irrespective of the level of sales.Show the resulting Free cash Flow stament.where the terminal value is calculated using a Gordon dividend model on the cash flows.
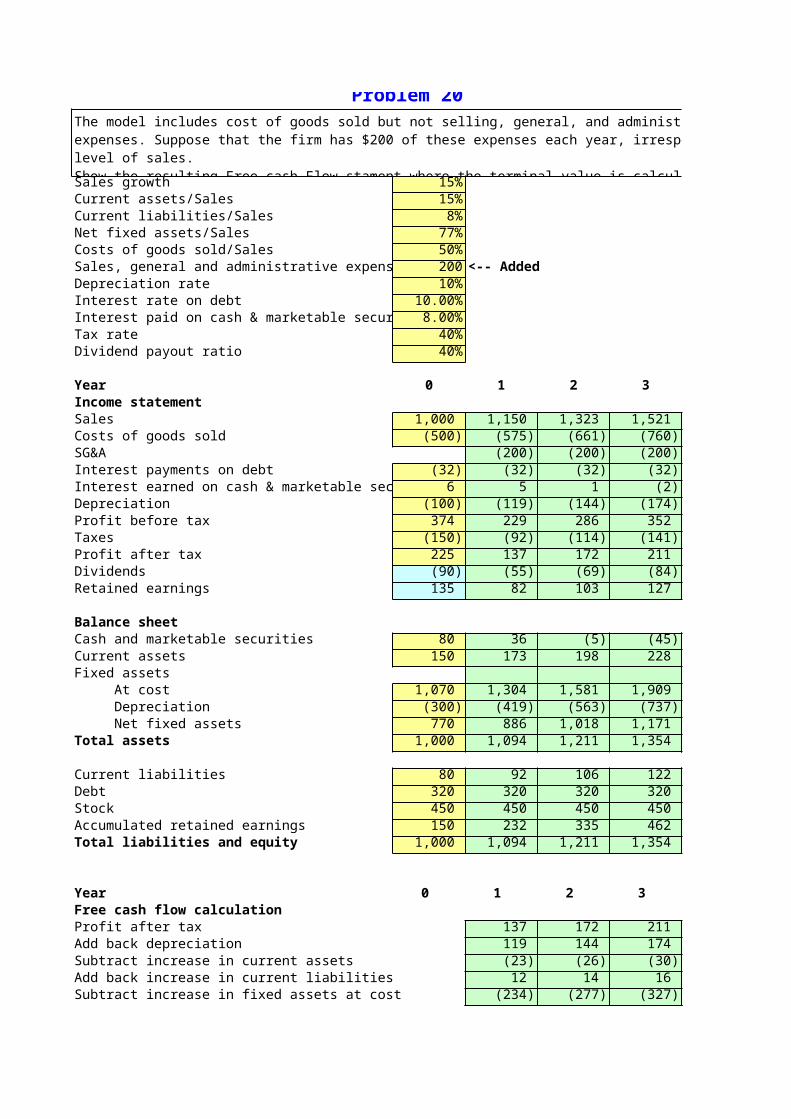
Add back after-tax interest on debt 19 19 19 19 Subtract after-tax interest on cash & mkt. securities (3) (1) 1 3 Free cash flow 28 45 65 87
Terminal value and free cash flowWeighted average cost of capital 20%
Year 0 1 2 3 4 FCF 28 45 65 87 Terminal valueTotal 28 45 65 87

5
2,011 (1,006) (200) (32) (8) (252) 513 (205) 308 (123) 185
(119) 302
2,749 (1,200) 1,549 1,732
161 320 450 801 1,732
5
308 252 (39)21
(454)
expenses. Suppose that the firm has $200 of these expenses each year, irrespective of the level of sales.Show the resulting Free cash Flow stament.where the terminal value is calculated using a Gordon dividend model on

19 5
112
5 112
2,570 <-- =G59*(1+B3)/(B56-B3)2,682
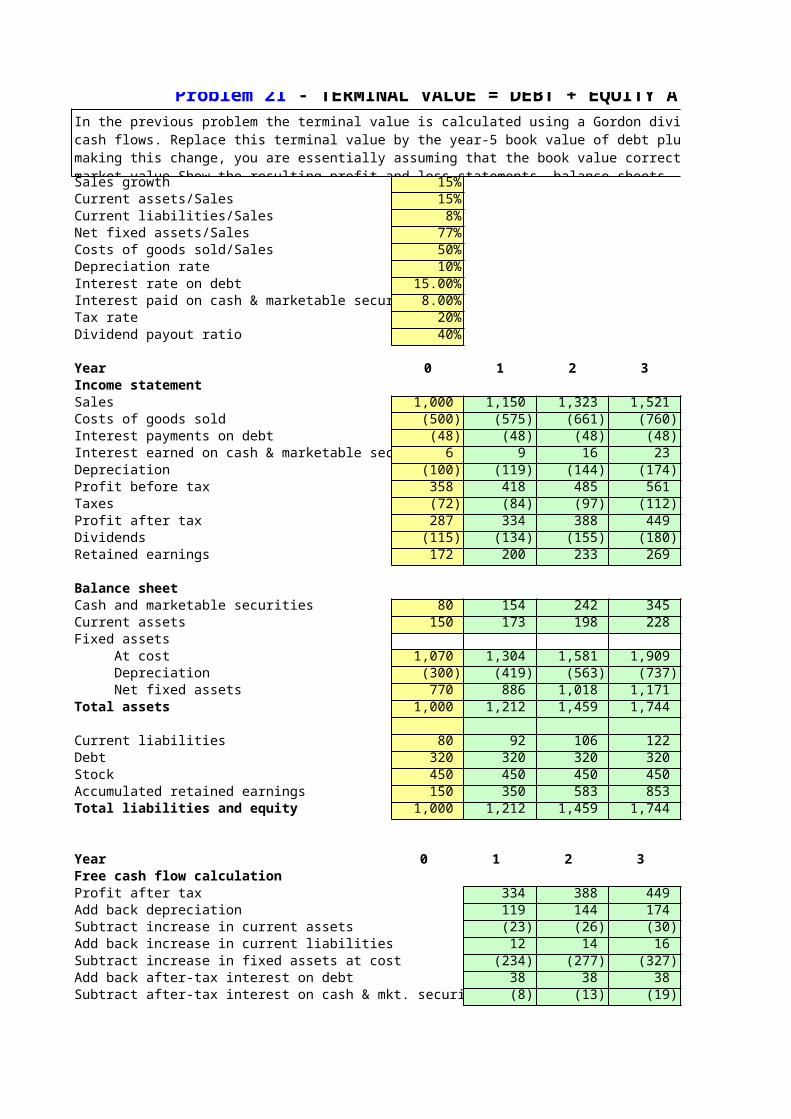
Sales growth 15%Current assets/Sales 15%Current liabilities/Sales 8%Net fixed assets/Sales 77%Costs of goods sold/Sales 50%Depreciation rate 10%Interest rate on debt 15.00%Interest paid on cash & marketable securities 8.00%Tax rate 20%Dividend payout ratio 40%
Year 0 1 2 3 4Income statementSales 1,000 1,150 1,323 1,521 1,749 Costs of goods sold (500) (575) (661) (760) (875)Interest payments on debt (48) (48) (48) (48) (48)Interest earned on cash & marketable securities 6 9 16 23 32 Depreciation (100) (119) (144) (174) (210)Profit before tax 358 418 485 561 649 Taxes (72) (84) (97) (112) (130)Profit after tax 287 334 388 449 519 Dividends (115) (134) (155) (180) (208)Retained earnings 172 200 233 269 311
Balance sheetCash and marketable securities 80 154 242 345 465 Current assets 150 173 198 228 262 Fixed assets At cost 1,070 1,304 1,581 1,909 2,294 Depreciation (300) (419) (563) (737) (948) Net fixed assets 770 886 1,018 1,171 1,347 Total assets 1,000 1,212 1,459 1,744 2,074
Current liabilities 80 92 106 122 140 Debt 320 320 320 320 320 Stock 450 450 450 450 450 Accumulated retained earnings 150 350 583 853 1,164 Total liabilities and equity 1,000 1,212 1,459 1,744 2,074
Year 0 1 2 3 4 Free cash flow calculationProfit after tax 334 388 449 519 Add back depreciation 119 144 174 210 Subtract increase in current assets (23) (26) (30) (34)Add back increase in current liabilities 12 14 16 18 Subtract increase in fixed assets at cost (234) (277) (327) (386)Add back after-tax interest on debt 38 38 38 38 Subtract after-tax interest on cash & mkt. securities (8) (13) (19) (26)
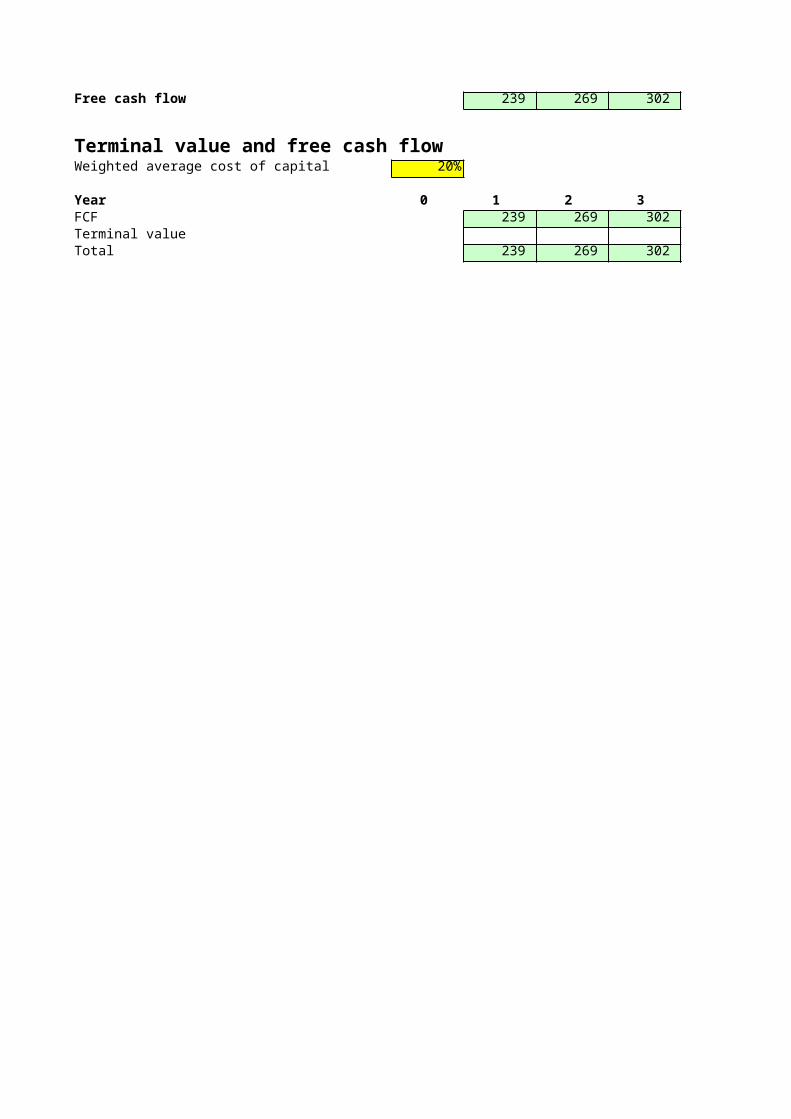
Problem 21 - TERMINAL VALUE = DEBT + EQUITY AT BOOK VALUEIn the previous problem the terminal value is calculated using a Gordon dividend model on the cash flows. Replace this terminal value by the year-5 book value of debt plus equity. In making this change, you are essentially assuming that the book value correctly predicts the market value.Show the resulting profit and loss statements, balance sheets, free cash flows, and Terminal value.
Free cash flow 239 269 302 340
Terminal value and free cash flowWeighted average cost of capital 20%
Year 0 1 2 3 4 FCF 239 269 302 340 Terminal valueTotal 239 269 302 340
5
2,011 (1,006) (48) 43 (252) 748 (150) 599 (239) 359
604 302
2,749 (1,200) 1,549 2,454
161 320 450 1,523 2,454
5
599 252 (39)21
(454)38
(34)
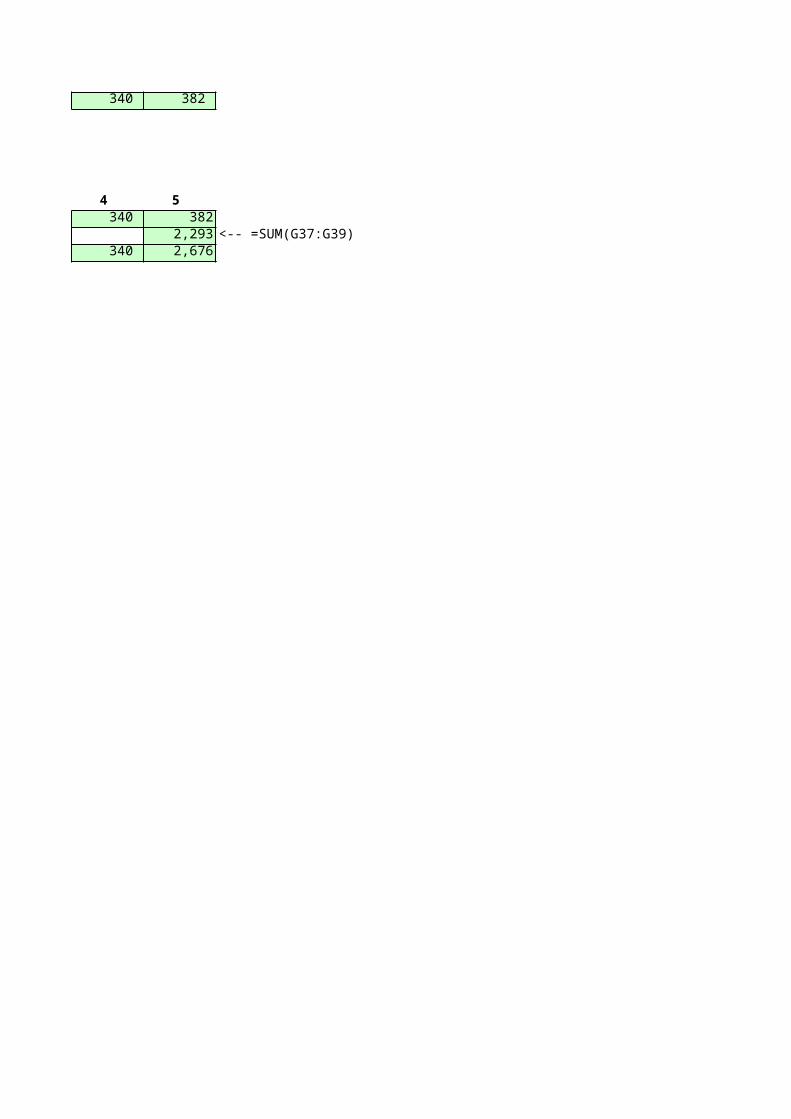
- TERMINAL VALUE = DEBT + EQUITY AT BOOK VALUEIn the previous problem the terminal value is calculated using a Gordon dividend model on the cash flows. Replace this terminal value by the year-5 book value of debt plus equity. In making this change, you are essentially assuming that the book value correctly predicts the market value.Show the resulting profit and loss statements, balance sheets,
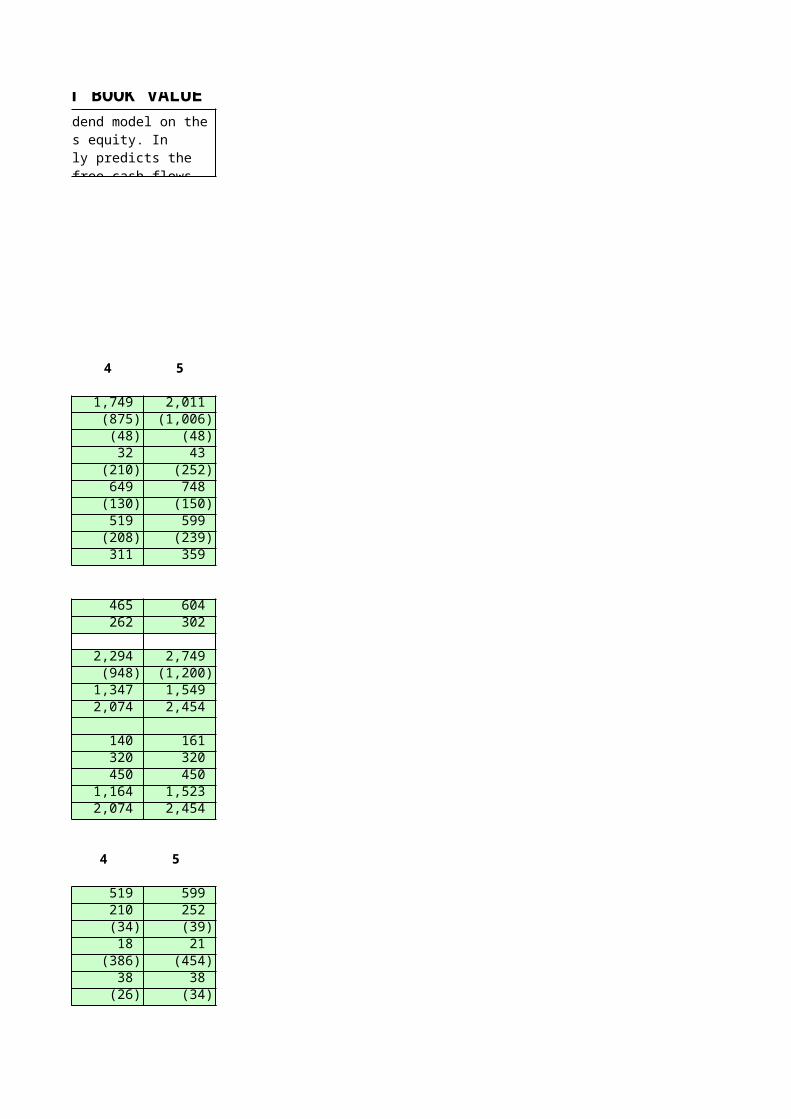
382
5 382
2,293 <-- =SUM(G37:G39)2,676
Sales growth 10%Current assets/Sales 15%Current liabilities/Sales 8%Net fixed assets/Sales 77%Costs of goods sold/Sales 50%Depreciation rate 10%Interest rate on debt 10.00%Interest paid on cash and marketable securities 8.00%Tax rate 40%Dividend payout ratio 40%
Year 0 1 2 3Income statementSales 1,000 1,100 1,210 1,331 Costs of goods sold (500) (550) (605) (666)Interest payments on debt (32) (32) (32) (32)Interest earned on cash and marketable securities 6 9 14 20 Depreciation (100) (117) (137) (161)Profit before tax 374 410 450 492 Taxes (150) (164) (180) (197)Profit after tax 225 246 270 295 Dividends (90) (98) (108) (118)Retained earnings 135 148 162 177
Balance sheetCash and marketable securities 80 144 213 289 Current assets 150 165 182 200 Fixed assets At cost 1,070 1,264 1,486 1,740 Depreciation (300) (417) (554) (715) Net fixed assets 770 847 932 1,025 Total assets 1,000 1,156 1,326 1,513
Current liabilities 80 88 97 106 Debt 320 320 320 320 Stock 450 450 450 450 Accumulated retained earnings 150 298 460 637 Total liabilities and equity 1,000 1,156 1,326 1,513
Year 0 1 2 3 Free cash flow calculationProfit after tax 246 270 295 Add back depreciation 117 137 161
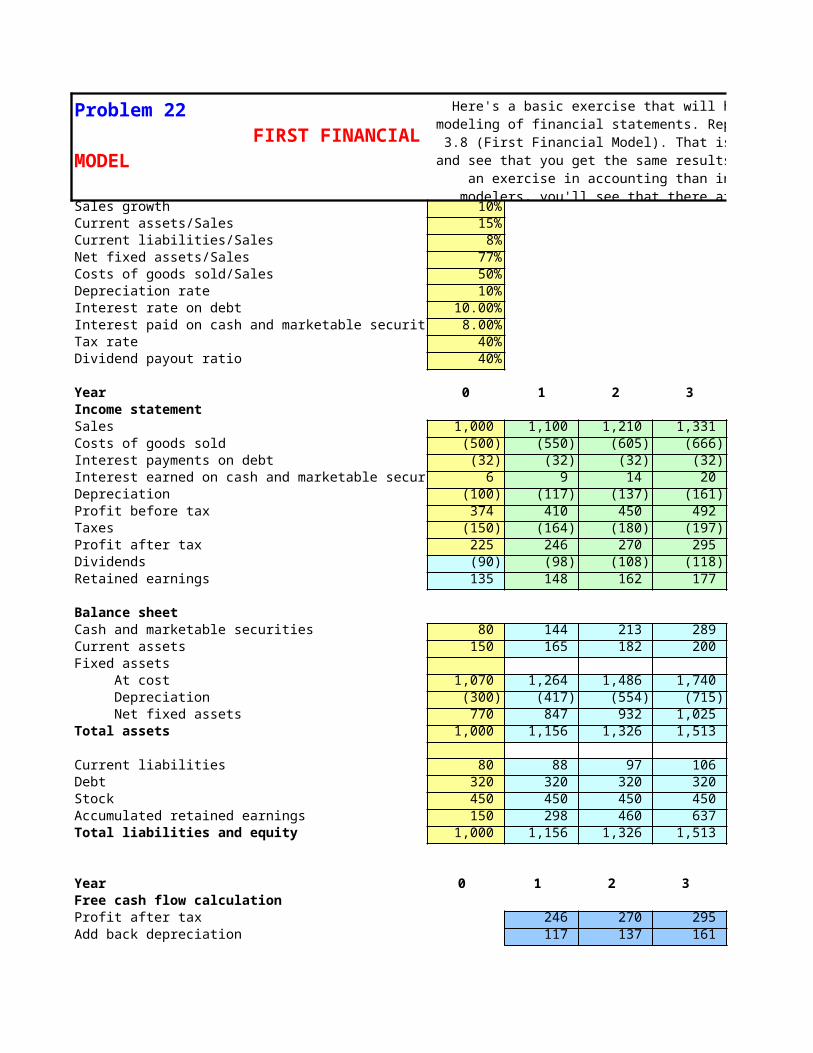
Problem 22 FIRST FINANCIAL MODEL
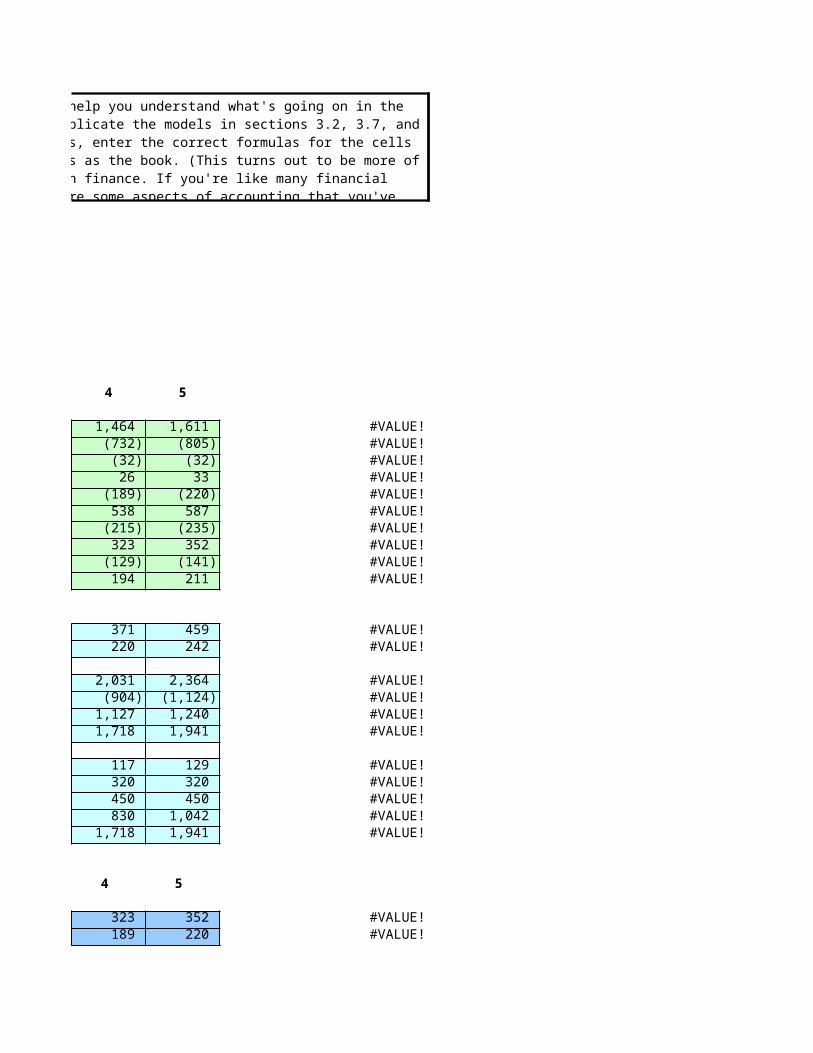
Here's a basic exercise that will help you understand what's going on in the modeling of financial statements. Replicate the models in sections 3.2, 3.7, and 3.8 (First Financial Model). That is, enter
the correct formulas for the cells and see that you get the same results as the book. (This turns out to be more of an exercise in accounting than in finance. If you're like many financial modelers, you'll see
that there are some aspects of accounting that you've forgotten!
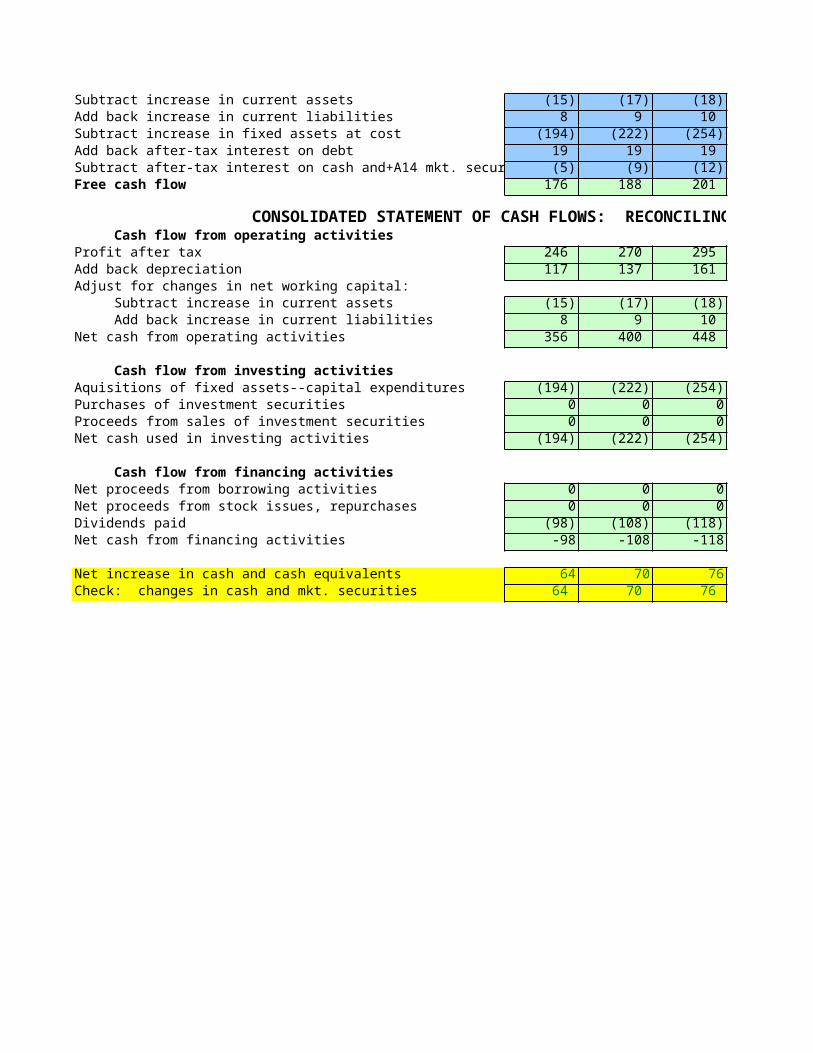
Subtract increase in current assets (15) (17) (18)Add back increase in current liabilities 8 9 10 Subtract increase in fixed assets at cost (194) (222) (254)Add back after-tax interest on debt 19 19 19 Subtract after-tax interest on cash and+A14 mkt. securities (5) (9) (12)Free cash flow 176 188 201
CONSOLIDATED STATEMENT OF CASH FLOWS: RECONCILING THE CASH BALANCES Cash flow from operating activitiesProfit after tax 246 270 295 Add back depreciation 117 137 161 Adjust for changes in net working capital: Subtract increase in current assets (15) (17) (18) Add back increase in current liabilities 8 9 10 Net cash from operating activities 356 400 448
Cash flow from investing activitiesAquisitions of fixed assets--capital expenditures (194) (222) (254)Purchases of investment securities 0 0 0Proceeds from sales of investment securities 0 0 0Net cash used in investing activities (194) (222) (254)
Cash flow from financing activitiesNet proceeds from borrowing activities 0 0 0Net proceeds from stock issues, repurchases 0 0 0Dividends paid (98) (108) (118)Net cash from financing activities -98 -108 -118
Net increase in cash and cash equivalents 64 70 76Check: changes in cash and mkt. securities 64 70 76
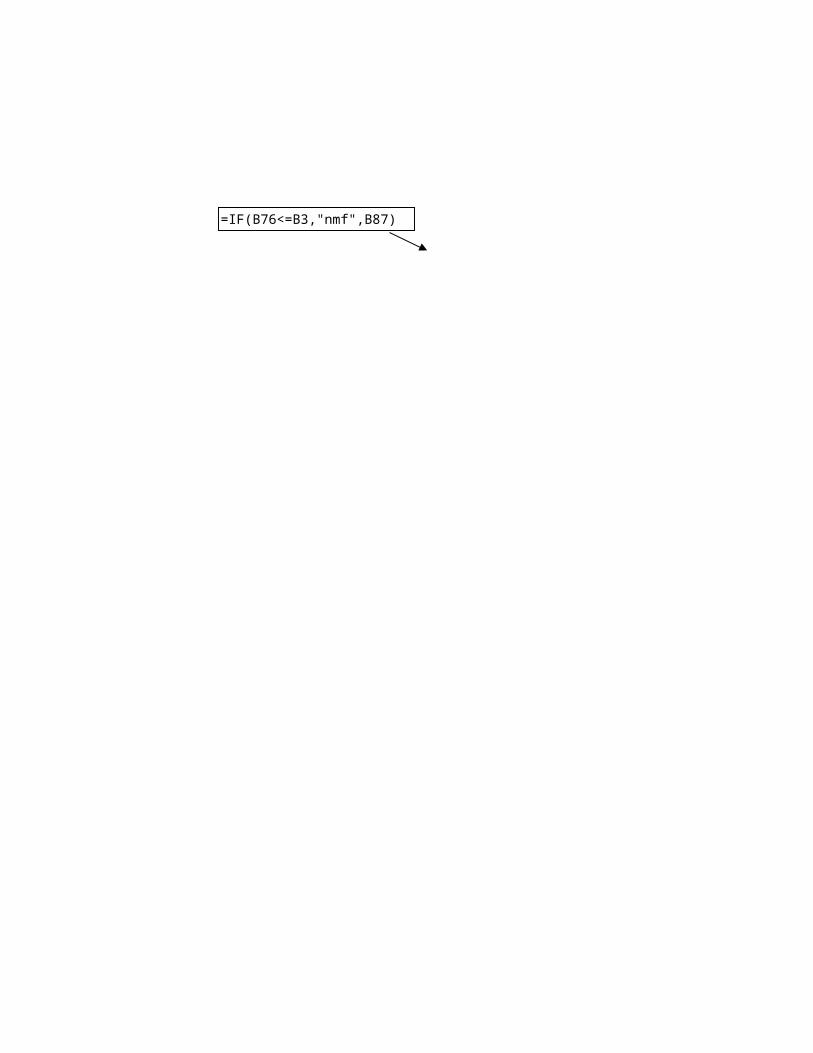
=IF(B76<=B3,"nmf",B87)
4 5
1,464 1,611 #VALUE! (732) (805) #VALUE! (32) (32) #VALUE! 26 33 #VALUE! (189) (220) #VALUE! 538 587 #VALUE! (215) (235) #VALUE! 323 352 #VALUE! (129) (141) #VALUE! 194 211 #VALUE!
371 459 #VALUE! 220 242 #VALUE!
2,031 2,364 #VALUE! (904) (1,124) #VALUE! 1,127 1,240 #VALUE! 1,718 1,941 #VALUE!
117 129 #VALUE! 320 320 #VALUE! 450 450 #VALUE! 830 1,042 #VALUE! 1,718 1,941 #VALUE!
4 5
323 352 #VALUE!189 220 #VALUE!
Here's a basic exercise that will help you understand what's going on in the modeling of financial statements. Replicate the models in sections 3.2, 3.7, and 3.8 (First Financial Model). That is, enter
the correct formulas for the cells and see that you get the same results as the book. (This turns out to be more of an exercise in accounting than in finance. If you're like many financial modelers, you'll see
that there are some aspects of accounting that you've forgotten!
(20) (22) #VALUE!11 12 #VALUE!
(291) (333) #VALUE!19 19 #VALUE!
(16) (20) #VALUE!214 228 #VALUE!
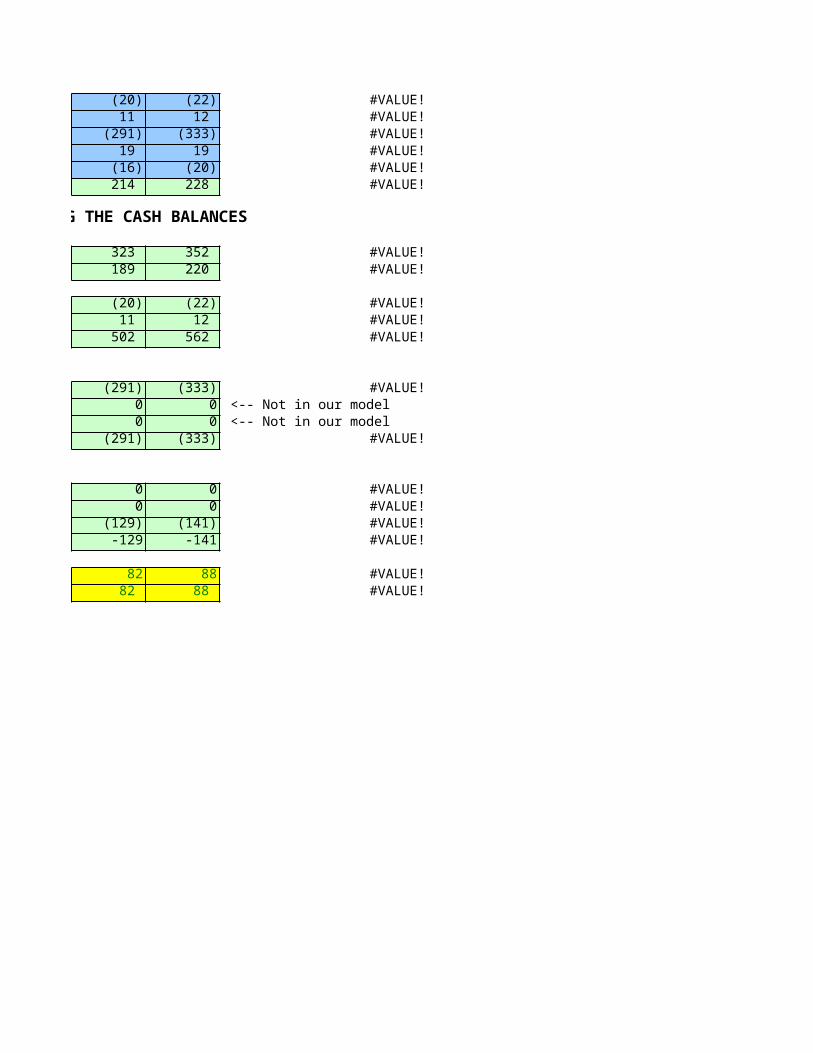
CONSOLIDATED STATEMENT OF CASH FLOWS: RECONCILING THE CASH BALANCES
323 352 #VALUE! 189 220 #VALUE!
(20) (22) #VALUE! 11 12 #VALUE! 502 562 #VALUE!
(291) (333) #VALUE!0 0 <-- Not in our model 0 0 <-- Not in our model
(291) (333) #VALUE!
0 0 #VALUE!0 0 #VALUE!
(129) (141) #VALUE!-129 -141 #VALUE!
82 88 #VALUE! 82 88 #VALUE!
Sales growth 10%Current assets/Sales 15%Current liabilities/Sales 8%Costs of goods sold/Sales 50%Depreciation rate 10%Interest rate on debt 10.00%Interest paid on cash & marketable securities 8.00%Tax rate 40%Dividend payout ratio 40%
Year 0 1 2 3Income statementSales 1,000 1,100 1,210 1,331 Costs of goods sold (500) (550) (605) (666)Interest payments on debt (32) (32) (32) (32)Interest earned on cash & marketable securities 6 15 31 47 Depreciation (100) (109) (115) (126)Profit before tax 374 425 489 554 Taxes (150) (170) (196) (222)Profit after tax 224 255 293 332 Dividends (90) (102) (117) (133)Retained earnings 135 153 176 199
Balance sheetCash and marketable securities 80 304 479 688 Current assets 150 165 182 200 Fixed assets At cost 1,070 1,100 1,209 1,318 Depreciation (300) (409) (524) (650) Net fixed assets 770 692 685 668 Total assets 1,000 1,161 1,346 1,555
Current liabilities 80 88 97 106 Debt 320 320 320 320 Stock 450 450 450 450 Accumulated retained earnings 150 303 479 678 Total liabilities and equity 1,000 1,161 1,346 1,555
Year 0 1 2 3 Free cash flow calculationProfit after tax 255 293 332 Add back depreciation 109 115 126 Subtract increase in current assets (15) (17) (18)Add back increase in current liabilities 8 9 10 Subtract increase in fixed assets at cost (30) (109) (109)Add back after-tax interest on debt 19 19 19
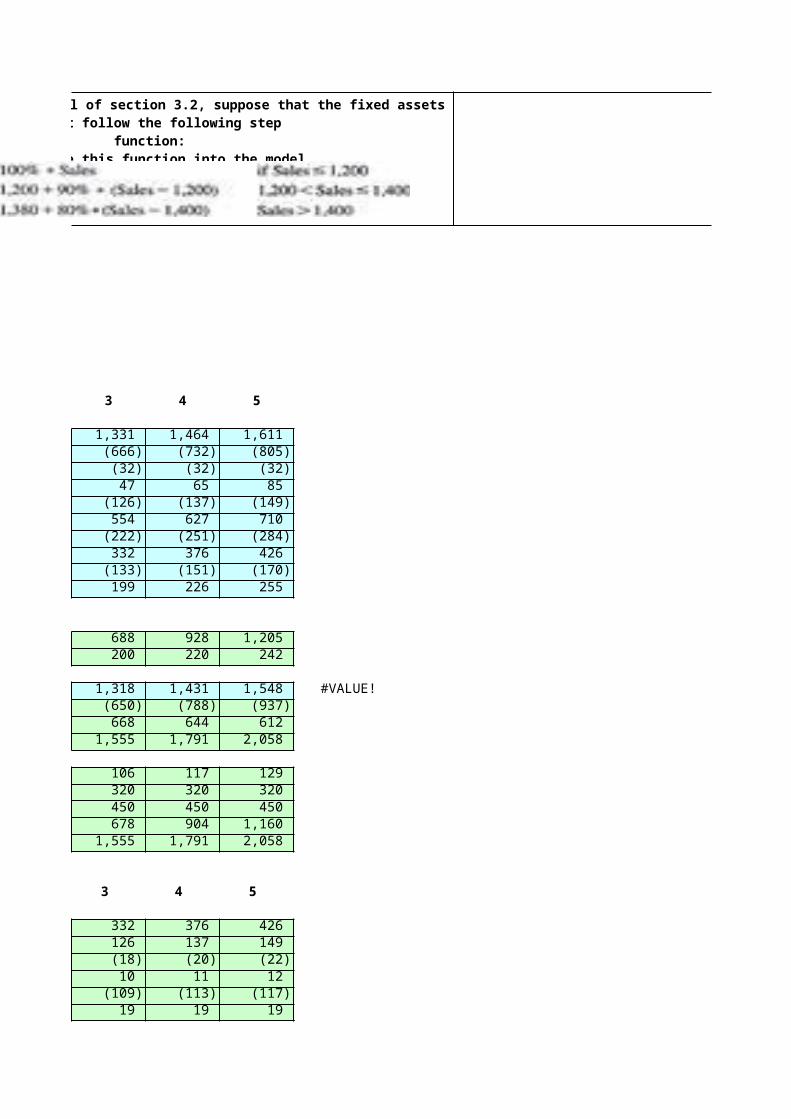
Problem 23 ASSETS AT COST GIVEN BY A STEP FUNCTION
Referring again to the model of section 3.2, suppose that the fixed assets at cost follow the following step
function:Incorporate this function into the model.
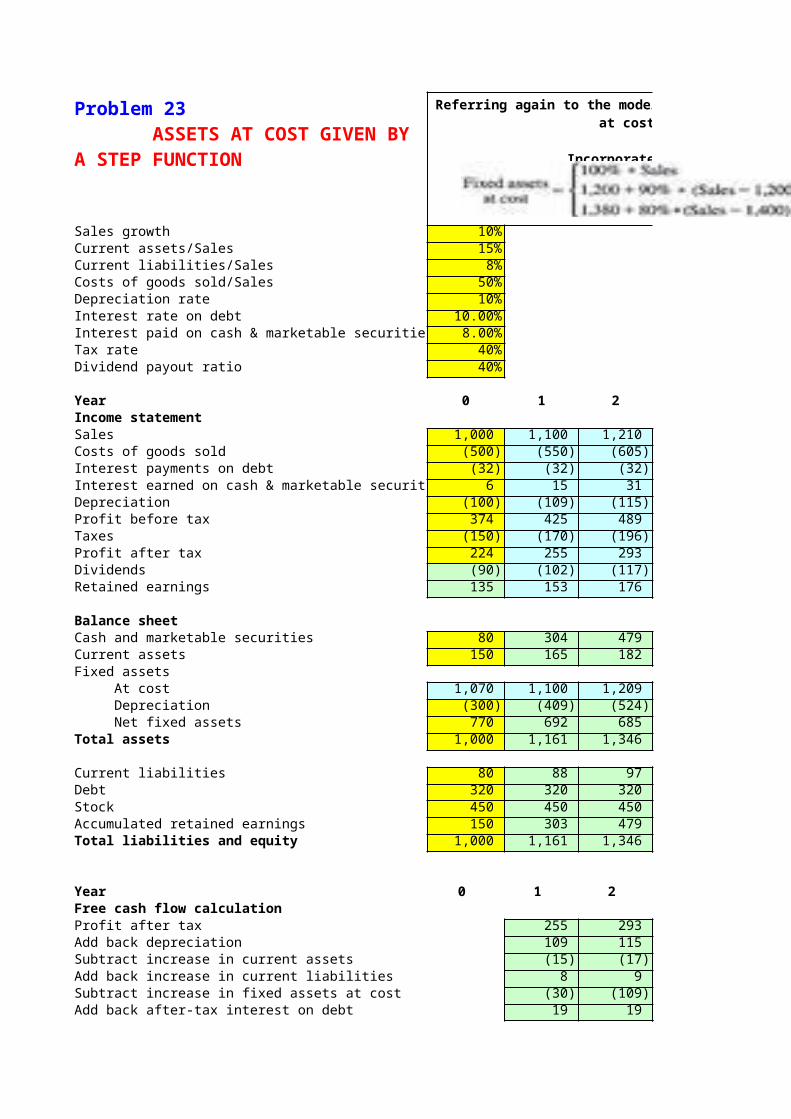
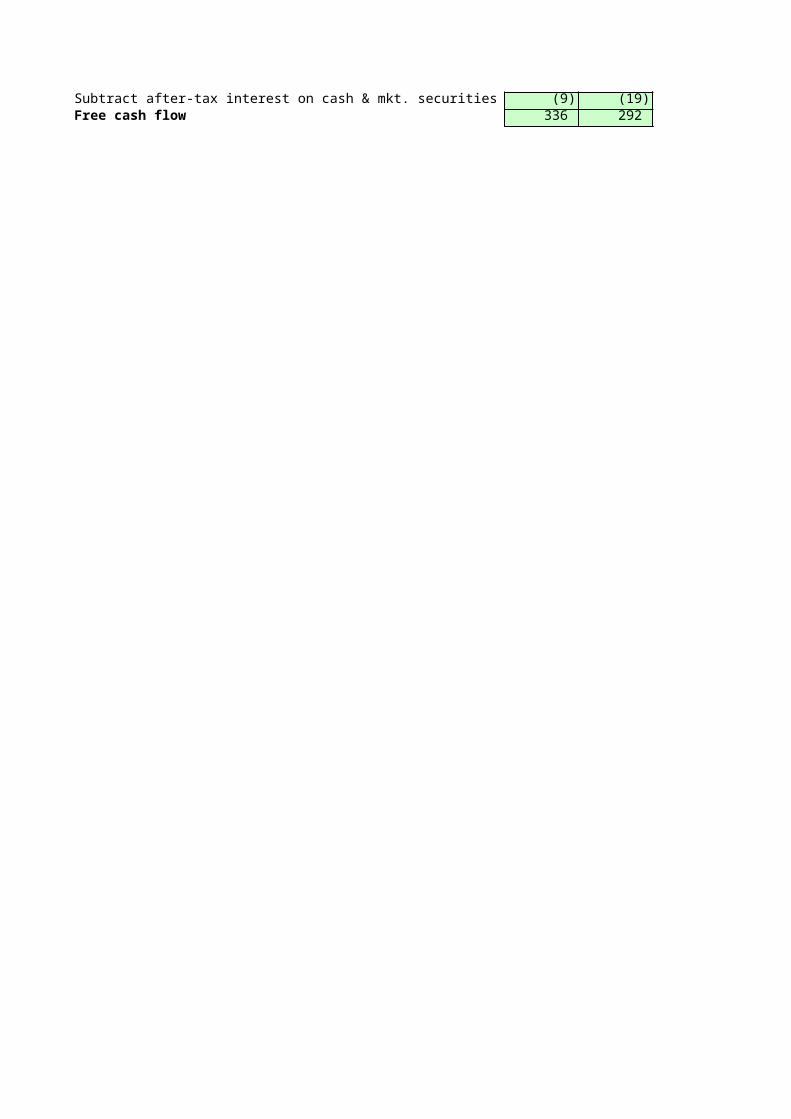
Subtract after-tax interest on cash & mkt. securities (9) (19) (28)Free cash flow 336 292 332
4 5
1,464 1,611 (732) (805) (32) (32) 65 85 (137) (149) 627 710 (251) (284) 376 426 (151) (170) 226 255
928 1,205 220 242
1,431 1,548 #VALUE! (788) (937) 644 612 1,791 2,058
117 129 320 320 450 450 904 1,160 1,791 2,058
4 5
376 426 137 149 (20) (22)11 12
(113) (117)19 19
Referring again to the model of section 3.2, suppose that the fixed assets at cost follow the following step
function:Incorporate this function into the model.
(39) (51)372 415
Related Documents