44237-000 1 1 44237-000 FLORIDA ONSITE SEWAGE NITROGEN REDUCTION STRATEGIES (FOSNRS) STUDY Presentation to the FDOH Research Review and Advisory Committee (RRAC) July 28, 2015 by Damann L. Anderson, P.E. Josefin E. Hirst, P.E. OTIS ENVIRONMENTAL CONSULTANTS

Welcome message from author
This document is posted to help you gain knowledge. Please leave a comment to let me know what you think about it! Share it to your friends and learn new things together.
Transcript
4423
7-00
0
1 1 4423
7-00
0
FLORIDA ONSITE SEWAGE NITROGEN REDUCTION
STRATEGIES (FOSNRS) STUDY
Presentation to the FDOH Research Review and Advisory Committee (RRAC)
July 28, 2015
by Damann L. Anderson, P.E.
Josefin E. Hirst, P.E.
OTIS
ENVIRONMENTAL CONSULTANTS

4423
7-00
0
2
PROJECT TEAM ACKNOWLEDGEMENTS
OTIS
ENVIRONMENTAL CONSULTANTS
And many support firms and staff! Special acknowledgements to the volunteer homeowners!
4423
7-00
0
3
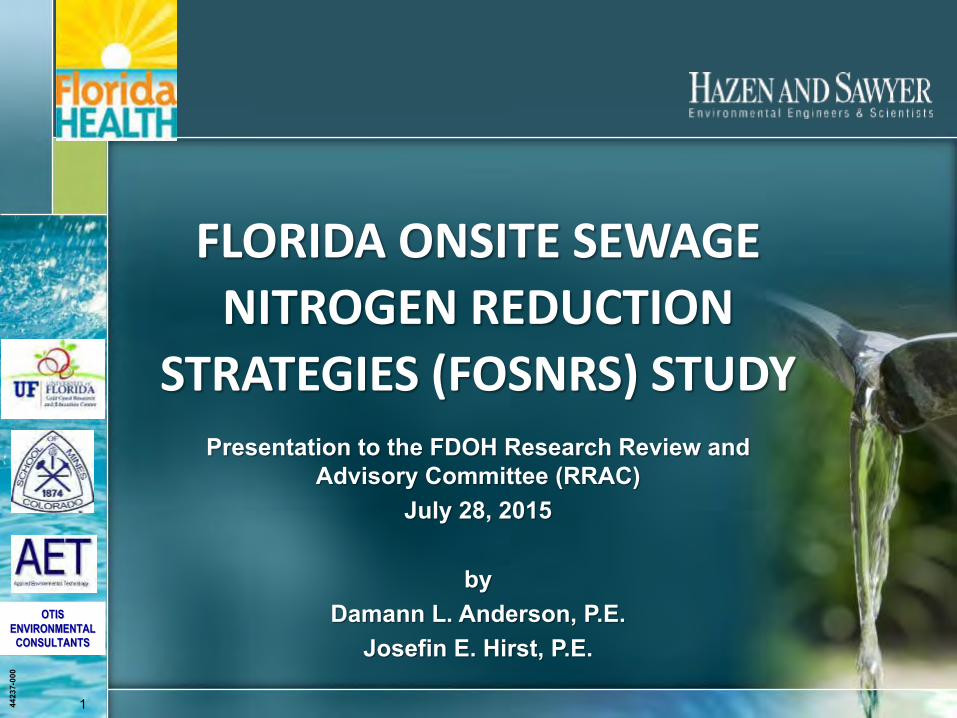
Presentation Outline
■ Excess Nitrogen impacts water quality! ■ Florida onsite sewage nitrogen reduction strategies
(FOSNRS) project background ■ Task A: Technology Review and Pilot Testing ■ Task B: Full Scale Prototype PNRS Testing
● Proprietary system (System 1) ● In-tank PNRS (System 2) ● In-ground PNRS (System 3)
■ Task C: Soil and Groundwater Monitoring ■ Task D: Nitrogen Fate & Transport Modeling and
Tool Development ■ Summary & Questions

4423
7-00
0
4 4 4423
7-00
0
Why are we here? Excess Nitrogen impacts water quality!
4423
7-00
0
5
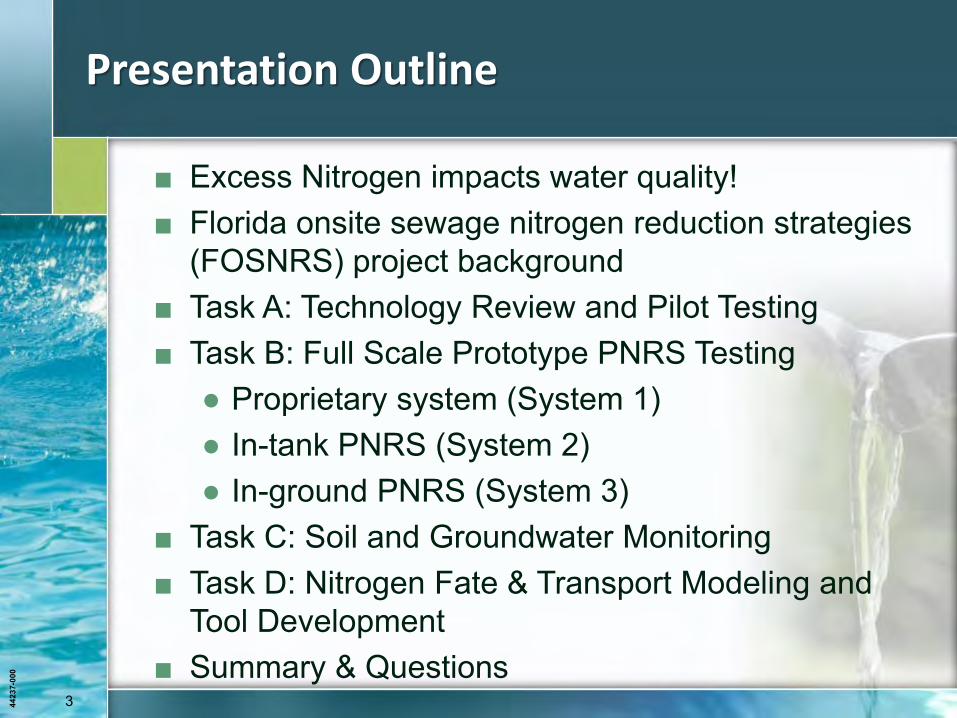
Adverse effects of nitrogen
■ Public Health: SDWA Limit of 10 mg/L NO3 – N,
Harmful Algal Blooms (HABs) ■ Ecosystem Health/ Water Qualty: N is limiting
nutrient in many water bodies ● Algal blooms, loss of habitat, hypoxia
■ Impacts of excess nitrogen on water quality have been documented in many areas: ● Tampa Bay, Sarasota Bay, Indian River Lagoon ● Florida Keys ● Florida’s Freshwater Springs and elsewhere
4423
7-00
0
6
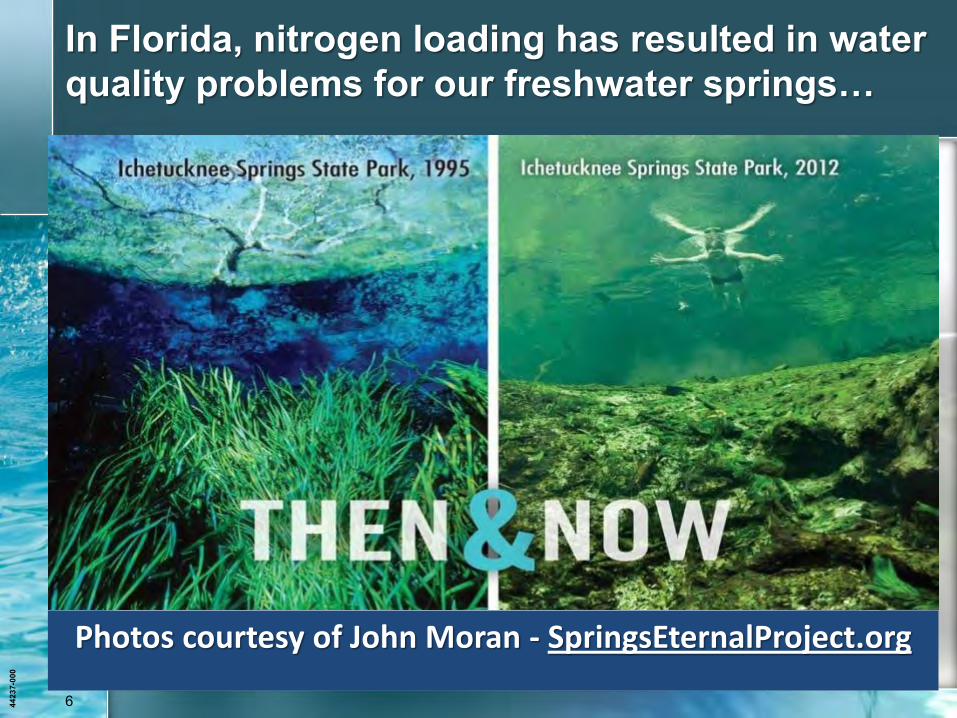
In Florida, nitrogen loading has resulted in water quality problems for our freshwater springs…
Photos courtesy of John Moran - SpringsEternalProject.org
4423
7-00
0
7
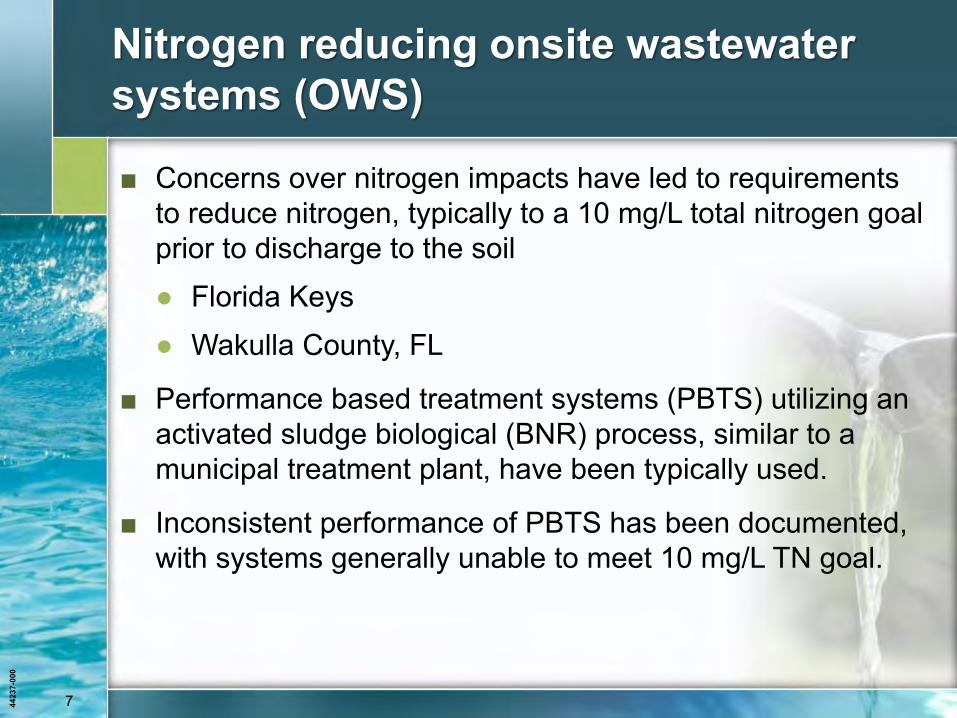
Nitrogen reducing onsite wastewater systems (OWS)
■ Concerns over nitrogen impacts have led to requirements to reduce nitrogen, typically to a 10 mg/L total nitrogen goal prior to discharge to the soil ● Florida Keys ● Wakulla County, FL
■ Performance based treatment systems (PBTS) utilizing an activated sludge biological (BNR) process, similar to a municipal treatment plant, have been typically used.
■ Inconsistent performance of PBTS has been documented, with systems generally unable to meet 10 mg/L TN goal.
4423
7-00
0
8 8 4423
7-00
0
Florida Onsite Sewage Nitrogen Reduction
Strategies (FOSNRS) project background
4423
7-00
0
9
FOSNRS project initiated by Florida legislature
■ Florida Legislature directed FDOH to conduct a study to further develop more “passive” & cost-effective nitrogen reduction strategies for onsite sewage treatment and disposal systems (OSTDS)
■ “Passive” nitrogen reducing OSTDS should be more similar to conventional onsite systems in their operation and maintenance
■ Initiated the Florida Onsite Sewage Nitrogen Reduction Strategies (FOSNRS) Project in 2009
■ RFP identified four primary study areas
4423
7-00
0
10
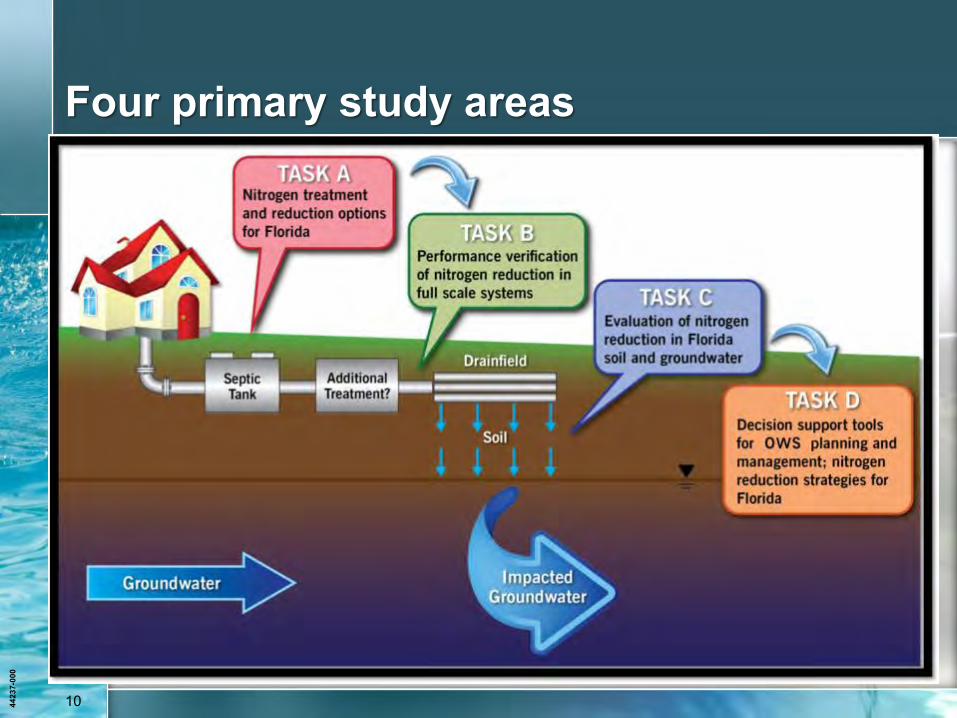
Four primary study areas

4423
7-00
0
11 11 4423
7-00
0
Task A: Technology Review
and Pilot Testing

4423
7-00
0
12
Task A Components
■ Literature review to evaluate nitrogen reducing technologies
■ Ranking and prioritization of nitrogen reducing technologies for field testing
■ Technology ranking workshop with RRAC conducted on May 28, 2009
■ Pilot testing of passive nitrogen reduction systems (PNRS)
■ Materials testing for FDOH additives rule
4423
7-00
0
13
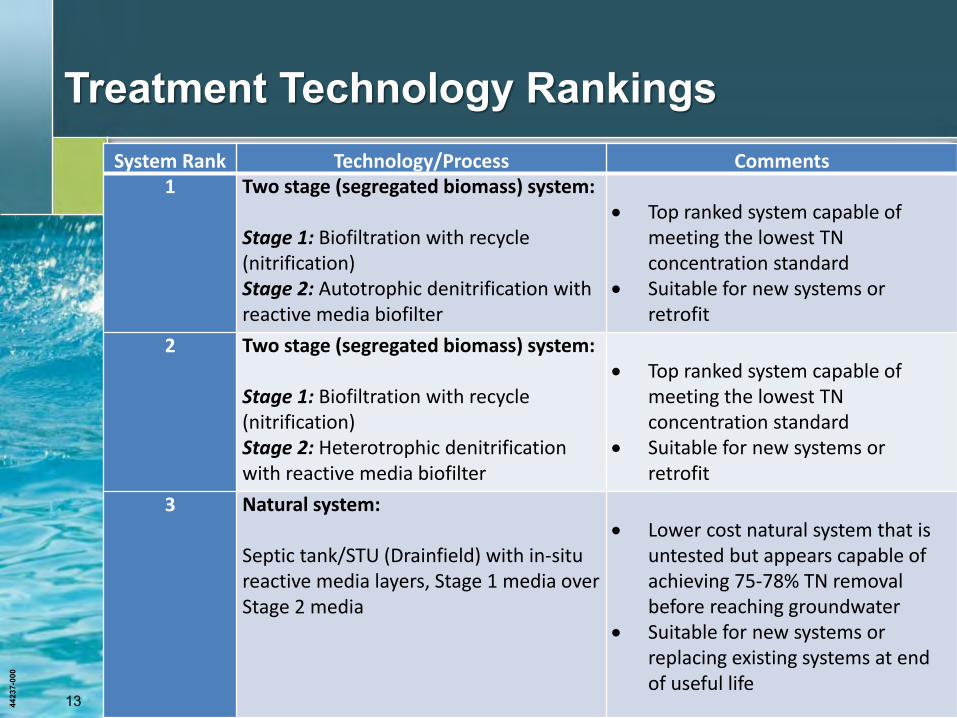
Treatment Technology Rankings System Rank Technology/Process Comments
1 Two stage (segregated biomass) system: Stage 1: Biofiltration with recycle (nitrification) Stage 2: Autotrophic denitrification with reactive media biofilter
Top ranked system capable of
meeting the lowest TN concentration standard
Suitable for new systems or retrofit
2 Two stage (segregated biomass) system: Stage 1: Biofiltration with recycle (nitrification) Stage 2: Heterotrophic denitrification with reactive media biofilter
Top ranked system capable of
meeting the lowest TN concentration standard
Suitable for new systems or retrofit
3 Natural system: Septic tank/STU (Drainfield) with in-situ reactive media layers, Stage 1 media over Stage 2 media
Lower cost natural system that is
untested but appears capable of achieving 75-78% TN removal before reaching groundwater
Suitable for new systems or replacing existing systems at end of useful life
4423
7-00
0
14
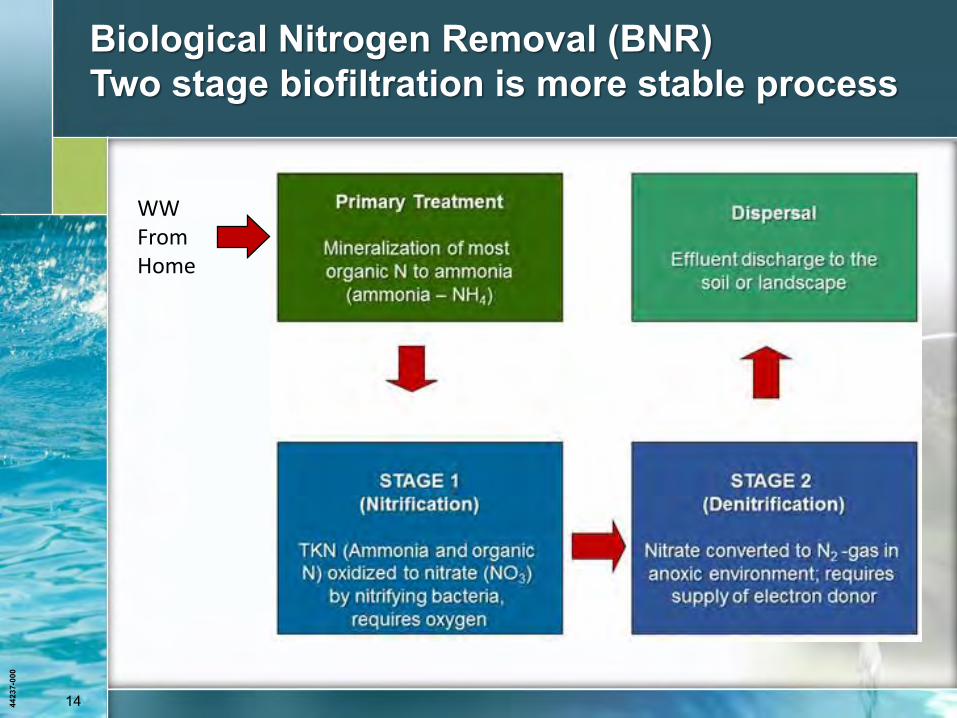
Biological Nitrogen Removal (BNR) Two stage biofiltration is more stable process
WW From Home
4423
7-00
0
15
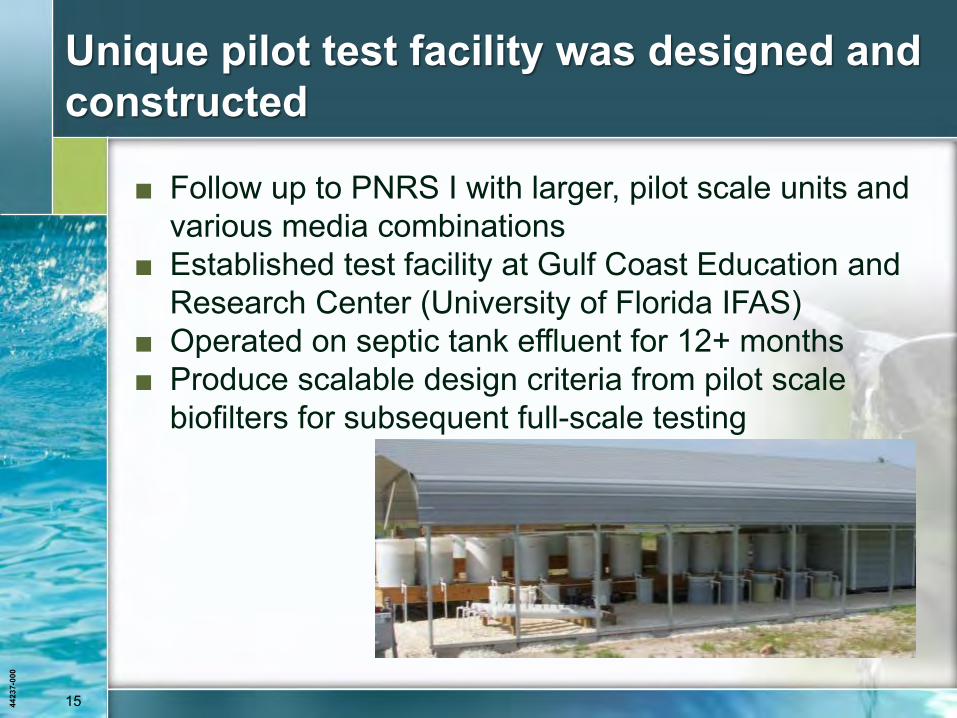
Unique pilot test facility was designed and constructed
■ Follow up to PNRS I with larger, pilot scale units and various media combinations
■ Established test facility at Gulf Coast Education and Research Center (University of Florida IFAS)
■ Operated on septic tank effluent for 12+ months ■ Produce scalable design criteria from pilot scale
biofilters for subsequent full-scale testing
4423
7-00
0
16
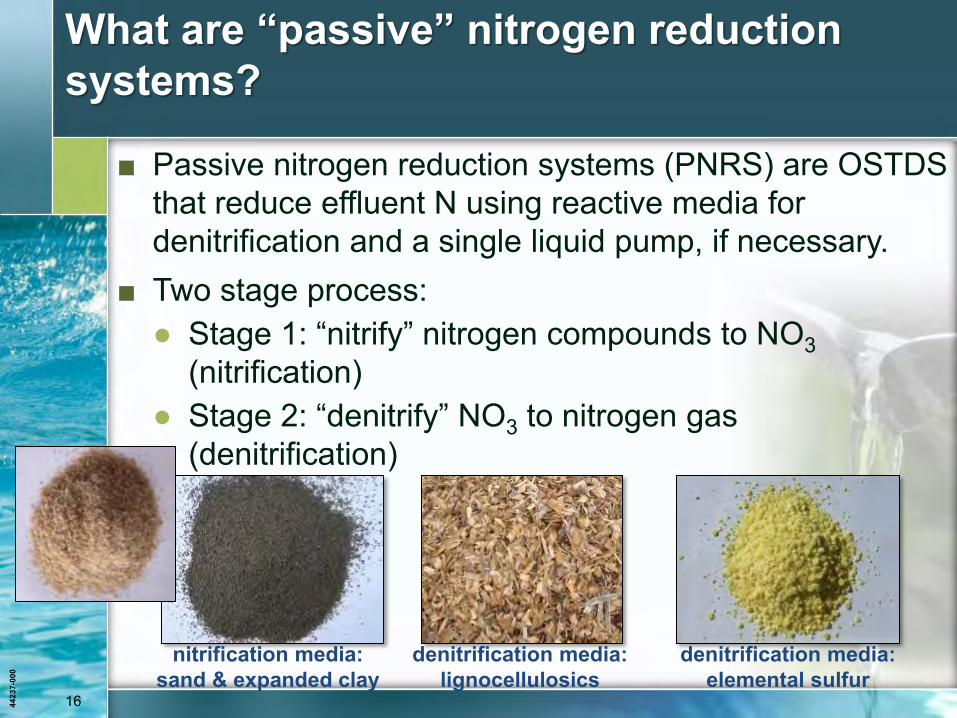
What are “passive” nitrogen reduction systems?
■ Passive nitrogen reduction systems (PNRS) are OSTDS that reduce effluent N using reactive media for denitrification and a single liquid pump, if necessary.
■ Two stage process: ● Stage 1: “nitrify” nitrogen compounds to NO3
(nitrification) ● Stage 2: “denitrify” NO3 to nitrogen gas
(denitrification)
nitrification media: sand & expanded clay
denitrification media: elemental sulfur
denitrification media: lignocellulosics
4423
7-00
0
17
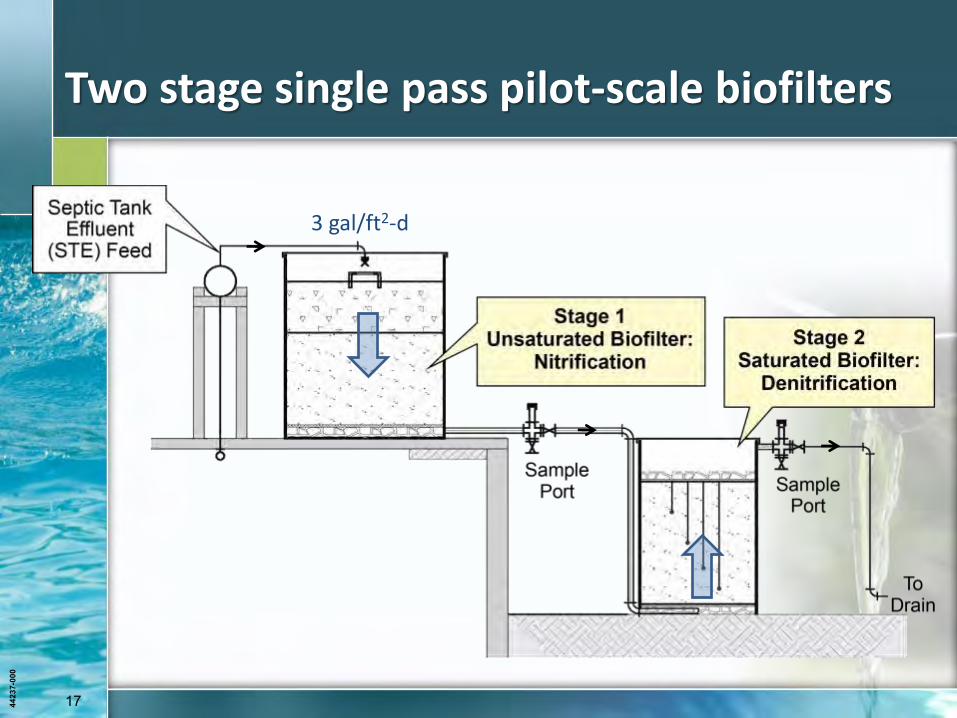
Two stage single pass pilot-scale biofilters
3 gal/ft2-d
4423
7-00
0
18
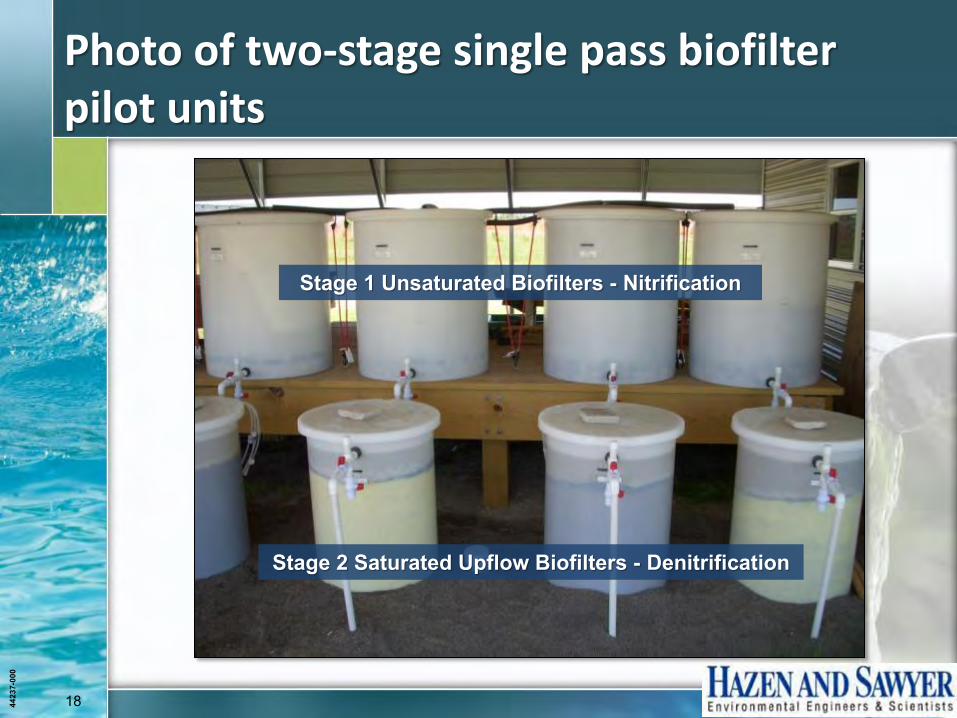
Photo of two-stage single pass biofilter pilot units
Stage 1 Unsaturated Biofilters - Nitrification
Stage 2 Saturated Upflow Biofilters - Denitrification
4423
7-00
0
19
0%
10%
20%
30%
40%
50%
60%
70%
80%
90%
100%
0 50 100 150 200 250 300 350 400
TN R
ed
uct
ion
Eff
icie
ncy
, %
Experimental Day
Single Pass System
Recirculating System
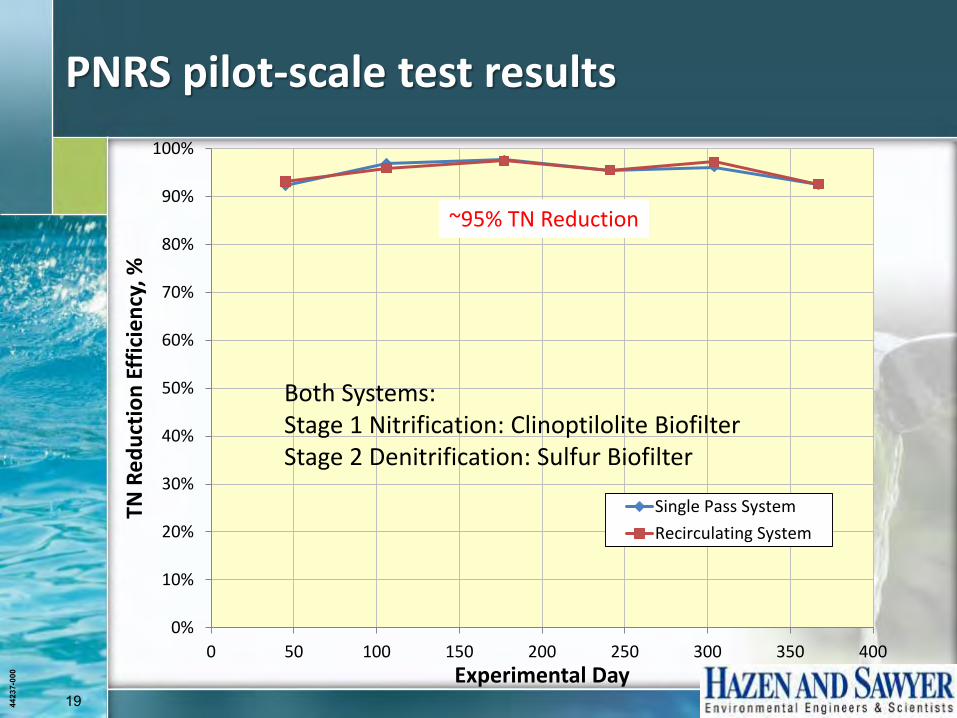
PNRS pilot-scale test results
Both Systems: Stage 1 Nitrification: Clinoptilolite Biofilter Stage 2 Denitrification: Sulfur Biofilter
~95% TN Reduction
4423
7-00
0
20
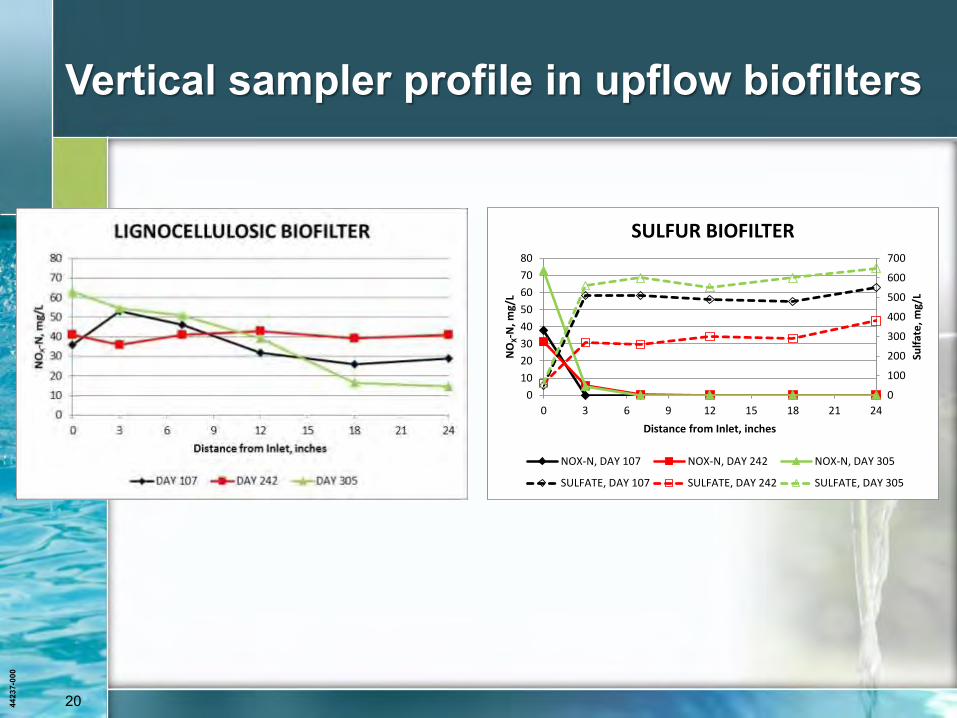
Vertical sampler profile in upflow biofilters
0
100
200
300
400
500
600
700
0
10
20
30
40
50
60
70
80
0 3 6 9 12 15 18 21 24
Sulf
ate
, mg/
L
NO
X-N
, mg/
L
Distance from Inlet, inches
SULFUR BIOFILTER
NOX-N, DAY 107 NOX-N, DAY 242 NOX-N, DAY 305
SULFATE, DAY 107 SULFATE, DAY 242 SULFATE, DAY 305
4423
7-00
0
21
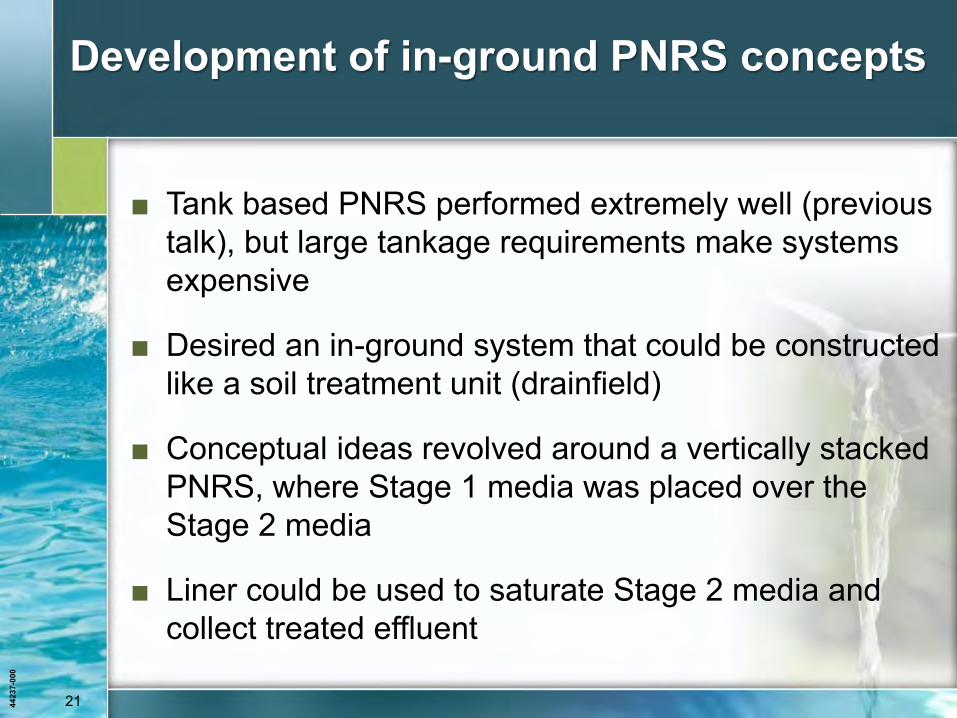
Development of in-ground PNRS concepts
■ Tank based PNRS performed extremely well (previous talk), but large tankage requirements make systems expensive
■ Desired an in-ground system that could be constructed like a soil treatment unit (drainfield)
■ Conceptual ideas revolved around a vertically stacked PNRS, where Stage 1 media was placed over the Stage 2 media
■ Liner could be used to saturate Stage 2 media and collect treated effluent
4423
7-00
0
22
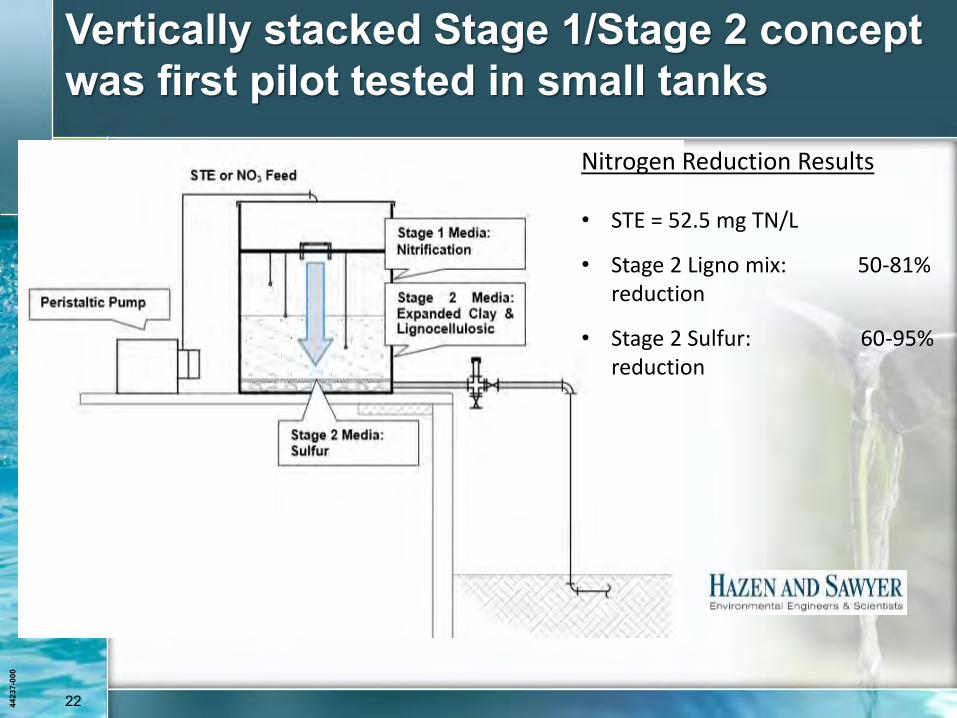
Vertically stacked Stage 1/Stage 2 concept was first pilot tested in small tanks
Nitrogen Reduction Results
• STE = 52.5 mg TN/L
• Stage 2 Ligno mix: 50-81% reduction
• Stage 2 Sulfur: 60-95% reduction
4423
7-00
0
23
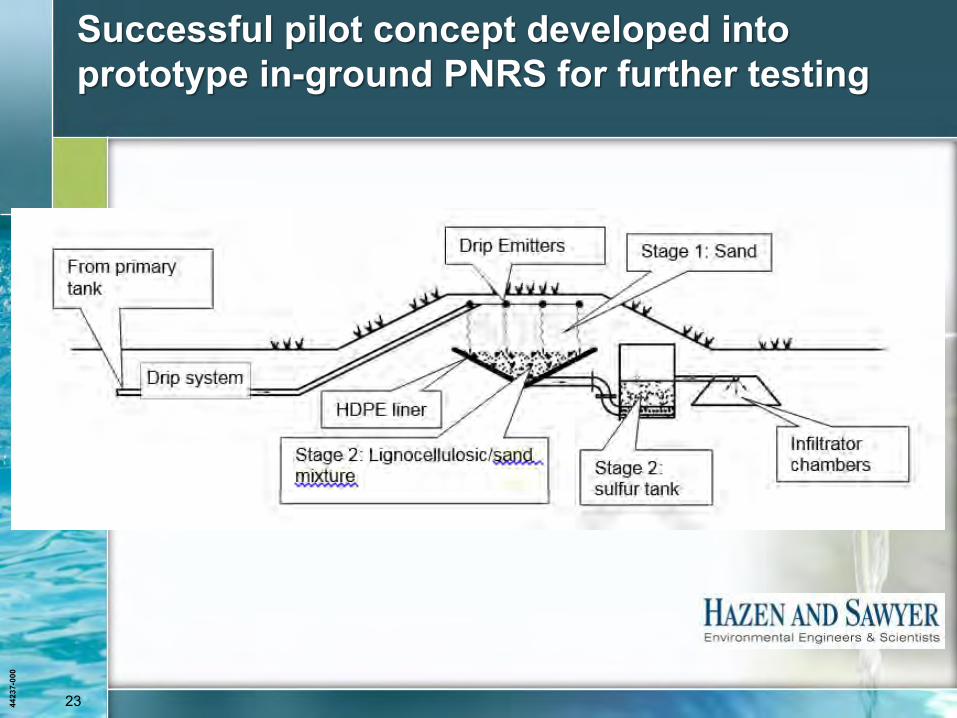
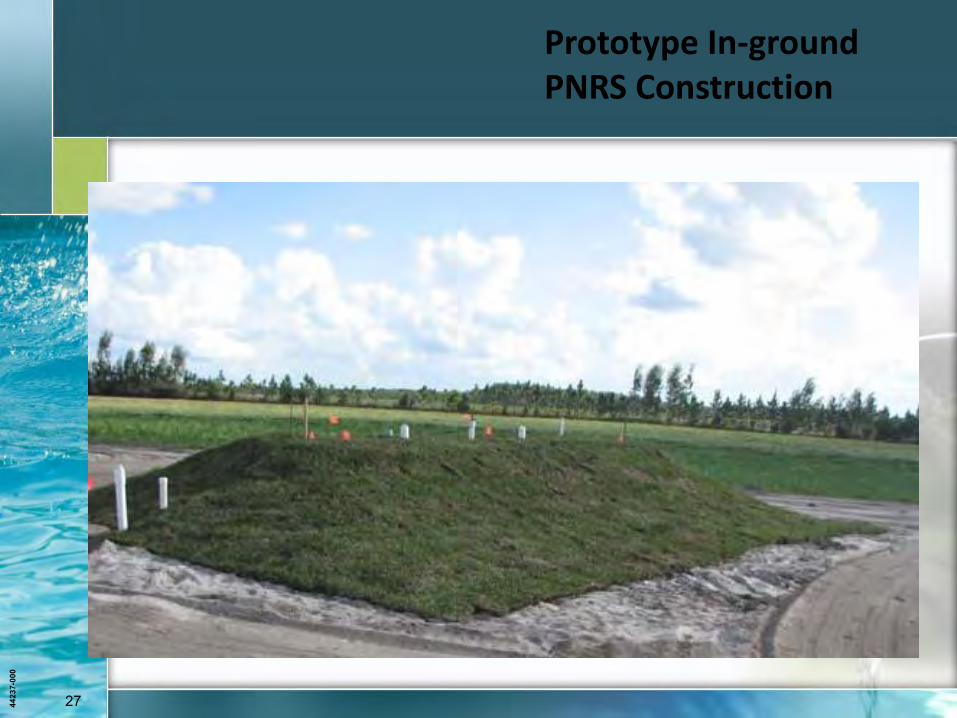
Successful pilot concept developed into prototype in-ground PNRS for further testing
4423
7-00
0
24
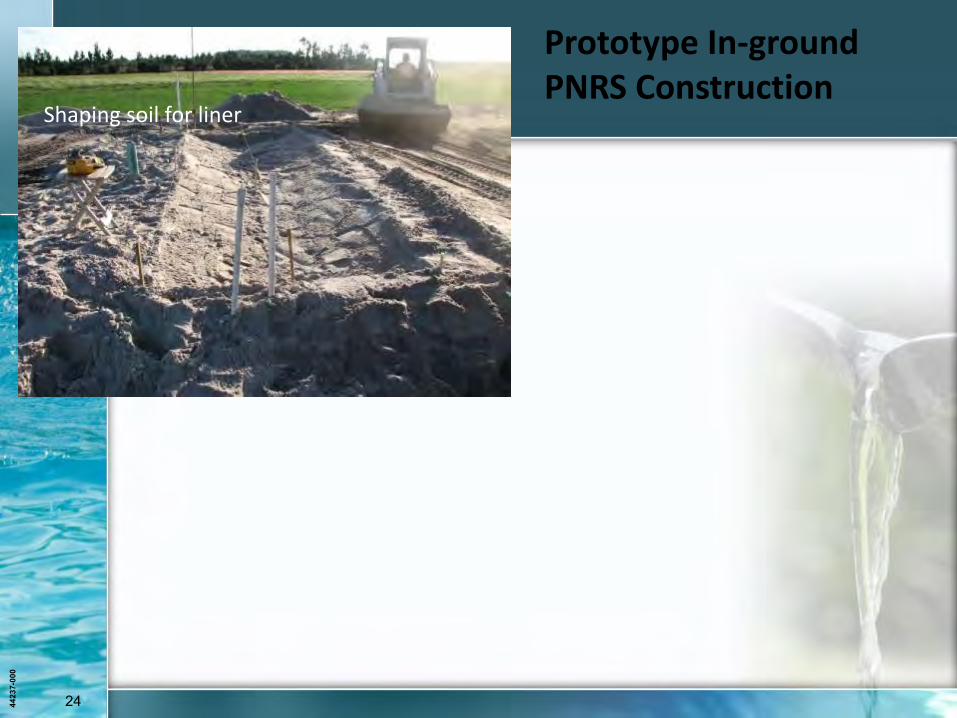
Prototype In-ground PNRS Construction
Shaping soil for liner
4423
7-00
0
25
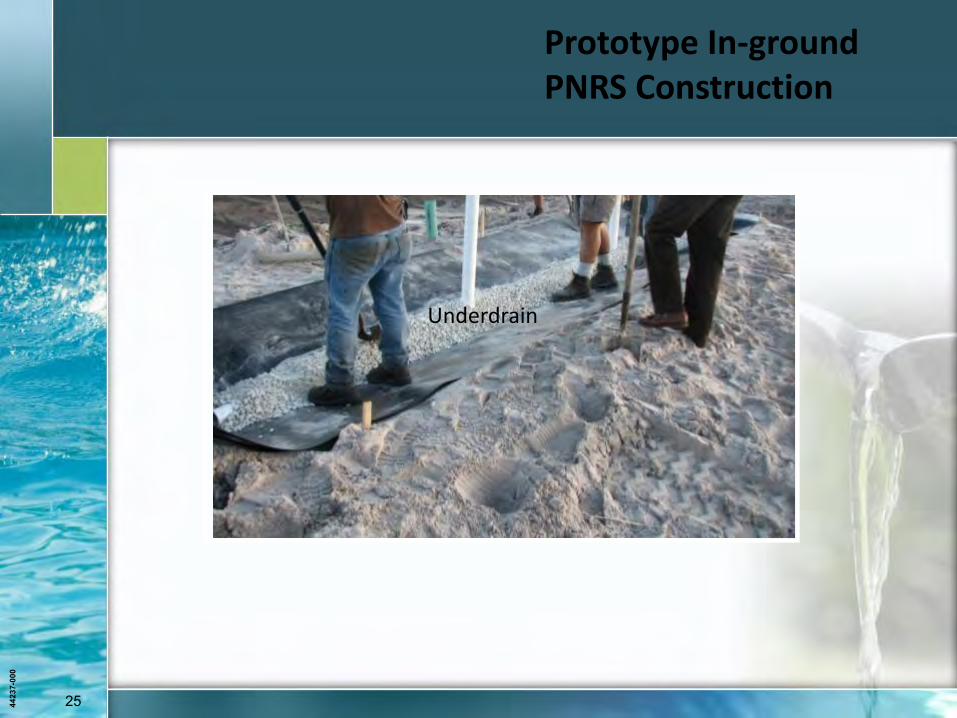
Prototype In-ground PNRS Construction
Underdrain
4423
7-00
0
26
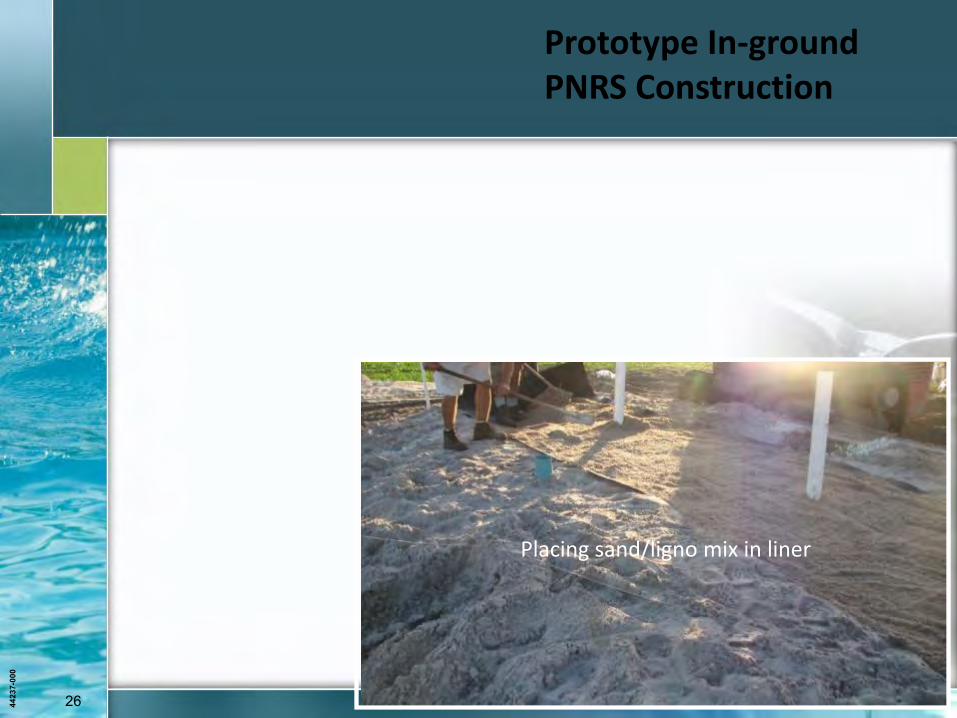
Prototype In-ground PNRS Construction
Placing sand/ligno mix in liner
4423
7-00
0
27
Prototype In-ground PNRS Construction
Underdrain
Placing sand/ligno mix in liner
4423
7-00
0
28
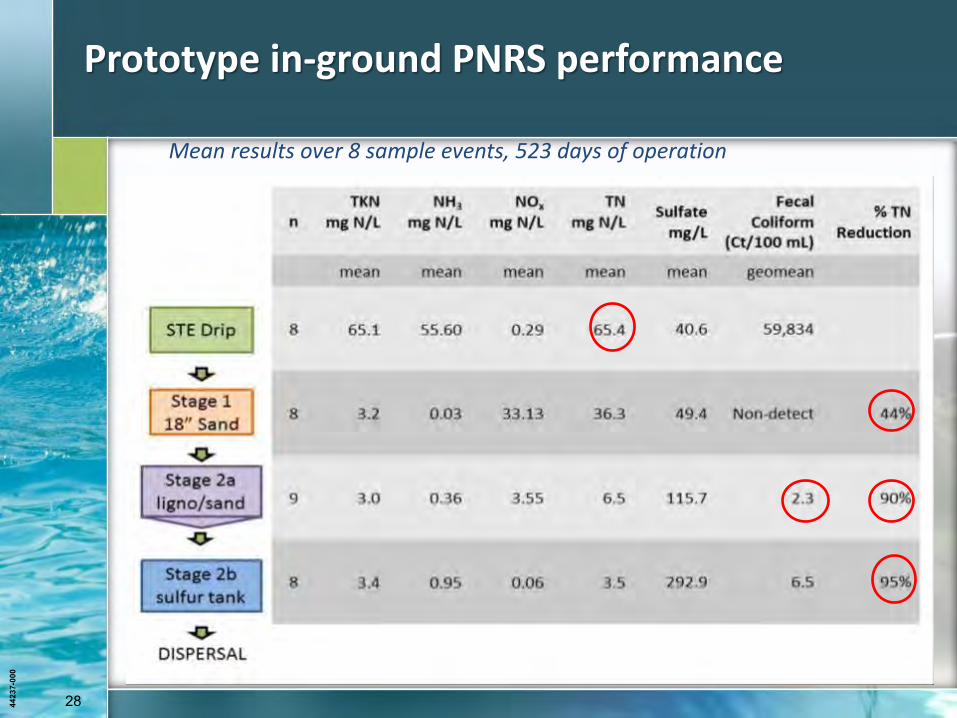
Prototype in-ground PNRS performance
Mean results over 8 sample events, 523 days of operation
4423
7-00
0
29
Lessons learned from pilot test
■ Encouraging results from pilot PNRS; several system configurations capable of > 95% N reduction
■ Sulfate production vs nitrate reduction
■ Highly reactive elemental sulfur media
■ Lignocellulosic retention time issues
■ Recommended evaluation of combination lignocellulosic and elemental sulfur denitrification systems for full-scale treatment units
4423
7-00
0
30 30 4423
7-00
0
Task B: Full Scale Prototype
PNRS Testing
4423
7-00
0
31
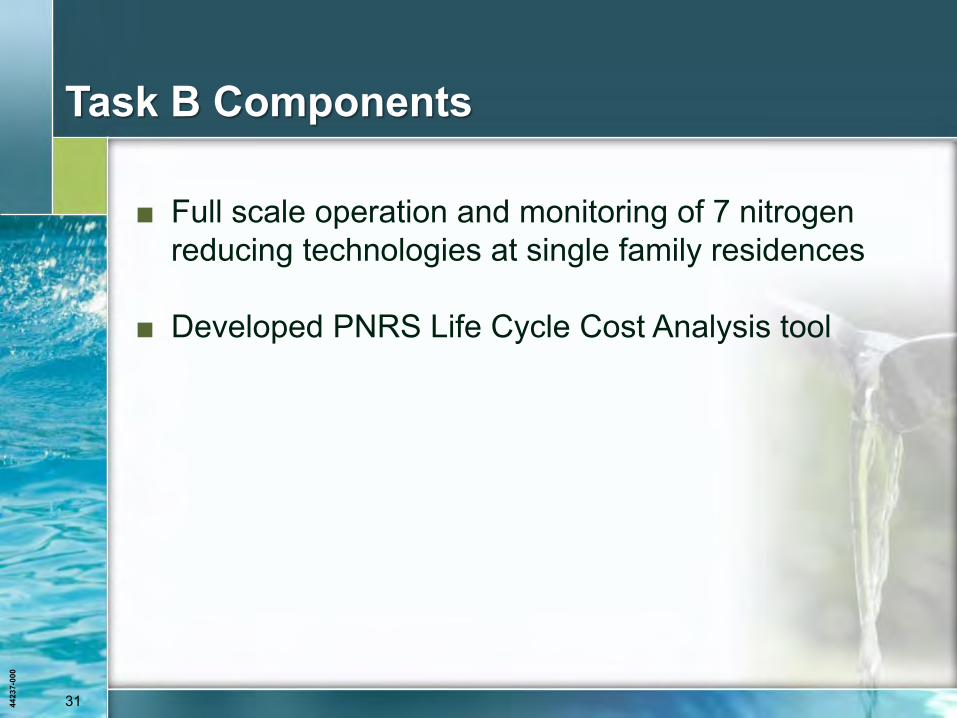
Task B Components
■ Full scale operation and monitoring of 7 nitrogen reducing technologies at single family residences
■ Developed PNRS Life Cycle Cost Analysis tool
4423
7-00
0
32
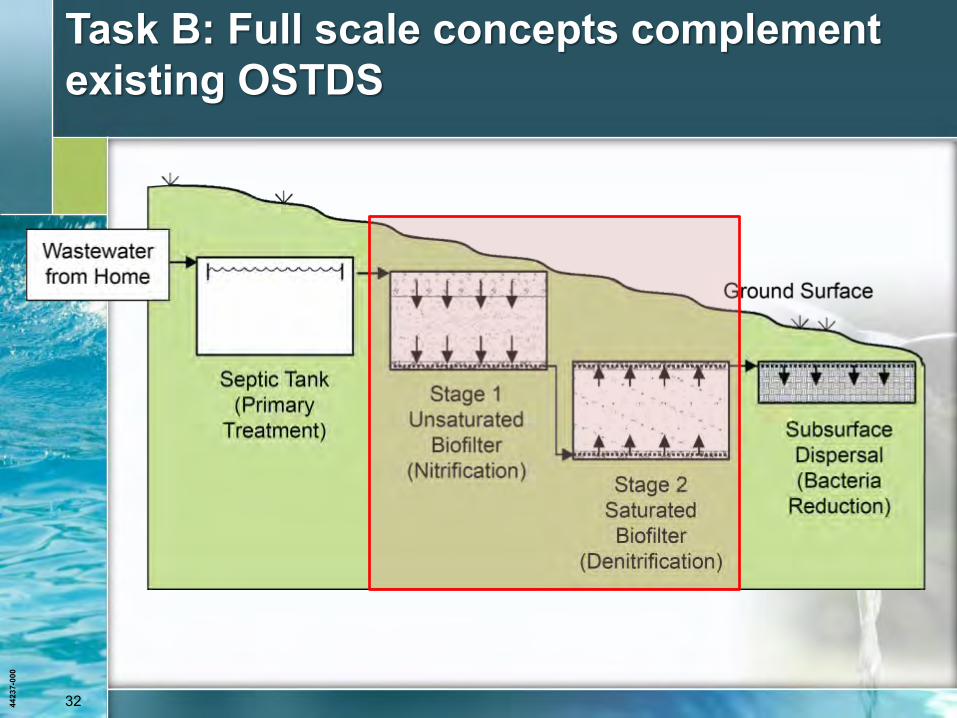
Task B: Full scale concepts complement existing OSTDS
4423
7-00
0
33
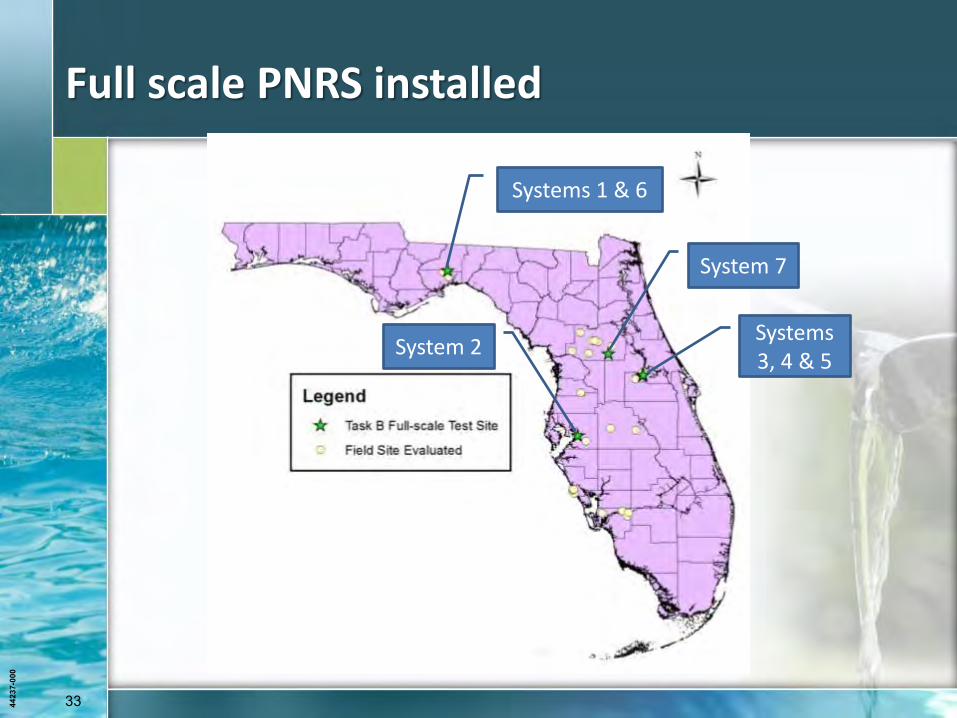
Full scale PNRS installed
Systems 3, 4 & 5
System 2
System 7
Systems 1 & 6
4423
7-00
0
34
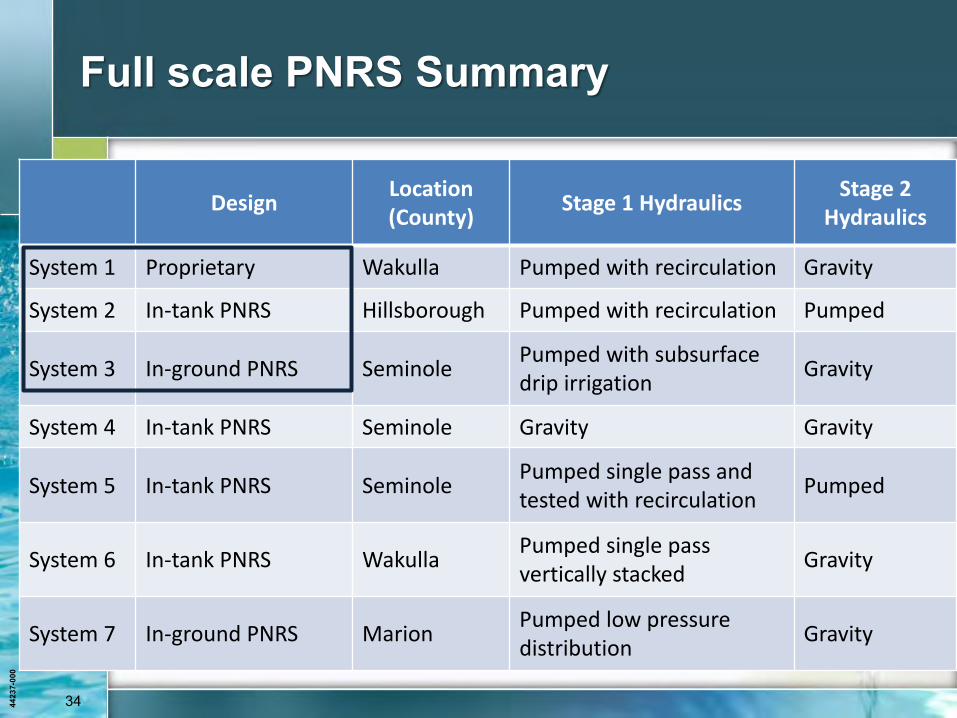
Full scale PNRS Summary
Design Location (County)
Stage 1 Hydraulics Stage 2
Hydraulics
System 1 Proprietary Wakulla Pumped with recirculation Gravity
System 2 In-tank PNRS Hillsborough Pumped with recirculation Pumped
System 3 In-ground PNRS Seminole Pumped with subsurface drip irrigation
Gravity
System 4 In-tank PNRS Seminole Gravity Gravity
System 5 In-tank PNRS Seminole Pumped single pass and tested with recirculation
Pumped
System 6 In-tank PNRS Wakulla Pumped single pass vertically stacked
Gravity
System 7 In-ground PNRS Marion Pumped low pressure distribution
Gravity
4423
7-00
0
35 35 4423
7-00
0
Proprietary system (System 1)
4423
7-00
0
36
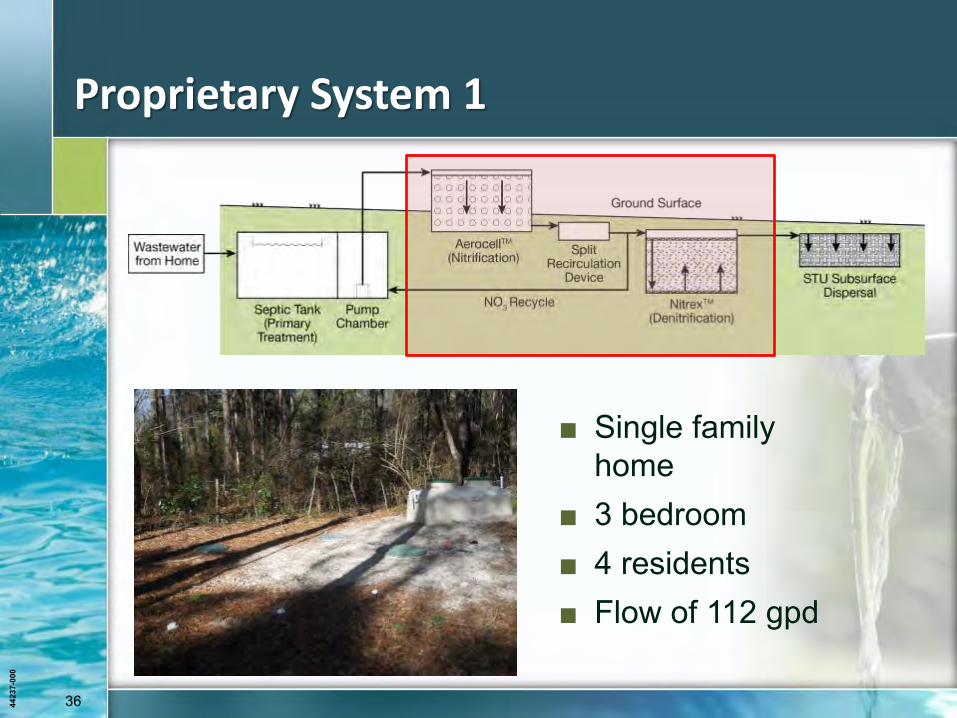
Proprietary System 1
■ Single family home
■ 3 bedroom ■ 4 residents ■ Flow of 112 gpd
4423
7-00
0
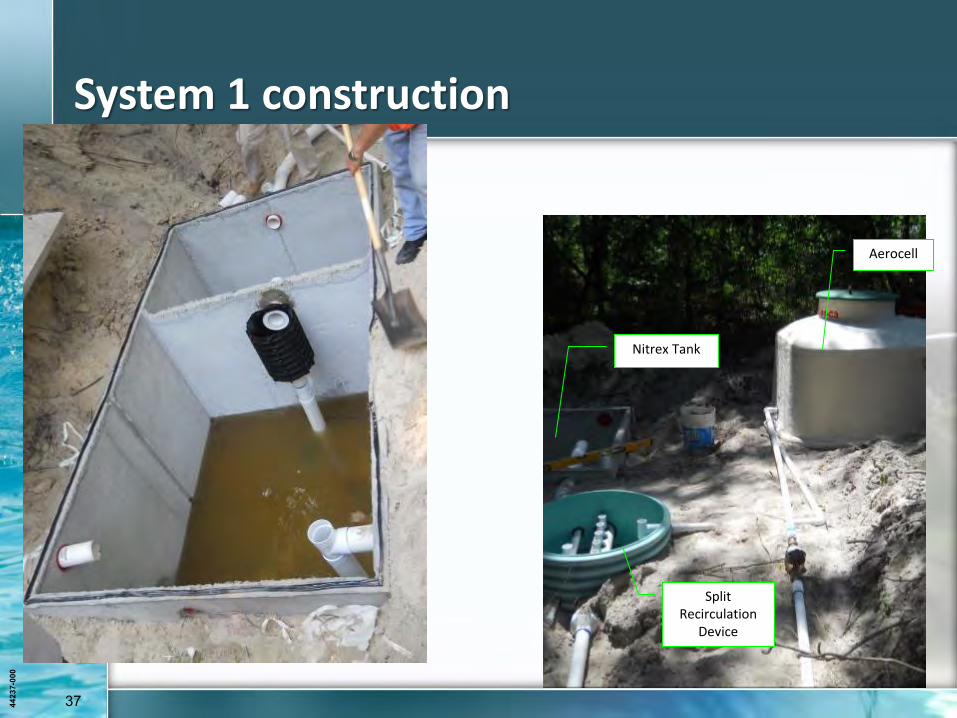
37
System 1 construction
Nitrex Tank
Aerocell
Split Recirculation
Device
4423
7-00
0
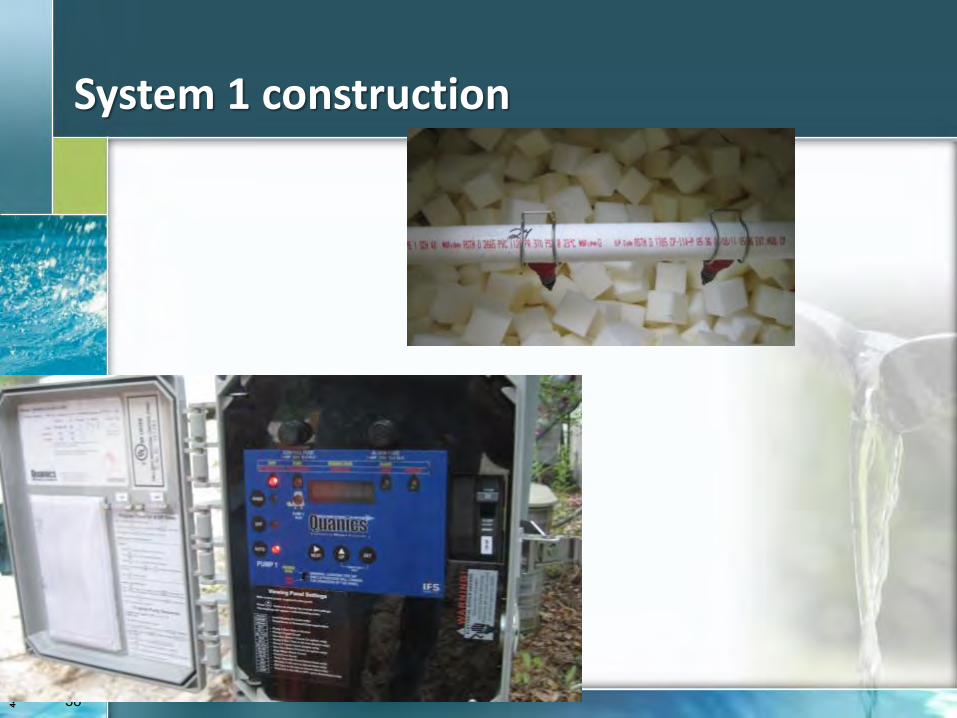
38
System 1 construction
4423
7-00
0
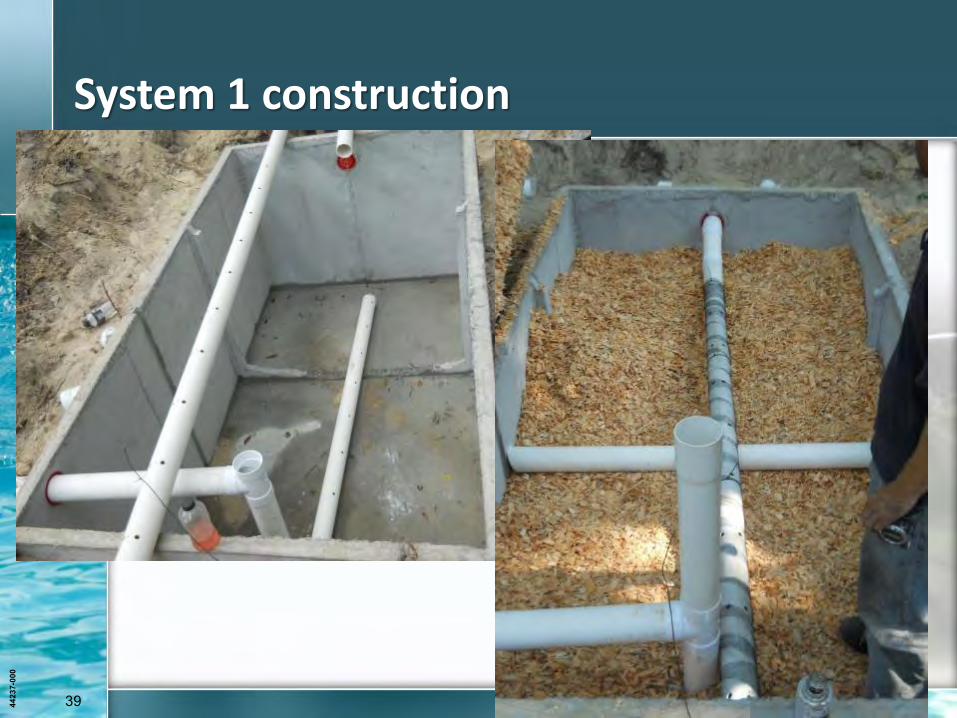
39
System 1 construction
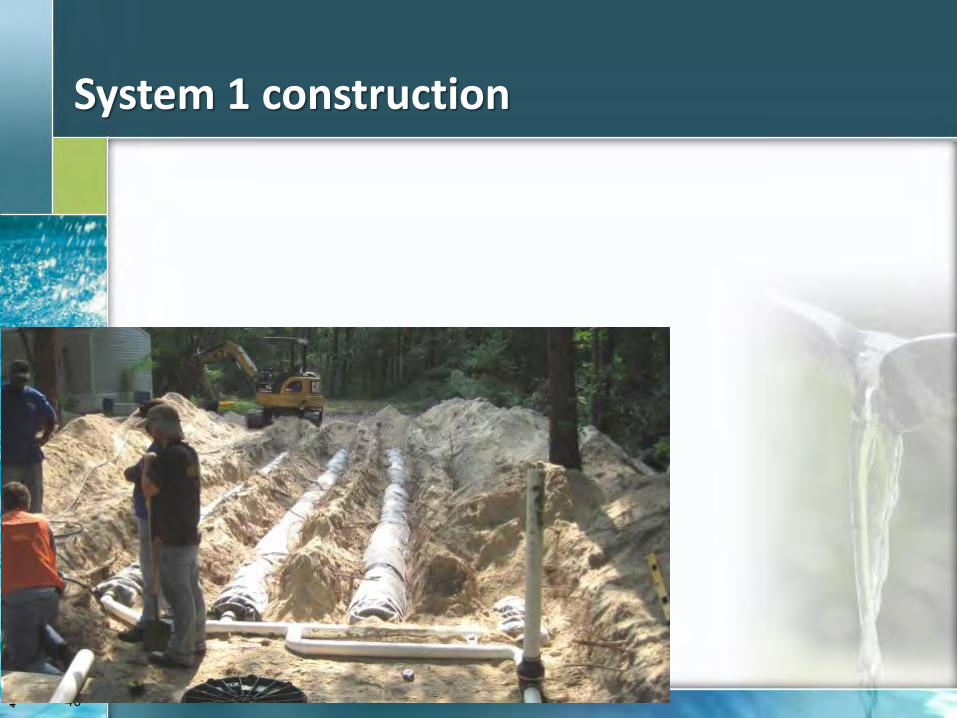
4423
7-00
0
40
System 1 construction
4423
7-00
0
41
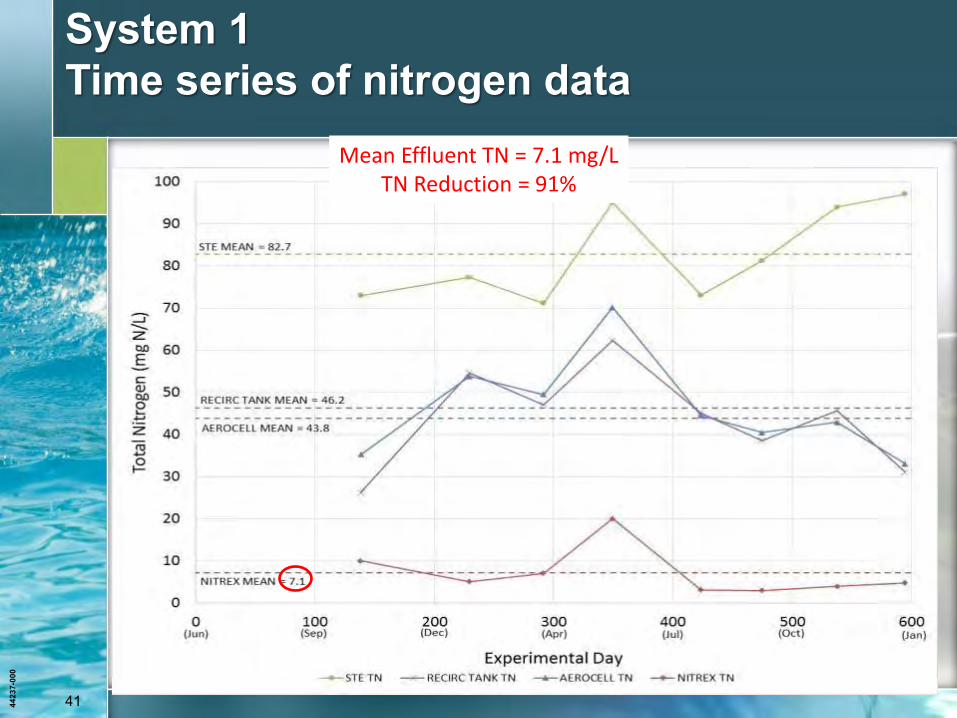
System 1 Time series of nitrogen data
Mean Effluent TN = 7.1 mg/L TN Reduction = 91%
4423
7-00
0
42
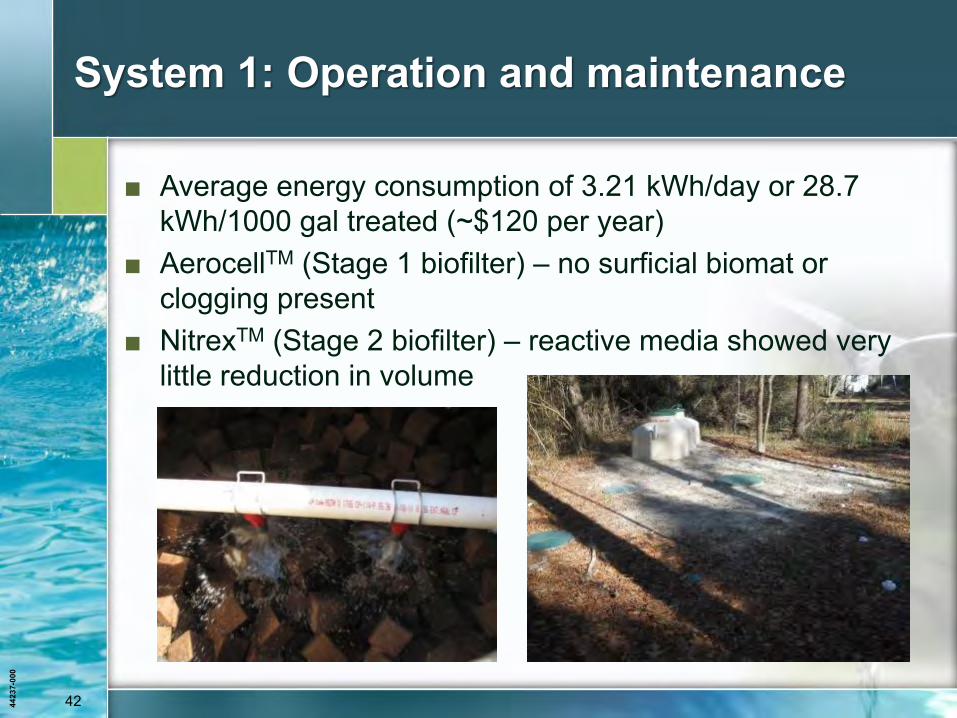
System 1: Operation and maintenance
■ Average energy consumption of 3.21 kWh/day or 28.7 kWh/1000 gal treated (~$120 per year)
■ AerocellTM (Stage 1 biofilter) – no surficial biomat or clogging present
■ NitrexTM (Stage 2 biofilter) – reactive media showed very little reduction in volume
4423
7-00
0
43 43 4423
7-00
0
In-tank PNRS (System 2)
4423
7-00
0
44
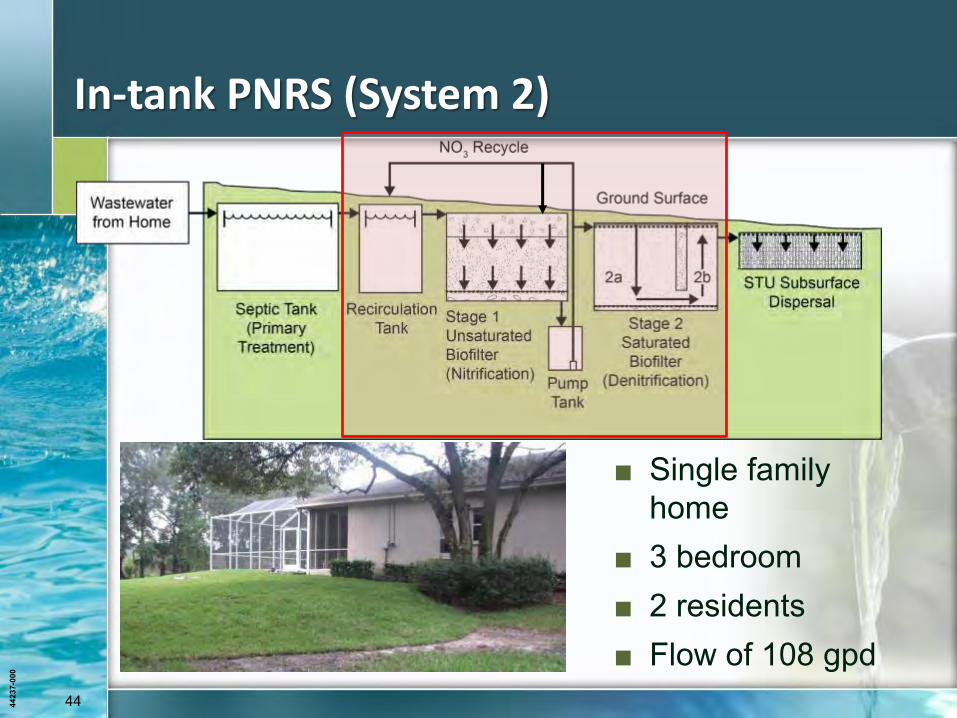
In-tank PNRS (System 2)
■ Single family home
■ 3 bedroom ■ 2 residents ■ Flow of 108 gpd
4423
7-00
0
45
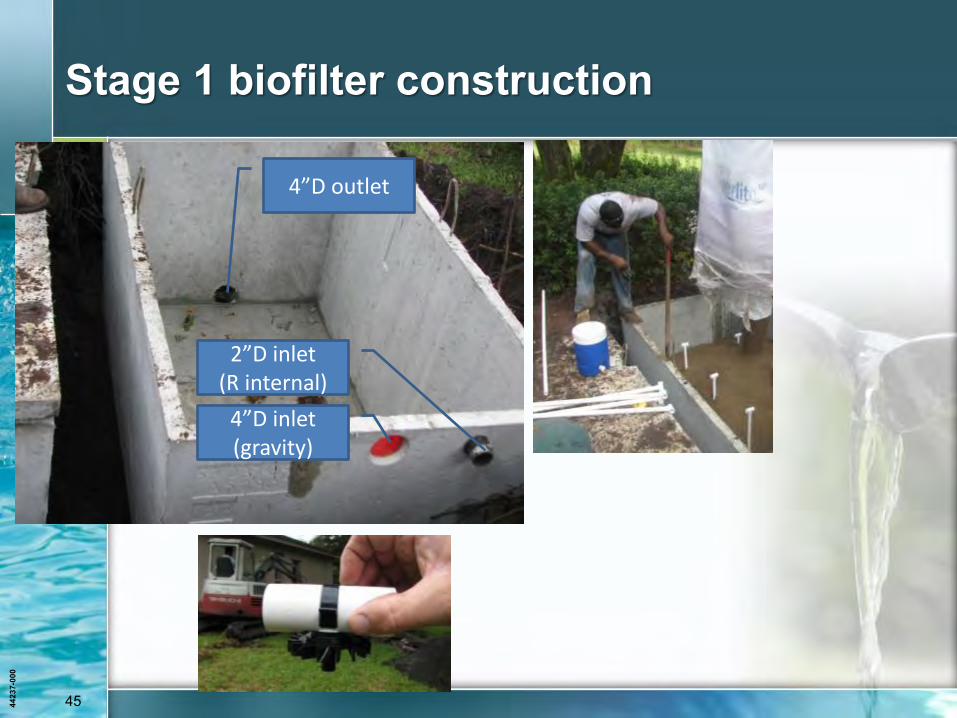
Stage 1 biofilter construction
4”D outlet
4”D inlet (gravity)
2”D inlet (R internal)
4423
7-00
0
46
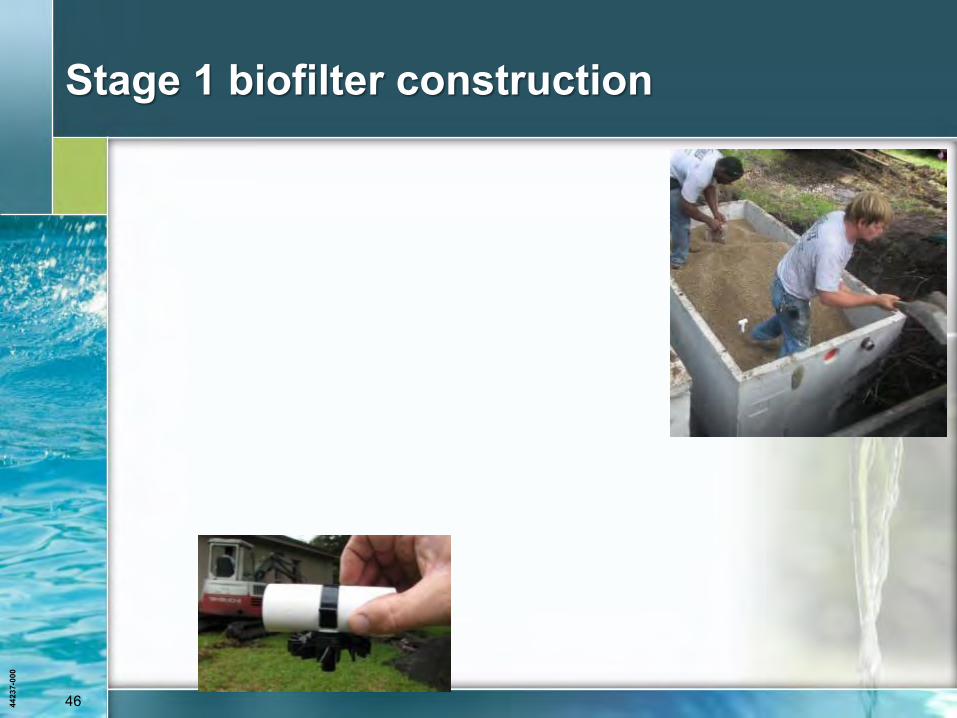
Stage 1 biofilter construction
4423
7-00
0
47
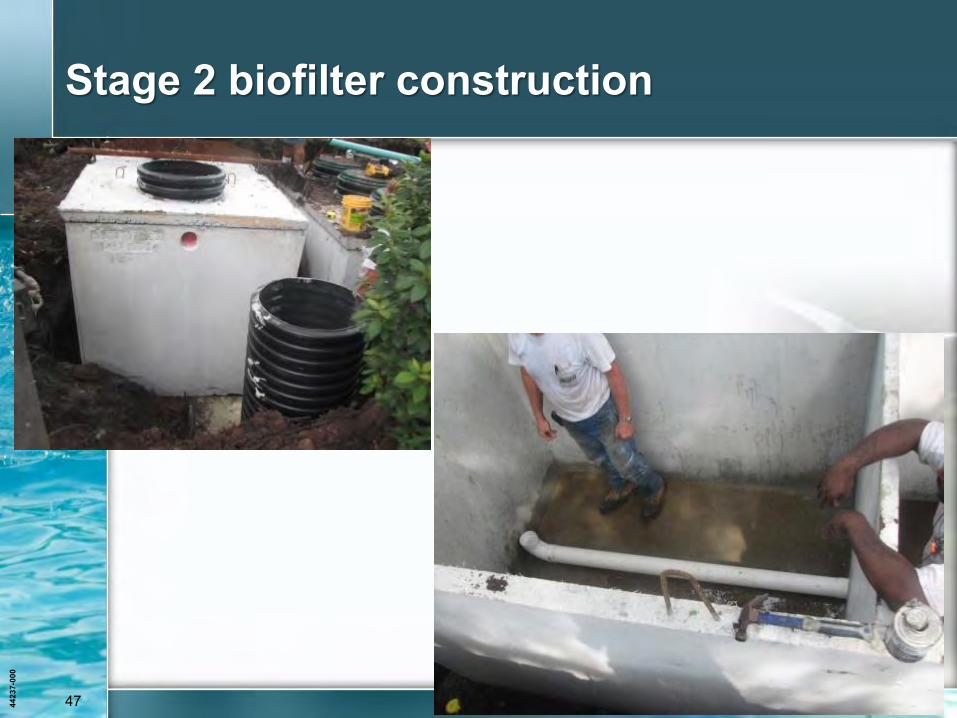
Stage 2 biofilter construction
4423
7-00
0
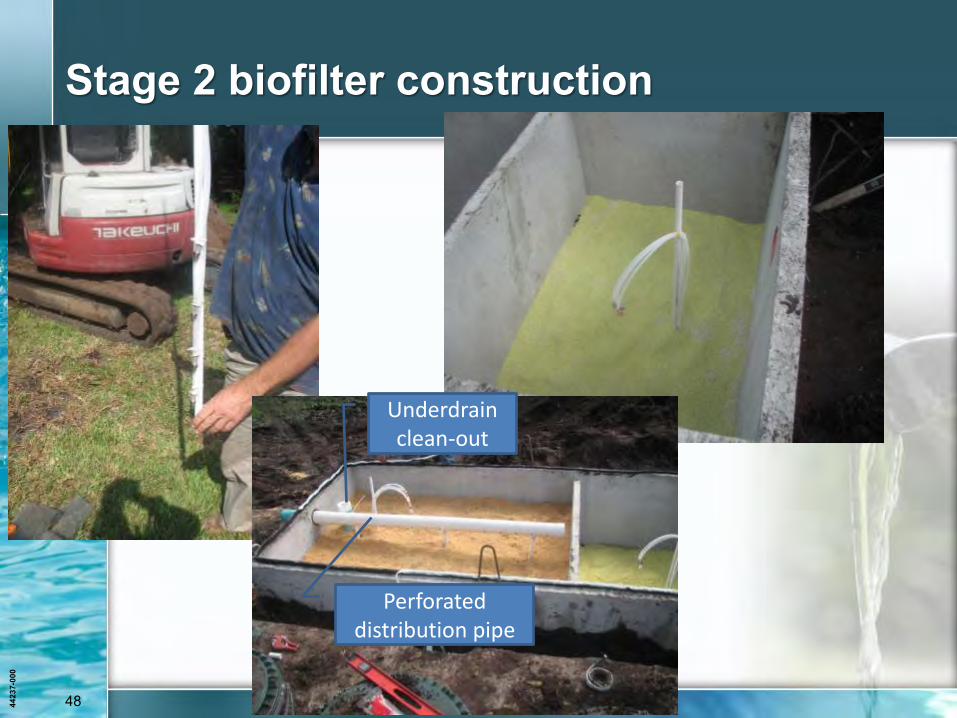
48
Stage 2 biofilter construction
Underdrain clean-out
Perforated distribution pipe
4423
7-00
0
49
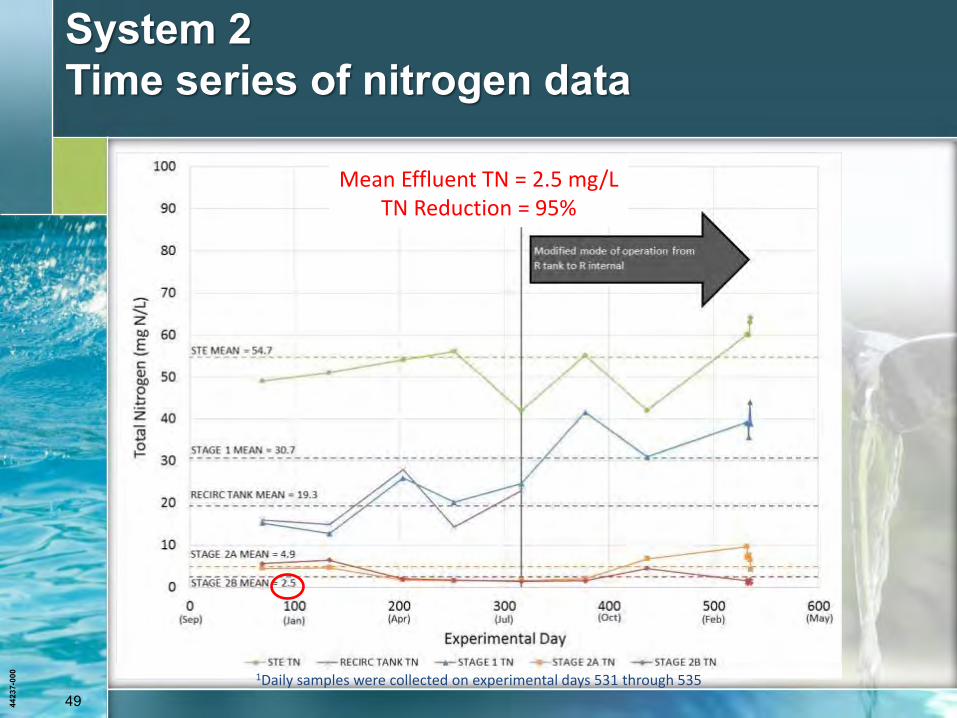
System 2 Time series of nitrogen data
1Daily samples were collected on experimental days 531 through 535
Mean Effluent TN = 2.5 mg/L TN Reduction = 95%
4423
7-00
0
50
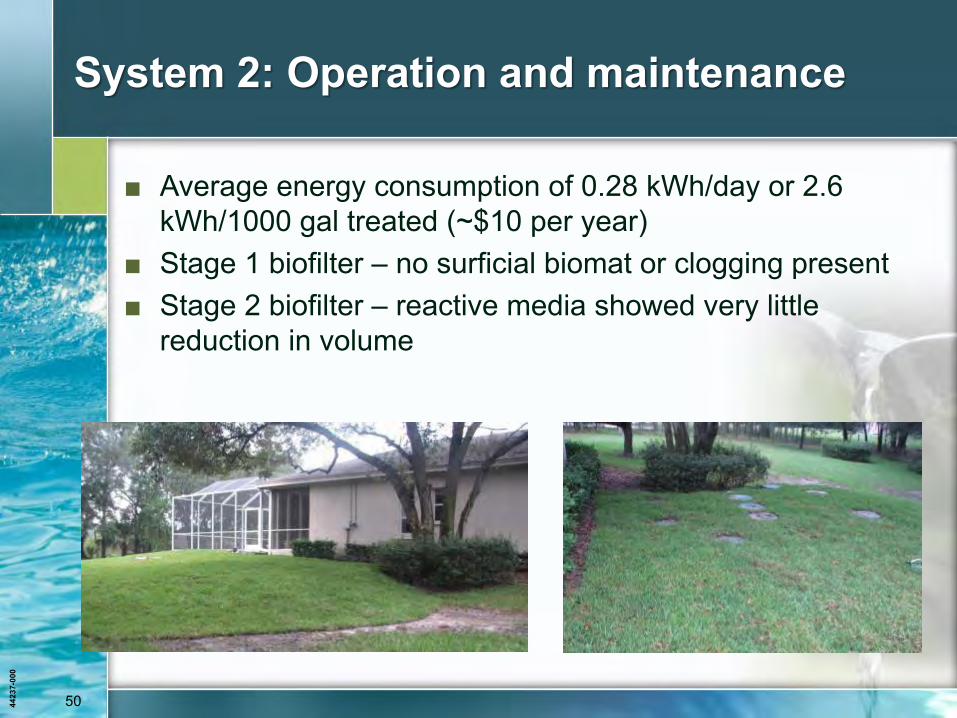
System 2: Operation and maintenance
■ Average energy consumption of 0.28 kWh/day or 2.6 kWh/1000 gal treated (~$10 per year)
■ Stage 1 biofilter – no surficial biomat or clogging present ■ Stage 2 biofilter – reactive media showed very little
reduction in volume
4423
7-00
0
51 51 4423
7-00
0
In-ground PNRS (System 3)
4423
7-00
0
52
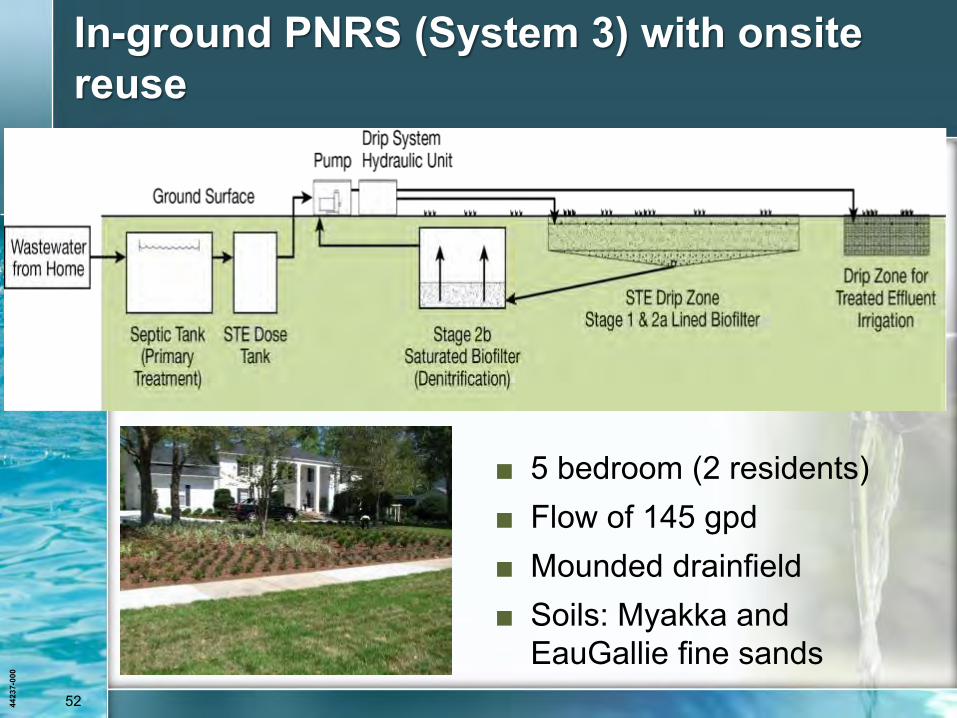
In-ground PNRS (System 3) with onsite reuse
■ 5 bedroom (2 residents) ■ Flow of 145 gpd ■ Mounded drainfield ■ Soils: Myakka and
EauGallie fine sands
4423
7-00
0
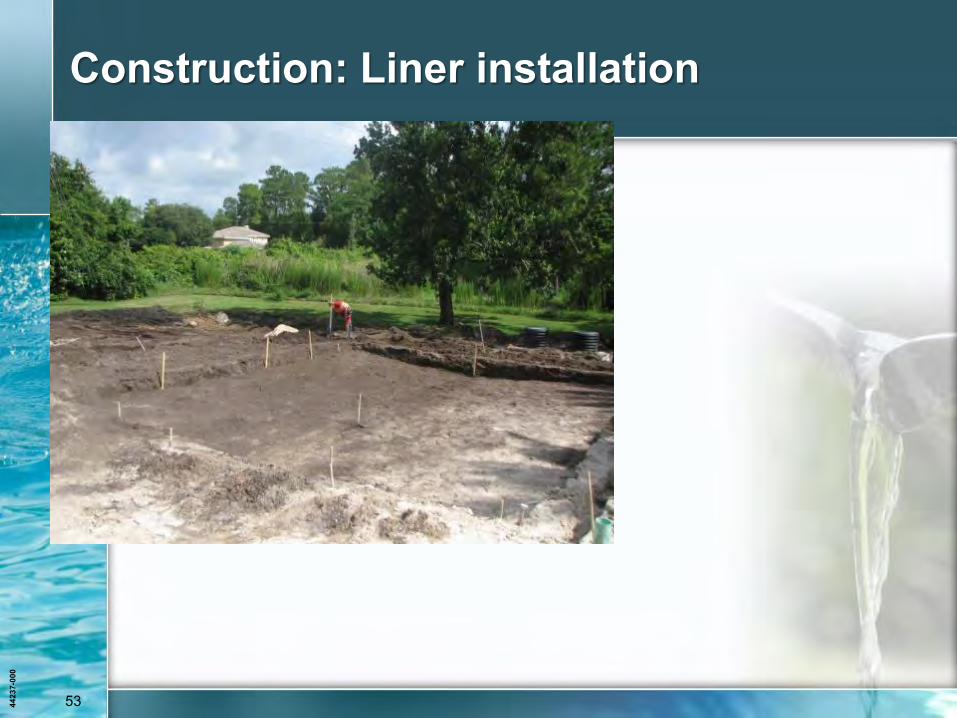
53
Construction: Liner installation
4423
7-00
0
54
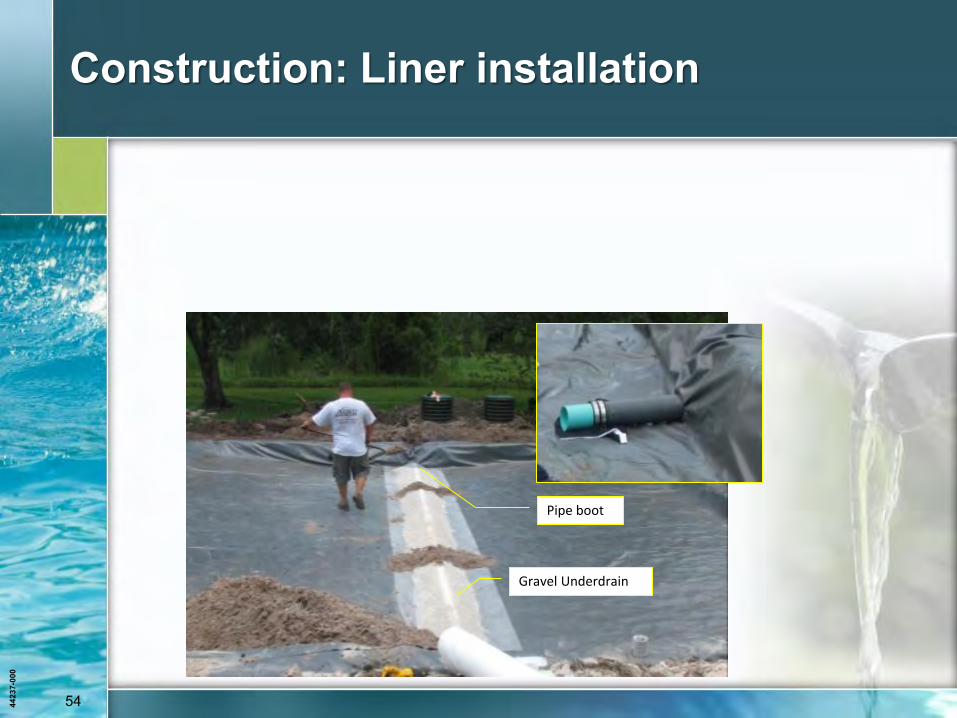
Construction: Liner installation
Pipe boot
Gravel Underdrain
4423
7-00
0
55
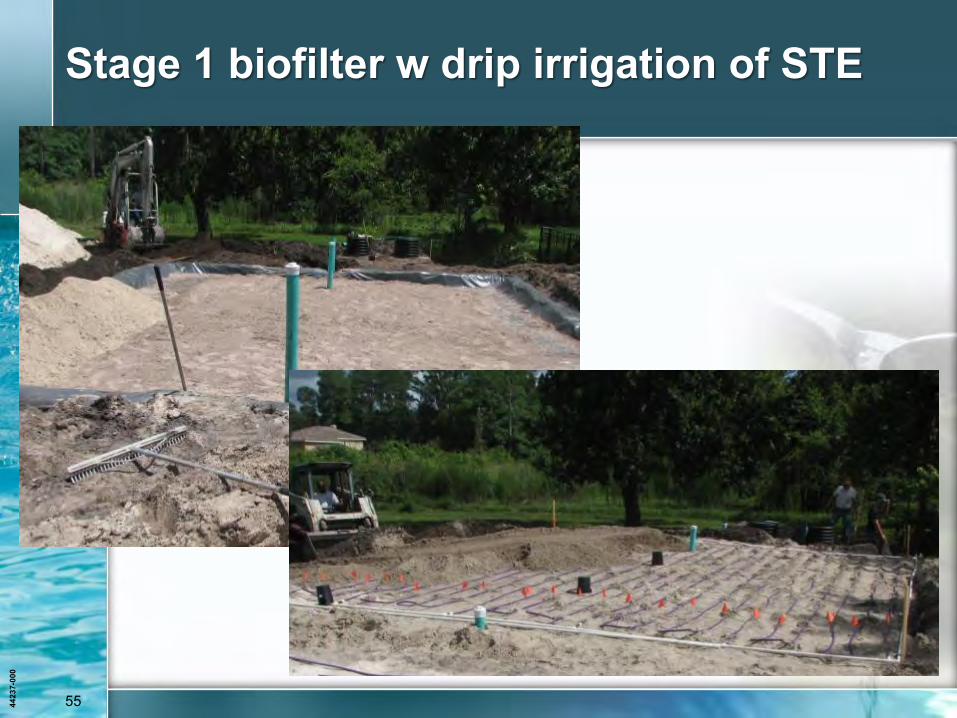
Stage 1 biofilter w drip irrigation of STE
4423
7-00
0
56
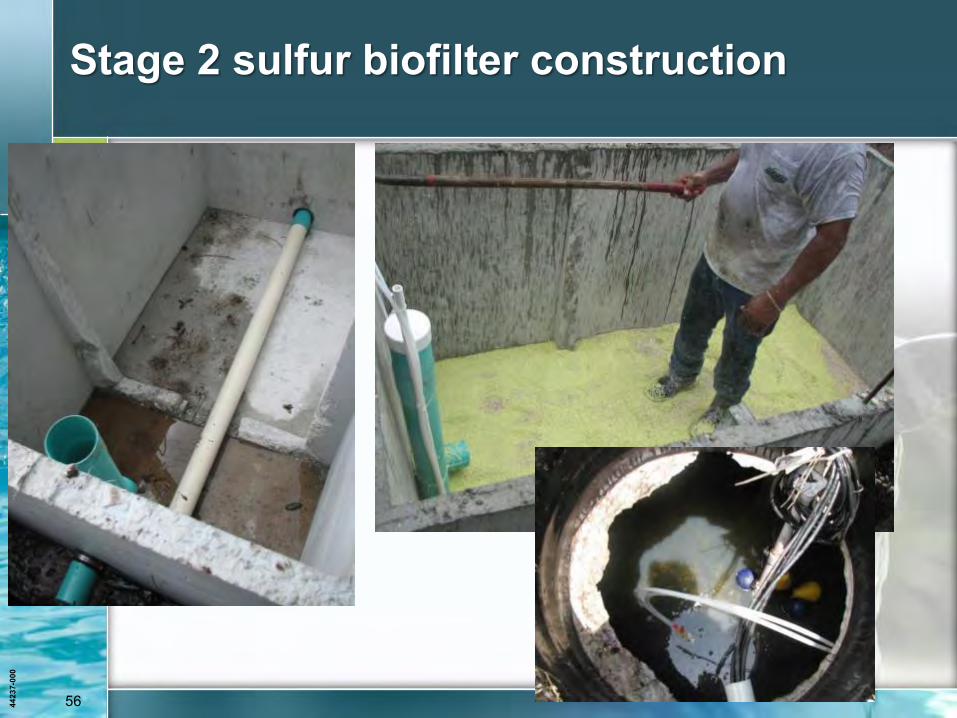
Stage 2 sulfur biofilter construction
4423
7-00
0
57
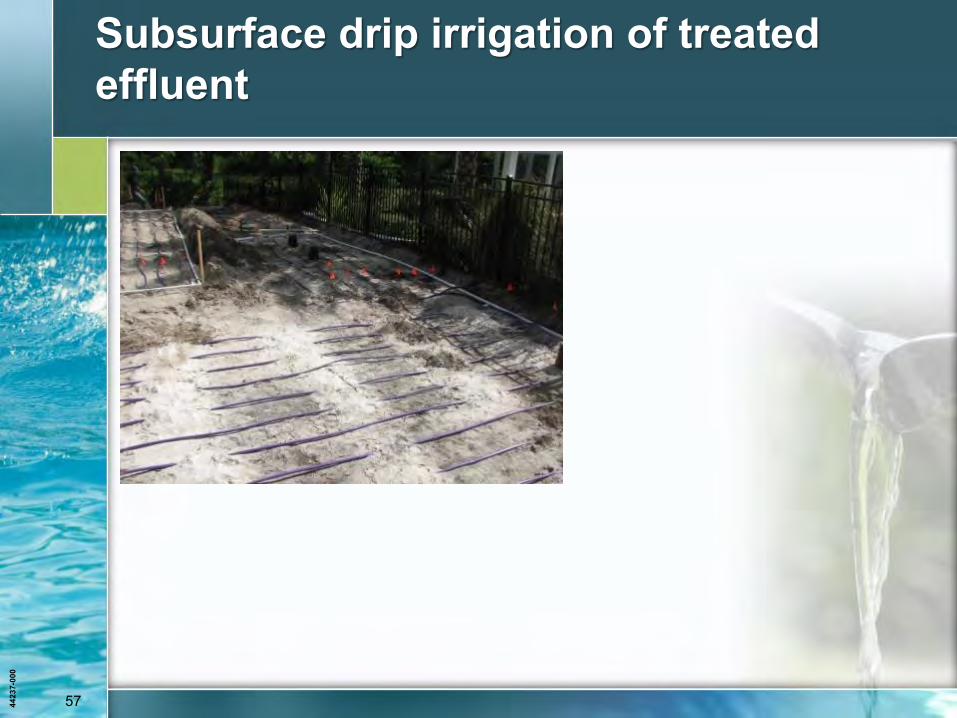
Subsurface drip irrigation of treated effluent
4423
7-00
0
58
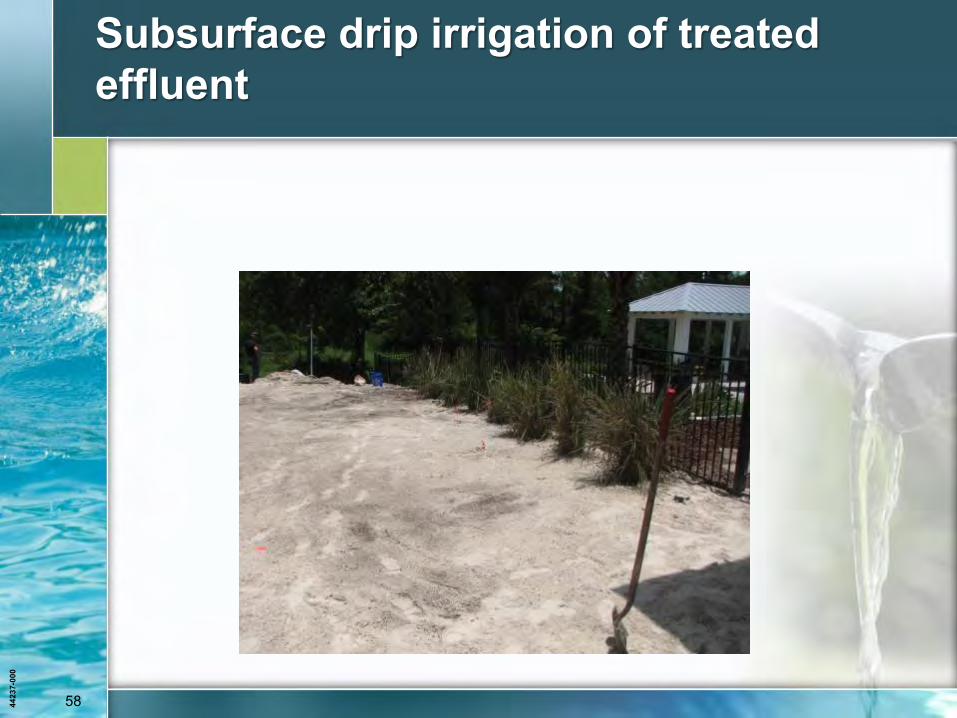
Subsurface drip irrigation of treated effluent
4423
7-00
0
59
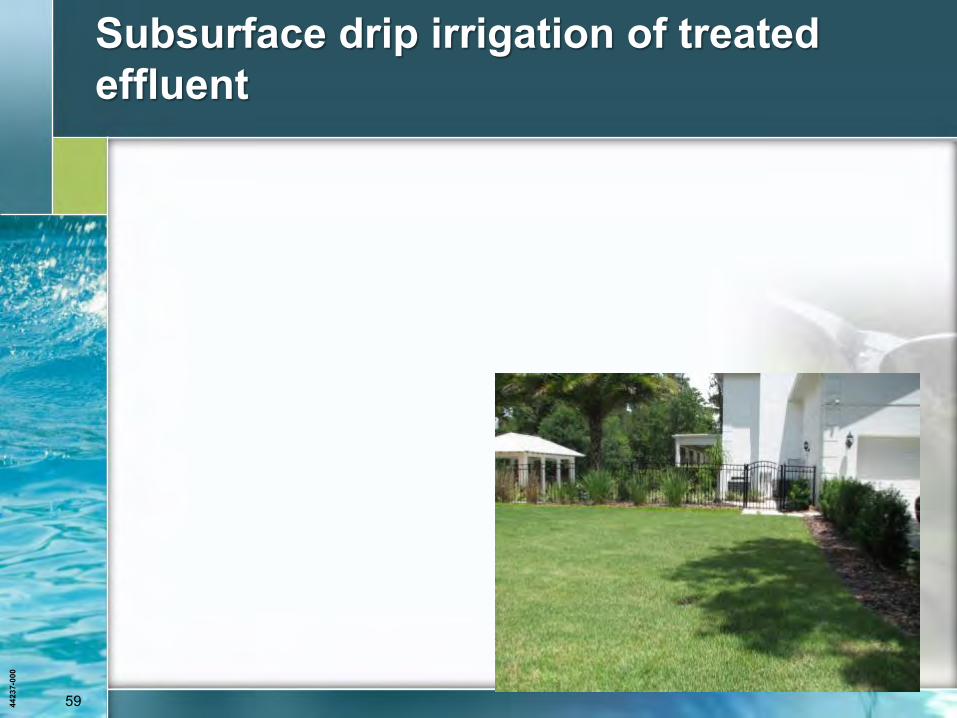
Subsurface drip irrigation of treated effluent
4423
7-00
0
60
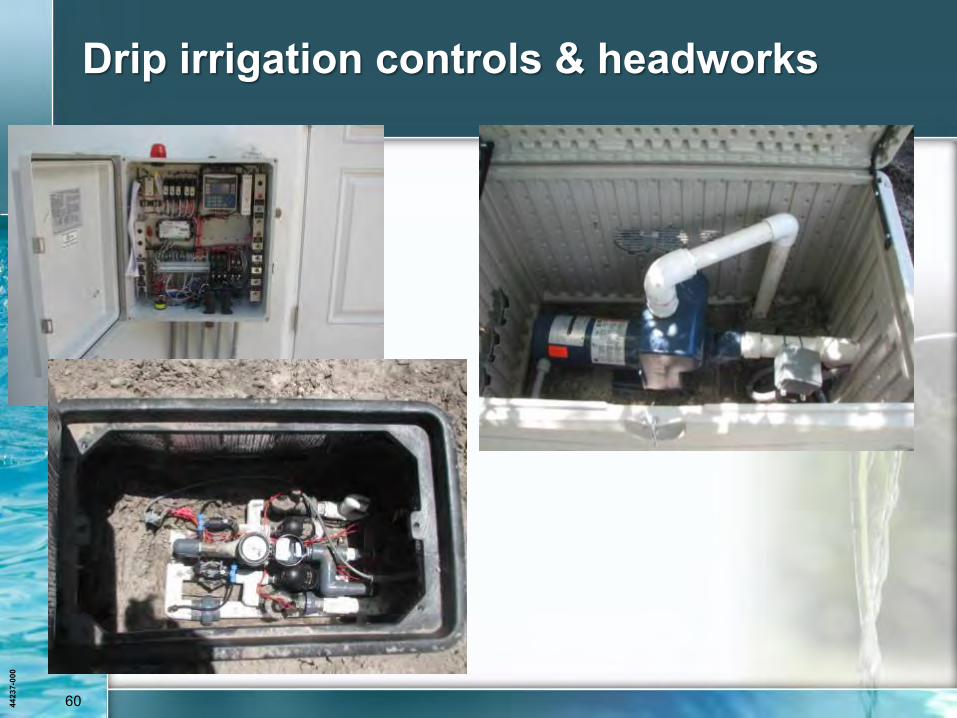
Drip irrigation controls & headworks
4423
7-00
0
61
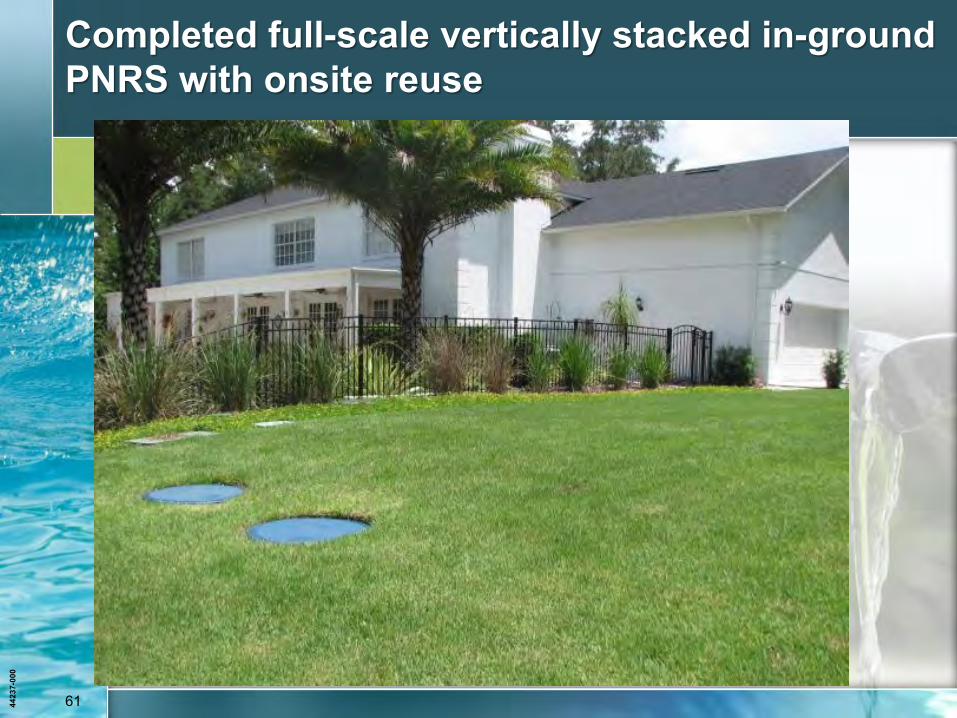
Completed full-scale vertically stacked in-ground PNRS with onsite reuse
4423
7-00
0
62
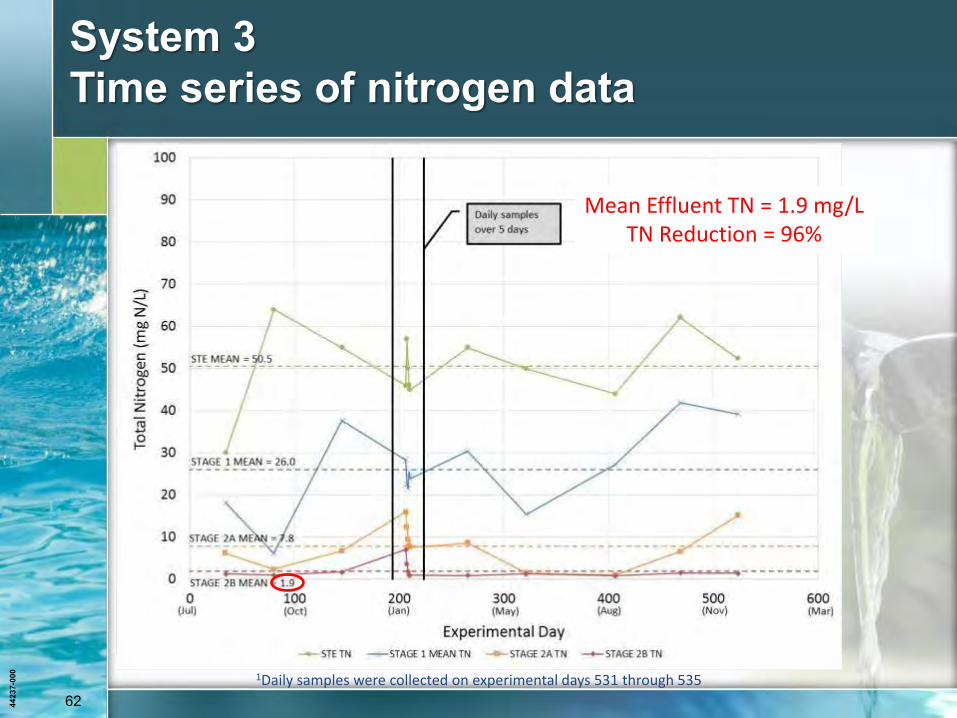
System 3 Time series of nitrogen data
1Daily samples were collected on experimental days 531 through 535
Mean Effluent TN = 1.9 mg/L TN Reduction = 96%
4423
7-00
0
63
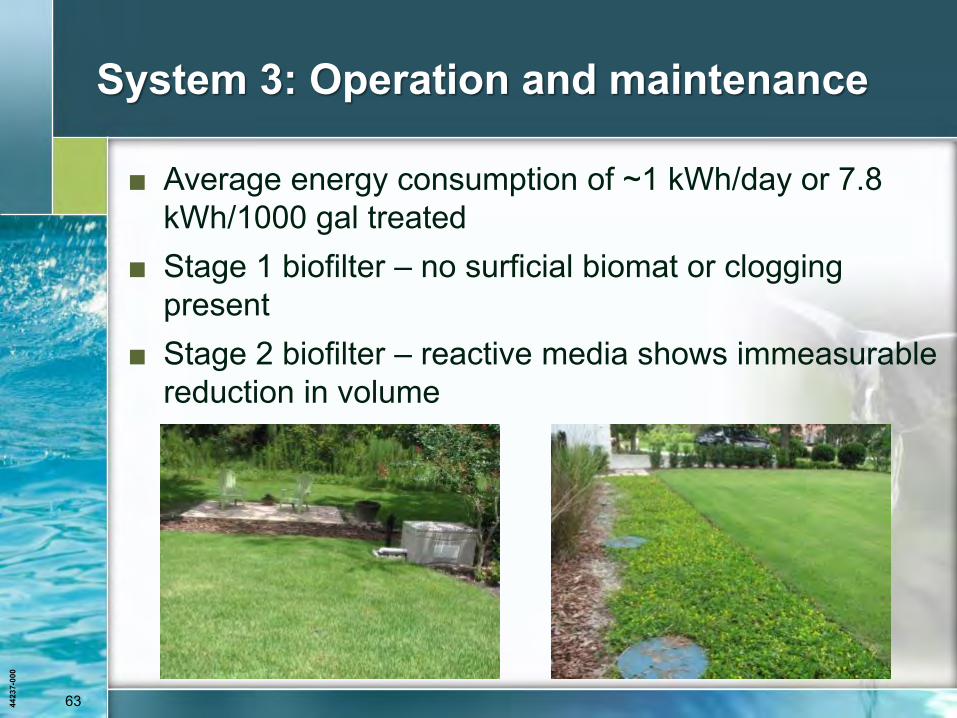
System 3: Operation and maintenance
■ Average energy consumption of ~1 kWh/day or 7.8 kWh/1000 gal treated
■ Stage 1 biofilter – no surficial biomat or clogging present
■ Stage 2 biofilter – reactive media shows immeasurable reduction in volume
4423
7-00
0
64
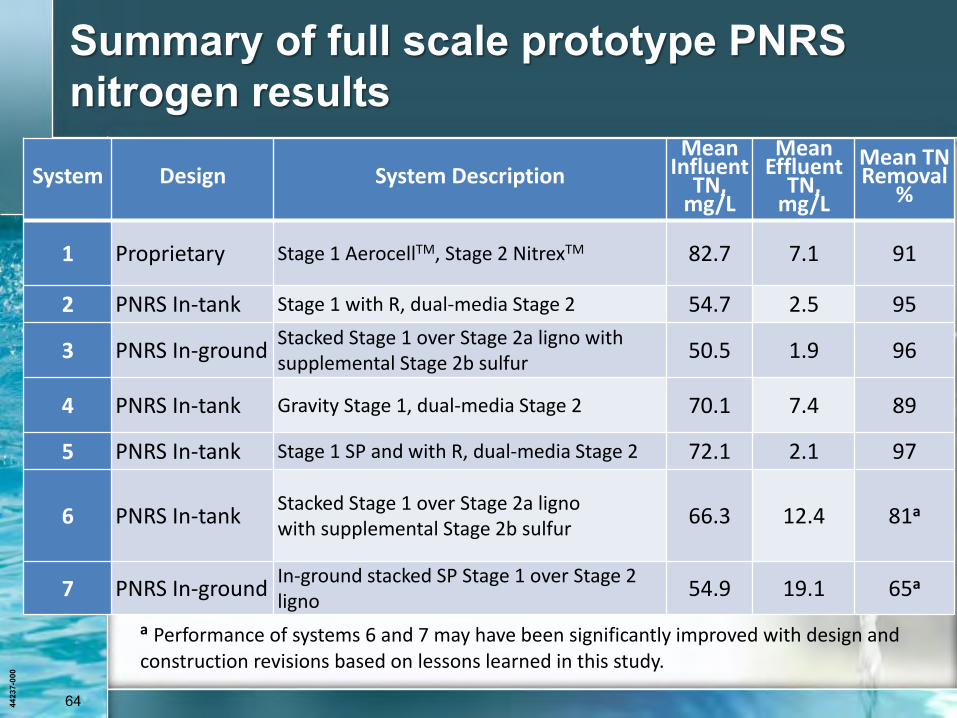
Summary of full scale prototype PNRS nitrogen results
System Design System Description Mean
Influent TN,
mg/L
Mean Effluent
TN, mg/L
Mean TN Removal
%
1 Proprietary Stage 1 AerocellTM, Stage 2 NitrexTM 82.7 7.1 91
2 PNRS In-tank Stage 1 with R, dual-media Stage 2 54.7 2.5 95
3 PNRS In-ground Stacked Stage 1 over Stage 2a ligno with supplemental Stage 2b sulfur
50.5 1.9 96
4 PNRS In-tank Gravity Stage 1, dual-media Stage 2 70.1 7.4 89
5 PNRS In-tank Stage 1 SP and with R, dual-media Stage 2 72.1 2.1 97
6 PNRS In-tank Stacked Stage 1 over Stage 2a ligno with supplemental Stage 2b sulfur
66.3 12.4 81a
7 PNRS In-ground In-ground stacked SP Stage 1 over Stage 2 ligno
54.9 19.1 65a
a Performance of systems 6 and 7 may have been significantly improved with design and construction revisions based on lessons learned in this study.
4423
7-00
0
65
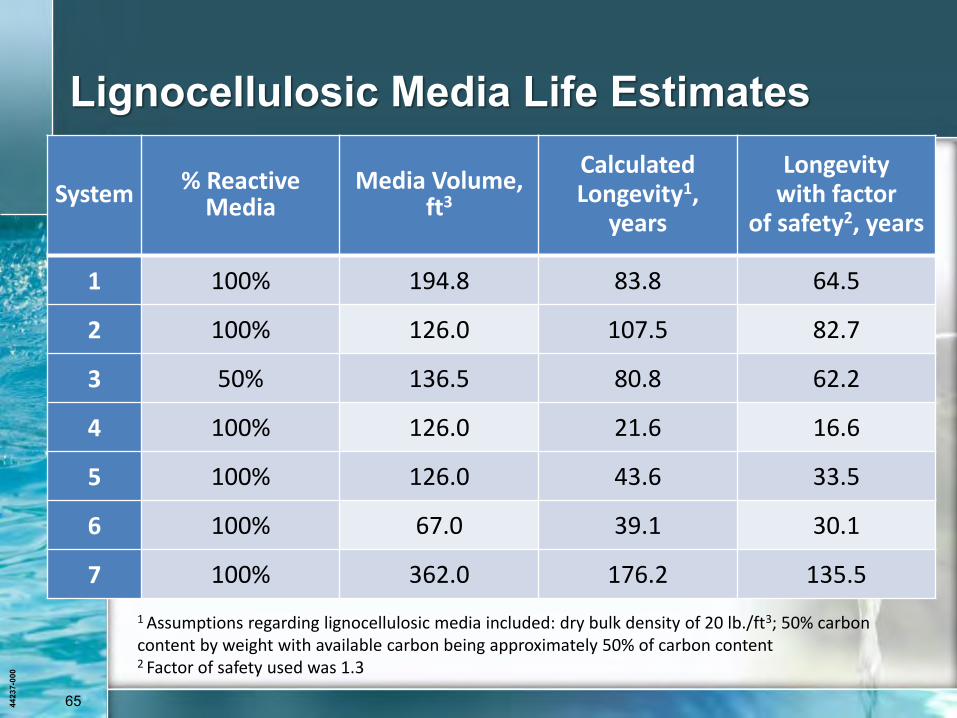
Lignocellulosic Media Life Estimates
System % Reactive Media
Media Volume, ft3
Calculated Longevity1,
years
Longevity with factor
of safety2, years
1 100% 194.8 83.8 64.5
2 100% 126.0 107.5 82.7
3 50% 136.5 80.8 62.2
4 100% 126.0 21.6 16.6
5 100% 126.0 43.6 33.5
6 100% 67.0 39.1 30.1
7 100% 362.0 176.2 135.5
1 Assumptions regarding lignocellulosic media included: dry bulk density of 20 lb./ft3; 50% carbon content by weight with available carbon being approximately 50% of carbon content 2 Factor of safety used was 1.3
4423
7-00
0
66
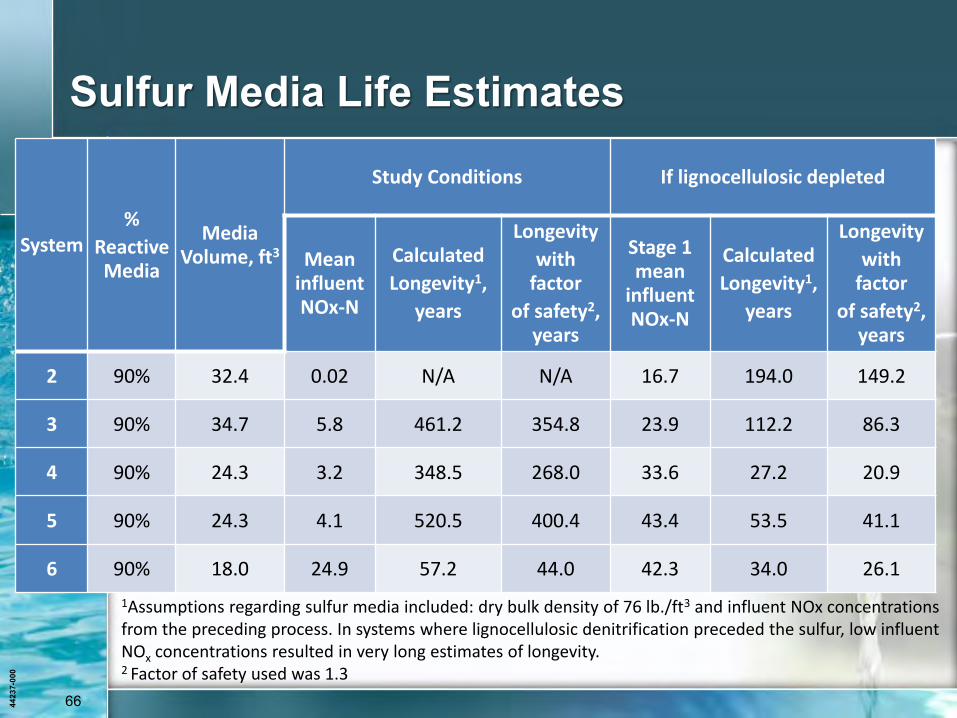
Sulfur Media Life Estimates
System %
Reactive Media
Media Volume, ft3
Study Conditions If lignocellulosic depleted
Mean influent NOx-N
Calculated
Longevity1,
years
Longevity
with factor
of safety2, years
Stage 1 mean
influent NOx-N
Calculated
Longevity1,
years
Longevity
with factor
of safety2, years
2 90% 32.4 0.02 N/A N/A 16.7 194.0 149.2
3 90% 34.7 5.8 461.2 354.8 23.9 112.2 86.3
4 90% 24.3 3.2 348.5 268.0 33.6 27.2 20.9
5 90% 24.3 4.1 520.5 400.4 43.4 53.5 41.1
6 90% 18.0 24.9 57.2 44.0 42.3 34.0 26.1
1Assumptions regarding sulfur media included: dry bulk density of 76 lb./ft3 and influent NOx concentrations from the preceding process. In systems where lignocellulosic denitrification preceded the sulfur, low influent NOx concentrations resulted in very long estimates of longevity. 2 Factor of safety used was 1.3
4423
7-00
0
67
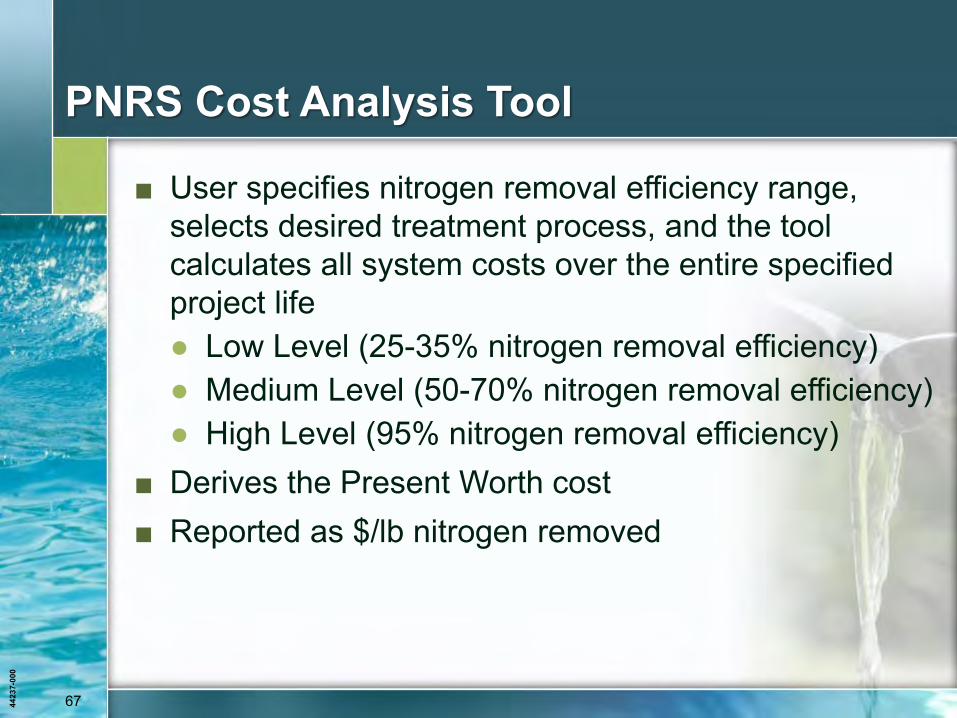
PNRS Cost Analysis Tool
■ User specifies nitrogen removal efficiency range, selects desired treatment process, and the tool calculates all system costs over the entire specified project life ● Low Level (25-35% nitrogen removal efficiency) ● Medium Level (50-70% nitrogen removal efficiency) ● High Level (95% nitrogen removal efficiency)
■ Derives the Present Worth cost ■ Reported as $/lb nitrogen removed
4423
7-00
0
68
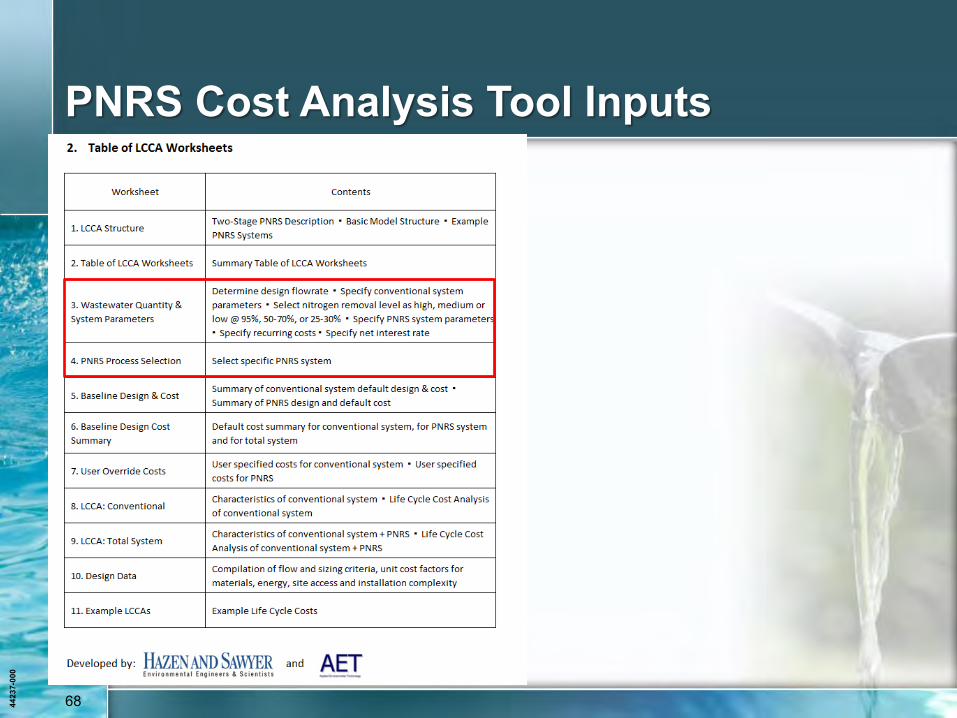
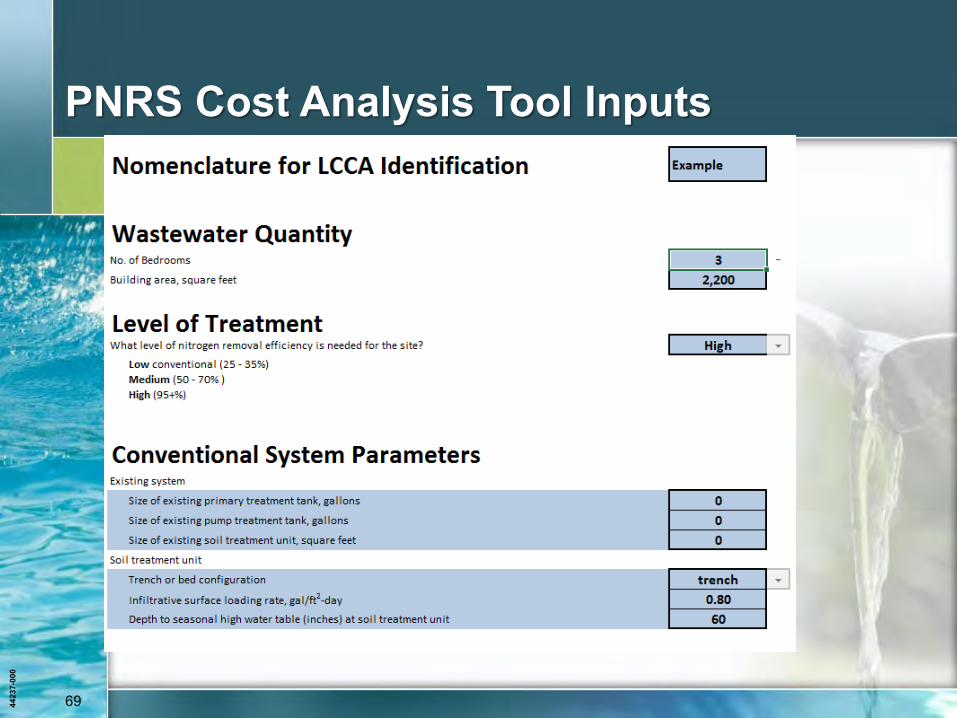
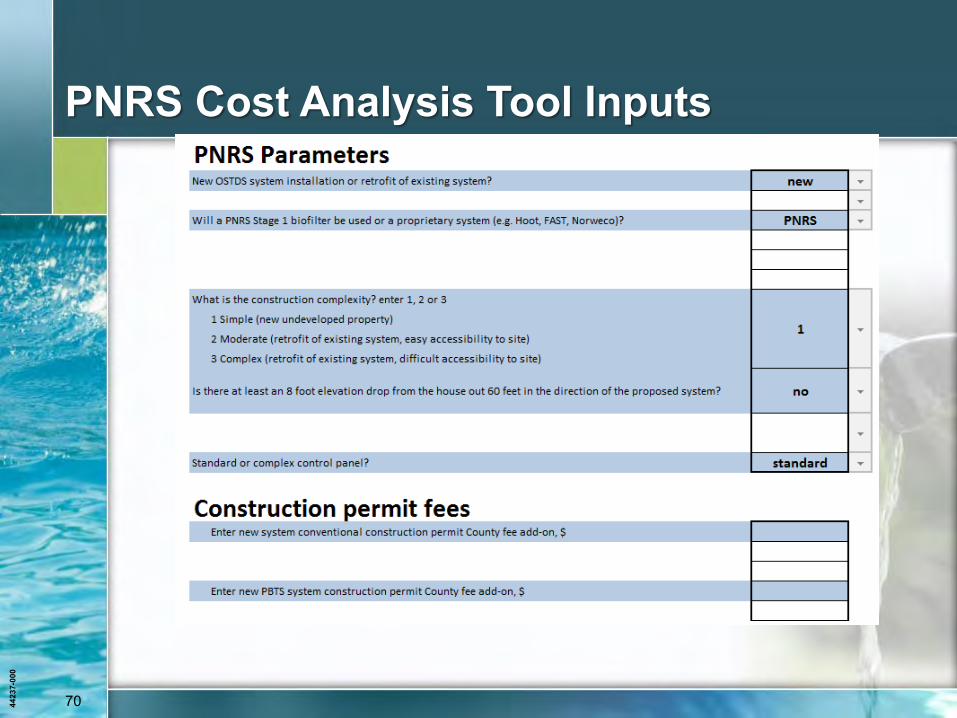
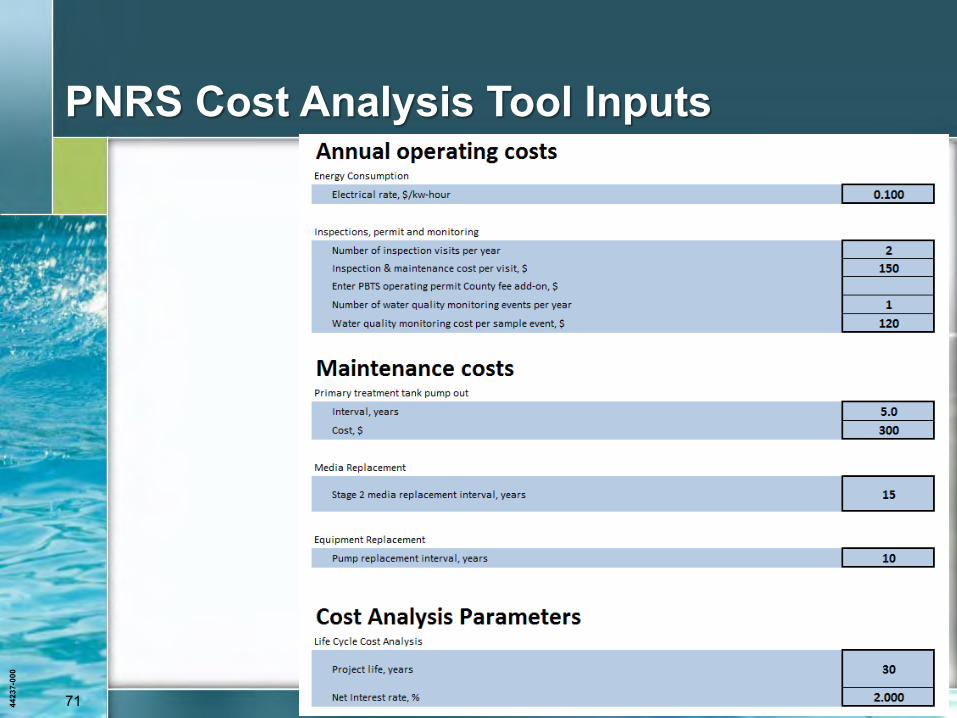
PNRS Cost Analysis Tool Inputs
4423
7-00
0
69
PNRS Cost Analysis Tool Inputs
4423
7-00
0
70
PNRS Cost Analysis Tool Inputs
4423
7-00
0
71
PNRS Cost Analysis Tool Inputs
4423
7-00
0
72
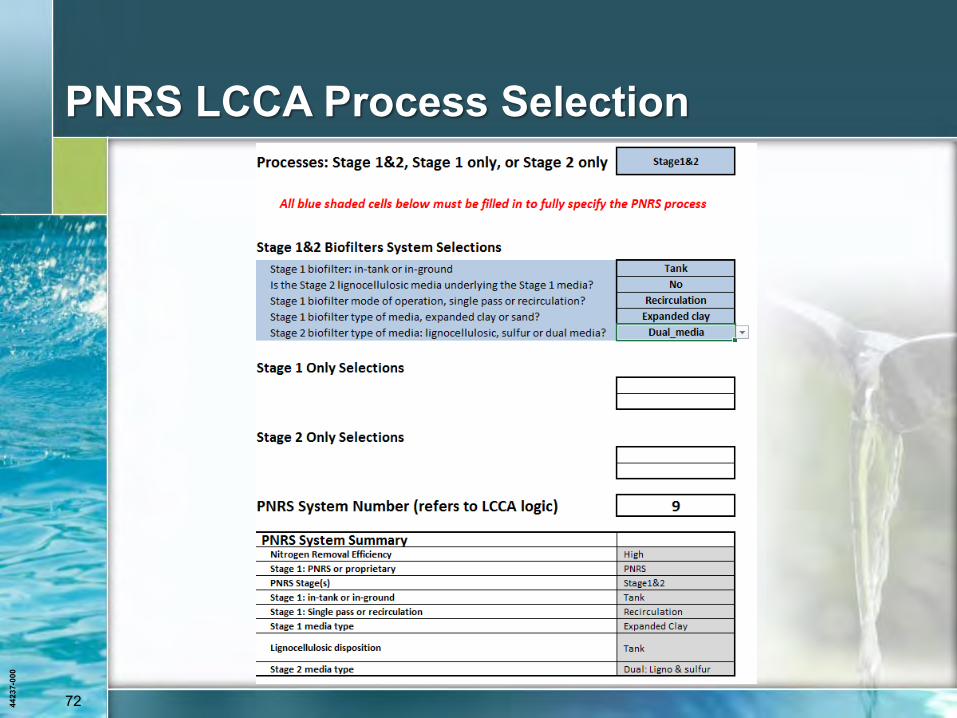
PNRS LCCA Process Selection
4423
7-00
0
73
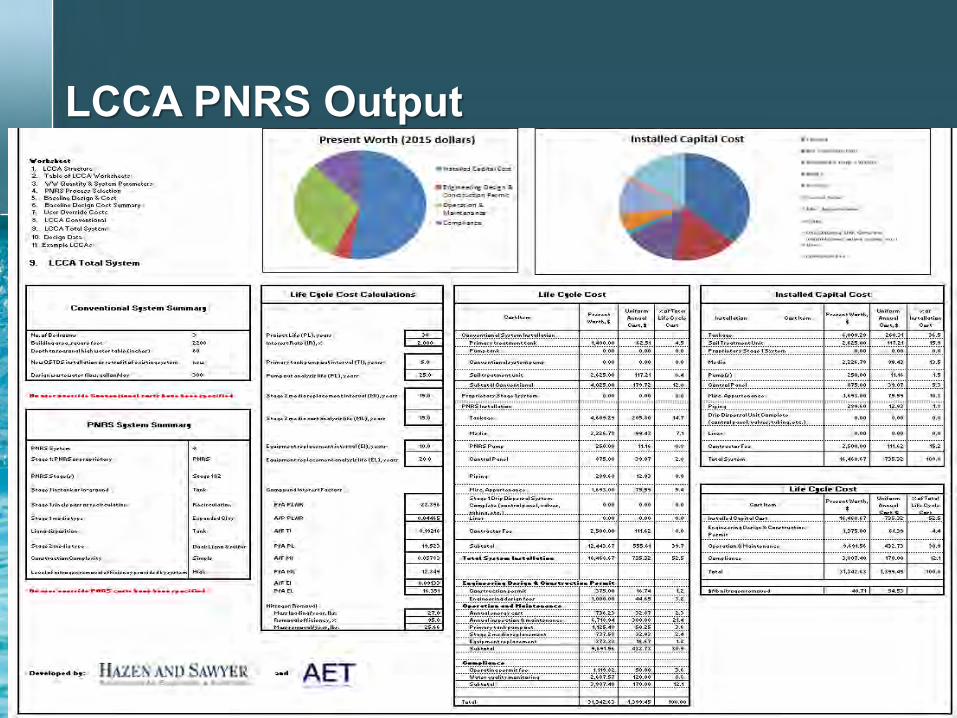
LCCA PNRS Output
4423
7-00
0
74
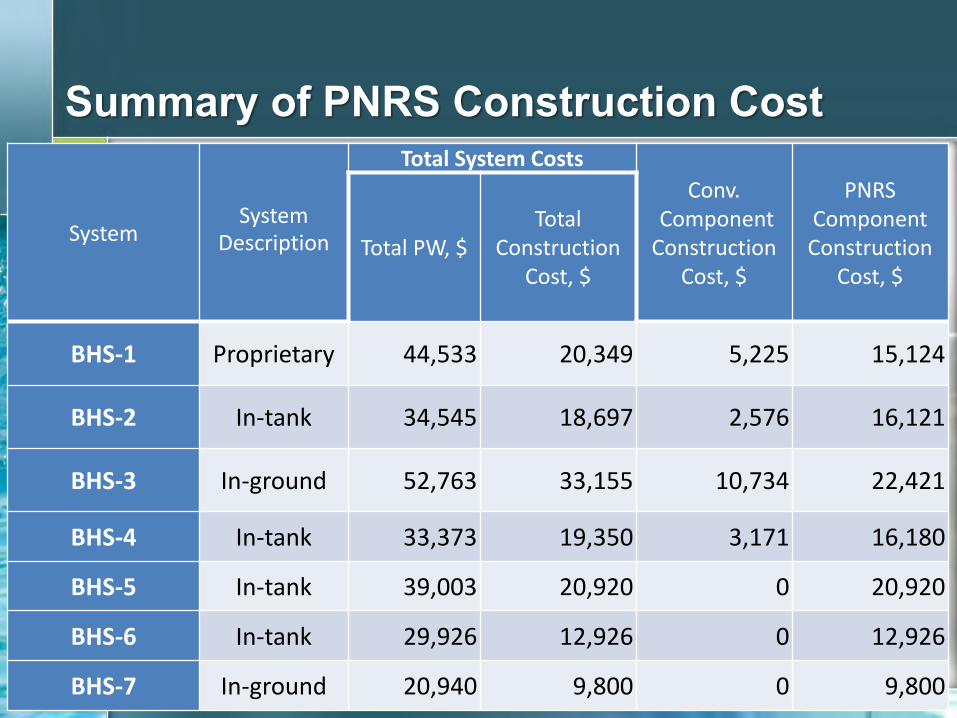
Summary of PNRS Construction Cost
System System
Description
Total System Costs Conv.
Component Construction
Cost, $
PNRS Component Construction
Cost, $ Total PW, $
Total Construction
Cost, $
BHS-1 Proprietary 44,533 20,349 5,225 15,124
BHS-2 In-tank 34,545 18,697 2,576 16,121
BHS-3 In-ground 52,763 33,155 10,734 22,421
BHS-4 In-tank 33,373 19,350 3,171 16,180
BHS-5 In-tank 39,003 20,920 0 20,920
BHS-6 In-tank 29,926 12,926 0 12,926
BHS-7 In-ground 20,940 9,800 0 9,800
4423
7-00
0
75
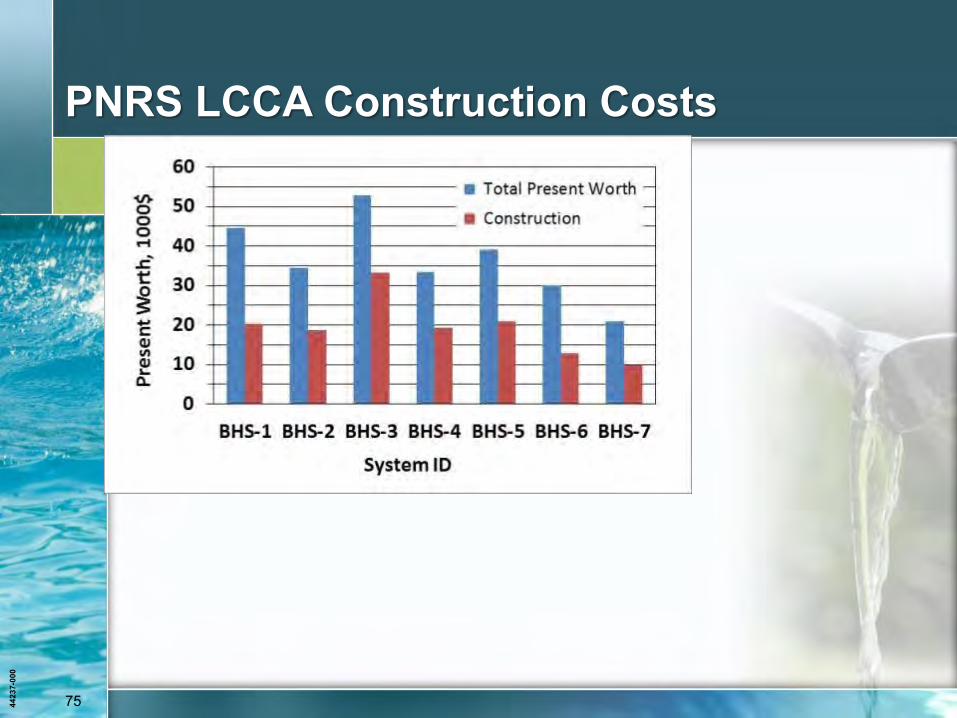
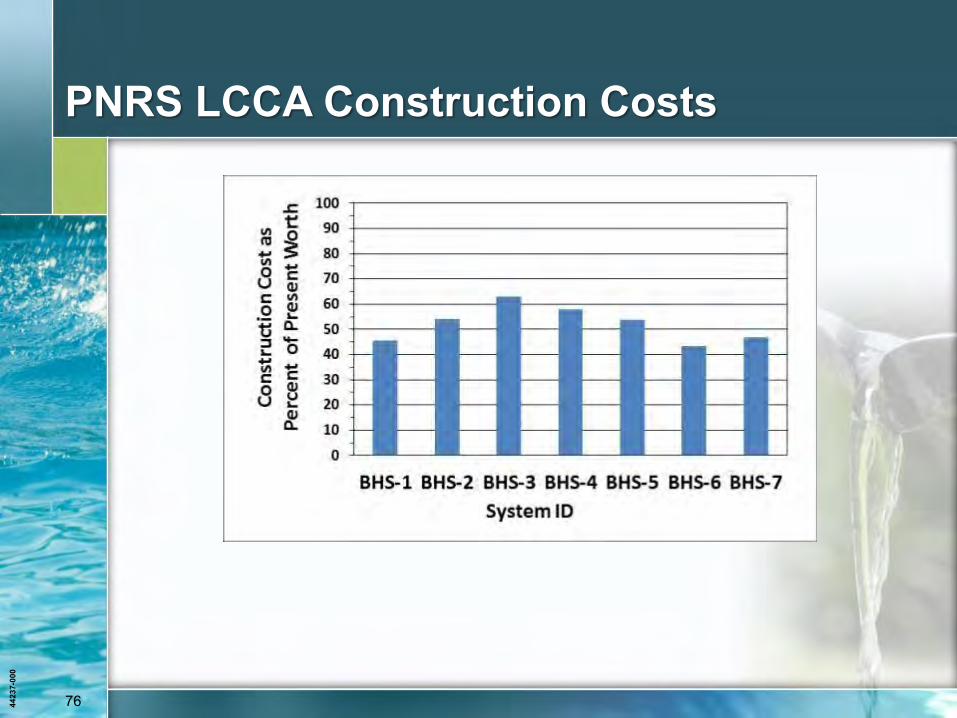
PNRS LCCA Construction Costs
4423
7-00
0
76
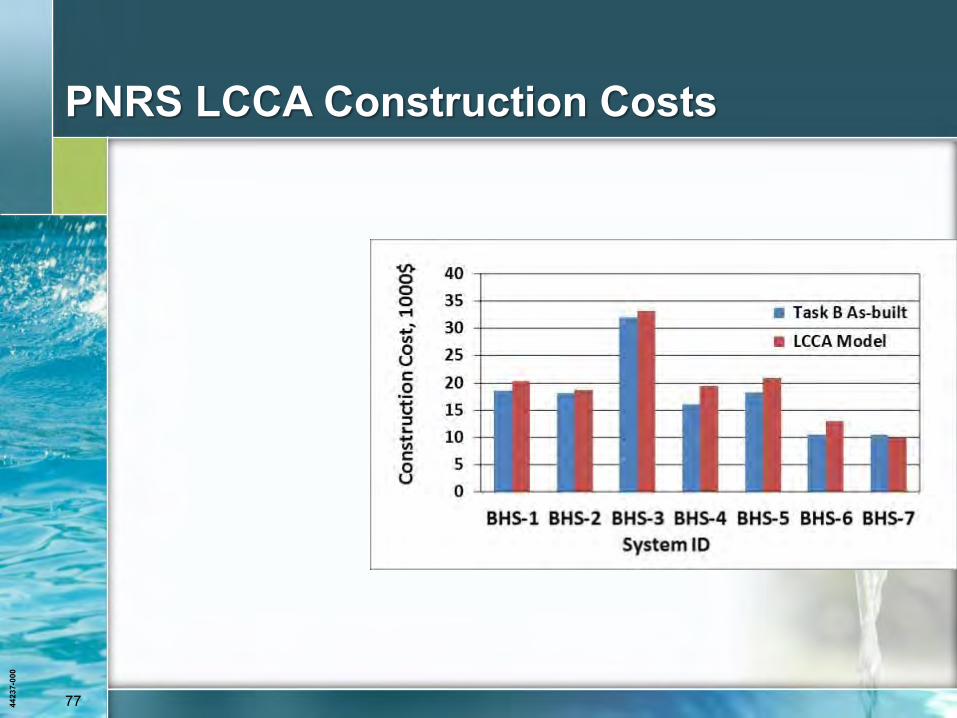
PNRS LCCA Construction Costs
4423
7-00
0
77
PNRS LCCA Construction Costs
4423
7-00
0
78
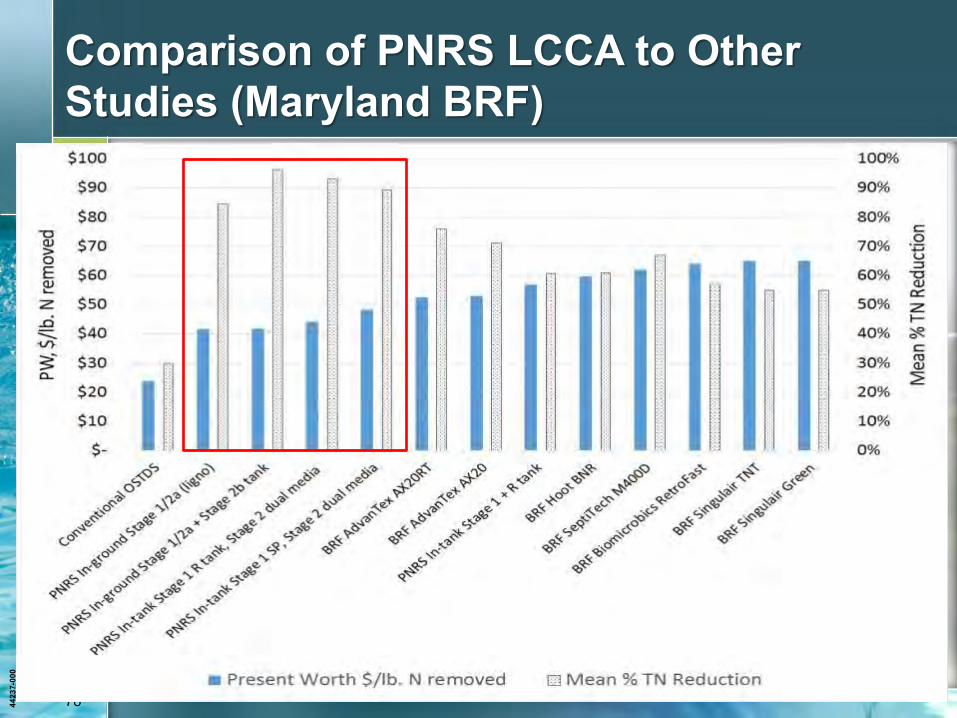
Comparison of PNRS LCCA to Other Studies (Maryland BRF)
4423
7-00
0
79
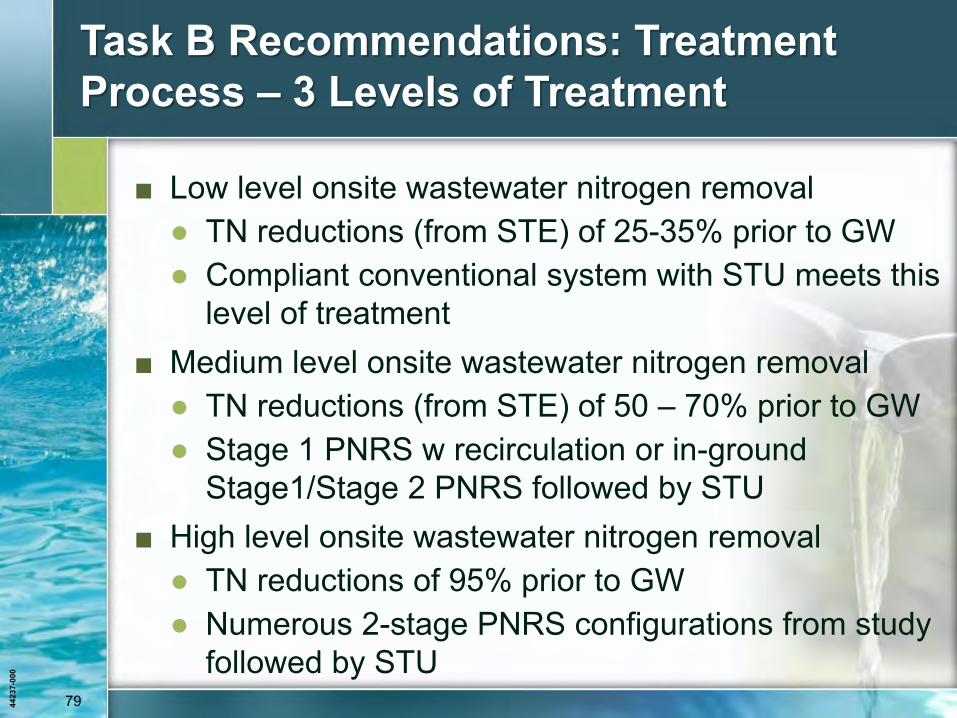
Task B Recommendations: Treatment Process – 3 Levels of Treatment
■ Low level onsite wastewater nitrogen removal ● TN reductions (from STE) of 25-35% prior to GW ● Compliant conventional system with STU meets this
level of treatment ■ Medium level onsite wastewater nitrogen removal
● TN reductions (from STE) of 50 – 70% prior to GW ● Stage 1 PNRS w recirculation or in-ground
Stage1/Stage 2 PNRS followed by STU ■ High level onsite wastewater nitrogen removal
● TN reductions of 95% prior to GW ● Numerous 2-stage PNRS configurations from study
followed by STU
4423
7-00
0
80
Task B Recommendations: Technical Recommendations
■ Long term monitoring of PNRS is needed to evaluate reliability and life
■ PNRS specific tanks, equipment, media, appurtenances are needed prior to widespread implementation
■ Detailed design criteria and designs should be developed for several standardized PNRS
■ PNRS specifications should be established for all materials and methods ● Tanks, lids & covers, liners, media, pipe, controls,
process controls, operations
4423
7-00
0
81
Recommendations: PNRS Implementation
■ Establish uniform guidance for PNRS regulation and permitting, streamline permitting requirements.
■ Establish uniform requirements for PNRS inspection, operation and maintenance
■ Establish uniform requirements for PNRS performance monitoring
■ Implement technology transfer and training on PNRS implementation
■ Establish sufficient FDOH staffing for PNRS implementation, including wastewater engineering staff
4423
7-00
0
82 82 4423
7-00
0
Task C: Soil and Groundwater
Monitoring

4423
7-00
0
83
Task C Components
■ Literature review to evaluate nitrogen fate and transport in saturated and unsaturated soils
■ Developed the soil and groundwater (S&GW) research test facility
■ Conducted soil and groundwater monitoring at test facility
■ Conducted 3 tracer tests at the S&GW test facility ■ Groundwater monitoring at 4 single family residences

4423
7-00
0
84
Soil and Groundwater Test Facility: N transport studies
NOx plumes at ~ 400 days
4423
7-00
0
85
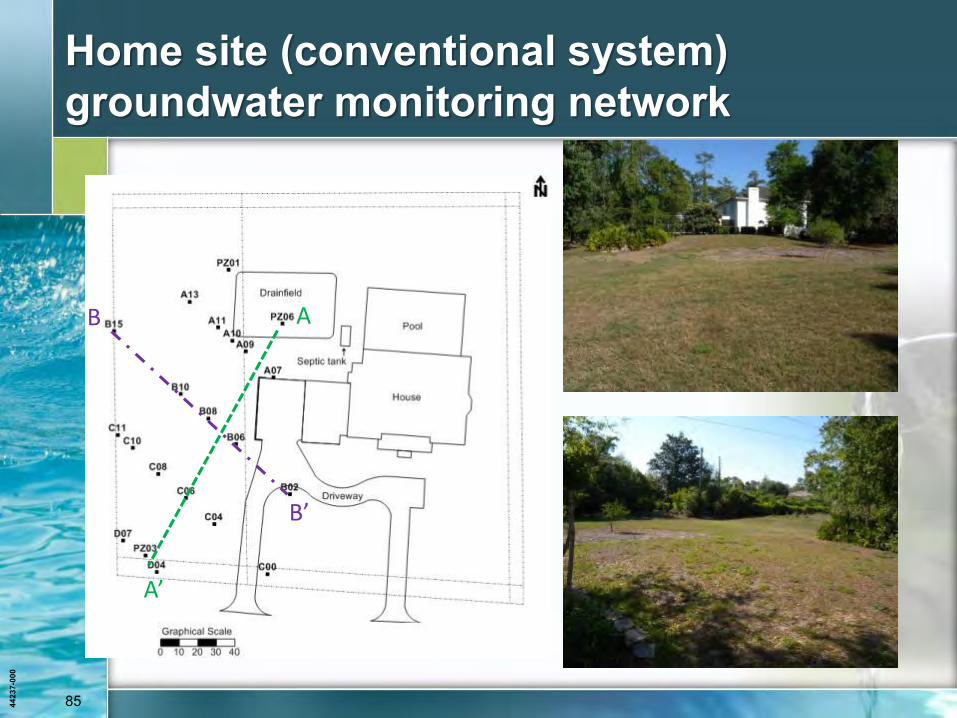
Home site (conventional system) groundwater monitoring network
B
B’
A
A’
4423
7-00
0
86
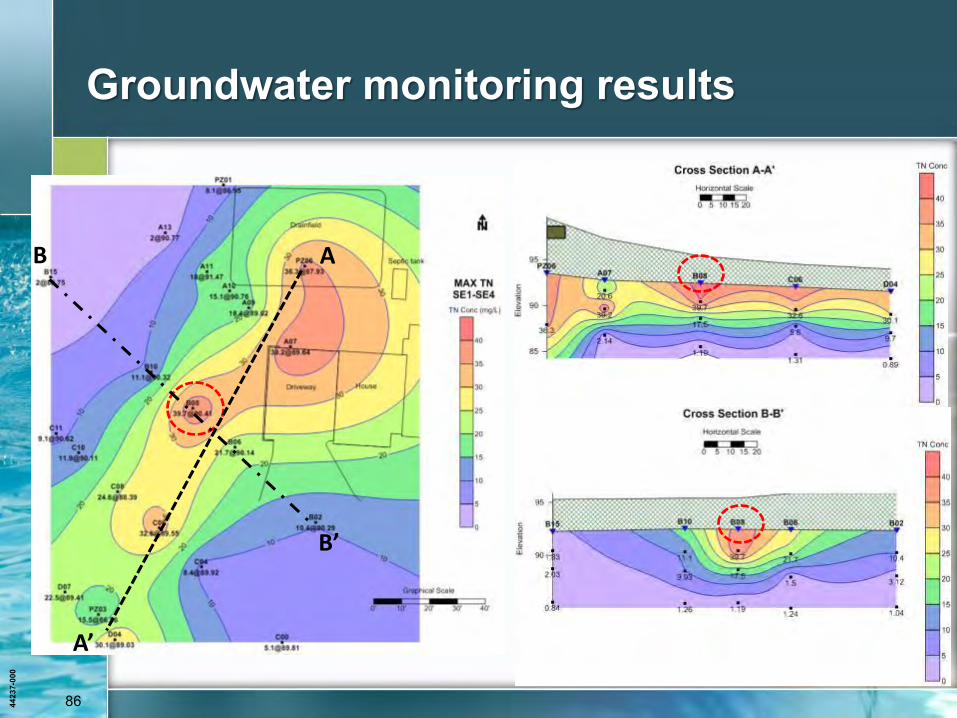
Groundwater monitoring results
B
B’
A
A’
4423
7-00
0
87
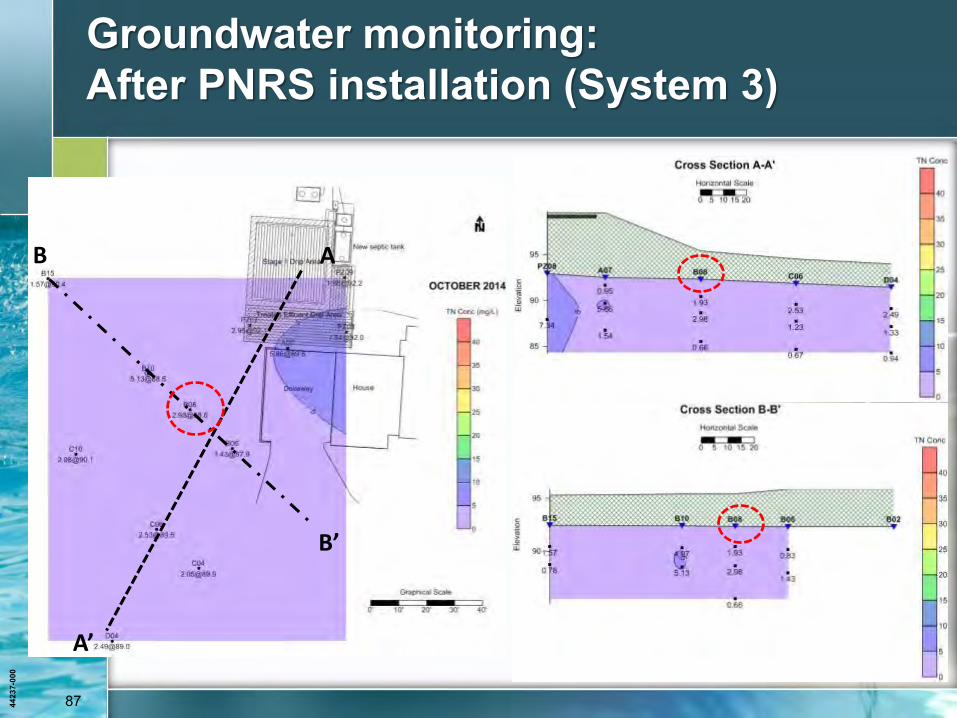
Groundwater monitoring: After PNRS installation (System 3)
B
B’
A
A’
4423
7-00
0
88
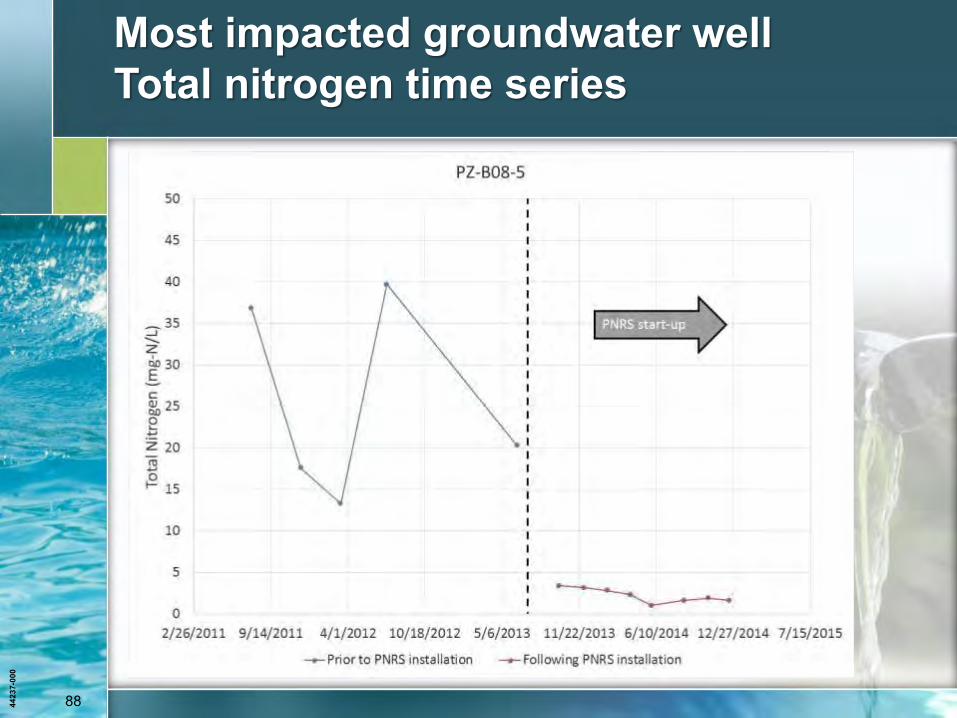
Most impacted groundwater well Total nitrogen time series
4423
7-00
0
89 89 4423
7-00
0
Task D: Nitrogen Fate and
Transport Modeling and Tool Development
4423
7-00
0
90
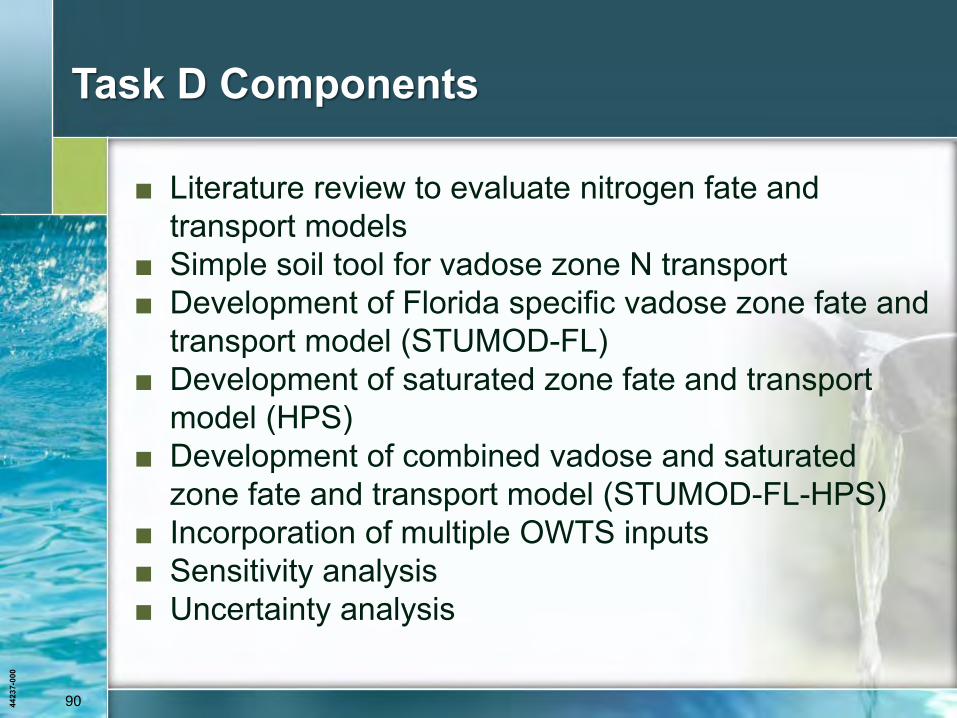
Task D Components
■ Literature review to evaluate nitrogen fate and transport models
■ Simple soil tool for vadose zone N transport ■ Development of Florida specific vadose zone fate and
transport model (STUMOD-FL) ■ Development of saturated zone fate and transport
model (HPS) ■ Development of combined vadose and saturated
zone fate and transport model (STUMOD-FL-HPS) ■ Incorporation of multiple OWTS inputs ■ Sensitivity analysis ■ Uncertainty analysis
4423
7-00
0
91
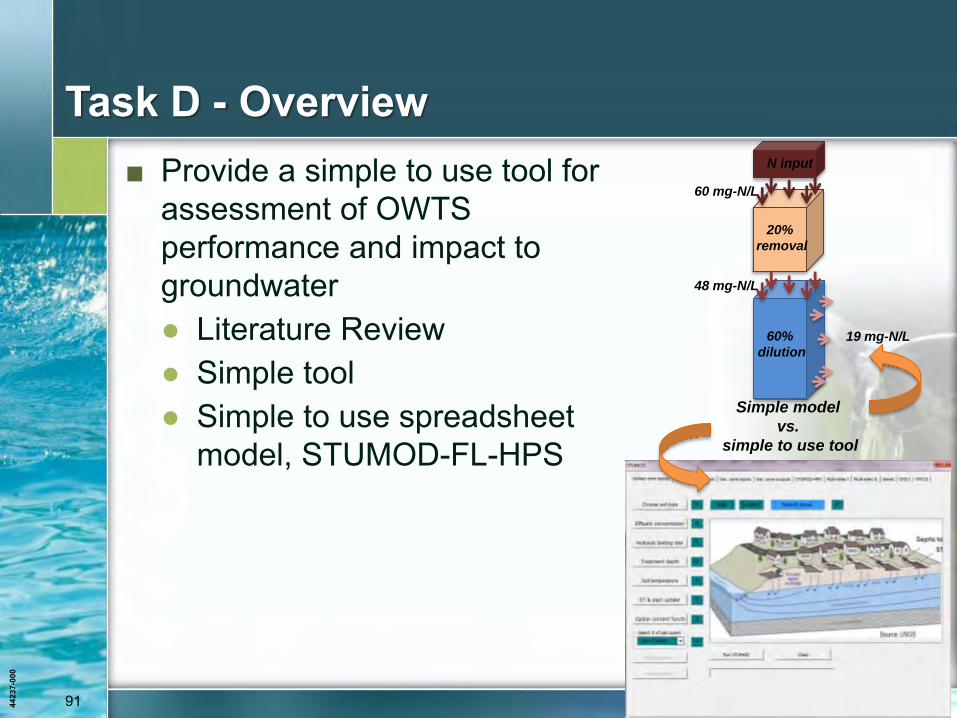
Task D - Overview ■ Provide a simple to use tool for
assessment of OWTS performance and impact to groundwater ● Literature Review ● Simple tool ● Simple to use spreadsheet
model, STUMOD-FL-HPS
20%
removal
N input
60 mg-N/L
48 mg-N/L
60%
dilution
19 mg-N/L
Simple model
vs.
simple to use tool
4423
7-00
0
92
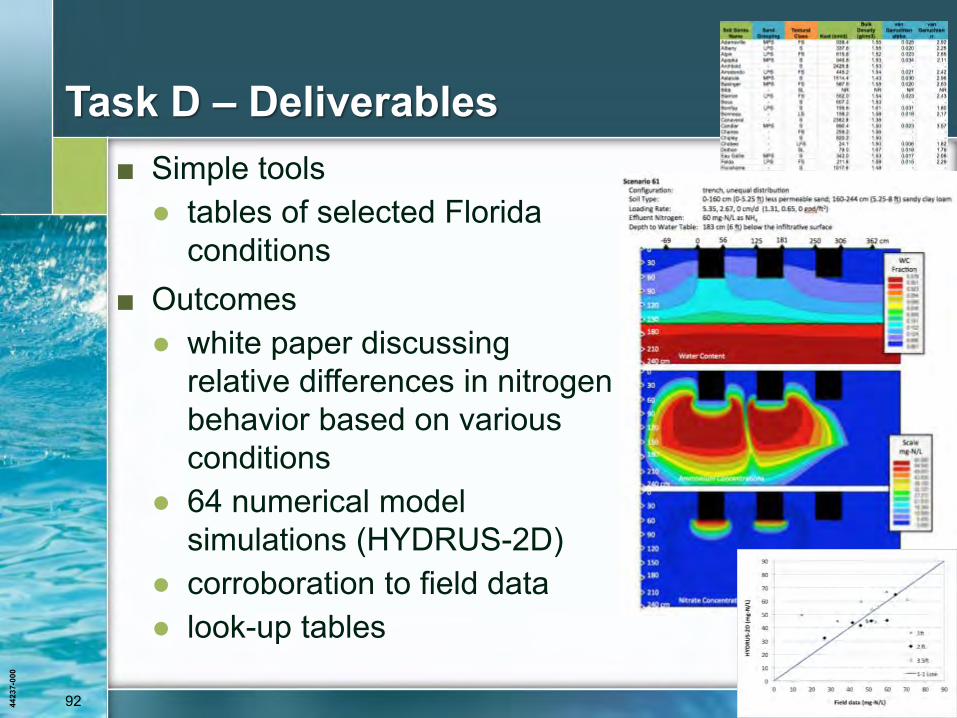
Task D – Deliverables ■ Simple tools
● tables of selected Florida conditions
■ Outcomes ● white paper discussing
relative differences in nitrogen behavior based on various conditions
● 64 numerical model simulations (HYDRUS-2D)
● corroboration to field data ● look-up tables
4423
7-00
0
93
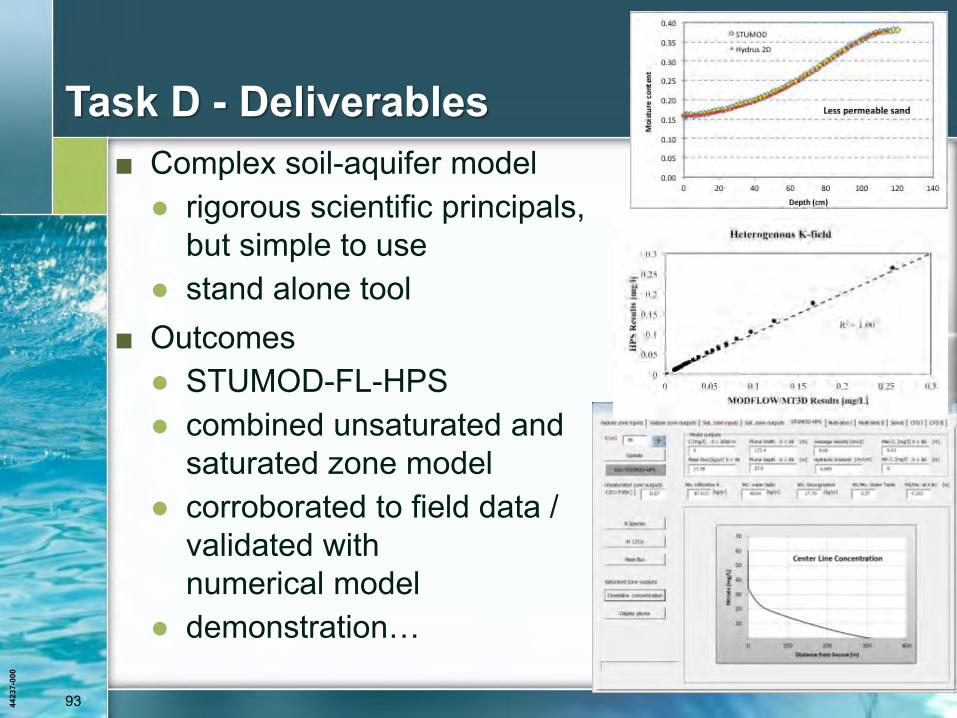
Task D - Deliverables ■ Complex soil-aquifer model
● rigorous scientific principals, but simple to use
● stand alone tool ■ Outcomes
● STUMOD-FL-HPS ● combined unsaturated and
saturated zone model ● corroborated to field data /
validated with numerical model
● demonstration…

4423
7-00
0
94 94 4423
7-00
0
Summary & Questions
4423
7-00
0
95
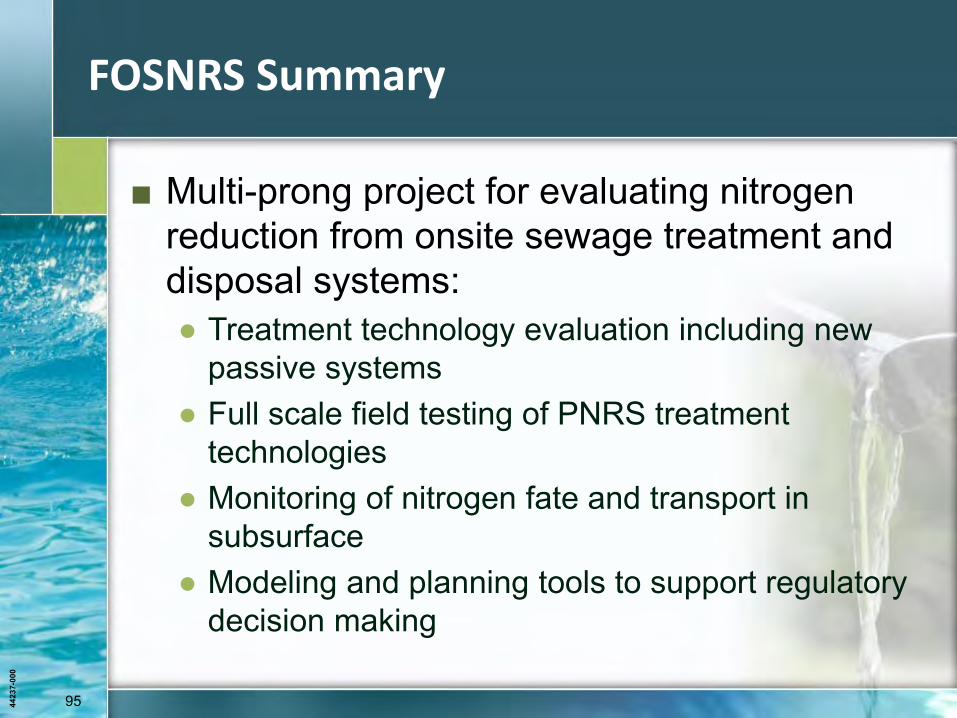
FOSNRS Summary
■ Multi-prong project for evaluating nitrogen reduction from onsite sewage treatment and disposal systems: ● Treatment technology evaluation including new
passive systems ● Full scale field testing of PNRS treatment
technologies ● Monitoring of nitrogen fate and transport in
subsurface ● Modeling and planning tools to support regulatory
decision making
4423
7-00
0
96
FOSNRS Summary (cont)
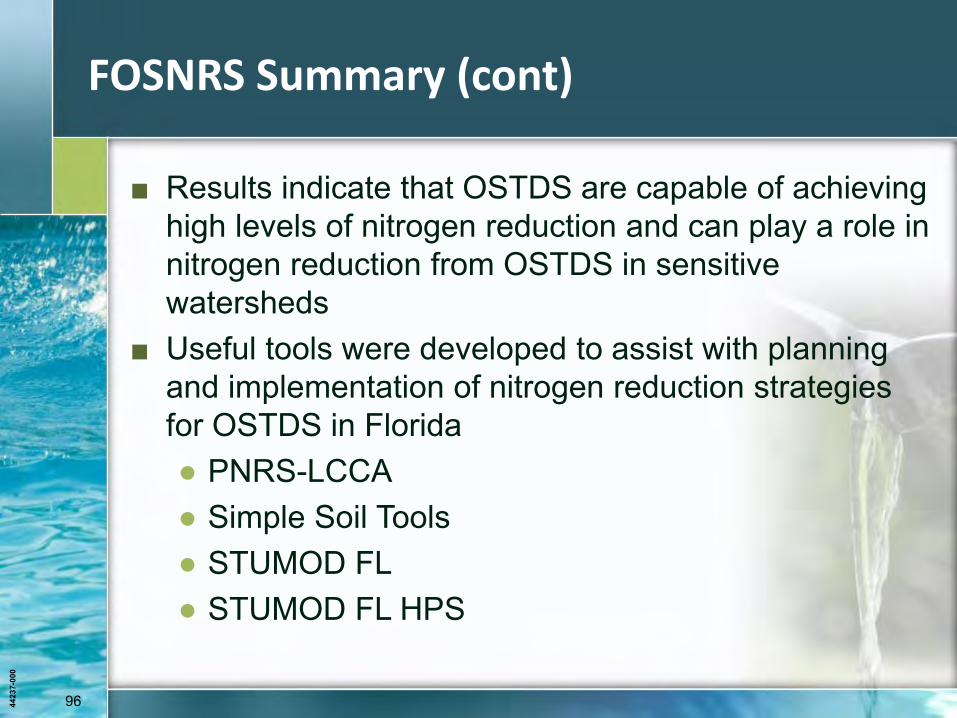
■ Results indicate that OSTDS are capable of achieving high levels of nitrogen reduction and can play a role in nitrogen reduction from OSTDS in sensitive watersheds
■ Useful tools were developed to assist with planning and implementation of nitrogen reduction strategies for OSTDS in Florida ● PNRS-LCCA ● Simple Soil Tools ● STUMOD FL ● STUMOD FL HPS
4423
7-00
0
97
What’s left to do?
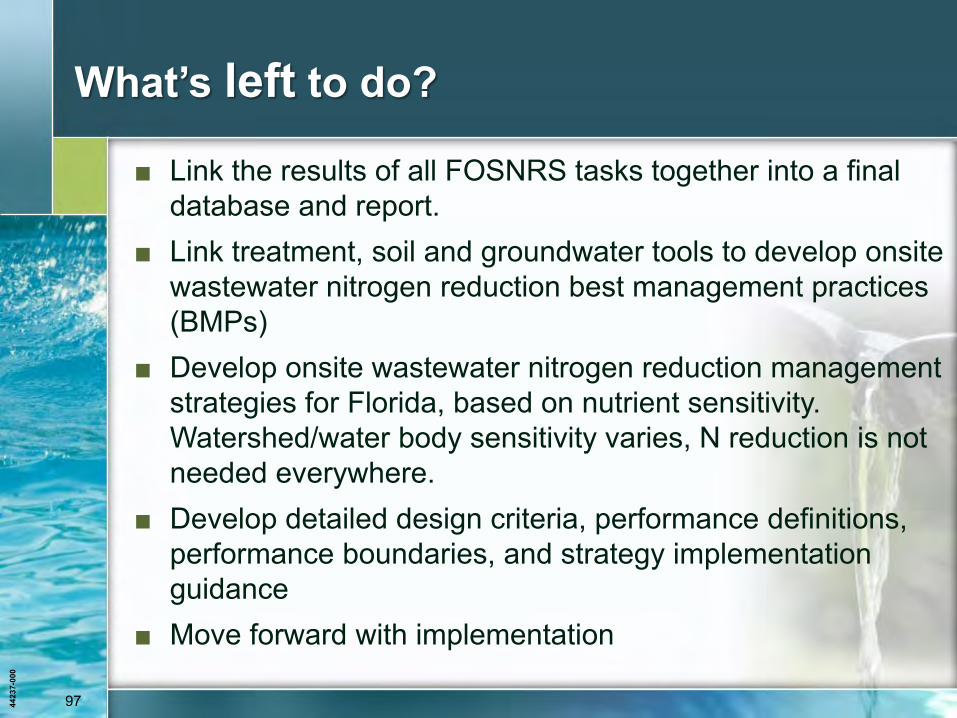
■ Link the results of all FOSNRS tasks together into a final database and report.
■ Link treatment, soil and groundwater tools to develop onsite wastewater nitrogen reduction best management practices (BMPs)
■ Develop onsite wastewater nitrogen reduction management strategies for Florida, based on nutrient sensitivity. Watershed/water body sensitivity varies, N reduction is not needed everywhere.
■ Develop detailed design criteria, performance definitions, performance boundaries, and strategy implementation guidance
■ Move forward with implementation

4423
7-00
0
98 98 4423
7-00
0
QUESTIONS ?
Damann L. Anderson, P.E., Vice President Josefin E. Hirst, P.E., Senior Principal Engineer Hazen and Sawyer Phone: 813-630-4498 e-mail: [email protected] [email protected]
4423
7-00
0
99
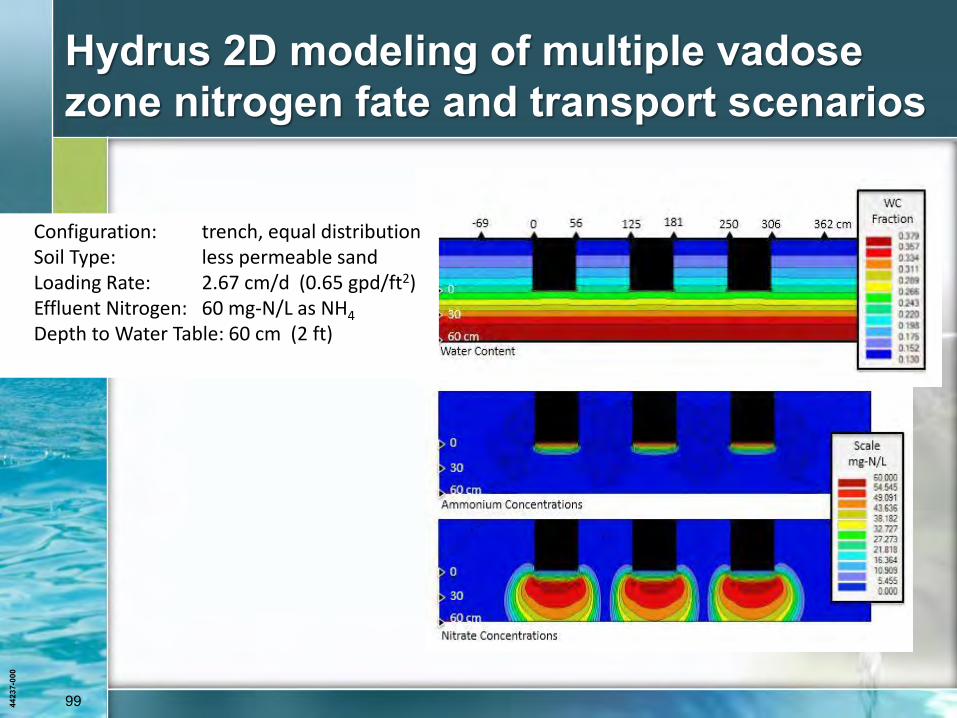
Hydrus 2D modeling of multiple vadose zone nitrogen fate and transport scenarios
Configuration: trench, equal distribution Soil Type: less permeable sand Loading Rate: 2.67 cm/d (0.65 gpd/ft2) Effluent Nitrogen: 60 mg-N/L as NH4
Depth to Water Table: 60 cm (2 ft)
4423
7-00
0
100
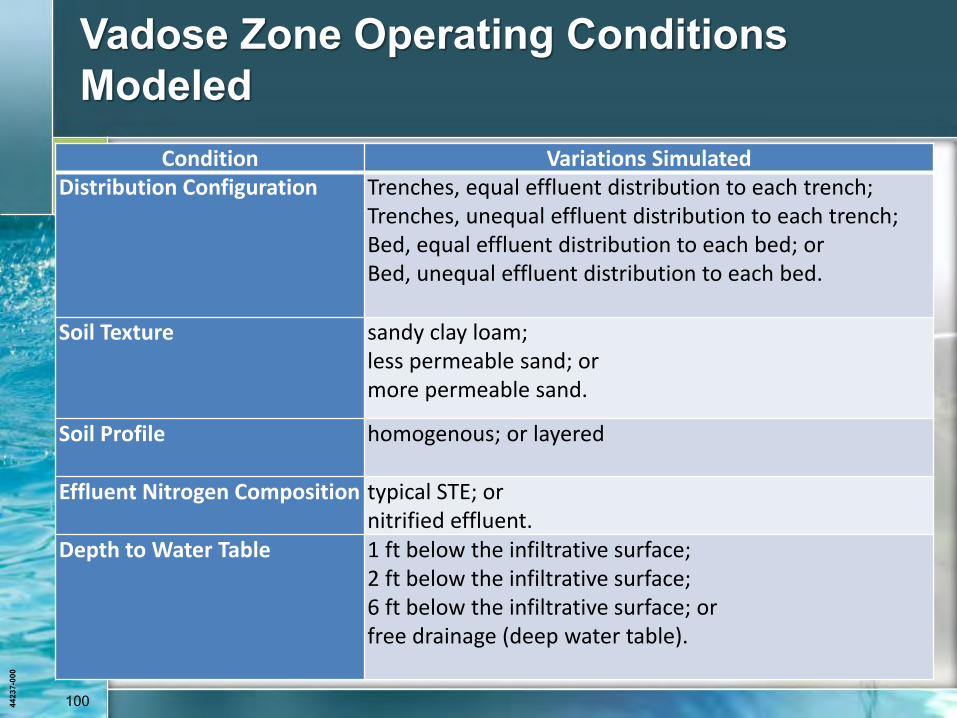
Vadose Zone Operating Conditions Modeled
Condition Variations Simulated Distribution Configuration Trenches, equal effluent distribution to each trench;
Trenches, unequal effluent distribution to each trench; Bed, equal effluent distribution to each bed; or Bed, unequal effluent distribution to each bed.
Soil Texture sandy clay loam; less permeable sand; or more permeable sand.
Soil Profile homogenous; or layered
Effluent Nitrogen Composition typical STE; or nitrified effluent.
Depth to Water Table 1 ft below the infiltrative surface; 2 ft below the infiltrative surface; 6 ft below the infiltrative surface; or free drainage (deep water table).
4423
7-00
0
101
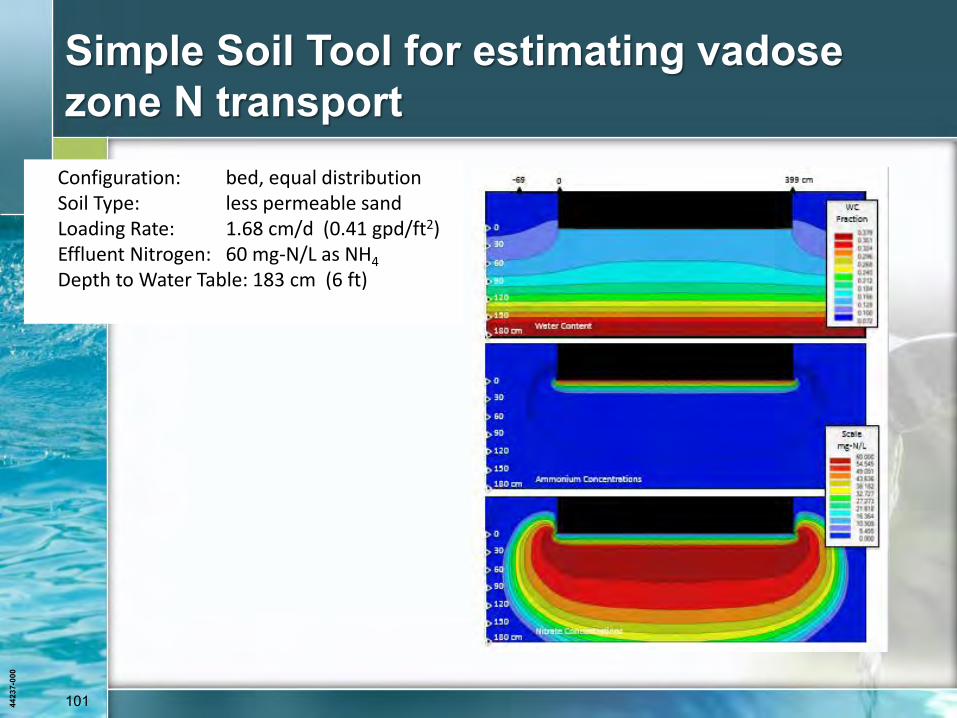
Simple Soil Tool for estimating vadose zone N transport
Configuration: bed, equal distribution Soil Type: less permeable sand Loading Rate: 1.68 cm/d (0.41 gpd/ft2) Effluent Nitrogen: 60 mg-N/L as NH4
Depth to Water Table: 183 cm (6 ft)
4423
7-00
0
102
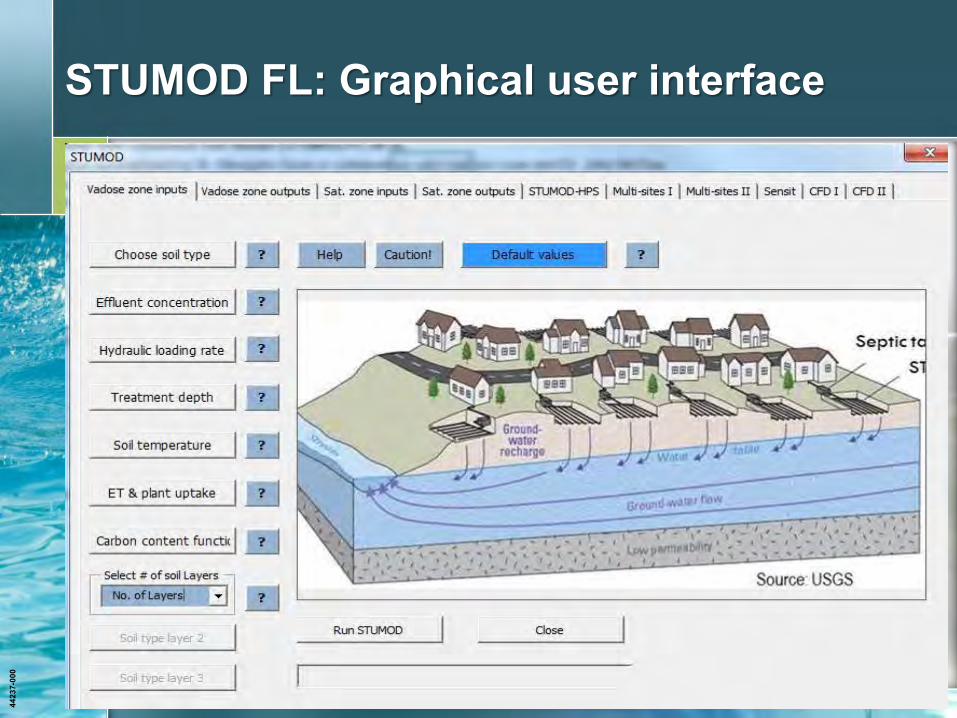
STUMOD FL: Graphical user interface
4423
7-00
0
103
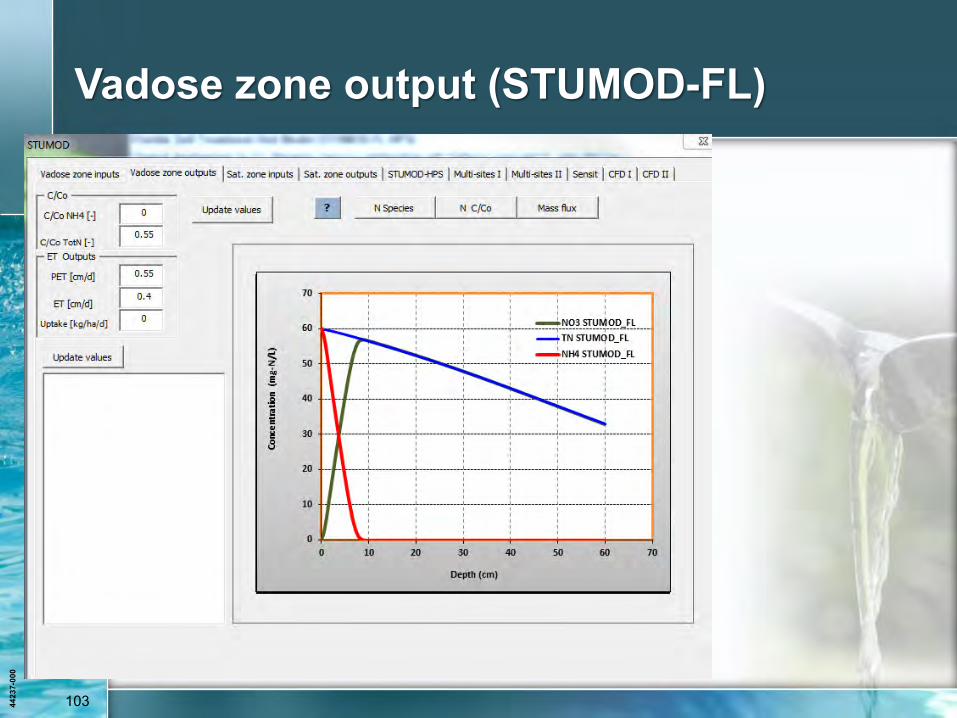
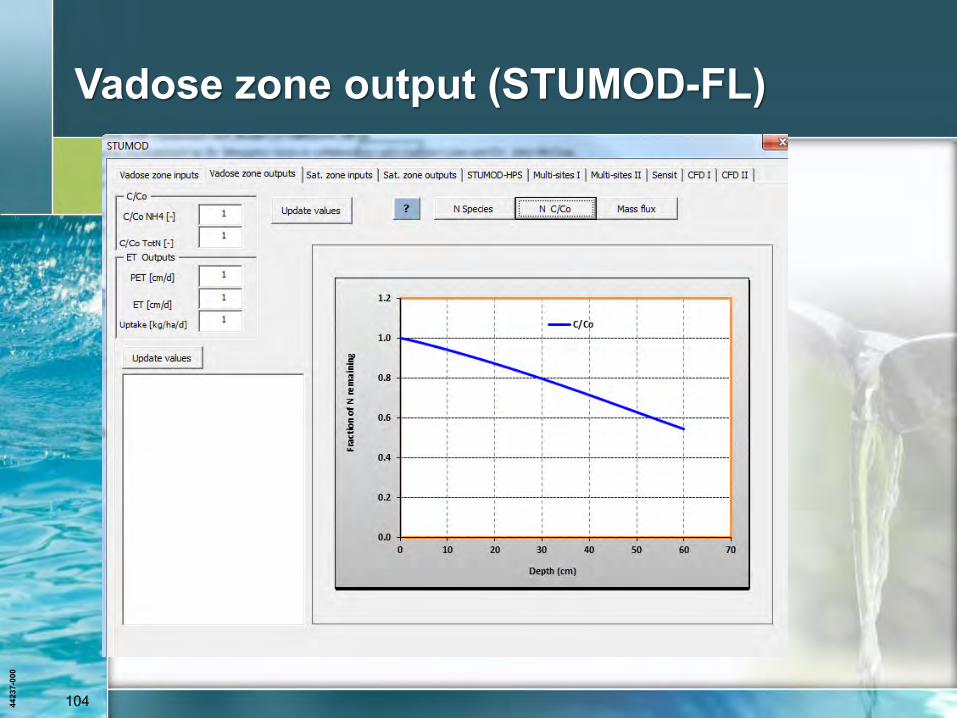
Vadose zone output (STUMOD-FL)
4423
7-00
0
104
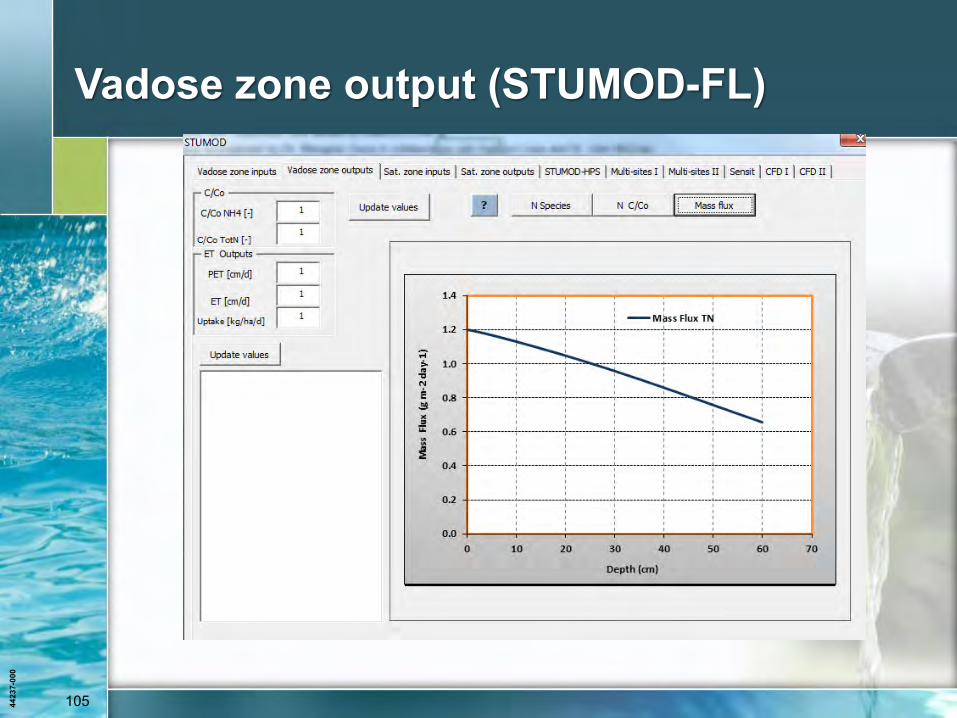
Vadose zone output (STUMOD-FL)
4423
7-00
0
105
Vadose zone output (STUMOD-FL)
4423
7-00
0
106
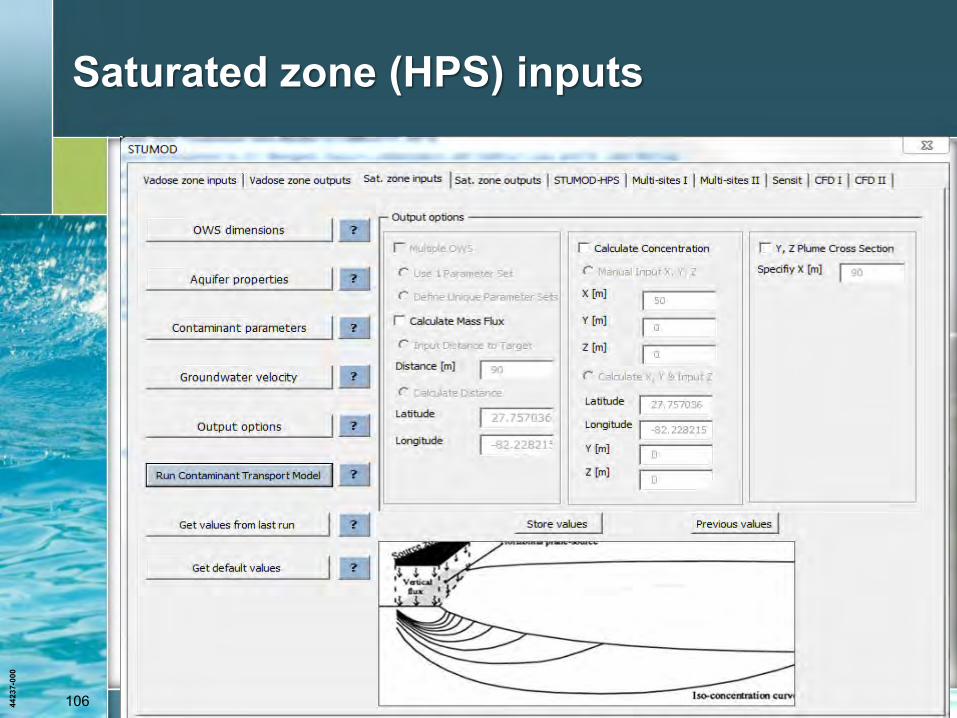
Saturated zone (HPS) inputs
4423
7-00
0
107
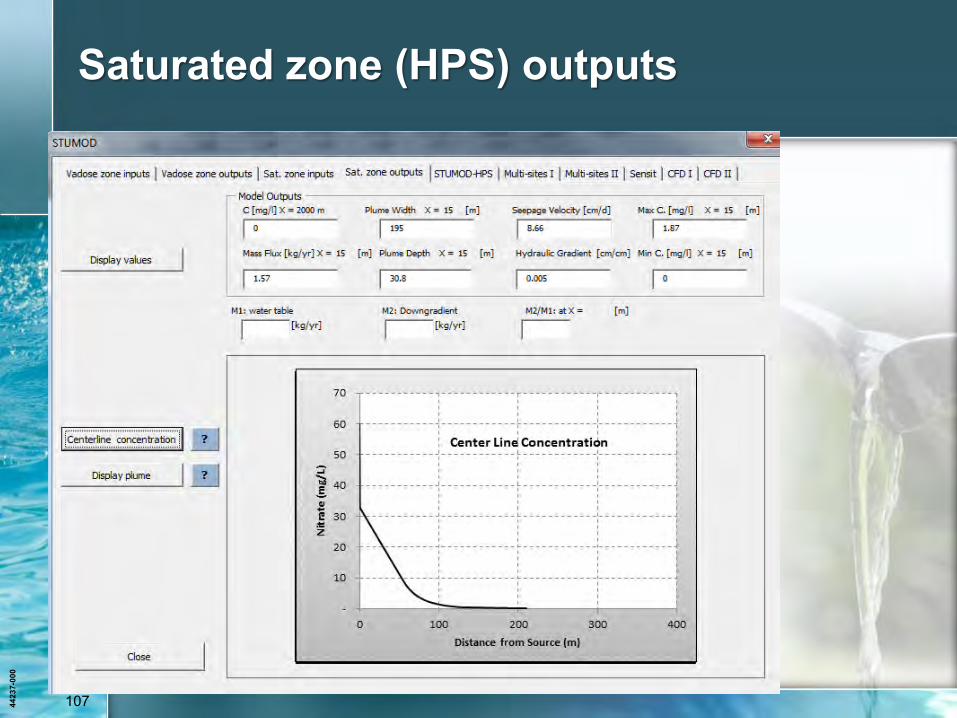
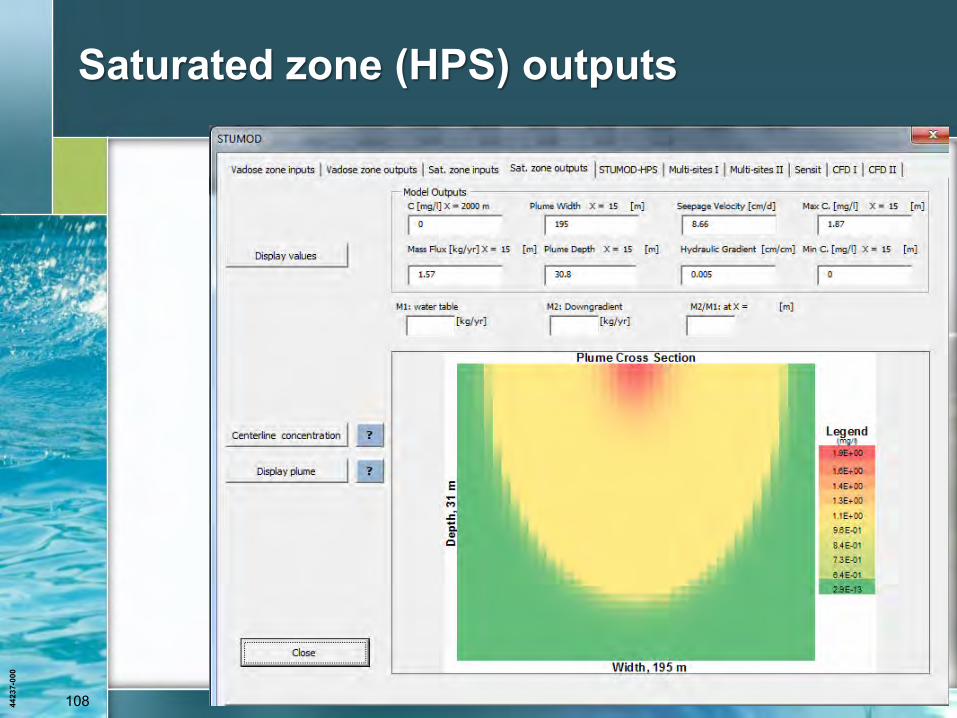
Saturated zone (HPS) outputs
4423
7-00
0
108
Saturated zone (HPS) outputs
Related Documents