Flexural Behaviour and Design of Hollow Flange Steel Beams By Tharmarajah ANAPAYAN Faculty of Environmental and Engineering School of Urban Development Queensland University of Technology A THESIS SUBMITTED TO THE SCHOOL OF URBAN DEVELOPMENT QUEENSLAND UNIVERSITY OF TECHNOLOGY IN PARTIAL FULFILLMENT OF REQUIREMENT FOR THE DEGREE OF DOCTOR OF PHILOSOPHY March 2010

Welcome message from author
This document is posted to help you gain knowledge. Please leave a comment to let me know what you think about it! Share it to your friends and learn new things together.
Transcript
Flexural Behaviour and Design of
Hollow Flange Steel Beams
By
Tharmarajah ANAPAYAN
Faculty of Environmental and Engineering School of Urban Development
Queensland University of Technology
A THESIS SUBMITTED TO THE SCHOOL OF URBAN DEVELOPMENT QUEENSLAND UNIVERSITY OF TECHNOLOGY IN PARTIAL
FULFILLMENT OF REQUIREMENT FOR THE DEGREE OF DOCTOR OF PHILOSOPHY
March 2010

Keywords
iii
KEYWORDS
LiteSteel beams, Hollow flange beams, Hollow flange steel beams, Lateral
distortional buckling, Lateral buckling tests, Section moment capacity tests, inelastic
reserve bending moments, Finite element analyses (FEA), Cold-formed steel
structures, Flexural members, Web stiffeners, Transverse web stiffeners.
Keywords
iv
Abstract
v
ABSTRACT
The LiteSteel Beam (LSB) is a new hollow flange channel section developed by
OneSteel Australian Tube Mills using a patented Dual Electric Resistance Welding
technique. The LSB has a unique geometry consisting of torsionally rigid rectangular
hollow flanges and a relatively slender web. It is commonly used as rafters, floor
joists and bearers and roof beams in residential, industrial and commercial buildings.
It is on average 40% lighter than traditional hot-rolled steel beams of equivalent
performance. The LSB flexural members are subjected to a relatively new Lateral
Distortional Buckling mode, which reduces the member moment capacity. Unlike the
commonly observed lateral torsional buckling of steel beams, lateral distortional
buckling of LSBs is characterised by simultaneous lateral deflection, twist and web
distortion.
Current member moment capacity design rules for lateral distortional buckling in
AS/NZS 4600 (SA, 2005) do not include the effect of section geometry of hollow
flange beams although its effect is considered to be important. Therefore detailed
experimental and finite element analyses (FEA) were carried out to investigate the
lateral distortional buckling behaviour of LSBs including the effect of section
geometry. The results showed that the current design rules in AS/NZS 4600 (SA,
2005) are over-conservative in the inelastic lateral buckling region. New improved
design rules were therefore developed for LSBs based on both FEA and experimental
results. A geometrical parameter (K) defined as the ratio of the flange torsional
rigidity to the major axis flexural rigidity of the web (GJf/EIxweb) was identified as
the critical parameter affecting the lateral distortional buckling of hollow flange
beams. The effect of section geometry was then included in the new design rules
using the new parameter (K). The new design rule developed by including this
parameter was found to be accurate in calculating the member moment capacities of
not only LSBs, but also other types of hollow flange steel beams such as Hollow
Flange Beams (HFBs), Monosymmetric Hollow Flange Beams (MHFBs) and
Rectangular Hollow Flange Beams (RHFBs).
The inelastic reserve bending capacity of LSBs has not been investigated yet
although the section moment capacity tests of LSBs in the past revealed that inelastic
reserve bending capacity is present in LSBs. However, the Australian and American
Abstract
vi
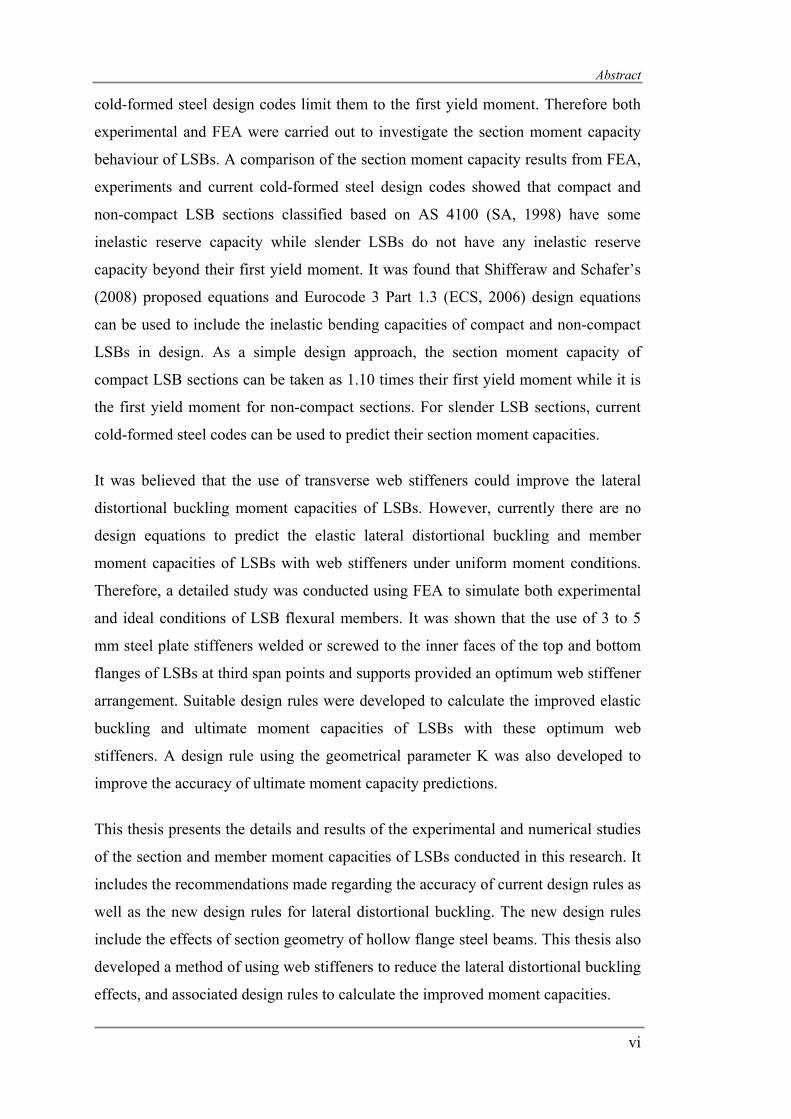
cold-formed steel design codes limit them to the first yield moment. Therefore both
experimental and FEA were carried out to investigate the section moment capacity
behaviour of LSBs. A comparison of the section moment capacity results from FEA,
experiments and current cold-formed steel design codes showed that compact and
non-compact LSB sections classified based on AS 4100 (SA, 1998) have some
inelastic reserve capacity while slender LSBs do not have any inelastic reserve
capacity beyond their first yield moment. It was found that Shifferaw and Schafer’s
(2008) proposed equations and Eurocode 3 Part 1.3 (ECS, 2006) design equations
can be used to include the inelastic bending capacities of compact and non-compact
LSBs in design. As a simple design approach, the section moment capacity of
compact LSB sections can be taken as 1.10 times their first yield moment while it is
the first yield moment for non-compact sections. For slender LSB sections, current
cold-formed steel codes can be used to predict their section moment capacities.
It was believed that the use of transverse web stiffeners could improve the lateral
distortional buckling moment capacities of LSBs. However, currently there are no
design equations to predict the elastic lateral distortional buckling and member
moment capacities of LSBs with web stiffeners under uniform moment conditions.
Therefore, a detailed study was conducted using FEA to simulate both experimental
and ideal conditions of LSB flexural members. It was shown that the use of 3 to 5
mm steel plate stiffeners welded or screwed to the inner faces of the top and bottom
flanges of LSBs at third span points and supports provided an optimum web stiffener
arrangement. Suitable design rules were developed to calculate the improved elastic
buckling and ultimate moment capacities of LSBs with these optimum web
stiffeners. A design rule using the geometrical parameter K was also developed to
improve the accuracy of ultimate moment capacity predictions.
This thesis presents the details and results of the experimental and numerical studies
of the section and member moment capacities of LSBs conducted in this research. It
includes the recommendations made regarding the accuracy of current design rules as
well as the new design rules for lateral distortional buckling. The new design rules
include the effects of section geometry of hollow flange steel beams. This thesis also
developed a method of using web stiffeners to reduce the lateral distortional buckling
effects, and associated design rules to calculate the improved moment capacities.
Publications
vii
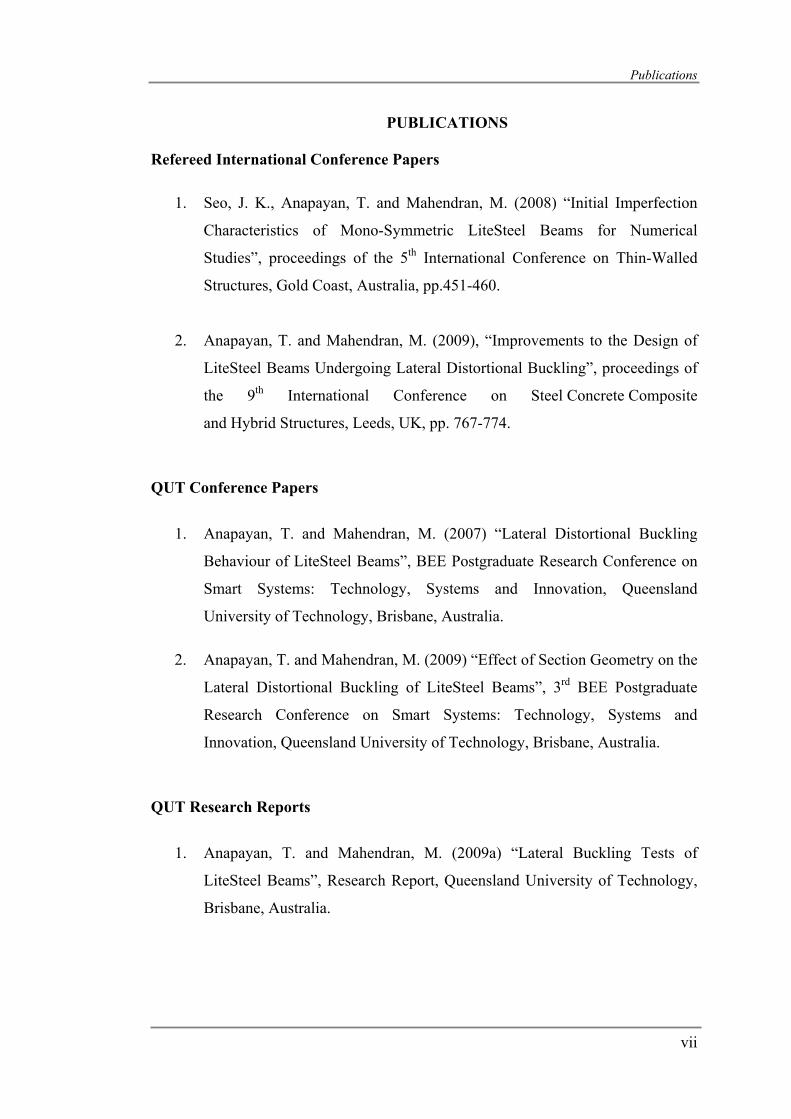
PUBLICATIONS
Refereed International Conference Papers
1. Seo, J. K., Anapayan, T. and Mahendran, M. (2008) “Initial Imperfection
Characteristics of Mono-Symmetric LiteSteel Beams for Numerical
Studies”, proceedings of the 5th International Conference on Thin-Walled
Structures, Gold Coast, Australia, pp.451-460.
2. Anapayan, T. and Mahendran, M. (2009), “Improvements to the Design of
LiteSteel Beams Undergoing Lateral Distortional Buckling”, proceedings of
the 9th International Conference on Steel Concrete Composite
and Hybrid Structures, Leeds, UK, pp. 767-774.
QUT Conference Papers
1. Anapayan, T. and Mahendran, M. (2007) “Lateral Distortional Buckling
Behaviour of LiteSteel Beams”, BEE Postgraduate Research Conference on
Smart Systems: Technology, Systems and Innovation, Queensland
University of Technology, Brisbane, Australia.
2. Anapayan, T. and Mahendran, M. (2009) “Effect of Section Geometry on the
Lateral Distortional Buckling of LiteSteel Beams”, 3rd BEE Postgraduate
Research Conference on Smart Systems: Technology, Systems and
Innovation, Queensland University of Technology, Brisbane, Australia.
QUT Research Reports
1. Anapayan, T. and Mahendran, M. (2009a) “Lateral Buckling Tests of
LiteSteel Beams”, Research Report, Queensland University of Technology,
Brisbane, Australia.
Publications
viii
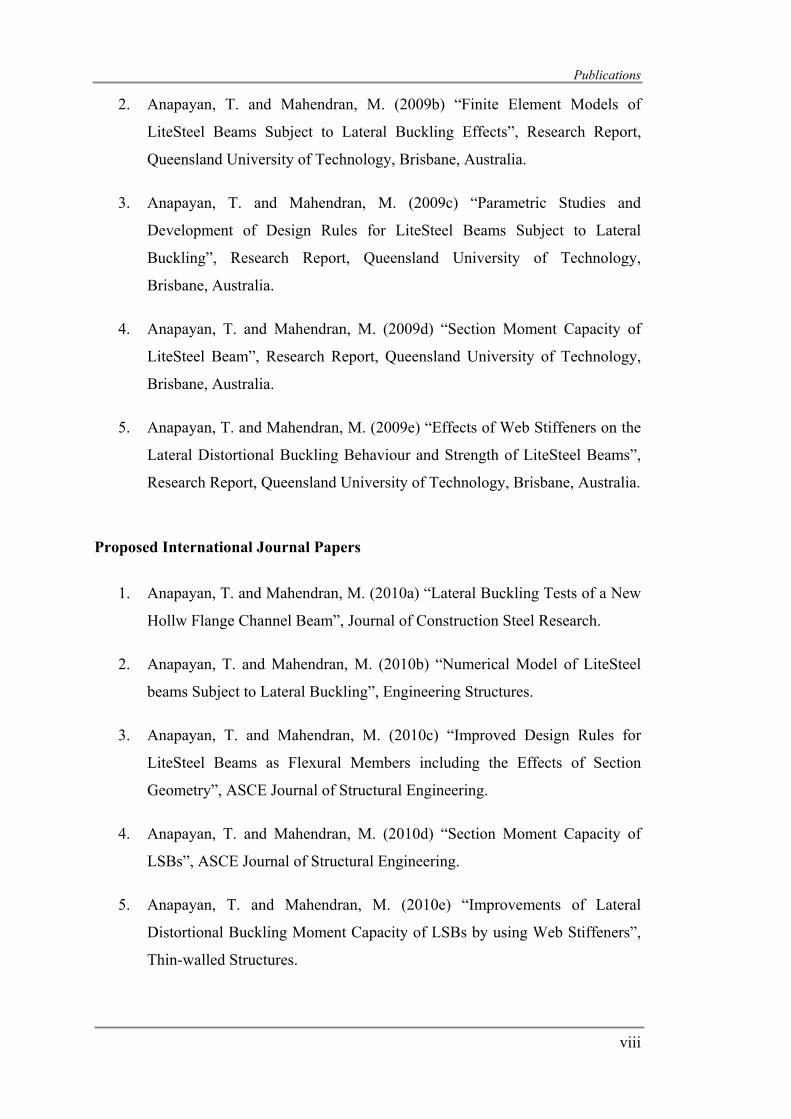
2. Anapayan, T. and Mahendran, M. (2009b) “Finite Element Models of
LiteSteel Beams Subject to Lateral Buckling Effects”, Research Report,
Queensland University of Technology, Brisbane, Australia.
3. Anapayan, T. and Mahendran, M. (2009c) “Parametric Studies and
Development of Design Rules for LiteSteel Beams Subject to Lateral
Buckling”, Research Report, Queensland University of Technology,
Brisbane, Australia.
4. Anapayan, T. and Mahendran, M. (2009d) “Section Moment Capacity of
LiteSteel Beam”, Research Report, Queensland University of Technology,
Brisbane, Australia.
5. Anapayan, T. and Mahendran, M. (2009e) “Effects of Web Stiffeners on the
Lateral Distortional Buckling Behaviour and Strength of LiteSteel Beams”,
Research Report, Queensland University of Technology, Brisbane, Australia.
Proposed International Journal Papers
1. Anapayan, T. and Mahendran, M. (2010a) “Lateral Buckling Tests of a New
Hollw Flange Channel Beam”, Journal of Construction Steel Research.
2. Anapayan, T. and Mahendran, M. (2010b) “Numerical Model of LiteSteel
beams Subject to Lateral Buckling”, Engineering Structures.
3. Anapayan, T. and Mahendran, M. (2010c) “Improved Design Rules for
LiteSteel Beams as Flexural Members including the Effects of Section
Geometry”, ASCE Journal of Structural Engineering.
4. Anapayan, T. and Mahendran, M. (2010d) “Section Moment Capacity of
LSBs”, ASCE Journal of Structural Engineering.
5. Anapayan, T. and Mahendran, M. (2010e) “Improvements of Lateral
Distortional Buckling Moment Capacity of LSBs by using Web Stiffeners”,
Thin-walled Structures.
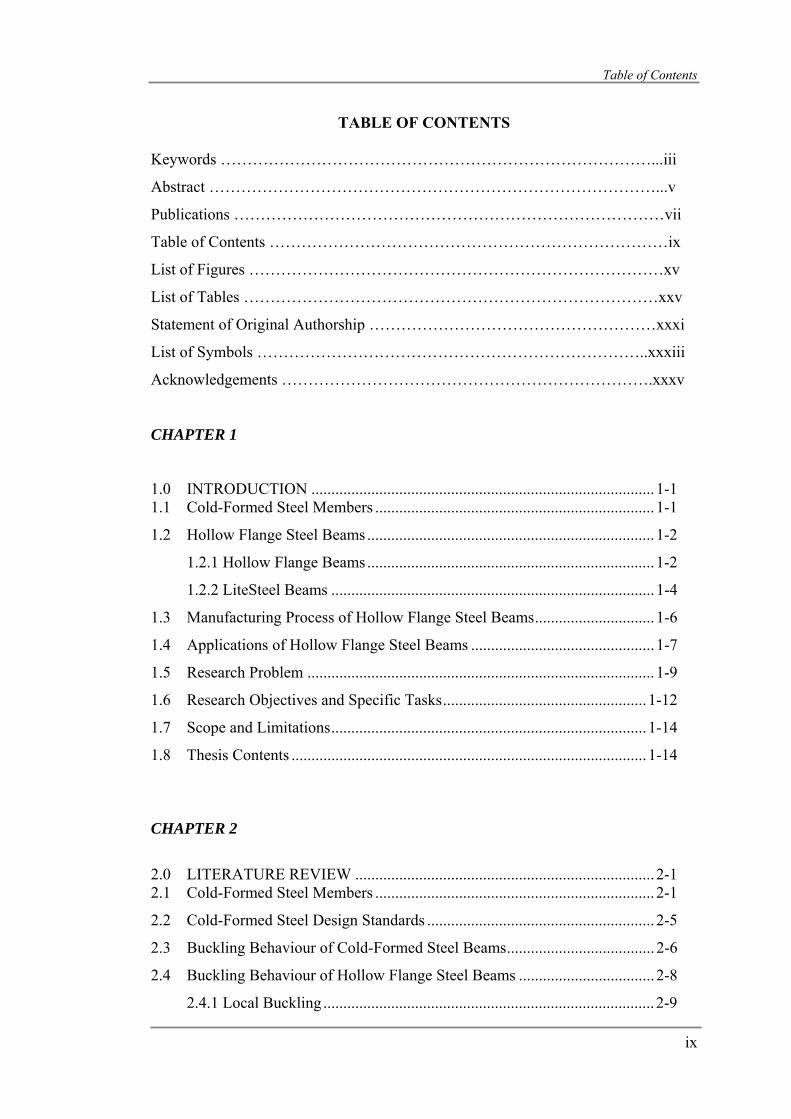
Table of Contents
ix
TABLE OF CONTENTS
Keywords ………………………………………………………………………...iii
Abstract …………………………………………………………………………...v
Publications ………………………………………………………………………vii
Table of Contents …………………………………………………………………ix
List of Figures ……………………………………………………………………xv
List of Tables ……………………………………………………………………xxv
Statement of Original Authorship ………………………………………………xxxi
List of Symbols ………………………………………………………………..xxxiii
Acknowledgements …………………………………………………………….xxxv
CHAPTER 1
1.0 INTRODUCTION ...................................................................................... 1-1 1.1 Cold-Formed Steel Members ...................................................................... 1-1
1.2 Hollow Flange Steel Beams ........................................................................ 1-2
1.2.1 Hollow Flange Beams ........................................................................ 1-2
1.2.2 LiteSteel Beams ................................................................................. 1-4
1.3 Manufacturing Process of Hollow Flange Steel Beams .............................. 1-6
1.4 Applications of Hollow Flange Steel Beams .............................................. 1-7
1.5 Research Problem ....................................................................................... 1-9
1.6 Research Objectives and Specific Tasks ................................................... 1-12
1.7 Scope and Limitations ............................................................................... 1-14
1.8 Thesis Contents ......................................................................................... 1-14
CHAPTER 2
2.0 LITERATURE REVIEW ........................................................................... 2-1 2.1 Cold-Formed Steel Members ...................................................................... 2-1
2.2 Cold-Formed Steel Design Standards ......................................................... 2-5
2.3 Buckling Behaviour of Cold-Formed Steel Beams ..................................... 2-6
2.4 Buckling Behaviour of Hollow Flange Steel Beams .................................. 2-8
2.4.1 Local Buckling ................................................................................... 2-9

Table of Contents
x
2.4.2 Lateral Distortional Buckling ........................................................... 2-11
2.4.3 Lateral Torsional Buckling ............................................................... 2-13
2.5 Lateral Buckling Strength of Beams ......................................................... 2-13
2.5.1 Pre-Buckling Deflections ................................................................. 2-15
2.5.2 Post-Buckling Behaviour ................................................................. 2-15
2.5.3 Web Distortion ................................................................................. 2-16
2.5.4 Inelastic Behaviour ........................................................................... 2-17
2.5.5 Initial Geometric Imperfection and Twist ........................................ 2-18
2.5.6 Residual Stress ................................................................................. 2-20
2.5.7 Moment Distribution ........................................................................ 2-21
2.5.8 Load Height ...................................................................................... 2-23
2.5.9 Warping ............................................................................................ 2-24
2.6 Design Guidelines for Cold-Formed Hollow Flange Steel Beams ........... 2-25
2.6.1 Moment Capacity Based on AS 4100 (SA, 1998) ........................... 2-26
2.6.1.1 Section Moment Capacity ....................................................... 2-26
2.6.1.2 Member Moment Capacity ...................................................... 2-27
2.6.2 Moment Capacity Based on AS/NZS 4600 (SA, 2005) ................... 2-29
2.6.2.1 Section Moment Capacity ....................................................... 2-29
2.6.2.2 Member Moment Capacity ...................................................... 2-31
2.6.3 The Direct Strength Method ............................................................. 2-37
2.7 Hollow Flange Steel Beams with Web Stiffeners ..................................... 2-39
2.7.1 HFBs with Web Stiffeners ............................................................... 2-40
2.7.2 LSBs with Web Stiffeners ................................................................ 2-42
2.7.2.1 Stiffener Type and Configurations .......................................... 2-42
2.7.2.2 Design Methods ....................................................................... 2-43
2.7.2.3 Experimental Results of Kurniawan (2005) ............................ 2-45
2.7.2.4 Finite Element Analysis Results of Kurniawan (2005) ........... 2-45
2.8 Finite Element Analysis ............................................................................ 2-47
2.8.1 Finite Element Analyses of LSBs .................................................... 2-48
2.8.2 Finite Element Analyses of HFBs .................................................... 2-54
2.9 Experimental Investigation ....................................................................... 2-56
2.9.1 Tensile Coupon Tests ....................................................................... 2-56
2.9.2 Residual Stress Measurement ........................................................... 2-58
Table of Contents
xi
2.9.3 Initial Geometric Imperfection Measurement .................................. 2-59
2.9.4 Section Capacity Tests ..................................................................... 2-60
2.9.5 Lateral Buckling Tests ..................................................................... 2-60
2.9.6 Experimental Investigation of HFBs ................................................ 2-64
2.9.7 Experiments of other Cold-Formed Steel Beams ............................ 2-65
2.10 Literature Review Findings ....................................................................... 2-67
CHAPTER 3
3.0 MATERIAL PROPERTIES, RESIDUAL STRESSES AND GEOMETRIC
IMPERFECTIONS OF LSB SECTIONS ................................................... 3-1
3.1 Introduction ................................................................................................. 3-1
3.2 Tensile Coupon Tests to Determine the Mechanical Properties ................. 3-2
3.3 Residual Stress Measurements for LSB Sections ....................................... 3-7
3.3.1 Test Procedure .................................................................................... 3-7
3.3.2 Results ................................................................................................ 3-9
3.4 Initial Geometric Imperfection Measurements ......................................... 3-14
3.5 Conclusions ............................................................................................... 3-16
CHAPTER 4
4.0 LATERAL BUCKLING TESTS OF LSB SECTIONS ............................. 4-1
4.1 Introduction ................................................................................................. 4-1
4.2 Selection of Test Specimens ....................................................................... 4-2
4.3 Test Method ................................................................................................ 4-4
4.3.1 Support System .................................................................................. 4-7
4.3.1.1 Flange Twist Restraints ............................................................. 4-8
4.3.2 Loading System .................................................................................. 4-9
4.3.3 Measuring System ............................................................................ 4-11
4.3.4 Test Procedure .................................................................................. 4-13
4.4 Experimental Results and Discussions ..................................................... 4-15
4.5 Comparisons with Design Methods .......................................................... 4-21
4.6 Conclusions ............................................................................................... 4-29
Table of Contents
xii
CHAPTER 5
5.0 FINITE ELEMENT MODELLING OF LSBs SUBJECT TO LATERAL
BUCKLING EFFECTS ............................................................................... 5-1
5.1 Introduction ................................................................................................. 5-1
5.2 Model Description ....................................................................................... 5-1
5.2.1 Discretization of the Finite Element Mesh ......................................... 5-7
5.2.2 Material Model and Properties ........................................................... 5-8
5.2.3 Load and Boundary Conditions .......................................................... 5-9
5.2.3.1 Ideal Finite Element Model ....................................................... 5-9
5.2.3.2 Experimental Finite Element Model ....................................... 5-12
5.2.4 Initial Geometric Imperfections ....................................................... 5-16
5.2.5 Residual Stresses .............................................................................. 5-18
5.2.6 Analysis Methods ............................................................................. 5-21
5.3 Model Validation ....................................................................................... 5-22
5.3.1 Typical Buckling Modes of Ideal Finite Element Model ................. 5-23
5.3.2 Comparison of Elastic Buckling Moment Results ........................... 5-25
5.3.3 Comparison with Experimental Test Results ................................... 5-29
5.4 Conclusions ............................................................................................... 5-34
CHAPTER 6
6.0 PARAMETRIC STUDIES AND DESIGN RULE DEVELOPMENT ...... 6-1
6.1 Introduction ................................................................................................. 6-1
6.2 Parametric Study ......................................................................................... 6-2
6.3 Lateral Distortional Buckling Behaviour and Strength of LSBs ................. 6-4
6.3.1 Effects of Initial Geometric Imperfection Direction .......................... 6-4
6.3.2 Effects of Residual Stresses ............................................................... 6-7
6.4 Ultimate Moment Capacities of LSBs ...................................................... 6-12
6.5 Comparison of Member Moment Capacities of LSBs with AS/NZS 4600 (SA,
2005) Design Rules ................................................................................... 6-15
6.6 Proposed Design Rules for Member Moment Capacities of LSBs ........... 6-22
6.6.1 Calculation of Capacity Reduction Factor (Φ) ................................. 6-25
6.6.2 Moment Capacities of Hollow Flange Beams .................................. 6-30
Table of Contents
xiii
6.7 Effect of Section Geometry on the Lateral Distortional Buckling Moment
Capacities of LSBs .................................................................................... 6-36
6.8 Applicability of the Geometrical Parameter for Other Types of Hollow Flange
Steel Beams ............................................................................................... 6-55
6.9 Conclusions ............................................................................................... 6-62
CHAPTER 7
7.0 SECTION MOMENT CAPACITY OF LITESTEEL BEAM .................... 7-1
7.1 Introduction ................................................................................................. 7-1
7.2 Section Moment Capacity Tests of LSBs ................................................... 7-2
7.2.1 Test Set-Up and Procedure ................................................................ 7-3
7.2.2 Test Results and Discussion ............................................................... 7-6
7.2.3 Comparison of Ultimate Moment Capacities from Tests and Current
Design Rules ...................................................................................................... 7-11
7.3 Finite Element Modelling of LSBs to Determine their Section Moment
Capacities .................................................................................................. 7-16
7.3.1 Experimental Finite Element Model of LSBs .................................. 7-16
7.3.2 Finite Element Analyses of LSBs Subject to Local Buckling Effects7-27
7.4 Comparison of Ultimate Moment Capacities from FEA and Current Design
Rules .......................................................................................................... 7-31
7.5 Comparison of Ultimate Moment Capacities from FEA and Other Proposed
Design Rules ............................................................................................. 7-38
7.6 Discussion of Maximum Available Moment Capacity of LSBs and
Compressive Strain Limits ........................................................................ 7-41
7.7 Conclusions ............................................................................................... 7-49
CHAPTER 8
8.0 EFFECT OF WEB STIFFENERS ON THE LATERAL DISTORTIONAL
BUCKLING BEHAVIOUR AND STRENGTH OF LITESTEEL BEAMS8-1
8.1 Introduction ................................................................................................. 8-1
8.2 Elastic Buckling Analyses........................................................................... 8-4
Table of Contents
xiv
8.2.1 Finite Element Models ....................................................................... 8-6
8.2.2 Results .............................................................................................. 8-13
8.2.3 Determination of Optimum Spacing and Size of Web Stiffeners .... 8-17
8.3 Elastic Lateral Distortional Buckling of LSBs with Web Stiffeners ........ 8-23
8.4 Ultimate Member Moment Capacities of LSBs with Web Stiffeners ....... 8-31
8.5 Development of Design Rules ................................................................... 8-37
8.6 Conclusions ............................................................................................... 8-42
CHAPTER 9
9.0 Conclusions and Recommendations ............................................................ 9-1
9.1 Experimental Investigation of LSBs ........................................................... 9-3
9.2 Finite element Modelling of LSBs Subject to Lateral Buckling ................. 9-4
9.3 Parametric Studies and Design Rule Development ..................................... 9-5
9.4 Section Moment Capacity of LSBs ............................................................. 9-6
9.5 Effect of Web Stiffeners on the Lateral Distortional Buckling Moment Capacity
of LSBs ........................................................................................................ 9-6
9.6 Future Research ........................................................................................... 9-7
Appendix A…………………………………………………………………….A-1
Appendix B…………………………………………………………………….B-1
Appendix C…………………………………………………………………….C-1
Appendix D…………………………………………………………………….D-1
Appendix E…………………………………………………………………….E-1
References..........................................................................................................R-1
List of Figures
xv
LIST OF FIGURES
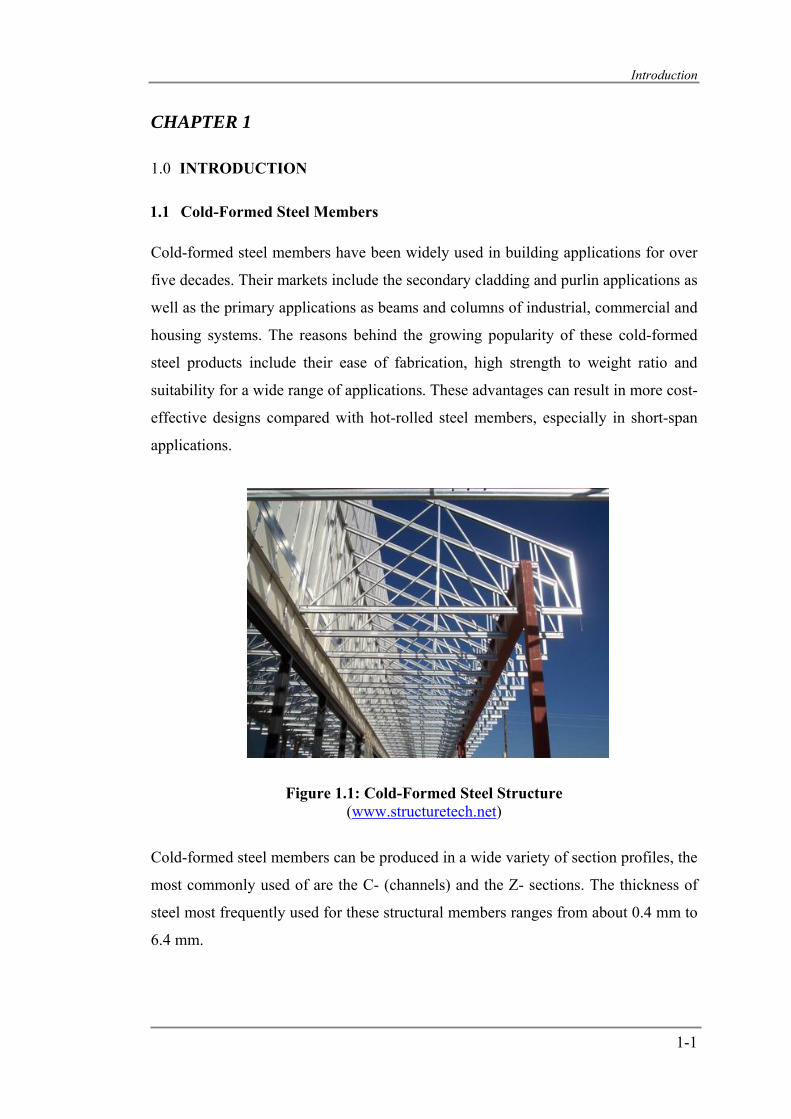
Figure 1.1: Cold-Formed Steel Structure .................................................................. 1-1
Figure 1.2: Cold-Formed Steel Cross-Sections ......................................................... 1-2
Figure 1.3: The Hollow Flange Beam ....................................................................... 1-3
Figure 1.4: Typical LSBs .......................................................................................... 1-4
Figure 1.5: HFS Manufacturing Process ................................................................... 1-6
Figure 1.6: Applications of LSBs ............................................................................. 1-7
Figure 1.6: Applications of LSBs ............................................................................. 1-8
Figure 1.7: Lateral Distortional Buckling of LSB .................................................. 1-10
Figure 1.8: HFB with Web Stiffener ....................................................................... 1-11
Figure 2.1: Various Shapes of Cold-Formed Steel Sections ..................................... 2-1
Figure 2.2: Different Types of Cold-Formed Steel Sections .................................... 2-2
Figure 2.3: Roll Forming Sequence for a Z-Section ………………………………2-3
Figure 2.4: Press Brake Dies ………………………………………………………2-3
Figure 2.5: Typical Stress-Strain Curves .................................................................. 2-4
Figure 2.6: Effects on Strain Hardening and Strain Ageing ..................................... 2-5
Figure 2.7: Different Buckling Modes of Z- Section ................................................ 2-7
Figure 2.8: Different Buckling Modes of Channel Section ...................................... 2-7
Figure 2.9: Flange Distortional and Lateral Distortional Buckling .......................... 2-8
Figure 2.10: HFB and LSB ....................................................................................... 2-9
Figure 2.11: Different Buckling Modes and Stresses of HFB Subject to Bending 2-10
Figure 2.12: Local Buckling Mode of LSB Sections .............................................. 2-11
Figure 2.13: Lateral Distortional Buckling Mode of LSB Sections ....................... 2-11
Figure 2.14: Elastic Lateral Distortional Buckling Moments ................................. 2-12
Figure 2.15: Lateral Torsional Buckling Mode of LSB Sections ........................... 2-13
Figure 2.16: Lateral Buckling Behaviour of Steel Beams ...................................... 2-14
Figure 2.17: Positive and Negative Imperfections of LSBs .................................... 2-19
Figure 2.18: Membrane and Flexural Residual Stresses ......................................... 2-20
Figure 2.19: Bending Moment Diagrams of Beams ............................................... 2-21
Figure 2.20: Effects of Moment Gradient ............................................................... 2-22
List of Figures
xvi
Figure 2.21: Warping Restraining Devices ............................................................. 2-25
Figure 2.22: Comparisons of Experimental and AS 4100 (1998) Predictions ........ 2-29
Figure 2.23: Stiffened Elements and Webs with Stress Gradient ........................... 2-31
Figure 2.24: Comparisons of Experiments and AS/NZS 4600 (1996) Predictions 2-33
Figure 2.25: Comparison of FEA Results with Avery et al.’s (1999b) Predictions 2-34
Figure 2.26: Comparisons of New Design Rules, FEA and Experiments (Φ=0.85) .. 2-
35
Figure 2.27: Comparisons of New Design Rules, FEA and Experiments (Φ=0.90) .. 2-
36
Figure 2.28: Stiffener Types .................................................................................... 2-40
Figure 2.29: Stiffener Configuration ....................................................................... 2-41
Figure 2.30: Special Stiffener Screw Fastened to HFB Flanges ............................. 2-42
Figure 2.31: Stiffener Types .................................................................................... 2-43
Figure 2.32: Predicted Member Capacities of 250x60x2.0 LSB ............................ 2-44
Figure 2.33: FEA Models used by Mahaarachchi and Mahendran (2005c) ........... 2-46
Figure 2.34: Idealised Simply Supported Boundary Conditions ............................. 2-49
Figure 2.35: Ideal Finite Element Model ................................................................ 2-50
Figure 2.36: Experimental Finite Element Model ................................................... 2-51
Figure 2.37: Idealised Models of Residual Stresses for LSBs ................................ 2-52
Figure 2.38: Modified Ideal Finite Element Model (First Version) ........................ 2-53
Figure 2.39: Member Capacity Curves ................................................................... 2-53
Figure 2.40: Modified Ideal FE Model (Final Version) .......................................... 2-54
Figure 2.41: Finite Element Models of HFBs ......................................................... 2-55
Figure 2.42: Typical Stress-Strain Curves of the Base Steel used in LSB Sections ... 2-
57
Figure 2.43: Sectioning of LSBs ............................................................................. 2-59
Figure 2.44: Geometric Imperfection Test Set-up .................................................. 2-59
Figure 2.45: Section Capacity Test Set-up .............................................................. 2-60
Figure 2.46: Overall View of Test Rig .................................................................... 2-61
Figure 2.47: Support System ................................................................................... 2-61
Figure 2.48: Loading System .................................................................................. 2-62
Figure 2.49: Stiffener Types .................................................................................... 2-63
Figure 2.50: Test Set-up of LSB with Stiffeners ..................................................... 2-63
List of Figures
xvii
Figure 2.51: Schematic Diagram for Lateral Buckling Tests of HFBs ................... 2-64
Figure 2.52: Schematic Diagram of Test Rig Including Support System ............... 2-65
Figure 2.53: Lateral Buckling Tsts of RHS Beams ................................................ 2-66
Figure 2.54: Test Arrangement for C- and Z- Section Beams ................................ 2-67
Figure 3.1: Tensile Test Coupons ............................................................................. 3-3
Figure 3.2: Tensile Test Arrangement ...................................................................... 3-4
Figure 3.3: Typical Stress-Strain Curves from Tensile Coupon Tests...................... 3-5
Figure 3.4: Strain Gauge Arrangement ..................................................................... 3-7
Figure 3.5: Sectioning Process of LSB ..................................................................... 3-8
Figure 3.6: Measured Released Strain along the Web Element ................................ 3-9
Figure 3.7: Measured Stresses along the Web Element of a 150x45x1.6 LSB ...... 3-10
Figure 3.8: Membrane Residual Stress Distribution ............................................... 3-11
Figure 3.9: Flexural Residual Stress Distribution ................................................... 3-11
Figure 3.10: Membrane Residual Stress Distribution for 150x45x1.6 LSB ........... 3-13
Figure 3.11: Geometric Imperfection Measurements ............................................. 3-14
Figure 3.12: Measured Imperfections of a 4 m Long 200x45x1.6 LSB Section .... 3-15
Figure 4.1: Experimental Results of Mahaarachchi and Mahendran (2005a) .......... 4-2
Figure 4.2: LSB Test Specimens ............................................................................... 4-3
Figure 4.3: Different Types of Test Methods ........................................................... 4-5
Figure 4.4: Overall View of Test Rig........................................................................ 4-6
Figure 4.5: Support System ....................................................................................... 4-7
Figure 4.6: Flange Twist at Failure of a 250x75x2.5 LSB with 3.5 m Span ............ 4-8
Figure 4.7: Flange Twist Restraint Arrangement of LSBs ....................................... 4-9
Figure 4.8: Loading System .................................................................................... 4-10
Figure 4.9: Data Logger and Load Cells ................................................................. 4-12
Figure 4.10: Wire Displacement Transducers (WDTs) .......................................... 4-12
Figure 4.11: Schematic Diagram of a Typical Test Specimen................................ 4-13
Figure 4.12: Schematic Diagram of Flange Twist Restraints ................................. 4-14
Figure 4.13: Typical Lateral Distortional Buckling Failure.................................... 4-15
List of Figures
xviii
Figure 4.14: A Closer View of Lateral Distortional Buckling Failure .................... 4-16
Figure 4.15: Local Web Buckling after Ultimate Failure ....................................... 4-16
Figure 4.16: Comparison of Flange Twist Condition at Failure ............................. 4-17
Figure 4.17: Shear Buckling Failure of 150x45x1.6 LSB with 1.2 m Span ........... 4-17
Figure 4.18: Moment vs Lateral Deflection Curves ................................................ 4-18
Figure 4.19: Comparison of Experimental Failure Moments with AS/NZS 4600 (SA,
2005) Predictions ..................................................................................................... 4-25
Figure 4.20: Typical Elastic Buckling Failure Mode from Finite Element Analysis 4-
28
Figure 5.1: Schematic Diagrams of Ideal and Experimental FE Models .................. 5-2
Figure 5.2: Actual and Idealised LSBs ...................................................................... 5-4
Figure 5.3: Typical Finite Element Mesh for LSB Models ....................................... 5-8
Figure 5.4: Stress-Strain Relationships ..................................................................... 5-9
Figure 5.5: Idealised Simply Supported Boundary Conditions ............................... 5-10
Figure 5.6: Boundary Conditions of the Ideal Finite Element Model of LSB ........ 5-11
Figure 5.7: Typical Loading Method for the Ideal Finite Element Model of LSB . 5-12
Figure 5.8: Loading and Boundary Conditions of the Experimental Finite Element
Model of LSB .......................................................................................................... 5-14
Figure 5.9: Loading Plate Twisting in the Experimental FE Model ....................... 5-15
Figure 5.10: Various Plate Elements in Experimental Finite Element Model ........ 5-16
Figure 5.11: Critical Buckling Mode from Elastic Buckling Analysis of Ideal Finite
Element Model ........................................................................................................ 5-17
Figure 5.12: Effect of Imperfection Direction Based on Nonlinear Analysis ......... 5-18
Figure 5.13: Residual Stress Distributions in LSB Sections ................................... 5-19
Figure 5.14: Typical Residual Stresses Distribution for LSB Sections .................. 5-20
Figure 5.15: Elastic Buckling Modes of 200x60x2.0 LSB ..................................... 5-23
Figure 5.15: Elastic Buckling Modes of 200x60x2.0 LSB ..................................... 5-24
Figure 5.16: Ultimate Failure Modes of 200x60x2.0 LSB ..................................... 5-25
Figure 5.17: Comparison of Elastic Buckling Moments ......................................... 5-28
Figure 5.18: Bending Moment vs Vertical Deflection at Mid-Span Curves for
150x45x1.6 LSB (3000 mm Span) .......................................................................... 5-30
List of Figures
xix
Figure 5.19: Bending Moment vs Vertical Deflection at Mid-Span Curves for
200x45x1.6 LSB (4000 mm Span) ......................................................................... 5-31
Figure 5.20: Bending Moment vs Vertical Deflection at Mid-Span Curves for
300x60x2.0 LSB (4000 mm Span) ......................................................................... 5-31
Figure 5.21: Bending Moment vs Lateral Deflection at Mid-Span Curves for
150x45x1.6 LSB (1800 mm Span) ......................................................................... 5-32
Figure 5.22: Bending Moment vs Lateral Deflection at Mid-Span Curves for
200x45x1.6 LSB (4000 mm Span) ......................................................................... 5-32
Figure 5.23: Bending Moment vs Lateral Deflection at Mid-Span Curves for
150x45x2.0 LSB (3000 mm Span) ......................................................................... 5-33
Figure 6.1: Positive and Negative Imperfections of LSBs ........................................ 6-5
Figure 6.2: Effects of Initial Geometric Imperfection Direction on the Ultimate
Moment Capacities of LSBs ..................................................................................... 6-7
Figure 6.3: Effects of Residual Stresses on the Ultimate Moment Capacities of
300x75x3.0 LSBs ...................................................................................................... 6-9
Figure 6.4: Comparison of Moment Capacities of 300x75x3.0 LSBs with and without
Residual Stresses ..................................................................................................... 6-10
Figure 6.5: Comparison of Moment Capacities of 300x60x2.0 LSBs with and without
Residual Stresses ..................................................................................................... 6-10
Figure 6.6: Comparison of Moment Capacities of 200x60x2.5 LSBs with and without
Residual Stresses ..................................................................................................... 6-11
Figure 6.7: Comparison of Moment Capacities of 200x45x1.6 LSBs with and without
Residual Stresses ..................................................................................................... 6-11
Figure 6.8: Comparison of Moment Capacities of 150x45x1.6 LSBs with and without
Residual Stresses ..................................................................................................... 6-12
Figure 6.9: Ultimate Moment Capacity Curves of LSBs ........................................ 6-13
Figure 6.10: Comparison of Moment Capacity Results from FEA with AS/NZS 4600
(SA, 2005) Design Curve ........................................................................................ 6-17
Figure 6.11: Comparison of FEA Moment Capacities with the Design Curve based
on Equations 6.7 (a) to (c) ....................................................................................... 6-23
List of Figures
xx
Figure 6.12: Comparison of Experimental Moment Capacities with the Design Curve
based on Equations 6.7 (a) to (c) ............................................................................. 6-24
Figure 6.13: Comparison of FEA and Experimental Moment Capacities with the
Design Curve based on Equations 6.7 (a) to (c) ...................................................... 6-24
Figure 6.14: Comparison of FEA Moment Capacities with the Design Curve based
on Equations 6.10 (a) to (c) ..................................................................................... 6-27
Figure 6.15: Comparison of Experimental Moment Capacities with the Design Curve
based on Equations 6.10 (a) to (c) ........................................................................... 6-28
Figure 6.16: Comparison of Experimental Moment Capacities with the Design Curve
based on Equations 6.11 (a) to (c) ........................................................................... 6-29
Figure 6.17: Comparison of FEA Moment Capacities with the Design Curve based
on Equations 6.11 (a) to (c) ..................................................................................... 6-30
Figure 6.18: Hollow Flange Beams ......................................................................... 6-30
Figure 6.19: Comparison of FEA Moment Capacities of HFBs from Avery et al.
(1999b) with Equations 6.7 (a) to (c) ...................................................................... 6-35
Figure 6.20: Non-Dimensional Member Moment Capacity versus Modified
Slenderness λd for LSBs .......................................................................................... 6-37
Figure 6.21: Non-Dimensional Member Moment Capacity versus Slenderness λ for
LSBs ........................................................................................................................ 6-38
Figure 6.22: Moment Capacity Design Curve for LSBs based on a Modified
Slenderness Parameter K1λ ..................................................................................... 6-39
Figure 6.23: Moment Capacity Design Curve for LSBs based on a Modified
Slenderness Parameter K2λd .................................................................................... 6-40
Figure 6.24: Moment Capacity Design Curve for LSBs based on a Modified
Slenderness Parameter Kλd ..................................................................................... 6-42
Figure 6.25: Comparison of Experimental Results with Equation 6.18 .................. 6-43
Figure 6.26: Moment Capacities of LSBs with Similar Values of GJf/EIxweb (Set 1) . 6-
44
Figure 6.27: Moment Capacities of LSBs with Similar Values of GJf/EIxweb (Set 2) . 6-
45
Figure 6.28: Moment Capacities of LSBs with Similar Values of GJf/EIxweb (Set 3) . 6-
46
List of Figures
xxi
Figure 6.29: Comparison of FEA Moment Capacities of HFBs from Avery et al.
(1999b) with Equation 6.18 .................................................................................... 6-47
Figure 6.30: Comparison of FEA Moment Capacities of Selected HFBs from Avery
et al. (1999b) with Equation 6.18 ............................................................................ 6-47
Figure 6.31: Moment Capacities of HFBs with Similar Values of GJf/EIxweb (Set 1) 6-
49
Figure 6.32: Moment Capacities of HFBs with Similar Values of GJf/EIxweb (Set 2) 6-
49
Figure 6.33: Moment Capacities of New LSBs with Different GJf/EIxweb Values . 6-51
Figure 6.34: Moment Capacities of Hollow Flange Steel Beams with GJf/EIxweb ≥
0.0811 ...................................................................................................................... 6-53
Figure 6.35: Moment Capacities of Hollow Flange Steel Beams with the Modified
Slenderness Parameter K as Defined in Equation 6.19 ........................................... 6-54
Figure 6.36: Moment Capacities of Hollow Flange Steel Beams with the Modified
Slenderness Parameter K as Defined in Equation 6.20 ........................................... 6-54
Figure 6.37: MHFB and RHFB Sections ................................................................ 6-55
Figure 6.38: Comparison of Moment Capacities of Hollow Flange Steel Beams with
Similar Values of GJf/EIxweb ................................................................................... 6-61
Figure 7.1: Schematic Diagram of the Test Set-Up .................................................. 7-3
Figure 7.2: Test Set-Up ............................................................................................. 7-5
Figure 7.2: Overall View of Test Set-up ................................................................... 7-5
Figure 7.3: Simply Supported Conditions at the End Supports ................................ 7-5
Figure 7.4: Load Application and Deflection Measurement ..................................... 7-6
Figure 7.5: Moment vs Vertical Deflection Curves of 150x45x2.0 LSB ................. 7-7
Figure 7.6: Moment vs Vertical Deflection Curves of 300x75x3.0 LSB ................. 7-7
Figure 7.7: Moment vs Vertical Deflection Curves of 200x45x1.6 LSB ................. 7-8
Figure 7.8: Plan View of Failed Specimen ............................................................... 7-9
Figure 7.9: Flange and Web Local Buckling ............................................................ 7-9
Figure 7.10: Flange Local Buckling ....................................................................... 7-10
Figure 7.11: Failure Mode of 300x60x2.0 LSB ...................................................... 7-13
Figure 7.12: Schematic Diagram of Experimental Finite Element Model.............. 7-17
List of Figures
xxii
Figure 7.13: Loading and Boundary Conditions of Experimental Finite Element
Model ...................................................................................................................... 7-18
Figure 7.14: Various Plate Elements in Experimental Finite Element Model ........ 7-19
Figure 7.15: Failure Modes from Finite Element Analyses of 150x45x2.0 LSB ... 7-20
Figure 7.16: Failure Modes from Finite Element Analyses of 300x60x2.0 LSB ... 7-21
Figure 7.17: Typical Buckling Mode after Failure from FEA ................................ 7-22
Figure 7.18: Bending Moment vs Vertical Deflection of 150x45x1.6 LSB ........... 7-23
Figure 7.19: Bending Moment vs Vertical Deflection of 200x45x1.6 LSB ........... 7-23
Figure 7.20: Stress-Strain Curves of 150x45x2.0 LSB ........................................... 7-26
Figure 7.20: Stress-Strain Curves of 150x45x2.0 LSB ........................................... 7-27
Figure 7.21: Stress Variation across the Cross-section of LSB from FEA ............. 7-29
Figure 7.21: Stress Variation across the Cross-section of LSB from FEA ............. 7-30
Figure 7.22: Strain Variation across the Cross-section of 150x45x3.0 LSB .......... 7-46
Figure 7.23: Strain along the Top Flange of 150x45x3.0 LSB ............................... 7-46
Figure 7.24: Strain Variation across the cross-section of 150x45x3.0 LSB as Fringe
Results ..................................................................................................................... 7-47
Figure 8.1: Lateral Distortional Buckling of LSBs ................................................... 8-1
Figure 8.1: Lateral Distortional Buckling of LSBs ................................................... 8-2
Figure 8.2: Use of Web Stiffeners in HFBs (Mahendran and Avery, 1997) ............. 8-2
Figure 8.3: Twist Restraint at the Supports ............................................................... 8-3
Figure 8.4: Types of Web Stiffeners Used by Avery and Mahendran (1997) and
Kurniawan (2005) ..................................................................................................... 8-5
Figure 8.4: Types of Web Stiffeners Used by Avery and Mahendran (1997) and
Kurniawan (2005) ..................................................................................................... 8-6
Figure 8.5: Schematic Diagrams of Ideal and Experimental FE Models .................. 8-7
Figure 8.6: Experimental Finite Element Model of LSB with Web Stiffeners ......... 8-7
Figure 8.6: Experimental Finite Element Model of LSB with Web Stiffeners ......... 8-8
Figure 8.7: Experimental FE Model with Web Stiffeners and Flange Twist Restraints
................................................................................................................................... 8-9
Figure 8.7: Experimental FE Model with Web Stiffeners and Flange Twist Restraints
................................................................................................................................. 8-10
List of Figures
xxiii
Figure 8.8: Ideal Finite Element Model with Full Twist Restraint at the Supports
(Including Flanges) and Web Stiffeners ................................................................. 8-10
Figure 8.9: Idealised Simply Supported Boundary Conditions .............................. 8-11
Figure 8.10: Loading Method of Ideal Finite Element Model ................................ 8-12
Figure 8.11: Elastic Lateral Distortional Buckling Failure Modes of LSBs with
Various Stiffener Arrangements ............................................................................. 8-15
Figure 8.11: Elastic Lateral Distortional Buckling Failure Modes of LSBs with
Various Stiffener Arrangements ............................................................................. 8-16
Figure 8.12: LSBs with Web Stiffeners at Different Spacings ............................... 8-18
Figure 8.13: Elastic Lateral Buckling Modes of LSBs ........................................... 8-19
Figure 8.13: Elastic Lateral Buckling Modes of LSBs ........................................... 8-20
Figure 8.14: Elastic Lateral Distortional Buckling of LSB with Web Stiffener ..... 8-24
Figure 8.15: Modw/Mo versus Span for LSBs with Web Stiffeners ......................... 8-28
Figure 8.16: Modw/Mo versus Slenderness for LSBs with Web Stiffeners .............. 8-28
Figure 8.17: Comparison of Modw with Equation 8.2 .............................................. 8-29
Figure 8.18: Comparison of Modw with Equation 8.3 .............................................. 8-30
Figure 8.19: Lateral Buckling Mode of a 2 m Span 150x45x2.0 LSB from Non-linear
FEA ......................................................................................................................... 8-32
Figure 8.20: Ultimate Moments of LSBs with Web Stiffeners ............................... 8-36
Figure 8.21: Comparison of Ultimate Moments of LSBs with and without Web
Stiffeners ................................................................................................................. 8-36
Figure 8.22: Comparison of Ultimate Moments with Equation 8.4 ........................ 8-37
Figure 8.23: Comparison of Ultimate Moments with Equation 8.5 ........................ 8-38
Figure 8.24: Comparison of Ultimate Moments with Equation 8.6 ........................ 8-39
Figure 8.25: Comparison of Ultimate Moments with Equation 8.7 ........................ 8-40
Figure 8.26: Comparison of Ultimate Moments with Equation 8.8 ........................ 8-41
List of Figures
xxiv
List of Tables
xxv
LIST OF TABLES
Table 1.1: Geometry of HFB Sections ...................................................................... 1-3
Table 1.2: Mechanical Properties of LSBs ............................................................... 1-5
Table 1.3: LSB Section Dimensions ......................................................................... 1-5
Table 2.1: Avery et al.’s (1999b) Coefficients for Equation 2.32 ........................... 2-34
Table 2.2: Idealised Simply Supported Boundary Conditions ................................ 2-49
Table 2.3 Nonlinear Analysis Parameters ............................................................... 2-51
Table 2.4: Tensile Coupon Test Results ................................................................. 2-57
Table 3.1: Tensile Test Results ................................................................................. 3-5
Table 3.2: Comparison of Yield and Ultimate Stresses ............................................ 3-6
Table 3.3: Membrane Residual Stress of LSBs ...................................................... 3-13
Table 4.1: Details of Test Specimens ........................................................................ 4-4
Table 4.2: Lateral Buckling Test Results from this Study ...................................... 4-19
Table 4.3: Details and Results of Mahaarachchi and Mahendran’s (2005a) Lateral
Buckling Tests ......................................................................................................... 4-20
Table 4.4: Measured Properties and Capacities of LSBs Used in the Current Lateral
Buckling Tests ......................................................................................................... 4-23
Table 4.5: Measured Properties and Capacities of LSBs Used in the Lateral Buckling
Tests of Mahaarachchi and Mahendran (2005a) ..................................................... 4-24
Table 4.6: Comparison of Experimental Failure Moments of Mahaarachchi and
Mahendran (2005a) with AS/NZS 4600 (SA, 2005) Predictions ........................... 4-26
Table 4.7: Comparison of Experimental Failure Moments with AS/NZS 4600 (SA,
2005) Predictions .................................................................................................... 4-27
Table 4.8: Effect of Flange Twist Restraint from Finite Element Analysis ............ 4-28
Table 5.1: Nominal Properties of Available LSB Sections....................................... 5-3
Table 5.2: Elastic Section Modulus of Actual and Idealised LSBs .......................... 5-4
List of Tables
xxvi
Table 5.3: Elastic Lateral Buckling Moments of Actual and Idealised LSB Sections
................................................................................................................................. ..5-5
Table 5.4: Percentage Differences in Elastic Lateral Buckling Moments of Idealised
and Actual LSBs ........................................................................................................ 5-6
Table 5.5: Idealised Simply Supported Boundary Conditions ................................ 5-10
Table 5.6: Membrane Residual Stress Distribution of LSB Sections ..................... 5-20
Table 5.7: Comparison of Elastic Buckling Moments of LSB from FEA, Thin-Wall
and Pi and Trahair’s (1997) Equation ..................................................................... 5-26
Table 5.7 (Continued): Comparison of Elastic Buckling Moments of LSB from FEA,
Thin-Wall and Pi and Trahair’s (1997) Equation .................................................... 5-27
Table 5.8: Comparison of Experimental and FEA Ultimate Moment Capacities ... 5-30
Table 6.1: Nominal Dimensions of LSBs ................................................................. 6-3
Table 6.2: Effects of Initial Geometric Imperfection Direction on the Ultimate
Moment Capacities of LSBs ..................................................................................... 6-6
Table 6.3: Effects of Residual Stresses on the Ultimate Moment Capacities ........... 6-8
Table 6.4: Ultimate Moment Capacities of LSBs in kNm ...................................... 6-14
Table 6.5: Comparison of Moment Capacities from FEA and AS/NZS 4600 (SA,
2005) ........................................................................................................................ 6-19
Table 6.5 (continued): Comparison of Moment Capacities from FEA and AS/NZS
4600 (SA, 2005) ...................................................................................................... 6-20
Table 6.5 (continued): Comparison of Moment Capacities from FEA and AS/NZS
4600 (SA, 2005) ...................................................................................................... 6-21
Table 6.5 (continued): Comparison of Moment Capacities from FEA and AS/NZS
4600 (SA, 2005) ...................................................................................................... 6-22
Table 6.6: Capacity Reduction Factors for Eq.6.7 .................................................. 6-26
Table 6.7: Capacity Reduction Factors for Eq.6.10 ................................................ 6-27
Table 6.8: Capacity Reduction Factors for Eq.6.11 ................................................ 6-29
Table 6.9: Geometrical Dimensions of HFB Sections ............................................ 6-31
Table 6.10: Comparison of Avery et al.’s (1999b) FEA Results with Eq.6.7 ......... 6-32
Table 6.10 (continued): Comparison of Avery et al.’s (1999b) FEA Results with
Eq.6.7 ...................................................................................................................... 6-33
List of Tables
xxvii
Table 6.10 (continued): Comparison of Avery et al.’s (1999b) FEA Results with
Eq.6.7 ...................................................................................................................... 6-34
Table 6.11: Capacity Reduction factors for Eq.6.18 ............................................... 6-43
Table 6.12: Section Properties of LSBs including K .............................................. 6-44
Table 6.13: Section Properties of HFBs including K .............................................. 6-46
Table 6.14: Two New LSBs with Different GJf/EIxweb and K Values .................... 6-50
Table 6.15: FEA Moment Capacity Results of Two New LSBs ............................ 6-50
Table 6.16: Two New LSBs with Higher Values of GJf/EIxweb .............................. 6-52
Table 6.17: FEA Moment Capacity Results of Two New LSBs with Higher Values
of GJf/EIxweb ............................................................................................................ 6-52
Table 6.18: Dimensions of MHFB and RHFB Sections ......................................... 6-56
Table 6.19: Section Properties of MHFBs and RHFBs including K ...................... 6-56
Table 6.20: FEA Results of MHFB Sections without Residual Stresses ................ 6-57
Table 6.21: FEA Results of RHFB Sections without Residual Stresses ................. 6-58
Table 6.22: FEA Results of LSB Sections without Residual Stresses .................... 6-59
Table 7.1: Section Classification for LSBs ............................................................... 7-1
Table 7.2: Measured Dimensions of LSBs ............................................................... 7-2
Table 7.3: Measured Yield Stresses of LSBs ............................................................ 7-3
Table 7.4: Spans of Test Beams ................................................................................ 7-4
Table 7.5: Ultimate Moments of LSBs ................................................................... 7-10
Table 7.6: Section Moment Capacities from Tests and AS/NZS 4600 (SA, 2005) 7-13
Table 7.7: Measured Dimensions of LSBs used in Mahaarachchi and Mahendran’s
(2005b) Section Moment Capacity Tests ................................................................ 7-14
Table 7.8: Measured Yield Stresses of LSBs used in Mahaarachchi and Mahendran’s
(2005b) Section Moment Capacity Tests ................................................................ 7-14
Table 7.9: Section Moment Capacities from Mahaarachchi and Mahendran’s (2005b)
Tests and AS/NZS 4600 (SA, 2005) ....................................................................... 7-15
Table 7.10: Comparison of Experimental and FEA Ultimate Moment Capacities. 7-22
Table 7.11: Comparison of Mahaarachchi and Mahendran’s (2005b) Experimental
and FEA Ultimate Moment Capacities ................................................................... 7-24
Table 7.12: Ultimate Moments from the Ideal Finite Element Model .................... 7-28
Table 7.13: Ultimate Moment Capacities of LSBs from FEA ................................ 7-31
List of Tables
xxviii
Table 7.14: Compactness of LSBs Based on AS 4100 and AS/NZS 4600 ............. 7-33
Table 7.15: Section Moment Capacities of LSBs ................................................... 7-33
Table 7.16: Comparison of Ultimate Moment Capacities from FEA and Current
Design Rules ........................................................................................................... 7-35
Table 7.17: Comparison of Ultimate Moment Capacities from FEA and Eurocode 3
Part 1.3 (ECS, 2006 & 1996) .................................................................................. 7-37
Table 7.18: Comparison of Ultimate Moment Capacities from FEA and Shifferaw
and Schafer (2008) .................................................................................................. 7-40
Table 7.19: The Ratios of Mu/My and Section Compactness .................................. 7-41
Table 7.20: Dimensions and Properties of Non-Standard Compact LSBs ............. 7-42
Table 7.21: The Ratios of Mu/My of Some Non-Standard Compact LSBs ............. 7-42
Table 7.22: Comparison of Ultimate Moment Capacities from FEA and Eurocode 3
Part 1.3 (NSAI, 2006) for Non-Standard Compact LSBs ....................................... 7-44
Table 7.23: Comparison of Ultimate Moment Capacities from FEA and Shifferaw
and Schafer (2008) for Non-Standard Compact LSBs ............................................ 7-45
Table 7.24: Average and Maximum Membrane Strains of LSB Sections at Failure
............................................................................................................................. …7-48
Table 8.1: Idealised Simply Supported Boundary Conditions ................................ 8-11
Table 8.2: Elastic Lateral Distortional Buckling Moments of LSBs with Web
Stiffeners ................................................................................................................. 8-13
Table 8.3: Effect of Web Stiffener Arrangements on the Results of Mod from
Experimental Finite Element Models ...................................................................... 8-14
Table 8.4: Effect of Web Stiffener Spacing on the Elastic Distorional Buckling
Moments of LSBs in kNm ...................................................................................... 8-18
Table 8.5: Effect of Web Stiffener Sizes on the Elastic Lateral Distortional Buckling
Moments of LSBs .................................................................................................... 8-21
Table 8.5 (cont.): Effect of Web Stiffener Sizes on the Elastic Lateral Distortional
Buckling Moments of LSBs .................................................................................... 8-22
Table 8.5 (cont.): Effect of Web Stiffener Sizes on the Elastic Lateral Distortional
Buckling Moments of LSBs .................................................................................... 8-23
Table 8.6: Comparison of Elastic Buckling Moments ............................................ 8-25
Table 8.6 (continued): Comparison of Elastic Buckling Moments ......................... 8-26
List of Tables
xxix
Table 8.6 (continued): Comparison of Elastic Buckling Moments ......................... 8-27
Table 8.7: First Yield Moments of LSBs ................................................................ 8-29
Table 8.8: Comparison of Ultimate Moments with and without Web Stiffeners ... 8-33
Table 8.8 (continued): Comparison of Ultimate Moments with and without Web
Stiffeners (WS) ....................................................................................................... 8-34
Table 8.8 (continued): Comparison of Ultimate Moments with and without Web
Stiffeners (WS) ....................................................................................................... 8-35
Table 8.9: Section Properties of LSBs Including .................................................... 8-42
List of Tables
xxx
xxxi
STATEMENT OF ORIGINAL AUTHORSHIP
The work contained in this thesis has not been previously submitted to meet
requirements for an award at this or any other higher education institution. To the
best of my knowledge and belief, the thesis contains no material previously
published or written by another person except where due reference is made.
Tharmarajah Anapayan Signed: __________________________________________________ Date: __________________________________________________
xxxii
List of Symbols
xxxiii
LIST OF SYMBOLS
b = plate width
COV = Coefficient Of Variance
E = Young’s modulus
fcr = elastic critical buckling stress
fu = ultimate tensile strength
fyif = inner flange yield stress
fyof = outer flange yield stress
fyw = web yield stress
G = shear modulus
HFSB = Hollow Flange Steel Beam
HFB = Hollow Flange Beam
Ix = second moment of area about major axis
Iy = second moment of area about minor axis
Iw = warping constant
J = torsional constant
k = buckling co-efficient
K = geometrical parameter
L = span
λ = slenderness
λd = modified slenderness
λdw = modified slenderness with web stiffeners
LDB = Lateral Distortional Buckling
LSB = LiteSteel Beam
Mb = member moment capacity
Mc = critical moment
Mo = elatic lateral torsional buckling moment
Mod = elatic lateral distortional buckling moment
Modw = elatic lateral distortional buckling moment with web stiffeners
Mp = plastic moment
MPC = Multiple Point Constraint
List of Symbols
xxxiv
Ms = section moment capacity
My = first yield moment
υ = Poison’s ratio
Φ = capacity reduction factor
OATM = OneSteel Australian Tube Mills
S = plastic section modulus
SPC = Single Point Constraint
SSTM = Smorgon Steel Tube Mills
t = plate thickness
Z = full elastic section modulus
Zc = critical elastic section modulus
Ze = effective elastic section modulus
Acknowledgements
xxxv
ACKNOWLEDGEMENTS
The author wishes to express sincere gratitude to his supervisor, Professor Mahen
Mahendran for his patient guidance, invaluable expertise, rigorous discussions and
continuous support in many ways over the past three years. This study would not
have been success to this level without such assistance. The author would also like to
thank Dr. Jung Kwan Seo for his assistance and experience and friendship during his
postdoctoral study at QUT.
Author would like to thank QUT and OneSteel Australian Tube Mills (OATM) and
Australian Research Council (ARC) for providing financial support to this research.
The author would also like to thank Mr. Ross Dempsey, Manager - Research and
Testing, OneSteel Australian Tube Mills for his technical contributions, and his
overall support to the many different phases of this research project. Thanks also to
the School of Urban Development and the Faculty of Built Environment and
Engineering at QUT for providing the necessary facilities and technical support.
Many thanks to the structural laboratory staff members, particularly Mr. Arthur
Powell, Mr. Brian Pelin and Mr. Terry Beach for their assistance with operating the
equipment, fabrication and preparation of test set-up and specimens. Also many
thanks to staffs of high performance computing (HPC) and research support services
for providing necessary facilities and support with high performance computers and
relevant finite element packages. Special thank is given to Mr. Mark Barry for his
great help regarding HPC facilities.
The author wishes to thank Dr. John Papangelis for his assistance with THIN-WALL
program. Special thanks are given to senior postgraduate students, Dr. Yasintha
Bandulaheva and Mr. Win Kurniawan for their support during this research. It is also
important to thank fellow post-graduate students, Mr. Sivapathasunderam Jeyaragan,
Ms. Nirosha Dolamune Kankanamge, Mr. Poologanathan Keerthan, Mr.
Shanmuganathan Gunalan and Mr. Balachandren Baleshan for their support and
Acknowledgements
xxxvi
contribution to this research, and other postgraduate students for their friendship at
QUT.
Finally, the author wishes to express his sincere appreciation to his parents and sister,
particularly his mother, for their blessings, providing endless support and
encouragement and beliefs in his abilities.
Introduction
1-1
CHAPTER 1
1.0 INTRODUCTION
1.1 Cold-Formed Steel Members
Cold-formed steel members have been widely used in building applications for over
five decades. Their markets include the secondary cladding and purlin applications as
well as the primary applications as beams and columns of industrial, commercial and
housing systems. The reasons behind the growing popularity of these cold-formed
steel products include their ease of fabrication, high strength to weight ratio and
suitability for a wide range of applications. These advantages can result in more cost-
effective designs compared with hot-rolled steel members, especially in short-span
applications.
Figure 1.1: Cold-Formed Steel Structure
(www.structuretech.net)
Cold-formed steel members can be produced in a wide variety of section profiles, the
most commonly used of are the C- (channels) and the Z- sections. The thickness of
steel most frequently used for these structural members ranges from about 0.4 mm to
6.4 mm.
Introduction
1-2
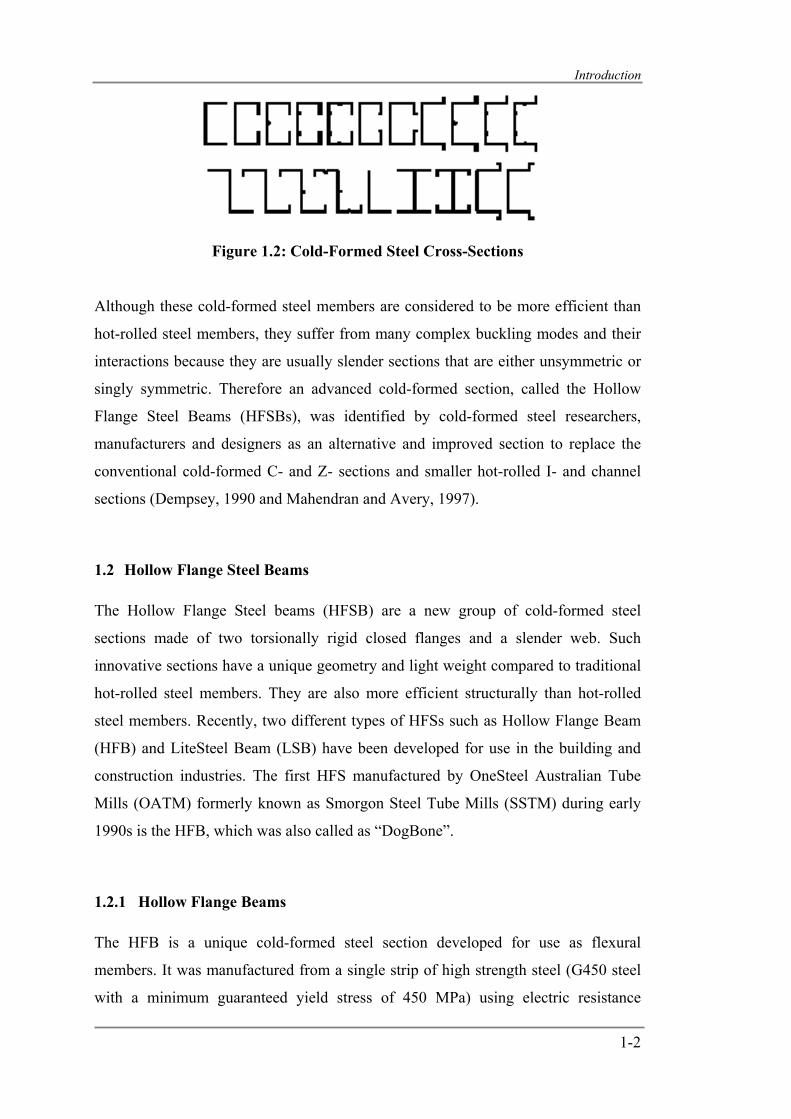
Figure 1.2: Cold-Formed Steel Cross-Sections
Although these cold-formed steel members are considered to be more efficient than
hot-rolled steel members, they suffer from many complex buckling modes and their
interactions because they are usually slender sections that are either unsymmetric or
singly symmetric. Therefore an advanced cold-formed section, called the Hollow
Flange Steel Beams (HFSBs), was identified by cold-formed steel researchers,
manufacturers and designers as an alternative and improved section to replace the
conventional cold-formed C- and Z- sections and smaller hot-rolled I- and channel
sections (Dempsey, 1990 and Mahendran and Avery, 1997).
1.2 Hollow Flange Steel Beams
The Hollow Flange Steel beams (HFSB) are a new group of cold-formed steel
sections made of two torsionally rigid closed flanges and a slender web. Such
innovative sections have a unique geometry and light weight compared to traditional
hot-rolled steel members. They are also more efficient structurally than hot-rolled
steel members. Recently, two different types of HFSs such as Hollow Flange Beam
(HFB) and LiteSteel Beam (LSB) have been developed for use in the building and
construction industries. The first HFS manufactured by OneSteel Australian Tube
Mills (OATM) formerly known as Smorgon Steel Tube Mills (SSTM) during early
1990s is the HFB, which was also called as “DogBone”.
1.2.1 Hollow Flange Beams
The HFB is a unique cold-formed steel section developed for use as flexural
members. It was manufactured from a single strip of high strength steel (G450 steel
with a minimum guaranteed yield stress of 450 MPa) using electric resistance
Introduction
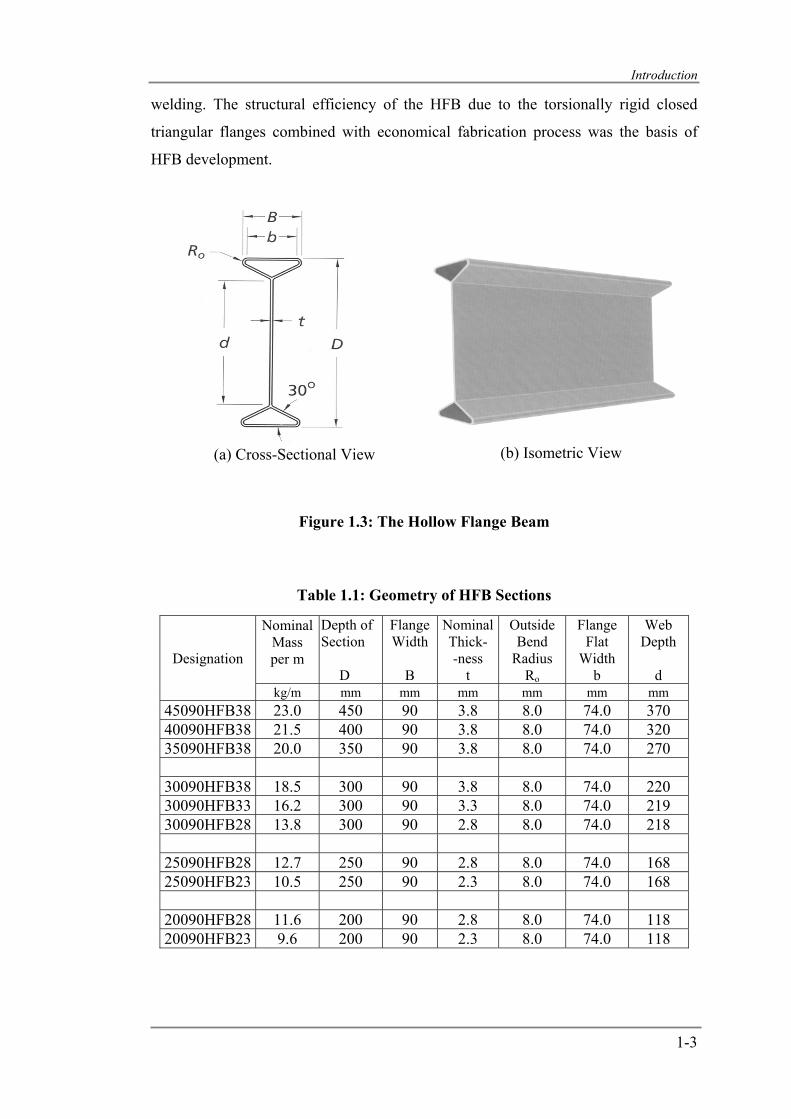
1-3
welding. The structural efficiency of the HFB due to the torsionally rigid closed
triangular flanges combined with economical fabrication process was the basis of
HFB development.
Figure 1.3: The Hollow Flange Beam
Table 1.1: Geometry of HFB Sections
Designation
Nominal Mass per m
Depth of Section D
Flange Width
B
NominalThick- -ness
t
Outside Bend
Radius Ro
Flange Flat
Width b
Web Depth
d
kg/m mm mm mm mm mm mm 45090HFB38 23.0 450 90 3.8 8.0 74.0 370 40090HFB38 21.5 400 90 3.8 8.0 74.0 320 35090HFB38 20.0 350 90 3.8 8.0 74.0 270
30090HFB38 18.5 300 90 3.8 8.0 74.0 220 30090HFB33 16.2 300 90 3.3 8.0 74.0 219 30090HFB28 13.8 300 90 2.8 8.0 74.0 218
25090HFB28 12.7 250 90 2.8 8.0 74.0 168 25090HFB23 10.5 250 90 2.3 8.0 74.0 168
20090HFB28 11.6 200 90 2.8 8.0 74.0 118 20090HFB23 9.6 200 90 2.3 8.0 74.0 118
(b) Isometric View (a) Cross-Sectional View
Introduction
1-4
Figures 1.3 (a) and (b) show the typical cross-section and an isometric view of HFB,
respectively while Table 1.1 presents the details of such HFBs. This doubly
symmetric member has been used as both compression and flexural members.
The HFBs when used as flexural members are subjected to a relatively new Lateral
Distortional Buckling (LDB) mode which reduces their moment capacity. This
caused the researchers to focus on this detrimental effect in the 1990s. It can be seen
in Table 1.1 that the flange width was 90 mm for all the HFBs and other flange
widths could not be manufactured using the existing equipment. The electric welding
process was also found to be somewhat expensive for the manufacturers. Therefore
the HFB production was discontinued in 1997.
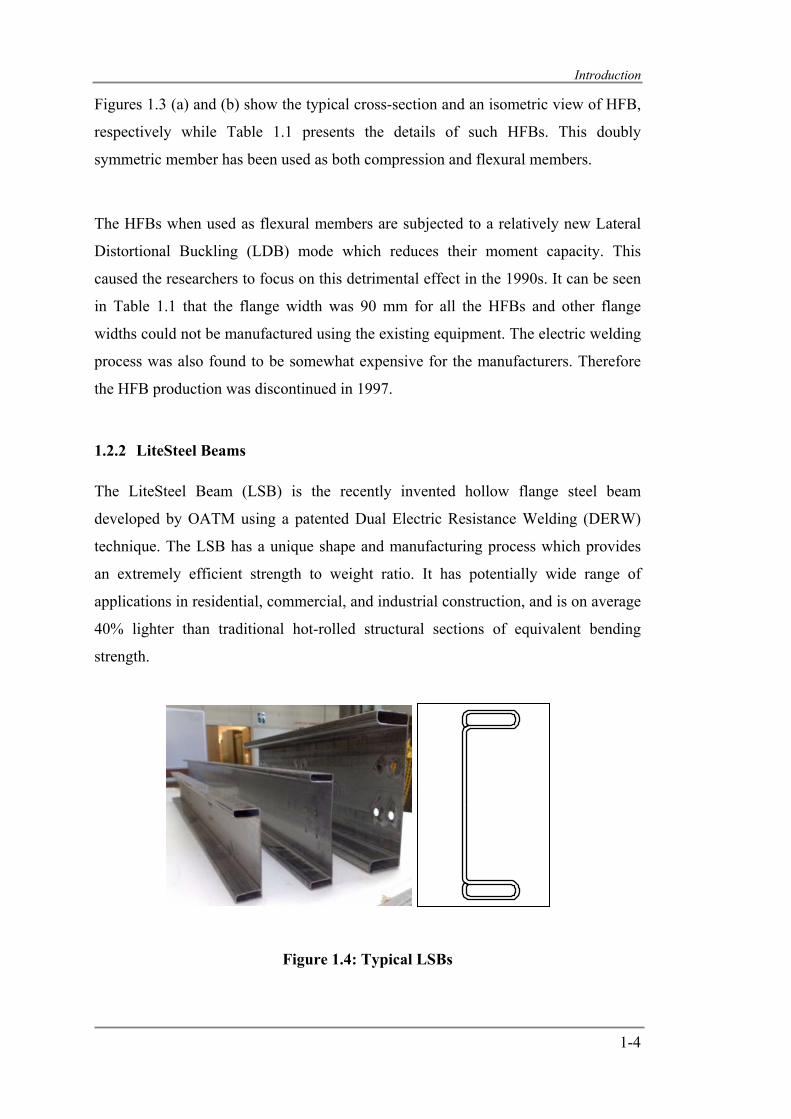
1.2.2 LiteSteel Beams
The LiteSteel Beam (LSB) is the recently invented hollow flange steel beam
developed by OATM using a patented Dual Electric Resistance Welding (DERW)
technique. The LSB has a unique shape and manufacturing process which provides
an extremely efficient strength to weight ratio. It has potentially wide range of
applications in residential, commercial, and industrial construction, and is on average
40% lighter than traditional hot-rolled structural sections of equivalent bending
strength.
Figure 1.4: Typical LSBs
Introduction
1-5
Figure 1.4 shows the typical section of LSBs. The high strength steel material used
for LSBs is DuoSteel grade with a web yield stress of 380 MPa and a flange yield
stress of 450 MPa. Initially it is from a base steel with a yield stress fy of 380 MPa
and a tensile strength fu of 490 MPa. However, the cold-forming process improves
the yield stress and tensile strength of the LSB flanges to 450 MPa and 500 MPa,
respectively (not for web). The mechanical properties of steel used in the design of
LSBs are given in Table 1.2.
Table 1.2: Mechanical Properties of LSBs
Location Minimum
Yield Stress, fy (MPa)
Minimum Tensile Strength,
fu (MPa)
Minimum Elongation as a Proportion of Gauge Length
of So (%) Web 380 490 14
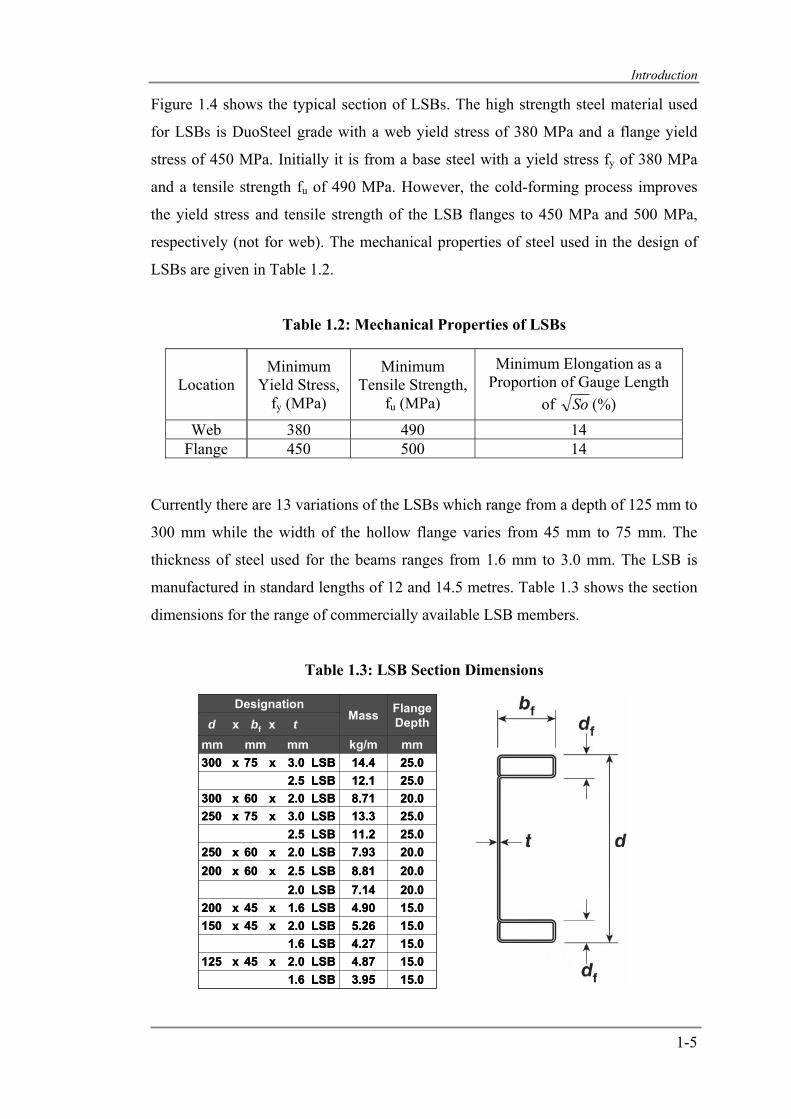
Flange 450 500 14 Currently there are 13 variations of the LSBs which range from a depth of 125 mm to
300 mm while the width of the hollow flange varies from 45 mm to 75 mm. The
thickness of steel used for the beams ranges from 1.6 mm to 3.0 mm. The LSB is
manufactured in standard lengths of 12 and 14.5 metres. Table 1.3 shows the section
dimensions for the range of commercially available LSB members.
Table 1.3: LSB Section Dimensions
20.07.93250 x 60 x 2.0 LSB
15.03.951.6 LSB15.04.87125 x 45 x 2.0 LSB15.04.271.6 LSB15.05.26150 x 45 x 2.0 LSB15.04.90200 x 45 x 1.6 LSB20.07.142.0 LSB20.08.81200 x 60 x 2.5 LSB
25.011.22.5 LSB25.013.3250 x 75 x 3.0 LSB20.08.71300 x 60 x 2.0 LSB25.012.12.5 LSB25.014.4300 x 75 x 3.0 LSBmmkg/mmm mm mm
d x bf x tFlange DepthMass
Designation
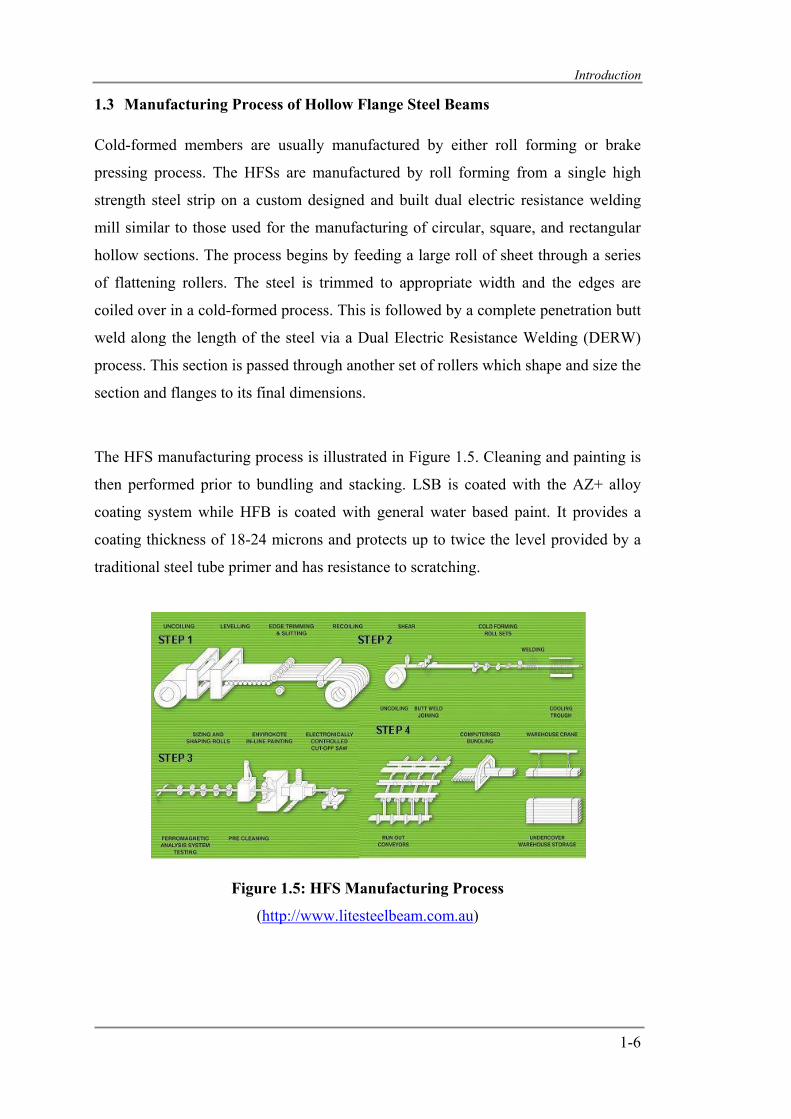
Introduction
1-6
1.3 Manufacturing Process of Hollow Flange Steel Beams
Cold-formed members are usually manufactured by either roll forming or brake
pressing process. The HFSs are manufactured by roll forming from a single high
strength steel strip on a custom designed and built dual electric resistance welding
mill similar to those used for the manufacturing of circular, square, and rectangular
hollow sections. The process begins by feeding a large roll of sheet through a series
of flattening rollers. The steel is trimmed to appropriate width and the edges are
coiled over in a cold-formed process. This is followed by a complete penetration butt
weld along the length of the steel via a Dual Electric Resistance Welding (DERW)
process. This section is passed through another set of rollers which shape and size the
section and flanges to its final dimensions.
The HFS manufacturing process is illustrated in Figure 1.5. Cleaning and painting is
then performed prior to bundling and stacking. LSB is coated with the AZ+ alloy
coating system while HFB is coated with general water based paint. It provides a
coating thickness of 18-24 microns and protects up to twice the level provided by a
traditional steel tube primer and has resistance to scratching.
Figure 1.5: HFS Manufacturing Process
(http://www.litesteelbeam.com.au)
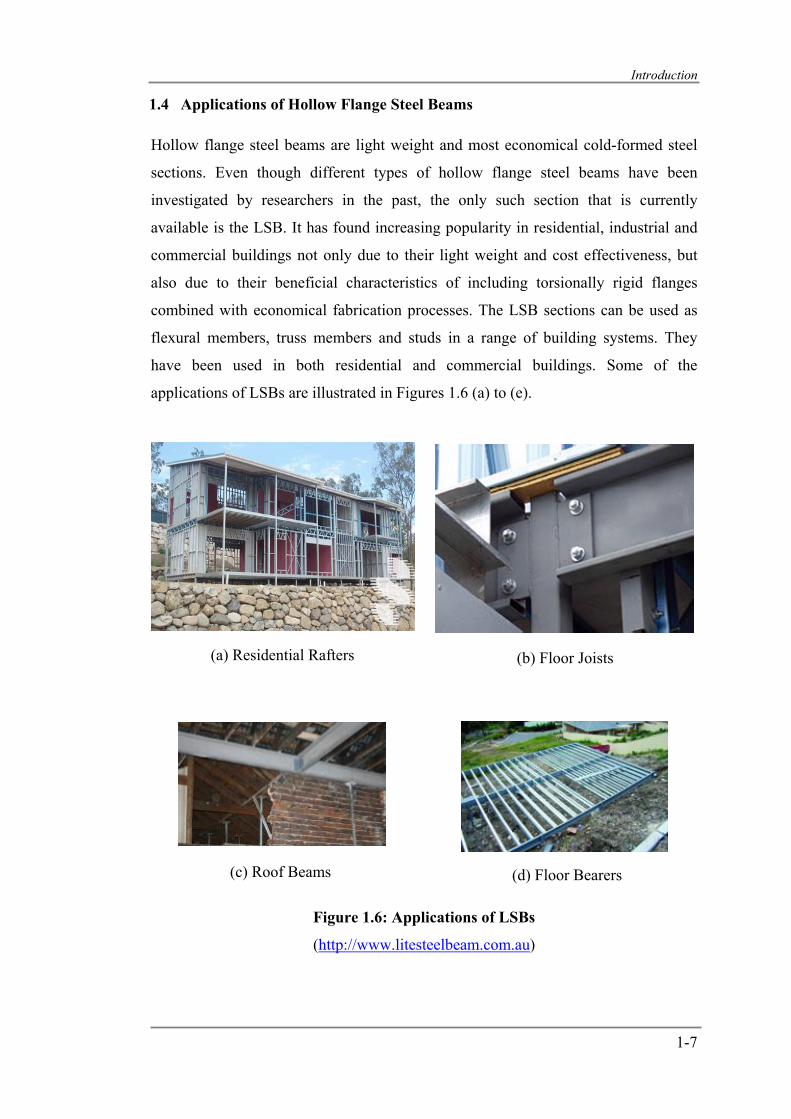
Introduction
1-7
1.4 Applications of Hollow Flange Steel Beams
Hollow flange steel beams are light weight and most economical cold-formed steel
sections. Even though different types of hollow flange steel beams have been
investigated by researchers in the past, the only such section that is currently
available is the LSB. It has found increasing popularity in residential, industrial and
commercial buildings not only due to their light weight and cost effectiveness, but
also due to their beneficial characteristics of including torsionally rigid flanges
combined with economical fabrication processes. The LSB sections can be used as
flexural members, truss members and studs in a range of building systems. They
have been used in both residential and commercial buildings. Some of the
applications of LSBs are illustrated in Figures 1.6 (a) to (e).
Figure 1.6: Applications of LSBs
(http://www.litesteelbeam.com.au)
(a) Residential Rafters (b) Floor Joists
(c) Roof Beams (d) Floor Bearers
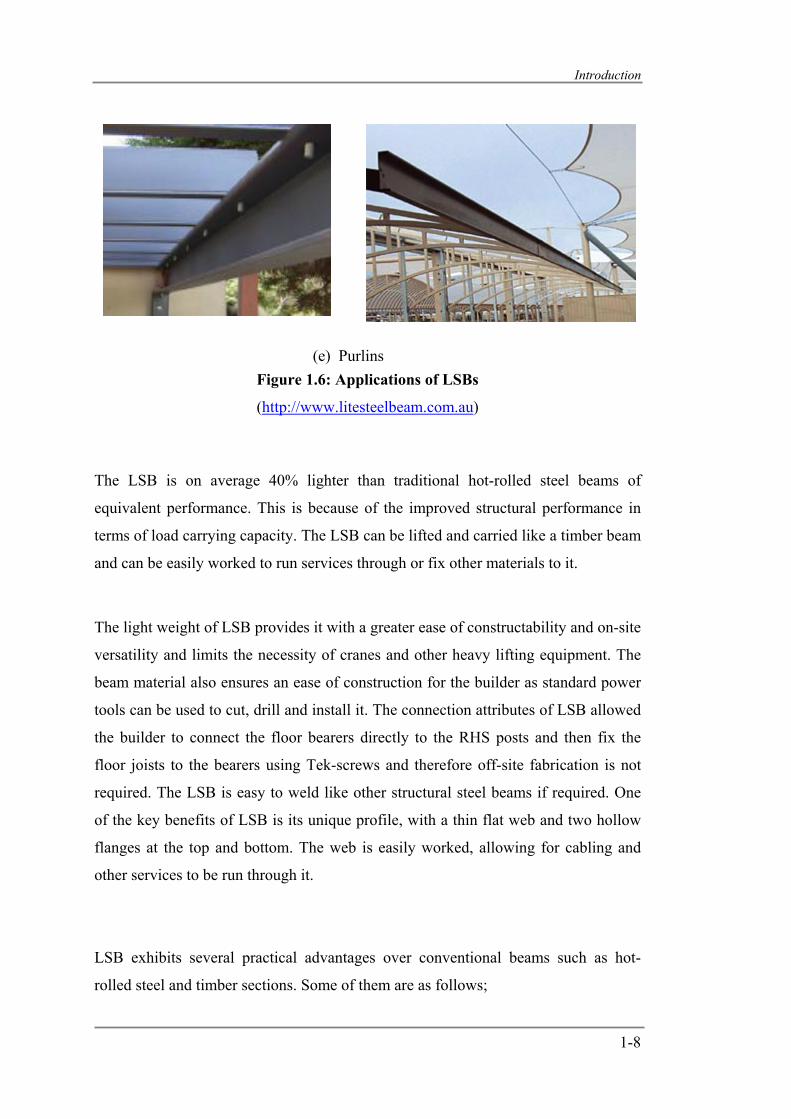
Introduction
1-8
Figure 1.6: Applications of LSBs
(http://www.litesteelbeam.com.au)
The LSB is on average 40% lighter than traditional hot-rolled steel beams of
equivalent performance. This is because of the improved structural performance in
terms of load carrying capacity. The LSB can be lifted and carried like a timber beam
and can be easily worked to run services through or fix other materials to it.
The light weight of LSB provides it with a greater ease of constructability and on-site
versatility and limits the necessity of cranes and other heavy lifting equipment. The
beam material also ensures an ease of construction for the builder as standard power
tools can be used to cut, drill and install it. The connection attributes of LSB allowed
the builder to connect the floor bearers directly to the RHS posts and then fix the
floor joists to the bearers using Tek-screws and therefore off-site fabrication is not
required. The LSB is easy to weld like other structural steel beams if required. One
of the key benefits of LSB is its unique profile, with a thin flat web and two hollow
flanges at the top and bottom. The web is easily worked, allowing for cabling and
other services to be run through it.
LSB exhibits several practical advantages over conventional beams such as hot-
rolled steel and timber sections. Some of them are as follows;
(e) Purlins
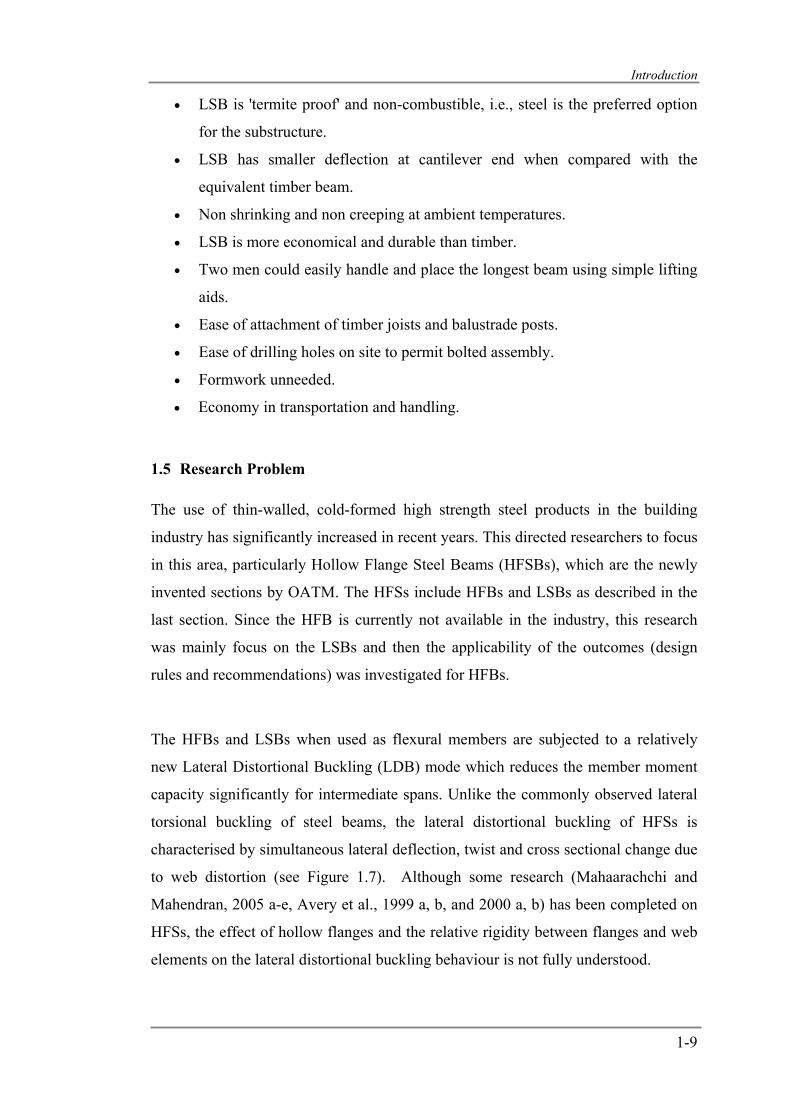
Introduction
1-9
• LSB is 'termite proof' and non-combustible, i.e., steel is the preferred option
for the substructure.
• LSB has smaller deflection at cantilever end when compared with the
equivalent timber beam.
• Non shrinking and non creeping at ambient temperatures.
• LSB is more economical and durable than timber.
• Two men could easily handle and place the longest beam using simple lifting
aids.
• Ease of attachment of timber joists and balustrade posts.
• Ease of drilling holes on site to permit bolted assembly.
• Formwork unneeded.
• Economy in transportation and handling.
1.5 Research Problem
The use of thin-walled, cold-formed high strength steel products in the building
industry has significantly increased in recent years. This directed researchers to focus
in this area, particularly Hollow Flange Steel Beams (HFSBs), which are the newly
invented sections by OATM. The HFSs include HFBs and LSBs as described in the
last section. Since the HFB is currently not available in the industry, this research
was mainly focus on the LSBs and then the applicability of the outcomes (design
rules and recommendations) was investigated for HFBs.
The HFBs and LSBs when used as flexural members are subjected to a relatively
new Lateral Distortional Buckling (LDB) mode which reduces the member moment
capacity significantly for intermediate spans. Unlike the commonly observed lateral
torsional buckling of steel beams, the lateral distortional buckling of HFSs is
characterised by simultaneous lateral deflection, twist and cross sectional change due
to web distortion (see Figure 1.7). Although some research (Mahaarachchi and
Mahendran, 2005 a-e, Avery et al., 1999 a, b, and 2000 a, b) has been completed on
HFSs, the effect of hollow flanges and the relative rigidity between flanges and web
elements on the lateral distortional buckling behaviour is not fully understood.
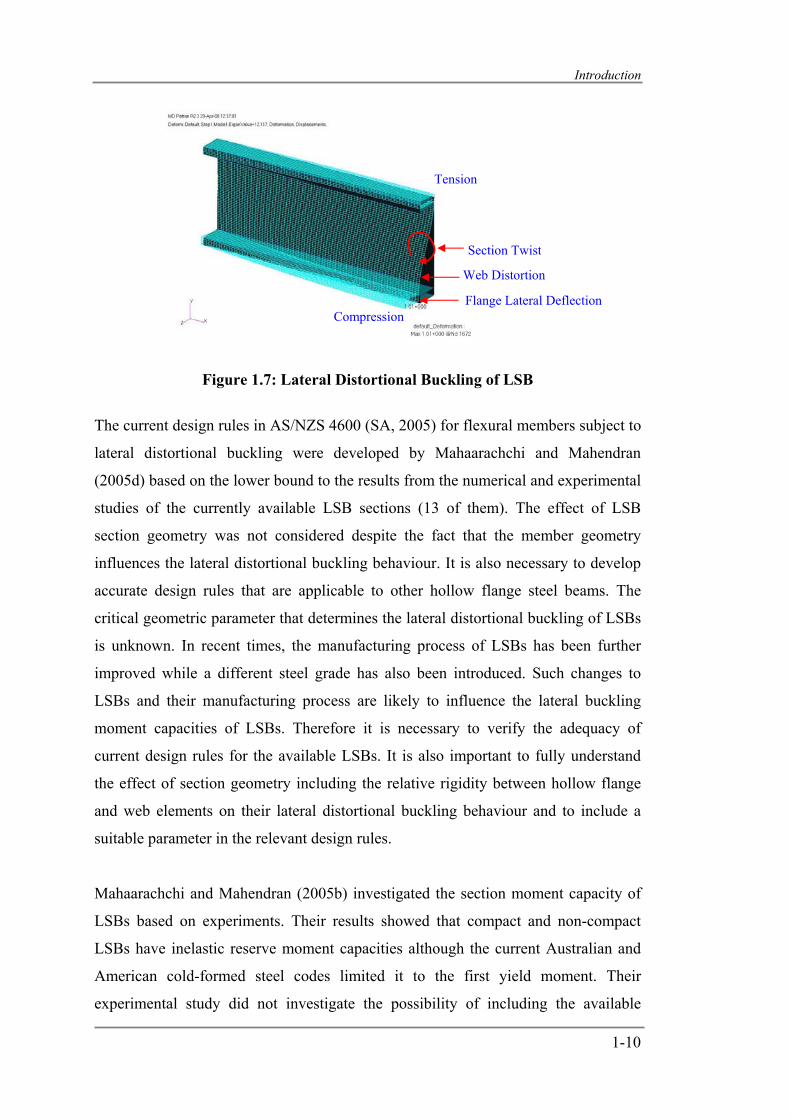
Introduction
1-10
Figure 1.7: Lateral Distortional Buckling of LSB
The current design rules in AS/NZS 4600 (SA, 2005) for flexural members subject to
lateral distortional buckling were developed by Mahaarachchi and Mahendran
(2005d) based on the lower bound to the results from the numerical and experimental
studies of the currently available LSB sections (13 of them). The effect of LSB
section geometry was not considered despite the fact that the member geometry
influences the lateral distortional buckling behaviour. It is also necessary to develop
accurate design rules that are applicable to other hollow flange steel beams. The
critical geometric parameter that determines the lateral distortional buckling of LSBs
is unknown. In recent times, the manufacturing process of LSBs has been further
improved while a different steel grade has also been introduced. Such changes to
LSBs and their manufacturing process are likely to influence the lateral buckling
moment capacities of LSBs. Therefore it is necessary to verify the adequacy of
current design rules for the available LSBs. It is also important to fully understand
the effect of section geometry including the relative rigidity between hollow flange
and web elements on their lateral distortional buckling behaviour and to include a
suitable parameter in the relevant design rules.
Mahaarachchi and Mahendran (2005b) investigated the section moment capacity of
LSBs based on experiments. Their results showed that compact and non-compact
LSBs have inelastic reserve moment capacities although the current Australian and
American cold-formed steel codes limited it to the first yield moment. Their
experimental study did not investigate the possibility of including the available
Flange Lateral Deflection
Web Distortion
Section Twist
Tension
Compression
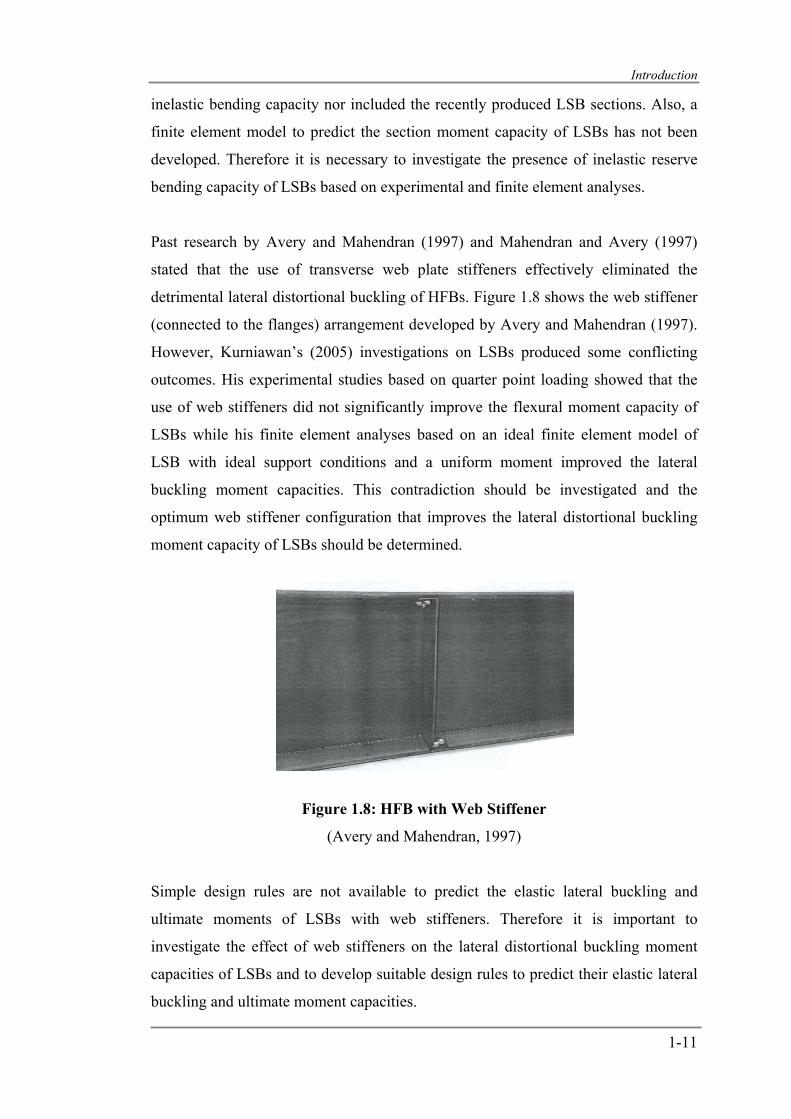
Introduction
1-11
inelastic bending capacity nor included the recently produced LSB sections. Also, a
finite element model to predict the section moment capacity of LSBs has not been
developed. Therefore it is necessary to investigate the presence of inelastic reserve
bending capacity of LSBs based on experimental and finite element analyses.
Past research by Avery and Mahendran (1997) and Mahendran and Avery (1997)
stated that the use of transverse web plate stiffeners effectively eliminated the
detrimental lateral distortional buckling of HFBs. Figure 1.8 shows the web stiffener
(connected to the flanges) arrangement developed by Avery and Mahendran (1997).
However, Kurniawan’s (2005) investigations on LSBs produced some conflicting
outcomes. His experimental studies based on quarter point loading showed that the
use of web stiffeners did not significantly improve the flexural moment capacity of
LSBs while his finite element analyses based on an ideal finite element model of
LSB with ideal support conditions and a uniform moment improved the lateral
buckling moment capacities. This contradiction should be investigated and the
optimum web stiffener configuration that improves the lateral distortional buckling
moment capacity of LSBs should be determined.
Figure 1.8: HFB with Web Stiffener
(Avery and Mahendran, 1997)
Simple design rules are not available to predict the elastic lateral buckling and
ultimate moments of LSBs with web stiffeners. Therefore it is important to
investigate the effect of web stiffeners on the lateral distortional buckling moment
capacities of LSBs and to develop suitable design rules to predict their elastic lateral
buckling and ultimate moment capacities.
Introduction
1-12
1.6 Research Objectives and Specific Tasks
The overall objective of this research is to investigate the member moment capacity
of LSBs with and without web stiffeners subject to lateral distortional and lateral
torsional buckling effects, and the section moment capacity of LSBs including their
inelastic reserve bending capacity so that safe and efficient design guidelines can be
developed for LSB flexural members in relation to their applications in the
construction industry.
Specific tasks are described next.
1. Conduct a series of lateral buckling tests on LSB sections subject to bending
and to compare the member moment capacity results with the predictions
from the current design rules in AS/NZS 4600 (SA, 2005). (Phase 1).
2. Develop suitable experimental and ideal finite element models of LSBs
subject to lateral distortional buckling and validate them using experimental
results and other numerical methods. (Phase 1).
3. Use the developed ideal finite element models with ideal support conditions
and a uniform moment in a parametric study to investigate the lateral
distortional and lateral torsional buckling modes of failures and the reduction
of member moment capacity due to lateral distortional buckling of LSBs, and
compare with predicted member moment capacities using the current
AS/NZS 4600 (SA, 2005) design rules. Modify and develop new design rules
if necessary. (Phase 1).
4. Investigate the effects of relevant geometrical parameters of LSBs such as
depth/thickness, slenderness of plate elements, torsional and flexural rigidity
of flanges and web using a parametric study based on the validated ideal
finite element model and determine the critical geometrical parameter that
influences the lateral distortional buckling capacity of LSBs. Develop new
design rules based on this geometrical parameter. (Phase 1).
Introduction
1-13
5. Verify the adequacy of the developed member moment capacity design rules
for lateral distortional buckling for other types of hollow flange steel beams
such as hollow flange beams. (Phase 1).
6. Conduct a series of section moment capacity tests to verify the existence of
inelastic bending capacity of LSBs. (Phase 2).
7. Develop suitable finite element models of LSBs to predict their section
moment capacity and validate them using experimental results. (Phase 2).
8. Use the validated finite element models to investigate the existence of
inelastic bending capacity and develop suitable design rules or
recommendations to calculate the section moment capacities of LSBs
including their inelastic bending reserve capacities. (Phase 2).
9. Develop suitable finite element models of LSBs with web stiffeners and
undertake a study to determine the optimum web stiffener configuration that
eliminates/reduces the detrimental lateral distortional buckling effects. (Phase
3).
10. Develop appropriate design rules to predict the elastic lateral distortional
buckling and ultimate member moment capacities of LSBs with the optimum
web stiffener configuration based on a detailed parametric study. (Phase 3).
11. Verify the applicability of the geometrical parameter found for unstiffened
LSBs to LSBs with web stiffeners. Develop or modify design equations based
on this geometrical parameter to predict the member moment capacities of
LSBs with web stiffeners. (Phase 3).
Ultimately, the accurate design rules developed for unstiffened and stiffened LSBs
will enhance their structural efficiency, mitigate lateral distortional buckling effects,
allow designers to make use of the increased lateral buckling capacities and the
Introduction
1-14
available inelastic reserve bending capacities, and increase their range of applications
in the construction industry.
1.7 Scope and Limitations
This research includes three major phases involving the following:
• Phase 1 – lateral distortional buckling of hollow flange steel beams and the
effects of their section geometry on lateral distortional buckling capacities
based on the experiments and finite element analyses,
• Phase 2 – section moment capacity of LSBs including the presence of their
inelastic reserve bending capacity based on the experimental and finite
element analyses and
• Phase 3 – effects of web stiffeners on the lateral distortional buckling
behaviour and capacity of LSBs based on finite element analyses.
The scope and limitations of this research based on the above three phases are as
follows:
1. Lateral distortional buckling behaviour of hollow flange steel beams subject
to a uniform bending moment with shear centre loading was considered.
However, the effects of moment gradient and load height were not
considered.
2. Elastic local buckling effects that may occur in thinner hollow flange steel
beams were not considered nor the interaction effects of local and lateral
buckling modes of failure.
3. Effects of transverse web stiffeners on the lateral distortional buckling
moment capacity of LSBs were considered under a uniform bending moment
with shear centre loading. However, the effects of moment gradient and load
height were not considered.
1.8 Thesis Contents
The outline of this thesis is as follows: Chapter 1 presents the introduction of thin-walled cold-formed steel members and
hollow flange steel beams such as Hollow Flange Beams (HFBs) and
Introduction
1-15
LiteSteel Beams (LSBs) and describes the manufacturing process,
mechanical properties, shapes and dimensions, and their applications in
the building industry. This chapter then provides the details of research
problems, objectives and research methods.
Chapter 2 presents the relevant literature review to successfully carry out this
research. It describes the buckling behaviour of cold-formed steel
members and hollow flanges sections. Further, it describes the past
research conducted on cold-formed steel members and LSBs subject to
lateral distortional buckling and the current design methods.
Chapter 3 presents the details of tensile coupon tests, residual stress measurements
and imperfection measurements of LSBs.
Chapter 4 presents the experimental investigation of LSBs subject to lateral
buckling. A comparison of the tests results with the current design rules
is also presented in this chapter.
Chapter 5 presents the details of the development and validation of both
experimental and ideal finite element models of LSBs subject to lateral
buckling.
Chapter 6 presents the details of a parametric study on the lateral buckling of LSBs,
effects of imperfections and residual stresses and the development of
design rules based on the ideal finite element model of LSBs subject to
lateral buckling. This chapter also includes the investigation on the
effects of section geometry of LSBs on the lateral distortional buckling
behaviour and the development suitable design rules based on a suitable
geometrical parameter.
Chapter 7 presents the details of the investigation of section moment capacity of
LSBs including inelastic bending reserve capacity based on experimental
and finite element analyses.
Introduction
1-16
Chapter 8 presents the details of the effect of web stiffeners on the lateral
distortional buckling moment capacity of LSBs based on finite element
analyses. Suitable design rules to calculate the elastic lateral buckling
and ultimate moment capacities of LSBs with web stiffeners are also
presented in this chapter.
Chapter 9 presents the significant findings from this research and the
recommendations for future research.
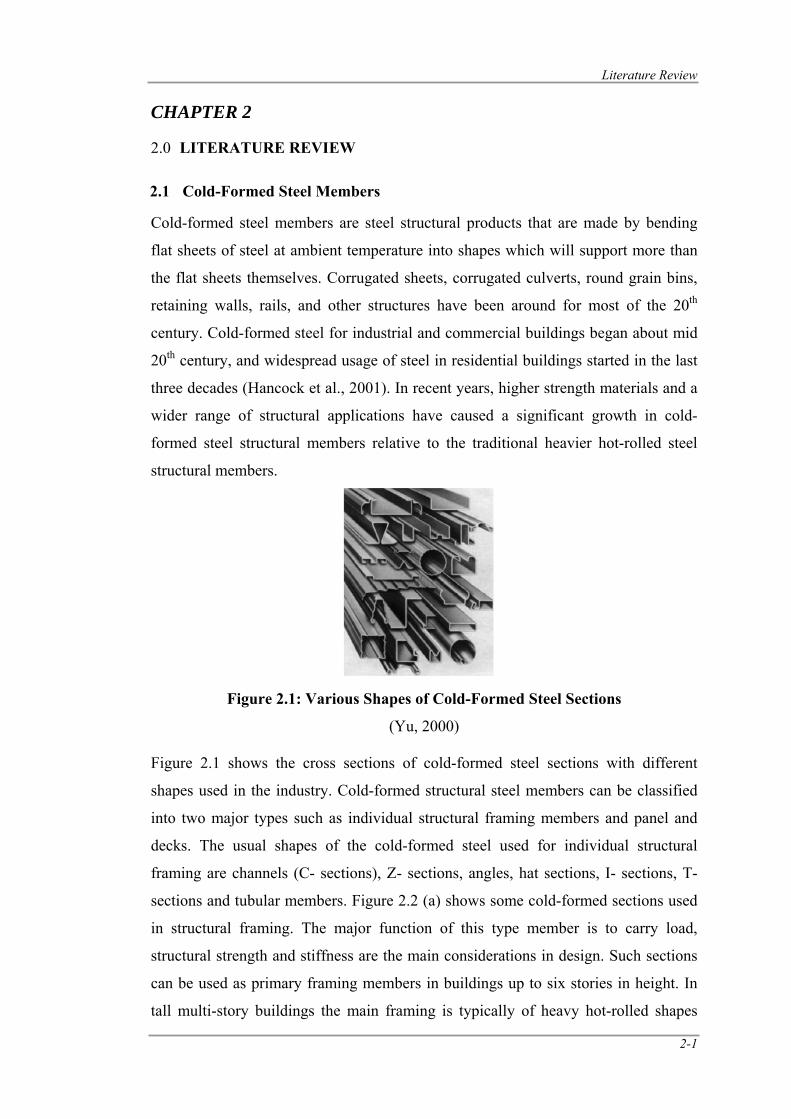
Literature Review
2-1
CHAPTER 2
2.0 LITERATURE REVIEW
2.1 Cold-Formed Steel Members
Cold-formed steel members are steel structural products that are made by bending
flat sheets of steel at ambient temperature into shapes which will support more than
the flat sheets themselves. Corrugated sheets, corrugated culverts, round grain bins,
retaining walls, rails, and other structures have been around for most of the 20th
century. Cold-formed steel for industrial and commercial buildings began about mid
20th century, and widespread usage of steel in residential buildings started in the last
three decades (Hancock et al., 2001). In recent years, higher strength materials and a
wider range of structural applications have caused a significant growth in cold-
formed steel structural members relative to the traditional heavier hot-rolled steel
structural members.
Figure 2.1: Various Shapes of Cold-Formed Steel Sections
(Yu, 2000) Figure 2.1 shows the cross sections of cold-formed steel sections with different
shapes used in the industry. Cold-formed structural steel members can be classified
into two major types such as individual structural framing members and panel and
decks. The usual shapes of the cold-formed steel used for individual structural
framing are channels (C- sections), Z- sections, angles, hat sections, I- sections, T-
sections and tubular members. Figure 2.2 (a) shows some cold-formed sections used
in structural framing. The major function of this type member is to carry load,
structural strength and stiffness are the main considerations in design. Such sections
can be used as primary framing members in buildings up to six stories in height. In
tall multi-story buildings the main framing is typically of heavy hot-rolled shapes
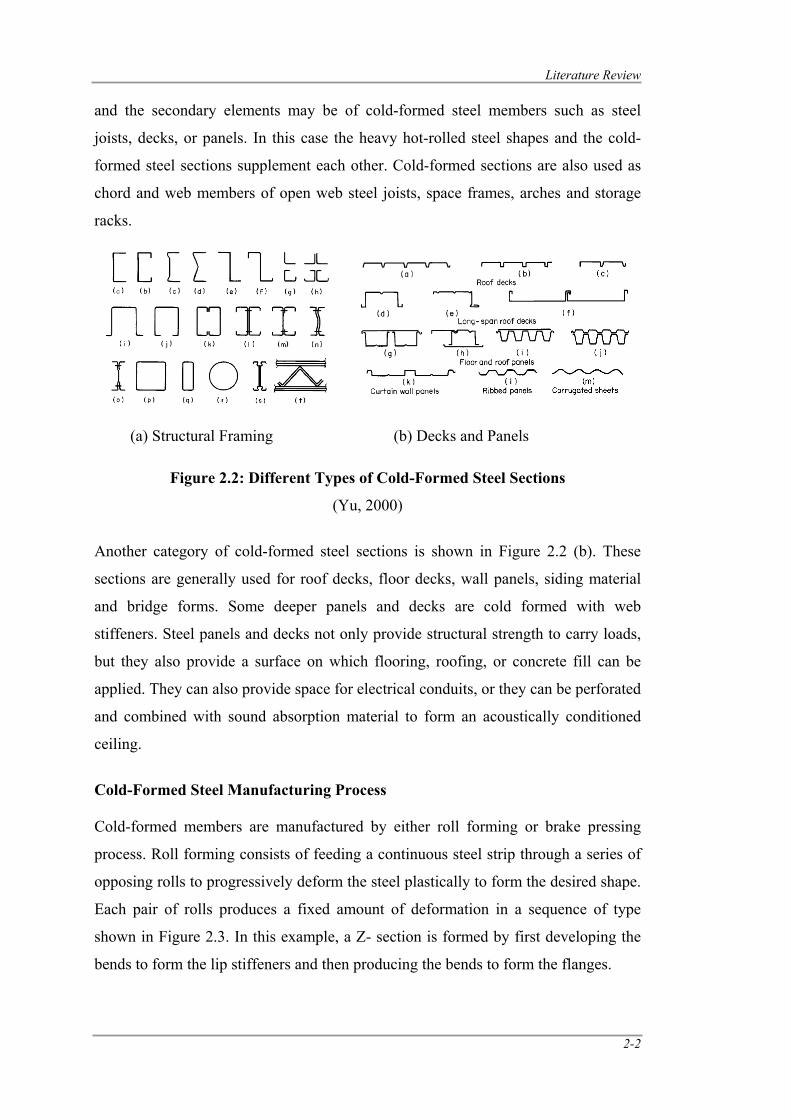
Literature Review
2-2
and the secondary elements may be of cold-formed steel members such as steel
joists, decks, or panels. In this case the heavy hot-rolled steel shapes and the cold-
formed steel sections supplement each other. Cold-formed sections are also used as
chord and web members of open web steel joists, space frames, arches and storage
racks.
Figure 2.2: Different Types of Cold-Formed Steel Sections
(Yu, 2000)
Another category of cold-formed steel sections is shown in Figure 2.2 (b). These
sections are generally used for roof decks, floor decks, wall panels, siding material
and bridge forms. Some deeper panels and decks are cold formed with web
stiffeners. Steel panels and decks not only provide structural strength to carry loads,
but they also provide a surface on which flooring, roofing, or concrete fill can be
applied. They can also provide space for electrical conduits, or they can be perforated
and combined with sound absorption material to form an acoustically conditioned
ceiling.
Cold-Formed Steel Manufacturing Process
Cold-formed members are manufactured by either roll forming or brake pressing
process. Roll forming consists of feeding a continuous steel strip through a series of
opposing rolls to progressively deform the steel plastically to form the desired shape.
Each pair of rolls produces a fixed amount of deformation in a sequence of type
shown in Figure 2.3. In this example, a Z- section is formed by first developing the
bends to form the lip stiffeners and then producing the bends to form the flanges.
(a) Structural Framing (b) Decks and Panels
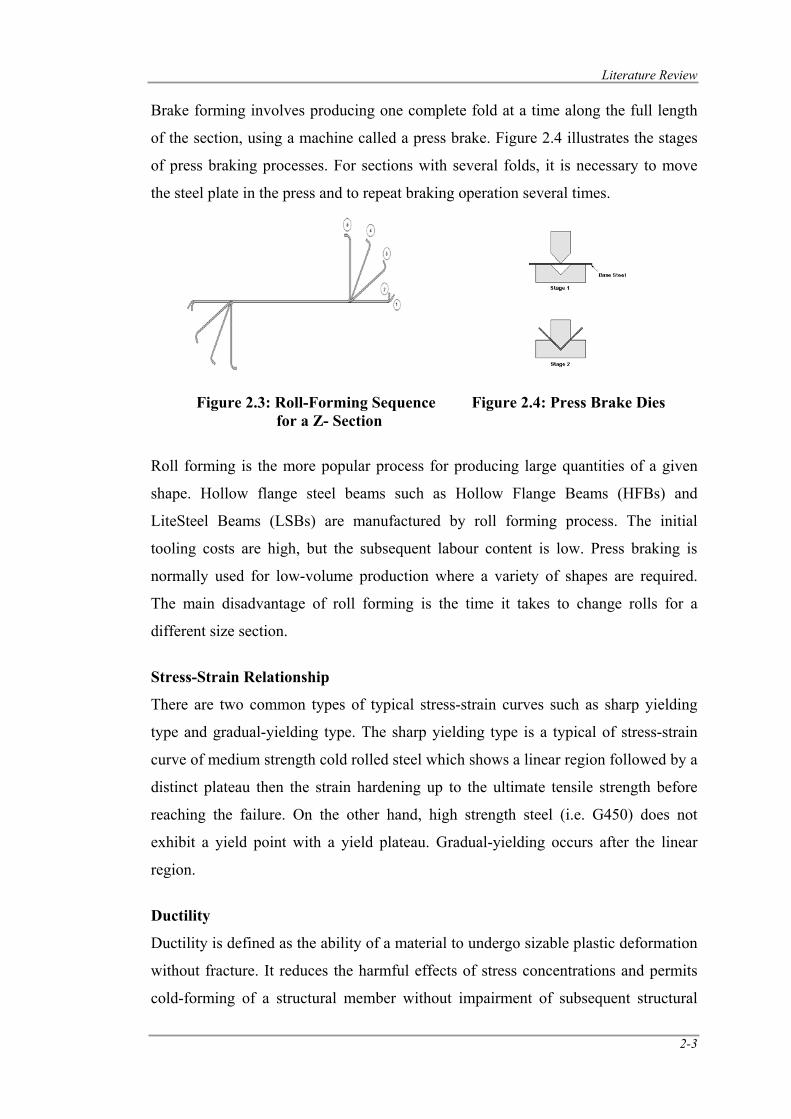
Literature Review
2-3
Brake forming involves producing one complete fold at a time along the full length
of the section, using a machine called a press brake. Figure 2.4 illustrates the stages
of press braking processes. For sections with several folds, it is necessary to move
the steel plate in the press and to repeat braking operation several times.
Roll forming is the more popular process for producing large quantities of a given
shape. Hollow flange steel beams such as Hollow Flange Beams (HFBs) and
LiteSteel Beams (LSBs) are manufactured by roll forming process. The initial
tooling costs are high, but the subsequent labour content is low. Press braking is
normally used for low-volume production where a variety of shapes are required.
The main disadvantage of roll forming is the time it takes to change rolls for a
different size section.
Stress-Strain Relationship
There are two common types of typical stress-strain curves such as sharp yielding
type and gradual-yielding type. The sharp yielding type is a typical of stress-strain
curve of medium strength cold rolled steel which shows a linear region followed by a
distinct plateau then the strain hardening up to the ultimate tensile strength before
reaching the failure. On the other hand, high strength steel (i.e. G450) does not
exhibit a yield point with a yield plateau. Gradual-yielding occurs after the linear
region.
Ductility
Ductility is defined as the ability of a material to undergo sizable plastic deformation
without fracture. It reduces the harmful effects of stress concentrations and permits
cold-forming of a structural member without impairment of subsequent structural
Figure 2.3: Roll-Forming Sequence for a Z- Section
Figure 2.4: Press Brake Dies
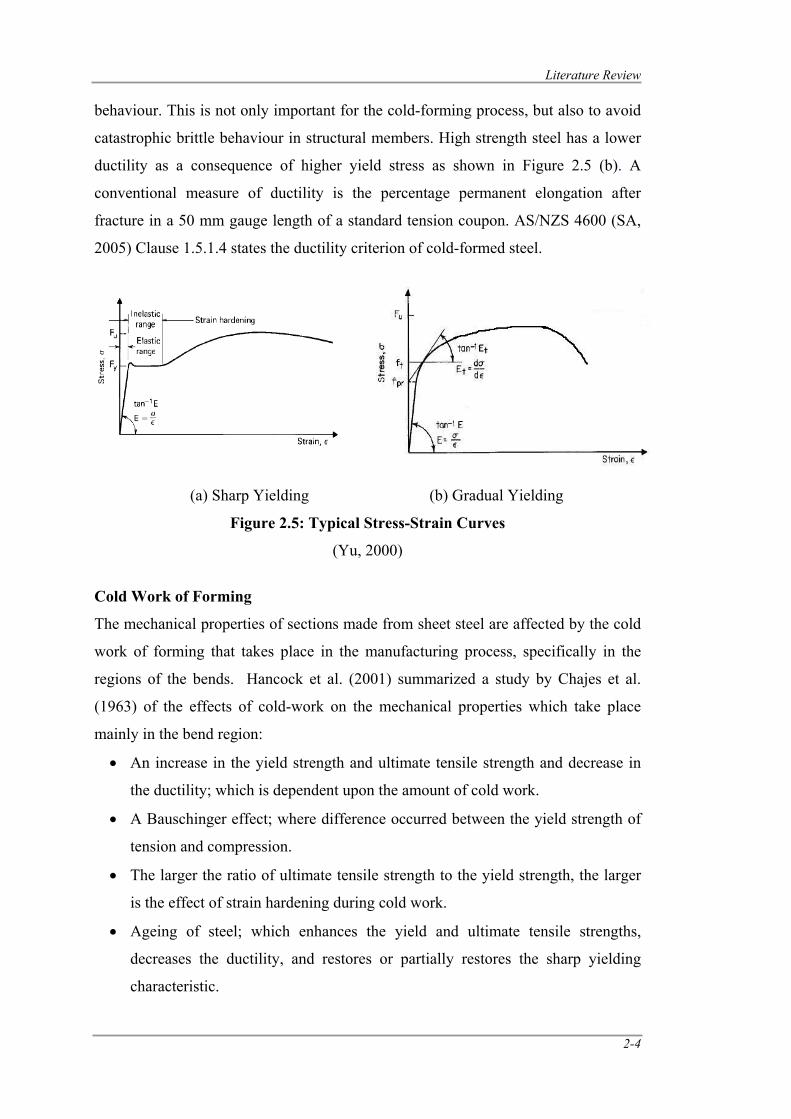
Literature Review
2-4
behaviour. This is not only important for the cold-forming process, but also to avoid
catastrophic brittle behaviour in structural members. High strength steel has a lower
ductility as a consequence of higher yield stress as shown in Figure 2.5 (b). A
conventional measure of ductility is the percentage permanent elongation after
fracture in a 50 mm gauge length of a standard tension coupon. AS/NZS 4600 (SA,
2005) Clause 1.5.1.4 states the ductility criterion of cold-formed steel.
(a) Sharp Yielding (b) Gradual Yielding
Figure 2.5: Typical Stress-Strain Curves
(Yu, 2000)
Cold Work of Forming
The mechanical properties of sections made from sheet steel are affected by the cold
work of forming that takes place in the manufacturing process, specifically in the
regions of the bends. Hancock et al. (2001) summarized a study by Chajes et al.
(1963) of the effects of cold-work on the mechanical properties which take place
mainly in the bend region:
• An increase in the yield strength and ultimate tensile strength and decrease in
the ductility; which is dependent upon the amount of cold work.
• A Bauschinger effect; where difference occurred between the yield strength of
tension and compression.
• The larger the ratio of ultimate tensile strength to the yield strength, the larger
is the effect of strain hardening during cold work.
• Ageing of steel; which enhances the yield and ultimate tensile strengths,
decreases the ductility, and restores or partially restores the sharp yielding
characteristic.
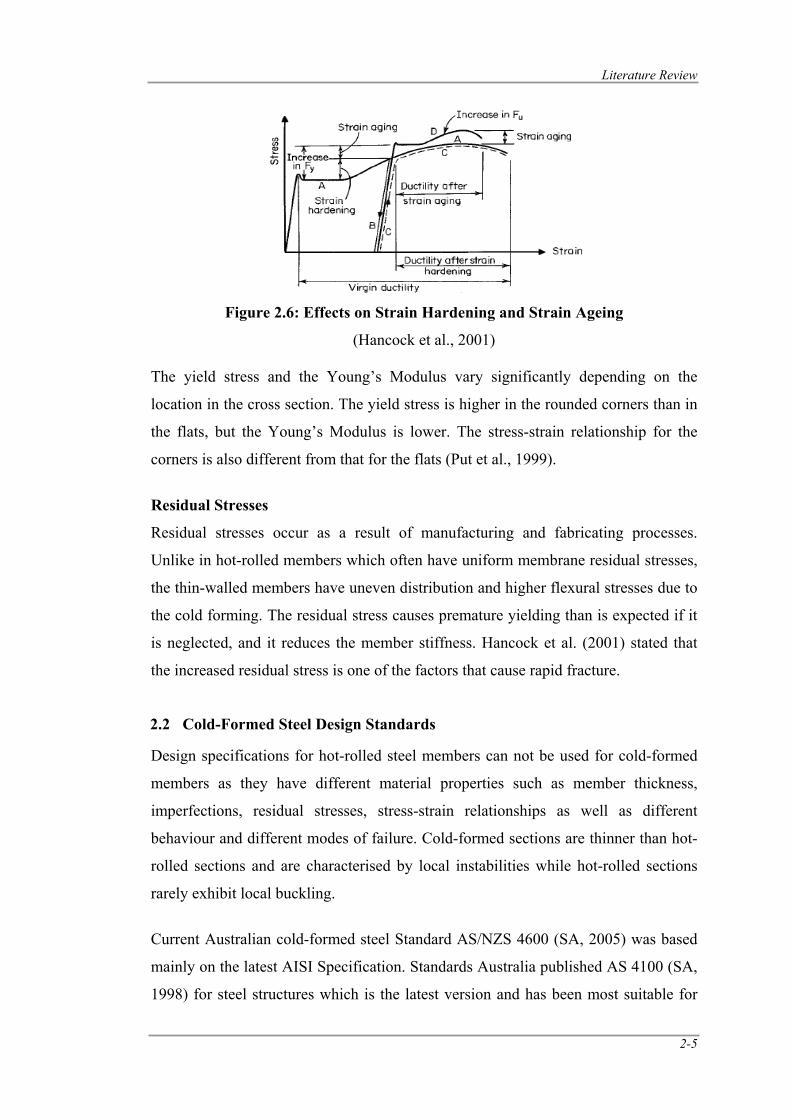
Literature Review
2-5
Figure 2.6: Effects on Strain Hardening and Strain Ageing
(Hancock et al., 2001) The yield stress and the Young’s Modulus vary significantly depending on the
location in the cross section. The yield stress is higher in the rounded corners than in
the flats, but the Young’s Modulus is lower. The stress-strain relationship for the
corners is also different from that for the flats (Put et al., 1999).
Residual Stresses
Residual stresses occur as a result of manufacturing and fabricating processes.
Unlike in hot-rolled members which often have uniform membrane residual stresses,
the thin-walled members have uneven distribution and higher flexural stresses due to
the cold forming. The residual stress causes premature yielding than is expected if it
is neglected, and it reduces the member stiffness. Hancock et al. (2001) stated that
the increased residual stress is one of the factors that cause rapid fracture.
2.2 Cold-Formed Steel Design Standards
Design specifications for hot-rolled steel members can not be used for cold-formed
members as they have different material properties such as member thickness,
imperfections, residual stresses, stress-strain relationships as well as different
behaviour and different modes of failure. Cold-formed sections are thinner than hot-
rolled sections and are characterised by local instabilities while hot-rolled sections
rarely exhibit local buckling.
Current Australian cold-formed steel Standard AS/NZS 4600 (SA, 2005) was based
mainly on the latest AISI Specification. Standards Australia published AS 4100 (SA,
1998) for steel structures which is the latest version and has been most suitable for
Literature Review
2-6
hot-rolled members. British Standard BS 5950 Part 5 (BSI, 1998) specifies guidance
for the design of cold-formed structural steel works. Eurocode 3 (ECS, 1996) and
Canadian Standards are the other international standards providing design guidance
for cold-formed steel structures. The Direct Strength Method is the new design
method for cold-formed steel members and is adopted in the supplement to the North
American specification (AISI, 2004). It is also included in Section 7 of AS/NZS
4600 (SA, 2005). A Direct Strength Method Design Guide (CF06-1) was published
by AISI (2006).
2.3 Buckling Behaviour of Cold-Formed Steel Beams
Buckling is characterised by deformation of the plate elements or members under
compressive stresses. Beams when subject to bending action introduces tensile and
compressive stresses either side of the neutral axis where buckling is likely to occur
in the compressive stress region. Because of the open nature and the thin material
used in cold-formed steel, the failure mode under flexural action has higher
complexity than the hot-rolled members. Cross section instabilities in cold-formed
steel beams include local buckling, distortional buckling and lateral torsional
buckling.
Generally, lateral torsional buckling predominantly limits the cold-formed beam
design; hence requires lateral restraint provision. However, the improvement in the
shape has led to a new buckling mode, lateral distortional buckling.
The cross section deformations associated with each of the three buckling modes are
illustrated in Figure 2.7. Local buckling involves distortion of the cross section with
only rotation occurring at interior fold lines of the section. Distortional buckling
involves distortion of the cross section with rotation and translation occurring at
interior fold lines. Lateral torsional buckling excludes distortion of the cross section;
however, translation and rotation of the entire cross section occur. Local buckling
occurs in short span members while lateral torsional buckling occurs in long span
members and distortional buckling in beams with intermediate spans. Figures 2.8 (a)
to (d) show the different modes of buckling failure that occur in channel sections.
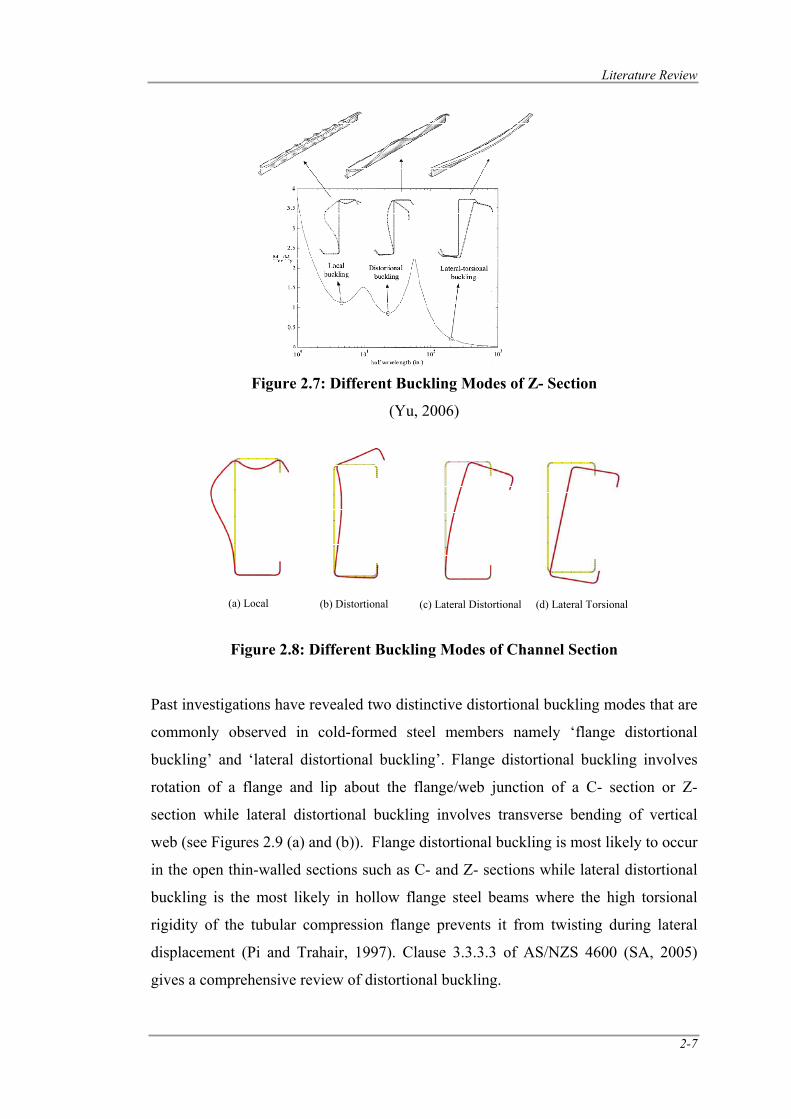
Literature Review
2-7
Figure 2.7: Different Buckling Modes of Z- Section
(Yu, 2006)
Figure 2.8: Different Buckling Modes of Channel Section Past investigations have revealed two distinctive distortional buckling modes that are
commonly observed in cold-formed steel members namely ‘flange distortional
buckling’ and ‘lateral distortional buckling’. Flange distortional buckling involves
rotation of a flange and lip about the flange/web junction of a C- section or Z-
section while lateral distortional buckling involves transverse bending of vertical
web (see Figures 2.9 (a) and (b)). Flange distortional buckling is most likely to occur
in the open thin-walled sections such as C- and Z- sections while lateral distortional
buckling is the most likely in hollow flange steel beams where the high torsional
rigidity of the tubular compression flange prevents it from twisting during lateral
displacement (Pi and Trahair, 1997). Clause 3.3.3.3 of AS/NZS 4600 (SA, 2005)
gives a comprehensive review of distortional buckling.
(a) Local (b) Distortional (c) Lateral Distortional (d) Lateral Torsional
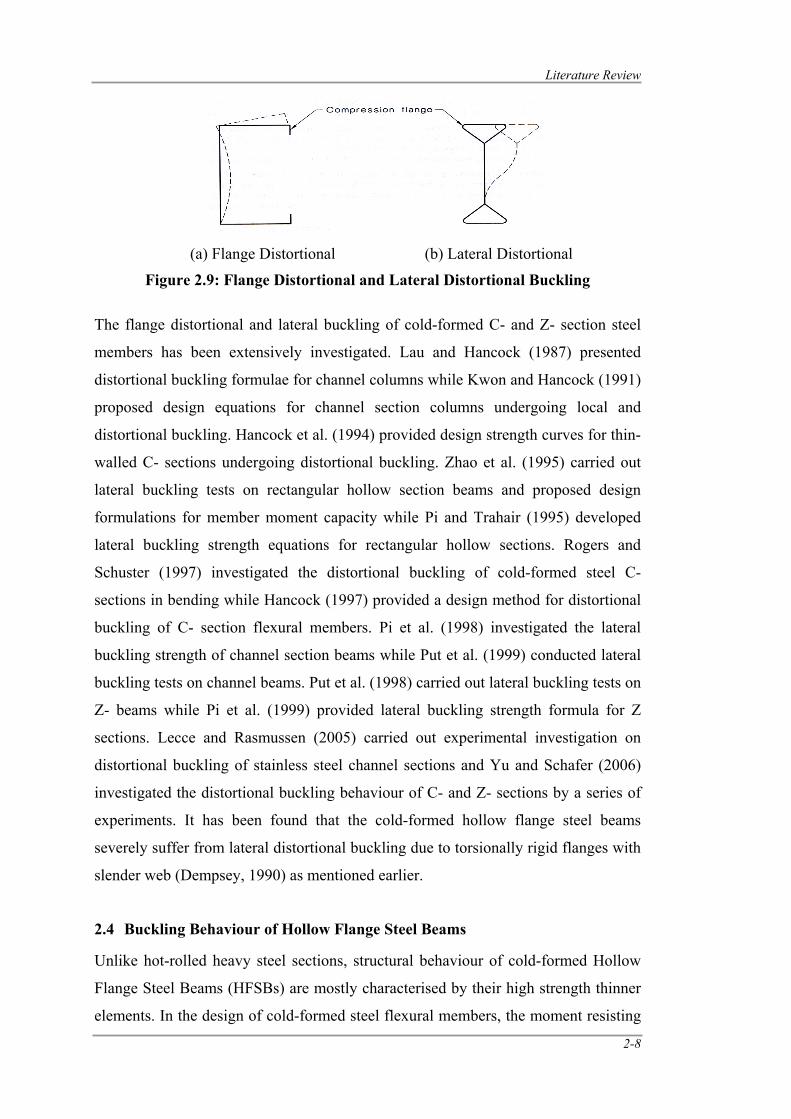
Literature Review
2-8
Figure 2.9: Flange Distortional and Lateral Distortional Buckling
The flange distortional and lateral buckling of cold-formed C- and Z- section steel
members has been extensively investigated. Lau and Hancock (1987) presented
distortional buckling formulae for channel columns while Kwon and Hancock (1991)
proposed design equations for channel section columns undergoing local and
distortional buckling. Hancock et al. (1994) provided design strength curves for thin-
walled C- sections undergoing distortional buckling. Zhao et al. (1995) carried out
lateral buckling tests on rectangular hollow section beams and proposed design
formulations for member moment capacity while Pi and Trahair (1995) developed
lateral buckling strength equations for rectangular hollow sections. Rogers and
Schuster (1997) investigated the distortional buckling of cold-formed steel C-
sections in bending while Hancock (1997) provided a design method for distortional
buckling of C- section flexural members. Pi et al. (1998) investigated the lateral
buckling strength of channel section beams while Put et al. (1999) conducted lateral
buckling tests on channel beams. Put et al. (1998) carried out lateral buckling tests on
Z- beams while Pi et al. (1999) provided lateral buckling strength formula for Z
sections. Lecce and Rasmussen (2005) carried out experimental investigation on
distortional buckling of stainless steel channel sections and Yu and Schafer (2006)
investigated the distortional buckling behaviour of C- and Z- sections by a series of
experiments. It has been found that the cold-formed hollow flange steel beams
severely suffer from lateral distortional buckling due to torsionally rigid flanges with
slender web (Dempsey, 1990) as mentioned earlier.
2.4 Buckling Behaviour of Hollow Flange Steel Beams
Unlike hot-rolled heavy steel sections, structural behaviour of cold-formed Hollow
Flange Steel Beams (HFSBs) are mostly characterised by their high strength thinner
elements. In the design of cold-formed steel flexural members, the moment resisting
(a) Flange Distortional (b) Lateral Distortional
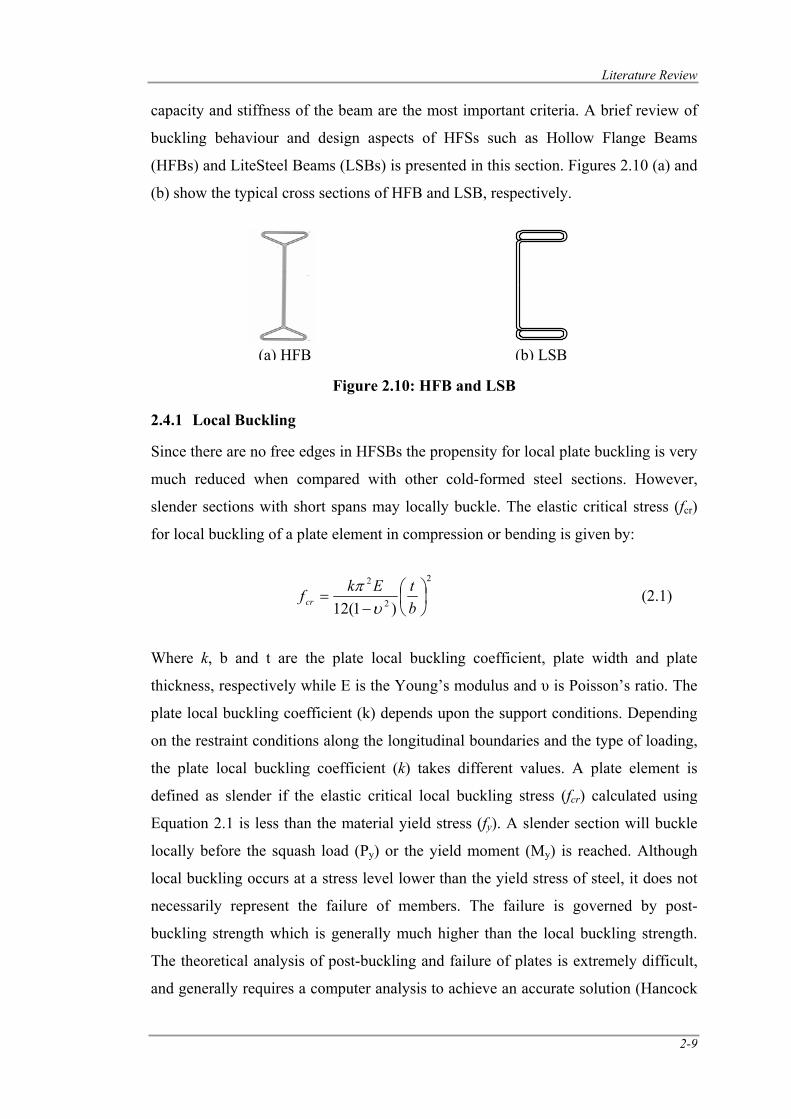
Literature Review
2-9
capacity and stiffness of the beam are the most important criteria. A brief review of
buckling behaviour and design aspects of HFSs such as Hollow Flange Beams
(HFBs) and LiteSteel Beams (LSBs) is presented in this section. Figures 2.10 (a) and
(b) show the typical cross sections of HFB and LSB, respectively.
Figure 2.10: HFB and LSB
2.4.1 Local Buckling
Since there are no free edges in HFSBs the propensity for local plate buckling is very
much reduced when compared with other cold-formed steel sections. However,
slender sections with short spans may locally buckle. The elastic critical stress (fcr)
for local buckling of a plate element in compression or bending is given by:
2
2
2
)1(12⎟⎠⎞
⎜⎝⎛
−=
btEkfcr υ
π (2.1)
Where k, b and t are the plate local buckling coefficient, plate width and plate
thickness, respectively while E is the Young’s modulus and υ is Poisson’s ratio. The
plate local buckling coefficient (k) depends upon the support conditions. Depending
on the restraint conditions along the longitudinal boundaries and the type of loading,
the plate local buckling coefficient (k) takes different values. A plate element is
defined as slender if the elastic critical local buckling stress (fcr) calculated using
Equation 2.1 is less than the material yield stress (fy). A slender section will buckle
locally before the squash load (Py) or the yield moment (My) is reached. Although
local buckling occurs at a stress level lower than the yield stress of steel, it does not
necessarily represent the failure of members. The failure is governed by post-
buckling strength which is generally much higher than the local buckling strength.
The theoretical analysis of post-buckling and failure of plates is extremely difficult,
and generally requires a computer analysis to achieve an accurate solution (Hancock
(a) HFB (b) LSB
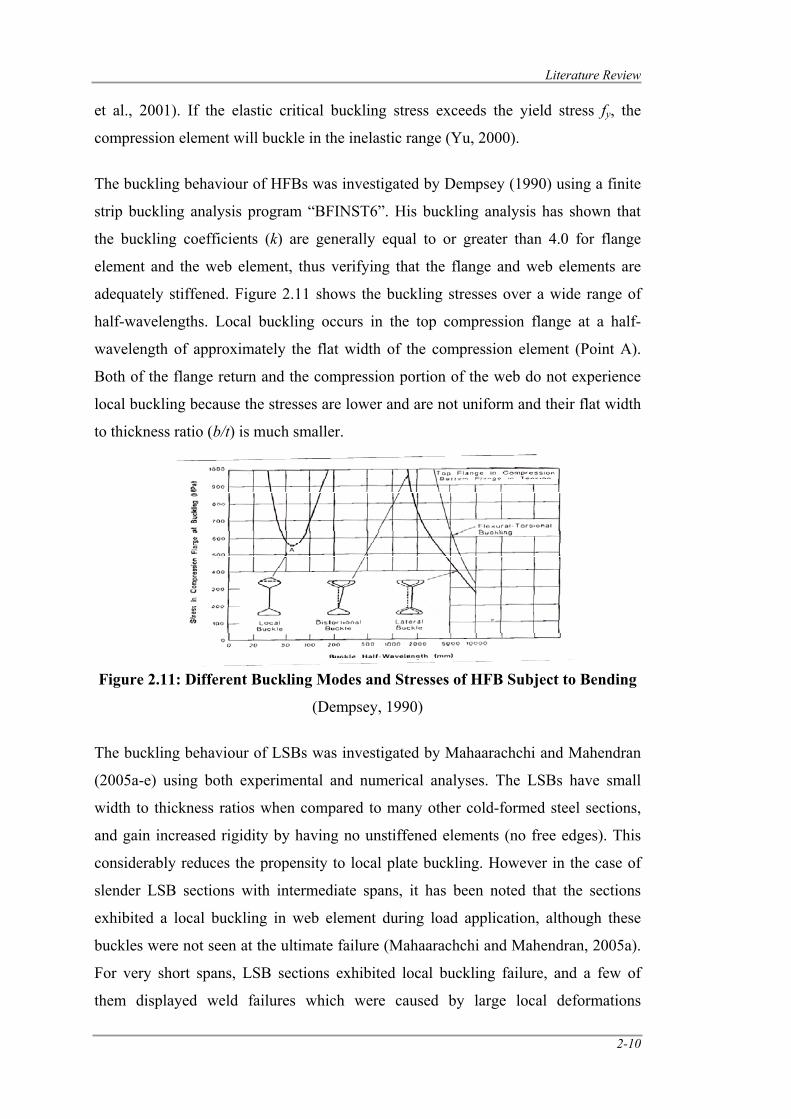
Literature Review
2-10
et al., 2001). If the elastic critical buckling stress exceeds the yield stress fy, the
compression element will buckle in the inelastic range (Yu, 2000).
The buckling behaviour of HFBs was investigated by Dempsey (1990) using a finite
strip buckling analysis program “BFINST6”. His buckling analysis has shown that
the buckling coefficients (k) are generally equal to or greater than 4.0 for flange
element and the web element, thus verifying that the flange and web elements are
adequately stiffened. Figure 2.11 shows the buckling stresses over a wide range of
half-wavelengths. Local buckling occurs in the top compression flange at a half-
wavelength of approximately the flat width of the compression element (Point A).
Both of the flange return and the compression portion of the web do not experience
local buckling because the stresses are lower and are not uniform and their flat width
to thickness ratio (b/t) is much smaller.
Figure 2.11: Different Buckling Modes and Stresses of HFB Subject to Bending
(Dempsey, 1990)
The buckling behaviour of LSBs was investigated by Mahaarachchi and Mahendran
(2005a-e) using both experimental and numerical analyses. The LSBs have small
width to thickness ratios when compared to many other cold-formed steel sections,
and gain increased rigidity by having no unstiffened elements (no free edges). This
considerably reduces the propensity to local plate buckling. However in the case of
slender LSB sections with intermediate spans, it has been noted that the sections
exhibited a local buckling in web element during load application, although these
buckles were not seen at the ultimate failure (Mahaarachchi and Mahendran, 2005a).
For very short spans, LSB sections exhibited local buckling failure, and a few of
them displayed weld failures which were caused by large local deformations
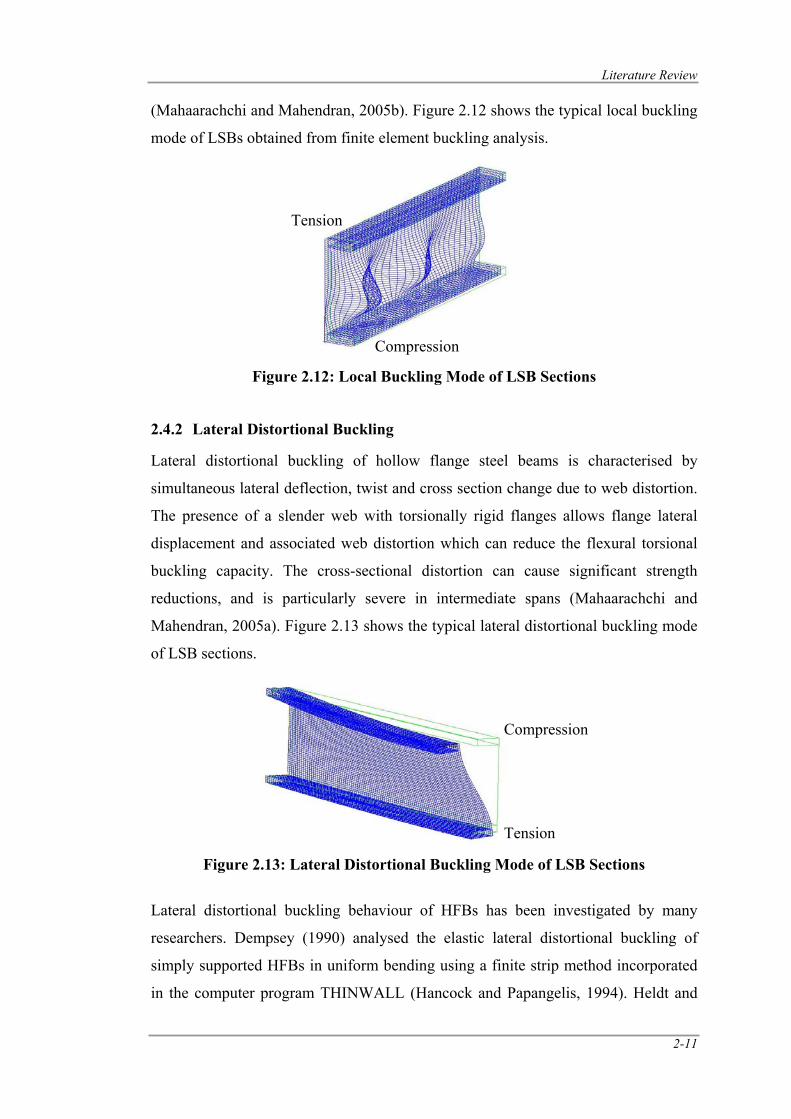
Literature Review
2-11
(Mahaarachchi and Mahendran, 2005b). Figure 2.12 shows the typical local buckling
mode of LSBs obtained from finite element buckling analysis.
Figure 2.12: Local Buckling Mode of LSB Sections
2.4.2 Lateral Distortional Buckling
Lateral distortional buckling of hollow flange steel beams is characterised by
simultaneous lateral deflection, twist and cross section change due to web distortion.
The presence of a slender web with torsionally rigid flanges allows flange lateral
displacement and associated web distortion which can reduce the flexural torsional
buckling capacity. The cross-sectional distortion can cause significant strength
reductions, and is particularly severe in intermediate spans (Mahaarachchi and
Mahendran, 2005a). Figure 2.13 shows the typical lateral distortional buckling mode
of LSB sections.
Figure 2.13: Lateral Distortional Buckling Mode of LSB Sections
Lateral distortional buckling behaviour of HFBs has been investigated by many
researchers. Dempsey (1990) analysed the elastic lateral distortional buckling of
simply supported HFBs in uniform bending using a finite strip method incorporated
in the computer program THINWALL (Hancock and Papangelis, 1994). Heldt and
Tension
Compression
Tension
Compression
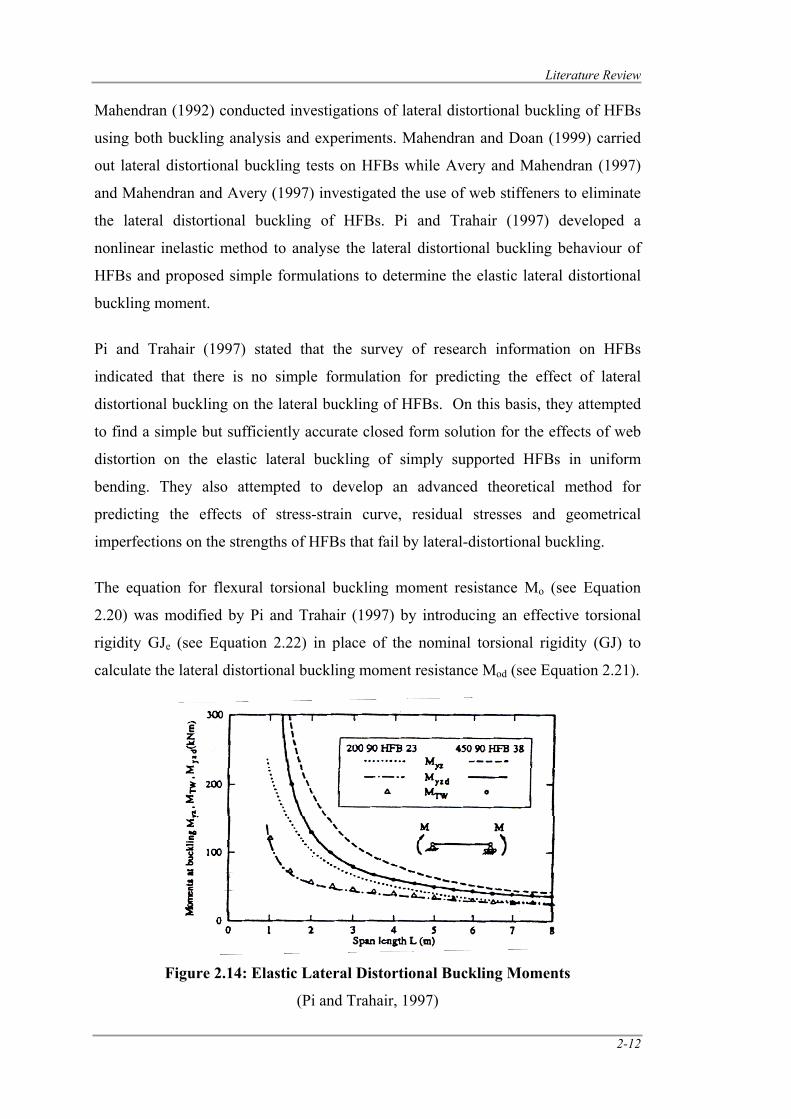
Literature Review
2-12
Mahendran (1992) conducted investigations of lateral distortional buckling of HFBs
using both buckling analysis and experiments. Mahendran and Doan (1999) carried
out lateral distortional buckling tests on HFBs while Avery and Mahendran (1997)
and Mahendran and Avery (1997) investigated the use of web stiffeners to eliminate
the lateral distortional buckling of HFBs. Pi and Trahair (1997) developed a
nonlinear inelastic method to analyse the lateral distortional buckling behaviour of
HFBs and proposed simple formulations to determine the elastic lateral distortional
buckling moment.
Pi and Trahair (1997) stated that the survey of research information on HFBs
indicated that there is no simple formulation for predicting the effect of lateral
distortional buckling on the lateral buckling of HFBs. On this basis, they attempted
to find a simple but sufficiently accurate closed form solution for the effects of web
distortion on the elastic lateral buckling of simply supported HFBs in uniform
bending. They also attempted to develop an advanced theoretical method for
predicting the effects of stress-strain curve, residual stresses and geometrical
imperfections on the strengths of HFBs that fail by lateral-distortional buckling.
The equation for flexural torsional buckling moment resistance Mo (see Equation
2.20) was modified by Pi and Trahair (1997) by introducing an effective torsional
rigidity GJe (see Equation 2.22) in place of the nominal torsional rigidity (GJ) to
calculate the lateral distortional buckling moment resistance Mod (see Equation 2.21).
Figure 2.14: Elastic Lateral Distortional Buckling Moments
(Pi and Trahair, 1997)
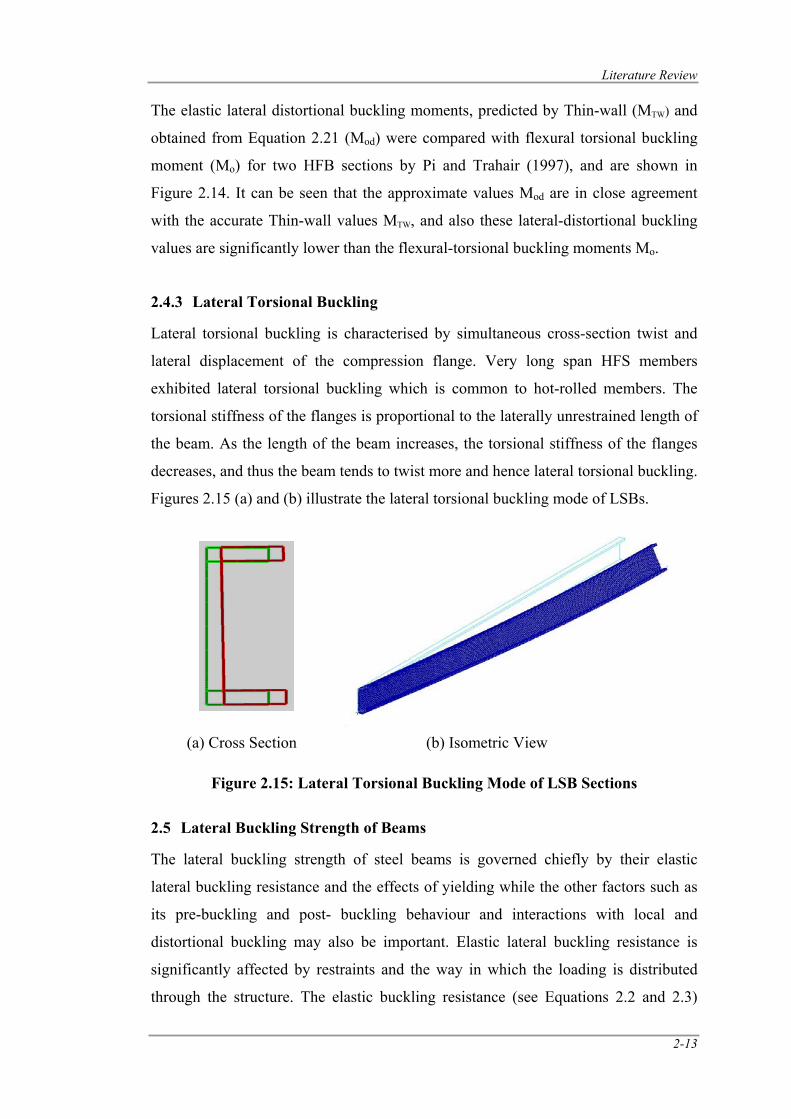
Literature Review
2-13
The elastic lateral distortional buckling moments, predicted by Thin-wall (MTW) and
obtained from Equation 2.21 (Mod) were compared with flexural torsional buckling
moment (Mo) for two HFB sections by Pi and Trahair (1997), and are shown in
Figure 2.14. It can be seen that the approximate values Mod are in close agreement
with the accurate Thin-wall values MTW, and also these lateral-distortional buckling
values are significantly lower than the flexural-torsional buckling moments Mo.
2.4.3 Lateral Torsional Buckling
Lateral torsional buckling is characterised by simultaneous cross-section twist and
lateral displacement of the compression flange. Very long span HFS members
exhibited lateral torsional buckling which is common to hot-rolled members. The
torsional stiffness of the flanges is proportional to the laterally unrestrained length of
the beam. As the length of the beam increases, the torsional stiffness of the flanges
decreases, and thus the beam tends to twist more and hence lateral torsional buckling.
Figures 2.15 (a) and (b) illustrate the lateral torsional buckling mode of LSBs.
Figure 2.15: Lateral Torsional Buckling Mode of LSB Sections
2.5 Lateral Buckling Strength of Beams
The lateral buckling strength of steel beams is governed chiefly by their elastic
lateral buckling resistance and the effects of yielding while the other factors such as
its pre-buckling and post- buckling behaviour and interactions with local and
distortional buckling may also be important. Elastic lateral buckling resistance is
significantly affected by restraints and the way in which the loading is distributed
through the structure. The elastic buckling resistance (see Equations 2.2 and 2.3)
(a) Cross Section (b) Isometric View
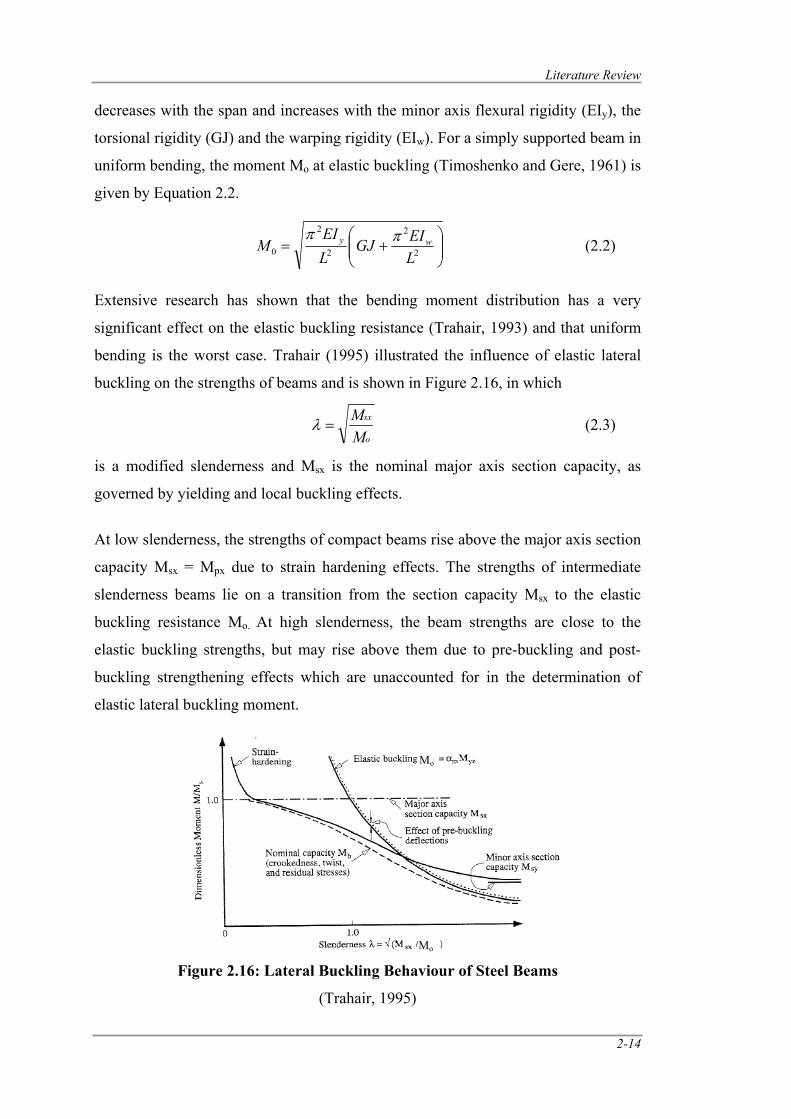
Literature Review
2-14
decreases with the span and increases with the minor axis flexural rigidity (EIy), the
torsional rigidity (GJ) and the warping rigidity (EIw). For a simply supported beam in
uniform bending, the moment Mo at elastic buckling (Timoshenko and Gere, 1961) is
given by Equation 2.2.
⎟⎟⎠
⎞⎜⎜⎝
⎛+= 2
2
2
2
0 LEIGJ
LEI
M wy ππ (2.2)
Extensive research has shown that the bending moment distribution has a very
significant effect on the elastic buckling resistance (Trahair, 1993) and that uniform
bending is the worst case. Trahair (1995) illustrated the influence of elastic lateral
buckling on the strengths of beams and is shown in Figure 2.16, in which
o
sx
MM
=λ (2.3)
is a modified slenderness and Msx is the nominal major axis section capacity, as
governed by yielding and local buckling effects.
At low slenderness, the strengths of compact beams rise above the major axis section
capacity Msx = Mpx due to strain hardening effects. The strengths of intermediate
slenderness beams lie on a transition from the section capacity Msx to the elastic
buckling resistance Mo. At high slenderness, the beam strengths are close to the
elastic buckling strengths, but may rise above them due to pre-buckling and post-
buckling strengthening effects which are unaccounted for in the determination of
elastic lateral buckling moment.
Figure 2.16: Lateral Buckling Behaviour of Steel Beams
(Trahair, 1995)
Mo
Mo
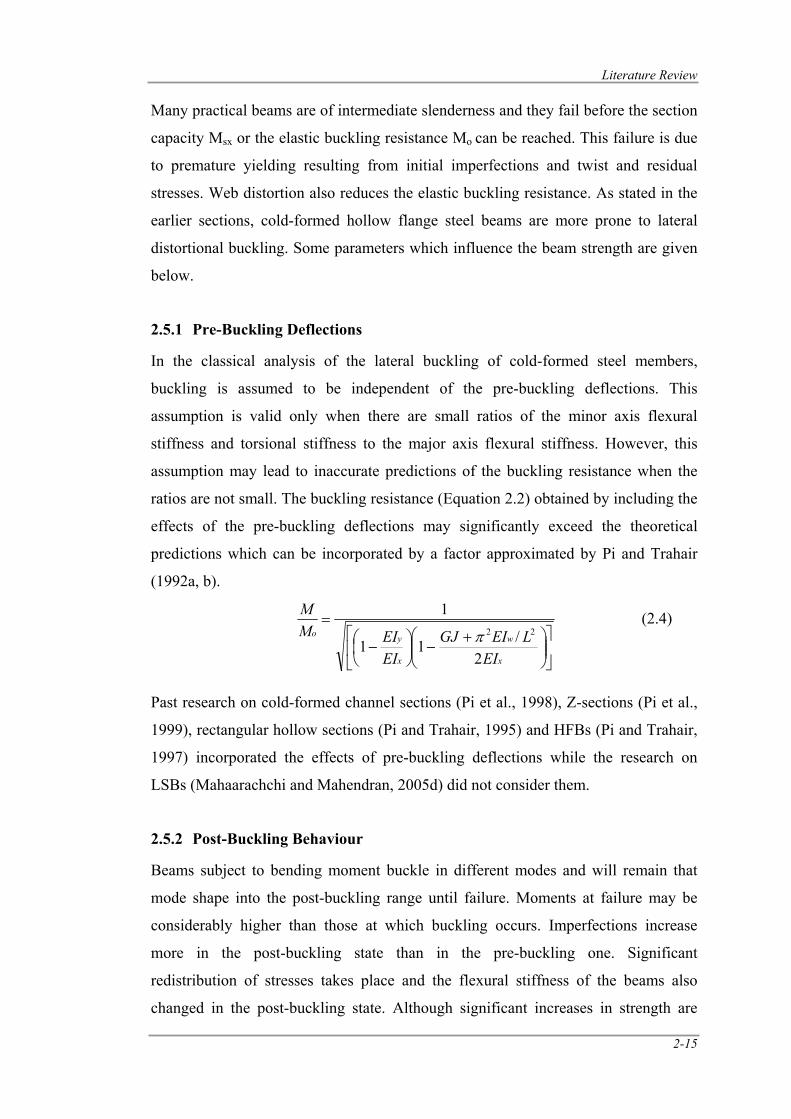
Literature Review
2-15
Many practical beams are of intermediate slenderness and they fail before the section
capacity Msx or the elastic buckling resistance Mo can be reached. This failure is due
to premature yielding resulting from initial imperfections and twist and residual
stresses. Web distortion also reduces the elastic buckling resistance. As stated in the
earlier sections, cold-formed hollow flange steel beams are more prone to lateral
distortional buckling. Some parameters which influence the beam strength are given
below.
2.5.1 Pre-Buckling Deflections
In the classical analysis of the lateral buckling of cold-formed steel members,
buckling is assumed to be independent of the pre-buckling deflections. This
assumption is valid only when there are small ratios of the minor axis flexural
stiffness and torsional stiffness to the major axis flexural stiffness. However, this
assumption may lead to inaccurate predictions of the buckling resistance when the
ratios are not small. The buckling resistance (Equation 2.2) obtained by including the
effects of the pre-buckling deflections may significantly exceed the theoretical
predictions which can be incorporated by a factor approximated by Pi and Trahair
(1992a, b).
⎥⎦
⎤⎢⎣
⎡⎟⎟⎠
⎞⎜⎜⎝
⎛ +−⎟
⎠⎞
⎜⎝⎛ −
=
x
w
x
yo
EILEIGJ
EIEIM
M
2/11
122π
(2.4)
Past research on cold-formed channel sections (Pi et al., 1998), Z-sections (Pi et al.,
1999), rectangular hollow sections (Pi and Trahair, 1995) and HFBs (Pi and Trahair,
1997) incorporated the effects of pre-buckling deflections while the research on
LSBs (Mahaarachchi and Mahendran, 2005d) did not consider them.
2.5.2 Post-Buckling Behaviour
Beams subject to bending moment buckle in different modes and will remain that
mode shape into the post-buckling range until failure. Moments at failure may be
considerably higher than those at which buckling occurs. Imperfections increase
more in the post-buckling state than in the pre-buckling one. Significant
redistribution of stresses takes place and the flexural stiffness of the beams also
changed in the post-buckling state. Although significant increases in strength are
Literature Review
2-16
only realised for very slender beams, this post-buckling behaviour causes the beam
strength to remain above the minor axis section capacity Msy, even when this is
greater than the elastic buckling resistance.
2.5.3 Web Distortion
While the flanges of hollow flange steel beams are very stiff torsionally, their webs
are comparatively flexible, and may allow web distortion effects to reduce their
resistances to lateral torsional buckling. The flanges of an I-section beam are not stiff
torsionally, and so web distortion does not become very significant unless the web is
particularly slender, or only the tension flange is restrained torsionally (Pi and
Trahair, 1997). The web flexibility allows significant flange displacements with only
small flange rotations. Web distortion introduces some effects that are not
encountered in lateral torsional buckling. First, web distortion may reduce the
effective torsional rigidity of the cross section. Second, the parallel flanges may have
different angles of twist rotation during buckling. Third, the symmetrical nature of
the hollow flange steel beams become unsymmetric during lateral distortional
buckling so that the centroid, shear centre and principal axes of the distorted cross
section are all different from those of undistorted cross section before buckling (Pi
and Trahair, 2000). Web distortion reduces the warping rigidities. The adoption of
reduced warping rigidity is important for the beams with small flange torsional
rigidities (Pi and Trahair, 2000) and this can be ignored for the hollow flange steel
beams as these have high flange torsional rigidities.
Past research identified that the lateral buckling strength of cold-formed channel
section beams (Pi et al., 1998) and Z- section beams (Pi et al., 1999) with web
distortion are lower than those without web distortion. However, the effects of web
distortion are small for these beams as they have low torsional rigidities.
Lateral buckling strengths of HFBs with web distortion are lower than those without
web distortion for beams of intermediate slenderness, but the effects of web
distortion on the strength of beams with very high and very low slenderness are small
(Pi and Trahair, 1997). Findings by Mahaarachchi and Mahendran (2005a) on LSBs
also support this fact.
Literature Review
2-17
2.5.4 Inelastic Behaviour
In a short span beam, yielding occurs before the ultimate moment is reached, and
significant portions of the beams are inelastic when buckling commences. The
effective rigidities of these inelastic portions are reduced by yielding, and
consequently, the buckling moment is also reduced. In the inelastic range, the
buckling moment increases almost linearly with decreasing slenderness from the first
yield moment to the full plastic moment which is reached soon after the flanges are
fully yielded, when buckling is controlled by the strain hardening moduli. Residual
stresses and initial imperfections further reduce the inelastic buckling moment of a
beam. Theodore and Galambos (1963) presented a theoretical method for the
determination of the inelastic buckling strength of simply supported wide-flange
steel beams subjected to equal and opposite end moments which fail by lateral
buckling. The method they adopted was based on the determination of the reduction
in the lateral and torsional stiffness due to yielding. They considered the effect of
initial residual stresses as well. These theoretical derivations consisted of several
assumptions such as no initial imperfections, no cross section change during
buckling, etc.
Ma and Hughes (1996) investigated the lateral distortional buckling behaviour of
monosymmetric I-beams under distributed vertical loads by using an energy method.
They used nonlinear elastic theory to obtain the external work due to buckling and
developed a new formulation of total potential energy. Also they assumed that the
flanges buckle as rigid rectangular section beams and the web distorts as an elastic
plate during buckling. Further, they considered both cubic and 5th order polynomial
functions for web out-of-plane buckling deformation and concluded that 5th order
polynomial improved the accuracy of the results for the beams with uniformly
distributed vertical load.
Dekker and Kemp (1998) developed a simplified theoretical model for I-sections
undergoing lateral distortional buckling. Trahair and Hancock (2004) developed a
simple advanced method to design steel members against out-of-plane failure. They
included the effects of high moment, residual stresses and geometrical imperfections
on yielding. In this study, it was suggested that the nominal beam strength may be
obtained by making an inelastic lateral buckling analysis using inelastic moduli (EI =
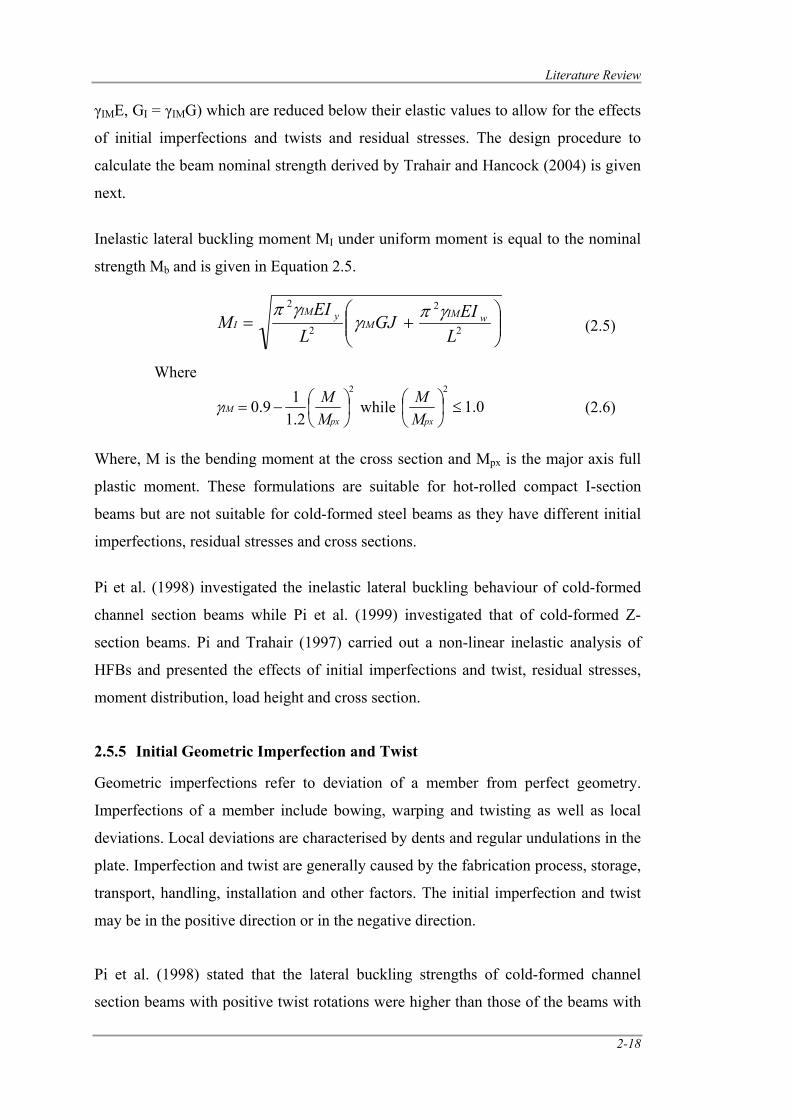
Literature Review
2-18
γIME, GI = γIMG) which are reduced below their elastic values to allow for the effects
of initial imperfections and twists and residual stresses. The design procedure to
calculate the beam nominal strength derived by Trahair and Hancock (2004) is given
next.
Inelastic lateral buckling moment MI under uniform moment is equal to the nominal
strength Mb and is given in Equation 2.5.
⎟⎟⎠
⎞⎜⎜⎝
⎛+= 2
2
2
2
LEIGJ
LEI
M wIMIM
yIMI
γπγγπ
(2.5)
Where
2
2.119.0 ⎟
⎠⎞
⎜⎝⎛−=
pxIM
MMγ while 0.1
2
≤⎟⎠⎞
⎜⎝⎛
pxMM (2.6)
Where, M is the bending moment at the cross section and Mpx is the major axis full
plastic moment. These formulations are suitable for hot-rolled compact I-section
beams but are not suitable for cold-formed steel beams as they have different initial
imperfections, residual stresses and cross sections.
Pi et al. (1998) investigated the inelastic lateral buckling behaviour of cold-formed
channel section beams while Pi et al. (1999) investigated that of cold-formed Z-
section beams. Pi and Trahair (1997) carried out a non-linear inelastic analysis of
HFBs and presented the effects of initial imperfections and twist, residual stresses,
moment distribution, load height and cross section.
2.5.5 Initial Geometric Imperfection and Twist
Geometric imperfections refer to deviation of a member from perfect geometry.
Imperfections of a member include bowing, warping and twisting as well as local
deviations. Local deviations are characterised by dents and regular undulations in the
plate. Imperfection and twist are generally caused by the fabrication process, storage,
transport, handling, installation and other factors. The initial imperfection and twist
may be in the positive direction or in the negative direction.
Pi et al. (1998) stated that the lateral buckling strengths of cold-formed channel
section beams with positive twist rotations were higher than those of the beams with
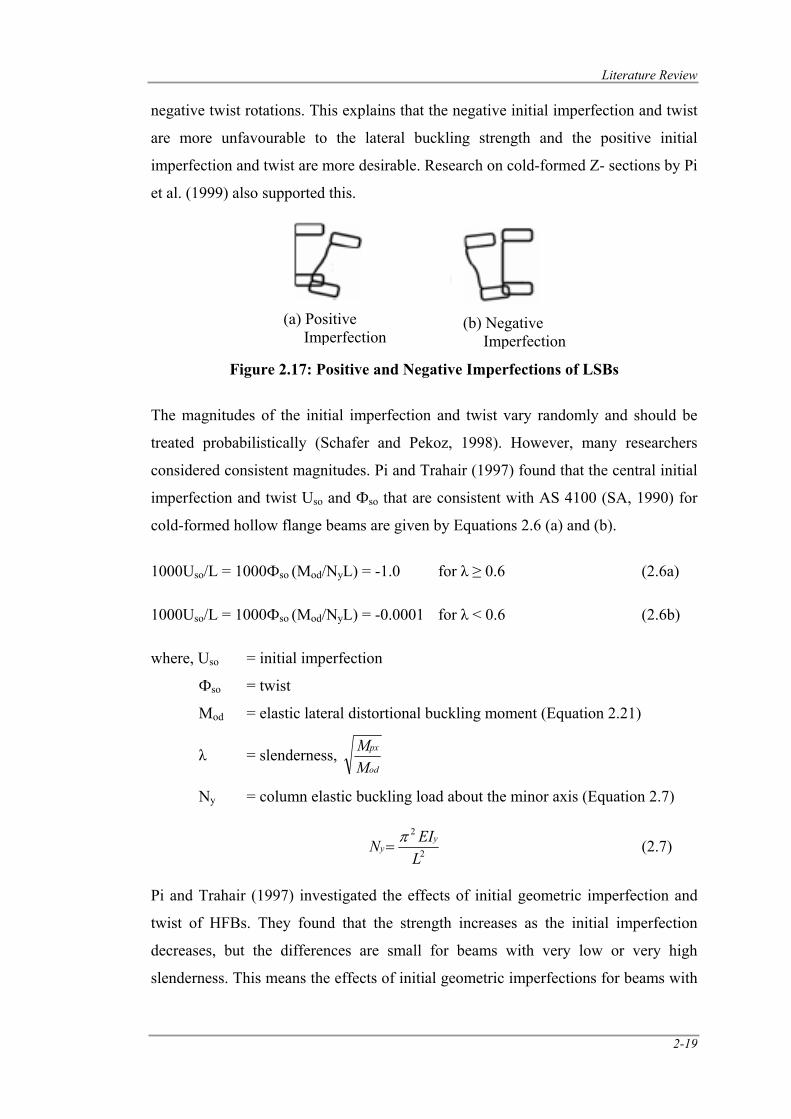
Literature Review
2-19
negative twist rotations. This explains that the negative initial imperfection and twist
are more unfavourable to the lateral buckling strength and the positive initial
imperfection and twist are more desirable. Research on cold-formed Z- sections by Pi
et al. (1999) also supported this.
Figure 2.17: Positive and Negative Imperfections of LSBs
The magnitudes of the initial imperfection and twist vary randomly and should be
treated probabilistically (Schafer and Pekoz, 1998). However, many researchers
considered consistent magnitudes. Pi and Trahair (1997) found that the central initial
imperfection and twist Uso and Фso that are consistent with AS 4100 (SA, 1990) for
cold-formed hollow flange beams are given by Equations 2.6 (a) and (b).
1000Uso/L = 1000Фso (Mod/NyL) = -1.0 for λ ≥ 0.6 (2.6a)
1000Uso/L = 1000Фso (Mod/NyL) = -0.0001 for λ < 0.6 (2.6b)
where, Uso = initial imperfection
Фso = twist
Mod = elastic lateral distortional buckling moment (Equation 2.21)
λ = slenderness, od
px
MM
Ny = column elastic buckling load about the minor axis (Equation 2.7)
2
2
LEIN y
yπ
= (2.7)
Pi and Trahair (1997) investigated the effects of initial geometric imperfection and
twist of HFBs. They found that the strength increases as the initial imperfection
decreases, but the differences are small for beams with very low or very high
slenderness. This means the effects of initial geometric imperfections for beams with
(a) Positive Imperfection
(b) Negative Imperfection
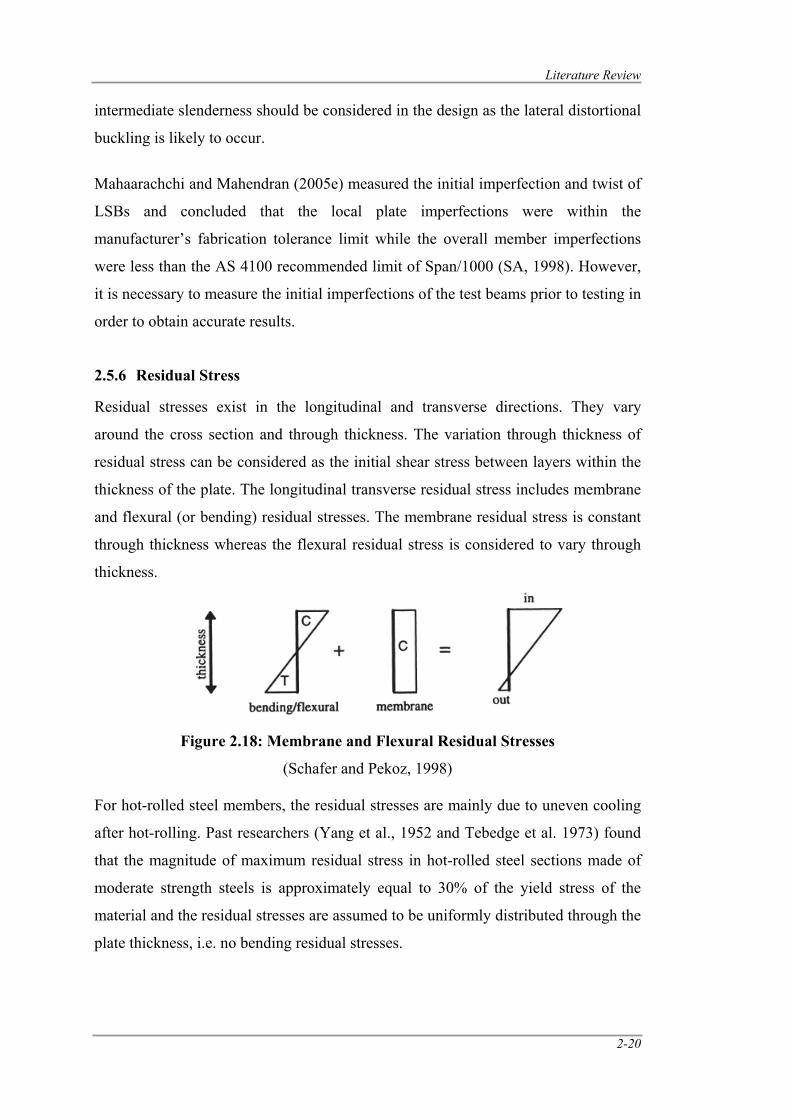
Literature Review
2-20
intermediate slenderness should be considered in the design as the lateral distortional
buckling is likely to occur.
Mahaarachchi and Mahendran (2005e) measured the initial imperfection and twist of
LSBs and concluded that the local plate imperfections were within the
manufacturer’s fabrication tolerance limit while the overall member imperfections
were less than the AS 4100 recommended limit of Span/1000 (SA, 1998). However,
it is necessary to measure the initial imperfections of the test beams prior to testing in
order to obtain accurate results.
2.5.6 Residual Stress
Residual stresses exist in the longitudinal and transverse directions. They vary
around the cross section and through thickness. The variation through thickness of
residual stress can be considered as the initial shear stress between layers within the
thickness of the plate. The longitudinal transverse residual stress includes membrane
and flexural (or bending) residual stresses. The membrane residual stress is constant
through thickness whereas the flexural residual stress is considered to vary through
thickness.
Figure 2.18: Membrane and Flexural Residual Stresses
(Schafer and Pekoz, 1998) For hot-rolled steel members, the residual stresses are mainly due to uneven cooling
after hot-rolling. Past researchers (Yang et al., 1952 and Tebedge et al. 1973) found
that the magnitude of maximum residual stress in hot-rolled steel sections made of
moderate strength steels is approximately equal to 30% of the yield stress of the
material and the residual stresses are assumed to be uniformly distributed through the
plate thickness, i.e. no bending residual stresses.
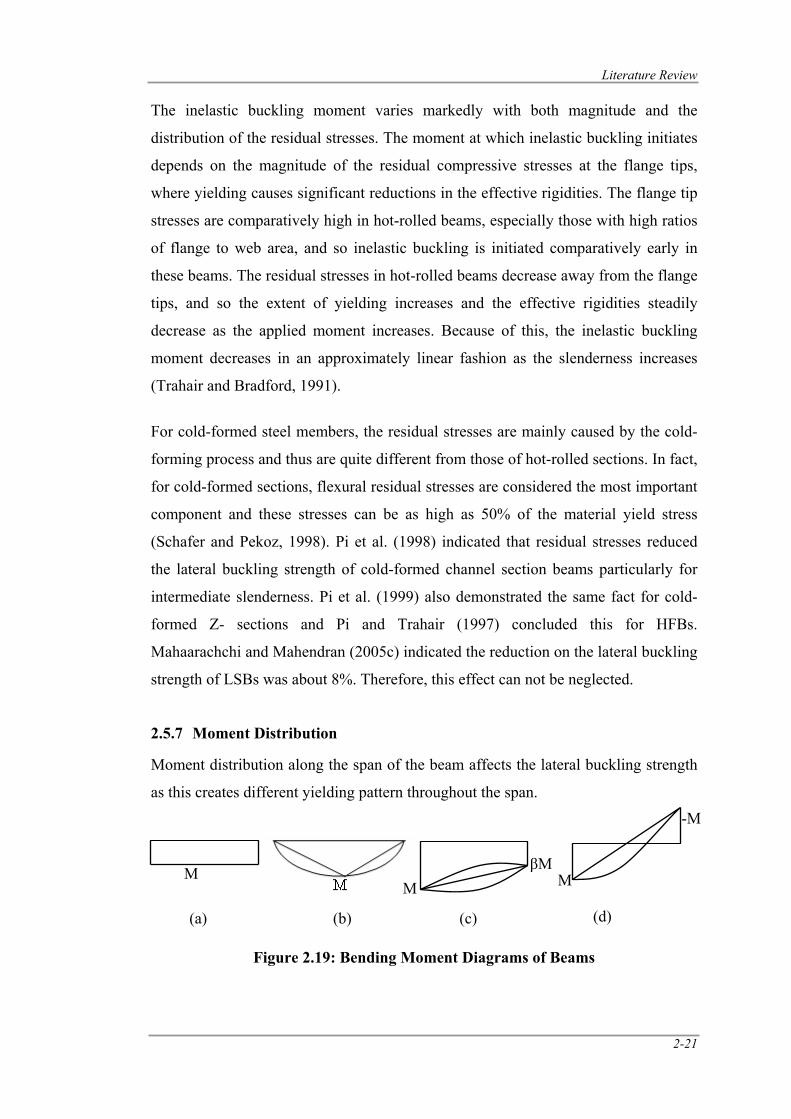
Literature Review
2-21
The inelastic buckling moment varies markedly with both magnitude and the
distribution of the residual stresses. The moment at which inelastic buckling initiates
depends on the magnitude of the residual compressive stresses at the flange tips,
where yielding causes significant reductions in the effective rigidities. The flange tip
stresses are comparatively high in hot-rolled beams, especially those with high ratios
of flange to web area, and so inelastic buckling is initiated comparatively early in
these beams. The residual stresses in hot-rolled beams decrease away from the flange
tips, and so the extent of yielding increases and the effective rigidities steadily
decrease as the applied moment increases. Because of this, the inelastic buckling
moment decreases in an approximately linear fashion as the slenderness increases
(Trahair and Bradford, 1991).
For cold-formed steel members, the residual stresses are mainly caused by the cold-
forming process and thus are quite different from those of hot-rolled sections. In fact,
for cold-formed sections, flexural residual stresses are considered the most important
component and these stresses can be as high as 50% of the material yield stress
(Schafer and Pekoz, 1998). Pi et al. (1998) indicated that residual stresses reduced
the lateral buckling strength of cold-formed channel section beams particularly for
intermediate slenderness. Pi et al. (1999) also demonstrated the same fact for cold-
formed Z- sections and Pi and Trahair (1997) concluded this for HFBs.
Mahaarachchi and Mahendran (2005c) indicated the reduction on the lateral buckling
strength of LSBs was about 8%. Therefore, this effect can not be neglected.
2.5.7 Moment Distribution
Moment distribution along the span of the beam affects the lateral buckling strength
as this creates different yielding pattern throughout the span.
Figure 2.19: Bending Moment Diagrams of Beams
(a) (b) (c)
M M
βMM
-M
(d)
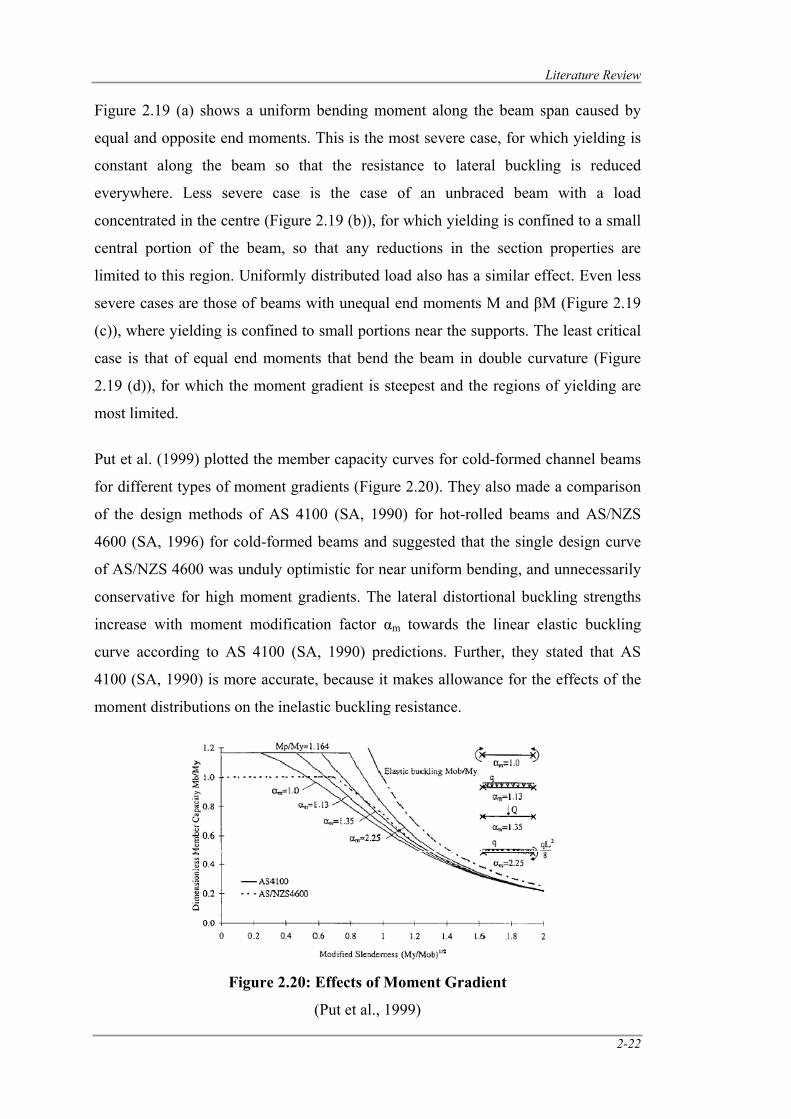
Literature Review
2-22
Figure 2.19 (a) shows a uniform bending moment along the beam span caused by
equal and opposite end moments. This is the most severe case, for which yielding is
constant along the beam so that the resistance to lateral buckling is reduced
everywhere. Less severe case is the case of an unbraced beam with a load
concentrated in the centre (Figure 2.19 (b)), for which yielding is confined to a small
central portion of the beam, so that any reductions in the section properties are
limited to this region. Uniformly distributed load also has a similar effect. Even less
severe cases are those of beams with unequal end moments M and βM (Figure 2.19
(c)), where yielding is confined to small portions near the supports. The least critical
case is that of equal end moments that bend the beam in double curvature (Figure
2.19 (d)), for which the moment gradient is steepest and the regions of yielding are
most limited.
Put et al. (1999) plotted the member capacity curves for cold-formed channel beams
for different types of moment gradients (Figure 2.20). They also made a comparison
of the design methods of AS 4100 (SA, 1990) for hot-rolled beams and AS/NZS
4600 (SA, 1996) for cold-formed beams and suggested that the single design curve
of AS/NZS 4600 was unduly optimistic for near uniform bending, and unnecessarily
conservative for high moment gradients. The lateral distortional buckling strengths
increase with moment modification factor αm towards the linear elastic buckling
curve according to AS 4100 (SA, 1990) predictions. Further, they stated that AS
4100 (SA, 1990) is more accurate, because it makes allowance for the effects of the
moment distributions on the inelastic buckling resistance.
Figure 2.20: Effects of Moment Gradient
(Put et al., 1999)
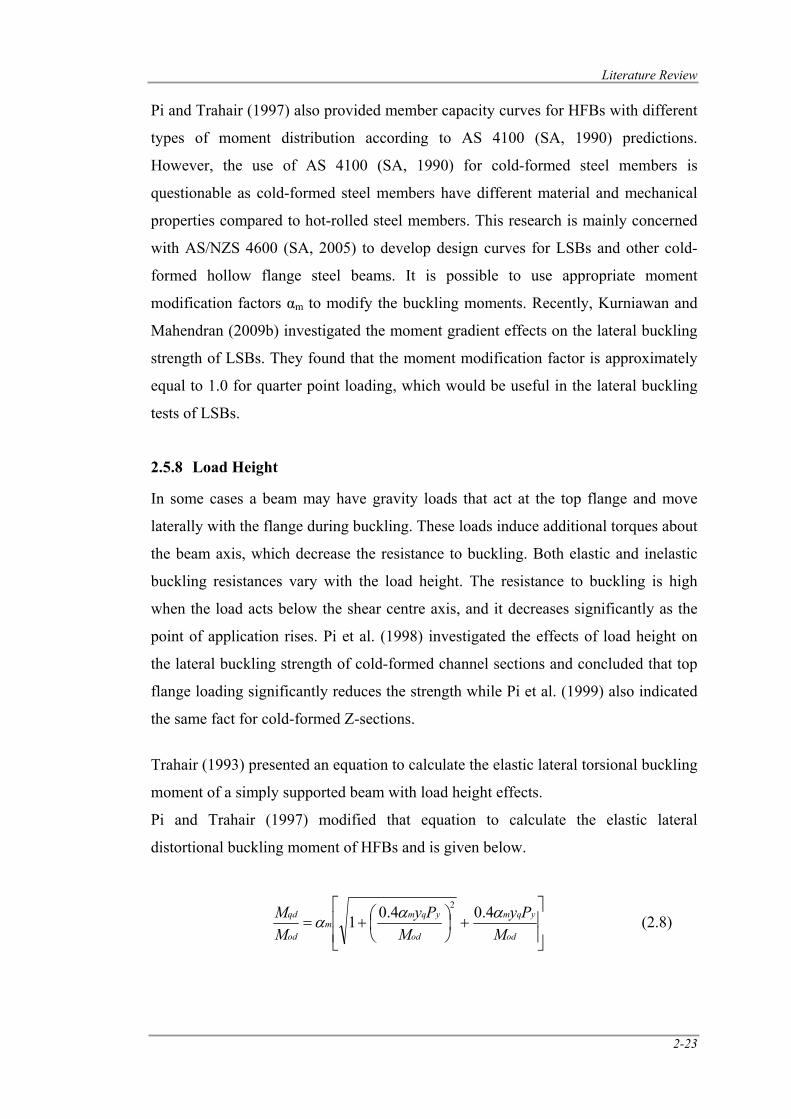
Literature Review
2-23
Pi and Trahair (1997) also provided member capacity curves for HFBs with different
types of moment distribution according to AS 4100 (SA, 1990) predictions.
However, the use of AS 4100 (SA, 1990) for cold-formed steel members is
questionable as cold-formed steel members have different material and mechanical
properties compared to hot-rolled steel members. This research is mainly concerned
with AS/NZS 4600 (SA, 2005) to develop design curves for LSBs and other cold-
formed hollow flange steel beams. It is possible to use appropriate moment
modification factors αm to modify the buckling moments. Recently, Kurniawan and
Mahendran (2009b) investigated the moment gradient effects on the lateral buckling
strength of LSBs. They found that the moment modification factor is approximately
equal to 1.0 for quarter point loading, which would be useful in the lateral buckling
tests of LSBs.
2.5.8 Load Height
In some cases a beam may have gravity loads that act at the top flange and move
laterally with the flange during buckling. These loads induce additional torques about
the beam axis, which decrease the resistance to buckling. Both elastic and inelastic
buckling resistances vary with the load height. The resistance to buckling is high
when the load acts below the shear centre axis, and it decreases significantly as the
point of application rises. Pi et al. (1998) investigated the effects of load height on
the lateral buckling strength of cold-formed channel sections and concluded that top
flange loading significantly reduces the strength while Pi et al. (1999) also indicated
the same fact for cold-formed Z-sections.
Trahair (1993) presented an equation to calculate the elastic lateral torsional buckling
moment of a simply supported beam with load height effects.
Pi and Trahair (1997) modified that equation to calculate the elastic lateral
distortional buckling moment of HFBs and is given below.
⎥⎥⎦
⎤
⎢⎢⎣
⎡+⎟
⎠⎞
⎜⎝⎛+=
od
yqm
od
yqmm
od
qd
MPy
MPy
MM ααα 4.04.01
2
(2.8)
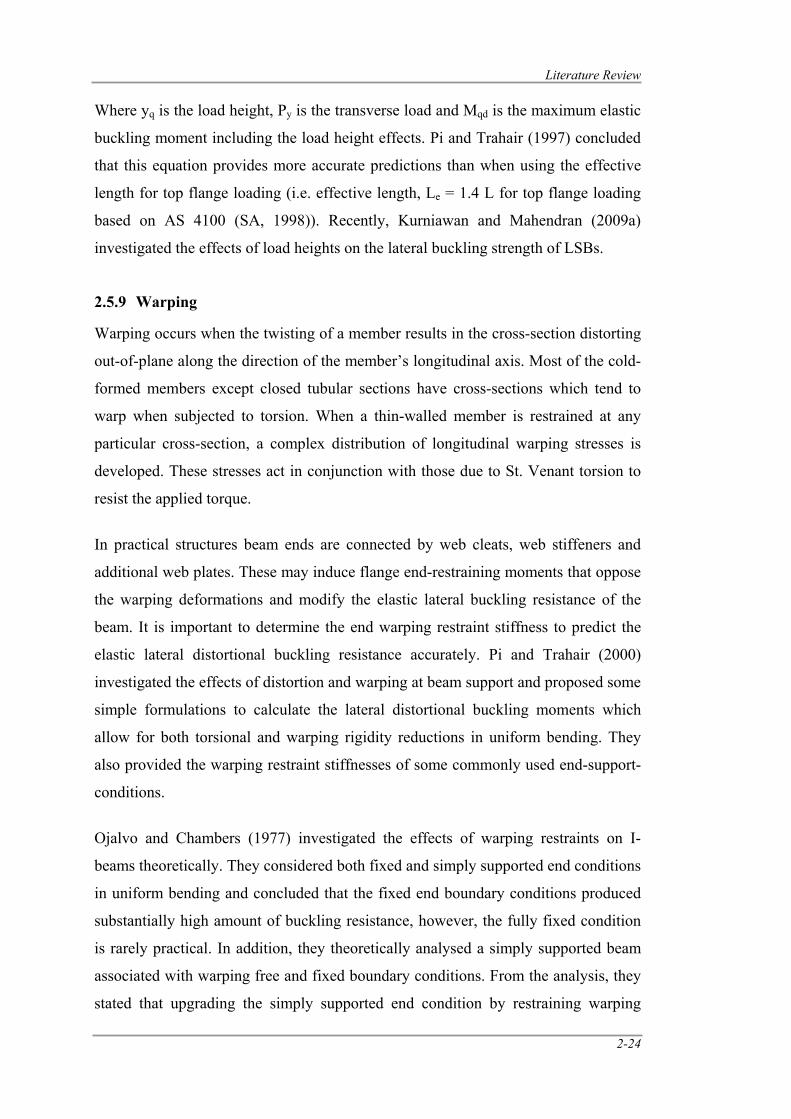
Literature Review
2-24
Where yq is the load height, Py is the transverse load and Mqd is the maximum elastic
buckling moment including the load height effects. Pi and Trahair (1997) concluded
that this equation provides more accurate predictions than when using the effective
length for top flange loading (i.e. effective length, Le = 1.4 L for top flange loading
based on AS 4100 (SA, 1998)). Recently, Kurniawan and Mahendran (2009a)
investigated the effects of load heights on the lateral buckling strength of LSBs.
2.5.9 Warping
Warping occurs when the twisting of a member results in the cross-section distorting
out-of-plane along the direction of the member’s longitudinal axis. Most of the cold-
formed members except closed tubular sections have cross-sections which tend to
warp when subjected to torsion. When a thin-walled member is restrained at any
particular cross-section, a complex distribution of longitudinal warping stresses is
developed. These stresses act in conjunction with those due to St. Venant torsion to
resist the applied torque.
In practical structures beam ends are connected by web cleats, web stiffeners and
additional web plates. These may induce flange end-restraining moments that oppose
the warping deformations and modify the elastic lateral buckling resistance of the
beam. It is important to determine the end warping restraint stiffness to predict the
elastic lateral distortional buckling resistance accurately. Pi and Trahair (2000)
investigated the effects of distortion and warping at beam support and proposed some
simple formulations to calculate the lateral distortional buckling moments which
allow for both torsional and warping rigidity reductions in uniform bending. They
also provided the warping restraint stiffnesses of some commonly used end-support-
conditions.
Ojalvo and Chambers (1977) investigated the effects of warping restraints on I-
beams theoretically. They considered both fixed and simply supported end conditions
in uniform bending and concluded that the fixed end boundary conditions produced
substantially high amount of buckling resistance, however, the fully fixed condition
is rarely practical. In addition, they theoretically analysed a simply supported beam
associated with warping free and fixed boundary conditions. From the analysis, they
stated that upgrading the simply supported end condition by restraining warping
Literature Review
2-25
produces a significant improvement in the bucking moment. Further, they
recommended two types of warping restraining devices such as stiffener type (Figure
2.21 (a)) and tube type (Figure 2.21 (b)) welded on the flanges near to the support.
Figure 2.21: Warping Restraining Devices
(Ojalvo and Chambers, 1977)
Xiao et al. (2004) investigated the effects of warping stress on the lateral torsional
buckling of cold-formed zed-purlins. They developed an analytical model based on
energy method to analyse the elastic lateral torsional buckling of zed-purlins subject
to partial lateral restraint from the metal sheeting under a uniformly distributed uplift
load. They considered various loading positions and concluded that the influence of
warping stress is less when the load is acting at the web central line, hence increases
the critical load.
Different loading methods also induce warping restraints, specifically overhang
method loading increases the warping restraint. Mahaarachchi and Mahendran
(2005a) conducted lateral buckling tests of LSBs and reported that overhang method
loading over-predicted the failure moment by about 12%.
2.6 Design Guidelines for Cold-Formed Hollow Flange Steel Beams
Mahaarachchi and Mahendran (2005d) identified that the Australia/New Zealand
cold-formed steel design standard AS/NZS 4600 (SA, 1996) was most relevant for
the design of LSBs, as compared to the Australian hot-rolled steel design standard
AS 4100 (SA, 1998). The latter was deemed over-conservative in predicting the
ultimate member moment capacities. A new design rule based upon the work
undertaken by Mahaarachchi and Mahendran (2005d) was included on the latest
version of AS/NZS 4600 (SA, 2005). This section provides the design procedures
suitable for hollow flange steel beams such as HFBs and LSBs.
(a) Stiffeners Type (b) Tube Type
Literature Review
2-26
2.6.1 Moment Capacity Based on AS 4100 (SA, 1998)
AS 4100 (SA, 1998) states the design procedures for local and lateral torsional
buckling failure modes of flexural members. Local buckling is governed by the
section moment capacity formula while lateral torsional buckling is governed by the
member moment capacity formula. There are no provisions made for flexural
members subjected to distortional buckling.
2.6.1.1 Section Moment Capacity
The section moment capacity of a beam is associated with yielding and/or local
buckling of the plate elements in the cross-section and is used where the compression
flange is fully laterally restrained. The nominal section moment capacity (Ms) as in
Clause 5.2.1 is given by Equation 2.9:
Ms = fy Ze (2.9)
Where, fy is the nominal yield stress. The effective section modulus (Ze) used to
calculate the section moment capacity (Ms) is governed by the compactness of the
section’s individual plate equations and is given by Equations 2.10 to 2.13:
For λe ≤ λep : (Compact Sections) Ze = Zc (2.10)
For λep < λe ≤ λey : (Non-Compact Sections) ( )⎥⎦
⎤⎢⎣
⎡−⎟
⎠⎞
⎜⎝⎛
−−
+= ZZZZ cepey
seye
λλλλ (2.11)
For λe > λey : (Slender Sections, Web elements) 2
⎟⎠⎞
⎜⎝⎛=
e
eyeZ
λλ (2.12)
For λe > λey : (Slender Sections, Flange elements) ⎟⎠⎞
⎜⎝⎛=
e
eyeZ
λλ (2.13)
where, λe = plate element slenderness
λey = plate element yield limit (Table 5.2 of AS 4100)
λep = plate element plasticity limit (Table 5.2 of AS 4100)
Zc = effective section modulus of the compact element
Z = full elastic section modulus
The element with the greatest ratio λe/λey is to be used for calculating the effective
section modulus (Ze). The plate element slenderness (λe) as in Clause 5.5.2 is given
by Equation 2.14:
Literature Review
2-27
250
ye
ftb⎟⎠⎞
⎜⎝⎛=λ (2.14)
Where, b is the clear width of the element outstand from the face or between the
faces of the supporting plate element and t is the element thickness. The effective
section of the compact element (Zc) is given by Equation 2.15:
Zc = min [S, 1.5Z] (2.15)
Where, S is the plastic section modulus.
2.6.1.2 Member Moment Capacity
The member moment capacity of a flexural member is governed by the extent of
lateral restraint provided to the compression flange in order to prevent lateral
buckling. No specific provision are made in AS 4100 (SA, 1998) for lateral
distortional buckling. The nominal member moment capacity (Mb) without full
lateral restraint is specified in AS 4100 (SA, 1998), Clause 5.6.1 (see Equation 2.16)
while the nominal member moment capacity allowing for the lateral distortional
buckling is given by Pi and Trahair (1997) (see Equation 2.17).
Mb = αmαsMs ≤ Ms (2.16)
Mb = αmαsdMs ≤ Ms (2.17)
where, Ms = section moment capacity (Equation 2.9)
αm = moment distribution factor (=1 for constant moment)
αs = slenderness reduction factor
αsd = as above for distortional buckling
The slenderness reduction factors (αs and αsd) based on AS 4100 (SA, 1998) and Pi
and Trahair (1997), respectively, are given by Equations 2.18 and 2.19, respectively.
Bradford (1992) reported that “the relationship between distortional buckling
strength, yielding and elastic distortional buckling is the same as that between the
lateral buckling strength, yielding and elastic lateral buckling”. This implies that if
the elastic buckling moment (Mo) is replaced by the elastic buckling moment in the
distortional mode (Mod) then the method outlined by AS 4100 (SA, 1998) is
adequate for the design of hollow flange steel beams subject to lateral distortional
buckling.
Literature Review
2-28
0.136.02
≤⎥⎥⎦
⎤
⎢⎢⎣
⎡⎟⎠⎞
⎜⎝⎛−+⎟
⎠⎞
⎜⎝⎛=
od
s
od
ss
MM
MMα (2.18)
0.18.26.02
≤⎥⎥⎦
⎤
⎢⎢⎣
⎡⎟⎠⎞
⎜⎝⎛−+⎟
⎠⎞
⎜⎝⎛=
od
s
od
ssd
MM
MMα (2.19)
The elastic lateral torsional buckling moment (Mo) of section with equal flanges for
simply supported beam under uniform bending as in AS 4100 (SA, 1998) Clause
5.6.1.1 is:
⎟⎟⎠
⎞⎜⎜⎝
⎛+= 2
2
2
2
0 LEIGJ
LEI
M wy ππ (2.20)
Pi and Trahair (1997) modified Equation 2.20 by introducing an effective torsional
rigidity (GJe) in place of the nominal torsional rigidity (GJ) to calculate the lateral
distortional buckling moment (Mod).
⎟⎟
⎠
⎞
⎜⎜
⎝
⎛+= 2
2
2
2
LEIGJ
LEIM w
ey
odππ (2.21)
where, EIy, EIw = minor axis flexural rigidity, warping rigidity
GJe = effective torsional rigidity
L = span
The effective torsional rigidity (GJe) is given by Equation 2.22:
⎟⎟⎠
⎞⎜⎜⎝
⎛+
⎟⎟⎠
⎞⎜⎜⎝
⎛
=
1
1
2
23
2
23
91.02
91.02
dLEtGJ
dLEtGJ
GJf
f
e
π
π (2.22)
Where, GJf is the flange torsional rigidity and d1 is the clear web depth.
Comparisons between the variations of non-dimensional member capacity (Mu/Ms)
with slenderness (My/Mod)0.5 of experimental results, finite element analyses, AS
4100 (SA, 1998) and Pi and Trahair’s (1997) predictions made by Mahaarachchi and
Mahendran (2005d) are shown in Figure 2.22. With reference to Figure 2.22,
Mahaarachchi and Mahendran (2005d) concluded that both Pi and Trahair (1997)
and AS 4100 (SA, 1998) methods predicted the lower (conservative) bound of the
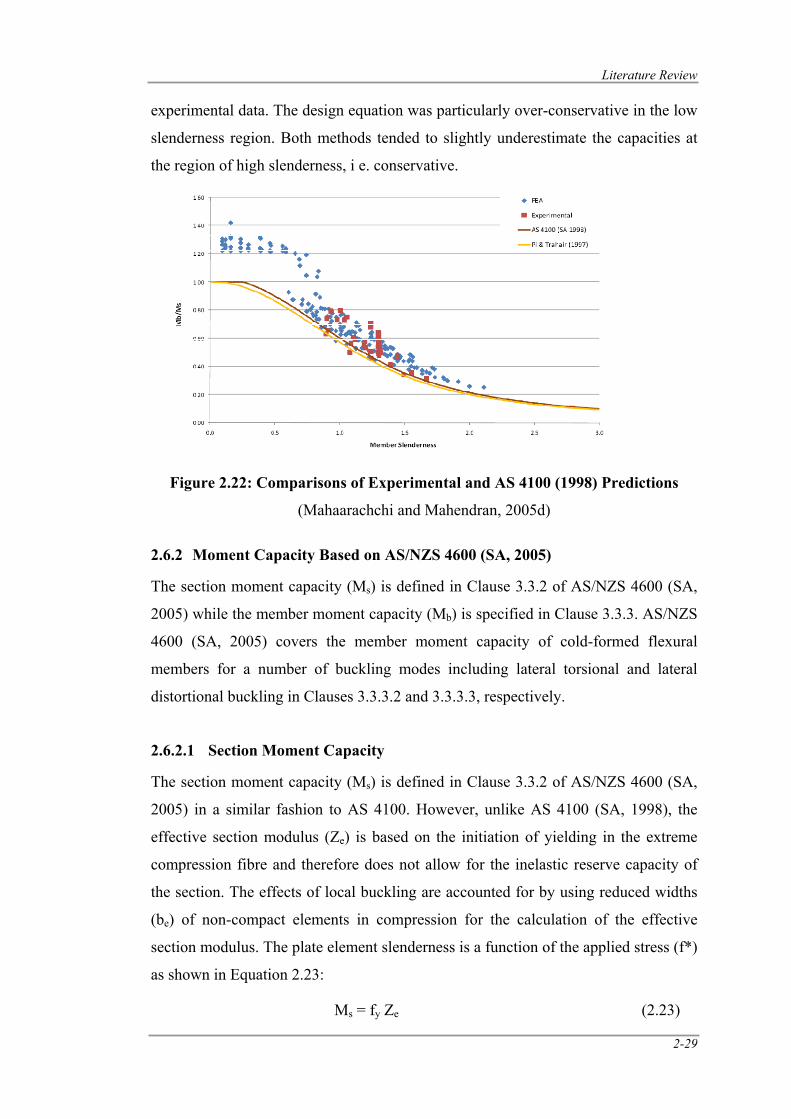
Literature Review
2-29
experimental data. The design equation was particularly over-conservative in the low
slenderness region. Both methods tended to slightly underestimate the capacities at
the region of high slenderness, i e. conservative.
Figure 2.22: Comparisons of Experimental and AS 4100 (1998) Predictions
(Mahaarachchi and Mahendran, 2005d)
2.6.2 Moment Capacity Based on AS/NZS 4600 (SA, 2005)
The section moment capacity (Ms) is defined in Clause 3.3.2 of AS/NZS 4600 (SA,
2005) while the member moment capacity (Mb) is specified in Clause 3.3.3. AS/NZS
4600 (SA, 2005) covers the member moment capacity of cold-formed flexural
members for a number of buckling modes including lateral torsional and lateral
distortional buckling in Clauses 3.3.3.2 and 3.3.3.3, respectively.
2.6.2.1 Section Moment Capacity
The section moment capacity (Ms) is defined in Clause 3.3.2 of AS/NZS 4600 (SA,
2005) in a similar fashion to AS 4100. However, unlike AS 4100 (SA, 1998), the
effective section modulus (Ze) is based on the initiation of yielding in the extreme
compression fibre and therefore does not allow for the inelastic reserve capacity of
the section. The effects of local buckling are accounted for by using reduced widths
(be) of non-compact elements in compression for the calculation of the effective
section modulus. The plate element slenderness is a function of the applied stress (f*)
as shown in Equation 2.23:
Ms = fy Ze (2.23)
Literature Review
2-30
Ef
tb
k
*052.1⎟⎠⎞
⎜⎝⎛=λ (2.24)
Where, λ, t = plate slenderness and thickness
k = plate buckling coefficient
b = flat width of element excluding radii
f* = design stress in the compression element
The procedure to find out the effective widths of uniformly compressed stiffened
elements for capacity calculations is given in Clause 2.2.1.2 of AS/NZS 4600 (SA,
2005).
For λ ≤ 0.673 : be = b (2.25a)
For λ > 0.673: be = ρb (2.25b)
ρ 0.1
22.01≤
⎟⎠⎞
⎜⎝⎛−
=λλ (2.26)
The procedure to find out the effective widths of stiffened elements with stress
gradient for capacity calculations is given in Clause 2.2.3.2 of AS/NZS 4600 (SA,
2005).
ψ−
=3
1e
ebb (2.27)
For ψ ≤ -0.236 : be2 = 2
eb (2.28a)
For ψ > -0.236 : be2 = be – be1 (2.28b)
Where
be = effective width from Equation 2.25 with f1* substituted for f* and
with k determined as follows;
k = 4 + 2(1- ψ)3 + 2(1- ψ)
ψ = *
*
1
2
ff
*
*
1
2
ff = web stresses calculated on the basis of the effective section
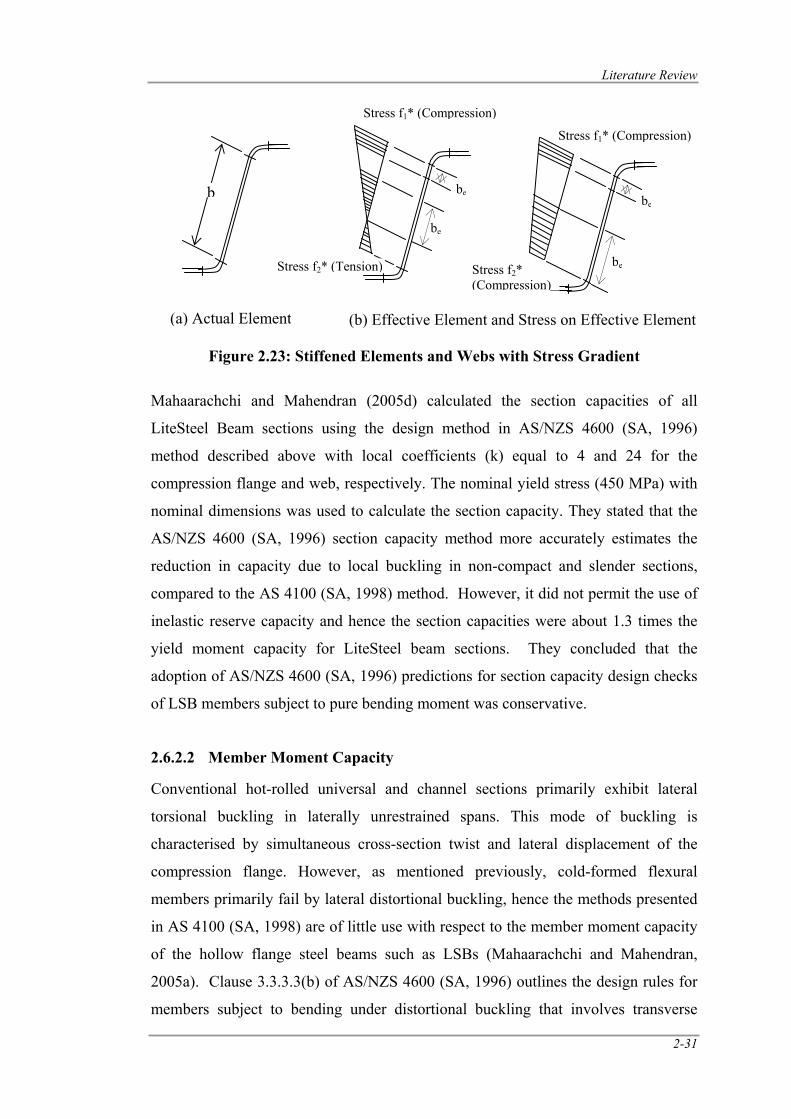
Literature Review
2-31
Figure 2.23: Stiffened Elements and Webs with Stress Gradient
Mahaarachchi and Mahendran (2005d) calculated the section capacities of all
LiteSteel Beam sections using the design method in AS/NZS 4600 (SA, 1996)
method described above with local coefficients (k) equal to 4 and 24 for the
compression flange and web, respectively. The nominal yield stress (450 MPa) with
nominal dimensions was used to calculate the section capacity. They stated that the
AS/NZS 4600 (SA, 1996) section capacity method more accurately estimates the
reduction in capacity due to local buckling in non-compact and slender sections,
compared to the AS 4100 (SA, 1998) method. However, it did not permit the use of
inelastic reserve capacity and hence the section capacities were about 1.3 times the
yield moment capacity for LiteSteel beam sections. They concluded that the
adoption of AS/NZS 4600 (SA, 1996) predictions for section capacity design checks
of LSB members subject to pure bending moment was conservative.
2.6.2.2 Member Moment Capacity
Conventional hot-rolled universal and channel sections primarily exhibit lateral
torsional buckling in laterally unrestrained spans. This mode of buckling is
characterised by simultaneous cross-section twist and lateral displacement of the
compression flange. However, as mentioned previously, cold-formed flexural
members primarily fail by lateral distortional buckling, hence the methods presented
in AS 4100 (SA, 1998) are of little use with respect to the member moment capacity
of the hollow flange steel beams such as LSBs (Mahaarachchi and Mahendran,
2005a). Clause 3.3.3.3(b) of AS/NZS 4600 (SA, 1996) outlines the design rules for
members subject to bending under distortional buckling that involves transverse
b
(a) Actual Element
Stress f1* (Compression)
be
be
Stress f2* (Tension)
be
beStress f2* (Compression)
Stress f1* (Compression)
(b) Effective Element and Stress on Effective Element
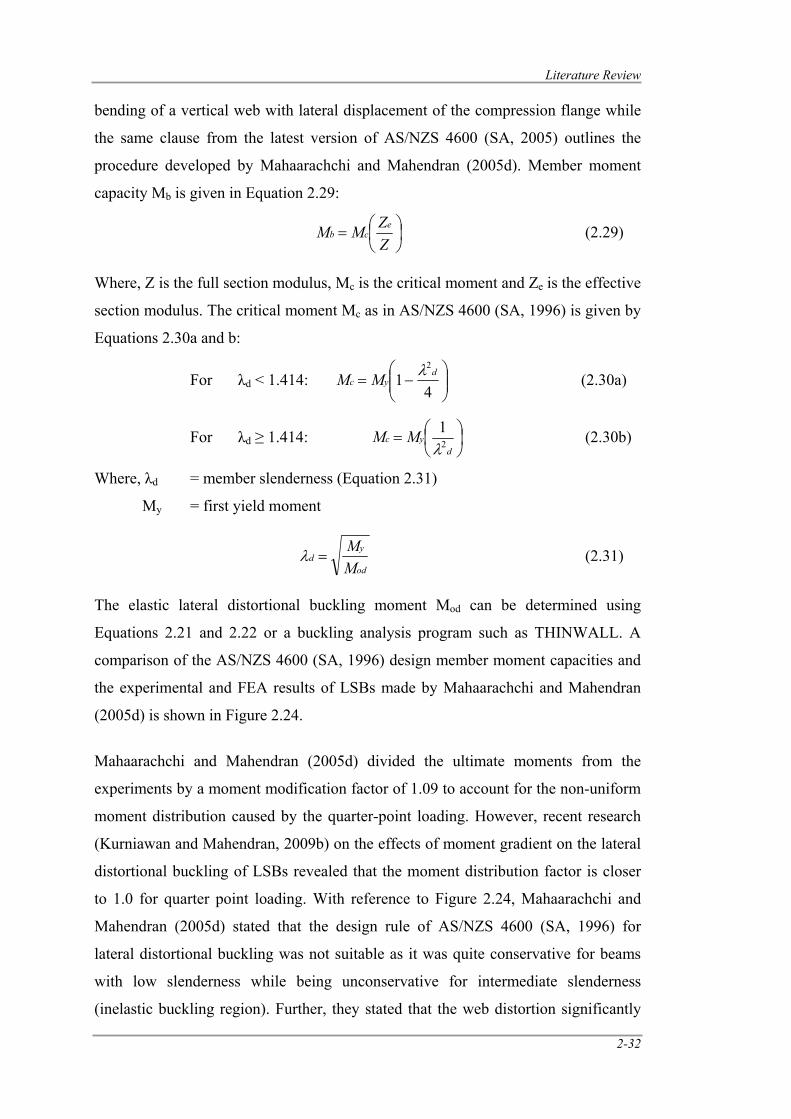
Literature Review
2-32
bending of a vertical web with lateral displacement of the compression flange while
the same clause from the latest version of AS/NZS 4600 (SA, 2005) outlines the
procedure developed by Mahaarachchi and Mahendran (2005d). Member moment
capacity Mb is given in Equation 2.29:
⎟⎠⎞
⎜⎝⎛=
ZZMM e
cb (2.29)
Where, Z is the full section modulus, Mc is the critical moment and Ze is the effective
section modulus. The critical moment Mc as in AS/NZS 4600 (SA, 1996) is given by
Equations 2.30a and b:
For λd < 1.414: ⎟⎟⎠
⎞⎜⎜⎝
⎛−=
41
2d
yc MM λ (2.30a)
For λd ≥ 1.414: ⎟⎠⎞
⎜⎝⎛=
dyc MM 2
1λ
(2.30b)
Where, λd = member slenderness (Equation 2.31)
My = first yield moment
od
yd
MM
=λ (2.31)
The elastic lateral distortional buckling moment Mod can be determined using
Equations 2.21 and 2.22 or a buckling analysis program such as THINWALL. A
comparison of the AS/NZS 4600 (SA, 1996) design member moment capacities and
the experimental and FEA results of LSBs made by Mahaarachchi and Mahendran
(2005d) is shown in Figure 2.24.
Mahaarachchi and Mahendran (2005d) divided the ultimate moments from the
experiments by a moment modification factor of 1.09 to account for the non-uniform
moment distribution caused by the quarter-point loading. However, recent research
(Kurniawan and Mahendran, 2009b) on the effects of moment gradient on the lateral
distortional buckling of LSBs revealed that the moment distribution factor is closer
to 1.0 for quarter point loading. With reference to Figure 2.24, Mahaarachchi and
Mahendran (2005d) stated that the design rule of AS/NZS 4600 (SA, 1996) for
lateral distortional buckling was not suitable as it was quite conservative for beams
with low slenderness while being unconservative for intermediate slenderness
(inelastic buckling region). Further, they stated that the web distortion significantly
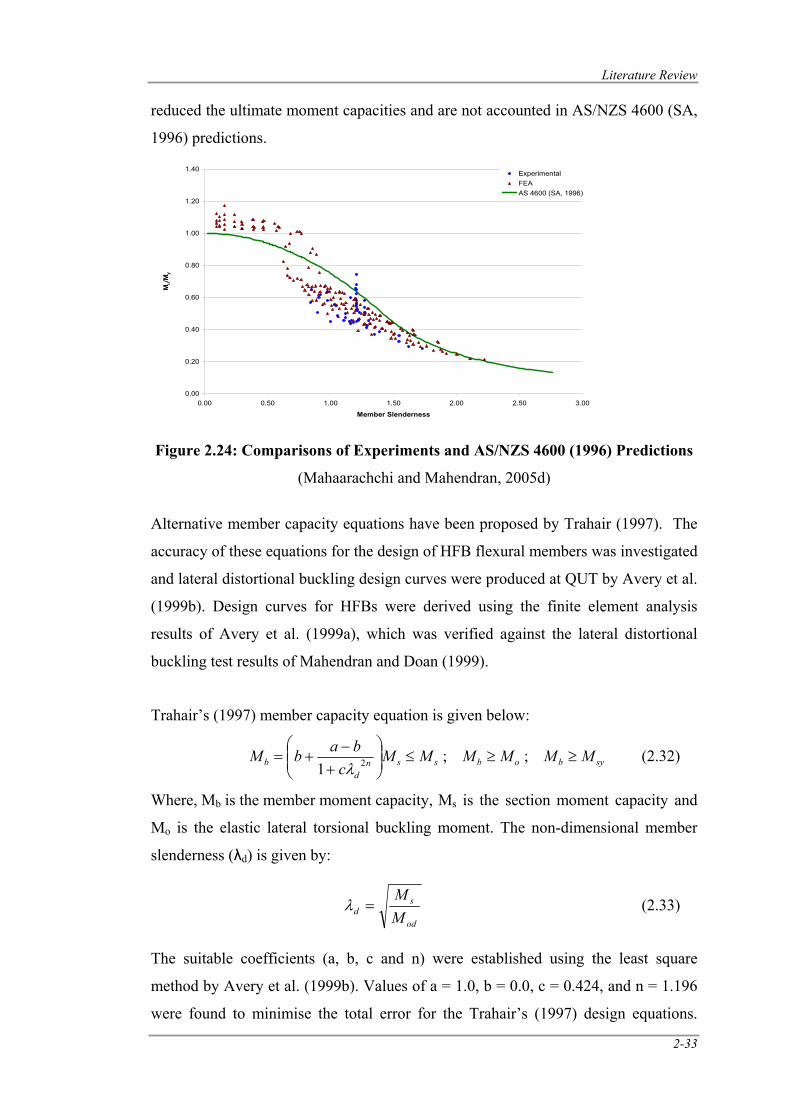
Literature Review
2-33
reduced the ultimate moment capacities and are not accounted in AS/NZS 4600 (SA,
1996) predictions.
Figure 2.24: Comparisons of Experiments and AS/NZS 4600 (1996) Predictions
(Mahaarachchi and Mahendran, 2005d)
Alternative member capacity equations have been proposed by Trahair (1997). The
accuracy of these equations for the design of HFB flexural members was investigated
and lateral distortional buckling design curves were produced at QUT by Avery et al.
(1999b). Design curves for HFBs were derived using the finite element analysis
results of Avery et al. (1999a), which was verified against the lateral distortional
buckling test results of Mahendran and Doan (1999).
Trahair’s (1997) member capacity equation is given below:
sybobssnd
b MMMMMMc
babM ≥≥≤⎟⎟⎠
⎞⎜⎜⎝
⎛
+−
+= ;;1 2λ
(2.32)
Where, Mb is the member moment capacity, Ms is the section moment capacity and
Mo is the elastic lateral torsional buckling moment. The non-dimensional member
slenderness (λd) is given by:
od
sd M
M=λ (2.33)
The suitable coefficients (a, b, c and n) were established using the least square
method by Avery et al. (1999b). Values of a = 1.0, b = 0.0, c = 0.424, and n = 1.196
were found to minimise the total error for the Trahair’s (1997) design equations.
0.00
0.20
0.40
0.60
0.80
1.00
1.20
1.40
0.00 0.50 1.00 1.50 2.00 2.50 3.00
Member Slenderness
Mu/M
yExperimentalFEAAS 4600 (SA, 1996)
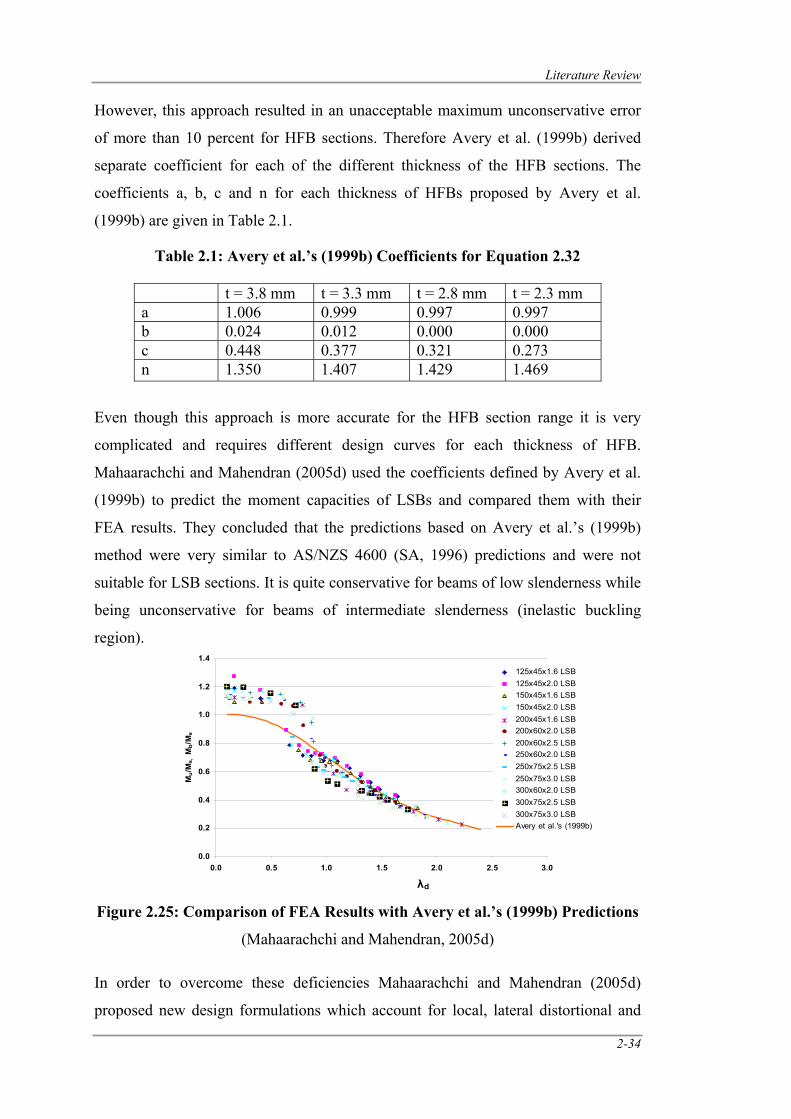
Literature Review
2-34
However, this approach resulted in an unacceptable maximum unconservative error
of more than 10 percent for HFB sections. Therefore Avery et al. (1999b) derived
separate coefficient for each of the different thickness of the HFB sections. The
coefficients a, b, c and n for each thickness of HFBs proposed by Avery et al.
(1999b) are given in Table 2.1.
Table 2.1: Avery et al.’s (1999b) Coefficients for Equation 2.32
t = 3.8 mm t = 3.3 mm t = 2.8 mm t = 2.3 mm a 1.006 0.999 0.997 0.997 b 0.024 0.012 0.000 0.000 c 0.448 0.377 0.321 0.273 n 1.350 1.407 1.429 1.469
Even though this approach is more accurate for the HFB section range it is very
complicated and requires different design curves for each thickness of HFB.
Mahaarachchi and Mahendran (2005d) used the coefficients defined by Avery et al.
(1999b) to predict the moment capacities of LSBs and compared them with their
FEA results. They concluded that the predictions based on Avery et al.’s (1999b)
method were very similar to AS/NZS 4600 (SA, 1996) predictions and were not
suitable for LSB sections. It is quite conservative for beams of low slenderness while
being unconservative for beams of intermediate slenderness (inelastic buckling
region).
Figure 2.25: Comparison of FEA Results with Avery et al.’s (1999b) Predictions
(Mahaarachchi and Mahendran, 2005d)
In order to overcome these deficiencies Mahaarachchi and Mahendran (2005d)
proposed new design formulations which account for local, lateral distortional and
0.0
0.2
0.4
0.6
0.8
1.0
1.2
1.4
0.0 0.5 1.0 1.5 2.0 2.5 3.0
Mu/
Ms,
Mb/
Ms
125x45x1.6 LSB125x45x2.0 LSB150x45x1.6 LSB150x45x2.0 LSB200x45x1.6 LSB200x60x2.0 LSB200x60x2.5 LSB250x60x2.0 LSB250x75x2.5 LSB250x75x3.0 LSB300x60x2.0 LSB300x75x2.5 LSB300x75x3.0 LSBAvery et al.'s (1999b)
λd
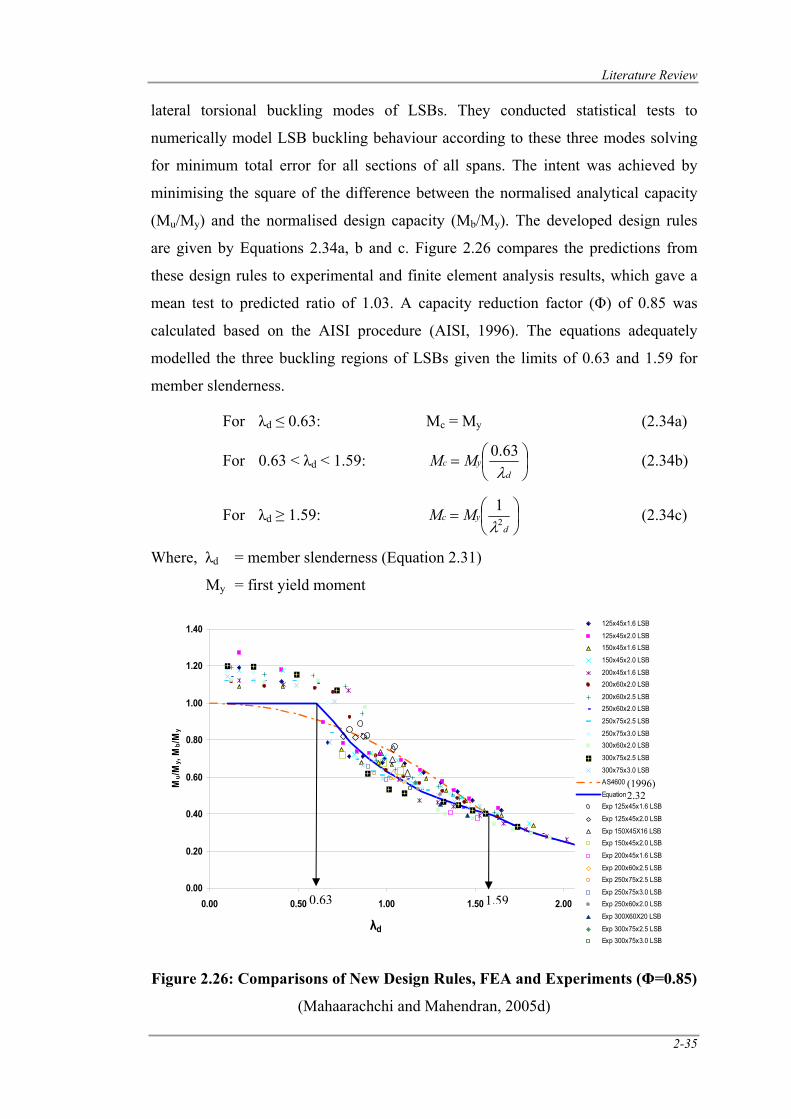
Literature Review
2-35
lateral torsional buckling modes of LSBs. They conducted statistical tests to
numerically model LSB buckling behaviour according to these three modes solving
for minimum total error for all sections of all spans. The intent was achieved by
minimising the square of the difference between the normalised analytical capacity
(Mu/My) and the normalised design capacity (Mb/My). The developed design rules
are given by Equations 2.34a, b and c. Figure 2.26 compares the predictions from
these design rules to experimental and finite element analysis results, which gave a
mean test to predicted ratio of 1.03. A capacity reduction factor (Φ) of 0.85 was
calculated based on the AISI procedure (AISI, 1996). The equations adequately
modelled the three buckling regions of LSBs given the limits of 0.63 and 1.59 for
member slenderness.
For λd ≤ 0.63: Mc = My (2.34a)
For 0.63 < λd < 1.59: ⎟⎠⎞
⎜⎝⎛=
dyc MM
λ63.0 (2.34b)
For λd ≥ 1.59: ⎟⎠⎞
⎜⎝⎛=
dyc MM 2
1λ
(2.34c)
Where, λd = member slenderness (Equation 2.31)
My = first yield moment
Figure 2.26: Comparisons of New Design Rules, FEA and Experiments (Φ=0.85)
(Mahaarachchi and Mahendran, 2005d)
0.00
0.20
0.40
0.60
0.80
1.00
1.20
1.40
0.00 0.50 1.00 1.50 2.00 2.50
Mu/M
y, M
b/My
125x45x1.6 LSB
125x45x2.0 LSB150x45x1.6 LSB
150x45x2.0 LSB
200x45x1.6 LSB200x60x2.0 LSB
200x60x2.5 LSB250x60x2.0 LSB
250x75x2.5 LSB
250x75x3.0 LSB300x60x2.0 LSB
300x75x2.5 LSB
300x75x3.0 LSBAS4600
Equation 15Exp 125x45x1.6 LSB
Exp 125x45x2.0 LSB
Exp 150X45X16 LSBExp 150x45x2.0 LSB
Exp 200x45x1.6 LSB
Exp 200x60x2.5 LSBExp 250x75x2.5 LSB
Exp 250x75x3.0 LSBExp 250x60x2.0 LSB
Exp 300X60X20 LSB
Exp 300x75x2.5 LSBExp 300x75x3.0 LSB
λd
(1996)2.32
0.63 1.59
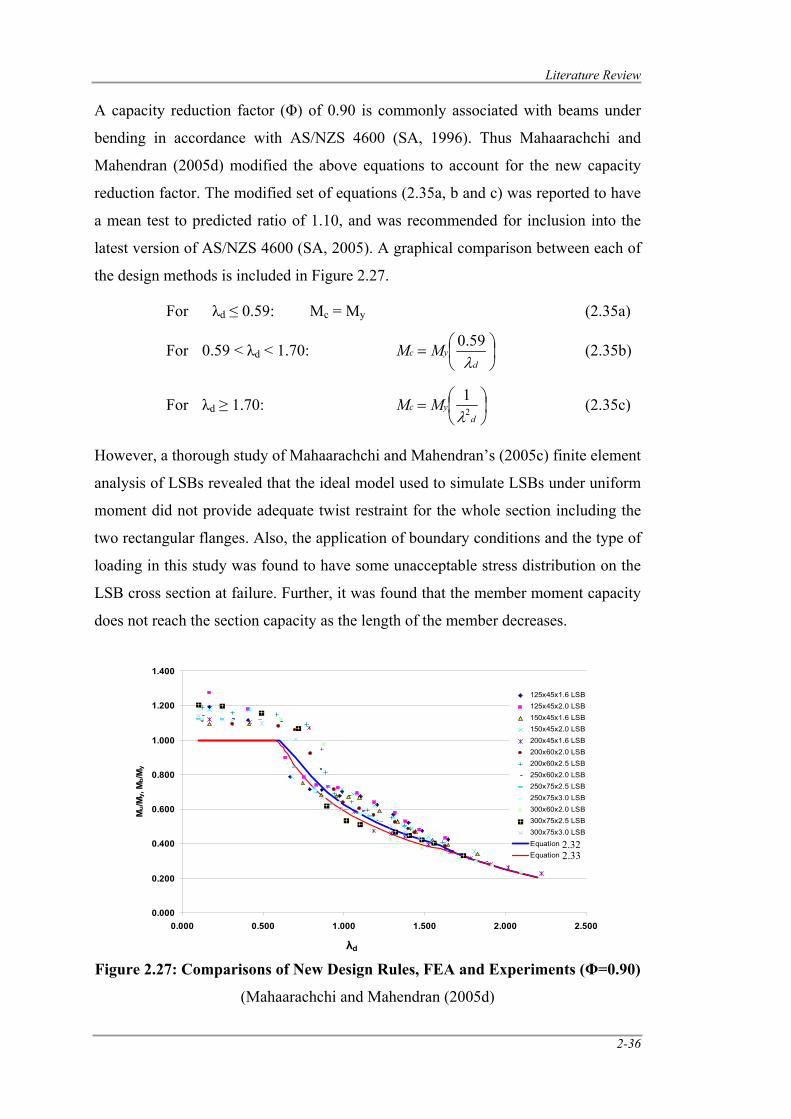
Literature Review
2-36
A capacity reduction factor (Φ) of 0.90 is commonly associated with beams under
bending in accordance with AS/NZS 4600 (SA, 1996). Thus Mahaarachchi and
Mahendran (2005d) modified the above equations to account for the new capacity
reduction factor. The modified set of equations (2.35a, b and c) was reported to have
a mean test to predicted ratio of 1.10, and was recommended for inclusion into the
latest version of AS/NZS 4600 (SA, 2005). A graphical comparison between each of
the design methods is included in Figure 2.27.
For λd ≤ 0.59: Mc = My (2.35a)
For 0.59 < λd < 1.70: ⎟⎠⎞
⎜⎝⎛=
dyc MM
λ59.0 (2.35b)
For λd ≥ 1.70: ⎟⎠⎞
⎜⎝⎛=
dyc MM 2
1λ
(2.35c)
However, a thorough study of Mahaarachchi and Mahendran’s (2005c) finite element
analysis of LSBs revealed that the ideal model used to simulate LSBs under uniform
moment did not provide adequate twist restraint for the whole section including the
two rectangular flanges. Also, the application of boundary conditions and the type of
loading in this study was found to have some unacceptable stress distribution on the
LSB cross section at failure. Further, it was found that the member moment capacity
does not reach the section capacity as the length of the member decreases.
Figure 2.27: Comparisons of New Design Rules, FEA and Experiments (Φ=0.90)
(Mahaarachchi and Mahendran (2005d)
0.000
0.200
0.400
0.600
0.800
1.000
1.200
1.400
0.000 0.500 1.000 1.500 2.000 2.500
Mu/M
y, M
b/My
125x45x1.6 LSB125x45x2.0 LSB150x45x1.6 LSB150x45x2.0 LSB200x45x1.6 LSB200x60x2.0 LSB200x60x2.5 LSB250x60x2.0 LSB250x75x2.5 LSB250x75x3.0 LSB300x60x2.0 LSB300x75x2.5 LSB300x75x3.0 LSBEquation 15Equation 16
λd
2.32 2.33
Literature Review
2-37
This research is mainly aimed at developing an accurate design curve using an
appropriate ideal finite element model including correct boundary conditions and
loading type. Also it is necessary to find out the appropriate geometrical parameters
which influence the lateral distortional buckling of LSBs and to include them in the
design procedures.
2.6.3 The Direct Strength Method
The Direct Strength Method (DSM) is a recently established method and was
formally adopted in the North American design specifications in 2004 as an
alterative to the traditional Effective Width Method. Accurate member elastic
stability is the fundamental idea behind the DSM. The Direct strength method is
predicted upon the idea that if an engineer determines all of the elastic instabilities
for the gross section (i.e., local, distortional and global buckling) and the load (or
moment) that causes the section to yield, then the strength can be directly determined
(Schafer, 2006). It is essentially an extension of the use of column curves for global
buckling, but with application to local and distortional buckling instabilities. Direct
strength method can be used with many advantages such as no effective width
calculation or iterations are required, gross sectional properties can be directly used,
explicit design method for distortional buckling, includes interaction of elements,
explores and includes all stability limit states and focus on the correct determination
of elastic buckling behaviour, instead of the empirical effective widths.
Elastic buckling analysis results are directly integrated into DSM. This provides a
general method of designing cold-formed steel members and creates the potential for
much broader extensions than the traditional specifications with limited applicability.
However, limitations of the direct strength method (as implemented in AISI 2004)
are given in the direct strength method design guide (CF06-1) and some of them are
presented here;
• overly conservative if very slender elements are used.
• shift in the neutral axis is ignored.
• empirical method calibrated only to work for cross-sections previously
investigated.
Section 7 of AS/NZS 4600 (SA, 2005) gives the direct strength method provisions
for cold-formed steel beams subject to bending with separate provisions for local
Literature Review
2-38
buckling, lateral torsional buckling and distortional buckling. As stated in Clause
7.2.2.1 of AS/NZS 4600 (SA, 2005), the nominal member moment capacity (Mb)
shall be the minimum of the nominal member moment capacity (Mbe) for lateral
torsional buckling, the nominal member moment capacity (Mbl) for local buckling
and the nominal member moment capacity (Mbd) for distortional buckling.
Clause 7.2.2.2 of AS/NZS 4600 (SA, 2005) gives design procedure to determine the
nominal member moment capacity (Mbe) for lateral torsional buckling and is given in
Equations 2.36 (a), (b) and (c).
For Mo < 0.56 My: Mbe = Mo (2.36a)
For 2.78 My ≥ Mo ≥ 0.56 My: ⎟⎟⎟
⎠
⎞
⎜⎜⎜
⎝
⎛
−=o
yybe
MMMM
36101
910 (2.36b)
For Mo > 2.78 My: Mbe = My (2.36c)
My= Zf fy (2.37)
Where, Mo is the elastic lateral torsional buckling moment, Zf is the full section
modulus and fy is the yield stress.
As in Clause 7.2.2.3 of AS/NZS 4600 (SA, 2005) the nominal member moment
capacity (Mbl) for local buckling is given in Equations 2.38 (a) and (b).
For λl ≤ 0.776: Mbl = Mbe (2.38a)
For λl > 0.776: bebe
ol
be
olbl M
MM
MMM
4.04.0
15.01 ⎟⎠⎞
⎜⎝⎛
⎥⎥⎦
⎤
⎢⎢⎣
⎡⎟⎠⎞
⎜⎝⎛−= (2.38b)
The non-dimensional member slenderness (λl) is given by:
ol
bel M
M=λ (2.39)
The elastic local buckling moment (Mol) is given by:
Mol = Zf fol (2.40)
Where fol is the elastic local buckling stress.
Clause 7.2.2.4 of AS/NZS 4600 (SA, 2005) provides the nominal member moment
capacity (Mbd) for distortional buckling and is given in Equations 2.41 (a) and (b).
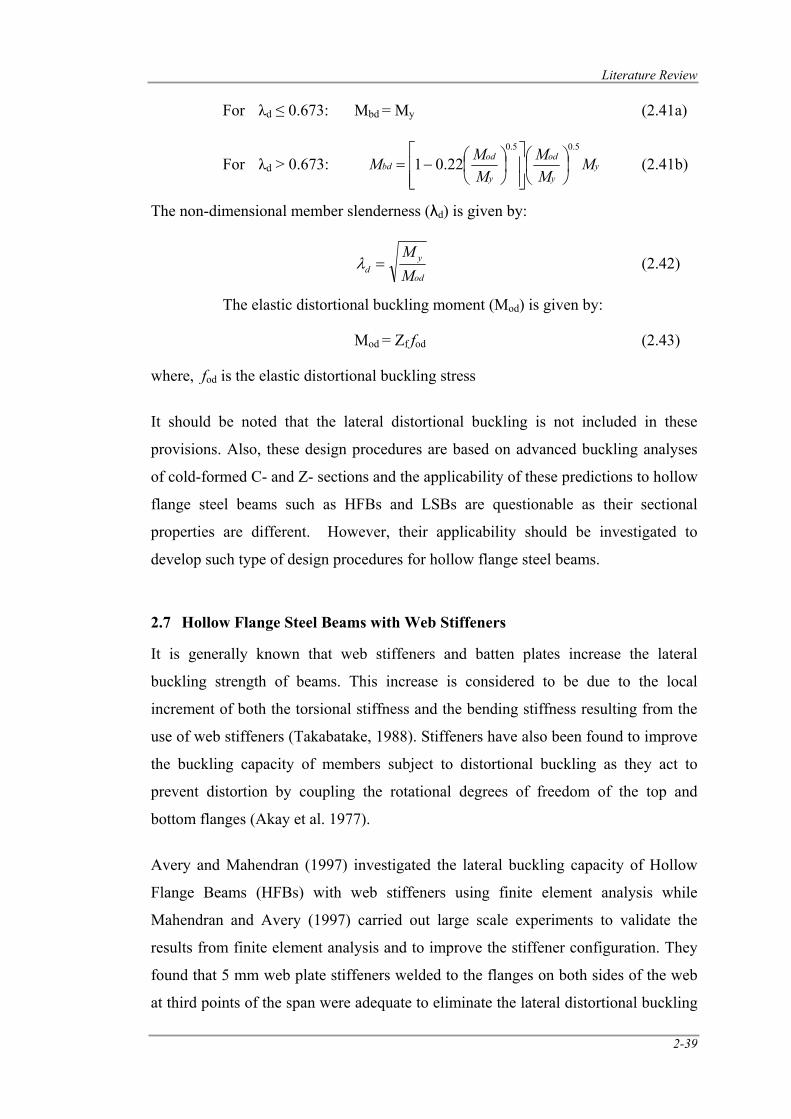
Literature Review
2-39
For λd ≤ 0.673: Mbd = My (2.41a)
For λd > 0.673: yy
od
y
odbd M
MM
MMM
5.05.0
22.01 ⎟⎠⎞
⎜⎝⎛
⎥⎥⎦
⎤
⎢⎢⎣
⎡⎟⎠⎞
⎜⎝⎛−= (2.41b)
The non-dimensional member slenderness (λd) is given by:
od
yd M
M=λ (2.42)
The elastic distortional buckling moment (Mod) is given by:
Mod = Zf fod (2.43)
where, fod is the elastic distortional buckling stress
It should be noted that the lateral distortional buckling is not included in these
provisions. Also, these design procedures are based on advanced buckling analyses
of cold-formed C- and Z- sections and the applicability of these predictions to hollow
flange steel beams such as HFBs and LSBs are questionable as their sectional
properties are different. However, their applicability should be investigated to
develop such type of design procedures for hollow flange steel beams.
2.7 Hollow Flange Steel Beams with Web Stiffeners
It is generally known that web stiffeners and batten plates increase the lateral
buckling strength of beams. This increase is considered to be due to the local
increment of both the torsional stiffness and the bending stiffness resulting from the
use of web stiffeners (Takabatake, 1988). Stiffeners have also been found to improve
the buckling capacity of members subject to distortional buckling as they act to
prevent distortion by coupling the rotational degrees of freedom of the top and
bottom flanges (Akay et al. 1977).
Avery and Mahendran (1997) investigated the lateral buckling capacity of Hollow
Flange Beams (HFBs) with web stiffeners using finite element analysis while
Mahendran and Avery (1997) carried out large scale experiments to validate the
results from finite element analysis and to improve the stiffener configuration. They
found that 5 mm web plate stiffeners welded to the flanges on both sides of the web
at third points of the span were adequate to eliminate the lateral distortional buckling
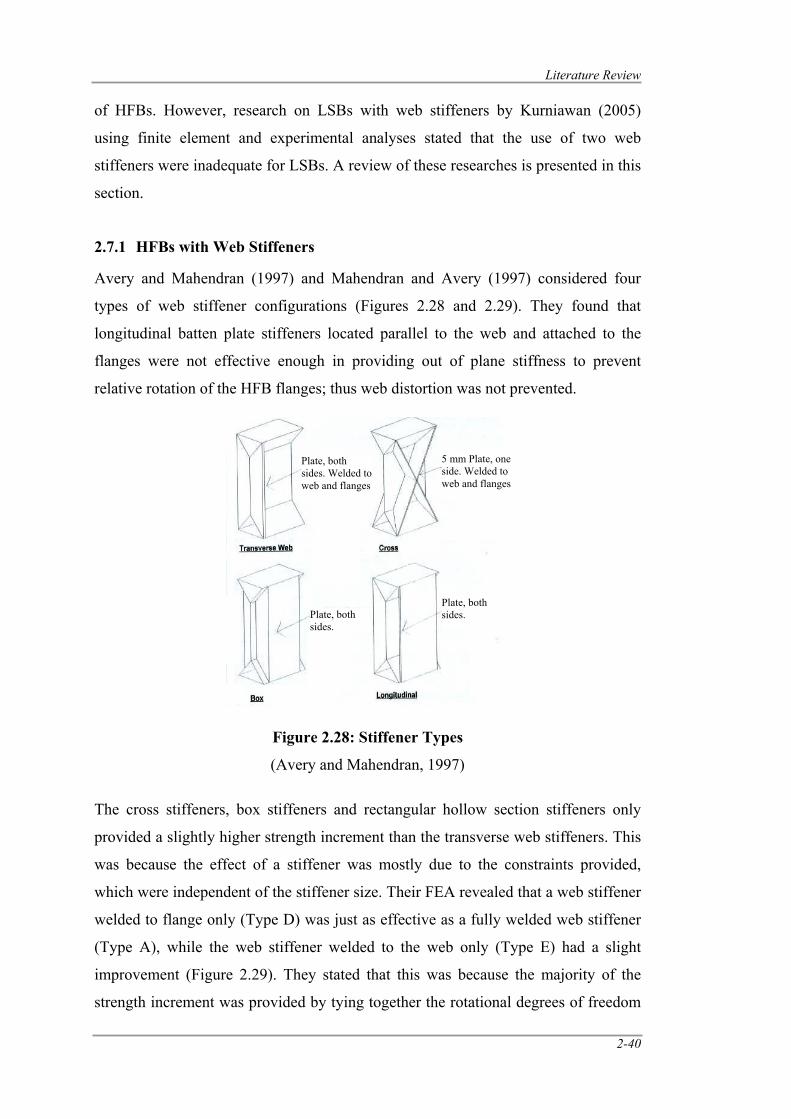
Literature Review
2-40
of HFBs. However, research on LSBs with web stiffeners by Kurniawan (2005)
using finite element and experimental analyses stated that the use of two web
stiffeners were inadequate for LSBs. A review of these researches is presented in this
section.
2.7.1 HFBs with Web Stiffeners
Avery and Mahendran (1997) and Mahendran and Avery (1997) considered four
types of web stiffener configurations (Figures 2.28 and 2.29). They found that
longitudinal batten plate stiffeners located parallel to the web and attached to the
flanges were not effective enough in providing out of plane stiffness to prevent
relative rotation of the HFB flanges; thus web distortion was not prevented.
Figure 2.28: Stiffener Types
(Avery and Mahendran, 1997)
The cross stiffeners, box stiffeners and rectangular hollow section stiffeners only
provided a slightly higher strength increment than the transverse web stiffeners. This
was because the effect of a stiffener was mostly due to the constraints provided,
which were independent of the stiffener size. Their FEA revealed that a web stiffener
welded to flange only (Type D) was just as effective as a fully welded web stiffener
(Type A), while the web stiffener welded to the web only (Type E) had a slight
improvement (Figure 2.29). They stated that this was because the majority of the
strength increment was provided by tying together the rotational degrees of freedom
Plate, both sides. Welded to web and flanges
5 mm Plate, one side. Welded to web and flanges
Plate, both sides.
Plate, both sides.
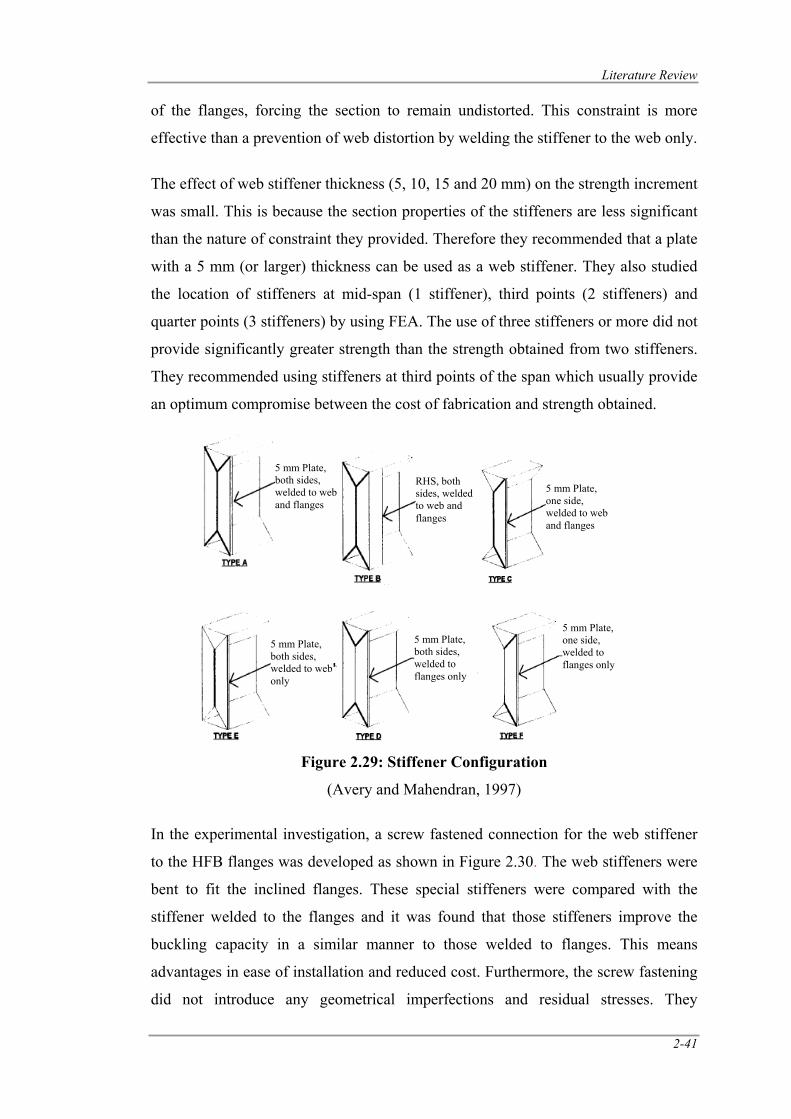
Literature Review
2-41
of the flanges, forcing the section to remain undistorted. This constraint is more
effective than a prevention of web distortion by welding the stiffener to the web only.
The effect of web stiffener thickness (5, 10, 15 and 20 mm) on the strength increment
was small. This is because the section properties of the stiffeners are less significant
than the nature of constraint they provided. Therefore they recommended that a plate
with a 5 mm (or larger) thickness can be used as a web stiffener. They also studied
the location of stiffeners at mid-span (1 stiffener), third points (2 stiffeners) and
quarter points (3 stiffeners) by using FEA. The use of three stiffeners or more did not
provide significantly greater strength than the strength obtained from two stiffeners.
They recommended using stiffeners at third points of the span which usually provide
an optimum compromise between the cost of fabrication and strength obtained.
Figure 2.29: Stiffener Configuration
(Avery and Mahendran, 1997)
In the experimental investigation, a screw fastened connection for the web stiffener
to the HFB flanges was developed as shown in Figure 2.30. The web stiffeners were
bent to fit the inclined flanges. These special stiffeners were compared with the
stiffener welded to the flanges and it was found that those stiffeners improve the
buckling capacity in a similar manner to those welded to flanges. This means
advantages in ease of installation and reduced cost. Furthermore, the screw fastening
did not introduce any geometrical imperfections and residual stresses. They
5 mm Plate, both sides, welded to web and flanges
RHS, both sides, welded to web and flanges
5 mm Plate, one side, welded to web and flanges
5 mm Plate, both sides, welded to web only
5 mm Plate, both sides, welded to flanges only
5 mm Plate, one side, welded to flanges only
Literature Review
2-42
considered overhang loading method in the experimental investigations. Further
details of their experiments can be found in Section 2.9.6.
Figure 2.30: Special Stiffener Screw Fastened to HFB Flanges
(Mahendran and Avery, 1997)
2.7.2 LSBs with Web Stiffeners
Even though web stiffeners effectively eliminated the detrimental lateral distortional
buckling of HFBs the applicability of these results to LSB is questionable as the HFB
is a doubly symmetric section with two triangular hollow flanges whereas the LSB is
a monosymmetric channel section with two rectangular hollow flanges. Kurniawan
(2005) investigated the lateral distortional buckling behaviour of LSB sections with
web stiffeners. This section provides a summary of his study.
2.7.2.1 Stiffener Type and Configurations
Six types of stiffeners were considered with the recommendations of Avery and
Mahendran (1997) and Mahendran and Avery (1997) in order meet economical and
strength requirements. Figure 2.31 shows different types of stiffeners studied by
Kurniawan (2005). He used them at third points of the span as this provided an
optimum compromise between the cost and strength. He selected 250 x 60 x 2.0 LSB
with quarter point loading condition and a span of 3.5 m. Details of the experiments
can be found in Section 2.9.5.
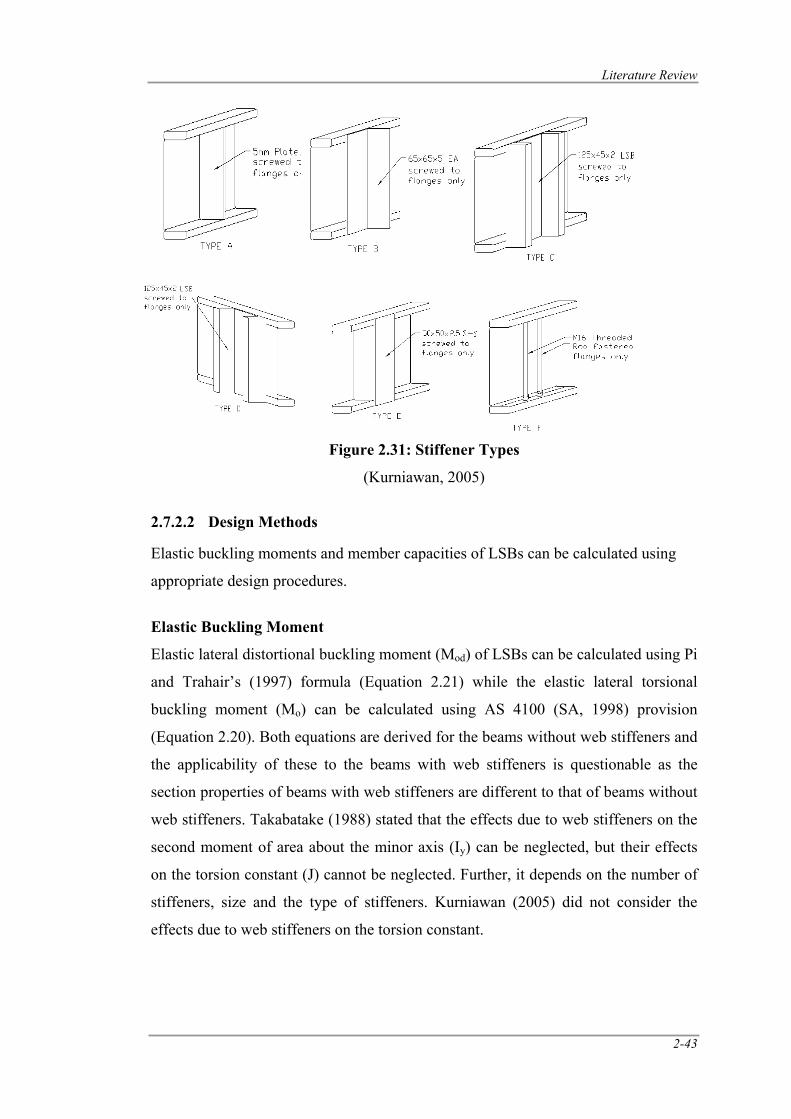
Literature Review
2-43
Figure 2.31: Stiffener Types
(Kurniawan, 2005)
2.7.2.2 Design Methods
Elastic buckling moments and member capacities of LSBs can be calculated using
appropriate design procedures.
Elastic Buckling Moment
Elastic lateral distortional buckling moment (Mod) of LSBs can be calculated using Pi
and Trahair’s (1997) formula (Equation 2.21) while the elastic lateral torsional
buckling moment (Mo) can be calculated using AS 4100 (SA, 1998) provision
(Equation 2.20). Both equations are derived for the beams without web stiffeners and
the applicability of these to the beams with web stiffeners is questionable as the
section properties of beams with web stiffeners are different to that of beams without
web stiffeners. Takabatake (1988) stated that the effects due to web stiffeners on the
second moment of area about the minor axis (Iy) can be neglected, but their effects
on the torsion constant (J) cannot be neglected. Further, it depends on the number of
stiffeners, size and the type of stiffeners. Kurniawan (2005) did not consider the
effects due to web stiffeners on the torsion constant.
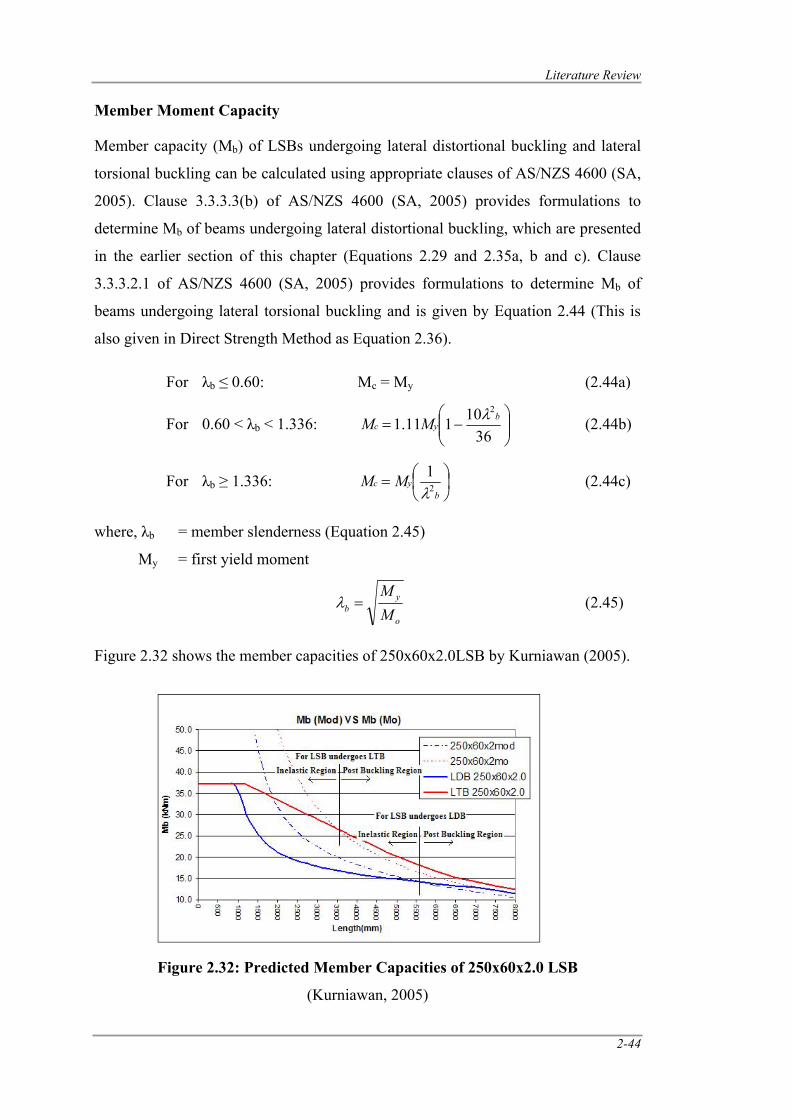
Literature Review
2-44
Member Moment Capacity
Member capacity (Mb) of LSBs undergoing lateral distortional buckling and lateral
torsional buckling can be calculated using appropriate clauses of AS/NZS 4600 (SA,
2005). Clause 3.3.3.3(b) of AS/NZS 4600 (SA, 2005) provides formulations to
determine Mb of beams undergoing lateral distortional buckling, which are presented
in the earlier section of this chapter (Equations 2.29 and 2.35a, b and c). Clause
3.3.3.2.1 of AS/NZS 4600 (SA, 2005) provides formulations to determine Mb of
beams undergoing lateral torsional buckling and is given by Equation 2.44 (This is
also given in Direct Strength Method as Equation 2.36).
For λb ≤ 0.60: Mc = My (2.44a)
For 0.60 < λb < 1.336: ⎟⎟⎠
⎞⎜⎜⎝
⎛−=
3610111.1
2b
yc MM λ (2.44b)
For λb ≥ 1.336: ⎟⎠⎞
⎜⎝⎛=
byc MM 2
1λ
(2.44c)
where, λb = member slenderness (Equation 2.45)
My = first yield moment
o
yb M
M=λ (2.45)
Figure 2.32 shows the member capacities of 250x60x2.0LSB by Kurniawan (2005).
Figure 2.32: Predicted Member Capacities of 250x60x2.0 LSB
(Kurniawan, 2005)
Literature Review
2-45
2.7.2.3 Experimental Results of Kurniawan (2005)
All the stiffener types were not able to eliminate the web distortion of the LSB
section during its lateral buckling failure. Even though expected capacity
improvement was approximately 58% the results from experiments showed a
maximum increase of only 11% with web stiffener and threaded rod stiffener.
Although all the stiffened LSBs failed in lateral distortional buckling mode, the
difference of top and bottom flange deflection was smaller than that for the
unstiffened LSBs. In addition, the use of stiffeners also improved the vertical
deflection. Stiffener Type D was found to have the greatest reduction of vertical
deflection by approximately 13%.
The connection type of the stiffener to the beams also was found to have some
effects on the capacity increase. Kurniawan (2005) stated that the TEK screw
fasteners were somewhat little loose due to the action of tying together the rotational
degrees of flange freedom. In particular, this occurred in the experiments using
stiffener types B, C, D and E because the screws were fastened at the flange corners
thus subjected to pull out action (tension). A screw has a lower resistance to tension
than to shear action. The web stiffener and the threaded rods were fastened and
bolted to the inner flanges, respectively hence the screws and bolts were subjected to
a shear action. He suspected this might be one of the reasons why other stiffener
types gave lower strength improvement than the web stiffener and threaded rods.
Ultimately, Kurniawan (2005) concluded that none of the proposed stiffener types
could effectively improve the LiteSteel beam bending strength while the lateral
buckling strengths of Hollow Flange beams, with similar section characteristic to
LSBs, were improved significantly by simply introducing two web stiffeners (Avery
and Mahendran, 1997). This led Kurniawan (2005) to undertake an advanced
computer analysis of finite element modelling in order to verify the experimental
investigations and to further observe the behaviour of stiffened LSBs.
2.7.2.4 Finite Element Analysis Results of Kurniawan (2005)
This investigation used both the experimental and ideal finite element models,
developed by Mahaarachchi and Mahendran (2005c). Details of this model can be
found in Section 2.8.1. The experimental model is a simulation of the actual test
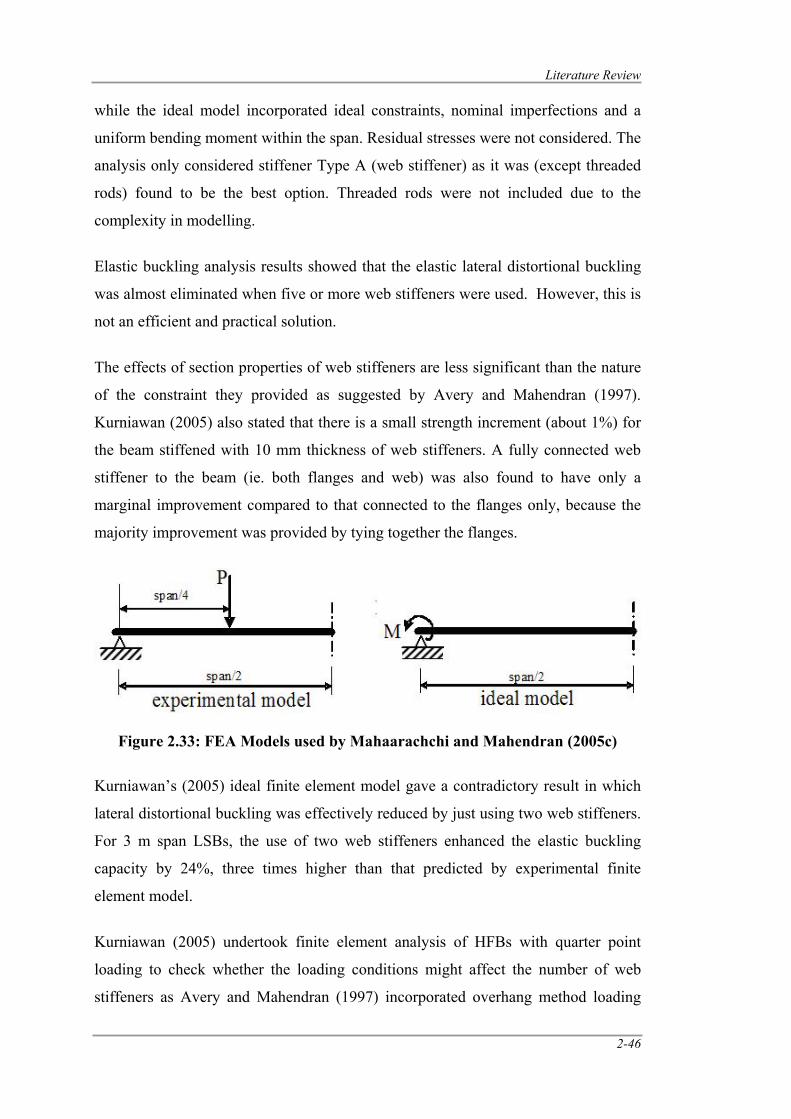
Literature Review
2-46
while the ideal model incorporated ideal constraints, nominal imperfections and a
uniform bending moment within the span. Residual stresses were not considered. The
analysis only considered stiffener Type A (web stiffener) as it was (except threaded
rods) found to be the best option. Threaded rods were not included due to the
complexity in modelling.
Elastic buckling analysis results showed that the elastic lateral distortional buckling
was almost eliminated when five or more web stiffeners were used. However, this is
not an efficient and practical solution.
The effects of section properties of web stiffeners are less significant than the nature
of the constraint they provided as suggested by Avery and Mahendran (1997).
Kurniawan (2005) also stated that there is a small strength increment (about 1%) for
the beam stiffened with 10 mm thickness of web stiffeners. A fully connected web
stiffener to the beam (ie. both flanges and web) was also found to have only a
marginal improvement compared to that connected to the flanges only, because the
majority improvement was provided by tying together the flanges.
Figure 2.33: FEA Models used by Mahaarachchi and Mahendran (2005c)
Kurniawan’s (2005) ideal finite element model gave a contradictory result in which
lateral distortional buckling was effectively reduced by just using two web stiffeners.
For 3 m span LSBs, the use of two web stiffeners enhanced the elastic buckling
capacity by 24%, three times higher than that predicted by experimental finite
element model.
Kurniawan (2005) undertook finite element analysis of HFBs with quarter point
loading to check whether the loading conditions might affect the number of web
stiffeners as Avery and Mahendran (1997) incorporated overhang method loading
Literature Review
2-47
and concluded that two web stiffeners would adequately eliminate the lateral
distortional buckling. However, Kurniawan (2005) did not obtain strength increase
for HFB as much as Avery and Mahendran (1997) achieved. It should be noted that
Kurniawan (2005) considered only one HFB (30090HFB2.8) with 3 m span and
further investigation is required to conclude this fact.
Finally, Kurniawan (2005) used the same finite element model which was used by
Maharachchi and Mahendran (2005c). However, it was found that this finite element
model had some deficiencies such as inadequate lateral restraint, improper
application of end moments and loads and the direction of initial imperfections.
Experiments also found to be limited to only one LSB section. Therefore detailed
finite element analyses using both experimental model with quarter point loading and
ideal model of LSBs should be undertaken. Web plate stiffeners with 5 mm thickness
would be adequate. Further, large scale experimental analyses are also required to
validate the FEA results.
2.8 Finite Element Analysis
Finite element analysis (FEA) of cold-formed steel structures plays an increasingly
important role in engineering practice, as it is relatively inexpensive and time
efficient compared with physical experiments, especially when a parametric study of
cross-section geometries is involved. Furthermore, it is difficult to investigate the
effects of geometric imperfections and residual stresses of structural members
experimentally. Therefore, FEA is more economical than physical experiments,
provided the finite element model is accurate and the results could be validated with
sufficient experimental results.
The finite element analysis process involves three major phases such as pre-
processing, solution and post processing. The purpose of pre-processing is to develop
an appropriate finite element mesh, assign suitable material properties, and apply
boundary conditions in the form of restraints and loads. Governing equations are
assembled into a matrix form and are solved numerically in the “solution” phase.
The assembly process depends not only on the type of analysis (e.g. static or
dynamic), but also on the model’s element types and properties, material properties
and boundary conditions. Post-processing begins with a thorough check for problems
Literature Review
2-48
that may have occurred during the solution stage. Most solvers provide a log file,
which should be searched for warning or error messages, and which will also provide
a quantitative measure of how well behaved the numerical procedures were during
solution.
2.8.1 Finite Element Analyses of LSBs
Mahaarachchi and Mahendran (2005c) conducted a numerical study of LSB sections
including elastic buckling and non-linear static analyses using a finite element
program called ABAQUS. They used MSC/PATRAN pre-processing facilities to
model the LSBs and ABAQUS (HKS, 2003) to analyse the model. They considered
both experimental and ideal finite element models. Experimental model was used to
validate the finite element models using experimental test results whereas the ideal
model was used to develop design curves (Figures 2.35 and 2.36). The cross-section
geometry of experimental models was based on measured dimensions. However,
they used nominal outside dimensions (OATM, 2008) to develop the ideal finite
element model instead of centreline dimensions. The geometric modelling process of
MSC/PATRAN is such that the specified section thickness is offset either side of
what is assumed to be a centreline dimension. This led to have somewhat higher
geometric area than actual. Also they ignored the corners of LSB sections in the
modelling for convenience as they verified that it did not affect the results
significantly.
Mahaarachchi and Mahendran (2005c) used shell elements (S4R5) to model the
LiteSteel beams. This element is a thin, shear flexible, isoparametric quadrilateral
shell with four nodes and five degrees of freedom per node, utilising reduced
integration and bilinear interpolation schemes. R3D4 rigid body elements and stiff
beam elements were used to create the ideal pinned member end restraints and
loading for both models. The R3D4 element is a rigid quadrilateral element with four
nodes and three translational degrees.
Using some convergence studies, Mahaarachchi and Mahendran (2005c) selected the
element sizes to be 5 mm in width and 10 mm in length in the longitudinal direction.
The support conditions were simulated to provide the required idealised simply
supported conditions where the following requirements were satisfied.
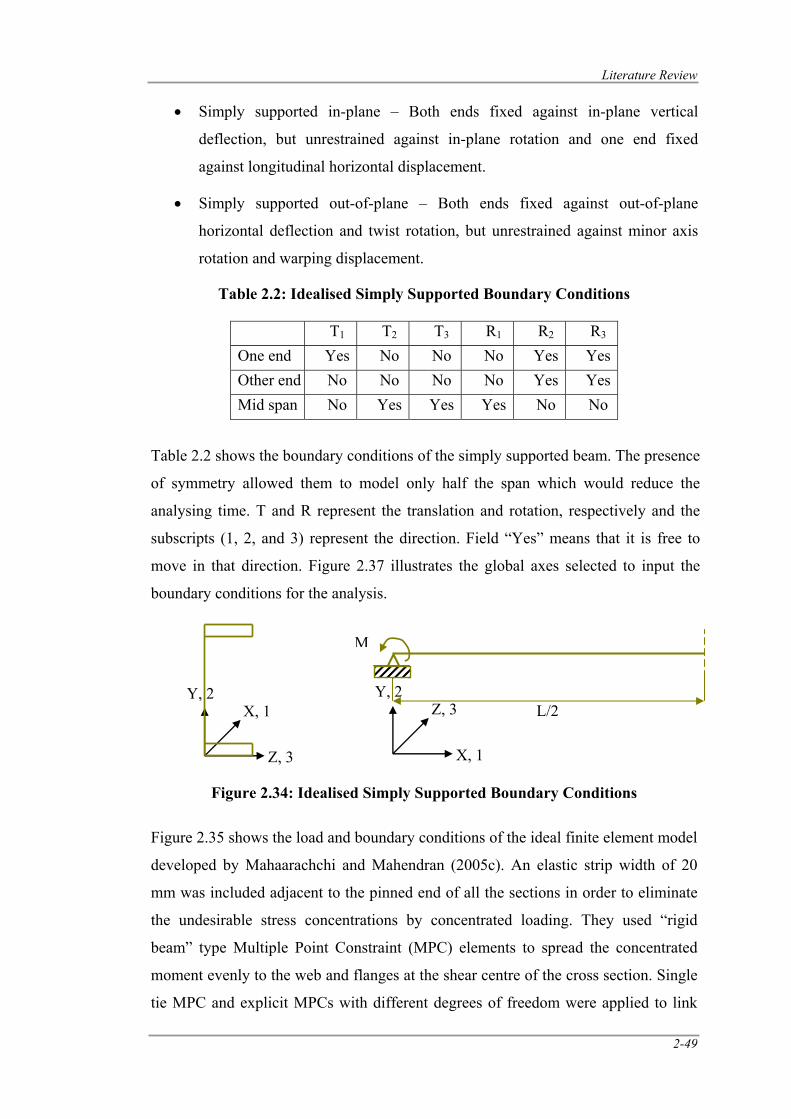
Literature Review
2-49
• Simply supported in-plane – Both ends fixed against in-plane vertical
deflection, but unrestrained against in-plane rotation and one end fixed
against longitudinal horizontal displacement.
• Simply supported out-of-plane – Both ends fixed against out-of-plane
horizontal deflection and twist rotation, but unrestrained against minor axis
rotation and warping displacement.
Table 2.2: Idealised Simply Supported Boundary Conditions
T1 T2 T3 R1 R2 R3 One end Yes No No No Yes Yes Other end No No No No Yes Yes Mid span No Yes Yes Yes No No
Table 2.2 shows the boundary conditions of the simply supported beam. The presence
of symmetry allowed them to model only half the span which would reduce the
analysing time. T and R represent the translation and rotation, respectively and the
subscripts (1, 2, and 3) represent the direction. Field “Yes” means that it is free to
move in that direction. Figure 2.37 illustrates the global axes selected to input the
boundary conditions for the analysis.
Figure 2.34: Idealised Simply Supported Boundary Conditions
Figure 2.35 shows the load and boundary conditions of the ideal finite element model
developed by Mahaarachchi and Mahendran (2005c). An elastic strip width of 20
mm was included adjacent to the pinned end of all the sections in order to eliminate
the undesirable stress concentrations by concentrated loading. They used “rigid
beam” type Multiple Point Constraint (MPC) elements to spread the concentrated
moment evenly to the web and flanges at the shear centre of the cross section. Single
tie MPC and explicit MPCs with different degrees of freedom were applied to link
X, 1
Z, 3
Y, 2 Z, 3
X, 1
Y, 2
M
L/2
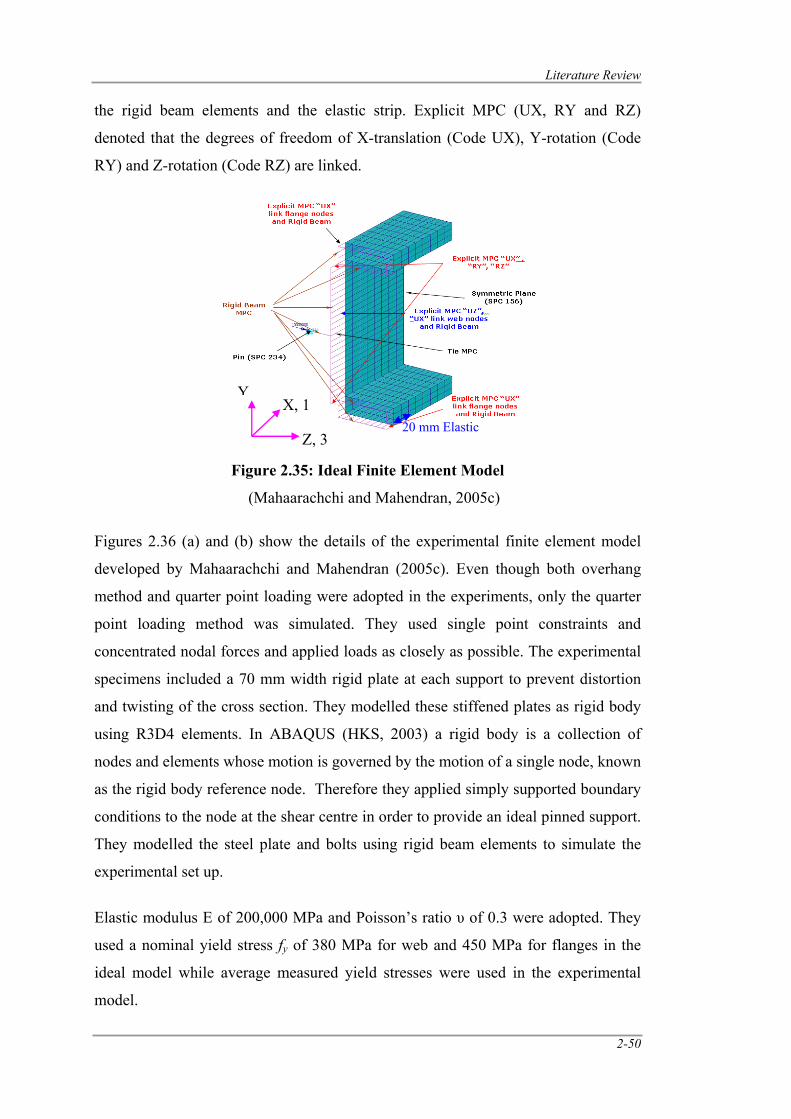
Literature Review
2-50
the rigid beam elements and the elastic strip. Explicit MPC (UX, RY and RZ)
denoted that the degrees of freedom of X-translation (Code UX), Y-rotation (Code
RY) and Z-rotation (Code RZ) are linked.
Figure 2.35: Ideal Finite Element Model
(Mahaarachchi and Mahendran, 2005c)
Figures 2.36 (a) and (b) show the details of the experimental finite element model
developed by Mahaarachchi and Mahendran (2005c). Even though both overhang
method and quarter point loading were adopted in the experiments, only the quarter
point loading method was simulated. They used single point constraints and
concentrated nodal forces and applied loads as closely as possible. The experimental
specimens included a 70 mm width rigid plate at each support to prevent distortion
and twisting of the cross section. They modelled these stiffened plates as rigid body
using R3D4 elements. In ABAQUS (HKS, 2003) a rigid body is a collection of
nodes and elements whose motion is governed by the motion of a single node, known
as the rigid body reference node. Therefore they applied simply supported boundary
conditions to the node at the shear centre in order to provide an ideal pinned support.
They modelled the steel plate and bolts using rigid beam elements to simulate the
experimental set up.
Elastic modulus E of 200,000 MPa and Poisson’s ratio υ of 0.3 were adopted. They
used a nominal yield stress fy of 380 MPa for web and 450 MPa for flanges in the
ideal model while average measured yield stresses were used in the experimental
model.
X, 1
Z, 3
Y
20 mm Elastic
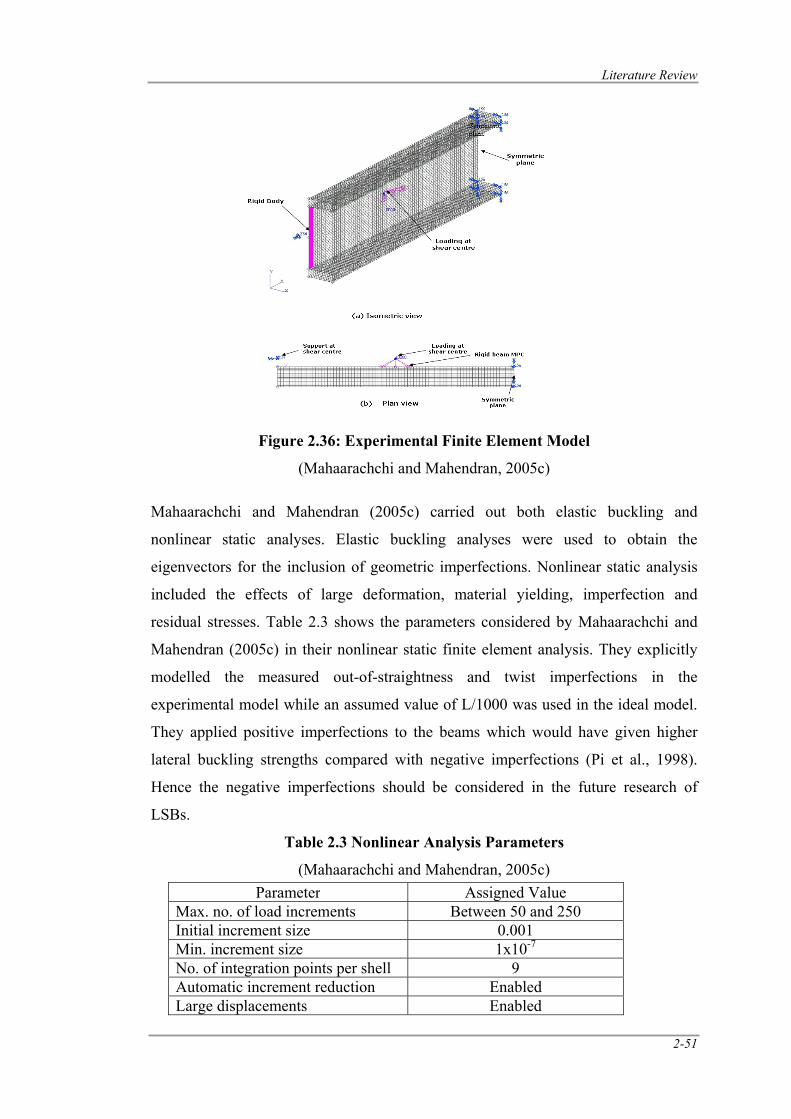
Literature Review
2-51
Figure 2.36: Experimental Finite Element Model
(Mahaarachchi and Mahendran, 2005c)
Mahaarachchi and Mahendran (2005c) carried out both elastic buckling and
nonlinear static analyses. Elastic buckling analyses were used to obtain the
eigenvectors for the inclusion of geometric imperfections. Nonlinear static analysis
included the effects of large deformation, material yielding, imperfection and
residual stresses. Table 2.3 shows the parameters considered by Mahaarachchi and
Mahendran (2005c) in their nonlinear static finite element analysis. They explicitly
modelled the measured out-of-straightness and twist imperfections in the
experimental model while an assumed value of L/1000 was used in the ideal model.
They applied positive imperfections to the beams which would have given higher
lateral buckling strengths compared with negative imperfections (Pi et al., 1998).
Hence the negative imperfections should be considered in the future research of
LSBs.
Table 2.3 Nonlinear Analysis Parameters
(Mahaarachchi and Mahendran, 2005c)
Parameter Assigned Value Max. no. of load increments Between 50 and 250 Initial increment size 0.001 Min. increment size 1x10⁻⁷
No. of integration points per shell 9Automatic increment reduction Enabled Large displacements Enabled
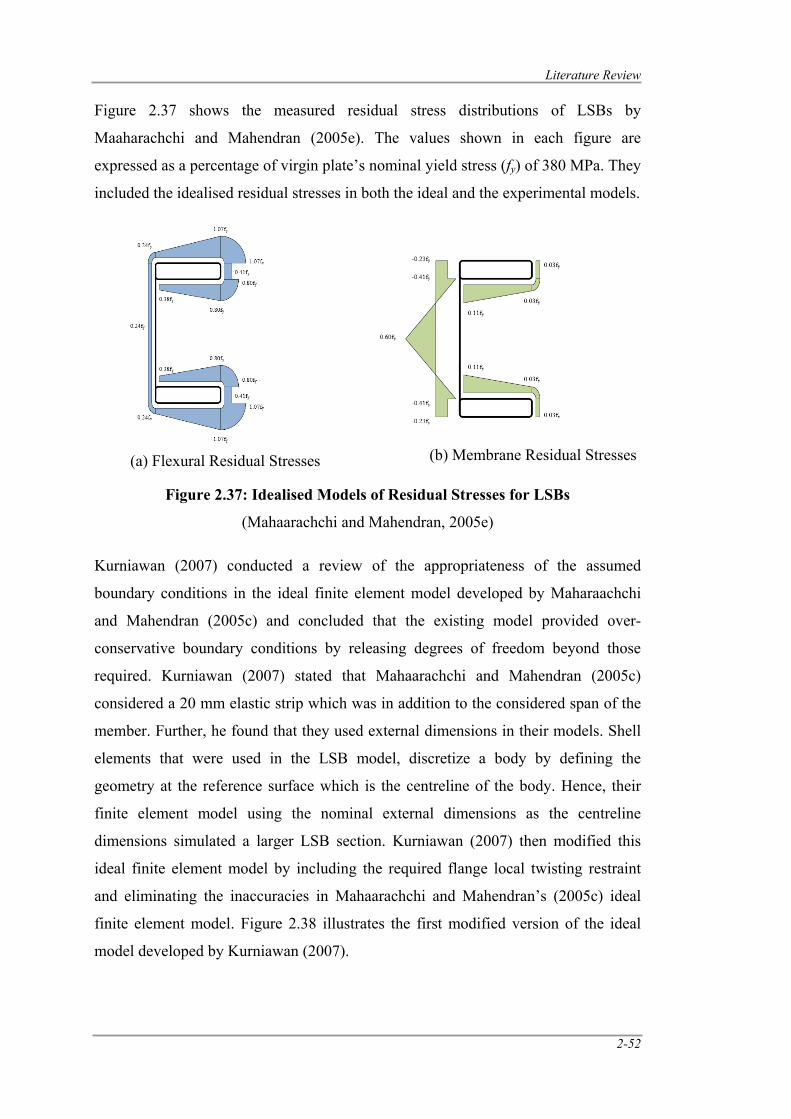
Literature Review
2-52
Figure 2.37 shows the measured residual stress distributions of LSBs by
Maaharachchi and Mahendran (2005e). The values shown in each figure are
expressed as a percentage of virgin plate’s nominal yield stress (fy) of 380 MPa. They
included the idealised residual stresses in both the ideal and the experimental models.
Figure 2.37: Idealised Models of Residual Stresses for LSBs
(Mahaarachchi and Mahendran, 2005e)
Kurniawan (2007) conducted a review of the appropriateness of the assumed
boundary conditions in the ideal finite element model developed by Maharaachchi
and Mahendran (2005c) and concluded that the existing model provided over-
conservative boundary conditions by releasing degrees of freedom beyond those
required. Kurniawan (2007) stated that Mahaarachchi and Mahendran (2005c)
considered a 20 mm elastic strip which was in addition to the considered span of the
member. Further, he found that they used external dimensions in their models. Shell
elements that were used in the LSB model, discretize a body by defining the
geometry at the reference surface which is the centreline of the body. Hence, their
finite element model using the nominal external dimensions as the centreline
dimensions simulated a larger LSB section. Kurniawan (2007) then modified this
ideal finite element model by including the required flange local twisting restraint
and eliminating the inaccuracies in Mahaarachchi and Mahendran’s (2005c) ideal
finite element model. Figure 2.38 illustrates the first modified version of the ideal
model developed by Kurniawan (2007).
(a) Flexural Residual Stresses (b) Membrane Residual Stresses
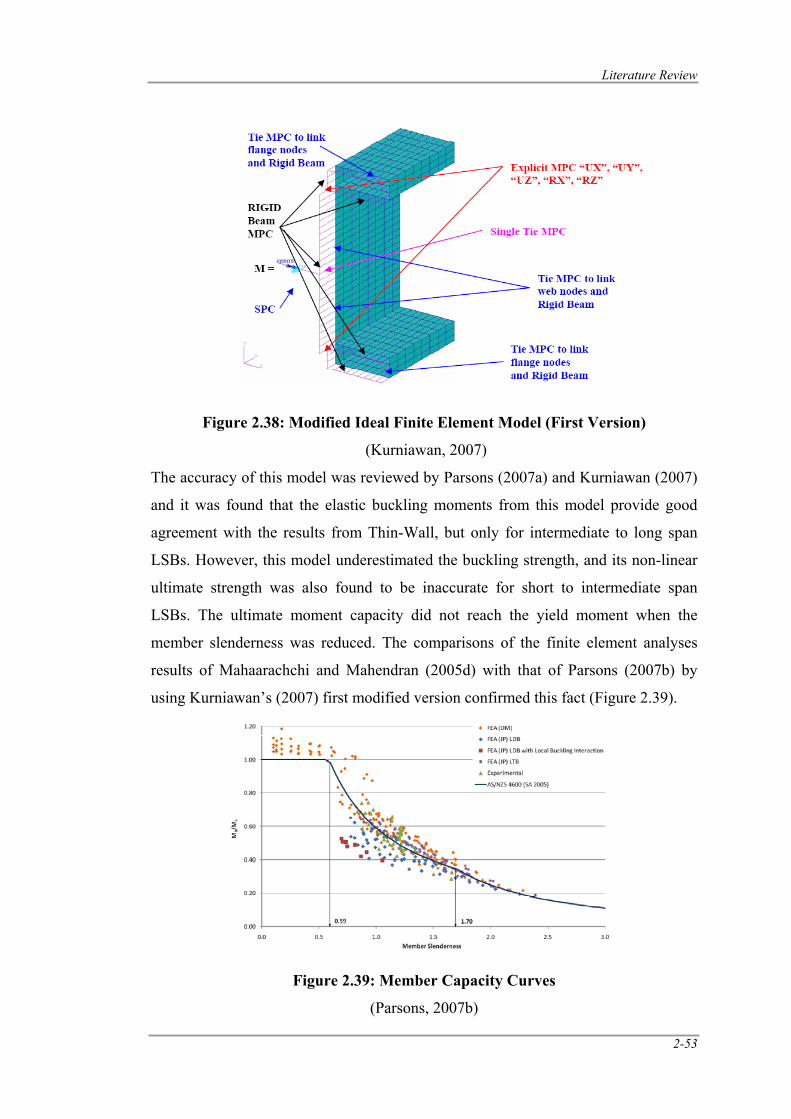
Literature Review
2-53
Figure 2.38: Modified Ideal Finite Element Model (First Version)
(Kurniawan, 2007)
The accuracy of this model was reviewed by Parsons (2007a) and Kurniawan (2007)
and it was found that the elastic buckling moments from this model provide good
agreement with the results from Thin-Wall, but only for intermediate to long span
LSBs. However, this model underestimated the buckling strength, and its non-linear
ultimate strength was also found to be inaccurate for short to intermediate span
LSBs. The ultimate moment capacity did not reach the yield moment when the
member slenderness was reduced. The comparisons of the finite element analyses
results of Mahaarachchi and Mahendran (2005d) with that of Parsons (2007b) by
using Kurniawan’s (2007) first modified version confirmed this fact (Figure 2.39).
Figure 2.39: Member Capacity Curves
(Parsons, 2007b)
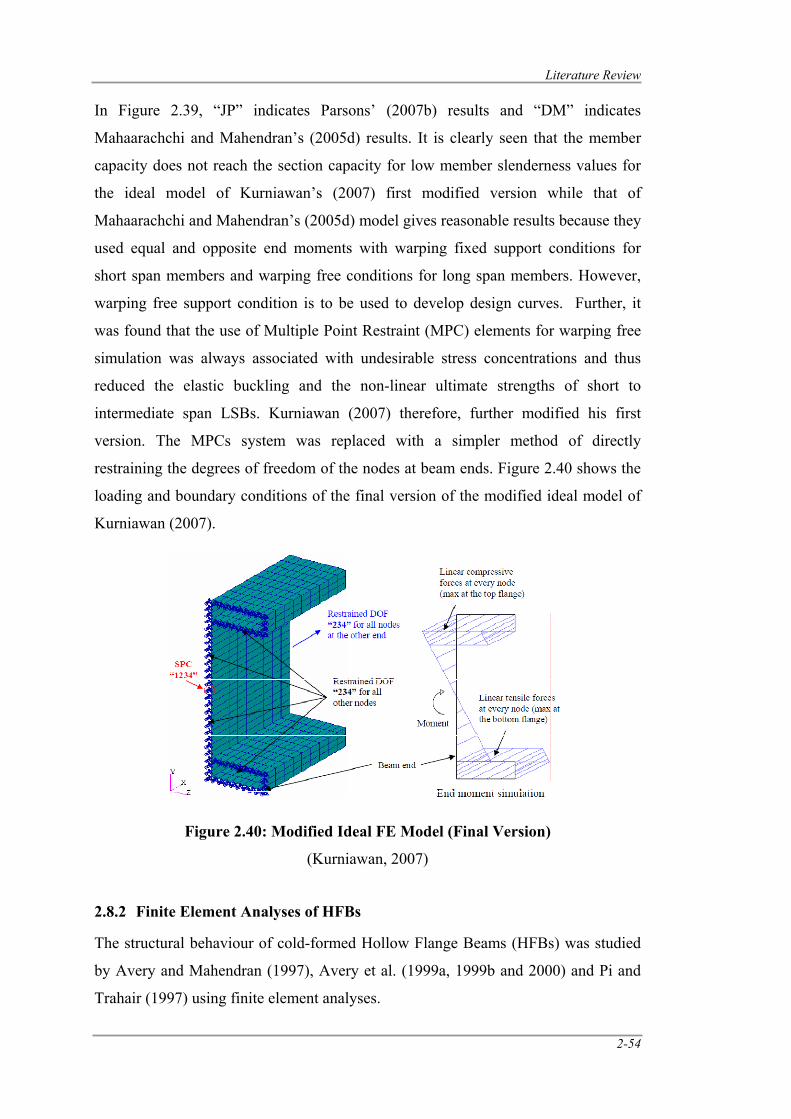
Literature Review
2-54
In Figure 2.39, “JP” indicates Parsons’ (2007b) results and “DM” indicates
Mahaarachchi and Mahendran’s (2005d) results. It is clearly seen that the member
capacity does not reach the section capacity for low member slenderness values for
the ideal model of Kurniawan’s (2007) first modified version while that of
Mahaarachchi and Mahendran’s (2005d) model gives reasonable results because they
used equal and opposite end moments with warping fixed support conditions for
short span members and warping free conditions for long span members. However,
warping free support condition is to be used to develop design curves. Further, it
was found that the use of Multiple Point Restraint (MPC) elements for warping free
simulation was always associated with undesirable stress concentrations and thus
reduced the elastic buckling and the non-linear ultimate strengths of short to
intermediate span LSBs. Kurniawan (2007) therefore, further modified his first
version. The MPCs system was replaced with a simpler method of directly
restraining the degrees of freedom of the nodes at beam ends. Figure 2.40 shows the
loading and boundary conditions of the final version of the modified ideal model of
Kurniawan (2007).
Figure 2.40: Modified Ideal FE Model (Final Version)
(Kurniawan, 2007)
2.8.2 Finite Element Analyses of HFBs
The structural behaviour of cold-formed Hollow Flange Beams (HFBs) was studied
by Avery and Mahendran (1997), Avery et al. (1999a, 1999b and 2000) and Pi and
Trahair (1997) using finite element analyses.
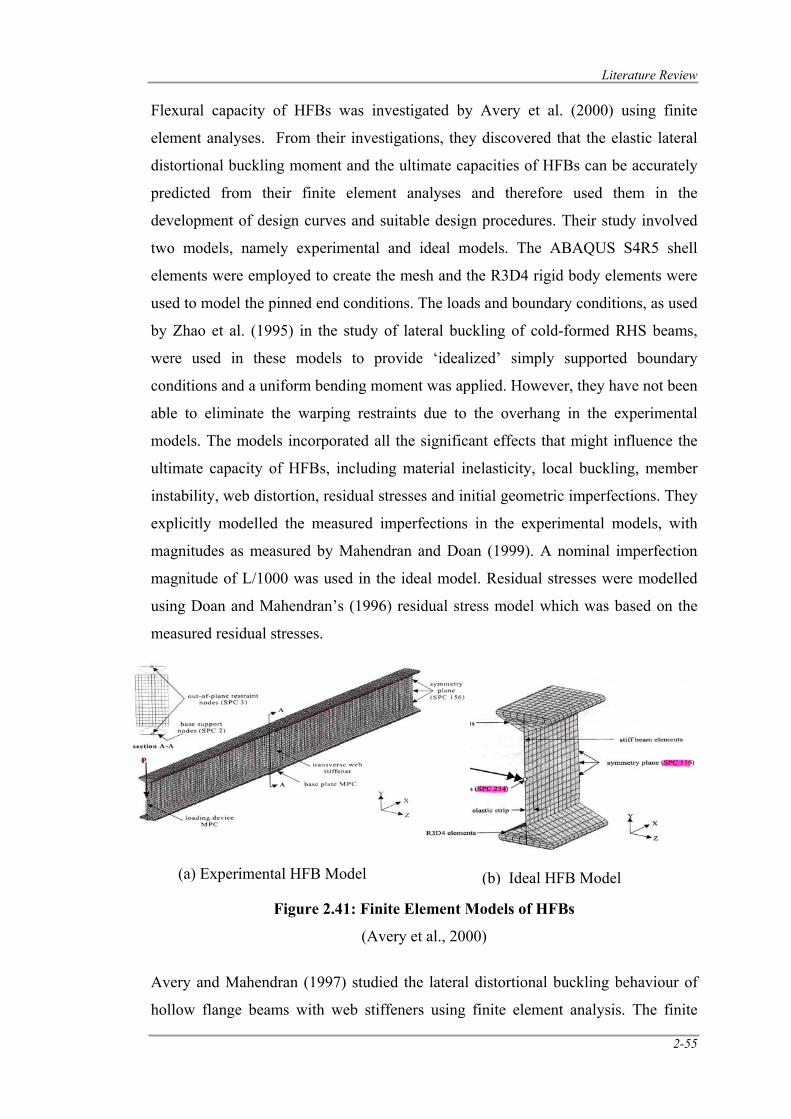
Literature Review
2-55
Flexural capacity of HFBs was investigated by Avery et al. (2000) using finite
element analyses. From their investigations, they discovered that the elastic lateral
distortional buckling moment and the ultimate capacities of HFBs can be accurately
predicted from their finite element analyses and therefore used them in the
development of design curves and suitable design procedures. Their study involved
two models, namely experimental and ideal models. The ABAQUS S4R5 shell
elements were employed to create the mesh and the R3D4 rigid body elements were
used to model the pinned end conditions. The loads and boundary conditions, as used
by Zhao et al. (1995) in the study of lateral buckling of cold-formed RHS beams,
were used in these models to provide ‘idealized’ simply supported boundary
conditions and a uniform bending moment was applied. However, they have not been
able to eliminate the warping restraints due to the overhang in the experimental
models. The models incorporated all the significant effects that might influence the
ultimate capacity of HFBs, including material inelasticity, local buckling, member
instability, web distortion, residual stresses and initial geometric imperfections. They
explicitly modelled the measured imperfections in the experimental models, with
magnitudes as measured by Mahendran and Doan (1999). A nominal imperfection
magnitude of L/1000 was used in the ideal model. Residual stresses were modelled
using Doan and Mahendran’s (1996) residual stress model which was based on the
measured residual stresses.
Figure 2.41: Finite Element Models of HFBs
(Avery et al., 2000)
Avery and Mahendran (1997) studied the lateral distortional buckling behaviour of
hollow flange beams with web stiffeners using finite element analysis. The finite
(b) Ideal HFB Model(a) Experimental HFB Model
Literature Review
2-56
element analysis program, MSC/NASTRAN was used for this study and the
quadrilateral shell elements (QUAD4) were used in this finite element modelling.
Triangular shell elements (TRIA3) were used to model the stiffeners. Only half of
the beam was modelled by making use of the symmetry of geometry and loading
conditions about the centre plane of the span. They developed both ideal and
experimental models. The ideal model consisted of typical idealised simply
supported boundary conditions and overhang method loading provided that the
cantilever span was fully restrained against lateral buckling. Also, no warping
restraints were allowed at the support. The experimental model was similar to the
ideal model which simulated the actual experimental set up. However, warping
restraints induced by overhang length were not eliminated.
They compared both the elastic buckling and non-linear analysis results from
experimental and ideal finite element model and concluded that the difference is
insignificant except short spans. For short span members, an interactive buckling
mode between the main span and the cantilever was observed in the experimental
model. Further, they used their ideal finite element model for parametric studies
using elastic buckling analysis.
2.9 Experimental Investigation
Experimental methods are the base and a necessity for scientific research even
though they are very time-consuming and expensive. Experimental results can be
used to verify the numerical models that can then be used to expand the results to
enable a full understanding of the structural behaviour and the development of design
rules. Past experiments on LSBs and HFBs are summarised in this section.
Mahaarachchi and Mahendran (2005a, b, and e) carried out lateral buckling tests,
section capacity tests and tensile coupon tests on LSBs. They also measured the
initial imperfections and residual stresses for LSBs.
2.9.1 Tensile Coupon Tests
Mahaarachchi and Mahendran (2005e) tested 42 tensile coupons, taken form
different locations such as outside flange, inside flange and web of different LSBs.
Details of the test specimens were chosen in accordance with the recommendations
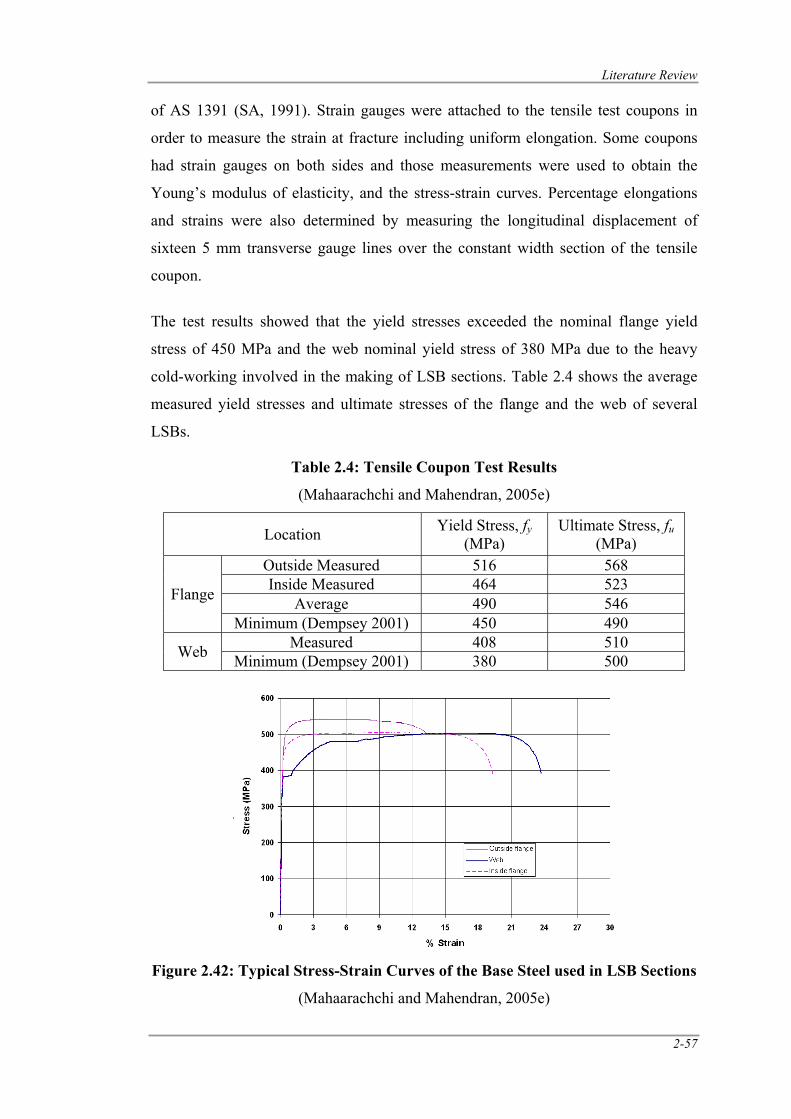
Literature Review
2-57
of AS 1391 (SA, 1991). Strain gauges were attached to the tensile test coupons in
order to measure the strain at fracture including uniform elongation. Some coupons
had strain gauges on both sides and those measurements were used to obtain the
Young’s modulus of elasticity, and the stress-strain curves. Percentage elongations
and strains were also determined by measuring the longitudinal displacement of
sixteen 5 mm transverse gauge lines over the constant width section of the tensile
coupon.
The test results showed that the yield stresses exceeded the nominal flange yield
stress of 450 MPa and the web nominal yield stress of 380 MPa due to the heavy
cold-working involved in the making of LSB sections. Table 2.4 shows the average
measured yield stresses and ultimate stresses of the flange and the web of several
LSBs.
Table 2.4: Tensile Coupon Test Results
(Mahaarachchi and Mahendran, 2005e)
Location Yield Stress, fy (MPa)
Ultimate Stress, fu(MPa)
Flange
Outside Measured 516 568 Inside Measured 464 523
Average 490 546 Minimum (Dempsey 2001) 450 490
Web Measured 408 510 Minimum (Dempsey 2001) 380 500
Figure 2.42: Typical Stress-Strain Curves of the Base Steel used in LSB Sections
(Mahaarachchi and Mahendran, 2005e)
Literature Review
2-58
Figure 2.42 shows the typical stress-strain curves of steel used in LSB sections. The
lack of yield plateau in the stress-strain curves of flange specimens indicating the
higher level of cold-working in the flanges. The web and flange yield stresses varied
depending on the thickness and LSB section (Mahaarachchi and Mahendran, 2005e).
2.9.2 Residual Stress Measurement
Generally, there are three groups of experimental methods used in residual stress
measurements such as destructive, semi-destructive and non-destructive methods.
Semi-destructive methods includes hole-drilling which is based on the fact that
drilling a hole releases the residual stresses, thus resulting in measurable
deformations on the surface adjacent to the hole. Non-destructive methods use
advanced techniques with high accuracy. One of the most frequently used non-
destructive methods is known as the X-ray diffraction technique. But it may not be
suitable for cold-formed steel. Other non-destructive techniques are the
electromagnetic method, neutron diffraction method, magnetic Barkhausen noise
method and the ultrasonic technique. The use of non-destructive methods is limited
because of the unavailability of highly specialised equipment.
The most commonly used destructive method is the sectioning method which is
considered to be the most reliable method of measuring residual stresses.
Mahaarachchi and Mahendran (2005e) used the sectioning method using electrical
strain gauges to measure the longitudinal and transverse residual stresses of LSBs.
However, since early tests showed the absence of transverse residual stresses, most
of the tests included only the longitudinal residual stress measurements. Electrical
strain gauges were used on both the inside and outside surfaces of the flanges. Due to
the difficulties of attaching the strain gauges on the inside corner, the measured
residual strains were extrapolated to the corners.
Figure 2.43 show some pictures of sectioning carried out by Mahaarachchi and
Mahendran (2005e) while the idealised residual stress distribution models for LSBs
are given in earlier section as Figure 2.37.
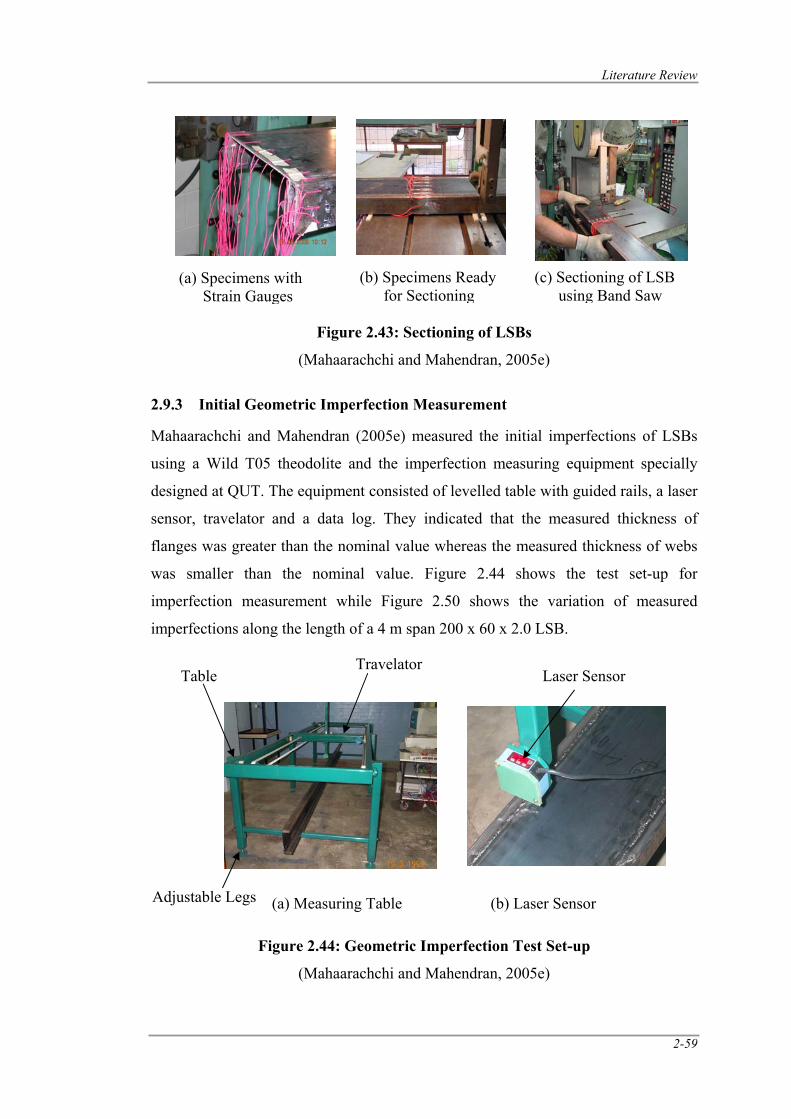
Literature Review
2-59
Figure 2.43: Sectioning of LSBs
(Mahaarachchi and Mahendran, 2005e)
2.9.3 Initial Geometric Imperfection Measurement
Mahaarachchi and Mahendran (2005e) measured the initial imperfections of LSBs
using a Wild T05 theodolite and the imperfection measuring equipment specially
designed at QUT. The equipment consisted of levelled table with guided rails, a laser
sensor, travelator and a data log. They indicated that the measured thickness of
flanges was greater than the nominal value whereas the measured thickness of webs
was smaller than the nominal value. Figure 2.44 shows the test set-up for
imperfection measurement while Figure 2.50 shows the variation of measured
imperfections along the length of a 4 m span 200 x 60 x 2.0 LSB.
Figure 2.44: Geometric Imperfection Test Set-up
(Mahaarachchi and Mahendran, 2005e)
(a) Specimens with Strain Gauges
(b) Specimens Ready for Sectioning
(c) Sectioning of LSB using Band Saw
Travelator Table
Adjustable Legs (a) Measuring Table (b) Laser Sensor
Laser Sensor
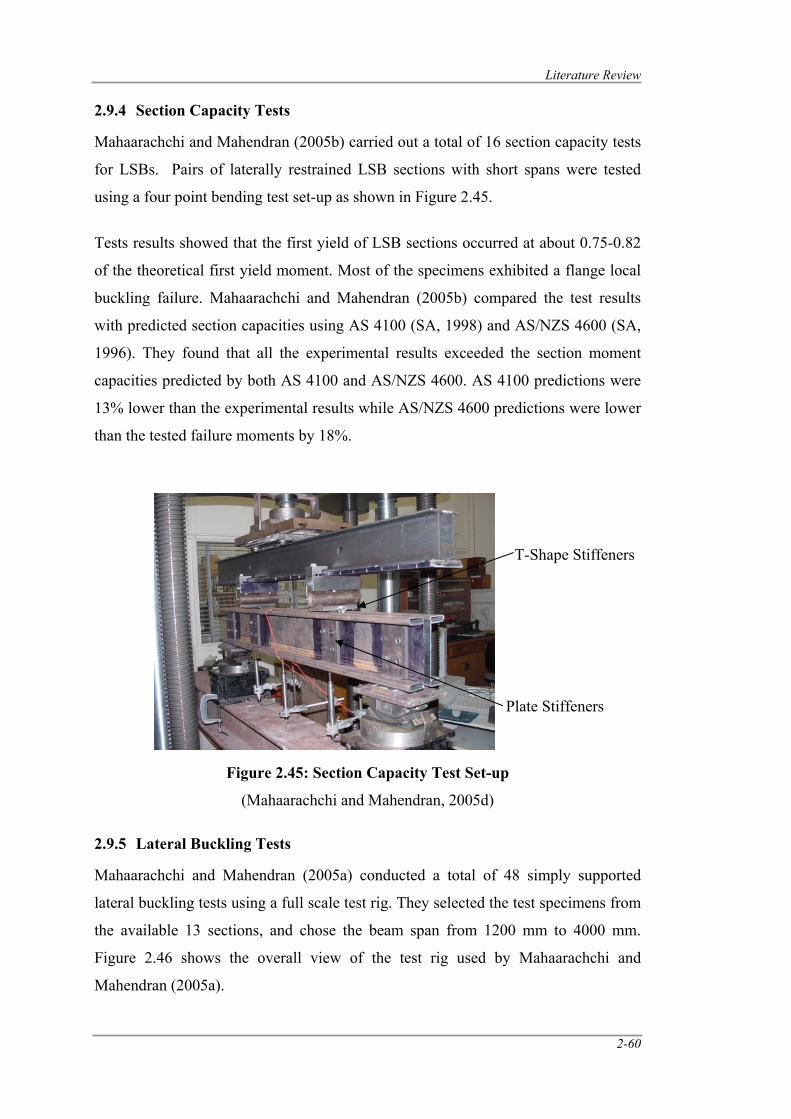
Literature Review
2-60
2.9.4 Section Capacity Tests
Mahaarachchi and Mahendran (2005b) carried out a total of 16 section capacity tests
for LSBs. Pairs of laterally restrained LSB sections with short spans were tested
using a four point bending test set-up as shown in Figure 2.45.
Tests results showed that the first yield of LSB sections occurred at about 0.75-0.82
of the theoretical first yield moment. Most of the specimens exhibited a flange local
buckling failure. Mahaarachchi and Mahendran (2005b) compared the test results
with predicted section capacities using AS 4100 (SA, 1998) and AS/NZS 4600 (SA,
1996). They found that all the experimental results exceeded the section moment
capacities predicted by both AS 4100 and AS/NZS 4600. AS 4100 predictions were
13% lower than the experimental results while AS/NZS 4600 predictions were lower
than the tested failure moments by 18%.
Figure 2.45: Section Capacity Test Set-up
(Mahaarachchi and Mahendran, 2005d)
2.9.5 Lateral Buckling Tests
Mahaarachchi and Mahendran (2005a) conducted a total of 48 simply supported
lateral buckling tests using a full scale test rig. They selected the test specimens from
the available 13 sections, and chose the beam span from 1200 mm to 4000 mm.
Figure 2.46 shows the overall view of the test rig used by Mahaarachchi and
Mahendran (2005a).
T-Shape Stiffeners
Plate Stiffeners
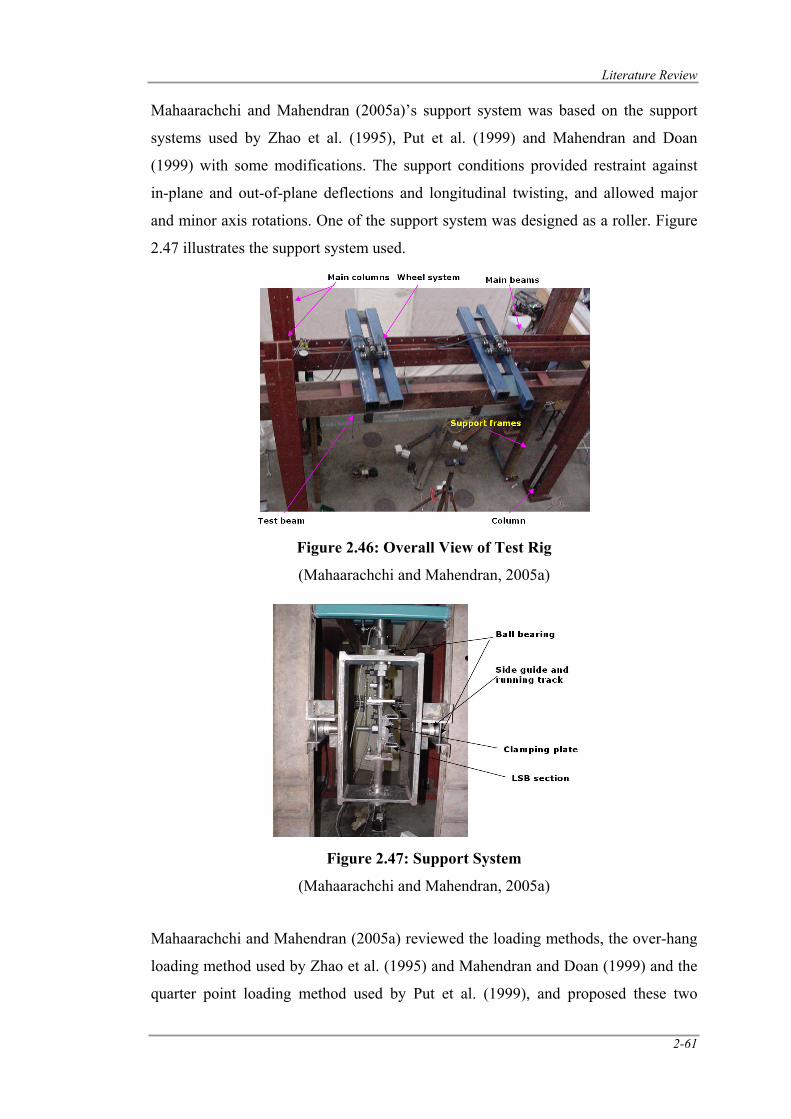
Literature Review
2-61
Mahaarachchi and Mahendran (2005a)’s support system was based on the support
systems used by Zhao et al. (1995), Put et al. (1999) and Mahendran and Doan
(1999) with some modifications. The support conditions provided restraint against
in-plane and out-of-plane deflections and longitudinal twisting, and allowed major
and minor axis rotations. One of the support system was designed as a roller. Figure
2.47 illustrates the support system used.
Figure 2.46: Overall View of Test Rig
(Mahaarachchi and Mahendran, 2005a)
Figure 2.47: Support System
(Mahaarachchi and Mahendran, 2005a)
Mahaarachchi and Mahendran (2005a) reviewed the loading methods, the over-hang
loading method used by Zhao et al. (1995) and Mahendran and Doan (1999) and the
quarter point loading method used by Put et al. (1999), and proposed these two
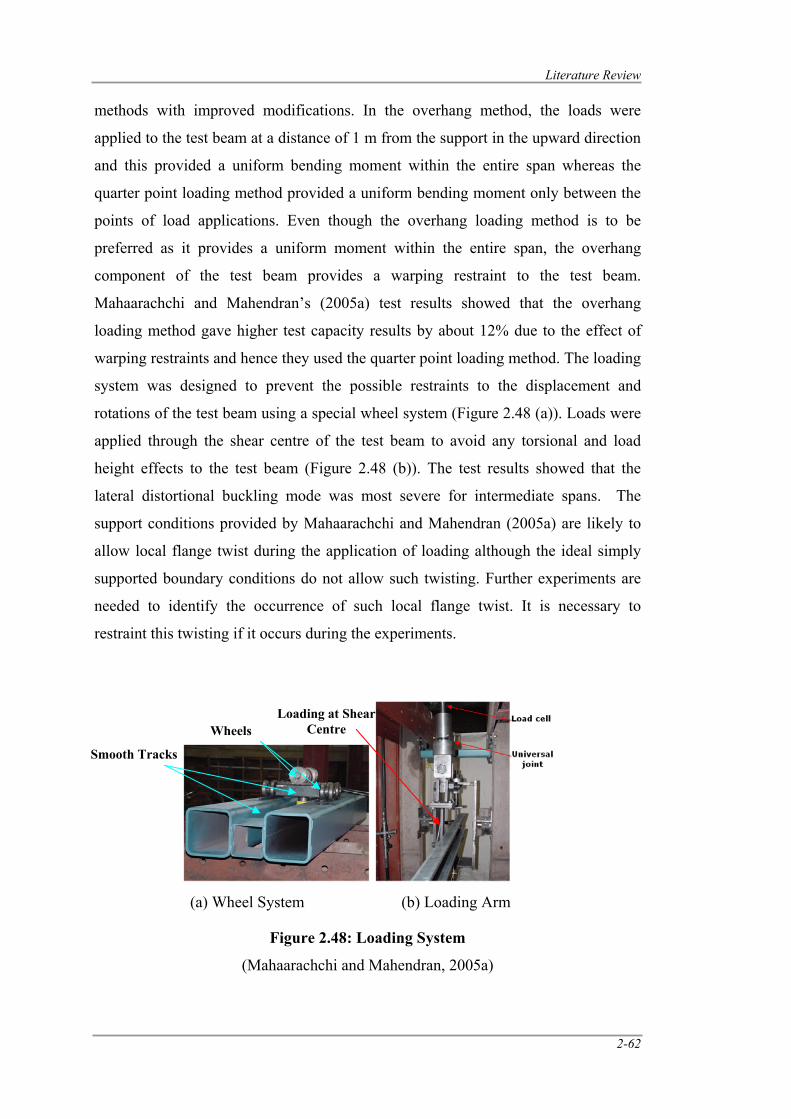
Literature Review
2-62
methods with improved modifications. In the overhang method, the loads were
applied to the test beam at a distance of 1 m from the support in the upward direction
and this provided a uniform bending moment within the entire span whereas the
quarter point loading method provided a uniform bending moment only between the
points of load applications. Even though the overhang loading method is to be
preferred as it provides a uniform moment within the entire span, the overhang
component of the test beam provides a warping restraint to the test beam.
Mahaarachchi and Mahendran’s (2005a) test results showed that the overhang
loading method gave higher test capacity results by about 12% due to the effect of
warping restraints and hence they used the quarter point loading method. The loading
system was designed to prevent the possible restraints to the displacement and
rotations of the test beam using a special wheel system (Figure 2.48 (a)). Loads were
applied through the shear centre of the test beam to avoid any torsional and load
height effects to the test beam (Figure 2.48 (b)). The test results showed that the
lateral distortional buckling mode was most severe for intermediate spans. The
support conditions provided by Mahaarachchi and Mahendran (2005a) are likely to
allow local flange twist during the application of loading although the ideal simply
supported boundary conditions do not allow such twisting. Further experiments are
needed to identify the occurrence of such local flange twist. It is necessary to
restraint this twisting if it occurs during the experiments.
(a) Wheel System (b) Loading Arm
Figure 2.48: Loading System
(Mahaarachchi and Mahendran, 2005a)
Wheels
Smooth Tracks
Loading at Shear Centre
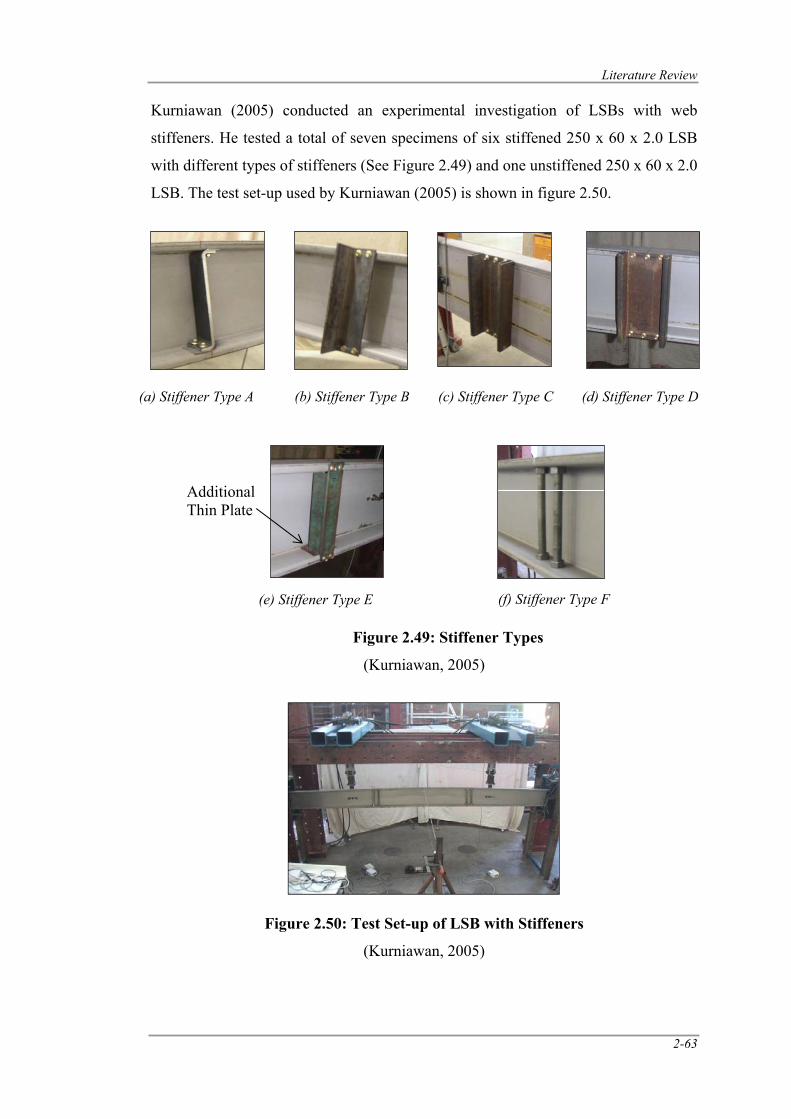
Literature Review
2-63
Kurniawan (2005) conducted an experimental investigation of LSBs with web
stiffeners. He tested a total of seven specimens of six stiffened 250 x 60 x 2.0 LSB
with different types of stiffeners (See Figure 2.49) and one unstiffened 250 x 60 x 2.0
LSB. The test set-up used by Kurniawan (2005) is shown in figure 2.50.
Figure 2.49: Stiffener Types
(Kurniawan, 2005)
Figure 2.50: Test Set-up of LSB with Stiffeners
(Kurniawan, 2005)
(a) Stiffener Type A (b) Stiffener Type B (d) Stiffener Type D (c) Stiffener Type C
(f) Stiffener Type F (e) Stiffener Type E
Additional Thin Plate
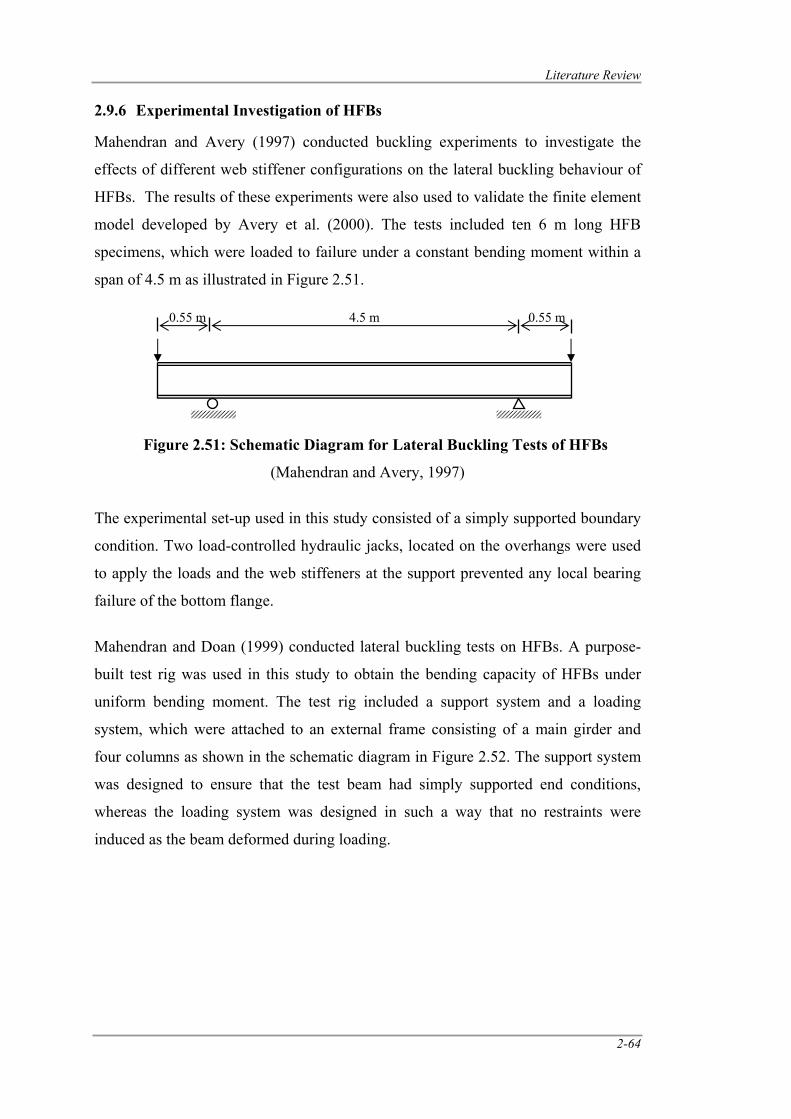
Literature Review
2-64
2.9.6 Experimental Investigation of HFBs
Mahendran and Avery (1997) conducted buckling experiments to investigate the
effects of different web stiffener configurations on the lateral buckling behaviour of
HFBs. The results of these experiments were also used to validate the finite element
model developed by Avery et al. (2000). The tests included ten 6 m long HFB
specimens, which were loaded to failure under a constant bending moment within a
span of 4.5 m as illustrated in Figure 2.51.
Figure 2.51: Schematic Diagram for Lateral Buckling Tests of HFBs
(Mahendran and Avery, 1997)
The experimental set-up used in this study consisted of a simply supported boundary
condition. Two load-controlled hydraulic jacks, located on the overhangs were used
to apply the loads and the web stiffeners at the support prevented any local bearing
failure of the bottom flange.
Mahendran and Doan (1999) conducted lateral buckling tests on HFBs. A purpose-
built test rig was used in this study to obtain the bending capacity of HFBs under
uniform bending moment. The test rig included a support system and a loading
system, which were attached to an external frame consisting of a main girder and
four columns as shown in the schematic diagram in Figure 2.52. The support system
was designed to ensure that the test beam had simply supported end conditions,
whereas the loading system was designed in such a way that no restraints were
induced as the beam deformed during loading.
0.55 m 0.55 m 4.5 m
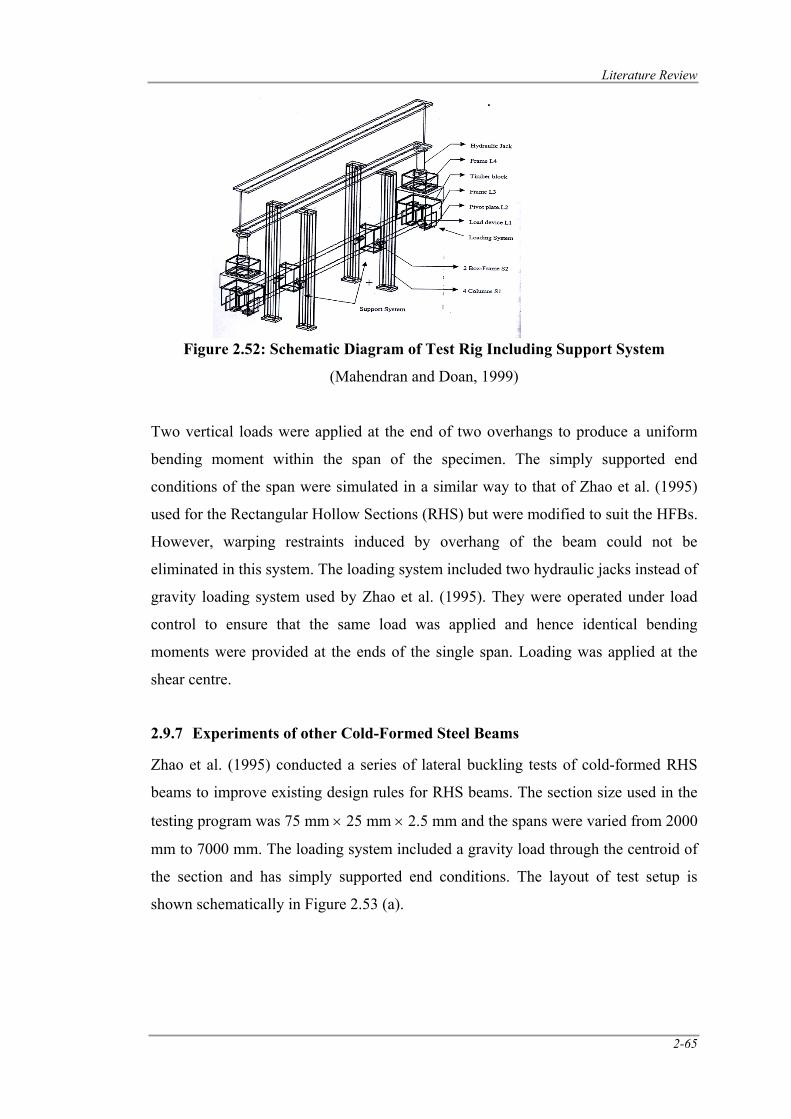
Literature Review
2-65
Figure 2.52: Schematic Diagram of Test Rig Including Support System
(Mahendran and Doan, 1999)
Two vertical loads were applied at the end of two overhangs to produce a uniform
bending moment within the span of the specimen. The simply supported end
conditions of the span were simulated in a similar way to that of Zhao et al. (1995)
used for the Rectangular Hollow Sections (RHS) but were modified to suit the HFBs.
However, warping restraints induced by overhang of the beam could not be
eliminated in this system. The loading system included two hydraulic jacks instead of
gravity loading system used by Zhao et al. (1995). They were operated under load
control to ensure that the same load was applied and hence identical bending
moments were provided at the ends of the single span. Loading was applied at the
shear centre.
2.9.7 Experiments of other Cold-Formed Steel Beams
Zhao et al. (1995) conducted a series of lateral buckling tests of cold-formed RHS
beams to improve existing design rules for RHS beams. The section size used in the
testing program was 75 mm × 25 mm × 2.5 mm and the spans were varied from 2000
mm to 7000 mm. The loading system included a gravity load through the centroid of
the section and has simply supported end conditions. The layout of test setup is
shown schematically in Figure 2.53 (a).
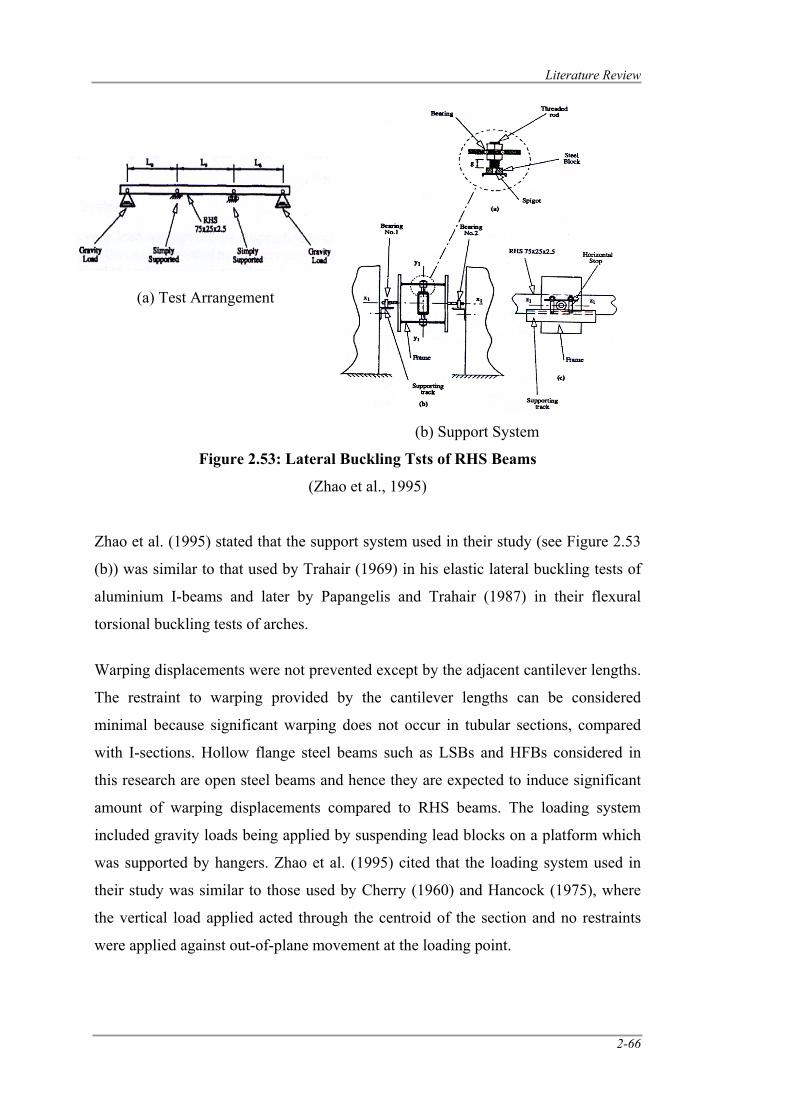
Literature Review
2-66
Figure 2.53: Lateral Buckling Tsts of RHS Beams
(Zhao et al., 1995)
Zhao et al. (1995) stated that the support system used in their study (see Figure 2.53
(b)) was similar to that used by Trahair (1969) in his elastic lateral buckling tests of
aluminium I-beams and later by Papangelis and Trahair (1987) in their flexural
torsional buckling tests of arches.
Warping displacements were not prevented except by the adjacent cantilever lengths.
The restraint to warping provided by the cantilever lengths can be considered
minimal because significant warping does not occur in tubular sections, compared
with I-sections. Hollow flange steel beams such as LSBs and HFBs considered in
this research are open steel beams and hence they are expected to induce significant
amount of warping displacements compared to RHS beams. The loading system
included gravity loads being applied by suspending lead blocks on a platform which
was supported by hangers. Zhao et al. (1995) cited that the loading system used in
their study was similar to those used by Cherry (1960) and Hancock (1975), where
the vertical load applied acted through the centroid of the section and no restraints
were applied against out-of-plane movement at the loading point.
(a) Test Arrangement
(b) Support System
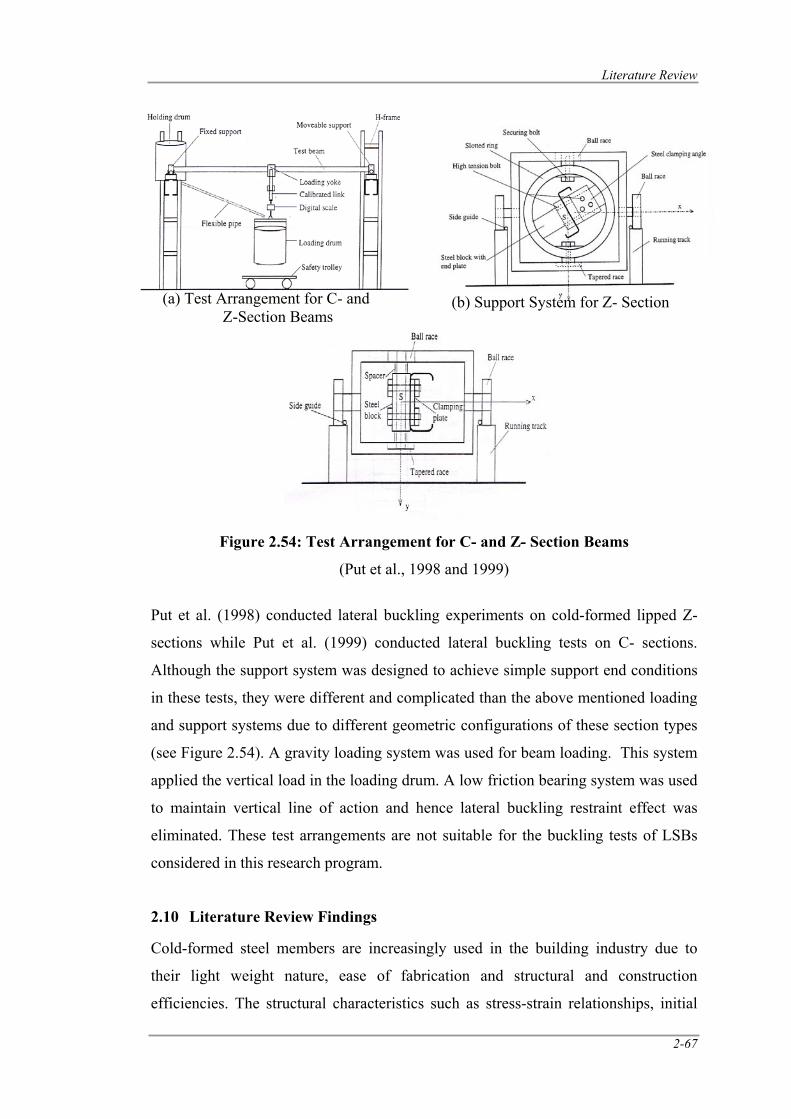
Literature Review
2-67
Figure 2.54: Test Arrangement for C- and Z- Section Beams
(Put et al., 1998 and 1999)
Put et al. (1998) conducted lateral buckling experiments on cold-formed lipped Z-
sections while Put et al. (1999) conducted lateral buckling tests on C- sections.
Although the support system was designed to achieve simple support end conditions
in these tests, they were different and complicated than the above mentioned loading
and support systems due to different geometric configurations of these section types
(see Figure 2.54). A gravity loading system was used for beam loading. This system
applied the vertical load in the loading drum. A low friction bearing system was used
to maintain vertical line of action and hence lateral buckling restraint effect was
eliminated. These test arrangements are not suitable for the buckling tests of LSBs
considered in this research program.
2.10 Literature Review Findings
Cold-formed steel members are increasingly used in the building industry due to
their light weight nature, ease of fabrication and structural and construction
efficiencies. The structural characteristics such as stress-strain relationships, initial
(b) Support System for Z- Section
(a) Test Arrangement for C- and Z-Section Beams
Literature Review
2-68
imperfections and residual stresses of cold-formed steel sections are different from
those of hot-rolled steel members mainly due to the manufacturing process which
involves cold-forming. The mechanical properties of cold-formed steel members are
affected by cold forming specifically in the regions of bends. The resulting changes
in material properties must be included in the design of cold-formed steel members.
Hollow flange steel beams such as HFBs and LSBs are some innovative cold-formed
steel members used in the building industry due to their superior structural and
construction efficiencies. However, the manufacturing of HFBs was discontinued in
1997 because of its relatively expensive electric welding process and lack of
equipment facilities.
Past research identified that hollow flange steel beams suffer from lateral distortional
buckling when used as flexural members. Lateral distortional buckling is
characterised by simultaneous lateral displacement, twist and web distortion which is
severe for intermediate spans and reduces the member moment capacity. AS 4100
(SA, 1998) does not provide any design procedure to determine the lateral
distortional buckling moment capacity of hollow flange steel beams while AS/NZS
4600 (SA, 1996) provides some design formulae. The equation given in AS 4100
(SA, 1998) to predict the lateral torsional buckling moment capacity was modified by
Pi and Trahair (1997) to predict the lateral distortional buckling moment capacity of
HFBs. However, it was not validated by experiments. Avery et al. (2000) then
modified Trahair’s (1997) equation to predict the lateral distortional buckling
moment capacity of HFBs by applying suitable coefficients for each thickness of
HFBs. But the applicability of these equations to predict the lateral distortional
buckling moment of LSBs is questionable.
The design formulae developed by Mahaarachchi and Mahendran (2005d) using
finite element analysis to predict the lateral distortional buckling moment capacity of
LSBs were found to be accurate and have been included in AS/NZS 4600 (SA,
2005). However, a thorough study of Mahaarachchi and Mahendran’s (2005c) finite
element analysis of LSBs revealed that the ideal model used to simulate LSBs under
uniform moment did not provide adequate twist restraint for the whole section
including the two rectangular flanges. Also, the application of boundary conditions
Literature Review
2-69
and the type of loading in this study found to have some unacceptable stress
distribution on the LSB cross section at failure. Therefore it is important to develop
an accurate ideal finite element model to predict the lateral distortional buckling
moment capacity of LSBs. Also, the existing design rules do not account for the
section geometry of LSBs and can only be used for the existing 13 LSB sections.
Therefore it is important to investigate the effect of section geometry on the lateral
distortional buckling moments of hollow flange steel beams and to develop a
comprehensive design procedure for all types of hollow flange steel beams (HFBs
and LSBs).
Mahaarachchi and Mahendran (2005a) carried out large scale experiments on LSBs
with quarter point and overhang type loading and found that the overhang loading
method increased the ultimate moments of LSBs due to warping. Therefore, they
used quarter point loading method and incorporated a moment modification factor of
1.09 to account for non-uniform bending moment along the span. However, this was
taken from AS 4100 (SA, 1998) which was developed for hot-rolled steel members
and the applicability of this to cold-formed steel members is questionable. Recent
research (Kurniawan and Mahendran, 2009b) on the effects of moment gradient on
the lateral distortional buckling capacity of LSBs revealed that the moment
distribution factor is closer to 1.0 for quarter point loading. Hence, this results can be
used in the experimental investigation.
Mahaarahchi Mahendran (2005b) carried out section moment capacity tests on LSBs
and their results revealed that some of the LSBs have inelastic reserve bending
capacity beyond their first yield moment. However, they did not develop finite
element models nor developed suitable design rules for LSBs to predict their section
moment capacities with inelastic reserve bending capacities.
Lateral buckling strengths of steel members are affected by initial imperfections,
residual stresses, moment distribution, web distortion, load height and pre-buckling
deformations and their effects on cold-formed hollow flange steel beams are
summarised in Section 2.5.
Web stiffeners were used with both HFBs and LSBs to eliminate the detrimental
effect of lateral distortional buckling. The results showed that the use of two web
Literature Review
2-70
stiffeners at third points of span were able to eliminate the lateral distortional
buckling of HFBs (Avery and Mahendran, 1997) while LSBs (Kurniawan, 2005)
required large number of web stiffeners. Overhang type loading method was used in
the experimental investigation of HFBs while quarter point loading was adopted for
LSBs. These different loading conditions and geometries of HFBs (doubly
symmetric with triangular hollow flanges) and LSBs (singly symmetric with
rectangular hollow flanges) would be some of the factors in determining the required
number of web stiffeners. It is important to investigate the effects of web stiffeners
on the lateral distortional buckling of LSBs.
Material Properties, Residual Stresses and Imperfections of LSBs
3-1
CHAPTER 3
3.0 MATERIAL PROPERTIES, RESIDUAL STRESSES AND GEOMETRIC
IMPERFECTIONS OF LSB SECTIONS
3.1 Introduction
The unique cold-forming and dual electric resistance welding process of LiteSteel
Beam (LSB) sections introduce considerable differences to the stress-strain curves,
residual stresses and initial geometric imperfections compared to the conventional
hot-rolled and cold-formed steel sections. Although Mahaarachchi and Mahendran
(2005e) measured the mechanical properties, residual stresses and initial geometric
imperfections of LSB sections the quality of the manufacturing process in relation to
cold-forming and electric resistance welding has been improved over the last three
years. Currently the LSB sections are made from a single strip of G60 galvanized
steel while the earlier LSB sections were manufactured from a single steel strip of TF
380 coil. The coating system has also been changed from EnviroKote water-based
primer paint protective coating system to AZ+ alloy coating system. Therefore it is
important to determine the accurate mechanical properties of these LSBs that can be
used in the finite element analyses of LSBs. The mechanical properties of LSBs were
measured using tensile coupon tests.
The residual stresses due to combined cold-forming and electrical resistance welding
process can have a significant effect on the behaviour and strength of LSB sections.
Unlike other cold-formed steel sections the LSB sections have both flexural and
membrane residual stresses due to cold-forming and welding processes, respectively.
Maharaachchi and Mahendran (2005e) measured the residual stresses of LSBs and
developed approximate residual stress models for both flexural and membrane
residual stresses. However, it was found that the sum of the membrane residual
forces was not equal to zero in their model. Further, their model had more
compressive stresses at the welding point despite the common belief that welding
creates tensile membrane residual stresses. In order to investigate these issues a
residual stress test was carried out for the web element of a 150x45x1.6 LSB section.
Material Properties, Residual Stresses and Imperfections of LSBs
3-2
The LSB members exhibit a complicated post-buckling regime that is difficult to
predict. Today advanced computational modelling supplements experimental
investigations. Accuracy of computational models relies significantly on the various
inputs relating to material and section characteristics including section and member
imperfections used as input data. Mahaarachchi and Mahendran (2005e) measured
the initial geometric imperfections of a large number of LSBs and confirmed that
they were within the currently accepted fabrication tolerances. However, the initial
geometric imperfections were also measured for some LSBs in order to verify their
finding for the new LSBs.
This chapter presents the details of tensile coupon tests, residual stress and geometric
imperfection measurement tests of LSBs, and the results.
3.2 Tensile Coupon Tests to Determine the Mechanical Properties
The structural behaviour of LSBs depends on the mechanical properties of the steel
used, which are required in the finite element analyses of LSBs. Therefore tensile
tests of steel coupons taken from LSBs were conducted to determine the required
important mechanical properties based on the procedure specified in the Australian
Standard AS 1391 (SA, 2007).
Fifty four coupons were fabricated in the workshop at the Queensland University of
Technology. They were taken from the LSB sections used in the section and member
moment capacity tests. The coupons were cut in the longitudinal direction from
various locations of the beam, namely the outside flange, inside flange and web.
The coupon size and shape are important variables that can affect the behaviour of
tensile coupons. Previous research of G550 steel (Rogers and Hancock, 1997)
consisted of tensile testing of coupons with large grips. They have shown that uneven
gripping of these coupons might have occurred due to misalignment and improper
lubrication of the test machine grips, i.e. only one side of the grip portion of the
coupon was secured, resulting in either a slip of the test specimen as the load was
increased or eccentric tensile forces. This can cause a reduction in the true capacity
of the test specimens and influence their stress-strain behaviour. It is necessary to
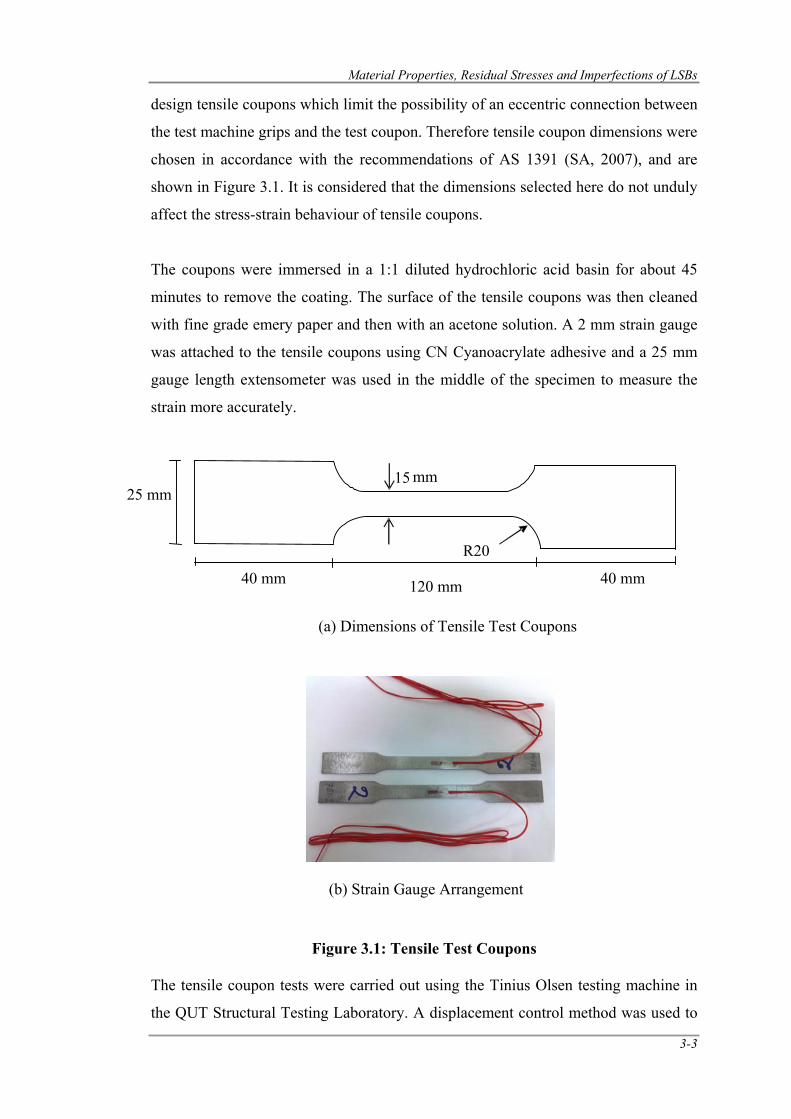
Material Properties, Residual Stresses and Imperfections of LSBs
3-3
design tensile coupons which limit the possibility of an eccentric connection between
the test machine grips and the test coupon. Therefore tensile coupon dimensions were
chosen in accordance with the recommendations of AS 1391 (SA, 2007), and are
shown in Figure 3.1. It is considered that the dimensions selected here do not unduly
affect the stress-strain behaviour of tensile coupons.
The coupons were immersed in a 1:1 diluted hydrochloric acid basin for about 45
minutes to remove the coating. The surface of the tensile coupons was then cleaned
with fine grade emery paper and then with an acetone solution. A 2 mm strain gauge
was attached to the tensile coupons using CN Cyanoacrylate adhesive and a 25 mm
gauge length extensometer was used in the middle of the specimen to measure the
strain more accurately.
Figure 3.1: Tensile Test Coupons The tensile coupon tests were carried out using the Tinius Olsen testing machine in
the QUT Structural Testing Laboratory. A displacement control method was used to
(b) Strain Gauge Arrangement
(a) Dimensions of Tensile Test Coupons
R20
15 mm
120 mm
25 mm
40 mm 40 mm
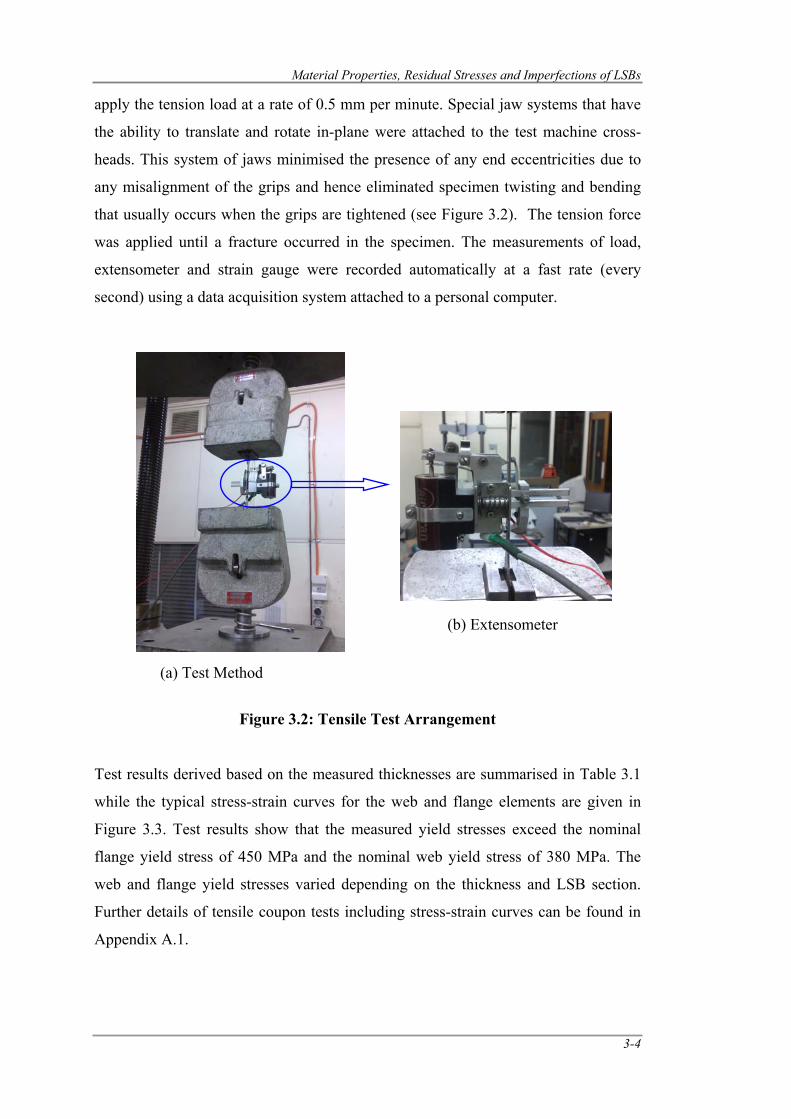
Material Properties, Residual Stresses and Imperfections of LSBs
3-4
apply the tension load at a rate of 0.5 mm per minute. Special jaw systems that have
the ability to translate and rotate in-plane were attached to the test machine cross-
heads. This system of jaws minimised the presence of any end eccentricities due to
any misalignment of the grips and hence eliminated specimen twisting and bending
that usually occurs when the grips are tightened (see Figure 3.2). The tension force
was applied until a fracture occurred in the specimen. The measurements of load,
extensometer and strain gauge were recorded automatically at a fast rate (every
second) using a data acquisition system attached to a personal computer.
Figure 3.2: Tensile Test Arrangement
Test results derived based on the measured thicknesses are summarised in Table 3.1
while the typical stress-strain curves for the web and flange elements are given in
Figure 3.3. Test results show that the measured yield stresses exceed the nominal
flange yield stress of 450 MPa and the nominal web yield stress of 380 MPa. The
web and flange yield stresses varied depending on the thickness and LSB section.
Further details of tensile coupon tests including stress-strain curves can be found in
Appendix A.1.
(b) Extensometer
(a) Test Method
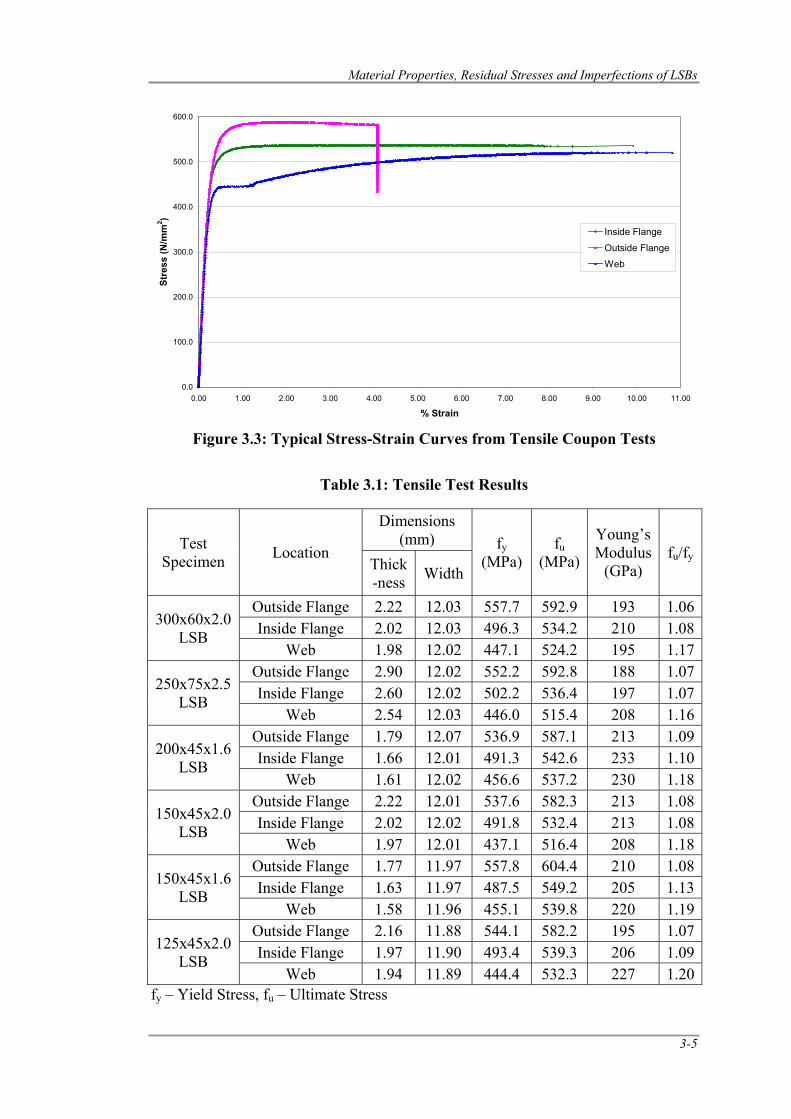
Material Properties, Residual Stresses and Imperfections of LSBs
3-5
Figure 3.3: Typical Stress-Strain Curves from Tensile Coupon Tests
Table 3.1: Tensile Test Results
Test Specimen Location
Dimensions (mm) fy
(MPa) fu
(MPa)
Young’s Modulus
(GPa) fu/fy Thick
-ness Width
300x60x2.0 LSB
Outside Flange 2.22 12.03 557.7 592.9 193 1.06Inside Flange 2.02 12.03 496.3 534.2 210 1.08
Web 1.98 12.02 447.1 524.2 195 1.17
250x75x2.5 LSB
Outside Flange 2.90 12.02 552.2 592.8 188 1.07Inside Flange 2.60 12.02 502.2 536.4 197 1.07
Web 2.54 12.03 446.0 515.4 208 1.16
200x45x1.6 LSB
Outside Flange 1.79 12.07 536.9 587.1 213 1.09Inside Flange 1.66 12.01 491.3 542.6 233 1.10
Web 1.61 12.02 456.6 537.2 230 1.18
150x45x2.0 LSB
Outside Flange 2.22 12.01 537.6 582.3 213 1.08Inside Flange 2.02 12.02 491.8 532.4 213 1.08
Web 1.97 12.01 437.1 516.4 208 1.18
150x45x1.6 LSB
Outside Flange 1.77 11.97 557.8 604.4 210 1.08Inside Flange 1.63 11.97 487.5 549.2 205 1.13
Web 1.58 11.96 455.1 539.8 220 1.19
125x45x2.0 LSB
Outside Flange 2.16 11.88 544.1 582.2 195 1.07Inside Flange 1.97 11.90 493.4 539.3 206 1.09
Web 1.94 11.89 444.4 532.3 227 1.20fy – Yield Stress, fu – Ultimate Stress
0.0
100.0
200.0
300.0
400.0
500.0
600.0
0.00 1.00 2.00 3.00 4.00 5.00 6.00 7.00 8.00 9.00 10.00 11.00
% Strain
Stre
ss (N
/mm
2 )
Inside Flange
Outside Flange
Web
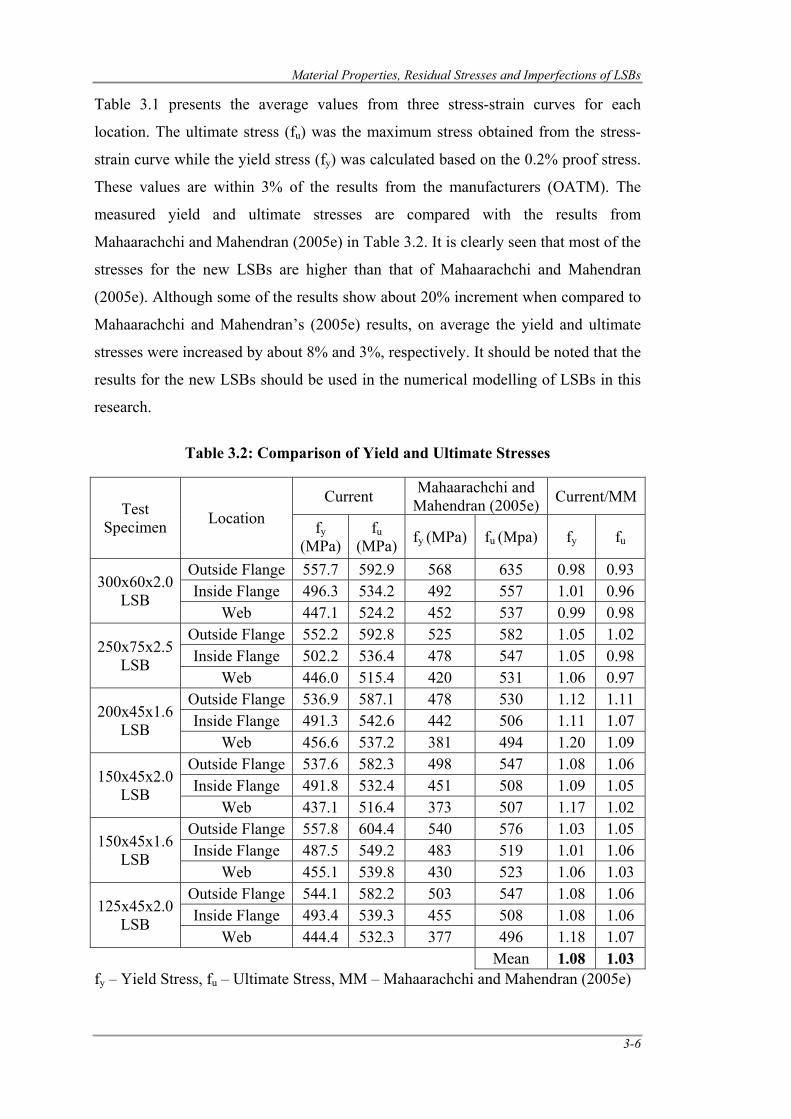
Material Properties, Residual Stresses and Imperfections of LSBs
3-6
Table 3.1 presents the average values from three stress-strain curves for each
location. The ultimate stress (fu) was the maximum stress obtained from the stress-
strain curve while the yield stress (fy) was calculated based on the 0.2% proof stress.
These values are within 3% of the results from the manufacturers (OATM). The
measured yield and ultimate stresses are compared with the results from
Mahaarachchi and Mahendran (2005e) in Table 3.2. It is clearly seen that most of the
stresses for the new LSBs are higher than that of Mahaarachchi and Mahendran
(2005e). Although some of the results show about 20% increment when compared to
Mahaarachchi and Mahendran’s (2005e) results, on average the yield and ultimate
stresses were increased by about 8% and 3%, respectively. It should be noted that the
results for the new LSBs should be used in the numerical modelling of LSBs in this
research.
Table 3.2: Comparison of Yield and Ultimate Stresses
Test Specimen Location
Current Mahaarachchi and Mahendran (2005e) Current/MM
fy (MPa)
fu (MPa) fy (MPa) fu (Mpa) fy fu
300x60x2.0 LSB
Outside Flange 557.7 592.9 568 635 0.98 0.93 Inside Flange 496.3 534.2 492 557 1.01 0.96
Web 447.1 524.2 452 537 0.99 0.98
250x75x2.5 LSB
Outside Flange 552.2 592.8 525 582 1.05 1.02 Inside Flange 502.2 536.4 478 547 1.05 0.98
Web 446.0 515.4 420 531 1.06 0.97
200x45x1.6 LSB
Outside Flange 536.9 587.1 478 530 1.12 1.11 Inside Flange 491.3 542.6 442 506 1.11 1.07
Web 456.6 537.2 381 494 1.20 1.09
150x45x2.0 LSB
Outside Flange 537.6 582.3 498 547 1.08 1.06 Inside Flange 491.8 532.4 451 508 1.09 1.05
Web 437.1 516.4 373 507 1.17 1.02
150x45x1.6 LSB
Outside Flange 557.8 604.4 540 576 1.03 1.05 Inside Flange 487.5 549.2 483 519 1.01 1.06
Web 455.1 539.8 430 523 1.06 1.03
125x45x2.0 LSB
Outside Flange 544.1 582.2 503 547 1.08 1.06 Inside Flange 493.4 539.3 455 508 1.08 1.06
Web 444.4 532.3 377 496 1.18 1.07 Mean 1.08 1.03
fy – Yield Stress, fu – Ultimate Stress, MM – Mahaarachchi and Mahendran (2005e)
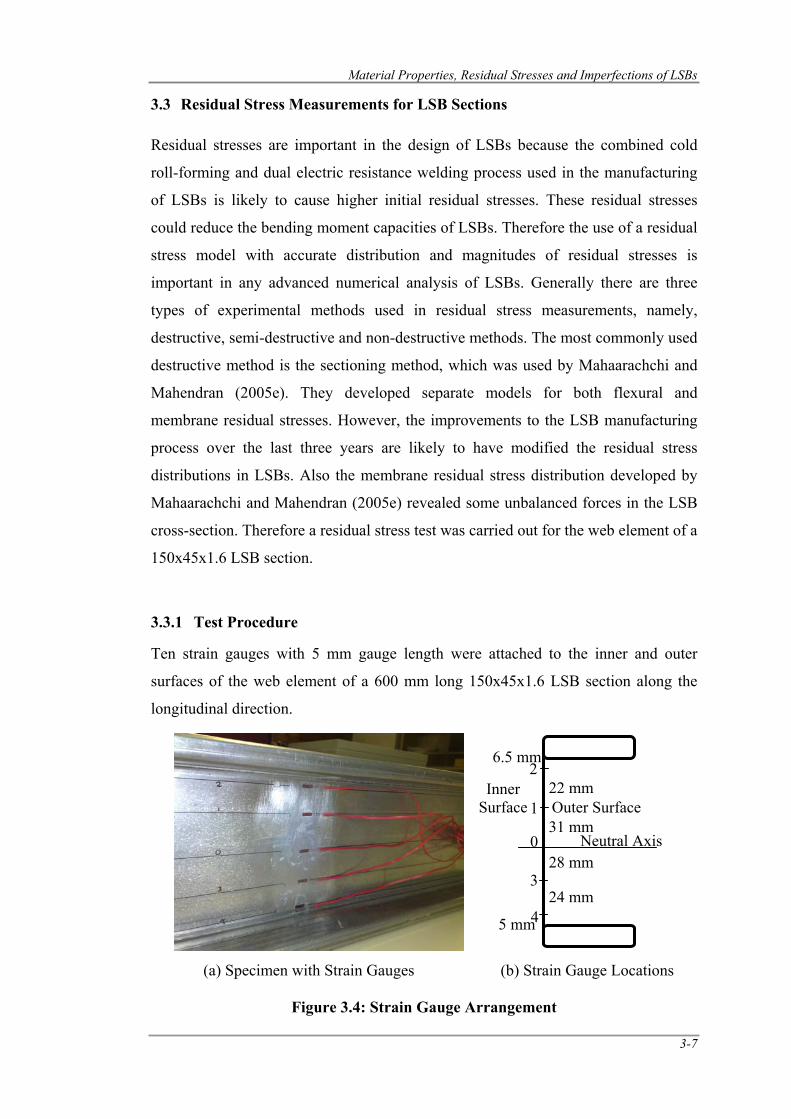
Material Properties, Residual Stresses and Imperfections of LSBs
3-7
3.3 Residual Stress Measurements for LSB Sections
Residual stresses are important in the design of LSBs because the combined cold
roll-forming and dual electric resistance welding process used in the manufacturing
of LSBs is likely to cause higher initial residual stresses. These residual stresses
could reduce the bending moment capacities of LSBs. Therefore the use of a residual
stress model with accurate distribution and magnitudes of residual stresses is
important in any advanced numerical analysis of LSBs. Generally there are three
types of experimental methods used in residual stress measurements, namely,
destructive, semi-destructive and non-destructive methods. The most commonly used
destructive method is the sectioning method, which was used by Mahaarachchi and
Mahendran (2005e). They developed separate models for both flexural and
membrane residual stresses. However, the improvements to the LSB manufacturing
process over the last three years are likely to have modified the residual stress
distributions in LSBs. Also the membrane residual stress distribution developed by
Mahaarachchi and Mahendran (2005e) revealed some unbalanced forces in the LSB
cross-section. Therefore a residual stress test was carried out for the web element of a
150x45x1.6 LSB section.
3.3.1 Test Procedure
Ten strain gauges with 5 mm gauge length were attached to the inner and outer
surfaces of the web element of a 600 mm long 150x45x1.6 LSB section along the
longitudinal direction.
Figure 3.4: Strain Gauge Arrangement
(a) Specimen with Strain Gauges (b) Strain Gauge Locations
31 mm
22 mm
Neutral Axis28 mm
24 mm
5 mm
6.5 mm
0
1
2
3
4
Outer Surface Inner
Surface
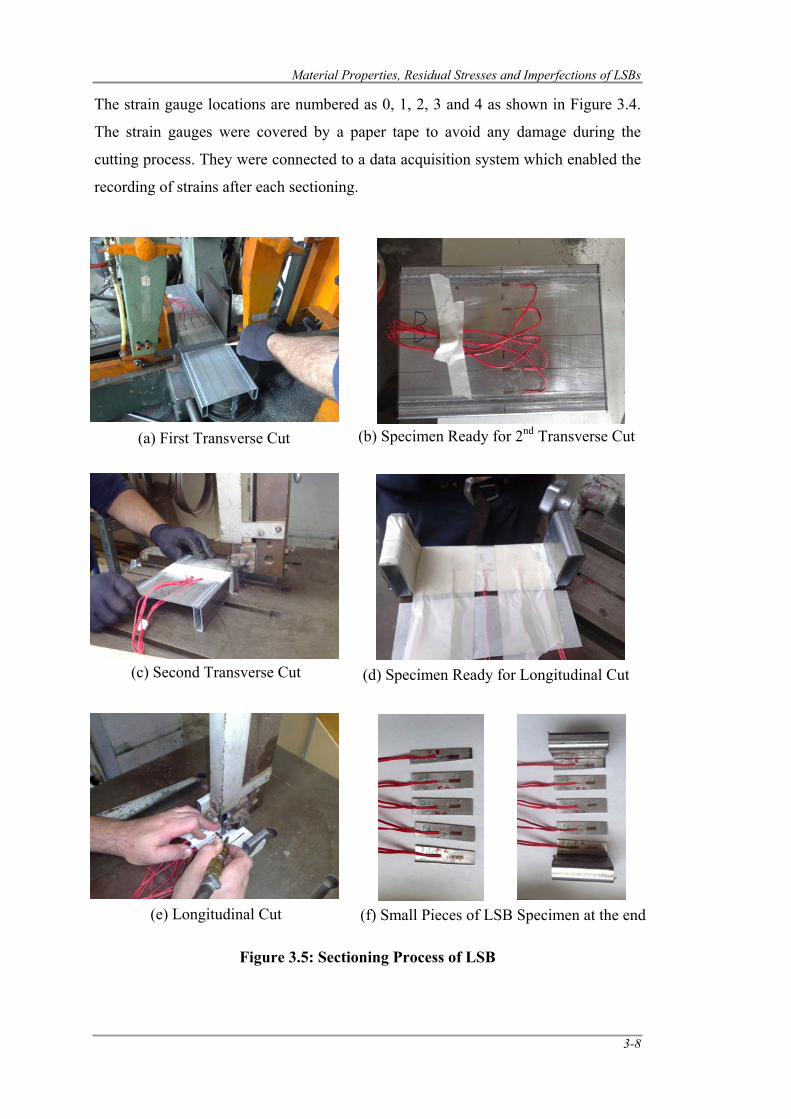
Material Properties, Residual Stresses and Imperfections of LSBs
3-8
The strain gauge locations are numbered as 0, 1, 2, 3 and 4 as shown in Figure 3.4.
The strain gauges were covered by a paper tape to avoid any damage during the
cutting process. They were connected to a data acquisition system which enabled the
recording of strains after each sectioning.
Figure 3.5: Sectioning Process of LSB
(a) First Transverse Cut (b) Specimen Ready for 2nd Transverse Cut
(c) Second Transverse Cut (d) Specimen Ready for Longitudinal Cut
(e) Longitudinal Cut (f) Small Pieces of LSB Specimen at the end
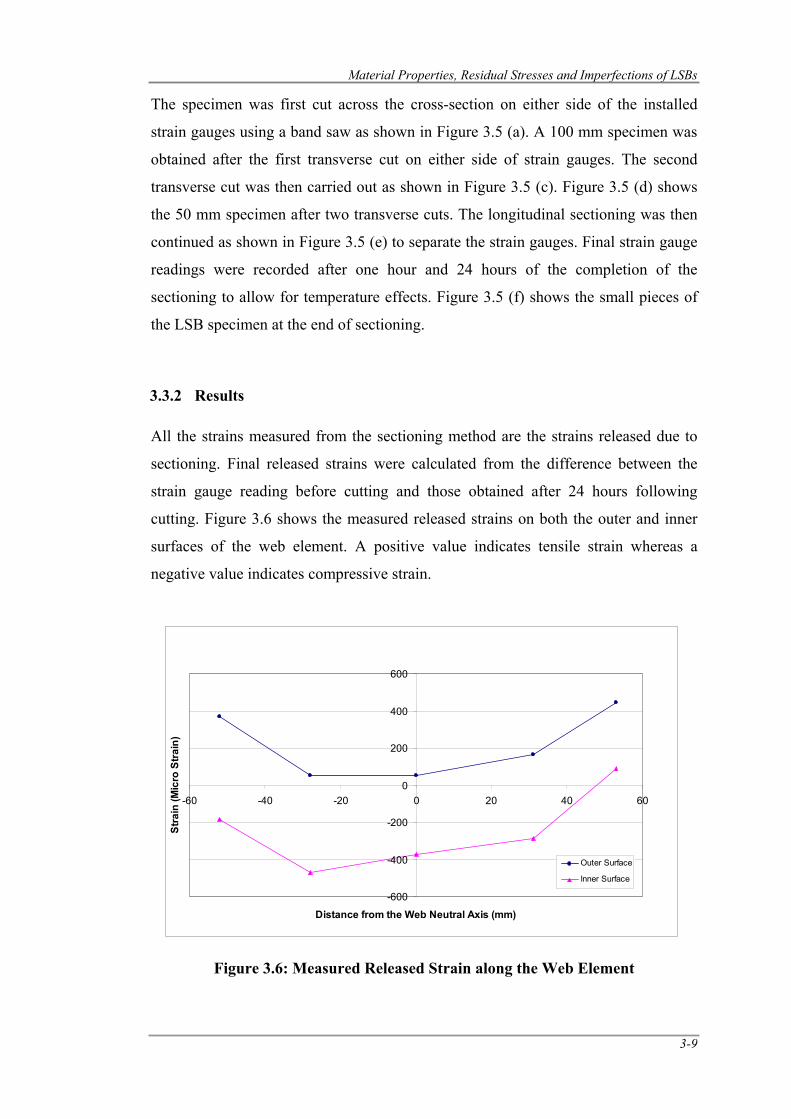
Material Properties, Residual Stresses and Imperfections of LSBs
3-9
The specimen was first cut across the cross-section on either side of the installed
strain gauges using a band saw as shown in Figure 3.5 (a). A 100 mm specimen was
obtained after the first transverse cut on either side of strain gauges. The second
transverse cut was then carried out as shown in Figure 3.5 (c). Figure 3.5 (d) shows
the 50 mm specimen after two transverse cuts. The longitudinal sectioning was then
continued as shown in Figure 3.5 (e) to separate the strain gauges. Final strain gauge
readings were recorded after one hour and 24 hours of the completion of the
sectioning to allow for temperature effects. Figure 3.5 (f) shows the small pieces of
the LSB specimen at the end of sectioning.
3.3.2 Results
All the strains measured from the sectioning method are the strains released due to
sectioning. Final released strains were calculated from the difference between the
strain gauge reading before cutting and those obtained after 24 hours following
cutting. Figure 3.6 shows the measured released strains on both the outer and inner
surfaces of the web element. A positive value indicates tensile strain whereas a
negative value indicates compressive strain.
Figure 3.6: Measured Released Strain along the Web Element
-600
-400
-200
0
200
400
600
-60 -40 -20 0 20 40 60
Distance from the Web Neutral Axis (mm)
Stra
in (M
icro
Stra
in)
Outer Surface
Inner Surface
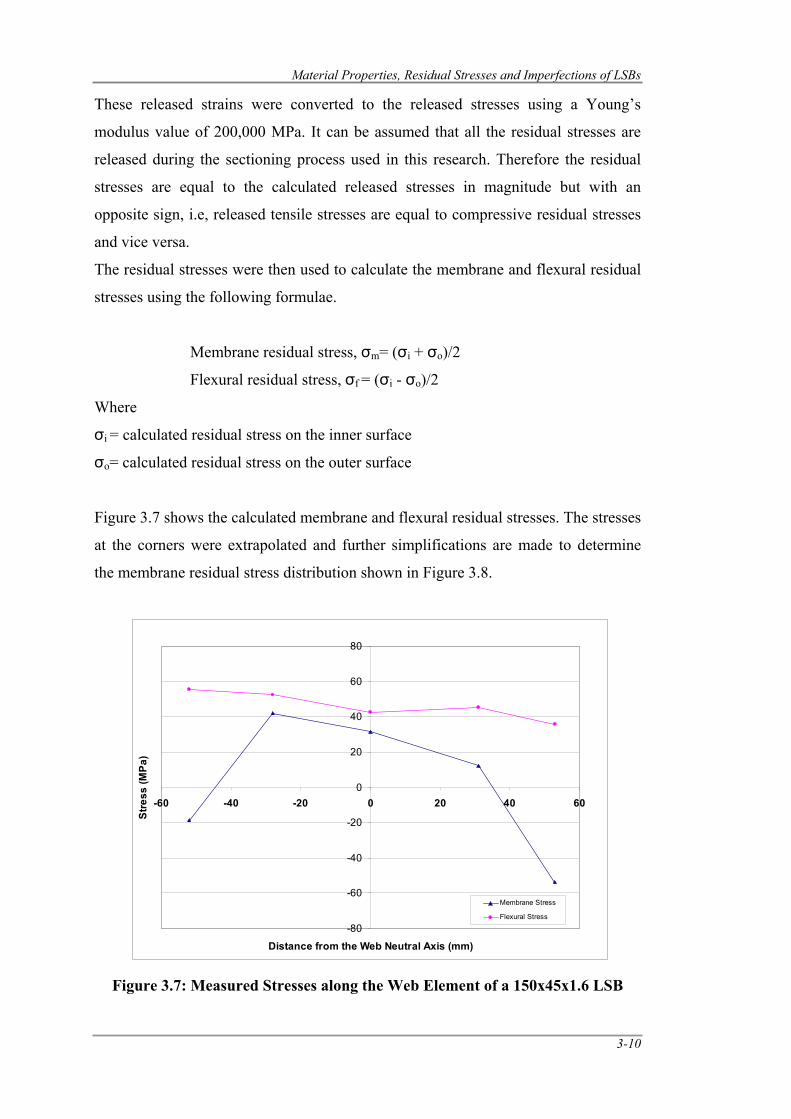
Material Properties, Residual Stresses and Imperfections of LSBs
3-10
These released strains were converted to the released stresses using a Young’s
modulus value of 200,000 MPa. It can be assumed that all the residual stresses are
released during the sectioning process used in this research. Therefore the residual
stresses are equal to the calculated released stresses in magnitude but with an
opposite sign, i.e, released tensile stresses are equal to compressive residual stresses
and vice versa.
The residual stresses were then used to calculate the membrane and flexural residual
stresses using the following formulae.
Membrane residual stress, σm= (σi + σo)/2
Flexural residual stress, σf = (σi - σo)/2
Where
σi = calculated residual stress on the inner surface
σo= calculated residual stress on the outer surface
Figure 3.7 shows the calculated membrane and flexural residual stresses. The stresses
at the corners were extrapolated and further simplifications are made to determine
the membrane residual stress distribution shown in Figure 3.8.
Figure 3.7: Measured Stresses along the Web Element of a 150x45x1.6 LSB
-80
-60
-40
-20
0
20
40
60
80
-60 -40 -20 0 20 40 60
Distance from the Web Neutral Axis (mm)
Stre
ss (M
Pa)
Membrane Stress
Flexural Stress
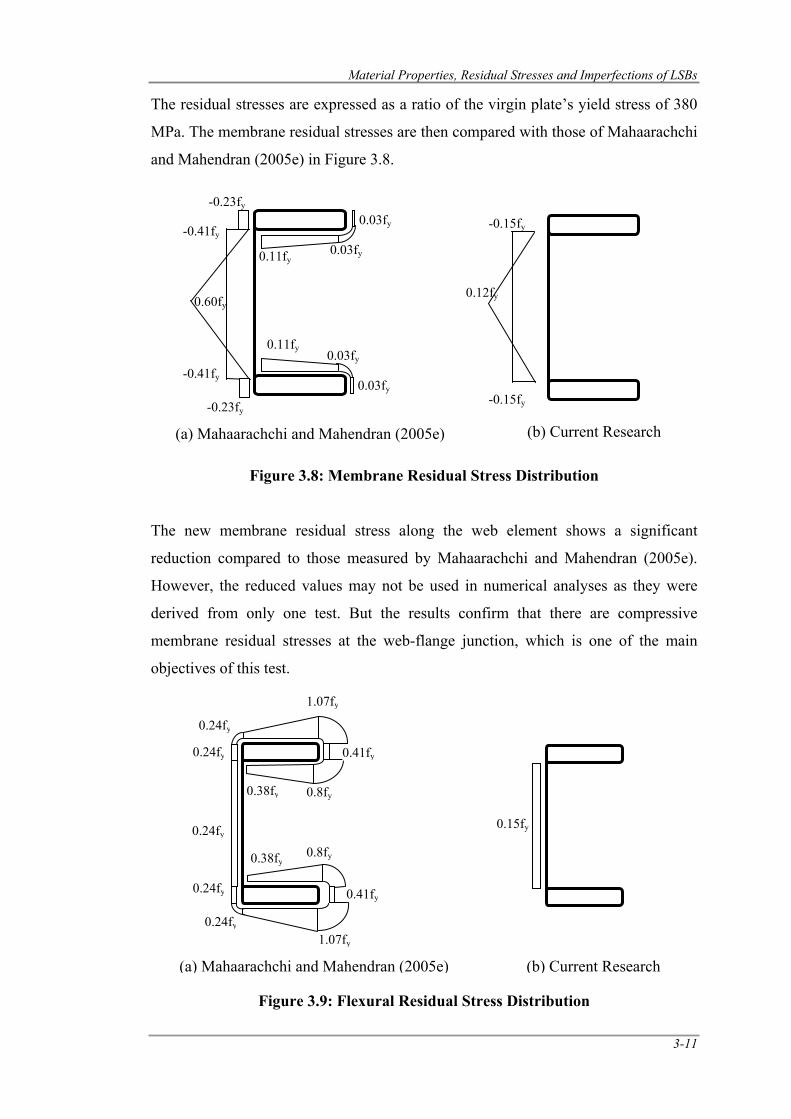
Material Properties, Residual Stresses and Imperfections of LSBs
3-11
The residual stresses are expressed as a ratio of the virgin plate’s yield stress of 380
MPa. The membrane residual stresses are then compared with those of Mahaarachchi
and Mahendran (2005e) in Figure 3.8.
Figure 3.8: Membrane Residual Stress Distribution
The new membrane residual stress along the web element shows a significant
reduction compared to those measured by Mahaarachchi and Mahendran (2005e).
However, the reduced values may not be used in numerical analyses as they were
derived from only one test. But the results confirm that there are compressive
membrane residual stresses at the web-flange junction, which is one of the main
objectives of this test.
Figure 3.9: Flexural Residual Stress Distribution
0.03fy
-0.23fy
0.11fy
-0.41fy
0.60fy
-0.41fy
-0.23fy
0.11fy 0.03fy
0.03fy
0.03fy
(a) Mahaarachchi and Mahendran (2005e)
-0.15fy
0.12fy
-0.15fy
(b) Current Research
0.24fy
0.24fy
0.24fy
1.07fy
0.41fy
0.8fy0.38fy
0.38fy 0.8fy
0.41fy
1.07fy
0.24fy
0.24fy
(a) Mahaarachchi and Mahendran (2005e) (b) Current Research
0.15fy
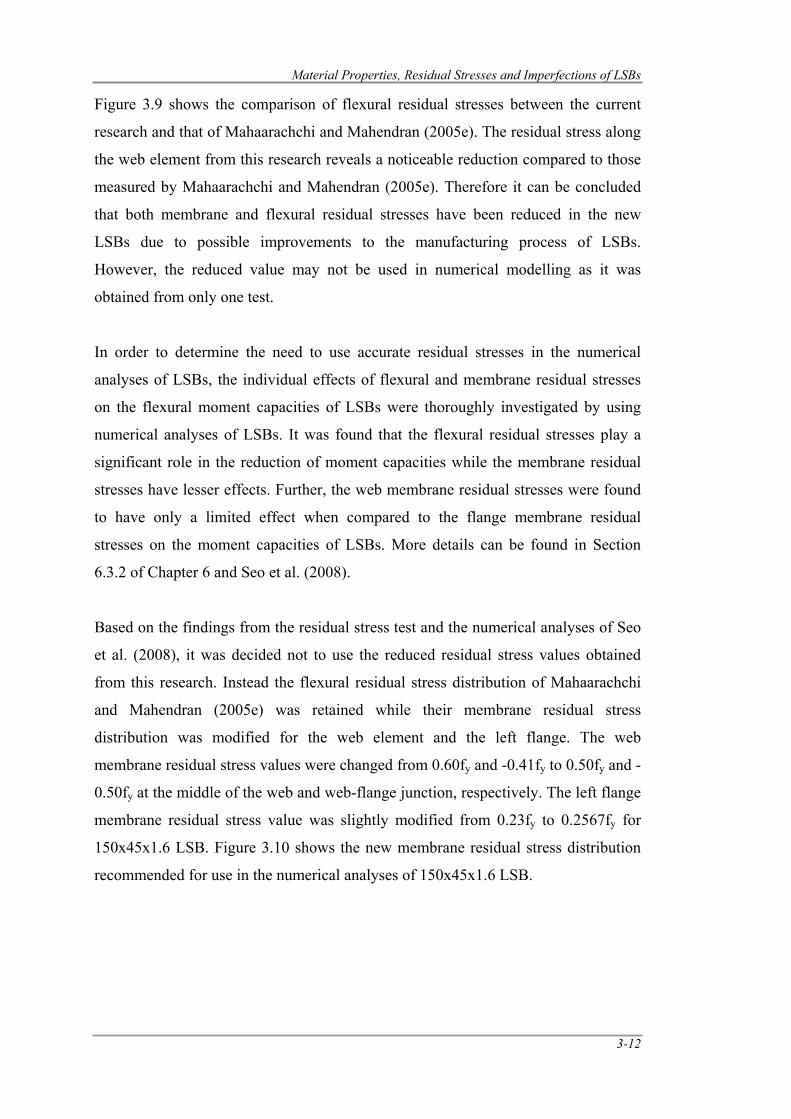
Material Properties, Residual Stresses and Imperfections of LSBs
3-12
Figure 3.9 shows the comparison of flexural residual stresses between the current
research and that of Mahaarachchi and Mahendran (2005e). The residual stress along
the web element from this research reveals a noticeable reduction compared to those
measured by Mahaarachchi and Mahendran (2005e). Therefore it can be concluded
that both membrane and flexural residual stresses have been reduced in the new
LSBs due to possible improvements to the manufacturing process of LSBs.
However, the reduced value may not be used in numerical modelling as it was
obtained from only one test.
In order to determine the need to use accurate residual stresses in the numerical
analyses of LSBs, the individual effects of flexural and membrane residual stresses
on the flexural moment capacities of LSBs were thoroughly investigated by using
numerical analyses of LSBs. It was found that the flexural residual stresses play a
significant role in the reduction of moment capacities while the membrane residual
stresses have lesser effects. Further, the web membrane residual stresses were found
to have only a limited effect when compared to the flange membrane residual
stresses on the moment capacities of LSBs. More details can be found in Section
6.3.2 of Chapter 6 and Seo et al. (2008).
Based on the findings from the residual stress test and the numerical analyses of Seo
et al. (2008), it was decided not to use the reduced residual stress values obtained
from this research. Instead the flexural residual stress distribution of Mahaarachchi
and Mahendran (2005e) was retained while their membrane residual stress
distribution was modified for the web element and the left flange. The web
membrane residual stress values were changed from 0.60fy and -0.41fy to 0.50fy and -
0.50fy at the middle of the web and web-flange junction, respectively. The left flange
membrane residual stress value was slightly modified from 0.23fy to 0.2567fy for
150x45x1.6 LSB. Figure 3.10 shows the new membrane residual stress distribution
recommended for use in the numerical analyses of 150x45x1.6 LSB.
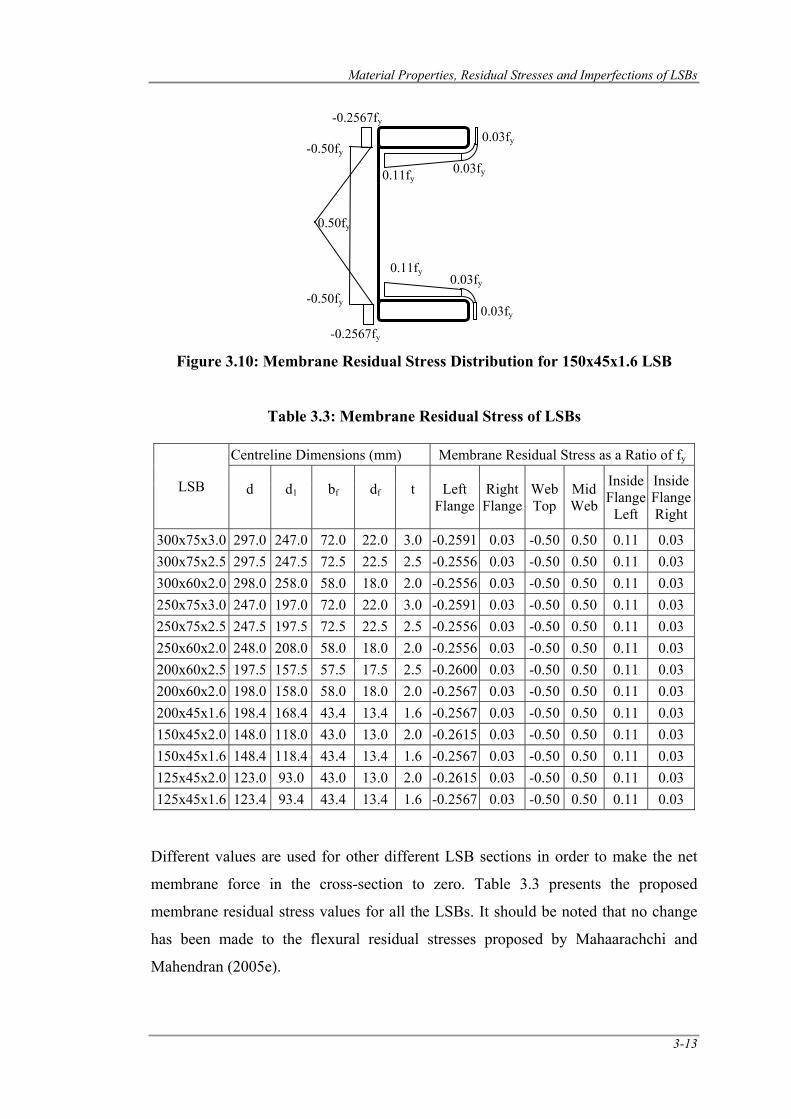
Material Properties, Residual Stresses and Imperfections of LSBs
3-13
Figure 3.10: Membrane Residual Stress Distribution for 150x45x1.6 LSB
Table 3.3: Membrane Residual Stress of LSBs
LSB
Centreline Dimensions (mm) Membrane Residual Stress as a Ratio of fy
d
d1
bf
df
t
Left Flange
Right Flange
Web Top
MidWeb
Inside Flange
Left
Inside Flange Right
300x75x3.0 297.0 247.0 72.0 22.0 3.0 -0.2591 0.03 -0.50 0.50 0.11 0.03 300x75x2.5 297.5 247.5 72.5 22.5 2.5 -0.2556 0.03 -0.50 0.50 0.11 0.03 300x60x2.0 298.0 258.0 58.0 18.0 2.0 -0.2556 0.03 -0.50 0.50 0.11 0.03 250x75x3.0 247.0 197.0 72.0 22.0 3.0 -0.2591 0.03 -0.50 0.50 0.11 0.03 250x75x2.5 247.5 197.5 72.5 22.5 2.5 -0.2556 0.03 -0.50 0.50 0.11 0.03 250x60x2.0 248.0 208.0 58.0 18.0 2.0 -0.2556 0.03 -0.50 0.50 0.11 0.03 200x60x2.5 197.5 157.5 57.5 17.5 2.5 -0.2600 0.03 -0.50 0.50 0.11 0.03 200x60x2.0 198.0 158.0 58.0 18.0 2.0 -0.2567 0.03 -0.50 0.50 0.11 0.03 200x45x1.6 198.4 168.4 43.4 13.4 1.6 -0.2567 0.03 -0.50 0.50 0.11 0.03 150x45x2.0 148.0 118.0 43.0 13.0 2.0 -0.2615 0.03 -0.50 0.50 0.11 0.03 150x45x1.6 148.4 118.4 43.4 13.4 1.6 -0.2567 0.03 -0.50 0.50 0.11 0.03 125x45x2.0 123.0 93.0 43.0 13.0 2.0 -0.2615 0.03 -0.50 0.50 0.11 0.03 125x45x1.6 123.4 93.4 43.4 13.4 1.6 -0.2567 0.03 -0.50 0.50 0.11 0.03
Different values are used for other different LSB sections in order to make the net
membrane force in the cross-section to zero. Table 3.3 presents the proposed
membrane residual stress values for all the LSBs. It should be noted that no change
has been made to the flexural residual stresses proposed by Mahaarachchi and
Mahendran (2005e).
0.03fy
-0.2567fy
0.11fy
-0.50fy
0.50fy
-0.50fy
-0.2567fy
0.11fy 0.03fy
0.03fy
0.03fy
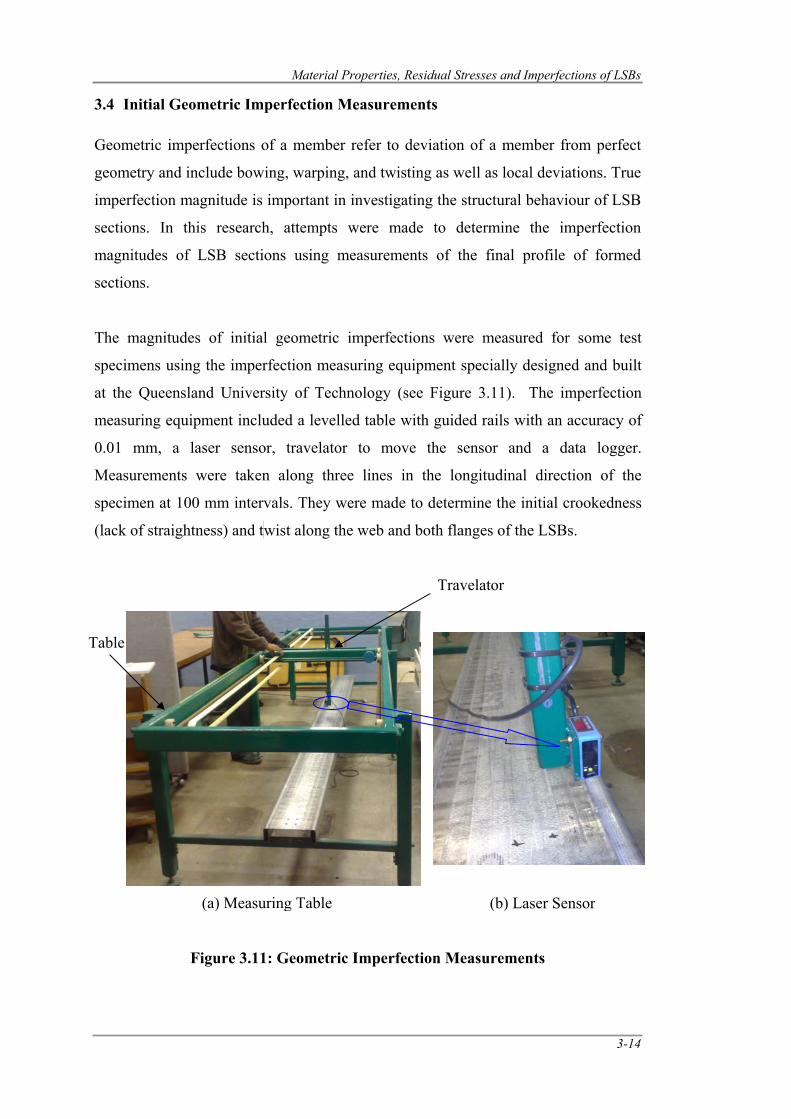
Material Properties, Residual Stresses and Imperfections of LSBs
3-14
3.4 Initial Geometric Imperfection Measurements
Geometric imperfections of a member refer to deviation of a member from perfect
geometry and include bowing, warping, and twisting as well as local deviations. True
imperfection magnitude is important in investigating the structural behaviour of LSB
sections. In this research, attempts were made to determine the imperfection
magnitudes of LSB sections using measurements of the final profile of formed
sections.
The magnitudes of initial geometric imperfections were measured for some test
specimens using the imperfection measuring equipment specially designed and built
at the Queensland University of Technology (see Figure 3.11). The imperfection
measuring equipment included a levelled table with guided rails with an accuracy of
0.01 mm, a laser sensor, travelator to move the sensor and a data logger.
Measurements were taken along three lines in the longitudinal direction of the
specimen at 100 mm intervals. They were made to determine the initial crookedness
(lack of straightness) and t wist along the web and both flanges of the LSBs.
Figure 3.11: Geometric Imperfection Measurements
Travelator
Table
(a) Measuring Table (b) Laser Sensor
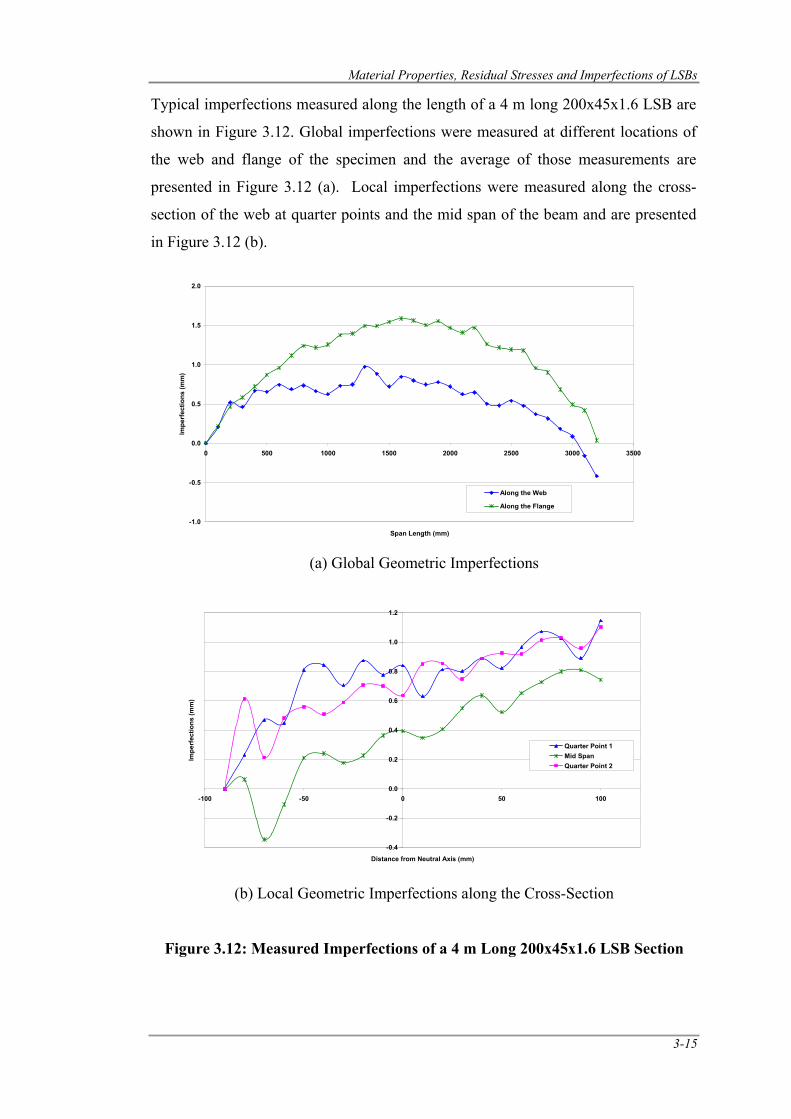
Material Properties, Residual Stresses and Imperfections of LSBs
3-15
Typical imperfections measured along the length of a 4 m long 200x45x1.6 LSB are
shown in Figure 3.12. Global imperfections were measured at different locations of
the web and flange of the specimen and the average of those measurements are
presented in Figure 3.12 (a). Local imperfections were measured along the cross-
section of the web at quarter points and the mid span of the beam and are presented
in Figure 3.12 (b).
(a) Global Geometric Imperfections
(b) Local Geometric Imperfections along the Cross-Section
Figure 3.12: Measured Imperfections of a 4 m Long 200x45x1.6 LSB Section
-1.0
-0.5
0.0
0.5
1.0
1.5
2.0
0 500 1000 1500 2000 2500 3000 3500
Span Length (mm)
Impe
rfec
tions
(mm
)
Along the Web
Along the Flange
-0.4
-0.2
0.0
0.2
0.4
0.6
0.8
1.0
1.2
-100 -50 0 50 100
Distance from Neutral Axis (mm)
Impe
rfec
tions
(mm
)
Quarter Point 1 Mid SpanQuarter Point 2
Material Properties, Residual Stresses and Imperfections of LSBs
3-16
Measured imperfections of other LSB sections are presented in Appendix A.2. The
results show that the measured local plate imperfections are within the
manufacturer’s fabrication tolerance limit of depth or width/150 while the overall
member imperfections are less than the recommended limit of span/1000 (SA, 1998).
This demonstrates that the unique manufacturing process of LSB does not lead to
geometric imperfections that exceed the currently accepted fabrication tolerances.
Mahaarachchi and Mahendran (2005e) also measured these imperfections for a large
number of LSBs and confirmed this observation. The measured geometric
imperfection values and distribution can be used in the numerical modelling of LSBs
to improve its accuracy of simulating the structural behaviour of LSBs.
3.5 Conclusions
This chapter has presented the details of a series of tests to determine the mechanical
properties, residual stresses and initial geometric imperfections of the current LSB
sections manufactured using a unique cold-formed and dual electric resistance
welding process. A series of tensile tests was carried out based on coupons taken
from the web, outside flange and inside flange elements of six LSBs, and the
mechanical properties were compared with those of Mahaarachchi and Mahendran
(2005e). It was found that both the yield stress and ultimate tensile strength have
increased due to the improved manufacturing process over the last three years.
Residual stresses were measured along the web element of a 150x45x1.6 LSB
section, and it was found that the improved manufacturing process has reduced the
level of residual stresses in LSBs. The results also showed that there are compressive
membrane forces at the web-flange junction. The membrane residual stress
distribution was slightly modified so that the net membrane force in the LSB cross-
section is zero. Initial geometric imperfections of some LSB members showed that
the LSB imperfections are within the currently accepted fabrication tolerances.

Lateral Buckling Tests of LSB Sections
4-1
CHAPTER 4
4.0 LATERAL BUCKLING TESTS OF LSB SECTIONS
4.1 Introduction
Experimental investigations are important to fully understand the structural
behaviour of LiteSteel Beams (LSBs) subjected to flexural action and to calibrate the
numerical analyses of LSBs. Both elastic buckling and post-buckling behaviour of
LSBs can be investigated using lateral buckling tests. Mahaarachchi and Mahendran
(2005a) carried out a series of large scale lateral buckling tests of LSBs. However,
the quality of the LSB manufacturing process in relation to cold-forming and electric
resistance welding has improved over the last three years while the manufacturers are
currently using a different grade steel. It was found that the new LSB sections have
higher yield stresses and ultimate tensile strength when compared to those of the
earlier LSB sections (see Chapter 3). It is therefore believed that the lateral buckling
moment capacities of the currently available LSBs are higher than those of
Mahaarachchi and Mahendran (2005a).
Mahaarachchi and Mahendran (2005a) did not consider short span LSBs in their
lateral bucking tests. In their tests, both the top and bottom flanges of LSBs were
kept free at the supports which would have reduced the moment capacities due to the
occurrence of flange twist despite the fact that the idealised simply supported
boundary conditions do not allow such twisting. This effect can be minimised or
eliminated by plotting these results on the non-dimensional capacity curve using the
appropriate elastic lateral distortional buckling moments from numerical analyses.
Considering the new developments in LSB sections and their manufacturing and the
limitations in Mahaarachchi and Mahendran’s (2005a) series of tests as described
above, it was decided to undertake another series of lateral buckling test. In this
study a total of 12 tests was undertaken using the currently available LSBs. Some of
the tests considered the same spans used by Mahaarachchi and Mahendran (2005a)
for comparison purposes while other tests considered shorter spans subject to lateral
distortional buckling to obtain more points on the non-dimensional member moment
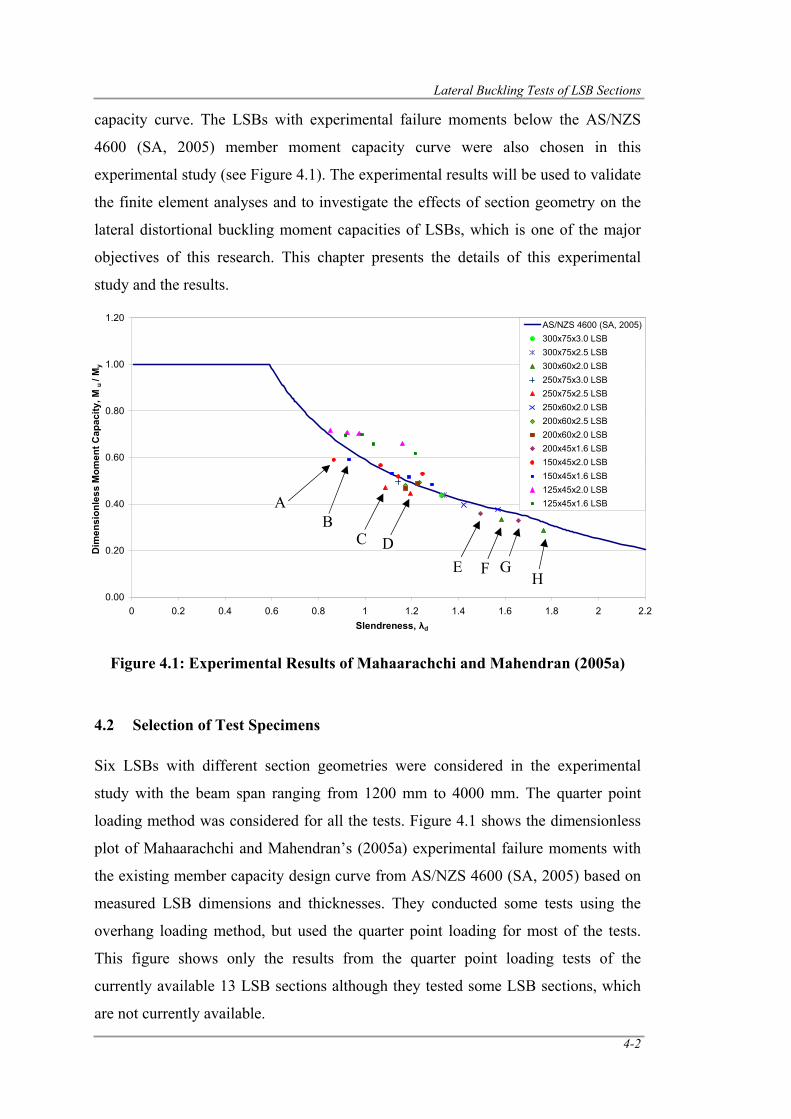
Lateral Buckling Tests of LSB Sections
4-2
capacity curve. The LSBs with experimental failure moments below the AS/NZS
4600 (SA, 2005) member moment capacity curve were also chosen in this
experimental study (see Figure 4.1). The experimental results will be used to validate
the finite element analyses and to investigate the effects of section geometry on the
lateral distortional buckling moment capacities of LSBs, which is one of the major
objectives of this research. This chapter presents the details of this experimental
study and the results.
Figure 4.1: Experimental Results of Mahaarachchi and Mahendran (2005a)
4.2 Selection of Test Specimens
Six LSBs with different section geometries were considered in the experimental
study with the beam span ranging from 1200 mm to 4000 mm. The quarter point
loading method was considered for all the tests. Figure 4.1 shows the dimensionless
plot of Mahaarachchi and Mahendran’s (2005a) experimental failure moments with
the existing member capacity design curve from AS/NZS 4600 (SA, 2005) based on
measured LSB dimensions and thicknesses. They conducted some tests using the
overhang loading method, but used the quarter point loading for most of the tests.
This figure shows only the results from the quarter point loading tests of the
currently available 13 LSB sections although they tested some LSB sections, which
are not currently available.
0.00
0.20
0.40
0.60
0.80
1.00
1.20
0 0.2 0.4 0.6 0.8 1 1.2 1.4 1.6 1.8 2 2.2Slendreness, λd
Dim
ensi
onle
ss M
omen
t Cap
acity
, M u
/ My
AS/NZS 4600 (SA, 2005)300x75x3.0 LSB300x75x2.5 LSB300x60x2.0 LSB250x75x3.0 LSB250x75x2.5 LSB250x60x2.0 LSB200x60x2.5 LSB200x60x2.0 LSB200x45x1.6 LSB150x45x2.0 LSB150x45x1.6 LSB125x45x2.0 LSB125x45x1.6 LSBA
B
E F GH
C D
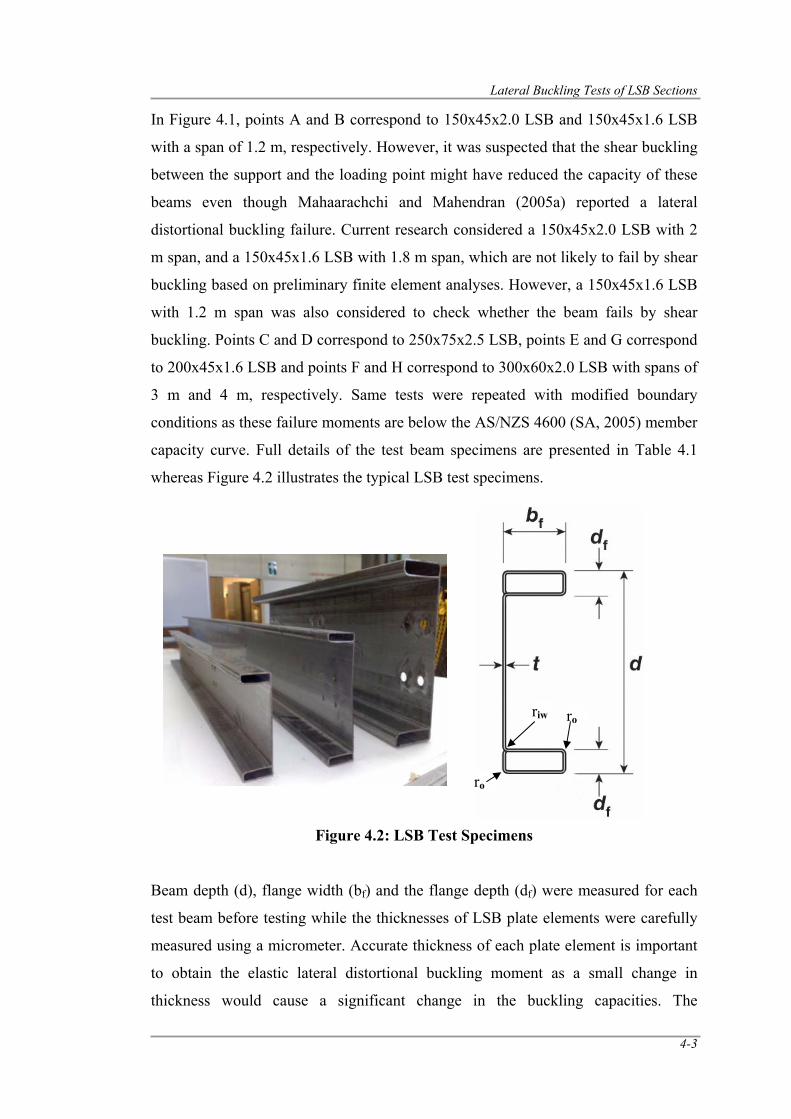
Lateral Buckling Tests of LSB Sections
4-3
In Figure 4.1, points A and B correspond to 150x45x2.0 LSB and 150x45x1.6 LSB
with a span of 1.2 m, respectively. However, it was suspected that the shear buckling
between the support and the loading point might have reduced the capacity of these
beams even though Mahaarachchi and Mahendran (2005a) reported a lateral
distortional buckling failure. Current research considered a 150x45x2.0 LSB with 2
m span, and a 150x45x1.6 LSB with 1.8 m span, which are not likely to fail by shear
buckling based on preliminary finite element analyses. However, a 150x45x1.6 LSB
with 1.2 m span was also considered to check whether the beam fails by shear
buckling. Points C and D correspond to 250x75x2.5 LSB, points E and G correspond
to 200x45x1.6 LSB and points F and H correspond to 300x60x2.0 LSB with spans of
3 m and 4 m, respectively. Same tests were repeated with modified boundary
conditions as these failure moments are below the AS/NZS 4600 (SA, 2005) member
capacity curve. Full details of the test beam specimens are presented in Table 4.1
whereas Figure 4.2 illustrates the typical LSB test specimens.
Figure 4.2: LSB Test Specimens
Beam depth (d), flange width (bf) and the flange depth (df) were measured for each
test beam before testing while the thicknesses of LSB plate elements were carefully
measured using a micrometer. Accurate thickness of each plate element is important
to obtain the elastic lateral distortional buckling moment as a small change in
thickness would cause a significant change in the buckling capacities. The
riw ro
ro
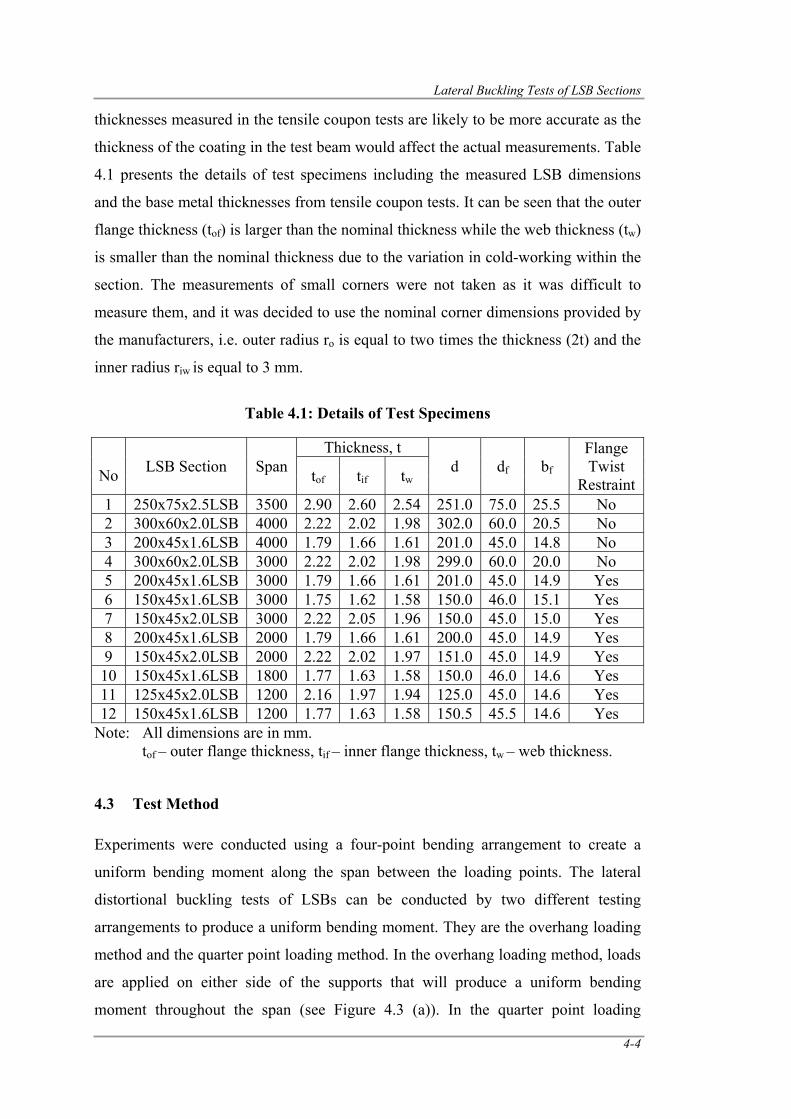
Lateral Buckling Tests of LSB Sections
4-4
thicknesses measured in the tensile coupon tests are likely to be more accurate as the
thickness of the coating in the test beam would affect the actual measurements. Table
4.1 presents the details of test specimens including the measured LSB dimensions
and the base metal thicknesses from tensile coupon tests. It can be seen that the outer
flange thickness (tof) is larger than the nominal thickness while the web thickness (tw)
is smaller than the nominal thickness due to the variation in cold-working within the
section. The measurements of small corners were not taken as it was difficult to
measure them, and it was decided to use the nominal corner dimensions provided by
the manufacturers, i.e. outer radius ro is equal to two times the thickness (2t) and the
inner radius riw is equal to 3 mm.
Table 4.1: Details of Test Specimens
No LSB Section Span
Thickness, t d df bf
Flange Twist
Restraint tof tif tw
1 250x75x2.5LSB 3500 2.90 2.60 2.54 251.0 75.0 25.5 No 2 300x60x2.0LSB 4000 2.22 2.02 1.98 302.0 60.0 20.5 No 3 200x45x1.6LSB 4000 1.79 1.66 1.61 201.0 45.0 14.8 No 4 300x60x2.0LSB 3000 2.22 2.02 1.98 299.0 60.0 20.0 No 5 200x45x1.6LSB 3000 1.79 1.66 1.61 201.0 45.0 14.9 Yes 6 150x45x1.6LSB 3000 1.75 1.62 1.58 150.0 46.0 15.1 Yes 7 150x45x2.0LSB 3000 2.22 2.05 1.96 150.0 45.0 15.0 Yes 8 200x45x1.6LSB 2000 1.79 1.66 1.61 200.0 45.0 14.9 Yes 9 150x45x2.0LSB 2000 2.22 2.02 1.97 151.0 45.0 14.9 Yes 10 150x45x1.6LSB 1800 1.77 1.63 1.58 150.0 46.0 14.6 Yes 11 125x45x2.0LSB 1200 2.16 1.97 1.94 125.0 45.0 14.6 Yes 12 150x45x1.6LSB 1200 1.77 1.63 1.58 150.5 45.5 14.6 Yes
Note: All dimensions are in mm. tof – outer flange thickness, tif – inner flange thickness, tw – web thickness.
4.3 Test Method
Experiments were conducted using a four-point bending arrangement to create a
uniform bending moment along the span between the loading points. The lateral
distortional buckling tests of LSBs can be conducted by two different testing
arrangements to produce a uniform bending moment. They are the overhang loading
method and the quarter point loading method. In the overhang loading method, loads
are applied on either side of the supports that will produce a uniform bending
moment throughout the span (see Figure 4.3 (a)). In the quarter point loading
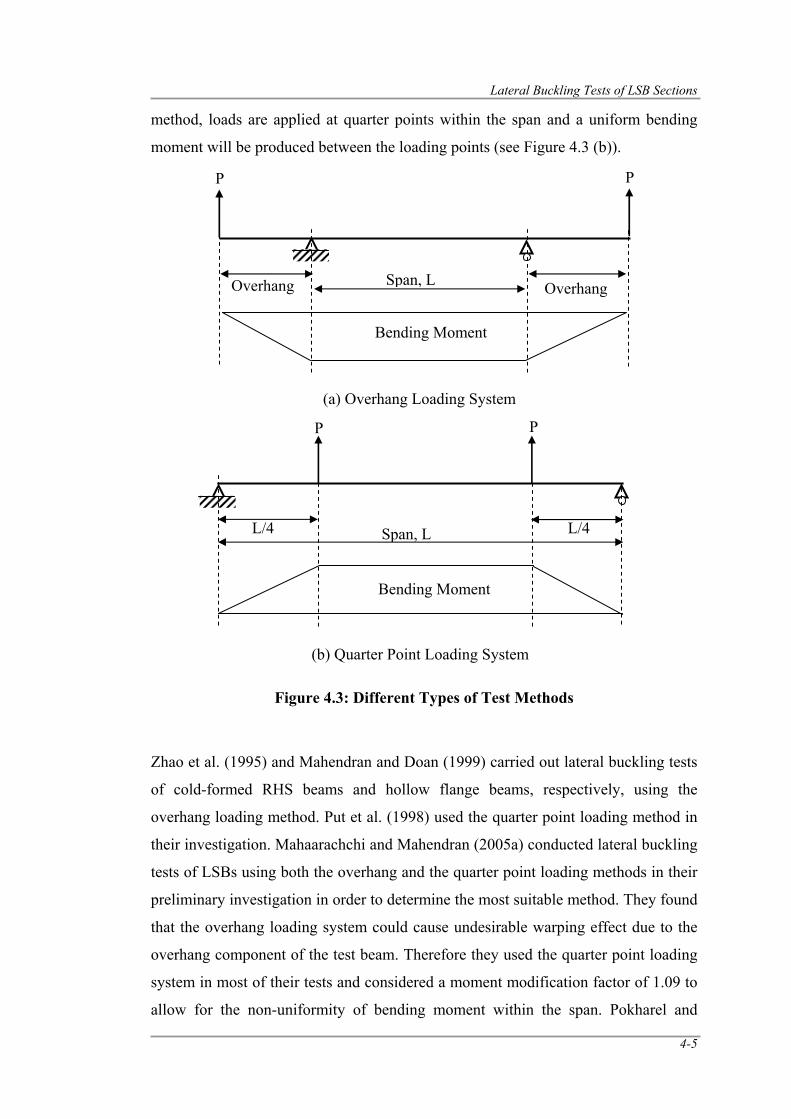
Lateral Buckling Tests of LSB Sections
4-5
method, loads are applied at quarter points within the span and a uniform bending
moment will be produced between the loading points (see Figure 4.3 (b)).
Figure 4.3: Different Types of Test Methods
Zhao et al. (1995) and Mahendran and Doan (1999) carried out lateral buckling tests
of cold-formed RHS beams and hollow flange beams, respectively, using the
overhang loading method. Put et al. (1998) used the quarter point loading method in
their investigation. Mahaarachchi and Mahendran (2005a) conducted lateral buckling
tests of LSBs using both the overhang and the quarter point loading methods in their
preliminary investigation in order to determine the most suitable method. They found
that the overhang loading system could cause undesirable warping effect due to the
overhang component of the test beam. Therefore they used the quarter point loading
system in most of their tests and considered a moment modification factor of 1.09 to
allow for the non-uniformity of bending moment within the span. Pokharel and
P P
Span, LOverhang
Bending Moment
Overhang
(a) Overhang Loading System
Span, L
P
L/4
P
L/4
Bending Moment
(b) Quarter Point Loading System
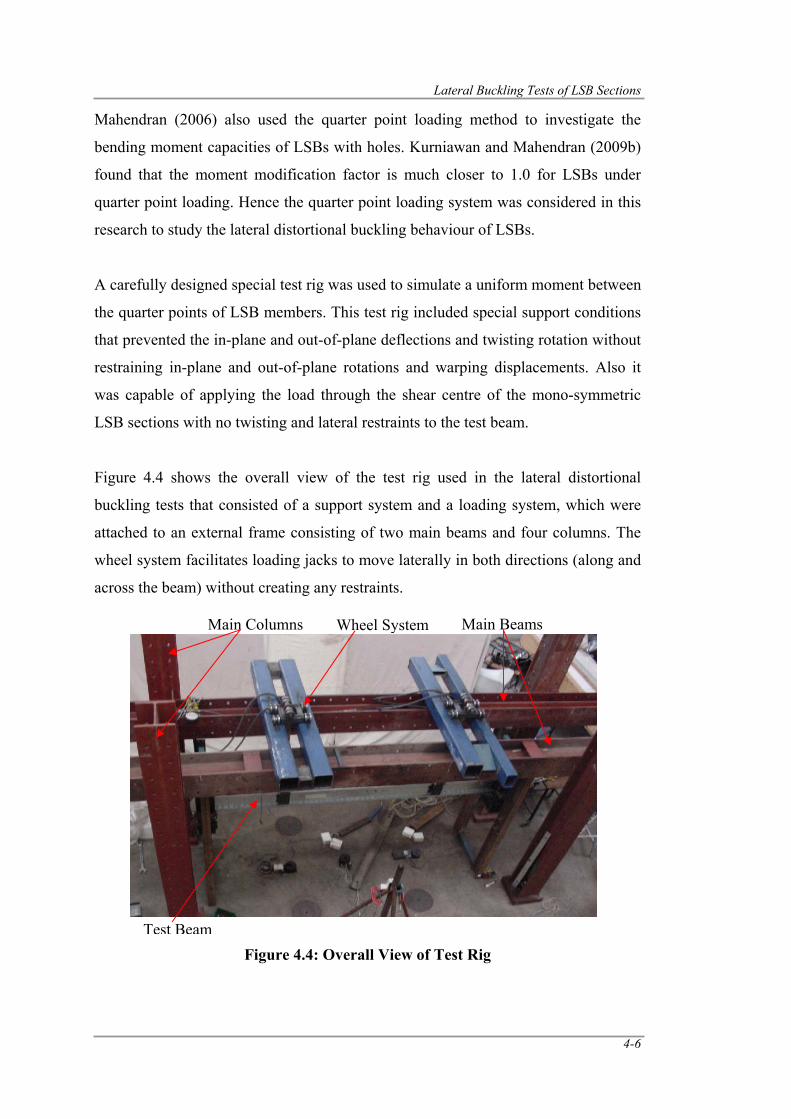
Lateral Buckling Tests of LSB Sections
4-6
Mahendran (2006) also used the quarter point loading method to investigate the
bending moment capacities of LSBs with holes. Kurniawan and Mahendran (2009b)
found that the moment modification factor is much closer to 1.0 for LSBs under
quarter point loading. Hence the quarter point loading system was considered in this
research to study the lateral distortional buckling behaviour of LSBs.
A carefully designed special test rig was used to simulate a uniform moment between
the quarter points of LSB members. This test rig included special support conditions
that prevented the in-plane and out-of-plane deflections and twisting rotation without
restraining in-plane and out-of-plane rotations and warping displacements. Also it
was capable of applying the load through the shear centre of the mono-symmetric
LSB sections with no twisting and lateral restraints to the test beam.
Figure 4.4 shows the overall view of the test rig used in the lateral distortional
buckling tests that consisted of a support system and a loading system, which were
attached to an external frame consisting of two main beams and four columns. The
wheel system facilitates loading jacks to move laterally in both directions (along and
across the beam) without creating any restraints.
Figure 4.4: Overall View of Test Rig
Main Columns Main BeamsWheel System
Test Beam
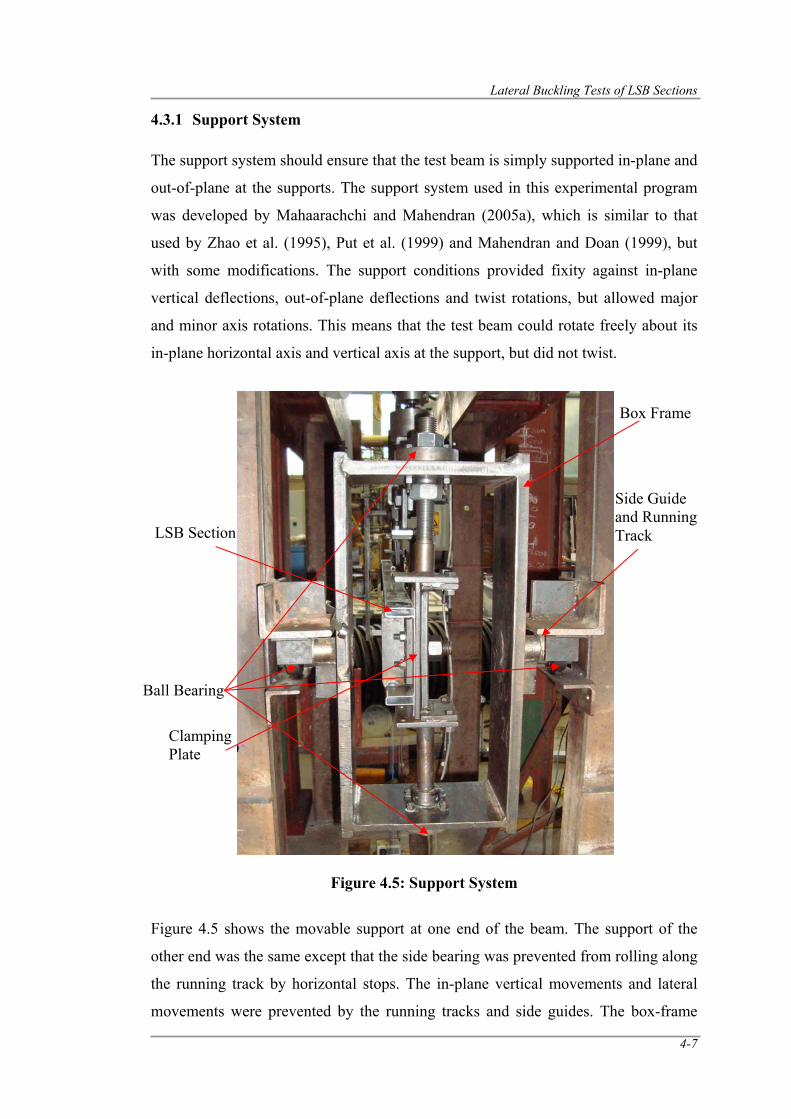
Lateral Buckling Tests of LSB Sections
4-7
4.3.1 Support System
The support system should ensure that the test beam is simply supported in-plane and
out-of-plane at the supports. The support system used in this experimental program
was developed by Mahaarachchi and Mahendran (2005a), which is similar to that
used by Zhao et al. (1995), Put et al. (1999) and Mahendran and Doan (1999), but
with some modifications. The support conditions provided fixity against in-plane
vertical deflections, out-of-plane deflections and twist rotations, but allowed major
and minor axis rotations. This means that the test beam could rotate freely about its
in-plane horizontal axis and vertical axis at the support, but did not twist.
Figure 4.5: Support System
Figure 4.5 shows the movable support at one end of the beam. The support of the
other end was the same except that the side bearing was prevented from rolling along
the running track by horizontal stops. The in-plane vertical movements and lateral
movements were prevented by the running tracks and side guides. The box-frame
Ball Bearing
LSB Section
Clamping Plate
Side Guide and Running Track
Box Frame
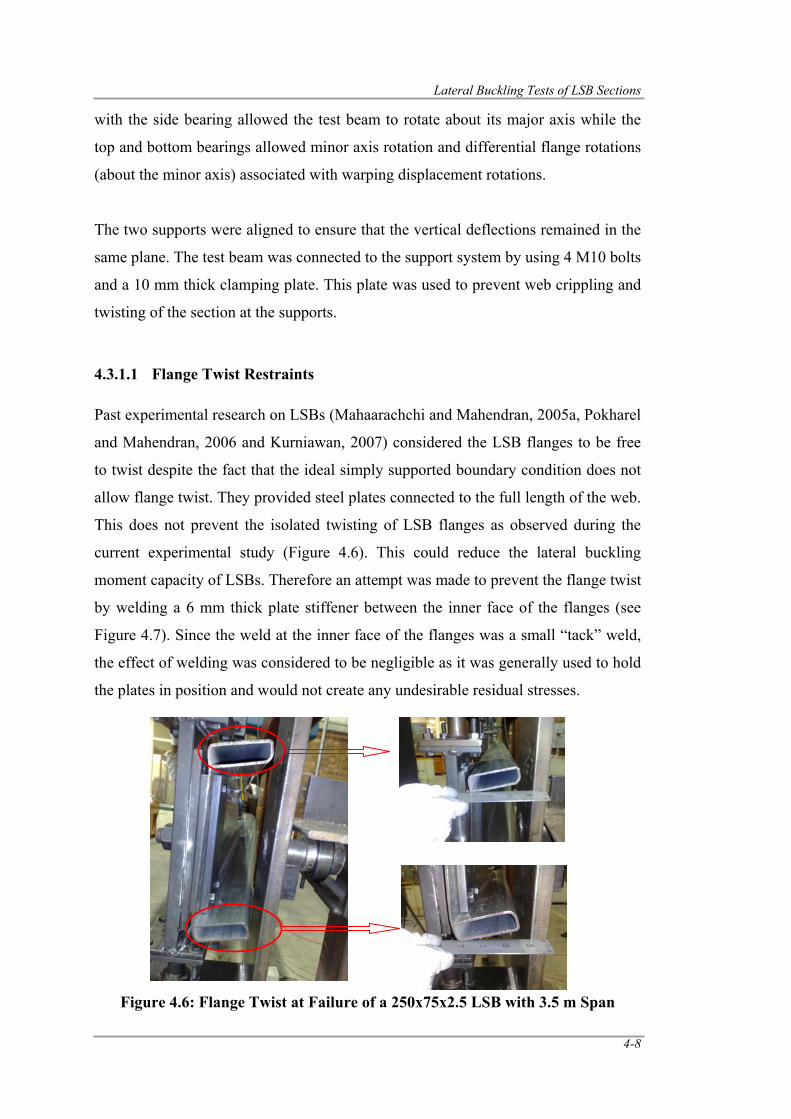
Lateral Buckling Tests of LSB Sections
4-8
with the side bearing allowed the test beam to rotate about its major axis while the
top and bottom bearings allowed minor axis rotation and differential flange rotations
(about the minor axis) associated with warping displacement rotations.
The two supports were aligned to ensure that the vertical deflections remained in the
same plane. The test beam was connected to the support system by using 4 M10 bolts
and a 10 mm thick clamping plate. This plate was used to prevent web crippling and
twisting of the section at the supports.
4.3.1.1 Flange Twist Restraints
Past experimental research on LSBs (Mahaarachchi and Mahendran, 2005a, Pokharel
and Mahendran, 2006 and Kurniawan, 2007) considered the LSB flanges to be free
to twist despite the fact that the ideal simply supported boundary condition does not
allow flange twist. They provided steel plates connected to the full length of the web.
This does not prevent the isolated twisting of LSB flanges as observed during the
current experimental study (Figure 4.6). This could reduce the lateral buckling
moment capacity of LSBs. Therefore an attempt was made to prevent the flange twist
by welding a 6 mm thick plate stiffener between the inner face of the flanges (see
Figure 4.7). Since the weld at the inner face of the flanges was a small “tack” weld,
the effect of welding was considered to be negligible as it was generally used to hold
the plates in position and would not create any undesirable residual stresses.
Figure 4.6: Flange Twist at Failure of a 250x75x2.5 LSB with 3.5 m Span
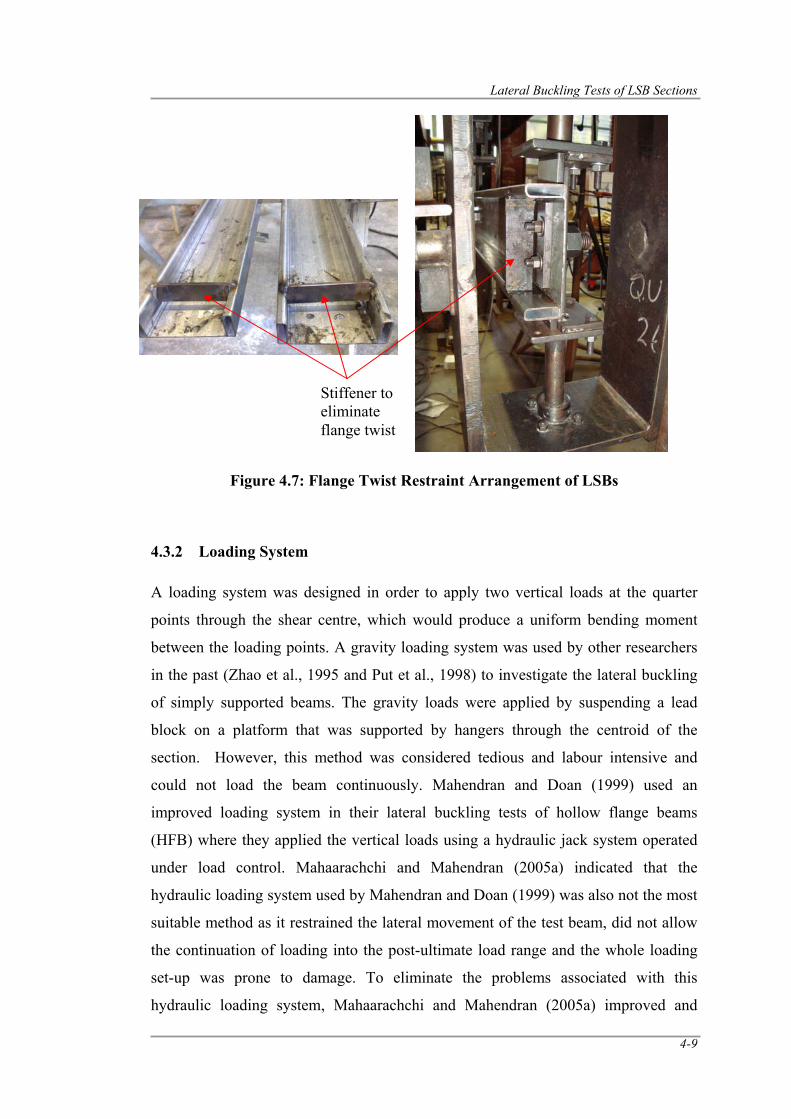
Lateral Buckling Tests of LSB Sections
4-9
Figure 4.7: Flange Twist Restraint Arrangement of LSBs
4.3.2 Loading System
A loading system was designed in order to apply two vertical loads at the quarter
points through the shear centre, which would produce a uniform bending moment
between the loading points. A gravity loading system was used by other researchers
in the past (Zhao et al., 1995 and Put et al., 1998) to investigate the lateral buckling
of simply supported beams. The gravity loads were applied by suspending a lead
block on a platform that was supported by hangers through the centroid of the
section. However, this method was considered tedious and labour intensive and
could not load the beam continuously. Mahendran and Doan (1999) used an
improved loading system in their lateral buckling tests of hollow flange beams
(HFB) where they applied the vertical loads using a hydraulic jack system operated
under load control. Mahaarachchi and Mahendran (2005a) indicated that the
hydraulic loading system used by Mahendran and Doan (1999) was also not the most
suitable method as it restrained the lateral movement of the test beam, did not allow
the continuation of loading into the post-ultimate load range and the whole loading
set-up was prone to damage. To eliminate the problems associated with this
hydraulic loading system, Mahaarachchi and Mahendran (2005a) improved and
Stiffener to eliminate flange twist
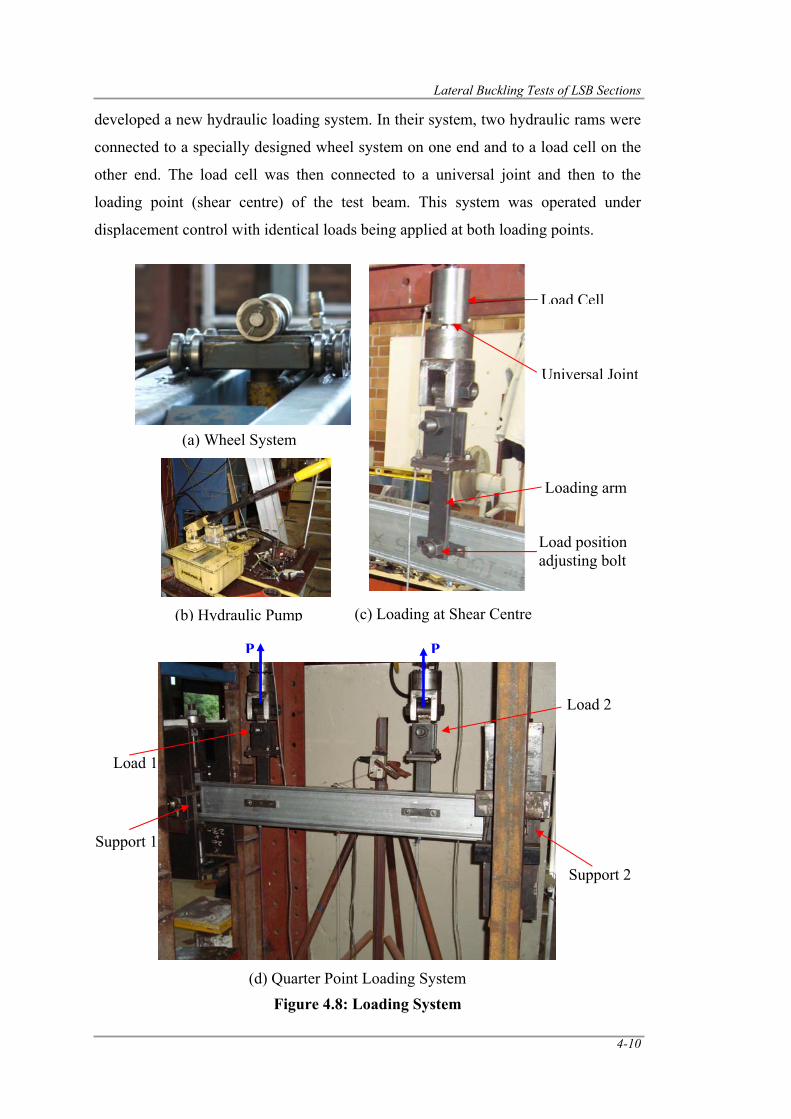
Lateral Buckling Tests of LSB Sections
4-10
developed a new hydraulic loading system. In their system, two hydraulic rams were
connected to a specially designed wheel system on one end and to a load cell on the
other end. The load cell was then connected to a universal joint and then to the
loading point (shear centre) of the test beam. This system was operated under
displacement control with identical loads being applied at both loading points.
Figure 4.8: Loading System
(c) Loading at Shear Centre
Load position adjusting bolt
Load Cell
Universal Joint
Loading arm
(b) Hydraulic Pump
(a) Wheel System
P P
(d) Quarter Point Loading System
Support 1
Load 2
Load 1
Support 2
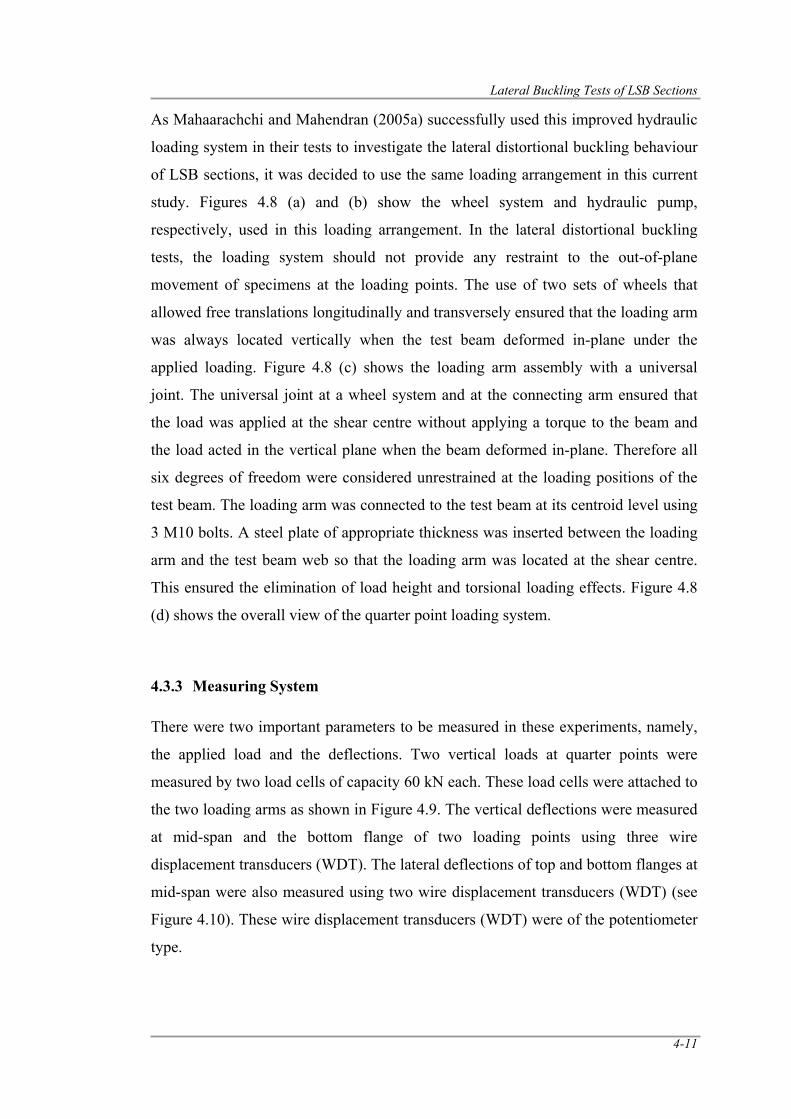
Lateral Buckling Tests of LSB Sections
4-11
As Mahaarachchi and Mahendran (2005a) successfully used this improved hydraulic
loading system in their tests to investigate the lateral distortional buckling behaviour
of LSB sections, it was decided to use the same loading arrangement in this current
study. Figures 4.8 (a) and (b) show the wheel system and hydraulic pump,
respectively, used in this loading arrangement. In the lateral distortional buckling
tests, the loading system should not provide any restraint to the out-of-plane
movement of specimens at the loading points. The use of two sets of wheels that
allowed free translations longitudinally and transversely ensured that the loading arm
was always located vertically when the test beam deformed in-plane under the
applied loading. Figure 4.8 (c) shows the loading arm assembly with a universal
joint. The universal joint at a wheel system and at the connecting arm ensured that
the load was applied at the shear centre without applying a torque to the beam and
the load acted in the vertical plane when the beam deformed in-plane. Therefore all
six degrees of freedom were considered unrestrained at the loading positions of the
test beam. The loading arm was connected to the test beam at its centroid level using
3 M10 bolts. A steel plate of appropriate thickness was inserted between the loading
arm and the test beam web so that the loading arm was located at the shear centre.
This ensured the elimination of load height and torsional loading effects. Figure 4.8
(d) shows the overall view of the quarter point loading system.
4.3.3 Measuring System
There were two important parameters to be measured in these experiments, namely,
the applied load and the deflections. Two vertical loads at quarter points were
measured by two load cells of capacity 60 kN each. These load cells were attached to
the two loading arms as shown in Figure 4.9. The vertical deflections were measured
at mid-span and the bottom flange of two loading points using three wire
displacement transducers (WDT). The lateral deflections of top and bottom flanges at
mid-span were also measured using two wire displacement transducers (WDT) (see
Figure 4.10). These wire displacement transducers (WDT) were of the potentiometer
type.
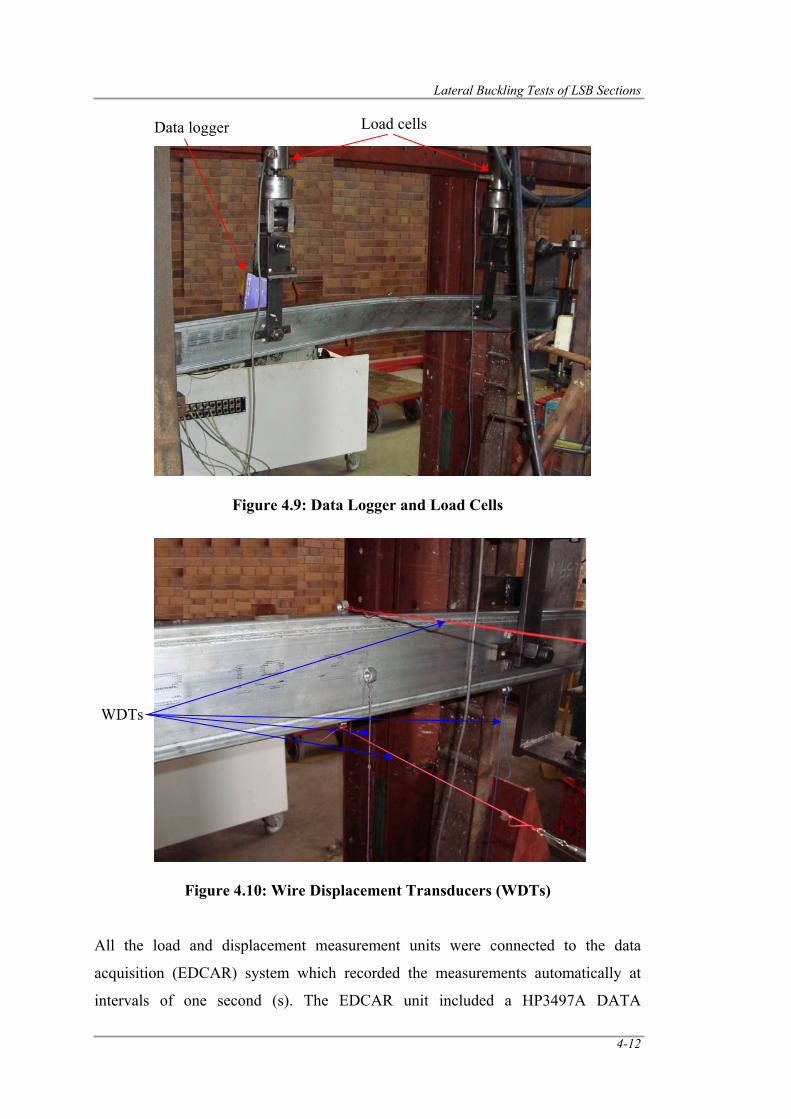
Lateral Buckling Tests of LSB Sections
4-12
Figure 4.9: Data Logger and Load Cells
Figure 4.10: Wire Displacement Transducers (WDTs)
All the load and displacement measurement units were connected to the data
acquisition (EDCAR) system which recorded the measurements automatically at
intervals of one second (s). The EDCAR unit included a HP3497A DATA
WDTs
Data logger Load cells
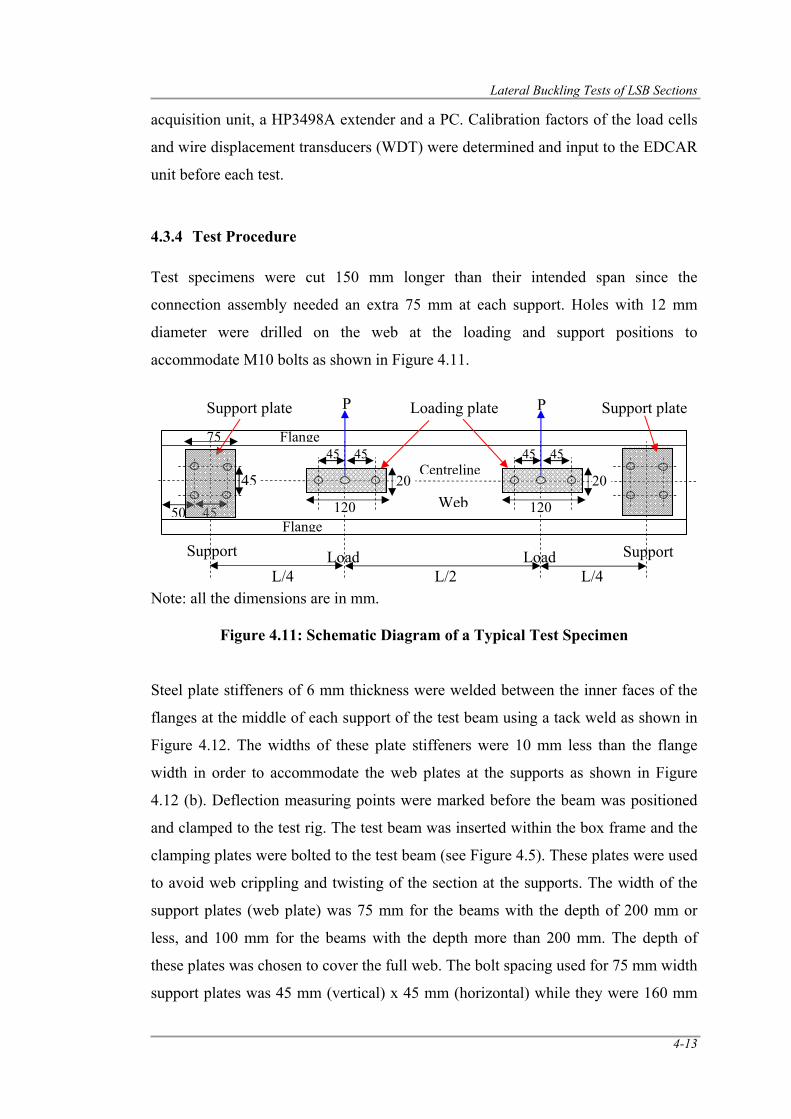
Lateral Buckling Tests of LSB Sections
4-13
acquisition unit, a HP3498A extender and a PC. Calibration factors of the load cells
and wire displacement transducers (WDT) were determined and input to the EDCAR
unit before each test.
4.3.4 Test Procedure
Test specimens were cut 150 mm longer than their intended span since the
connection assembly needed an extra 75 mm at each support. Holes with 12 mm
diameter were drilled on the web at the loading and support positions to
accommodate M10 bolts as shown in Figure 4.11.
Note: all the dimensions are in mm.
Figure 4.11: Schematic Diagram of a Typical Test Specimen
Steel plate stiffeners of 6 mm thickness were welded between the inner faces of the
flanges at the middle of each support of the test beam using a tack weld as shown in
Figure 4.12. The widths of these plate stiffeners were 10 mm less than the flange
width in order to accommodate the web plates at the supports as shown in Figure
4.12 (b). Deflection measuring points were marked before the beam was positioned
and clamped to the test rig. The test beam was inserted within the box frame and the
clamping plates were bolted to the test beam (see Figure 4.5). These plates were used
to avoid web crippling and twisting of the section at the supports. The width of the
support plates (web plate) was 75 mm for the beams with the depth of 200 mm or
less, and 100 mm for the beams with the depth more than 200 mm. The depth of
these plates was chosen to cover the full web. The bolt spacing used for 75 mm width
support plates was 45 mm (vertical) x 45 mm (horizontal) while they were 160 mm
Support
Support plate P P
75
Load
Flange
Flange
L/2 L/4
Centreline
LoadL/4
Support
Web
45 45
20
120
45 45
20
120
Support plate Loading plate
45 50
45
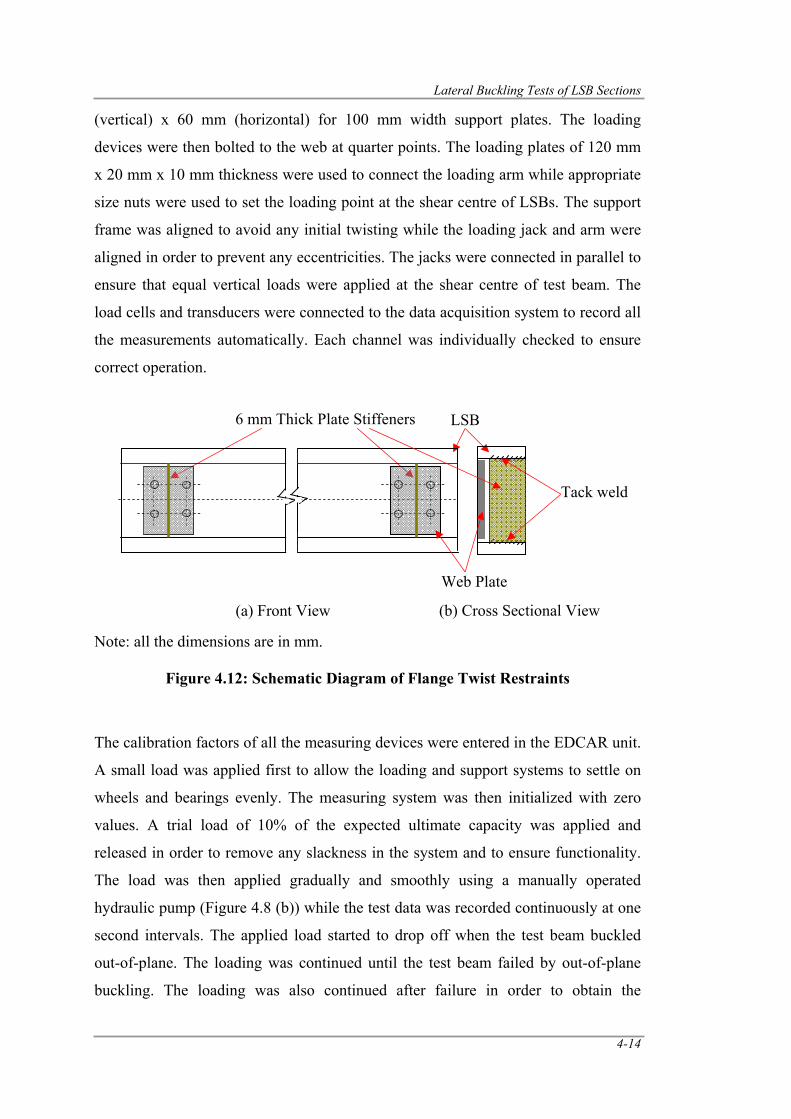
Lateral Buckling Tests of LSB Sections
4-14
(vertical) x 60 mm (horizontal) for 100 mm width support plates. The loading
devices were then bolted to the web at quarter points. The loading plates of 120 mm
x 20 mm x 10 mm thickness were used to connect the loading arm while appropriate
size nuts were used to set the loading point at the shear centre of LSBs. The support
frame was aligned to avoid any initial twisting while the loading jack and arm were
aligned in order to prevent any eccentricities. The jacks were connected in parallel to
ensure that equal vertical loads were applied at the shear centre of test beam. The
load cells and transducers were connected to the data acquisition system to record all
the measurements automatically. Each channel was individually checked to ensure
correct operation.
Note: all the dimensions are in mm.
Figure 4.12: Schematic Diagram of Flange Twist Restraints
The calibration factors of all the measuring devices were entered in the EDCAR unit.
A small load was applied first to allow the loading and support systems to settle on
wheels and bearings evenly. The measuring system was then initialized with zero
values. A trial load of 10% of the expected ultimate capacity was applied and
released in order to remove any slackness in the system and to ensure functionality.
The load was then applied gradually and smoothly using a manually operated
hydraulic pump (Figure 4.8 (b)) while the test data was recorded continuously at one
second intervals. The applied load started to drop off when the test beam buckled
out-of-plane. The loading was continued until the test beam failed by out-of-plane
buckling. The loading was also continued after failure in order to obtain the
(a) Front View (b) Cross Sectional View
6 mm Thick Plate Stiffeners
Tack weld
LSB
Web Plate
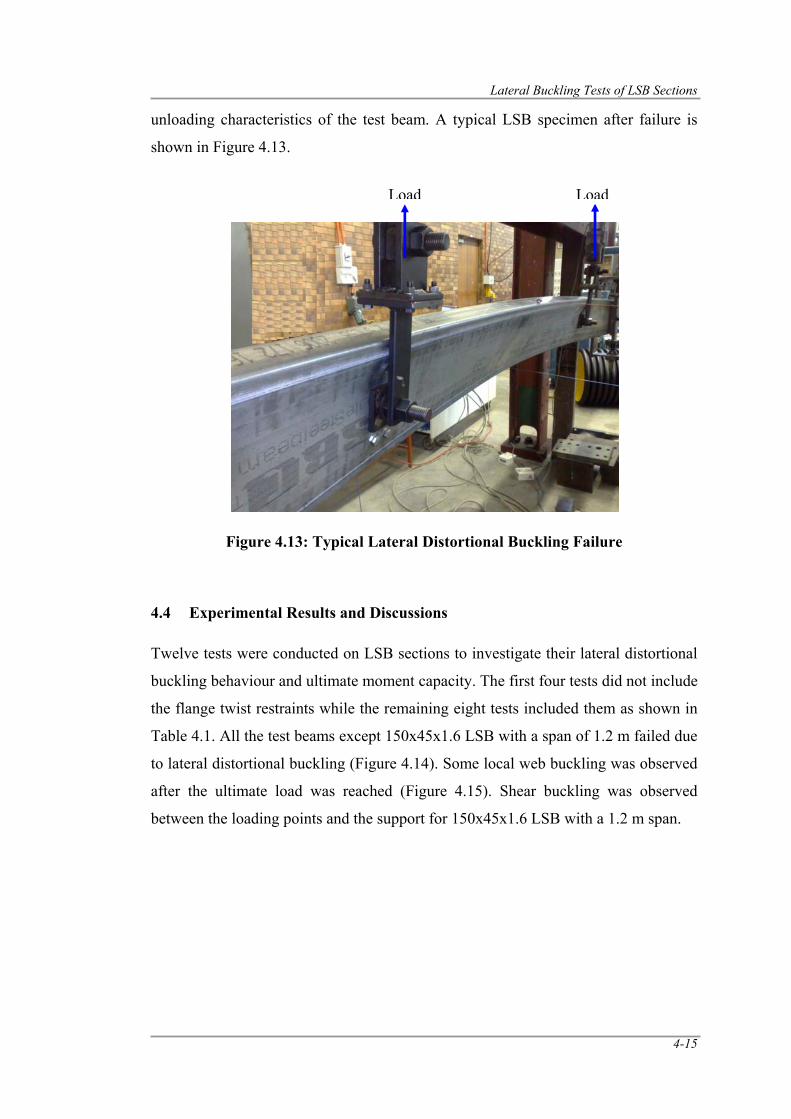
Lateral Buckling Tests of LSB Sections
4-15
unloading characteristics of the test beam. A typical LSB specimen after failure is
shown in Figure 4.13.
Figure 4.13: Typical Lateral Distortional Buckling Failure
4.4 Experimental Results and Discussions
Twelve tests were conducted on LSB sections to investigate their lateral distortional
buckling behaviour and ultimate moment capacity. The first four tests did not include
the flange twist restraints while the remaining eight tests included them as shown in
Table 4.1. All the test beams except 150x45x1.6 LSB with a span of 1.2 m failed due
to lateral distortional buckling (Figure 4.14). Some local web buckling was observed
after the ultimate load was reached (Figure 4.15). Shear buckling was observed
between the loading points and the support for 150x45x1.6 LSB with a 1.2 m span.
Load Load
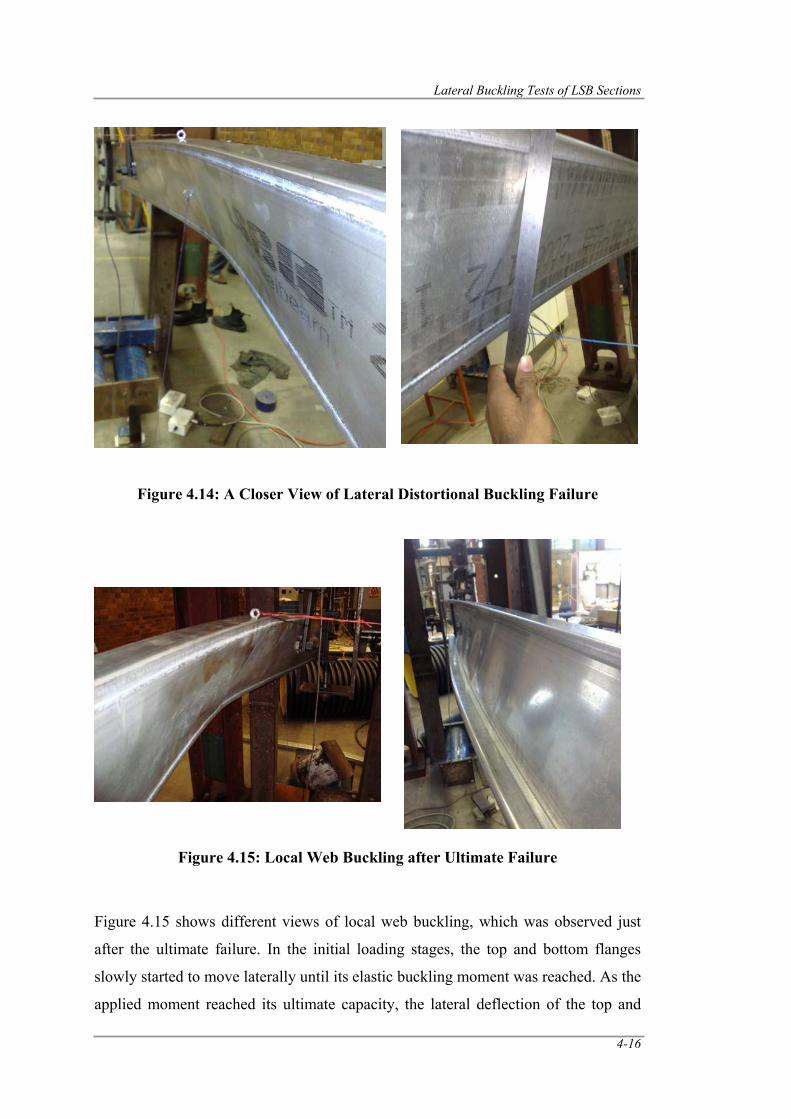
Lateral Buckling Tests of LSB Sections
4-16
Figure 4.14: A Closer View of Lateral Distortional Buckling Failure
Figure 4.15: Local Web Buckling after Ultimate Failure
Figure 4.15 shows different views of local web buckling, which was observed just
after the ultimate failure. In the initial loading stages, the top and bottom flanges
slowly started to move laterally until its elastic buckling moment was reached. As the
applied moment reached its ultimate capacity, the lateral deflection of the top and
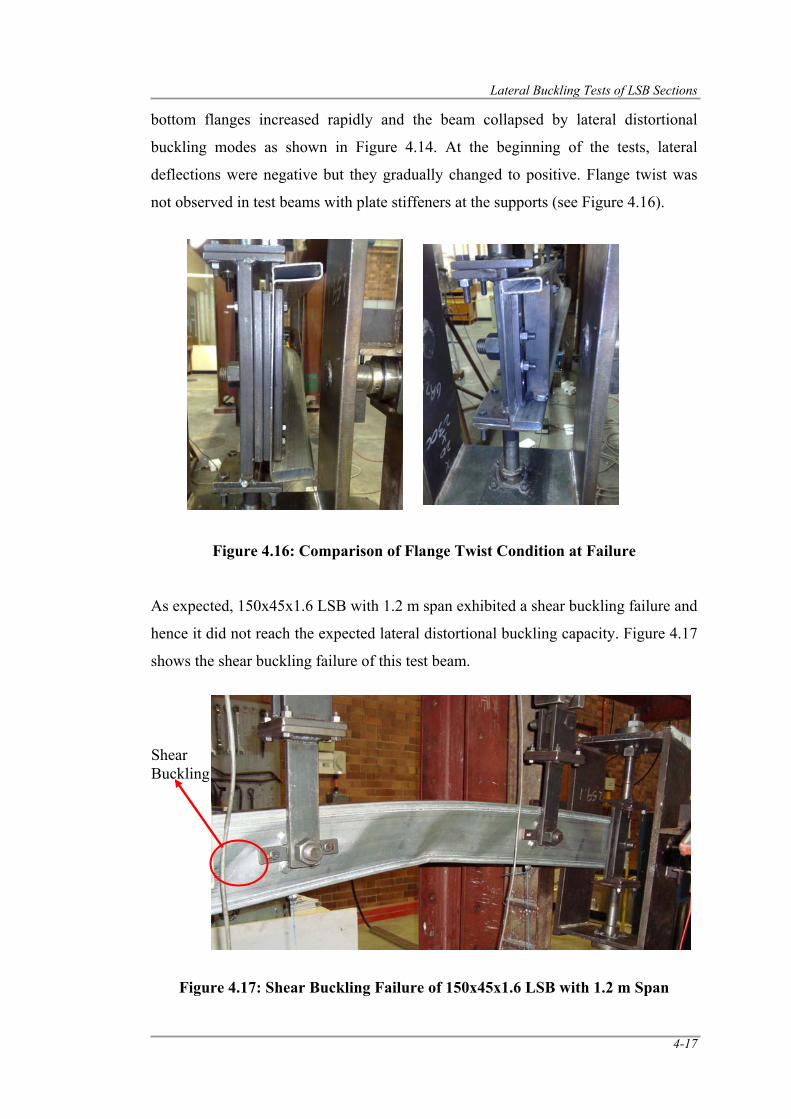
Lateral Buckling Tests of LSB Sections
4-17
bottom flanges increased rapidly and the beam collapsed by lateral distortional
buckling modes as shown in Figure 4.14. At the beginning of the tests, lateral
deflections were negative but they gradually changed to positive. Flange twist was
not observed in test beams with plate stiffeners at the supports (see Figure 4.16).
Figure 4.16: Comparison of Flange Twist Condition at Failure
As expected, 150x45x1.6 LSB with 1.2 m span exhibited a shear buckling failure and
hence it did not reach the expected lateral distortional buckling capacity. Figure 4.17
shows the shear buckling failure of this test beam.
Figure 4.17: Shear Buckling Failure of 150x45x1.6 LSB with 1.2 m Span
Shear Buckling
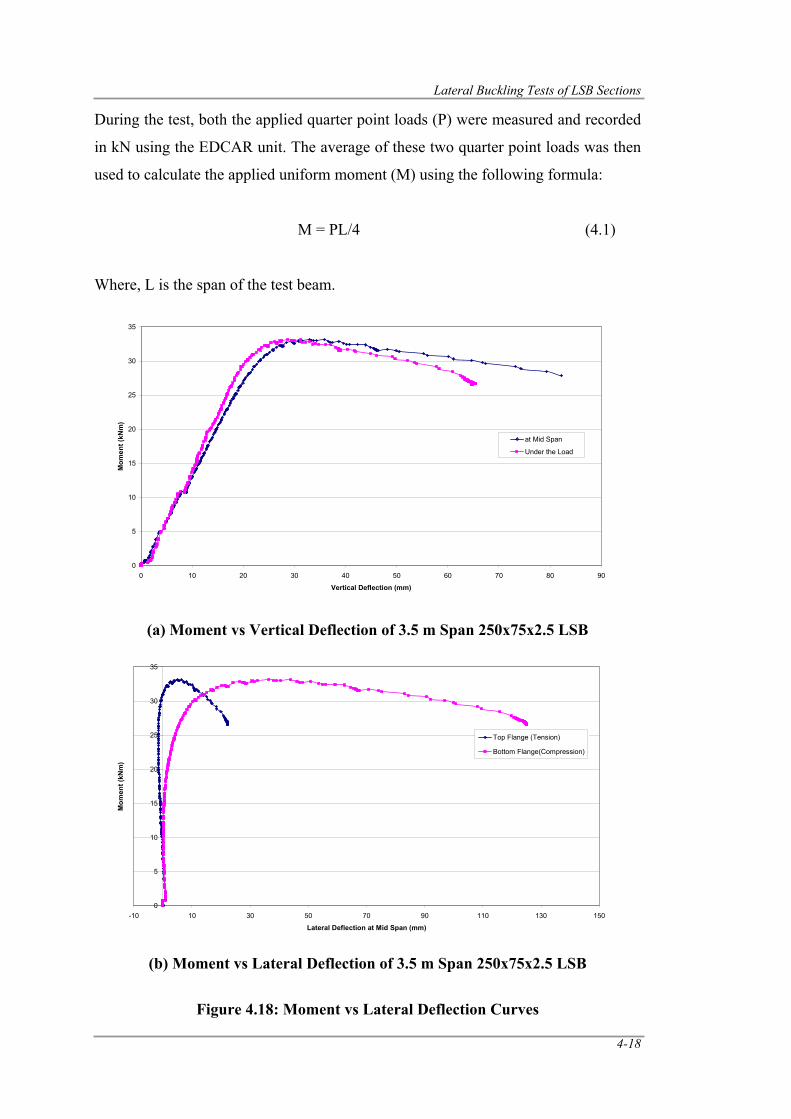
Lateral Buckling Tests of LSB Sections
4-18
During the test, both the applied quarter point loads (P) were measured and recorded
in kN using the EDCAR unit. The average of these two quarter point loads was then
used to calculate the applied uniform moment (M) using the following formula:
M = PL/4 (4.1)
Where, L is the span of the test beam.
(a) Moment vs Vertical Deflection of 3.5 m Span 250x75x2.5 LSB
(b) Moment vs Lateral Deflection of 3.5 m Span 250x75x2.5 LSB
Figure 4.18: Moment vs Lateral Deflection Curves
0
5
10
15
20
25
30
35
-10 10 30 50 70 90 110 130 150
Lateral Deflection at Mid Span (mm)
Mom
ent (
kNm
)
Top Flange (Tension)
Bottom Flange(Compression)
0
5
10
15
20
25
30
35
0 10 20 30 40 50 60 70 80 90
Vertical Deflection (mm)
Mom
ent (
kNm
)
at Mid Span
Under the Load
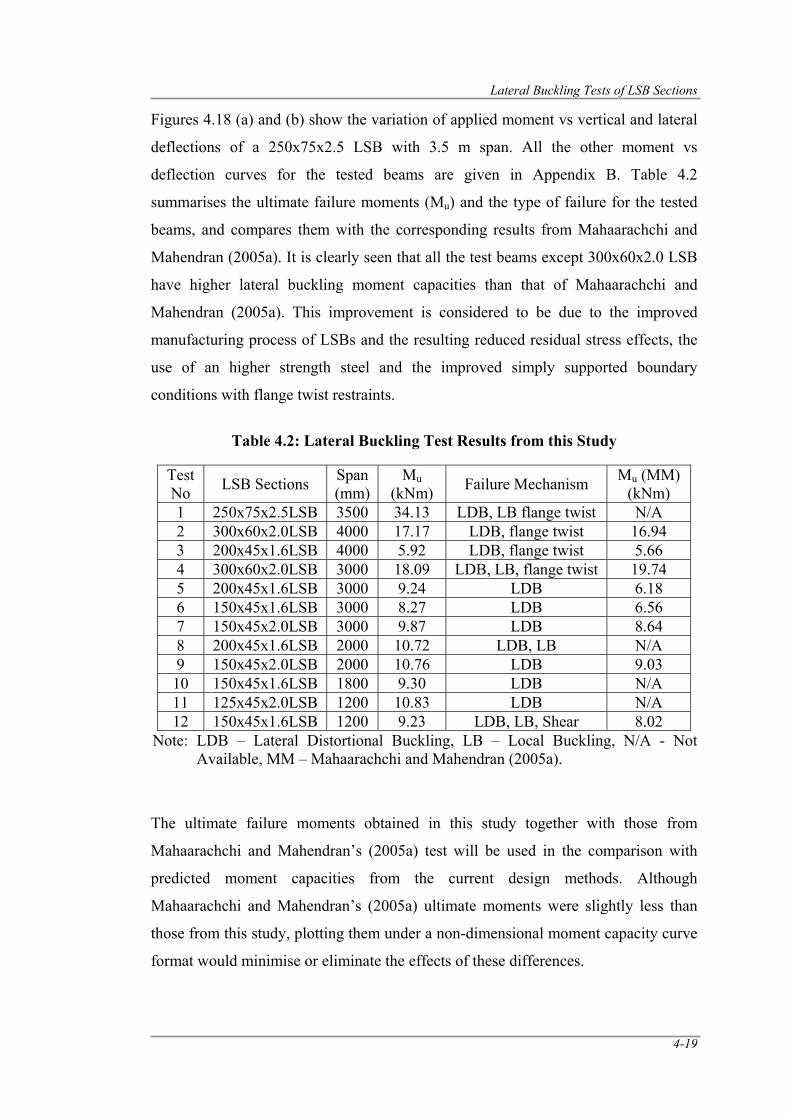
Lateral Buckling Tests of LSB Sections
4-19
Figures 4.18 (a) and (b) show the variation of applied moment vs vertical and lateral
deflections of a 250x75x2.5 LSB with 3.5 m span. All the other moment vs
deflection curves for the tested beams are given in Appendix B. Table 4.2
summarises the ultimate failure moments (Mu) and the type of failure for the tested
beams, and compares them with the corresponding results from Mahaarachchi and
Mahendran (2005a). It is clearly seen that all the test beams except 300x60x2.0 LSB
have higher lateral buckling moment capacities than that of Mahaarachchi and
Mahendran (2005a). This improvement is considered to be due to the improved
manufacturing process of LSBs and the resulting reduced residual stress effects, the
use of an higher strength steel and the improved simply supported boundary
conditions with flange twist restraints.
Table 4.2: Lateral Buckling Test Results from this Study
Test No LSB Sections Span
(mm)Mu
(kNm) Failure Mechanism Mu (MM) (kNm)
1 250x75x2.5LSB 3500 34.13 LDB, LB flange twist N/A 2 300x60x2.0LSB 4000 17.17 LDB, flange twist 16.94 3 200x45x1.6LSB 4000 5.92 LDB, flange twist 5.66 4 300x60x2.0LSB 3000 18.09 LDB, LB, flange twist 19.74 5 200x45x1.6LSB 3000 9.24 LDB 6.18 6 150x45x1.6LSB 3000 8.27 LDB 6.56 7 150x45x2.0LSB 3000 9.87 LDB 8.64 8 200x45x1.6LSB 2000 10.72 LDB, LB N/A 9 150x45x2.0LSB 2000 10.76 LDB 9.03 10 150x45x1.6LSB 1800 9.30 LDB N/A 11 125x45x2.0LSB 1200 10.83 LDB N/A 12 150x45x1.6LSB 1200 9.23 LDB, LB, Shear 8.02
Note: LDB – Lateral Distortional Buckling, LB – Local Buckling, N/A - Not Available, MM – Mahaarachchi and Mahendran (2005a).
The ultimate failure moments obtained in this study together with those from
Mahaarachchi and Mahendran’s (2005a) test will be used in the comparison with
predicted moment capacities from the current design methods. Although
Mahaarachchi and Mahendran’s (2005a) ultimate moments were slightly less than
those from this study, plotting them under a non-dimensional moment capacity curve
format would minimise or eliminate the effects of these differences.
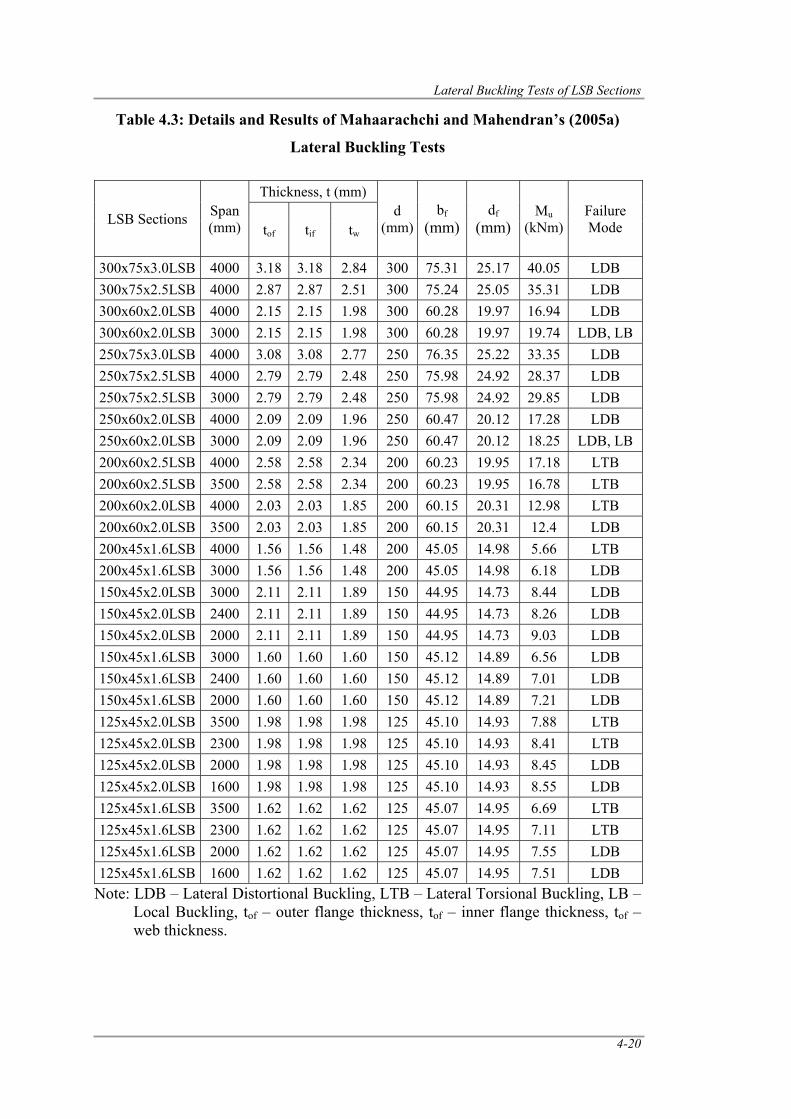
Lateral Buckling Tests of LSB Sections
4-20
Table 4.3: Details and Results of Mahaarachchi and Mahendran’s (2005a)
Lateral Buckling Tests
LSB Sections Span (mm)
Thickness, t (mm) d
(mm)bf
(mm)df
(mm) Mu
(kNm) Failure Mode tof tif tw
300x75x3.0LSB 4000 3.18 3.18 2.84 300 75.31 25.17 40.05 LDB 300x75x2.5LSB 4000 2.87 2.87 2.51 300 75.24 25.05 35.31 LDB 300x60x2.0LSB 4000 2.15 2.15 1.98 300 60.28 19.97 16.94 LDB 300x60x2.0LSB 3000 2.15 2.15 1.98 300 60.28 19.97 19.74 LDB, LB 250x75x3.0LSB 4000 3.08 3.08 2.77 250 76.35 25.22 33.35 LDB 250x75x2.5LSB 4000 2.79 2.79 2.48 250 75.98 24.92 28.37 LDB 250x75x2.5LSB 3000 2.79 2.79 2.48 250 75.98 24.92 29.85 LDB 250x60x2.0LSB 4000 2.09 2.09 1.96 250 60.47 20.12 17.28 LDB 250x60x2.0LSB 3000 2.09 2.09 1.96 250 60.47 20.12 18.25 LDB, LB 200x60x2.5LSB 4000 2.58 2.58 2.34 200 60.23 19.95 17.18 LTB 200x60x2.5LSB 3500 2.58 2.58 2.34 200 60.23 19.95 16.78 LTB 200x60x2.0LSB 4000 2.03 2.03 1.85 200 60.15 20.31 12.98 LTB 200x60x2.0LSB 3500 2.03 2.03 1.85 200 60.15 20.31 12.4 LDB 200x45x1.6LSB 4000 1.56 1.56 1.48 200 45.05 14.98 5.66 LTB 200x45x1.6LSB 3000 1.56 1.56 1.48 200 45.05 14.98 6.18 LDB 150x45x2.0LSB 3000 2.11 2.11 1.89 150 44.95 14.73 8.44 LDB 150x45x2.0LSB 2400 2.11 2.11 1.89 150 44.95 14.73 8.26 LDB 150x45x2.0LSB 2000 2.11 2.11 1.89 150 44.95 14.73 9.03 LDB 150x45x1.6LSB 3000 1.60 1.60 1.60 150 45.12 14.89 6.56 LDB 150x45x1.6LSB 2400 1.60 1.60 1.60 150 45.12 14.89 7.01 LDB 150x45x1.6LSB 2000 1.60 1.60 1.60 150 45.12 14.89 7.21 LDB 125x45x2.0LSB 3500 1.98 1.98 1.98 125 45.10 14.93 7.88 LTB 125x45x2.0LSB 2300 1.98 1.98 1.98 125 45.10 14.93 8.41 LTB 125x45x2.0LSB 2000 1.98 1.98 1.98 125 45.10 14.93 8.45 LDB 125x45x2.0LSB 1600 1.98 1.98 1.98 125 45.10 14.93 8.55 LDB 125x45x1.6LSB 3500 1.62 1.62 1.62 125 45.07 14.95 6.69 LTB 125x45x1.6LSB 2300 1.62 1.62 1.62 125 45.07 14.95 7.11 LTB 125x45x1.6LSB 2000 1.62 1.62 1.62 125 45.07 14.95 7.55 LDB 125x45x1.6LSB 1600 1.62 1.62 1.62 125 45.07 14.95 7.51 LDB
Note: LDB – Lateral Distortional Buckling, LTB – Lateral Torsional Buckling, LB – Local Buckling, tof – outer flange thickness, tof – inner flange thickness, tof – web thickness.
Lateral Buckling Tests of LSB Sections
4-21
Table 4.3 shows the lateral buckling test details and the results from Mahaarachchi
and Mahendran (2005a). Although they conducted lateral buckling tests with both
the overhang and the quarter point loading methods, only the results from the latter
were considered due to several reasons including the undesirable warping effects
associated with the overhang loading method. Among their results from the quarter
point loading, the results for 150x45x2.0 LSB and 150x45x1.6 LSB sections with 1.2
m span (Points A and B in Figure 4.1) were not considered as their capacities were
reduced by premature shear buckling failures. Since Kurniawan and Mahendran
(2009b) showed that the moment modification factor for quarter point loading of
LSB flexural members can be taken as 1.0 the ultimate moment capacities from tests
will not be reduced as was done by Mahaarachchi and Mahendran (2005a).
4.5 Comparisons with Design Methods
The ultimate moment capacity results from this research and those from
Mahaarachchi and Mahendran (2005a) were plotted within the framework of non-
dimensional moment capacity curves and compared with the member moment
capacity predictions from the current design method given in AS/NZS 4600 (SA,
2005).
Clause 3.3.3.3 (b) of AS/NZS 4600 (SA, 2005) outlines the design rules for members
subject to bending under distortional buckling that involves transverse bending of a
vertical web with lateral displacements of the compression flange, which were
developed by Mahaarachchi and Mahendran (2005d). In this case, the nominal
member moment capacity Mb is given by Equation 4.2.
(4.2)
For hollow flange beams, it is appropriate to determine the effective section modulus
(Ze) at a stress corresponding to Mc/Z, where Mc is the critical moment as defined in
Equations 4.3 (a) to (d) and Z is the full elastic section modulus.
For λd ≤ 0.59: Mc = My (4.3a)
⎟⎠⎞
⎜⎝⎛=
ZMZM c
eb
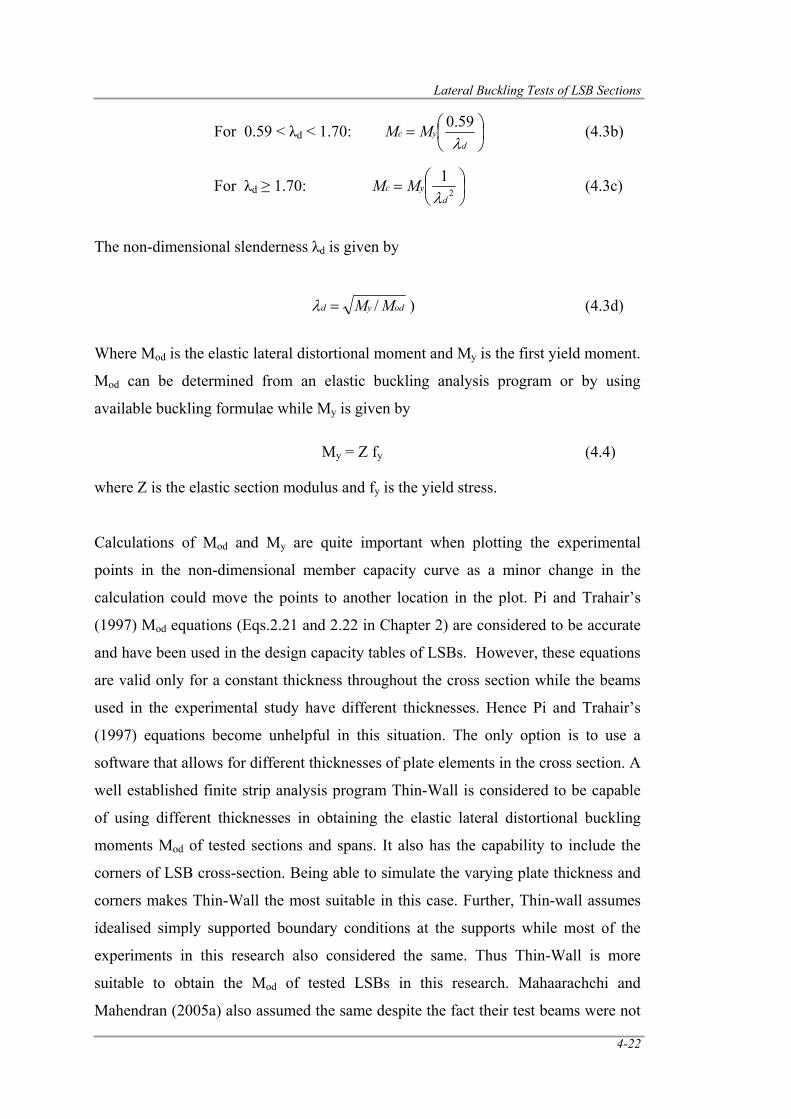
Lateral Buckling Tests of LSB Sections
4-22
For 0.59 < λd < 1.70: ⎟⎠⎞
⎜⎝⎛=
dyc MM
λ59.0 (4.3b)
For λd ≥ 1.70: ⎟⎠⎞
⎜⎝⎛= 2
1d
yc MMλ
(4.3c)
The non-dimensional slenderness λd is given by odyd MM /=λ ) (4.3d)
Where Mod is the elastic lateral distortional moment and My is the first yield moment.
Mod can be determined from an elastic buckling analysis program or by using
available buckling formulae while My is given by
My = Z fy (4.4)
where Z is the elastic section modulus and fy is the yield stress.
Calculations of Mod and My are quite important when plotting the experimental
points in the non-dimensional member capacity curve as a minor change in the
calculation could move the points to another location in the plot. Pi and Trahair’s
(1997) Mod equations (Eqs.2.21 and 2.22 in Chapter 2) are considered to be accurate
and have been used in the design capacity tables of LSBs. However, these equations
are valid only for a constant thickness throughout the cross section while the beams
used in the experimental study have different thicknesses. Hence Pi and Trahair’s
(1997) equations become unhelpful in this situation. The only option is to use a
software that allows for different thicknesses of plate elements in the cross section. A
well established finite strip analysis program Thin-Wall is considered to be capable
of using different thicknesses in obtaining the elastic lateral distortional buckling
moments Mod of tested sections and spans. It also has the capability to include the
corners of LSB cross-section. Being able to simulate the varying plate thickness and
corners makes Thin-Wall the most suitable in this case. Further, Thin-wall assumes
idealised simply supported boundary conditions at the supports while most of the
experiments in this research also considered the same. Thus Thin-Wall is more
suitable to obtain the Mod of tested LSBs in this research. Mahaarachchi and
Mahendran (2005a) also assumed the same despite the fact their test beams were not
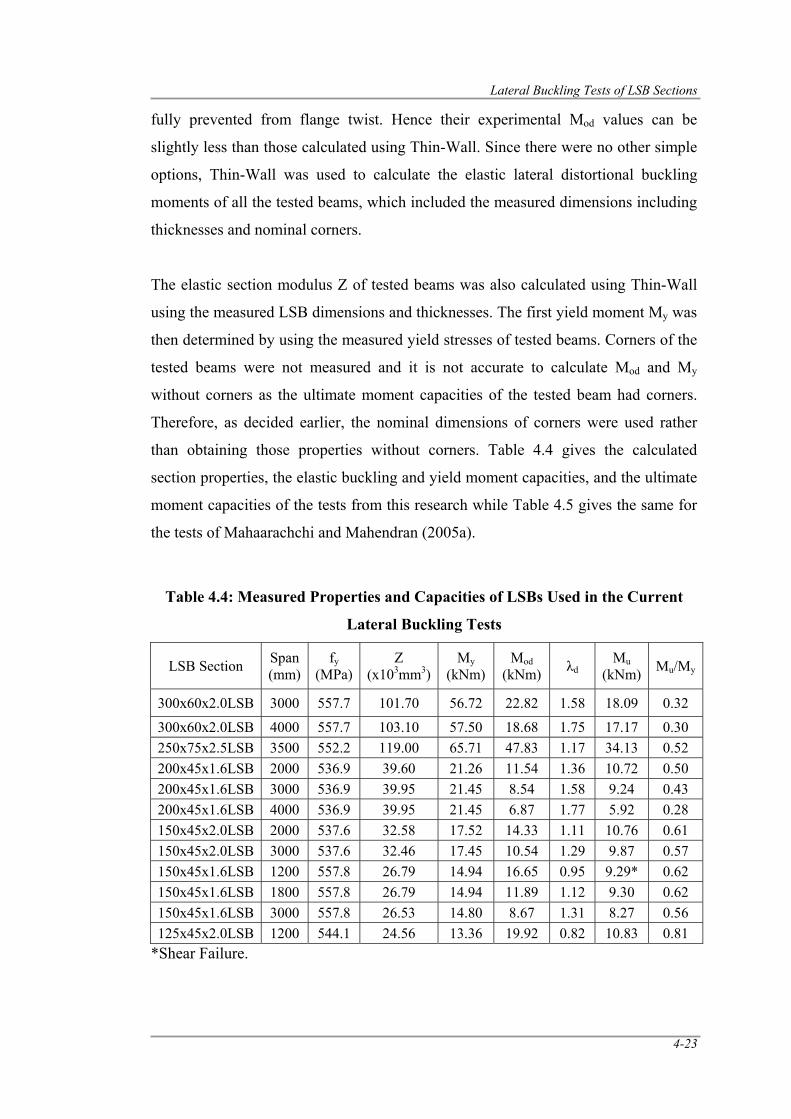
Lateral Buckling Tests of LSB Sections
4-23
fully prevented from flange twist. Hence their experimental Mod values can be
slightly less than those calculated using Thin-Wall. Since there were no other simple
options, Thin-Wall was used to calculate the elastic lateral distortional buckling
moments of all the tested beams, which included the measured dimensions including
thicknesses and nominal corners.
The elastic section modulus Z of tested beams was also calculated using Thin-Wall
using the measured LSB dimensions and thicknesses. The first yield moment My was
then determined by using the measured yield stresses of tested beams. Corners of the
tested beams were not measured and it is not accurate to calculate Mod and My
without corners as the ultimate moment capacities of the tested beam had corners.
Therefore, as decided earlier, the nominal dimensions of corners were used rather
than obtaining those properties without corners. Table 4.4 gives the calculated
section properties, the elastic buckling and yield moment capacities, and the ultimate
moment capacities of the tests from this research while Table 4.5 gives the same for
the tests of Mahaarachchi and Mahendran (2005a).
Table 4.4: Measured Properties and Capacities of LSBs Used in the Current
Lateral Buckling Tests
LSB Section Span (mm)
fy (MPa)
Z (x103mm3)
My (kNm)
Mod (kNm) λd
Mu (kNm) Mu/My
300x60x2.0LSB 3000 557.7 101.70 56.72 22.82 1.58 18.09 0.32
300x60x2.0LSB 4000 557.7 103.10 57.50 18.68 1.75 17.17 0.30 250x75x2.5LSB 3500 552.2 119.00 65.71 47.83 1.17 34.13 0.52 200x45x1.6LSB 2000 536.9 39.60 21.26 11.54 1.36 10.72 0.50 200x45x1.6LSB 3000 536.9 39.95 21.45 8.54 1.58 9.24 0.43 200x45x1.6LSB 4000 536.9 39.95 21.45 6.87 1.77 5.92 0.28 150x45x2.0LSB 2000 537.6 32.58 17.52 14.33 1.11 10.76 0.61 150x45x2.0LSB 3000 537.6 32.46 17.45 10.54 1.29 9.87 0.57 150x45x1.6LSB 1200 557.8 26.79 14.94 16.65 0.95 9.29* 0.62 150x45x1.6LSB 1800 557.8 26.79 14.94 11.89 1.12 9.30 0.62 150x45x1.6LSB 3000 557.8 26.53 14.80 8.67 1.31 8.27 0.56 125x45x2.0LSB 1200 544.1 24.56 13.36 19.92 0.82 10.83 0.81
*Shear Failure.
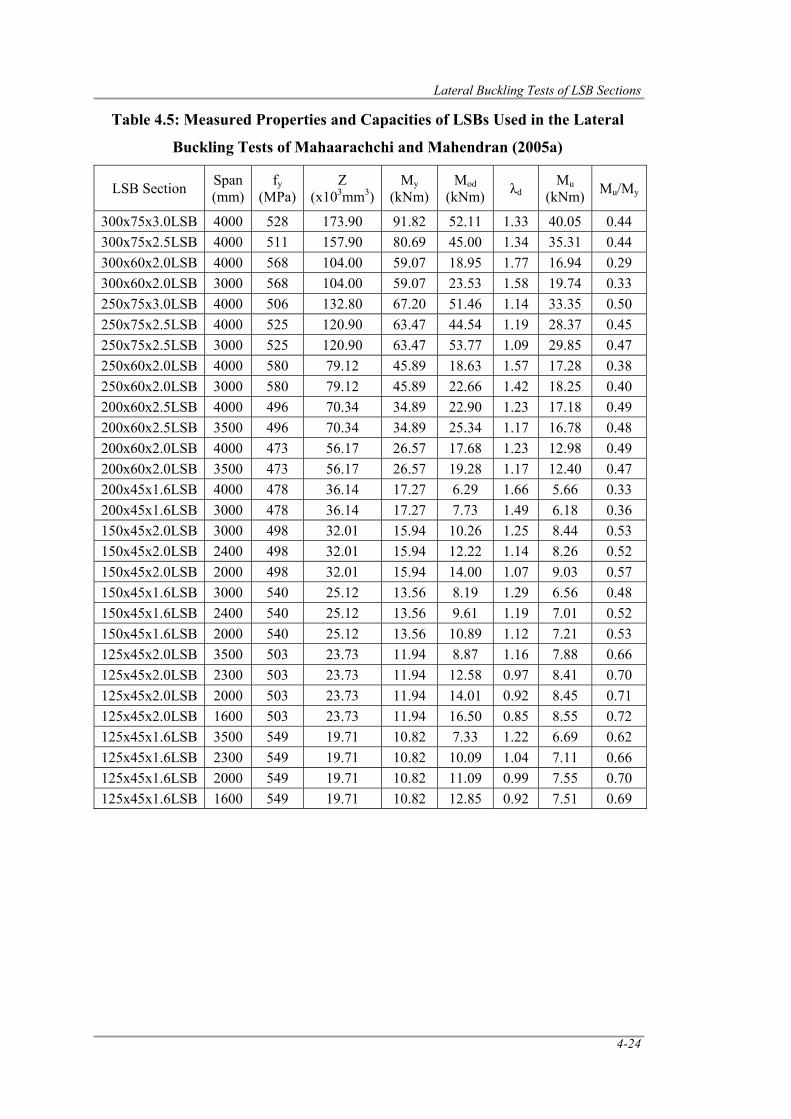
Lateral Buckling Tests of LSB Sections
4-24
Table 4.5: Measured Properties and Capacities of LSBs Used in the Lateral
Buckling Tests of Mahaarachchi and Mahendran (2005a)
LSB Section Span (mm)
fy (MPa)
Z (x103mm3)
My (kNm)
Mod (kNm) λd
Mu (kNm) Mu/My
300x75x3.0LSB 4000 528 173.90 91.82 52.11 1.33 40.05 0.44 300x75x2.5LSB 4000 511 157.90 80.69 45.00 1.34 35.31 0.44 300x60x2.0LSB 4000 568 104.00 59.07 18.95 1.77 16.94 0.29 300x60x2.0LSB 3000 568 104.00 59.07 23.53 1.58 19.74 0.33 250x75x3.0LSB 4000 506 132.80 67.20 51.46 1.14 33.35 0.50 250x75x2.5LSB 4000 525 120.90 63.47 44.54 1.19 28.37 0.45 250x75x2.5LSB 3000 525 120.90 63.47 53.77 1.09 29.85 0.47 250x60x2.0LSB 4000 580 79.12 45.89 18.63 1.57 17.28 0.38 250x60x2.0LSB 3000 580 79.12 45.89 22.66 1.42 18.25 0.40 200x60x2.5LSB 4000 496 70.34 34.89 22.90 1.23 17.18 0.49 200x60x2.5LSB 3500 496 70.34 34.89 25.34 1.17 16.78 0.48 200x60x2.0LSB 4000 473 56.17 26.57 17.68 1.23 12.98 0.49 200x60x2.0LSB 3500 473 56.17 26.57 19.28 1.17 12.40 0.47 200x45x1.6LSB 4000 478 36.14 17.27 6.29 1.66 5.66 0.33 200x45x1.6LSB 3000 478 36.14 17.27 7.73 1.49 6.18 0.36 150x45x2.0LSB 3000 498 32.01 15.94 10.26 1.25 8.44 0.53 150x45x2.0LSB 2400 498 32.01 15.94 12.22 1.14 8.26 0.52 150x45x2.0LSB 2000 498 32.01 15.94 14.00 1.07 9.03 0.57 150x45x1.6LSB 3000 540 25.12 13.56 8.19 1.29 6.56 0.48 150x45x1.6LSB 2400 540 25.12 13.56 9.61 1.19 7.01 0.52 150x45x1.6LSB 2000 540 25.12 13.56 10.89 1.12 7.21 0.53 125x45x2.0LSB 3500 503 23.73 11.94 8.87 1.16 7.88 0.66 125x45x2.0LSB 2300 503 23.73 11.94 12.58 0.97 8.41 0.70 125x45x2.0LSB 2000 503 23.73 11.94 14.01 0.92 8.45 0.71 125x45x2.0LSB 1600 503 23.73 11.94 16.50 0.85 8.55 0.72 125x45x1.6LSB 3500 549 19.71 10.82 7.33 1.22 6.69 0.62 125x45x1.6LSB 2300 549 19.71 10.82 10.09 1.04 7.11 0.66 125x45x1.6LSB 2000 549 19.71 10.82 11.09 0.99 7.55 0.70 125x45x1.6LSB 1600 549 19.71 10.82 12.85 0.92 7.51 0.69
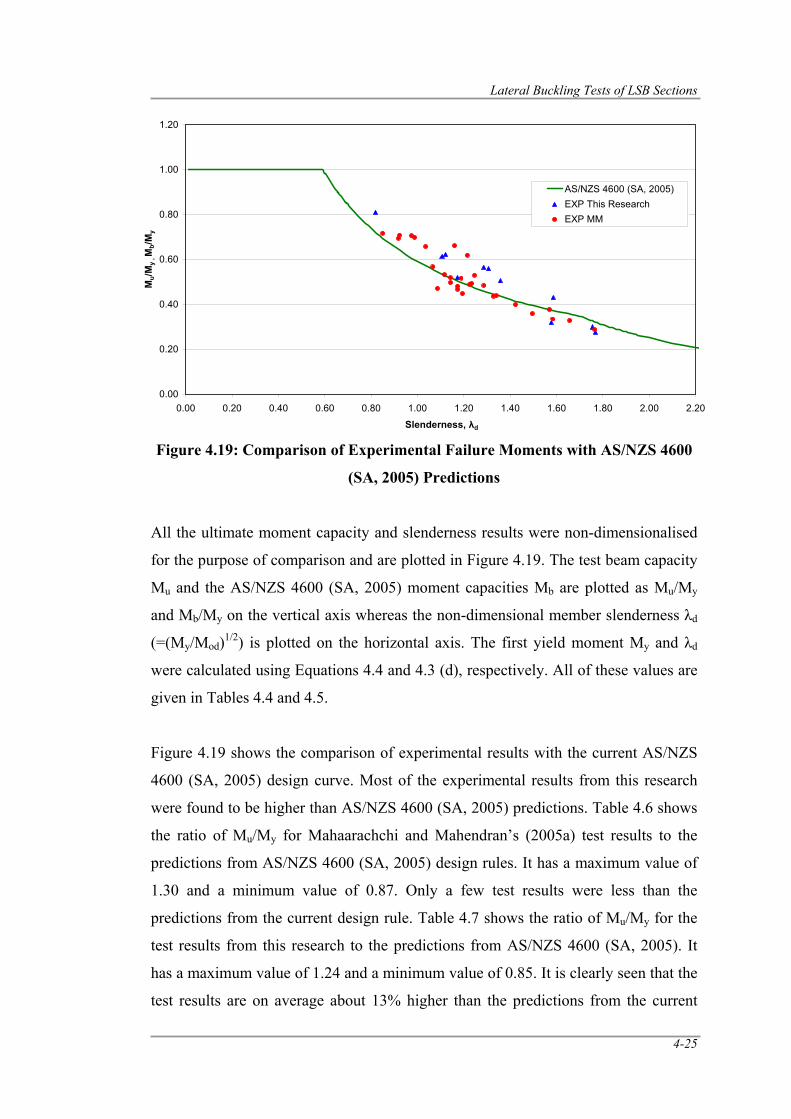
Lateral Buckling Tests of LSB Sections
4-25
0.00
0.20
0.40
0.60
0.80
1.00
1.20
0.00 0.20 0.40 0.60 0.80 1.00 1.20 1.40 1.60 1.80 2.00 2.20
Slenderness, λd
Mu/M
y , M
b/My
AS/NZS 4600 (SA, 2005)EXP This ResearchEXP MM
Figure 4.19: Comparison of Experimental Failure Moments with AS/NZS 4600
(SA, 2005) Predictions
All the ultimate moment capacity and slenderness results were non-dimensionalised
for the purpose of comparison and are plotted in Figure 4.19. The test beam capacity
Mu and the AS/NZS 4600 (SA, 2005) moment capacities Mb are plotted as Mu/My
and Mb/My on the vertical axis whereas the non-dimensional member slenderness λd
(=(My/Mod)1/2) is plotted on the horizontal axis. The first yield moment My and λd
were calculated using Equations 4.4 and 4.3 (d), respectively. All of these values are
given in Tables 4.4 and 4.5.
Figure 4.19 shows the comparison of experimental results with the current AS/NZS
4600 (SA, 2005) design curve. Most of the experimental results from this research
were found to be higher than AS/NZS 4600 (SA, 2005) predictions. Table 4.6 shows
the ratio of Mu/My for Mahaarachchi and Mahendran’s (2005a) test results to the
predictions from AS/NZS 4600 (SA, 2005) design rules. It has a maximum value of
1.30 and a minimum value of 0.87. Only a few test results were less than the
predictions from the current design rule. Table 4.7 shows the ratio of Mu/My for the
test results from this research to the predictions from AS/NZS 4600 (SA, 2005). It
has a maximum value of 1.24 and a minimum value of 0.85. It is clearly seen that the
test results are on average about 13% higher than the predictions from the current
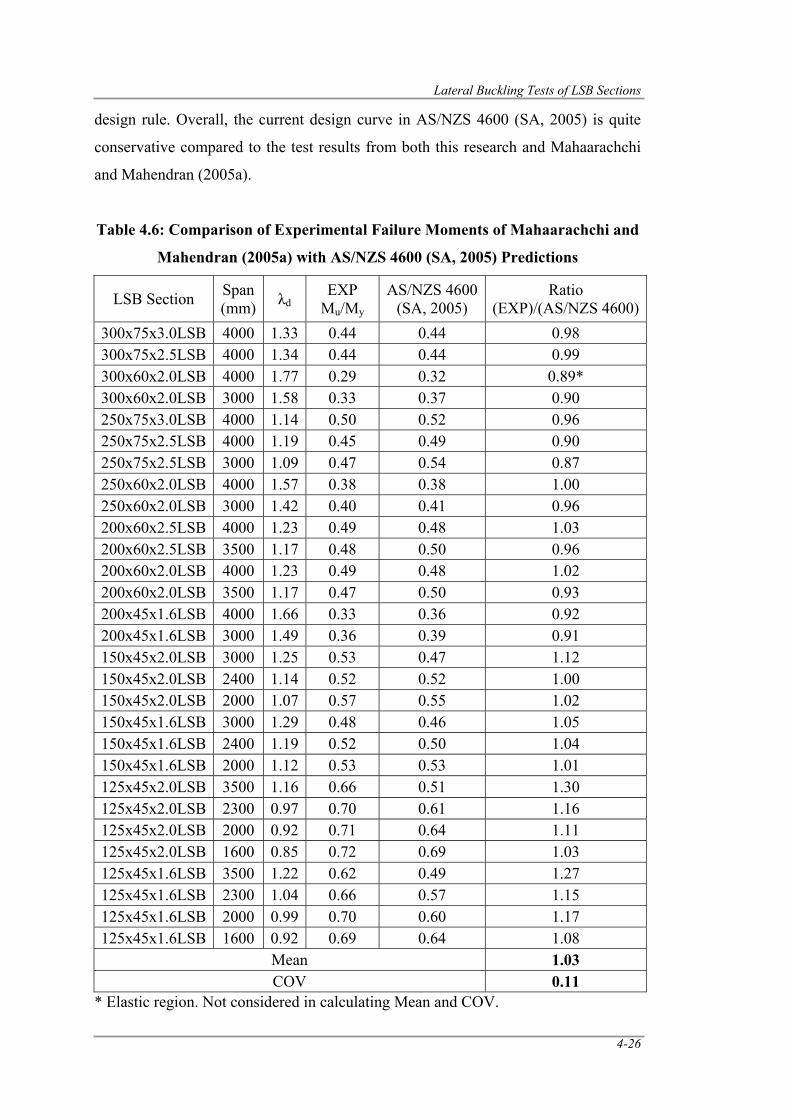
Lateral Buckling Tests of LSB Sections
4-26
design rule. Overall, the current design curve in AS/NZS 4600 (SA, 2005) is quite
conservative compared to the test results from both this research and Mahaarachchi
and Mahendran (2005a).
Table 4.6: Comparison of Experimental Failure Moments of Mahaarachchi and
Mahendran (2005a) with AS/NZS 4600 (SA, 2005) Predictions
LSB Section Span (mm) λd
EXP Mu/My
AS/NZS 4600 (SA, 2005)
Ratio (EXP)/(AS/NZS 4600)
300x75x3.0LSB 4000 1.33 0.44 0.44 0.98 300x75x2.5LSB 4000 1.34 0.44 0.44 0.99 300x60x2.0LSB 4000 1.77 0.29 0.32 0.89* 300x60x2.0LSB 3000 1.58 0.33 0.37 0.90 250x75x3.0LSB 4000 1.14 0.50 0.52 0.96 250x75x2.5LSB 4000 1.19 0.45 0.49 0.90 250x75x2.5LSB 3000 1.09 0.47 0.54 0.87 250x60x2.0LSB 4000 1.57 0.38 0.38 1.00 250x60x2.0LSB 3000 1.42 0.40 0.41 0.96 200x60x2.5LSB 4000 1.23 0.49 0.48 1.03 200x60x2.5LSB 3500 1.17 0.48 0.50 0.96 200x60x2.0LSB 4000 1.23 0.49 0.48 1.02 200x60x2.0LSB 3500 1.17 0.47 0.50 0.93 200x45x1.6LSB 4000 1.66 0.33 0.36 0.92 200x45x1.6LSB 3000 1.49 0.36 0.39 0.91 150x45x2.0LSB 3000 1.25 0.53 0.47 1.12 150x45x2.0LSB 2400 1.14 0.52 0.52 1.00 150x45x2.0LSB 2000 1.07 0.57 0.55 1.02 150x45x1.6LSB 3000 1.29 0.48 0.46 1.05 150x45x1.6LSB 2400 1.19 0.52 0.50 1.04 150x45x1.6LSB 2000 1.12 0.53 0.53 1.01 125x45x2.0LSB 3500 1.16 0.66 0.51 1.30 125x45x2.0LSB 2300 0.97 0.70 0.61 1.16 125x45x2.0LSB 2000 0.92 0.71 0.64 1.11 125x45x2.0LSB 1600 0.85 0.72 0.69 1.03 125x45x1.6LSB 3500 1.22 0.62 0.49 1.27 125x45x1.6LSB 2300 1.04 0.66 0.57 1.15 125x45x1.6LSB 2000 0.99 0.70 0.60 1.17 125x45x1.6LSB 1600 0.92 0.69 0.64 1.08
Mean 1.03 COV 0.11
* Elastic region. Not considered in calculating Mean and COV.
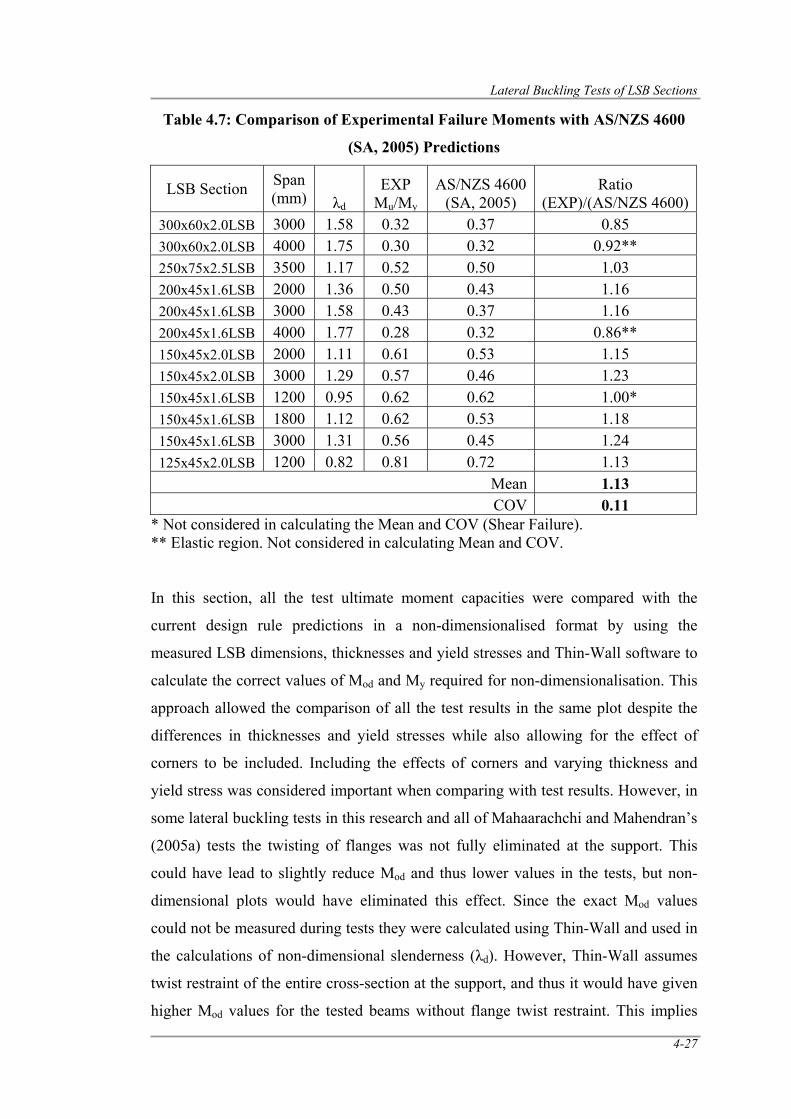
Lateral Buckling Tests of LSB Sections
4-27
Table 4.7: Comparison of Experimental Failure Moments with AS/NZS 4600
(SA, 2005) Predictions
LSB Section Span (mm) λd
EXP Mu/My
AS/NZS 4600 (SA, 2005)
Ratio (EXP)/(AS/NZS 4600)
300x60x2.0LSB 3000 1.58 0.32 0.37 0.85 300x60x2.0LSB 4000 1.75 0.30 0.32 0.92** 250x75x2.5LSB 3500 1.17 0.52 0.50 1.03 200x45x1.6LSB 2000 1.36 0.50 0.43 1.16 200x45x1.6LSB 3000 1.58 0.43 0.37 1.16 200x45x1.6LSB 4000 1.77 0.28 0.32 0.86** 150x45x2.0LSB 2000 1.11 0.61 0.53 1.15 150x45x2.0LSB 3000 1.29 0.57 0.46 1.23 150x45x1.6LSB 1200 0.95 0.62 0.62 1.00* 150x45x1.6LSB 1800 1.12 0.62 0.53 1.18 150x45x1.6LSB 3000 1.31 0.56 0.45 1.24 125x45x2.0LSB 1200 0.82 0.81 0.72 1.13
Mean 1.13 COV 0.11
* Not considered in calculating the Mean and COV (Shear Failure). ** Elastic region. Not considered in calculating Mean and COV. In this section, all the test ultimate moment capacities were compared with the
current design rule predictions in a non-dimensionalised format by using the
measured LSB dimensions, thicknesses and yield stresses and Thin-Wall software to
calculate the correct values of Mod and My required for non-dimensionalisation. This
approach allowed the comparison of all the test results in the same plot despite the
differences in thicknesses and yield stresses while also allowing for the effect of
corners to be included. Including the effects of corners and varying thickness and
yield stress was considered important when comparing with test results. However, in
some lateral buckling tests in this research and all of Mahaarachchi and Mahendran’s
(2005a) tests the twisting of flanges was not fully eliminated at the support. This
could have lead to slightly reduce Mod and thus lower values in the tests, but non-
dimensional plots would have eliminated this effect. Since the exact Mod values
could not be measured during tests they were calculated using Thin-Wall and used in
the calculations of non-dimensional slenderness (λd). However, Thin-Wall assumes
twist restraint of the entire cross-section at the support, and thus it would have given
higher Mod values for the tested beams without flange twist restraint. This implies
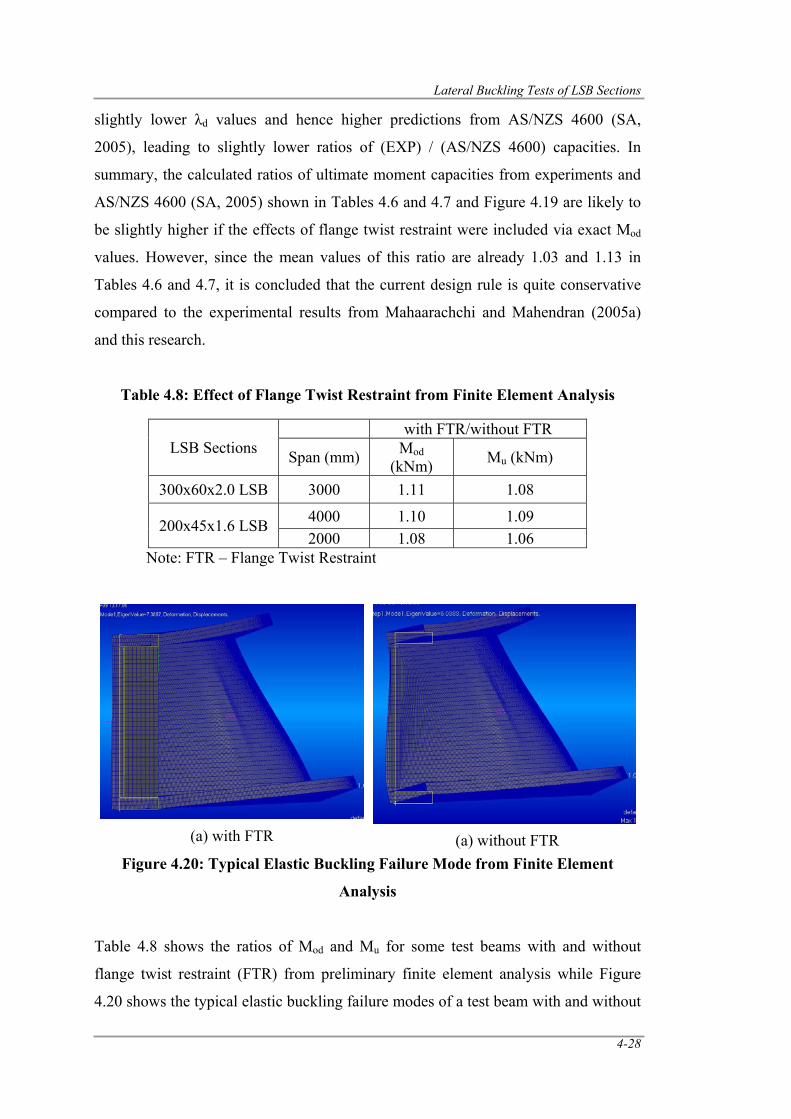
Lateral Buckling Tests of LSB Sections
4-28
slightly lower λd values and hence higher predictions from AS/NZS 4600 (SA,
2005), leading to slightly lower ratios of (EXP) / (AS/NZS 4600) capacities. In
summary, the calculated ratios of ultimate moment capacities from experiments and
AS/NZS 4600 (SA, 2005) shown in Tables 4.6 and 4.7 and Figure 4.19 are likely to
be slightly higher if the effects of flange twist restraint were included via exact Mod
values. However, since the mean values of this ratio are already 1.03 and 1.13 in
Tables 4.6 and 4.7, it is concluded that the current design rule is quite conservative
compared to the experimental results from Mahaarachchi and Mahendran (2005a)
and this research.
Table 4.8: Effect of Flange Twist Restraint from Finite Element Analysis
LSB Sections with FTR/without FTR
Span (mm) Mod (kNm) Mu (kNm)
300x60x2.0 LSB 3000 1.11 1.08
200x45x1.6 LSB 4000 1.10 1.09 2000 1.08 1.06
Note: FTR – Flange Twist Restraint
Figure 4.20: Typical Elastic Buckling Failure Mode from Finite Element
Analysis
Table 4.8 shows the ratios of Mod and Mu for some test beams with and without
flange twist restraint (FTR) from preliminary finite element analysis while Figure
4.20 shows the typical elastic buckling failure modes of a test beam with and without
(a) with FTR (a) without FTR
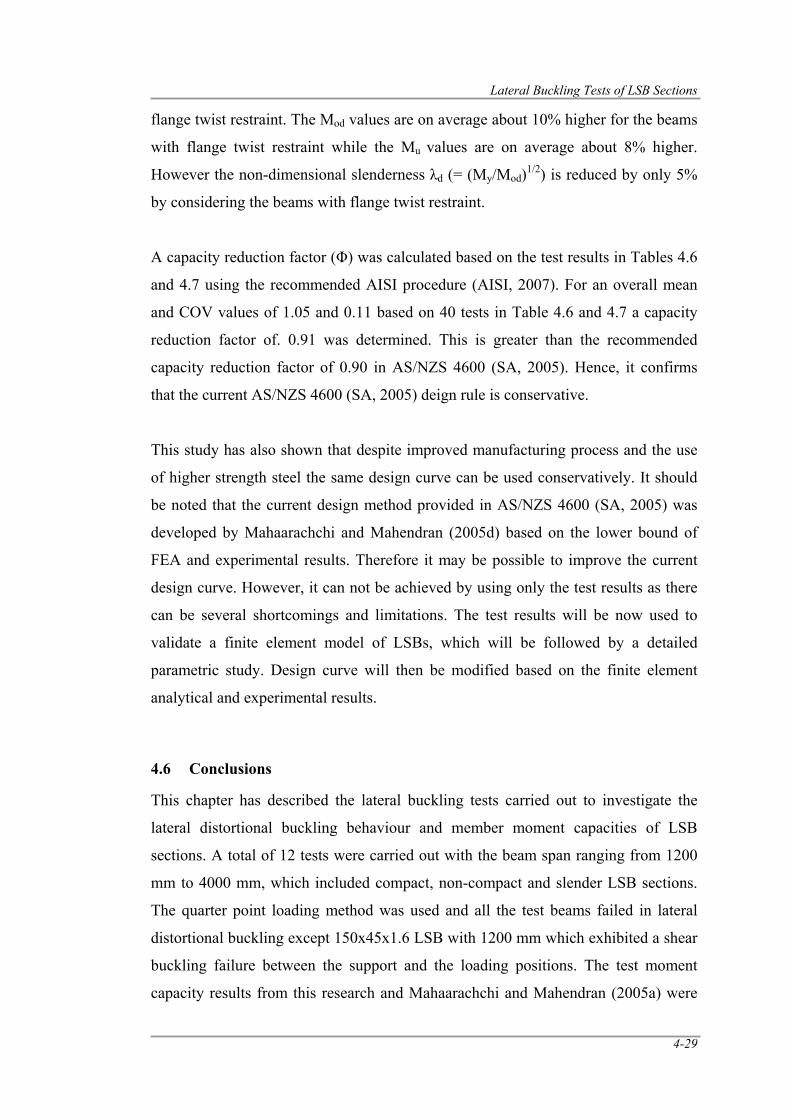
Lateral Buckling Tests of LSB Sections
4-29
flange twist restraint. The Mod values are on average about 10% higher for the beams
with flange twist restraint while the Mu values are on average about 8% higher.
However the non-dimensional slenderness λd (= (My/Mod)1/2) is reduced by only 5%
by considering the beams with flange twist restraint.
A capacity reduction factor (Φ) was calculated based on the test results in Tables 4.6
and 4.7 using the recommended AISI procedure (AISI, 2007). For an overall mean
and COV values of 1.05 and 0.11 based on 40 tests in Table 4.6 and 4.7 a capacity
reduction factor of. 0.91 was determined. This is greater than the recommended
capacity reduction factor of 0.90 in AS/NZS 4600 (SA, 2005). Hence, it confirms
that the current AS/NZS 4600 (SA, 2005) deign rule is conservative.
This study has also shown that despite improved manufacturing process and the use
of higher strength steel the same design curve can be used conservatively. It should
be noted that the current design method provided in AS/NZS 4600 (SA, 2005) was
developed by Mahaarachchi and Mahendran (2005d) based on the lower bound of
FEA and experimental results. Therefore it may be possible to improve the current
design curve. However, it can not be achieved by using only the test results as there
can be several shortcomings and limitations. The test results will be now used to
validate a finite element model of LSBs, which will be followed by a detailed
parametric study. Design curve will then be modified based on the finite element
analytical and experimental results.
4.6 Conclusions
This chapter has described the lateral buckling tests carried out to investigate the
lateral distortional buckling behaviour and member moment capacities of LSB
sections. A total of 12 tests were carried out with the beam span ranging from 1200
mm to 4000 mm, which included compact, non-compact and slender LSB sections.
The quarter point loading method was used and all the test beams failed in lateral
distortional buckling except 150x45x1.6 LSB with 1200 mm which exhibited a shear
buckling failure between the support and the loading positions. The test moment
capacity results from this research and Mahaarachchi and Mahendran (2005a) were
Lateral Buckling Tests of LSB Sections
4-30
compared with the predictions from the current design rules in AS/NZS 4600 (SA,
2005). It was found that the test moment capacity results from this research were on
average about 13% higher than the AS/NZS 4600 (SA, 2005) predictions while those
of Mahaarachchi and Mahendran (2005a) were on average about 3% higher than the
predictions from AS/NZS 4600 (SA, 2005). The use of accurate Mod values for some
test beams without flange twist restraint would have given higher ratios of test
capacity to AS/NZS 4600 prediction. Therefore it is considered that the current
AS/NZS 4600 (SA, 2005) design rule for lateral distortional buckling is considered
to be conservative for LSBs. Further research using finite element analyses is likely
to develop improved design rules for LSBs.
Finite Element Modelling of LSBs
5-1
CHAPTER 5
5.0 FINITE ELEMENT MODELLING OF LSBs SUBJECT TO LATERAL
BUCKLING EFFECTS
5.1 Introduction
Finite Element Analysis (FEA) plays an important role in any research as it is
relatively inexpensive and time efficient compared with physical experiments. It is
particularly useful when a detailed parametric study into the effects of section
geometry is involved. Lateral distortional buckling behaviour of hollow flange steel
beams, particularly LSB sections, the effects of their geometry on lateral distortional
buckling capacity and the section moment capacity of LSBs were investigated using
finite element analyses in this research. Mahaarachchi and Mahendran (2005c)
developed the first finite element model of LSBs. The accuracy of this model was
improved by Kurniawan (2007) and Parsons (2007a) in relation to the boundary
conditions and dimensions considered by Mahaarachchi and Mahendran (2005c).
Kurniawan (2007) developed two modified versions of LSB finite element model to
investigate the moment distribution and load height effects on the moment capacities
of LSBs. The final version developed by Kurniawan (2007) was found to be the most
appropriate for use in this research on the lateral distortional buckling moment
capacities of LSBs. This chapter presents a detailed description of the finite element
model used in this research, which is capable of simulating the significant
behavioural effects of material inelasticity, buckling deformations including web
distortion, member instability, residual stresses and geometric imperfections. The
results from both elastic buckling and non-linear static analyses of LSBs are
compared with the finite strip analysis and experimental results, respectively. Details
of those comparisons are also presented in this chapter.
5.2 Model Description
Two types of finite element models were considered in this research, namely the
ideal finite element models and the experimental finite element models. The purpose
and the description of these models are given next.
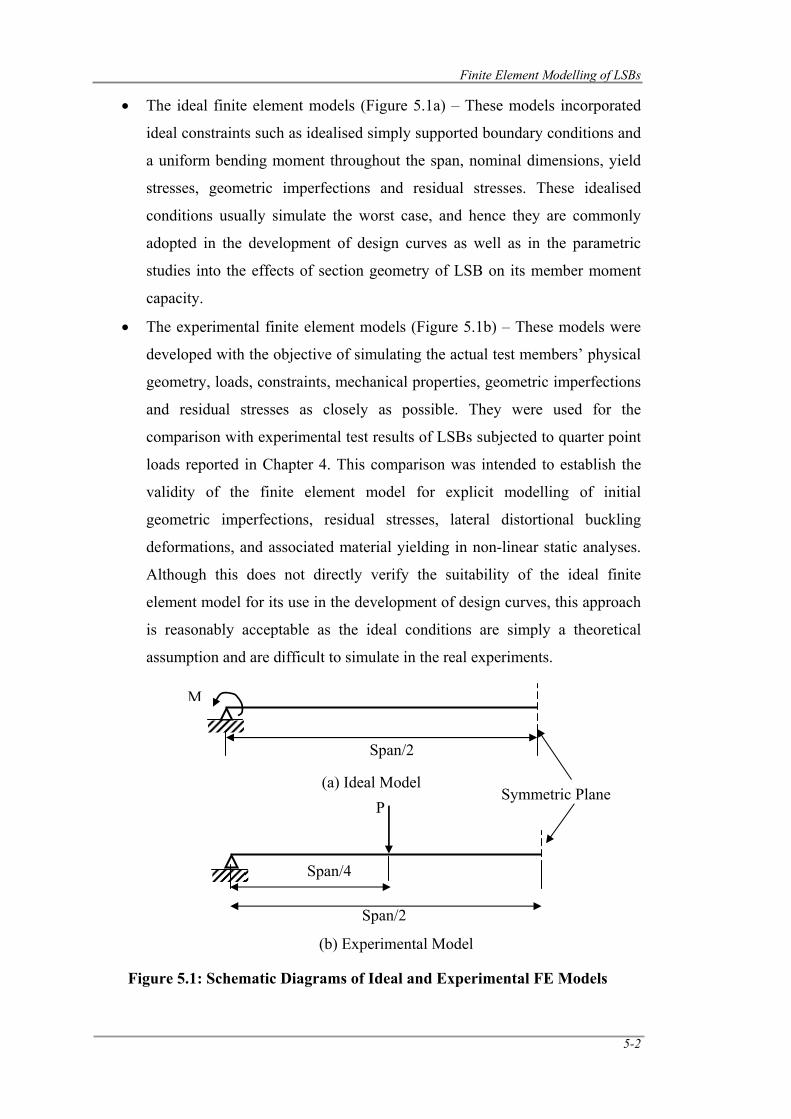
Finite Element Modelling of LSBs
5-2
• The ideal finite element models (Figure 5.1a) – These models incorporated
ideal constraints such as idealised simply supported boundary conditions and
a uniform bending moment throughout the span, nominal dimensions, yield
stresses, geometric imperfections and residual stresses. These idealised
conditions usually simulate the worst case, and hence they are commonly
adopted in the development of design curves as well as in the parametric
studies into the effects of section geometry of LSB on its member moment
capacity.
• The experimental finite element models (Figure 5.1b) – These models were
developed with the objective of simulating the actual test members’ physical
geometry, loads, constraints, mechanical properties, geometric imperfections
and residual stresses as closely as possible. They were used for the
comparison with experimental test results of LSBs subjected to quarter point
loads reported in Chapter 4. This comparison was intended to establish the
validity of the finite element model for explicit modelling of initial
geometric imperfections, residual stresses, lateral distortional buckling
deformations, and associated material yielding in non-linear static analyses.
Although this does not directly verify the suitability of the ideal finite
element model for its use in the development of design curves, this approach
is reasonably acceptable as the ideal conditions are simply a theoretical
assumption and are difficult to simulate in the real experiments.
Figure 5.1: Schematic Diagrams of Ideal and Experimental FE Models
Span/2
P
Span/4
(b) Experimental Model
Span/2
M
(a) Ideal Model Symmetric Plane
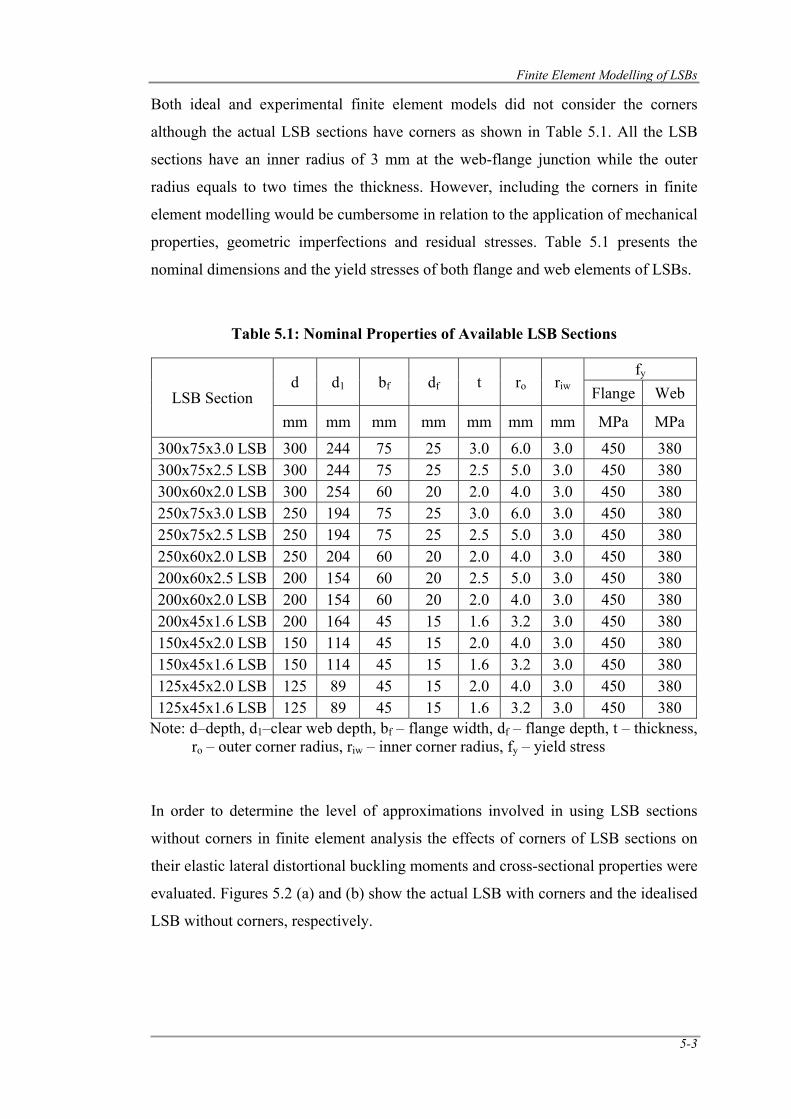
Finite Element Modelling of LSBs
5-3
Both ideal and experimental finite element models did not consider the corners
although the actual LSB sections have corners as shown in Table 5.1. All the LSB
sections have an inner radius of 3 mm at the web-flange junction while the outer
radius equals to two times the thickness. However, including the corners in finite
element modelling would be cumbersome in relation to the application of mechanical
properties, geometric imperfections and residual stresses. Table 5.1 presents the
nominal dimensions and the yield stresses of both flange and web elements of LSBs.
Table 5.1: Nominal Properties of Available LSB Sections
LSB Section d d1 bf df t ro riw
fy Flange Web
mm mm mm mm mm mm mm MPa MPa
300x75x3.0 LSB 300 244 75 25 3.0 6.0 3.0 450 380 300x75x2.5 LSB 300 244 75 25 2.5 5.0 3.0 450 380 300x60x2.0 LSB 300 254 60 20 2.0 4.0 3.0 450 380 250x75x3.0 LSB 250 194 75 25 3.0 6.0 3.0 450 380 250x75x2.5 LSB 250 194 75 25 2.5 5.0 3.0 450 380 250x60x2.0 LSB 250 204 60 20 2.0 4.0 3.0 450 380 200x60x2.5 LSB 200 154 60 20 2.5 5.0 3.0 450 380 200x60x2.0 LSB 200 154 60 20 2.0 4.0 3.0 450 380 200x45x1.6 LSB 200 164 45 15 1.6 3.2 3.0 450 380 150x45x2.0 LSB 150 114 45 15 2.0 4.0 3.0 450 380 150x45x1.6 LSB 150 114 45 15 1.6 3.2 3.0 450 380 125x45x2.0 LSB 125 89 45 15 2.0 4.0 3.0 450 380 125x45x1.6 LSB 125 89 45 15 1.6 3.2 3.0 450 380
Note: d–depth, d1–clear web depth, bf – flange width, df – flange depth, t – thickness, ro – outer corner radius, riw – inner corner radius, fy – yield stress
In order to determine the level of approximations involved in using LSB sections
without corners in finite element analysis the effects of corners of LSB sections on
their elastic lateral distortional buckling moments and cross-sectional properties were
evaluated. Figures 5.2 (a) and (b) show the actual LSB with corners and the idealised
LSB without corners, respectively.
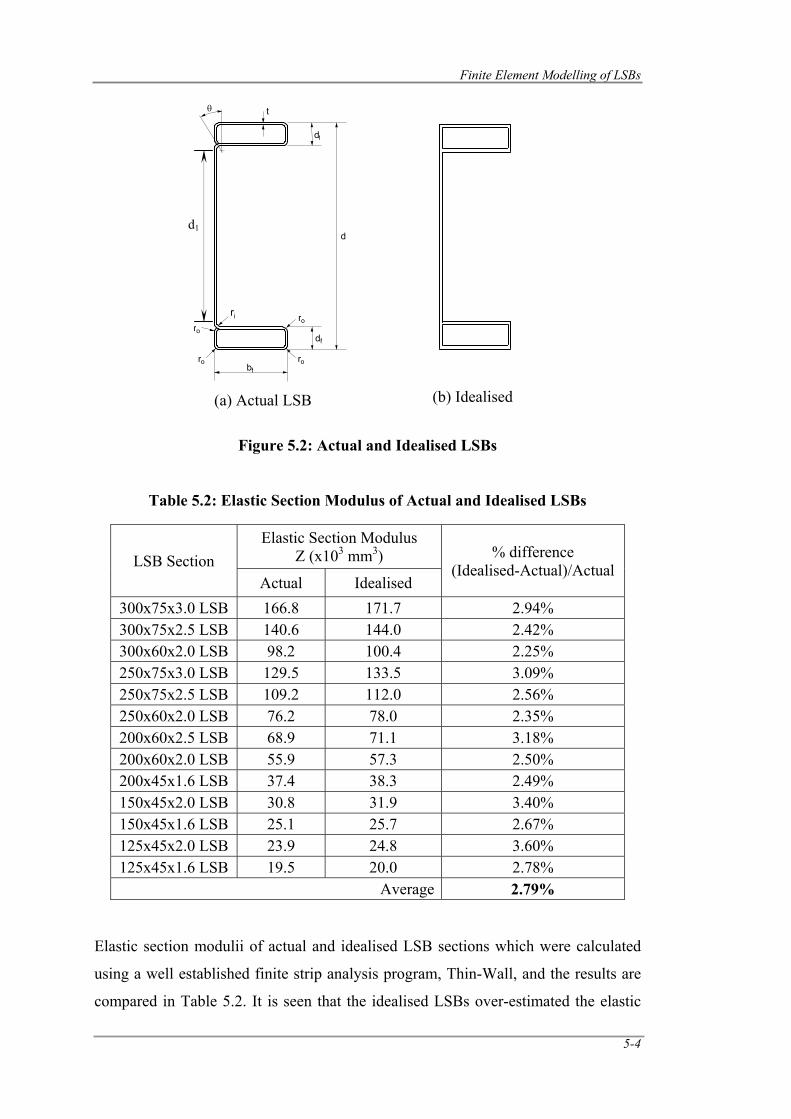
Finite Element Modelling of LSBs
5-4
Figure 5.2: Actual and Idealised LSBs
Table 5.2: Elastic Section Modulus of Actual and Idealised LSBs
LSB Section Elastic Section Modulus
Z (x103 mm3) % difference (Idealised-Actual)/Actual
Actual Idealised 300x75x3.0 LSB 166.8 171.7 2.94% 300x75x2.5 LSB 140.6 144.0 2.42% 300x60x2.0 LSB 98.2 100.4 2.25% 250x75x3.0 LSB 129.5 133.5 3.09% 250x75x2.5 LSB 109.2 112.0 2.56% 250x60x2.0 LSB 76.2 78.0 2.35% 200x60x2.5 LSB 68.9 71.1 3.18% 200x60x2.0 LSB 55.9 57.3 2.50% 200x45x1.6 LSB 37.4 38.3 2.49% 150x45x2.0 LSB 30.8 31.9 3.40% 150x45x1.6 LSB 25.1 25.7 2.67% 125x45x2.0 LSB 23.9 24.8 3.60% 125x45x1.6 LSB 19.5 20.0 2.78%
Average 2.79%
Elastic section modulii of actual and idealised LSB sections which were calculated
using a well established finite strip analysis program, Thin-Wall, and the results are
compared in Table 5.2. It is seen that the idealised LSBs over-estimated the elastic
d1
ri
ro
ro ro
robf
df
d
df
t θ
(a) Actual LSB (b) Idealised
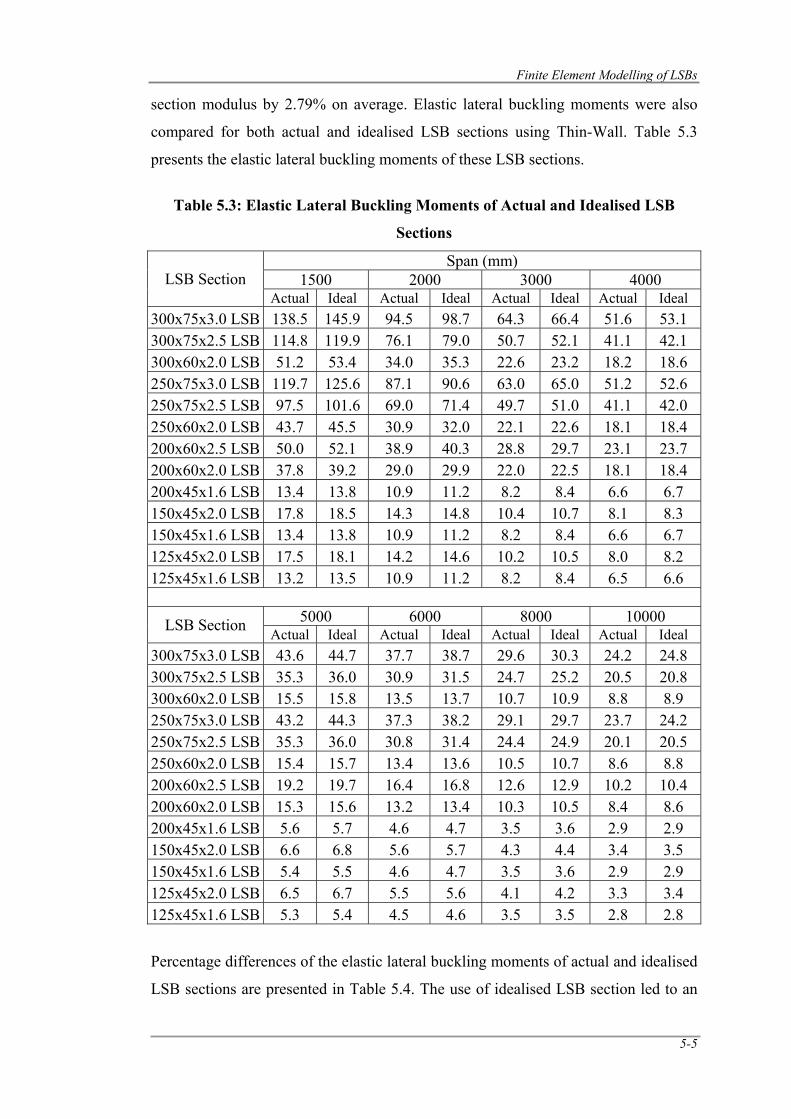
Finite Element Modelling of LSBs
5-5
section modulus by 2.79% on average. Elastic lateral buckling moments were also
compared for both actual and idealised LSB sections using Thin-Wall. Table 5.3
presents the elastic lateral buckling moments of these LSB sections.
Table 5.3: Elastic Lateral Buckling Moments of Actual and Idealised LSB
Sections
LSB Section Span (mm)
1500 2000 3000 4000 Actual Ideal Actual Ideal Actual Ideal Actual Ideal
300x75x3.0 LSB 138.5 145.9 94.5 98.7 64.3 66.4 51.6 53.1 300x75x2.5 LSB 114.8 119.9 76.1 79.0 50.7 52.1 41.1 42.1 300x60x2.0 LSB 51.2 53.4 34.0 35.3 22.6 23.2 18.2 18.6 250x75x3.0 LSB 119.7 125.6 87.1 90.6 63.0 65.0 51.2 52.6 250x75x2.5 LSB 97.5 101.6 69.0 71.4 49.7 51.0 41.1 42.0 250x60x2.0 LSB 43.7 45.5 30.9 32.0 22.1 22.6 18.1 18.4 200x60x2.5 LSB 50.0 52.1 38.9 40.3 28.8 29.7 23.1 23.7 200x60x2.0 LSB 37.8 39.2 29.0 29.9 22.0 22.5 18.1 18.4 200x45x1.6 LSB 13.4 13.8 10.9 11.2 8.2 8.4 6.6 6.7 150x45x2.0 LSB 17.8 18.5 14.3 14.8 10.4 10.7 8.1 8.3 150x45x1.6 LSB 13.4 13.8 10.9 11.2 8.2 8.4 6.6 6.7 125x45x2.0 LSB 17.5 18.1 14.2 14.6 10.2 10.5 8.0 8.2 125x45x1.6 LSB 13.2 13.5 10.9 11.2 8.2 8.4 6.5 6.6
LSB Section 5000 6000 8000 10000 Actual Ideal Actual Ideal Actual Ideal Actual Ideal
300x75x3.0 LSB 43.6 44.7 37.7 38.7 29.6 30.3 24.2 24.8 300x75x2.5 LSB 35.3 36.0 30.9 31.5 24.7 25.2 20.5 20.8 300x60x2.0 LSB 15.5 15.8 13.5 13.7 10.7 10.9 8.8 8.9 250x75x3.0 LSB 43.2 44.3 37.3 38.2 29.1 29.7 23.7 24.2 250x75x2.5 LSB 35.3 36.0 30.8 31.4 24.4 24.9 20.1 20.5 250x60x2.0 LSB 15.4 15.7 13.4 13.6 10.5 10.7 8.6 8.8 200x60x2.5 LSB 19.2 19.7 16.4 16.8 12.6 12.9 10.2 10.4 200x60x2.0 LSB 15.3 15.6 13.2 13.4 10.3 10.5 8.4 8.6 200x45x1.6 LSB 5.6 5.7 4.6 4.7 3.5 3.6 2.9 2.9 150x45x2.0 LSB 6.6 6.8 5.6 5.7 4.3 4.4 3.4 3.5 150x45x1.6 LSB 5.4 5.5 4.6 4.7 3.5 3.6 2.9 2.9 125x45x2.0 LSB 6.5 6.7 5.5 5.6 4.1 4.2 3.3 3.4 125x45x1.6 LSB 5.3 5.4 4.5 4.6 3.5 3.5 2.8 2.8
Percentage differences of the elastic lateral buckling moments of actual and idealised
LSB sections are presented in Table 5.4. The use of idealised LSB section led to an
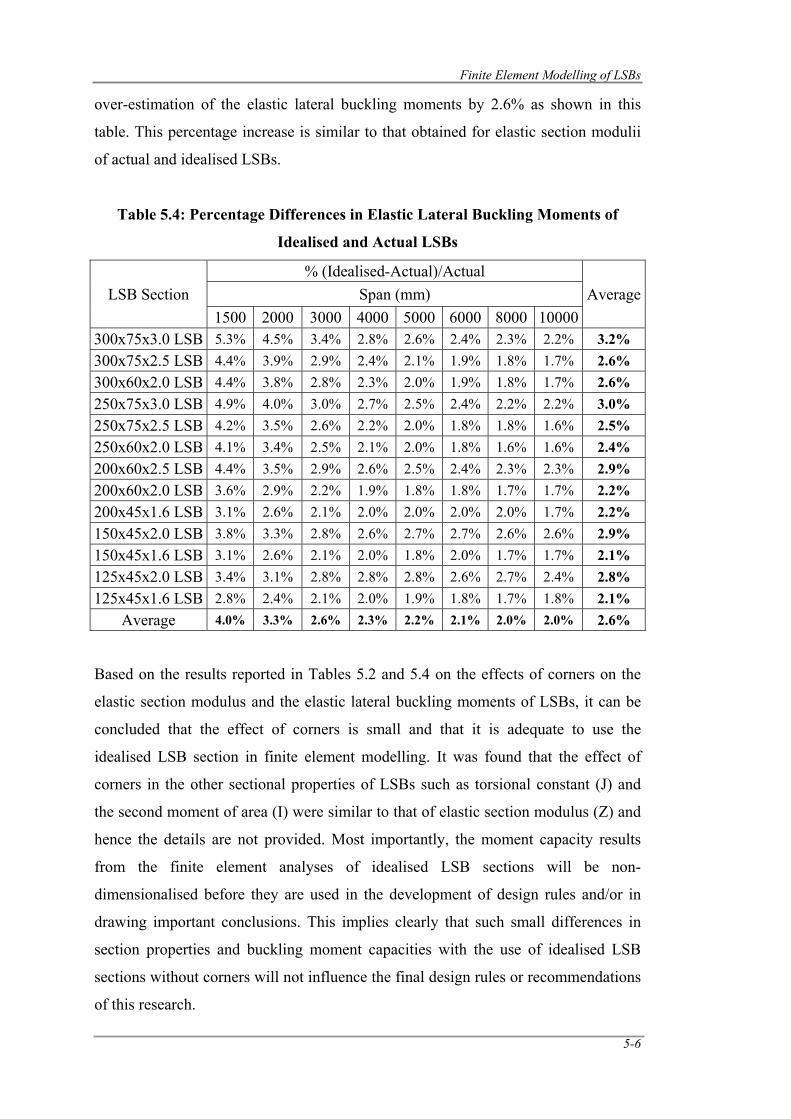
Finite Element Modelling of LSBs
5-6
over-estimation of the elastic lateral buckling moments by 2.6% as shown in this
table. This percentage increase is similar to that obtained for elastic section modulii
of actual and idealised LSBs.
Table 5.4: Percentage Differences in Elastic Lateral Buckling Moments of
Idealised and Actual LSBs
LSB Section % (Idealised-Actual)/Actual
Average Span (mm) 1500 2000 3000 4000 5000 6000 8000 10000
300x75x3.0 LSB 5.3% 4.5% 3.4% 2.8% 2.6% 2.4% 2.3% 2.2% 3.2% 300x75x2.5 LSB 4.4% 3.9% 2.9% 2.4% 2.1% 1.9% 1.8% 1.7% 2.6% 300x60x2.0 LSB 4.4% 3.8% 2.8% 2.3% 2.0% 1.9% 1.8% 1.7% 2.6% 250x75x3.0 LSB 4.9% 4.0% 3.0% 2.7% 2.5% 2.4% 2.2% 2.2% 3.0% 250x75x2.5 LSB 4.2% 3.5% 2.6% 2.2% 2.0% 1.8% 1.8% 1.6% 2.5% 250x60x2.0 LSB 4.1% 3.4% 2.5% 2.1% 2.0% 1.8% 1.6% 1.6% 2.4% 200x60x2.5 LSB 4.4% 3.5% 2.9% 2.6% 2.5% 2.4% 2.3% 2.3% 2.9% 200x60x2.0 LSB 3.6% 2.9% 2.2% 1.9% 1.8% 1.8% 1.7% 1.7% 2.2% 200x45x1.6 LSB 3.1% 2.6% 2.1% 2.0% 2.0% 2.0% 2.0% 1.7% 2.2% 150x45x2.0 LSB 3.8% 3.3% 2.8% 2.6% 2.7% 2.7% 2.6% 2.6% 2.9% 150x45x1.6 LSB 3.1% 2.6% 2.1% 2.0% 1.8% 2.0% 1.7% 1.7% 2.1% 125x45x2.0 LSB 3.4% 3.1% 2.8% 2.8% 2.8% 2.6% 2.7% 2.4% 2.8% 125x45x1.6 LSB 2.8% 2.4% 2.1% 2.0% 1.9% 1.8% 1.7% 1.8% 2.1%
Average 4.0% 3.3% 2.6% 2.3% 2.2% 2.1% 2.0% 2.0% 2.6% Based on the results reported in Tables 5.2 and 5.4 on the effects of corners on the
elastic section modulus and the elastic lateral buckling moments of LSBs, it can be
concluded that the effect of corners is small and that it is adequate to use the
idealised LSB section in finite element modelling. It was found that the effect of
corners in the other sectional properties of LSBs such as torsional constant (J) and
the second moment of area (I) were similar to that of elastic section modulus (Z) and
hence the details are not provided. Most importantly, the moment capacity results
from the finite element analyses of idealised LSB sections will be non-
dimensionalised before they are used in the development of design rules and/or in
drawing important conclusions. This implies clearly that such small differences in
section properties and buckling moment capacities with the use of idealised LSB
sections without corners will not influence the final design rules or recommendations
of this research.
Finite Element Modelling of LSBs
5-7
Both ideal and experimental finite element models were developed using MD
PATRAN (MSC Software, 2008) pre-processing facilities while they were analysed
using ABAQUS (HKS, 2007). MD/PATRAN (MSC Software, 2008) post-processing
facilities were then used to view the results from the ABAQUS analyses.
5.2.1 Discretization of the Finite Element Mesh
Shell elements are generally used to model thin-walled structures. ABAQUS (HKS,
2007) includes general purpose shell elements as well as elements that are
specifically formulated to analyse ‘thick’ and ‘thin’ shell problems. The general
purpose shell elements provide robust and accurate solutions in most applications
and have the capability of providing sufficient degrees of freedom. Therefore, local
buckling deformations and spread of plasticity could be explicitly modelled. The
shell element in ABAQUS (HKS, 2007) called S4R5 was used to develop the LSB
model. This element is thin, shear flexible, isometric quadrilateral shell with four
nodes and five degrees of freedom per node, utilizing reduced integration and
bilinear interpolation scheme.
One of the most important aspects of finite element modelling is to identify a suitable
mesh size for the accurate modelling of structural response. Finer meshes are
generally preferred to obtain accurate predictions although there is no general
guidelines on the required mesh density, which depends on the type of structure and
analysis involved (Ashraf et al., 2006). But finer meshes make the whole process
more expensive in terms of computational time. A compromise is therefore required
between the level of accuracy and the cost of a solution. Convergence study by
Mahaarachchi and Mahendran (2005c) indicated that a minimum mesh size density
comprising of 5 mm × 10 mm elements was required to represent accurate residual
stress distributions, spread of plasticity, and local buckling deformations of LSB
sections. Element widths equal to or less than 5 mm and a length of 10 mm were
selected as the suitable mesh size for the entire cross-section. Nine integration points
through the thickness of the elements were used to model the distribution of flexural
residual stresses in the LSB sections and the spread of plasticity through the
thickness of the shell elements. Kurniawan (2007) also used the same mesh size and
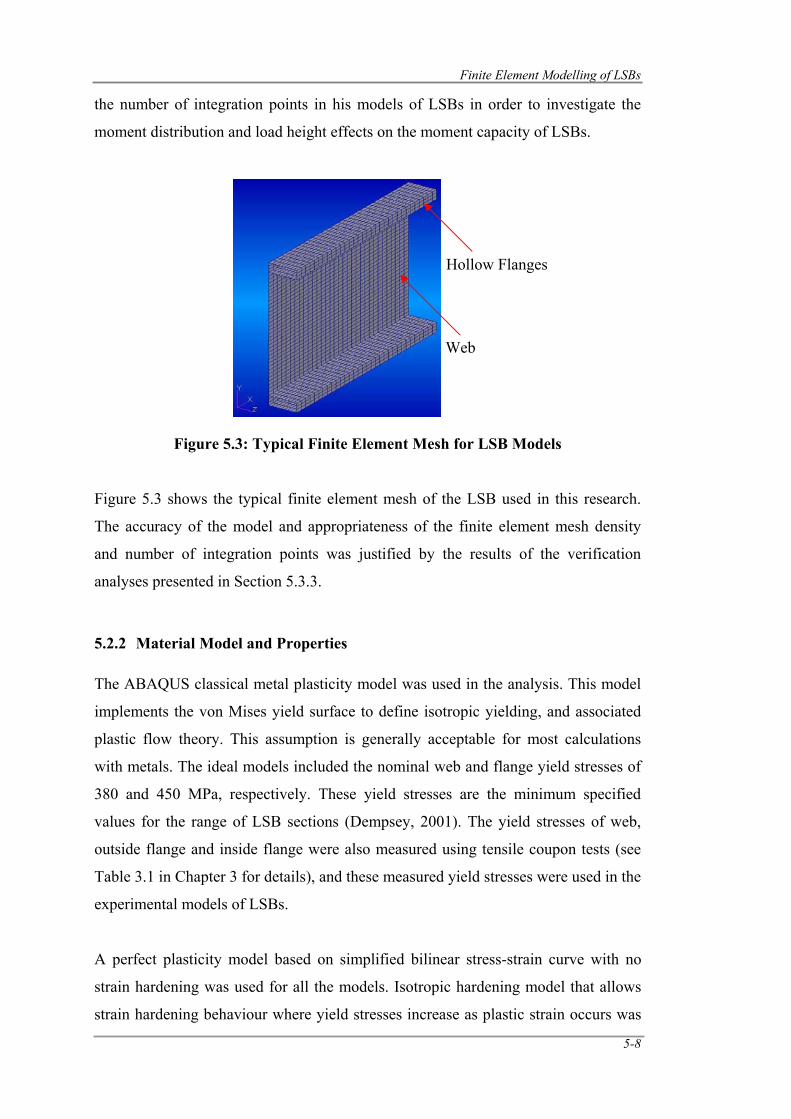
Finite Element Modelling of LSBs
5-8
the number of integration points in his models of LSBs in order to investigate the
moment distribution and load height effects on the moment capacity of LSBs.
Figure 5.3: Typical Finite Element Mesh for LSB Models
Figure 5.3 shows the typical finite element mesh of the LSB used in this research.
The accuracy of the model and appropriateness of the finite element mesh density
and number of integration points was justified by the results of the verification
analyses presented in Section 5.3.3.
5.2.2 Material Model and Properties
The ABAQUS classical metal plasticity model was used in the analysis. This model
implements the von Mises yield surface to define isotropic yielding, and associated
plastic flow theory. This assumption is generally acceptable for most calculations
with metals. The ideal models included the nominal web and flange yield stresses of
380 and 450 MPa, respectively. These yield stresses are the minimum specified
values for the range of LSB sections (Dempsey, 2001). The yield stresses of web,
outside flange and inside flange were also measured using tensile coupon tests (see
Table 3.1 in Chapter 3 for details), and these measured yield stresses were used in the
experimental models of LSBs.
A perfect plasticity model based on simplified bilinear stress-strain curve with no
strain hardening was used for all the models. Isotropic hardening model that allows
strain hardening behaviour where yield stresses increase as plastic strain occurs was
Hollow Flanges
Web
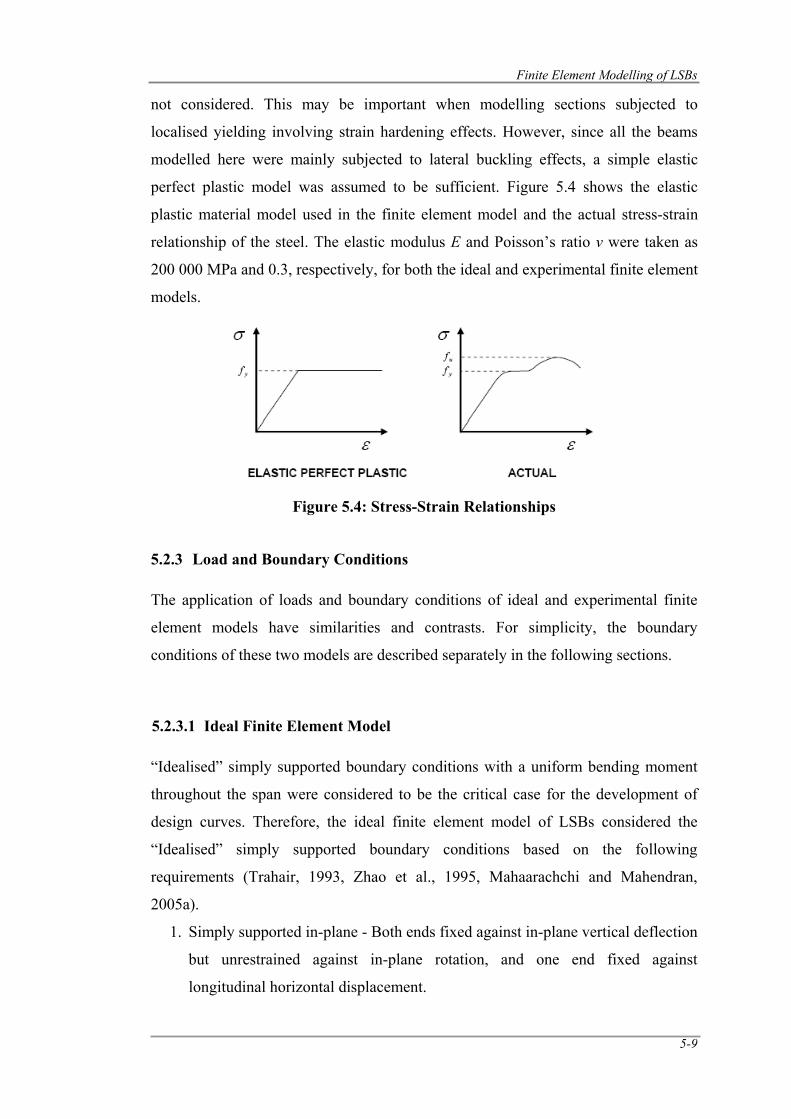
Finite Element Modelling of LSBs
5-9
not considered. This may be important when modelling sections subjected to
localised yielding involving strain hardening effects. However, since all the beams
modelled here were mainly subjected to lateral buckling effects, a simple elastic
perfect plastic model was assumed to be sufficient. Figure 5.4 shows the elastic
plastic material model used in the finite element model and the actual stress-strain
relationship of the steel. The elastic modulus E and Poisson’s ratio ν were taken as
200 000 MPa and 0.3, respectively, for both the ideal and experimental finite element
models.
Figure 5.4: Stress-Strain Relationships
5.2.3 Load and Boundary Conditions
The application of loads and boundary conditions of ideal and experimental finite
element models have similarities and contrasts. For simplicity, the boundary
conditions of these two models are described separately in the following sections.
5.2.3.1 Ideal Finite Element Model
“Idealised” simply supported boundary conditions with a uniform bending moment
throughout the span were considered to be the critical case for the development of
design curves. Therefore, the ideal finite element model of LSBs considered the
“Idealised” simply supported boundary conditions based on the following
requirements (Trahair, 1993, Zhao et al., 1995, Mahaarachchi and Mahendran,
2005a).
1. Simply supported in-plane - Both ends fixed against in-plane vertical deflection
but unrestrained against in-plane rotation, and one end fixed against
longitudinal horizontal displacement.
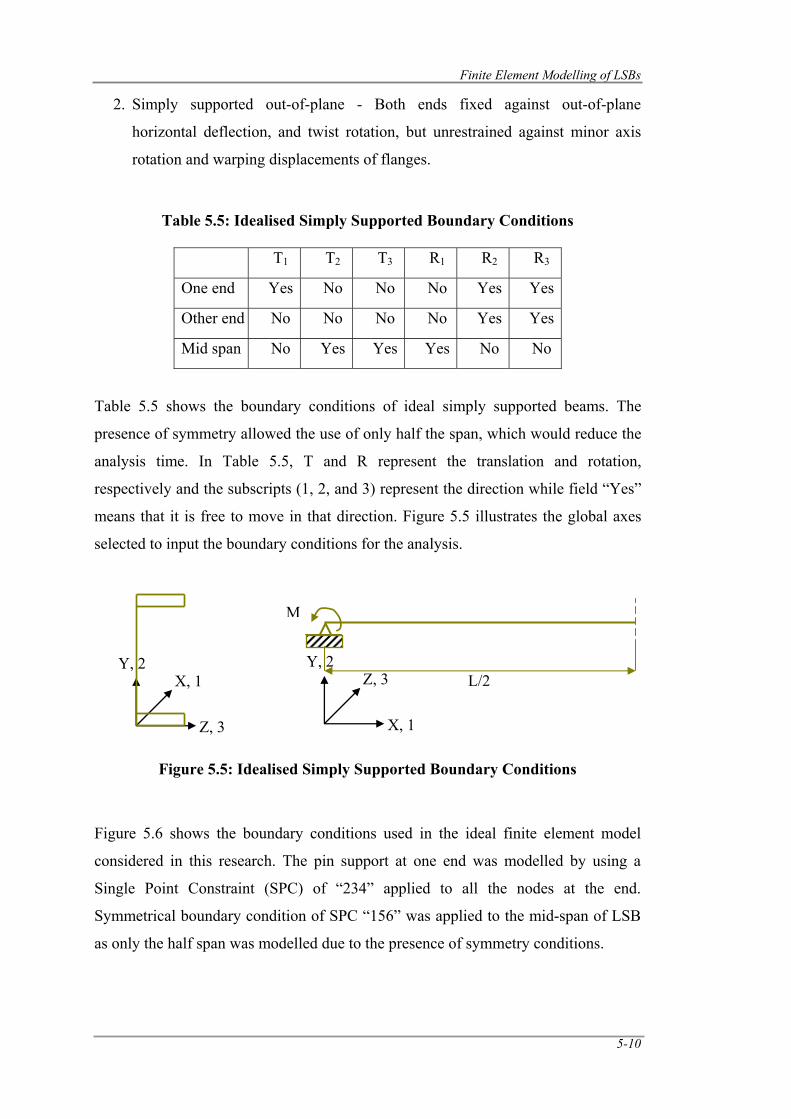
Finite Element Modelling of LSBs
5-10
2. Simply supported out-of-plane - Both ends fixed against out-of-plane
horizontal deflection, and twist rotation, but unrestrained against minor axis
rotation and warping displacements of flanges.
Table 5.5: Idealised Simply Supported Boundary Conditions
T1 T2 T3 R1 R2 R3
One end Yes No No No Yes Yes
Other end No No No No Yes Yes
Mid span No Yes Yes Yes No No
Table 5.5 shows the boundary conditions of ideal simply supported beams. The
presence of symmetry allowed the use of only half the span, which would reduce the
analysis time. In Table 5.5, T and R represent the translation and rotation,
respectively and the subscripts (1, 2, and 3) represent the direction while field “Yes”
means that it is free to move in that direction. Figure 5.5 illustrates the global axes
selected to input the boundary conditions for the analysis.
Figure 5.5: Idealised Simply Supported Boundary Conditions
Figure 5.6 shows the boundary conditions used in the ideal finite element model
considered in this research. The pin support at one end was modelled by using a
Single Point Constraint (SPC) of “234” applied to all the nodes at the end.
Symmetrical boundary condition of SPC “156” was applied to the mid-span of LSB
as only the half span was modelled due to the presence of symmetry conditions.
X, 1
Z, 3
Y, 2 Z, 3
X, 1
Y, 2
M
L/2
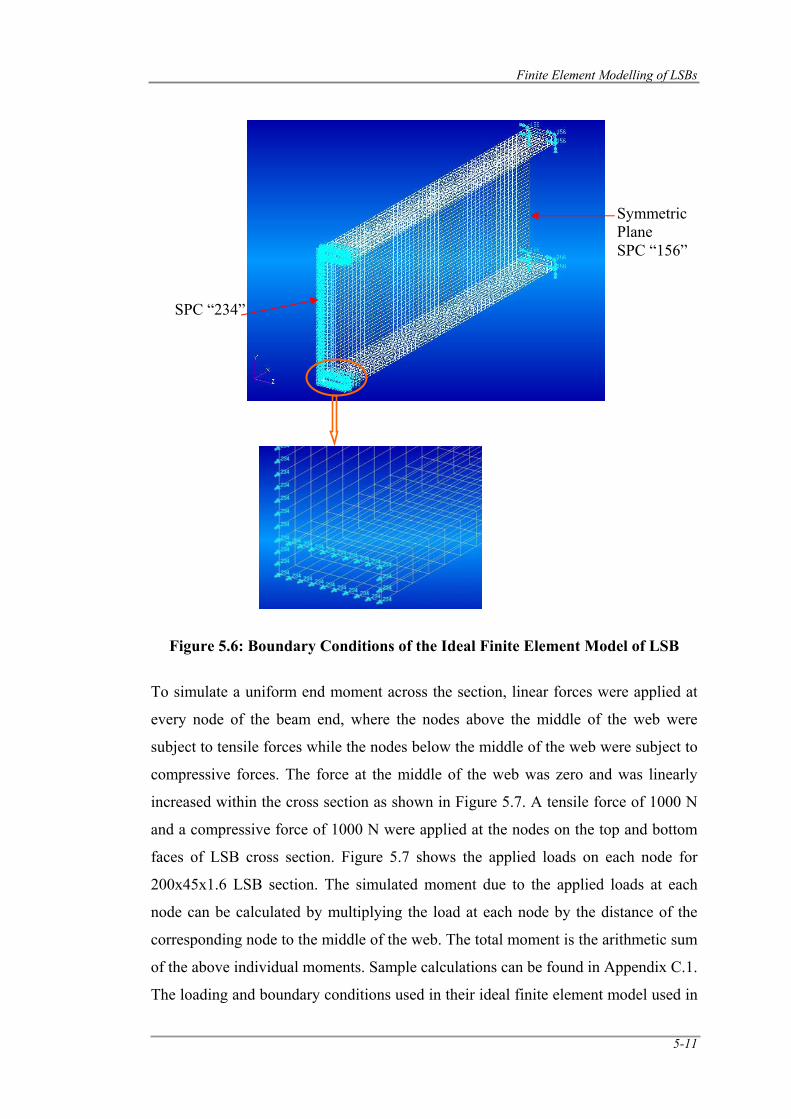
Finite Element Modelling of LSBs
5-11
Figure 5.6: Boundary Conditions of the Ideal Finite Element Model of LSB
To simulate a uniform end moment across the section, linear forces were applied at
every node of the beam end, where the nodes above the middle of the web were
subject to tensile forces while the nodes below the middle of the web were subject to
compressive forces. The force at the middle of the web was zero and was linearly
increased within the cross section as shown in Figure 5.7. A tensile force of 1000 N
and a compressive force of 1000 N were applied at the nodes on the top and bottom
faces of LSB cross section. Figure 5.7 shows the applied loads on each node for
200x45x1.6 LSB section. The simulated moment due to the applied loads at each
node can be calculated by multiplying the load at each node by the distance of the
corresponding node to the middle of the web. The total moment is the arithmetic sum
of the above individual moments. Sample calculations can be found in Appendix C.1.
The loading and boundary conditions used in their ideal finite element model used in
SPC “234”
Symmetric Plane SPC “156”
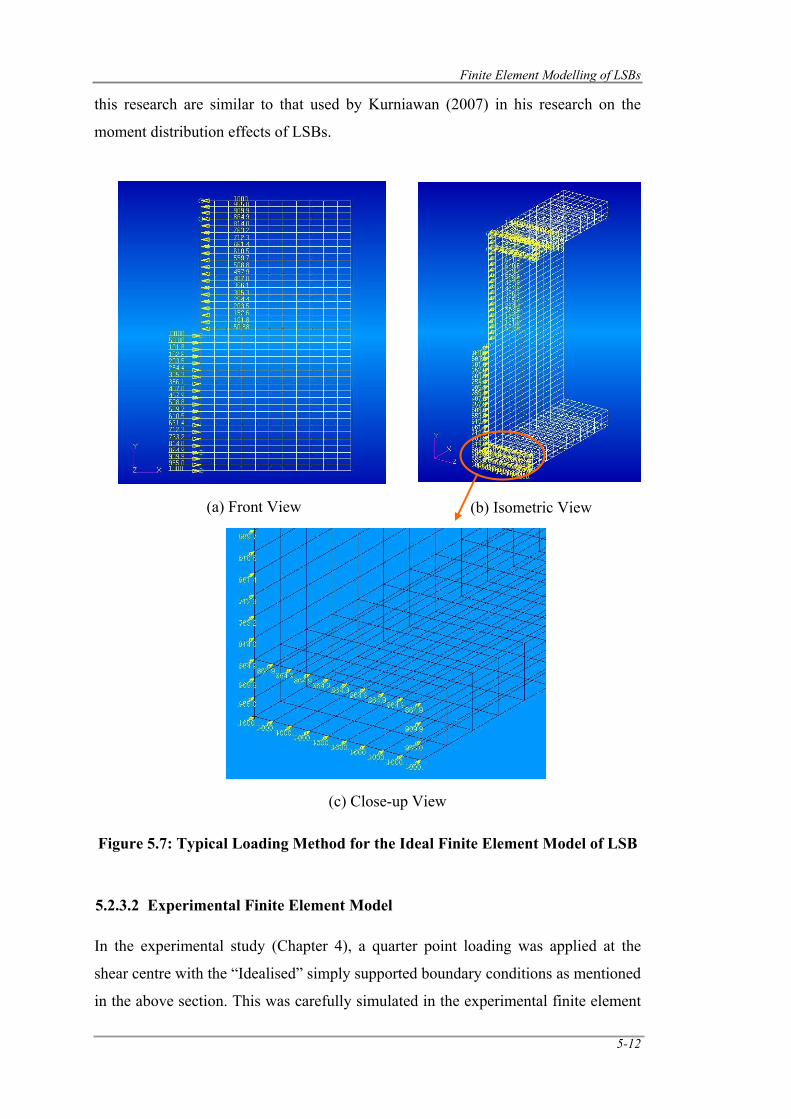
Finite Element Modelling of LSBs
5-12
this research are similar to that used by Kurniawan (2007) in his research on the
moment distribution effects of LSBs.
Figure 5.7: Typical Loading Method for the Ideal Finite Element Model of LSB
5.2.3.2 Experimental Finite Element Model
In the experimental study (Chapter 4), a quarter point loading was applied at the
shear centre with the “Idealised” simply supported boundary conditions as mentioned
in the above section. This was carefully simulated in the experimental finite element
(a) Front View (b) Isometric View
(c) Close-up View
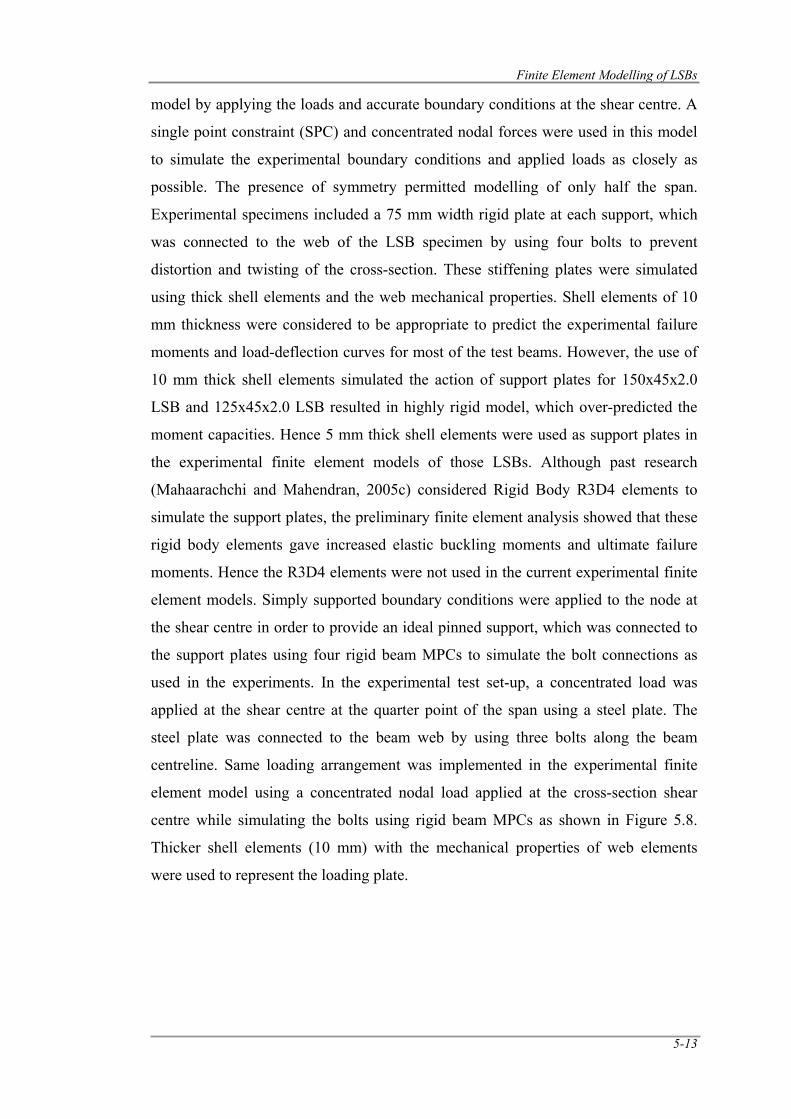
Finite Element Modelling of LSBs
5-13
model by applying the loads and accurate boundary conditions at the shear centre. A
single point constraint (SPC) and concentrated nodal forces were used in this model
to simulate the experimental boundary conditions and applied loads as closely as
possible. The presence of symmetry permitted modelling of only half the span.
Experimental specimens included a 75 mm width rigid plate at each support, which
was connected to the web of the LSB specimen by using four bolts to prevent
distortion and twisting of the cross-section. These stiffening plates were simulated
using thick shell elements and the web mechanical properties. Shell elements of 10
mm thickness were considered to be appropriate to predict the experimental failure
moments and load-deflection curves for most of the test beams. However, the use of
10 mm thick shell elements simulated the action of support plates for 150x45x2.0
LSB and 125x45x2.0 LSB resulted in highly rigid model, which over-predicted the
moment capacities. Hence 5 mm thick shell elements were used as support plates in
the experimental finite element models of those LSBs. Although past research
(Mahaarachchi and Mahendran, 2005c) considered Rigid Body R3D4 elements to
simulate the support plates, the preliminary finite element analysis showed that these
rigid body elements gave increased elastic buckling moments and ultimate failure
moments. Hence the R3D4 elements were not used in the current experimental finite
element models. Simply supported boundary conditions were applied to the node at
the shear centre in order to provide an ideal pinned support, which was connected to
the support plates using four rigid beam MPCs to simulate the bolt connections as
used in the experiments. In the experimental test set-up, a concentrated load was
applied at the shear centre at the quarter point of the span using a steel plate. The
steel plate was connected to the beam web by using three bolts along the beam
centreline. Same loading arrangement was implemented in the experimental finite
element model using a concentrated nodal load applied at the cross-section shear
centre while simulating the bolts using rigid beam MPCs as shown in Figure 5.8.
Thicker shell elements (10 mm) with the mechanical properties of web elements
were used to represent the loading plate.
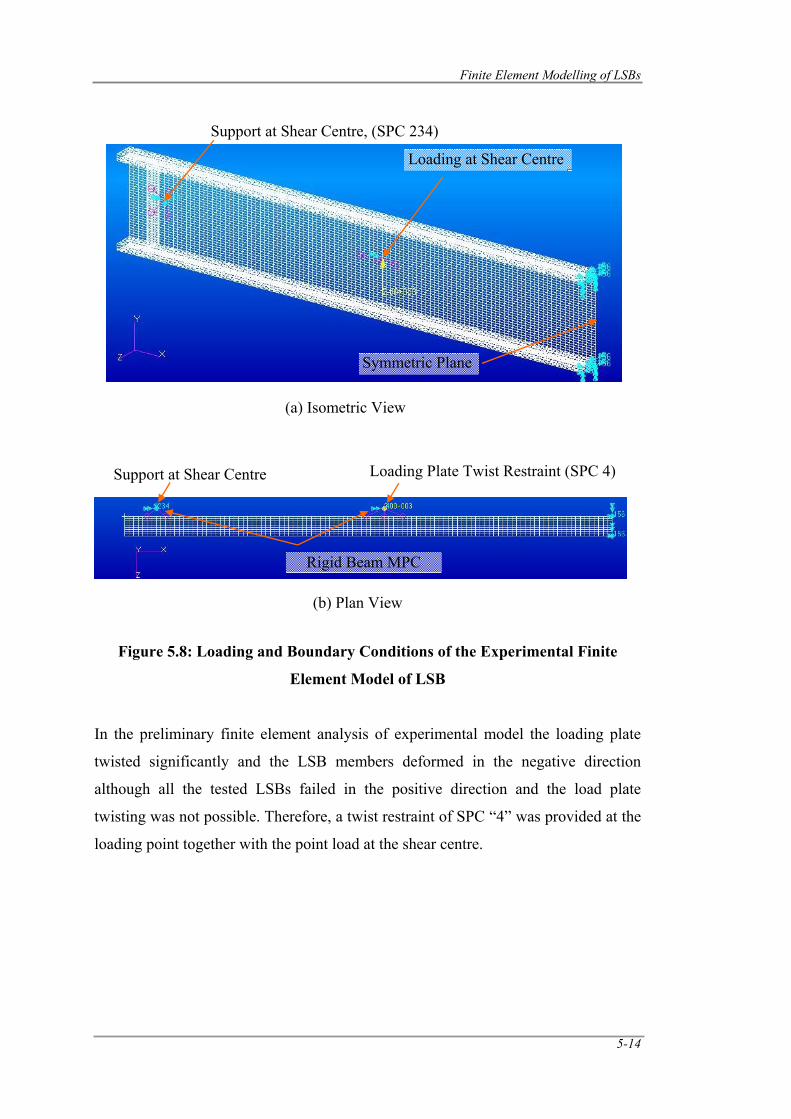
Finite Element Modelling of LSBs
5-14
Figure 5.8: Loading and Boundary Conditions of the Experimental Finite
Element Model of LSB
In the preliminary finite element analysis of experimental model the loading plate
twisted significantly and the LSB members deformed in the negative direction
although all the tested LSBs failed in the positive direction and the load plate
twisting was not possible. Therefore, a twist restraint of SPC “4” was provided at the
loading point together with the point load at the shear centre.
(a) Isometric View
Support at Shear Centre, (SPC 234)
Symmetric Plane
Loading at Shear Centre
Support at Shear Centre
(b) Plan View
Loading Plate Twist Restraint (SPC 4)
Rigid Beam MPC
Finite Element Modelling of LSBs
5-15
Figure 5.9: Loading Plate Twisting in the Experimental FE Model
Figure 5.9 shows the typical loading plate twisting observed in the experimental
finite element models of LSBs at ultimate failure. This is not possible and was
eliminated by restraining the degree of freedom “4” (rotation about the longitudinal
axis).
Steel stiffener plates of 6 mm thickness were welded to the inner surfaces of the
flanges at each support as flange twist restraints in the experimental testing except
the first four tests. These plates were modelled in the experimental finite element
model using the elastic perfect plastic material model and a yield stress of 300 MPa.
Welding process was not simulated as this was a “tack” weld and the effects are
negligible. Also the maximum bending moment occurred at mid-span while the
moment at the support was zero. Therefore a small change in the residual stress and
imperfection due to welding (if any) would not create any adverse effects on the
ultimate failure of the beam. Figure 5.10 identifies the various plate elements with
different mechanical material properties as defined in ABAQUS. Measured
dimensions and yield stresses were used for both the web and flange elements of
LSBs.
It should be noted that the first four tests did not include the stiffener plates
mentioned above and hence their experiment models did not include the flange twist
restraints.
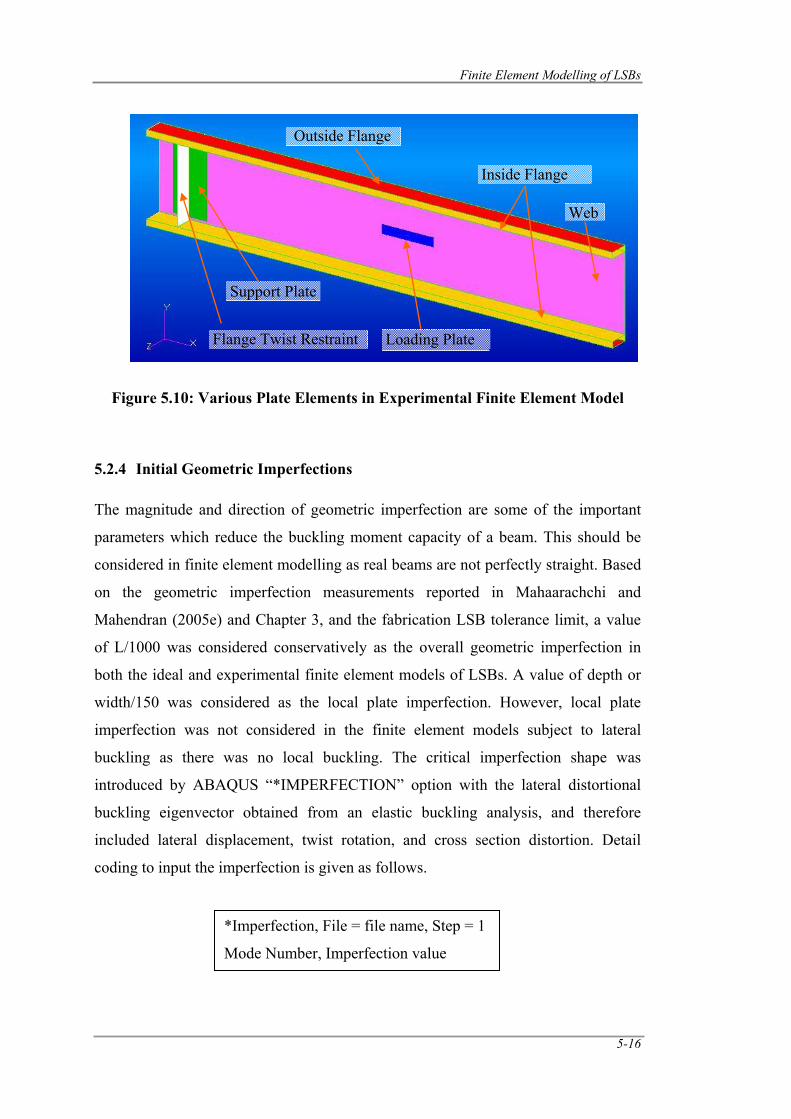
Finite Element Modelling of LSBs
5-16
Figure 5.10: Various Plate Elements in Experimental Finite Element Model
5.2.4 Initial Geometric Imperfections
The magnitude and direction of geometric imperfection are some of the important
parameters which reduce the buckling moment capacity of a beam. This should be
considered in finite element modelling as real beams are not perfectly straight. Based
on the geometric imperfection measurements reported in Mahaarachchi and
Mahendran (2005e) and Chapter 3, and the fabrication LSB tolerance limit, a value
of L/1000 was considered conservatively as the overall geometric imperfection in
both the ideal and experimental finite element models of LSBs. A value of depth or
width/150 was considered as the local plate imperfection. However, local plate
imperfection was not considered in the finite element models subject to lateral
buckling as there was no local buckling. The critical imperfection shape was
introduced by ABAQUS “*IMPERFECTION” option with the lateral distortional
buckling eigenvector obtained from an elastic buckling analysis, and therefore
included lateral displacement, twist rotation, and cross section distortion. Detail
coding to input the imperfection is given as follows.
Outside Flange
Inside Flange
Loading Plate
Support Plate
Flange Twist Restraint
Web
*Imperfection, File = file name, Step = 1
Mode Number, Imperfection value
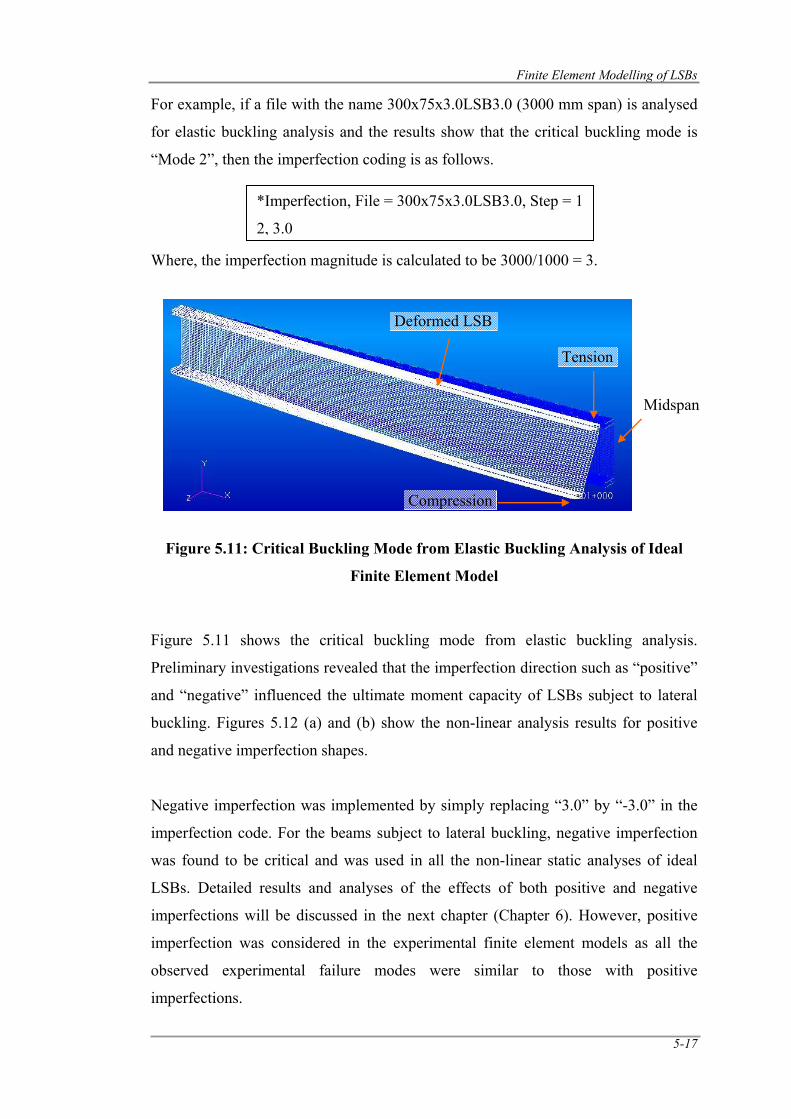
Finite Element Modelling of LSBs
5-17
For example, if a file with the name 300x75x3.0LSB3.0 (3000 mm span) is analysed
for elastic buckling analysis and the results show that the critical buckling mode is
“Mode 2”, then the imperfection coding is as follows.
Where, the imperfection magnitude is calculated to be 3000/1000 = 3.
Figure 5.11: Critical Buckling Mode from Elastic Buckling Analysis of Ideal
Finite Element Model
Figure 5.11 shows the critical buckling mode from elastic buckling analysis.
Preliminary investigations revealed that the imperfection direction such as “positive”
and “negative” influenced the ultimate moment capacity of LSBs subject to lateral
buckling. Figures 5.12 (a) and (b) show the non-linear analysis results for positive
and negative imperfection shapes.
Negative imperfection was implemented by simply replacing “3.0” by “-3.0” in the
imperfection code. For the beams subject to lateral buckling, negative imperfection
was found to be critical and was used in all the non-linear static analyses of ideal
LSBs. Detailed results and analyses of the effects of both positive and negative
imperfections will be discussed in the next chapter (Chapter 6). However, positive
imperfection was considered in the experimental finite element models as all the
observed experimental failure modes were similar to those with positive
imperfections.
*Imperfection, File = 300x75x3.0LSB3.0, Step = 1
2, 3.0
Deformed LSB
Tension
Compression
Midspan
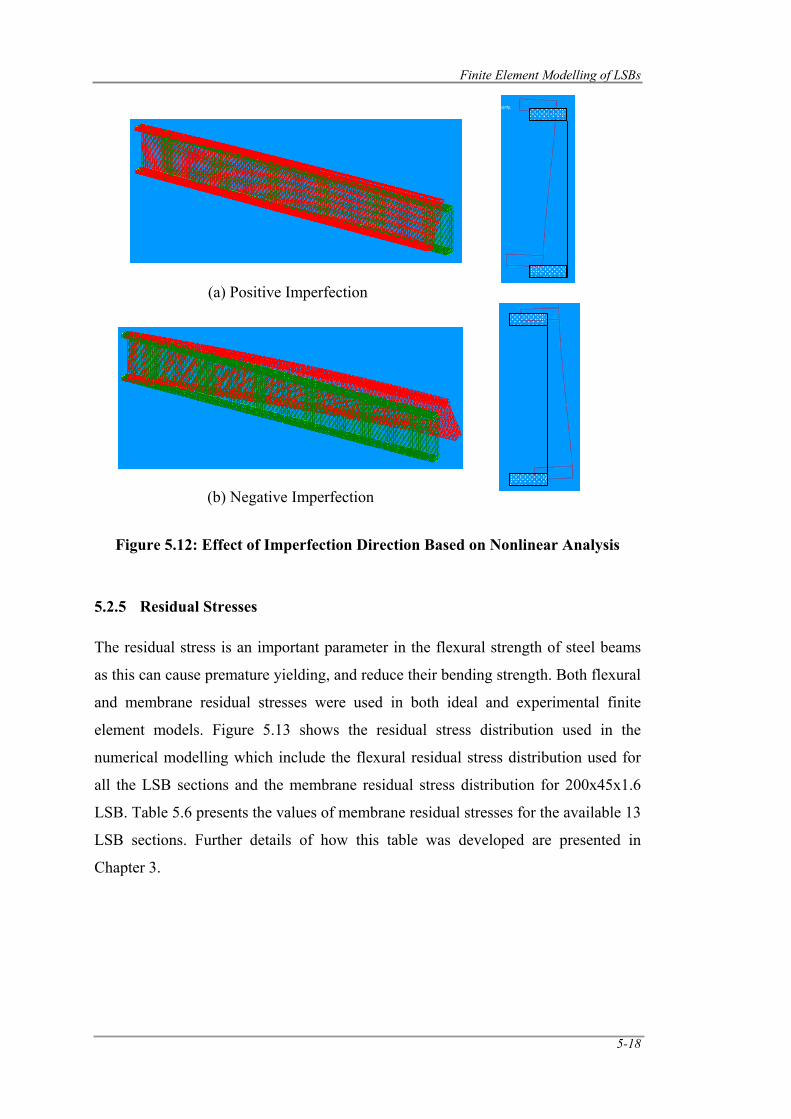
Finite Element Modelling of LSBs
5-18
Figure 5.12: Effect of Imperfection Direction Based on Nonlinear Analysis
5.2.5 Residual Stresses
The residual stress is an important parameter in the flexural strength of steel beams
as this can cause premature yielding, and reduce their bending strength. Both flexural
and membrane residual stresses were used in both ideal and experimental finite
element models. Figure 5.13 shows the residual stress distribution used in the
numerical modelling which include the flexural residual stress distribution used for
all the LSB sections and the membrane residual stress distribution for 200x45x1.6
LSB. Table 5.6 presents the values of membrane residual stresses for the available 13
LSB sections. Further details of how this table was developed are presented in
Chapter 3.
(a) Positive Imperfection
(b) Negative Imperfection
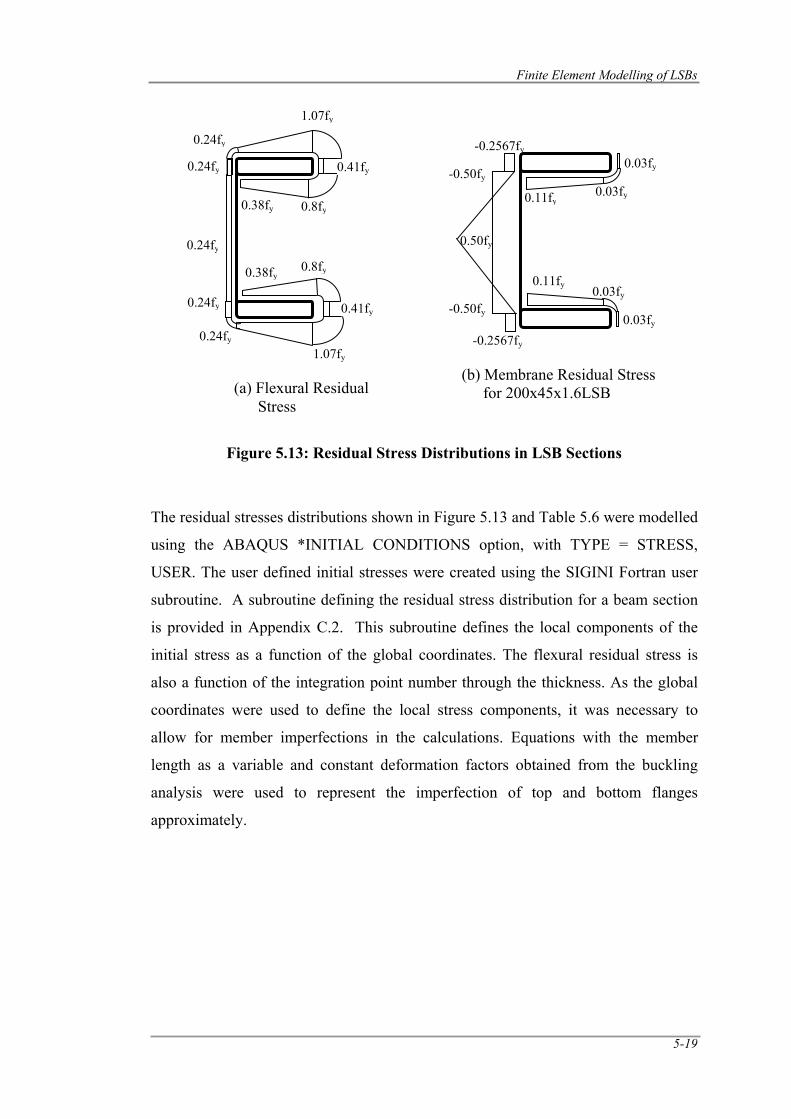
Finite Element Modelling of LSBs
5-19
Figure 5.13: Residual Stress Distributions in LSB Sections
The residual stresses distributions shown in Figure 5.13 and Table 5.6 were modelled
using the ABAQUS *INITIAL CONDITIONS option, with TYPE = STRESS,
USER. The user defined initial stresses were created using the SIGINI Fortran user
subroutine. A subroutine defining the residual stress distribution for a beam section
is provided in Appendix C.2. This subroutine defines the local components of the
initial stress as a function of the global coordinates. The flexural residual stress is
also a function of the integration point number through the thickness. As the global
coordinates were used to define the local stress components, it was necessary to
allow for member imperfections in the calculations. Equations with the member
length as a variable and constant deformation factors obtained from the buckling
analysis were used to represent the imperfection of top and bottom flanges
approximately.
0.03fy
-0.2567fy
0.11fy
-0.50fy
0.50fy
-0.50fy
-0.2567fy
0.11fy 0.03fy
0.03fy
0.03fy
(b) Membrane Residual Stress for 200x45x1.6LSB
0.24fy
0.24fy
0.24fy
1.07fy
0.41fy
0.8fy 0.38fy
0.38fy 0.8fy
0.41fy
1.07fy
0.24fy
0.24fy
(a) Flexural Residual Stress
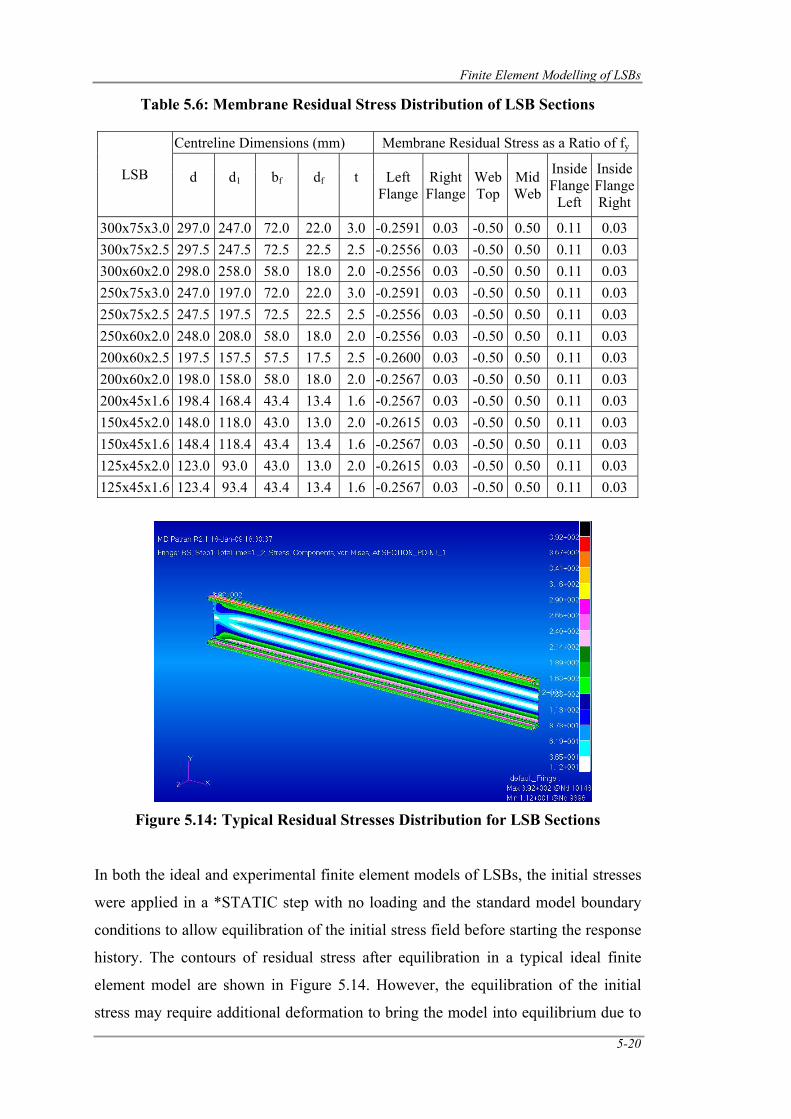
Finite Element Modelling of LSBs
5-20
Table 5.6: Membrane Residual Stress Distribution of LSB Sections
LSB
Centreline Dimensions (mm) Membrane Residual Stress as a Ratio of fy
d
d1
bf
df
t
Left Flange
Right Flange
Web Top
MidWeb
Inside Flange
Left
Inside Flange Right
300x75x3.0 297.0 247.0 72.0 22.0 3.0 -0.2591 0.03 -0.50 0.50 0.11 0.03 300x75x2.5 297.5 247.5 72.5 22.5 2.5 -0.2556 0.03 -0.50 0.50 0.11 0.03 300x60x2.0 298.0 258.0 58.0 18.0 2.0 -0.2556 0.03 -0.50 0.50 0.11 0.03 250x75x3.0 247.0 197.0 72.0 22.0 3.0 -0.2591 0.03 -0.50 0.50 0.11 0.03 250x75x2.5 247.5 197.5 72.5 22.5 2.5 -0.2556 0.03 -0.50 0.50 0.11 0.03 250x60x2.0 248.0 208.0 58.0 18.0 2.0 -0.2556 0.03 -0.50 0.50 0.11 0.03 200x60x2.5 197.5 157.5 57.5 17.5 2.5 -0.2600 0.03 -0.50 0.50 0.11 0.03 200x60x2.0 198.0 158.0 58.0 18.0 2.0 -0.2567 0.03 -0.50 0.50 0.11 0.03 200x45x1.6 198.4 168.4 43.4 13.4 1.6 -0.2567 0.03 -0.50 0.50 0.11 0.03 150x45x2.0 148.0 118.0 43.0 13.0 2.0 -0.2615 0.03 -0.50 0.50 0.11 0.03 150x45x1.6 148.4 118.4 43.4 13.4 1.6 -0.2567 0.03 -0.50 0.50 0.11 0.03 125x45x2.0 123.0 93.0 43.0 13.0 2.0 -0.2615 0.03 -0.50 0.50 0.11 0.03 125x45x1.6 123.4 93.4 43.4 13.4 1.6 -0.2567 0.03 -0.50 0.50 0.11 0.03
Figure 5.14: Typical Residual Stresses Distribution for LSB Sections
In both the ideal and experimental finite element models of LSBs, the initial stresses
were applied in a *STATIC step with no loading and the standard model boundary
conditions to allow equilibration of the initial stress field before starting the response
history. The contours of residual stress after equilibration in a typical ideal finite
element model are shown in Figure 5.14. However, the equilibration of the initial
stress may require additional deformation to bring the model into equilibrium due to
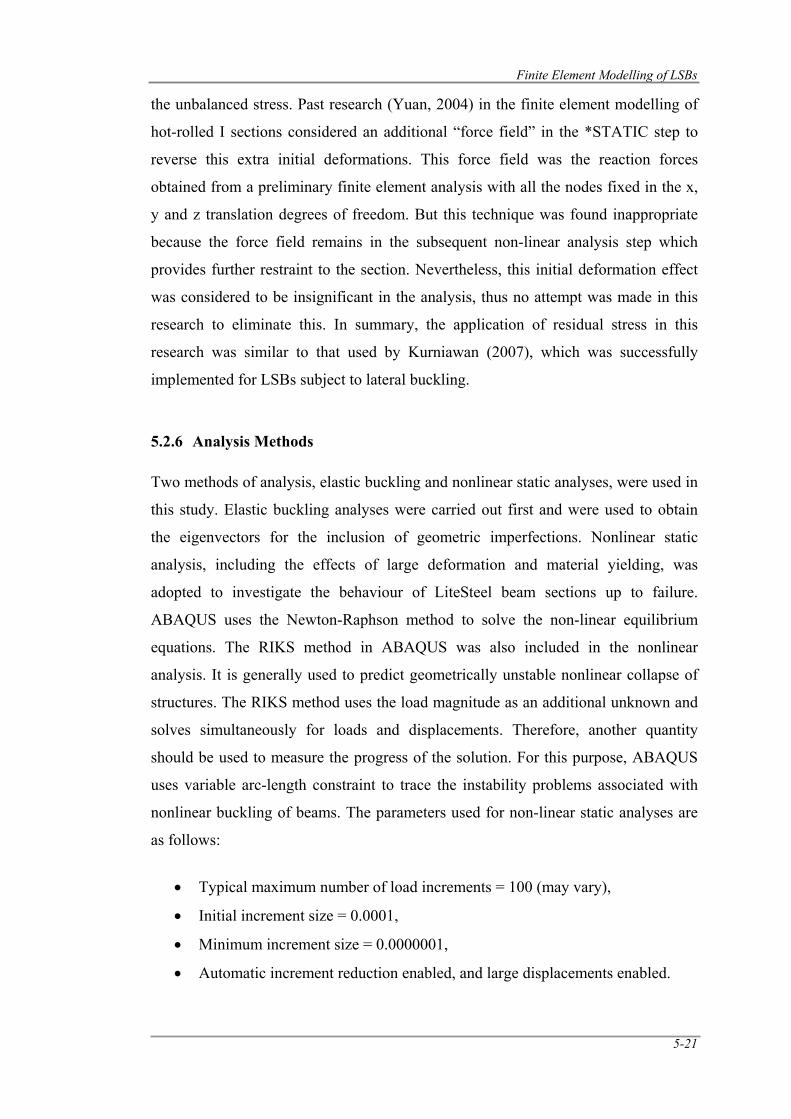
Finite Element Modelling of LSBs
5-21
the unbalanced stress. Past research (Yuan, 2004) in the finite element modelling of
hot-rolled I sections considered an additional “force field” in the *STATIC step to
reverse this extra initial deformations. This force field was the reaction forces
obtained from a preliminary finite element analysis with all the nodes fixed in the x,
y and z translation degrees of freedom. But this technique was found inappropriate
because the force field remains in the subsequent non-linear analysis step which
provides further restraint to the section. Nevertheless, this initial deformation effect
was considered to be insignificant in the analysis, thus no attempt was made in this
research to eliminate this. In summary, the application of residual stress in this
research was similar to that used by Kurniawan (2007), which was successfully
implemented for LSBs subject to lateral buckling.
5.2.6 Analysis Methods
Two methods of analysis, elastic buckling and nonlinear static analyses, were used in
this study. Elastic buckling analyses were carried out first and were used to obtain
the eigenvectors for the inclusion of geometric imperfections. Nonlinear static
analysis, including the effects of large deformation and material yielding, was
adopted to investigate the behaviour of LiteSteel beam sections up to failure.
ABAQUS uses the Newton-Raphson method to solve the non-linear equilibrium
equations. The RIKS method in ABAQUS was also included in the nonlinear
analysis. It is generally used to predict geometrically unstable nonlinear collapse of
structures. The RIKS method uses the load magnitude as an additional unknown and
solves simultaneously for loads and displacements. Therefore, another quantity
should be used to measure the progress of the solution. For this purpose, ABAQUS
uses variable arc-length constraint to trace the instability problems associated with
nonlinear buckling of beams. The parameters used for non-linear static analyses are
as follows:
• Typical maximum number of load increments = 100 (may vary),
• Initial increment size = 0.0001,
• Minimum increment size = 0.0000001,
• Automatic increment reduction enabled, and large displacements enabled.
Finite Element Modelling of LSBs
5-22
The finite element models of LSBs were developed in MD/PATRAN and submitted
to ABAQUS (Version 6.7-1) for analysis. Following is a summary of the steps
involved in the finite element modelling of LSBs used in this research.
1. Define geometric surfaces for the flanges and the web.
2. Mesh those surfaces using shell S4R5 elements.
3. Define the support and mid-span boundary conditions and the loads.
(including the MPC rigid beam in the experimental model to simulate the
bolts).
4. Define and assign the mechanical properties for web and flanges (support,
load and stiffener plates for experimental model).
5. Define buckling analysis parameters and run bifurcation buckling analysis
using ABAQUS.
6. Obtain the critical buckling eigenvector and the required maximum
deformation factors for member equations to be included in the residual
stress input subroutine.
7. Prepare the residual stress input subroutine.
8. Define the non-linear static analysis parameters.
9. Using ABAQUS, run a non-linear static analysis, which consists of two
“load steps”:
Equilibration STATIC step – with the standard boundary
conditions, initial geometric imperfection and residual stress input
subroutine.
Ultimate load factor step – with the applied moment or load.
5.3 Model Validation
It is necessary to verify the accuracy of the developed finite element models prior to
their use in the development of member capacity curves and design
recommendations. This was achieved by conducting two series of comparisons. The
first series, presented in Section 5.3.2, involved comparison of the elastic lateral
distortional buckling moments obtained using the ideal finite element model with the
corresponding moment solutions obtained from the established finite strip analysis
program, Thin-Wall and the predictions from Pi and Trahair (1997). The second
series of comparisons, presented in Section 5.3.3, involved the use of the
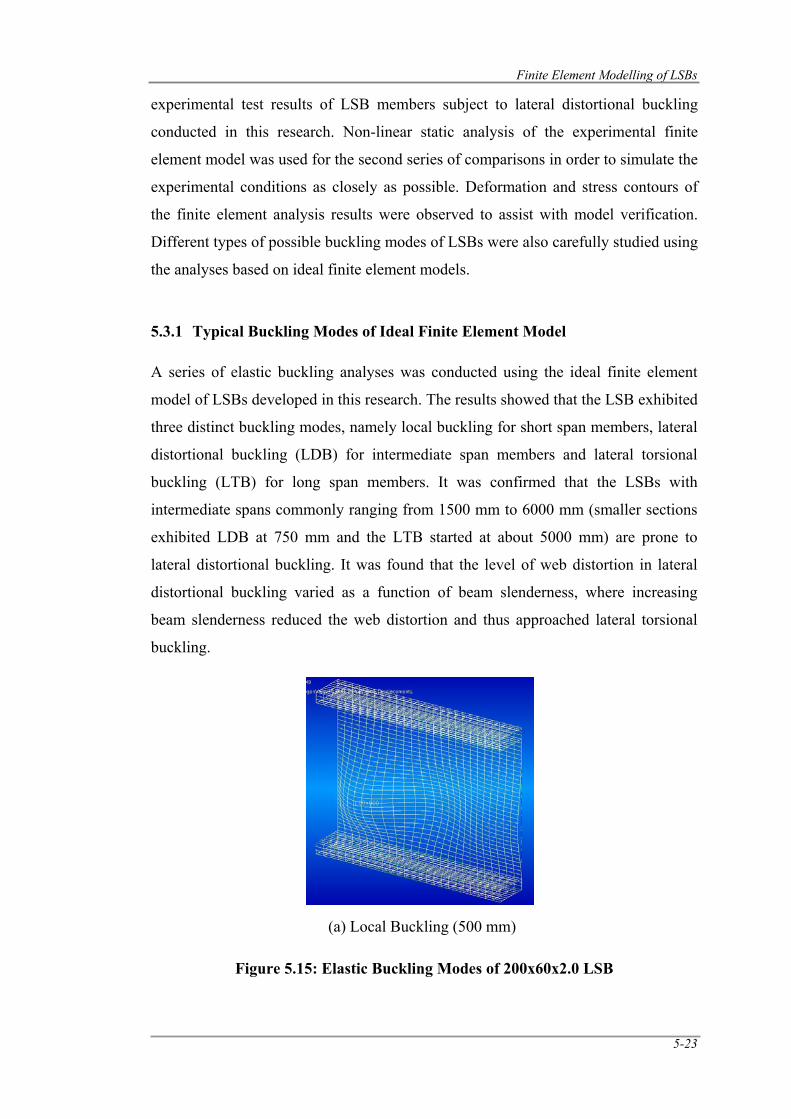
Finite Element Modelling of LSBs
5-23
experimental test results of LSB members subject to lateral distortional buckling
conducted in this research. Non-linear static analysis of the experimental finite
element model was used for the second series of comparisons in order to simulate the
experimental conditions as closely as possible. Deformation and stress contours of
the finite element analysis results were observed to assist with model verification.
Different types of possible buckling modes of LSBs were also carefully studied using
the analyses based on ideal finite element models.
5.3.1 Typical Buckling Modes of Ideal Finite Element Model
A series of elastic buckling analyses was conducted using the ideal finite element
model of LSBs developed in this research. The results showed that the LSB exhibited
three distinct buckling modes, namely local buckling for short span members, lateral
distortional buckling (LDB) for intermediate span members and lateral torsional
buckling (LTB) for long span members. It was confirmed that the LSBs with
intermediate spans commonly ranging from 1500 mm to 6000 mm (smaller sections
exhibited LDB at 750 mm and the LTB started at about 5000 mm) are prone to
lateral distortional buckling. It was found that the level of web distortion in lateral
distortional buckling varied as a function of beam slenderness, where increasing
beam slenderness reduced the web distortion and thus approached lateral torsional
buckling.
Figure 5.15: Elastic Buckling Modes of 200x60x2.0 LSB
(a) Local Buckling (500 mm)
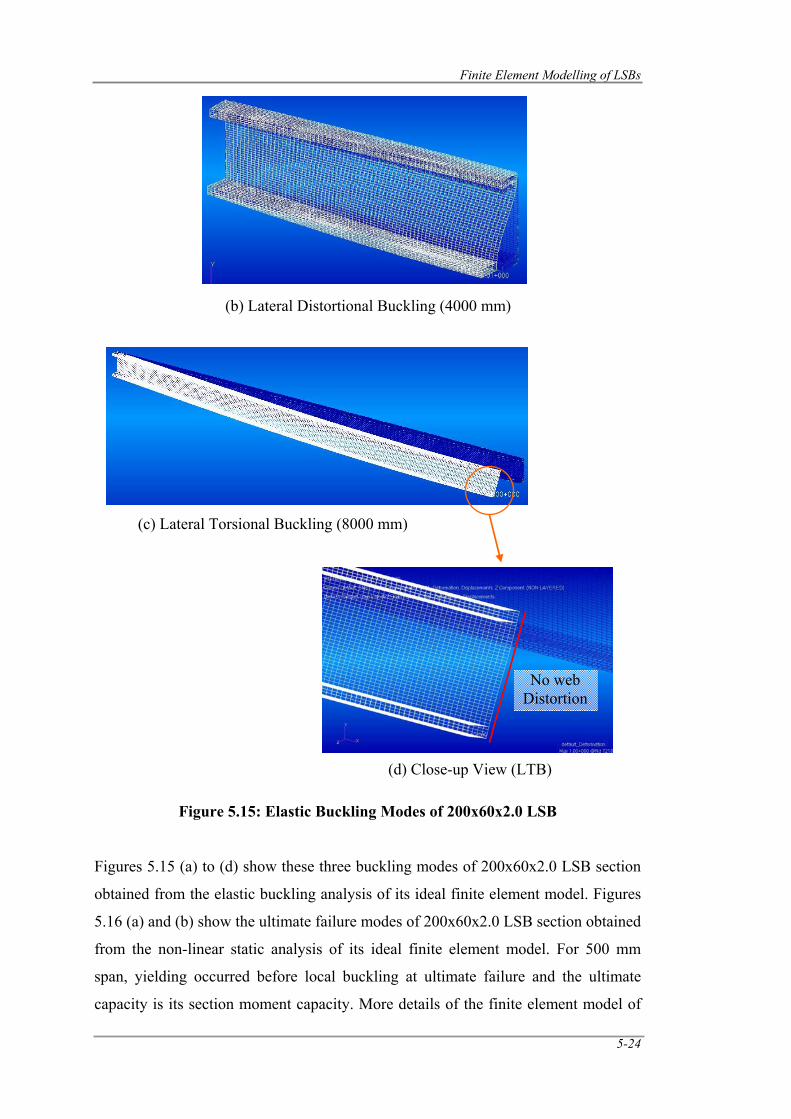
Finite Element Modelling of LSBs
5-24
Figure 5.15: Elastic Buckling Modes of 200x60x2.0 LSB
Figures 5.15 (a) to (d) show these three buckling modes of 200x60x2.0 LSB section
obtained from the elastic buckling analysis of its ideal finite element model. Figures
5.16 (a) and (b) show the ultimate failure modes of 200x60x2.0 LSB section obtained
from the non-linear static analysis of its ideal finite element model. For 500 mm
span, yielding occurred before local buckling at ultimate failure and the ultimate
capacity is its section moment capacity. More details of the finite element model of
(b) Lateral Distortional Buckling (4000 mm)
(c) Lateral Torsional Buckling (8000 mm)
(d) Close-up View (LTB)
No web Distortion
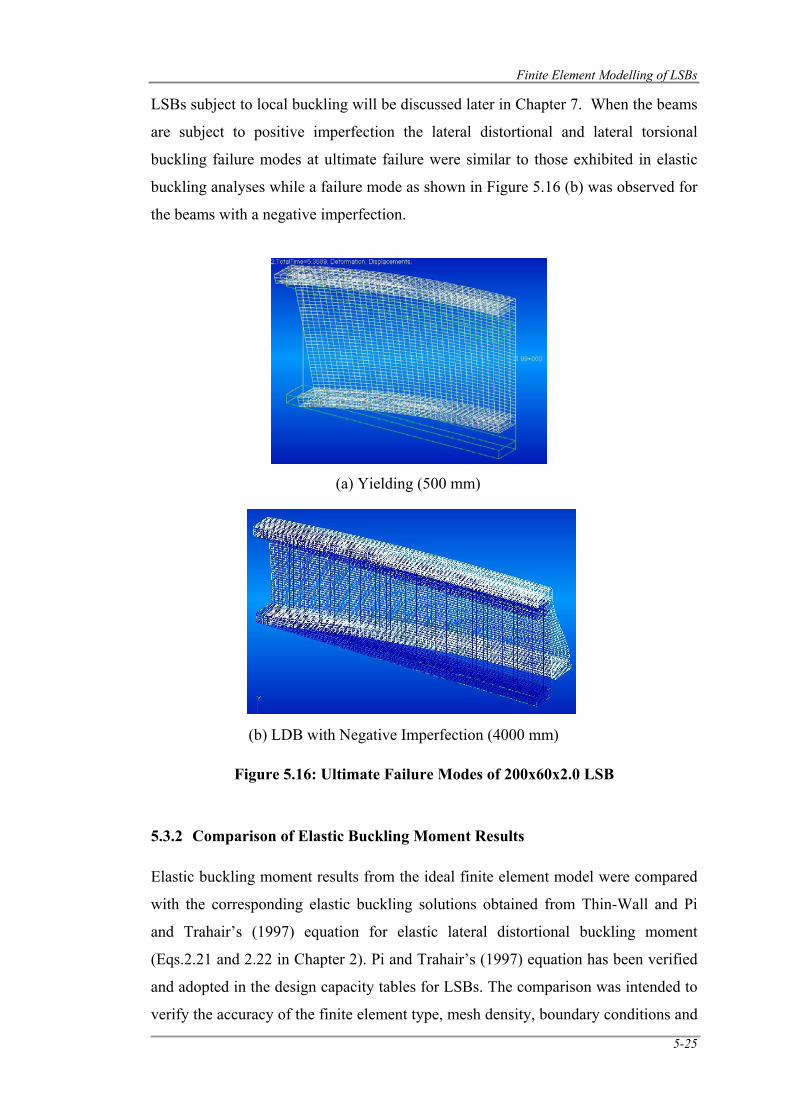
Finite Element Modelling of LSBs
5-25
LSBs subject to local buckling will be discussed later in Chapter 7. When the beams
are subject to positive imperfection the lateral distortional and lateral torsional
buckling failure modes at ultimate failure were similar to those exhibited in elastic
buckling analyses while a failure mode as shown in Figure 5.16 (b) was observed for
the beams with a negative imperfection.
Figure 5.16: Ultimate Failure Modes of 200x60x2.0 LSB
5.3.2 Comparison of Elastic Buckling Moment Results
Elastic buckling moment results from the ideal finite element model were compared
with the corresponding elastic buckling solutions obtained from Thin-Wall and Pi
and Trahair’s (1997) equation for elastic lateral distortional buckling moment
(Eqs.2.21 and 2.22 in Chapter 2). Pi and Trahair’s (1997) equation has been verified
and adopted in the design capacity tables for LSBs. The comparison was intended to
verify the accuracy of the finite element type, mesh density, boundary conditions and
(a) Yielding (500 mm)
(b) LDB with Negative Imperfection (4000 mm)
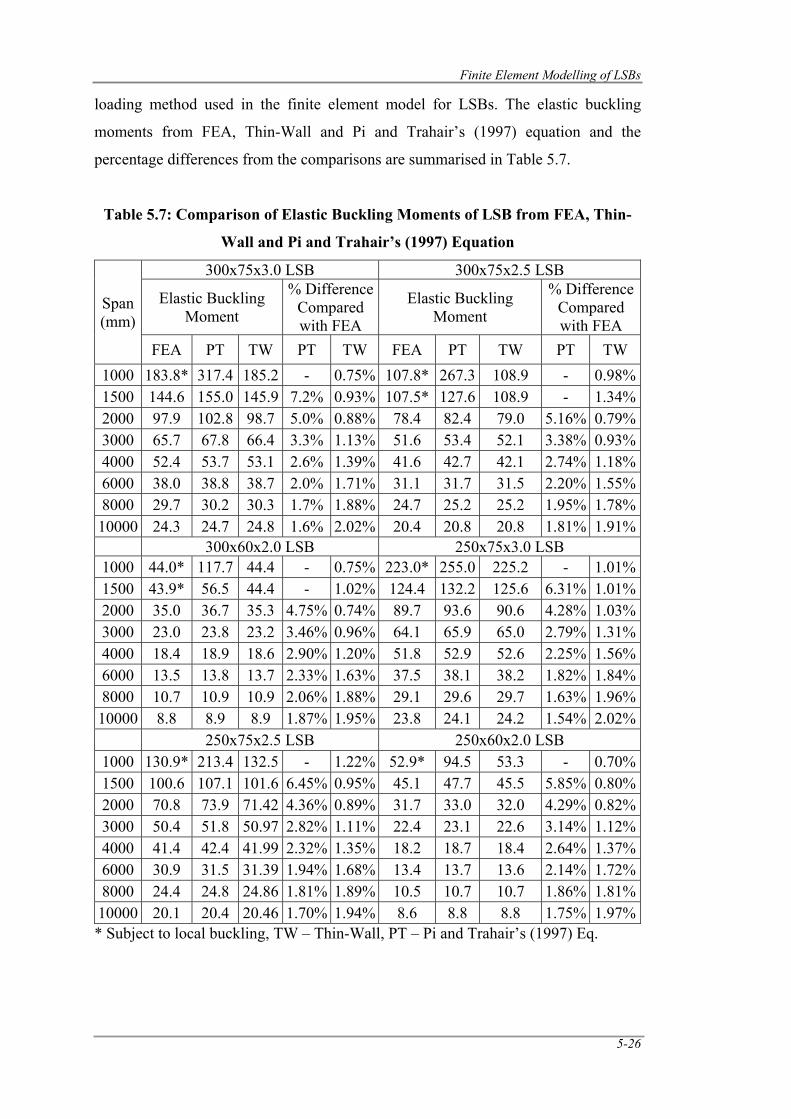
Finite Element Modelling of LSBs
5-26
loading method used in the finite element model for LSBs. The elastic buckling
moments from FEA, Thin-Wall and Pi and Trahair’s (1997) equation and the
percentage differences from the comparisons are summarised in Table 5.7.
Table 5.7: Comparison of Elastic Buckling Moments of LSB from FEA, Thin-
Wall and Pi and Trahair’s (1997) Equation
Span (mm)
300x75x3.0 LSB 300x75x2.5 LSB
Elastic Buckling Moment
% Difference Compared with FEA
Elastic Buckling Moment
% Difference Compared with FEA
FEA PT TW PT TW FEA PT TW PT TW 1000 183.8* 317.4 185.2 - 0.75% 107.8* 267.3 108.9 - 0.98% 1500 144.6 155.0 145.9 7.2% 0.93% 107.5* 127.6 108.9 - 1.34% 2000 97.9 102.8 98.7 5.0% 0.88% 78.4 82.4 79.0 5.16% 0.79% 3000 65.7 67.8 66.4 3.3% 1.13% 51.6 53.4 52.1 3.38% 0.93% 4000 52.4 53.7 53.1 2.6% 1.39% 41.6 42.7 42.1 2.74% 1.18% 6000 38.0 38.8 38.7 2.0% 1.71% 31.1 31.7 31.5 2.20% 1.55% 8000 29.7 30.2 30.3 1.7% 1.88% 24.7 25.2 25.2 1.95% 1.78% 10000 24.3 24.7 24.8 1.6% 2.02% 20.4 20.8 20.8 1.81% 1.91%
300x60x2.0 LSB 250x75x3.0 LSB 1000 44.0* 117.7 44.4 - 0.75% 223.0* 255.0 225.2 - 1.01% 1500 43.9* 56.5 44.4 - 1.02% 124.4 132.2 125.6 6.31% 1.01% 2000 35.0 36.7 35.3 4.75% 0.74% 89.7 93.6 90.6 4.28% 1.03% 3000 23.0 23.8 23.2 3.46% 0.96% 64.1 65.9 65.0 2.79% 1.31% 4000 18.4 18.9 18.6 2.90% 1.20% 51.8 52.9 52.6 2.25% 1.56% 6000 13.5 13.8 13.7 2.33% 1.63% 37.5 38.1 38.2 1.82% 1.84% 8000 10.7 10.9 10.9 2.06% 1.88% 29.1 29.6 29.7 1.63% 1.96% 10000 8.8 8.9 8.9 1.87% 1.95% 23.8 24.1 24.2 1.54% 2.02%
250x75x2.5 LSB 250x60x2.0 LSB 1000 130.9* 213.4 132.5 - 1.22% 52.9* 94.5 53.3 - 0.70% 1500 100.6 107.1 101.6 6.45% 0.95% 45.1 47.7 45.5 5.85% 0.80% 2000 70.8 73.9 71.42 4.36% 0.89% 31.7 33.0 32.0 4.29% 0.82% 3000 50.4 51.8 50.97 2.82% 1.11% 22.4 23.1 22.6 3.14% 1.12% 4000 41.4 42.4 41.99 2.32% 1.35% 18.2 18.7 18.4 2.64% 1.37% 6000 30.9 31.5 31.39 1.94% 1.68% 13.4 13.7 13.6 2.14% 1.72% 8000 24.4 24.8 24.86 1.81% 1.89% 10.5 10.7 10.7 1.86% 1.81% 10000 20.1 20.4 20.46 1.70% 1.94% 8.6 8.8 8.8 1.75% 1.97% * Subject to local buckling, TW – Thin-Wall, PT – Pi and Trahair’s (1997) Eq.
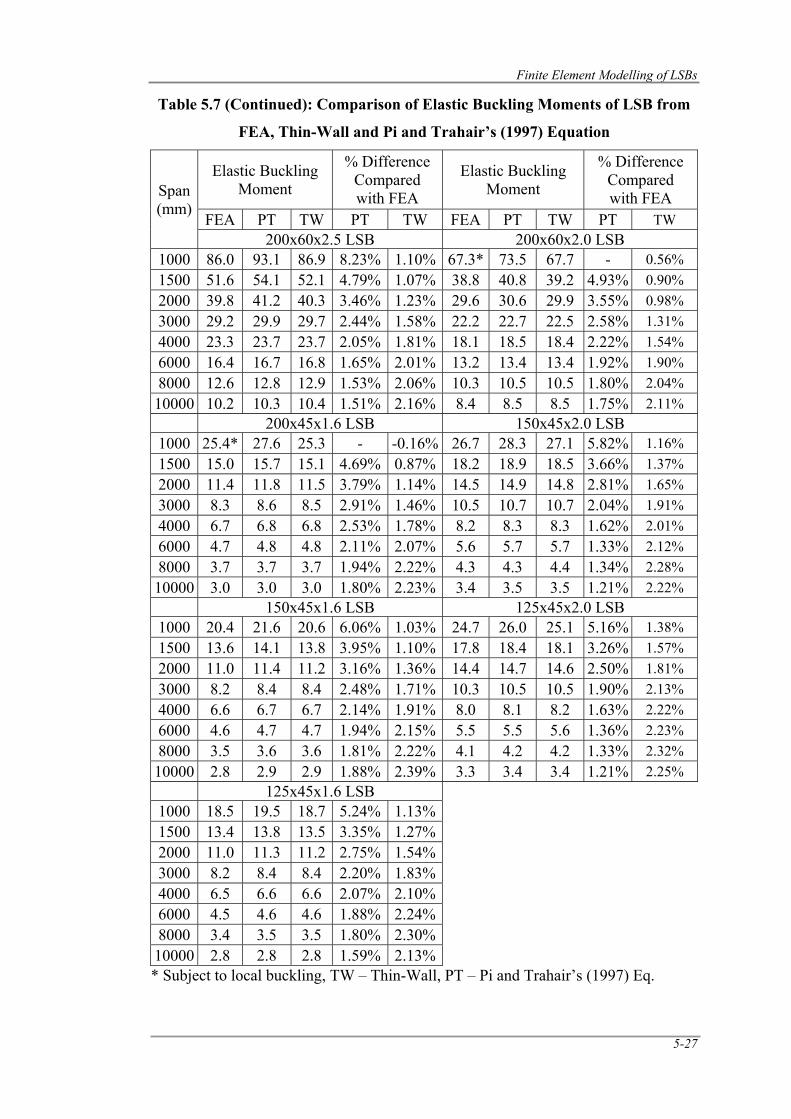
Finite Element Modelling of LSBs
5-27
Table 5.7 (Continued): Comparison of Elastic Buckling Moments of LSB from
FEA, Thin-Wall and Pi and Trahair’s (1997) Equation
Span (mm)
Elastic Buckling Moment
% Difference Compared with FEA
Elastic Buckling Moment
% Difference Compared with FEA
FEA PT TW PT TW FEA PT TW PT TW 200x60x2.5 LSB 200x60x2.0 LSB
1000 86.0 93.1 86.9 8.23% 1.10% 67.3* 73.5 67.7 - 0.56% 1500 51.6 54.1 52.1 4.79% 1.07% 38.8 40.8 39.2 4.93% 0.90% 2000 39.8 41.2 40.3 3.46% 1.23% 29.6 30.6 29.9 3.55% 0.98% 3000 29.2 29.9 29.7 2.44% 1.58% 22.2 22.7 22.5 2.58% 1.31% 4000 23.3 23.7 23.7 2.05% 1.81% 18.1 18.5 18.4 2.22% 1.54% 6000 16.4 16.7 16.8 1.65% 2.01% 13.2 13.4 13.4 1.92% 1.90% 8000 12.6 12.8 12.9 1.53% 2.06% 10.3 10.5 10.5 1.80% 2.04% 10000 10.2 10.3 10.4 1.51% 2.16% 8.4 8.5 8.5 1.75% 2.11% 200x45x1.6 LSB 150x45x2.0 LSB 1000 25.4* 27.6 25.3 - -0.16% 26.7 28.3 27.1 5.82% 1.16% 1500 15.0 15.7 15.1 4.69% 0.87% 18.2 18.9 18.5 3.66% 1.37% 2000 11.4 11.8 11.5 3.79% 1.14% 14.5 14.9 14.8 2.81% 1.65% 3000 8.3 8.6 8.5 2.91% 1.46% 10.5 10.7 10.7 2.04% 1.91% 4000 6.7 6.8 6.8 2.53% 1.78% 8.2 8.3 8.3 1.62% 2.01% 6000 4.7 4.8 4.8 2.11% 2.07% 5.6 5.7 5.7 1.33% 2.12% 8000 3.7 3.7 3.7 1.94% 2.22% 4.3 4.3 4.4 1.34% 2.28% 10000 3.0 3.0 3.0 1.80% 2.23% 3.4 3.5 3.5 1.21% 2.22% 150x45x1.6 LSB 125x45x2.0 LSB 1000 20.4 21.6 20.6 6.06% 1.03% 24.7 26.0 25.1 5.16% 1.38% 1500 13.6 14.1 13.8 3.95% 1.10% 17.8 18.4 18.1 3.26% 1.57% 2000 11.0 11.4 11.2 3.16% 1.36% 14.4 14.7 14.6 2.50% 1.81% 3000 8.2 8.4 8.4 2.48% 1.71% 10.3 10.5 10.5 1.90% 2.13% 4000 6.6 6.7 6.7 2.14% 1.91% 8.0 8.1 8.2 1.63% 2.22% 6000 4.6 4.7 4.7 1.94% 2.15% 5.5 5.5 5.6 1.36% 2.23% 8000 3.5 3.6 3.6 1.81% 2.22% 4.1 4.2 4.2 1.33% 2.32% 10000 2.8 2.9 2.9 1.88% 2.39% 3.3 3.4 3.4 1.21% 2.25%
125x45x1.6 LSB 1000 18.5 19.5 18.7 5.24% 1.13% 1500 13.4 13.8 13.5 3.35% 1.27% 2000 11.0 11.3 11.2 2.75% 1.54% 3000 8.2 8.4 8.4 2.20% 1.83% 4000 6.5 6.6 6.6 2.07% 2.10% 6000 4.5 4.6 4.6 1.88% 2.24% 8000 3.4 3.5 3.5 1.80% 2.30% 10000 2.8 2.8 2.8 1.59% 2.13% * Subject to local buckling, TW – Thin-Wall, PT – Pi and Trahair’s (1997) Eq.
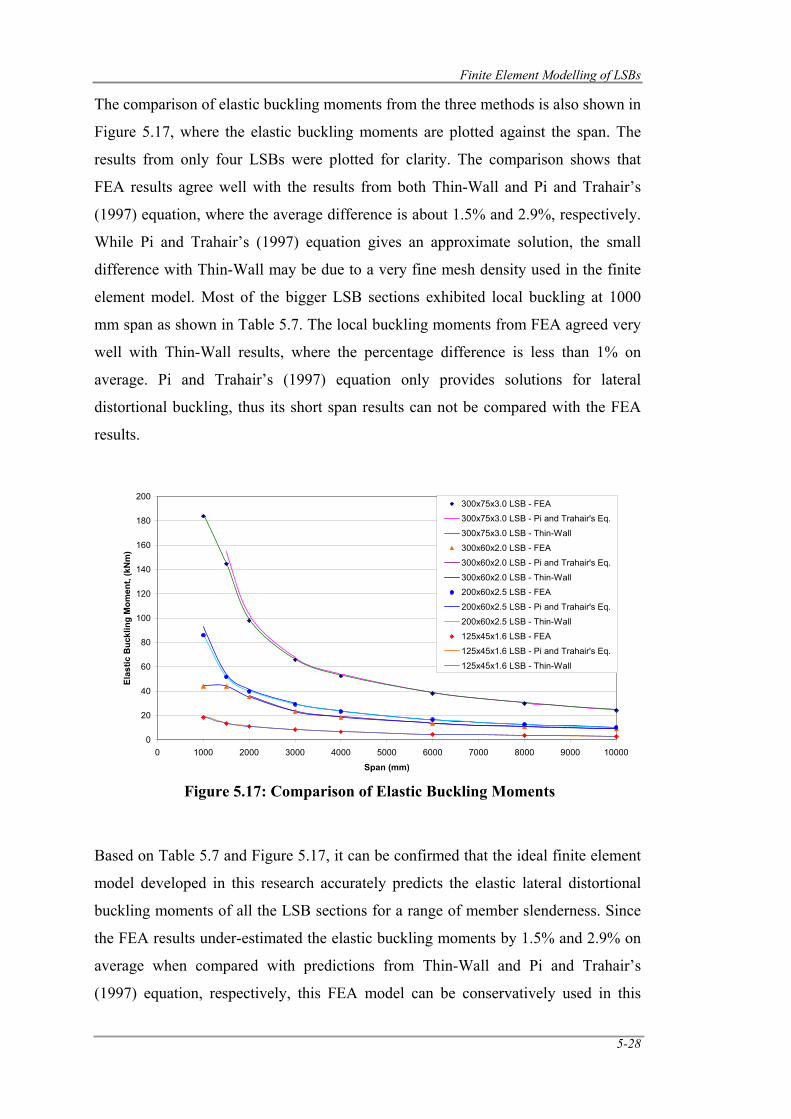
Finite Element Modelling of LSBs
5-28
The comparison of elastic buckling moments from the three methods is also shown in
Figure 5.17, where the elastic buckling moments are plotted against the span. The
results from only four LSBs were plotted for clarity. The comparison shows that
FEA results agree well with the results from both Thin-Wall and Pi and Trahair’s
(1997) equation, where the average difference is about 1.5% and 2.9%, respectively.
While Pi and Trahair’s (1997) equation gives an approximate solution, the small
difference with Thin-Wall may be due to a very fine mesh density used in the finite
element model. Most of the bigger LSB sections exhibited local buckling at 1000
mm span as shown in Table 5.7. The local buckling moments from FEA agreed very
well with Thin-Wall results, where the percentage difference is less than 1% on
average. Pi and Trahair’s (1997) equation only provides solutions for lateral
distortional buckling, thus its short span results can not be compared with the FEA
results.
Figure 5.17: Comparison of Elastic Buckling Moments
Based on Table 5.7 and Figure 5.17, it can be confirmed that the ideal finite element
model developed in this research accurately predicts the elastic lateral distortional
buckling moments of all the LSB sections for a range of member slenderness. Since
the FEA results under-estimated the elastic buckling moments by 1.5% and 2.9% on
average when compared with predictions from Thin-Wall and Pi and Trahair’s
(1997) equation, respectively, this FEA model can be conservatively used in this
0
20
40
60
80
100
120
140
160
180
200
0 1000 2000 3000 4000 5000 6000 7000 8000 9000 10000
Span (mm)
Elas
tic B
uckl
ing
Mom
ent,
(kN
m)
300x75x3.0 LSB - FEA
300x75x3.0 LSB - Pi and Trahair's Eq.
300x75x3.0 LSB - Thin-Wall
300x60x2.0 LSB - FEA
300x60x2.0 LSB - Pi and Trahair's Eq.
300x60x2.0 LSB - Thin-Wall
200x60x2.5 LSB - FEA
200x60x2.5 LSB - Pi and Trahair's Eq.
200x60x2.5 LSB - Thin-Wall
125x45x1.6 LSB - FEA
125x45x1.6 LSB - Pi and Trahair's Eq.
125x45x1.6 LSB - Thin-Wall
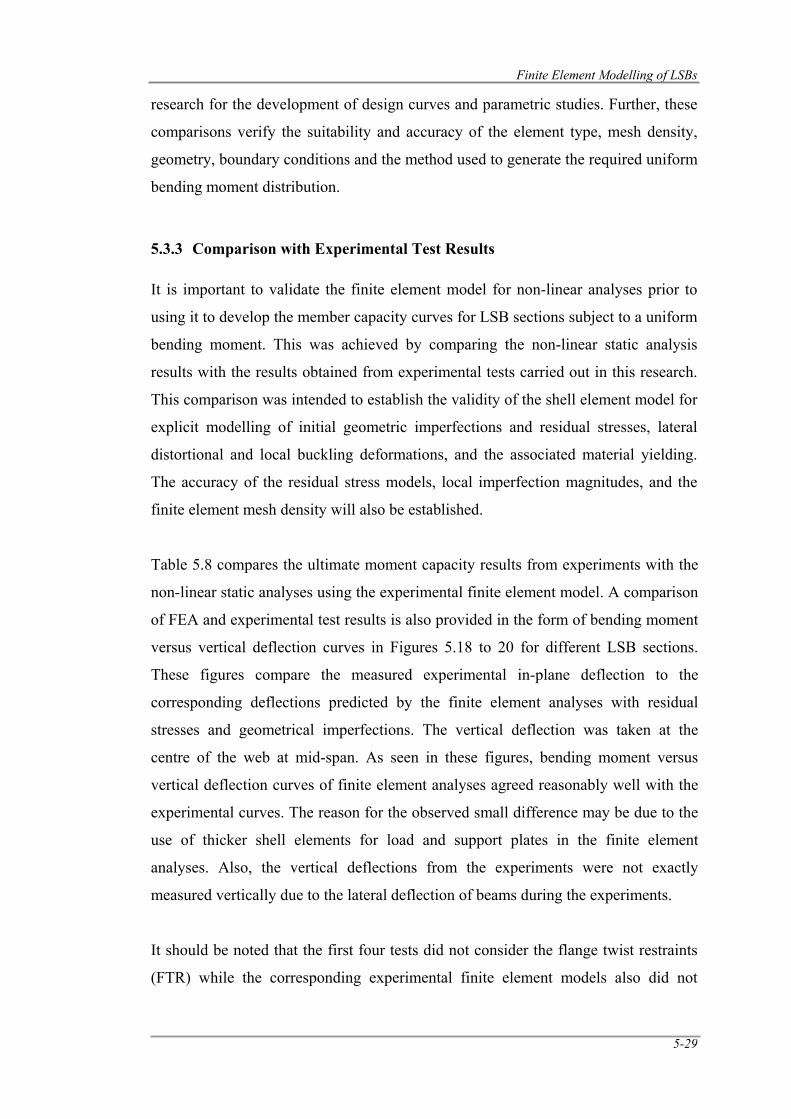
Finite Element Modelling of LSBs
5-29
research for the development of design curves and parametric studies. Further, these
comparisons verify the suitability and accuracy of the element type, mesh density,
geometry, boundary conditions and the method used to generate the required uniform
bending moment distribution.
5.3.3 Comparison with Experimental Test Results
It is important to validate the finite element model for non-linear analyses prior to
using it to develop the member capacity curves for LSB sections subject to a uniform
bending moment. This was achieved by comparing the non-linear static analysis
results with the results obtained from experimental tests carried out in this research.
This comparison was intended to establish the validity of the shell element model for
explicit modelling of initial geometric imperfections and residual stresses, lateral
distortional and local buckling deformations, and the associated material yielding.
The accuracy of the residual stress models, local imperfection magnitudes, and the
finite element mesh density will also be established.
Table 5.8 compares the ultimate moment capacity results from experiments with the
non-linear static analyses using the experimental finite element model. A comparison
of FEA and experimental test results is also provided in the form of bending moment
versus vertical deflection curves in Figures 5.18 to 20 for different LSB sections.
These figures compare the measured experimental in-plane deflection to the
corresponding deflections predicted by the finite element analyses with residual
stresses and geometrical imperfections. The vertical deflection was taken at the
centre of the web at mid-span. As seen in these figures, bending moment versus
vertical deflection curves of finite element analyses agreed reasonably well with the
experimental curves. The reason for the observed small difference may be due to the
use of thicker shell elements for load and support plates in the finite element
analyses. Also, the vertical deflections from the experiments were not exactly
measured vertically due to the lateral deflection of beams during the experiments.
It should be noted that the first four tests did not consider the flange twist restraints
(FTR) while the corresponding experimental finite element models also did not
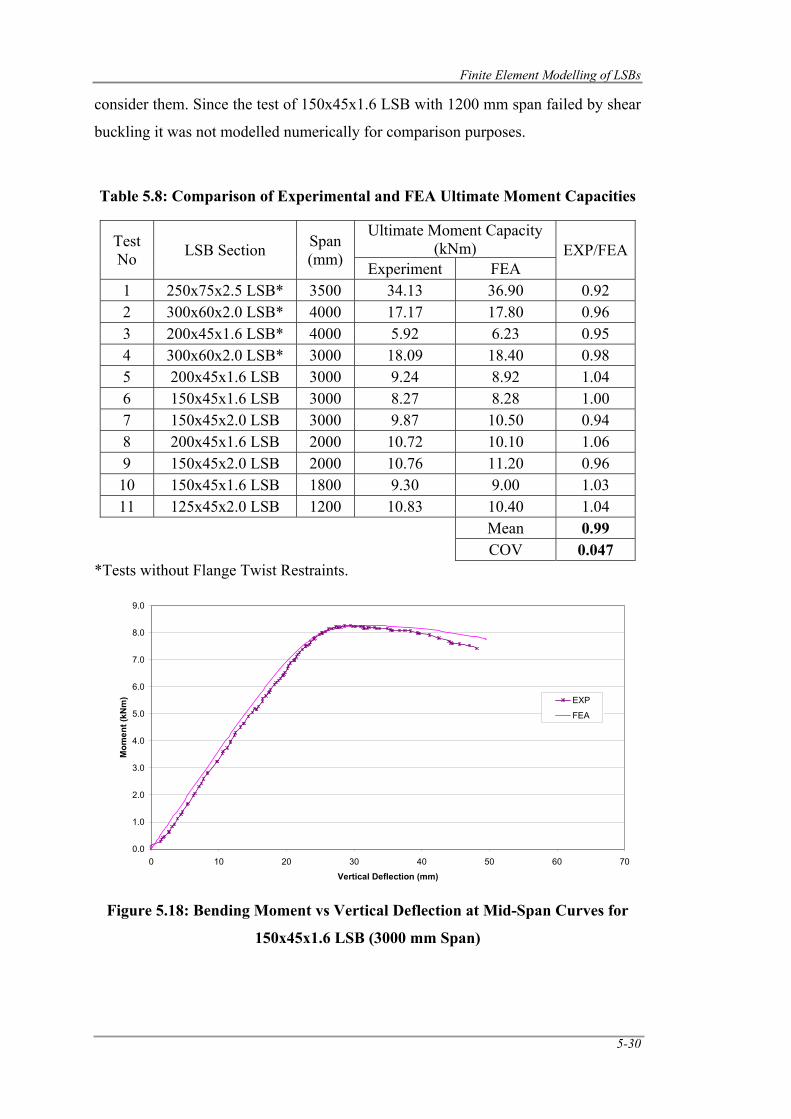
Finite Element Modelling of LSBs
5-30
consider them. Since the test of 150x45x1.6 LSB with 1200 mm span failed by shear
buckling it was not modelled numerically for comparison purposes.
Table 5.8: Comparison of Experimental and FEA Ultimate Moment Capacities
Test No LSB Section Span
(mm)
Ultimate Moment Capacity (kNm) EXP/FEA
Experiment FEA 1 250x75x2.5 LSB* 3500 34.13 36.90 0.92 2 300x60x2.0 LSB* 4000 17.17 17.80 0.96 3 200x45x1.6 LSB* 4000 5.92 6.23 0.95 4 300x60x2.0 LSB* 3000 18.09 18.40 0.98 5 200x45x1.6 LSB 3000 9.24 8.92 1.04 6 150x45x1.6 LSB 3000 8.27 8.28 1.00 7 150x45x2.0 LSB 3000 9.87 10.50 0.94 8 200x45x1.6 LSB 2000 10.72 10.10 1.06 9 150x45x2.0 LSB 2000 10.76 11.20 0.96 10 150x45x1.6 LSB 1800 9.30 9.00 1.03 11 125x45x2.0 LSB 1200 10.83 10.40 1.04 Mean 0.99 COV 0.047
*Tests without Flange Twist Restraints.
Figure 5.18: Bending Moment vs Vertical Deflection at Mid-Span Curves for
150x45x1.6 LSB (3000 mm Span)
0.0
1.0
2.0
3.0
4.0
5.0
6.0
7.0
8.0
9.0
0 10 20 30 40 50 60 70
Vertical Deflection (mm)
Mom
ent (
kNm
) EXP
FEA
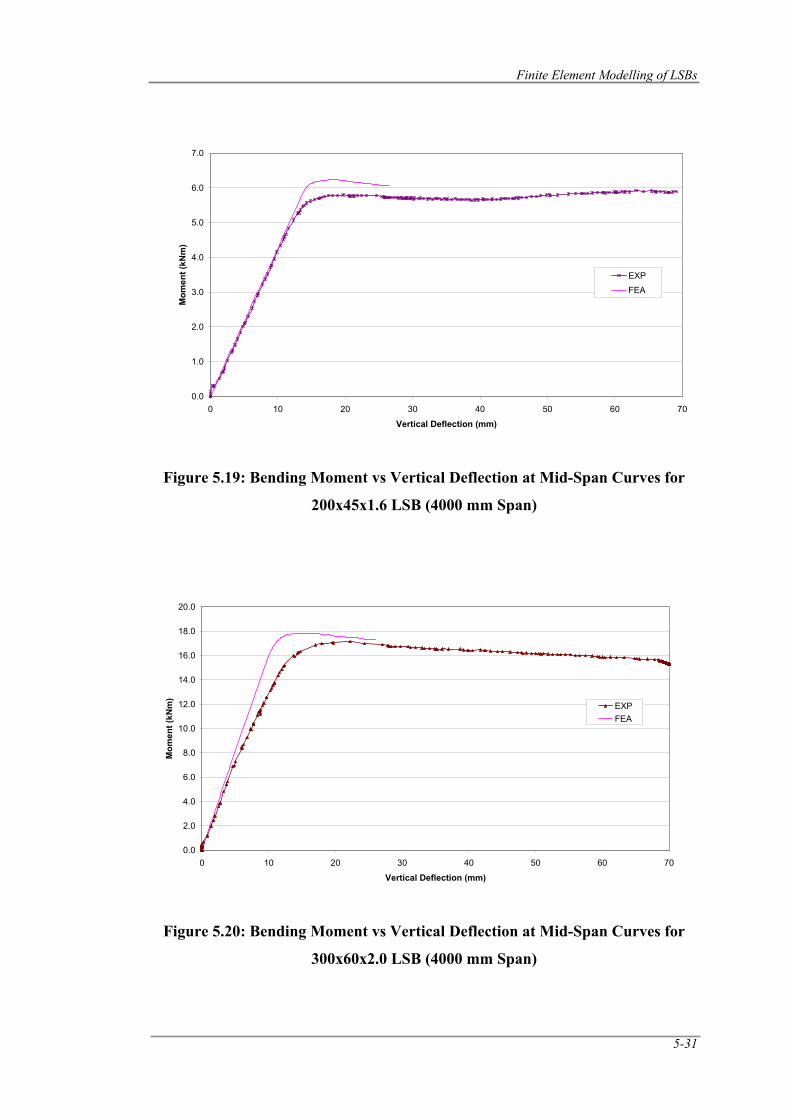
Finite Element Modelling of LSBs
5-31
Figure 5.19: Bending Moment vs Vertical Deflection at Mid-Span Curves for
200x45x1.6 LSB (4000 mm Span)
Figure 5.20: Bending Moment vs Vertical Deflection at Mid-Span Curves for
300x60x2.0 LSB (4000 mm Span)
0.0
1.0
2.0
3.0
4.0
5.0
6.0
7.0
0 10 20 30 40 50 60 70
Vertical Deflection (mm)
Mom
ent (
kNm
)
EXPFEA
0.0
2.0
4.0
6.0
8.0
10.0
12.0
14.0
16.0
18.0
20.0
0 10 20 30 40 50 60 70
Vertical Deflection (mm)
Mom
ent (
kNm
)
EXPFEA
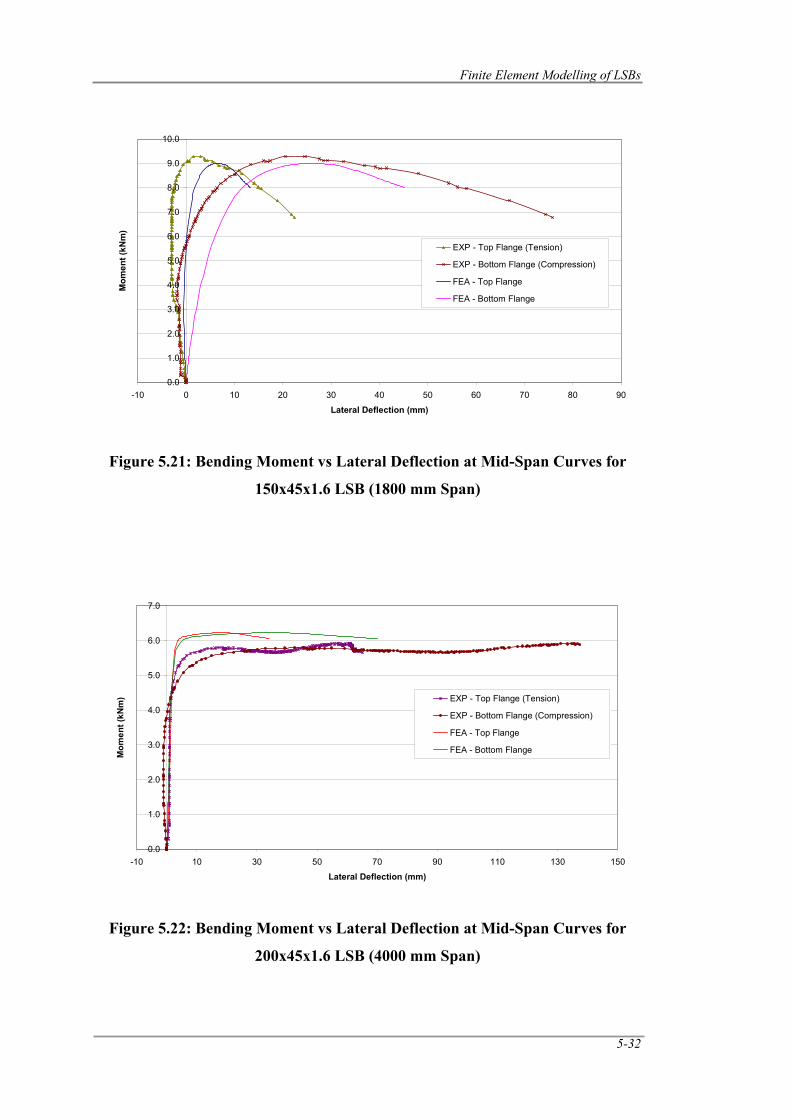
Finite Element Modelling of LSBs
5-32
Figure 5.21: Bending Moment vs Lateral Deflection at Mid-Span Curves for
150x45x1.6 LSB (1800 mm Span)
Figure 5.22: Bending Moment vs Lateral Deflection at Mid-Span Curves for
200x45x1.6 LSB (4000 mm Span)
0.0
1.0
2.0
3.0
4.0
5.0
6.0
7.0
8.0
9.0
10.0
-10 0 10 20 30 40 50 60 70 80 90
Lateral Deflection (mm)
Mom
ent (
kNm
)
EXP - Top Flange (Tension)
EXP - Bottom Flange (Compression)
FEA - Top Flange
FEA - Bottom Flange
0.0
1.0
2.0
3.0
4.0
5.0
6.0
7.0
-10 10 30 50 70 90 110 130 150
Lateral Deflection (mm)
Mom
ent (
kNm
) EXP - Top Flange (Tension)
EXP - Bottom Flange (Compression)
FEA - Top Flange
FEA - Bottom Flange
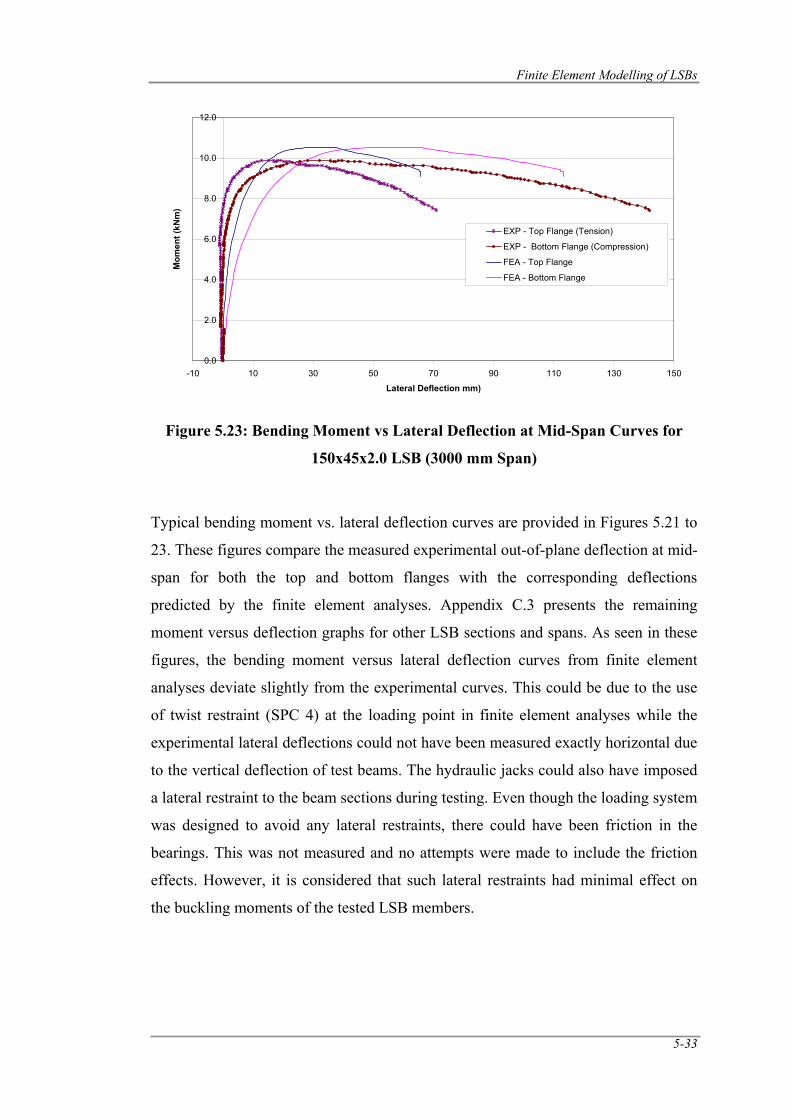
Finite Element Modelling of LSBs
5-33
Figure 5.23: Bending Moment vs Lateral Deflection at Mid-Span Curves for
150x45x2.0 LSB (3000 mm Span)
Typical bending moment vs. lateral deflection curves are provided in Figures 5.21 to
23. These figures compare the measured experimental out-of-plane deflection at mid-
span for both the top and bottom flanges with the corresponding deflections
predicted by the finite element analyses. Appendix C.3 presents the remaining
moment versus deflection graphs for other LSB sections and spans. As seen in these
figures, the bending moment versus lateral deflection curves from finite element
analyses deviate slightly from the experimental curves. This could be due to the use
of twist restraint (SPC 4) at the loading point in finite element analyses while the
experimental lateral deflections could not have been measured exactly horizontal due
to the vertical deflection of test beams. The hydraulic jacks could also have imposed
a lateral restraint to the beam sections during testing. Even though the loading system
was designed to avoid any lateral restraints, there could have been friction in the
bearings. This was not measured and no attempts were made to include the friction
effects. However, it is considered that such lateral restraints had minimal effect on
the buckling moments of the tested LSB members.
0.0
2.0
4.0
6.0
8.0
10.0
12.0
-10 10 30 50 70 90 110 130 150
Lateral Deflection mm)
Mom
ent (
kNm
)
EXP - Top Flange (Tension)
EXP - Bottom Flange (Compression)
FEA - Top Flange
FEA - Bottom Flange
Finite Element Modelling of LSBs
5-34
The comparisons provided in Table 5.8 and Figures 5.18 to 23 demonstrate that the
experimental finite element model predicts the ultimate failure moment accurately.
The mean ratio of the ultimate moment capacities from the finite element analyses
and experiments was 0.99 with a COV of 0.047. This result suggests that the
developed finite element model is accurate, considering the possible approximations
in the finite element models and limitations in the experimental measurements as
described above.
The finite element model provided reasonable comparisons with all the experimental
results. It is therefore reasonable to assume that the experimental comparisons
presented in this section establish the validity of the shell element model for explicit
modelling of initial geometric imperfections and residual stresses, lateral distortional
buckling deformations, and the associated material yielding. The suitability of the
residual stress model, geometric imperfection magnitudes, and the finite element
mesh density has also been verified.
5.4 Conclusions
This section has described the details of ideal and experimental finite element models
developed for the investigation into the behaviour and capacity of LSB flexural
members. The models accurately predicted both the elastic lateral distortional buckling
moments and the non-linear ultimate moment capacities of LiteSteel beam members
subject to pure bending. The models accounted for all the significant behavioural
effects including material inelasticity, lateral distortional buckling deformations,
member instability, web distortion, residual stresses, and geometric imperfections.
The models were validated by the comparison of elastic buckling and ultimate moment
capacity results with corresponding results from an established finite strip analysis
program Thin-Wall and Pi and Trahair’s (1997) equation, and experimental test
results, respectively. The validated model can be used for the development of design
curves for LSB flexural members.
Parametric Studies and Design Rule Development
6-1
CHAPTER 6
6.0 PARAMETRIC STUDIES AND DESIGN RULE DEVELOPMENT
6.1 Introduction
Chapter 4 provided the details of an experimental investigation into the lateral
distortional buckling behaviour of LiteSteel beams (LSBs) and the results while
Chapter 5 presented the details of finite element analyses of tested LSBs and the
results. Comparison of experimental results with the current design rules in AS/NZS
4600 (SA, 2005) for lateral distortional buckling showed that the experimental
results were on average about 13% higher than the predictions of the current design
rules while Mahaarachchi and Mahendran’s (2005a) experimental results were about
3% higher than the predictions of the current design rules. These comparisons
indicate that further improvements can be made to the current design rules for lateral
distortional buckling. Therefore a detailed parametric study was undertaken based on
the validated ideal finite element models of LSBs to improve the understanding and
knowledge of lateral distortional buckling behaviour of LSBs and to obtain
additional moment capacity results. It is important to understand the lateral
distortional buckling behaviour of LSBs as a function of their section geometry,
slenderness, geometric imperfections and residual stresses. The parametric study
included varying spans of the currently available 13 LSB sections manufactured by
OneSteel Australian Tube Mills. The results from the parametric study and
experimental investigation were then used to develop new/improved design rules.
This important chapter presents the details of parametric studies and the development
of design rules for lateral distortional buckling of LSBs.
Other types of hollow flange steel beams including the Hollow Flange Beam (HFB)
were also considered in this chapter to investigate the applicability of the developed
design rules to other hollow flange steel beams. Effects of geometric imperfections
and residual stresses on the member moment capacities of LSBs are also presented in
this chapter.
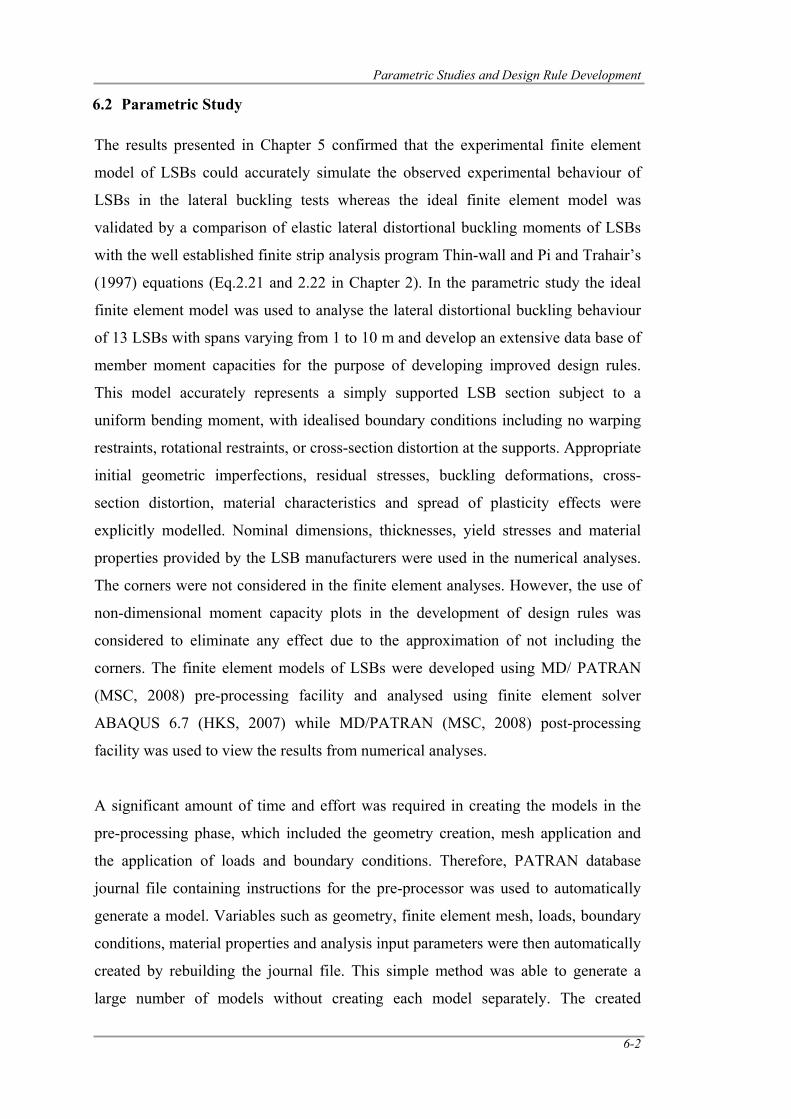
Parametric Studies and Design Rule Development
6-2
6.2 Parametric Study
The results presented in Chapter 5 confirmed that the experimental finite element
model of LSBs could accurately simulate the observed experimental behaviour of
LSBs in the lateral buckling tests whereas the ideal finite element model was
validated by a comparison of elastic lateral distortional buckling moments of LSBs
with the well established finite strip analysis program Thin-wall and Pi and Trahair’s
(1997) equations (Eq.2.21 and 2.22 in Chapter 2). In the parametric study the ideal
finite element model was used to analyse the lateral distortional buckling behaviour
of 13 LSBs with spans varying from 1 to 10 m and develop an extensive data base of
member moment capacities for the purpose of developing improved design rules.
This model accurately represents a simply supported LSB section subject to a
uniform bending moment, with idealised boundary conditions including no warping
restraints, rotational restraints, or cross-section distortion at the supports. Appropriate
initial geometric imperfections, residual stresses, buckling deformations, cross-
section distortion, material characteristics and spread of plasticity effects were
explicitly modelled. Nominal dimensions, thicknesses, yield stresses and material
properties provided by the LSB manufacturers were used in the numerical analyses.
The corners were not considered in the finite element analyses. However, the use of
non-dimensional moment capacity plots in the development of design rules was
considered to eliminate any effect due to the approximation of not including the
corners. The finite element models of LSBs were developed using MD/ PATRAN
(MSC, 2008) pre-processing facility and analysed using finite element solver
ABAQUS 6.7 (HKS, 2007) while MD/PATRAN (MSC, 2008) post-processing
facility was used to view the results from numerical analyses.
A significant amount of time and effort was required in creating the models in the
pre-processing phase, which included the geometry creation, mesh application and
the application of loads and boundary conditions. Therefore, PATRAN database
journal file containing instructions for the pre-processor was used to automatically
generate a model. Variables such as geometry, finite element mesh, loads, boundary
conditions, material properties and analysis input parameters were then automatically
created by rebuilding the journal file. This simple method was able to generate a
large number of models without creating each model separately. The created
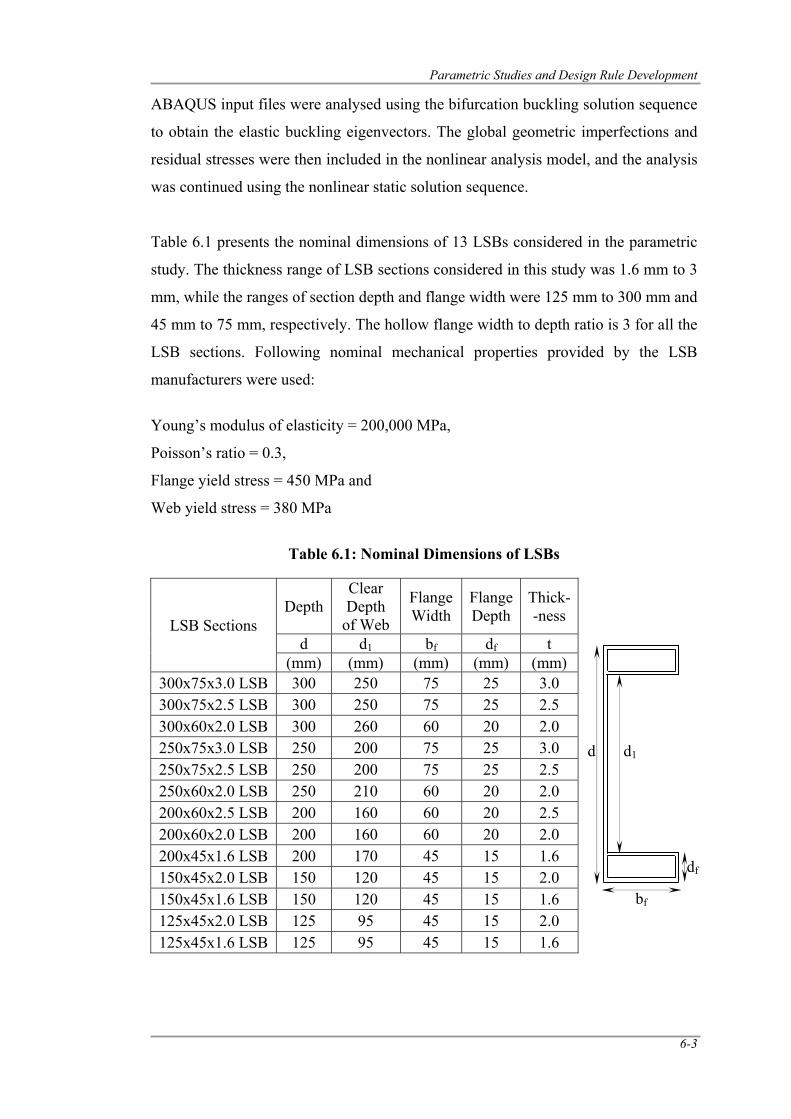
Parametric Studies and Design Rule Development
6-3
ABAQUS input files were analysed using the bifurcation buckling solution sequence
to obtain the elastic buckling eigenvectors. The global geometric imperfections and
residual stresses were then included in the nonlinear analysis model, and the analysis
was continued using the nonlinear static solution sequence.
Table 6.1 presents the nominal dimensions of 13 LSBs considered in the parametric
study. The thickness range of LSB sections considered in this study was 1.6 mm to 3
mm, while the ranges of section depth and flange width were 125 mm to 300 mm and
45 mm to 75 mm, respectively. The hollow flange width to depth ratio is 3 for all the
LSB sections. Following nominal mechanical properties provided by the LSB
manufacturers were used:
Young’s modulus of elasticity = 200,000 MPa,
Poisson’s ratio = 0.3,
Flange yield stress = 450 MPa and
Web yield stress = 380 MPa
Table 6.1: Nominal Dimensions of LSBs
LSB Sections Depth
Clear Depth
of Web
Flange Width
Flange Depth
Thick--ness
d d1 bf df t (mm) (mm) (mm) (mm) (mm)
300x75x3.0 LSB 300 250 75 25 3.0 300x75x2.5 LSB 300 250 75 25 2.5 300x60x2.0 LSB 300 260 60 20 2.0 250x75x3.0 LSB 250 200 75 25 3.0 250x75x2.5 LSB 250 200 75 25 2.5 250x60x2.0 LSB 250 210 60 20 2.0 200x60x2.5 LSB 200 160 60 20 2.5 200x60x2.0 LSB 200 160 60 20 2.0 200x45x1.6 LSB 200 170 45 15 1.6 150x45x2.0 LSB 150 120 45 15 2.0 150x45x1.6 LSB 150 120 45 15 1.6 125x45x2.0 LSB 125 95 45 15 2.0 125x45x1.6 LSB 125 95 45 15 1.6
bf
d1
df
d
Parametric Studies and Design Rule Development
6-4
Based on AS/NZS 4600 (SA, 2005) design rules for local buckling, the web and
flange plate elements of all the LSB sections are fully effective if corners are
included. In this case, the effective section modulus is equal to the full section
modulus when the maximum compressive flange stress is taken as its yield stress.
However, if corners are not included as assumed in the finite element models, the
effective section moduli of five LSB sections are about 2% less than their full section
moduli. Local buckling could therefore occur in the case of these slender LSB
sections with short spans. However, the ultimate moment capacity results of such
cases were not considered in this research as it was focussed on lateral buckling only.
Appendix D.1 provides the sample calculations for the effective section moduli of
LSB sections.
6.3 Lateral Distortional Buckling Behaviour and Strength of LSBs
Due to the presence of torsionally rigid rectangular hollow flanges and a relatively
slender web, the dominant failure mode of LSBs is lateral distortional buckling. The
lateral distortional buckling behaviour of LSBs made of thin and high strength steel
is complicated and is dependent on a number of parameters including section
geometry. Initial geometric imperfection direction and residual stresses are also
considered critical for the lateral distortional buckling capacities of LSBs. The
effects of imperfection direction and residual stresses on the ultimate moment
capacities of LSBs are presented in this section while the effects of section geometry
will be presented later in this chapter.
6.3.1 Effects of Initial Geometric Imperfection Direction
Initial geometric imperfections are present in real beams and their magnitude and
direction influence the moment capacities of LSBs subject to lateral distortional
buckling. Past research has shown that the presence of initial geometric imperfection
reduces the capacity of LSBs. However, the effect of the direction of initial
geometric imperfection of LSBs on the moment capacity is not well understood.
Since LSBs are mono-symmetric sections their imperfection direction is likely to
have a significant effect on their moment capacity (Kurniawan and Mahendran,
2009b). Figure 6.1 shows the positive and negative imperfection directions of LSBs.
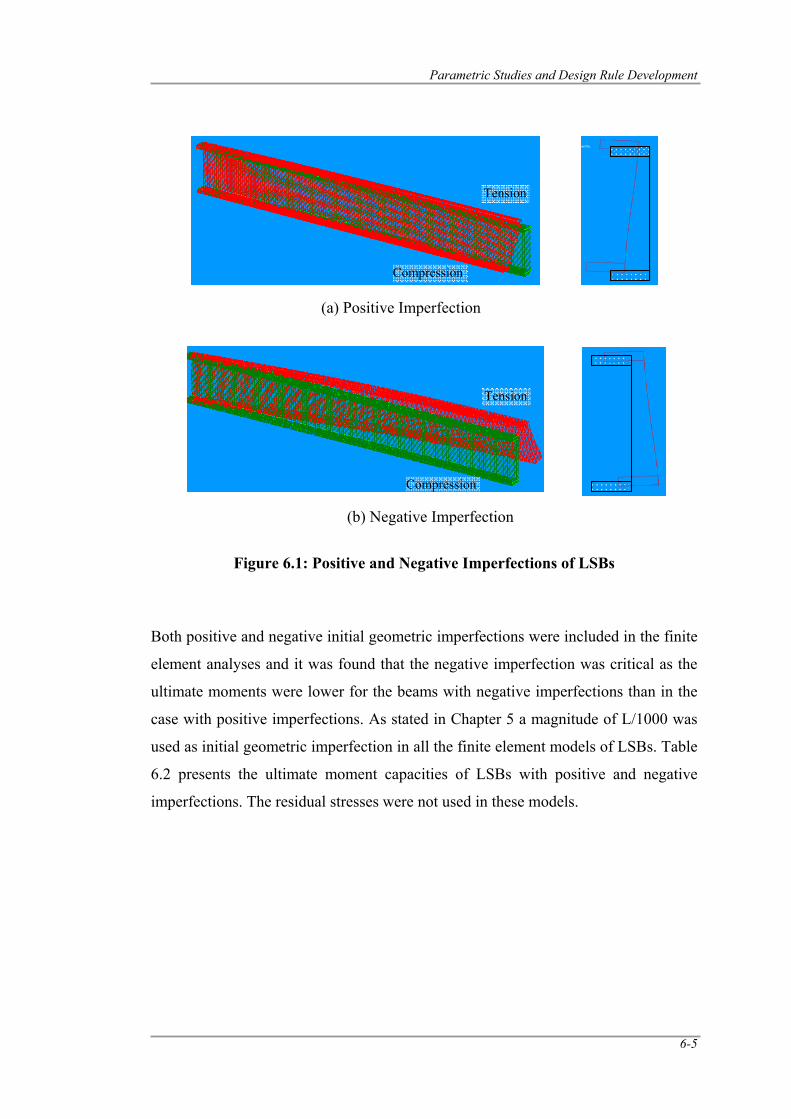
Parametric Studies and Design Rule Development
6-5
Figure 6.1: Positive and Negative Imperfections of LSBs
Both positive and negative initial geometric imperfections were included in the finite
element analyses and it was found that the negative imperfection was critical as the
ultimate moments were lower for the beams with negative imperfections than in the
case with positive imperfections. As stated in Chapter 5 a magnitude of L/1000 was
used as initial geometric imperfection in all the finite element models of LSBs. Table
6.2 presents the ultimate moment capacities of LSBs with positive and negative
imperfections. The residual stresses were not used in these models.
(a) Positive Imperfection
Tension
Compression
(b) Negative Imperfection
Tension
Compression
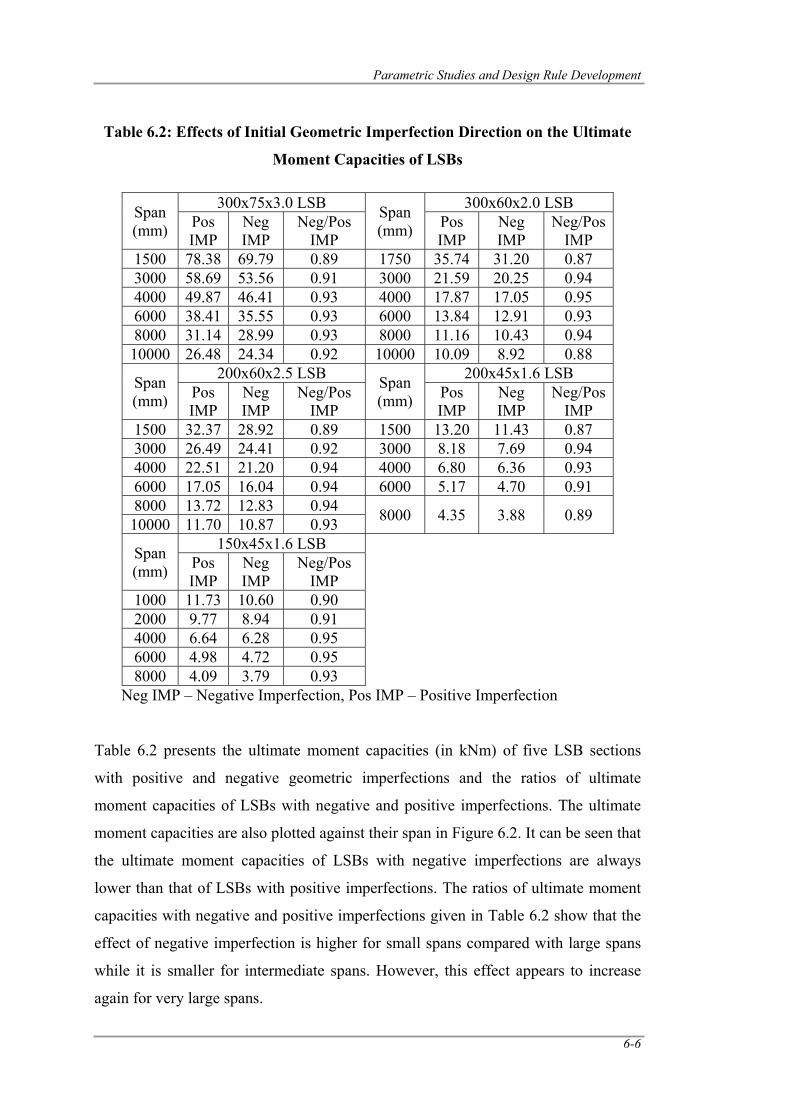
Parametric Studies and Design Rule Development
6-6
Table 6.2: Effects of Initial Geometric Imperfection Direction on the Ultimate
Moment Capacities of LSBs
Span (mm)
300x75x3.0 LSB Span (mm)
300x60x2.0 LSB Pos IMP
Neg IMP
Neg/Pos IMP
Pos IMP
Neg IMP
Neg/Pos IMP
1500 78.38 69.79 0.89 1750 35.74 31.20 0.87 3000 58.69 53.56 0.91 3000 21.59 20.25 0.94 4000 49.87 46.41 0.93 4000 17.87 17.05 0.95 6000 38.41 35.55 0.93 6000 13.84 12.91 0.93 8000 31.14 28.99 0.93 8000 11.16 10.43 0.94 10000 26.48 24.34 0.92 10000 10.09 8.92 0.88
Span (mm)
200x60x2.5 LSB Span (mm)
200x45x1.6 LSB Pos IMP
Neg IMP
Neg/Pos IMP
Pos IMP
Neg IMP
Neg/Pos IMP
1500 32.37 28.92 0.89 1500 13.20 11.43 0.87 3000 26.49 24.41 0.92 3000 8.18 7.69 0.94 4000 22.51 21.20 0.94 4000 6.80 6.36 0.93 6000 17.05 16.04 0.94 6000 5.17 4.70 0.91 8000 13.72 12.83 0.94 8000 4.35 3.88 0.89 10000 11.70 10.87 0.93
Span (mm)
150x45x1.6 LSB Pos IMP
Neg IMP
Neg/Pos IMP
1000 11.73 10.60 0.90 2000 9.77 8.94 0.91 4000 6.64 6.28 0.95 6000 4.98 4.72 0.95 8000 4.09 3.79 0.93
Neg IMP – Negative Imperfection, Pos IMP – Positive Imperfection
Table 6.2 presents the ultimate moment capacities (in kNm) of five LSB sections
with positive and negative geometric imperfections and the ratios of ultimate
moment capacities of LSBs with negative and positive imperfections. The ultimate
moment capacities are also plotted against their span in Figure 6.2. It can be seen that
the ultimate moment capacities of LSBs with negative imperfections are always
lower than that of LSBs with positive imperfections. The ratios of ultimate moment
capacities with negative and positive imperfections given in Table 6.2 show that the
effect of negative imperfection is higher for small spans compared with large spans
while it is smaller for intermediate spans. However, this effect appears to increase
again for very large spans.
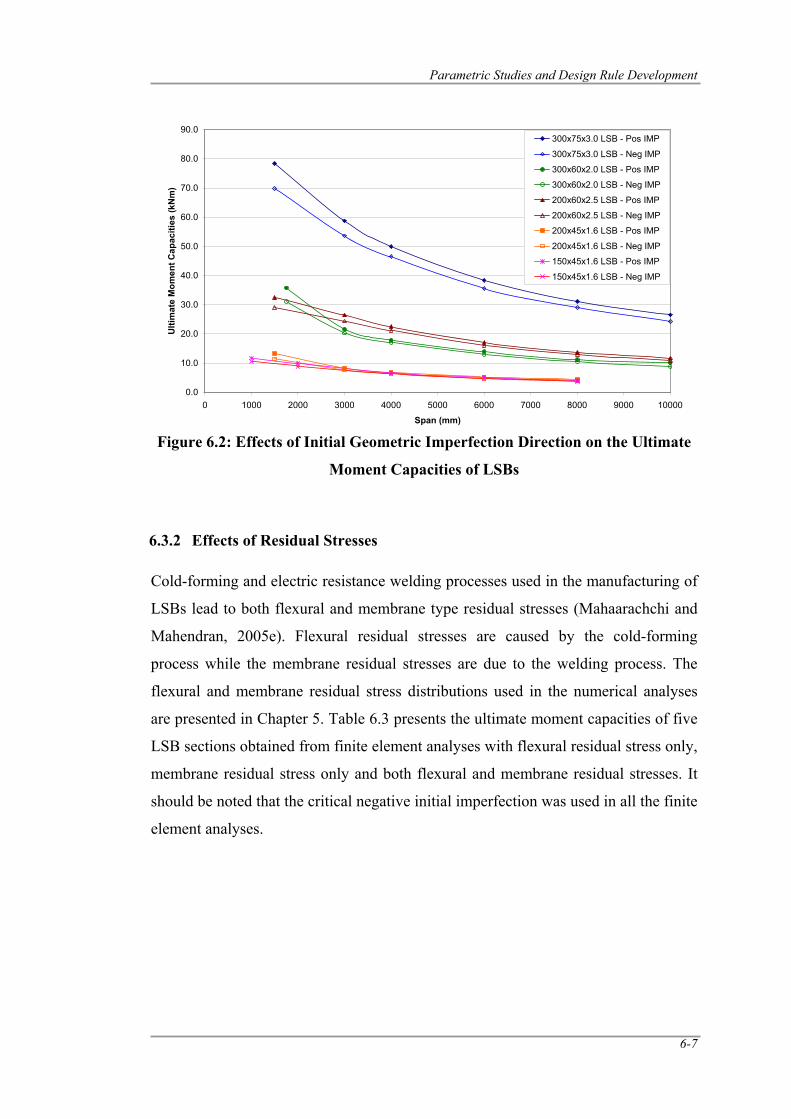
Parametric Studies and Design Rule Development
6-7
Figure 6.2: Effects of Initial Geometric Imperfection Direction on the Ultimate
Moment Capacities of LSBs
6.3.2 Effects of Residual Stresses
Cold-forming and electric resistance welding processes used in the manufacturing of
LSBs lead to both flexural and membrane type residual stresses (Mahaarachchi and
Mahendran, 2005e). Flexural residual stresses are caused by the cold-forming
process while the membrane residual stresses are due to the welding process. The
flexural and membrane residual stress distributions used in the numerical analyses
are presented in Chapter 5. Table 6.3 presents the ultimate moment capacities of five
LSB sections obtained from finite element analyses with flexural residual stress only,
membrane residual stress only and both flexural and membrane residual stresses. It
should be noted that the critical negative initial imperfection was used in all the finite
element analyses.
0.0
10.0
20.0
30.0
40.0
50.0
60.0
70.0
80.0
90.0
0 1000 2000 3000 4000 5000 6000 7000 8000 9000 10000
Span (mm)
Ulti
mat
e M
omen
t Cap
aciti
es (k
Nm
)
300x75x3.0 LSB - Pos IMP
300x75x3.0 LSB - Neg IMP
300x60x2.0 LSB - Pos IMP
300x60x2.0 LSB - Neg IMP
200x60x2.5 LSB - Pos IMP
200x60x2.5 LSB - Neg IMP
200x45x1.6 LSB - Pos IMP
200x45x1.6 LSB - Neg IMP
150x45x1.6 LSB - Pos IMP
150x45x1.6 LSB - Neg IMP
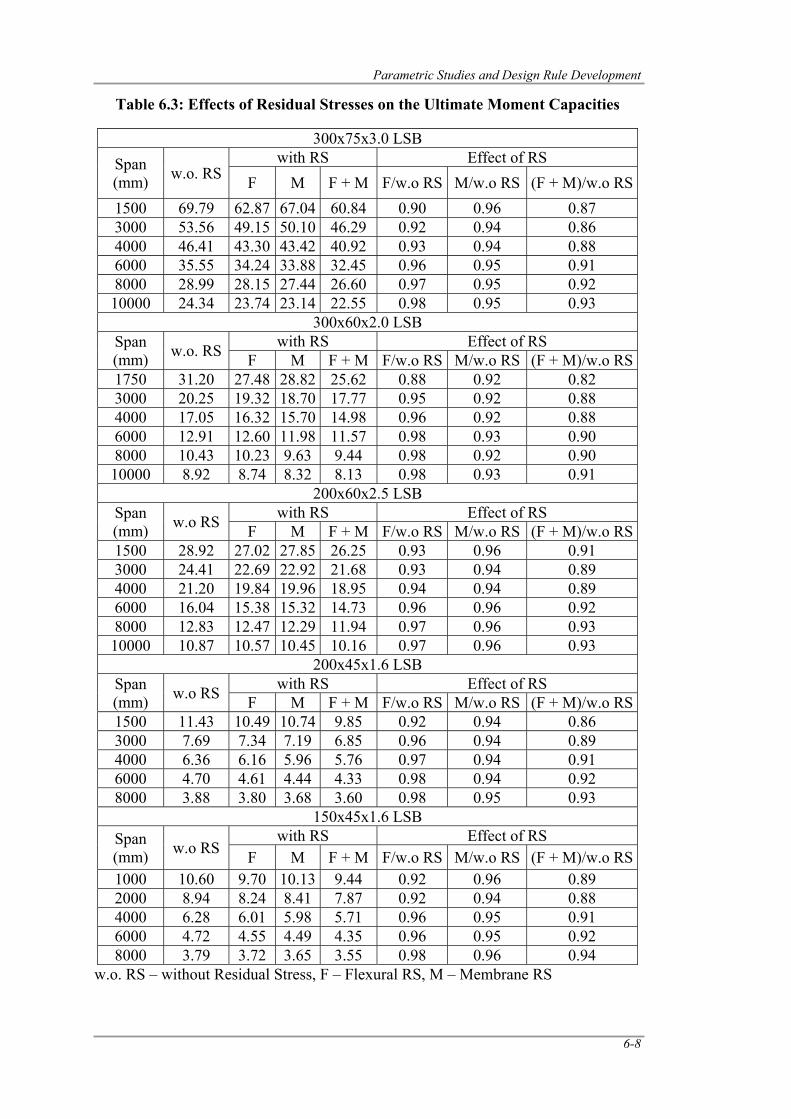
Parametric Studies and Design Rule Development
6-8
Table 6.3: Effects of Residual Stresses on the Ultimate Moment Capacities
300x75x3.0 LSB Span (mm) w.o. RS
with RS Effect of RS F M F + M F/w.o RS M/w.o RS (F + M)/w.o RS
1500 69.79 62.87 67.04 60.84 0.90 0.96 0.87 3000 53.56 49.15 50.10 46.29 0.92 0.94 0.86 4000 46.41 43.30 43.42 40.92 0.93 0.94 0.88 6000 35.55 34.24 33.88 32.45 0.96 0.95 0.91 8000 28.99 28.15 27.44 26.60 0.97 0.95 0.92 10000 24.34 23.74 23.14 22.55 0.98 0.95 0.93
300x60x2.0 LSB Span (mm) w.o. RS with RS Effect of RS
F M F + M F/w.o RS M/w.o RS (F + M)/w.o RS 1750 31.20 27.48 28.82 25.62 0.88 0.92 0.82 3000 20.25 19.32 18.70 17.77 0.95 0.92 0.88 4000 17.05 16.32 15.70 14.98 0.96 0.92 0.88 6000 12.91 12.60 11.98 11.57 0.98 0.93 0.90 8000 10.43 10.23 9.63 9.44 0.98 0.92 0.90 10000 8.92 8.74 8.32 8.13 0.98 0.93 0.91
200x60x2.5 LSB Span (mm) w.o RS with RS Effect of RS
F M F + M F/w.o RS M/w.o RS (F + M)/w.o RS 1500 28.92 27.02 27.85 26.25 0.93 0.96 0.91 3000 24.41 22.69 22.92 21.68 0.93 0.94 0.89 4000 21.20 19.84 19.96 18.95 0.94 0.94 0.89 6000 16.04 15.38 15.32 14.73 0.96 0.96 0.92 8000 12.83 12.47 12.29 11.94 0.97 0.96 0.93 10000 10.87 10.57 10.45 10.16 0.97 0.96 0.93
200x45x1.6 LSB Span (mm) w.o RS with RS Effect of RS
F M F + M F/w.o RS M/w.o RS (F + M)/w.o RS 1500 11.43 10.49 10.74 9.85 0.92 0.94 0.86 3000 7.69 7.34 7.19 6.85 0.96 0.94 0.89 4000 6.36 6.16 5.96 5.76 0.97 0.94 0.91 6000 4.70 4.61 4.44 4.33 0.98 0.94 0.92 8000 3.88 3.80 3.68 3.60 0.98 0.95 0.93
150x45x1.6 LSB Span (mm) w.o RS
with RS Effect of RS F M F + M F/w.o RS M/w.o RS (F + M)/w.o RS
1000 10.60 9.70 10.13 9.44 0.92 0.96 0.89 2000 8.94 8.24 8.41 7.87 0.92 0.94 0.88 4000 6.28 6.01 5.98 5.71 0.96 0.95 0.91 6000 4.72 4.55 4.49 4.35 0.96 0.95 0.92 8000 3.79 3.72 3.65 3.55 0.98 0.96 0.94
w.o. RS – without Residual Stress, F – Flexural RS, M – Membrane RS
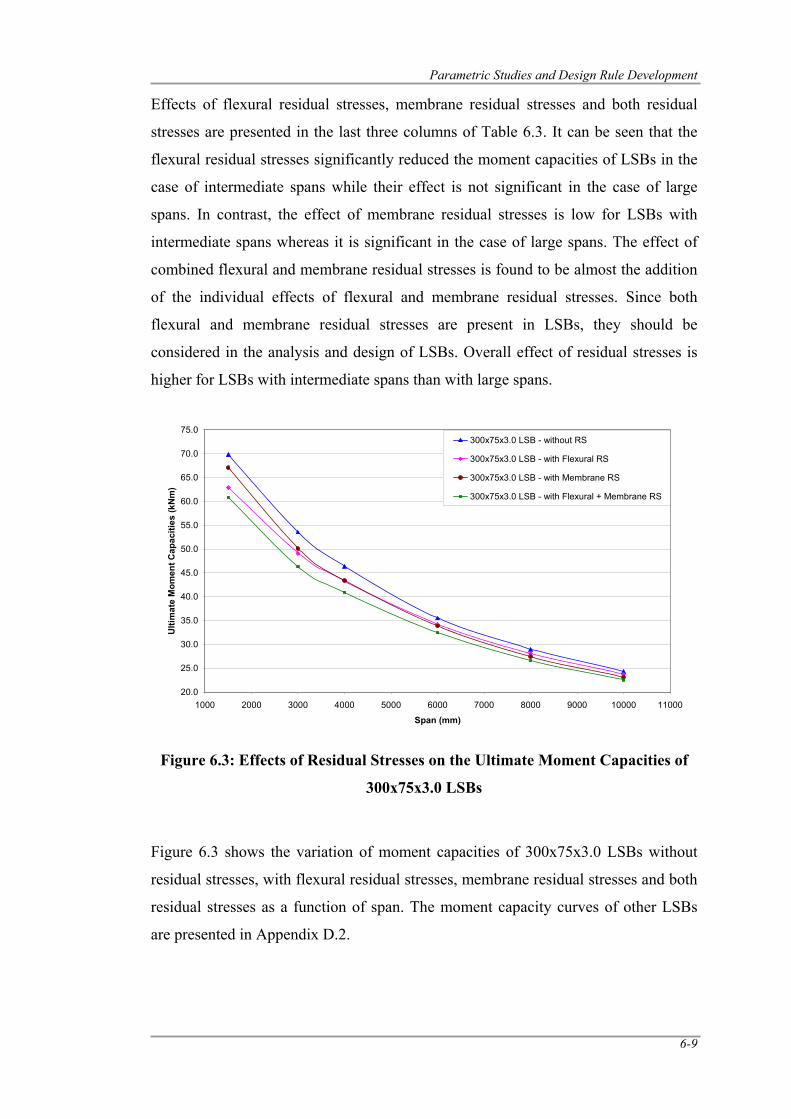
Parametric Studies and Design Rule Development
6-9
Effects of flexural residual stresses, membrane residual stresses and both residual
stresses are presented in the last three columns of Table 6.3. It can be seen that the
flexural residual stresses significantly reduced the moment capacities of LSBs in the
case of intermediate spans while their effect is not significant in the case of large
spans. In contrast, the effect of membrane residual stresses is low for LSBs with
intermediate spans whereas it is significant in the case of large spans. The effect of
combined flexural and membrane residual stresses is found to be almost the addition
of the individual effects of flexural and membrane residual stresses. Since both
flexural and membrane residual stresses are present in LSBs, they should be
considered in the analysis and design of LSBs. Overall effect of residual stresses is
higher for LSBs with intermediate spans than with large spans.
Figure 6.3: Effects of Residual Stresses on the Ultimate Moment Capacities of
300x75x3.0 LSBs
Figure 6.3 shows the variation of moment capacities of 300x75x3.0 LSBs without
residual stresses, with flexural residual stresses, membrane residual stresses and both
residual stresses as a function of span. The moment capacity curves of other LSBs
are presented in Appendix D.2.
20.0
25.0
30.0
35.0
40.0
45.0
50.0
55.0
60.0
65.0
70.0
75.0
1000 2000 3000 4000 5000 6000 7000 8000 9000 10000 11000
Span (mm)
Ulti
mat
e M
omen
t Cap
aciti
es (k
Nm
)
300x75x3.0 LSB - without RS
300x75x3.0 LSB - with Flexural RS
300x75x3.0 LSB - with Membrane RS
300x75x3.0 LSB - with Flexural + Membrane RS
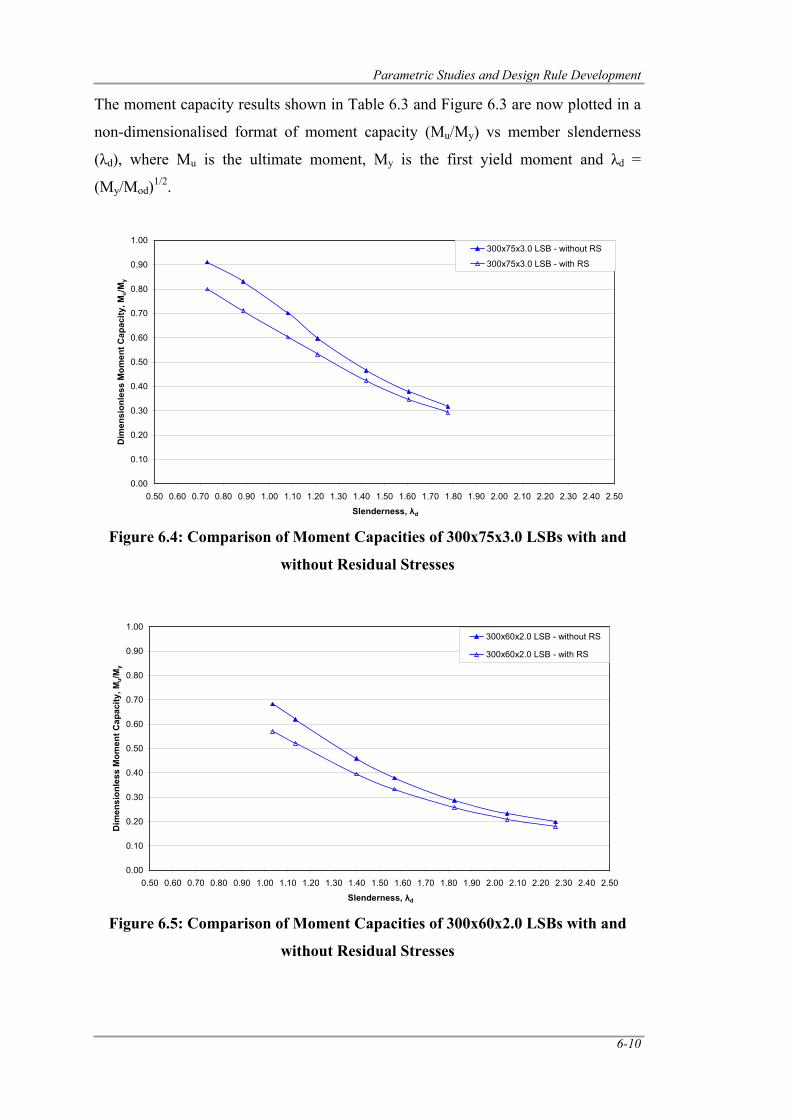
Parametric Studies and Design Rule Development
6-10
The moment capacity results shown in Table 6.3 and Figure 6.3 are now plotted in a
non-dimensionalised format of moment capacity (Mu/My) vs member slenderness
(λd), where Mu is the ultimate moment, My is the first yield moment and λd =
(My/Mod)1/2.
Figure 6.4: Comparison of Moment Capacities of 300x75x3.0 LSBs with and
without Residual Stresses
Figure 6.5: Comparison of Moment Capacities of 300x60x2.0 LSBs with and
without Residual Stresses
0.00
0.10
0.20
0.30
0.40
0.50
0.60
0.70
0.80
0.90
1.00
0.50 0.60 0.70 0.80 0.90 1.00 1.10 1.20 1.30 1.40 1.50 1.60 1.70 1.80 1.90 2.00 2.10 2.20 2.30 2.40 2.50
Slenderness, λd
Dim
ensi
onle
ss M
omen
t Cap
acity
, Mu/M
y
300x75x3.0 LSB - without RS
300x75x3.0 LSB - with RS
0.00
0.10
0.20
0.30
0.40
0.50
0.60
0.70
0.80
0.90
1.00
0.50 0.60 0.70 0.80 0.90 1.00 1.10 1.20 1.30 1.40 1.50 1.60 1.70 1.80 1.90 2.00 2.10 2.20 2.30 2.40 2.50
Slenderness, λd
Dim
ensi
onle
ss M
omen
t Cap
acity
, Mu/M
y
300x60x2.0 LSB - without RS
300x60x2.0 LSB - with RS
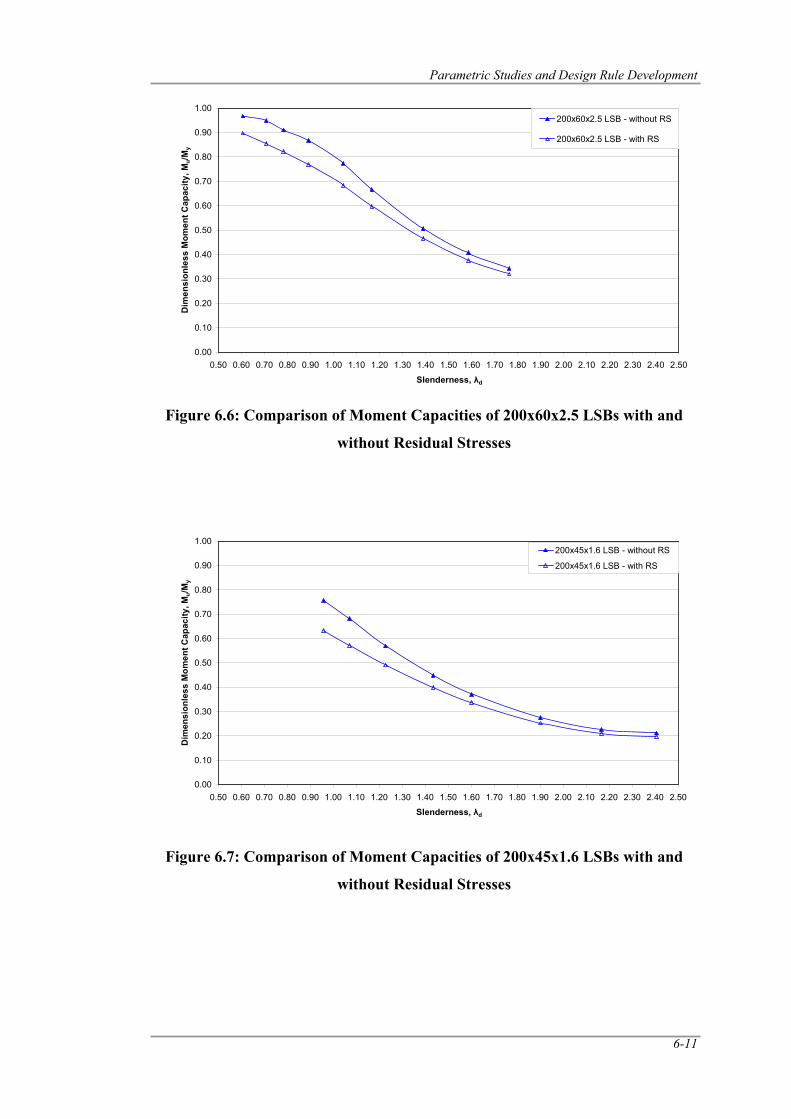
Parametric Studies and Design Rule Development
6-11
Figure 6.6: Comparison of Moment Capacities of 200x60x2.5 LSBs with and
without Residual Stresses
Figure 6.7: Comparison of Moment Capacities of 200x45x1.6 LSBs with and
without Residual Stresses
0.00
0.10
0.20
0.30
0.40
0.50
0.60
0.70
0.80
0.90
1.00
0.50 0.60 0.70 0.80 0.90 1.00 1.10 1.20 1.30 1.40 1.50 1.60 1.70 1.80 1.90 2.00 2.10 2.20 2.30 2.40 2.50
Slenderness, λd
Dim
ensi
onle
ss M
omen
t Cap
acity
, Mu/M
y
200x45x1.6 LSB - without RS
200x45x1.6 LSB - with RS
0.00
0.10
0.20
0.30
0.40
0.50
0.60
0.70
0.80
0.90
1.00
0.50 0.60 0.70 0.80 0.90 1.00 1.10 1.20 1.30 1.40 1.50 1.60 1.70 1.80 1.90 2.00 2.10 2.20 2.30 2.40 2.50
Slenderness, λd
Dim
ensi
onle
ss M
omen
t Cap
acity
, Mu/M
y
200x60x2.5 LSB - without RS
200x60x2.5 LSB - with RS
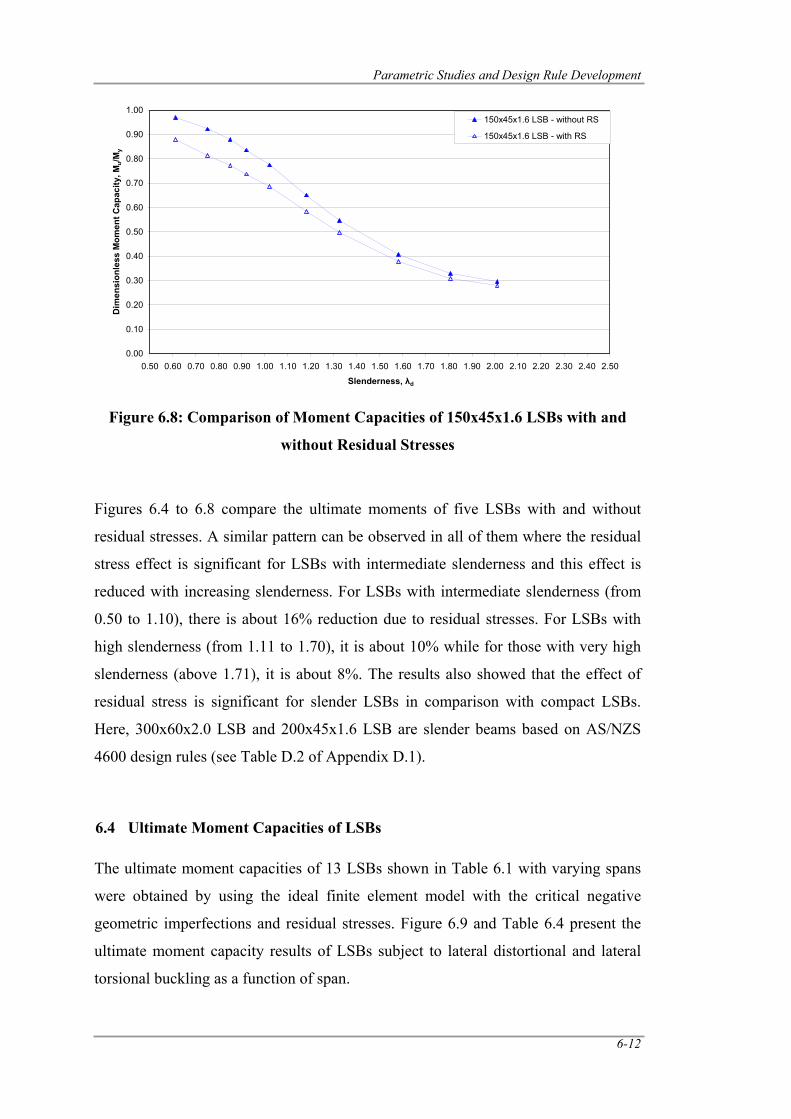
Parametric Studies and Design Rule Development
6-12
Figure 6.8: Comparison of Moment Capacities of 150x45x1.6 LSBs with and
without Residual Stresses
Figures 6.4 to 6.8 compare the ultimate moments of five LSBs with and without
residual stresses. A similar pattern can be observed in all of them where the residual
stress effect is significant for LSBs with intermediate slenderness and this effect is
reduced with increasing slenderness. For LSBs with intermediate slenderness (from
0.50 to 1.10), there is about 16% reduction due to residual stresses. For LSBs with
high slenderness (from 1.11 to 1.70), it is about 10% while for those with very high
slenderness (above 1.71), it is about 8%. The results also showed that the effect of
residual stress is significant for slender LSBs in comparison with compact LSBs.
Here, 300x60x2.0 LSB and 200x45x1.6 LSB are slender beams based on AS/NZS
4600 design rules (see Table D.2 of Appendix D.1).
6.4 Ultimate Moment Capacities of LSBs
The ultimate moment capacities of 13 LSBs shown in Table 6.1 with varying spans
were obtained by using the ideal finite element model with the critical negative
geometric imperfections and residual stresses. Figure 6.9 and Table 6.4 present the
ultimate moment capacity results of LSBs subject to lateral distortional and lateral
torsional buckling as a function of span.
0.00
0.10
0.20
0.30
0.40
0.50
0.60
0.70
0.80
0.90
1.00
0.50 0.60 0.70 0.80 0.90 1.00 1.10 1.20 1.30 1.40 1.50 1.60 1.70 1.80 1.90 2.00 2.10 2.20 2.30 2.40 2.50
Slenderness, λd
Dim
ensi
onle
ss M
omen
t Cap
acity
, Mu/M
y150x45x1.6 LSB - without RS
150x45x1.6 LSB - with RS
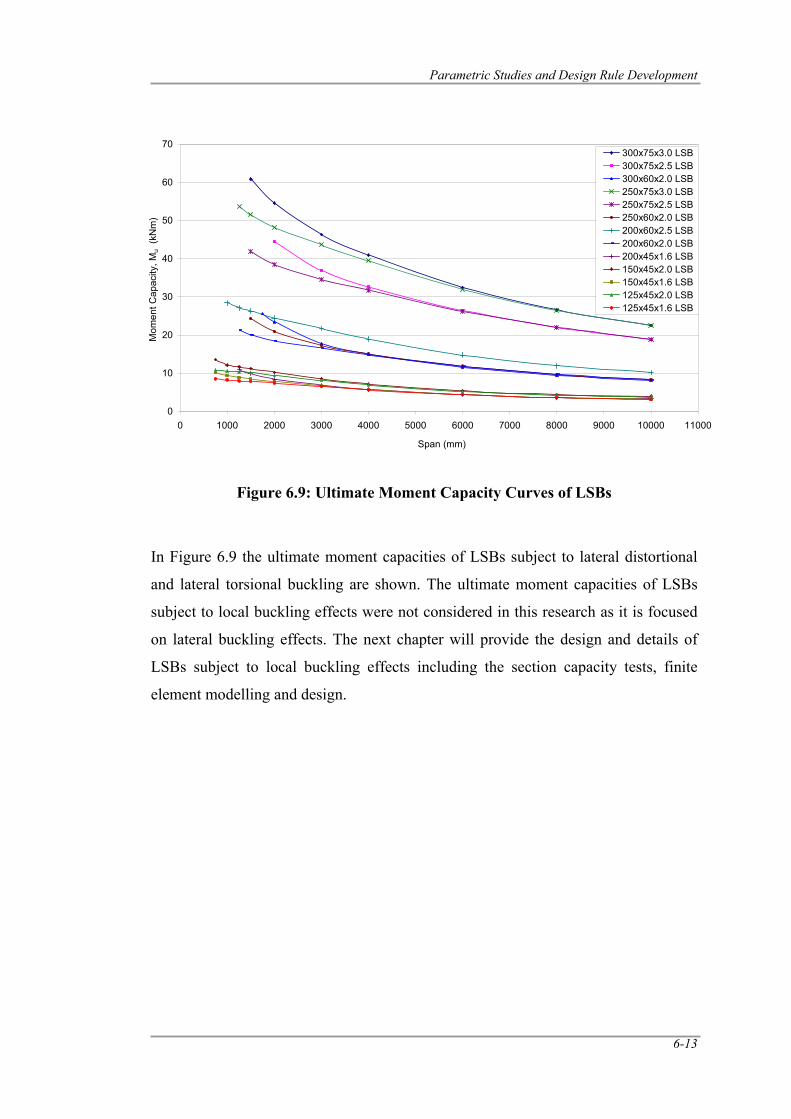
Parametric Studies and Design Rule Development
6-13
Figure 6.9: Ultimate Moment Capacity Curves of LSBs
In Figure 6.9 the ultimate moment capacities of LSBs subject to lateral distortional
and lateral torsional buckling are shown. The ultimate moment capacities of LSBs
subject to local buckling effects were not considered in this research as it is focused
on lateral buckling effects. The next chapter will provide the design and details of
LSBs subject to local buckling effects including the section capacity tests, finite
element modelling and design.
0
10
20
30
40
50
60
70
0 1000 2000 3000 4000 5000 6000 7000 8000 9000 10000 11000
Span (mm)
Mom
ent C
apac
ity, M
u (k
Nm
)300x75x3.0 LSB300x75x2.5 LSB300x60x2.0 LSB250x75x3.0 LSB250x75x2.5 LSB250x60x2.0 LSB200x60x2.5 LSB200x60x2.0 LSB200x45x1.6 LSB150x45x2.0 LSB150x45x1.6 LSB125x45x2.0 LSB125x45x1.6 LSB
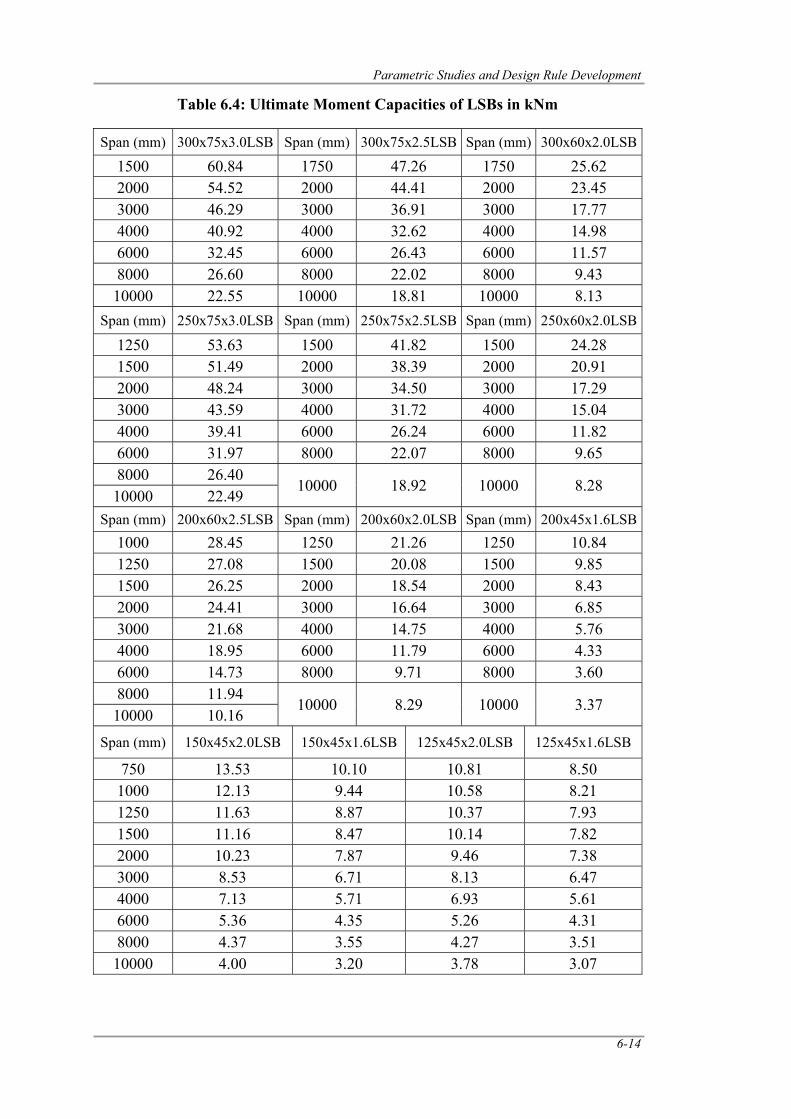
Parametric Studies and Design Rule Development
6-14
Table 6.4: Ultimate Moment Capacities of LSBs in kNm Span (mm) 300x75x3.0LSB Span (mm) 300x75x2.5LSB Span (mm) 300x60x2.0LSB
1500 60.84 1750 47.26 1750 25.62 2000 54.52 2000 44.41 2000 23.45 3000 46.29 3000 36.91 3000 17.77 4000 40.92 4000 32.62 4000 14.98 6000 32.45 6000 26.43 6000 11.57 8000 26.60 8000 22.02 8000 9.43 10000 22.55 10000 18.81 10000 8.13
Span (mm) 250x75x3.0LSB Span (mm) 250x75x2.5LSB Span (mm) 250x60x2.0LSB
1250 53.63 1500 41.82 1500 24.28 1500 51.49 2000 38.39 2000 20.91 2000 48.24 3000 34.50 3000 17.29 3000 43.59 4000 31.72 4000 15.04 4000 39.41 6000 26.24 6000 11.82 6000 31.97 8000 22.07 8000 9.65 8000 26.40
10000 18.92 10000 8.28 10000 22.49
Span (mm) 200x60x2.5LSB Span (mm) 200x60x2.0LSB Span (mm) 200x45x1.6LSB 1000 28.45 1250 21.26 1250 10.84 1250 27.08 1500 20.08 1500 9.85 1500 26.25 2000 18.54 2000 8.43 2000 24.41 3000 16.64 3000 6.85 3000 21.68 4000 14.75 4000 5.76 4000 18.95 6000 11.79 6000 4.33 6000 14.73 8000 9.71 8000 3.60 8000 11.94
10000 8.29 10000 3.37 10000 10.16
Span (mm) 150x45x2.0LSB 150x45x1.6LSB 125x45x2.0LSB 125x45x1.6LSB
750 13.53 10.10 10.81 8.50 1000 12.13 9.44 10.58 8.21 1250 11.63 8.87 10.37 7.93 1500 11.16 8.47 10.14 7.82 2000 10.23 7.87 9.46 7.38 3000 8.53 6.71 8.13 6.47 4000 7.13 5.71 6.93 5.61 6000 5.36 4.35 5.26 4.31 8000 4.37 3.55 4.27 3.51 10000 4.00 3.20 3.78 3.07
Parametric Studies and Design Rule Development
6-15
As seen from the results of LSBs with intermediate slenderness, the moment capacity
is reduced below the first yield moment due to the interaction of yielding and
buckling effects. This inelastic lateral distortional buckling capacity is influenced by
residual stress distributions and initial geometric imperfections. For LSBs with high
slenderness, the ultimate moment capacity can be predicted approximately by the
elastic lateral distortional buckling moment Mod. This indicates that the effects of
yielding, residual stresses and initial geometric imperfections are very small for
slender beams. Figure 6.9 shows that the moment capacity curves of LSBs with
identical flange properties merge with increasing span. For example,
• Group 1 – 300x75x3.0 LSB and 250x75x3.0 LSB
• Group 2 – 300x75x2.5 LSB and 250x75x2.5 LSB
• Group 3 – 300x60x20 LSB, 250x60x2.0 and 200x60x2.0 LSB
It was also observed that for LSBs with very high slenderness, the ultimate moment
capacity exceeded the elastic lateral distortional buckling moment. This is due to the
effects of pre-buckling deflections, which transform a straight beam into a “negative
arch” and thus increases its moment capacity (Trahair, 1993), in particular for small
beams such as the 150 and 125 LSBs with spans more than 8000 mm. However, this
effect can be ignored as it is unlikely for very slender beams to be used without any
lateral restraint.
6.5 Comparison of Member Moment Capacities of LSBs with AS/NZS 4600
(SA, 2005) Design Rules
In this section, the ultimate moment capacities of LSBs obtained from finite element
analyses are compared with the predictions from the current design rules in AS/NZS
4600 (SA, 2005). Clause 3.3.3.3(b) of AS/NZS 4600 (SA, 2005) presents the design
rules for members subject to bending under distortional buckling that involves
transverse bending of a vertical web with lateral displacement of the compression
flange. The member moment capacity, Mb, is given by Equation 6.1:
⎟⎠⎞
⎜⎝⎛=
ZZMM e
cb (6.1)
Parametric Studies and Design Rule Development
6-16
where
Z = full section modulus
Mc = critical moment
Ze = effective section modulus
For LSBs, it is appropriate to determine the effective section modulus at a stress
corresponding to Mc/Z, where Mc is the critical moment as defined in Equation 6.2.
For λd ≤ 0.59: Mc = My (6.2a)
For 0.59 < λd < 1.70: ⎟⎠⎞
⎜⎝⎛=
dyc MM
λ59.0 (6.2b)
For λd ≥ 1.70: ⎟⎠⎞
⎜⎝⎛= 2
1d
yc MMλ
(6.2c)
where
λd = member slenderness (Equation 6.3)
My = first yield moment
od
yd
MM
=λ (6.3)
The elastic lateral distortional buckling moment Mod can be calculated using Pi and
Trahair’s (1997) equations as provided in Equations 6.4 and 6.5 or an elastic
buckling analysis program such as Thin-Wall or CUFSM.
⎟⎟
⎠
⎞
⎜⎜
⎝
⎛+= 2
2
2
2
LEIGJ
LEIM w
ey
odππ (6.4)
where
EIy = minor axis flexural rigidity
EIw = warping rigidity
GJe = effective torsional rigidity
L = span
The effective torsional rigidity (GJe) is given by Equation 6.5:
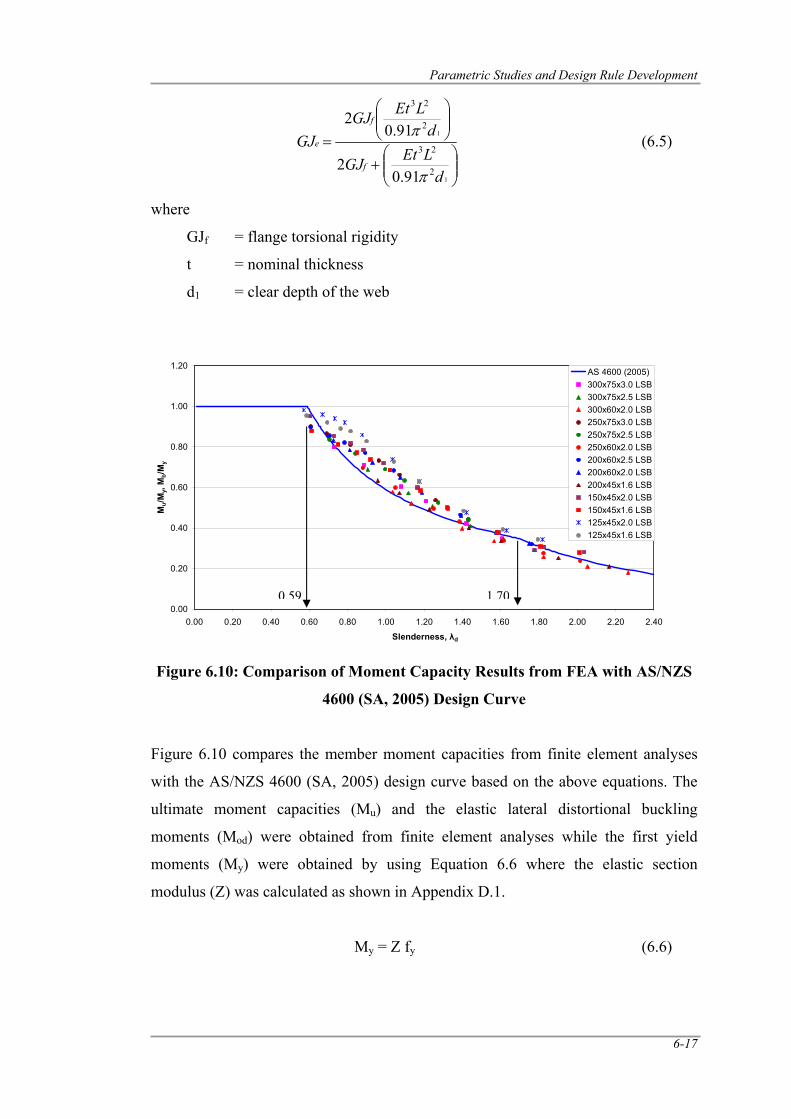
Parametric Studies and Design Rule Development
6-17
⎟⎟⎠
⎞⎜⎜⎝
⎛+
⎟⎟⎠
⎞⎜⎜⎝
⎛
=
1
1
2
23
2
23
91.02
91.02
dLEtGJ
dLEtGJ
GJf
f
e
π
π (6.5)
where
GJf = flange torsional rigidity
t = nominal thickness
d1 = clear depth of the web
Figure 6.10: Comparison of Moment Capacity Results from FEA with AS/NZS
4600 (SA, 2005) Design Curve
Figure 6.10 compares the member moment capacities from finite element analyses
with the AS/NZS 4600 (SA, 2005) design curve based on the above equations. The
ultimate moment capacities (Mu) and the elastic lateral distortional buckling
moments (Mod) were obtained from finite element analyses while the first yield
moments (My) were obtained by using Equation 6.6 where the elastic section
modulus (Z) was calculated as shown in Appendix D.1.
My = Z fy (6.6)
0.00
0.20
0.40
0.60
0.80
1.00
1.20
0.00 0.20 0.40 0.60 0.80 1.00 1.20 1.40 1.60 1.80 2.00 2.20 2.40
Slenderness, λd
Mu/M
y, M
b/My
AS 4600 (2005)300x75x3.0 LSB300x75x2.5 LSB300x60x2.0 LSB250x75x3.0 LSB250x75x2.5 LSB250x60x2.0 LSB200x60x2.5 LSB200x60x2.0 LSB200x45x1.6 LSB150x45x2.0 LSB150x45x1.6 LSB125x45x2.0 LSB125x45x1.6 LSB
0.59 1.70
Parametric Studies and Design Rule Development
6-18
As stated in the earlier chapters the corners of LSBs were ignored in the calculation
of section properties (Z) since the finite element models also did not include the
corners. The nominal flange yield stress of 450 MPa was used to calculate the first
yield moment My.
Sample calculations of the effective section moduli of LSB sections based on
AS/NZS 4600 (SA, 2005) are presented in Appendix D.1. They show that some LSB
sections without corners are likely to exhibit local buckling effects as their Ze values
are about 2% less than their Z values when the maximum compressive stress is taken
as its yield stress (450 MPa). However, only the FEA moment capacities of LSB
members subject to lateral distortional and lateral torsional buckling are considered
in this research in the comparison with design rules and in developing the new design
rules. Therefore there is no need to allow for any local buckling effects as a result of
the reduced Z values of some LSB sections.
Figure 6.10 clearly shows that almost all the finite element analysis data points are
above the current design curve for intermediate slenderness (inelastic lateral buckling
region). Experimental study (Chapter 4) also showed that the moment capacities of
LSBs were higher than the predictions from the current design rule in the inelastic
region. Table 6.5 compares the member moment capacities from finite element
analyses and AS/NZS 4600 (SA, 2005) for each LSB and span. The mean and COV
values of the ratio of member moment capacities from FEA and AS/NZS 4600 (SA,
2005) are 1.08 and 0.088 for LSBs within the inelastic lateral buckling region (0.59 <
λd < 1.70). For these calculated mean and COV values, a capacity reduction factor
(Φ) of 0.96 was determined using the recommended AISI procedure (AISI, 2007).
This is greater than the recommended capacity reduction factor of 0.90 in AS/NZS
4600 (SA, 2005) for flexural members and hence confirms that the current AS/NZS
4600 (SA, 2005) design rule is conservative in the inelastic lateral buckling region.
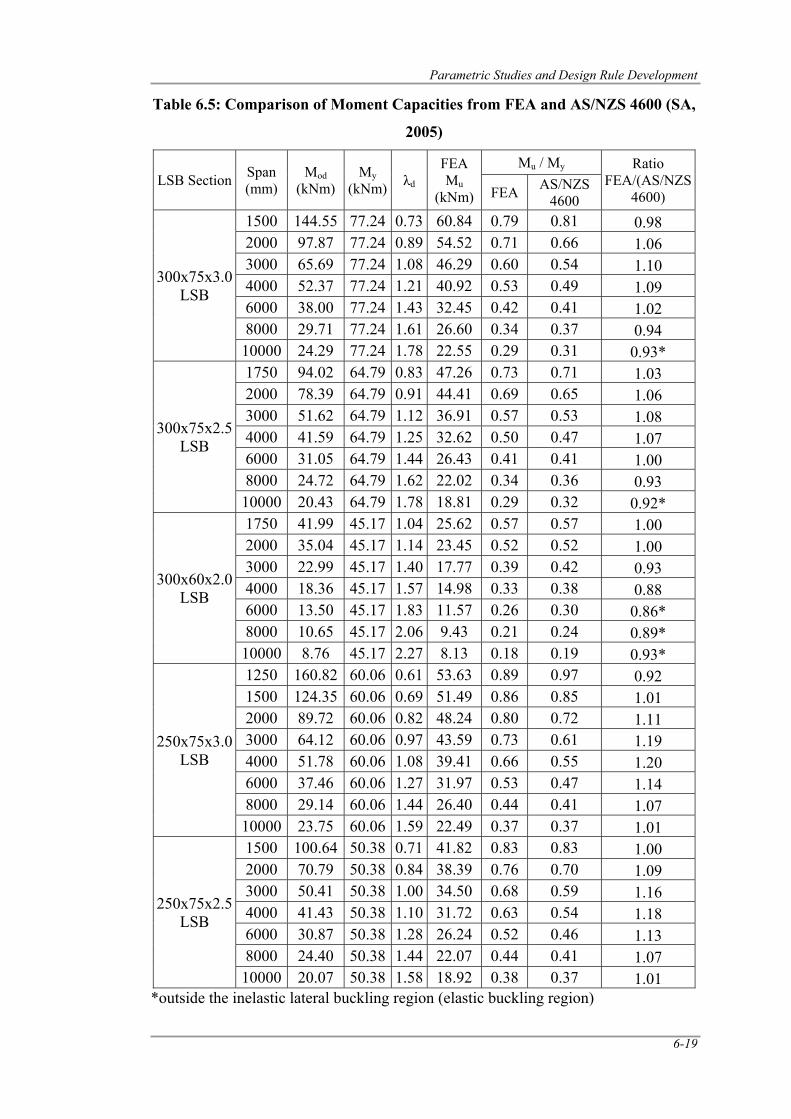
Parametric Studies and Design Rule Development
6-19
Table 6.5: Comparison of Moment Capacities from FEA and AS/NZS 4600 (SA,
2005)
LSB Section Span (mm)
Mod (kNm)
My (kNm) λd
FEA Mu
(kNm)
Mu / My Ratio FEA/(AS/NZS
4600) FEA AS/NZS 4600
300x75x3.0LSB
1500 144.55 77.24 0.73 60.84 0.79 0.81 0.98 2000 97.87 77.24 0.89 54.52 0.71 0.66 1.06 3000 65.69 77.24 1.08 46.29 0.60 0.54 1.10 4000 52.37 77.24 1.21 40.92 0.53 0.49 1.09 6000 38.00 77.24 1.43 32.45 0.42 0.41 1.02 8000 29.71 77.24 1.61 26.60 0.34 0.37 0.94 10000 24.29 77.24 1.78 22.55 0.29 0.31 0.93*
300x75x2.5LSB
1750 94.02 64.79 0.83 47.26 0.73 0.71 1.03 2000 78.39 64.79 0.91 44.41 0.69 0.65 1.06 3000 51.62 64.79 1.12 36.91 0.57 0.53 1.08 4000 41.59 64.79 1.25 32.62 0.50 0.47 1.07 6000 31.05 64.79 1.44 26.43 0.41 0.41 1.00 8000 24.72 64.79 1.62 22.02 0.34 0.36 0.93 10000 20.43 64.79 1.78 18.81 0.29 0.32 0.92*
300x60x2.0LSB
1750 41.99 45.17 1.04 25.62 0.57 0.57 1.00 2000 35.04 45.17 1.14 23.45 0.52 0.52 1.00 3000 22.99 45.17 1.40 17.77 0.39 0.42 0.93 4000 18.36 45.17 1.57 14.98 0.33 0.38 0.88 6000 13.50 45.17 1.83 11.57 0.26 0.30 0.86* 8000 10.65 45.17 2.06 9.43 0.21 0.24 0.89* 10000 8.76 45.17 2.27 8.13 0.18 0.19 0.93*
250x75x3.0LSB
1250 160.82 60.06 0.61 53.63 0.89 0.97 0.92 1500 124.35 60.06 0.69 51.49 0.86 0.85 1.01 2000 89.72 60.06 0.82 48.24 0.80 0.72 1.11 3000 64.12 60.06 0.97 43.59 0.73 0.61 1.19 4000 51.78 60.06 1.08 39.41 0.66 0.55 1.20 6000 37.46 60.06 1.27 31.97 0.53 0.47 1.14 8000 29.14 60.06 1.44 26.40 0.44 0.41 1.07 10000 23.75 60.06 1.59 22.49 0.37 0.37 1.01
250x75x2.5LSB
1500 100.64 50.38 0.71 41.82 0.83 0.83 1.00 2000 70.79 50.38 0.84 38.39 0.76 0.70 1.09 3000 50.41 50.38 1.00 34.50 0.68 0.59 1.16 4000 41.43 50.38 1.10 31.72 0.63 0.54 1.18 6000 30.87 50.38 1.28 26.24 0.52 0.46 1.13 8000 24.40 50.38 1.44 22.07 0.44 0.41 1.07 10000 20.07 50.38 1.58 18.92 0.38 0.37 1.01
*outside the inelastic lateral buckling region (elastic buckling region)
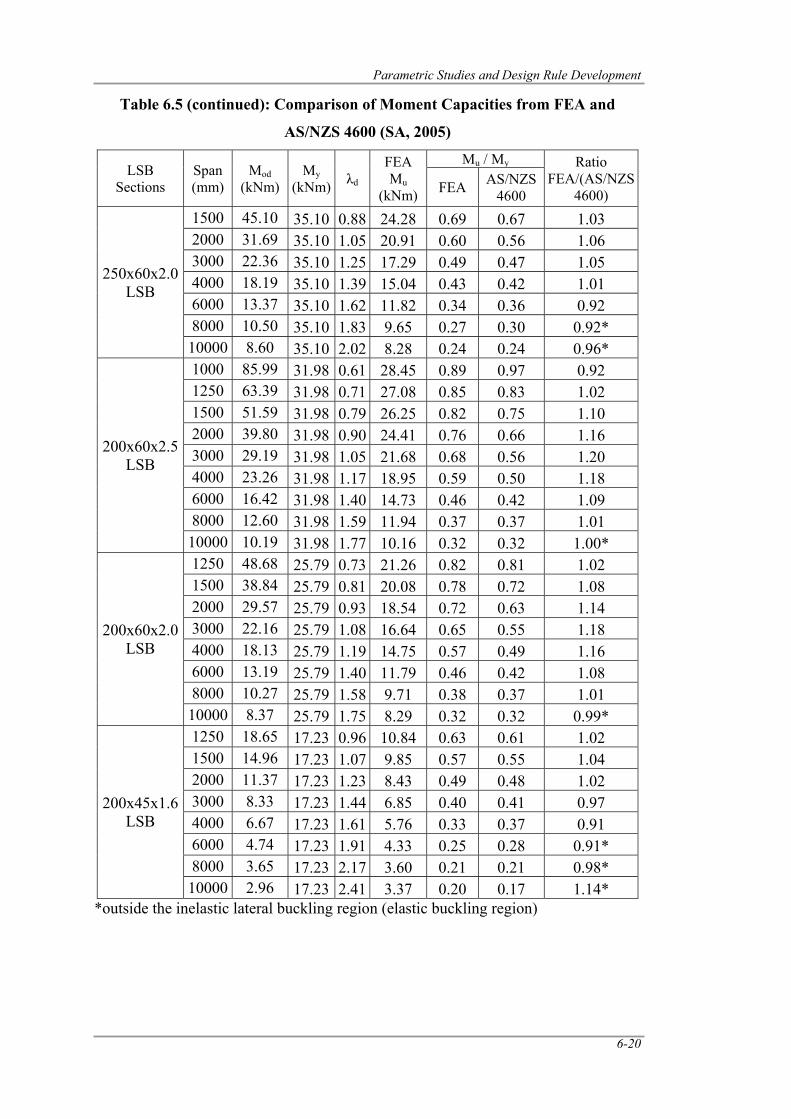
Parametric Studies and Design Rule Development
6-20
Table 6.5 (continued): Comparison of Moment Capacities from FEA and
AS/NZS 4600 (SA, 2005)
LSB Sections
Span (mm)
Mod (kNm)
My (kNm) λd
FEA Mu
(kNm)
Mu / My Ratio FEA/(AS/NZS
4600) FEA AS/NZS 4600
250x60x2.0 LSB
1500 45.10 35.10 0.88 24.28 0.69 0.67 1.03 2000 31.69 35.10 1.05 20.91 0.60 0.56 1.06 3000 22.36 35.10 1.25 17.29 0.49 0.47 1.05 4000 18.19 35.10 1.39 15.04 0.43 0.42 1.01 6000 13.37 35.10 1.62 11.82 0.34 0.36 0.92 8000 10.50 35.10 1.83 9.65 0.27 0.30 0.92* 10000 8.60 35.10 2.02 8.28 0.24 0.24 0.96*
200x60x2.5 LSB
1000 85.99 31.98 0.61 28.45 0.89 0.97 0.92 1250 63.39 31.98 0.71 27.08 0.85 0.83 1.02 1500 51.59 31.98 0.79 26.25 0.82 0.75 1.10 2000 39.80 31.98 0.90 24.41 0.76 0.66 1.16 3000 29.19 31.98 1.05 21.68 0.68 0.56 1.20 4000 23.26 31.98 1.17 18.95 0.59 0.50 1.18 6000 16.42 31.98 1.40 14.73 0.46 0.42 1.09 8000 12.60 31.98 1.59 11.94 0.37 0.37 1.01 10000 10.19 31.98 1.77 10.16 0.32 0.32 1.00*
200x60x2.0 LSB
1250 48.68 25.79 0.73 21.26 0.82 0.81 1.02 1500 38.84 25.79 0.81 20.08 0.78 0.72 1.08 2000 29.57 25.79 0.93 18.54 0.72 0.63 1.14 3000 22.16 25.79 1.08 16.64 0.65 0.55 1.18 4000 18.13 25.79 1.19 14.75 0.57 0.49 1.16 6000 13.19 25.79 1.40 11.79 0.46 0.42 1.08 8000 10.27 25.79 1.58 9.71 0.38 0.37 1.01 10000 8.37 25.79 1.75 8.29 0.32 0.32 0.99*
200x45x1.6 LSB
1250 18.65 17.23 0.96 10.84 0.63 0.61 1.02 1500 14.96 17.23 1.07 9.85 0.57 0.55 1.04 2000 11.37 17.23 1.23 8.43 0.49 0.48 1.02 3000 8.33 17.23 1.44 6.85 0.40 0.41 0.97 4000 6.67 17.23 1.61 5.76 0.33 0.37 0.91 6000 4.74 17.23 1.91 4.33 0.25 0.28 0.91* 8000 3.65 17.23 2.17 3.60 0.21 0.21 0.98* 10000 2.96 17.23 2.41 3.37 0.20 0.17 1.14*
*outside the inelastic lateral buckling region (elastic buckling region)
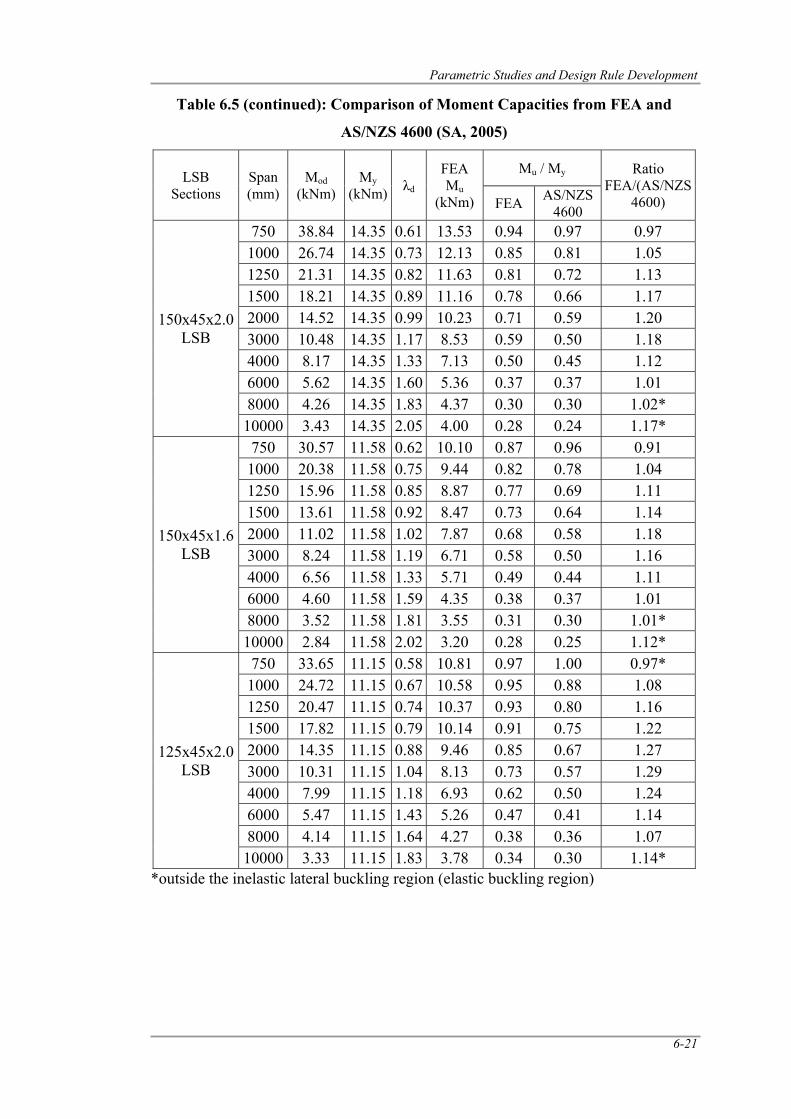
Parametric Studies and Design Rule Development
6-21
Table 6.5 (continued): Comparison of Moment Capacities from FEA and
AS/NZS 4600 (SA, 2005)
LSB Sections
Span (mm)
Mod (kNm)
My (kNm) λd
FEA Mu
(kNm)
Mu / My Ratio FEA/(AS/NZS
4600) FEA AS/NZS 4600
150x45x2.0 LSB
750 38.84 14.35 0.61 13.53 0.94 0.97 0.97 1000 26.74 14.35 0.73 12.13 0.85 0.81 1.05 1250 21.31 14.35 0.82 11.63 0.81 0.72 1.13 1500 18.21 14.35 0.89 11.16 0.78 0.66 1.17 2000 14.52 14.35 0.99 10.23 0.71 0.59 1.20 3000 10.48 14.35 1.17 8.53 0.59 0.50 1.18 4000 8.17 14.35 1.33 7.13 0.50 0.45 1.12 6000 5.62 14.35 1.60 5.36 0.37 0.37 1.01 8000 4.26 14.35 1.83 4.37 0.30 0.30 1.02* 10000 3.43 14.35 2.05 4.00 0.28 0.24 1.17*
150x45x1.6 LSB
750 30.57 11.58 0.62 10.10 0.87 0.96 0.91 1000 20.38 11.58 0.75 9.44 0.82 0.78 1.04 1250 15.96 11.58 0.85 8.87 0.77 0.69 1.11 1500 13.61 11.58 0.92 8.47 0.73 0.64 1.14 2000 11.02 11.58 1.02 7.87 0.68 0.58 1.18 3000 8.24 11.58 1.19 6.71 0.58 0.50 1.16 4000 6.56 11.58 1.33 5.71 0.49 0.44 1.11 6000 4.60 11.58 1.59 4.35 0.38 0.37 1.01 8000 3.52 11.58 1.81 3.55 0.31 0.30 1.01* 10000 2.84 11.58 2.02 3.20 0.28 0.25 1.12*
125x45x2.0 LSB
750 33.65 11.15 0.58 10.81 0.97 1.00 0.97* 1000 24.72 11.15 0.67 10.58 0.95 0.88 1.08 1250 20.47 11.15 0.74 10.37 0.93 0.80 1.16 1500 17.82 11.15 0.79 10.14 0.91 0.75 1.22 2000 14.35 11.15 0.88 9.46 0.85 0.67 1.27 3000 10.31 11.15 1.04 8.13 0.73 0.57 1.29 4000 7.99 11.15 1.18 6.93 0.62 0.50 1.24 6000 5.47 11.15 1.43 5.26 0.47 0.41 1.14 8000 4.14 11.15 1.64 4.27 0.38 0.36 1.07 10000 3.33 11.15 1.83 3.78 0.34 0.30 1.14*
*outside the inelastic lateral buckling region (elastic buckling region)
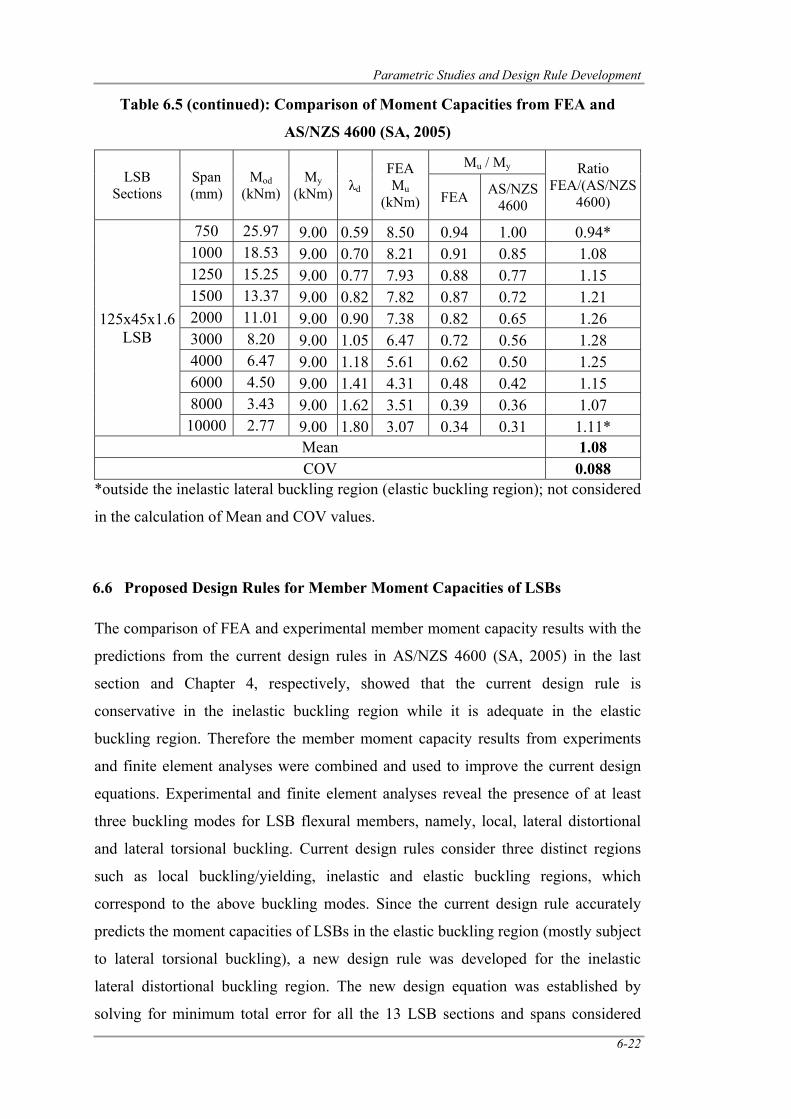
Parametric Studies and Design Rule Development
6-22
Table 6.5 (continued): Comparison of Moment Capacities from FEA and
AS/NZS 4600 (SA, 2005)
LSB Sections
Span (mm)
Mod (kNm)
My (kNm) λd
FEA Mu
(kNm)
Mu / My Ratio FEA/(AS/NZS
4600) FEA AS/NZS 4600
125x45x1.6 LSB
750 25.97 9.00 0.59 8.50 0.94 1.00 0.94* 1000 18.53 9.00 0.70 8.21 0.91 0.85 1.08 1250 15.25 9.00 0.77 7.93 0.88 0.77 1.15 1500 13.37 9.00 0.82 7.82 0.87 0.72 1.21 2000 11.01 9.00 0.90 7.38 0.82 0.65 1.26 3000 8.20 9.00 1.05 6.47 0.72 0.56 1.28 4000 6.47 9.00 1.18 5.61 0.62 0.50 1.25 6000 4.50 9.00 1.41 4.31 0.48 0.42 1.15 8000 3.43 9.00 1.62 3.51 0.39 0.36 1.07 10000 2.77 9.00 1.80 3.07 0.34 0.31 1.11*
Mean 1.08 COV 0.088
*outside the inelastic lateral buckling region (elastic buckling region); not considered
in the calculation of Mean and COV values.
6.6 Proposed Design Rules for Member Moment Capacities of LSBs
The comparison of FEA and experimental member moment capacity results with the
predictions from the current design rules in AS/NZS 4600 (SA, 2005) in the last
section and Chapter 4, respectively, showed that the current design rule is
conservative in the inelastic buckling region while it is adequate in the elastic
buckling region. Therefore the member moment capacity results from experiments
and finite element analyses were combined and used to improve the current design
equations. Experimental and finite element analyses reveal the presence of at least
three buckling modes for LSB flexural members, namely, local, lateral distortional
and lateral torsional buckling. Current design rules consider three distinct regions
such as local buckling/yielding, inelastic and elastic buckling regions, which
correspond to the above buckling modes. Since the current design rule accurately
predicts the moment capacities of LSBs in the elastic buckling region (mostly subject
to lateral torsional buckling), a new design rule was developed for the inelastic
lateral distortional buckling region. The new design equation was established by
solving for minimum total error for all the 13 LSB sections and spans considered
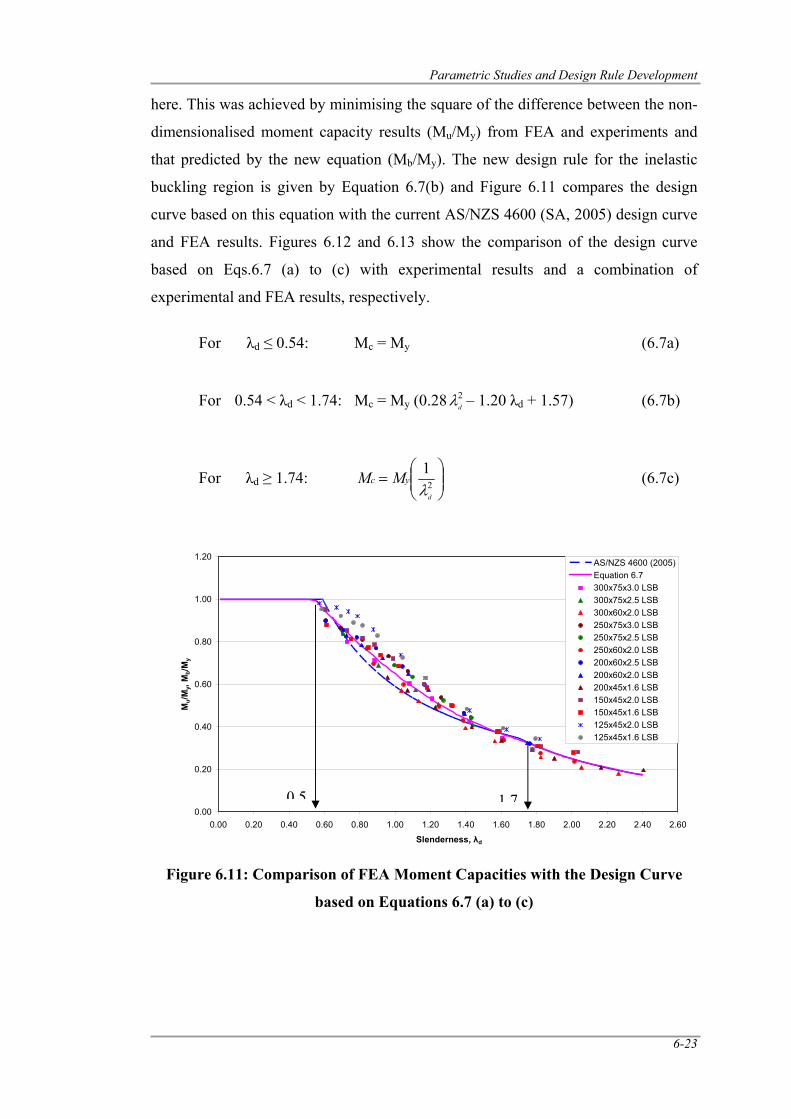
Parametric Studies and Design Rule Development
6-23
here. This was achieved by minimising the square of the difference between the non-
dimensionalised moment capacity results (Mu/My) from FEA and experiments and
that predicted by the new equation (Mb/My). The new design rule for the inelastic
buckling region is given by Equation 6.7(b) and Figure 6.11 compares the design
curve based on this equation with the current AS/NZS 4600 (SA, 2005) design curve
and FEA results. Figures 6.12 and 6.13 show the comparison of the design curve
based on Eqs.6.7 (a) to (c) with experimental results and a combination of
experimental and FEA results, respectively.
For λd ≤ 0.54: Mc = My (6.7a)
For 0.54 < λd < 1.74: Mc = My (0.28 2dλ – 1.20 λd + 1.57) (6.7b)
For λd ≥ 1.74: ⎟⎟⎠
⎞⎜⎜⎝
⎛= 2
1
d
yc MMλ
(6.7c)
Figure 6.11: Comparison of FEA Moment Capacities with the Design Curve
based on Equations 6.7 (a) to (c)
0.00
0.20
0.40
0.60
0.80
1.00
1.20
0.00 0.20 0.40 0.60 0.80 1.00 1.20 1.40 1.60 1.80 2.00 2.20 2.40 2.60
Slenderness, λd
Mu/M
y, M
b/My
AS/NZS 4600 (2005)Equation 6.7300x75x3.0 LSB300x75x2.5 LSB300x60x2.0 LSB250x75x3.0 LSB250x75x2.5 LSB250x60x2.0 LSB200x60x2.5 LSB200x60x2.0 LSB200x45x1.6 LSB150x45x2.0 LSB150x45x1.6 LSB125x45x2.0 LSB125x45x1.6 LSB
0 5 1 7
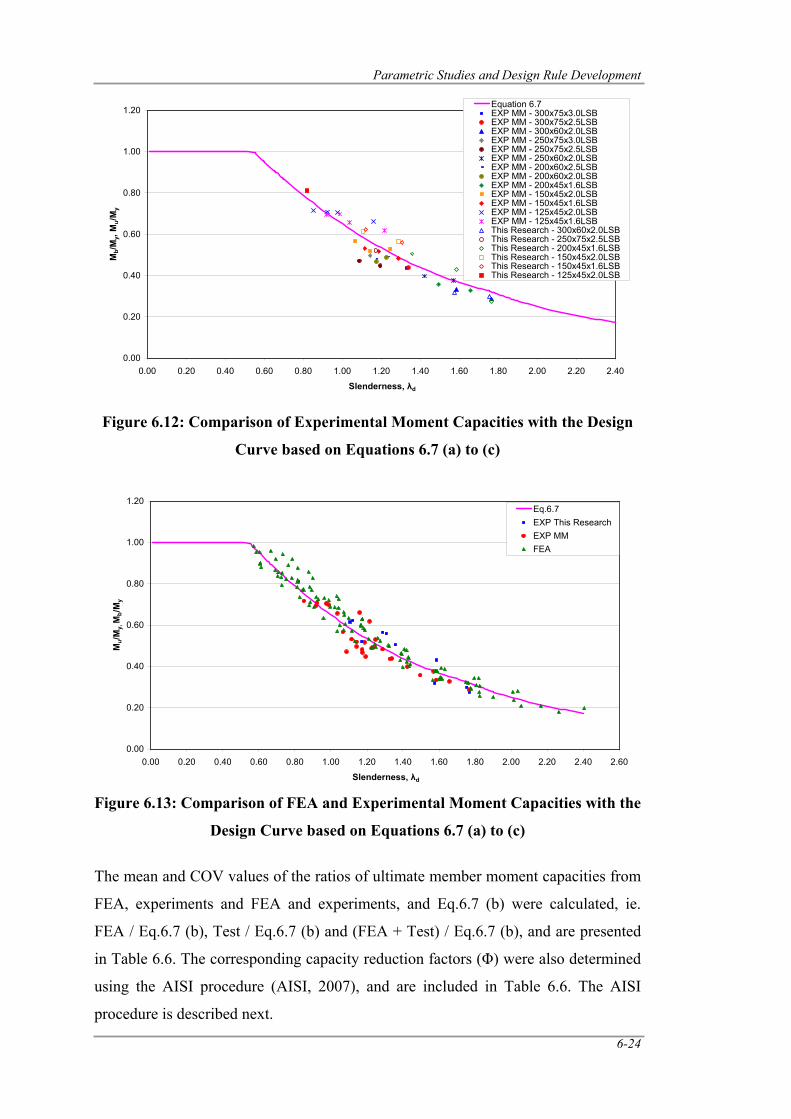
Parametric Studies and Design Rule Development
6-24
Figure 6.12: Comparison of Experimental Moment Capacities with the Design
Curve based on Equations 6.7 (a) to (c)
Figure 6.13: Comparison of FEA and Experimental Moment Capacities with the
Design Curve based on Equations 6.7 (a) to (c)
The mean and COV values of the ratios of ultimate member moment capacities from
FEA, experiments and FEA and experiments, and Eq.6.7 (b) were calculated, ie.
FEA / Eq.6.7 (b), Test / Eq.6.7 (b) and (FEA + Test) / Eq.6.7 (b), and are presented
in Table 6.6. The corresponding capacity reduction factors (Φ) were also determined
using the AISI procedure (AISI, 2007), and are included in Table 6.6. The AISI
procedure is described next.
0.00
0.20
0.40
0.60
0.80
1.00
1.20
0.00 0.20 0.40 0.60 0.80 1.00 1.20 1.40 1.60 1.80 2.00 2.20 2.40
Slenderness, λd
Mb/M
y, M
u/My
Equation 6.7EXP MM - 300x75x3.0LSBEXP MM - 300x75x2.5LSBEXP MM - 300x60x2.0LSBEXP MM - 250x75x3.0LSBEXP MM - 250x75x2.5LSBEXP MM - 250x60x2.0LSBEXP MM - 200x60x2.5LSBEXP MM - 200x60x2.0LSBEXP MM - 200x45x1.6LSBEXP MM - 150x45x2.0LSBEXP MM - 150x45x1.6LSBEXP MM - 125x45x2.0LSBEXP MM - 125x45x1.6LSBThis Research - 300x60x2.0LSBThis Research - 250x75x2.5LSBThis Research - 200x45x1.6LSBThis Research - 150x45x2.0LSBThis Research - 150x45x1.6LSBThis Research - 125x45x2.0LSB
0.00
0.20
0.40
0.60
0.80
1.00
1.20
0.00 0.20 0.40 0.60 0.80 1.00 1.20 1.40 1.60 1.80 2.00 2.20 2.40 2.60
Slenderness, λd
Mu/
My,
Mb/
My
Eq.6.7EXP This ResearchEXP MMFEA
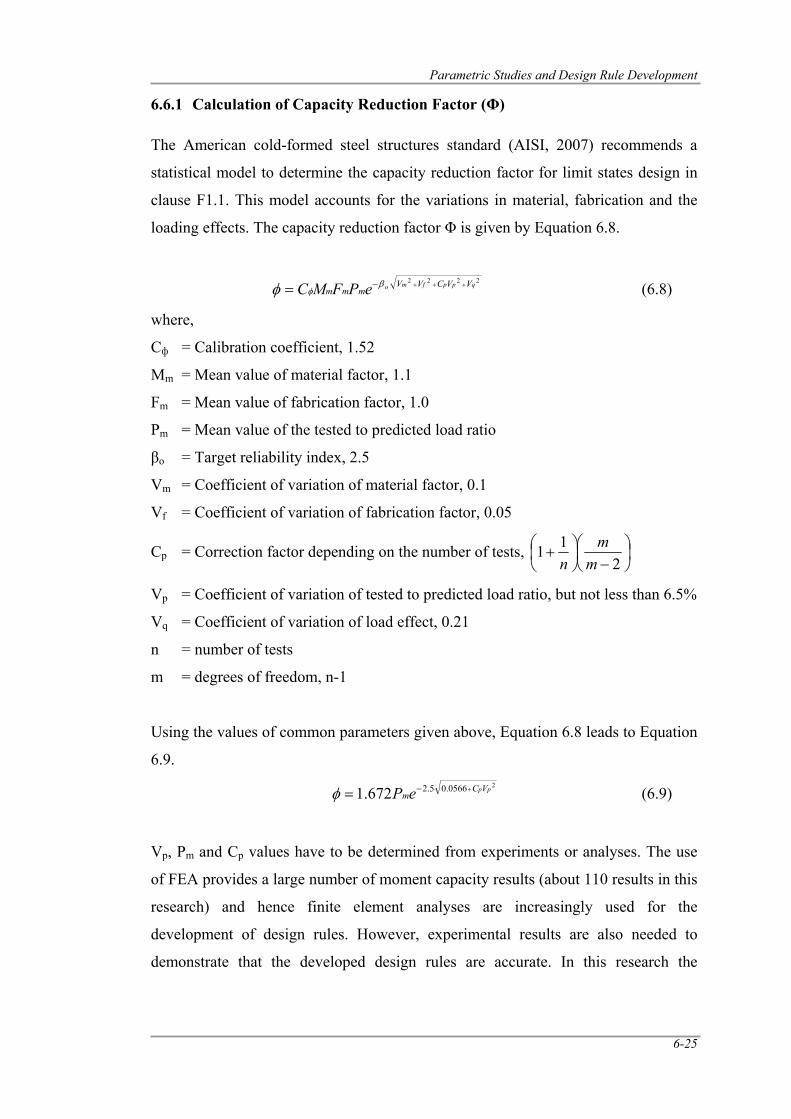
Parametric Studies and Design Rule Development
6-25
6.6.1 Calculation of Capacity Reduction Factor (Φ)
The American cold-formed steel structures standard (AISI, 2007) recommends a
statistical model to determine the capacity reduction factor for limit states design in
clause F1.1. This model accounts for the variations in material, fabrication and the
loading effects. The capacity reduction factor Φ is given by Equation 6.8.
2222 qppfmo VVCVV
mmm ePFMC +++−= βφφ (6.8)
where,
Cф = Calibration coefficient, 1.52
Mm = Mean value of material factor, 1.1
Fm = Mean value of fabrication factor, 1.0
Pm = Mean value of the tested to predicted load ratio
βo = Target reliability index, 2.5
Vm = Coefficient of variation of material factor, 0.1
Vf = Coefficient of variation of fabrication factor, 0.05
Cp = Correction factor depending on the number of tests, ⎟⎠⎞
⎜⎝⎛
−⎟⎠⎞
⎜⎝⎛ +
211
mm
n
Vp = Coefficient of variation of tested to predicted load ratio, but not less than 6.5%
Vq = Coefficient of variation of load effect, 0.21
n = number of tests
m = degrees of freedom, n-1
Using the values of common parameters given above, Equation 6.8 leads to Equation
6.9.
20566.05.2672.1 ppVC
meP +−=φ (6.9)
Vp, Pm and Cp values have to be determined from experiments or analyses. The use
of FEA provides a large number of moment capacity results (about 110 results in this
research) and hence finite element analyses are increasingly used for the
development of design rules. However, experimental results are also needed to
demonstrate that the developed design rules are accurate. In this research the
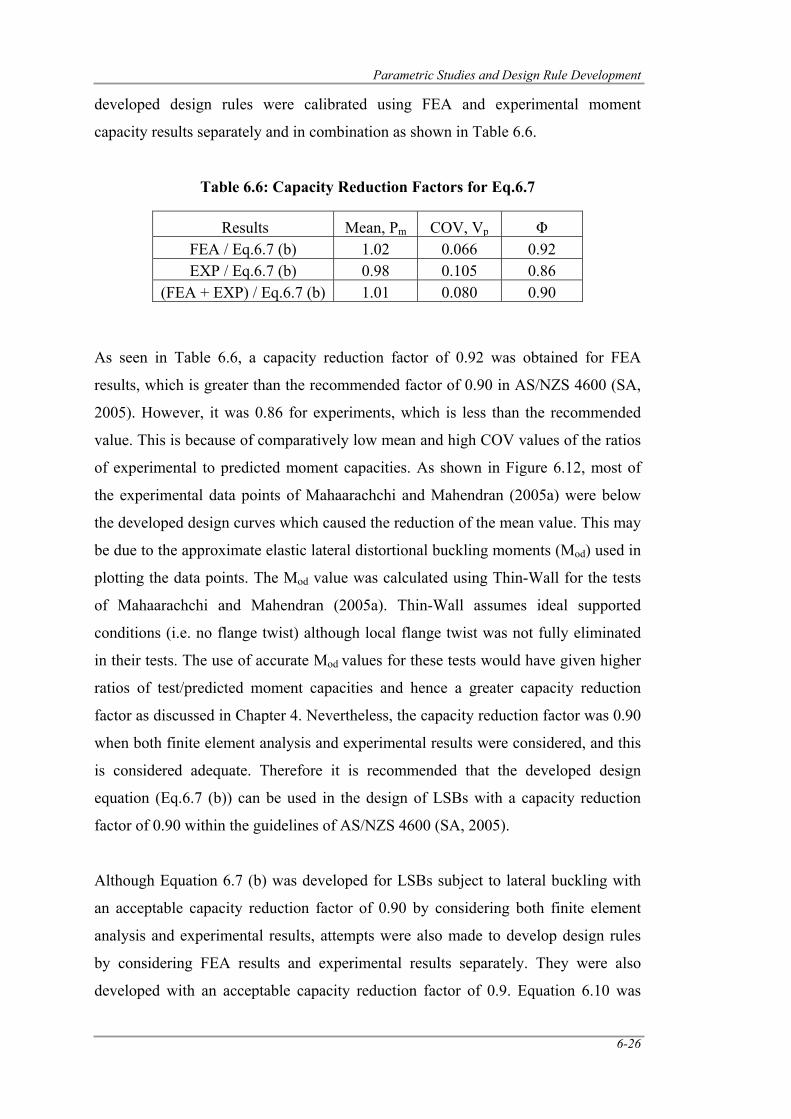
Parametric Studies and Design Rule Development
6-26
developed design rules were calibrated using FEA and experimental moment
capacity results separately and in combination as shown in Table 6.6.
Table 6.6: Capacity Reduction Factors for Eq.6.7
Results Mean, Pm COV, Vp Φ FEA / Eq.6.7 (b) 1.02 0.066 0.92 EXP / Eq.6.7 (b) 0.98 0.105 0.86
(FEA + EXP) / Eq.6.7 (b) 1.01 0.080 0.90
As seen in Table 6.6, a capacity reduction factor of 0.92 was obtained for FEA
results, which is greater than the recommended factor of 0.90 in AS/NZS 4600 (SA,
2005). However, it was 0.86 for experiments, which is less than the recommended
value. This is because of comparatively low mean and high COV values of the ratios
of experimental to predicted moment capacities. As shown in Figure 6.12, most of
the experimental data points of Mahaarachchi and Mahendran (2005a) were below
the developed design curves which caused the reduction of the mean value. This may
be due to the approximate elastic lateral distortional buckling moments (Mod) used in
plotting the data points. The Mod value was calculated using Thin-Wall for the tests
of Mahaarachchi and Mahendran (2005a). Thin-Wall assumes ideal supported
conditions (i.e. no flange twist) although local flange twist was not fully eliminated
in their tests. The use of accurate Mod values for these tests would have given higher
ratios of test/predicted moment capacities and hence a greater capacity reduction
factor as discussed in Chapter 4. Nevertheless, the capacity reduction factor was 0.90
when both finite element analysis and experimental results were considered, and this
is considered adequate. Therefore it is recommended that the developed design
equation (Eq.6.7 (b)) can be used in the design of LSBs with a capacity reduction
factor of 0.90 within the guidelines of AS/NZS 4600 (SA, 2005).
Although Equation 6.7 (b) was developed for LSBs subject to lateral buckling with
an acceptable capacity reduction factor of 0.90 by considering both finite element
analysis and experimental results, attempts were also made to develop design rules
by considering FEA results and experimental results separately. They were also
developed with an acceptable capacity reduction factor of 0.9. Equation 6.10 was
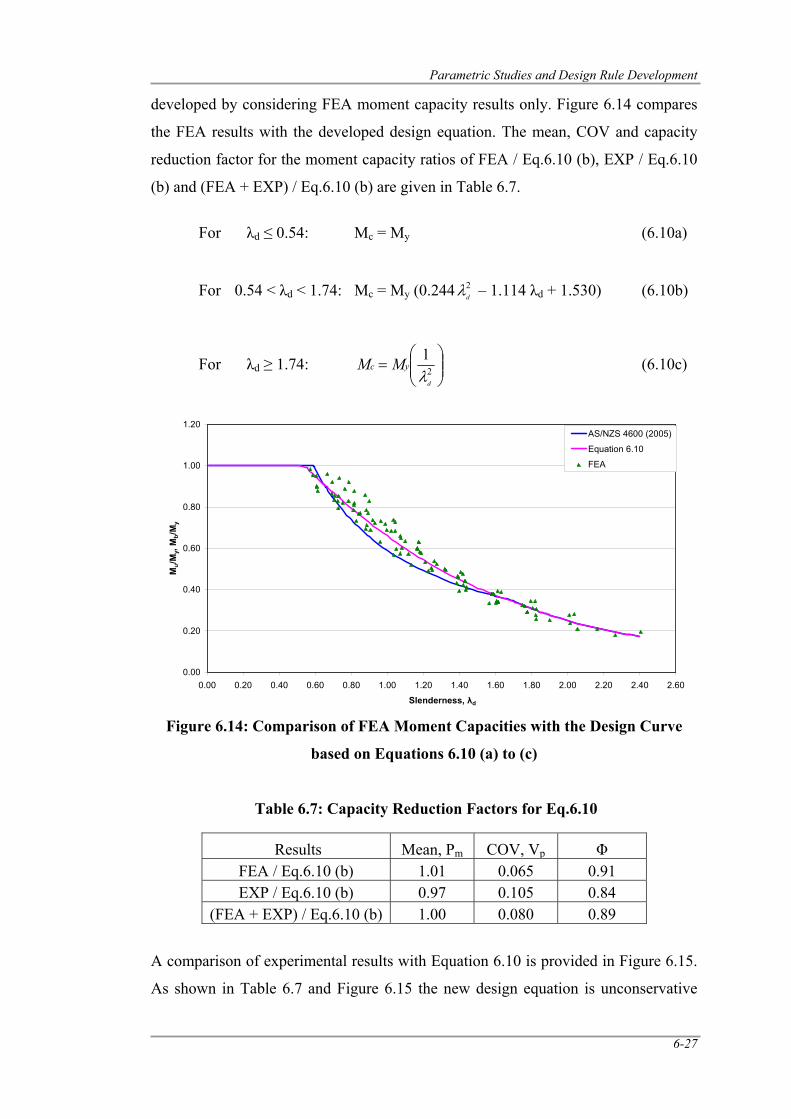
Parametric Studies and Design Rule Development
6-27
developed by considering FEA moment capacity results only. Figure 6.14 compares
the FEA results with the developed design equation. The mean, COV and capacity
reduction factor for the moment capacity ratios of FEA / Eq.6.10 (b), EXP / Eq.6.10
(b) and (FEA + EXP) / Eq.6.10 (b) are given in Table 6.7.
For λd ≤ 0.54: Mc = My (6.10a)
For 0.54 < λd < 1.74: Mc = My (0.244 2dλ – 1.114 λd + 1.530) (6.10b)
For λd ≥ 1.74: ⎟⎟⎠
⎞⎜⎜⎝
⎛= 2
1
d
yc MMλ
(6.10c)
Figure 6.14: Comparison of FEA Moment Capacities with the Design Curve
based on Equations 6.10 (a) to (c)
Table 6.7: Capacity Reduction Factors for Eq.6.10
Results Mean, Pm COV, Vp Φ FEA / Eq.6.10 (b) 1.01 0.065 0.91 EXP / Eq.6.10 (b) 0.97 0.105 0.84
(FEA + EXP) / Eq.6.10 (b) 1.00 0.080 0.89
A comparison of experimental results with Equation 6.10 is provided in Figure 6.15.
As shown in Table 6.7 and Figure 6.15 the new design equation is unconservative
0.00
0.20
0.40
0.60
0.80
1.00
1.20
0.00 0.20 0.40 0.60 0.80 1.00 1.20 1.40 1.60 1.80 2.00 2.20 2.40 2.60
Slenderness, λd
Mu/
My,
Mb/
My
AS/NZS 4600 (2005)
Equation 6.10
FEA
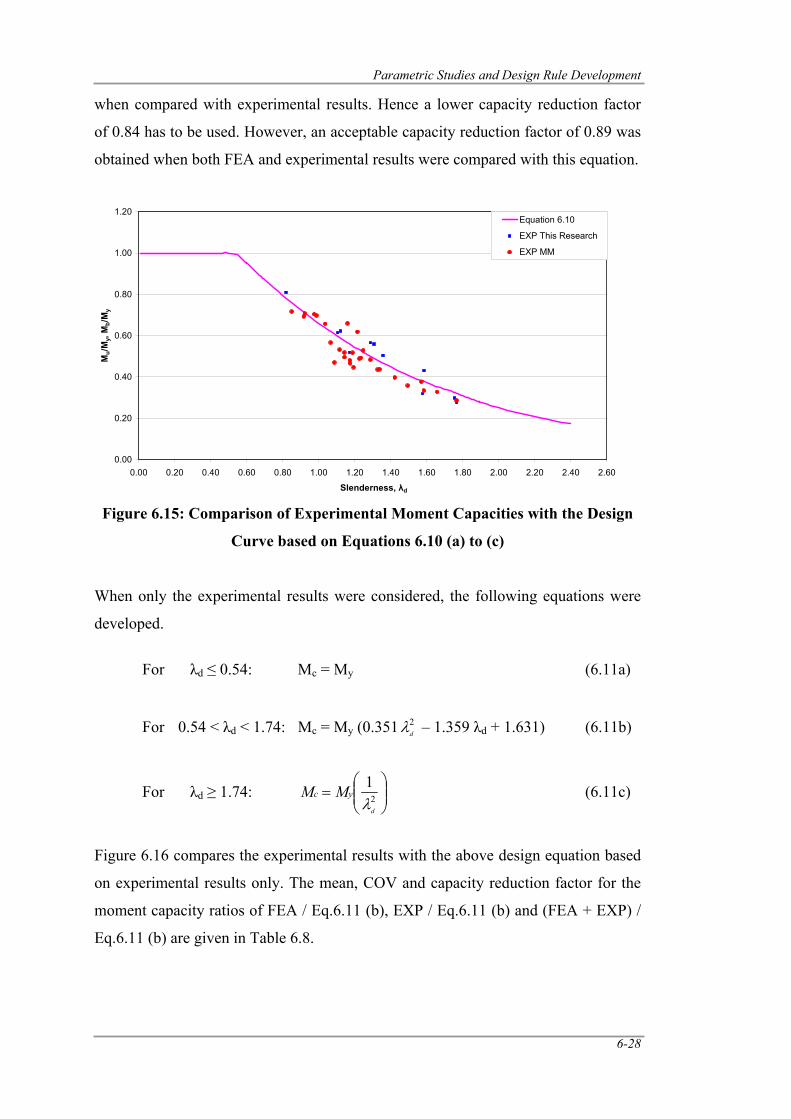
Parametric Studies and Design Rule Development
6-28
when compared with experimental results. Hence a lower capacity reduction factor
of 0.84 has to be used. However, an acceptable capacity reduction factor of 0.89 was
obtained when both FEA and experimental results were compared with this equation.
Figure 6.15: Comparison of Experimental Moment Capacities with the Design
Curve based on Equations 6.10 (a) to (c)
When only the experimental results were considered, the following equations were
developed.
For λd ≤ 0.54: Mc = My (6.11a)
For 0.54 < λd < 1.74: Mc = My (0.351 2dλ – 1.359 λd + 1.631) (6.11b)
For λd ≥ 1.74: ⎟⎟⎠
⎞⎜⎜⎝
⎛= 2
1
d
yc MMλ
(6.11c)
Figure 6.16 compares the experimental results with the above design equation based
on experimental results only. The mean, COV and capacity reduction factor for the
moment capacity ratios of FEA / Eq.6.11 (b), EXP / Eq.6.11 (b) and (FEA + EXP) /
Eq.6.11 (b) are given in Table 6.8.
0.00
0.20
0.40
0.60
0.80
1.00
1.20
0.00 0.20 0.40 0.60 0.80 1.00 1.20 1.40 1.60 1.80 2.00 2.20 2.40 2.60
Slenderness, λd
Mu/
My,
Mb/
My
Equation 6.10
EXP This Research
EXP MM
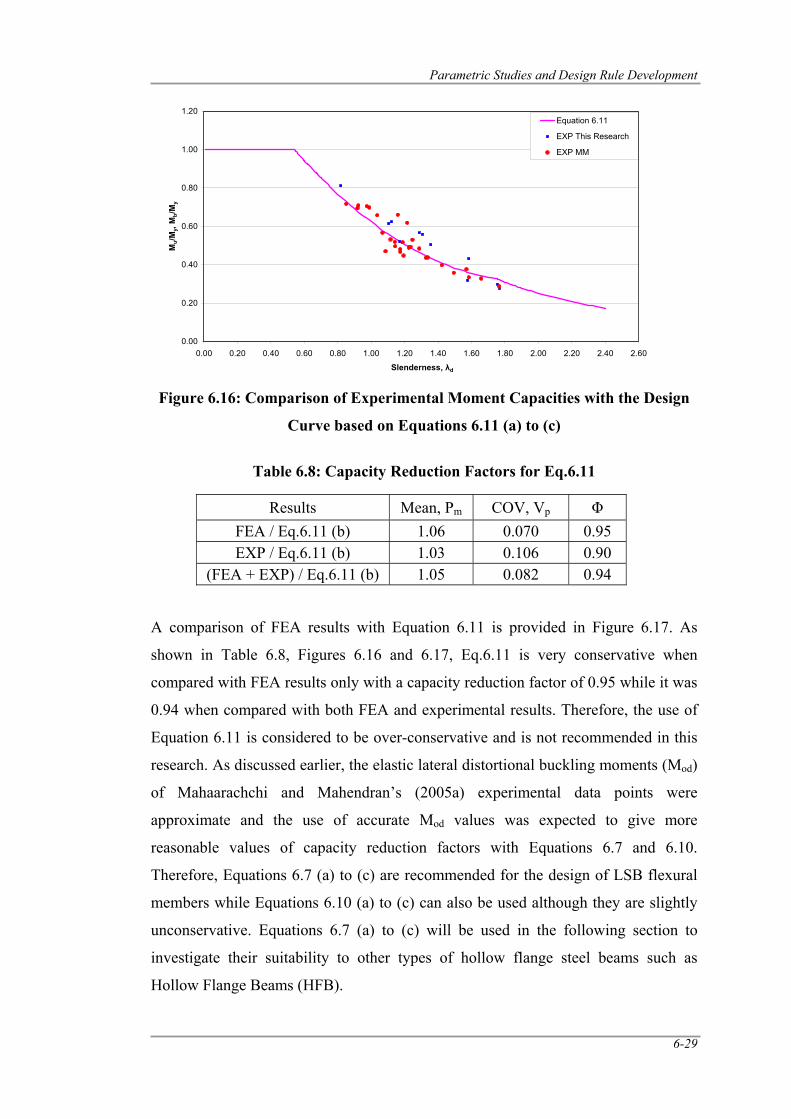
Parametric Studies and Design Rule Development
6-29
Figure 6.16: Comparison of Experimental Moment Capacities with the Design
Curve based on Equations 6.11 (a) to (c)
Table 6.8: Capacity Reduction Factors for Eq.6.11
A comparison of FEA results with Equation 6.11 is provided in Figure 6.17. As
shown in Table 6.8, Figures 6.16 and 6.17, Eq.6.11 is very conservative when
compared with FEA results only with a capacity reduction factor of 0.95 while it was
0.94 when compared with both FEA and experimental results. Therefore, the use of
Equation 6.11 is considered to be over-conservative and is not recommended in this
research. As discussed earlier, the elastic lateral distortional buckling moments (Mod)
of Mahaarachchi and Mahendran’s (2005a) experimental data points were
approximate and the use of accurate Mod values was expected to give more
reasonable values of capacity reduction factors with Equations 6.7 and 6.10.
Therefore, Equations 6.7 (a) to (c) are recommended for the design of LSB flexural
members while Equations 6.10 (a) to (c) can also be used although they are slightly
unconservative. Equations 6.7 (a) to (c) will be used in the following section to
investigate their suitability to other types of hollow flange steel beams such as
Hollow Flange Beams (HFB).
Results Mean, Pm COV, Vp Φ FEA / Eq.6.11 (b) 1.06 0.070 0.95 EXP / Eq.6.11 (b) 1.03 0.106 0.90
(FEA + EXP) / Eq.6.11 (b) 1.05 0.082 0.94
0.00
0.20
0.40
0.60
0.80
1.00
1.20
0.00 0.20 0.40 0.60 0.80 1.00 1.20 1.40 1.60 1.80 2.00 2.20 2.40 2.60
Slenderness, λd
Mu/M
y, M
b/My
Equation 6.11
EXP This Research
EXP MM
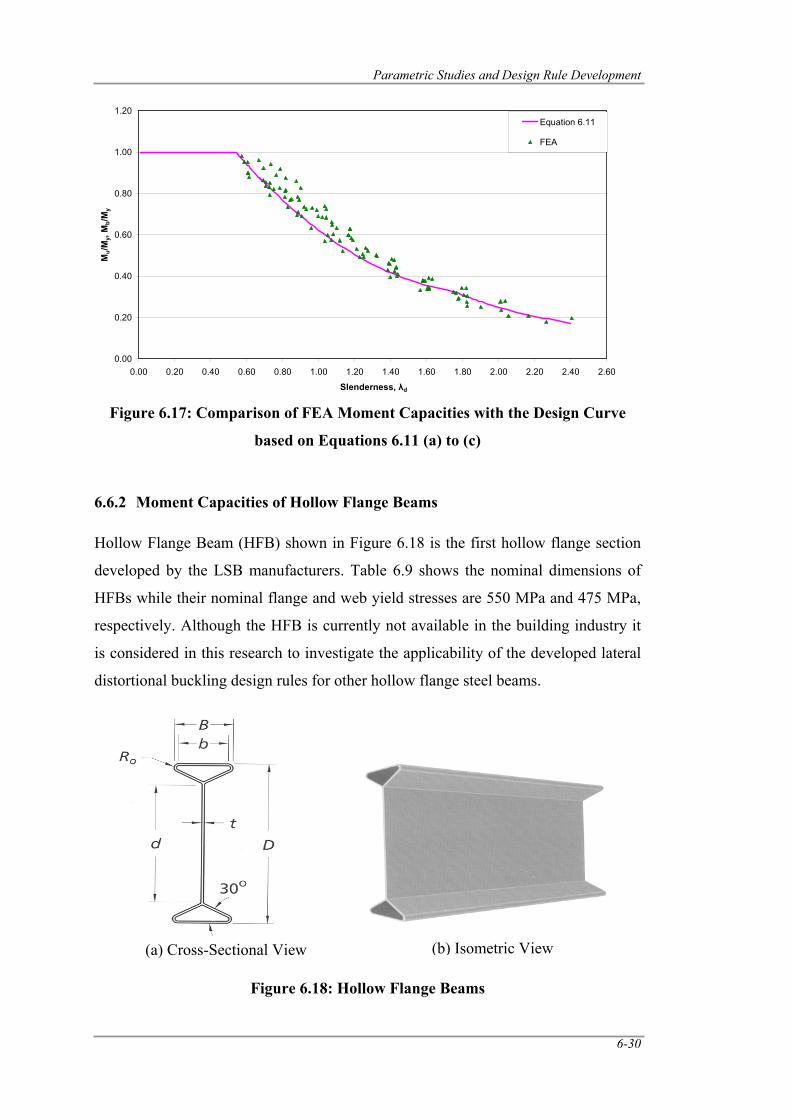
Parametric Studies and Design Rule Development
6-30
Figure 6.17: Comparison of FEA Moment Capacities with the Design Curve
based on Equations 6.11 (a) to (c)
6.6.2 Moment Capacities of Hollow Flange Beams
Hollow Flange Beam (HFB) shown in Figure 6.18 is the first hollow flange section
developed by the LSB manufacturers. Table 6.9 shows the nominal dimensions of
HFBs while their nominal flange and web yield stresses are 550 MPa and 475 MPa,
respectively. Although the HFB is currently not available in the building industry it
is considered in this research to investigate the applicability of the developed lateral
distortional buckling design rules for other hollow flange steel beams.
Figure 6.18: Hollow Flange Beams
0.00
0.20
0.40
0.60
0.80
1.00
1.20
0.00 0.20 0.40 0.60 0.80 1.00 1.20 1.40 1.60 1.80 2.00 2.20 2.40 2.60
Slenderness, λd
Mu/M
y, M
b/My
Equation 6.11
FEA
(b) Isometric View(a) Cross-Sectional View
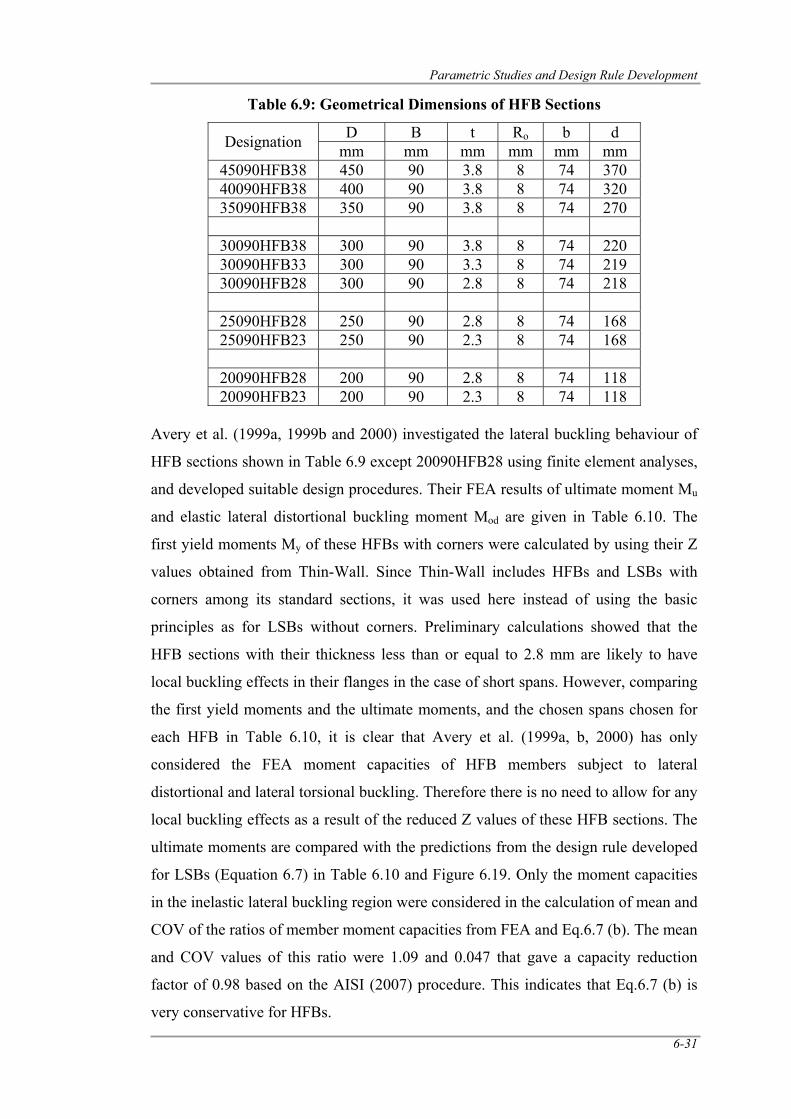
Parametric Studies and Design Rule Development
6-31
Table 6.9: Geometrical Dimensions of HFB Sections
Designation D B t Ro b d mm mm mm mm mm mm
45090HFB38 450 90 3.8 8 74 370 40090HFB38 400 90 3.8 8 74 320 35090HFB38 350 90 3.8 8 74 270
30090HFB38 300 90 3.8 8 74 220 30090HFB33 300 90 3.3 8 74 219 30090HFB28 300 90 2.8 8 74 218
25090HFB28 250 90 2.8 8 74 168 25090HFB23 250 90 2.3 8 74 168
20090HFB28 200 90 2.8 8 74 118 20090HFB23 200 90 2.3 8 74 118
Avery et al. (1999a, 1999b and 2000) investigated the lateral buckling behaviour of
HFB sections shown in Table 6.9 except 20090HFB28 using finite element analyses,
and developed suitable design procedures. Their FEA results of ultimate moment Mu
and elastic lateral distortional buckling moment Mod are given in Table 6.10. The
first yield moments My of these HFBs with corners were calculated by using their Z
values obtained from Thin-Wall. Since Thin-Wall includes HFBs and LSBs with
corners among its standard sections, it was used here instead of using the basic
principles as for LSBs without corners. Preliminary calculations showed that the
HFB sections with their thickness less than or equal to 2.8 mm are likely to have
local buckling effects in their flanges in the case of short spans. However, comparing
the first yield moments and the ultimate moments, and the chosen spans chosen for
each HFB in Table 6.10, it is clear that Avery et al. (1999a, b, 2000) has only
considered the FEA moment capacities of HFB members subject to lateral
distortional and lateral torsional buckling. Therefore there is no need to allow for any
local buckling effects as a result of the reduced Z values of these HFB sections. The
ultimate moments are compared with the predictions from the design rule developed
for LSBs (Equation 6.7) in Table 6.10 and Figure 6.19. Only the moment capacities
in the inelastic lateral buckling region were considered in the calculation of mean and
COV of the ratios of member moment capacities from FEA and Eq.6.7 (b). The mean
and COV values of this ratio were 1.09 and 0.047 that gave a capacity reduction
factor of 0.98 based on the AISI (2007) procedure. This indicates that Eq.6.7 (b) is
very conservative for HFBs.
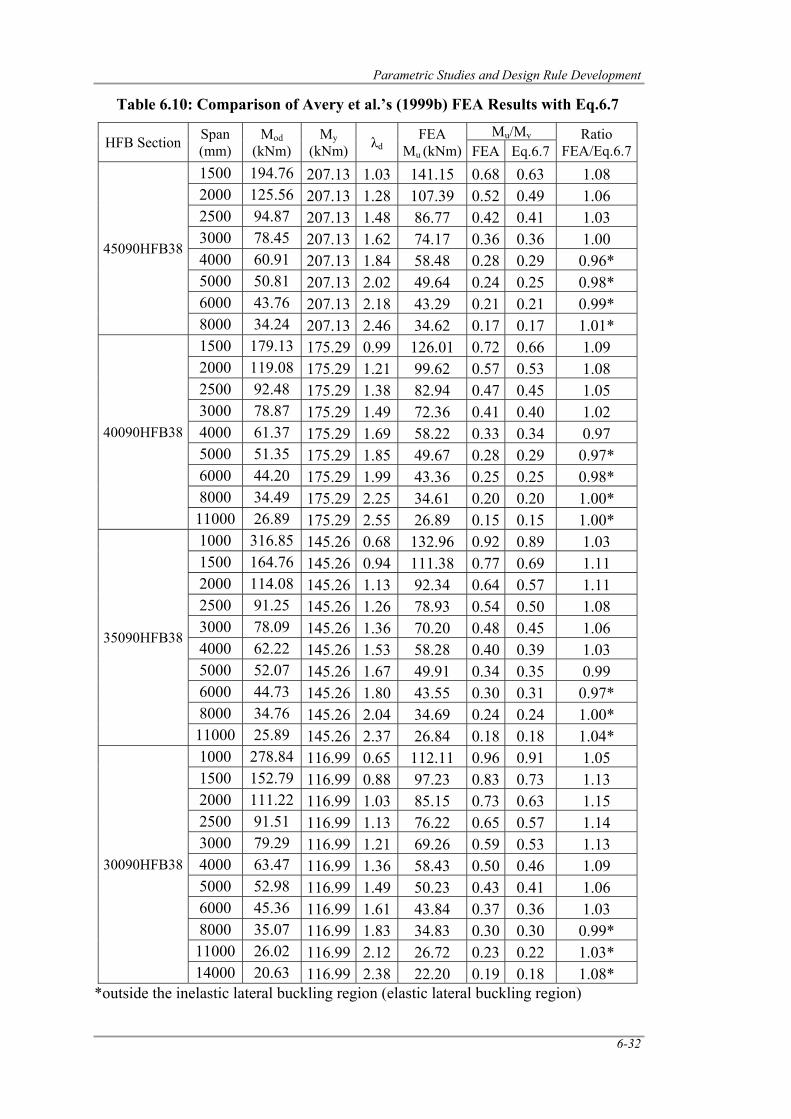
Parametric Studies and Design Rule Development
6-32
Table 6.10: Comparison of Avery et al.’s (1999b) FEA Results with Eq.6.7
HFB Section Span (mm)
Mod (kNm)
My (kNm) λd
FEA Mu (kNm)
Mu/My Ratio FEA/Eq.6.7 FEA Eq.6.7
45090HFB38
1500 194.76 207.13 1.03 141.15 0.68 0.63 1.08 2000 125.56 207.13 1.28 107.39 0.52 0.49 1.06 2500 94.87 207.13 1.48 86.77 0.42 0.41 1.03 3000 78.45 207.13 1.62 74.17 0.36 0.36 1.00 4000 60.91 207.13 1.84 58.48 0.28 0.29 0.96* 5000 50.81 207.13 2.02 49.64 0.24 0.25 0.98* 6000 43.76 207.13 2.18 43.29 0.21 0.21 0.99* 8000 34.24 207.13 2.46 34.62 0.17 0.17 1.01*
40090HFB38
1500 179.13 175.29 0.99 126.01 0.72 0.66 1.09 2000 119.08 175.29 1.21 99.62 0.57 0.53 1.08 2500 92.48 175.29 1.38 82.94 0.47 0.45 1.05 3000 78.87 175.29 1.49 72.36 0.41 0.40 1.02 4000 61.37 175.29 1.69 58.22 0.33 0.34 0.97 5000 51.35 175.29 1.85 49.67 0.28 0.29 0.97* 6000 44.20 175.29 1.99 43.36 0.25 0.25 0.98* 8000 34.49 175.29 2.25 34.61 0.20 0.20 1.00* 11000 26.89 175.29 2.55 26.89 0.15 0.15 1.00*
35090HFB38
1000 316.85 145.26 0.68 132.96 0.92 0.89 1.03 1500 164.76 145.26 0.94 111.38 0.77 0.69 1.11 2000 114.08 145.26 1.13 92.34 0.64 0.57 1.11 2500 91.25 145.26 1.26 78.93 0.54 0.50 1.08 3000 78.09 145.26 1.36 70.20 0.48 0.45 1.06 4000 62.22 145.26 1.53 58.28 0.40 0.39 1.03 5000 52.07 145.26 1.67 49.91 0.34 0.35 0.99 6000 44.73 145.26 1.80 43.55 0.30 0.31 0.97* 8000 34.76 145.26 2.04 34.69 0.24 0.24 1.00* 11000 25.89 145.26 2.37 26.84 0.18 0.18 1.04*
30090HFB38
1000 278.84 116.99 0.65 112.11 0.96 0.91 1.05 1500 152.79 116.99 0.88 97.23 0.83 0.73 1.13 2000 111.22 116.99 1.03 85.15 0.73 0.63 1.15 2500 91.51 116.99 1.13 76.22 0.65 0.57 1.14 3000 79.29 116.99 1.21 69.26 0.59 0.53 1.13 4000 63.47 116.99 1.36 58.43 0.50 0.46 1.09 5000 52.98 116.99 1.49 50.23 0.43 0.41 1.06 6000 45.36 116.99 1.61 43.84 0.37 0.36 1.03 8000 35.07 116.99 1.83 34.83 0.30 0.30 0.99* 11000 26.02 116.99 2.12 26.72 0.23 0.22 1.03* 14000 20.63 116.99 2.38 22.20 0.19 0.18 1.08*
*outside the inelastic lateral buckling region (elastic lateral buckling region)
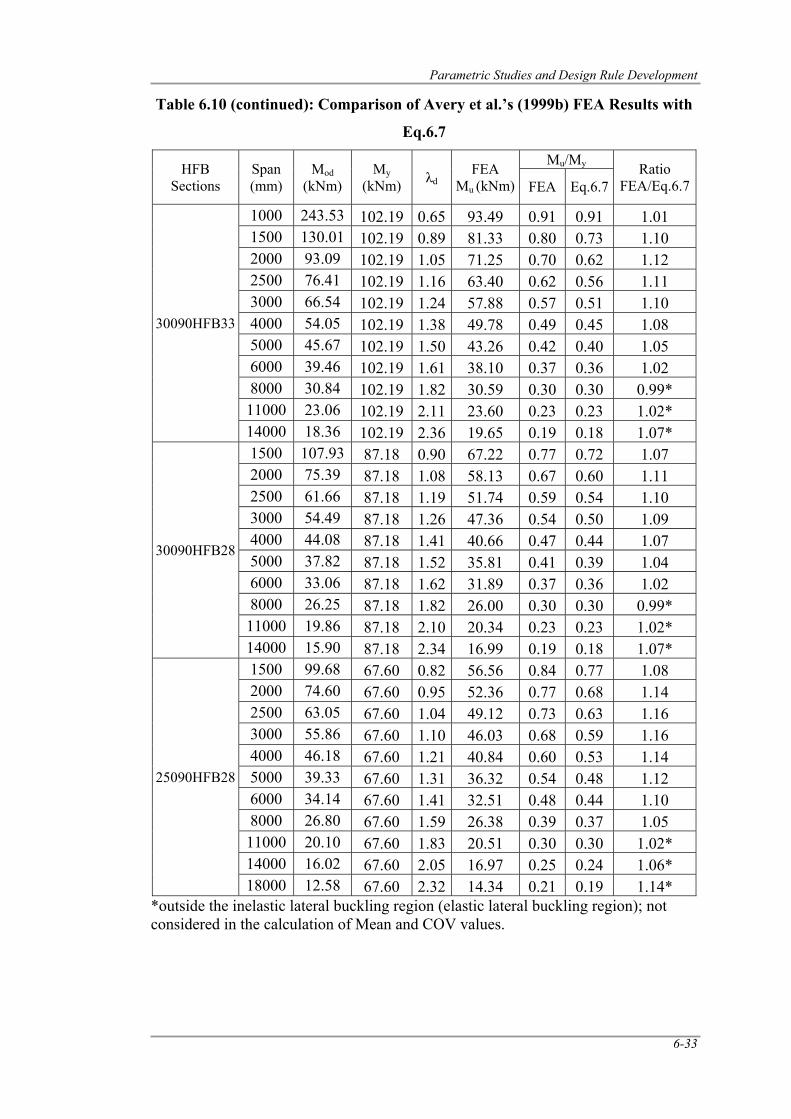
Parametric Studies and Design Rule Development
6-33
Table 6.10 (continued): Comparison of Avery et al.’s (1999b) FEA Results with
Eq.6.7
HFB Sections
Span (mm)
Mod (kNm)
My (kNm) λd
FEA Mu (kNm)
Mu/My Ratio FEA/Eq.6.7FEA Eq.6.7
30090HFB33
1000 243.53 102.19 0.65 93.49 0.91 0.91 1.01 1500 130.01 102.19 0.89 81.33 0.80 0.73 1.10 2000 93.09 102.19 1.05 71.25 0.70 0.62 1.12 2500 76.41 102.19 1.16 63.40 0.62 0.56 1.11 3000 66.54 102.19 1.24 57.88 0.57 0.51 1.10 4000 54.05 102.19 1.38 49.78 0.49 0.45 1.08 5000 45.67 102.19 1.50 43.26 0.42 0.40 1.05 6000 39.46 102.19 1.61 38.10 0.37 0.36 1.02 8000 30.84 102.19 1.82 30.59 0.30 0.30 0.99* 11000 23.06 102.19 2.11 23.60 0.23 0.23 1.02* 14000 18.36 102.19 2.36 19.65 0.19 0.18 1.07*
30090HFB28
1500 107.93 87.18 0.90 67.22 0.77 0.72 1.07 2000 75.39 87.18 1.08 58.13 0.67 0.60 1.11 2500 61.66 87.18 1.19 51.74 0.59 0.54 1.10 3000 54.49 87.18 1.26 47.36 0.54 0.50 1.09 4000 44.08 87.18 1.41 40.66 0.47 0.44 1.07 5000 37.82 87.18 1.52 35.81 0.41 0.39 1.04 6000 33.06 87.18 1.62 31.89 0.37 0.36 1.02 8000 26.25 87.18 1.82 26.00 0.30 0.30 0.99* 11000 19.86 87.18 2.10 20.34 0.23 0.23 1.02* 14000 15.90 87.18 2.34 16.99 0.19 0.18 1.07*
25090HFB28
1500 99.68 67.60 0.82 56.56 0.84 0.77 1.08 2000 74.60 67.60 0.95 52.36 0.77 0.68 1.14 2500 63.05 67.60 1.04 49.12 0.73 0.63 1.16 3000 55.86 67.60 1.10 46.03 0.68 0.59 1.16 4000 46.18 67.60 1.21 40.84 0.60 0.53 1.14 5000 39.33 67.60 1.31 36.32 0.54 0.48 1.12 6000 34.14 67.60 1.41 32.51 0.48 0.44 1.10 8000 26.80 67.60 1.59 26.38 0.39 0.37 1.05 11000 20.10 67.60 1.83 20.51 0.30 0.30 1.02* 14000 16.02 67.60 2.05 16.97 0.25 0.24 1.06* 18000 12.58 67.60 2.32 14.34 0.21 0.19 1.14*
*outside the inelastic lateral buckling region (elastic lateral buckling region); not considered in the calculation of Mean and COV values.
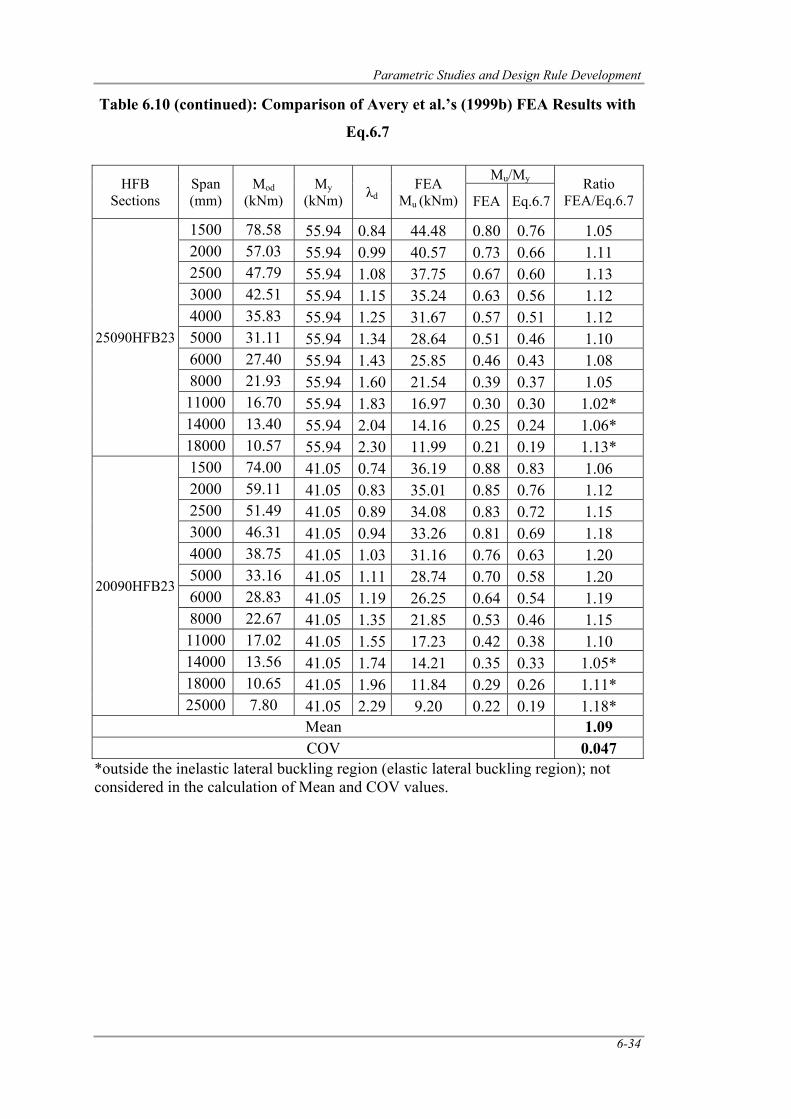
Parametric Studies and Design Rule Development
6-34
Table 6.10 (continued): Comparison of Avery et al.’s (1999b) FEA Results with
Eq.6.7
HFB Sections
Span (mm)
Mod (kNm)
My (kNm) λd
FEA Mu (kNm)
Mu/My Ratio FEA/Eq.6.7 FEA Eq.6.7
25090HFB23
1500 78.58 55.94 0.84 44.48 0.80 0.76 1.05 2000 57.03 55.94 0.99 40.57 0.73 0.66 1.11 2500 47.79 55.94 1.08 37.75 0.67 0.60 1.13 3000 42.51 55.94 1.15 35.24 0.63 0.56 1.12 4000 35.83 55.94 1.25 31.67 0.57 0.51 1.12 5000 31.11 55.94 1.34 28.64 0.51 0.46 1.10 6000 27.40 55.94 1.43 25.85 0.46 0.43 1.08 8000 21.93 55.94 1.60 21.54 0.39 0.37 1.05 11000 16.70 55.94 1.83 16.97 0.30 0.30 1.02* 14000 13.40 55.94 2.04 14.16 0.25 0.24 1.06* 18000 10.57 55.94 2.30 11.99 0.21 0.19 1.13*
20090HFB23
1500 74.00 41.05 0.74 36.19 0.88 0.83 1.06 2000 59.11 41.05 0.83 35.01 0.85 0.76 1.12 2500 51.49 41.05 0.89 34.08 0.83 0.72 1.15 3000 46.31 41.05 0.94 33.26 0.81 0.69 1.18 4000 38.75 41.05 1.03 31.16 0.76 0.63 1.20 5000 33.16 41.05 1.11 28.74 0.70 0.58 1.20 6000 28.83 41.05 1.19 26.25 0.64 0.54 1.19 8000 22.67 41.05 1.35 21.85 0.53 0.46 1.15 11000 17.02 41.05 1.55 17.23 0.42 0.38 1.10 14000 13.56 41.05 1.74 14.21 0.35 0.33 1.05* 18000 10.65 41.05 1.96 11.84 0.29 0.26 1.11* 25000 7.80 41.05 2.29 9.20 0.22 0.19 1.18*
Mean 1.09 COV 0.047
*outside the inelastic lateral buckling region (elastic lateral buckling region); not considered in the calculation of Mean and COV values.
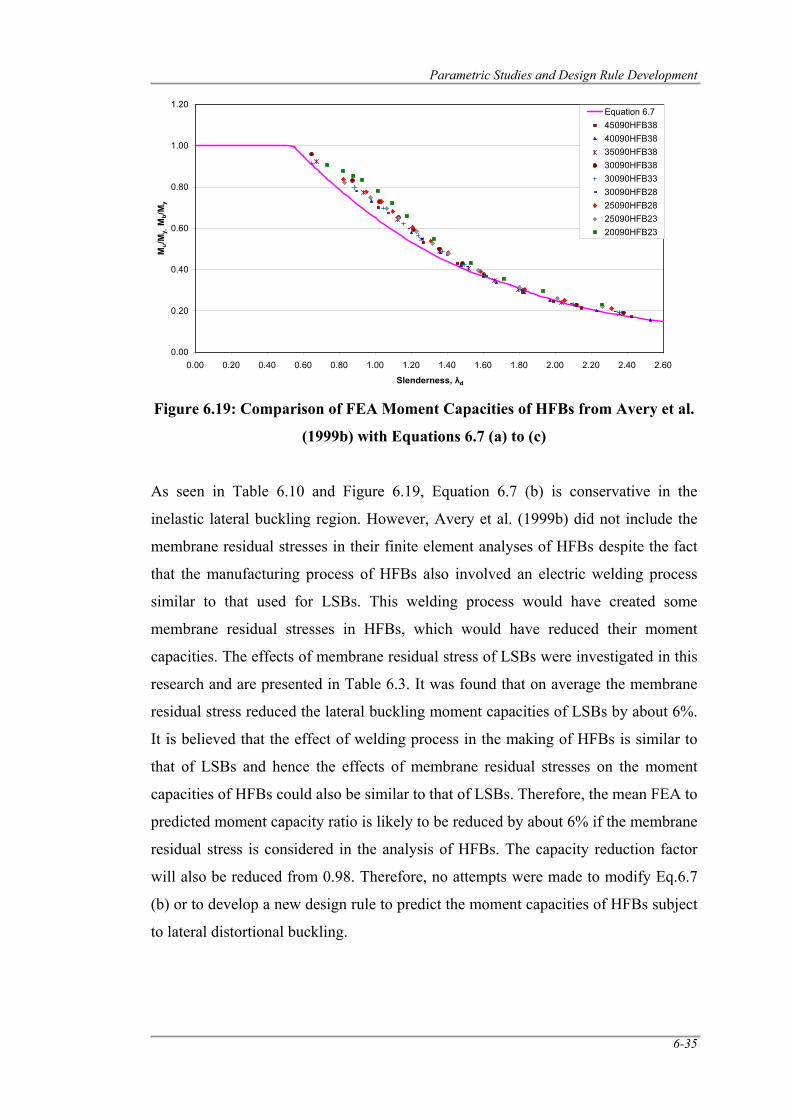
Parametric Studies and Design Rule Development
6-35
Figure 6.19: Comparison of FEA Moment Capacities of HFBs from Avery et al.
(1999b) with Equations 6.7 (a) to (c)
As seen in Table 6.10 and Figure 6.19, Equation 6.7 (b) is conservative in the
inelastic lateral buckling region. However, Avery et al. (1999b) did not include the
membrane residual stresses in their finite element analyses of HFBs despite the fact
that the manufacturing process of HFBs also involved an electric welding process
similar to that used for LSBs. This welding process would have created some
membrane residual stresses in HFBs, which would have reduced their moment
capacities. The effects of membrane residual stress of LSBs were investigated in this
research and are presented in Table 6.3. It was found that on average the membrane
residual stress reduced the lateral buckling moment capacities of LSBs by about 6%.
It is believed that the effect of welding process in the making of HFBs is similar to
that of LSBs and hence the effects of membrane residual stresses on the moment
capacities of HFBs could also be similar to that of LSBs. Therefore, the mean FEA to
predicted moment capacity ratio is likely to be reduced by about 6% if the membrane
residual stress is considered in the analysis of HFBs. The capacity reduction factor
will also be reduced from 0.98. Therefore, no attempts were made to modify Eq.6.7
(b) or to develop a new design rule to predict the moment capacities of HFBs subject
to lateral distortional buckling.
0.00
0.20
0.40
0.60
0.80
1.00
1.20
0.00 0.20 0.40 0.60 0.80 1.00 1.20 1.40 1.60 1.80 2.00 2.20 2.40 2.60
Slenderness, λd
Mu/M
y, M
b/My
Equation 6.745090HFB3840090HFB3835090HFB3830090HFB3830090HFB3330090HFB2825090HFB2825090HFB2320090HFB23
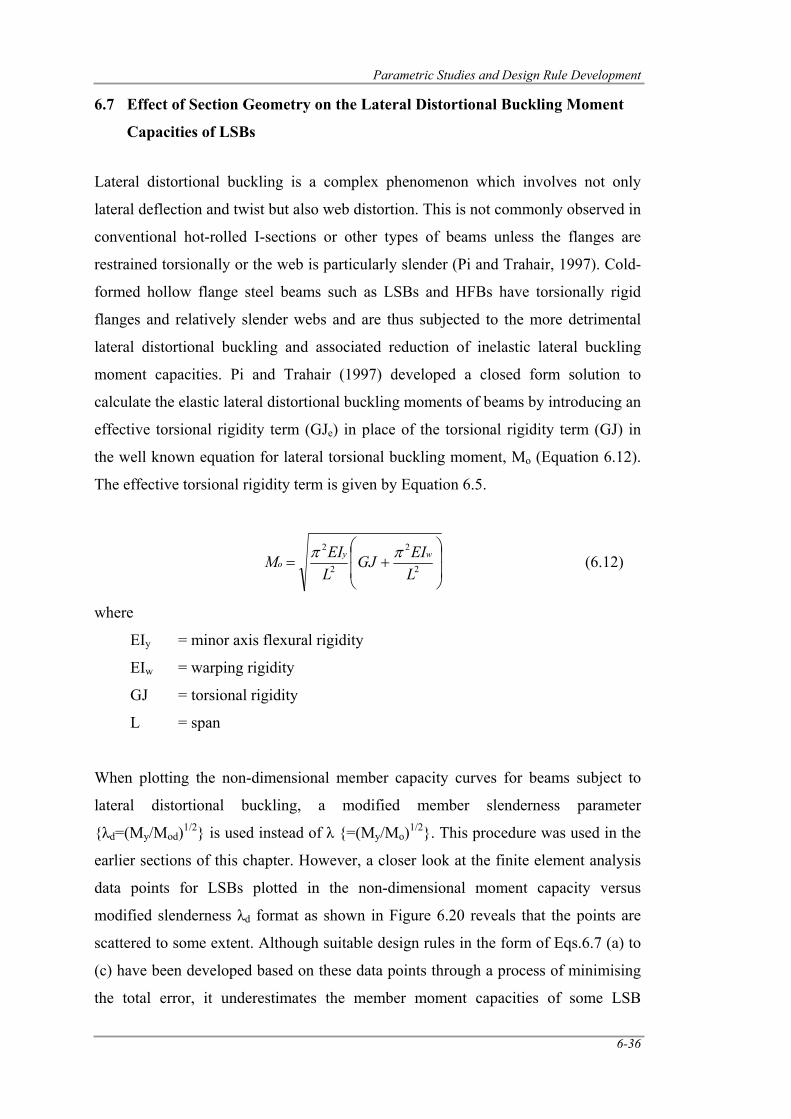
Parametric Studies and Design Rule Development
6-36
6.7 Effect of Section Geometry on the Lateral Distortional Buckling Moment
Capacities of LSBs
Lateral distortional buckling is a complex phenomenon which involves not only
lateral deflection and twist but also web distortion. This is not commonly observed in
conventional hot-rolled I-sections or other types of beams unless the flanges are
restrained torsionally or the web is particularly slender (Pi and Trahair, 1997). Cold-
formed hollow flange steel beams such as LSBs and HFBs have torsionally rigid
flanges and relatively slender webs and are thus subjected to the more detrimental
lateral distortional buckling and associated reduction of inelastic lateral buckling
moment capacities. Pi and Trahair (1997) developed a closed form solution to
calculate the elastic lateral distortional buckling moments of beams by introducing an
effective torsional rigidity term (GJe) in place of the torsional rigidity term (GJ) in
the well known equation for lateral torsional buckling moment, Mo (Equation 6.12).
The effective torsional rigidity term is given by Equation 6.5.
⎟⎟
⎠
⎞
⎜⎜
⎝
⎛+= 2
2
2
2
LEIGJ
LEIM wy
oππ (6.12)
where
EIy = minor axis flexural rigidity
EIw = warping rigidity
GJ = torsional rigidity
L = span
When plotting the non-dimensional member capacity curves for beams subject to
lateral distortional buckling, a modified member slenderness parameter
{λd=(My/Mod)1/2} is used instead of λ {=(My/Mo)1/2}. This procedure was used in the
earlier sections of this chapter. However, a closer look at the finite element analysis
data points for LSBs plotted in the non-dimensional moment capacity versus
modified slenderness λd format as shown in Figure 6.20 reveals that the points are
scattered to some extent. Although suitable design rules in the form of Eqs.6.7 (a) to
(c) have been developed based on these data points through a process of minimising
the total error, it underestimates the member moment capacities of some LSB
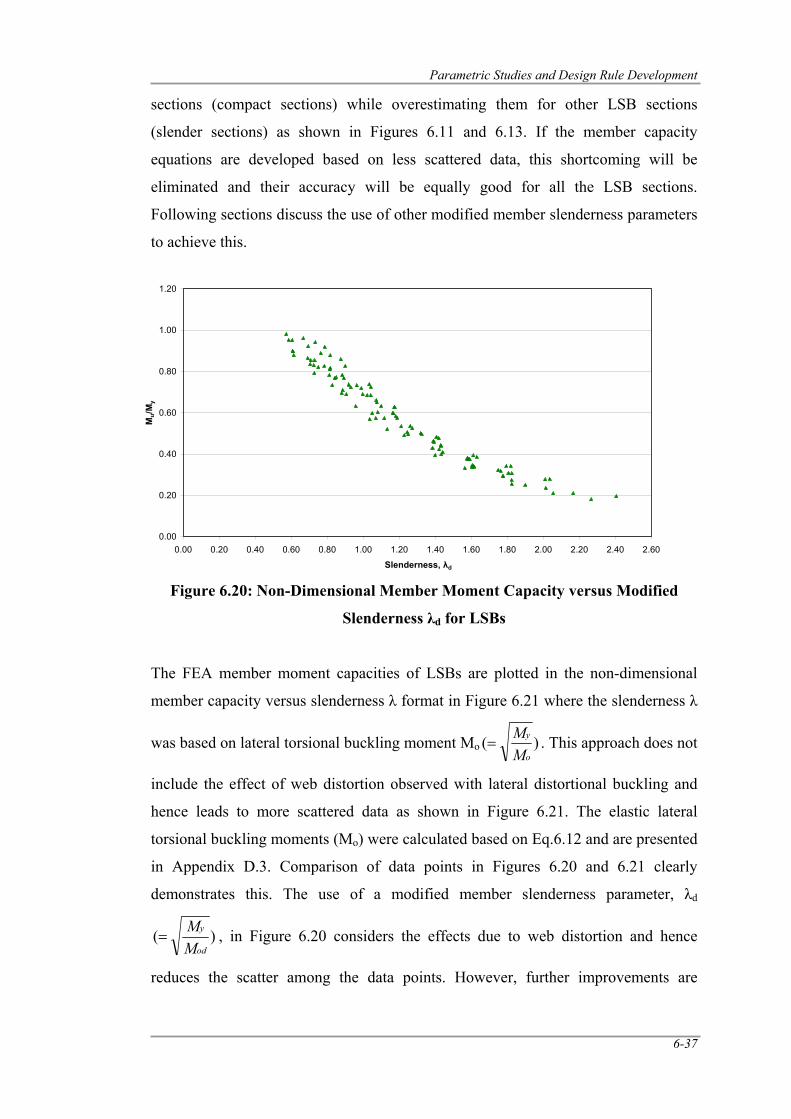
Parametric Studies and Design Rule Development
6-37
sections (compact sections) while overestimating them for other LSB sections
(slender sections) as shown in Figures 6.11 and 6.13. If the member capacity
equations are developed based on less scattered data, this shortcoming will be
eliminated and their accuracy will be equally good for all the LSB sections.
Following sections discuss the use of other modified member slenderness parameters
to achieve this.
Figure 6.20: Non-Dimensional Member Moment Capacity versus Modified
Slenderness λd for LSBs
The FEA member moment capacities of LSBs are plotted in the non-dimensional
member capacity versus slenderness λ format in Figure 6.21 where the slenderness λ
was based on lateral torsional buckling moment Mo )(o
y
MM
= . This approach does not
include the effect of web distortion observed with lateral distortional buckling and
hence leads to more scattered data as shown in Figure 6.21. The elastic lateral
torsional buckling moments (Mo) were calculated based on Eq.6.12 and are presented
in Appendix D.3. Comparison of data points in Figures 6.20 and 6.21 clearly
demonstrates this. The use of a modified member slenderness parameter, λd
)(od
y
MM
= , in Figure 6.20 considers the effects due to web distortion and hence
reduces the scatter among the data points. However, further improvements are
0.00
0.20
0.40
0.60
0.80
1.00
1.20
0.00 0.20 0.40 0.60 0.80 1.00 1.20 1.40 1.60 1.80 2.00 2.20 2.40 2.60
Slenderness, λd
Mu/
My
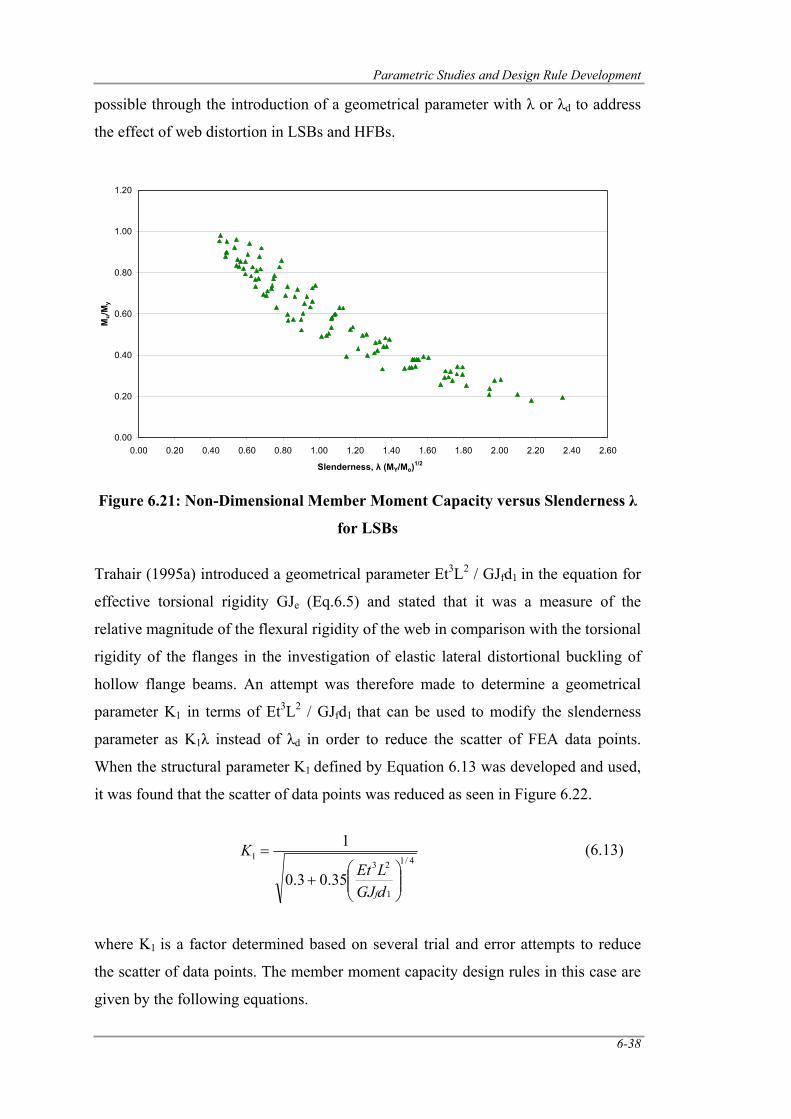
Parametric Studies and Design Rule Development
6-38
possible through the introduction of a geometrical parameter with λ or λd to address
the effect of web distortion in LSBs and HFBs.
Figure 6.21: Non-Dimensional Member Moment Capacity versus Slenderness λ
for LSBs
Trahair (1995a) introduced a geometrical parameter Et3L2 / GJfd1 in the equation for
effective torsional rigidity GJe (Eq.6.5) and stated that it was a measure of the
relative magnitude of the flexural rigidity of the web in comparison with the torsional
rigidity of the flanges in the investigation of elastic lateral distortional buckling of
hollow flange beams. An attempt was therefore made to determine a geometrical
parameter K1 in terms of Et3L2 / GJfd1 that can be used to modify the slenderness
parameter as K1λ instead of λd in order to reduce the scatter of FEA data points.
When the structural parameter K1 defined by Equation 6.13 was developed and used,
it was found that the scatter of data points was reduced as seen in Figure 6.22.
4/1
1
231
35.03.0
1
⎟⎟⎠
⎞⎜⎜⎝
⎛+
=
dGJLEt
K
f
(6.13)
where K1 is a factor determined based on several trial and error attempts to reduce
the scatter of data points. The member moment capacity design rules in this case are
given by the following equations.
0.00
0.20
0.40
0.60
0.80
1.00
1.20
0.00 0.20 0.40 0.60 0.80 1.00 1.20 1.40 1.60 1.80 2.00 2.20 2.40 2.60
Slenderness, λ (MY/Mo)1/2
Mu/M
y
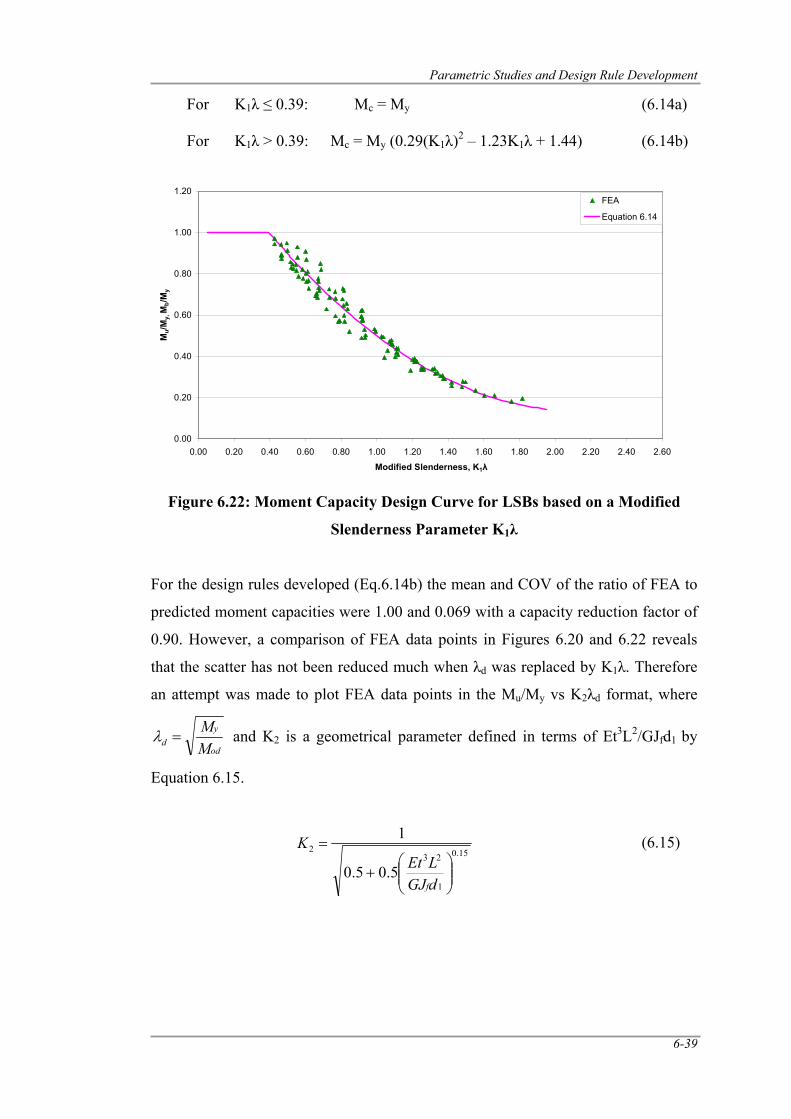
Parametric Studies and Design Rule Development
6-39
For K1λ ≤ 0.39: Mc = My (6.14a)
For K1λ > 0.39: Mc = My (0.29(K1λ)2 – 1.23K1λ + 1.44) (6.14b)
Figure 6.22: Moment Capacity Design Curve for LSBs based on a Modified
Slenderness Parameter K1λ
For the design rules developed (Eq.6.14b) the mean and COV of the ratio of FEA to
predicted moment capacities were 1.00 and 0.069 with a capacity reduction factor of
0.90. However, a comparison of FEA data points in Figures 6.20 and 6.22 reveals
that the scatter has not been reduced much when λd was replaced by K1λ. Therefore
an attempt was made to plot FEA data points in the Mu/My vs K2λd format, where
od
yd M
M=λ and K2 is a geometrical parameter defined in terms of Et3L2/GJfd1 by
Equation 6.15.
15.0
1
232
5.05.0
1
⎟⎟⎠
⎞⎜⎜⎝
⎛+
=
dGJLEt
K
f
(6.15)
0.00
0.20
0.40
0.60
0.80
1.00
1.20
0.00 0.20 0.40 0.60 0.80 1.00 1.20 1.40 1.60 1.80 2.00 2.20 2.40 2.60
Modified Slenderness, K1λ
Mu/M
y, M
b/My
FEA
Equation 6.14
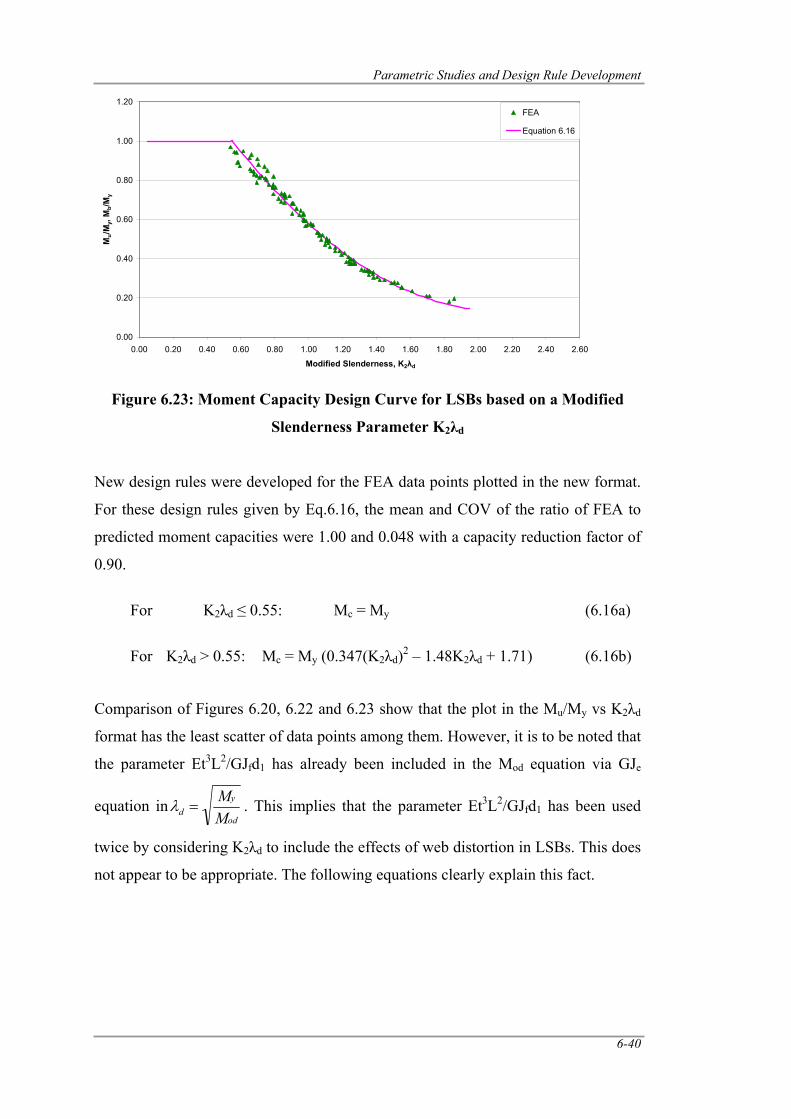
Parametric Studies and Design Rule Development
6-40
Figure 6.23: Moment Capacity Design Curve for LSBs based on a Modified
Slenderness Parameter K2λd
New design rules were developed for the FEA data points plotted in the new format.
For these design rules given by Eq.6.16, the mean and COV of the ratio of FEA to
predicted moment capacities were 1.00 and 0.048 with a capacity reduction factor of
0.90.
For K2λd ≤ 0.55: Mc = My (6.16a)
For K2λd > 0.55: Mc = My (0.347(K2λd)2 – 1.48K2λd + 1.71) (6.16b)
Comparison of Figures 6.20, 6.22 and 6.23 show that the plot in the Mu/My vs K2λd
format has the least scatter of data points among them. However, it is to be noted that
the parameter Et3L2/GJfd1 has already been included in the Mod equation via GJe
equation inod
yd M
M=λ . This implies that the parameter Et3L2/GJfd1 has been used
twice by considering K2λd to include the effects of web distortion in LSBs. This does
not appear to be appropriate. The following equations clearly explain this fact.
0.00
0.20
0.40
0.60
0.80
1.00
1.20
0.00 0.20 0.40 0.60 0.80 1.00 1.20 1.40 1.60 1.80 2.00 2.20 2.40 2.60
Modified Slenderness, K2λd
Mu/
My,
Mb/M
yFEA
Equation 6.16
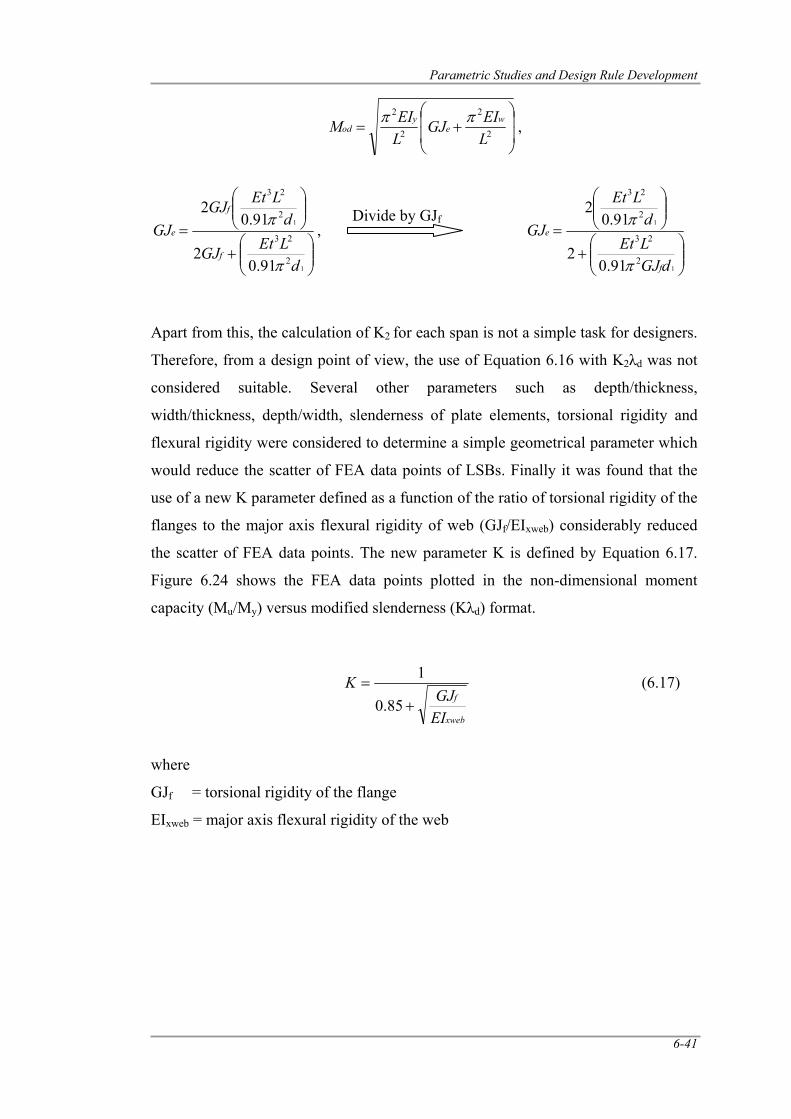
Parametric Studies and Design Rule Development
6-41
⎟⎟
⎠
⎞
⎜⎜
⎝
⎛+= 2
2
2
2
LEIGJ
LEIM w
ey
odππ ,
⎟⎟⎠
⎞⎜⎜⎝
⎛+
⎟⎟⎠
⎞⎜⎜⎝
⎛
=
1
1
2
23
2
23
91.02
91.02
dLEtGJ
dLEtGJ
GJf
f
e
π
π,
⎟⎟⎠
⎞⎜⎜⎝
⎛+
⎟⎟⎠
⎞⎜⎜⎝
⎛
=
1
1
2
23
2
23
91.02
91.02
dGJLEtd
LEt
GJ
f
e
π
π
Apart from this, the calculation of K2 for each span is not a simple task for designers.
Therefore, from a design point of view, the use of Equation 6.16 with K2λd was not
considered suitable. Several other parameters such as depth/thickness,
width/thickness, depth/width, slenderness of plate elements, torsional rigidity and
flexural rigidity were considered to determine a simple geometrical parameter which
would reduce the scatter of FEA data points of LSBs. Finally it was found that the
use of a new K parameter defined as a function of the ratio of torsional rigidity of the
flanges to the major axis flexural rigidity of web (GJf/EIxweb) considerably reduced
the scatter of FEA data points. The new parameter K is defined by Equation 6.17.
Figure 6.24 shows the FEA data points plotted in the non-dimensional moment
capacity (Mu/My) versus modified slenderness (Kλd) format.
xweb
f
EIGJ
K+
=85.0
1 (6.17)
where
GJf = torsional rigidity of the flange
EIxweb = major axis flexural rigidity of the web
Divide by GJf
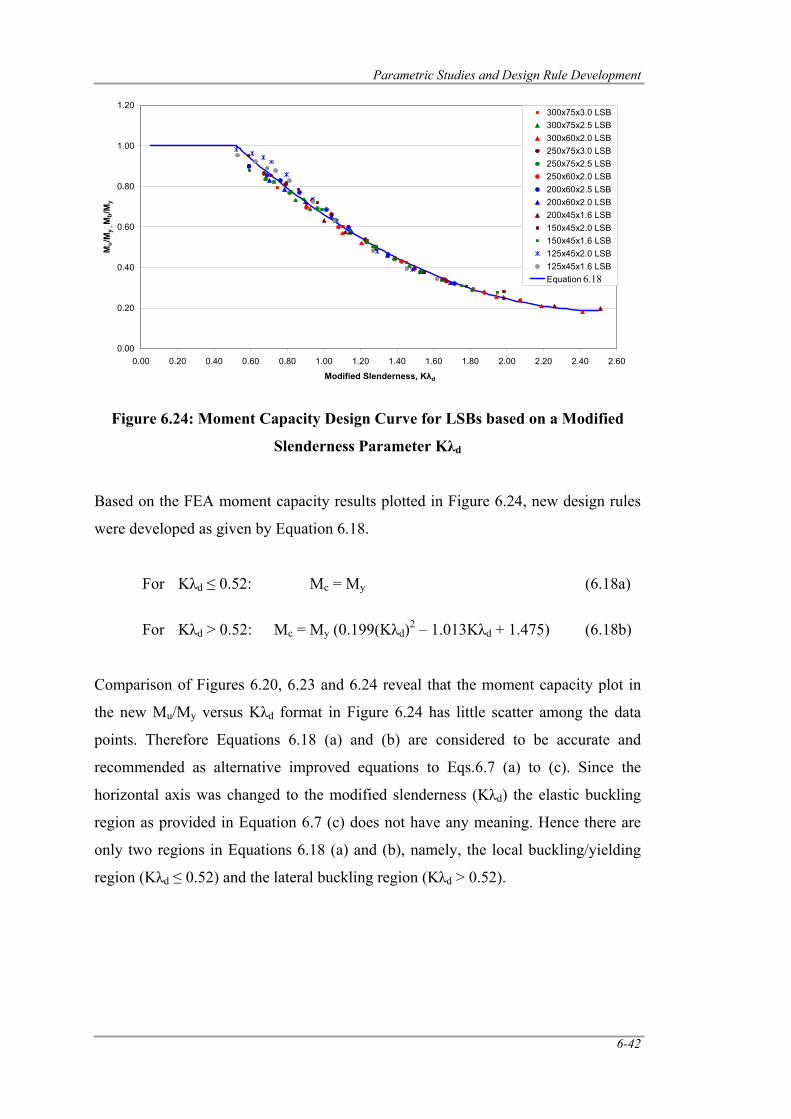
Parametric Studies and Design Rule Development
6-42
Figure 6.24: Moment Capacity Design Curve for LSBs based on a Modified
Slenderness Parameter Kλd
Based on the FEA moment capacity results plotted in Figure 6.24, new design rules
were developed as given by Equation 6.18.
For Kλd ≤ 0.52: Mc = My (6.18a)
For Kλd > 0.52: Mc = My (0.199(Kλd)2 – 1.013Kλd + 1.475) (6.18b)
Comparison of Figures 6.20, 6.23 and 6.24 reveal that the moment capacity plot in
the new Mu/My versus Kλd format in Figure 6.24 has little scatter among the data
points. Therefore Equations 6.18 (a) and (b) are considered to be accurate and
recommended as alternative improved equations to Eqs.6.7 (a) to (c). Since the
horizontal axis was changed to the modified slenderness (Kλd) the elastic buckling
region as provided in Equation 6.7 (c) does not have any meaning. Hence there are
only two regions in Equations 6.18 (a) and (b), namely, the local buckling/yielding
region (Kλd ≤ 0.52) and the lateral buckling region (Kλd > 0.52).
0.00
0.20
0.40
0.60
0.80
1.00
1.20
0.00 0.20 0.40 0.60 0.80 1.00 1.20 1.40 1.60 1.80 2.00 2.20 2.40 2.60
Modified Slenderness, Kλd
Mu/M
y , M
b/My
300x75x3.0 LSB300x75x2.5 LSB300x60x2.0 LSB250x75x3.0 LSB250x75x2.5 LSB250x60x2.0 LSB200x60x2.5 LSB200x60x2.0 LSB200x45x1.6 LSB150x45x2.0 LSB150x45x1.6 LSB125x45x2.0 LSB125x45x1.6 LSBEquation 6.116.18
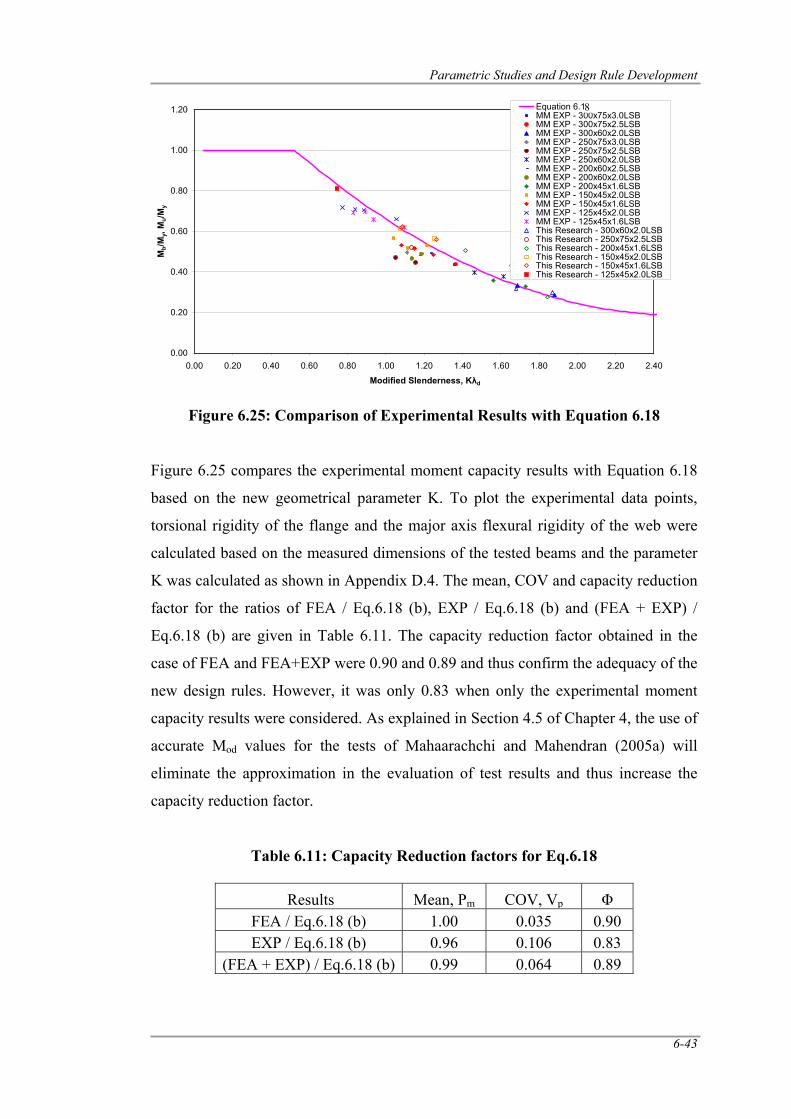
Parametric Studies and Design Rule Development
6-43
Figure 6.25: Comparison of Experimental Results with Equation 6.18
Figure 6.25 compares the experimental moment capacity results with Equation 6.18
based on the new geometrical parameter K. To plot the experimental data points,
torsional rigidity of the flange and the major axis flexural rigidity of the web were
calculated based on the measured dimensions of the tested beams and the parameter
K was calculated as shown in Appendix D.4. The mean, COV and capacity reduction
factor for the ratios of FEA / Eq.6.18 (b), EXP / Eq.6.18 (b) and (FEA + EXP) /
Eq.6.18 (b) are given in Table 6.11. The capacity reduction factor obtained in the
case of FEA and FEA+EXP were 0.90 and 0.89 and thus confirm the adequacy of the
new design rules. However, it was only 0.83 when only the experimental moment
capacity results were considered. As explained in Section 4.5 of Chapter 4, the use of
accurate Mod values for the tests of Mahaarachchi and Mahendran (2005a) will
eliminate the approximation in the evaluation of test results and thus increase the
capacity reduction factor.
Table 6.11: Capacity Reduction factors for Eq.6.18
Results Mean, Pm COV, Vp Φ FEA / Eq.6.18 (b) 1.00 0.035 0.90 EXP / Eq.6.18 (b) 0.96 0.106 0.83
(FEA + EXP) / Eq.6.18 (b) 0.99 0.064 0.89
0.00
0.20
0.40
0.60
0.80
1.00
1.20
0.00 0.20 0.40 0.60 0.80 1.00 1.20 1.40 1.60 1.80 2.00 2.20 2.40
Modified Slenderness, Kλd
Mb/M
y, M
u/My
Equation 6.11MM EXP - 300x75x3.0LSBMM EXP - 300x75x2.5LSBMM EXP - 300x60x2.0LSBMM EXP - 250x75x3.0LSBMM EXP - 250x75x2.5LSBMM EXP - 250x60x2.0LSBMM EXP - 200x60x2.5LSBMM EXP - 200x60x2.0LSBMM EXP - 200x45x1.6LSBMM EXP - 150x45x2.0LSBMM EXP - 150x45x1.6LSBMM EXP - 125x45x2.0LSBMM EXP - 125x45x1.6LSBThis Research - 300x60x2.0LSBThis Research - 250x75x2.5LSBThis Research - 200x45x1.6LSBThis Research - 150x45x2.0LSBThis Research - 150x45x1.6LSBThis Research - 125x45x2.0LSB
8
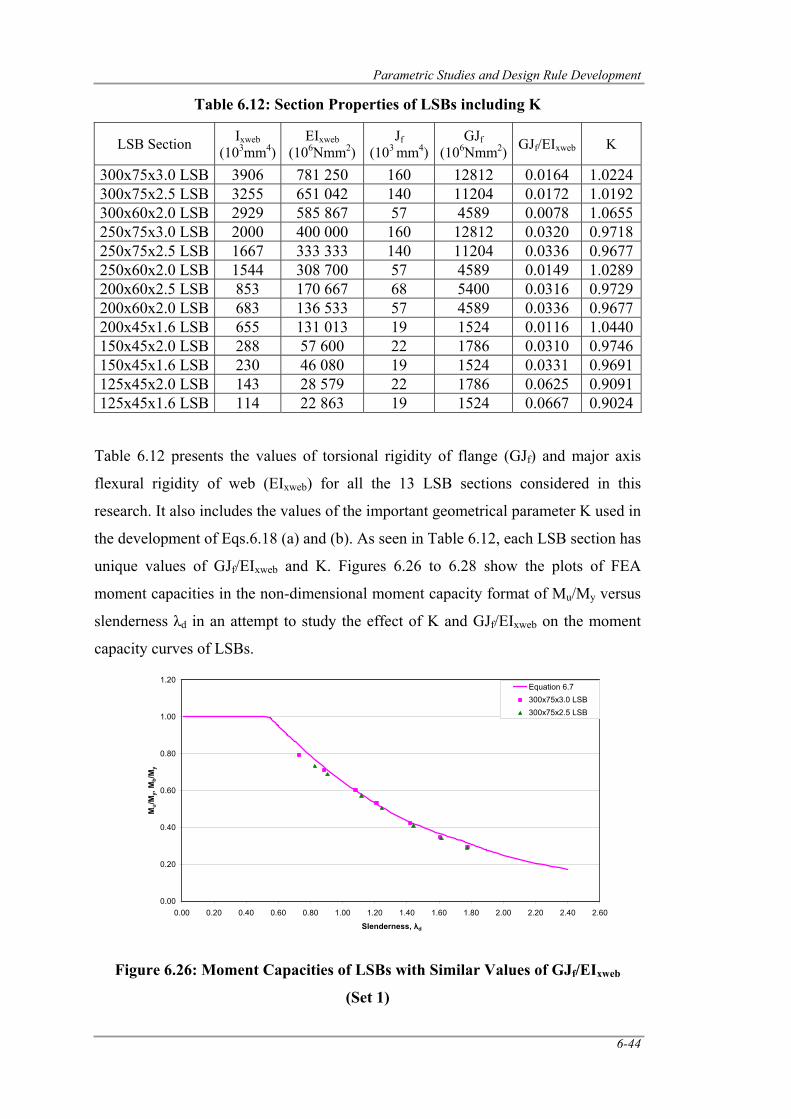
Parametric Studies and Design Rule Development
6-44
Table 6.12: Section Properties of LSBs including K
LSB Section Ixweb (103mm4)
EIxweb (106Nmm2)
Jf (103 mm4)
GJf (106Nmm2) GJf/EIxweb K
300x75x3.0 LSB 3906 781 250 160 12812 0.0164 1.0224 300x75x2.5 LSB 3255 651 042 140 11204 0.0172 1.0192 300x60x2.0 LSB 2929 585 867 57 4589 0.0078 1.0655 250x75x3.0 LSB 2000 400 000 160 12812 0.0320 0.9718 250x75x2.5 LSB 1667 333 333 140 11204 0.0336 0.9677 250x60x2.0 LSB 1544 308 700 57 4589 0.0149 1.0289 200x60x2.5 LSB 853 170 667 68 5400 0.0316 0.9729 200x60x2.0 LSB 683 136 533 57 4589 0.0336 0.9677 200x45x1.6 LSB 655 131 013 19 1524 0.0116 1.0440 150x45x2.0 LSB 288 57 600 22 1786 0.0310 0.9746 150x45x1.6 LSB 230 46 080 19 1524 0.0331 0.9691 125x45x2.0 LSB 143 28 579 22 1786 0.0625 0.9091 125x45x1.6 LSB 114 22 863 19 1524 0.0667 0.9024
Table 6.12 presents the values of torsional rigidity of flange (GJf) and major axis
flexural rigidity of web (EIxweb) for all the 13 LSB sections considered in this
research. It also includes the values of the important geometrical parameter K used in
the development of Eqs.6.18 (a) and (b). As seen in Table 6.12, each LSB section has
unique values of GJf/EIxweb and K. Figures 6.26 to 6.28 show the plots of FEA
moment capacities in the non-dimensional moment capacity format of Mu/My versus
slenderness λd in an attempt to study the effect of K and GJf/EIxweb on the moment
capacity curves of LSBs.
Figure 6.26: Moment Capacities of LSBs with Similar Values of GJf/EIxweb
(Set 1)
0.00
0.20
0.40
0.60
0.80
1.00
1.20
0.00 0.20 0.40 0.60 0.80 1.00 1.20 1.40 1.60 1.80 2.00 2.20 2.40 2.60
Slenderness, λd
Mu/M
y, M
b/My
Equation 6.7300x75x3.0 LSB300x75x2.5 LSB
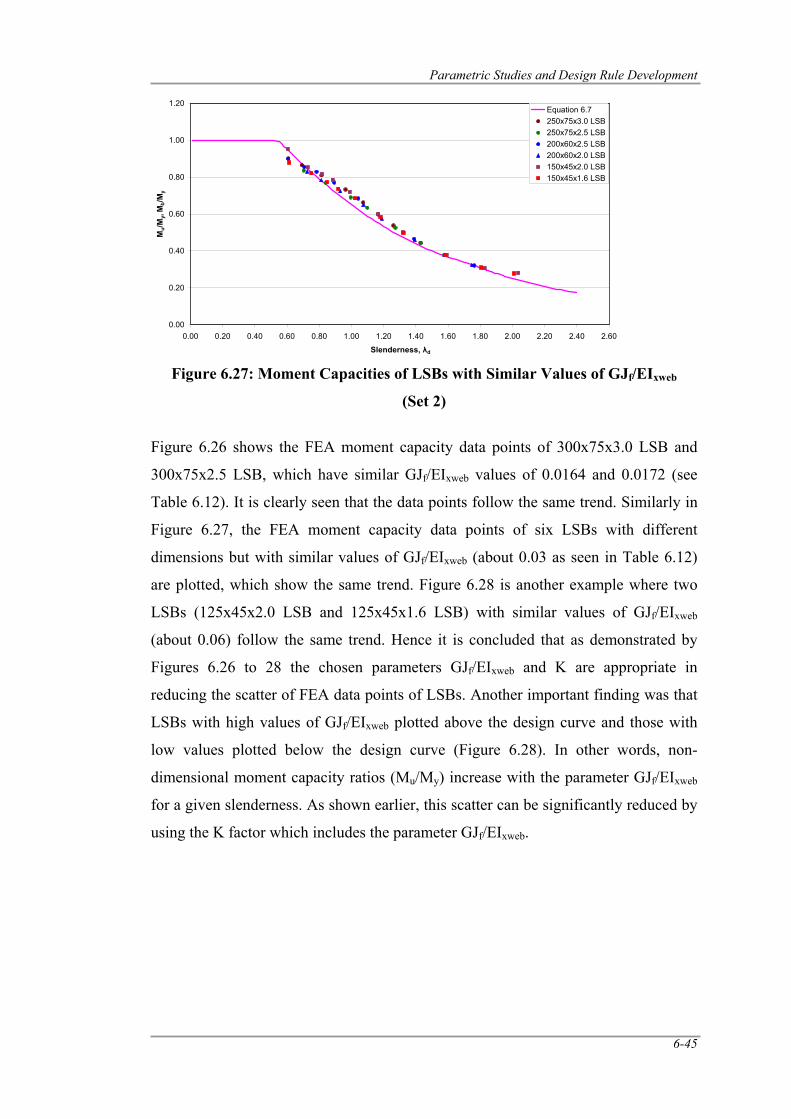
Parametric Studies and Design Rule Development
6-45
Figure 6.27: Moment Capacities of LSBs with Similar Values of GJf/EIxweb
(Set 2)
Figure 6.26 shows the FEA moment capacity data points of 300x75x3.0 LSB and
300x75x2.5 LSB, which have similar GJf/EIxweb values of 0.0164 and 0.0172 (see
Table 6.12). It is clearly seen that the data points follow the same trend. Similarly in
Figure 6.27, the FEA moment capacity data points of six LSBs with different
dimensions but with similar values of GJf/EIxweb (about 0.03 as seen in Table 6.12)
are plotted, which show the same trend. Figure 6.28 is another example where two
LSBs (125x45x2.0 LSB and 125x45x1.6 LSB) with similar values of GJf/EIxweb
(about 0.06) follow the same trend. Hence it is concluded that as demonstrated by
Figures 6.26 to 28 the chosen parameters GJf/EIxweb and K are appropriate in
reducing the scatter of FEA data points of LSBs. Another important finding was that
LSBs with high values of GJf/EIxweb plotted above the design curve and those with
low values plotted below the design curve (Figure 6.28). In other words, non-
dimensional moment capacity ratios (Mu/My) increase with the parameter GJf/EIxweb
for a given slenderness. As shown earlier, this scatter can be significantly reduced by
using the K factor which includes the parameter GJf/EIxweb.
0.00
0.20
0.40
0.60
0.80
1.00
1.20
0.00 0.20 0.40 0.60 0.80 1.00 1.20 1.40 1.60 1.80 2.00 2.20 2.40 2.60
Slenderness, λd
Mu/M
y, M
b/My
Equation 6.7250x75x3.0 LSB250x75x2.5 LSB200x60x2.5 LSB200x60x2.0 LSB150x45x2.0 LSB150x45x1.6 LSB
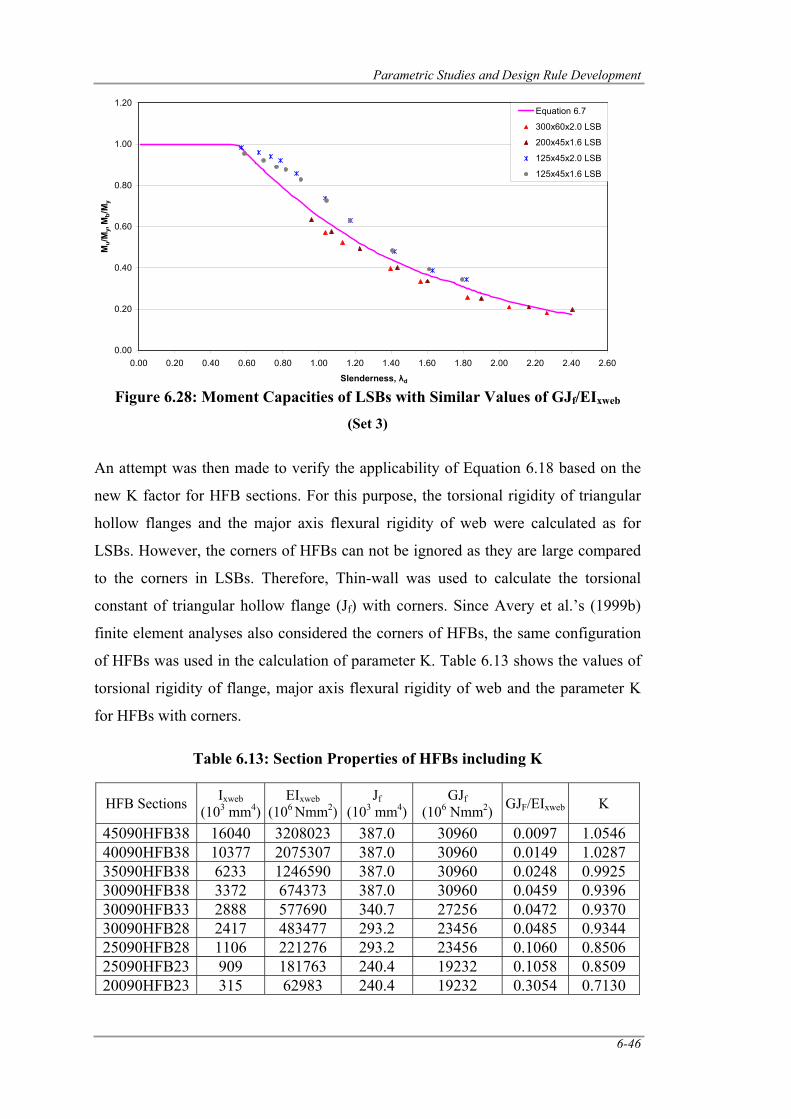
Parametric Studies and Design Rule Development
6-46
Figure 6.28: Moment Capacities of LSBs with Similar Values of GJf/EIxweb
(Set 3)
An attempt was then made to verify the applicability of Equation 6.18 based on the
new K factor for HFB sections. For this purpose, the torsional rigidity of triangular
hollow flanges and the major axis flexural rigidity of web were calculated as for
LSBs. However, the corners of HFBs can not be ignored as they are large compared
to the corners in LSBs. Therefore, Thin-wall was used to calculate the torsional
constant of triangular hollow flange (Jf) with corners. Since Avery et al.’s (1999b)
finite element analyses also considered the corners of HFBs, the same configuration
of HFBs was used in the calculation of parameter K. Table 6.13 shows the values of
torsional rigidity of flange, major axis flexural rigidity of web and the parameter K
for HFBs with corners.
Table 6.13: Section Properties of HFBs including K
HFB Sections Ixweb (103 mm4)
EIxweb (106 Nmm2)
Jf (103 mm4)
GJf (106 Nmm2) GJF/EIxweb K
45090HFB38 16040 3208023 387.0 30960 0.0097 1.0546 40090HFB38 10377 2075307 387.0 30960 0.0149 1.0287 35090HFB38 6233 1246590 387.0 30960 0.0248 0.9925 30090HFB38 3372 674373 387.0 30960 0.0459 0.9396 30090HFB33 2888 577690 340.7 27256 0.0472 0.9370 30090HFB28 2417 483477 293.2 23456 0.0485 0.9344 25090HFB28 1106 221276 293.2 23456 0.1060 0.8506 25090HFB23 909 181763 240.4 19232 0.1058 0.8509 20090HFB23 315 62983 240.4 19232 0.3054 0.7130
0.00
0.20
0.40
0.60
0.80
1.00
1.20
0.00 0.20 0.40 0.60 0.80 1.00 1.20 1.40 1.60 1.80 2.00 2.20 2.40 2.60
Slenderness, λd
Mu/M
y, M
b/M
yEquation 6.7
300x60x2.0 LSB
200x45x1.6 LSB
125x45x2.0 LSB
125x45x1.6 LSB
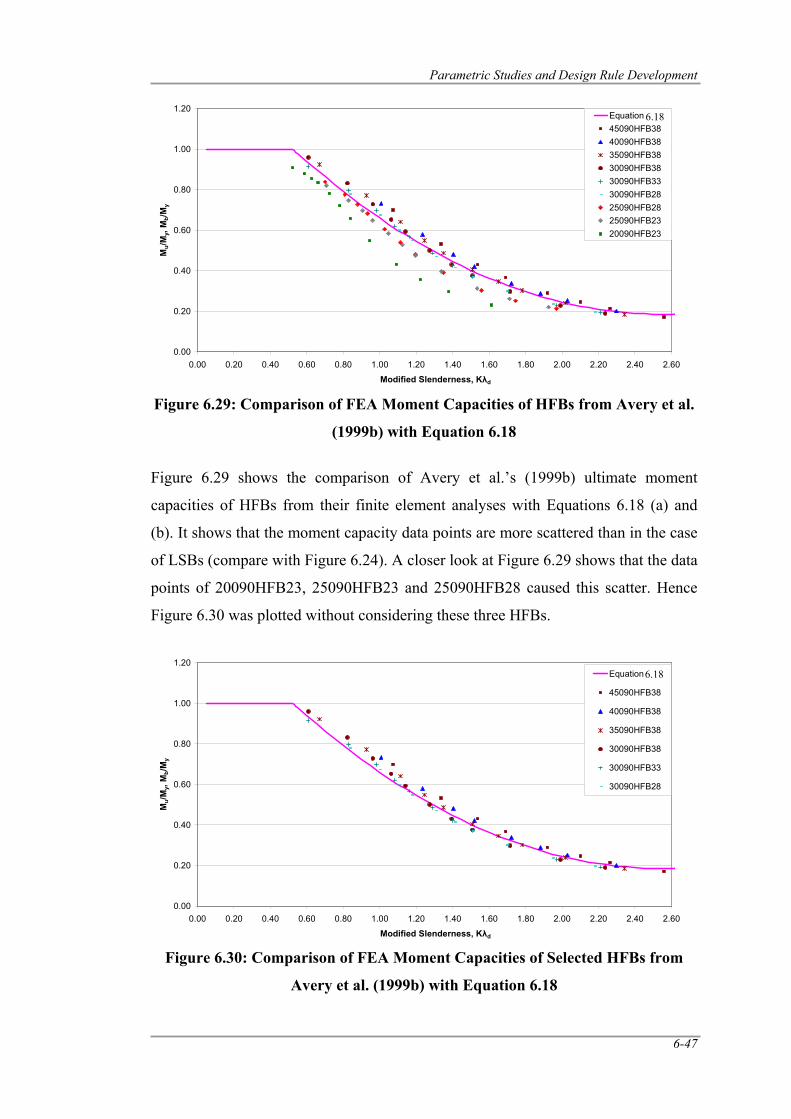
Parametric Studies and Design Rule Development
6-47
Figure 6.29: Comparison of FEA Moment Capacities of HFBs from Avery et al.
(1999b) with Equation 6.18
Figure 6.29 shows the comparison of Avery et al.’s (1999b) ultimate moment
capacities of HFBs from their finite element analyses with Equations 6.18 (a) and
(b). It shows that the moment capacity data points are more scattered than in the case
of LSBs (compare with Figure 6.24). A closer look at Figure 6.29 shows that the data
points of 20090HFB23, 25090HFB23 and 25090HFB28 caused this scatter. Hence
Figure 6.30 was plotted without considering these three HFBs.
Figure 6.30: Comparison of FEA Moment Capacities of Selected HFBs from
Avery et al. (1999b) with Equation 6.18
0.00
0.20
0.40
0.60
0.80
1.00
1.20
0.00 0.20 0.40 0.60 0.80 1.00 1.20 1.40 1.60 1.80 2.00 2.20 2.40 2.60
Modified Slenderness, Kλd
Mu/M
y, M
b/My
Equation 6.1145090HFB38 40090HFB3835090HFB3830090HFB3830090HFB3330090HFB2825090HFB2825090HFB2320090HFB23
6.18
0.00
0.20
0.40
0.60
0.80
1.00
1.20
0.00 0.20 0.40 0.60 0.80 1.00 1.20 1.40 1.60 1.80 2.00 2.20 2.40 2.60
Modified Slenderness, Kλd
Mu/M
y, M
b/My
Equation 6.11
45090HFB38
40090HFB38
35090HFB38
30090HFB38
30090HFB33
30090HFB28
6.18
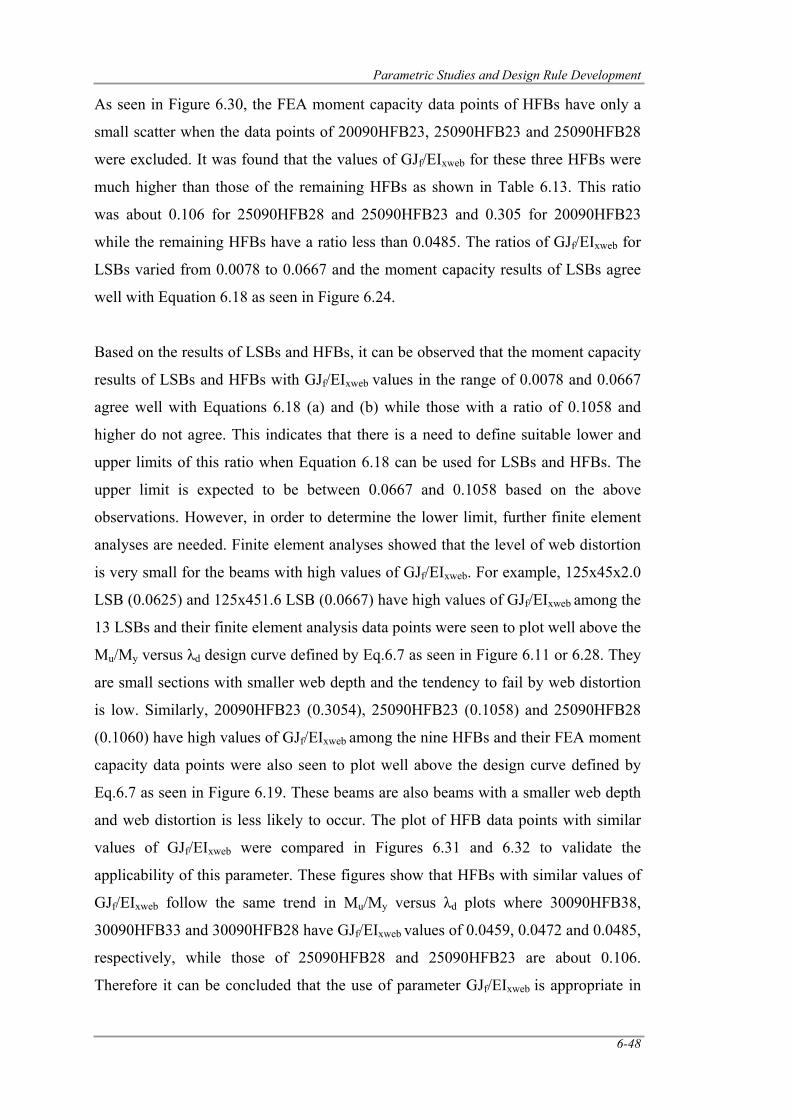
Parametric Studies and Design Rule Development
6-48
As seen in Figure 6.30, the FEA moment capacity data points of HFBs have only a
small scatter when the data points of 20090HFB23, 25090HFB23 and 25090HFB28
were excluded. It was found that the values of GJf/EIxweb for these three HFBs were
much higher than those of the remaining HFBs as shown in Table 6.13. This ratio
was about 0.106 for 25090HFB28 and 25090HFB23 and 0.305 for 20090HFB23
while the remaining HFBs have a ratio less than 0.0485. The ratios of GJf/EIxweb for
LSBs varied from 0.0078 to 0.0667 and the moment capacity results of LSBs agree
well with Equation 6.18 as seen in Figure 6.24.
Based on the results of LSBs and HFBs, it can be observed that the moment capacity
results of LSBs and HFBs with GJf/EIxweb values in the range of 0.0078 and 0.0667
agree well with Equations 6.18 (a) and (b) while those with a ratio of 0.1058 and
higher do not agree. This indicates that there is a need to define suitable lower and
upper limits of this ratio when Equation 6.18 can be used for LSBs and HFBs. The
upper limit is expected to be between 0.0667 and 0.1058 based on the above
observations. However, in order to determine the lower limit, further finite element
analyses are needed. Finite element analyses showed that the level of web distortion
is very small for the beams with high values of GJf/EIxweb. For example, 125x45x2.0
LSB (0.0625) and 125x451.6 LSB (0.0667) have high values of GJf/EIxweb among the
13 LSBs and their finite element analysis data points were seen to plot well above the
Mu/My versus λd design curve defined by Eq.6.7 as seen in Figure 6.11 or 6.28. They
are small sections with smaller web depth and the tendency to fail by web distortion
is low. Similarly, 20090HFB23 (0.3054), 25090HFB23 (0.1058) and 25090HFB28
(0.1060) have high values of GJf/EIxweb among the nine HFBs and their FEA moment
capacity data points were also seen to plot well above the design curve defined by
Eq.6.7 as seen in Figure 6.19. These beams are also beams with a smaller web depth
and web distortion is less likely to occur. The plot of HFB data points with similar
values of GJf/EIxweb were compared in Figures 6.31 and 6.32 to validate the
applicability of this parameter. These figures show that HFBs with similar values of
GJf/EIxweb follow the same trend in Mu/My versus λd plots where 30090HFB38,
30090HFB33 and 30090HFB28 have GJf/EIxweb values of 0.0459, 0.0472 and 0.0485,
respectively, while those of 25090HFB28 and 25090HFB23 are about 0.106.
Therefore it can be concluded that the use of parameter GJf/EIxweb is appropriate in
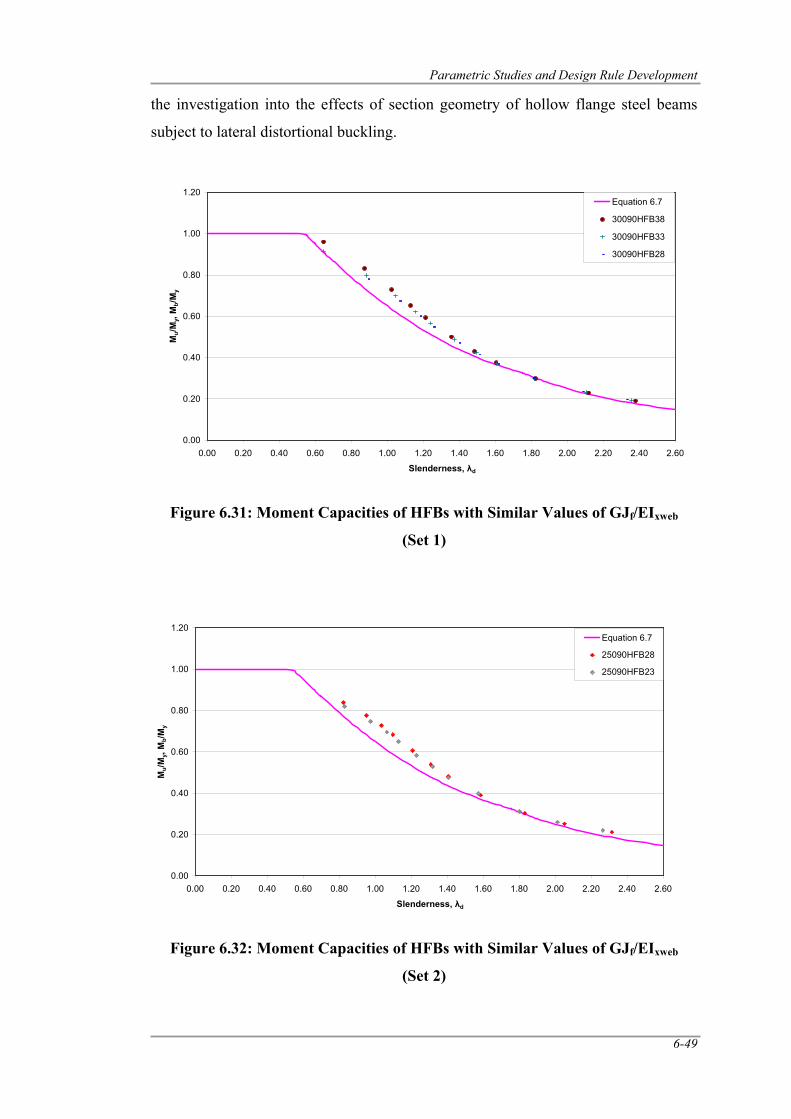
Parametric Studies and Design Rule Development
6-49
the investigation into the effects of section geometry of hollow flange steel beams
subject to lateral distortional buckling.
Figure 6.31: Moment Capacities of HFBs with Similar Values of GJf/EIxweb
(Set 1)
Figure 6.32: Moment Capacities of HFBs with Similar Values of GJf/EIxweb
(Set 2)
0.00
0.20
0.40
0.60
0.80
1.00
1.20
0.00 0.20 0.40 0.60 0.80 1.00 1.20 1.40 1.60 1.80 2.00 2.20 2.40 2.60
Slenderness, λd
Mu/
My,
Mb/
My
Equation 6.7
25090HFB28
25090HFB23
0.00
0.20
0.40
0.60
0.80
1.00
1.20
0.00 0.20 0.40 0.60 0.80 1.00 1.20 1.40 1.60 1.80 2.00 2.20 2.40 2.60
Slenderness, λd
Mu/
My,
Mb/
My
Equation 6.7
30090HFB38
30090HFB33
30090HFB28
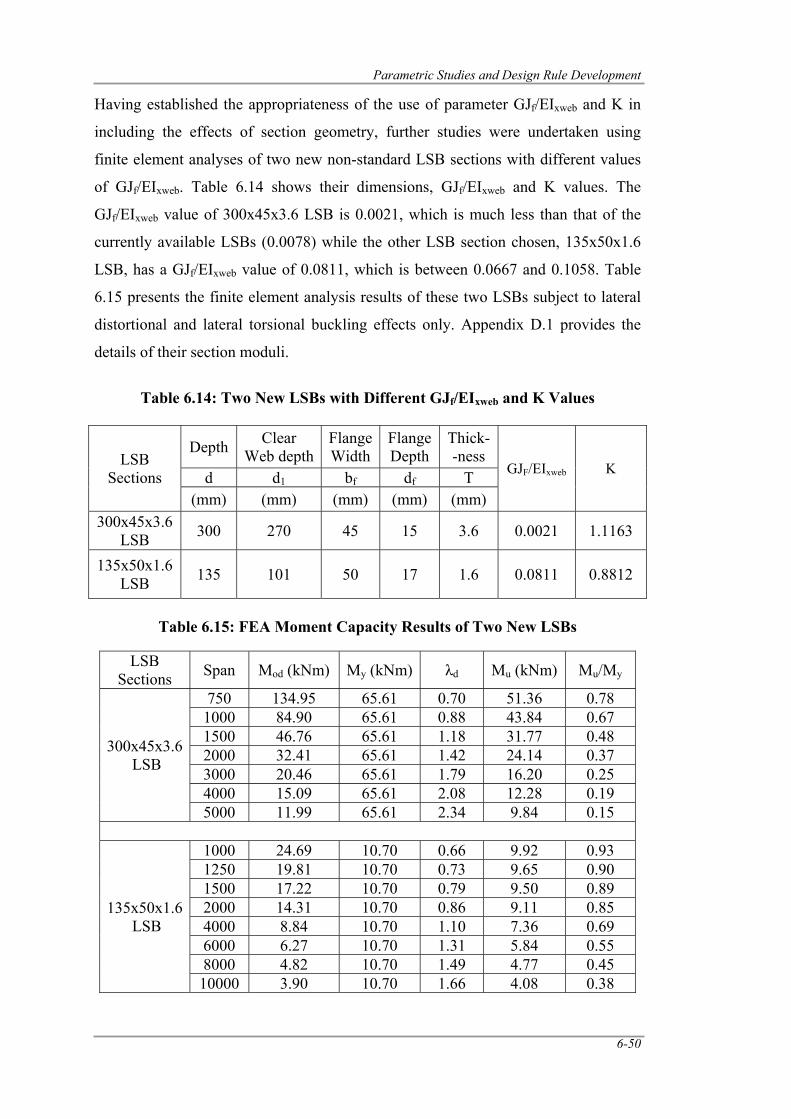
Parametric Studies and Design Rule Development
6-50
Having established the appropriateness of the use of parameter GJf/EIxweb and K in
including the effects of section geometry, further studies were undertaken using
finite element analyses of two new non-standard LSB sections with different values
of GJf/EIxweb. Table 6.14 shows their dimensions, GJf/EIxweb and K values. The
GJf/EIxweb value of 300x45x3.6 LSB is 0.0021, which is much less than that of the
currently available LSBs (0.0078) while the other LSB section chosen, 135x50x1.6
LSB, has a GJf/EIxweb value of 0.0811, which is between 0.0667 and 0.1058. Table
6.15 presents the finite element analysis results of these two LSBs subject to lateral
distortional and lateral torsional buckling effects only. Appendix D.1 provides the
details of their section moduli.
Table 6.14: Two New LSBs with Different GJf/EIxweb and K Values
Table 6.15: FEA Moment Capacity Results of Two New LSBs
LSB
Sections Span Mod (kNm) My (kNm) λd Mu (kNm) Mu/My
300x45x3.6 LSB
750 134.95 65.61 0.70 51.36 0.78 1000 84.90 65.61 0.88 43.84 0.67 1500 46.76 65.61 1.18 31.77 0.48 2000 32.41 65.61 1.42 24.14 0.37 3000 20.46 65.61 1.79 16.20 0.25 4000 15.09 65.61 2.08 12.28 0.19 5000 11.99 65.61 2.34 9.84 0.15
135x50x1.6 LSB
1000 24.69 10.70 0.66 9.92 0.93 1250 19.81 10.70 0.73 9.65 0.90 1500 17.22 10.70 0.79 9.50 0.89 2000 14.31 10.70 0.86 9.11 0.85 4000 8.84 10.70 1.10 7.36 0.69 6000 6.27 10.70 1.31 5.84 0.55 8000 4.82 10.70 1.49 4.77 0.45 10000 3.90 10.70 1.66 4.08 0.38
LSB Sections
Depth Clear Web depth
Flange Width
Flange Depth
Thick--ness
GJF/EIxweb K d d1 bf df T (mm) (mm) (mm) (mm) (mm)
300x45x3.6 LSB 300 270 45 15 3.6 0.0021 1.1163
135x50x1.6 LSB 135 101 50 17 1.6 0.0811 0.8812
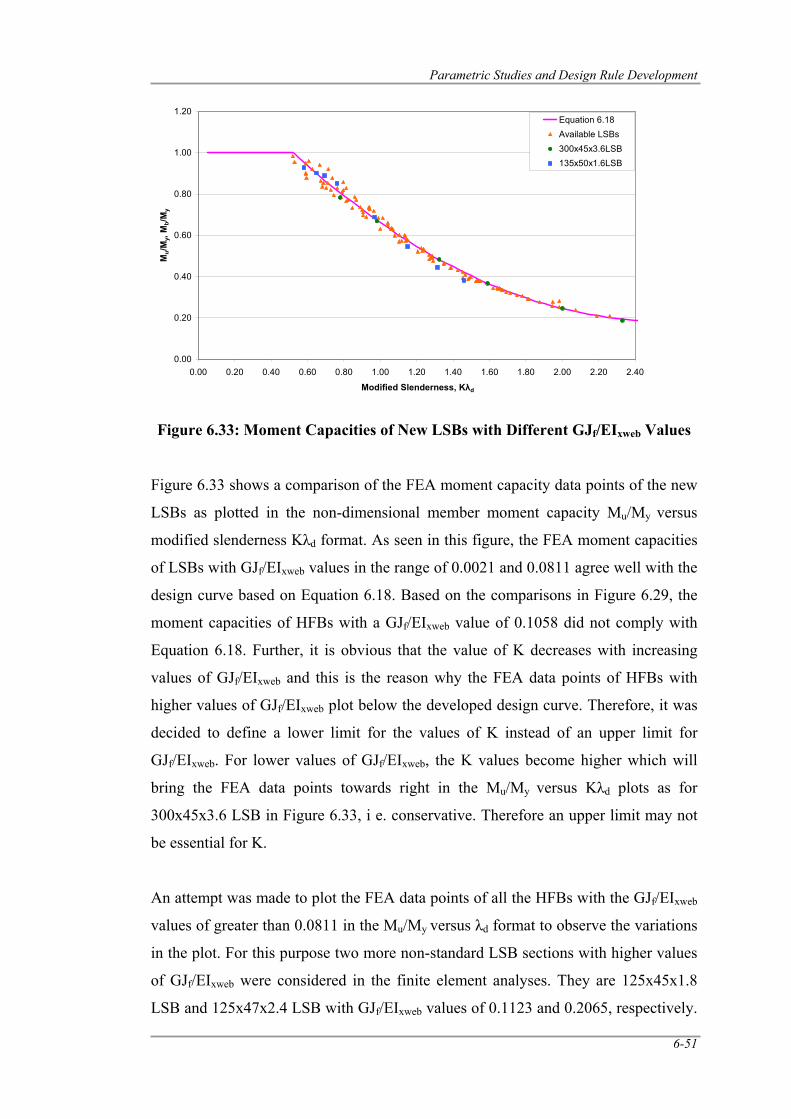
Parametric Studies and Design Rule Development
6-51
Figure 6.33: Moment Capacities of New LSBs with Different GJf/EIxweb Values Figure 6.33 shows a comparison of the FEA moment capacity data points of the new
LSBs as plotted in the non-dimensional member moment capacity Mu/My versus
modified slenderness Kλd format. As seen in this figure, the FEA moment capacities
of LSBs with GJf/EIxweb values in the range of 0.0021 and 0.0811 agree well with the
design curve based on Equation 6.18. Based on the comparisons in Figure 6.29, the
moment capacities of HFBs with a GJf/EIxweb value of 0.1058 did not comply with
Equation 6.18. Further, it is obvious that the value of K decreases with increasing
values of GJf/EIxweb and this is the reason why the FEA data points of HFBs with
higher values of GJf/EIxweb plot below the developed design curve. Therefore, it was
decided to define a lower limit for the values of K instead of an upper limit for
GJf/EIxweb. For lower values of GJf/EIxweb, the K values become higher which will
bring the FEA data points towards right in the Mu/My versus Kλd plots as for
300x45x3.6 LSB in Figure 6.33, i e. conservative. Therefore an upper limit may not
be essential for K.
An attempt was made to plot the FEA data points of all the HFBs with the GJf/EIxweb
values of greater than 0.0811 in the Mu/My versus λd format to observe the variations
in the plot. For this purpose two more non-standard LSB sections with higher values
of GJf/EIxweb were considered in the finite element analyses. They are 125x45x1.8
LSB and 125x47x2.4 LSB with GJf/EIxweb values of 0.1123 and 0.2065, respectively.
0.00
0.20
0.40
0.60
0.80
1.00
1.20
0.00 0.20 0.40 0.60 0.80 1.00 1.20 1.40 1.60 1.80 2.00 2.20 2.40
Modified Slenderness, Kλd
Mu/M
y, M
b/My
Equation 6.18Available LSBs300x45x3.6LSB135x50x1.6LSB
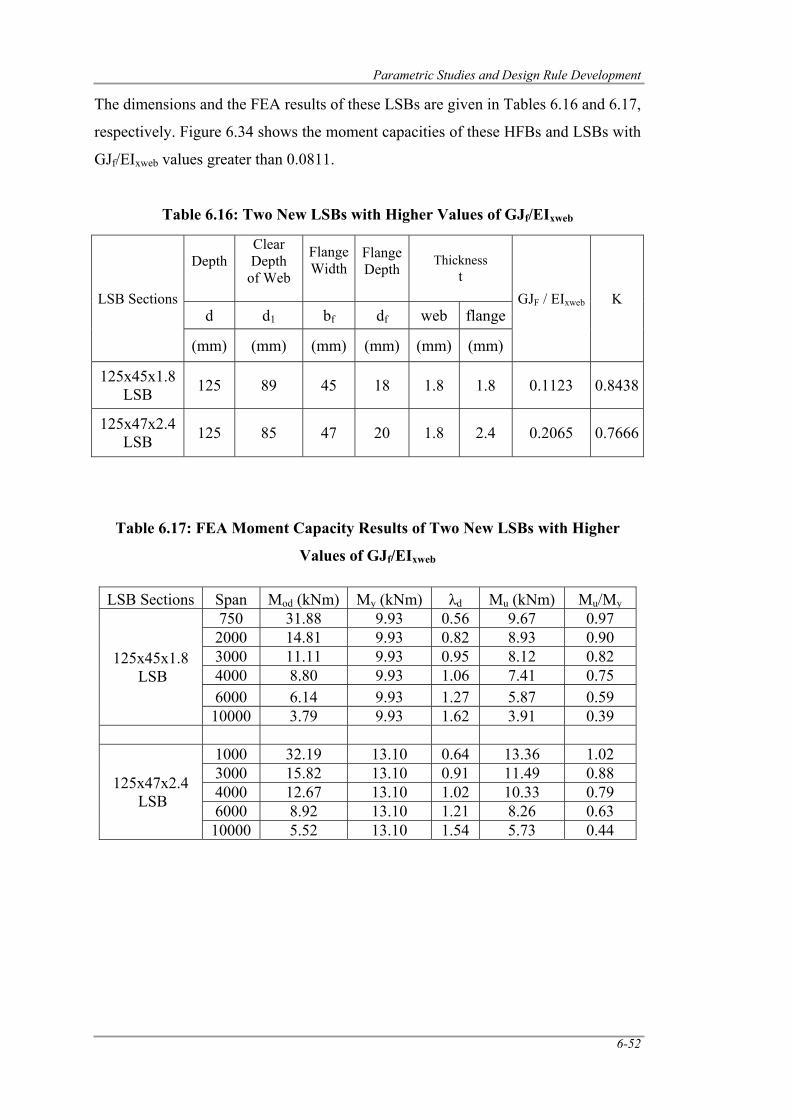
Parametric Studies and Design Rule Development
6-52
The dimensions and the FEA results of these LSBs are given in Tables 6.16 and 6.17,
respectively. Figure 6.34 shows the moment capacities of these HFBs and LSBs with
GJf/EIxweb values greater than 0.0811.
Table 6.16: Two New LSBs with Higher Values of GJf/EIxweb
Table 6.17: FEA Moment Capacity Results of Two New LSBs with Higher
Values of GJf/EIxweb
LSB Sections
Depth
Clear Depth
of Web
Flange Width
Flange Depth
Thickness t
GJF / EIxweb K d d1 bf df web flange
(mm) (mm) (mm) (mm) (mm) (mm)
125x45x1.8 LSB 125 89 45 18 1.8 1.8 0.1123 0.8438
125x47x2.4 LSB 125 85 47 20 1.8 2.4 0.2065 0.7666
LSB Sections Span Mod (kNm) My (kNm) λd Mu (kNm) Mu/My
125x45x1.8 LSB
750 31.88 9.93 0.56 9.67 0.97 2000 14.81 9.93 0.82 8.93 0.90 3000 11.11 9.93 0.95 8.12 0.82 4000 8.80 9.93 1.06 7.41 0.75 6000 6.14 9.93 1.27 5.87 0.59 10000 3.79 9.93 1.62 3.91 0.39
125x47x2.4 LSB
1000 32.19 13.10 0.64 13.36 1.02 3000 15.82 13.10 0.91 11.49 0.88 4000 12.67 13.10 1.02 10.33 0.79 6000 8.92 13.10 1.21 8.26 0.63 10000 5.52 13.10 1.54 5.73 0.44
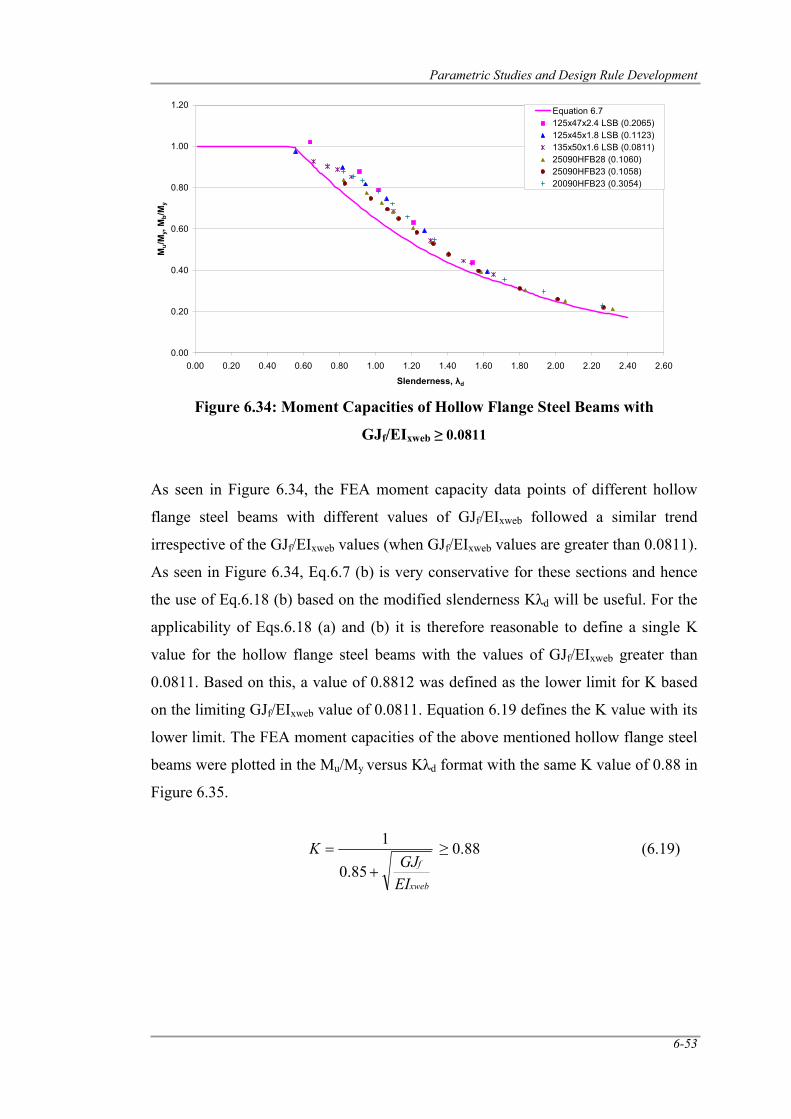
Parametric Studies and Design Rule Development
6-53
Figure 6.34: Moment Capacities of Hollow Flange Steel Beams with
GJf/EIxweb ≥ 0.0811
As seen in Figure 6.34, the FEA moment capacity data points of different hollow
flange steel beams with different values of GJf/EIxweb followed a similar trend
irrespective of the GJf/EIxweb values (when GJf/EIxweb values are greater than 0.0811).
As seen in Figure 6.34, Eq.6.7 (b) is very conservative for these sections and hence
the use of Eq.6.18 (b) based on the modified slenderness Kλd will be useful. For the
applicability of Eqs.6.18 (a) and (b) it is therefore reasonable to define a single K
value for the hollow flange steel beams with the values of GJf/EIxweb greater than
0.0811. Based on this, a value of 0.8812 was defined as the lower limit for K based
on the limiting GJf/EIxweb value of 0.0811. Equation 6.19 defines the K value with its
lower limit. The FEA moment capacities of the above mentioned hollow flange steel
beams were plotted in the Mu/My versus Kλd format with the same K value of 0.88 in
Figure 6.35.
xweb
f
EIGJ
K+
=85.0
1 ≥ 0.88 (6.19)
0.00
0.20
0.40
0.60
0.80
1.00
1.20
0.00 0.20 0.40 0.60 0.80 1.00 1.20 1.40 1.60 1.80 2.00 2.20 2.40 2.60
Slenderness, λd
Mu/
My,
Mb/
My
Equation 6.7125x47x2.4 LSB (0.2065)125x45x1.8 LSB (0.1123)135x50x1.6 LSB (0.0811)25090HFB28 (0.1060)25090HFB23 (0.1058)20090HFB23 (0.3054)
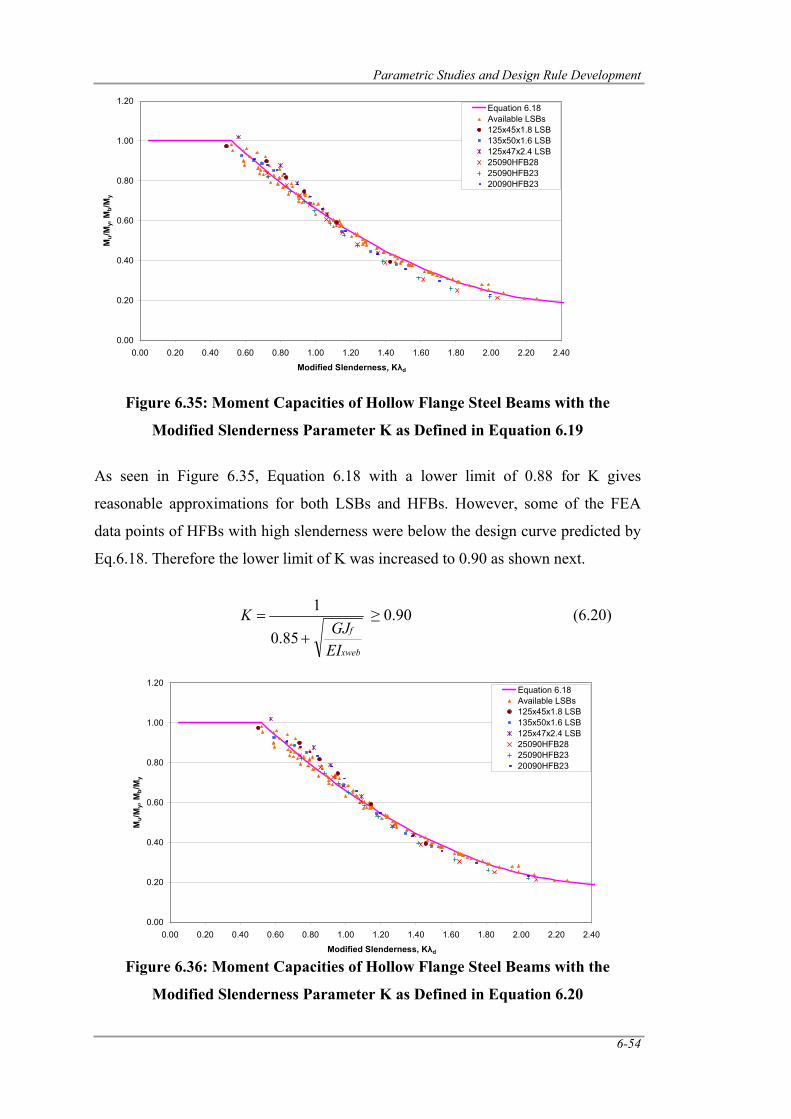
Parametric Studies and Design Rule Development
6-54
Figure 6.35: Moment Capacities of Hollow Flange Steel Beams with the
Modified Slenderness Parameter K as Defined in Equation 6.19
As seen in Figure 6.35, Equation 6.18 with a lower limit of 0.88 for K gives
reasonable approximations for both LSBs and HFBs. However, some of the FEA
data points of HFBs with high slenderness were below the design curve predicted by
Eq.6.18. Therefore the lower limit of K was increased to 0.90 as shown next.
xweb
f
EIGJ
K+
=85.0
1 ≥ 0.90 (6.20)
Figure 6.36: Moment Capacities of Hollow Flange Steel Beams with the
Modified Slenderness Parameter K as Defined in Equation 6.20
0.00
0.20
0.40
0.60
0.80
1.00
1.20
0.00 0.20 0.40 0.60 0.80 1.00 1.20 1.40 1.60 1.80 2.00 2.20 2.40
Modified Slenderness, Kλd
Mu/
My,
Mb/M
yEquation 6.18Available LSBs125x45x1.8 LSB135x50x1.6 LSB125x47x2.4 LSB25090HFB2825090HFB2320090HFB23
0.00
0.20
0.40
0.60
0.80
1.00
1.20
0.00 0.20 0.40 0.60 0.80 1.00 1.20 1.40 1.60 1.80 2.00 2.20 2.40
Modified Slenderness, Kλd
Mu/M
y, M
b/M
y
Equation 6.18Available LSBs125x45x1.8 LSB135x50x1.6 LSB125x47x2.4 LSB25090HFB2825090HFB2320090HFB23
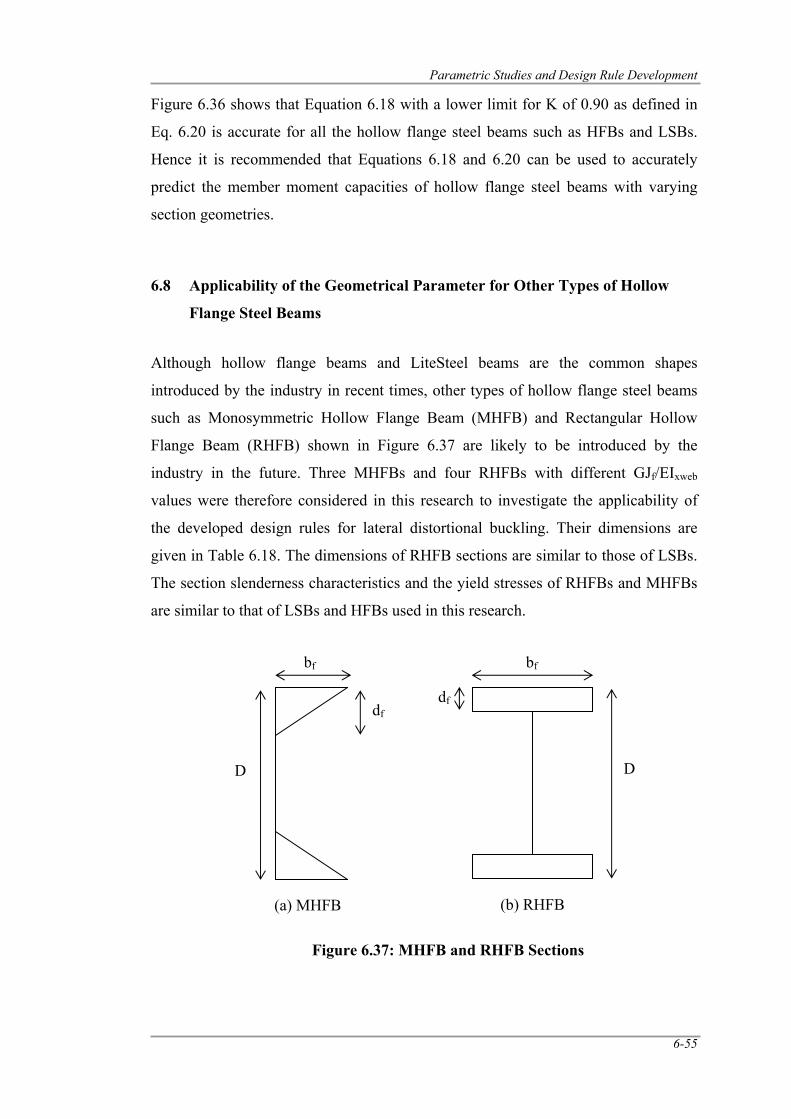
Parametric Studies and Design Rule Development
6-55
Figure 6.36 shows that Equation 6.18 with a lower limit for K of 0.90 as defined in
Eq. 6.20 is accurate for all the hollow flange steel beams such as HFBs and LSBs.
Hence it is recommended that Equations 6.18 and 6.20 can be used to accurately
predict the member moment capacities of hollow flange steel beams with varying
section geometries.
6.8 Applicability of the Geometrical Parameter for Other Types of Hollow
Flange Steel Beams
Although hollow flange beams and LiteSteel beams are the common shapes
introduced by the industry in recent times, other types of hollow flange steel beams
such as Monosymmetric Hollow Flange Beam (MHFB) and Rectangular Hollow
Flange Beam (RHFB) shown in Figure 6.37 are likely to be introduced by the
industry in the future. Three MHFBs and four RHFBs with different GJf/EIxweb
values were therefore considered in this research to investigate the applicability of
the developed design rules for lateral distortional buckling. Their dimensions are
given in Table 6.18. The dimensions of RHFB sections are similar to those of LSBs.
The section slenderness characteristics and the yield stresses of RHFBs and MHFBs
are similar to that of LSBs and HFBs used in this research.
Figure 6.37: MHFB and RHFB Sections
(a) MHFB
bf
df
D
bf
(b) RHFB
D
df
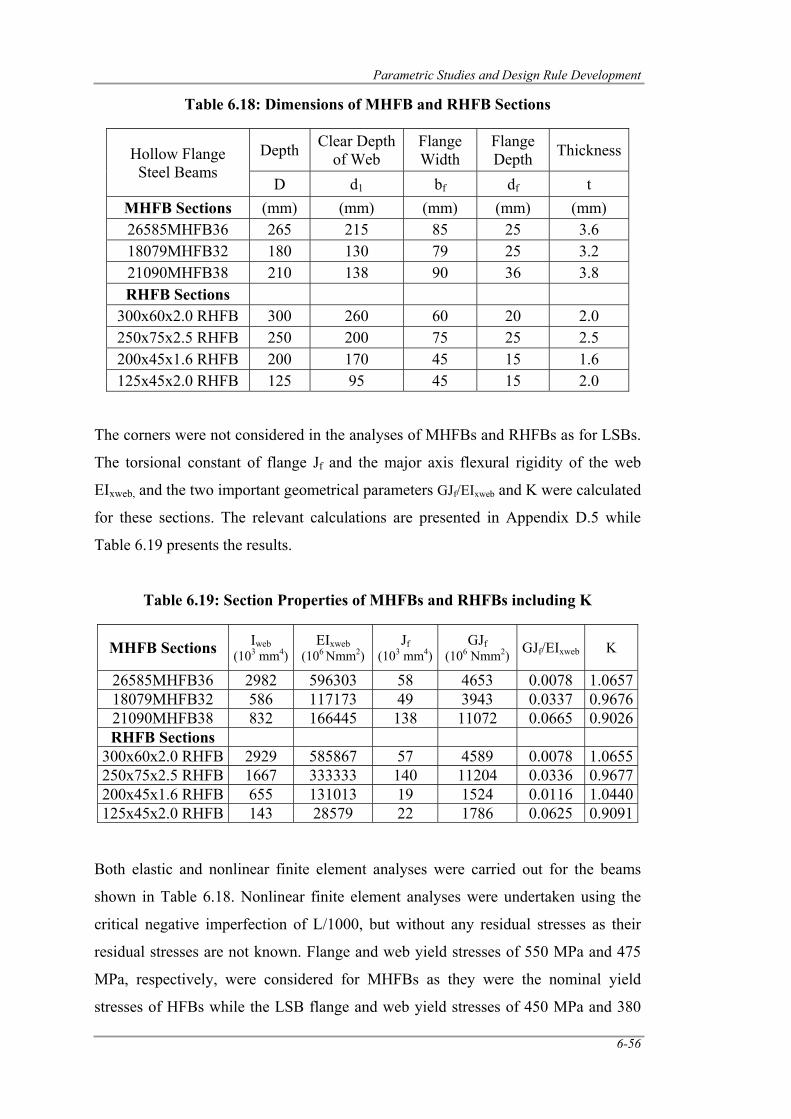
Parametric Studies and Design Rule Development
6-56
Table 6.18: Dimensions of MHFB and RHFB Sections
Hollow Flange Steel Beams
Depth Clear Depth of Web
Flange Width
Flange Depth Thickness
D d1 bf df t MHFB Sections (mm) (mm) (mm) (mm) (mm) 26585MHFB36 265 215 85 25 3.6 18079MHFB32 180 130 79 25 3.2 21090MHFB38 210 138 90 36 3.8 RHFB Sections
300x60x2.0 RHFB 300 260 60 20 2.0 250x75x2.5 RHFB 250 200 75 25 2.5 200x45x1.6 RHFB 200 170 45 15 1.6 125x45x2.0 RHFB 125 95 45 15 2.0
The corners were not considered in the analyses of MHFBs and RHFBs as for LSBs.
The torsional constant of flange Jf and the major axis flexural rigidity of the web
EIxweb, and the two important geometrical parameters GJf/EIxweb and K were calculated
for these sections. The relevant calculations are presented in Appendix D.5 while
Table 6.19 presents the results.
Table 6.19: Section Properties of MHFBs and RHFBs including K
MHFB Sections Iweb (103 mm4)
EIxweb (106 Nmm2)
Jf (103 mm4)
GJf (106 Nmm2) GJf/EIxweb K
26585MHFB36 2982 596303 58 4653 0.0078 1.0657 18079MHFB32 586 117173 49 3943 0.0337 0.9676 21090MHFB38 832 166445 138 11072 0.0665 0.9026 RHFB Sections
300x60x2.0 RHFB 2929 585867 57 4589 0.0078 1.0655 250x75x2.5 RHFB 1667 333333 140 11204 0.0336 0.9677 200x45x1.6 RHFB 655 131013 19 1524 0.0116 1.0440 125x45x2.0 RHFB 143 28579 22 1786 0.0625 0.9091
Both elastic and nonlinear finite element analyses were carried out for the beams
shown in Table 6.18. Nonlinear finite element analyses were undertaken using the
critical negative imperfection of L/1000, but without any residual stresses as their
residual stresses are not known. Flange and web yield stresses of 550 MPa and 475
MPa, respectively, were considered for MHFBs as they were the nominal yield
stresses of HFBs while the LSB flange and web yield stresses of 450 MPa and 380
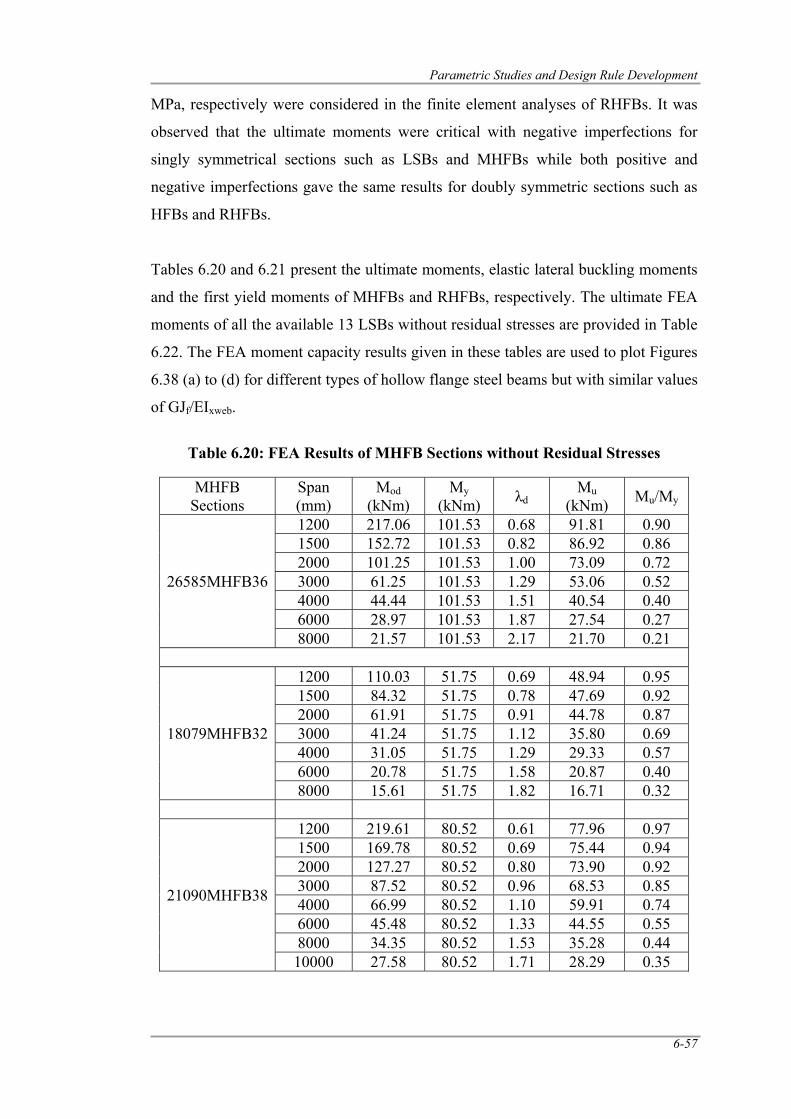
Parametric Studies and Design Rule Development
6-57
MPa, respectively were considered in the finite element analyses of RHFBs. It was
observed that the ultimate moments were critical with negative imperfections for
singly symmetrical sections such as LSBs and MHFBs while both positive and
negative imperfections gave the same results for doubly symmetric sections such as
HFBs and RHFBs.
Tables 6.20 and 6.21 present the ultimate moments, elastic lateral buckling moments
and the first yield moments of MHFBs and RHFBs, respectively. The ultimate FEA
moments of all the available 13 LSBs without residual stresses are provided in Table
6.22. The FEA moment capacity results given in these tables are used to plot Figures
6.38 (a) to (d) for different types of hollow flange steel beams but with similar values
of GJf/EIxweb.
Table 6.20: FEA Results of MHFB Sections without Residual Stresses
MHFB
Sections Span (mm)
Mod (kNm)
My (kNm) λd
Mu (kNm) Mu/My
26585MHFB36
1200 217.06 101.53 0.68 91.81 0.90 1500 152.72 101.53 0.82 86.92 0.86 2000 101.25 101.53 1.00 73.09 0.72 3000 61.25 101.53 1.29 53.06 0.52 4000 44.44 101.53 1.51 40.54 0.40 6000 28.97 101.53 1.87 27.54 0.27 8000 21.57 101.53 2.17 21.70 0.21
18079MHFB32
1200 110.03 51.75 0.69 48.94 0.95 1500 84.32 51.75 0.78 47.69 0.92 2000 61.91 51.75 0.91 44.78 0.87 3000 41.24 51.75 1.12 35.80 0.69 4000 31.05 51.75 1.29 29.33 0.57 6000 20.78 51.75 1.58 20.87 0.40 8000 15.61 51.75 1.82 16.71 0.32
21090MHFB38
1200 219.61 80.52 0.61 77.96 0.97 1500 169.78 80.52 0.69 75.44 0.94 2000 127.27 80.52 0.80 73.90 0.92 3000 87.52 80.52 0.96 68.53 0.85 4000 66.99 80.52 1.10 59.91 0.74 6000 45.48 80.52 1.33 44.55 0.55 8000 34.35 80.52 1.53 35.28 0.44 10000 27.58 80.52 1.71 28.29 0.35
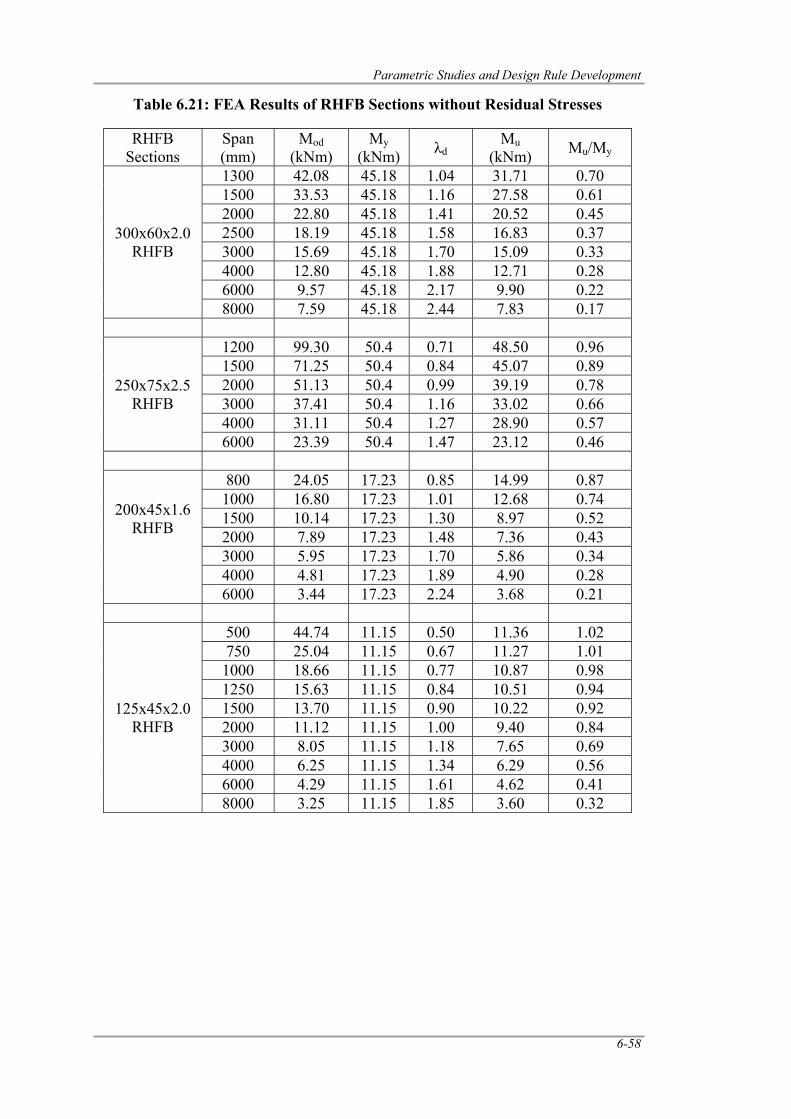
Parametric Studies and Design Rule Development
6-58
Table 6.21: FEA Results of RHFB Sections without Residual Stresses
RHFB Sections
Span (mm)
Mod (kNm)
My (kNm) λd
Mu (kNm) Mu/My
300x60x2.0 RHFB
1300 42.08 45.18 1.04 31.71 0.70 1500 33.53 45.18 1.16 27.58 0.61 2000 22.80 45.18 1.41 20.52 0.45 2500 18.19 45.18 1.58 16.83 0.37 3000 15.69 45.18 1.70 15.09 0.33 4000 12.80 45.18 1.88 12.71 0.28 6000 9.57 45.18 2.17 9.90 0.22 8000 7.59 45.18 2.44 7.83 0.17
250x75x2.5 RHFB
1200 99.30 50.4 0.71 48.50 0.96 1500 71.25 50.4 0.84 45.07 0.89 2000 51.13 50.4 0.99 39.19 0.78 3000 37.41 50.4 1.16 33.02 0.66 4000 31.11 50.4 1.27 28.90 0.57 6000 23.39 50.4 1.47 23.12 0.46
200x45x1.6 RHFB
800 24.05 17.23 0.85 14.99 0.87 1000 16.80 17.23 1.01 12.68 0.74 1500 10.14 17.23 1.30 8.97 0.52 2000 7.89 17.23 1.48 7.36 0.43 3000 5.95 17.23 1.70 5.86 0.34 4000 4.81 17.23 1.89 4.90 0.28 6000 3.44 17.23 2.24 3.68 0.21
125x45x2.0 RHFB
500 44.74 11.15 0.50 11.36 1.02 750 25.04 11.15 0.67 11.27 1.01 1000 18.66 11.15 0.77 10.87 0.98 1250 15.63 11.15 0.84 10.51 0.94 1500 13.70 11.15 0.90 10.22 0.92 2000 11.12 11.15 1.00 9.40 0.84 3000 8.05 11.15 1.18 7.65 0.69 4000 6.25 11.15 1.34 6.29 0.56 6000 4.29 11.15 1.61 4.62 0.41 8000 3.25 11.15 1.85 3.60 0.32
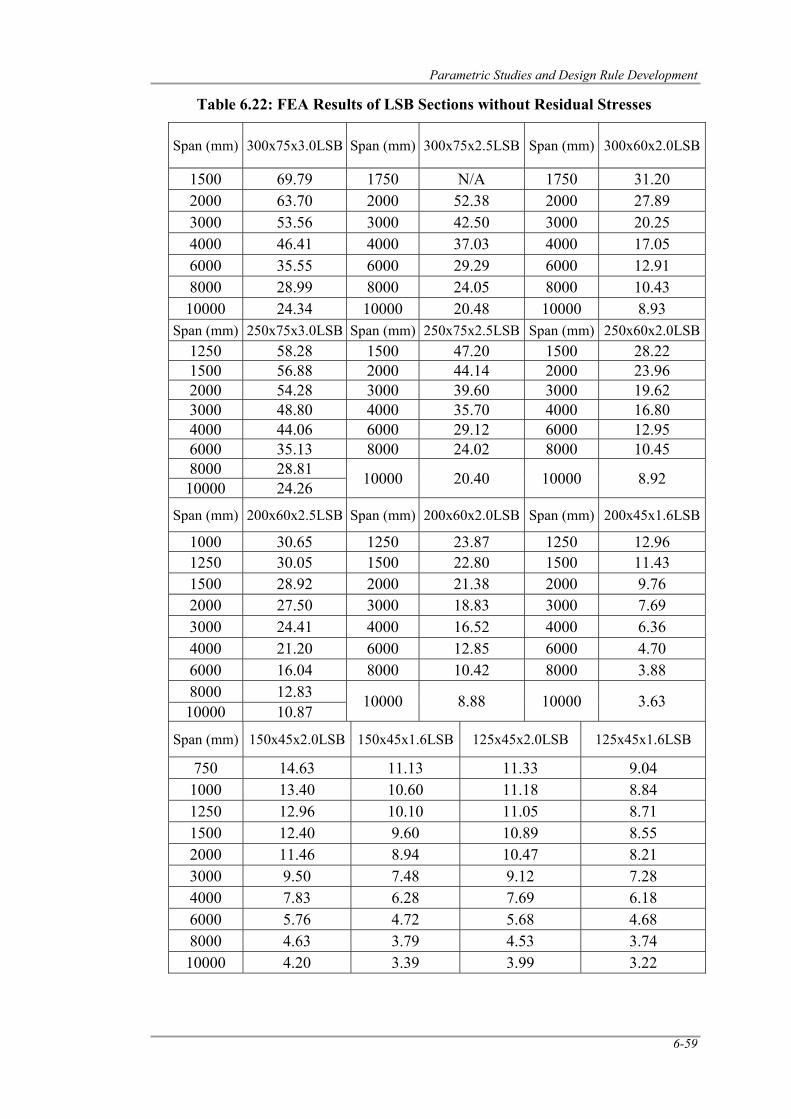
Parametric Studies and Design Rule Development
6-59
Table 6.22: FEA Results of LSB Sections without Residual Stresses
Span (mm) 300x75x3.0LSB Span (mm) 300x75x2.5LSB Span (mm) 300x60x2.0LSB
1500 69.79 1750 N/A 1750 31.20 2000 63.70 2000 52.38 2000 27.89 3000 53.56 3000 42.50 3000 20.25 4000 46.41 4000 37.03 4000 17.05 6000 35.55 6000 29.29 6000 12.91 8000 28.99 8000 24.05 8000 10.43 10000 24.34 10000 20.48 10000 8.93
Span (mm) 250x75x3.0LSB Span (mm) 250x75x2.5LSB Span (mm) 250x60x2.0LSB1250 58.28 1500 47.20 1500 28.22 1500 56.88 2000 44.14 2000 23.96 2000 54.28 3000 39.60 3000 19.62 3000 48.80 4000 35.70 4000 16.80 4000 44.06 6000 29.12 6000 12.95 6000 35.13 8000 24.02 8000 10.45 8000 28.81 10000 20.40 10000 8.92 10000 24.26
Span (mm) 200x60x2.5LSB Span (mm) 200x60x2.0LSB Span (mm) 200x45x1.6LSB
1000 30.65 1250 23.87 1250 12.96 1250 30.05 1500 22.80 1500 11.43 1500 28.92 2000 21.38 2000 9.76 2000 27.50 3000 18.83 3000 7.69 3000 24.41 4000 16.52 4000 6.36 4000 21.20 6000 12.85 6000 4.70 6000 16.04 8000 10.42 8000 3.88 8000 12.83 10000 8.88 10000 3.63 10000 10.87
Span (mm) 150x45x2.0LSB 150x45x1.6LSB 125x45x2.0LSB 125x45x1.6LSB
750 14.63 11.13 11.33 9.04 1000 13.40 10.60 11.18 8.84 1250 12.96 10.10 11.05 8.71 1500 12.40 9.60 10.89 8.55 2000 11.46 8.94 10.47 8.21 3000 9.50 7.48 9.12 7.28 4000 7.83 6.28 7.69 6.18 6000 5.76 4.72 5.68 4.68 8000 4.63 3.79 4.53 3.74 10000 4.20 3.39 3.99 3.22
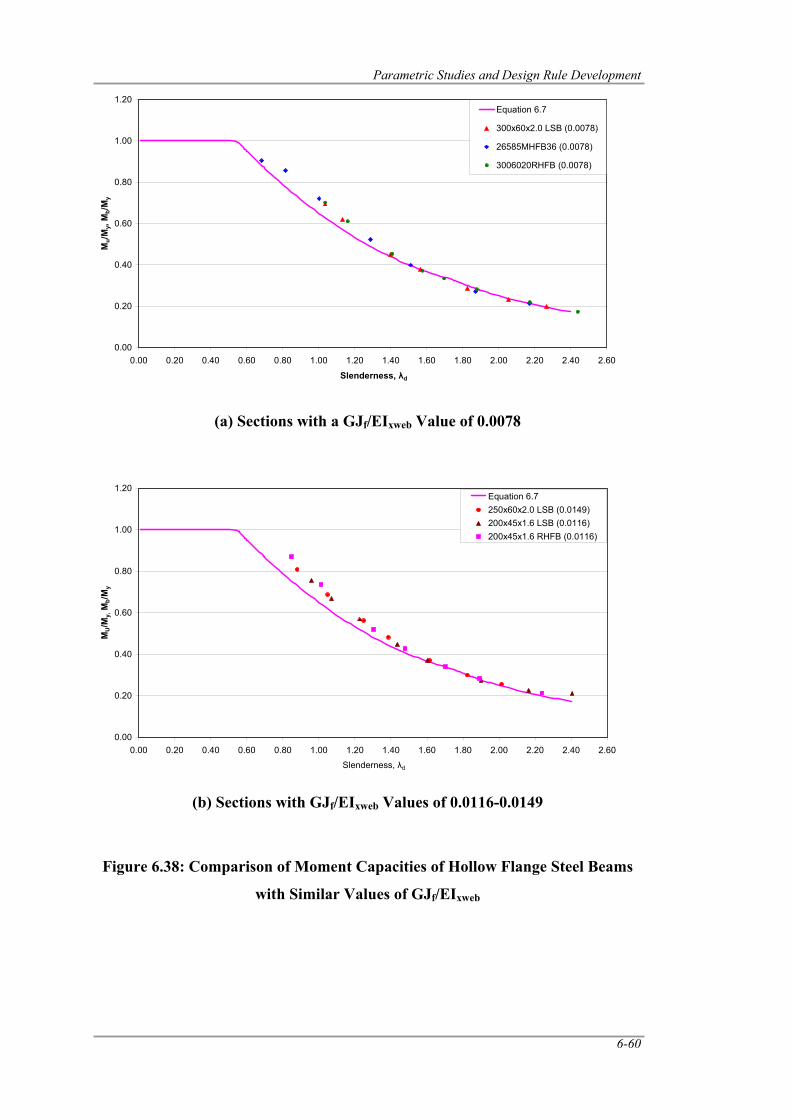
Parametric Studies and Design Rule Development
6-60
(a) Sections with a GJf/EIxweb Value of 0.0078
(b) Sections with GJf/EIxweb Values of 0.0116-0.0149
Figure 6.38: Comparison of Moment Capacities of Hollow Flange Steel Beams
with Similar Values of GJf/EIxweb
0.00
0.20
0.40
0.60
0.80
1.00
1.20
0.00 0.20 0.40 0.60 0.80 1.00 1.20 1.40 1.60 1.80 2.00 2.20 2.40 2.60
Slenderness, λd
Mu/
My,
Mb/
My
Equation 6.7
300x60x2.0 LSB (0.0078)
26585MHFB36 (0.0078)
3006020RHFB (0.0078)
0.00
0.20
0.40
0.60
0.80
1.00
1.20
0.00 0.20 0.40 0.60 0.80 1.00 1.20 1.40 1.60 1.80 2.00 2.20 2.40 2.60
Slenderness, λd
MU/M
y, M
b/M
y
Equation 6.7250x60x2.0 LSB (0.0149)200x45x1.6 LSB (0.0116)200x45x1.6 RHFB (0.0116)
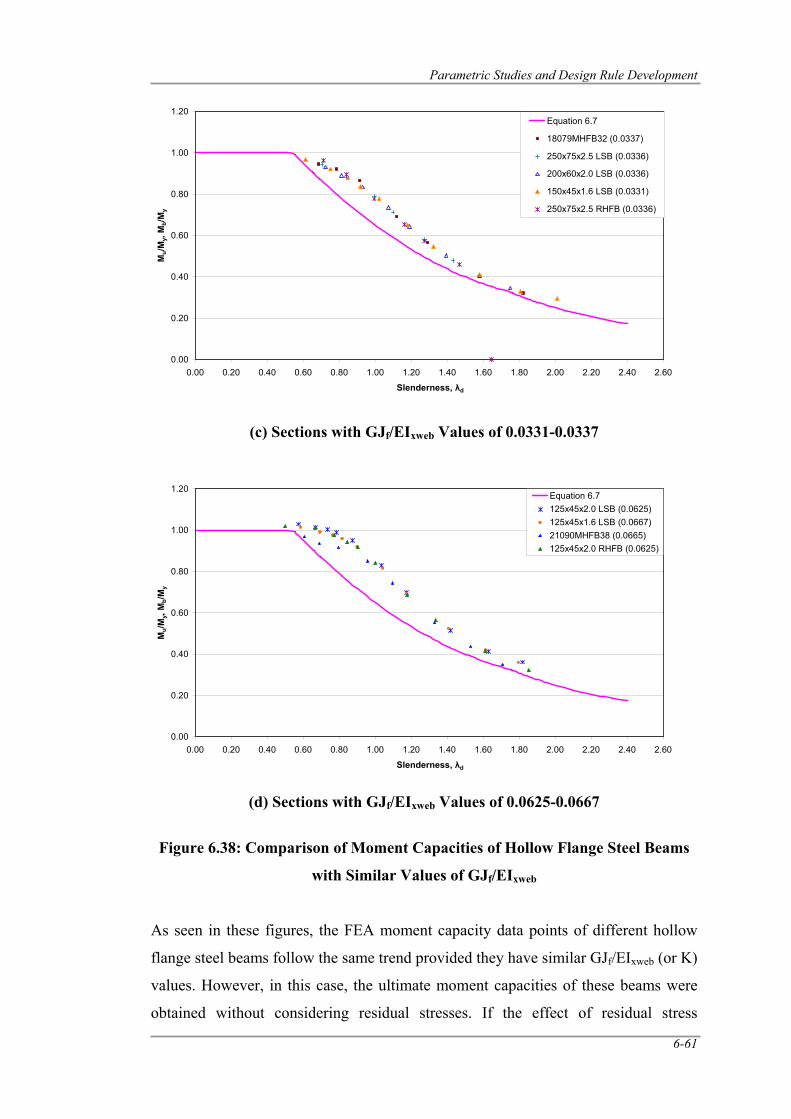
Parametric Studies and Design Rule Development
6-61
(c) Sections with GJf/EIxweb Values of 0.0331-0.0337
(d) Sections with GJf/EIxweb Values of 0.0625-0.0667
Figure 6.38: Comparison of Moment Capacities of Hollow Flange Steel Beams
with Similar Values of GJf/EIxweb
As seen in these figures, the FEA moment capacity data points of different hollow
flange steel beams follow the same trend provided they have similar GJf/EIxweb (or K)
values. However, in this case, the ultimate moment capacities of these beams were
obtained without considering residual stresses. If the effect of residual stress
0.00
0.20
0.40
0.60
0.80
1.00
1.20
0.00 0.20 0.40 0.60 0.80 1.00 1.20 1.40 1.60 1.80 2.00 2.20 2.40 2.60
Slenderness, λd
Mu/M
y, M
b/My
Equation 6.7
18079MHFB32 (0.0337)
250x75x2.5 LSB (0.0336)
200x60x2.0 LSB (0.0336)
150x45x1.6 LSB (0.0331)
250x75x2.5 RHFB (0.0336)
0.00
0.20
0.40
0.60
0.80
1.00
1.20
0.00 0.20 0.40 0.60 0.80 1.00 1.20 1.40 1.60 1.80 2.00 2.20 2.40 2.60
Slenderness, λd
Mu/M
y, M
b/My
Equation 6.7125x45x2.0 LSB (0.0625)125x45x1.6 LSB (0.0667)21090MHFB38 (0.0665)125x45x2.0 RHFB (0.0625)
Parametric Studies and Design Rule Development
6-62
variation of the hollow flange steel beams is similar, then it can be concluded that the
use of Equation 6.18 with parameter K as defined in Eq.6.20 is suitable for all the
hollow flange steel beams such as LSB, HFB, MHFB and RHFB.
6.9 Conclusions
This chapter has presented the details of a detailed parametric study into the lateral
distortional buckling behaviour of hollow flange steel beams such as LSBs, HFBs
and their variations (MHFBs and RHFBs)). The effects of initial geometric
imperfections and residual stresses were presented first for LSBs. The comparison of
ultimate moment capacities of LSBs from finite element analyses and experimental
studies with the current design rules in AS/NZS 4600 (SA, 2005) showed that the
current design rule was conservative by about 8% in the inelastic buckling region.
New improved design rules were developed for the LSBs based on both FEA and
experimental results, which can be used to predict the moment capacities of LSBs
with a capacity reduction factor of 0.90. The applicability of the developed design
rule was investigated for HFBs and it was found that the design rule developed for
monosymmetric LSBs was very conservative as HFB is a doubly symmetric section.
A geometrical parameter defined as the ratio of flange torsional rigidity to the major
axis flexural rigidity of the web (GJf/EIxweb) was found to be a critical parameter that
reduced the scatter in the FEA data points of hollow flange steel beams in the non-
dimensionalised moment capacity plots based on Mu/My versus λd. New design rules
were developed by using a modified slenderness parameter Kλd where K was
determined as a function of GJf/EIxweb. The new design rules based on the modified
slenderness parameter Kλd were found to be accurate in calculating the moment
capacities of not only LSBs and HFBs but also other types of hollow flange steel
beams such as MHFBs and RHFBs if their residual stress variations are similar to
that of LSBs and HFBs. The developed design rules in this research can be used in
the design of hollow flange steel beams subject to uniform bending while appropriate
moment modification factors developed by Kurniawan and Mahendran (2009b) can
be used for other types of loadings.
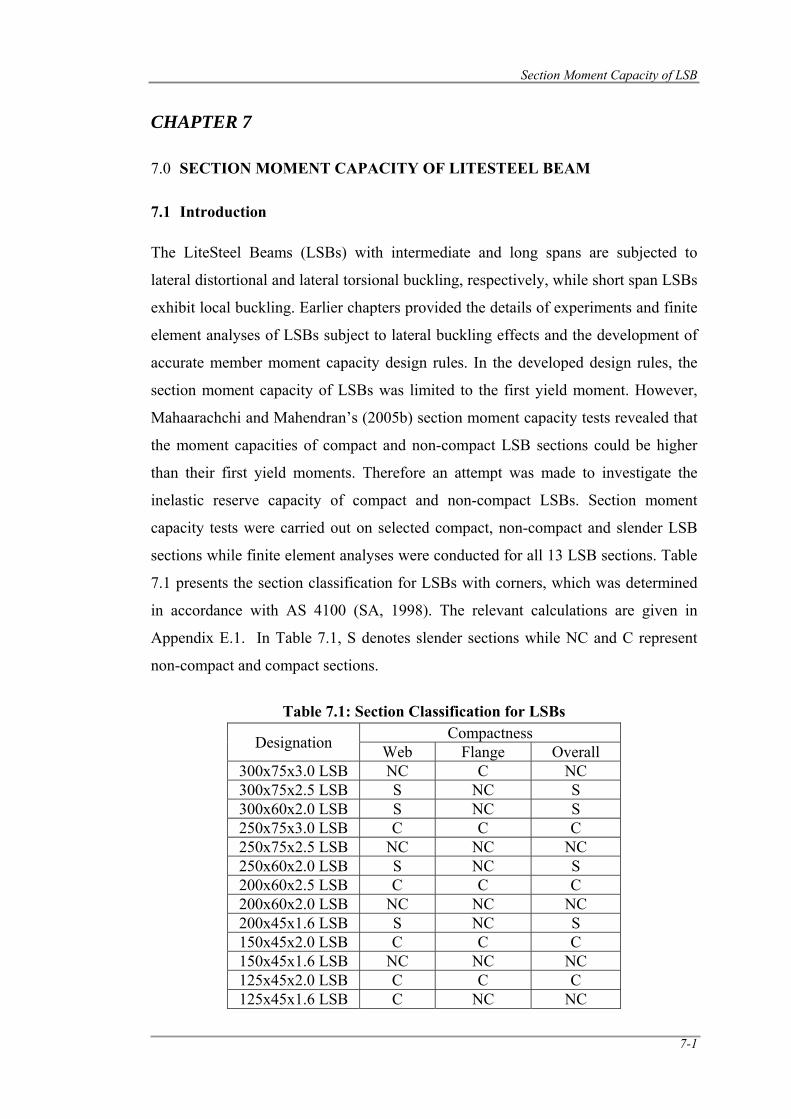
Section Moment Capacity of LSB
7-1
CHAPTER 7
7.0 SECTION MOMENT CAPACITY OF LITESTEEL BEAM
7.1 Introduction
The LiteSteel Beams (LSBs) with intermediate and long spans are subjected to
lateral distortional and lateral torsional buckling, respectively, while short span LSBs
exhibit local buckling. Earlier chapters provided the details of experiments and finite
element analyses of LSBs subject to lateral buckling effects and the development of
accurate member moment capacity design rules. In the developed design rules, the
section moment capacity of LSBs was limited to the first yield moment. However,
Mahaarachchi and Mahendran’s (2005b) section moment capacity tests revealed that
the moment capacities of compact and non-compact LSB sections could be higher
than their first yield moments. Therefore an attempt was made to investigate the
inelastic reserve capacity of compact and non-compact LSBs. Section moment
capacity tests were carried out on selected compact, non-compact and slender LSB
sections while finite element analyses were conducted for all 13 LSB sections. Table
7.1 presents the section classification for LSBs with corners, which was determined
in accordance with AS 4100 (SA, 1998). The relevant calculations are given in
Appendix E.1. In Table 7.1, S denotes slender sections while NC and C represent
non-compact and compact sections.
Table 7.1: Section Classification for LSBs
Designation Compactness Web Flange Overall
300x75x3.0 LSB NC C NC 300x75x2.5 LSB S NC S 300x60x2.0 LSB S NC S 250x75x3.0 LSB C C C 250x75x2.5 LSB NC NC NC 250x60x2.0 LSB S NC S 200x60x2.5 LSB C C C 200x60x2.0 LSB NC NC NC 200x45x1.6 LSB S NC S 150x45x2.0 LSB C C C 150x45x1.6 LSB NC NC NC 125x45x2.0 LSB C C C 125x45x1.6 LSB C NC NC
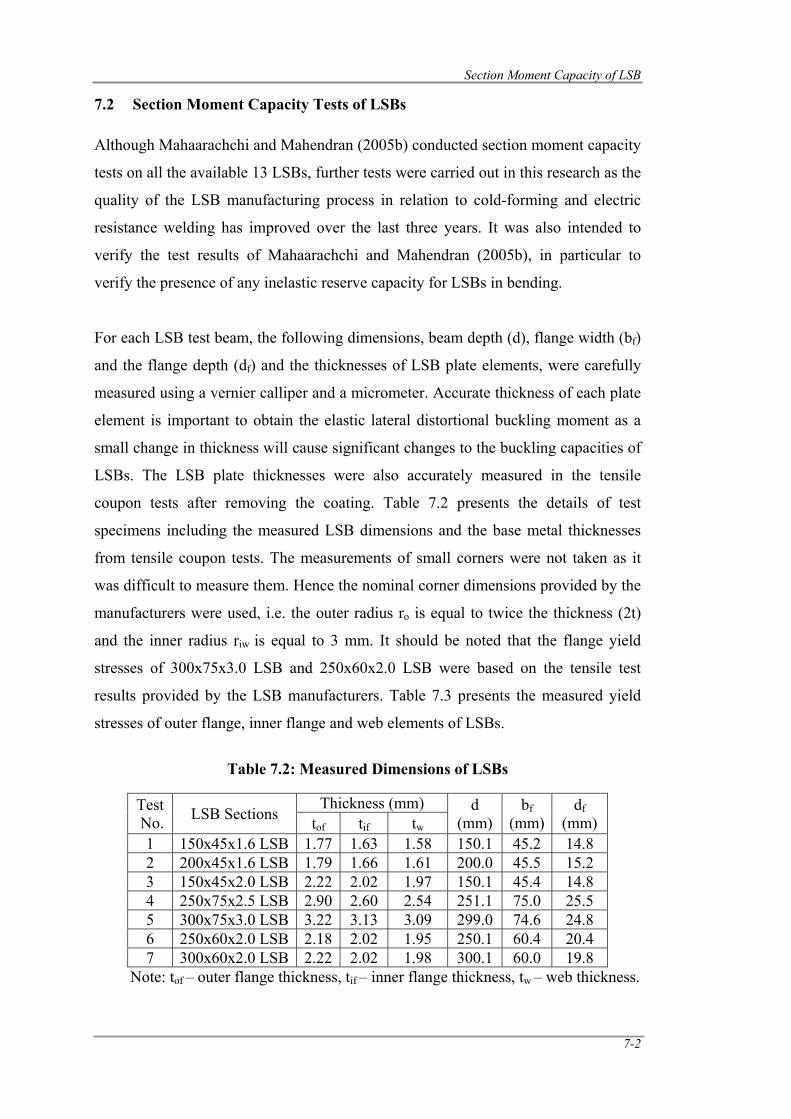
Section Moment Capacity of LSB
7-2
7.2 Section Moment Capacity Tests of LSBs
Although Mahaarachchi and Mahendran (2005b) conducted section moment capacity
tests on all the available 13 LSBs, further tests were carried out in this research as the
quality of the LSB manufacturing process in relation to cold-forming and electric
resistance welding has improved over the last three years. It was also intended to
verify the test results of Mahaarachchi and Mahendran (2005b), in particular to
verify the presence of any inelastic reserve capacity for LSBs in bending.
For each LSB test beam, the following dimensions, beam depth (d), flange width (bf)
and the flange depth (df) and the thicknesses of LSB plate elements, were carefully
measured using a vernier calliper and a micrometer. Accurate thickness of each plate
element is important to obtain the elastic lateral distortional buckling moment as a
small change in thickness will cause significant changes to the buckling capacities of
LSBs. The LSB plate thicknesses were also accurately measured in the tensile
coupon tests after removing the coating. Table 7.2 presents the details of test
specimens including the measured LSB dimensions and the base metal thicknesses
from tensile coupon tests. The measurements of small corners were not taken as it
was difficult to measure them. Hence the nominal corner dimensions provided by the
manufacturers were used, i.e. the outer radius ro is equal to twice the thickness (2t)
and the inner radius riw is equal to 3 mm. It should be noted that the flange yield
stresses of 300x75x3.0 LSB and 250x60x2.0 LSB were based on the tensile test
results provided by the LSB manufacturers. Table 7.3 presents the measured yield
stresses of outer flange, inner flange and web elements of LSBs.
Table 7.2: Measured Dimensions of LSBs
Test No. LSB Sections
Thickness (mm) d (mm)
bf (mm)
df (mm) tof tif tw
1 150x45x1.6 LSB 1.77 1.63 1.58 150.1 45.2 14.8 2 200x45x1.6 LSB 1.79 1.66 1.61 200.0 45.5 15.2 3 150x45x2.0 LSB 2.22 2.02 1.97 150.1 45.4 14.8 4 250x75x2.5 LSB 2.90 2.60 2.54 251.1 75.0 25.5 5 300x75x3.0 LSB 3.22 3.13 3.09 299.0 74.6 24.8 6 250x60x2.0 LSB 2.18 2.02 1.95 250.1 60.4 20.4 7 300x60x2.0 LSB 2.22 2.02 1.98 300.1 60.0 19.8
Note: tof – outer flange thickness, tif – inner flange thickness, tw – web thickness.
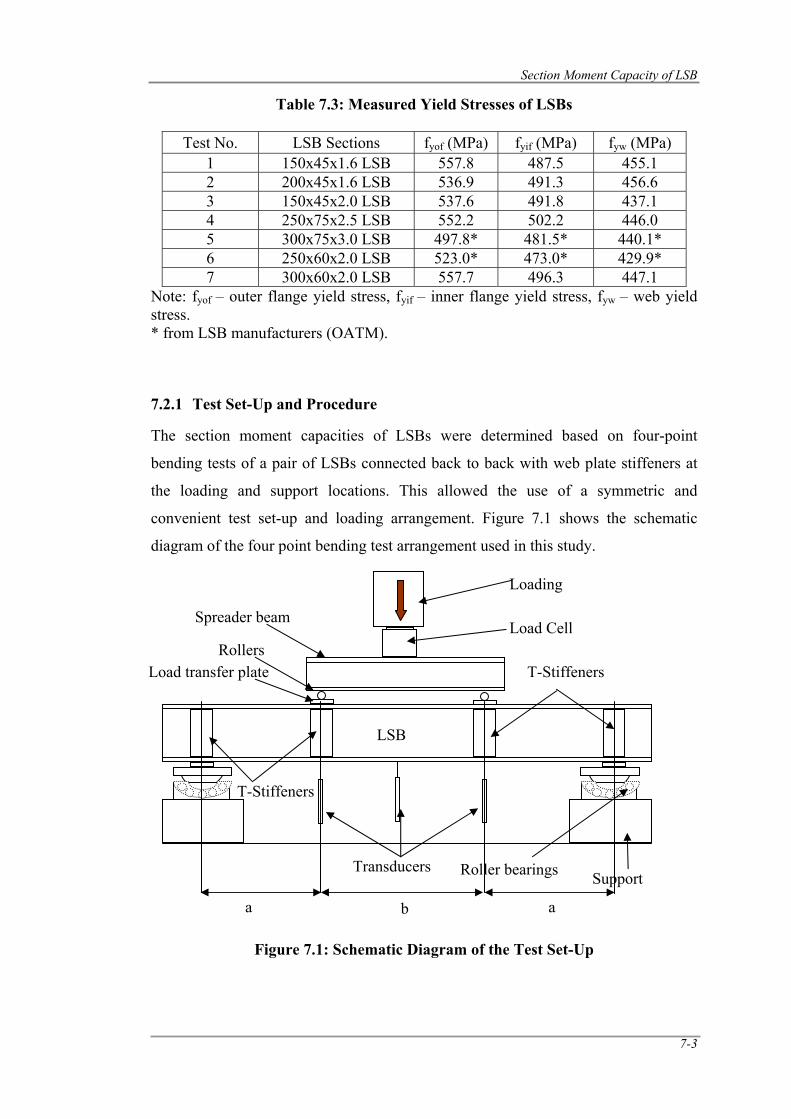
Section Moment Capacity of LSB
7-3
Table 7.3: Measured Yield Stresses of LSBs
Test No. LSB Sections fyof (MPa) fyif (MPa) fyw (MPa) 1 150x45x1.6 LSB 557.8 487.5 455.1 2 200x45x1.6 LSB 536.9 491.3 456.6 3 150x45x2.0 LSB 537.6 491.8 437.1 4 250x75x2.5 LSB 552.2 502.2 446.0 5 300x75x3.0 LSB 497.8* 481.5* 440.1* 6 250x60x2.0 LSB 523.0* 473.0* 429.9* 7 300x60x2.0 LSB 557.7 496.3 447.1
Note: fyof – outer flange yield stress, fyif – inner flange yield stress, fyw – web yield stress. * from LSB manufacturers (OATM).
7.2.1 Test Set-Up and Procedure
The section moment capacities of LSBs were determined based on four-point
bending tests of a pair of LSBs connected back to back with web plate stiffeners at
the loading and support locations. This allowed the use of a symmetric and
convenient test set-up and loading arrangement. Figure 7.1 shows the schematic
diagram of the four point bending test arrangement used in this study.
Figure 7.1: Schematic Diagram of the Test Set-Up
Spreader beam
Loading
Load Cell Rollers
Load transfer plate
Roller bearingsTransducersSupport
T-Stiffeners
T-Stiffeners
a b a
LSB
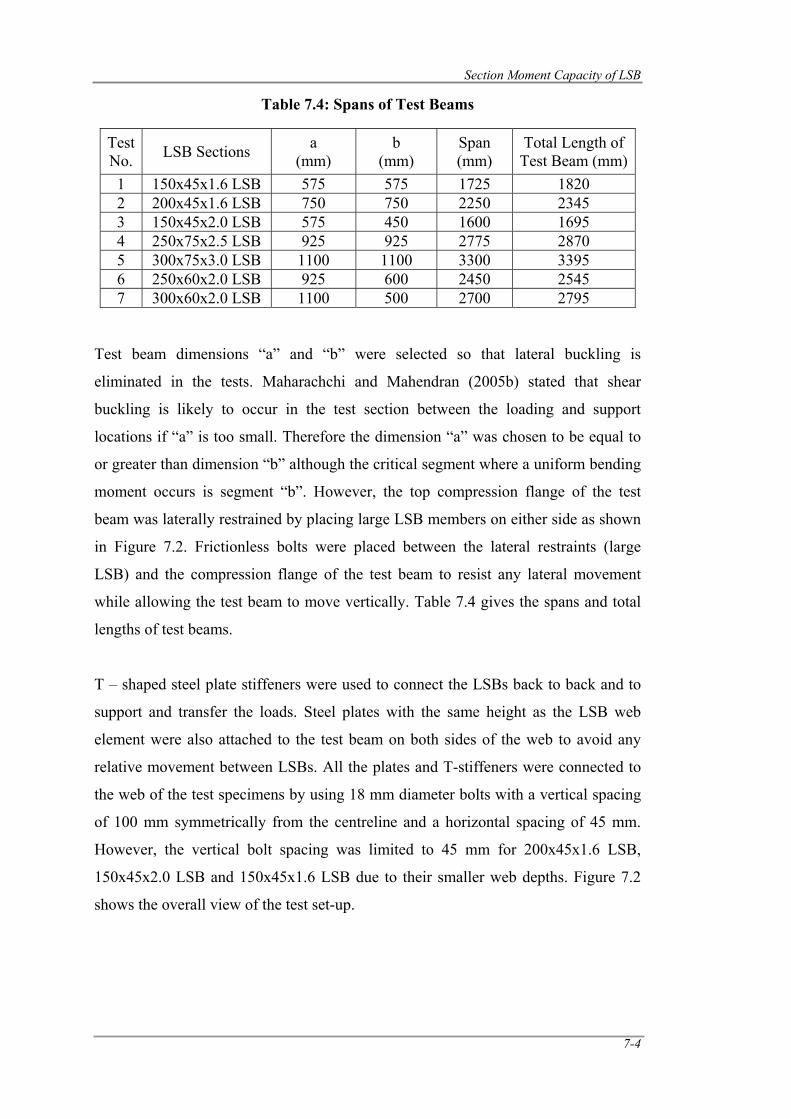
Section Moment Capacity of LSB
7-4
Table 7.4: Spans of Test Beams
Test No. LSB Sections a
(mm) b
(mm) Span (mm)
Total Length of Test Beam (mm)
1 150x45x1.6 LSB 575 575 1725 1820 2 200x45x1.6 LSB 750 750 2250 2345 3 150x45x2.0 LSB 575 450 1600 1695 4 250x75x2.5 LSB 925 925 2775 2870 5 300x75x3.0 LSB 1100 1100 3300 3395 6 250x60x2.0 LSB 925 600 2450 2545 7 300x60x2.0 LSB 1100 500 2700 2795
Test beam dimensions “a” and “b” were selected so that lateral buckling is
eliminated in the tests. Maharachchi and Mahendran (2005b) stated that shear
buckling is likely to occur in the test section between the loading and support
locations if “a” is too small. Therefore the dimension “a” was chosen to be equal to
or greater than dimension “b” although the critical segment where a uniform bending
moment occurs is segment “b”. However, the top compression flange of the test
beam was laterally restrained by placing large LSB members on either side as shown
in Figure 7.2. Frictionless bolts were placed between the lateral restraints (large
LSB) and the compression flange of the test beam to resist any lateral movement
while allowing the test beam to move vertically. Table 7.4 gives the spans and total
lengths of test beams.
T – shaped steel plate stiffeners were used to connect the LSBs back to back and to
support and transfer the loads. Steel plates with the same height as the LSB web
element were also attached to the test beam on both sides of the web to avoid any
relative movement between LSBs. All the plates and T-stiffeners were connected to
the web of the test specimens by using 18 mm diameter bolts with a vertical spacing
of 100 mm symmetrically from the centreline and a horizontal spacing of 45 mm.
However, the vertical bolt spacing was limited to 45 mm for 200x45x1.6 LSB,
150x45x2.0 LSB and 150x45x1.6 LSB due to their smaller web depths. Figure 7.2
shows the overall view of the test set-up.
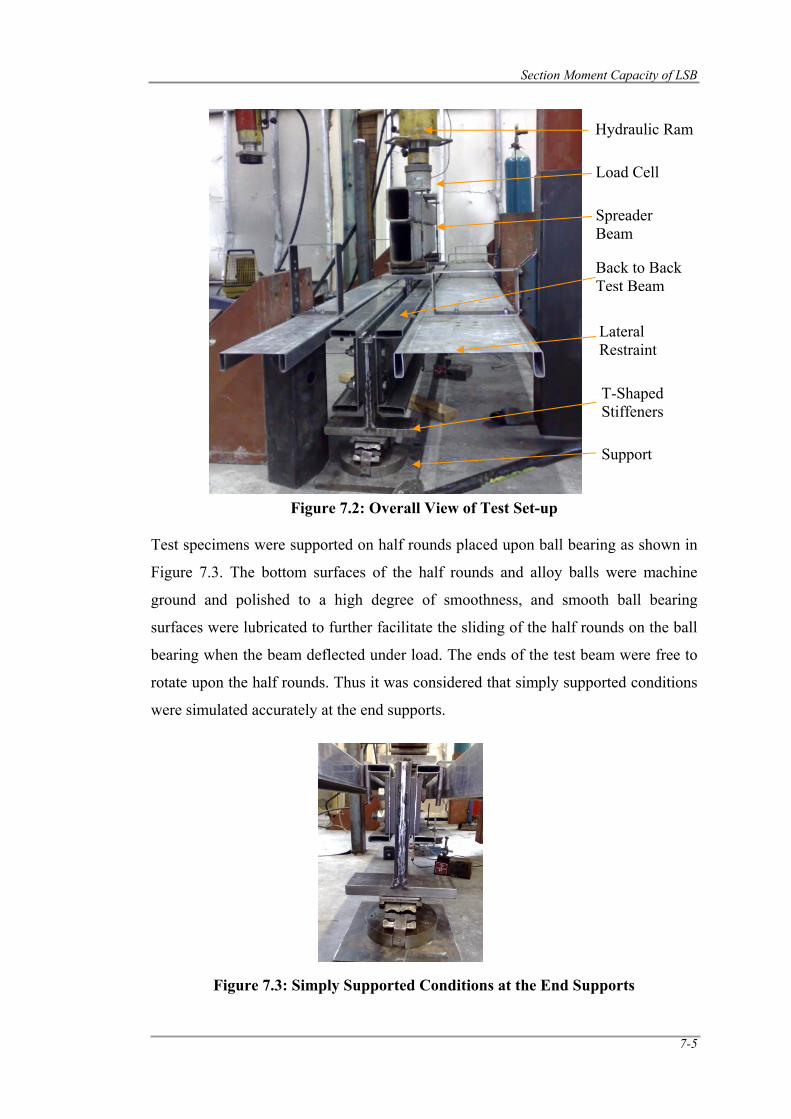
Section Moment Capacity of LSB
7-5
Figure 7.2: Test Set-Up
Figure 7.2: Overall View of Test Set-up Test specimens were supported on half rounds placed upon ball bearing as shown in
Figure 7.3. The bottom surfaces of the half rounds and alloy balls were machine
ground and polished to a high degree of smoothness, and smooth ball bearing
surfaces were lubricated to further facilitate the sliding of the half rounds on the ball
bearing when the beam deflected under load. The ends of the test beam were free to
rotate upon the half rounds. Thus it was considered that simply supported conditions
were simulated accurately at the end supports.
Figure 7.3: Simply Supported Conditions at the End Supports
Support
T-Shaped Stiffeners
Lateral Restraint
Spreader Beam
Load Cell
Hydraulic Ram
Back to Back Test Beam
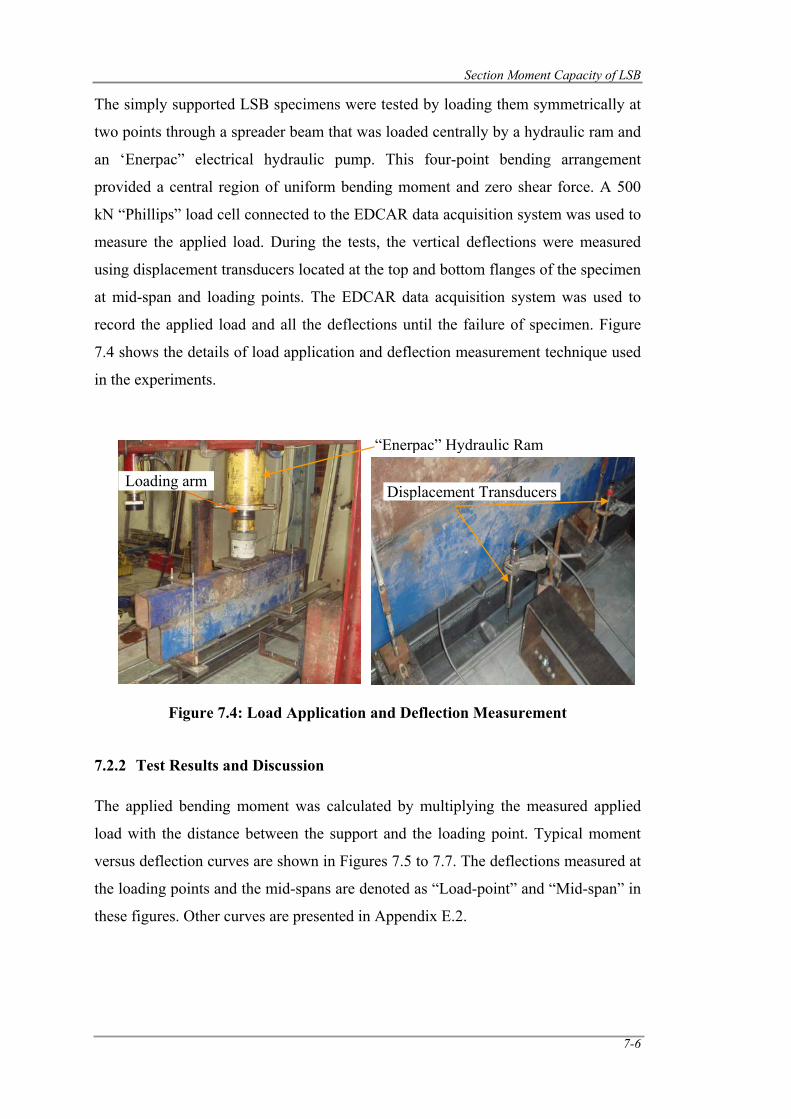
Section Moment Capacity of LSB
7-6
The simply supported LSB specimens were tested by loading them symmetrically at
two points through a spreader beam that was loaded centrally by a hydraulic ram and
an ‘Enerpac” electrical hydraulic pump. This four-point bending arrangement
provided a central region of uniform bending moment and zero shear force. A 500
kN “Phillips” load cell connected to the EDCAR data acquisition system was used to
measure the applied load. During the tests, the vertical deflections were measured
using displacement transducers located at the top and bottom flanges of the specimen
at mid-span and loading points. The EDCAR data acquisition system was used to
record the applied load and all the deflections until the failure of specimen. Figure
7.4 shows the details of load application and deflection measurement technique used
in the experiments.
Figure 7.4: Load Application and Deflection Measurement
7.2.2 Test Results and Discussion
The applied bending moment was calculated by multiplying the measured applied
load with the distance between the support and the loading point. Typical moment
versus deflection curves are shown in Figures 7.5 to 7.7. The deflections measured at
the loading points and the mid-spans are denoted as “Load-point” and “Mid-span” in
these figures. Other curves are presented in Appendix E.2.
Displacement Transducers
“Enerpac” Hydraulic Ram
Loading arm
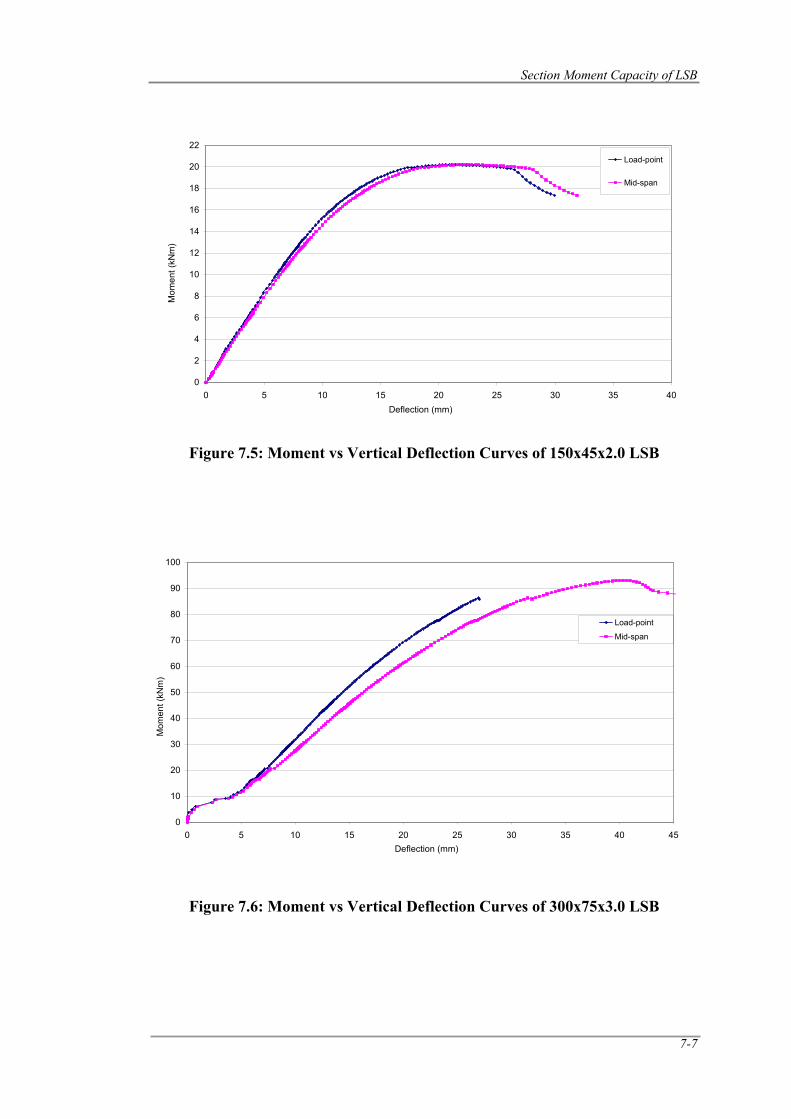
Section Moment Capacity of LSB
7-7
0
2
4
6
8
10
12
14
16
18
20
22
0 5 10 15 20 25 30 35 40Deflection (mm)
Mom
ent (
kNm
)Load-point
Mid-span
Figure 7.5: Moment vs Vertical Deflection Curves of 150x45x2.0 LSB
Figure 7.6: Moment vs Vertical Deflection Curves of 300x75x3.0 LSB
0
10
20
30
40
50
60
70
80
90
100
0 5 10 15 20 25 30 35 40 45Deflection (mm)
Mom
ent (
kNm
)
Load-point
Mid-span
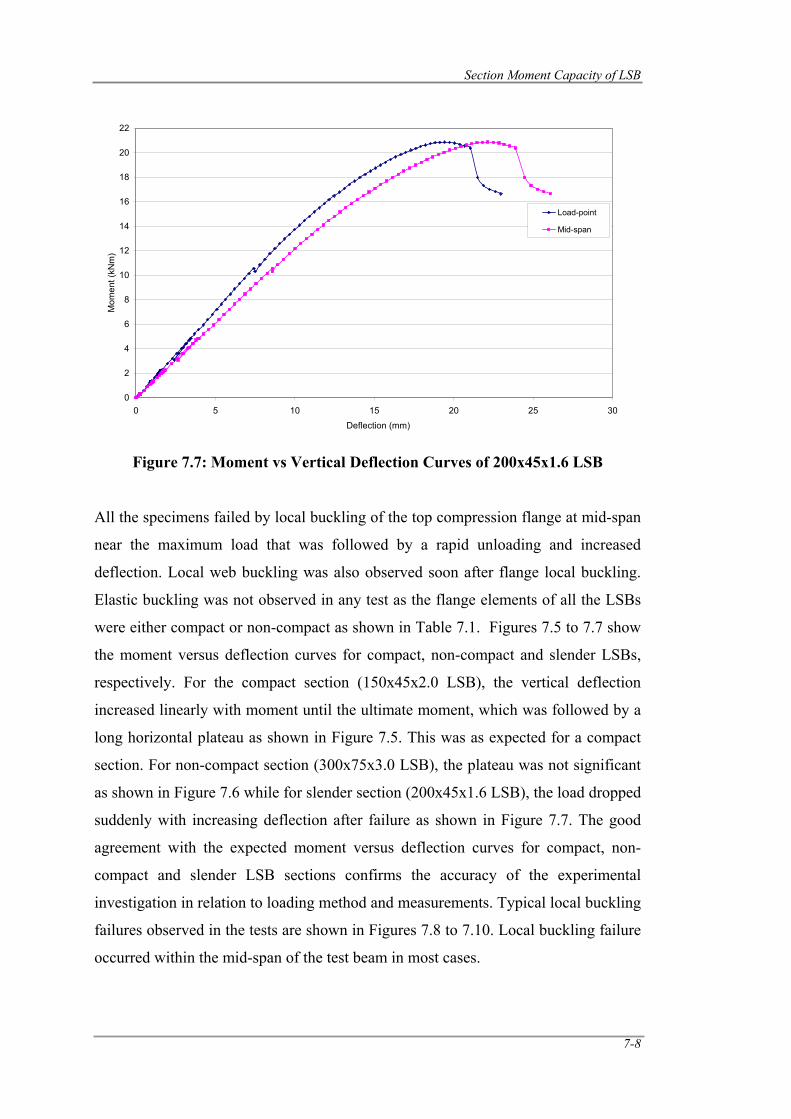
Section Moment Capacity of LSB
7-8
Figure 7.7: Moment vs Vertical Deflection Curves of 200x45x1.6 LSB
All the specimens failed by local buckling of the top compression flange at mid-span
near the maximum load that was followed by a rapid unloading and increased
deflection. Local web buckling was also observed soon after flange local buckling.
Elastic buckling was not observed in any test as the flange elements of all the LSBs
were either compact or non-compact as shown in Table 7.1. Figures 7.5 to 7.7 show
the moment versus deflection curves for compact, non-compact and slender LSBs,
respectively. For the compact section (150x45x2.0 LSB), the vertical deflection
increased linearly with moment until the ultimate moment, which was followed by a
long horizontal plateau as shown in Figure 7.5. This was as expected for a compact
section. For non-compact section (300x75x3.0 LSB), the plateau was not significant
as shown in Figure 7.6 while for slender section (200x45x1.6 LSB), the load dropped
suddenly with increasing deflection after failure as shown in Figure 7.7. The good
agreement with the expected moment versus deflection curves for compact, non-
compact and slender LSB sections confirms the accuracy of the experimental
investigation in relation to loading method and measurements. Typical local buckling
failures observed in the tests are shown in Figures 7.8 to 7.10. Local buckling failure
occurred within the mid-span of the test beam in most cases.
0
2
4
6
8
10
12
14
16
18
20
22
0 5 10 15 20 25 30
Deflection (mm)
Mom
ent (
kNm
)
Load-point
Mid-span
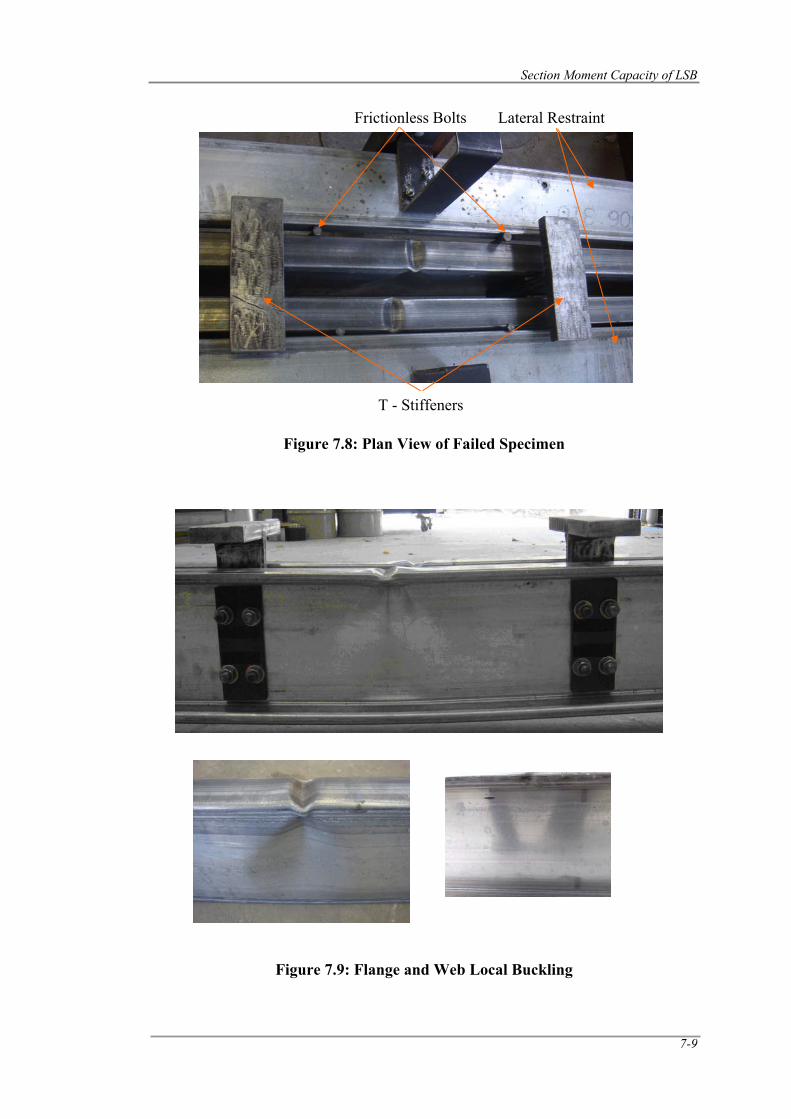
Section Moment Capacity of LSB
7-9
Figure 7.8: Plan View of Failed Specimen
Figure 7.9: Flange and Web Local Buckling
T - Stiffeners
Frictionless Bolts Lateral Restraint
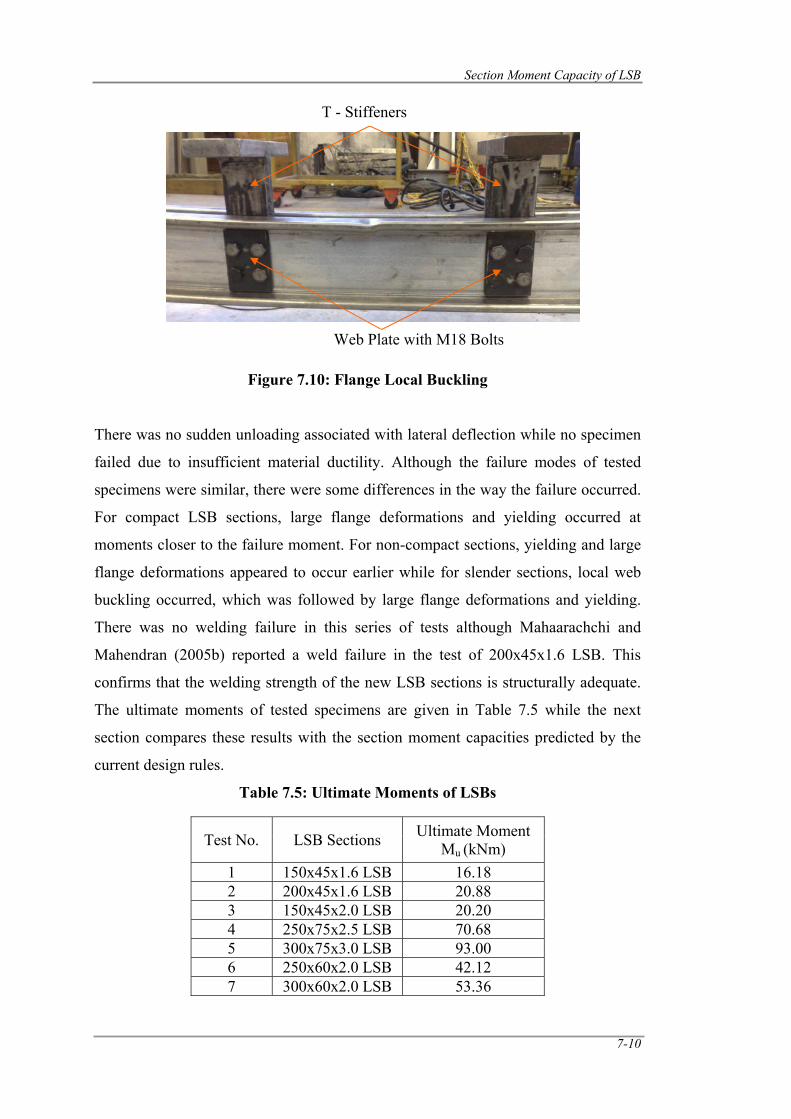
Section Moment Capacity of LSB
7-10
Figure 7.10: Flange Local Buckling There was no sudden unloading associated with lateral deflection while no specimen
failed due to insufficient material ductility. Although the failure modes of tested
specimens were similar, there were some differences in the way the failure occurred.
For compact LSB sections, large flange deformations and yielding occurred at
moments closer to the failure moment. For non-compact sections, yielding and large
flange deformations appeared to occur earlier while for slender sections, local web
buckling occurred, which was followed by large flange deformations and yielding.
There was no welding failure in this series of tests although Mahaarachchi and
Mahendran (2005b) reported a weld failure in the test of 200x45x1.6 LSB. This
confirms that the welding strength of the new LSB sections is structurally adequate.
The ultimate moments of tested specimens are given in Table 7.5 while the next
section compares these results with the section moment capacities predicted by the
current design rules.
Table 7.5: Ultimate Moments of LSBs
Test No. LSB Sections Ultimate Moment Mu (kNm)
1 150x45x1.6 LSB 16.18 2 200x45x1.6 LSB 20.88 3 150x45x2.0 LSB 20.20 4 250x75x2.5 LSB 70.68 5 300x75x3.0 LSB 93.00 6 250x60x2.0 LSB 42.12 7 300x60x2.0 LSB 53.36
T - Stiffeners
Web Plate with M18 Bolts
Section Moment Capacity of LSB
7-11
7.2.3 Comparison of Ultimate Moment Capacities from Tests and Current
Design Rules
The section moment capacity (Ms) of cold-formed steel section is usually based on
the initiation of yielding in the extreme compression fibre in the Australian cold-
formed steel standard AS/NZS 4600 (SA, 2005). The inelastic reserve capacity is
allowed subject to restrictive conditions as discussed in Section 7.4. Effects of local
buckling are accounted for by using the effective widths (be) of slender elements in
compression in the calculation of effective section modulus (Ze). The plate element
slenderness is a function of the applied stress (f *) as shown in Equation 7.2. This
accounts for the reduction in the strength due to local buckling effects with
increasing member slenderness. Clause 3.3.2 of AS/NZS 4600 (SA, 2005) provides
the equation for section moment capacity (Ms) as given in Equation 7.1, where fy is
the yield stress.
Ms = fy Ze (7.1)
Ef
tb
k
*052.1⎟⎠⎞
⎜⎝⎛=λ (7.2)
where
λ = plate slenderness
k = plate buckling coefficient
b = flat width of element excluding radii
t = thickness of the uniformly compressed stiffened elements
f* = design stress in the compression element
The procedure to determine the effective widths of uniformly compressed stiffened
elements for capacity calculations is given in Clause 2.2.1.2 of AS/NZS 4600 (SA,
2005).
For λ ≤ 0.673 : be = b (7.3a)
For λ > 0.673: be = ρb (7.3b)
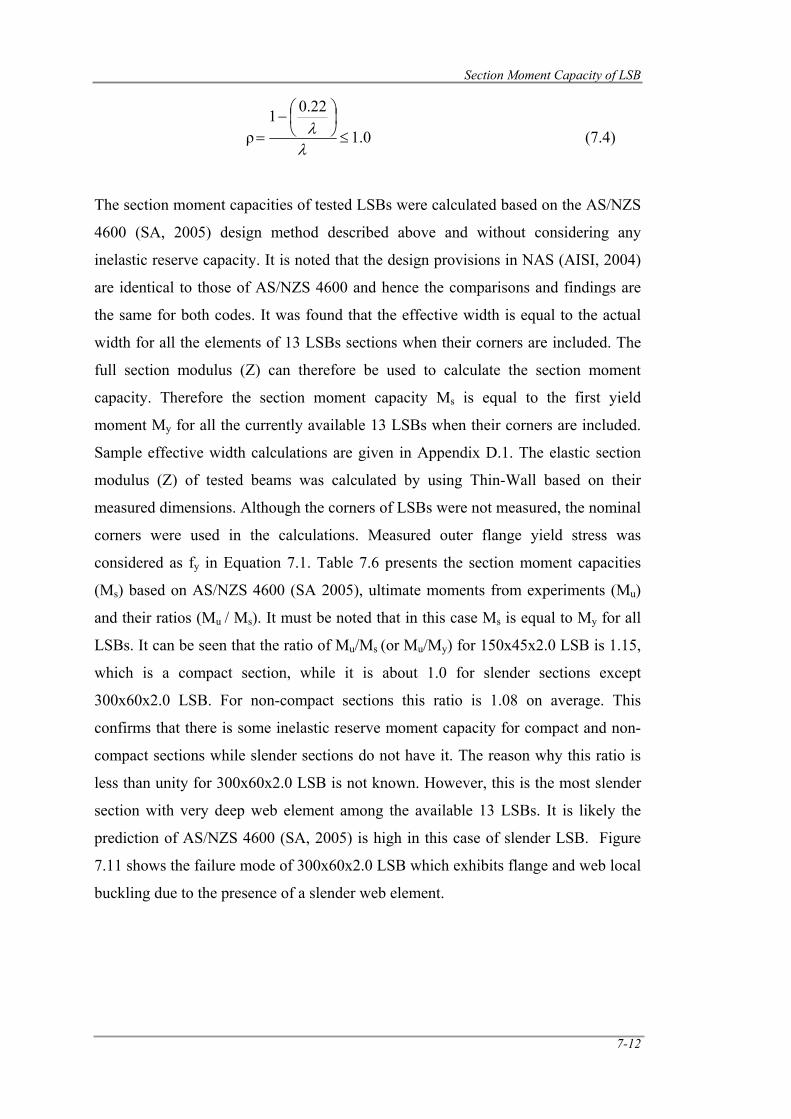
Section Moment Capacity of LSB
7-12
ρ 0.1
22.01≤
⎟⎠⎞
⎜⎝⎛−
=λλ (7.4)
The section moment capacities of tested LSBs were calculated based on the AS/NZS
4600 (SA, 2005) design method described above and without considering any
inelastic reserve capacity. It is noted that the design provisions in NAS (AISI, 2004)
are identical to those of AS/NZS 4600 and hence the comparisons and findings are
the same for both codes. It was found that the effective width is equal to the actual
width for all the elements of 13 LSBs sections when their corners are included. The
full section modulus (Z) can therefore be used to calculate the section moment
capacity. Therefore the section moment capacity Ms is equal to the first yield
moment My for all the currently available 13 LSBs when their corners are included.
Sample effective width calculations are given in Appendix D.1. The elastic section
modulus (Z) of tested beams was calculated by using Thin-Wall based on their
measured dimensions. Although the corners of LSBs were not measured, the nominal
corners were used in the calculations. Measured outer flange yield stress was
considered as fy in Equation 7.1. Table 7.6 presents the section moment capacities
(Ms) based on AS/NZS 4600 (SA 2005), ultimate moments from experiments (Mu)
and their ratios (Mu / Ms). It must be noted that in this case Ms is equal to My for all
LSBs. It can be seen that the ratio of Mu/Ms (or Mu/My) for 150x45x2.0 LSB is 1.15,
which is a compact section, while it is about 1.0 for slender sections except
300x60x2.0 LSB. For non-compact sections this ratio is 1.08 on average. This
confirms that there is some inelastic reserve moment capacity for compact and non-
compact sections while slender sections do not have it. The reason why this ratio is
less than unity for 300x60x2.0 LSB is not known. However, this is the most slender
section with very deep web element among the available 13 LSBs. It is likely the
prediction of AS/NZS 4600 (SA, 2005) is high in this case of slender LSB. Figure
7.11 shows the failure mode of 300x60x2.0 LSB which exhibits flange and web local
buckling due to the presence of a slender web element.
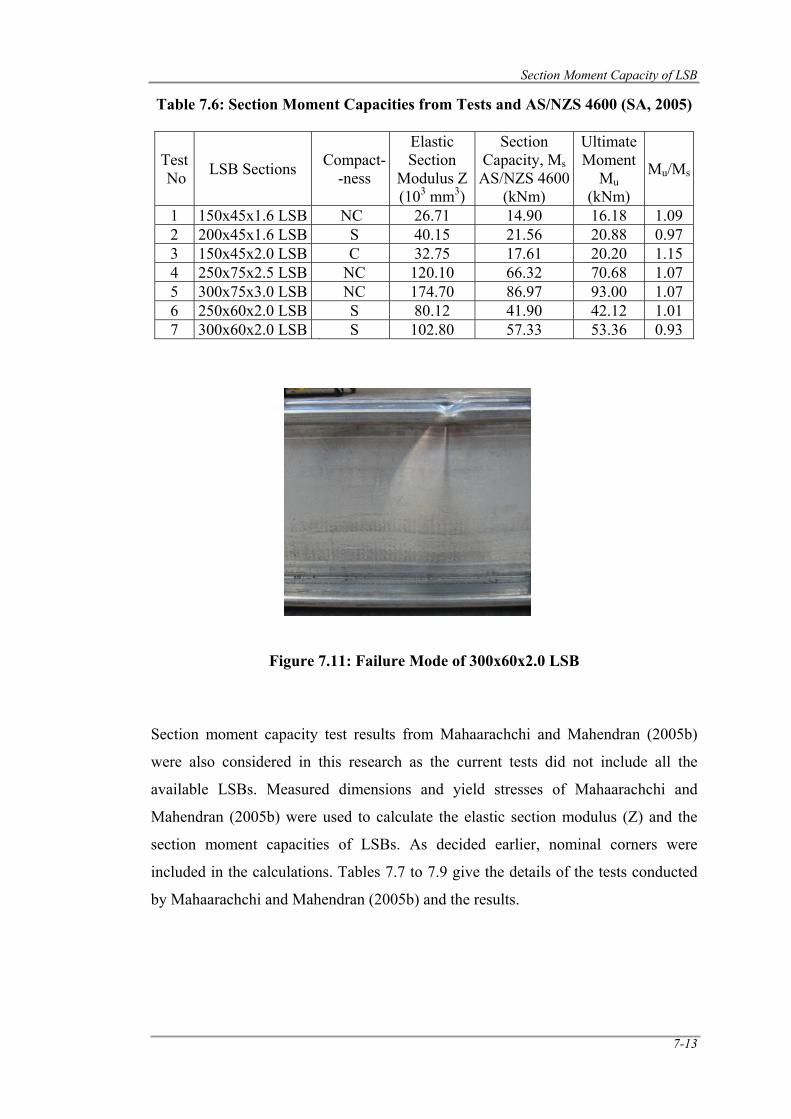
Section Moment Capacity of LSB
7-13
Table 7.6: Section Moment Capacities from Tests and AS/NZS 4600 (SA, 2005)
Test No LSB Sections
Compact-
-ness
Elastic Section
Modulus Z(103 mm3)
Section Capacity, Ms AS/NZS 4600
(kNm)
Ultimate Moment
Mu (kNm)
Mu/Ms
1 150x45x1.6 LSB NC 26.71 14.90 16.18 1.09 2 200x45x1.6 LSB S 40.15 21.56 20.88 0.97 3 150x45x2.0 LSB C 32.75 17.61 20.20 1.15 4 250x75x2.5 LSB NC 120.10 66.32 70.68 1.07 5 300x75x3.0 LSB NC 174.70 86.97 93.00 1.07 6 250x60x2.0 LSB S 80.12 41.90 42.12 1.01 7 300x60x2.0 LSB S 102.80 57.33 53.36 0.93
Figure 7.11: Failure Mode of 300x60x2.0 LSB
Section moment capacity test results from Mahaarachchi and Mahendran (2005b)
were also considered in this research as the current tests did not include all the
available LSBs. Measured dimensions and yield stresses of Mahaarachchi and
Mahendran (2005b) were used to calculate the elastic section modulus (Z) and the
section moment capacities of LSBs. As decided earlier, nominal corners were
included in the calculations. Tables 7.7 to 7.9 give the details of the tests conducted
by Mahaarachchi and Mahendran (2005b) and the results.
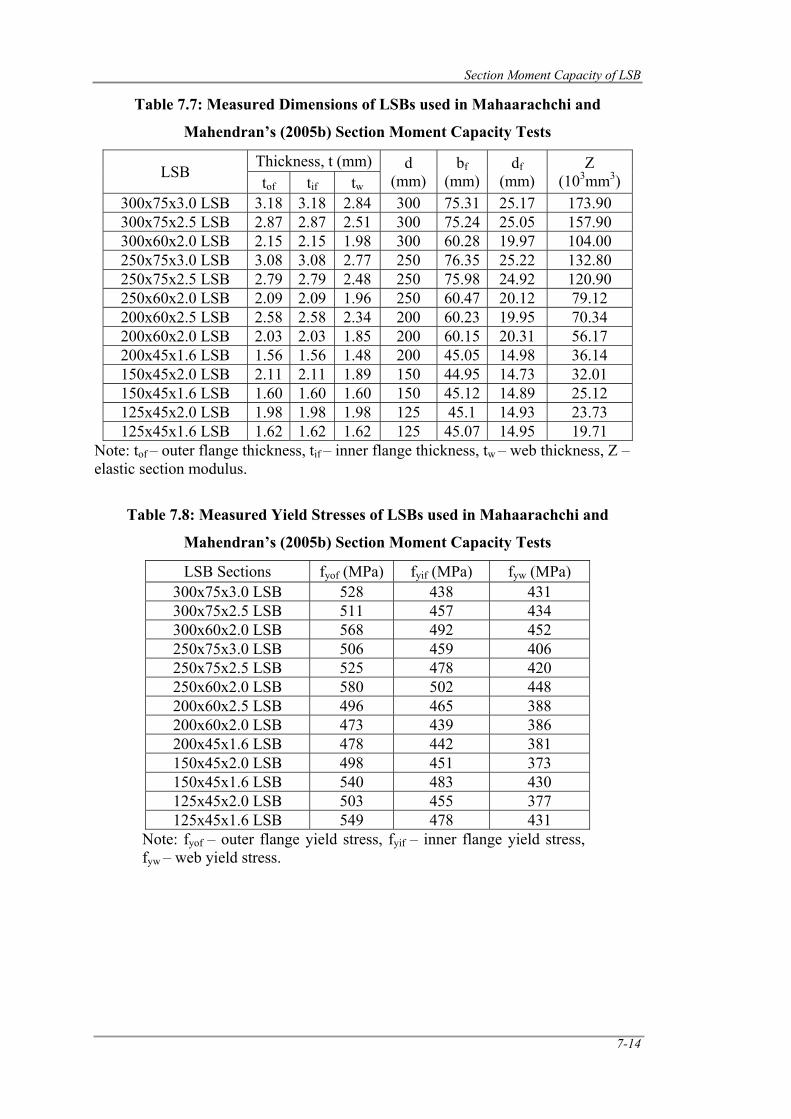
Section Moment Capacity of LSB
7-14
Table 7.7: Measured Dimensions of LSBs used in Mahaarachchi and
Mahendran’s (2005b) Section Moment Capacity Tests
LSB Thickness, t (mm) d
(mm) bf
(mm)df
(mm) Z
(103mm3) tof tif tw 300x75x3.0 LSB 3.18 3.18 2.84 300 75.31 25.17 173.90 300x75x2.5 LSB 2.87 2.87 2.51 300 75.24 25.05 157.90 300x60x2.0 LSB 2.15 2.15 1.98 300 60.28 19.97 104.00 250x75x3.0 LSB 3.08 3.08 2.77 250 76.35 25.22 132.80 250x75x2.5 LSB 2.79 2.79 2.48 250 75.98 24.92 120.90 250x60x2.0 LSB 2.09 2.09 1.96 250 60.47 20.12 79.12 200x60x2.5 LSB 2.58 2.58 2.34 200 60.23 19.95 70.34 200x60x2.0 LSB 2.03 2.03 1.85 200 60.15 20.31 56.17 200x45x1.6 LSB 1.56 1.56 1.48 200 45.05 14.98 36.14 150x45x2.0 LSB 2.11 2.11 1.89 150 44.95 14.73 32.01 150x45x1.6 LSB 1.60 1.60 1.60 150 45.12 14.89 25.12 125x45x2.0 LSB 1.98 1.98 1.98 125 45.1 14.93 23.73 125x45x1.6 LSB 1.62 1.62 1.62 125 45.07 14.95 19.71
Note: tof – outer flange thickness, tif – inner flange thickness, tw – web thickness, Z – elastic section modulus.
Table 7.8: Measured Yield Stresses of LSBs used in Mahaarachchi and
Mahendran’s (2005b) Section Moment Capacity Tests
LSB Sections fyof (MPa) fyif (MPa) fyw (MPa) 300x75x3.0 LSB 528 438 431 300x75x2.5 LSB 511 457 434 300x60x2.0 LSB 568 492 452 250x75x3.0 LSB 506 459 406 250x75x2.5 LSB 525 478 420 250x60x2.0 LSB 580 502 448 200x60x2.5 LSB 496 465 388 200x60x2.0 LSB 473 439 386 200x45x1.6 LSB 478 442 381 150x45x2.0 LSB 498 451 373 150x45x1.6 LSB 540 483 430 125x45x2.0 LSB 503 455 377 125x45x1.6 LSB 549 478 431
Note: fyof – outer flange yield stress, fyif – inner flange yield stress, fyw – web yield stress.
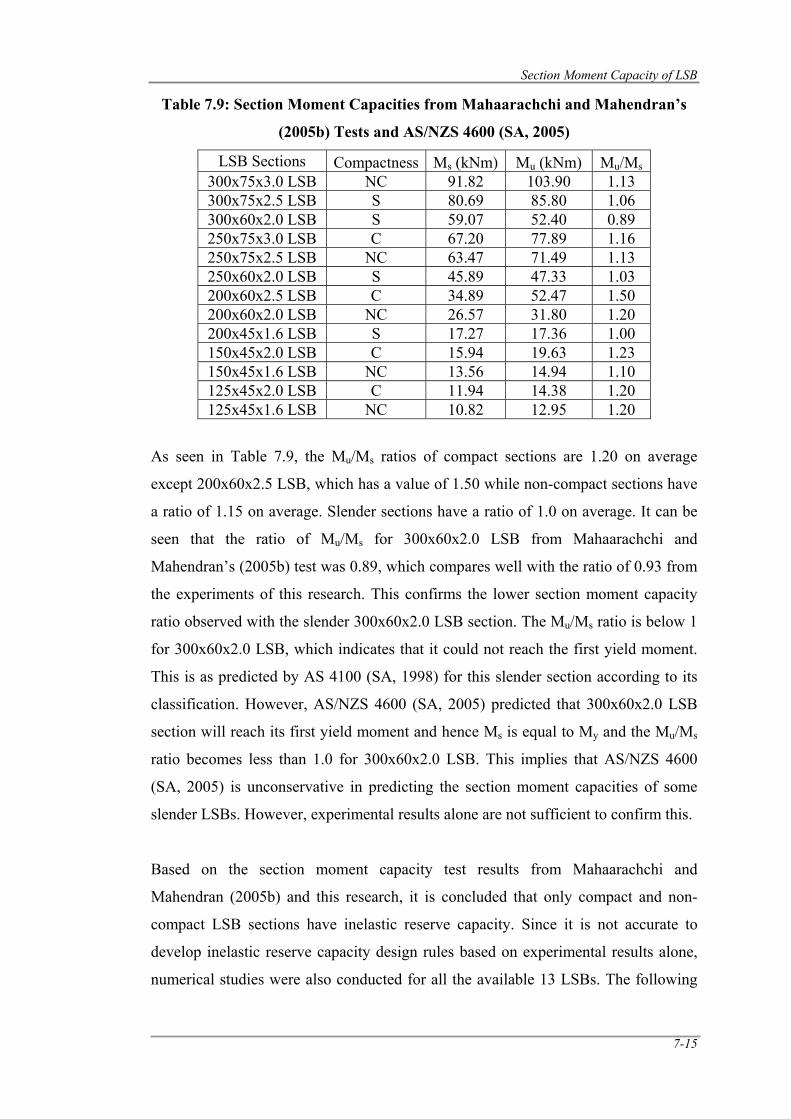
Section Moment Capacity of LSB
7-15
Table 7.9: Section Moment Capacities from Mahaarachchi and Mahendran’s
(2005b) Tests and AS/NZS 4600 (SA, 2005)
LSB Sections Compactness Ms (kNm) Mu (kNm) Mu/Ms 300x75x3.0 LSB NC 91.82 103.90 1.13 300x75x2.5 LSB S 80.69 85.80 1.06 300x60x2.0 LSB S 59.07 52.40 0.89 250x75x3.0 LSB C 67.20 77.89 1.16 250x75x2.5 LSB NC 63.47 71.49 1.13 250x60x2.0 LSB S 45.89 47.33 1.03 200x60x2.5 LSB C 34.89 52.47 1.50 200x60x2.0 LSB NC 26.57 31.80 1.20 200x45x1.6 LSB S 17.27 17.36 1.00 150x45x2.0 LSB C 15.94 19.63 1.23 150x45x1.6 LSB NC 13.56 14.94 1.10 125x45x2.0 LSB C 11.94 14.38 1.20 125x45x1.6 LSB NC 10.82 12.95 1.20
As seen in Table 7.9, the Mu/Ms ratios of compact sections are 1.20 on average
except 200x60x2.5 LSB, which has a value of 1.50 while non-compact sections have
a ratio of 1.15 on average. Slender sections have a ratio of 1.0 on average. It can be
seen that the ratio of Mu/Ms for 300x60x2.0 LSB from Mahaarachchi and
Mahendran’s (2005b) test was 0.89, which compares well with the ratio of 0.93 from
the experiments of this research. This confirms the lower section moment capacity
ratio observed with the slender 300x60x2.0 LSB section. The Mu/Ms ratio is below 1
for 300x60x2.0 LSB, which indicates that it could not reach the first yield moment.
This is as predicted by AS 4100 (SA, 1998) for this slender section according to its
classification. However, AS/NZS 4600 (SA, 2005) predicted that 300x60x2.0 LSB
section will reach its first yield moment and hence Ms is equal to My and the Mu/Ms
ratio becomes less than 1.0 for 300x60x2.0 LSB. This implies that AS/NZS 4600
(SA, 2005) is unconservative in predicting the section moment capacities of some
slender LSBs. However, experimental results alone are not sufficient to confirm this.
Based on the section moment capacity test results from Mahaarachchi and
Mahendran (2005b) and this research, it is concluded that only compact and non-
compact LSB sections have inelastic reserve capacity. Since it is not accurate to
develop inelastic reserve capacity design rules based on experimental results alone,
numerical studies were also conducted for all the available 13 LSBs. The following
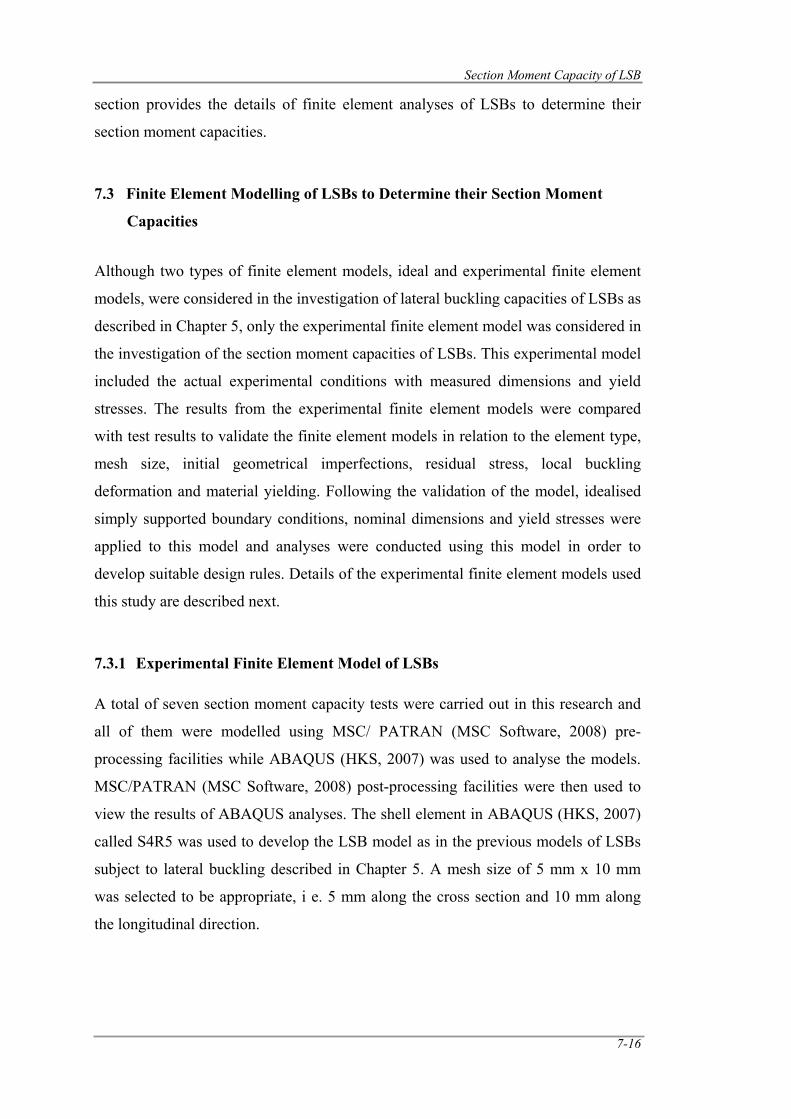
Section Moment Capacity of LSB
7-16
section provides the details of finite element analyses of LSBs to determine their
section moment capacities.
7.3 Finite Element Modelling of LSBs to Determine their Section Moment
Capacities
Although two types of finite element models, ideal and experimental finite element
models, were considered in the investigation of lateral buckling capacities of LSBs as
described in Chapter 5, only the experimental finite element model was considered in
the investigation of the section moment capacities of LSBs. This experimental model
included the actual experimental conditions with measured dimensions and yield
stresses. The results from the experimental finite element models were compared
with test results to validate the finite element models in relation to the element type,
mesh size, initial geometrical imperfections, residual stress, local buckling
deformation and material yielding. Following the validation of the model, idealised
simply supported boundary conditions, nominal dimensions and yield stresses were
applied to this model and analyses were conducted using this model in order to
develop suitable design rules. Details of the experimental finite element models used
this study are described next.
7.3.1 Experimental Finite Element Model of LSBs
A total of seven section moment capacity tests were carried out in this research and
all of them were modelled using MSC/ PATRAN (MSC Software, 2008) pre-
processing facilities while ABAQUS (HKS, 2007) was used to analyse the models.
MSC/PATRAN (MSC Software, 2008) post-processing facilities were then used to
view the results of ABAQUS analyses. The shell element in ABAQUS (HKS, 2007)
called S4R5 was used to develop the LSB model as in the previous models of LSBs
subject to lateral buckling described in Chapter 5. A mesh size of 5 mm x 10 mm
was selected to be appropriate, i e. 5 mm along the cross section and 10 mm along
the longitudinal direction.
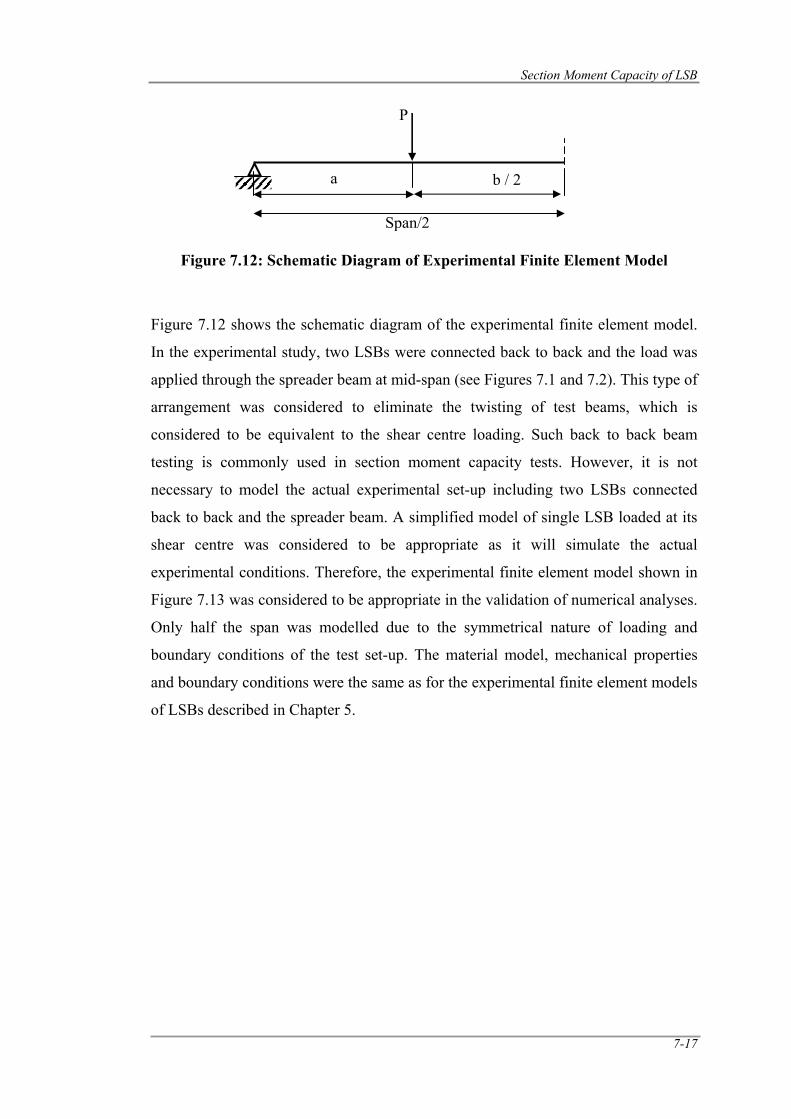
Section Moment Capacity of LSB
7-17
Figure 7.12: Schematic Diagram of Experimental Finite Element Model
Figure 7.12 shows the schematic diagram of the experimental finite element model.
In the experimental study, two LSBs were connected back to back and the load was
applied through the spreader beam at mid-span (see Figures 7.1 and 7.2). This type of
arrangement was considered to eliminate the twisting of test beams, which is
considered to be equivalent to the shear centre loading. Such back to back beam
testing is commonly used in section moment capacity tests. However, it is not
necessary to model the actual experimental set-up including two LSBs connected
back to back and the spreader beam. A simplified model of single LSB loaded at its
shear centre was considered to be appropriate as it will simulate the actual
experimental conditions. Therefore, the experimental finite element model shown in
Figure 7.13 was considered to be appropriate in the validation of numerical analyses.
Only half the span was modelled due to the symmetrical nature of loading and
boundary conditions of the test set-up. The material model, mechanical properties
and boundary conditions were the same as for the experimental finite element models
of LSBs described in Chapter 5.
Span/2
P
a b / 2
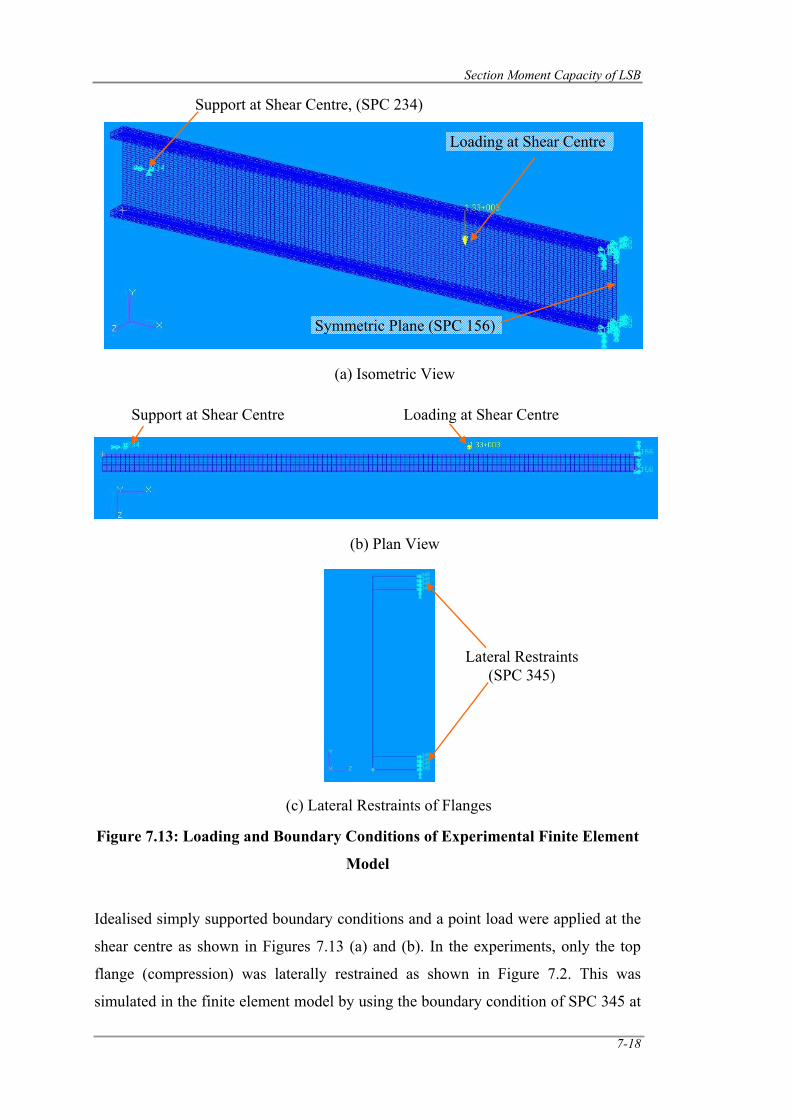
Section Moment Capacity of LSB
7-18
Figure 7.13: Loading and Boundary Conditions of Experimental Finite Element
Model
Idealised simply supported boundary conditions and a point load were applied at the
shear centre as shown in Figures 7.13 (a) and (b). In the experiments, only the top
flange (compression) was laterally restrained as shown in Figure 7.2. This was
simulated in the finite element model by using the boundary condition of SPC 345 at
(a) Isometric View
Support at Shear Centre, (SPC 234)
Symmetric Plane (SPC 156)
Loading at Shear Centre
(b) Plan View
Support at Shear Centre Loading at Shear Centre
Lateral Restraints (SPC 345)
(c) Lateral Restraints of Flanges
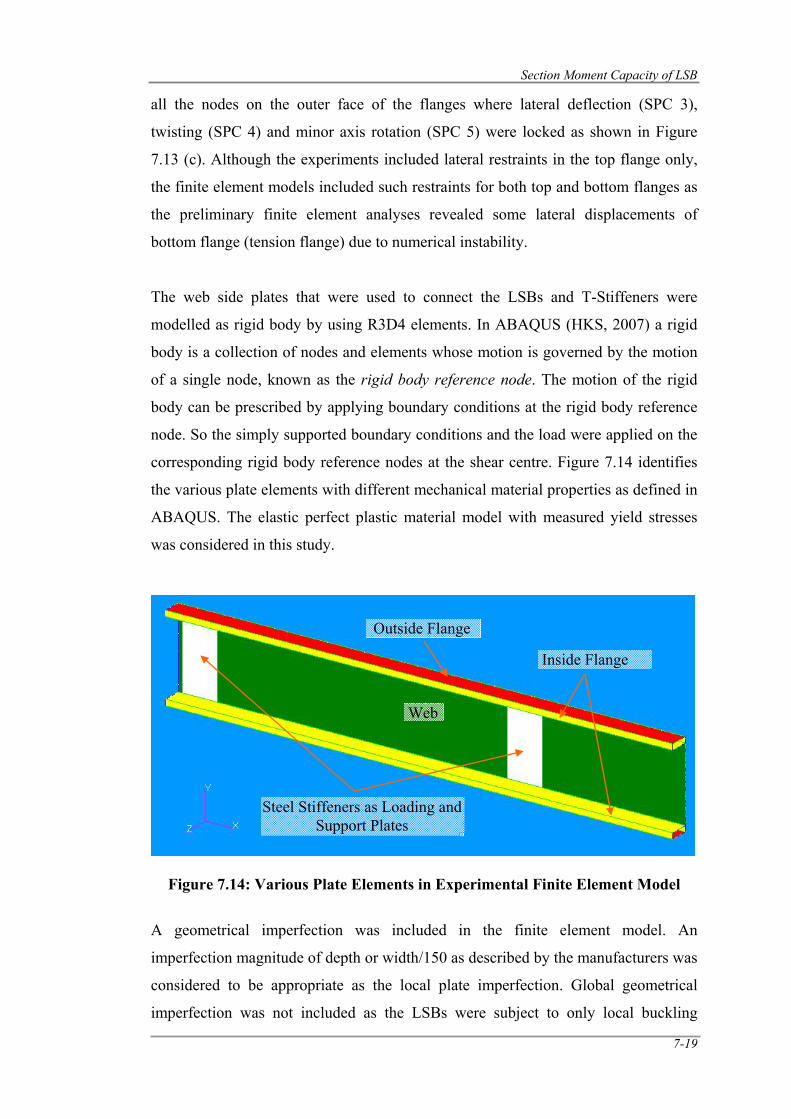
Section Moment Capacity of LSB
7-19
all the nodes on the outer face of the flanges where lateral deflection (SPC 3),
twisting (SPC 4) and minor axis rotation (SPC 5) were locked as shown in Figure
7.13 (c). Although the experiments included lateral restraints in the top flange only,
the finite element models included such restraints for both top and bottom flanges as
the preliminary finite element analyses revealed some lateral displacements of
bottom flange (tension flange) due to numerical instability.
The web side plates that were used to connect the LSBs and T-Stiffeners were
modelled as rigid body by using R3D4 elements. In ABAQUS (HKS, 2007) a rigid
body is a collection of nodes and elements whose motion is governed by the motion
of a single node, known as the rigid body reference node. The motion of the rigid
body can be prescribed by applying boundary conditions at the rigid body reference
node. So the simply supported boundary conditions and the load were applied on the
corresponding rigid body reference nodes at the shear centre. Figure 7.14 identifies
the various plate elements with different mechanical material properties as defined in
ABAQUS. The elastic perfect plastic material model with measured yield stresses
was considered in this study.
Figure 7.14: Various Plate Elements in Experimental Finite Element Model
A geometrical imperfection was included in the finite element model. An
imperfection magnitude of depth or width/150 as described by the manufacturers was
considered to be appropriate as the local plate imperfection. Global geometrical
imperfection was not included as the LSBs were subject to only local buckling
Web
Outside Flange
Inside Flange
Steel Stiffeners as Loading and Support Plates
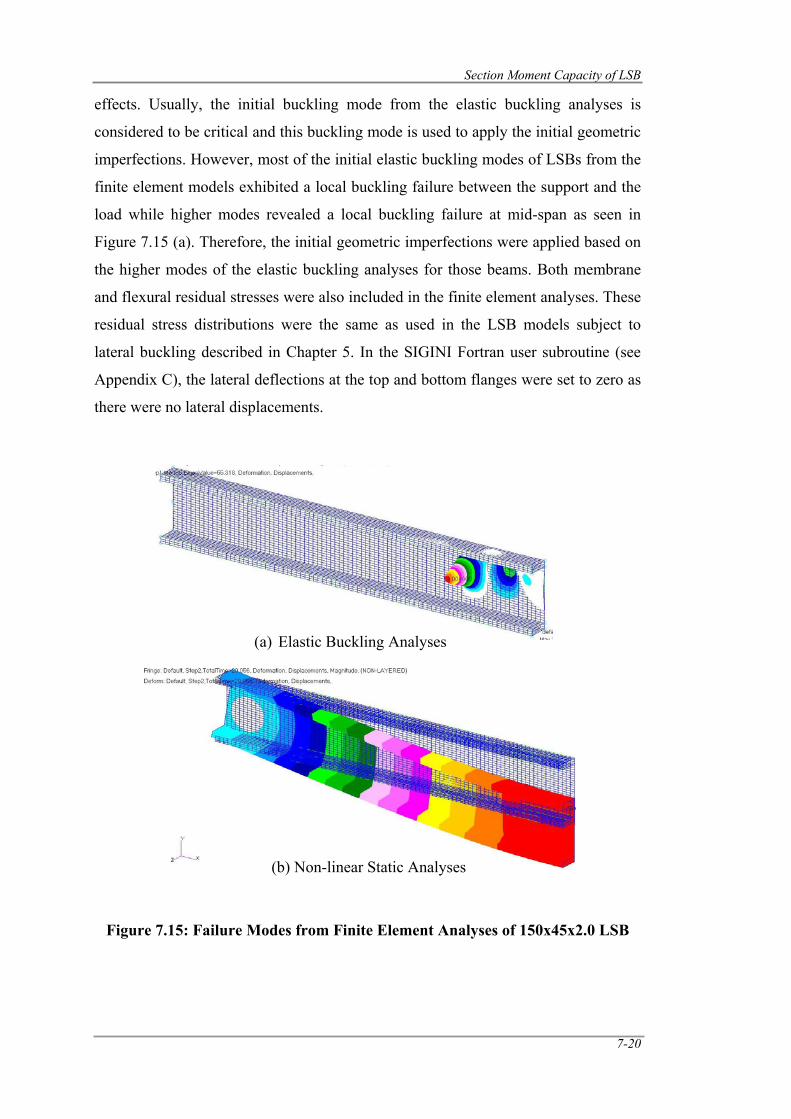
Section Moment Capacity of LSB
7-20
effects. Usually, the initial buckling mode from the elastic buckling analyses is
considered to be critical and this buckling mode is used to apply the initial geometric
imperfections. However, most of the initial elastic buckling modes of LSBs from the
finite element models exhibited a local buckling failure between the support and the
load while higher modes revealed a local buckling failure at mid-span as seen in
Figure 7.15 (a). Therefore, the initial geometric imperfections were applied based on
the higher modes of the elastic buckling analyses for those beams. Both membrane
and flexural residual stresses were also included in the finite element analyses. These
residual stress distributions were the same as used in the LSB models subject to
lateral buckling described in Chapter 5. In the SIGINI Fortran user subroutine (see
Appendix C), the lateral deflections at the top and bottom flanges were set to zero as
there were no lateral displacements.
Figure 7.15: Failure Modes from Finite Element Analyses of 150x45x2.0 LSB
(a) Elastic Buckling Analyses
(b) Non-linear Static Analyses
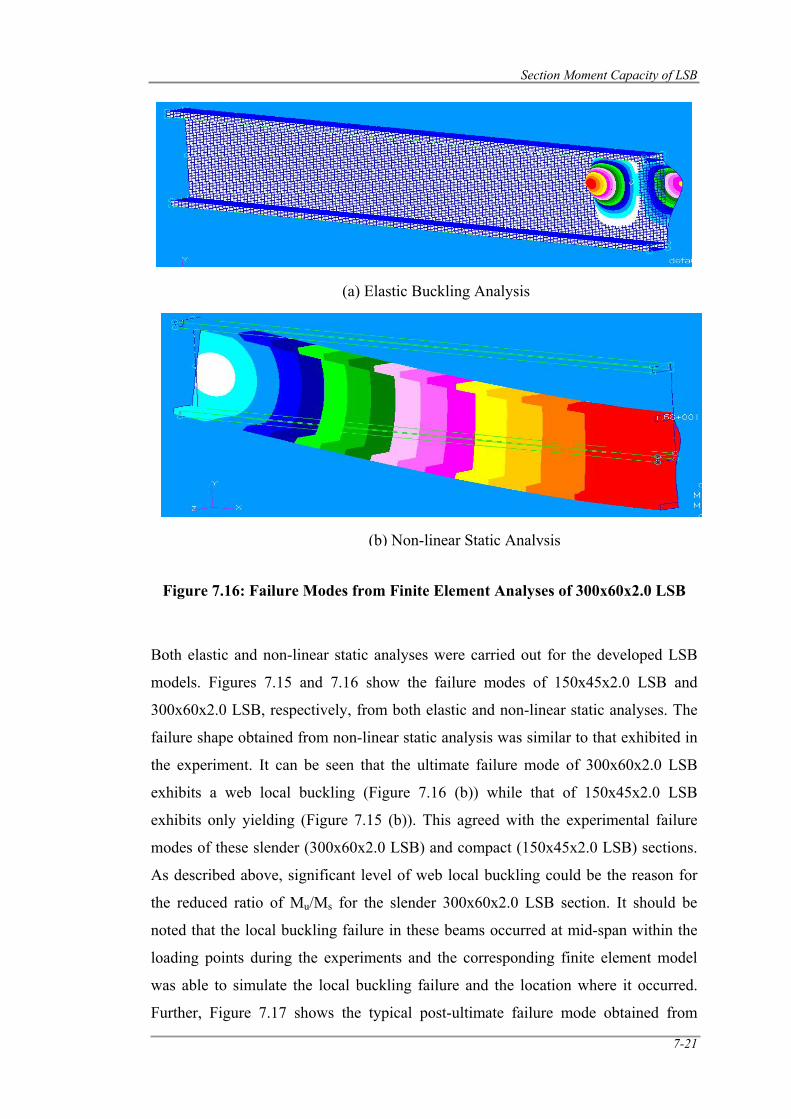
Section Moment Capacity of LSB
7-21
Figure 7.16: Failure Modes from Finite Element Analyses of 300x60x2.0 LSB
Both elastic and non-linear static analyses were carried out for the developed LSB
models. Figures 7.15 and 7.16 show the failure modes of 150x45x2.0 LSB and
300x60x2.0 LSB, respectively, from both elastic and non-linear static analyses. The
failure shape obtained from non-linear static analysis was similar to that exhibited in
the experiment. It can be seen that the ultimate failure mode of 300x60x2.0 LSB
exhibits a web local buckling (Figure 7.16 (b)) while that of 150x45x2.0 LSB
exhibits only yielding (Figure 7.15 (b)). This agreed with the experimental failure
modes of these slender (300x60x2.0 LSB) and compact (150x45x2.0 LSB) sections.
As described above, significant level of web local buckling could be the reason for
the reduced ratio of Mu/Ms for the slender 300x60x2.0 LSB section. It should be
noted that the local buckling failure in these beams occurred at mid-span within the
loading points during the experiments and the corresponding finite element model
was able to simulate the local buckling failure and the location where it occurred.
Further, Figure 7.17 shows the typical post-ultimate failure mode obtained from
(b) Non-linear Static Analysis
(a) Elastic Buckling Analysis
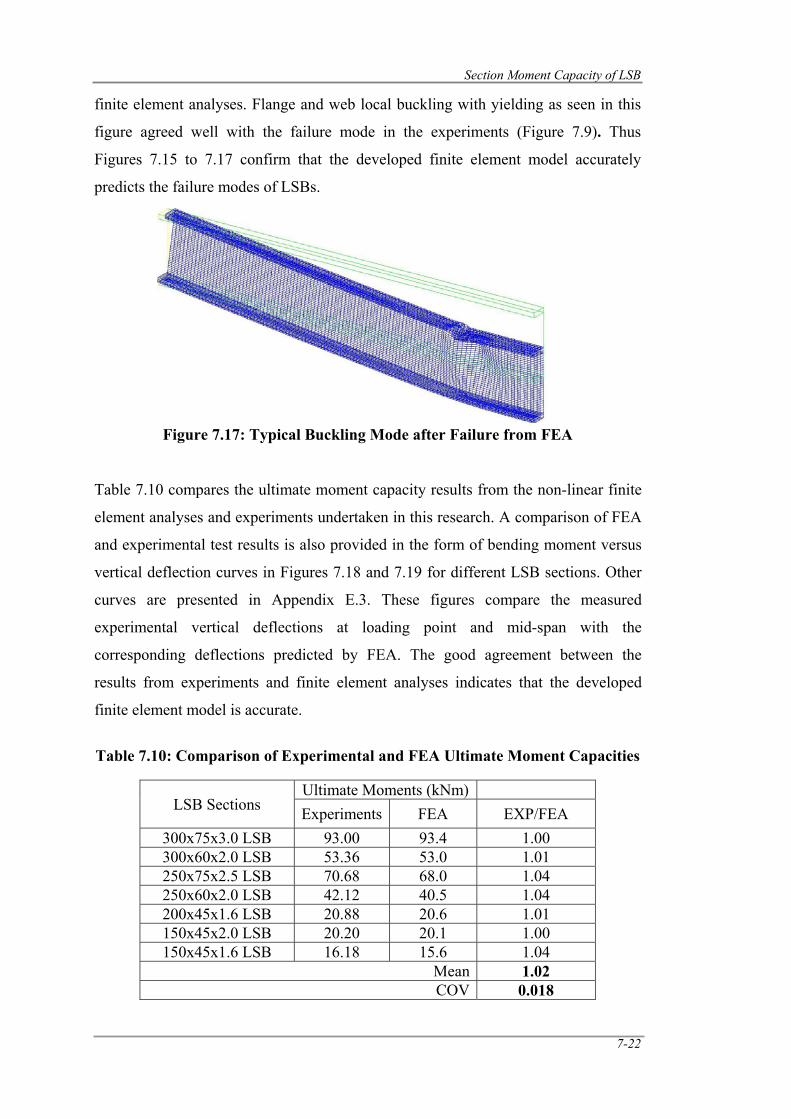
Section Moment Capacity of LSB
7-22
finite element analyses. Flange and web local buckling with yielding as seen in this
figure agreed well with the failure mode in the experiments (Figure 7.9). Thus
Figures 7.15 to 7.17 confirm that the developed finite element model accurately
predicts the failure modes of LSBs.
Figure 7.17: Typical Buckling Mode after Failure from FEA
Table 7.10 compares the ultimate moment capacity results from the non-linear finite
element analyses and experiments undertaken in this research. A comparison of FEA
and experimental test results is also provided in the form of bending moment versus
vertical deflection curves in Figures 7.18 and 7.19 for different LSB sections. Other
curves are presented in Appendix E.3. These figures compare the measured
experimental vertical deflections at loading point and mid-span with the
corresponding deflections predicted by FEA. The good agreement between the
results from experiments and finite element analyses indicates that the developed
finite element model is accurate.
Table 7.10: Comparison of Experimental and FEA Ultimate Moment Capacities
LSB Sections Ultimate Moments (kNm) Experiments FEA EXP/FEA
300x75x3.0 LSB 93.00 93.4 1.00 300x60x2.0 LSB 53.36 53.0 1.01 250x75x2.5 LSB 70.68 68.0 1.04 250x60x2.0 LSB 42.12 40.5 1.04 200x45x1.6 LSB 20.88 20.6 1.01 150x45x2.0 LSB 20.20 20.1 1.00 150x45x1.6 LSB 16.18 15.6 1.04
Mean 1.02 COV 0.018
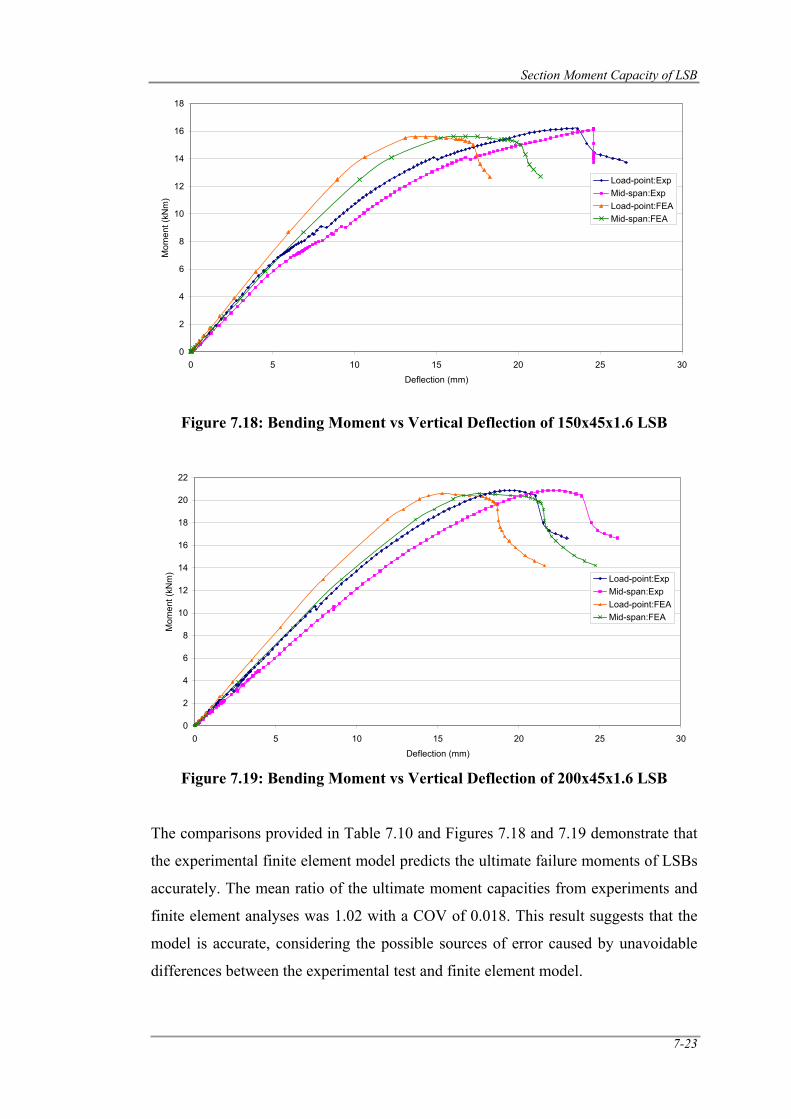
Section Moment Capacity of LSB
7-23
Figure 7.18: Bending Moment vs Vertical Deflection of 150x45x1.6 LSB
Figure 7.19: Bending Moment vs Vertical Deflection of 200x45x1.6 LSB
The comparisons provided in Table 7.10 and Figures 7.18 and 7.19 demonstrate that
the experimental finite element model predicts the ultimate failure moments of LSBs
accurately. The mean ratio of the ultimate moment capacities from experiments and
finite element analyses was 1.02 with a COV of 0.018. This result suggests that the
model is accurate, considering the possible sources of error caused by unavoidable
differences between the experimental test and finite element model.
0
2
4
6
8
10
12
14
16
18
0 5 10 15 20 25 30
Deflection (mm)
Mom
ent (
kNm
)
Load-point:ExpMid-span:ExpLoad-point:FEAMid-span:FEA
0
2
4
6
8
10
12
14
16
18
20
22
0 5 10 15 20 25 30
Deflection (mm)
Mom
ent (
kNm
)
Load-point:ExpMid-span:ExpLoad-point:FEAMid-span:FEA
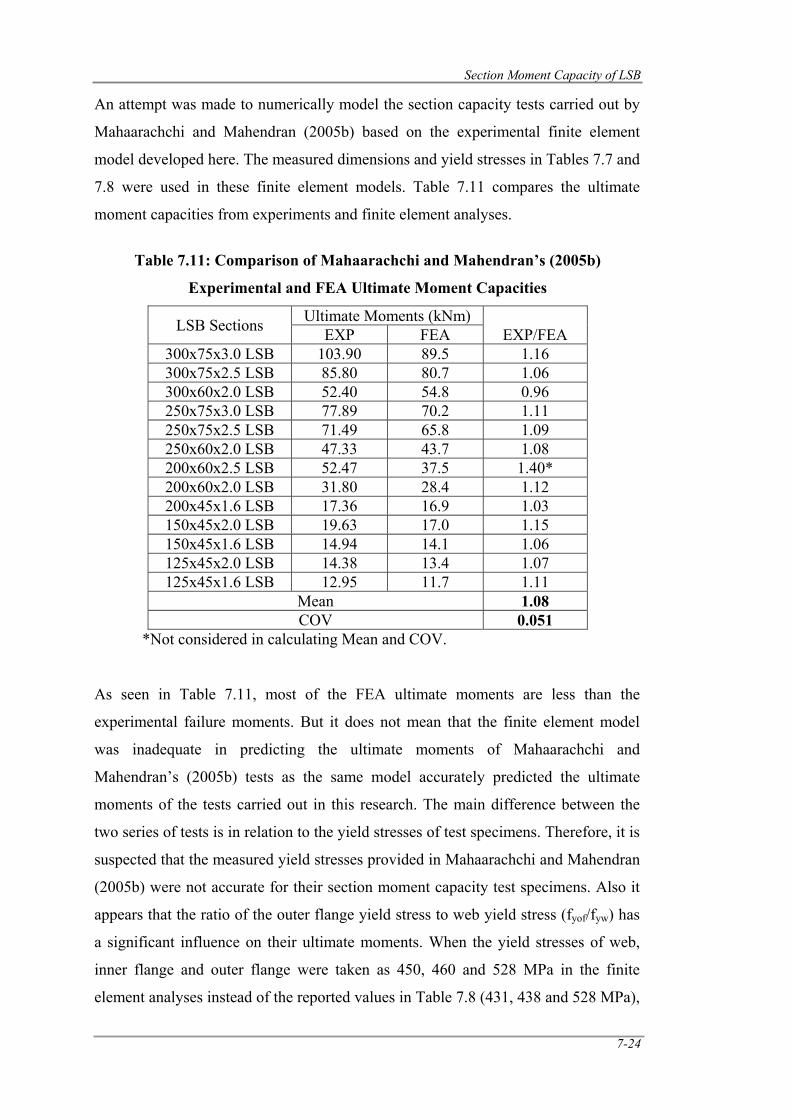
Section Moment Capacity of LSB
7-24
An attempt was made to numerically model the section capacity tests carried out by
Mahaarachchi and Mahendran (2005b) based on the experimental finite element
model developed here. The measured dimensions and yield stresses in Tables 7.7 and
7.8 were used in these finite element models. Table 7.11 compares the ultimate
moment capacities from experiments and finite element analyses.
Table 7.11: Comparison of Mahaarachchi and Mahendran’s (2005b)
Experimental and FEA Ultimate Moment Capacities
LSB Sections Ultimate Moments (kNm) EXP/FEA EXP FEA
300x75x3.0 LSB 103.90 89.5 1.16 300x75x2.5 LSB 85.80 80.7 1.06 300x60x2.0 LSB 52.40 54.8 0.96 250x75x3.0 LSB 77.89 70.2 1.11 250x75x2.5 LSB 71.49 65.8 1.09 250x60x2.0 LSB 47.33 43.7 1.08 200x60x2.5 LSB 52.47 37.5 1.40* 200x60x2.0 LSB 31.80 28.4 1.12 200x45x1.6 LSB 17.36 16.9 1.03 150x45x2.0 LSB 19.63 17.0 1.15 150x45x1.6 LSB 14.94 14.1 1.06 125x45x2.0 LSB 14.38 13.4 1.07 125x45x1.6 LSB 12.95 11.7 1.11
Mean 1.08 COV 0.051
*Not considered in calculating Mean and COV. As seen in Table 7.11, most of the FEA ultimate moments are less than the
experimental failure moments. But it does not mean that the finite element model
was inadequate in predicting the ultimate moments of Mahaarachchi and
Mahendran’s (2005b) tests as the same model accurately predicted the ultimate
moments of the tests carried out in this research. The main difference between the
two series of tests is in relation to the yield stresses of test specimens. Therefore, it is
suspected that the measured yield stresses provided in Mahaarachchi and Mahendran
(2005b) were not accurate for their section moment capacity test specimens. Also it
appears that the ratio of the outer flange yield stress to web yield stress (fyof/fyw) has
a significant influence on their ultimate moments. When the yield stresses of web,
inner flange and outer flange were taken as 450, 460 and 528 MPa in the finite
element analyses instead of the reported values in Table 7.8 (431, 438 and 528 MPa),
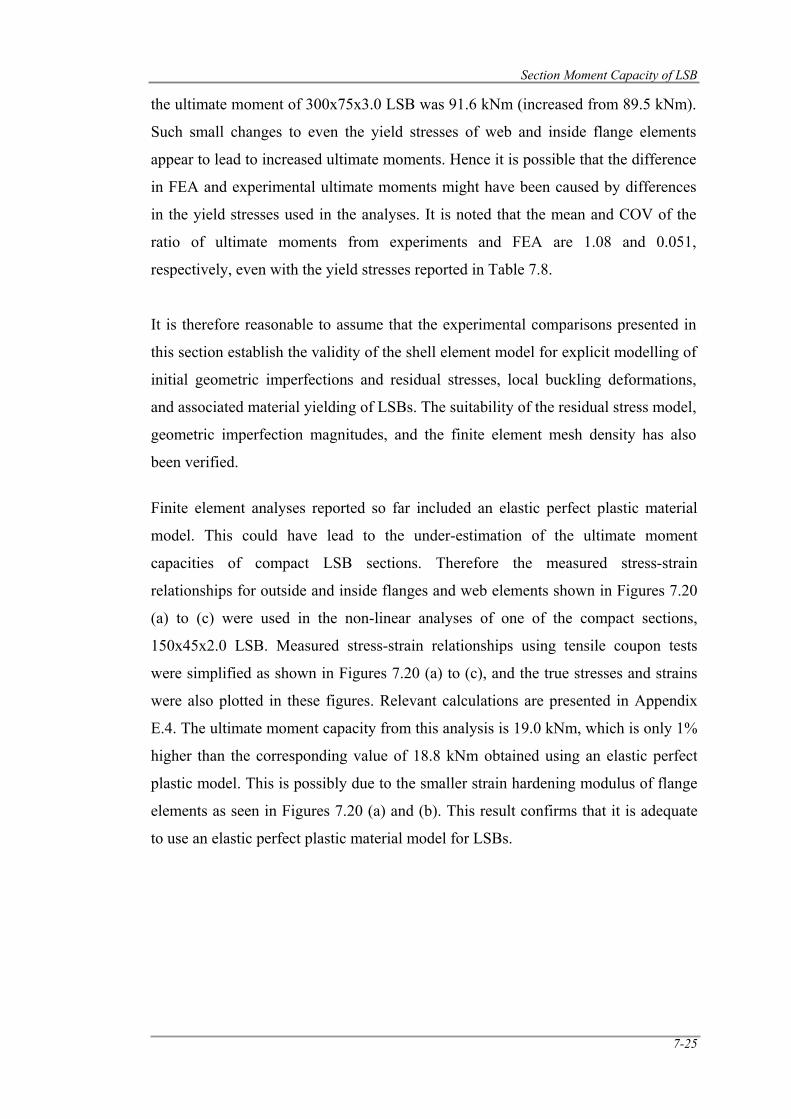
Section Moment Capacity of LSB
7-25
the ultimate moment of 300x75x3.0 LSB was 91.6 kNm (increased from 89.5 kNm).
Such small changes to even the yield stresses of web and inside flange elements
appear to lead to increased ultimate moments. Hence it is possible that the difference
in FEA and experimental ultimate moments might have been caused by differences
in the yield stresses used in the analyses. It is noted that the mean and COV of the
ratio of ultimate moments from experiments and FEA are 1.08 and 0.051,
respectively, even with the yield stresses reported in Table 7.8.
It is therefore reasonable to assume that the experimental comparisons presented in
this section establish the validity of the shell element model for explicit modelling of
initial geometric imperfections and residual stresses, local buckling deformations,
and associated material yielding of LSBs. The suitability of the residual stress model,
geometric imperfection magnitudes, and the finite element mesh density has also
been verified.
Finite element analyses reported so far included an elastic perfect plastic material
model. This could have lead to the under-estimation of the ultimate moment
capacities of compact LSB sections. Therefore the measured stress-strain
relationships for outside and inside flanges and web elements shown in Figures 7.20
(a) to (c) were used in the non-linear analyses of one of the compact sections,
150x45x2.0 LSB. Measured stress-strain relationships using tensile coupon tests
were simplified as shown in Figures 7.20 (a) to (c), and the true stresses and strains
were also plotted in these figures. Relevant calculations are presented in Appendix
E.4. The ultimate moment capacity from this analysis is 19.0 kNm, which is only 1%
higher than the corresponding value of 18.8 kNm obtained using an elastic perfect
plastic model. This is possibly due to the smaller strain hardening modulus of flange
elements as seen in Figures 7.20 (a) and (b). This result confirms that it is adequate
to use an elastic perfect plastic material model for LSBs.
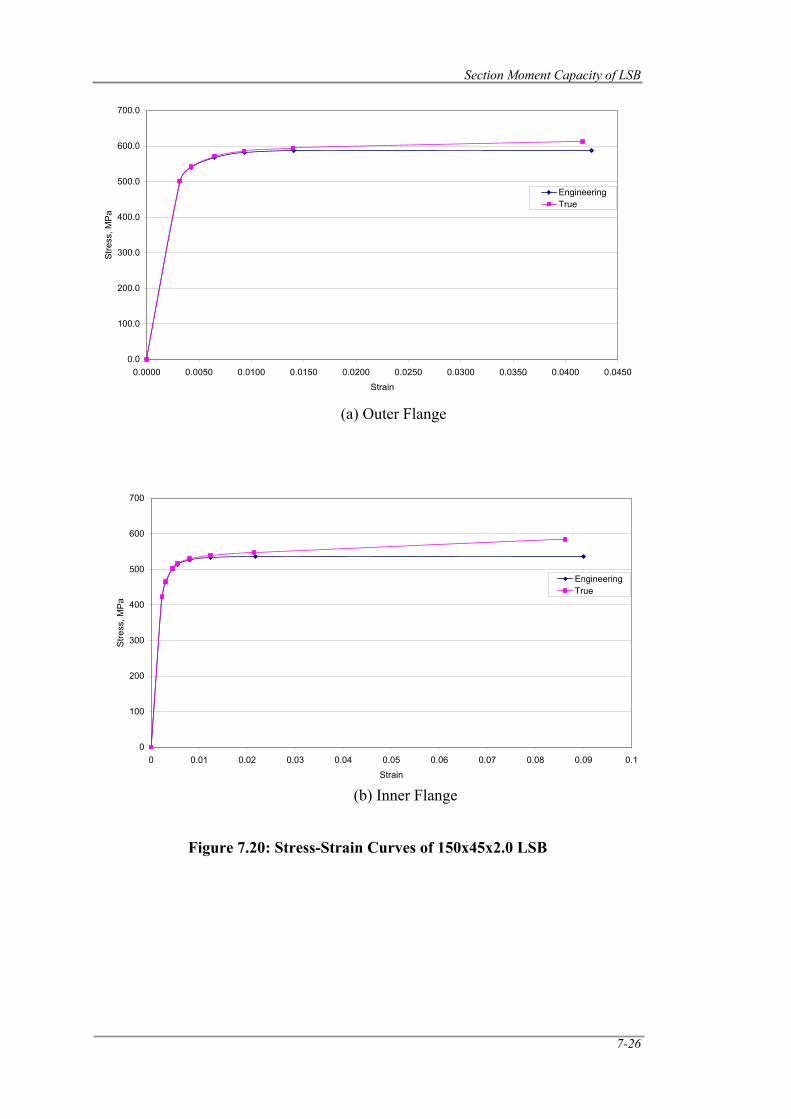
Section Moment Capacity of LSB
7-26
Figure 7.20: Stress-Strain Curves of 150x45x2.0 LSB
(a) Outer Flange
0.0
100.0
200.0
300.0
400.0
500.0
600.0
700.0
0.0000 0.0050 0.0100 0.0150 0.0200 0.0250 0.0300 0.0350 0.0400 0.0450
Strain
Stre
ss, M
Pa
EngineeringTrue
(b) Inner Flange
0
100
200
300
400
500
600
700
0 0.01 0.02 0.03 0.04 0.05 0.06 0.07 0.08 0.09 0.1
Strain
Stre
ss, M
Pa
EngineeringTrue
Section Moment Capacity of LSB
7-27
Figure 7.20: Stress-Strain Curves of 150x45x2.0 LSB
It is necessary to obtain the section moment capacities of all the available 13 LSBs
with nominal dimensions and yield stresses in order to investigate the inelastic
reserve capacity of each LSB. This can be achieved by using the non-linear analyses
based on the validated finite element model. Next section provides these details.
7.3.2 Finite Element Analyses of LSBs Subject to Local Buckling Effects
It was believed that the ideal finite element model used to develop the design curves
for LSBs subject to lateral buckling as provided in Chapter 5 can be used with
reduced spans to obtain the section moment capacities of LSBs. Therefore, an
attempt was made to develop the ideal finite element models of LSBs with nominal
dimensions and yield stresses excluding corners as for the ideal models of LSBs
subject to lateral buckling. However, in this case, the top and bottom flanges were
laterally restrained by using SPC 345 as for the finite element models used in this
chapter to resist any lateral buckling deformations.
Preliminary finite element analyses without residual stresses revealed that the ratios
of ultimate moment (Mu) from FEA to the section moment capacity Ms based on
AS/NZS 4600 (SA, 2005) did not exceed 1.06 even for compact LSBs although they
were about 1.15 from the experiments. If the residual stresses were included, the
0
100
200
300
400
500
600
0 0.01 0.02 0.03 0.04 0.05 0.06 0.07 0.08 0.09
Strain
Stre
ss, M
Pa
EngineeringTrue
(c) Web
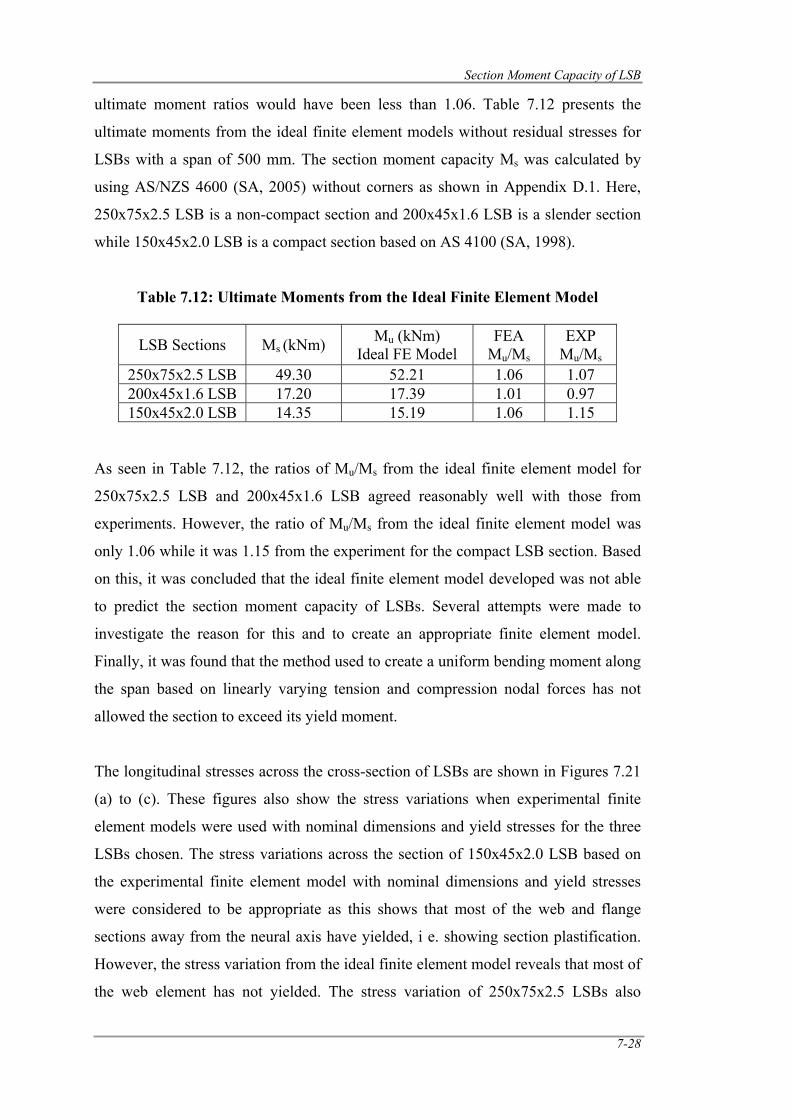
Section Moment Capacity of LSB
7-28
ultimate moment ratios would have been less than 1.06. Table 7.12 presents the
ultimate moments from the ideal finite element models without residual stresses for
LSBs with a span of 500 mm. The section moment capacity Ms was calculated by
using AS/NZS 4600 (SA, 2005) without corners as shown in Appendix D.1. Here,
250x75x2.5 LSB is a non-compact section and 200x45x1.6 LSB is a slender section
while 150x45x2.0 LSB is a compact section based on AS 4100 (SA, 1998).
Table 7.12: Ultimate Moments from the Ideal Finite Element Model
As seen in Table 7.12, the ratios of Mu/Ms from the ideal finite element model for
250x75x2.5 LSB and 200x45x1.6 LSB agreed reasonably well with those from
experiments. However, the ratio of Mu/Ms from the ideal finite element model was
only 1.06 while it was 1.15 from the experiment for the compact LSB section. Based
on this, it was concluded that the ideal finite element model developed was not able
to predict the section moment capacity of LSBs. Several attempts were made to
investigate the reason for this and to create an appropriate finite element model.
Finally, it was found that the method used to create a uniform bending moment along
the span based on linearly varying tension and compression nodal forces has not
allowed the section to exceed its yield moment.
The longitudinal stresses across the cross-section of LSBs are shown in Figures 7.21
(a) to (c). These figures also show the stress variations when experimental finite
element models were used with nominal dimensions and yield stresses for the three
LSBs chosen. The stress variations across the section of 150x45x2.0 LSB based on
the experimental finite element model with nominal dimensions and yield stresses
were considered to be appropriate as this shows that most of the web and flange
sections away from the neural axis have yielded, i e. showing section plastification.
However, the stress variation from the ideal finite element model reveals that most of
the web element has not yielded. The stress variation of 250x75x2.5 LSBs also
LSB Sections Ms (kNm) Mu (kNm) Ideal FE Model
FEA Mu/Ms
EXP Mu/Ms
250x75x2.5 LSB 49.30 52.21 1.06 1.07 200x45x1.6 LSB 17.20 17.39 1.01 0.97 150x45x2.0 LSB 14.35 15.19 1.06 1.15
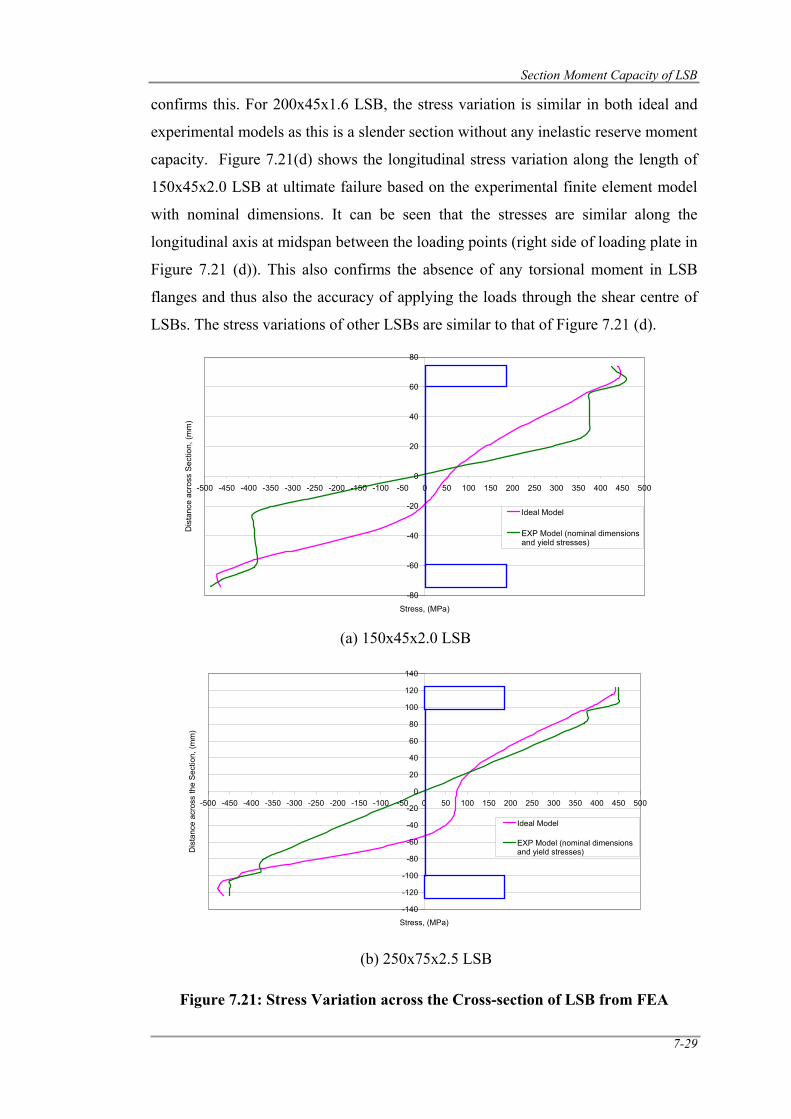
Section Moment Capacity of LSB
7-29
confirms this. For 200x45x1.6 LSB, the stress variation is similar in both ideal and
experimental models as this is a slender section without any inelastic reserve moment
capacity. Figure 7.21(d) shows the longitudinal stress variation along the length of
150x45x2.0 LSB at ultimate failure based on the experimental finite element model
with nominal dimensions. It can be seen that the stresses are similar along the
longitudinal axis at midspan between the loading points (right side of loading plate in
Figure 7.21 (d)). This also confirms the absence of any torsional moment in LSB
flanges and thus also the accuracy of applying the loads through the shear centre of
LSBs. The stress variations of other LSBs are similar to that of Figure 7.21 (d).
Figure 7.21: Stress Variation across the Cross-section of LSB from FEA
-80
-60
-40
-20
0
20
40
60
80
-500 -450 -400 -350 -300 -250 -200 -150 -100 -50 0 50 100 150 200 250 300 350 400 450 500
Stress, (MPa)
Dis
tanc
e ac
ross
Sec
tion,
(mm
)
Ideal Model
EXP Model (nominal dimensionsand yield stresses)
-140
-120
-100
-80
-60
-40
-20
0
20
40
60
80
100
120
140
-500 -450 -400 -350 -300 -250 -200 -150 -100 -50 0 50 100 150 200 250 300 350 400 450 500
Stress, (MPa)
Dis
tanc
e ac
ross
the
Sec
tion,
(mm
)
Ideal Model
EXP Model (nominal dimensionsand yield stresses)
(b) 250x75x2.5 LSB
(a) 150x45x2.0 LSB
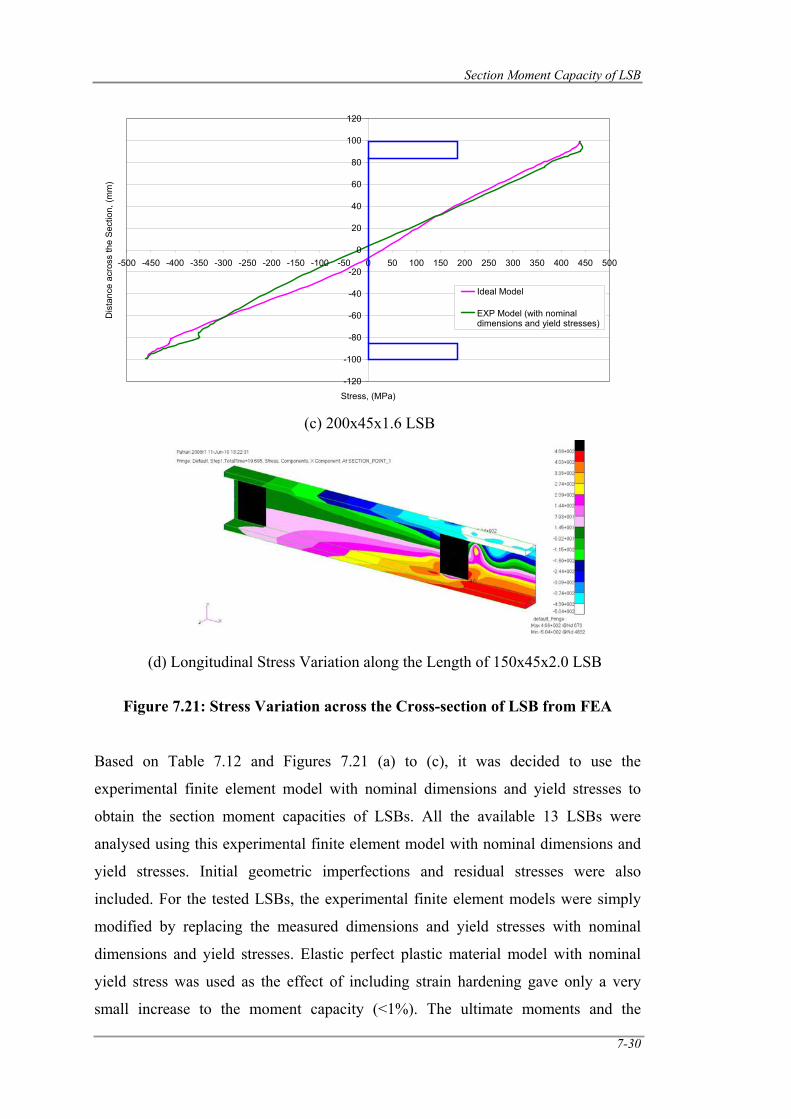
Section Moment Capacity of LSB
7-30
Figure 7.21: Stress Variation across the Cross-section of LSB from FEA
Based on Table 7.12 and Figures 7.21 (a) to (c), it was decided to use the
experimental finite element model with nominal dimensions and yield stresses to
obtain the section moment capacities of LSBs. All the available 13 LSBs were
analysed using this experimental finite element model with nominal dimensions and
yield stresses. Initial geometric imperfections and residual stresses were also
included. For the tested LSBs, the experimental finite element models were simply
modified by replacing the measured dimensions and yield stresses with nominal
dimensions and yield stresses. Elastic perfect plastic material model with nominal
yield stress was used as the effect of including strain hardening gave only a very
small increase to the moment capacity (<1%). The ultimate moments and the
-120
-100
-80
-60
-40
-20
0
20
40
60
80
100
120
-500 -450 -400 -350 -300 -250 -200 -150 -100 -50 0 50 100 150 200 250 300 350 400 450 500
Stress, (MPa)
Dis
tanc
e ac
ross
the
Sec
tion,
(mm
)
Ideal Model
EXP Model (with nominaldimensions and yield stresses)
(c) 200x45x1.6 LSB
(d) Longitudinal Stress Variation along the Length of 150x45x2.0 LSB
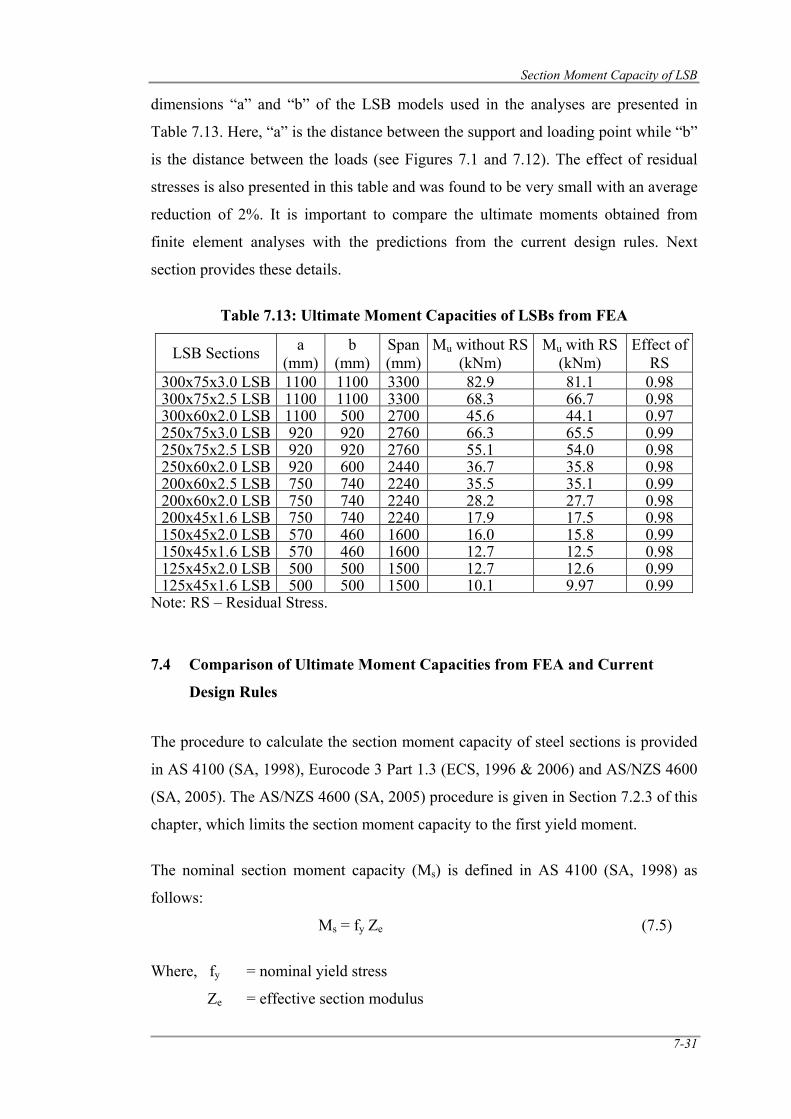
Section Moment Capacity of LSB
7-31
dimensions “a” and “b” of the LSB models used in the analyses are presented in
Table 7.13. Here, “a” is the distance between the support and loading point while “b”
is the distance between the loads (see Figures 7.1 and 7.12). The effect of residual
stresses is also presented in this table and was found to be very small with an average
reduction of 2%. It is important to compare the ultimate moments obtained from
finite element analyses with the predictions from the current design rules. Next
section provides these details.
Table 7.13: Ultimate Moment Capacities of LSBs from FEA
LSB Sections a (mm)
b (mm)
Span (mm)
Mu without RS(kNm)
Mu with RS (kNm)
Effect of RS
300x75x3.0 LSB 1100 1100 3300 82.9 81.1 0.98300x75x2.5 LSB 1100 1100 3300 68.3 66.7 0.98300x60x2.0 LSB 1100 500 2700 45.6 44.1 0.97250x75x3.0 LSB 920 920 2760 66.3 65.5 0.99250x75x2.5 LSB 920 920 2760 55.1 54.0 0.98250x60x2.0 LSB 920 600 2440 36.7 35.8 0.98200x60x2.5 LSB 750 740 2240 35.5 35.1 0.99200x60x2.0 LSB 750 740 2240 28.2 27.7 0.98200x45x1.6 LSB 750 740 2240 17.9 17.5 0.98150x45x2.0 LSB 570 460 1600 16.0 15.8 0.99150x45x1.6 LSB 570 460 1600 12.7 12.5 0.98125x45x2.0 LSB 500 500 1500 12.7 12.6 0.99125x45x1.6 LSB 500 500 1500 10.1 9.97 0.99
Note: RS – Residual Stress.
7.4 Comparison of Ultimate Moment Capacities from FEA and Current
Design Rules
The procedure to calculate the section moment capacity of steel sections is provided
in AS 4100 (SA, 1998), Eurocode 3 Part 1.3 (ECS, 1996 & 2006) and AS/NZS 4600
(SA, 2005). The AS/NZS 4600 (SA, 2005) procedure is given in Section 7.2.3 of this
chapter, which limits the section moment capacity to the first yield moment.
The nominal section moment capacity (Ms) is defined in AS 4100 (SA, 1998) as
follows:
Ms = fy Ze (7.5)
Where, fy = nominal yield stress
Ze = effective section modulus
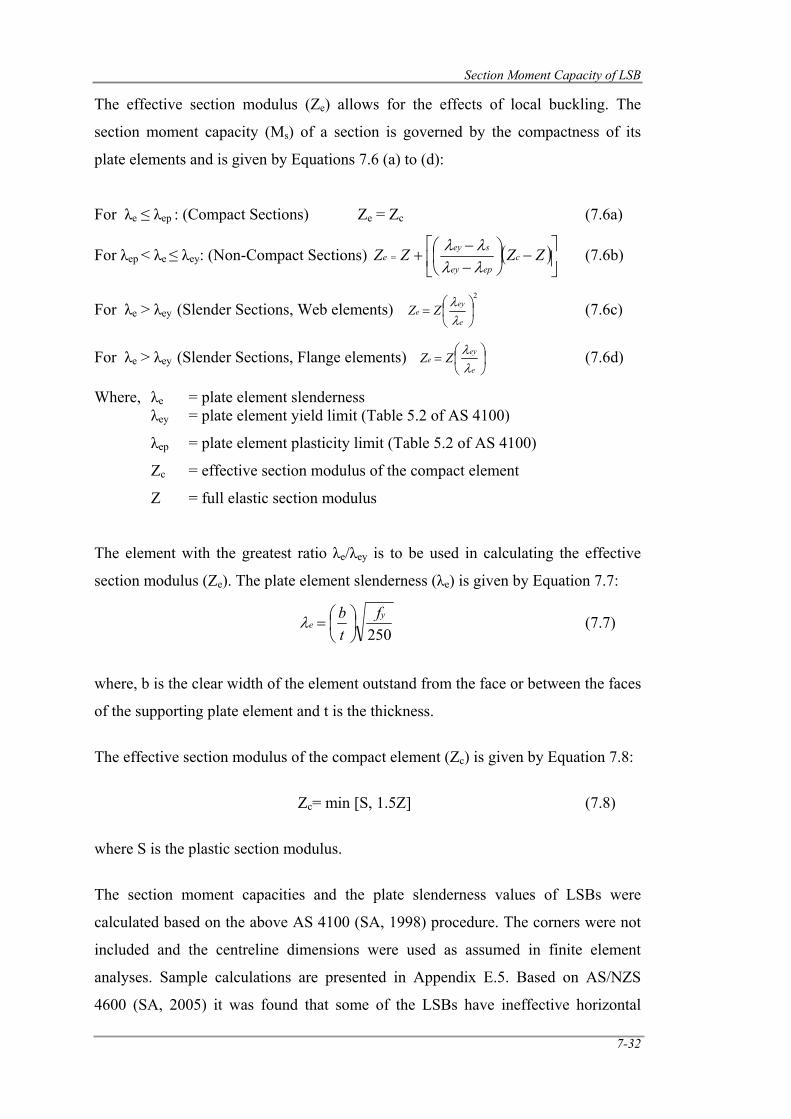
Section Moment Capacity of LSB
7-32
The effective section modulus (Ze) allows for the effects of local buckling. The
section moment capacity (Ms) of a section is governed by the compactness of its
plate elements and is given by Equations 7.6 (a) to (d):
For λe ≤ λep : (Compact Sections) Ze = Zc (7.6a)
For λep < λe ≤ λey: (Non-Compact Sections) ( )⎥⎦
⎤⎢⎣
⎡−⎟
⎠⎞
⎜⎝⎛
−−
+= ZZZZ cepey
seye
λλλλ (7.6b)
For λe > λey (Slender Sections, Web elements) 2
⎟⎠⎞
⎜⎝⎛=
e
eye ZZ
λλ (7.6c)
For λe > λey (Slender Sections, Flange elements) ⎟⎠⎞
⎜⎝⎛=
e
eye ZZ
λλ (7.6d)
Where, λe = plate element slenderness λey = plate element yield limit (Table 5.2 of AS 4100)
λep = plate element plasticity limit (Table 5.2 of AS 4100)
Zc = effective section modulus of the compact element
Z = full elastic section modulus
The element with the greatest ratio λe/λey is to be used in calculating the effective
section modulus (Ze). The plate element slenderness (λe) is given by Equation 7.7:
250
ye
ftb⎟⎠⎞
⎜⎝⎛=λ (7.7)
where, b is the clear width of the element outstand from the face or between the faces
of the supporting plate element and t is the thickness.
The effective section modulus of the compact element (Zc) is given by Equation 7.8:
Zc= min [S, 1.5Z] (7.8)
where S is the plastic section modulus.
The section moment capacities and the plate slenderness values of LSBs were
calculated based on the above AS 4100 (SA, 1998) procedure. The corners were not
included and the centreline dimensions were used as assumed in finite element
analyses. Sample calculations are presented in Appendix E.5. Based on AS/NZS
4600 (SA, 2005) it was found that some of the LSBs have ineffective horizontal
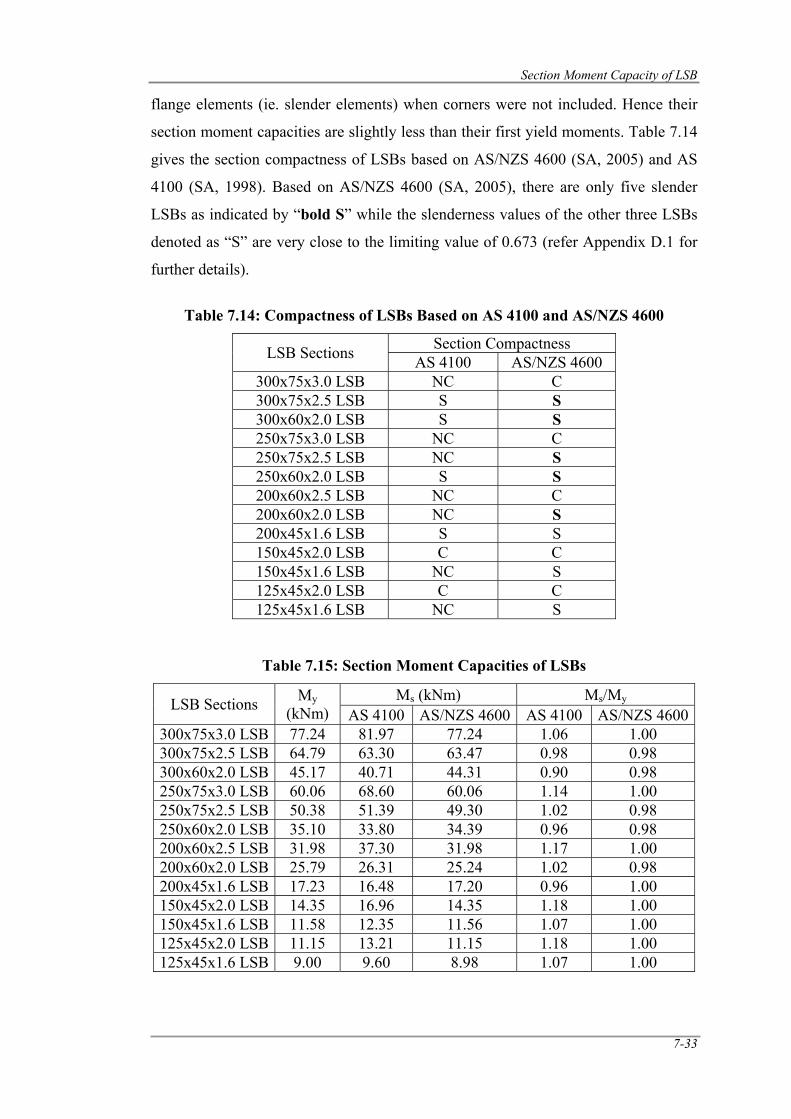
Section Moment Capacity of LSB
7-33
flange elements (ie. slender elements) when corners were not included. Hence their
section moment capacities are slightly less than their first yield moments. Table 7.14
gives the section compactness of LSBs based on AS/NZS 4600 (SA, 2005) and AS
4100 (SA, 1998). Based on AS/NZS 4600 (SA, 2005), there are only five slender
LSBs as indicated by “bold S” while the slenderness values of the other three LSBs
denoted as “S” are very close to the limiting value of 0.673 (refer Appendix D.1 for
further details).
Table 7.14: Compactness of LSBs Based on AS 4100 and AS/NZS 4600
LSB Sections Section Compactness AS 4100 AS/NZS 4600
300x75x3.0 LSB NC C 300x75x2.5 LSB S S 300x60x2.0 LSB S S 250x75x3.0 LSB NC C 250x75x2.5 LSB NC S 250x60x2.0 LSB S S 200x60x2.5 LSB NC C 200x60x2.0 LSB NC S 200x45x1.6 LSB S S 150x45x2.0 LSB C C 150x45x1.6 LSB NC S 125x45x2.0 LSB C C 125x45x1.6 LSB NC S
Table 7.15: Section Moment Capacities of LSBs
LSB Sections My (kNm)
Ms (kNm) Ms/My AS 4100 AS/NZS 4600 AS 4100 AS/NZS 4600
300x75x3.0 LSB 77.24 81.97 77.24 1.06 1.00 300x75x2.5 LSB 64.79 63.30 63.47 0.98 0.98 300x60x2.0 LSB 45.17 40.71 44.31 0.90 0.98 250x75x3.0 LSB 60.06 68.60 60.06 1.14 1.00 250x75x2.5 LSB 50.38 51.39 49.30 1.02 0.98 250x60x2.0 LSB 35.10 33.80 34.39 0.96 0.98 200x60x2.5 LSB 31.98 37.30 31.98 1.17 1.00 200x60x2.0 LSB 25.79 26.31 25.24 1.02 0.98 200x45x1.6 LSB 17.23 16.48 17.20 0.96 1.00 150x45x2.0 LSB 14.35 16.96 14.35 1.18 1.00 150x45x1.6 LSB 11.58 12.35 11.56 1.07 1.00 125x45x2.0 LSB 11.15 13.21 11.15 1.18 1.00 125x45x1.6 LSB 9.00 9.60 8.98 1.07 1.00
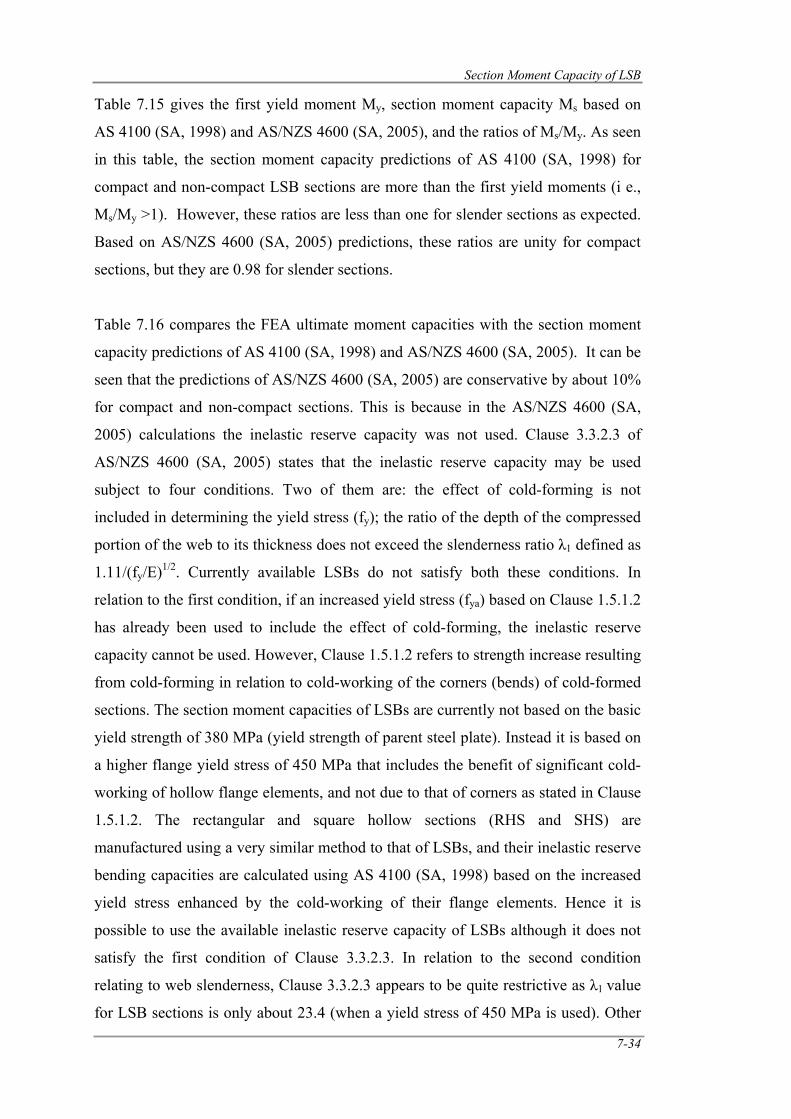
Section Moment Capacity of LSB
7-34
Table 7.15 gives the first yield moment My, section moment capacity Ms based on
AS 4100 (SA, 1998) and AS/NZS 4600 (SA, 2005), and the ratios of Ms/My. As seen
in this table, the section moment capacity predictions of AS 4100 (SA, 1998) for
compact and non-compact LSB sections are more than the first yield moments (i e.,
Ms/My >1). However, these ratios are less than one for slender sections as expected.
Based on AS/NZS 4600 (SA, 2005) predictions, these ratios are unity for compact
sections, but they are 0.98 for slender sections.
Table 7.16 compares the FEA ultimate moment capacities with the section moment
capacity predictions of AS 4100 (SA, 1998) and AS/NZS 4600 (SA, 2005). It can be
seen that the predictions of AS/NZS 4600 (SA, 2005) are conservative by about 10%
for compact and non-compact sections. This is because in the AS/NZS 4600 (SA,
2005) calculations the inelastic reserve capacity was not used. Clause 3.3.2.3 of
AS/NZS 4600 (SA, 2005) states that the inelastic reserve capacity may be used
subject to four conditions. Two of them are: the effect of cold-forming is not
included in determining the yield stress (fy); the ratio of the depth of the compressed
portion of the web to its thickness does not exceed the slenderness ratio λ1 defined as
1.11/(fy/E)1/2. Currently available LSBs do not satisfy both these conditions. In
relation to the first condition, if an increased yield stress (fya) based on Clause 1.5.1.2
has already been used to include the effect of cold-forming, the inelastic reserve
capacity cannot be used. However, Clause 1.5.1.2 refers to strength increase resulting
from cold-forming in relation to cold-working of the corners (bends) of cold-formed
sections. The section moment capacities of LSBs are currently not based on the basic
yield strength of 380 MPa (yield strength of parent steel plate). Instead it is based on
a higher flange yield stress of 450 MPa that includes the benefit of significant cold-
working of hollow flange elements, and not due to that of corners as stated in Clause
1.5.1.2. The rectangular and square hollow sections (RHS and SHS) are
manufactured using a very similar method to that of LSBs, and their inelastic reserve
bending capacities are calculated using AS 4100 (SA, 1998) based on the increased
yield stress enhanced by the cold-working of their flange elements. Hence it is
possible to use the available inelastic reserve capacity of LSBs although it does not
satisfy the first condition of Clause 3.3.2.3. In relation to the second condition
relating to web slenderness, Clause 3.3.2.3 appears to be quite restrictive as λ1 value
for LSB sections is only about 23.4 (when a yield stress of 450 MPa is used). Other
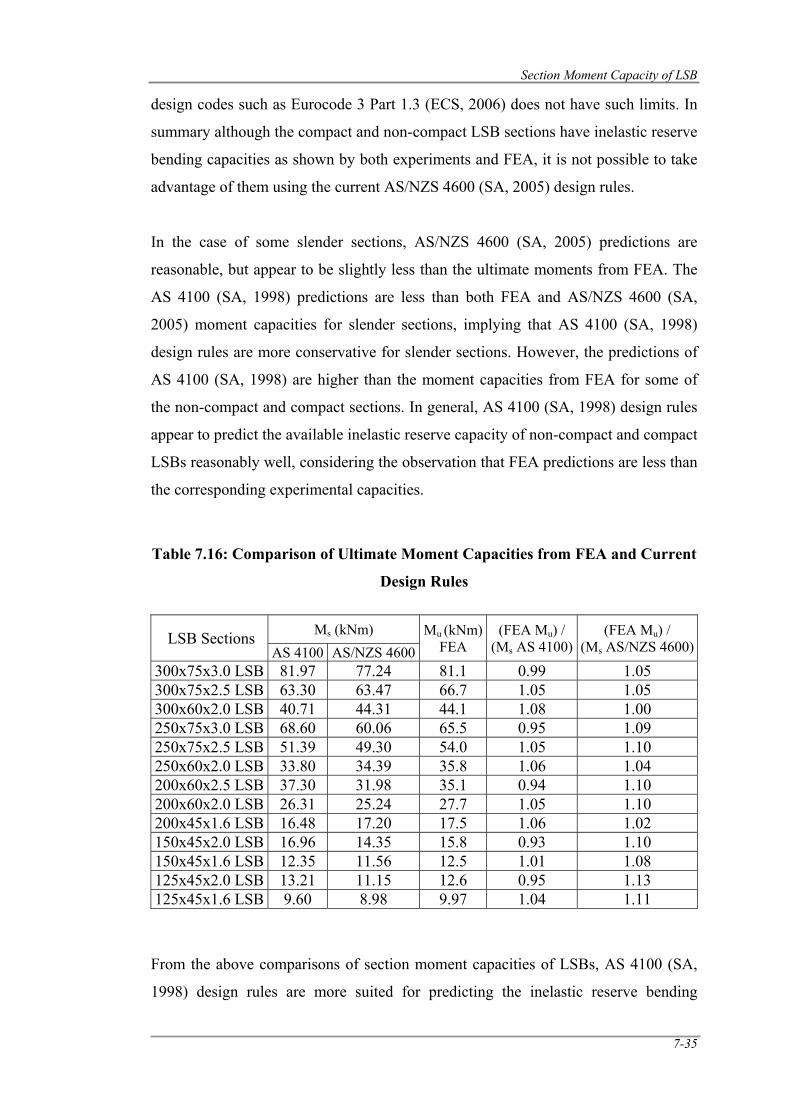
Section Moment Capacity of LSB
7-35
design codes such as Eurocode 3 Part 1.3 (ECS, 2006) does not have such limits. In
summary although the compact and non-compact LSB sections have inelastic reserve
bending capacities as shown by both experiments and FEA, it is not possible to take
advantage of them using the current AS/NZS 4600 (SA, 2005) design rules.
In the case of some slender sections, AS/NZS 4600 (SA, 2005) predictions are
reasonable, but appear to be slightly less than the ultimate moments from FEA. The
AS 4100 (SA, 1998) predictions are less than both FEA and AS/NZS 4600 (SA,
2005) moment capacities for slender sections, implying that AS 4100 (SA, 1998)
design rules are more conservative for slender sections. However, the predictions of
AS 4100 (SA, 1998) are higher than the moment capacities from FEA for some of
the non-compact and compact sections. In general, AS 4100 (SA, 1998) design rules
appear to predict the available inelastic reserve capacity of non-compact and compact
LSBs reasonably well, considering the observation that FEA predictions are less than
the corresponding experimental capacities.
Table 7.16: Comparison of Ultimate Moment Capacities from FEA and Current
Design Rules
LSB Sections Ms (kNm) Mu (kNm)FEA
(FEA Mu) / (Ms AS 4100)
(FEA Mu) / (Ms AS/NZS 4600)AS 4100 AS/NZS 4600
300x75x3.0 LSB 81.97 77.24 81.1 0.99 1.05 300x75x2.5 LSB 63.30 63.47 66.7 1.05 1.05 300x60x2.0 LSB 40.71 44.31 44.1 1.08 1.00 250x75x3.0 LSB 68.60 60.06 65.5 0.95 1.09 250x75x2.5 LSB 51.39 49.30 54.0 1.05 1.10 250x60x2.0 LSB 33.80 34.39 35.8 1.06 1.04 200x60x2.5 LSB 37.30 31.98 35.1 0.94 1.10 200x60x2.0 LSB 26.31 25.24 27.7 1.05 1.10 200x45x1.6 LSB 16.48 17.20 17.5 1.06 1.02 150x45x2.0 LSB 16.96 14.35 15.8 0.93 1.10 150x45x1.6 LSB 12.35 11.56 12.5 1.01 1.08 125x45x2.0 LSB 13.21 11.15 12.6 0.95 1.13 125x45x1.6 LSB 9.60 8.98 9.97 1.04 1.11
From the above comparisons of section moment capacities of LSBs, AS 4100 (SA,
1998) design rules are more suited for predicting the inelastic reserve bending
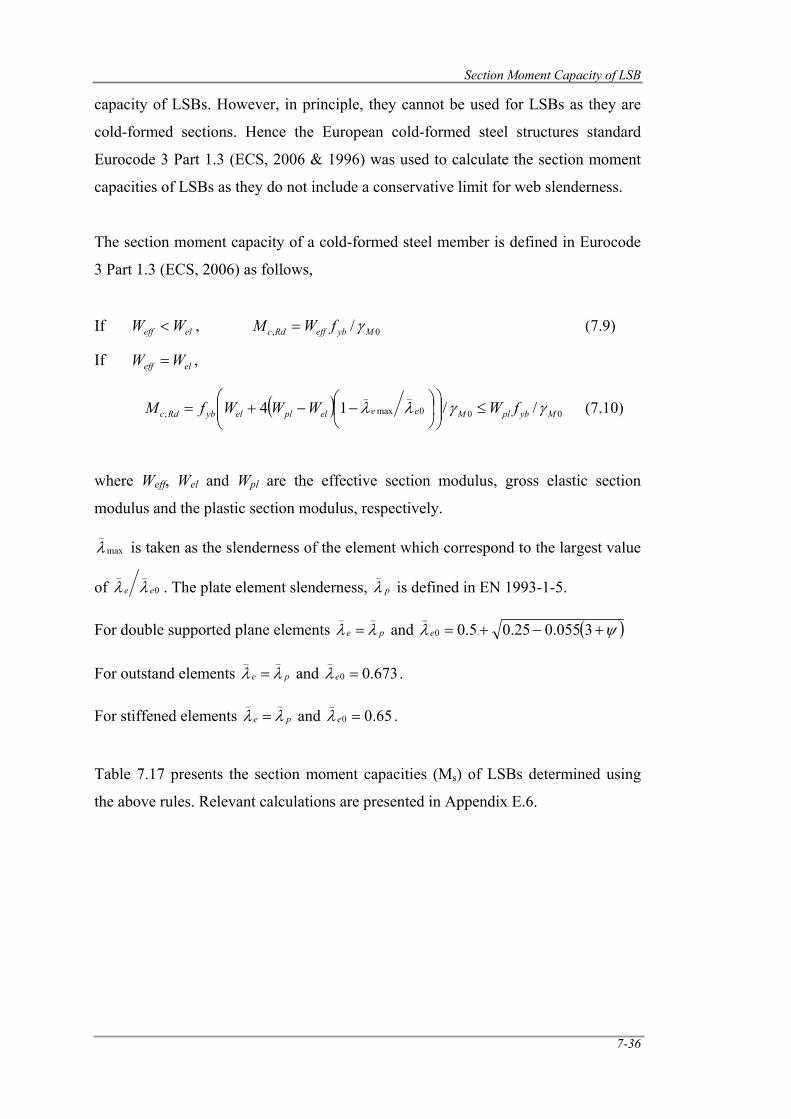
Section Moment Capacity of LSB
7-36
capacity of LSBs. However, in principle, they cannot be used for LSBs as they are
cold-formed sections. Hence the European cold-formed steel structures standard
Eurocode 3 Part 1.3 (ECS, 2006 & 1996) was used to calculate the section moment
capacities of LSBs as they do not include a conservative limit for web slenderness.
The section moment capacity of a cold-formed steel member is defined in Eurocode
3 Part 1.3 (ECS, 2006) as follows,
If eleff WW < , 0, / MybeffRdc fWM γ= (7.9)
If eleff WW = ,
( ) 00
_
max
_
, /14 MeeelplelybRdc WWWfM γλλ ⎟⎟⎠
⎞⎜⎜⎝
⎛⎟⎠⎞
⎜⎝⎛ −−+= 0/ Mybpl fW γ≤ (7.10)
where Weff, Wel and Wpl are the effective section modulus, gross elastic section
modulus and the plastic section modulus, respectively.
max
_
λ is taken as the slenderness of the element which correspond to the largest value
of 0
__
ee λλ . The plate element slenderness, p
_
λ is defined in EN 1993-1-5.
For double supported plane elements pe
__
λλ = and ( )ψλ +−+= 3055.025.05.00
_
e
For outstand elements pe
__
λλ = and 673.00
_
=eλ .
For stiffened elements pe
__
λλ = and 65.00
_
=eλ .
Table 7.17 presents the section moment capacities (Ms) of LSBs determined using
the above rules. Relevant calculations are presented in Appendix E.6.
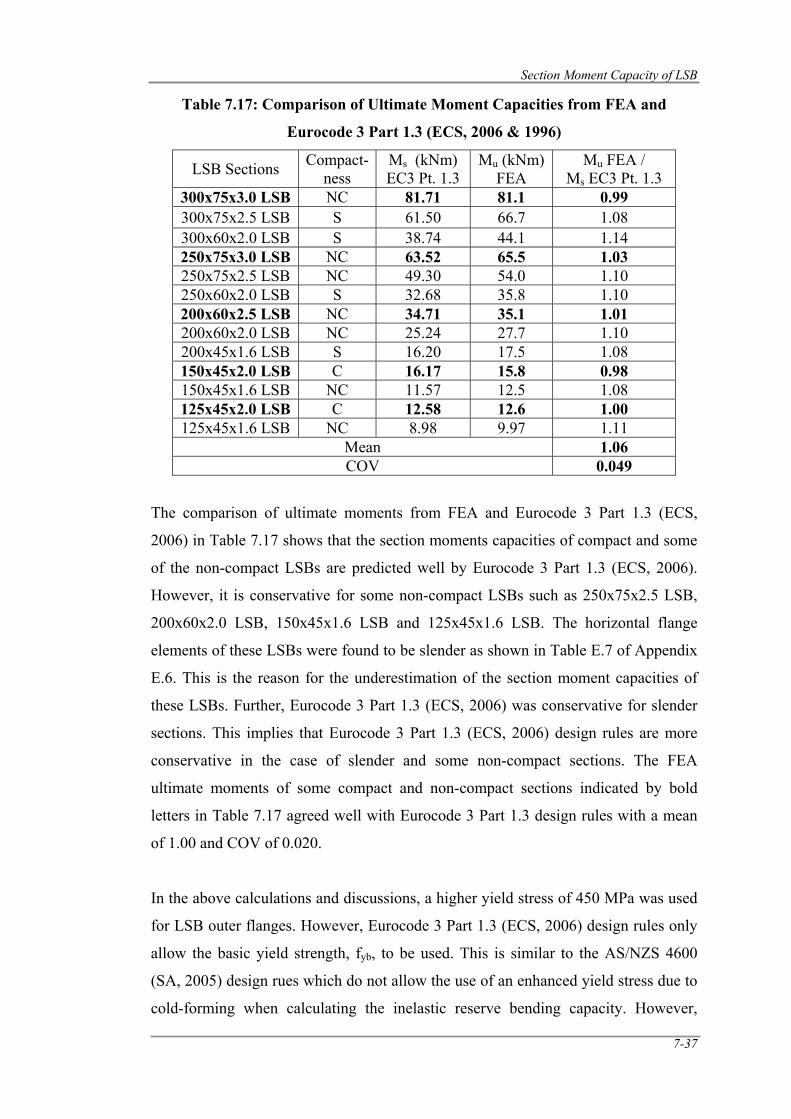
Section Moment Capacity of LSB
7-37
Table 7.17: Comparison of Ultimate Moment Capacities from FEA and
Eurocode 3 Part 1.3 (ECS, 2006 & 1996)
LSB Sections Compact-ness
Ms (kNm) EC3 Pt. 1.3
Mu (kNm) FEA
Mu FEA / Ms EC3 Pt. 1.3
300x75x3.0 LSB NC 81.71 81.1 0.99 300x75x2.5 LSB S 61.50 66.7 1.08 300x60x2.0 LSB S 38.74 44.1 1.14 250x75x3.0 LSB NC 63.52 65.5 1.03 250x75x2.5 LSB NC 49.30 54.0 1.10 250x60x2.0 LSB S 32.68 35.8 1.10 200x60x2.5 LSB NC 34.71 35.1 1.01 200x60x2.0 LSB NC 25.24 27.7 1.10 200x45x1.6 LSB S 16.20 17.5 1.08 150x45x2.0 LSB C 16.17 15.8 0.98 150x45x1.6 LSB NC 11.57 12.5 1.08 125x45x2.0 LSB C 12.58 12.6 1.00 125x45x1.6 LSB NC 8.98 9.97 1.11
Mean 1.06 COV 0.049
The comparison of ultimate moments from FEA and Eurocode 3 Part 1.3 (ECS,
2006) in Table 7.17 shows that the section moments capacities of compact and some
of the non-compact LSBs are predicted well by Eurocode 3 Part 1.3 (ECS, 2006).
However, it is conservative for some non-compact LSBs such as 250x75x2.5 LSB,
200x60x2.0 LSB, 150x45x1.6 LSB and 125x45x1.6 LSB. The horizontal flange
elements of these LSBs were found to be slender as shown in Table E.7 of Appendix
E.6. This is the reason for the underestimation of the section moment capacities of
these LSBs. Further, Eurocode 3 Part 1.3 (ECS, 2006) was conservative for slender
sections. This implies that Eurocode 3 Part 1.3 (ECS, 2006) design rules are more
conservative in the case of slender and some non-compact sections. The FEA
ultimate moments of some compact and non-compact sections indicated by bold
letters in Table 7.17 agreed well with Eurocode 3 Part 1.3 design rules with a mean
of 1.00 and COV of 0.020.
In the above calculations and discussions, a higher yield stress of 450 MPa was used
for LSB outer flanges. However, Eurocode 3 Part 1.3 (ECS, 2006) design rules only
allow the basic yield strength, fyb, to be used. This is similar to the AS/NZS 4600
(SA, 2005) design rues which do not allow the use of an enhanced yield stress due to
cold-forming when calculating the inelastic reserve bending capacity. However,
Section Moment Capacity of LSB
7-38
based on the reasons discussed earlier by comparing LSBs with RHS and SHS
sections, it is proposed that Eurocode 3 Part 1.3 (ECS, 2006) design rules are used to
predict the inelastic reserve capacities of compact and non-compact LSB sections
using the enhanced yield stress of flanges (450 MPa).
7.5 Comparison of Ultimate Moment Capacities from FEA and Other
Proposed Design Rules
The inelastic reserve bending strength of cold-formed steel sections was first
investigated by Reck et. al (1975). Their test results showed that cold-formed steel
sections did not achieve higher inelastic bending capacities like the hot-rolled
sections due to the inability of cold-formed sections to sustain high compressive
strains. The ratio of the compressive strain to yield strain (Cy) was found to be a
function of the compressive flange’s width to thickness ratio (b/t). Yener and Pekoz
(1983, 1985) developed design rules to determine the inelastic bending capacity
based on the recommended ratio of compressive strain to yield strain (Cy) as a
function of the b/t ratio of compression elements. These design rules are adopted in
the NAS (AISI, 2004) and AS/NZS 4600 (SA, 2005). Recently Shifferaw and
Schafer (2008) investigated the inelastic bending capacity of conventional open cold-
formed steel members such as C and Z-section beams and proposed suitable design
rules under the direct strength method format. They state that inelastic reserve
bending capacity is available in cold-formed steel beams.
AS/NZS 4600 (SA, 2005) and NAS (AISI, 2004) design rules allow the calculation
of inelastic bending capacity based on the calculated maximum compressive strains.
However, in the last section, the inelastic reserve bending capacities of LSBs were
not calculated based on these rules, as they did not meet the two conditions including
the limit on web slenderness. In their report, Shifferaw and Schafer (2008) state that
the presence of reduced inelastic bending capacity in cold-formed steel beams in
comparison to hot-rolled steel beams is due to higher web to flange area,
unsymmetric sections resulting in first yield occurring in the tension flange and the
inability of cold-formed steel sections to sustain high compressive strains. However,
LSBs despite being cold-formed, do not have the above shortcomings as they are not
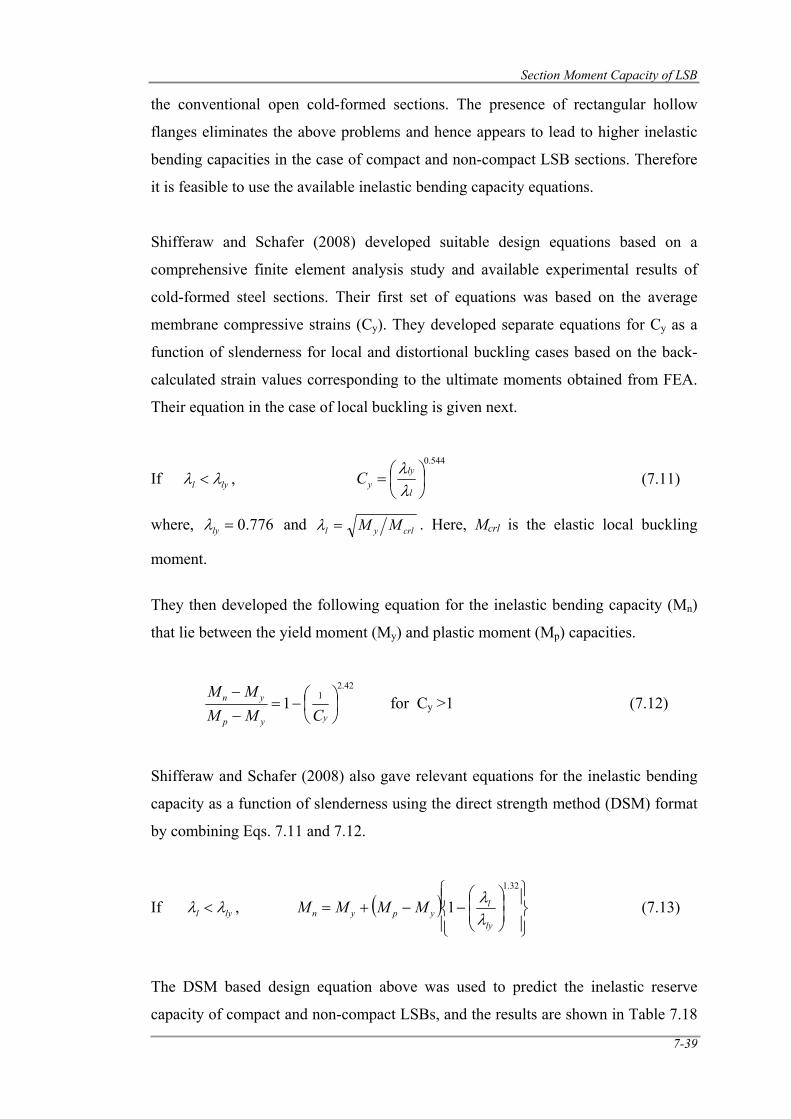
Section Moment Capacity of LSB
7-39
the conventional open cold-formed sections. The presence of rectangular hollow
flanges eliminates the above problems and hence appears to lead to higher inelastic
bending capacities in the case of compact and non-compact LSB sections. Therefore
it is feasible to use the available inelastic bending capacity equations.
Shifferaw and Schafer (2008) developed suitable design equations based on a
comprehensive finite element analysis study and available experimental results of
cold-formed steel sections. Their first set of equations was based on the average
membrane compressive strains (Cy). They developed separate equations for Cy as a
function of slenderness for local and distortional buckling cases based on the back-
calculated strain values corresponding to the ultimate moments obtained from FEA.
Their equation in the case of local buckling is given next.
If lyl λλ < , 544.0
⎟⎠⎞
⎜⎝⎛=
l
lyyC
λλ (7.11)
where, 776.0=lyλ and crlyl MM=λ . Here, Mcrl is the elastic local buckling
moment.
They then developed the following equation for the inelastic bending capacity (Mn)
that lie between the yield moment (My) and plastic moment (Mp) capacities.
42.2
11 ⎟⎠⎞
⎜⎝⎛−=
−−
yyp
yn
CMMMM
for Cy >1 (7.12)
Shifferaw and Schafer (2008) also gave relevant equations for the inelastic bending
capacity as a function of slenderness using the direct strength method (DSM) format
by combining Eqs. 7.11 and 7.12.
If lyl λλ < , ( )⎪⎭
⎪⎬⎫
⎪⎩
⎪⎨⎧
⎟⎟⎠
⎞⎜⎜⎝
⎛−−+=
32.1
1ly
lypyn MMMM
λλ (7.13)
The DSM based design equation above was used to predict the inelastic reserve
capacity of compact and non-compact LSBs, and the results are shown in Table 7.18
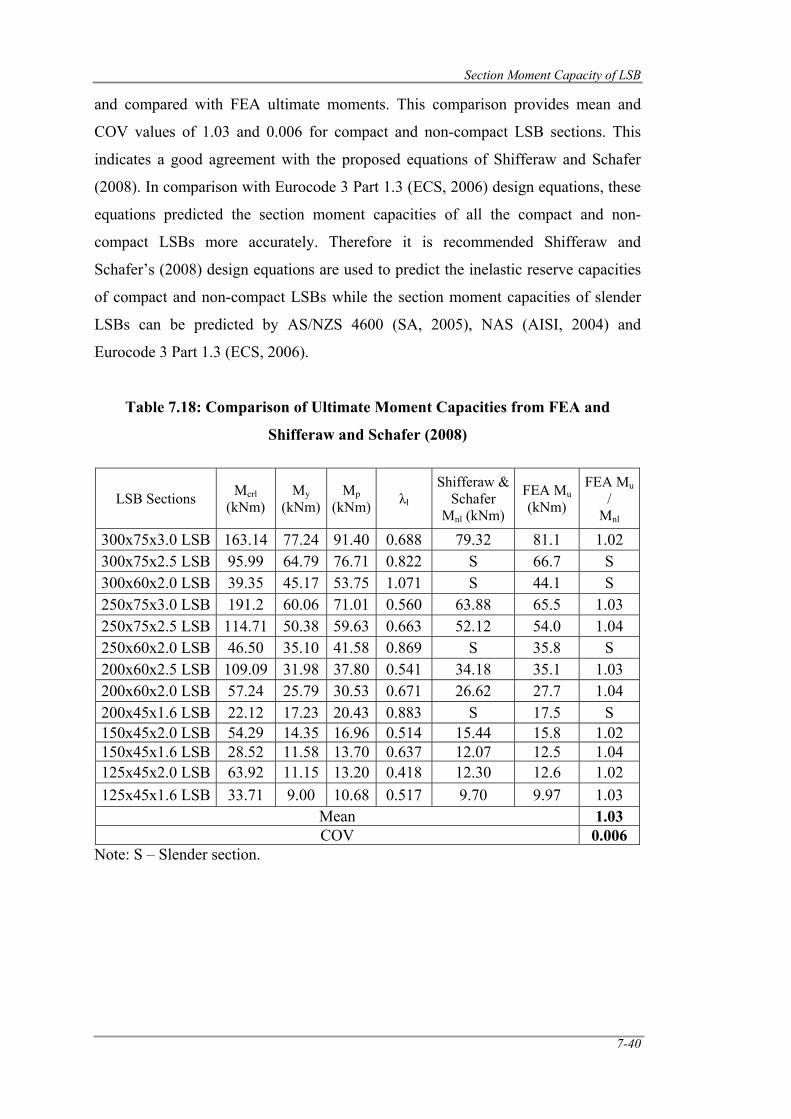
Section Moment Capacity of LSB
7-40
and compared with FEA ultimate moments. This comparison provides mean and
COV values of 1.03 and 0.006 for compact and non-compact LSB sections. This
indicates a good agreement with the proposed equations of Shifferaw and Schafer
(2008). In comparison with Eurocode 3 Part 1.3 (ECS, 2006) design equations, these
equations predicted the section moment capacities of all the compact and non-
compact LSBs more accurately. Therefore it is recommended Shifferaw and
Schafer’s (2008) design equations are used to predict the inelastic reserve capacities
of compact and non-compact LSBs while the section moment capacities of slender
LSBs can be predicted by AS/NZS 4600 (SA, 2005), NAS (AISI, 2004) and
Eurocode 3 Part 1.3 (ECS, 2006).
Table 7.18: Comparison of Ultimate Moment Capacities from FEA and
Shifferaw and Schafer (2008)
LSB Sections Mcrl (kNm)
My (kNm)
Mp (kNm) λl
Shifferaw & Schafer
Mnl (kNm)
FEA Mu (kNm)
FEA Mu /
Mnl
300x75x3.0 LSB 163.14 77.24 91.40 0.688 79.32 81.1 1.02 300x75x2.5 LSB 95.99 64.79 76.71 0.822 S 66.7 S 300x60x2.0 LSB 39.35 45.17 53.75 1.071 S 44.1 S 250x75x3.0 LSB 191.2 60.06 71.01 0.560 63.88 65.5 1.03 250x75x2.5 LSB 114.71 50.38 59.63 0.663 52.12 54.0 1.04 250x60x2.0 LSB 46.50 35.10 41.58 0.869 S 35.8 S 200x60x2.5 LSB 109.09 31.98 37.80 0.541 34.18 35.1 1.03 200x60x2.0 LSB 57.24 25.79 30.53 0.671 26.62 27.7 1.04 200x45x1.6 LSB 22.12 17.23 20.43 0.883 S 17.5 S 150x45x2.0 LSB 54.29 14.35 16.96 0.514 15.44 15.8 1.02 150x45x1.6 LSB 28.52 11.58 13.70 0.637 12.07 12.5 1.04 125x45x2.0 LSB 63.92 11.15 13.20 0.418 12.30 12.6 1.02 125x45x1.6 LSB 33.71 9.00 10.68 0.517 9.70 9.97 1.03
Mean 1.03 COV 0.006
Note: S – Slender section.
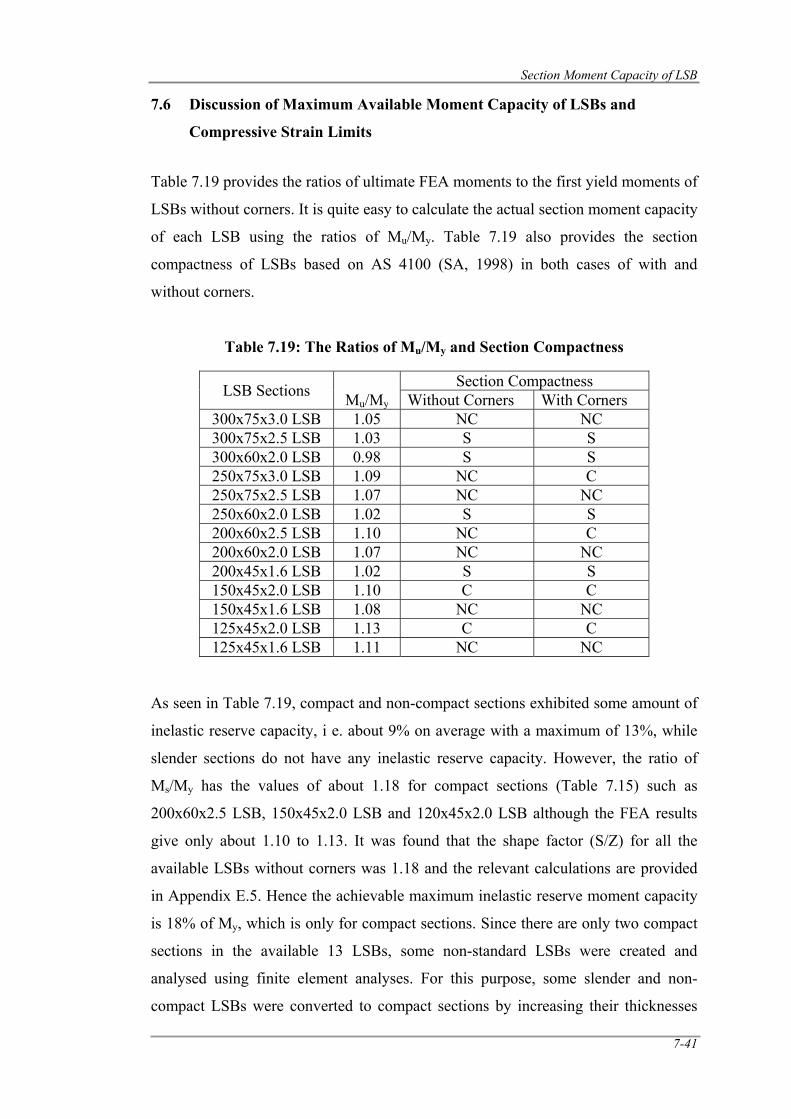
Section Moment Capacity of LSB
7-41
7.6 Discussion of Maximum Available Moment Capacity of LSBs and
Compressive Strain Limits
Table 7.19 provides the ratios of ultimate FEA moments to the first yield moments of
LSBs without corners. It is quite easy to calculate the actual section moment capacity
of each LSB using the ratios of Mu/My. Table 7.19 also provides the section
compactness of LSBs based on AS 4100 (SA, 1998) in both cases of with and
without corners.
Table 7.19: The Ratios of Mu/My and Section Compactness
LSB Sections Mu/My Section Compactness
Without Corners With Corners 300x75x3.0 LSB 1.05 NC NC 300x75x2.5 LSB 1.03 S S 300x60x2.0 LSB 0.98 S S 250x75x3.0 LSB 1.09 NC C 250x75x2.5 LSB 1.07 NC NC 250x60x2.0 LSB 1.02 S S 200x60x2.5 LSB 1.10 NC C 200x60x2.0 LSB 1.07 NC NC 200x45x1.6 LSB 1.02 S S 150x45x2.0 LSB 1.10 C C 150x45x1.6 LSB 1.08 NC NC 125x45x2.0 LSB 1.13 C C 125x45x1.6 LSB 1.11 NC NC
As seen in Table 7.19, compact and non-compact sections exhibited some amount of
inelastic reserve capacity, i e. about 9% on average with a maximum of 13%, while
slender sections do not have any inelastic reserve capacity. However, the ratio of
Ms/My has the values of about 1.18 for compact sections (Table 7.15) such as
200x60x2.5 LSB, 150x45x2.0 LSB and 120x45x2.0 LSB although the FEA results
give only about 1.10 to 1.13. It was found that the shape factor (S/Z) for all the
available LSBs without corners was 1.18 and the relevant calculations are provided
in Appendix E.5. Hence the achievable maximum inelastic reserve moment capacity
is 18% of My, which is only for compact sections. Since there are only two compact
sections in the available 13 LSBs, some non-standard LSBs were created and
analysed using finite element analyses. For this purpose, some slender and non-
compact LSBs were converted to compact sections by increasing their thicknesses
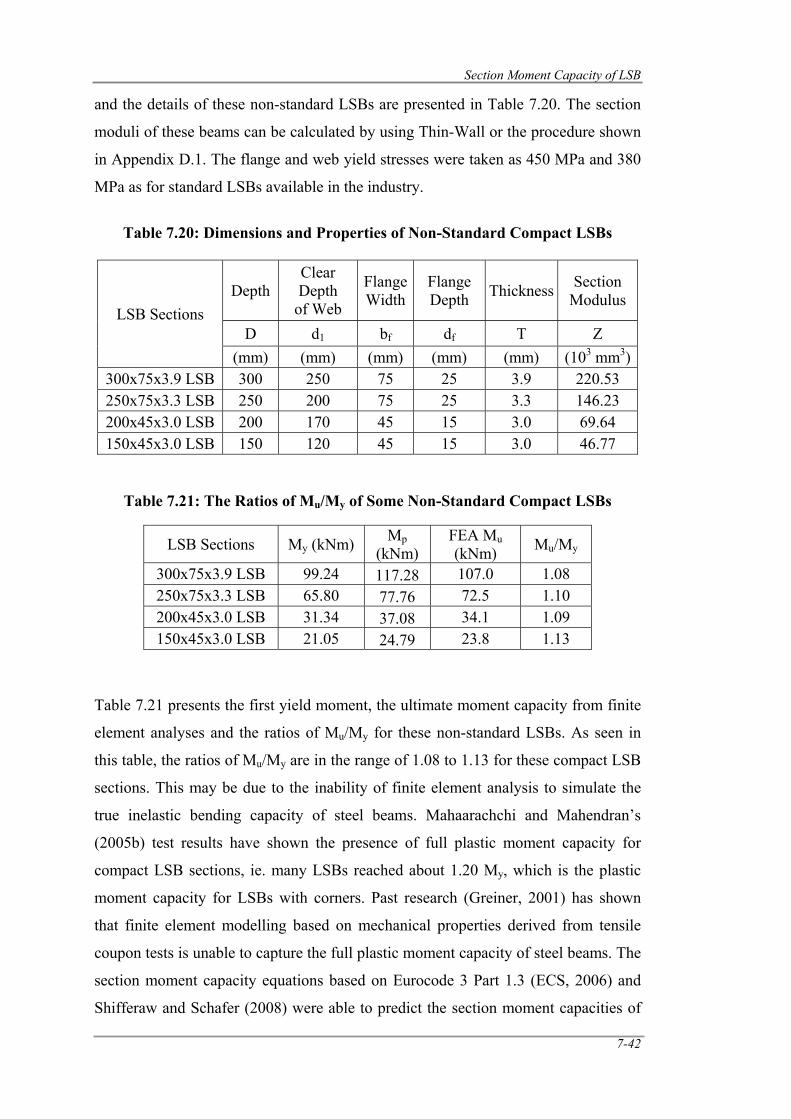
Section Moment Capacity of LSB
7-42
and the details of these non-standard LSBs are presented in Table 7.20. The section
moduli of these beams can be calculated by using Thin-Wall or the procedure shown
in Appendix D.1. The flange and web yield stresses were taken as 450 MPa and 380
MPa as for standard LSBs available in the industry.
Table 7.20: Dimensions and Properties of Non-Standard Compact LSBs
LSB Sections Depth
Clear Depth
of Web
Flange Width
Flange Depth Thickness Section
Modulus
D d1 bf df T Z (mm) (mm) (mm) (mm) (mm) (103 mm3)
300x75x3.9 LSB 300 250 75 25 3.9 220.53 250x75x3.3 LSB 250 200 75 25 3.3 146.23 200x45x3.0 LSB 200 170 45 15 3.0 69.64 150x45x3.0 LSB 150 120 45 15 3.0 46.77
Table 7.21: The Ratios of Mu/My of Some Non-Standard Compact LSBs
LSB Sections My (kNm) Mp (kNm)
FEA Mu (kNm) Mu/My
300x75x3.9 LSB 99.24 117.28 107.0 1.08 250x75x3.3 LSB 65.80 77.76 72.5 1.10 200x45x3.0 LSB 31.34 37.08 34.1 1.09 150x45x3.0 LSB 21.05 24.79 23.8 1.13
Table 7.21 presents the first yield moment, the ultimate moment capacity from finite
element analyses and the ratios of Mu/My for these non-standard LSBs. As seen in
this table, the ratios of Mu/My are in the range of 1.08 to 1.13 for these compact LSB
sections. This may be due to the inability of finite element analysis to simulate the
true inelastic bending capacity of steel beams. Mahaarachchi and Mahendran’s
(2005b) test results have shown the presence of full plastic moment capacity for
compact LSB sections, ie. many LSBs reached about 1.20 My, which is the plastic
moment capacity for LSBs with corners. Past research (Greiner, 2001) has shown
that finite element modelling based on mechanical properties derived from tensile
coupon tests is unable to capture the full plastic moment capacity of steel beams. The
section moment capacity equations based on Eurocode 3 Part 1.3 (ECS, 2006) and
Shifferaw and Schafer (2008) were able to predict the section moment capacities of
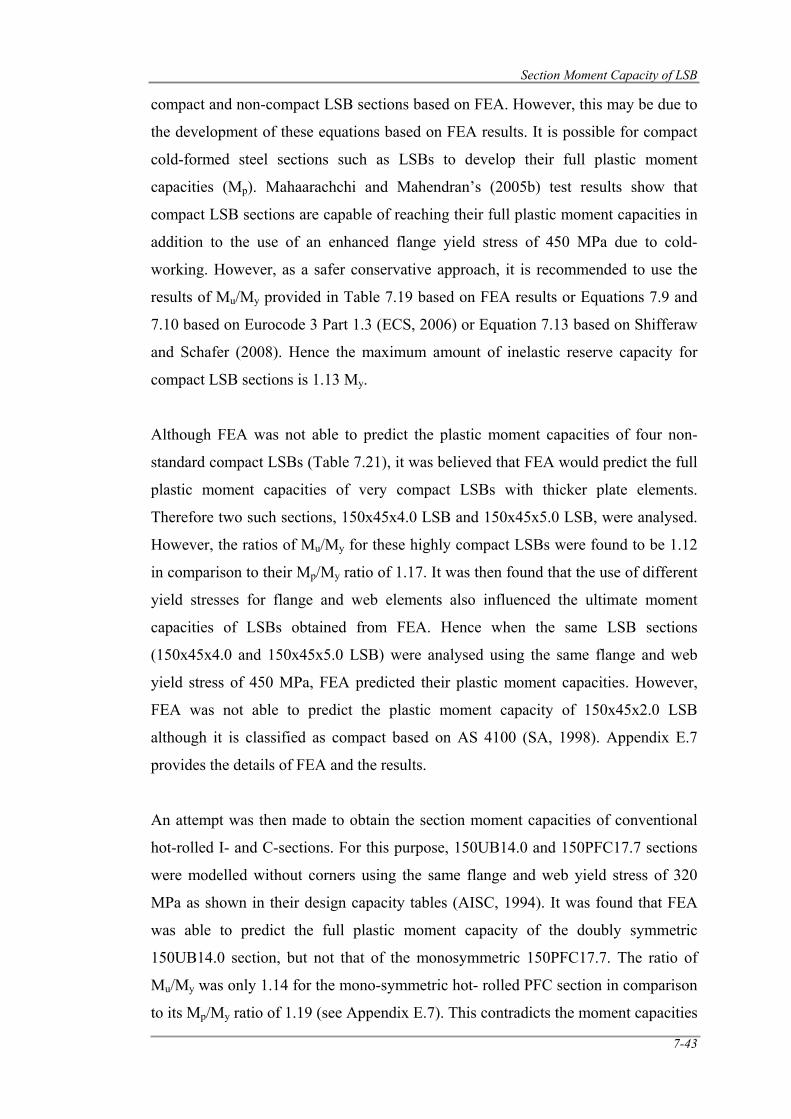
Section Moment Capacity of LSB
7-43
compact and non-compact LSB sections based on FEA. However, this may be due to
the development of these equations based on FEA results. It is possible for compact
cold-formed steel sections such as LSBs to develop their full plastic moment
capacities (Mp). Mahaarachchi and Mahendran’s (2005b) test results show that
compact LSB sections are capable of reaching their full plastic moment capacities in
addition to the use of an enhanced flange yield stress of 450 MPa due to cold-
working. However, as a safer conservative approach, it is recommended to use the
results of Mu/My provided in Table 7.19 based on FEA results or Equations 7.9 and
7.10 based on Eurocode 3 Part 1.3 (ECS, 2006) or Equation 7.13 based on Shifferaw
and Schafer (2008). Hence the maximum amount of inelastic reserve capacity for
compact LSB sections is 1.13 My.
Although FEA was not able to predict the plastic moment capacities of four non-
standard compact LSBs (Table 7.21), it was believed that FEA would predict the full
plastic moment capacities of very compact LSBs with thicker plate elements.
Therefore two such sections, 150x45x4.0 LSB and 150x45x5.0 LSB, were analysed.
However, the ratios of Mu/My for these highly compact LSBs were found to be 1.12
in comparison to their Mp/My ratio of 1.17. It was then found that the use of different
yield stresses for flange and web elements also influenced the ultimate moment
capacities of LSBs obtained from FEA. Hence when the same LSB sections
(150x45x4.0 and 150x45x5.0 LSB) were analysed using the same flange and web
yield stress of 450 MPa, FEA predicted their plastic moment capacities. However,
FEA was not able to predict the plastic moment capacity of 150x45x2.0 LSB
although it is classified as compact based on AS 4100 (SA, 1998). Appendix E.7
provides the details of FEA and the results.
An attempt was then made to obtain the section moment capacities of conventional
hot-rolled I- and C-sections. For this purpose, 150UB14.0 and 150PFC17.7 sections
were modelled without corners using the same flange and web yield stress of 320
MPa as shown in their design capacity tables (AISC, 1994). It was found that FEA
was able to predict the full plastic moment capacity of the doubly symmetric
150UB14.0 section, but not that of the monosymmetric 150PFC17.7. The ratio of
Mu/My was only 1.14 for the mono-symmetric hot- rolled PFC section in comparison
to its Mp/My ratio of 1.19 (see Appendix E.7). This contradicts the moment capacities
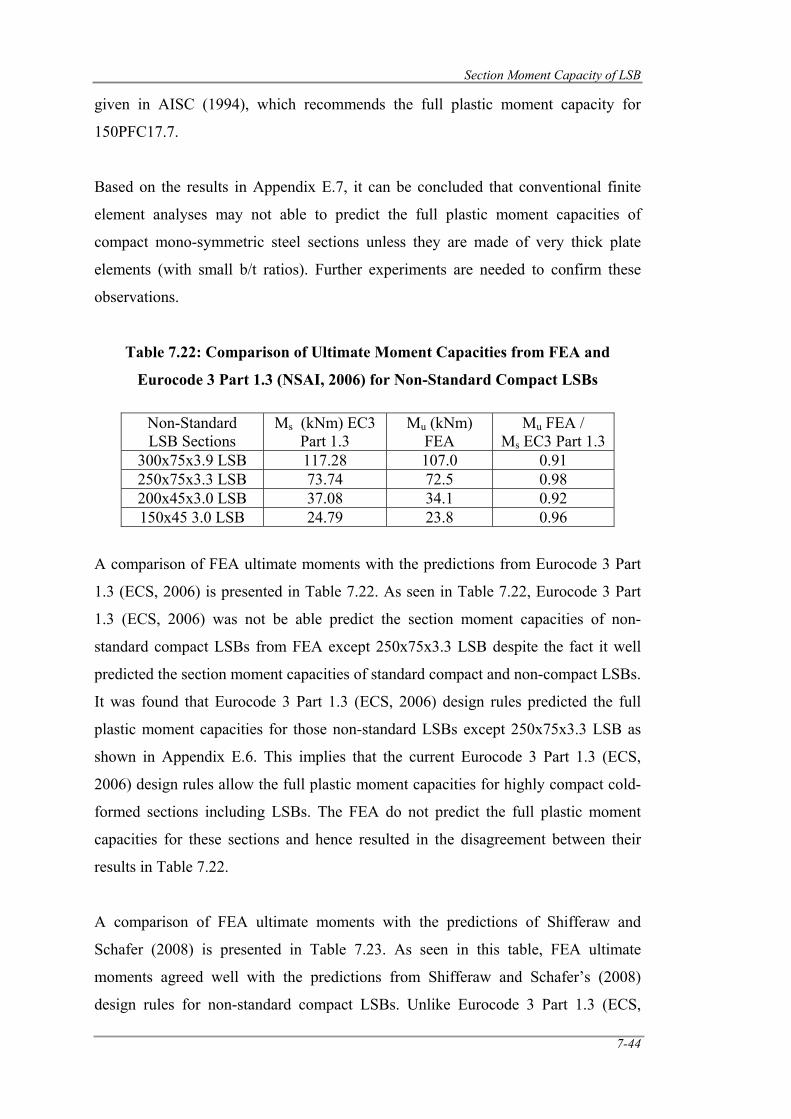
Section Moment Capacity of LSB
7-44
given in AISC (1994), which recommends the full plastic moment capacity for
150PFC17.7.
Based on the results in Appendix E.7, it can be concluded that conventional finite
element analyses may not able to predict the full plastic moment capacities of
compact mono-symmetric steel sections unless they are made of very thick plate
elements (with small b/t ratios). Further experiments are needed to confirm these
observations.
Table 7.22: Comparison of Ultimate Moment Capacities from FEA and
Eurocode 3 Part 1.3 (NSAI, 2006) for Non-Standard Compact LSBs
Non-Standard LSB Sections
Ms (kNm) EC3 Part 1.3
Mu (kNm) FEA
Mu FEA / Ms EC3 Part 1.3
300x75x3.9 LSB 117.28 107.0 0.91 250x75x3.3 LSB 73.74 72.5 0.98 200x45x3.0 LSB 37.08 34.1 0.92 150x45 3.0 LSB 24.79 23.8 0.96
A comparison of FEA ultimate moments with the predictions from Eurocode 3 Part
1.3 (ECS, 2006) is presented in Table 7.22. As seen in Table 7.22, Eurocode 3 Part
1.3 (ECS, 2006) was not be able predict the section moment capacities of non-
standard compact LSBs from FEA except 250x75x3.3 LSB despite the fact it well
predicted the section moment capacities of standard compact and non-compact LSBs.
It was found that Eurocode 3 Part 1.3 (ECS, 2006) design rules predicted the full
plastic moment capacities for those non-standard LSBs except 250x75x3.3 LSB as
shown in Appendix E.6. This implies that the current Eurocode 3 Part 1.3 (ECS,
2006) design rules allow the full plastic moment capacities for highly compact cold-
formed sections including LSBs. The FEA do not predict the full plastic moment
capacities for these sections and hence resulted in the disagreement between their
results in Table 7.22.
A comparison of FEA ultimate moments with the predictions of Shifferaw and
Schafer (2008) is presented in Table 7.23. As seen in this table, FEA ultimate
moments agreed well with the predictions from Shifferaw and Schafer’s (2008)
design rules for non-standard compact LSBs. Unlike Eurocode 3 Part 1.3 (ECS,
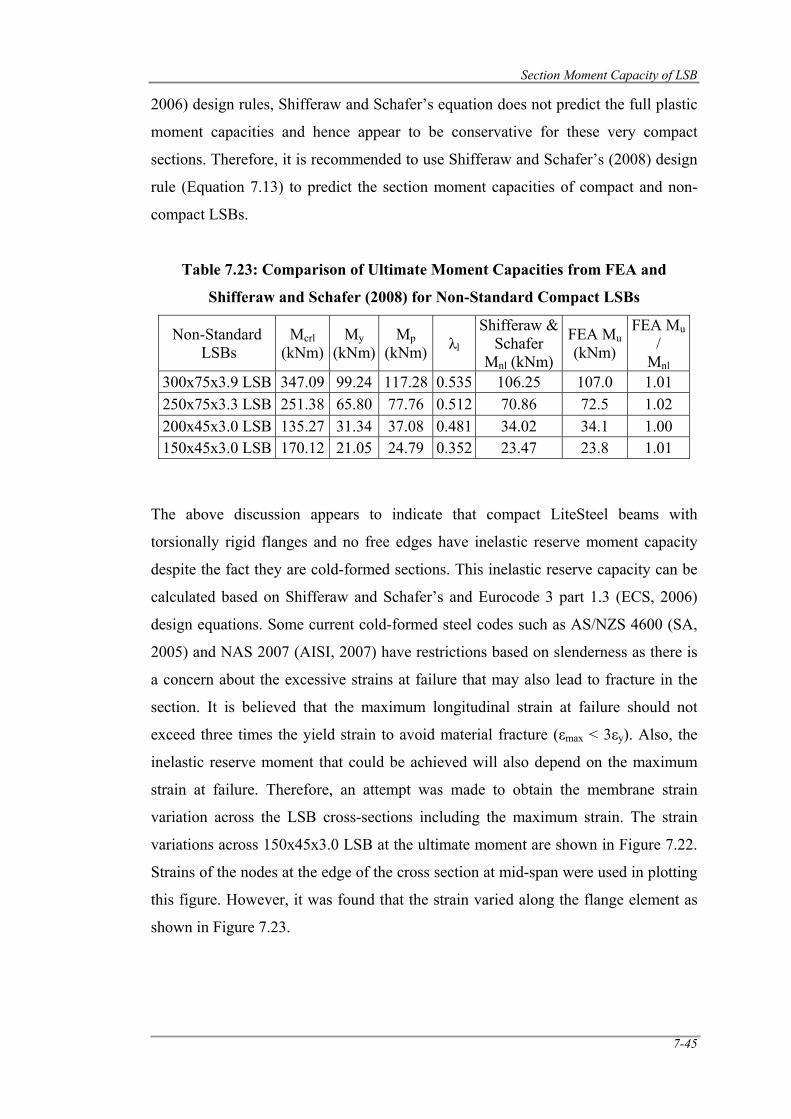
Section Moment Capacity of LSB
7-45
2006) design rules, Shifferaw and Schafer’s equation does not predict the full plastic
moment capacities and hence appear to be conservative for these very compact
sections. Therefore, it is recommended to use Shifferaw and Schafer’s (2008) design
rule (Equation 7.13) to predict the section moment capacities of compact and non-
compact LSBs.
Table 7.23: Comparison of Ultimate Moment Capacities from FEA and
Shifferaw and Schafer (2008) for Non-Standard Compact LSBs
The above discussion appears to indicate that compact LiteSteel beams with
torsionally rigid flanges and no free edges have inelastic reserve moment capacity
despite the fact they are cold-formed sections. This inelastic reserve capacity can be
calculated based on Shifferaw and Schafer’s and Eurocode 3 part 1.3 (ECS, 2006)
design equations. Some current cold-formed steel codes such as AS/NZS 4600 (SA,
2005) and NAS 2007 (AISI, 2007) have restrictions based on slenderness as there is
a concern about the excessive strains at failure that may also lead to fracture in the
section. It is believed that the maximum longitudinal strain at failure should not
exceed three times the yield strain to avoid material fracture (εmax < 3εy). Also, the
inelastic reserve moment that could be achieved will also depend on the maximum
strain at failure. Therefore, an attempt was made to obtain the membrane strain
variation across the LSB cross-sections including the maximum strain. The strain
variations across 150x45x3.0 LSB at the ultimate moment are shown in Figure 7.22.
Strains of the nodes at the edge of the cross section at mid-span were used in plotting
this figure. However, it was found that the strain varied along the flange element as
shown in Figure 7.23.
Non-Standard LSBs
Mcrl (kNm)
My (kNm)
Mp (kNm) λl
Shifferaw & Schafer
Mnl (kNm)
FEA Mu (kNm)
FEA Mu /
Mnl 300x75x3.9 LSB 347.09 99.24 117.28 0.535 106.25 107.0 1.01 250x75x3.3 LSB 251.38 65.80 77.76 0.512 70.86 72.5 1.02 200x45x3.0 LSB 135.27 31.34 37.08 0.481 34.02 34.1 1.00 150x45x3.0 LSB 170.12 21.05 24.79 0.352 23.47 23.8 1.01
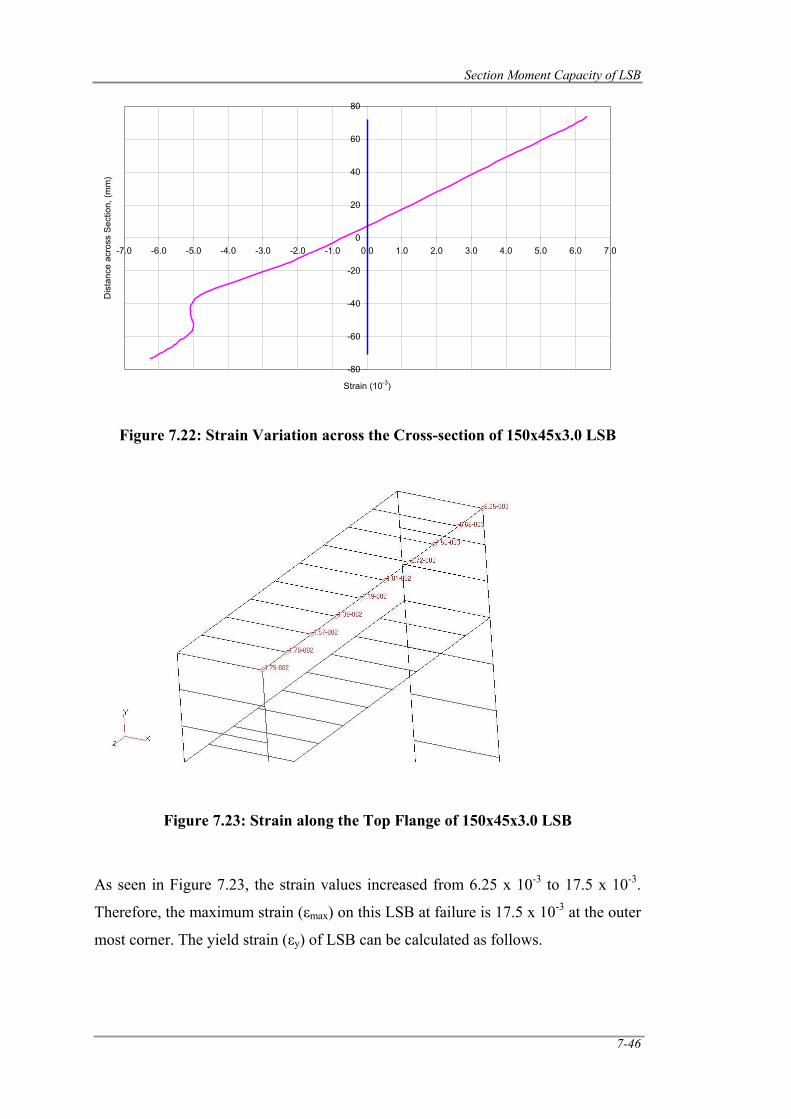
Section Moment Capacity of LSB
7-46
Figure 7.22: Strain Variation across the Cross-section of 150x45x3.0 LSB
Figure 7.23: Strain along the Top Flange of 150x45x3.0 LSB
As seen in Figure 7.23, the strain values increased from 6.25 x 10⁻³ to 17.5 x 10⁻³.
Therefore, the maximum strain (εmax) on this LSB at failure is 17.5 x 10⁻³ at the outer
most corner. The yield strain (εy) of LSB can be calculated as follows.
-80
-60
-40
-20
0
20
40
60
80
-7.0 -6.0 -5.0 -4.0 -3.0 -2.0 -1.0 0.0 1.0 2.0 3.0 4.0 5.0 6.0 7.0
Strain (10-3)
Dis
tanc
e ac
ross
Sec
tion,
(mm
)
Section Moment Capacity of LSB
7-47
Yield strain, εy = yield stress / Young’s modulus
= 450 / 200000
εy = 2.25 x 10⁻³
therefore, 3εy = 6.75 x 10⁻³.
In this case, εmax > 3εy for 150x45x3.0 LSB, hence material fracture may occur.
Figure 7.24 shows the membrane strain variation across the section and along one
element at mid-span as a fringe result from finite element analyses. Maximum
longitudinal strains for all the available 13 LSBs and 4 non-standard LSBs were
obtained at ultimate failure from FEA. Table 7.24 presents the maximum membrane
strains and Mu/My ratios of these LSBs. The average membrane strains along the
horizontal flange elements are also included in Table 7.24.
Figure 7.24: Strain Variation across the cross-section of 150x45x3.0 LSB as
Fringe Results
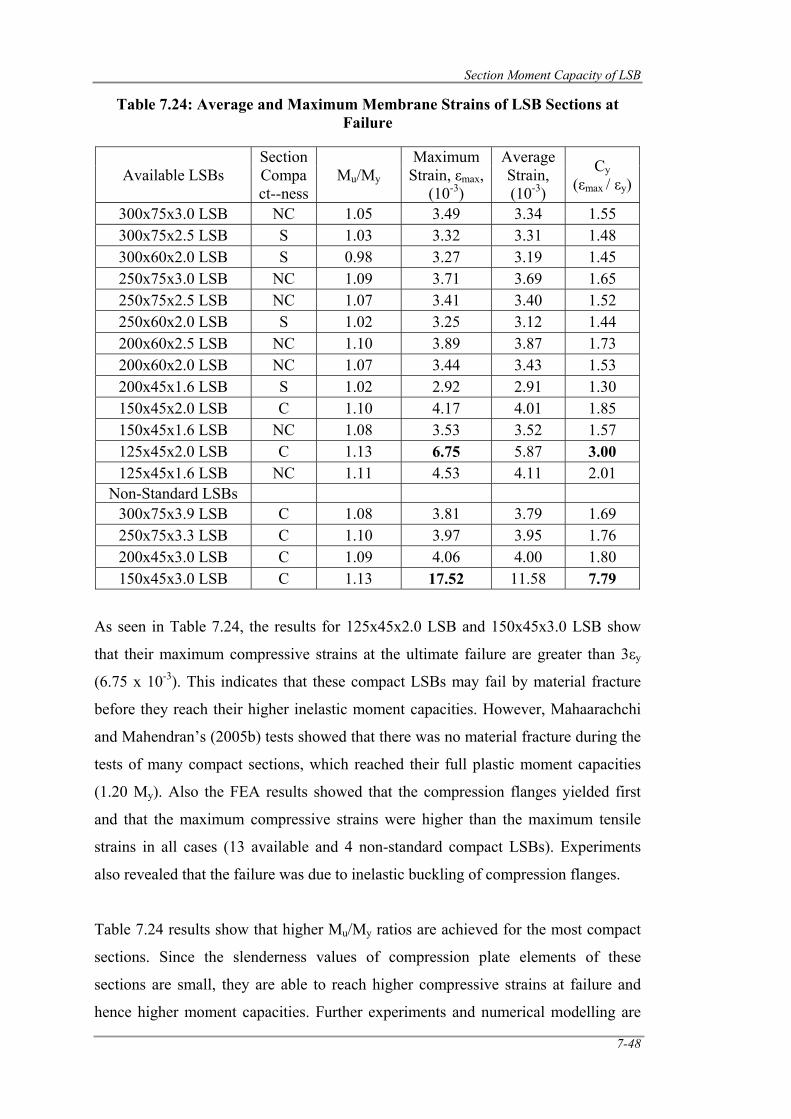
Section Moment Capacity of LSB
7-48
Table 7.24: Average and Maximum Membrane Strains of LSB Sections at Failure
Available LSBs Section Compact--ness
Mu/My Maximum
Strain, εmax, (10-3)
Average Strain, (10-3)
Cy (εmax / εy)
300x75x3.0 LSB NC 1.05 3.49 3.34 1.55 300x75x2.5 LSB S 1.03 3.32 3.31 1.48 300x60x2.0 LSB S 0.98 3.27 3.19 1.45 250x75x3.0 LSB NC 1.09 3.71 3.69 1.65 250x75x2.5 LSB NC 1.07 3.41 3.40 1.52 250x60x2.0 LSB S 1.02 3.25 3.12 1.44 200x60x2.5 LSB NC 1.10 3.89 3.87 1.73 200x60x2.0 LSB NC 1.07 3.44 3.43 1.53 200x45x1.6 LSB S 1.02 2.92 2.91 1.30 150x45x2.0 LSB C 1.10 4.17 4.01 1.85 150x45x1.6 LSB NC 1.08 3.53 3.52 1.57 125x45x2.0 LSB C 1.13 6.75 5.87 3.00 125x45x1.6 LSB NC 1.11 4.53 4.11 2.01
Non-Standard LSBs 300x75x3.9 LSB C 1.08 3.81 3.79 1.69 250x75x3.3 LSB C 1.10 3.97 3.95 1.76 200x45x3.0 LSB C 1.09 4.06 4.00 1.80 150x45x3.0 LSB C 1.13 17.52 11.58 7.79
As seen in Table 7.24, the results for 125x45x2.0 LSB and 150x45x3.0 LSB show
that their maximum compressive strains at the ultimate failure are greater than 3εy
(6.75 x 10⁻³). This indicates that these compact LSBs may fail by material fracture
before they reach their higher inelastic moment capacities. However, Mahaarachchi
and Mahendran’s (2005b) tests showed that there was no material fracture during the
tests of many compact sections, which reached their full plastic moment capacities
(1.20 My). Also the FEA results showed that the compression flanges yielded first
and that the maximum compressive strains were higher than the maximum tensile
strains in all cases (13 available and 4 non-standard compact LSBs). Experiments
also revealed that the failure was due to inelastic buckling of compression flanges.
Table 7.24 results show that higher Mu/My ratios are achieved for the most compact
sections. Since the slenderness values of compression plate elements of these
sections are small, they are able to reach higher compressive strains at failure and
hence higher moment capacities. Further experiments and numerical modelling are
Section Moment Capacity of LSB
7-49
required before full plastic moment capacities are adopted for compact LSB sections.
It is recommended that the section moment capacity equation (Equation 7.13) based
on Shifferaw and Schafer (2008) is used. Eurocode 3 Part 1.3 design rules can also
be used for this purpose.
If a simplified design approach is needed, it is recommended that the section moment
capacity of the currently available compact LSBs is taken as 1.10My. Since the
inelastic reserve capacity of non-compact sections is in most cases about 5% of My, it
can be neglected and the first yield moment (My) can be taken as their section
moment capacity.
7.7 Conclusions
This chapter has presented the details of an experimental investigation, finite element
analyses and a parametric study on the section moment capacities of LSBs. Four
point bending tests were carried out for seven LSBs. Experimental ultimate moment
capacities from this research and Mahaarachchi and Mahendran (2005b) were
compared with those predicted by the current design rules for section moment
capacity based on AS/NZS 4600 (SA, 2005). Appropriate finite element models were
developed and validated using the experimental results. The validated finite element
models with nominal dimensions and yield stresses were used to obtain the section
moment capacities of all the available 13 LSBs. A comparison of the section moment
capacity results from finite element analyses, experiments and design codes showed
that compact and non-compact LSBs based on AS 4100 (SA, 1998) have some
inelastic reserve capacity while slender LSBs do not have any inelastic reserve
capacity beyond their first yield moment. This chapter has presented the section
moment capacities of LSBs based on experiments, finite element analyses and the
current steel design codes and has made some suitable recommendations.
Although the currently available LSBs exceed the slenderness limits and other
conditions of AS/NZS 4600 (SA, 2005) and NAS (AISI, 2007) for inelastic reserve
bending capacity, considerable inelastic bending capacities exist for LSBs as evident
from experiments and finite element analyses of LSBs and should be included in
design. For this purpose, it is recommended that the inelastic bending capacity
Section Moment Capacity of LSB
7-50
equations developed by Shifferaw and Schafer (2008) are used to predict these
capacities for non-compact and compact LSBs. Eurocode 3 Part 1.3 (ECS, 2006)
design equations can also be used. As a simple design approach, it is also possible to
use the ultimate moment capacity of compact LSB sections as 1.10 times their first
yield moment while it is the first yield moment for non-compact sections. For slender
LSB sections, current cold-formed steel codes can be used to predict their section
moment capacities.
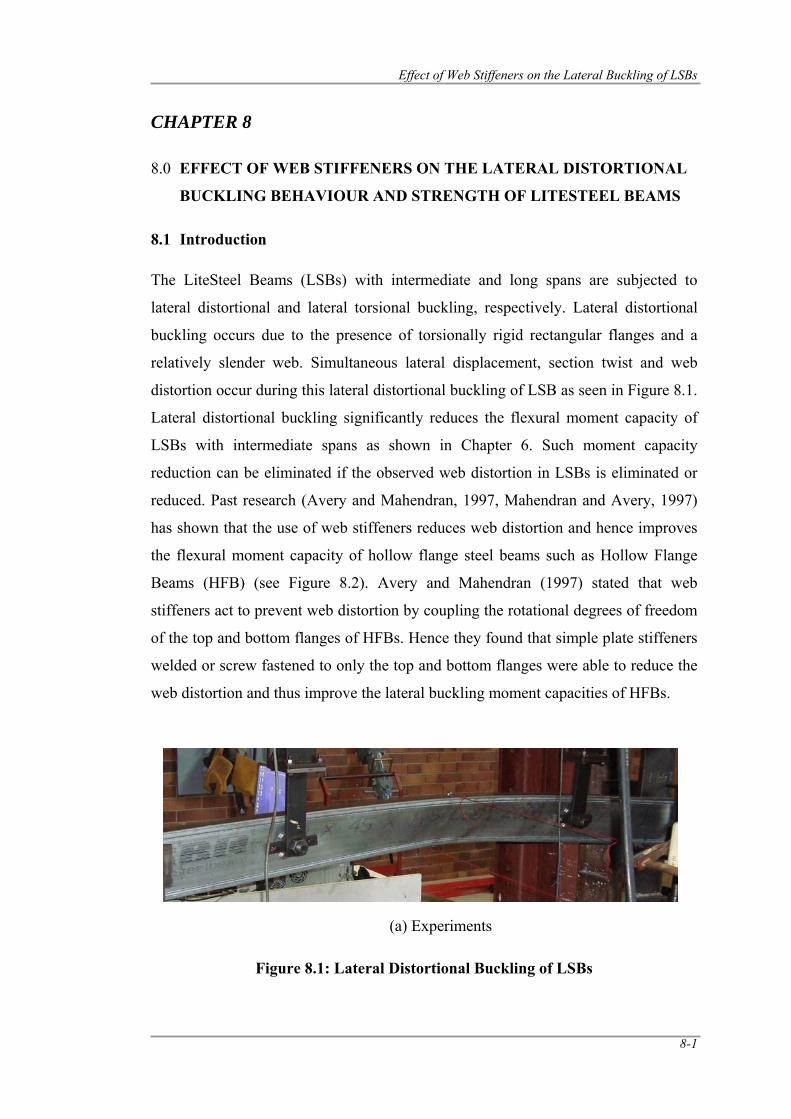
Effect of Web Stiffeners on the Lateral Buckling of LSBs
8-1
CHAPTER 8
8.0 EFFECT OF WEB STIFFENERS ON THE LATERAL DISTORTIONAL
BUCKLING BEHAVIOUR AND STRENGTH OF LITESTEEL BEAMS
8.1 Introduction
The LiteSteel Beams (LSBs) with intermediate and long spans are subjected to
lateral distortional and lateral torsional buckling, respectively. Lateral distortional
buckling occurs due to the presence of torsionally rigid rectangular flanges and a
relatively slender web. Simultaneous lateral displacement, section twist and web
distortion occur during this lateral distortional buckling of LSB as seen in Figure 8.1.
Lateral distortional buckling significantly reduces the flexural moment capacity of
LSBs with intermediate spans as shown in Chapter 6. Such moment capacity
reduction can be eliminated if the observed web distortion in LSBs is eliminated or
reduced. Past research (Avery and Mahendran, 1997, Mahendran and Avery, 1997)
has shown that the use of web stiffeners reduces web distortion and hence improves
the flexural moment capacity of hollow flange steel beams such as Hollow Flange
Beams (HFB) (see Figure 8.2). Avery and Mahendran (1997) stated that web
stiffeners act to prevent web distortion by coupling the rotational degrees of freedom
of the top and bottom flanges of HFBs. Hence they found that simple plate stiffeners
welded or screw fastened to only the top and bottom flanges were able to reduce the
web distortion and thus improve the lateral buckling moment capacities of HFBs.
Figure 8.1: Lateral Distortional Buckling of LSBs
(a) Experiments
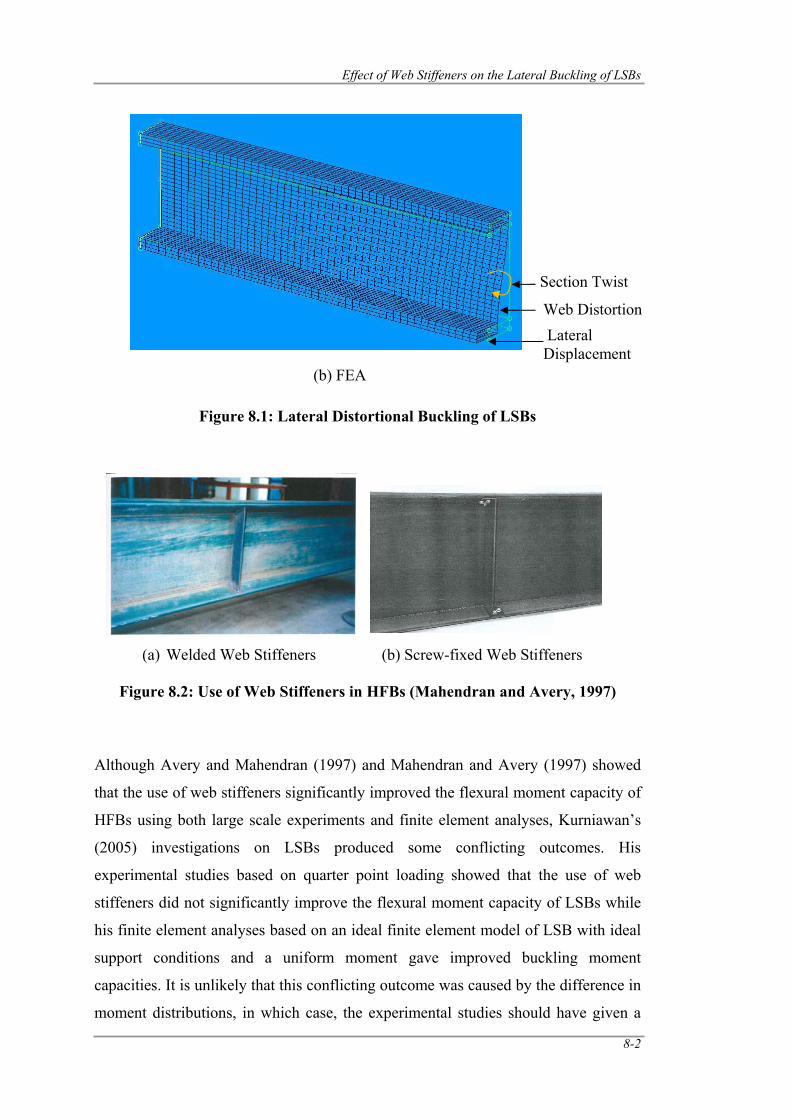
Effect of Web Stiffeners on the Lateral Buckling of LSBs
8-2
Figure 8.1: Lateral Distortional Buckling of LSBs
(a) Welded Web Stiffeners (b) Screw-fixed Web Stiffeners
Figure 8.2: Use of Web Stiffeners in HFBs (Mahendran and Avery, 1997)
Although Avery and Mahendran (1997) and Mahendran and Avery (1997) showed
that the use of web stiffeners significantly improved the flexural moment capacity of
HFBs using both large scale experiments and finite element analyses, Kurniawan’s
(2005) investigations on LSBs produced some conflicting outcomes. His
experimental studies based on quarter point loading showed that the use of web
stiffeners did not significantly improve the flexural moment capacity of LSBs while
his finite element analyses based on an ideal finite element model of LSB with ideal
support conditions and a uniform moment gave improved buckling moment
capacities. It is unlikely that this conflicting outcome was caused by the difference in
moment distributions, in which case, the experimental studies should have given a
Web Distortion Lateral Displacement
Section Twist
(b) FEA
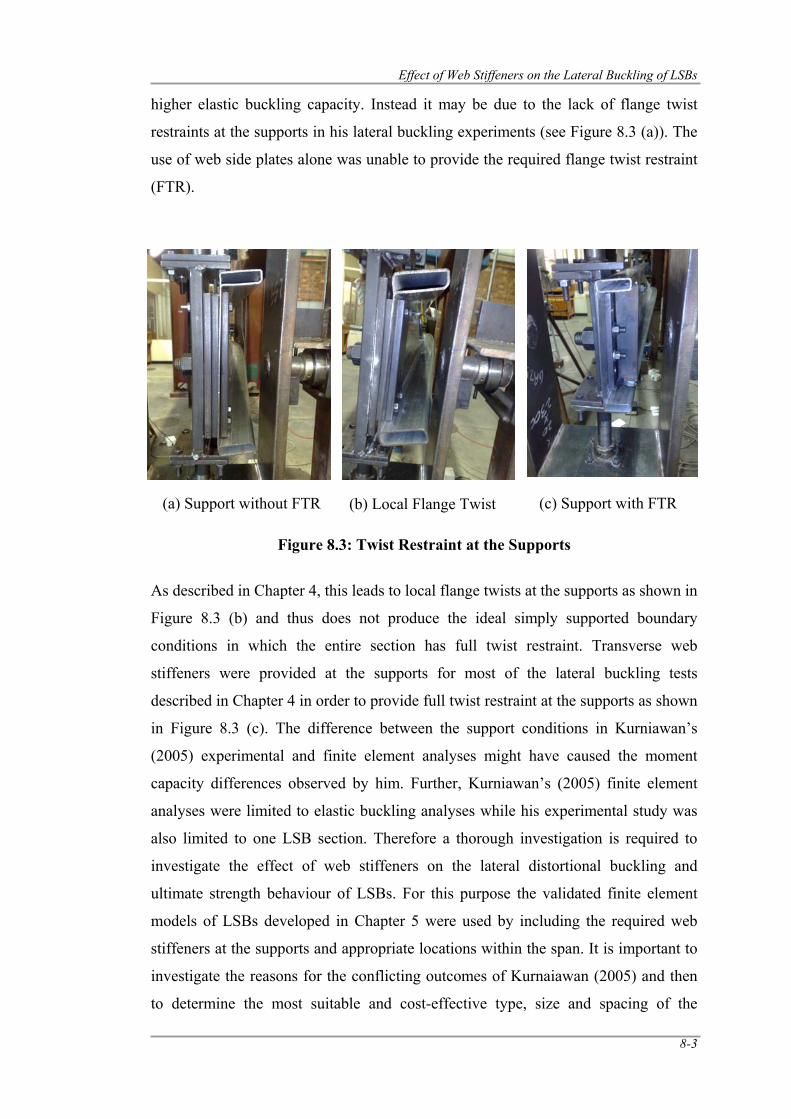
Effect of Web Stiffeners on the Lateral Buckling of LSBs
8-3
higher elastic buckling capacity. Instead it may be due to the lack of flange twist
restraints at the supports in his lateral buckling experiments (see Figure 8.3 (a)). The
use of web side plates alone was unable to provide the required flange twist restraint
(FTR).
Figure 8.3: Twist Restraint at the Supports
As described in Chapter 4, this leads to local flange twists at the supports as shown in
Figure 8.3 (b) and thus does not produce the ideal simply supported boundary
conditions in which the entire section has full twist restraint. Transverse web
stiffeners were provided at the supports for most of the lateral buckling tests
described in Chapter 4 in order to provide full twist restraint at the supports as shown
in Figure 8.3 (c). The difference between the support conditions in Kurniawan’s
(2005) experimental and finite element analyses might have caused the moment
capacity differences observed by him. Further, Kurniawan’s (2005) finite element
analyses were limited to elastic buckling analyses while his experimental study was
also limited to one LSB section. Therefore a thorough investigation is required to
investigate the effect of web stiffeners on the lateral distortional buckling and
ultimate strength behaviour of LSBs. For this purpose the validated finite element
models of LSBs developed in Chapter 5 were used by including the required web
stiffeners at the supports and appropriate locations within the span. It is important to
investigate the reasons for the conflicting outcomes of Kurnaiawan (2005) and then
to determine the most suitable and cost-effective type, size and spacing of the
(a) Support without FTR (b) Local Flange Twist (c) Support with FTR
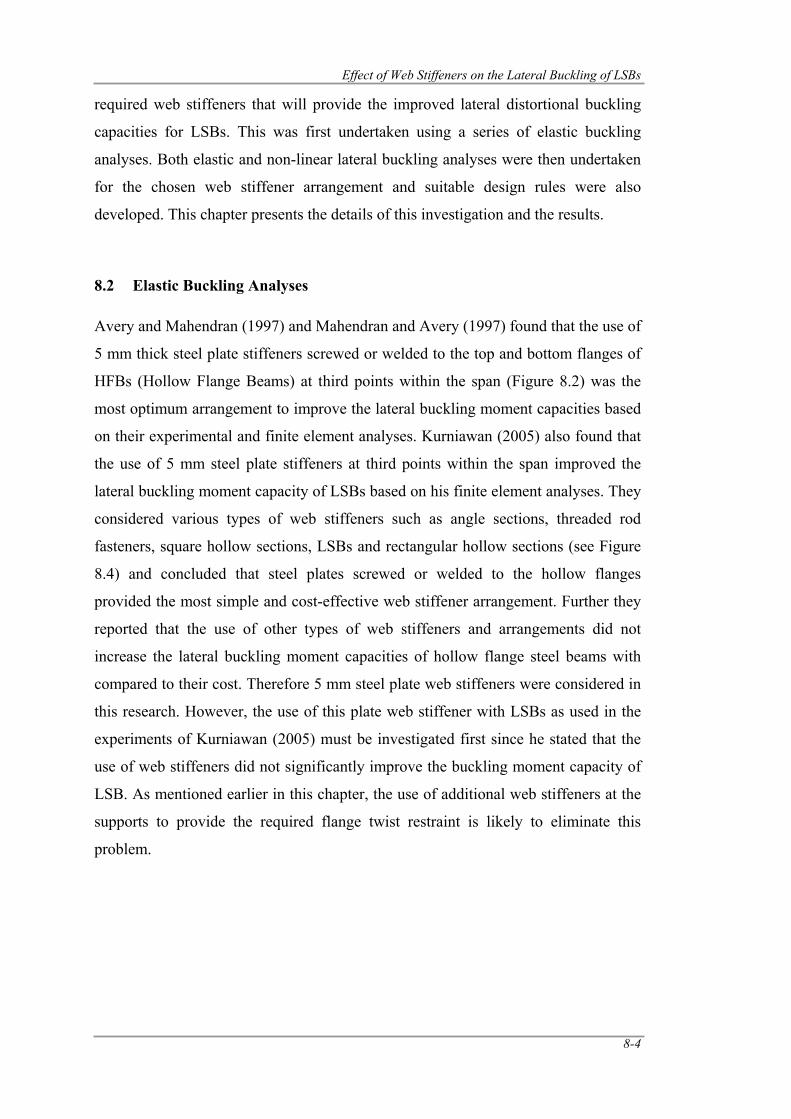
Effect of Web Stiffeners on the Lateral Buckling of LSBs
8-4
required web stiffeners that will provide the improved lateral distortional buckling
capacities for LSBs. This was first undertaken using a series of elastic buckling
analyses. Both elastic and non-linear lateral buckling analyses were then undertaken
for the chosen web stiffener arrangement and suitable design rules were also
developed. This chapter presents the details of this investigation and the results.
8.2 Elastic Buckling Analyses
Avery and Mahendran (1997) and Mahendran and Avery (1997) found that the use of
5 mm thick steel plate stiffeners screwed or welded to the top and bottom flanges of
HFBs (Hollow Flange Beams) at third points within the span (Figure 8.2) was the
most optimum arrangement to improve the lateral buckling moment capacities based
on their experimental and finite element analyses. Kurniawan (2005) also found that
the use of 5 mm steel plate stiffeners at third points within the span improved the
lateral buckling moment capacity of LSBs based on his finite element analyses. They
considered various types of web stiffeners such as angle sections, threaded rod
fasteners, square hollow sections, LSBs and rectangular hollow sections (see Figure
8.4) and concluded that steel plates screwed or welded to the hollow flanges
provided the most simple and cost-effective web stiffener arrangement. Further they
reported that the use of other types of web stiffeners and arrangements did not
increase the lateral buckling moment capacities of hollow flange steel beams with
compared to their cost. Therefore 5 mm steel plate web stiffeners were considered in
this research. However, the use of this plate web stiffener with LSBs as used in the
experiments of Kurniawan (2005) must be investigated first since he stated that the
use of web stiffeners did not significantly improve the buckling moment capacity of
LSB. As mentioned earlier in this chapter, the use of additional web stiffeners at the
supports to provide the required flange twist restraint is likely to eliminate this
problem.
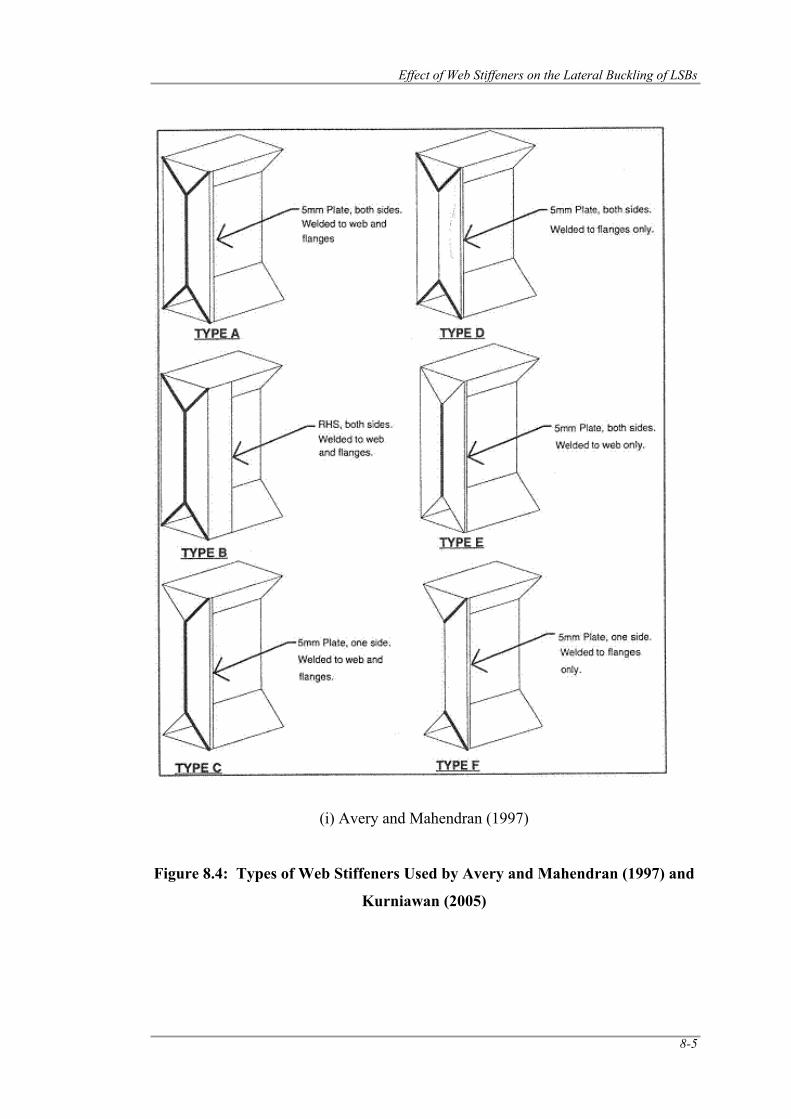
Effect of Web Stiffeners on the Lateral Buckling of LSBs
8-5
(i) Avery and Mahendran (1997)
Figure 8.4: Types of Web Stiffeners Used by Avery and Mahendran (1997) and
Kurniawan (2005)
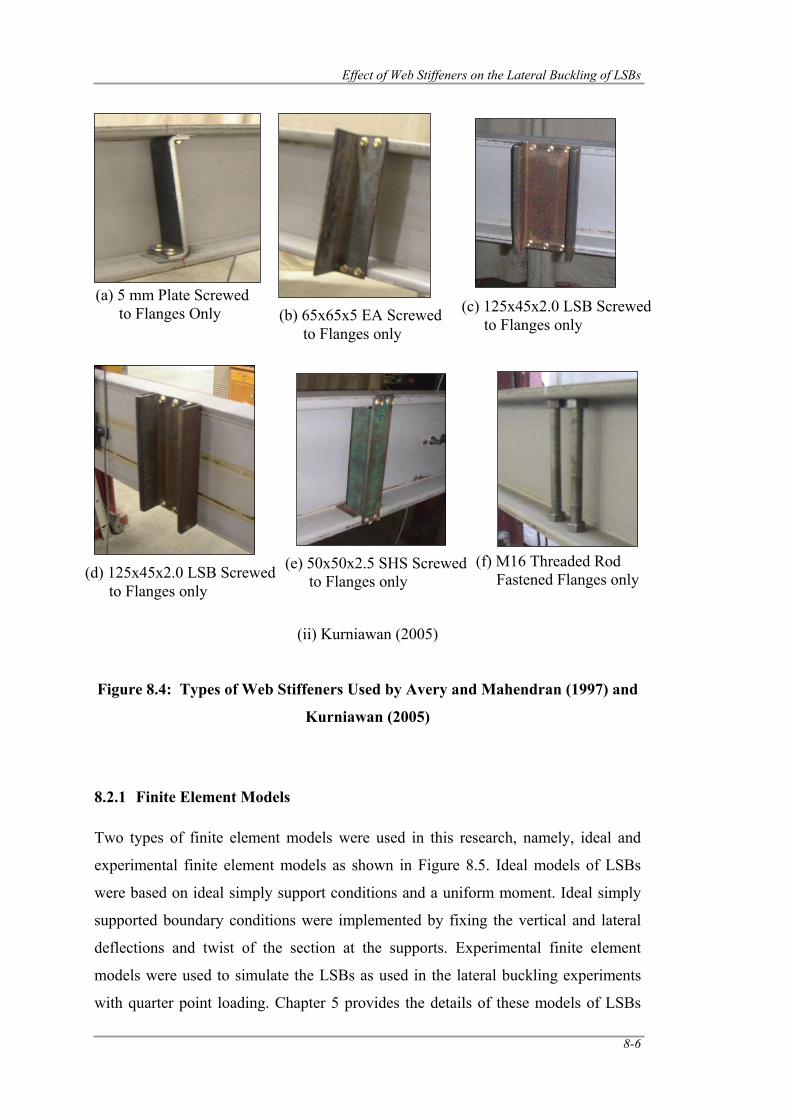
Effect of Web Stiffeners on the Lateral Buckling of LSBs
8-6
(ii) Kurniawan (2005) Figure 8.4: Types of Web Stiffeners Used by Avery and Mahendran (1997) and
Kurniawan (2005)
8.2.1 Finite Element Models
Two types of finite element models were used in this research, namely, ideal and
experimental finite element models as shown in Figure 8.5. Ideal models of LSBs
were based on ideal simply support conditions and a uniform moment. Ideal simply
supported boundary conditions were implemented by fixing the vertical and lateral
deflections and twist of the section at the supports. Experimental finite element
models were used to simulate the LSBs as used in the lateral buckling experiments
with quarter point loading. Chapter 5 provides the details of these models of LSBs
(a) 5 mm Plate Screwed to Flanges Only (b) 65x65x5 EA Screwed
to Flanges only
(d) 125x45x2.0 LSB Screwed to Flanges only
(c) 125x45x2.0 LSB Screwed to Flanges only
(e) 50x50x2.5 SHS Screwed to Flanges only
(f) M16 Threaded Rod Fastened Flanges only
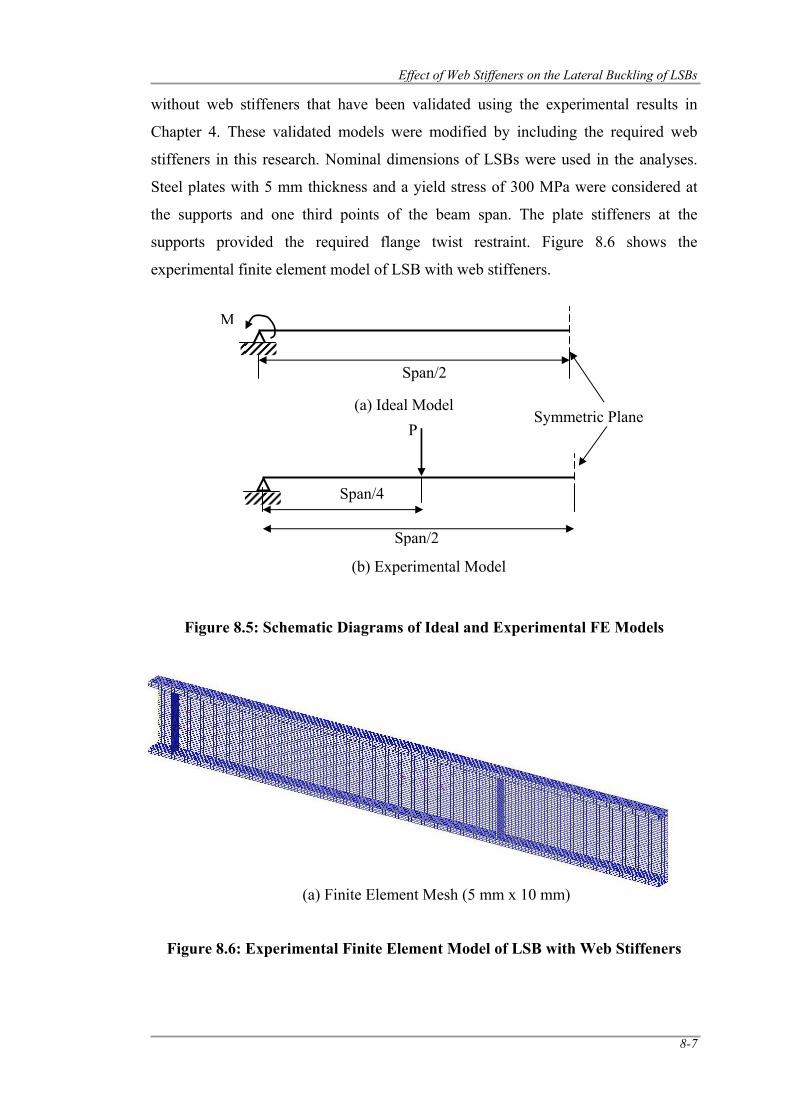
Effect of Web Stiffeners on the Lateral Buckling of LSBs
8-7
without web stiffeners that have been validated using the experimental results in
Chapter 4. These validated models were modified by including the required web
stiffeners in this research. Nominal dimensions of LSBs were used in the analyses.
Steel plates with 5 mm thickness and a yield stress of 300 MPa were considered at
the supports and one third points of the beam span. The plate stiffeners at the
supports provided the required flange twist restraint. Figure 8.6 shows the
experimental finite element model of LSB with web stiffeners.
Figure 8.5: Schematic Diagrams of Ideal and Experimental FE Models
Figure 8.6: Experimental Finite Element Model of LSB with Web Stiffeners
Span/2
P
Span/4
(b) Experimental Model
Span/2
M
(a) Ideal Model Symmetric Plane
(a) Finite Element Mesh (5 mm x 10 mm)
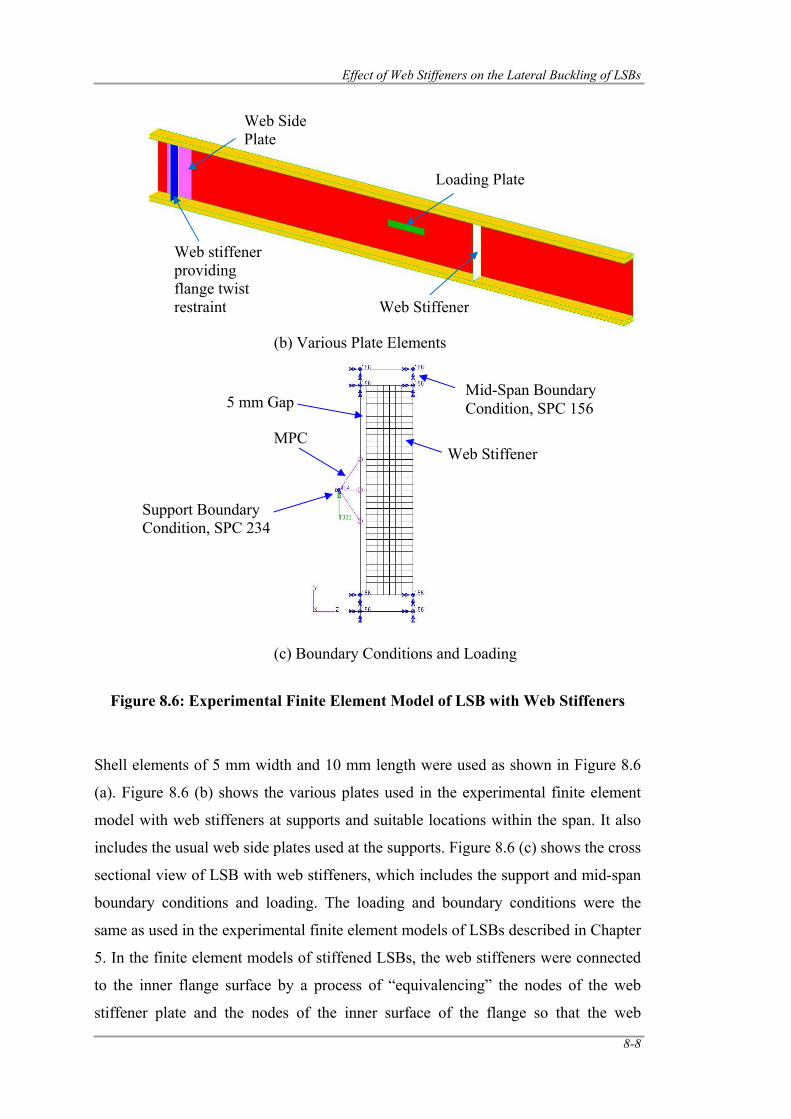
Effect of Web Stiffeners on the Lateral Buckling of LSBs
8-8
Figure 8.6: Experimental Finite Element Model of LSB with Web Stiffeners
Shell elements of 5 mm width and 10 mm length were used as shown in Figure 8.6
(a). Figure 8.6 (b) shows the various plates used in the experimental finite element
model with web stiffeners at supports and suitable locations within the span. It also
includes the usual web side plates used at the supports. Figure 8.6 (c) shows the cross
sectional view of LSB with web stiffeners, which includes the support and mid-span
boundary conditions and loading. The loading and boundary conditions were the
same as used in the experimental finite element models of LSBs described in Chapter
5. In the finite element models of stiffened LSBs, the web stiffeners were connected
to the inner flange surface by a process of “equivalencing” the nodes of the web
stiffener plate and the nodes of the inner surface of the flange so that the web
(b) Various Plate Elements
Loading Plate
Web Side Plate
Web stiffener providing flange twist restraint Web Stiffener
(c) Boundary Conditions and Loading
Support Boundary Condition, SPC 234
MPC
Mid-Span Boundary Condition, SPC 156
Web Stiffener
5 mm Gap
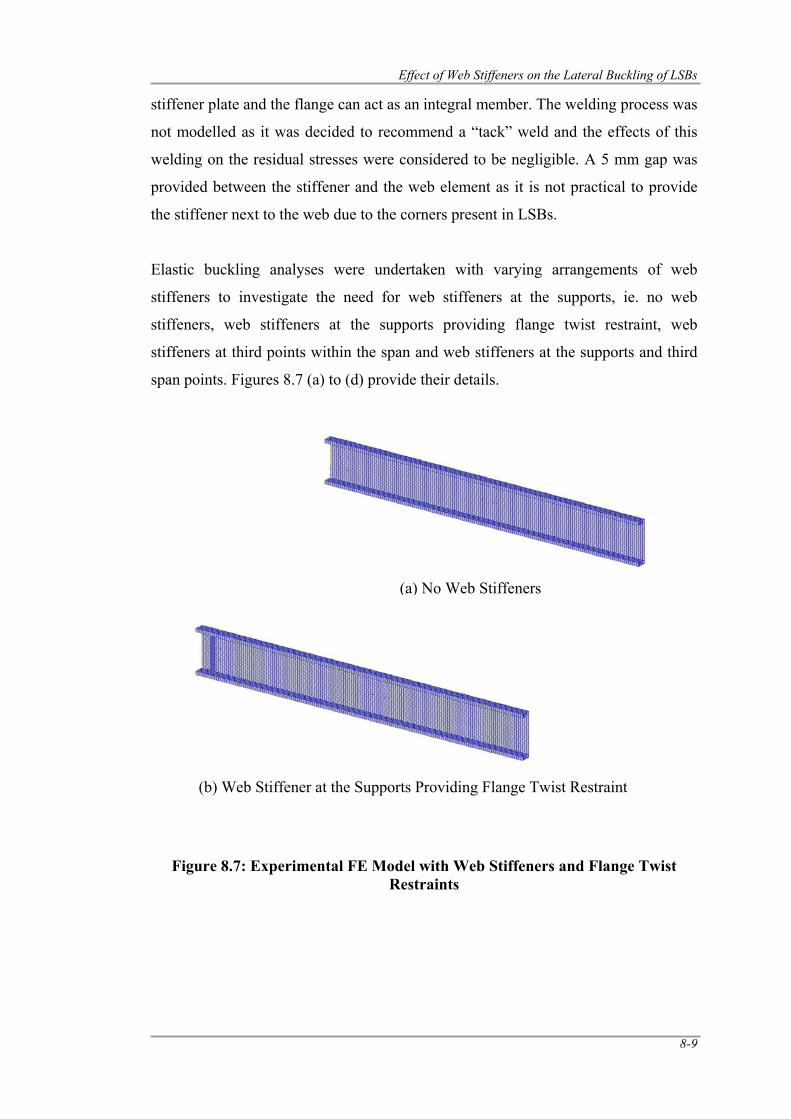
Effect of Web Stiffeners on the Lateral Buckling of LSBs
8-9
stiffener plate and the flange can act as an integral member. The welding process was
not modelled as it was decided to recommend a “tack” weld and the effects of this
welding on the residual stresses were considered to be negligible. A 5 mm gap was
provided between the stiffener and the web element as it is not practical to provide
the stiffener next to the web due to the corners present in LSBs.
Elastic buckling analyses were undertaken with varying arrangements of web
stiffeners to investigate the need for web stiffeners at the supports, ie. no web
stiffeners, web stiffeners at the supports providing flange twist restraint, web
stiffeners at third points within the span and web stiffeners at the supports and third
span points. Figures 8.7 (a) to (d) provide their details.
Figure 8.7: Experimental FE Model with Web Stiffeners and Flange Twist Restraints
(b) Web Stiffener at the Supports Providing Flange Twist Restraint
(a) No Web Stiffeners
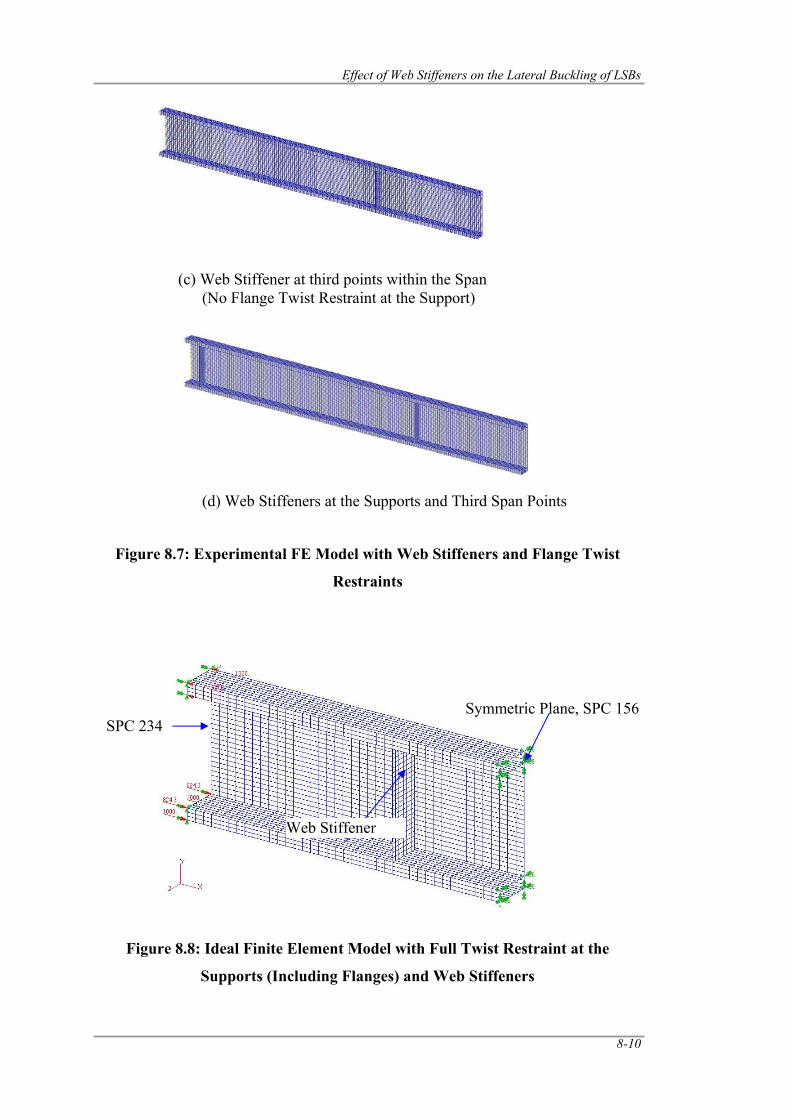
Effect of Web Stiffeners on the Lateral Buckling of LSBs
8-10
Figure 8.7: Experimental FE Model with Web Stiffeners and Flange Twist
Restraints
Figure 8.8: Ideal Finite Element Model with Full Twist Restraint at the
Supports (Including Flanges) and Web Stiffeners
(d) Web Stiffeners at the Supports and Third Span Points
(c) Web Stiffener at third points within the Span (No Flange Twist Restraint at the Support)
Symmetric Plane, SPC 156 SPC 234
Web Stiffener
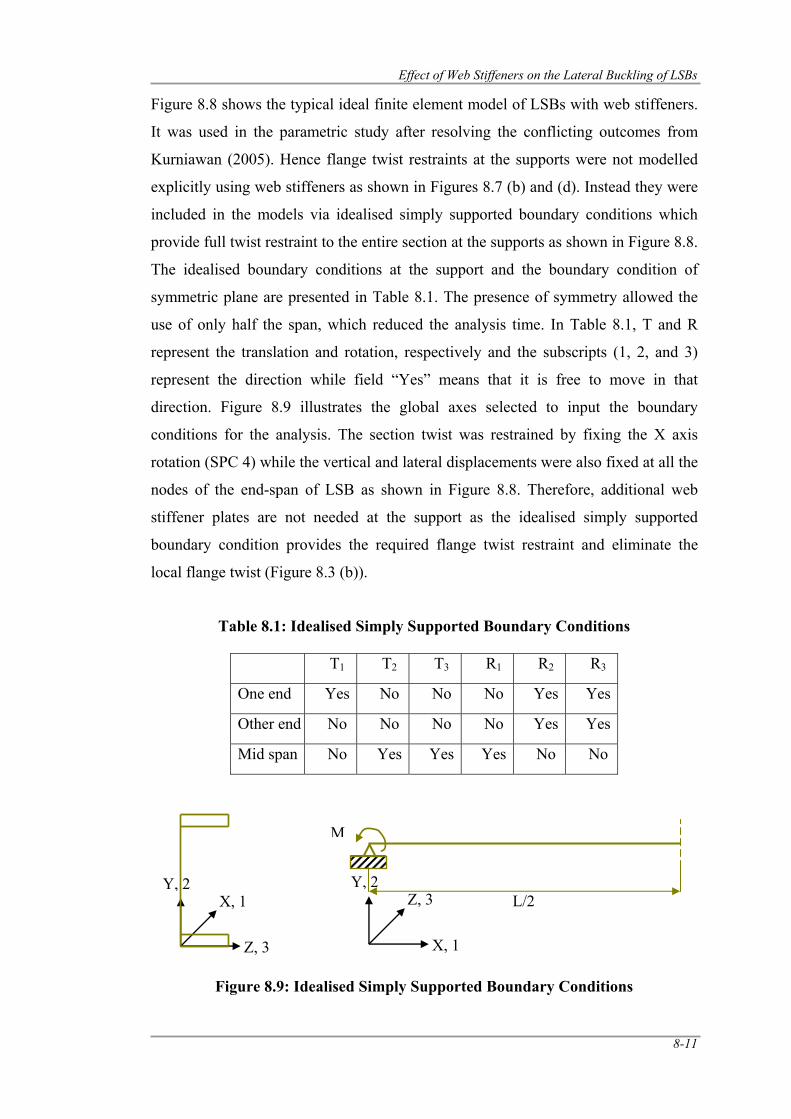
Effect of Web Stiffeners on the Lateral Buckling of LSBs
8-11
Figure 8.8 shows the typical ideal finite element model of LSBs with web stiffeners.
It was used in the parametric study after resolving the conflicting outcomes from
Kurniawan (2005). Hence flange twist restraints at the supports were not modelled
explicitly using web stiffeners as shown in Figures 8.7 (b) and (d). Instead they were
included in the models via idealised simply supported boundary conditions which
provide full twist restraint to the entire section at the supports as shown in Figure 8.8.
The idealised boundary conditions at the support and the boundary condition of
symmetric plane are presented in Table 8.1. The presence of symmetry allowed the
use of only half the span, which reduced the analysis time. In Table 8.1, T and R
represent the translation and rotation, respectively and the subscripts (1, 2, and 3)
represent the direction while field “Yes” means that it is free to move in that
direction. Figure 8.9 illustrates the global axes selected to input the boundary
conditions for the analysis. The section twist was restrained by fixing the X axis
rotation (SPC 4) while the vertical and lateral displacements were also fixed at all the
nodes of the end-span of LSB as shown in Figure 8.8. Therefore, additional web
stiffener plates are not needed at the support as the idealised simply supported
boundary condition provides the required flange twist restraint and eliminate the
local flange twist (Figure 8.3 (b)).
Table 8.1: Idealised Simply Supported Boundary Conditions
T1 T2 T3 R1 R2 R3
One end Yes No No No Yes Yes
Other end No No No No Yes Yes
Mid span No Yes Yes Yes No No
Figure 8.9: Idealised Simply Supported Boundary Conditions
X, 1
Z, 3
Y, 2 Z, 3
X, 1
Y, 2
M
L/2
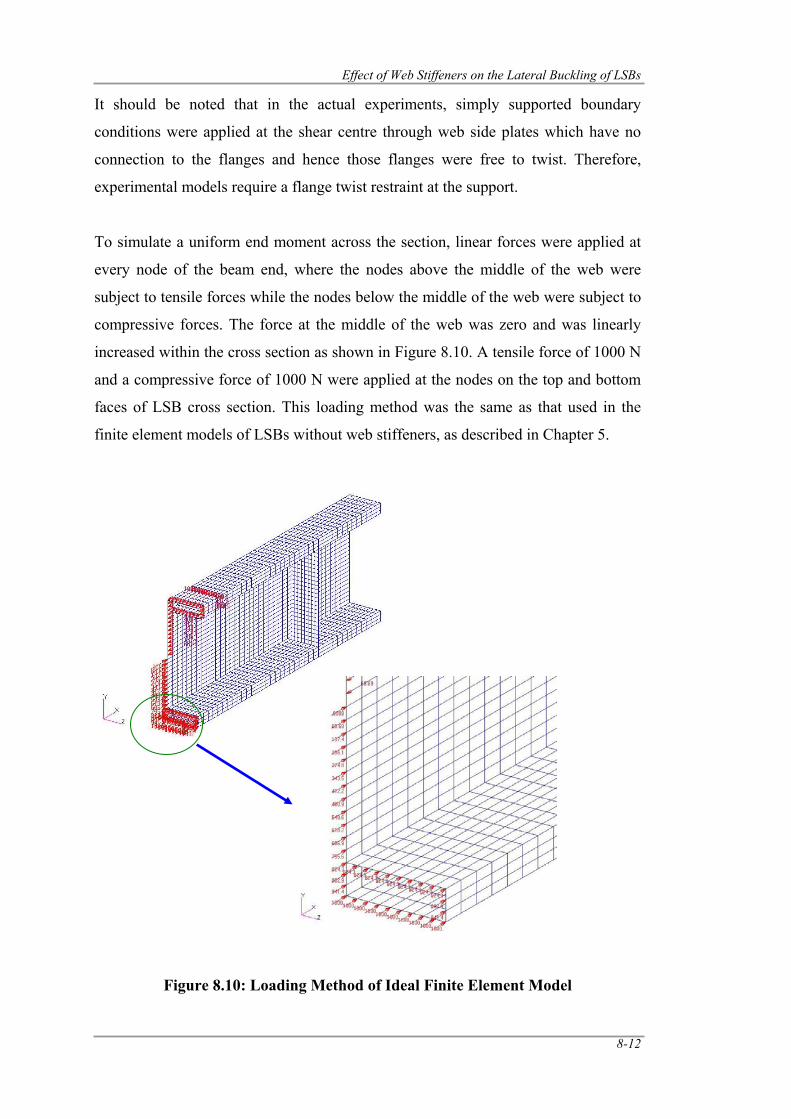
Effect of Web Stiffeners on the Lateral Buckling of LSBs
8-12
It should be noted that in the actual experiments, simply supported boundary
conditions were applied at the shear centre through web side plates which have no
connection to the flanges and hence those flanges were free to twist. Therefore,
experimental models require a flange twist restraint at the support.
To simulate a uniform end moment across the section, linear forces were applied at
every node of the beam end, where the nodes above the middle of the web were
subject to tensile forces while the nodes below the middle of the web were subject to
compressive forces. The force at the middle of the web was zero and was linearly
increased within the cross section as shown in Figure 8.10. A tensile force of 1000 N
and a compressive force of 1000 N were applied at the nodes on the top and bottom
faces of LSB cross section. This loading method was the same as that used in the
finite element models of LSBs without web stiffeners, as described in Chapter 5.
Figure 8.10: Loading Method of Ideal Finite Element Model
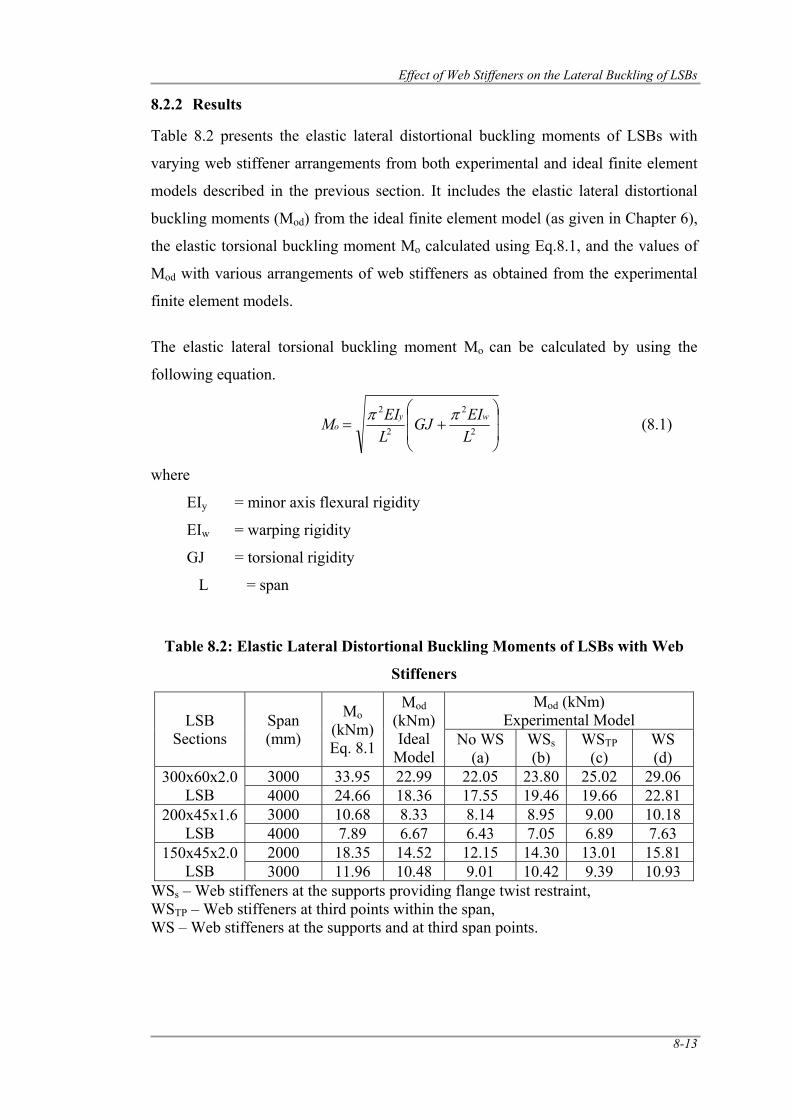
Effect of Web Stiffeners on the Lateral Buckling of LSBs
8-13
8.2.2 Results
Table 8.2 presents the elastic lateral distortional buckling moments of LSBs with
varying web stiffener arrangements from both experimental and ideal finite element
models described in the previous section. It includes the elastic lateral distortional
buckling moments (Mod) from the ideal finite element model (as given in Chapter 6),
the elastic torsional buckling moment Mo calculated using Eq.8.1, and the values of
Mod with various arrangements of web stiffeners as obtained from the experimental
finite element models.
The elastic lateral torsional buckling moment Mo can be calculated by using the
following equation.
⎟⎟
⎠
⎞
⎜⎜
⎝
⎛+= 2
2
2
2
LEIGJ
LEIM wy
oππ (8.1)
where
EIy = minor axis flexural rigidity
EIw = warping rigidity
GJ = torsional rigidity
L = span
Table 8.2: Elastic Lateral Distortional Buckling Moments of LSBs with Web
Stiffeners
LSB Sections
Span (mm)
Mo (kNm) Eq. 8.1
Mod (kNm) Ideal
Model
Mod (kNm) Experimental Model
No WS (a)
WSs (b)
WSTP (c)
WS (d)
300x60x2.0 LSB
3000 33.95 22.99 22.05 23.80 25.02 29.06 4000 24.66 18.36 17.55 19.46 19.66 22.81
200x45x1.6 LSB
3000 10.68 8.33 8.14 8.95 9.00 10.18 4000 7.89 6.67 6.43 7.05 6.89 7.63
150x45x2.0 LSB
2000 18.35 14.52 12.15 14.30 13.01 15.81 3000 11.96 10.48 9.01 10.42 9.39 10.93
WSs – Web stiffeners at the supports providing flange twist restraint, WSTP – Web stiffeners at third points within the span, WS – Web stiffeners at the supports and at third span points.
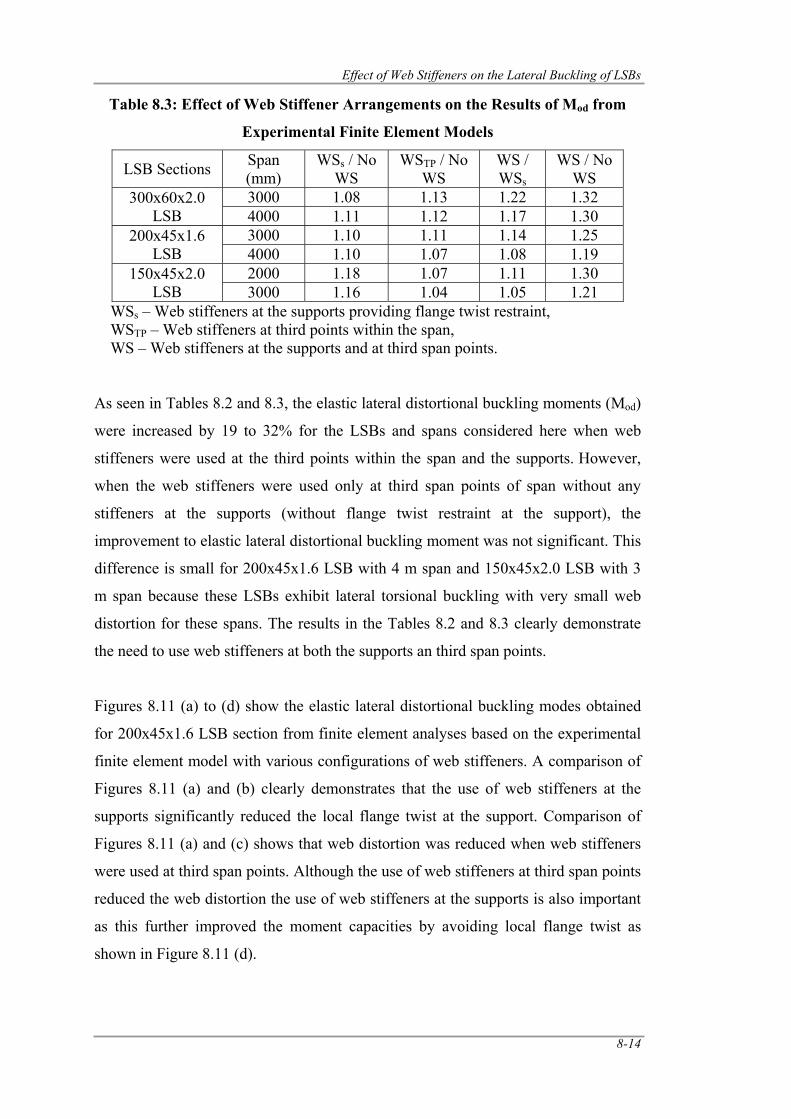
Effect of Web Stiffeners on the Lateral Buckling of LSBs
8-14
Table 8.3: Effect of Web Stiffener Arrangements on the Results of Mod from
Experimental Finite Element Models
LSB Sections Span (mm)
WSs / No WS
WSTP / No WS
WS / WSs
WS / No WS
300x60x2.0 LSB
3000 1.08 1.13 1.22 1.32 4000 1.11 1.12 1.17 1.30
200x45x1.6 LSB
3000 1.10 1.11 1.14 1.25 4000 1.10 1.07 1.08 1.19
150x45x2.0 LSB
2000 1.18 1.07 1.11 1.30 3000 1.16 1.04 1.05 1.21
WSs – Web stiffeners at the supports providing flange twist restraint, WSTP – Web stiffeners at third points within the span, WS – Web stiffeners at the supports and at third span points. As seen in Tables 8.2 and 8.3, the elastic lateral distortional buckling moments (Mod)
were increased by 19 to 32% for the LSBs and spans considered here when web
stiffeners were used at the third points within the span and the supports. However,
when the web stiffeners were used only at third span points of span without any
stiffeners at the supports (without flange twist restraint at the support), the
improvement to elastic lateral distortional buckling moment was not significant. This
difference is small for 200x45x1.6 LSB with 4 m span and 150x45x2.0 LSB with 3
m span because these LSBs exhibit lateral torsional buckling with very small web
distortion for these spans. The results in the Tables 8.2 and 8.3 clearly demonstrate
the need to use web stiffeners at both the supports an third span points.
Figures 8.11 (a) to (d) show the elastic lateral distortional buckling modes obtained
for 200x45x1.6 LSB section from finite element analyses based on the experimental
finite element model with various configurations of web stiffeners. A comparison of
Figures 8.11 (a) and (b) clearly demonstrates that the use of web stiffeners at the
supports significantly reduced the local flange twist at the support. Comparison of
Figures 8.11 (a) and (c) shows that web distortion was reduced when web stiffeners
were used at third span points. Although the use of web stiffeners at third span points
reduced the web distortion the use of web stiffeners at the supports is also important
as this further improved the moment capacities by avoiding local flange twist as
shown in Figure 8.11 (d).
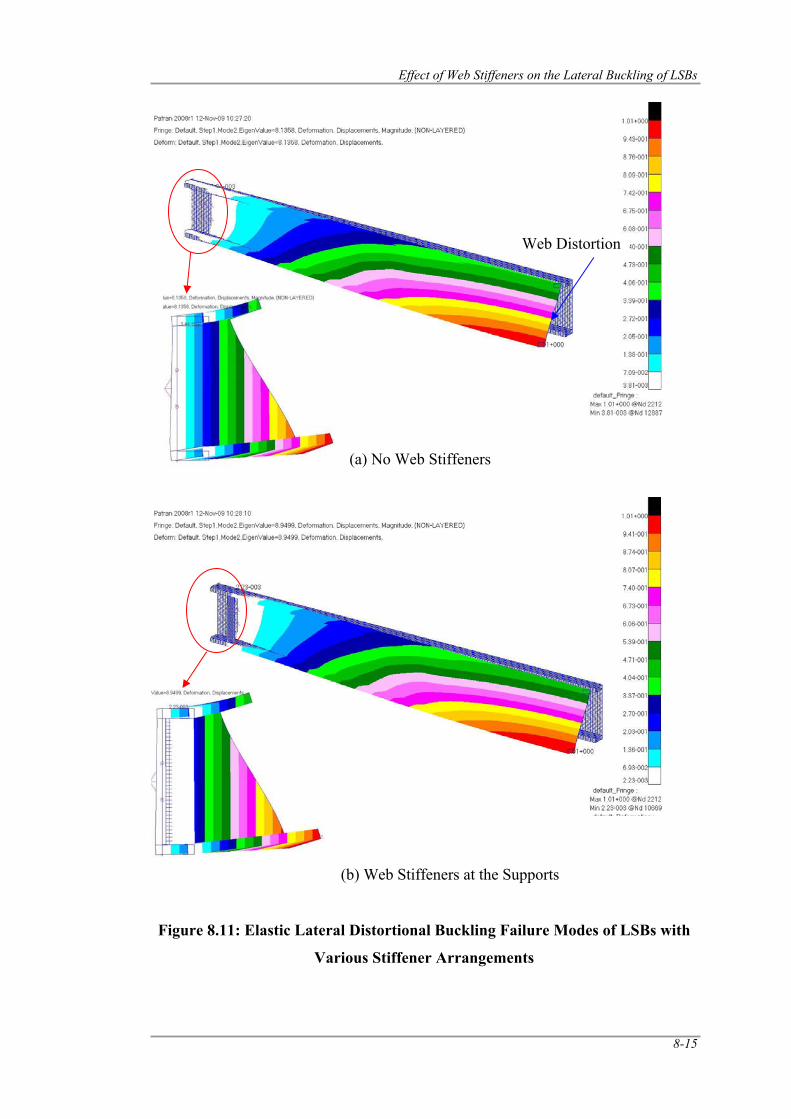
Effect of Web Stiffeners on the Lateral Buckling of LSBs
8-15
Figure 8.11: Elastic Lateral Distortional Buckling Failure Modes of LSBs with
Various Stiffener Arrangements
(a) No Web Stiffeners
Web Distortion
(b) Web Stiffeners at the Supports
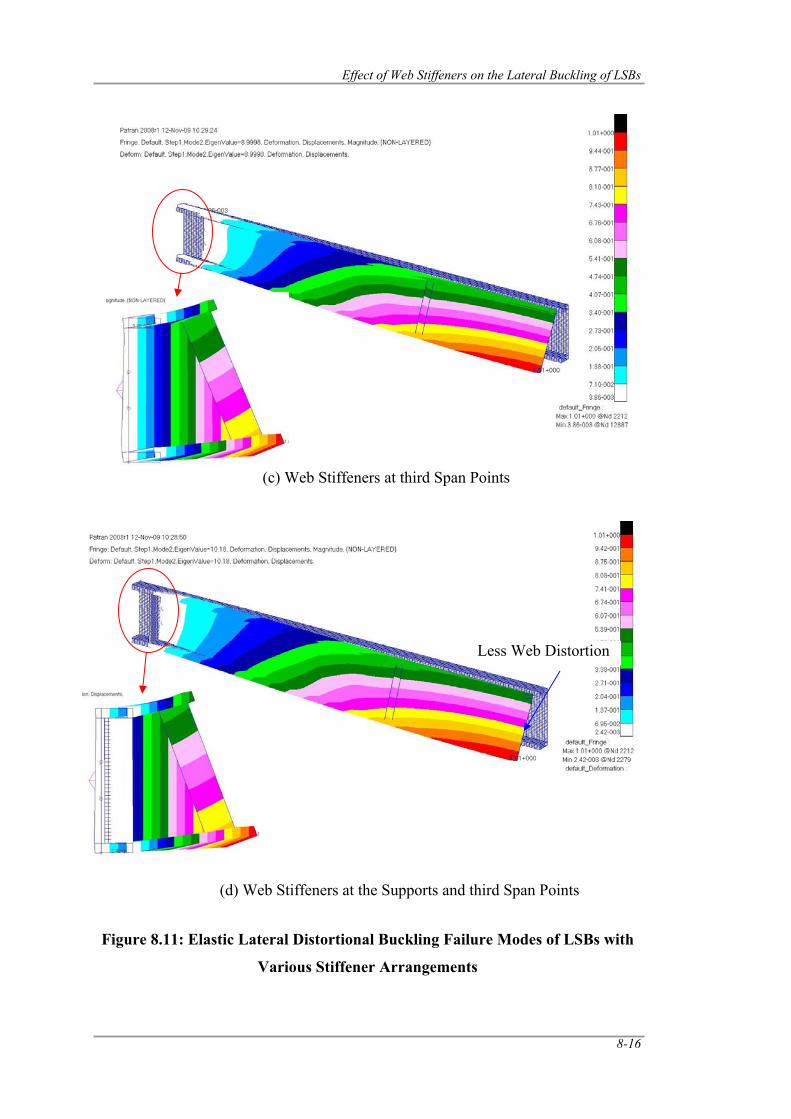
Effect of Web Stiffeners on the Lateral Buckling of LSBs
8-16
Figure 8.11: Elastic Lateral Distortional Buckling Failure Modes of LSBs with
Various Stiffener Arrangements
(c) Web Stiffeners at third Span Points
(d) Web Stiffeners at the Supports and third Span Points
Less Web Distortion
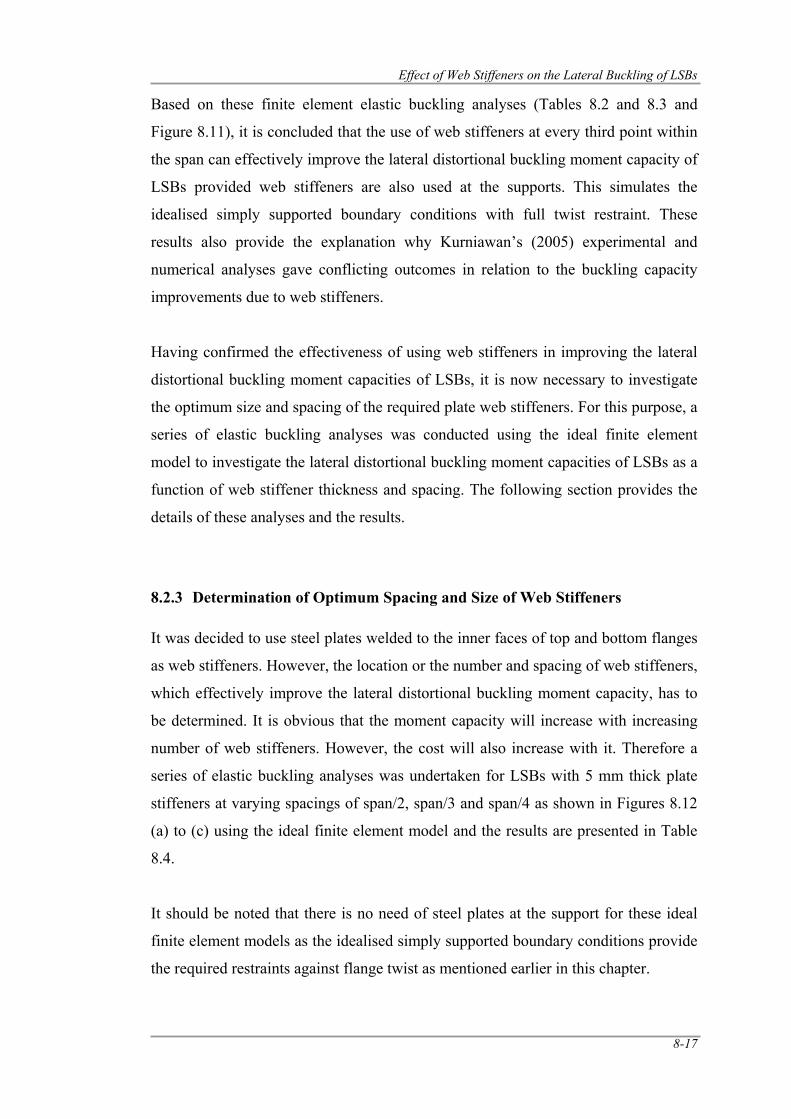
Effect of Web Stiffeners on the Lateral Buckling of LSBs
8-17
Based on these finite element elastic buckling analyses (Tables 8.2 and 8.3 and
Figure 8.11), it is concluded that the use of web stiffeners at every third point within
the span can effectively improve the lateral distortional buckling moment capacity of
LSBs provided web stiffeners are also used at the supports. This simulates the
idealised simply supported boundary conditions with full twist restraint. These
results also provide the explanation why Kurniawan’s (2005) experimental and
numerical analyses gave conflicting outcomes in relation to the buckling capacity
improvements due to web stiffeners.
Having confirmed the effectiveness of using web stiffeners in improving the lateral
distortional buckling moment capacities of LSBs, it is now necessary to investigate
the optimum size and spacing of the required plate web stiffeners. For this purpose, a
series of elastic buckling analyses was conducted using the ideal finite element
model to investigate the lateral distortional buckling moment capacities of LSBs as a
function of web stiffener thickness and spacing. The following section provides the
details of these analyses and the results.
8.2.3 Determination of Optimum Spacing and Size of Web Stiffeners
It was decided to use steel plates welded to the inner faces of top and bottom flanges
as web stiffeners. However, the location or the number and spacing of web stiffeners,
which effectively improve the lateral distortional buckling moment capacity, has to
be determined. It is obvious that the moment capacity will increase with increasing
number of web stiffeners. However, the cost will also increase with it. Therefore a
series of elastic buckling analyses was undertaken for LSBs with 5 mm thick plate
stiffeners at varying spacings of span/2, span/3 and span/4 as shown in Figures 8.12
(a) to (c) using the ideal finite element model and the results are presented in Table
8.4.
It should be noted that there is no need of steel plates at the support for these ideal
finite element models as the idealised simply supported boundary conditions provide
the required restraints against flange twist as mentioned earlier in this chapter.
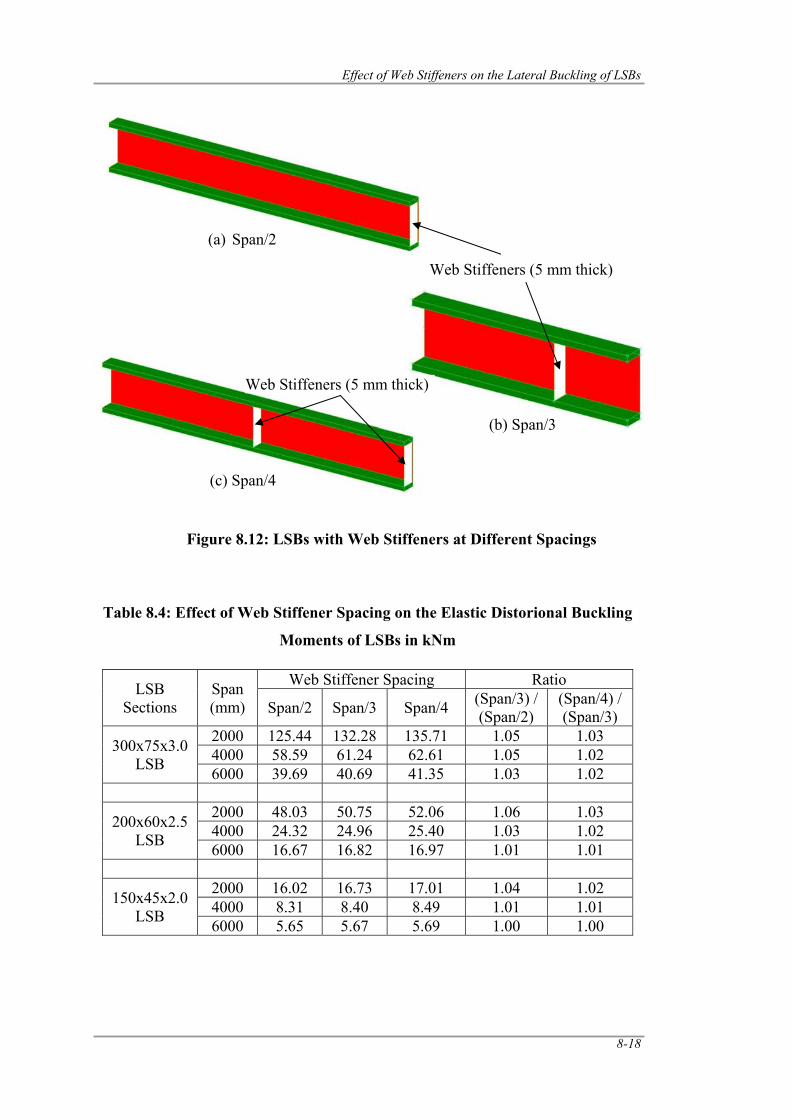
Effect of Web Stiffeners on the Lateral Buckling of LSBs
8-18
Figure 8.12: LSBs with Web Stiffeners at Different Spacings
Table 8.4: Effect of Web Stiffener Spacing on the Elastic Distorional Buckling
Moments of LSBs in kNm
LSB Sections
Span (mm)
Web Stiffener Spacing Ratio
Span/2 Span/3 Span/4 (Span/3) / (Span/2)
(Span/4) / (Span/3)
300x75x3.0 LSB
2000 125.44 132.28 135.71 1.05 1.03 4000 58.59 61.24 62.61 1.05 1.02 6000 39.69 40.69 41.35 1.03 1.02
200x60x2.5 LSB
2000 48.03 50.75 52.06 1.06 1.03 4000 24.32 24.96 25.40 1.03 1.02 6000 16.67 16.82 16.97 1.01 1.01
150x45x2.0 LSB
2000 16.02 16.73 17.01 1.04 1.02 4000 8.31 8.40 8.49 1.01 1.01 6000 5.65 5.67 5.69 1.00 1.00
(a) Span/2
(c) Span/4
(b) Span/3
Web Stiffeners (5 mm thick)
Web Stiffeners (5 mm thick)
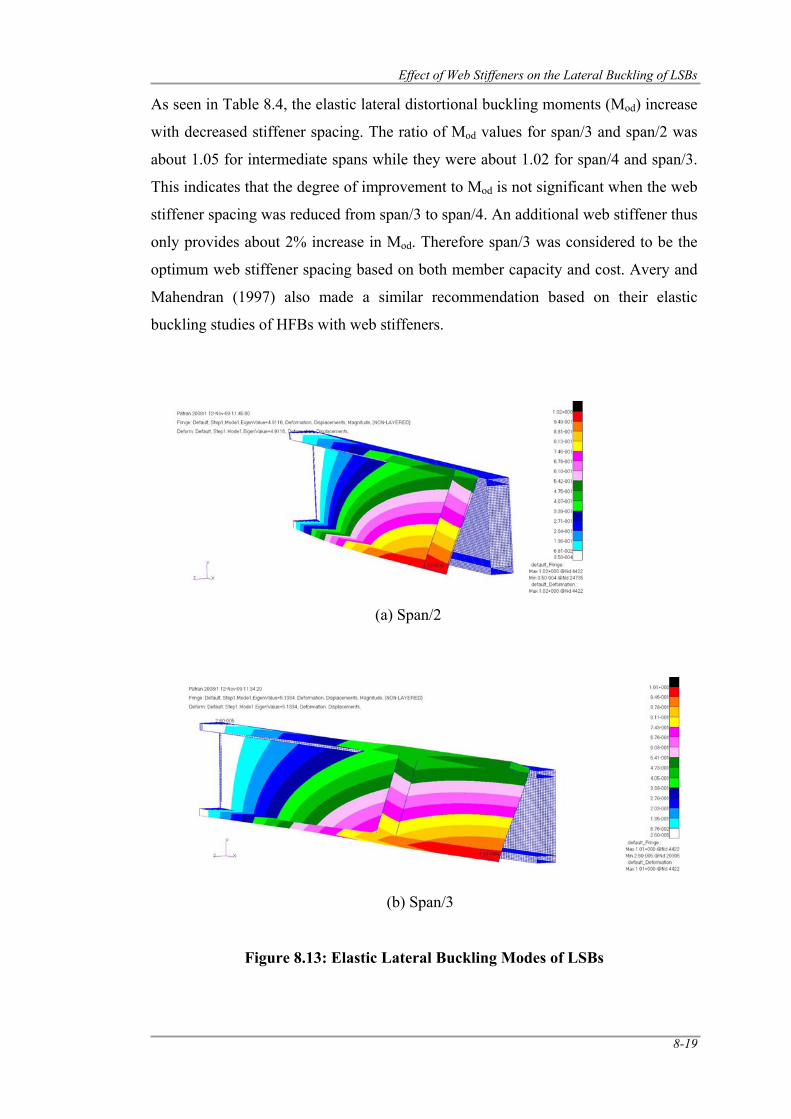
Effect of Web Stiffeners on the Lateral Buckling of LSBs
8-19
As seen in Table 8.4, the elastic lateral distortional buckling moments (Mod) increase
with decreased stiffener spacing. The ratio of Mod values for span/3 and span/2 was
about 1.05 for intermediate spans while they were about 1.02 for span/4 and span/3.
This indicates that the degree of improvement to Mod is not significant when the web
stiffener spacing was reduced from span/3 to span/4. An additional web stiffener thus
only provides about 2% increase in Mod. Therefore span/3 was considered to be the
optimum web stiffener spacing based on both member capacity and cost. Avery and
Mahendran (1997) also made a similar recommendation based on their elastic
buckling studies of HFBs with web stiffeners.
Figure 8.13: Elastic Lateral Buckling Modes of LSBs
(a) Span/2
(b) Span/3
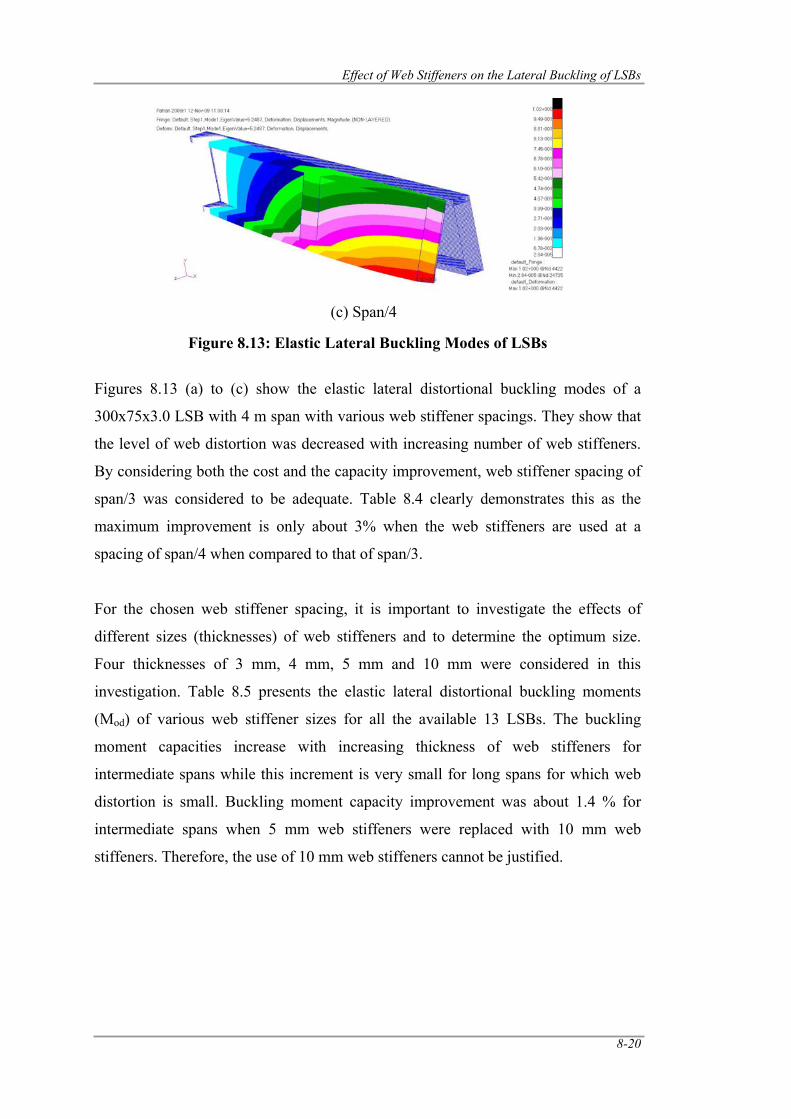
Effect of Web Stiffeners on the Lateral Buckling of LSBs
8-20
Figure 8.13: Elastic Lateral Buckling Modes of LSBs
Figures 8.13 (a) to (c) show the elastic lateral distortional buckling modes of a
300x75x3.0 LSB with 4 m span with various web stiffener spacings. They show that
the level of web distortion was decreased with increasing number of web stiffeners.
By considering both the cost and the capacity improvement, web stiffener spacing of
span/3 was considered to be adequate. Table 8.4 clearly demonstrates this as the
maximum improvement is only about 3% when the web stiffeners are used at a
spacing of span/4 when compared to that of span/3.
For the chosen web stiffener spacing, it is important to investigate the effects of
different sizes (thicknesses) of web stiffeners and to determine the optimum size.
Four thicknesses of 3 mm, 4 mm, 5 mm and 10 mm were considered in this
investigation. Table 8.5 presents the elastic lateral distortional buckling moments
(Mod) of various web stiffener sizes for all the available 13 LSBs. The buckling
moment capacities increase with increasing thickness of web stiffeners for
intermediate spans while this increment is very small for long spans for which web
distortion is small. Buckling moment capacity improvement was about 1.4 % for
intermediate spans when 5 mm web stiffeners were replaced with 10 mm web
stiffeners. Therefore, the use of 10 mm web stiffeners cannot be justified.
(c) Span/4
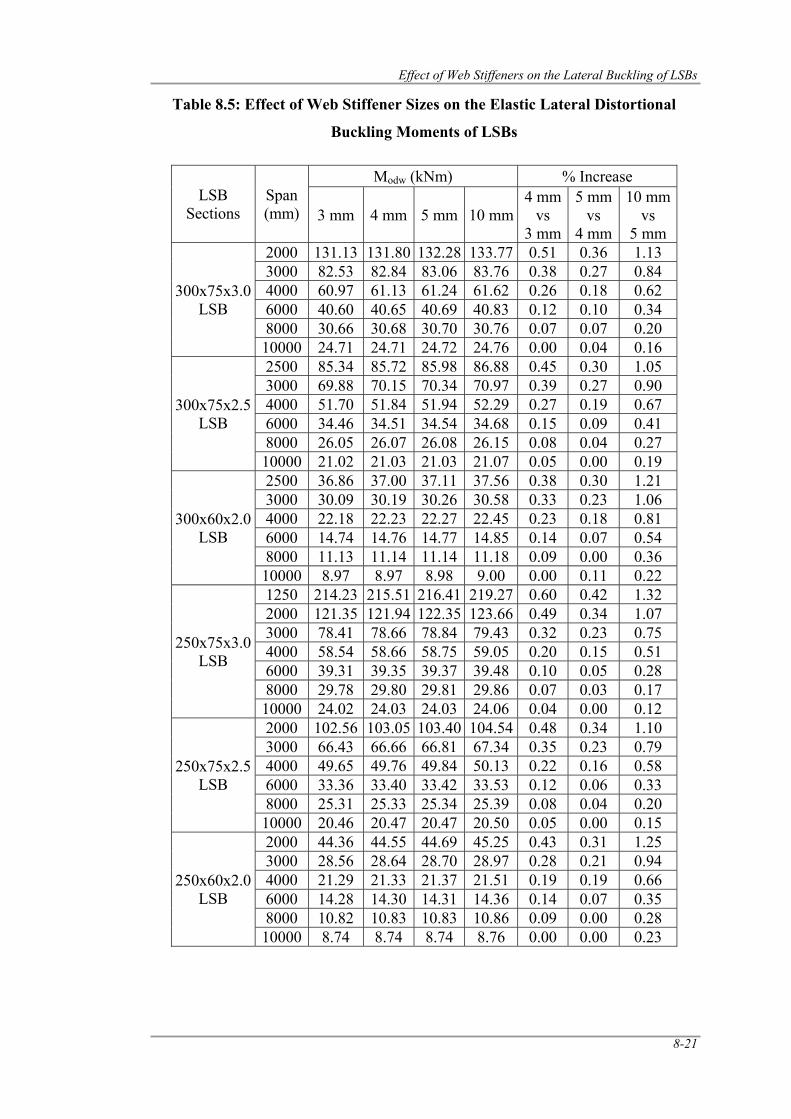
Effect of Web Stiffeners on the Lateral Buckling of LSBs
8-21
Table 8.5: Effect of Web Stiffener Sizes on the Elastic Lateral Distortional
Buckling Moments of LSBs
LSB Sections
Span (mm)
Modw (kNm) % Increase
3 mm 4 mm 5 mm 10 mm4 mm
vs 3 mm
5 mm vs
4 mm
10 mm vs
5 mm
300x75x3.0 LSB
2000 131.13 131.80 132.28 133.77 0.51 0.36 1.13 3000 82.53 82.84 83.06 83.76 0.38 0.27 0.84 4000 60.97 61.13 61.24 61.62 0.26 0.18 0.62 6000 40.60 40.65 40.69 40.83 0.12 0.10 0.34 8000 30.66 30.68 30.70 30.76 0.07 0.07 0.20 10000 24.71 24.71 24.72 24.76 0.00 0.04 0.16
300x75x2.5 LSB
2500 85.34 85.72 85.98 86.88 0.45 0.30 1.05 3000 69.88 70.15 70.34 70.97 0.39 0.27 0.90 4000 51.70 51.84 51.94 52.29 0.27 0.19 0.67 6000 34.46 34.51 34.54 34.68 0.15 0.09 0.41 8000 26.05 26.07 26.08 26.15 0.08 0.04 0.27 10000 21.02 21.03 21.03 21.07 0.05 0.00 0.19
300x60x2.0 LSB
2500 36.86 37.00 37.11 37.56 0.38 0.30 1.21 3000 30.09 30.19 30.26 30.58 0.33 0.23 1.06 4000 22.18 22.23 22.27 22.45 0.23 0.18 0.81 6000 14.74 14.76 14.77 14.85 0.14 0.07 0.54 8000 11.13 11.14 11.14 11.18 0.09 0.00 0.36 10000 8.97 8.97 8.98 9.00 0.00 0.11 0.22
250x75x3.0 LSB
1250 214.23 215.51 216.41 219.27 0.60 0.42 1.32 2000 121.35 121.94 122.35 123.66 0.49 0.34 1.07 3000 78.41 78.66 78.84 79.43 0.32 0.23 0.75 4000 58.54 58.66 58.75 59.05 0.20 0.15 0.51 6000 39.31 39.35 39.37 39.48 0.10 0.05 0.28 8000 29.78 29.80 29.81 29.86 0.07 0.03 0.17 10000 24.02 24.03 24.03 24.06 0.04 0.00 0.12
250x75x2.5 LSB
2000 102.56 103.05 103.40 104.54 0.48 0.34 1.10 3000 66.43 66.66 66.81 67.34 0.35 0.23 0.79 4000 49.65 49.76 49.84 50.13 0.22 0.16 0.58 6000 33.36 33.40 33.42 33.53 0.12 0.06 0.33 8000 25.31 25.33 25.34 25.39 0.08 0.04 0.20 10000 20.46 20.47 20.47 20.50 0.05 0.00 0.15
250x60x2.0 LSB
2000 44.36 44.55 44.69 45.25 0.43 0.31 1.25 3000 28.56 28.64 28.70 28.97 0.28 0.21 0.94 4000 21.29 21.33 21.37 21.51 0.19 0.19 0.66 6000 14.28 14.30 14.31 14.36 0.14 0.07 0.35 8000 10.82 10.83 10.83 10.86 0.09 0.00 0.28 10000 8.74 8.74 8.74 8.76 0.00 0.00 0.23
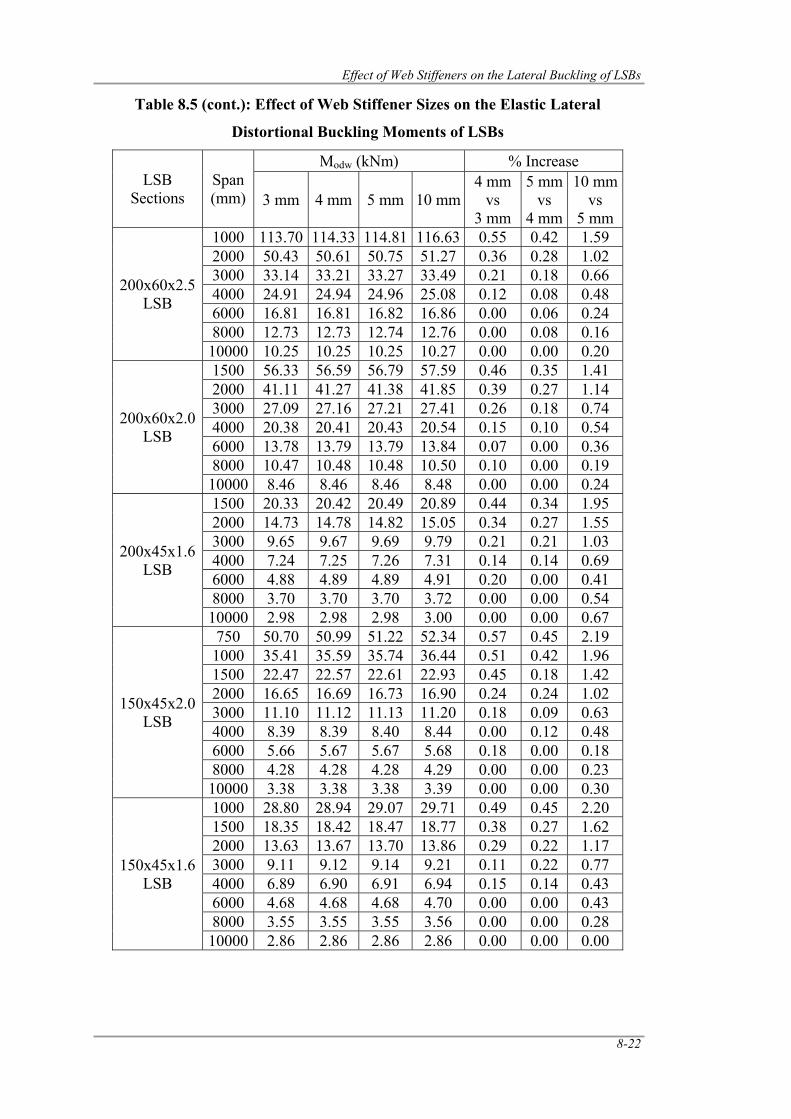
Effect of Web Stiffeners on the Lateral Buckling of LSBs
8-22
Table 8.5 (cont.): Effect of Web Stiffener Sizes on the Elastic Lateral
Distortional Buckling Moments of LSBs
LSB Sections
Span (mm)
Modw (kNm) % Increase
3 mm 4 mm 5 mm 10 mm4 mm
vs 3 mm
5 mm vs
4 mm
10 mm vs
5 mm
200x60x2.5 LSB
1000 113.70 114.33 114.81 116.63 0.55 0.42 1.59 2000 50.43 50.61 50.75 51.27 0.36 0.28 1.02 3000 33.14 33.21 33.27 33.49 0.21 0.18 0.66 4000 24.91 24.94 24.96 25.08 0.12 0.08 0.48 6000 16.81 16.81 16.82 16.86 0.00 0.06 0.24 8000 12.73 12.73 12.74 12.76 0.00 0.08 0.16 10000 10.25 10.25 10.25 10.27 0.00 0.00 0.20
200x60x2.0 LSB
1500 56.33 56.59 56.79 57.59 0.46 0.35 1.41 2000 41.11 41.27 41.38 41.85 0.39 0.27 1.14 3000 27.09 27.16 27.21 27.41 0.26 0.18 0.74 4000 20.38 20.41 20.43 20.54 0.15 0.10 0.54 6000 13.78 13.79 13.79 13.84 0.07 0.00 0.36 8000 10.47 10.48 10.48 10.50 0.10 0.00 0.19 10000 8.46 8.46 8.46 8.48 0.00 0.00 0.24
200x45x1.6 LSB
1500 20.33 20.42 20.49 20.89 0.44 0.34 1.95 2000 14.73 14.78 14.82 15.05 0.34 0.27 1.55 3000 9.65 9.67 9.69 9.79 0.21 0.21 1.03 4000 7.24 7.25 7.26 7.31 0.14 0.14 0.69 6000 4.88 4.89 4.89 4.91 0.20 0.00 0.41 8000 3.70 3.70 3.70 3.72 0.00 0.00 0.54 10000 2.98 2.98 2.98 3.00 0.00 0.00 0.67
150x45x2.0 LSB
750 50.70 50.99 51.22 52.34 0.57 0.45 2.19 1000 35.41 35.59 35.74 36.44 0.51 0.42 1.96 1500 22.47 22.57 22.61 22.93 0.45 0.18 1.42 2000 16.65 16.69 16.73 16.90 0.24 0.24 1.02 3000 11.10 11.12 11.13 11.20 0.18 0.09 0.63 4000 8.39 8.39 8.40 8.44 0.00 0.12 0.48 6000 5.66 5.67 5.67 5.68 0.18 0.00 0.18 8000 4.28 4.28 4.28 4.29 0.00 0.00 0.23 10000 3.38 3.38 3.38 3.39 0.00 0.00 0.30
150x45x1.6 LSB
1000 28.80 28.94 29.07 29.71 0.49 0.45 2.20 1500 18.35 18.42 18.47 18.77 0.38 0.27 1.62 2000 13.63 13.67 13.70 13.86 0.29 0.22 1.17 3000 9.11 9.12 9.14 9.21 0.11 0.22 0.77 4000 6.89 6.90 6.91 6.94 0.15 0.14 0.43 6000 4.68 4.68 4.68 4.70 0.00 0.00 0.43 8000 3.55 3.55 3.55 3.56 0.00 0.00 0.28 10000 2.86 2.86 2.86 2.86 0.00 0.00 0.00
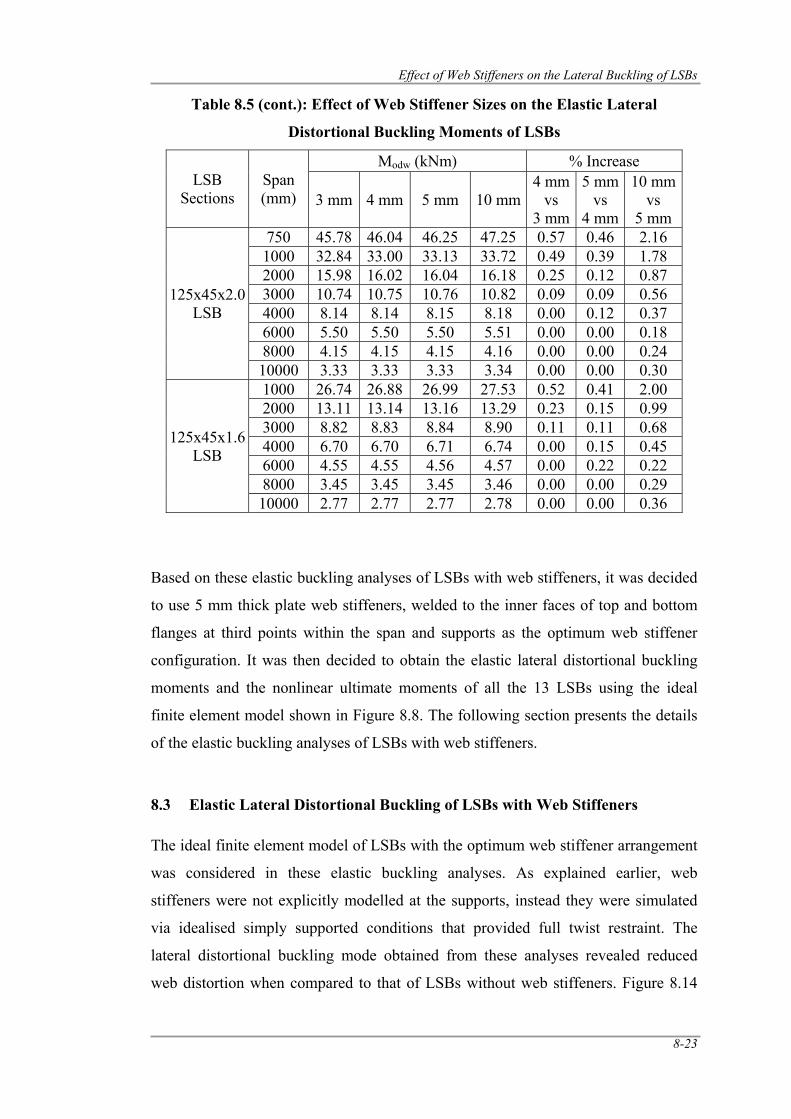
Effect of Web Stiffeners on the Lateral Buckling of LSBs
8-23
Table 8.5 (cont.): Effect of Web Stiffener Sizes on the Elastic Lateral
Distortional Buckling Moments of LSBs
LSB Sections
Span (mm)
Modw (kNm) % Increase
3 mm 4 mm 5 mm 10 mm4 mm
vs 3 mm
5 mm vs
4 mm
10 mm vs
5 mm
125x45x2.0 LSB
750 45.78 46.04 46.25 47.25 0.57 0.46 2.16 1000 32.84 33.00 33.13 33.72 0.49 0.39 1.78 2000 15.98 16.02 16.04 16.18 0.25 0.12 0.87 3000 10.74 10.75 10.76 10.82 0.09 0.09 0.56 4000 8.14 8.14 8.15 8.18 0.00 0.12 0.37 6000 5.50 5.50 5.50 5.51 0.00 0.00 0.18 8000 4.15 4.15 4.15 4.16 0.00 0.00 0.24 10000 3.33 3.33 3.33 3.34 0.00 0.00 0.30
125x45x1.6 LSB
1000 26.74 26.88 26.99 27.53 0.52 0.41 2.00 2000 13.11 13.14 13.16 13.29 0.23 0.15 0.99 3000 8.82 8.83 8.84 8.90 0.11 0.11 0.68 4000 6.70 6.70 6.71 6.74 0.00 0.15 0.45 6000 4.55 4.55 4.56 4.57 0.00 0.22 0.22 8000 3.45 3.45 3.45 3.46 0.00 0.00 0.29 10000 2.77 2.77 2.77 2.78 0.00 0.00 0.36
Based on these elastic buckling analyses of LSBs with web stiffeners, it was decided
to use 5 mm thick plate web stiffeners, welded to the inner faces of top and bottom
flanges at third points within the span and supports as the optimum web stiffener
configuration. It was then decided to obtain the elastic lateral distortional buckling
moments and the nonlinear ultimate moments of all the 13 LSBs using the ideal
finite element model shown in Figure 8.8. The following section presents the details
of the elastic buckling analyses of LSBs with web stiffeners.
8.3 Elastic Lateral Distortional Buckling of LSBs with Web Stiffeners
The ideal finite element model of LSBs with the optimum web stiffener arrangement
was considered in these elastic buckling analyses. As explained earlier, web
stiffeners were not explicitly modelled at the supports, instead they were simulated
via idealised simply supported conditions that provided full twist restraint. The
lateral distortional buckling mode obtained from these analyses revealed reduced
web distortion when compared to that of LSBs without web stiffeners. Figure 8.14
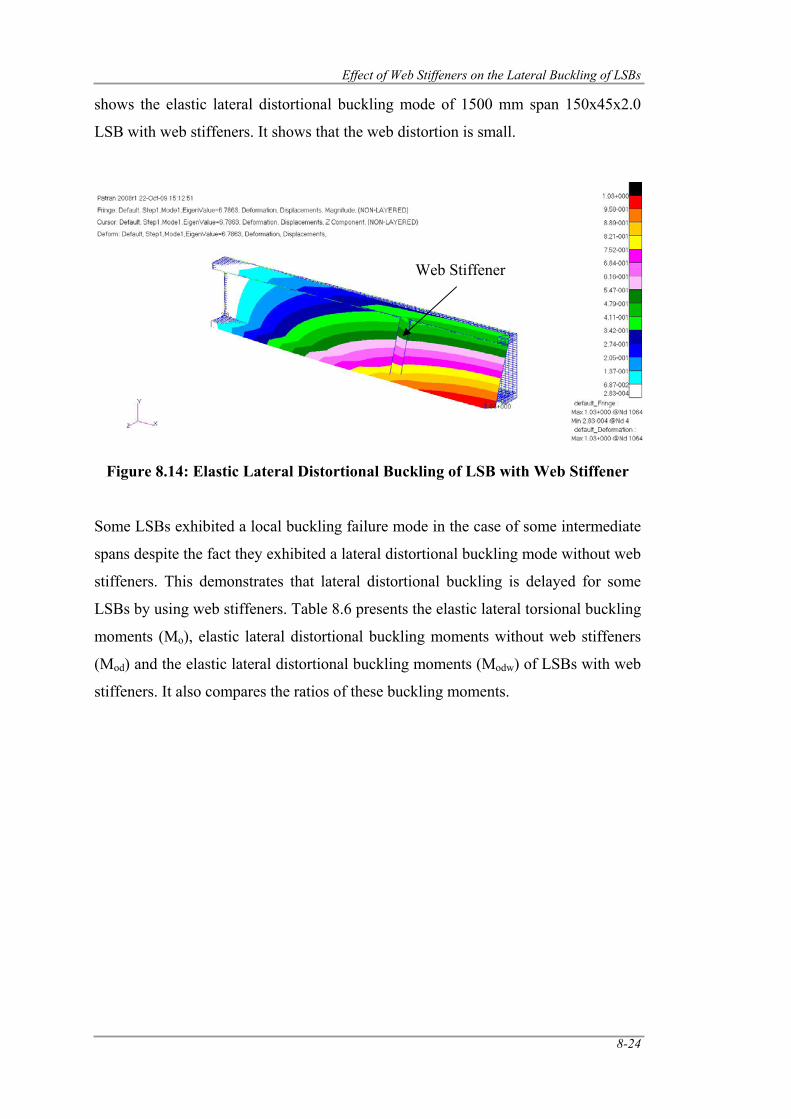
Effect of Web Stiffeners on the Lateral Buckling of LSBs
8-24
shows the elastic lateral distortional buckling mode of 1500 mm span 150x45x2.0
LSB with web stiffeners. It shows that the web distortion is small.
Figure 8.14: Elastic Lateral Distortional Buckling of LSB with Web Stiffener Some LSBs exhibited a local buckling failure mode in the case of some intermediate
spans despite the fact they exhibited a lateral distortional buckling mode without web
stiffeners. This demonstrates that lateral distortional buckling is delayed for some
LSBs by using web stiffeners. Table 8.6 presents the elastic lateral torsional buckling
moments (Mo), elastic lateral distortional buckling moments without web stiffeners
(Mod) and the elastic lateral distortional buckling moments (Modw) of LSBs with web
stiffeners. It also compares the ratios of these buckling moments.
Web Stiffener
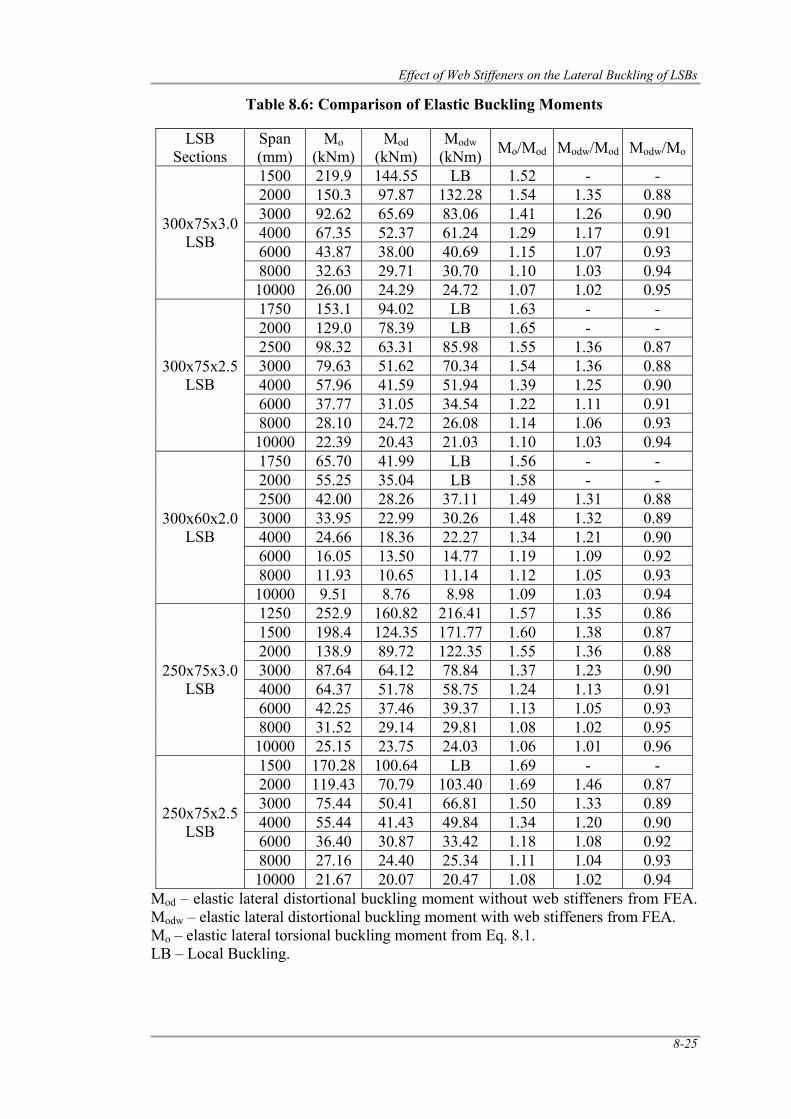
Effect of Web Stiffeners on the Lateral Buckling of LSBs
8-25
Table 8.6: Comparison of Elastic Buckling Moments
LSB Sections
Span (mm)
Mo (kNm)
Mod (kNm)
Modw (kNm) Mo/Mod Modw/Mod Modw/Mo
300x75x3.0 LSB
1500 219.9 144.55 LB 1.52 - - 2000 150.3 97.87 132.28 1.54 1.35 0.88 3000 92.62 65.69 83.06 1.41 1.26 0.90 4000 67.35 52.37 61.24 1.29 1.17 0.91 6000 43.87 38.00 40.69 1.15 1.07 0.93 8000 32.63 29.71 30.70 1.10 1.03 0.94 10000 26.00 24.29 24.72 1.07 1.02 0.95
300x75x2.5 LSB
1750 153.1 94.02 LB 1.63 - - 2000 129.0 78.39 LB 1.65 - - 2500 98.32 63.31 85.98 1.55 1.36 0.87 3000 79.63 51.62 70.34 1.54 1.36 0.88 4000 57.96 41.59 51.94 1.39 1.25 0.90 6000 37.77 31.05 34.54 1.22 1.11 0.91 8000 28.10 24.72 26.08 1.14 1.06 0.93 10000 22.39 20.43 21.03 1.10 1.03 0.94
300x60x2.0 LSB
1750 65.70 41.99 LB 1.56 - - 2000 55.25 35.04 LB 1.58 - - 2500 42.00 28.26 37.11 1.49 1.31 0.88 3000 33.95 22.99 30.26 1.48 1.32 0.89 4000 24.66 18.36 22.27 1.34 1.21 0.90 6000 16.05 13.50 14.77 1.19 1.09 0.92 8000 11.93 10.65 11.14 1.12 1.05 0.93 10000 9.51 8.76 8.98 1.09 1.03 0.94
250x75x3.0 LSB
1250 252.9 160.82 216.41 1.57 1.35 0.86 1500 198.4 124.35 171.77 1.60 1.38 0.87 2000 138.9 89.72 122.35 1.55 1.36 0.88 3000 87.64 64.12 78.84 1.37 1.23 0.90 4000 64.37 51.78 58.75 1.24 1.13 0.91 6000 42.25 37.46 39.37 1.13 1.05 0.93 8000 31.52 29.14 29.81 1.08 1.02 0.95 10000 25.15 23.75 24.03 1.06 1.01 0.96
250x75x2.5 LSB
1500 170.28 100.64 LB 1.69 - - 2000 119.43 70.79 103.40 1.69 1.46 0.87 3000 75.44 50.41 66.81 1.50 1.33 0.89 4000 55.44 41.43 49.84 1.34 1.20 0.90 6000 36.40 30.87 33.42 1.18 1.08 0.92 8000 27.16 24.40 25.34 1.11 1.04 0.93 10000 21.67 20.07 20.47 1.08 1.02 0.94
Mod – elastic lateral distortional buckling moment without web stiffeners from FEA. Modw – elastic lateral distortional buckling moment with web stiffeners from FEA. Mo – elastic lateral torsional buckling moment from Eq. 8.1. LB – Local Buckling.
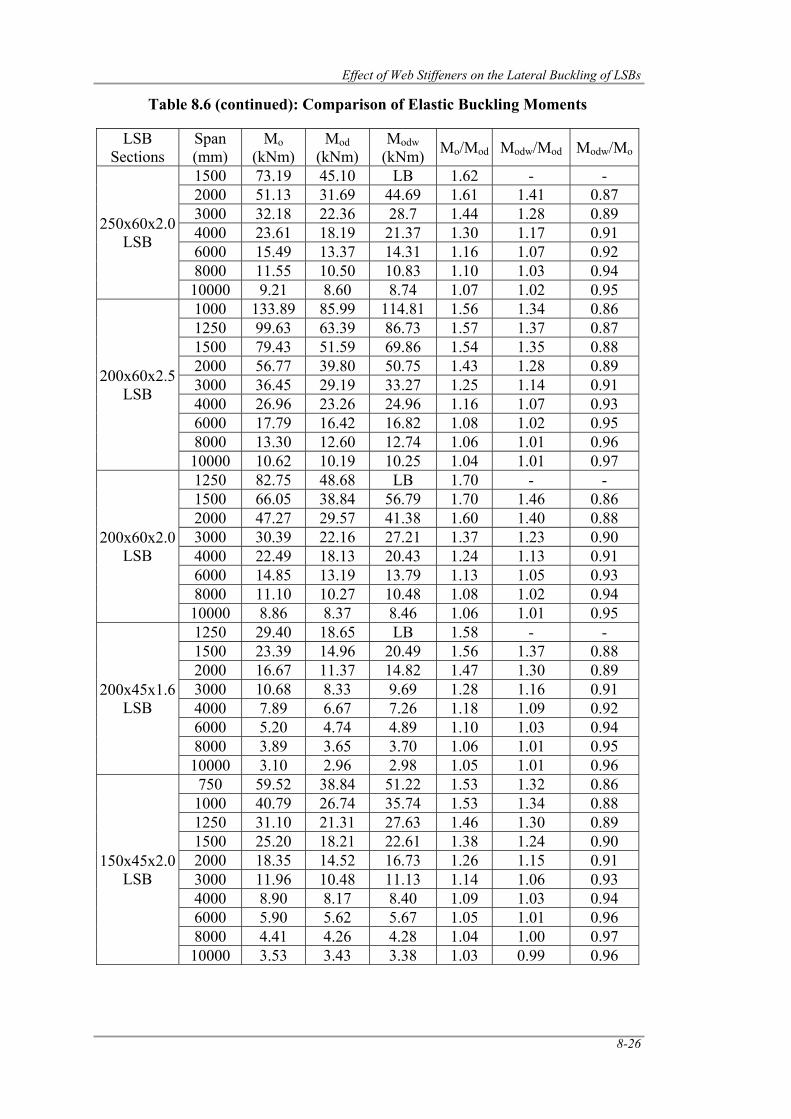
Effect of Web Stiffeners on the Lateral Buckling of LSBs
8-26
Table 8.6 (continued): Comparison of Elastic Buckling Moments
LSB Sections
Span (mm)
Mo (kNm)
Mod (kNm)
Modw (kNm) Mo/Mod Modw/Mod Modw/Mo
250x60x2.0 LSB
1500 73.19 45.10 LB 1.62 - - 2000 51.13 31.69 44.69 1.61 1.41 0.87 3000 32.18 22.36 28.7 1.44 1.28 0.89 4000 23.61 18.19 21.37 1.30 1.17 0.91 6000 15.49 13.37 14.31 1.16 1.07 0.92 8000 11.55 10.50 10.83 1.10 1.03 0.94 10000 9.21 8.60 8.74 1.07 1.02 0.95
200x60x2.5 LSB
1000 133.89 85.99 114.81 1.56 1.34 0.86 1250 99.63 63.39 86.73 1.57 1.37 0.87 1500 79.43 51.59 69.86 1.54 1.35 0.88 2000 56.77 39.80 50.75 1.43 1.28 0.89 3000 36.45 29.19 33.27 1.25 1.14 0.91 4000 26.96 23.26 24.96 1.16 1.07 0.93 6000 17.79 16.42 16.82 1.08 1.02 0.95 8000 13.30 12.60 12.74 1.06 1.01 0.96 10000 10.62 10.19 10.25 1.04 1.01 0.97
200x60x2.0 LSB
1250 82.75 48.68 LB 1.70 - - 1500 66.05 38.84 56.79 1.70 1.46 0.86 2000 47.27 29.57 41.38 1.60 1.40 0.88 3000 30.39 22.16 27.21 1.37 1.23 0.90 4000 22.49 18.13 20.43 1.24 1.13 0.91 6000 14.85 13.19 13.79 1.13 1.05 0.93 8000 11.10 10.27 10.48 1.08 1.02 0.94 10000 8.86 8.37 8.46 1.06 1.01 0.95
200x45x1.6 LSB
1250 29.40 18.65 LB 1.58 - - 1500 23.39 14.96 20.49 1.56 1.37 0.88 2000 16.67 11.37 14.82 1.47 1.30 0.89 3000 10.68 8.33 9.69 1.28 1.16 0.91 4000 7.89 6.67 7.26 1.18 1.09 0.92 6000 5.20 4.74 4.89 1.10 1.03 0.94 8000 3.89 3.65 3.70 1.06 1.01 0.95 10000 3.10 2.96 2.98 1.05 1.01 0.96
150x45x2.0 LSB
750 59.52 38.84 51.22 1.53 1.32 0.86 1000 40.79 26.74 35.74 1.53 1.34 0.88 1250 31.10 21.31 27.63 1.46 1.30 0.89 1500 25.20 18.21 22.61 1.38 1.24 0.90 2000 18.35 14.52 16.73 1.26 1.15 0.91 3000 11.96 10.48 11.13 1.14 1.06 0.93 4000 8.90 8.17 8.40 1.09 1.03 0.94 6000 5.90 5.62 5.67 1.05 1.01 0.96 8000 4.41 4.26 4.28 1.04 1.00 0.97 10000 3.53 3.43 3.38 1.03 0.99 0.96
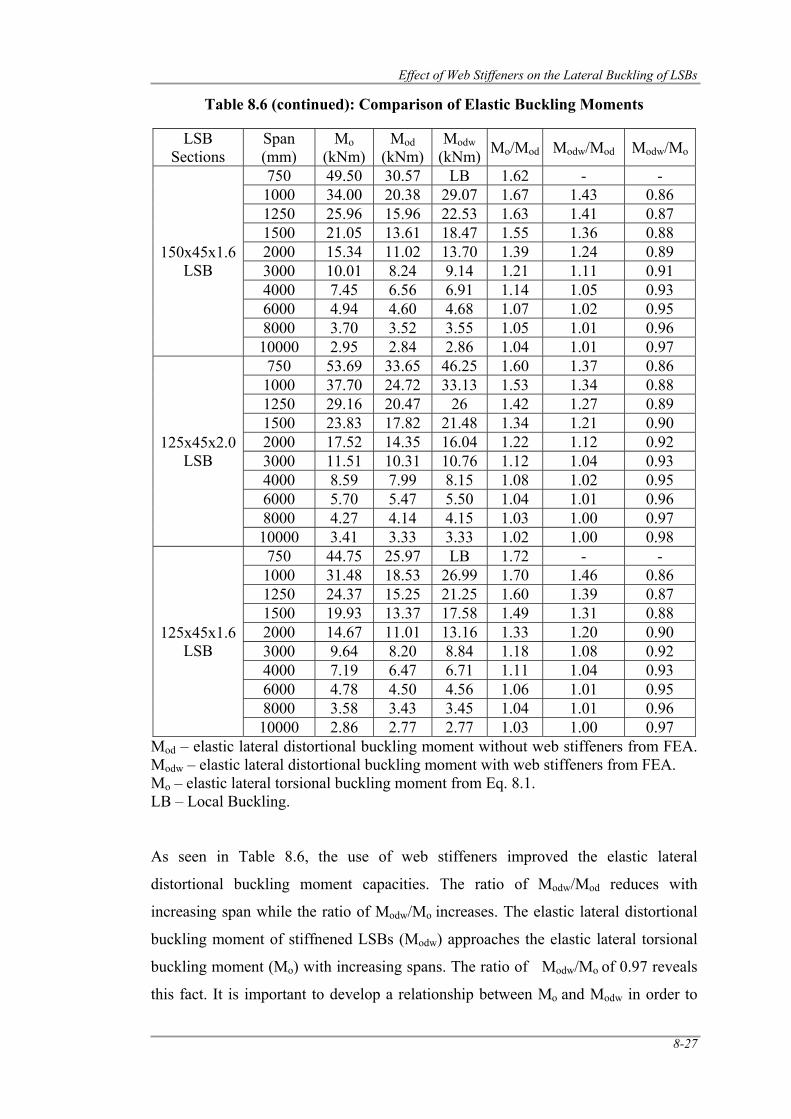
Effect of Web Stiffeners on the Lateral Buckling of LSBs
8-27
Table 8.6 (continued): Comparison of Elastic Buckling Moments
LSB Sections
Span (mm)
Mo (kNm)
Mod (kNm)
Modw (kNm) Mo/Mod Modw/Mod Modw/Mo
150x45x1.6 LSB
750 49.50 30.57 LB 1.62 - - 1000 34.00 20.38 29.07 1.67 1.43 0.86 1250 25.96 15.96 22.53 1.63 1.41 0.87 1500 21.05 13.61 18.47 1.55 1.36 0.88 2000 15.34 11.02 13.70 1.39 1.24 0.89 3000 10.01 8.24 9.14 1.21 1.11 0.91 4000 7.45 6.56 6.91 1.14 1.05 0.93 6000 4.94 4.60 4.68 1.07 1.02 0.95 8000 3.70 3.52 3.55 1.05 1.01 0.96 10000 2.95 2.84 2.86 1.04 1.01 0.97
125x45x2.0 LSB
750 53.69 33.65 46.25 1.60 1.37 0.86 1000 37.70 24.72 33.13 1.53 1.34 0.88 1250 29.16 20.47 26 1.42 1.27 0.89 1500 23.83 17.82 21.48 1.34 1.21 0.90 2000 17.52 14.35 16.04 1.22 1.12 0.92 3000 11.51 10.31 10.76 1.12 1.04 0.93 4000 8.59 7.99 8.15 1.08 1.02 0.95 6000 5.70 5.47 5.50 1.04 1.01 0.96 8000 4.27 4.14 4.15 1.03 1.00 0.97 10000 3.41 3.33 3.33 1.02 1.00 0.98
125x45x1.6 LSB
750 44.75 25.97 LB 1.72 - - 1000 31.48 18.53 26.99 1.70 1.46 0.86 1250 24.37 15.25 21.25 1.60 1.39 0.87 1500 19.93 13.37 17.58 1.49 1.31 0.88 2000 14.67 11.01 13.16 1.33 1.20 0.90 3000 9.64 8.20 8.84 1.18 1.08 0.92 4000 7.19 6.47 6.71 1.11 1.04 0.93 6000 4.78 4.50 4.56 1.06 1.01 0.95 8000 3.58 3.43 3.45 1.04 1.01 0.96 10000 2.86 2.77 2.77 1.03 1.00 0.97
Mod – elastic lateral distortional buckling moment without web stiffeners from FEA. Modw – elastic lateral distortional buckling moment with web stiffeners from FEA. Mo – elastic lateral torsional buckling moment from Eq. 8.1. LB – Local Buckling. As seen in Table 8.6, the use of web stiffeners improved the elastic lateral
distortional buckling moment capacities. The ratio of Modw/Mod reduces with
increasing span while the ratio of Modw/Mo increases. The elastic lateral distortional
buckling moment of stiffnened LSBs (Modw) approaches the elastic lateral torsional
buckling moment (Mo) with increasing spans. The ratio of Modw/Mo of 0.97 reveals
this fact. It is important to develop a relationship between Mo and Modw in order to
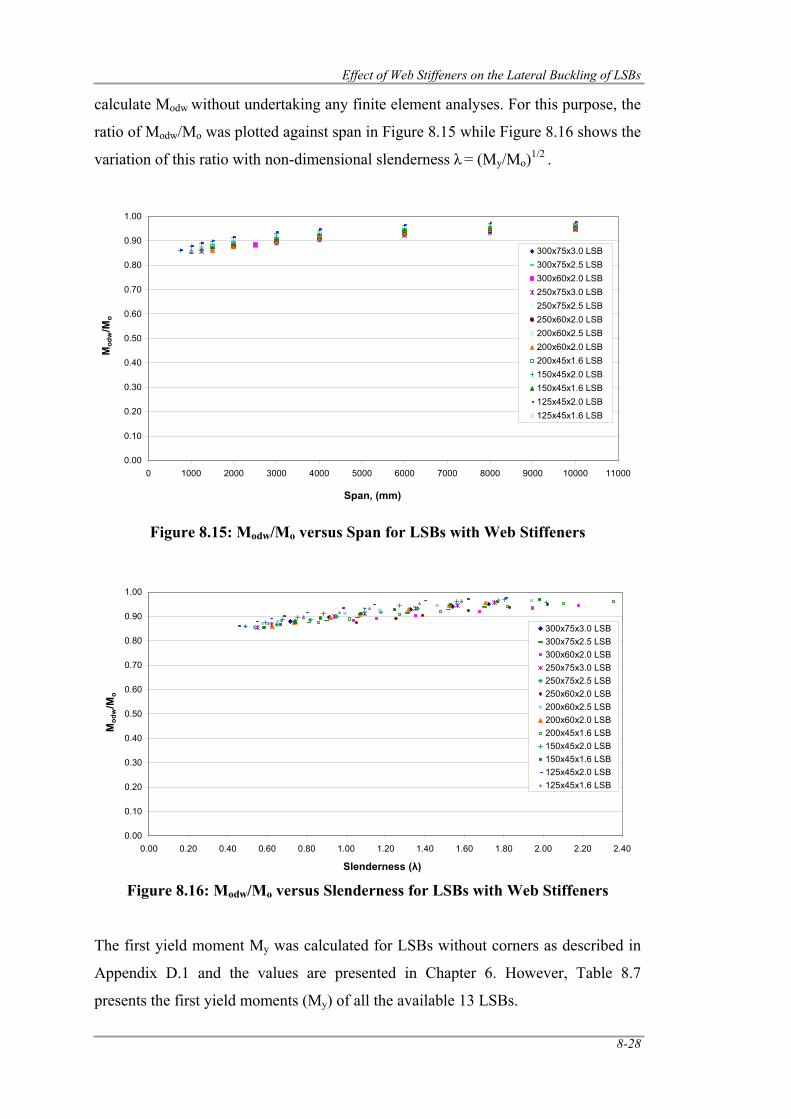
Effect of Web Stiffeners on the Lateral Buckling of LSBs
8-28
calculate Modw without undertaking any finite element analyses. For this purpose, the
ratio of Modw/Mo was plotted against span in Figure 8.15 while Figure 8.16 shows the
variation of this ratio with non-dimensional slenderness λ = (My/Mo)1/2 .
Figure 8.15: Modw/Mo versus Span for LSBs with Web Stiffeners
Figure 8.16: Modw/Mo versus Slenderness for LSBs with Web Stiffeners
The first yield moment My was calculated for LSBs without corners as described in
Appendix D.1 and the values are presented in Chapter 6. However, Table 8.7
presents the first yield moments (My) of all the available 13 LSBs.
0.00
0.10
0.20
0.30
0.40
0.50
0.60
0.70
0.80
0.90
1.00
0 1000 2000 3000 4000 5000 6000 7000 8000 9000 10000 11000
Span, (mm)
Mod
w/M
o
300x75x3.0 LSB300x75x2.5 LSB300x60x2.0 LSB250x75x3.0 LSB250x75x2.5 LSB250x60x2.0 LSB200x60x2.5 LSB200x60x2.0 LSB200x45x1.6 LSB150x45x2.0 LSB150x45x1.6 LSB125x45x2.0 LSB125x45x1.6 LSB
0.00
0.10
0.20
0.30
0.40
0.50
0.60
0.70
0.80
0.90
1.00
0.00 0.20 0.40 0.60 0.80 1.00 1.20 1.40 1.60 1.80 2.00 2.20 2.40
Slenderness (λ)
Mod
w/M
o
300x75x3.0 LSB300x75x2.5 LSB300x60x2.0 LSB250x75x3.0 LSB250x75x2.5 LSB250x60x2.0 LSB200x60x2.5 LSB200x60x2.0 LSB200x45x1.6 LSB150x45x2.0 LSB150x45x1.6 LSB125x45x2.0 LSB125x45x1.6 LSB
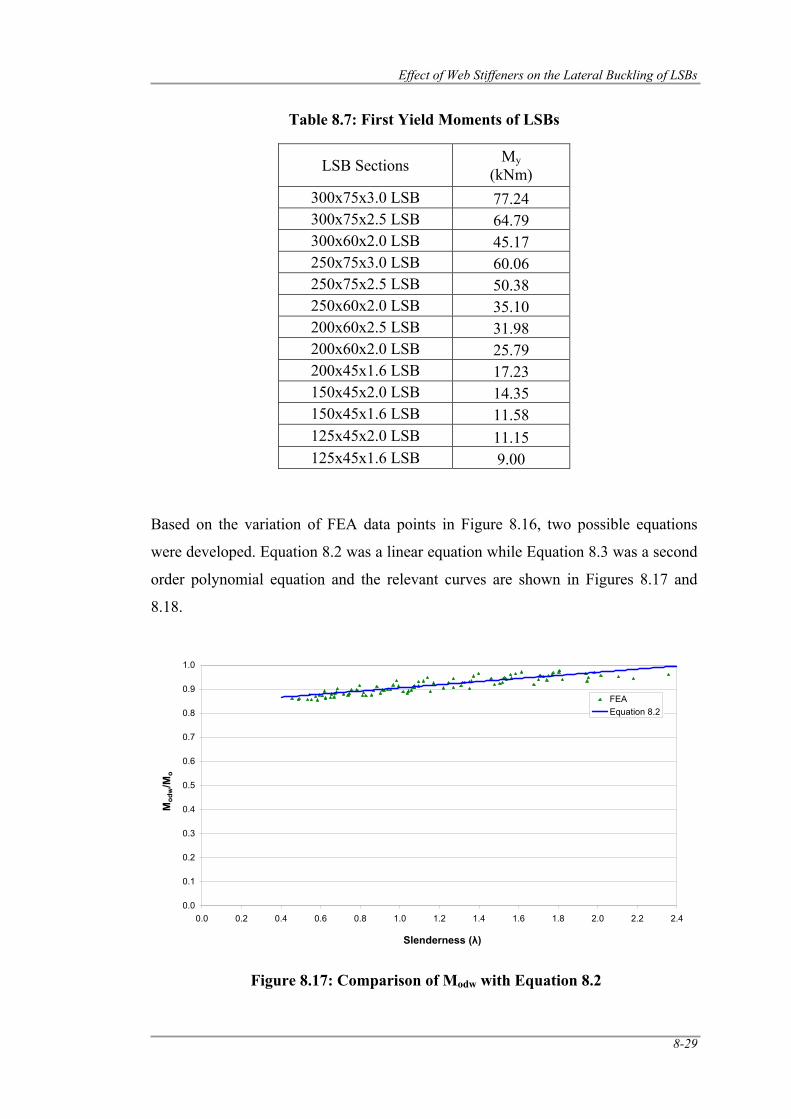
Effect of Web Stiffeners on the Lateral Buckling of LSBs
8-29
Table 8.7: First Yield Moments of LSBs
LSB Sections My (kNm)
300x75x3.0 LSB 77.24 300x75x2.5 LSB 64.79 300x60x2.0 LSB 45.17 250x75x3.0 LSB 60.06 250x75x2.5 LSB 50.38 250x60x2.0 LSB 35.10 200x60x2.5 LSB 31.98 200x60x2.0 LSB 25.79 200x45x1.6 LSB 17.23 150x45x2.0 LSB 14.35 150x45x1.6 LSB 11.58 125x45x2.0 LSB 11.15 125x45x1.6 LSB 9.00
Based on the variation of FEA data points in Figure 8.16, two possible equations
were developed. Equation 8.2 was a linear equation while Equation 8.3 was a second
order polynomial equation and the relevant curves are shown in Figures 8.17 and
8.18.
Figure 8.17: Comparison of Modw with Equation 8.2
0.0
0.1
0.2
0.3
0.4
0.5
0.6
0.7
0.8
0.9
1.0
0.0 0.2 0.4 0.6 0.8 1.0 1.2 1.4 1.6 1.8 2.0 2.2 2.4
Slenderness (λ)
Mod
w/M
o
FEAEquation 8.2
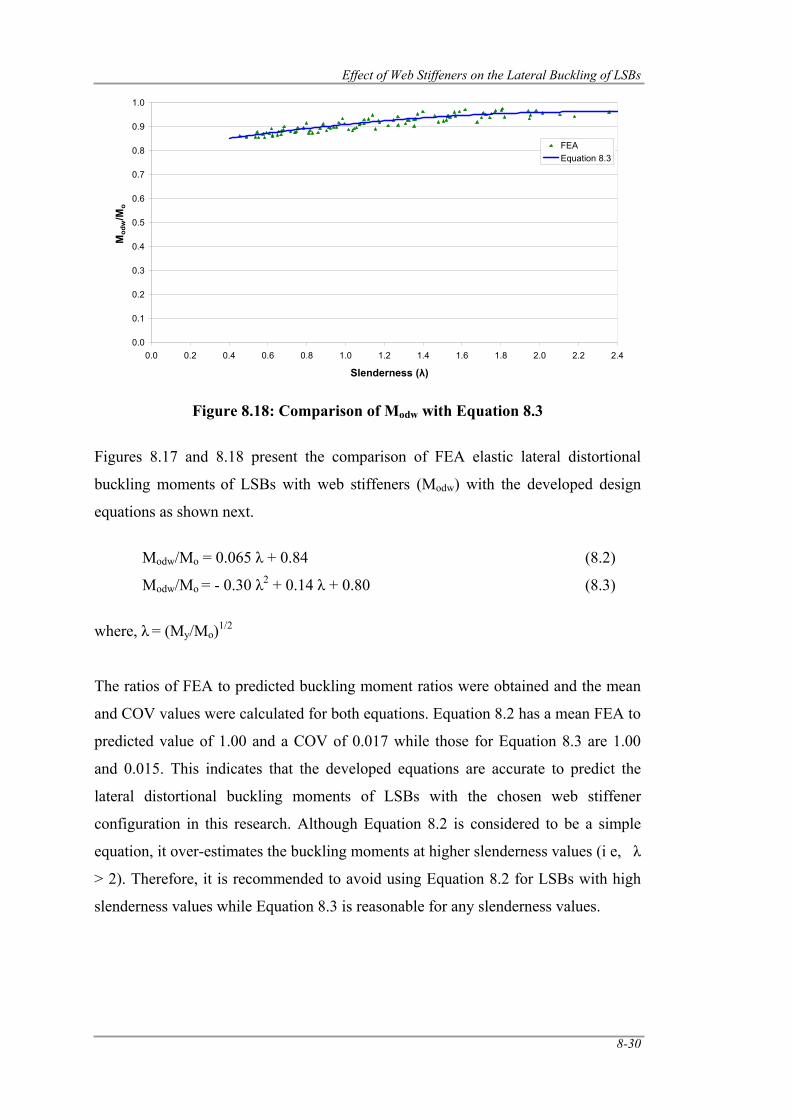
Effect of Web Stiffeners on the Lateral Buckling of LSBs
8-30
Figure 8.18: Comparison of Modw with Equation 8.3
Figures 8.17 and 8.18 present the comparison of FEA elastic lateral distortional
buckling moments of LSBs with web stiffeners (Modw) with the developed design
equations as shown next.
Modw/Mo = 0.065 λ + 0.84 (8.2)
Modw/Mo = - 0.30 λ2 + 0.14 λ + 0.80 (8.3)
where, λ = (My/Mo)1/2
The ratios of FEA to predicted buckling moment ratios were obtained and the mean
and COV values were calculated for both equations. Equation 8.2 has a mean FEA to
predicted value of 1.00 and a COV of 0.017 while those for Equation 8.3 are 1.00
and 0.015. This indicates that the developed equations are accurate to predict the
lateral distortional buckling moments of LSBs with the chosen web stiffener
configuration in this research. Although Equation 8.2 is considered to be a simple
equation, it over-estimates the buckling moments at higher slenderness values (i e, λ
> 2). Therefore, it is recommended to avoid using Equation 8.2 for LSBs with high
slenderness values while Equation 8.3 is reasonable for any slenderness values.
0.0
0.1
0.2
0.3
0.4
0.5
0.6
0.7
0.8
0.9
1.0
0.0 0.2 0.4 0.6 0.8 1.0 1.2 1.4 1.6 1.8 2.0 2.2 2.4
Slenderness (λ)
Mod
w/M
o
FEAEquation 8.3
Effect of Web Stiffeners on the Lateral Buckling of LSBs
8-31
8.4 Ultimate Member Moment Capacities of LSBs with Web Stiffeners
It is now necessary to predict the ultimate moment capacities of stiffened LSBs
subjected to lateral buckling. For this purpose, non-linear finite element analyses
were carried out for the available 13 LSBs with web stiffeners. Ideal finite element
models used in the investigation of elastic lateral distortional buckling of LSBs with
the optimum web stiffener configuration of 5 mm stiffeners at third span points was
adopted in the nonlinear analyses. Geometrical imperfection and both flexural and
membrane residual stresses were included in this study. The imperfection values,
direction and the residual stress distribution are the same as that used in the
investigation of lateral distortional buckling of LSBs described in Chapter 5.
Negative imperfection was found to be critical and this was used in this study. A
value of span/1000 was considered as the initial geometric imperfection. The lateral
buckling failure mode of a 2 m span 150x45x2.0 LSB obtained from the non-linear
finite element analysis is given in Figure 8.19 (a) while Figure 8.19 (b) shows the
non-linear failure mode of the same LSB without web stiffeners. These figures show
that web distortion has been significantly reduced by the use of web stiffeners. The
ultimate moment capacities from FEA with and without web stiffeners are presented
and compared in Table 8.8. The ultimate moment capacities in the case of LSBs with
web stiffeners are about the same even when smaller stiffener thicknesses of 3 mm
and 4 mm are used. The reduction in ultimate capacities is likely to be less than 1%
in all cases. Therefore, it is considered that the findings in this section including the
design rules are equally applicable to stiffener thicknesses in the range of 3 to 5 mm.
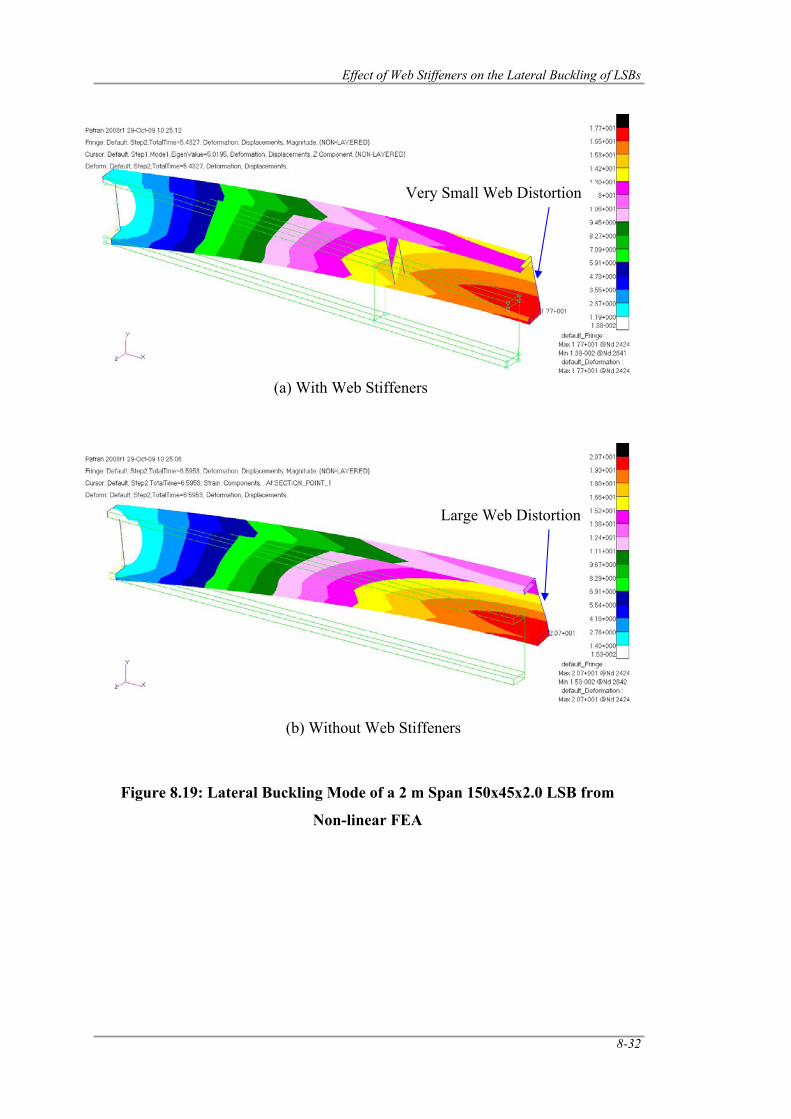
Effect of Web Stiffeners on the Lateral Buckling of LSBs
8-32
Figure 8.19: Lateral Buckling Mode of a 2 m Span 150x45x2.0 LSB from
Non-linear FEA
(a) With Web Stiffeners
Very Small Web Distortion
(b) Without Web Stiffeners
Large Web Distortion
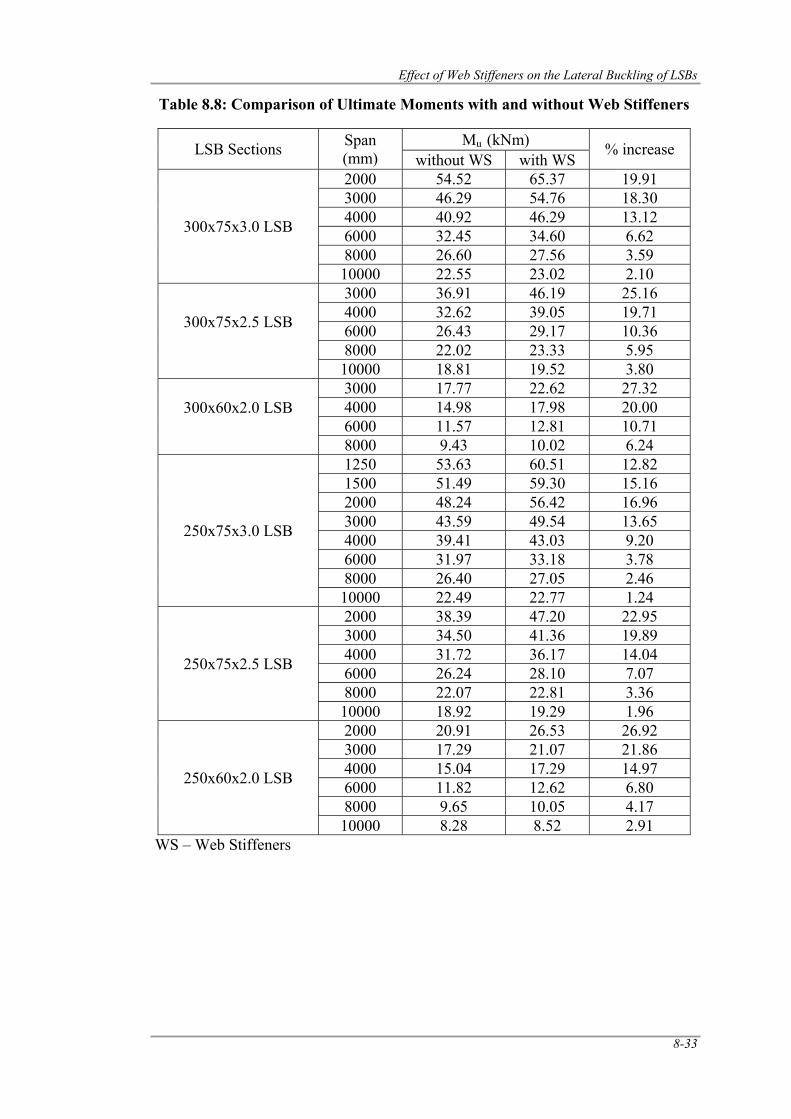
Effect of Web Stiffeners on the Lateral Buckling of LSBs
8-33
Table 8.8: Comparison of Ultimate Moments with and without Web Stiffeners
LSB Sections Span (mm)
Mu (kNm) % increase without WS with WS
300x75x3.0 LSB
2000 54.52 65.37 19.91 3000 46.29 54.76 18.30 4000 40.92 46.29 13.12 6000 32.45 34.60 6.62 8000 26.60 27.56 3.59 10000 22.55 23.02 2.10
300x75x2.5 LSB
3000 36.91 46.19 25.16 4000 32.62 39.05 19.71 6000 26.43 29.17 10.36 8000 22.02 23.33 5.95 10000 18.81 19.52 3.80
300x60x2.0 LSB
3000 17.77 22.62 27.32 4000 14.98 17.98 20.00 6000 11.57 12.81 10.71 8000 9.43 10.02 6.24
250x75x3.0 LSB
1250 53.63 60.51 12.82 1500 51.49 59.30 15.16 2000 48.24 56.42 16.96 3000 43.59 49.54 13.65 4000 39.41 43.03 9.20 6000 31.97 33.18 3.78 8000 26.40 27.05 2.46 10000 22.49 22.77 1.24
250x75x2.5 LSB
2000 38.39 47.20 22.95 3000 34.50 41.36 19.89 4000 31.72 36.17 14.04 6000 26.24 28.10 7.07 8000 22.07 22.81 3.36 10000 18.92 19.29 1.96
250x60x2.0 LSB
2000 20.91 26.53 26.92 3000 17.29 21.07 21.86 4000 15.04 17.29 14.97 6000 11.82 12.62 6.80 8000 9.65 10.05 4.17 10000 8.28 8.52 2.91
WS – Web Stiffeners
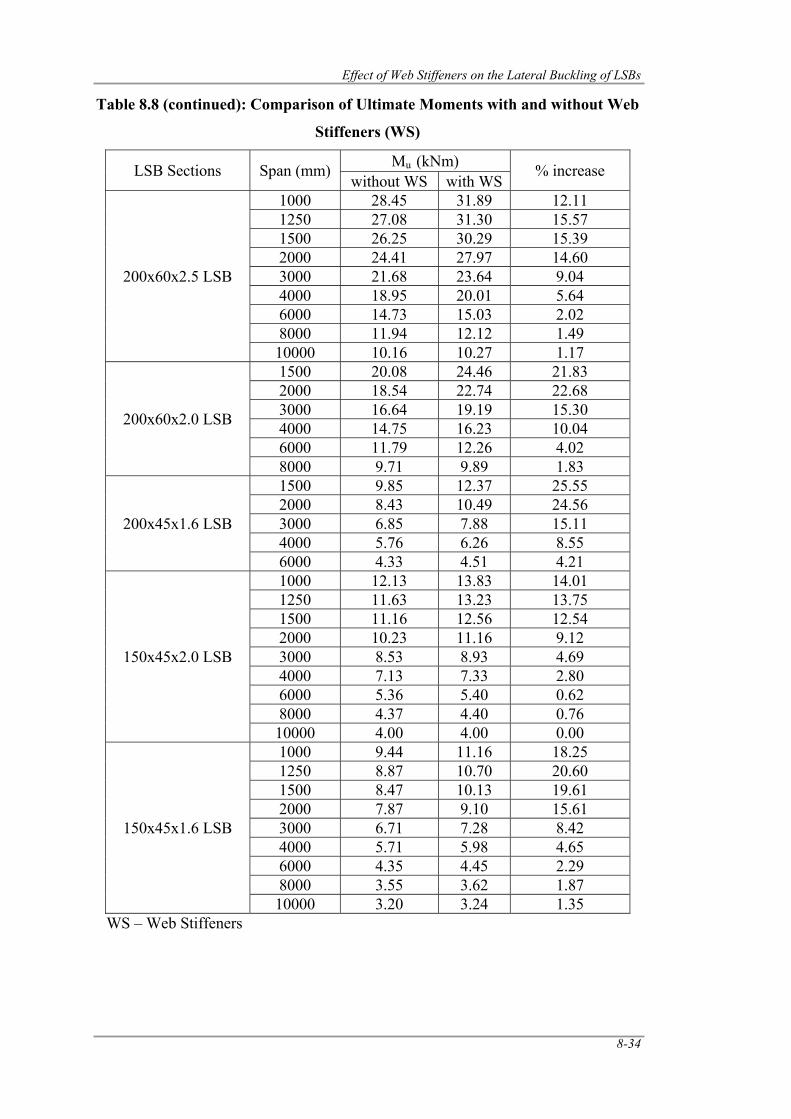
Effect of Web Stiffeners on the Lateral Buckling of LSBs
8-34
Table 8.8 (continued): Comparison of Ultimate Moments with and without Web
Stiffeners (WS)
LSB Sections Span (mm) Mu (kNm) % increase without WS with WS
200x60x2.5 LSB
1000 28.45 31.89 12.11 1250 27.08 31.30 15.57 1500 26.25 30.29 15.39 2000 24.41 27.97 14.60 3000 21.68 23.64 9.04 4000 18.95 20.01 5.64 6000 14.73 15.03 2.02 8000 11.94 12.12 1.49 10000 10.16 10.27 1.17
200x60x2.0 LSB
1500 20.08 24.46 21.83 2000 18.54 22.74 22.68 3000 16.64 19.19 15.30 4000 14.75 16.23 10.04 6000 11.79 12.26 4.02 8000 9.71 9.89 1.83
200x45x1.6 LSB
1500 9.85 12.37 25.55 2000 8.43 10.49 24.56 3000 6.85 7.88 15.11 4000 5.76 6.26 8.55 6000 4.33 4.51 4.21
150x45x2.0 LSB
1000 12.13 13.83 14.01 1250 11.63 13.23 13.75 1500 11.16 12.56 12.54 2000 10.23 11.16 9.12 3000 8.53 8.93 4.69 4000 7.13 7.33 2.80 6000 5.36 5.40 0.62 8000 4.37 4.40 0.76 10000 4.00 4.00 0.00
150x45x1.6 LSB
1000 9.44 11.16 18.25 1250 8.87 10.70 20.60 1500 8.47 10.13 19.61 2000 7.87 9.10 15.61 3000 6.71 7.28 8.42 4000 5.71 5.98 4.65 6000 4.35 4.45 2.29 8000 3.55 3.62 1.87 10000 3.20 3.24 1.35
WS – Web Stiffeners
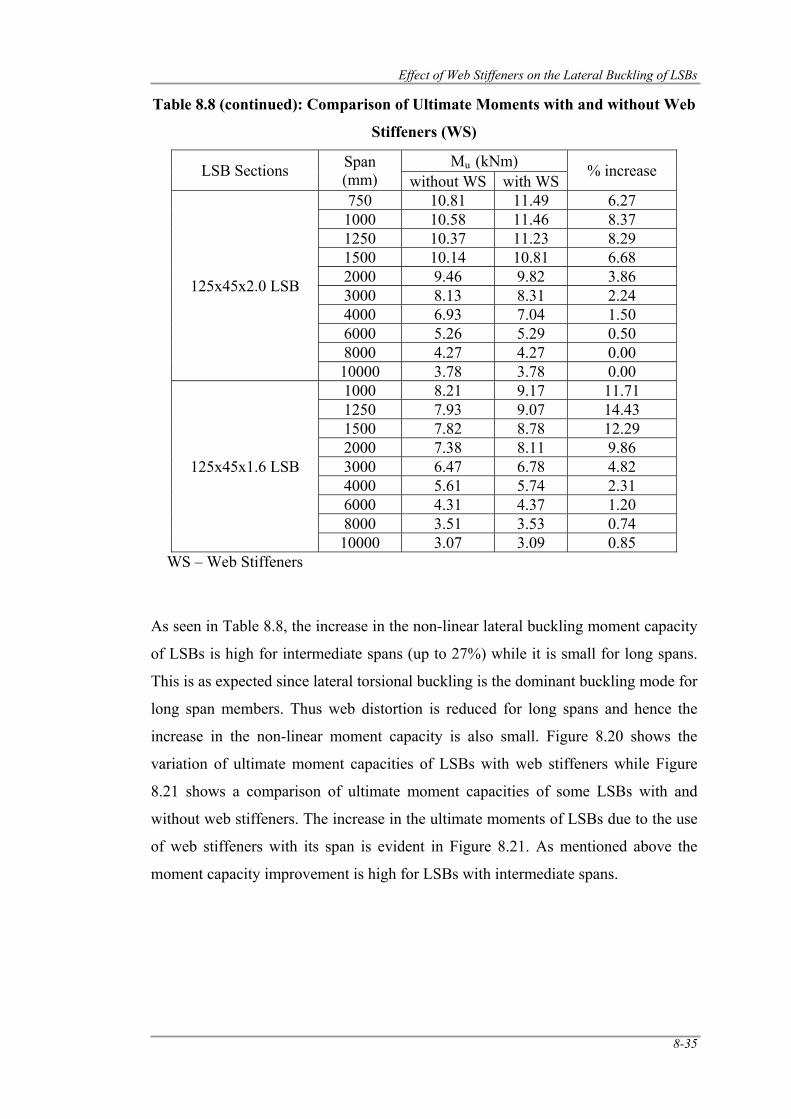
Effect of Web Stiffeners on the Lateral Buckling of LSBs
8-35
Table 8.8 (continued): Comparison of Ultimate Moments with and without Web
Stiffeners (WS)
LSB Sections Span (mm)
Mu (kNm) % increase without WS with WS
125x45x2.0 LSB
750 10.81 11.49 6.27 1000 10.58 11.46 8.37 1250 10.37 11.23 8.29 1500 10.14 10.81 6.68 2000 9.46 9.82 3.86 3000 8.13 8.31 2.24 4000 6.93 7.04 1.50 6000 5.26 5.29 0.50 8000 4.27 4.27 0.00 10000 3.78 3.78 0.00
125x45x1.6 LSB
1000 8.21 9.17 11.71 1250 7.93 9.07 14.43 1500 7.82 8.78 12.29 2000 7.38 8.11 9.86 3000 6.47 6.78 4.82 4000 5.61 5.74 2.31 6000 4.31 4.37 1.20 8000 3.51 3.53 0.74 10000 3.07 3.09 0.85
WS – Web Stiffeners
As seen in Table 8.8, the increase in the non-linear lateral buckling moment capacity
of LSBs is high for intermediate spans (up to 27%) while it is small for long spans.
This is as expected since lateral torsional buckling is the dominant buckling mode for
long span members. Thus web distortion is reduced for long spans and hence the
increase in the non-linear moment capacity is also small. Figure 8.20 shows the
variation of ultimate moment capacities of LSBs with web stiffeners while Figure
8.21 shows a comparison of ultimate moment capacities of some LSBs with and
without web stiffeners. The increase in the ultimate moments of LSBs due to the use
of web stiffeners with its span is evident in Figure 8.21. As mentioned above the
moment capacity improvement is high for LSBs with intermediate spans.
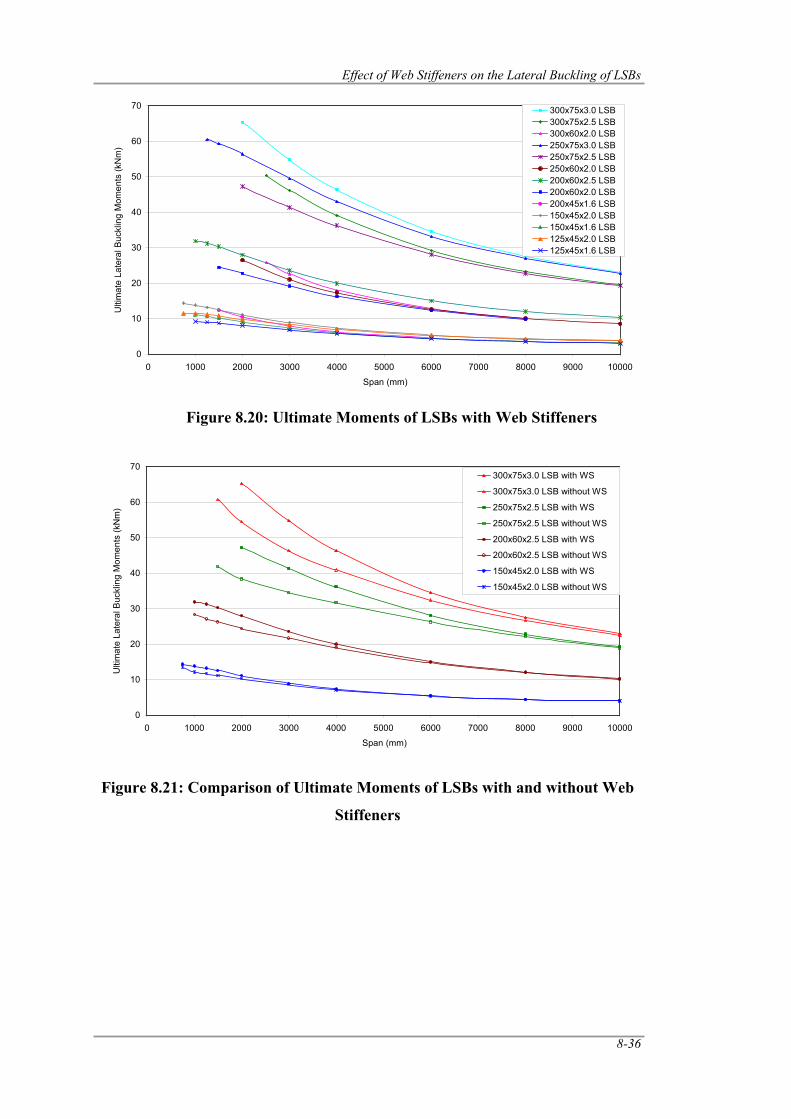
Effect of Web Stiffeners on the Lateral Buckling of LSBs
8-36
Figure 8.20: Ultimate Moments of LSBs with Web Stiffeners
Figure 8.21: Comparison of Ultimate Moments of LSBs with and without Web
Stiffeners
0
10
20
30
40
50
60
70
0 1000 2000 3000 4000 5000 6000 7000 8000 9000 10000
Span (mm)
Ulti
mat
e La
tera
l Buc
klin
g M
omen
ts (k
Nm
) 300x75x3.0 LSB300x75x2.5 LSB300x60x2.0 LSB250x75x3.0 LSB250x75x2.5 LSB250x60x2.0 LSB200x60x2.5 LSB200x60x2.0 LSB200x45x1.6 LSB150x45x2.0 LSB150x45x1.6 LSB125x45x2.0 LSB125x45x1.6 LSB
0
10
20
30
40
50
60
70
0 1000 2000 3000 4000 5000 6000 7000 8000 9000 10000
Span (mm)
Ulti
mat
e La
tera
l Buc
klin
g M
omen
ts (k
Nm
)
300x75x3.0 LSB with WS
300x75x3.0 LSB without WS
250x75x2.5 LSB with WS
250x75x2.5 LSB without WS
200x60x2.5 LSB with WS
200x60x2.5 LSB without WS
150x45x2.0 LSB with WS
150x45x2.0 LSB without WS
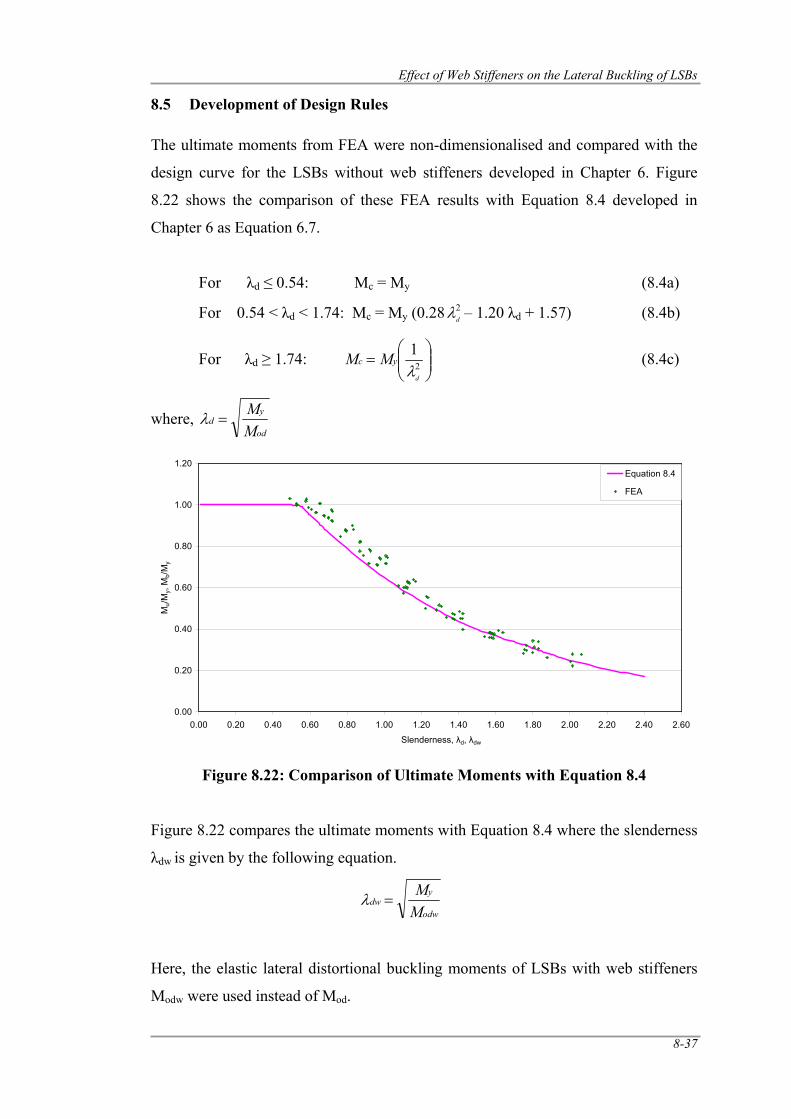
Effect of Web Stiffeners on the Lateral Buckling of LSBs
8-37
8.5 Development of Design Rules
The ultimate moments from FEA were non-dimensionalised and compared with the
design curve for the LSBs without web stiffeners developed in Chapter 6. Figure
8.22 shows the comparison of these FEA results with Equation 8.4 developed in
Chapter 6 as Equation 6.7.
For λd ≤ 0.54: Mc = My (8.4a)
For 0.54 < λd < 1.74: Mc = My (0.28 2dλ – 1.20 λd + 1.57) (8.4b)
For λd ≥ 1.74: ⎟⎟⎠
⎞⎜⎜⎝
⎛= 2
1
d
yc MMλ
(8.4c)
where, od
yd
MM
=λ
Figure 8.22: Comparison of Ultimate Moments with Equation 8.4
Figure 8.22 compares the ultimate moments with Equation 8.4 where the slenderness
λdw is given by the following equation.
odw
ydw
MM
=λ
Here, the elastic lateral distortional buckling moments of LSBs with web stiffeners
Modw were used instead of Mod.
0.00
0.20
0.40
0.60
0.80
1.00
1.20
0.00 0.20 0.40 0.60 0.80 1.00 1.20 1.40 1.60 1.80 2.00 2.20 2.40 2.60
Slenderness, λd, λdw
Mu/M
y, M
b/My
Equation 8.4
FEA
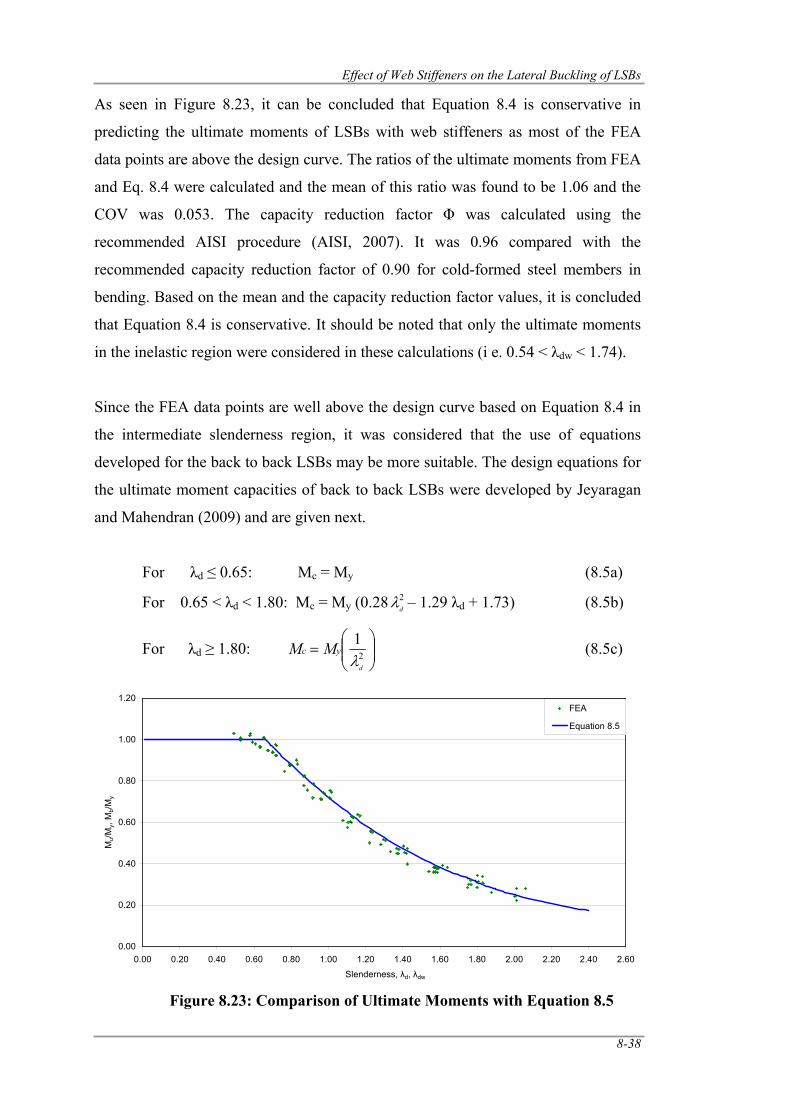
Effect of Web Stiffeners on the Lateral Buckling of LSBs
8-38
As seen in Figure 8.23, it can be concluded that Equation 8.4 is conservative in
predicting the ultimate moments of LSBs with web stiffeners as most of the FEA
data points are above the design curve. The ratios of the ultimate moments from FEA
and Eq. 8.4 were calculated and the mean of this ratio was found to be 1.06 and the
COV was 0.053. The capacity reduction factor Φ was calculated using the
recommended AISI procedure (AISI, 2007). It was 0.96 compared with the
recommended capacity reduction factor of 0.90 for cold-formed steel members in
bending. Based on the mean and the capacity reduction factor values, it is concluded
that Equation 8.4 is conservative. It should be noted that only the ultimate moments
in the inelastic region were considered in these calculations (i e. 0.54 < λdw < 1.74).
Since the FEA data points are well above the design curve based on Equation 8.4 in
the intermediate slenderness region, it was considered that the use of equations
developed for the back to back LSBs may be more suitable. The design equations for
the ultimate moment capacities of back to back LSBs were developed by Jeyaragan
and Mahendran (2009) and are given next.
For λd ≤ 0.65: Mc = My (8.5a)
For 0.65 < λd < 1.80: Mc = My (0.28 2dλ – 1.29 λd + 1.73) (8.5b)
For λd ≥ 1.80: ⎟⎟⎠
⎞⎜⎜⎝
⎛= 2
1
d
yc MMλ
(8.5c)
Figure 8.23: Comparison of Ultimate Moments with Equation 8.5
0.00
0.20
0.40
0.60
0.80
1.00
1.20
0.00 0.20 0.40 0.60 0.80 1.00 1.20 1.40 1.60 1.80 2.00 2.20 2.40 2.60
Slenderness, λd, λdw
Mu/M
y, M
b/My
FEA
Equation 8.5
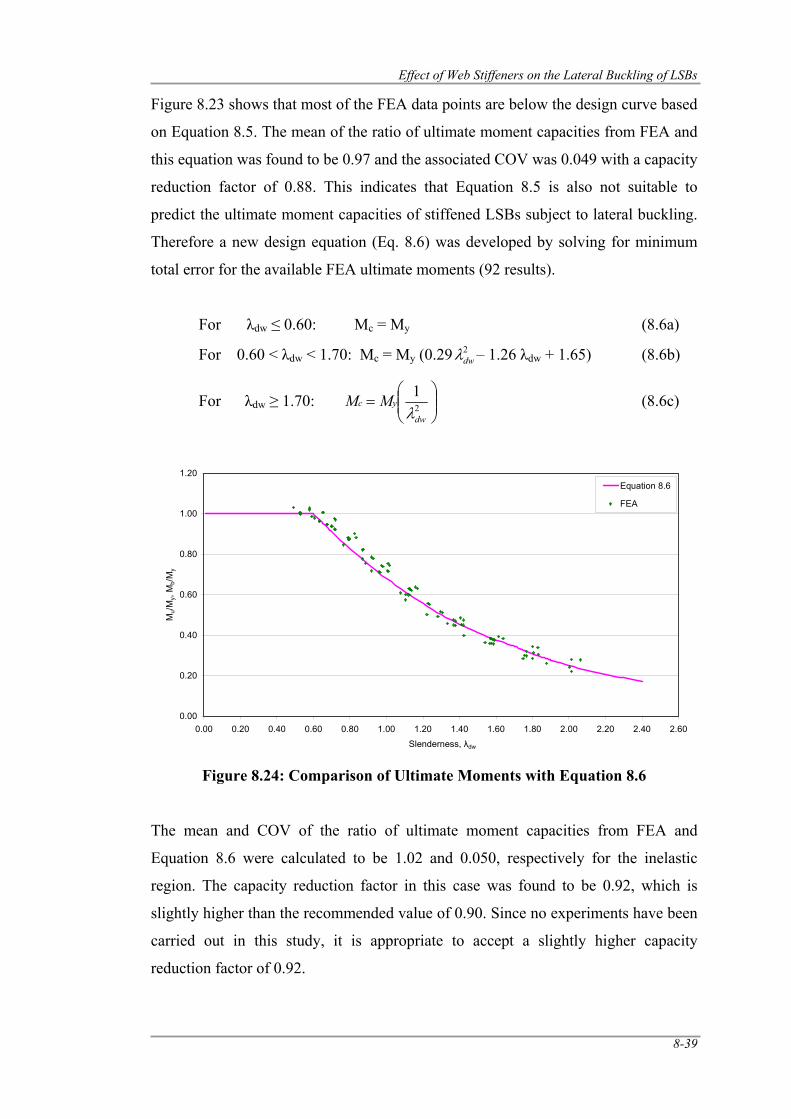
Effect of Web Stiffeners on the Lateral Buckling of LSBs
8-39
Figure 8.23 shows that most of the FEA data points are below the design curve based
on Equation 8.5. The mean of the ratio of ultimate moment capacities from FEA and
this equation was found to be 0.97 and the associated COV was 0.049 with a capacity
reduction factor of 0.88. This indicates that Equation 8.5 is also not suitable to
predict the ultimate moment capacities of stiffened LSBs subject to lateral buckling.
Therefore a new design equation (Eq. 8.6) was developed by solving for minimum
total error for the available FEA ultimate moments (92 results).
For λdw ≤ 0.60: Mc = My (8.6a)
For 0.60 < λdw < 1.70: Mc = My (0.29 2dwλ – 1.26 λdw + 1.65) (8.6b)
For λdw ≥ 1.70: ⎟⎟⎠
⎞⎜⎜⎝
⎛= 2
1
dw
yc MMλ
(8.6c)
Figure 8.24: Comparison of Ultimate Moments with Equation 8.6
The mean and COV of the ratio of ultimate moment capacities from FEA and
Equation 8.6 were calculated to be 1.02 and 0.050, respectively for the inelastic
region. The capacity reduction factor in this case was found to be 0.92, which is
slightly higher than the recommended value of 0.90. Since no experiments have been
carried out in this study, it is appropriate to accept a slightly higher capacity
reduction factor of 0.92.
0.00
0.20
0.40
0.60
0.80
1.00
1.20
0.00 0.20 0.40 0.60 0.80 1.00 1.20 1.40 1.60 1.80 2.00 2.20 2.40 2.60
Slenderness, λdw
Mu/M
y, M
b/My
Equation 8.6
FEA
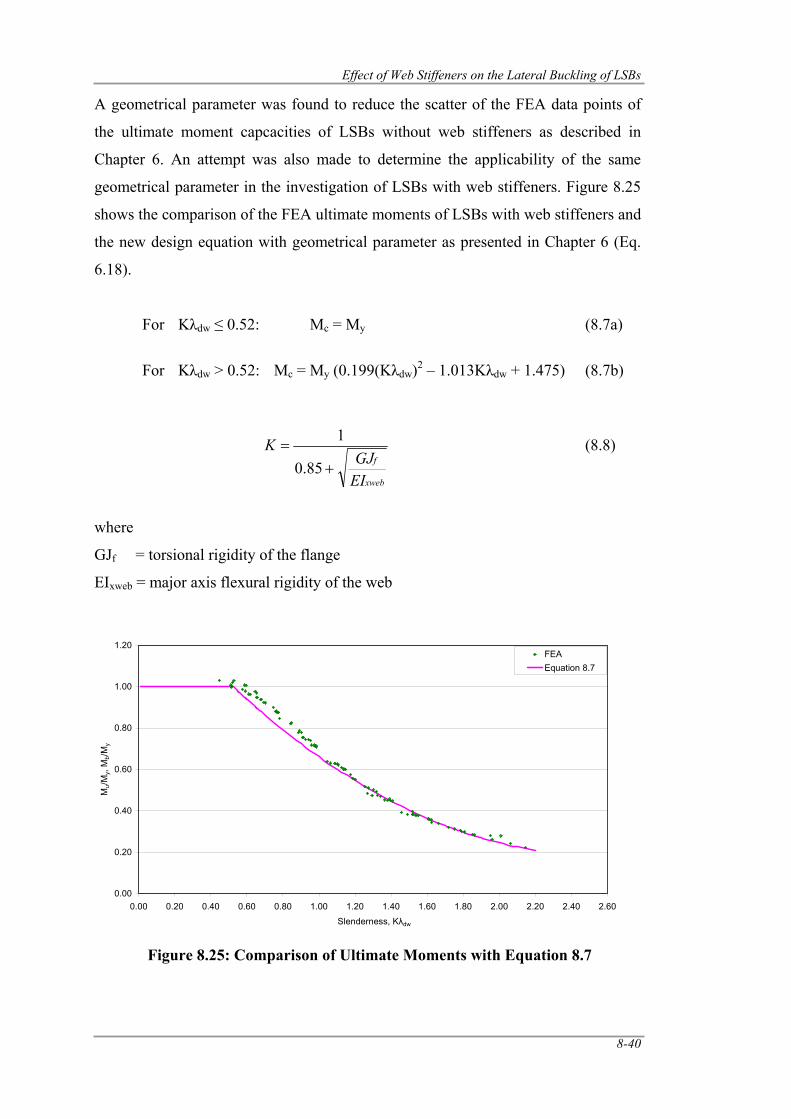
Effect of Web Stiffeners on the Lateral Buckling of LSBs
8-40
A geometrical parameter was found to reduce the scatter of the FEA data points of
the ultimate moment capcacities of LSBs without web stiffeners as described in
Chapter 6. An attempt was also made to determine the applicability of the same
geometrical parameter in the investigation of LSBs with web stiffeners. Figure 8.25
shows the comparison of the FEA ultimate moments of LSBs with web stiffeners and
the new design equation with geometrical parameter as presented in Chapter 6 (Eq.
6.18).
For Kλdw ≤ 0.52: Mc = My (8.7a)
For Kλdw > 0.52: Mc = My (0.199(Kλdw)2 – 1.013Kλdw + 1.475) (8.7b)
xweb
f
EIGJ
K+
=85.0
1 (8.8)
where
GJf = torsional rigidity of the flange
EIxweb = major axis flexural rigidity of the web
Figure 8.25: Comparison of Ultimate Moments with Equation 8.7
0.00
0.20
0.40
0.60
0.80
1.00
1.20
0.00 0.20 0.40 0.60 0.80 1.00 1.20 1.40 1.60 1.80 2.00 2.20 2.40 2.60
Slenderness, Kλdw
Mu/M
y, M
b/My
FEAEquation 8.7
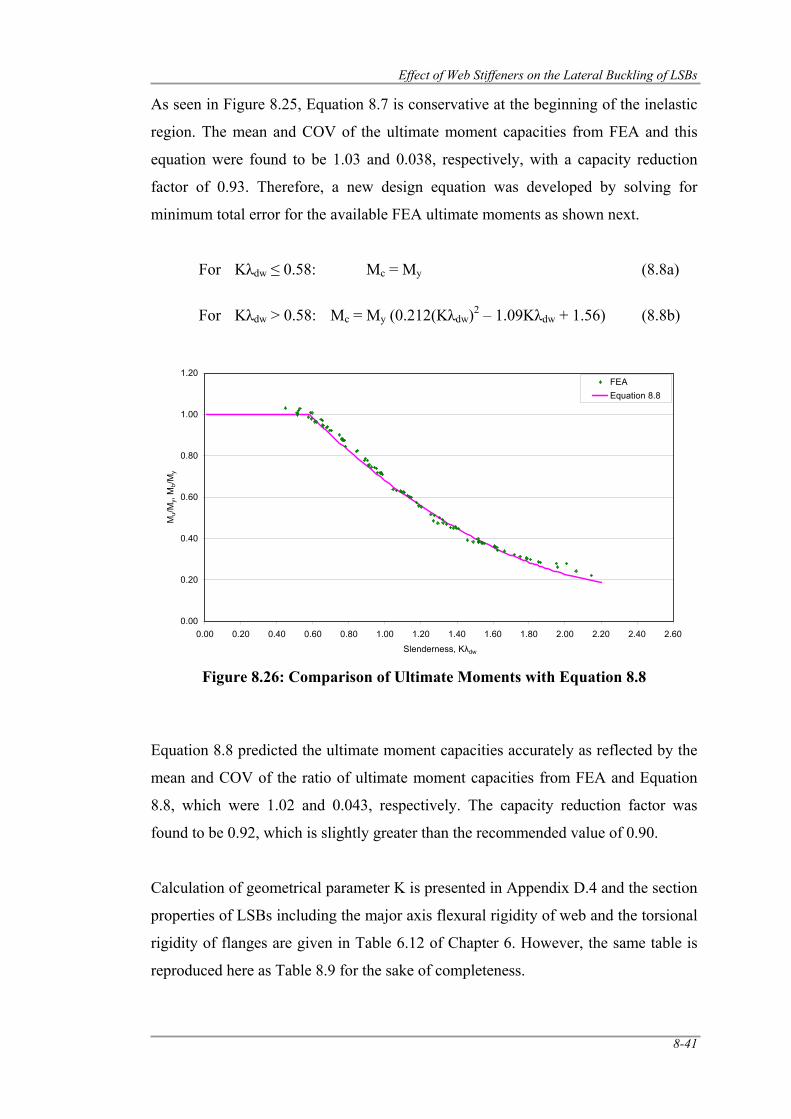
Effect of Web Stiffeners on the Lateral Buckling of LSBs
8-41
As seen in Figure 8.25, Equation 8.7 is conservative at the beginning of the inelastic
region. The mean and COV of the ultimate moment capacities from FEA and this
equation were found to be 1.03 and 0.038, respectively, with a capacity reduction
factor of 0.93. Therefore, a new design equation was developed by solving for
minimum total error for the available FEA ultimate moments as shown next.
For Kλdw ≤ 0.58: Mc = My (8.8a)
For Kλdw > 0.58: Mc = My (0.212(Kλdw)2 – 1.09Kλdw + 1.56) (8.8b)
Figure 8.26: Comparison of Ultimate Moments with Equation 8.8
Equation 8.8 predicted the ultimate moment capacities accurately as reflected by the
mean and COV of the ratio of ultimate moment capacities from FEA and Equation
8.8, which were 1.02 and 0.043, respectively. The capacity reduction factor was
found to be 0.92, which is slightly greater than the recommended value of 0.90.
Calculation of geometrical parameter K is presented in Appendix D.4 and the section
properties of LSBs including the major axis flexural rigidity of web and the torsional
rigidity of flanges are given in Table 6.12 of Chapter 6. However, the same table is
reproduced here as Table 8.9 for the sake of completeness.
0.00
0.20
0.40
0.60
0.80
1.00
1.20
0.00 0.20 0.40 0.60 0.80 1.00 1.20 1.40 1.60 1.80 2.00 2.20 2.40 2.60
Slenderness, Kλdw
Mu/M
y, M
b/My
FEAEquation 8.8
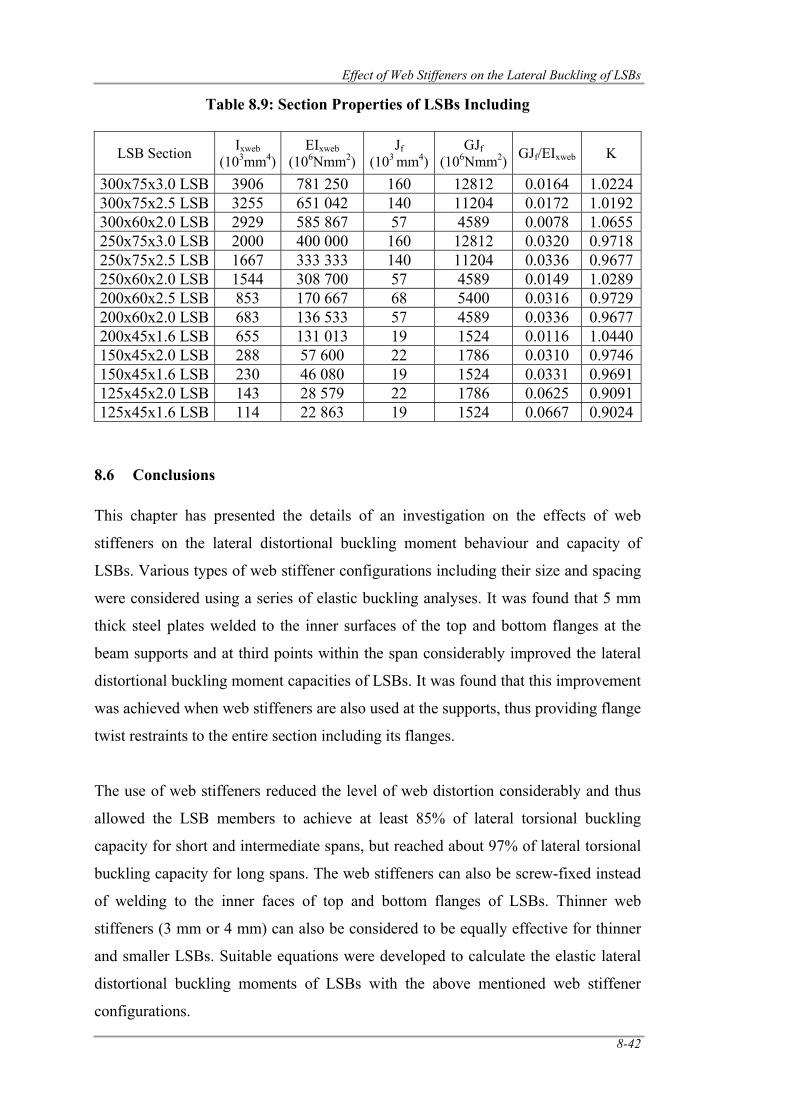
Effect of Web Stiffeners on the Lateral Buckling of LSBs
8-42
Table 8.9: Section Properties of LSBs Including
LSB Section Ixweb (103mm4)
EIxweb (106Nmm2)
Jf (103 mm4)
GJf (106Nmm2) GJf/EIxweb K
300x75x3.0 LSB 3906 781 250 160 12812 0.0164 1.0224 300x75x2.5 LSB 3255 651 042 140 11204 0.0172 1.0192 300x60x2.0 LSB 2929 585 867 57 4589 0.0078 1.0655 250x75x3.0 LSB 2000 400 000 160 12812 0.0320 0.9718 250x75x2.5 LSB 1667 333 333 140 11204 0.0336 0.9677 250x60x2.0 LSB 1544 308 700 57 4589 0.0149 1.0289 200x60x2.5 LSB 853 170 667 68 5400 0.0316 0.9729 200x60x2.0 LSB 683 136 533 57 4589 0.0336 0.9677 200x45x1.6 LSB 655 131 013 19 1524 0.0116 1.0440 150x45x2.0 LSB 288 57 600 22 1786 0.0310 0.9746 150x45x1.6 LSB 230 46 080 19 1524 0.0331 0.9691 125x45x2.0 LSB 143 28 579 22 1786 0.0625 0.9091 125x45x1.6 LSB 114 22 863 19 1524 0.0667 0.9024
8.6 Conclusions
This chapter has presented the details of an investigation on the effects of web
stiffeners on the lateral distortional buckling moment behaviour and capacity of
LSBs. Various types of web stiffener configurations including their size and spacing
were considered using a series of elastic buckling analyses. It was found that 5 mm
thick steel plates welded to the inner surfaces of the top and bottom flanges at the
beam supports and at third points within the span considerably improved the lateral
distortional buckling moment capacities of LSBs. It was found that this improvement
was achieved when web stiffeners are also used at the supports, thus providing flange
twist restraints to the entire section including its flanges.
The use of web stiffeners reduced the level of web distortion considerably and thus
allowed the LSB members to achieve at least 85% of lateral torsional buckling
capacity for short and intermediate spans, but reached about 97% of lateral torsional
buckling capacity for long spans. The web stiffeners can also be screw-fixed instead
of welding to the inner faces of top and bottom flanges of LSBs. Thinner web
stiffeners (3 mm or 4 mm) can also be considered to be equally effective for thinner
and smaller LSBs. Suitable equations were developed to calculate the elastic lateral
distortional buckling moments of LSBs with the above mentioned web stiffener
configurations.
Effect of Web Stiffeners on the Lateral Buckling of LSBs
8-43
The ultimate moment capacities of LSBs with web stiffeners were compared with the
developed design rules for single and back to back LSBs without web stiffeners.
Since they were not suitable, a new design rule was developed to accurately predict
the ultimate moment capacities of LSBs with web stiffeners subject to lateral
buckling.
It was found that the use of a geometrical parameter K significantly reduced the
scatter in the FEA data points where this parameter K was the same as that used in
the lateral buckling investigation of LSBs without web stiffeners. A new design rule
with the geometrical parameter K was also developed to accurately predict the
ultimate moment capacities of LSBs with web stiffeners.

Conclusions and Recommendations
9-1
CHAPTER 9
9.0 Conclusions and Recommendations
This thesis has described a detailed investigation into the flexural behaviour of
LiteSteel Beams (LSBs) based on experimental and finite element analyses. This
investigation included three phases. In the first phase the member moment capacity
of LSBs and other types of hollow flange sections such as Hollow Flange Beams
(HFBs), Monosymmetric Hollow Flange Beams (MHFBs) and Rectangular Hollow
Flange Beams (RHFBs) subject to lateral distortional buckling was investigated
while in the second phase, the section moment capacity of LSBs subject to local
buckling effects including the inelastic reserve moment capacity was investigated. In
the third phase the use of web stiffeners was investigated in order to improve the
lateral distortional buckling moment capacities of LSBs.
The LSB flexural members are subjected to a relatively new lateral distortional
buckling mode, which reduces their member moment capacities. A detailed
investigation into the flexural behaviour of LSBs and their member moment
capacities was undertaken in the first phase of this research using experimental and
finite element analyses. It included 12 lateral buckling tests of LSBs using a quarter
point loading arrangement, finite element modelling of tested LSBs, and a detailed
parametric study to develop suitable design rules. Numerical studies in this phase
entail the development of two finite element models, namely, experimental and ideal
models to simulate the flexural behaviour of LSBs including their lateral buckling
characteristics. A general purpose finite element analysis program ABAQUS Version
6.7 (HKS, 2007) and MSC PATRAN (PATRAN, 2008) were used in this study.
Experimental finite element models were used to simulate the tested LSBs and to
validate the models by a comparison of experimental and finite element analysis
results while ideal finite element models were used to develop member moment
capacity data under uniform moment conditions that were used to propose suitable
design rules. Chapters 4, 5 and 6 presented the details of Phase one of this research
project and the results.
Conclusions and Recommendations
9-2
In Phase two of this research, the section moment capacity of LSBs was investigated
based on experiments and finite element analyses. It included four point bending
tests of seven LSBs, numerical simulations and a detailed parametric study of section
moment capacity of LSBs including inelastic reserve capacity of LSBs. Suitable
experimental finite element models were developed and their results were compared
with experimental results for validation purposes. The validated model was then used
in the parametric study. The results from the parametric study and experiments were
used to review the available design rules for section moment capacity including the
presence of inelastic reserve bending capacity. Chapter 7 presented the details of
Phase 2 of this research project and the results.
Phase three of this research included an investigation on the effects of web stiffeners
on the lateral distortional buckling moment behaviour and capacity of LSBs. This
included finite element analyses of LSBs with different configurations of web
stiffeners in order to develop an optimum web stiffener configuration, and a detailed
parametric study to develop suitable design rules with optimum web stiffener
configuration. Chapter 8 presented the details of Phase 3 of this research project and
the results.
Chapter 3 of this thesis presented the details of tensile coupon tests and residual
stress and geometric imperfection measurements of LSBs used in the experimental
study. Chapter 4 presented the details of lateral buckling tests of LSBs. It includes a
comparison of the experimental results with the member moment capacity
predictions from AS/NZS 4600 (SA, 2005). Chapter 5 presented the details of the
finite element analyses of LSBs subject to lateral buckling including validation of
finite element models. The details of the detailed parametric study of LSBs subject to
lateral distortional buckling and the development of design rules are presented in
Chapter 6. The effect of section geometry and the applicability of developed design
rules for other types of hollow flange sections are also included in this chapter.
Chapter 7 presented the details of section moment capacity of LSBs including the
inelastic reserve moment capacity based on experiments and finite element analyses.
Chapter 8 presented the details of the effect of web stiffeners on the lateral
distortional buckling strength of LSBs. It includes the details of the optimum web
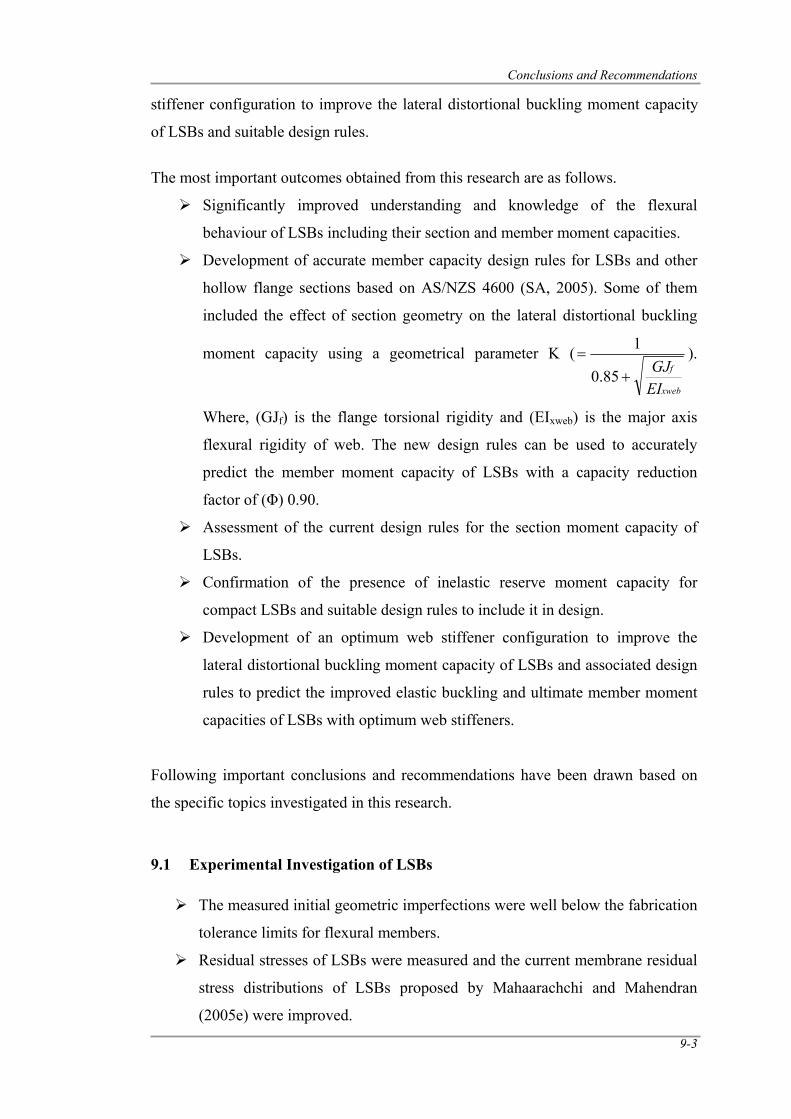
Conclusions and Recommendations
9-3
stiffener configuration to improve the lateral distortional buckling moment capacity
of LSBs and suitable design rules.
The most important outcomes obtained from this research are as follows.
Significantly improved understanding and knowledge of the flexural
behaviour of LSBs including their section and member moment capacities.
Development of accurate member capacity design rules for LSBs and other
hollow flange sections based on AS/NZS 4600 (SA, 2005). Some of them
included the effect of section geometry on the lateral distortional buckling
moment capacity using a geometrical parameter K (
xweb
f
EIGJ
+=
85.0
1 ).
Where, (GJf) is the flange torsional rigidity and (EIxweb) is the major axis
flexural rigidity of web. The new design rules can be used to accurately
predict the member moment capacity of LSBs with a capacity reduction
factor of (Φ) 0.90.
Assessment of the current design rules for the section moment capacity of
LSBs.
Confirmation of the presence of inelastic reserve moment capacity for
compact LSBs and suitable design rules to include it in design.
Development of an optimum web stiffener configuration to improve the
lateral distortional buckling moment capacity of LSBs and associated design
rules to predict the improved elastic buckling and ultimate member moment
capacities of LSBs with optimum web stiffeners.
Following important conclusions and recommendations have been drawn based on
the specific topics investigated in this research.
9.1 Experimental Investigation of LSBs
The measured initial geometric imperfections were well below the fabrication
tolerance limits for flexural members.
Residual stresses of LSBs were measured and the current membrane residual
stress distributions of LSBs proposed by Mahaarachchi and Mahendran
(2005e) were improved.
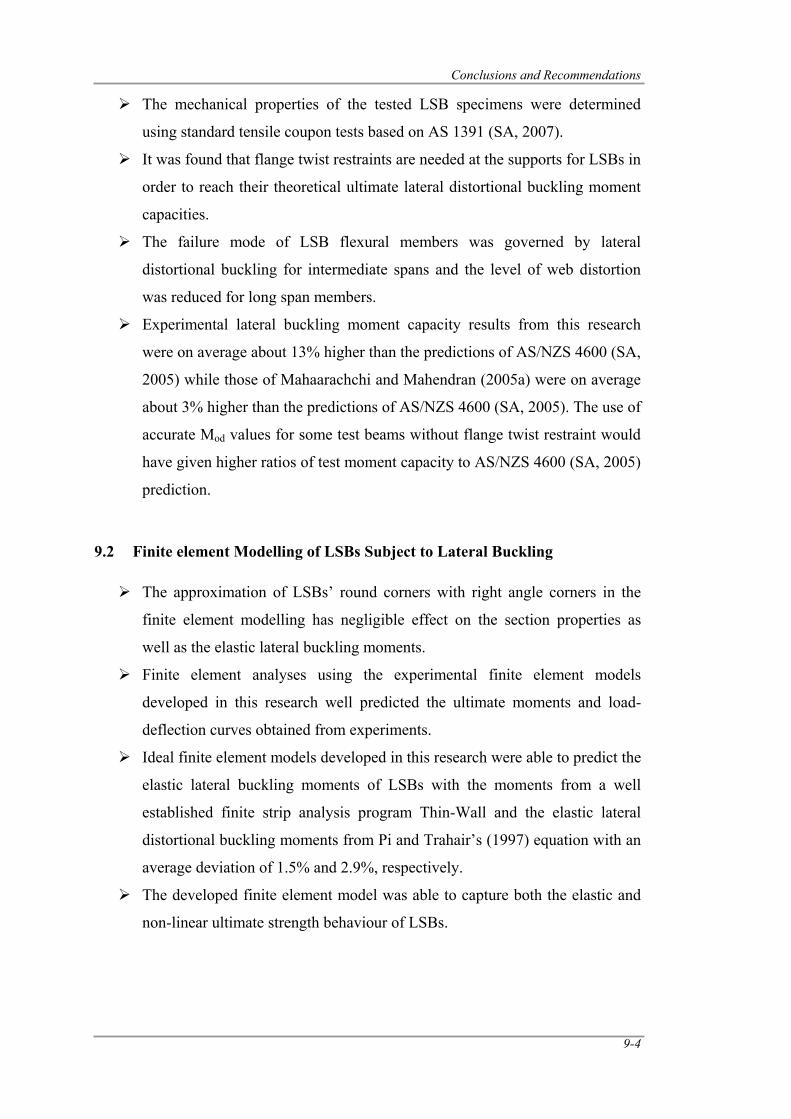
Conclusions and Recommendations
9-4
The mechanical properties of the tested LSB specimens were determined
using standard tensile coupon tests based on AS 1391 (SA, 2007).
It was found that flange twist restraints are needed at the supports for LSBs in
order to reach their theoretical ultimate lateral distortional buckling moment
capacities.
The failure mode of LSB flexural members was governed by lateral
distortional buckling for intermediate spans and the level of web distortion
was reduced for long span members.
Experimental lateral buckling moment capacity results from this research
were on average about 13% higher than the predictions of AS/NZS 4600 (SA,
2005) while those of Mahaarachchi and Mahendran (2005a) were on average
about 3% higher than the predictions of AS/NZS 4600 (SA, 2005). The use of
accurate Mod values for some test beams without flange twist restraint would
have given higher ratios of test moment capacity to AS/NZS 4600 (SA, 2005)
prediction.
9.2 Finite element Modelling of LSBs Subject to Lateral Buckling
The approximation of LSBs’ round corners with right angle corners in the
finite element modelling has negligible effect on the section properties as
well as the elastic lateral buckling moments.
Finite element analyses using the experimental finite element models
developed in this research well predicted the ultimate moments and load-
deflection curves obtained from experiments.
Ideal finite element models developed in this research were able to predict the
elastic lateral buckling moments of LSBs with the moments from a well
established finite strip analysis program Thin-Wall and the elastic lateral
distortional buckling moments from Pi and Trahair’s (1997) equation with an
average deviation of 1.5% and 2.9%, respectively.
The developed finite element model was able to capture both the elastic and
non-linear ultimate strength behaviour of LSBs.
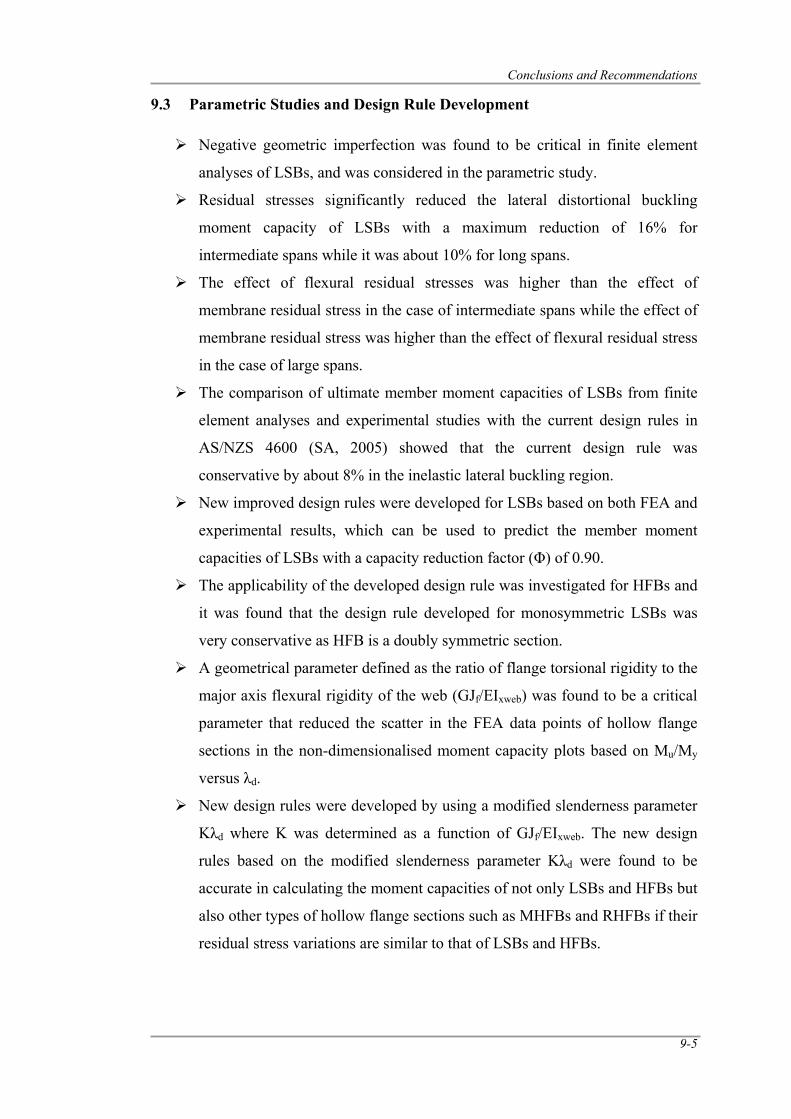
Conclusions and Recommendations
9-5
9.3 Parametric Studies and Design Rule Development
Negative geometric imperfection was found to be critical in finite element
analyses of LSBs, and was considered in the parametric study.
Residual stresses significantly reduced the lateral distortional buckling
moment capacity of LSBs with a maximum reduction of 16% for
intermediate spans while it was about 10% for long spans.
The effect of flexural residual stresses was higher than the effect of
membrane residual stress in the case of intermediate spans while the effect of
membrane residual stress was higher than the effect of flexural residual stress
in the case of large spans.
The comparison of ultimate member moment capacities of LSBs from finite
element analyses and experimental studies with the current design rules in
AS/NZS 4600 (SA, 2005) showed that the current design rule was
conservative by about 8% in the inelastic lateral buckling region.
New improved design rules were developed for LSBs based on both FEA and
experimental results, which can be used to predict the member moment
capacities of LSBs with a capacity reduction factor (Φ) of 0.90.
The applicability of the developed design rule was investigated for HFBs and
it was found that the design rule developed for monosymmetric LSBs was
very conservative as HFB is a doubly symmetric section.
A geometrical parameter defined as the ratio of flange torsional rigidity to the
major axis flexural rigidity of the web (GJf/EIxweb) was found to be a critical
parameter that reduced the scatter in the FEA data points of hollow flange
sections in the non-dimensionalised moment capacity plots based on Mu/My
versus λd.
New design rules were developed by using a modified slenderness parameter
Kλd where K was determined as a function of GJf/EIxweb. The new design
rules based on the modified slenderness parameter Kλd were found to be
accurate in calculating the moment capacities of not only LSBs and HFBs but
also other types of hollow flange sections such as MHFBs and RHFBs if their
residual stress variations are similar to that of LSBs and HFBs.
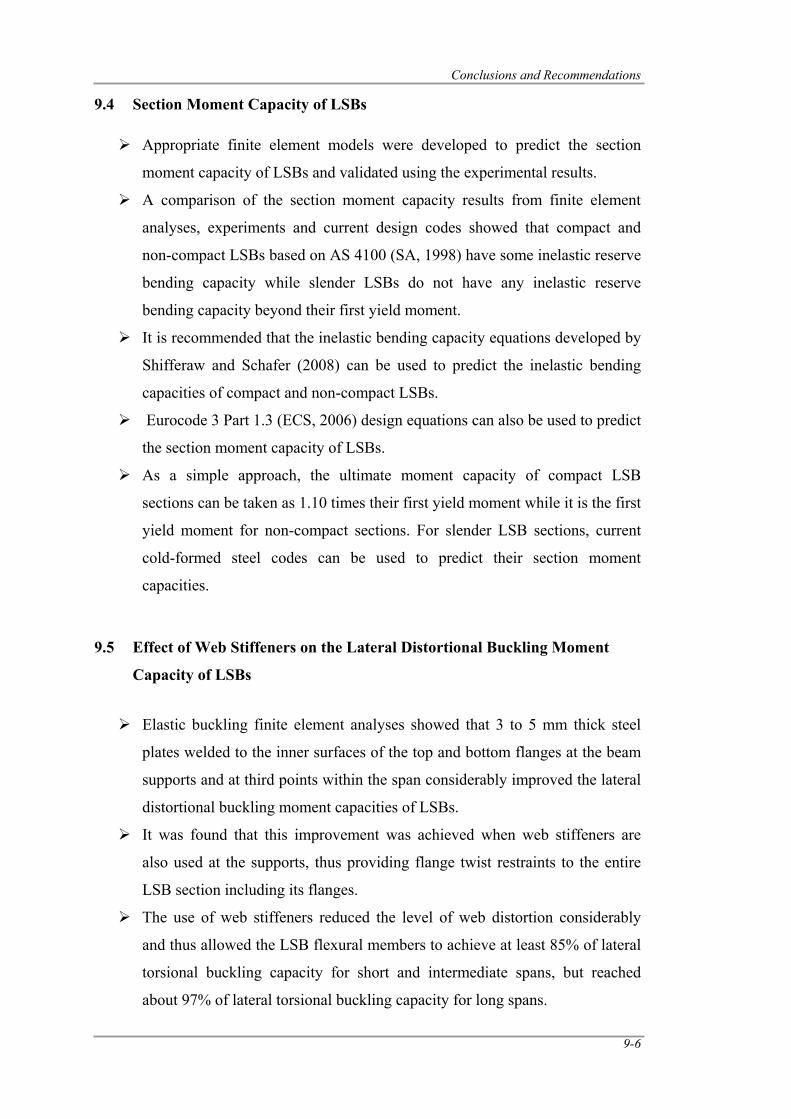
Conclusions and Recommendations
9-6
9.4 Section Moment Capacity of LSBs
Appropriate finite element models were developed to predict the section
moment capacity of LSBs and validated using the experimental results.
A comparison of the section moment capacity results from finite element
analyses, experiments and current design codes showed that compact and
non-compact LSBs based on AS 4100 (SA, 1998) have some inelastic reserve
bending capacity while slender LSBs do not have any inelastic reserve
bending capacity beyond their first yield moment.
It is recommended that the inelastic bending capacity equations developed by
Shifferaw and Schafer (2008) can be used to predict the inelastic bending
capacities of compact and non-compact LSBs.
Eurocode 3 Part 1.3 (ECS, 2006) design equations can also be used to predict
the section moment capacity of LSBs.
As a simple approach, the ultimate moment capacity of compact LSB
sections can be taken as 1.10 times their first yield moment while it is the first
yield moment for non-compact sections. For slender LSB sections, current
cold-formed steel codes can be used to predict their section moment
capacities.
9.5 Effect of Web Stiffeners on the Lateral Distortional Buckling Moment
Capacity of LSBs
Elastic buckling finite element analyses showed that 3 to 5 mm thick steel
plates welded to the inner surfaces of the top and bottom flanges at the beam
supports and at third points within the span considerably improved the lateral
distortional buckling moment capacities of LSBs.
It was found that this improvement was achieved when web stiffeners are
also used at the supports, thus providing flange twist restraints to the entire
LSB section including its flanges.
The use of web stiffeners reduced the level of web distortion considerably
and thus allowed the LSB flexural members to achieve at least 85% of lateral
torsional buckling capacity for short and intermediate spans, but reached
about 97% of lateral torsional buckling capacity for long spans.
Conclusions and Recommendations
9-7
The web stiffeners can also be screw-fixed instead of welding to the inner
faces of top and bottom flanges of LSBs.
Suitable design equations were developed to calculate the elastic lateral
distortional buckling moments of LSBs with the recommended optimum web
stiffener configurations.
It was found that the developed design rules for single and back to back LSBs
without web stiffeners were not suitable to predict the lateral buckling
moments of LSBs with web stiffeners.
A new design rule was developed to accurately predict the ultimate moment
capacities of LSBs with web stiffeners subject to lateral buckling. This can be
used with a capacity reduction factor (Φ) of 0.90.
The use of a geometrical parameter K significantly reduced the scatter in the
FEA data points where this parameter K was the same as that used in the
lateral buckling investigation of LSBs without web stiffeners.
A new design rule with the geometrical parameter K was also developed to
more accurately predict the ultimate moment capacities of LSBs with web
stiffeners.
The developed design equations for LSBs with 5 mm thick steel plate
stiffeners welded to the inner faces of the flanges of LSBs at third span points
and supports is recommended to be equally applicable when thinner web
stiffeners (3 mm or 4 mm) are used for thinner and smaller LSBs.
9.6 Future Research
It is recommended that the following research projects are undertaken in the future to
advance the knowledge in this field.
Experimental measurements of residual stresses in other types of hollow
flange sections such as MHFBs and RHFBs. Measured residual stresses can
then be used in the finite element analyses of these sections to confirm the
adequacy of the developed design rules in Phase one of this research.
Effects of support conditions on the flexural behaviour and strength of LSBs.
Further section moment capacity tests of compact LSBs to more accurately
predict the inelastic reserve capacity of compact LSBs.
Conclusions and Recommendations
9-8
Section moment capacity of other types of hollow flange sections such as
MHFBs and RHFBs including their inelastic reserve bending capacities.
Lateral buckling tests of LSBs and other types of hollow flange sections with
web stiffeners.
Lateral buckling behaviour of LSBs with web stiffeners under non-uniform
moment distributions and transverse loading.
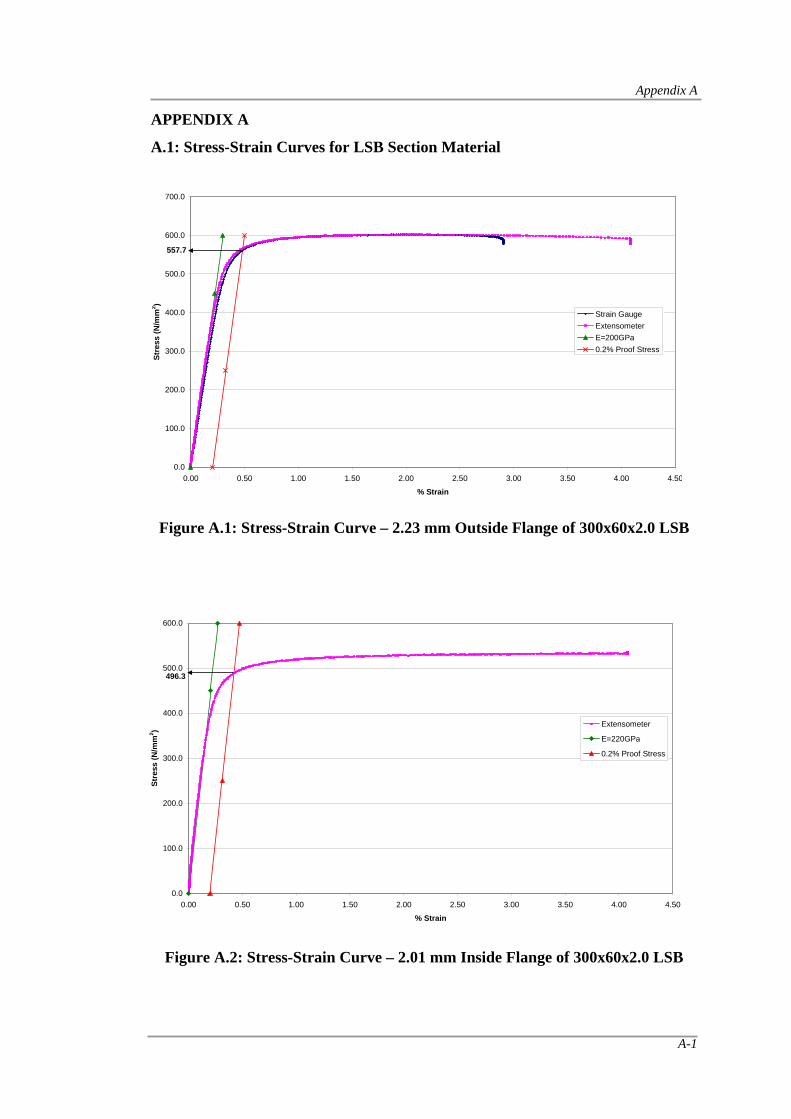
Appendix A
A-1
APPENDIX A
A.1: Stress-Strain Curves for LSB Section Material
Figure A.1: Stress-Strain Curve – 2.23 mm Outside Flange of 300x60x2.0 LSB
Figure A.2: Stress-Strain Curve – 2.01 mm Inside Flange of 300x60x2.0 LSB
0.0
100.0
200.0
300.0
400.0
500.0
600.0
700.0
0.00 0.50 1.00 1.50 2.00 2.50 3.00 3.50 4.00 4.50
% Strain
Stre
ss (N
/mm
2 )
Strain GaugeExtensometerE=200GPa0.2% Proof Stress
557.7
0.0
100.0
200.0
300.0
400.0
500.0
600.0
0.00 0.50 1.00 1.50 2.00 2.50 3.00 3.50 4.00 4.50
% Strain
Stre
ss (N
/mm
2 )
Extensometer
E=220GPa
0.2% Proof Stress
496.3
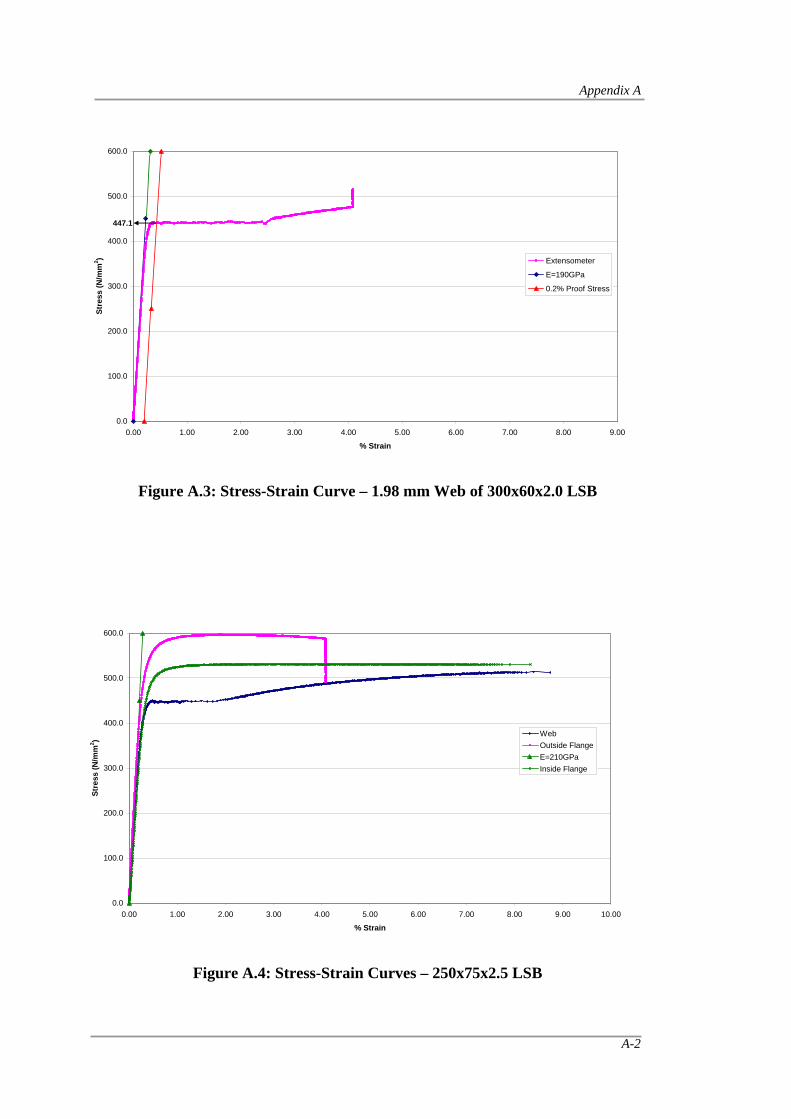
Appendix A
A-2
Figure A.3: Stress-Strain Curve – 1.98 mm Web of 300x60x2.0 LSB
Figure A.4: Stress-Strain Curves – 250x75x2.5 LSB
0.0
100.0
200.0
300.0
400.0
500.0
600.0
0.00 1.00 2.00 3.00 4.00 5.00 6.00 7.00 8.00 9.00 10.00
% Strain
Stre
ss (N
/mm
2 )
WebOutside FlangeE=210GPaInside Flange
0.0
100.0
200.0
300.0
400.0
500.0
600.0
0.00 1.00 2.00 3.00 4.00 5.00 6.00 7.00 8.00 9.00
% Strain
Stre
ss (N
/mm
2 ) Extensometer
E=190GPa
0.2% Proof Stress
447.1
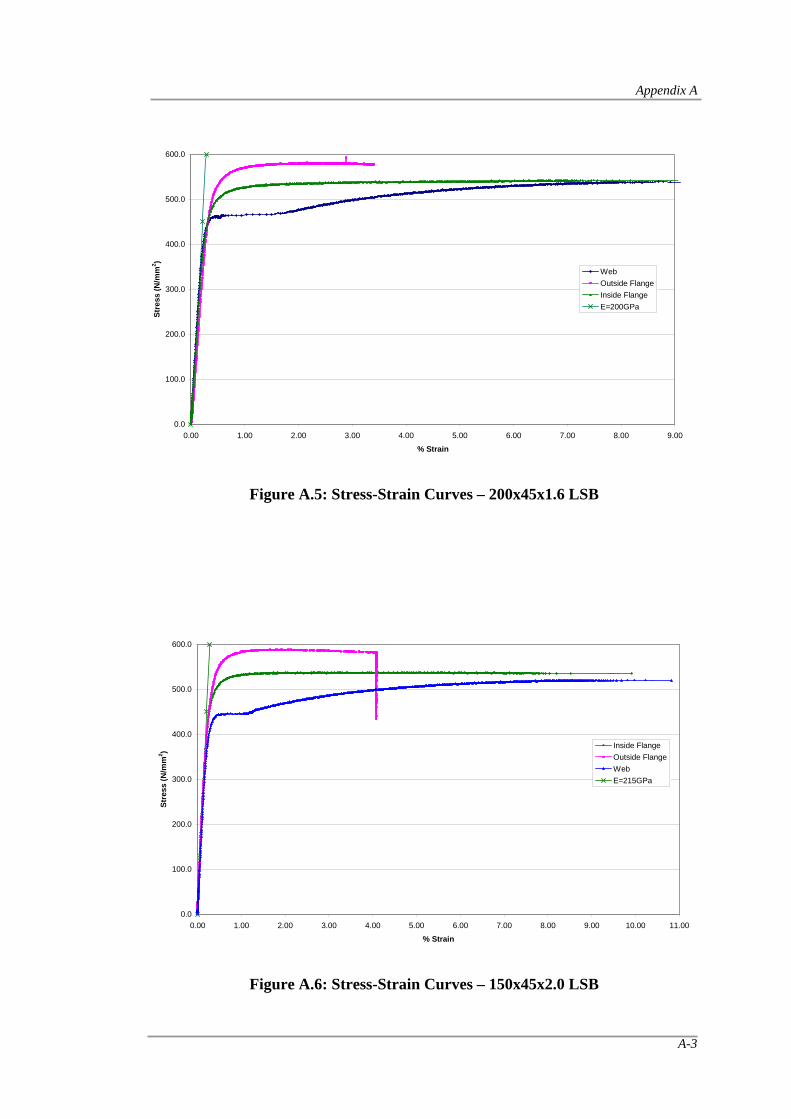
Appendix A
A-3
Figure A.5: Stress-Strain Curves – 200x45x1.6 LSB
Figure A.6: Stress-Strain Curves – 150x45x2.0 LSB
0.0
100.0
200.0
300.0
400.0
500.0
600.0
0.00 1.00 2.00 3.00 4.00 5.00 6.00 7.00 8.00 9.00
% Strain
Stre
ss (N
/mm
2 )
WebOutside FlangeInside FlangeE=200GPa
0.0
100.0
200.0
300.0
400.0
500.0
600.0
0.00 1.00 2.00 3.00 4.00 5.00 6.00 7.00 8.00 9.00 10.00 11.00
% Strain
Stre
ss (N
/mm
2 )
Inside FlangeOutside FlangeWebE=215GPa
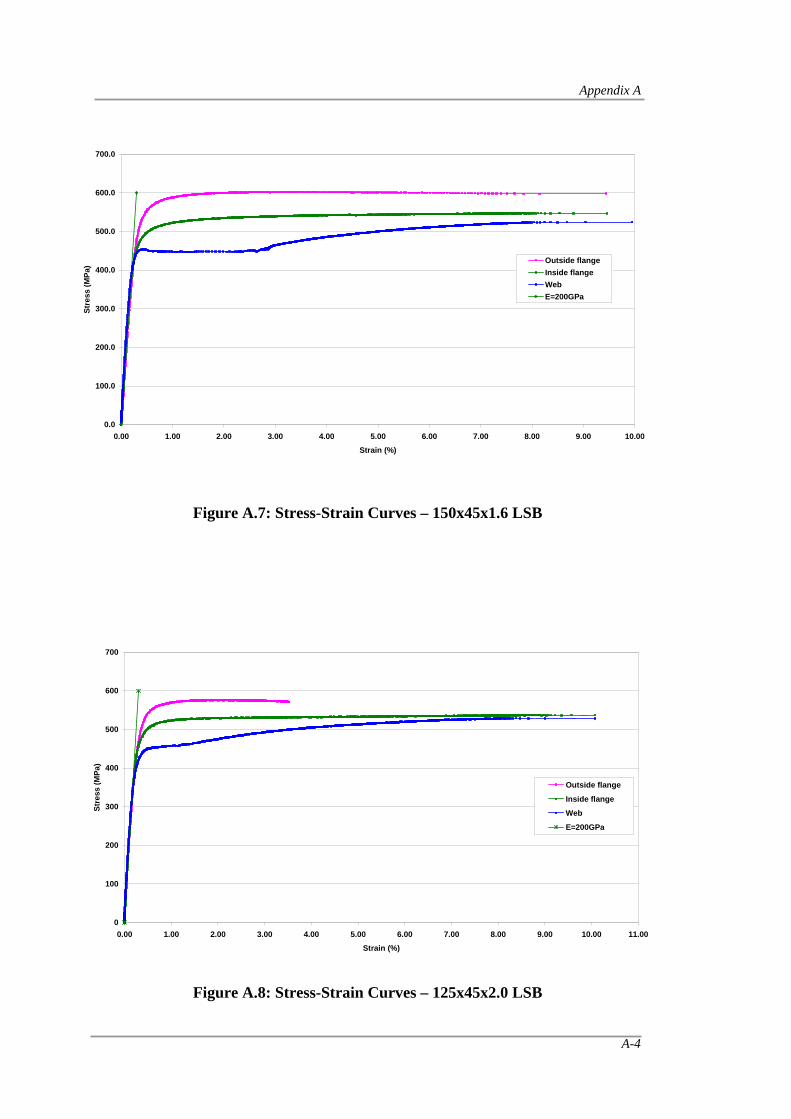
Appendix A
A-4
Figure A.7: Stress-Strain Curves – 150x45x1.6 LSB
Figure A.8: Stress-Strain Curves – 125x45x2.0 LSB
0.0
100.0
200.0
300.0
400.0
500.0
600.0
700.0
0.00 1.00 2.00 3.00 4.00 5.00 6.00 7.00 8.00 9.00 10.00
Strain (%)
Stre
ss (M
Pa) Outside flange
Inside flangeWebE=200GPa
0
100
200
300
400
500
600
700
0.00 1.00 2.00 3.00 4.00 5.00 6.00 7.00 8.00 9.00 10.00 11.00
Strain (%)
Stre
ss (M
Pa)
Outside flange
Inside flange
Web
E=200GPa
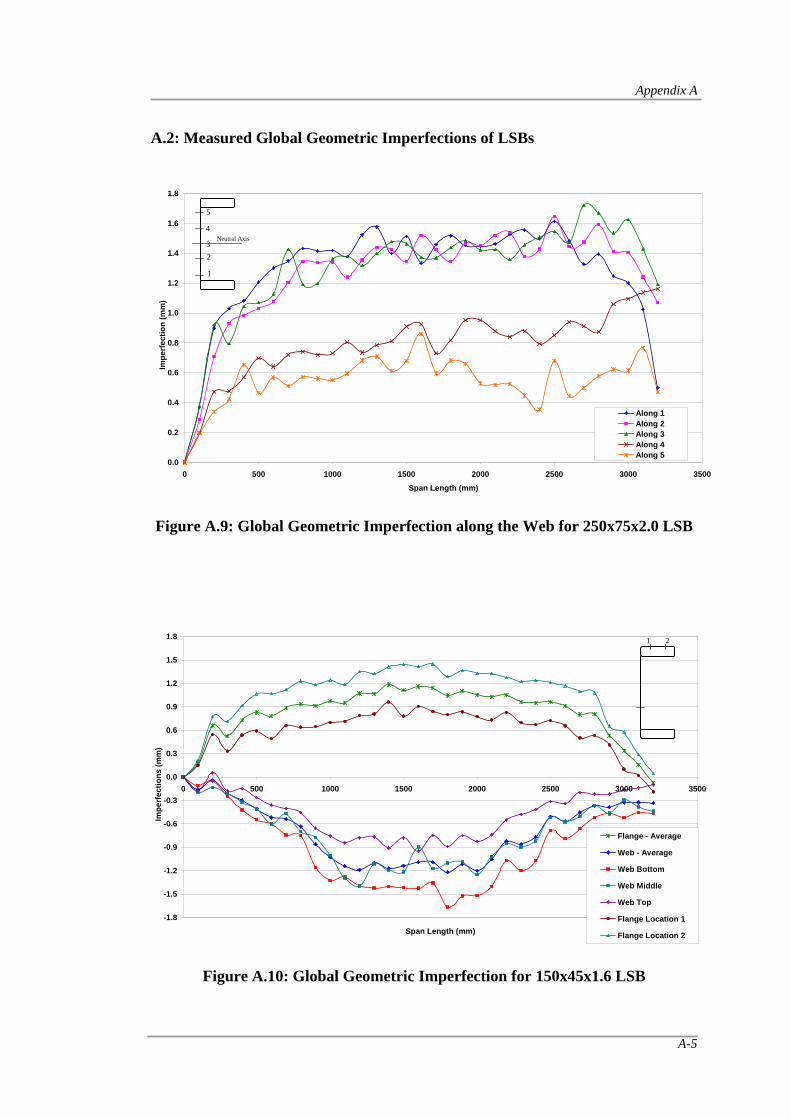
Appendix A
A-5
A.2: Measured Global Geometric Imperfections of LSBs
Figure A.9: Global Geometric Imperfection along the Web for 250x75x2.0 LSB
Figure A.10: Global Geometric Imperfection for 150x45x1.6 LSB
0.0
0.2
0.4
0.6
0.8
1.0
1.2
1.4
1.6
1.8
0 500 1000 1500 2000 2500 3000 3500
Span Length (mm)
Impe
rfec
tion
(mm
)
Along 1Along 2Along 3Along 4Along 5
2
1
4
5
3Neutral Axis
-1.8
-1.5
-1.2
-0.9
-0.6
-0.3
0.0
0.3
0.6
0.9
1.2
1.5
1.8
0 500 1000 1500 2000 2500 3000 3500
Span Length (mm)
Impe
rfec
tions
(mm
)
Flange - Average
Web - Average
Web Bottom
Web Middle
Web Top
Flange Location 1
Flange Location 2
1 2
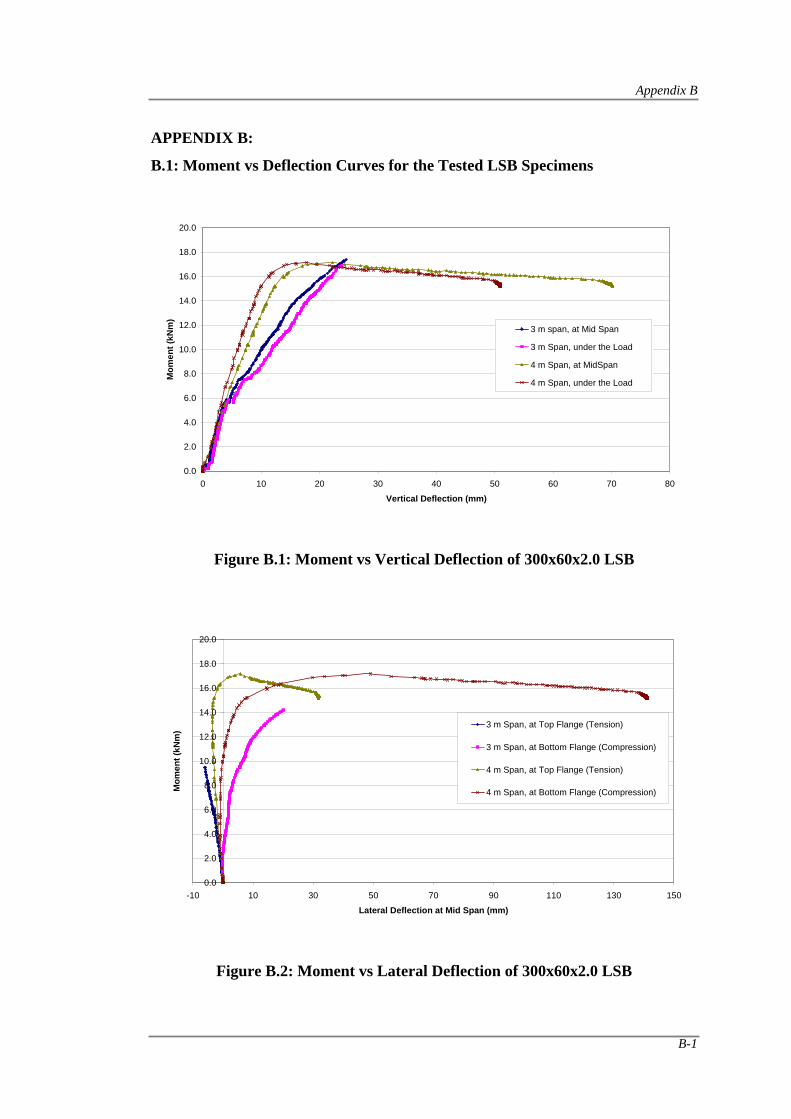
Appendix B
B-1
APPENDIX B:
B.1: Moment vs Deflection Curves for the Tested LSB Specimens
Figure B.1: Moment vs Vertical Deflection of 300x60x2.0 LSB
Figure B.2: Moment vs Lateral Deflection of 300x60x2.0 LSB
0.0
2.0
4.0
6.0
8.0
10.0
12.0
14.0
16.0
18.0
20.0
0 10 20 30 40 50 60 70 80
Vertical Deflection (mm)
Mom
ent (
kNm
)
3 m span, at Mid Span
3 m Span, under the Load
4 m Span, at MidSpan
4 m Span, under the Load
0.0
2.0
4.0
6.0
8.0
10.0
12.0
14.0
16.0
18.0
20.0
-10 10 30 50 70 90 110 130 150
Lateral Deflection at Mid Span (mm)
Mom
ent (
kNm
)
3 m Span, at Top Flange (Tension)
3 m Span, at Bottom Flange (Compression)
4 m Span, at Top Flange (Tension)
4 m Span, at Bottom Flange (Compression)
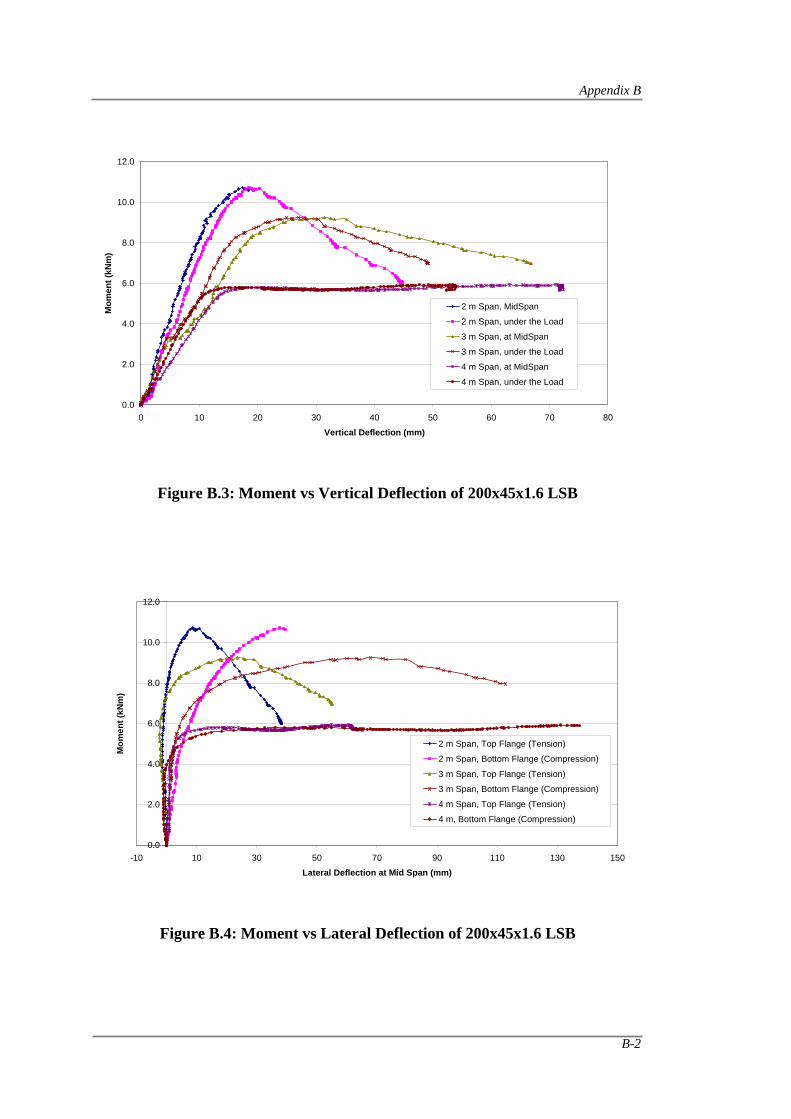
Appendix B
B-2
Figure B.3: Moment vs Vertical Deflection of 200x45x1.6 LSB
Figure B.4: Moment vs Lateral Deflection of 200x45x1.6 LSB
0.0
2.0
4.0
6.0
8.0
10.0
12.0
0 10 20 30 40 50 60 70 80
Vertical Deflection (mm)
Mom
ent (
kNm
)
2 m Span, MidSpan
2 m Span, under the Load
3 m Span, at MidSpan
3 m Span, under the Load
4 m Span, at MidSpan
4 m Span, under the Load
0.0
2.0
4.0
6.0
8.0
10.0
12.0
-10 10 30 50 70 90 110 130 150
Lateral Deflection at Mid Span (mm)
Mom
ent (
kNm
)
2 m Span, Top Flange (Tension)
2 m Span, Bottom Flange (Compression)
3 m Span, Top Flange (Tension)
3 m Span, Bottom Flange (Compression)
4 m Span, Top Flange (Tension)
4 m, Bottom Flange (Compression)
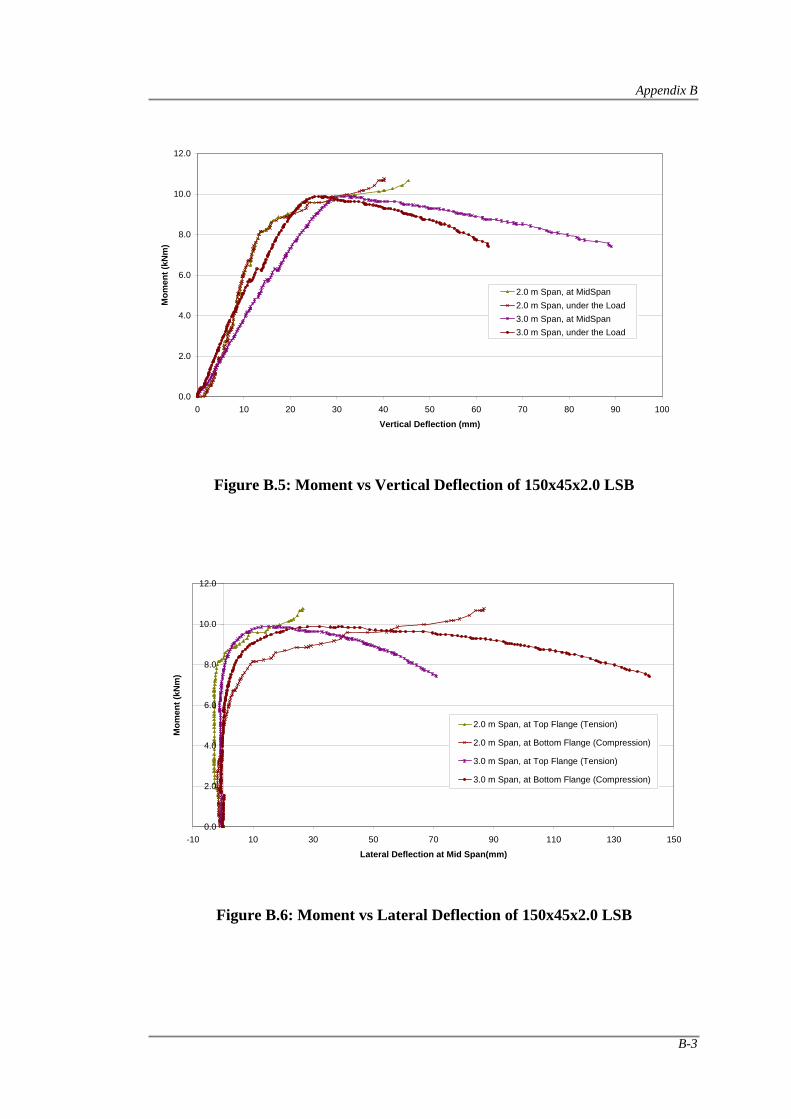
Appendix B
B-3
Figure B.5: Moment vs Vertical Deflection of 150x45x2.0 LSB
Figure B.6: Moment vs Lateral Deflection of 150x45x2.0 LSB
0.0
2.0
4.0
6.0
8.0
10.0
12.0
0 10 20 30 40 50 60 70 80 90 100
Vertical Deflection (mm)
Mom
ent (
kNm
)
2.0 m Span, at MidSpan2.0 m Span, under the Load3.0 m Span, at MidSpan3.0 m Span, under the Load
0.0
2.0
4.0
6.0
8.0
10.0
12.0
-10 10 30 50 70 90 110 130 150
Lateral Deflection at Mid Span(mm)
Mom
ent (
kNm
)
2.0 m Span, at Top Flange (Tension)
2.0 m Span, at Bottom Flange (Compression)
3.0 m Span, at Top Flange (Tension)
3.0 m Span, at Bottom Flange (Compression)
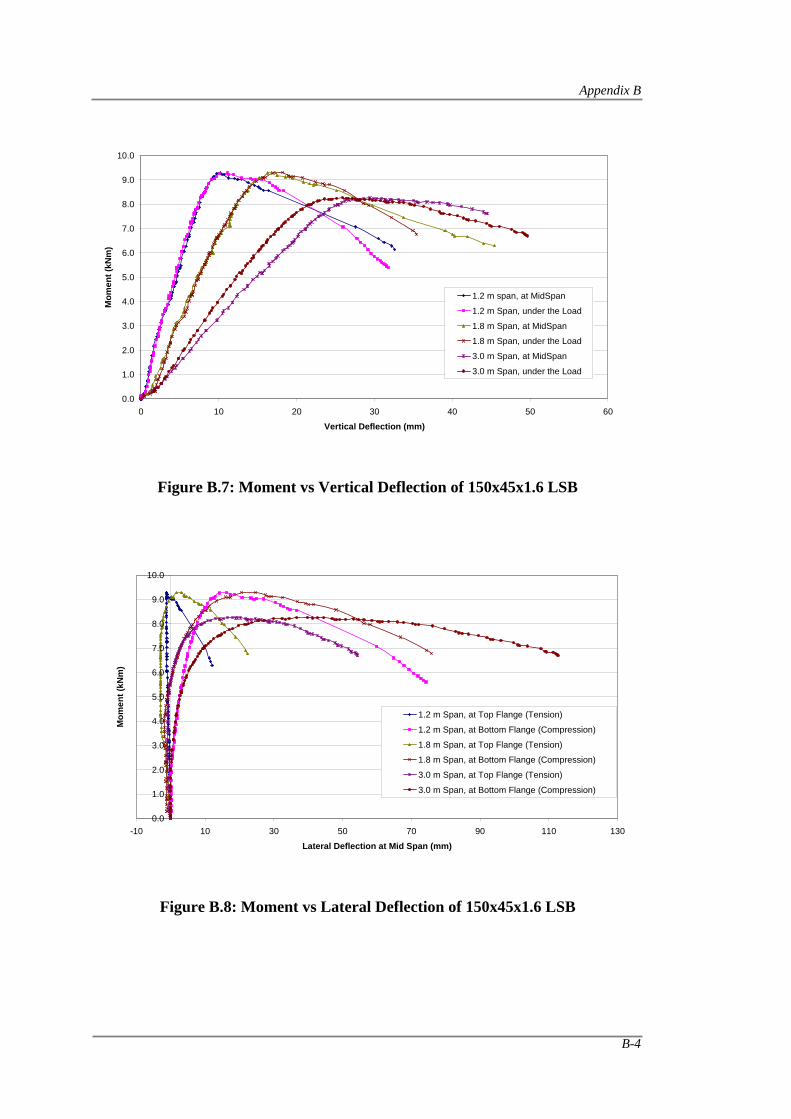
Appendix B
B-4
Figure B.7: Moment vs Vertical Deflection of 150x45x1.6 LSB
Figure B.8: Moment vs Lateral Deflection of 150x45x1.6 LSB
0.0
1.0
2.0
3.0
4.0
5.0
6.0
7.0
8.0
9.0
10.0
0 10 20 30 40 50 60
Vertical Deflection (mm)
Mom
ent (
kNm
)
1.2 m span, at MidSpan
1.2 m Span, under the Load
1.8 m Span, at MidSpan
1.8 m Span, under the Load
3.0 m Span, at MidSpan
3.0 m Span, under the Load
0.0
1.0
2.0
3.0
4.0
5.0
6.0
7.0
8.0
9.0
10.0
-10 10 30 50 70 90 110 130
Lateral Deflection at Mid Span (mm)
Mom
ent (
kNm
)
1.2 m Span, at Top Flange (Tension)
1.2 m Span, at Bottom Flange (Compression)
1.8 m Span, at Top Flange (Tension)
1.8 m Span, at Bottom Flange (Compression)
3.0 m Span, at Top Flange (Tension)
3.0 m Span, at Bottom Flange (Compression)
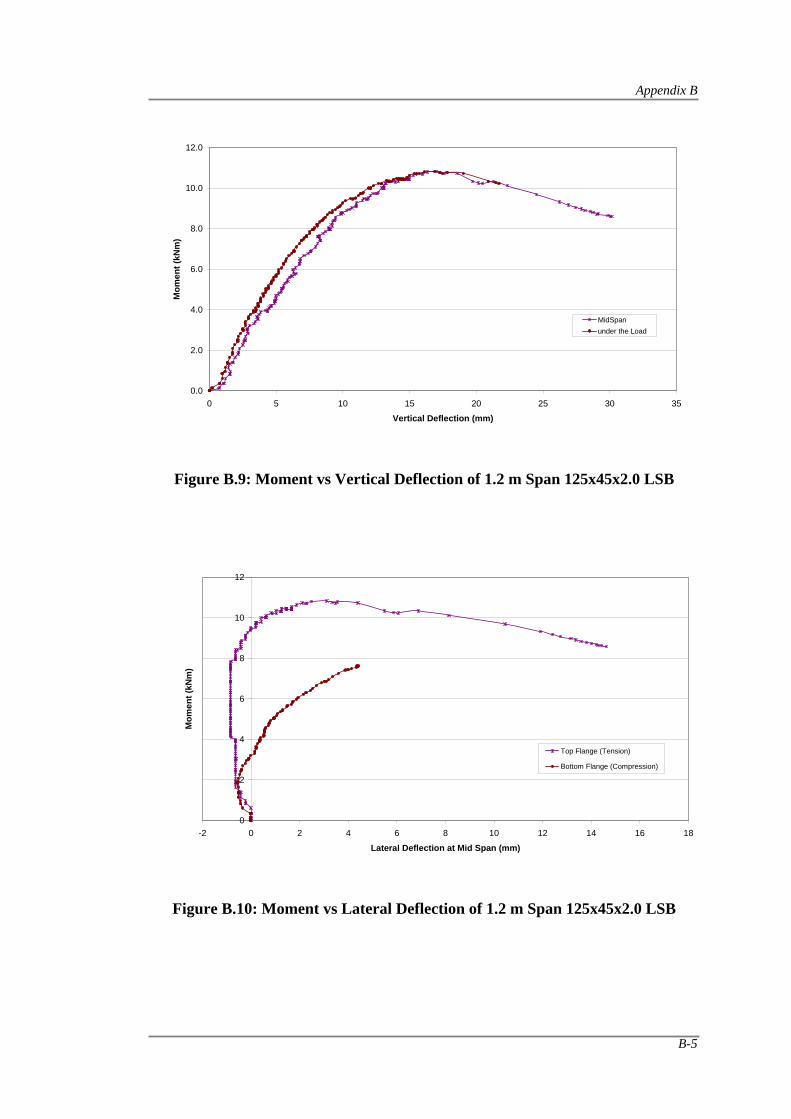
Appendix B
B-5
Figure B.9: Moment vs Vertical Deflection of 1.2 m Span 125x45x2.0 LSB
Figure B.10: Moment vs Lateral Deflection of 1.2 m Span 125x45x2.0 LSB
0.0
2.0
4.0
6.0
8.0
10.0
12.0
0 5 10 15 20 25 30 35
Vertical Deflection (mm)
Mom
ent (
kNm
)
MidSpanunder the Load
0
2
4
6
8
10
12
-2 0 2 4 6 8 10 12 14 16 18
Lateral Deflection at Mid Span (mm)
Mom
ent (
kNm
)
Top Flange (Tension)
Bottom Flange (Compression)
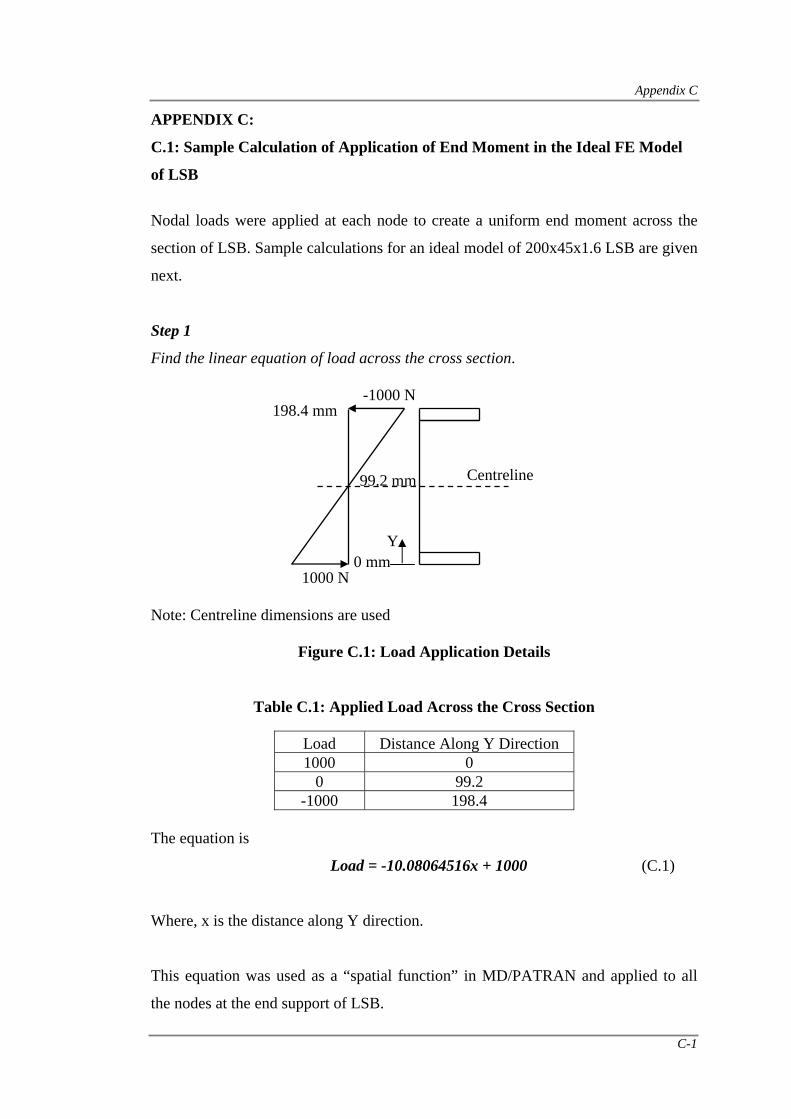
Appendix C
C-1
APPENDIX C:
C.1: Sample Calculation of Application of End Moment in the Ideal FE Model
of LSB
Nodal loads were applied at each node to create a uniform end moment across the
section of LSB. Sample calculations for an ideal model of 200x45x1.6 LSB are given
next.
Step 1
Find the linear equation of load across the cross section.
Note: Centreline dimensions are used
Figure C.1: Load Application Details
Table C.1: Applied Load Across the Cross Section
Load Distance Along Y Direction 1000 0
0 99.2 -1000 198.4
The equation is
Load = -10.08064516x + 1000 (C.1)
Where, x is the distance along Y direction.
This equation was used as a “spatial function” in MD/PATRAN and applied to all
the nodes at the end support of LSB.
99.2 mm
1000 N
-1000 N
Centreline
0 mm
198.4 mm
Y
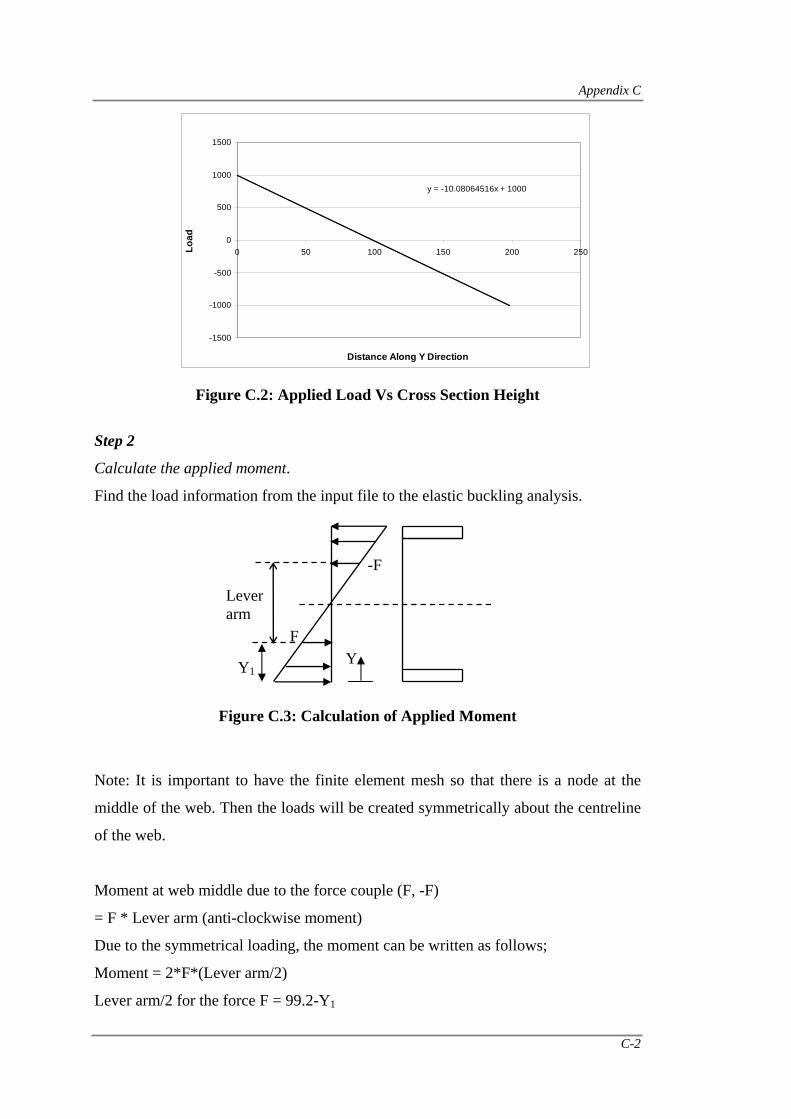
Appendix C
C-2
Figure C.2: Applied Load Vs Cross Section Height
Step 2
Calculate the applied moment.
Find the load information from the input file to the elastic buckling analysis.
Figure C.3: Calculation of Applied Moment
Note: It is important to have the finite element mesh so that there is a node at the
middle of the web. Then the loads will be created symmetrically about the centreline
of the web.
Moment at web middle due to the force couple (F, -F)
= F * Lever arm (anti-clockwise moment)
Due to the symmetrical loading, the moment can be written as follows;
Moment = 2*F*(Lever arm/2)
Lever arm/2 for the force F = 99.2-Y1
y = -10.08064516x + 1000
-1500
-1000
-500
0
500
1000
1500
0 50 100 150 200 250
Distance Along Y Direction
Load
F
Lever arm
-F
YY1
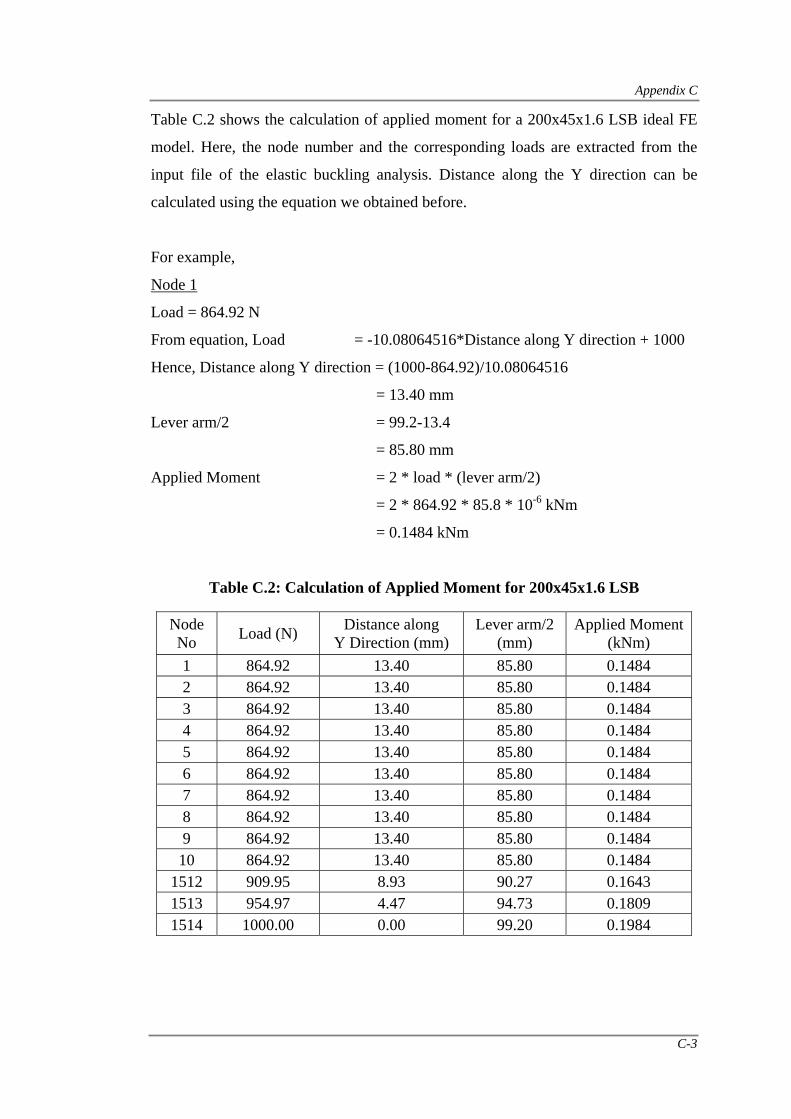
Appendix C
C-3
Table C.2 shows the calculation of applied moment for a 200x45x1.6 LSB ideal FE
model. Here, the node number and the corresponding loads are extracted from the
input file of the elastic buckling analysis. Distance along the Y direction can be
calculated using the equation we obtained before.
For example,
Node 1
Load = 864.92 N
From equation, Load = -10.08064516*Distance along Y direction + 1000
Hence, Distance along Y direction = (1000-864.92)/10.08064516
= 13.40 mm
Lever arm/2 = 99.2-13.4
= 85.80 mm
Applied Moment = 2 * load * (lever arm/2)
= 2 * 864.92 * 85.8 * 10-6 kNm
= 0.1484 kNm
Table C.2: Calculation of Applied Moment for 200x45x1.6 LSB
Node No Load (N) Distance along
Y Direction (mm) Lever arm/2
(mm) Applied Moment
(kNm) 1 864.92 13.40 85.80 0.1484 2 864.92 13.40 85.80 0.1484 3 864.92 13.40 85.80 0.1484 4 864.92 13.40 85.80 0.1484 5 864.92 13.40 85.80 0.1484 6 864.92 13.40 85.80 0.1484 7 864.92 13.40 85.80 0.1484 8 864.92 13.40 85.80 0.1484 9 864.92 13.40 85.80 0.1484 10 864.92 13.40 85.80 0.1484
1512 909.95 8.93 90.27 0.1643 1513 954.97 4.47 94.73 0.1809 1514 1000.00 0.00 99.20 0.1984
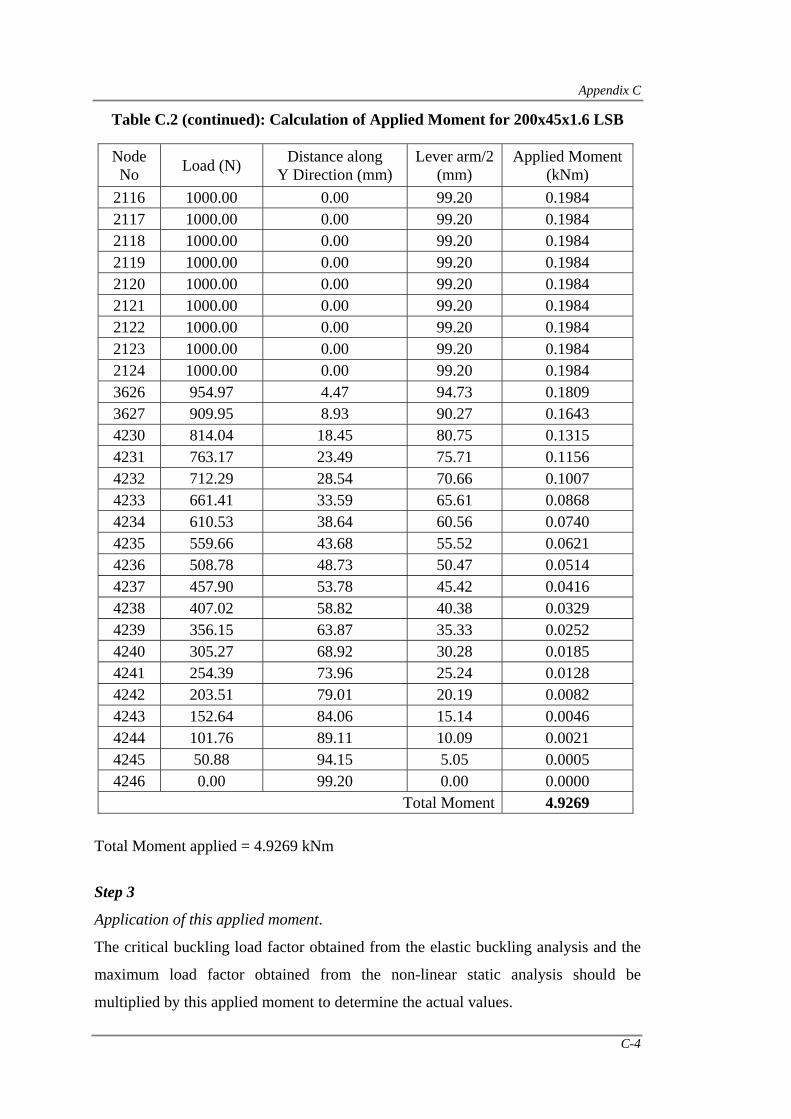
Appendix C
C-4
Table C.2 (continued): Calculation of Applied Moment for 200x45x1.6 LSB
Node No Load (N) Distance along
Y Direction (mm) Lever arm/2
(mm) Applied Moment
(kNm) 2116 1000.00 0.00 99.20 0.1984 2117 1000.00 0.00 99.20 0.1984 2118 1000.00 0.00 99.20 0.1984 2119 1000.00 0.00 99.20 0.1984 2120 1000.00 0.00 99.20 0.1984 2121 1000.00 0.00 99.20 0.1984 2122 1000.00 0.00 99.20 0.1984 2123 1000.00 0.00 99.20 0.1984 2124 1000.00 0.00 99.20 0.1984 3626 954.97 4.47 94.73 0.1809 3627 909.95 8.93 90.27 0.1643 4230 814.04 18.45 80.75 0.1315 4231 763.17 23.49 75.71 0.1156 4232 712.29 28.54 70.66 0.1007 4233 661.41 33.59 65.61 0.0868 4234 610.53 38.64 60.56 0.0740 4235 559.66 43.68 55.52 0.0621 4236 508.78 48.73 50.47 0.0514 4237 457.90 53.78 45.42 0.0416 4238 407.02 58.82 40.38 0.0329 4239 356.15 63.87 35.33 0.0252 4240 305.27 68.92 30.28 0.0185 4241 254.39 73.96 25.24 0.0128 4242 203.51 79.01 20.19 0.0082 4243 152.64 84.06 15.14 0.0046 4244 101.76 89.11 10.09 0.0021 4245 50.88 94.15 5.05 0.0005 4246 0.00 99.20 0.00 0.0000
Total Moment 4.9269
Total Moment applied = 4.9269 kNm
Step 3
Application of this applied moment.
The critical buckling load factor obtained from the elastic buckling analysis and the
maximum load factor obtained from the non-linear static analysis should be
multiplied by this applied moment to determine the actual values.
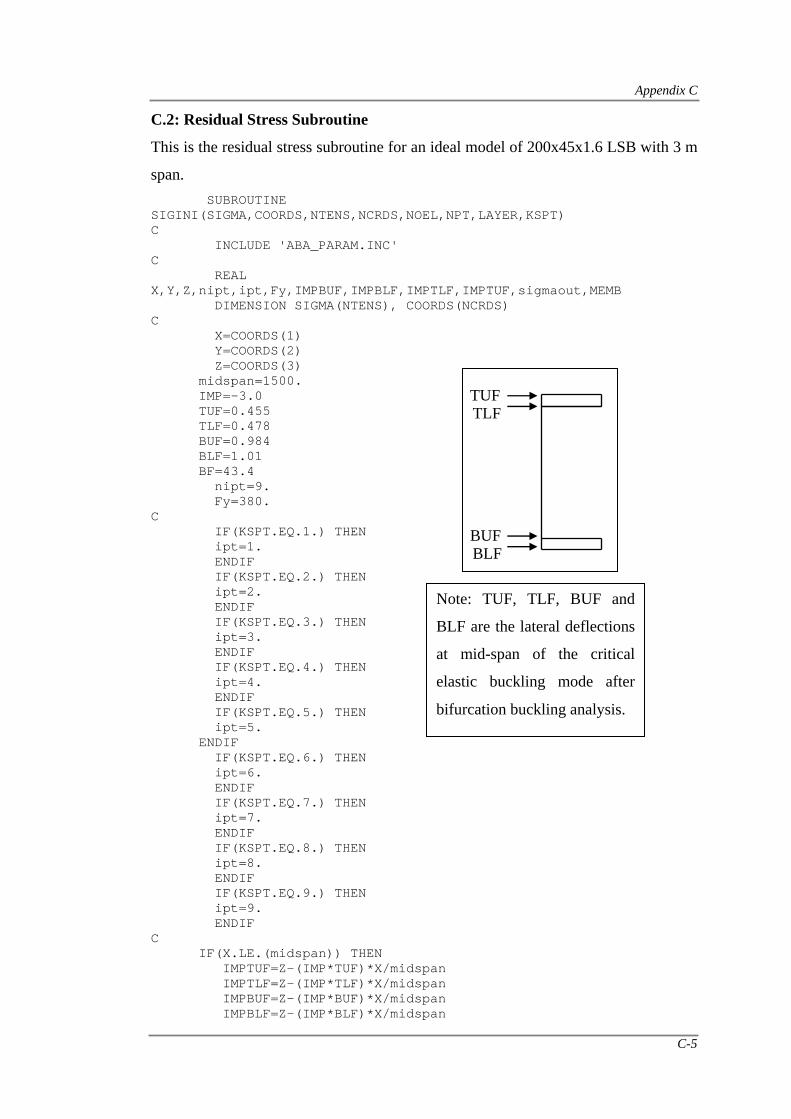
Appendix C
C-5
C.2: Residual Stress Subroutine
This is the residual stress subroutine for an ideal model of 200x45x1.6 LSB with 3 m
span. SUBROUTINE SIGINI(SIGMA,COORDS,NTENS,NCRDS,NOEL,NPT,LAYER,KSPT) C INCLUDE 'ABA_PARAM.INC' C REAL X,Y,Z,nipt,ipt,Fy,IMPBUF,IMPBLF,IMPTLF,IMPTUF,sigmaout,MEMB DIMENSION SIGMA(NTENS), COORDS(NCRDS) C X=COORDS(1) Y=COORDS(2) Z=COORDS(3) midspan=1500. IMP=-3.0 TUF=0.455 TLF=0.478 BUF=0.984 BLF=1.01 BF=43.4 nipt=9. Fy=380. C IF(KSPT.EQ.1.) THEN ipt=1. ENDIF IF(KSPT.EQ.2.) THEN ipt=2. ENDIF IF(KSPT.EQ.3.) THEN ipt=3. ENDIF IF(KSPT.EQ.4.) THEN ipt=4. ENDIF IF(KSPT.EQ.5.) THEN ipt=5. ENDIF IF(KSPT.EQ.6.) THEN ipt=6. ENDIF IF(KSPT.EQ.7.) THEN ipt=7. ENDIF IF(KSPT.EQ.8.) THEN ipt=8. ENDIF IF(KSPT.EQ.9.) THEN ipt=9. ENDIF C IF(X.LE.(midspan)) THEN IMPTUF=Z-(IMP*TUF)*X/midspan IMPTLF=Z-(IMP*TLF)*X/midspan IMPBUF=Z-(IMP*BUF)*X/midspan IMPBLF=Z-(IMP*BLF)*X/midspan
Note: TUF, TLF, BUF and
BLF are the lateral deflections
at mid-span of the critical
elastic buckling mode after
bifurcation buckling analysis.
TUFTLF
BUFBLF
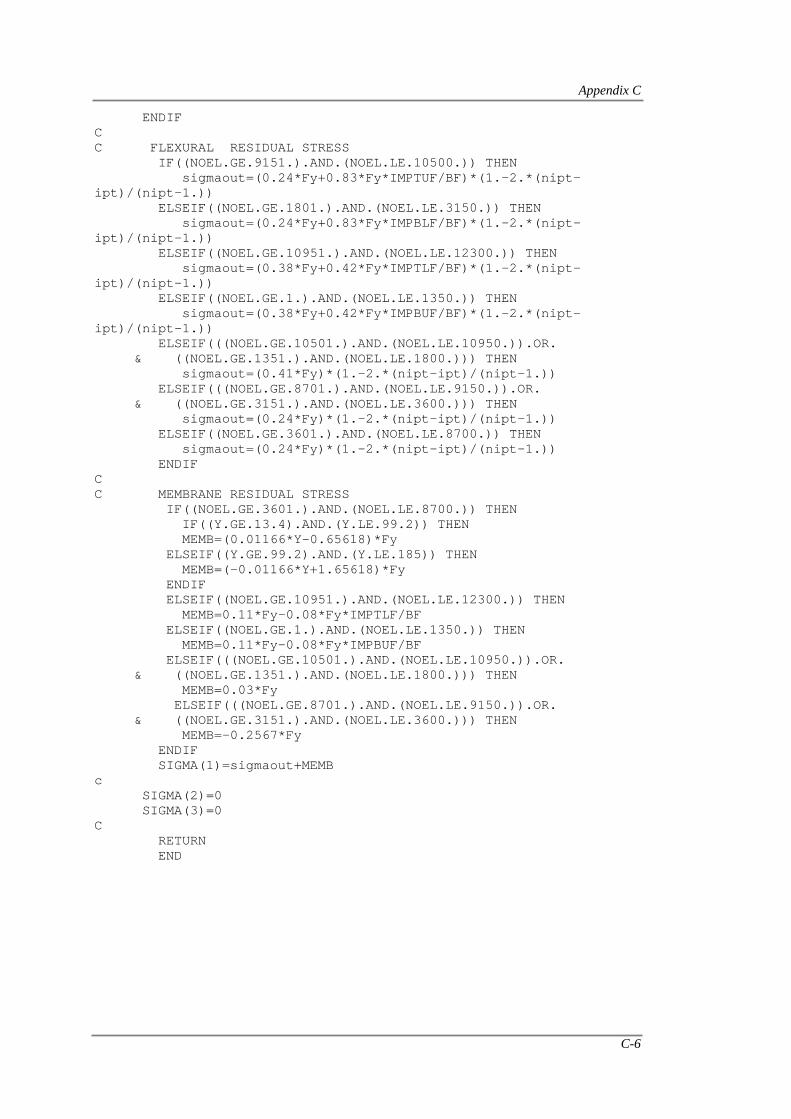
Appendix C
C-6
ENDIF C C FLEXURAL RESIDUAL STRESS IF((NOEL.GE.9151.).AND.(NOEL.LE.10500.)) THEN sigmaout=(0.24*Fy+0.83*Fy*IMPTUF/BF)*(1.-2.*(nipt-ipt)/(nipt-1.)) ELSEIF((NOEL.GE.1801.).AND.(NOEL.LE.3150.)) THEN sigmaout=(0.24*Fy+0.83*Fy*IMPBLF/BF)*(1.-2.*(nipt-ipt)/(nipt-1.)) ELSEIF((NOEL.GE.10951.).AND.(NOEL.LE.12300.)) THEN sigmaout=(0.38*Fy+0.42*Fy*IMPTLF/BF)*(1.-2.*(nipt-ipt)/(nipt-1.)) ELSEIF((NOEL.GE.1.).AND.(NOEL.LE.1350.)) THEN sigmaout=(0.38*Fy+0.42*Fy*IMPBUF/BF)*(1.-2.*(nipt-ipt)/(nipt-1.)) ELSEIF(((NOEL.GE.10501.).AND.(NOEL.LE.10950.)).OR. & ((NOEL.GE.1351.).AND.(NOEL.LE.1800.))) THEN sigmaout=(0.41*Fy)*(1.-2.*(nipt-ipt)/(nipt-1.)) ELSEIF(((NOEL.GE.8701.).AND.(NOEL.LE.9150.)).OR. & ((NOEL.GE.3151.).AND.(NOEL.LE.3600.))) THEN sigmaout=(0.24*Fy)*(1.-2.*(nipt-ipt)/(nipt-1.)) ELSEIF((NOEL.GE.3601.).AND.(NOEL.LE.8700.)) THEN sigmaout=(0.24*Fy)*(1.-2.*(nipt-ipt)/(nipt-1.)) ENDIF C C MEMBRANE RESIDUAL STRESS IF((NOEL.GE.3601.).AND.(NOEL.LE.8700.)) THEN IF((Y.GE.13.4).AND.(Y.LE.99.2)) THEN MEMB=(0.01166*Y-0.65618)*Fy ELSEIF((Y.GE.99.2).AND.(Y.LE.185)) THEN MEMB=(-0.01166*Y+1.65618)*Fy ENDIF ELSEIF((NOEL.GE.10951.).AND.(NOEL.LE.12300.)) THEN MEMB=0.11*Fy-0.08*Fy*IMPTLF/BF ELSEIF((NOEL.GE.1.).AND.(NOEL.LE.1350.)) THEN MEMB=0.11*Fy-0.08*Fy*IMPBUF/BF ELSEIF(((NOEL.GE.10501.).AND.(NOEL.LE.10950.)).OR. & ((NOEL.GE.1351.).AND.(NOEL.LE.1800.))) THEN MEMB=0.03*Fy ELSEIF(((NOEL.GE.8701.).AND.(NOEL.LE.9150.)).OR. & ((NOEL.GE.3151.).AND.(NOEL.LE.3600.))) THEN MEMB=-0.2567*Fy ENDIF SIGMA(1)=sigmaout+MEMB c SIGMA(2)=0 SIGMA(3)=0 C RETURN END
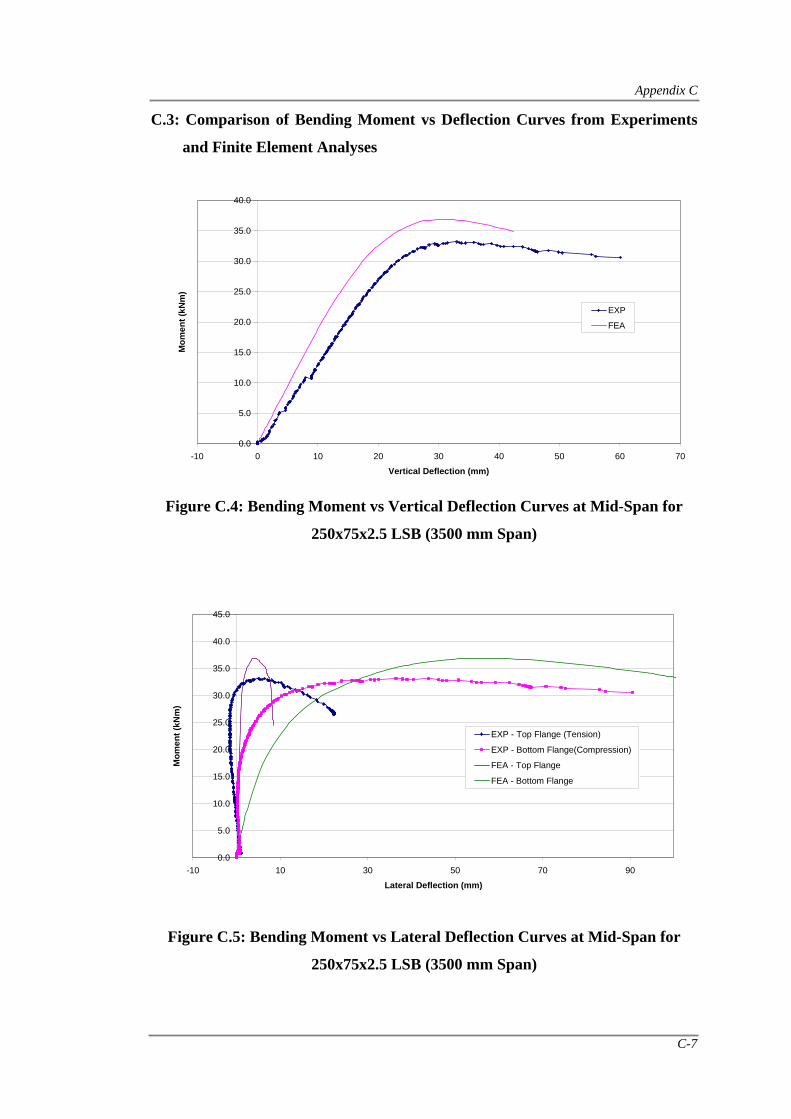
Appendix C
C-7
C.3: Comparison of Bending Moment vs Deflection Curves from Experiments
and Finite Element Analyses
Figure C.4: Bending Moment vs Vertical Deflection Curves at Mid-Span for
250x75x2.5 LSB (3500 mm Span)
Figure C.5: Bending Moment vs Lateral Deflection Curves at Mid-Span for
250x75x2.5 LSB (3500 mm Span)
0.0
5.0
10.0
15.0
20.0
25.0
30.0
35.0
40.0
-10 0 10 20 30 40 50 60 70
Vertical Deflection (mm)
Mom
ent (
kNm
)
EXP
FEA
0.0
5.0
10.0
15.0
20.0
25.0
30.0
35.0
40.0
45.0
-10 10 30 50 70 90
Lateral Deflection (mm)
Mom
ent (
kNm
)
EXP - Top Flange (Tension)
EXP - Bottom Flange(Compression)
FEA - Top Flange
FEA - Bottom Flange
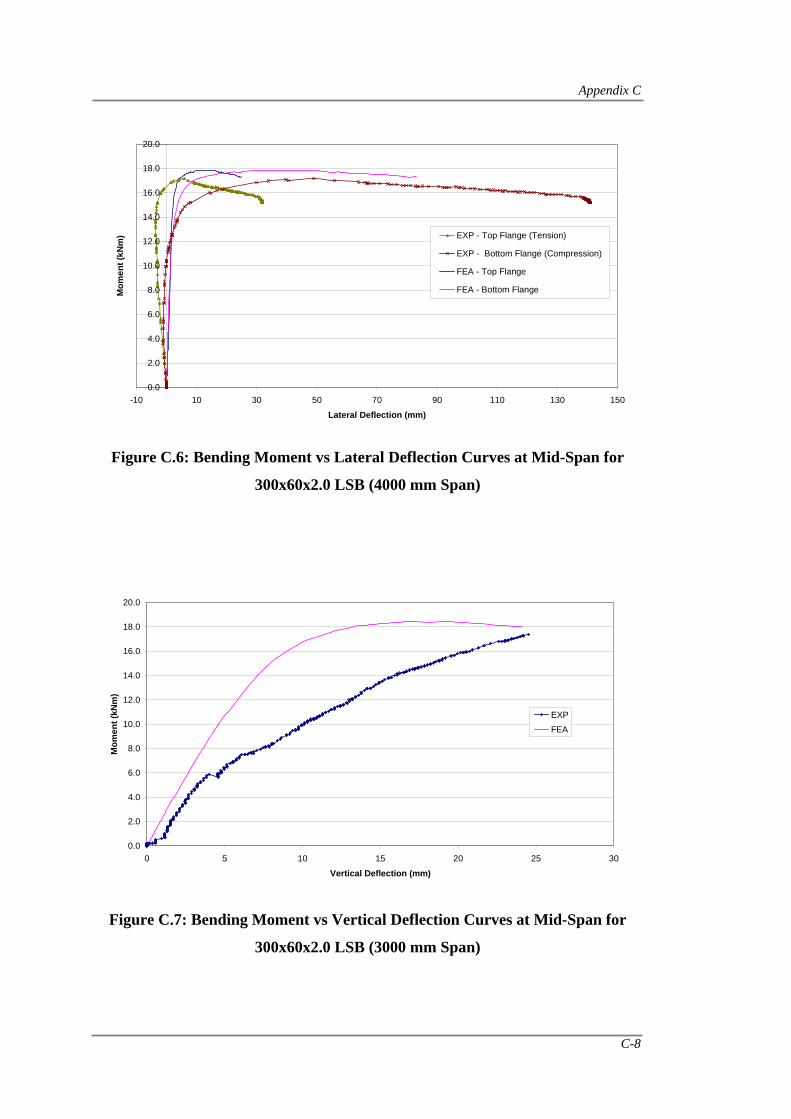
Appendix C
C-8
Figure C.6: Bending Moment vs Lateral Deflection Curves at Mid-Span for
300x60x2.0 LSB (4000 mm Span)
Figure C.7: Bending Moment vs Vertical Deflection Curves at Mid-Span for
300x60x2.0 LSB (3000 mm Span)
0.0
2.0
4.0
6.0
8.0
10.0
12.0
14.0
16.0
18.0
20.0
0 5 10 15 20 25 30
Vertical Deflection (mm)
Mom
ent (
kNm
)
EXP
FEA
0.0
2.0
4.0
6.0
8.0
10.0
12.0
14.0
16.0
18.0
20.0
-10 10 30 50 70 90 110 130 150
Lateral Deflection (mm)
Mom
ent (
kNm
) EXP - Top Flange (Tension)
EXP - Bottom Flange (Compression)
FEA - Top Flange
FEA - Bottom Flange
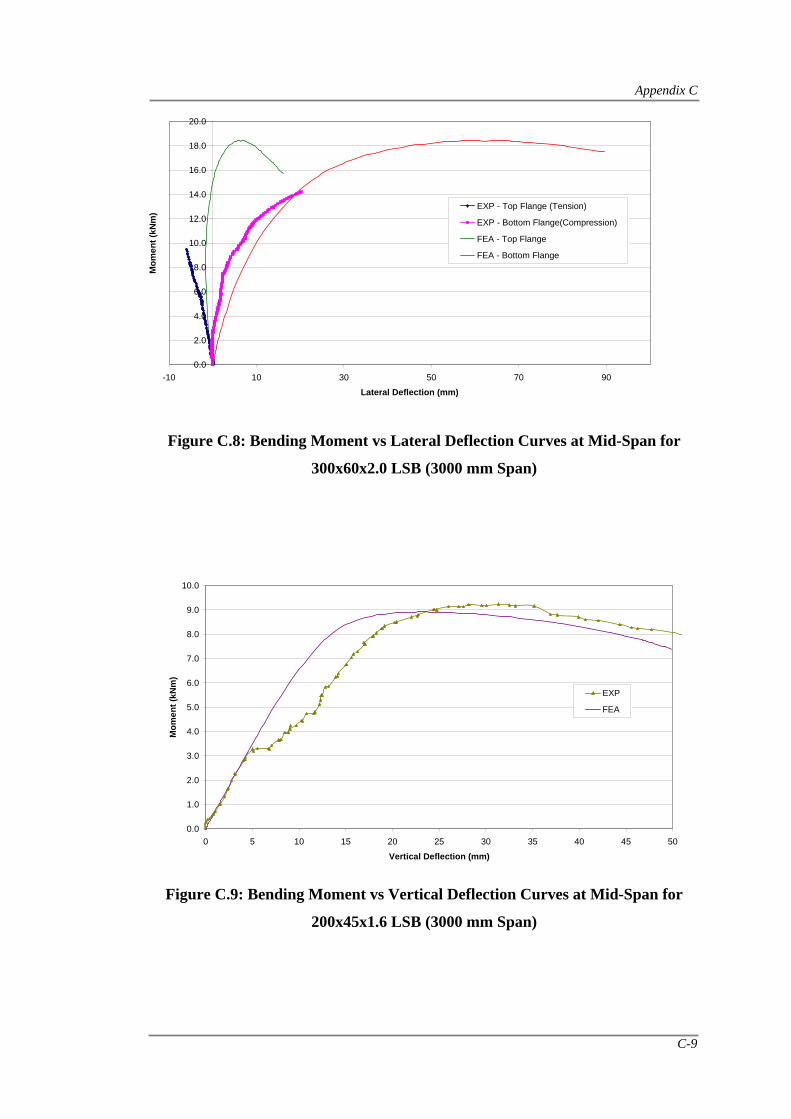
Appendix C
C-9
Figure C.8: Bending Moment vs Lateral Deflection Curves at Mid-Span for
300x60x2.0 LSB (3000 mm Span)
Figure C.9: Bending Moment vs Vertical Deflection Curves at Mid-Span for
200x45x1.6 LSB (3000 mm Span)
0.0
1.0
2.0
3.0
4.0
5.0
6.0
7.0
8.0
9.0
10.0
0 5 10 15 20 25 30 35 40 45 50
Vertical Deflection (mm)
Mom
ent (
kNm
)
EXP
FEA
0.0
2.0
4.0
6.0
8.0
10.0
12.0
14.0
16.0
18.0
20.0
-10 10 30 50 70 90
Lateral Deflection (mm)
Mom
ent (
kNm
)
EXP - Top Flange (Tension)
EXP - Bottom Flange(Compression)
FEA - Top Flange
FEA - Bottom Flange
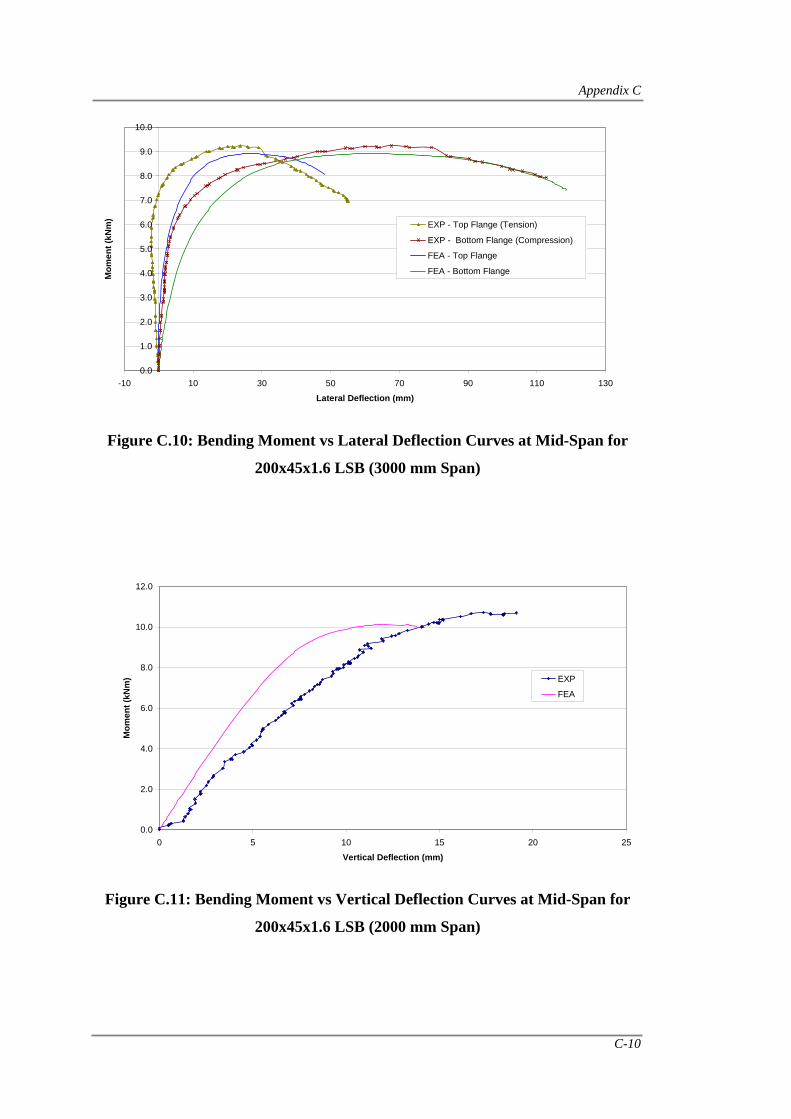
Appendix C
C-10
Figure C.10: Bending Moment vs Lateral Deflection Curves at Mid-Span for
200x45x1.6 LSB (3000 mm Span)
Figure C.11: Bending Moment vs Vertical Deflection Curves at Mid-Span for
200x45x1.6 LSB (2000 mm Span)
0.0
2.0
4.0
6.0
8.0
10.0
12.0
0 5 10 15 20 25
Vertical Deflection (mm)
Mom
ent (
kNm
) EXP
FEA
0.0
1.0
2.0
3.0
4.0
5.0
6.0
7.0
8.0
9.0
10.0
-10 10 30 50 70 90 110 130
Lateral Deflection (mm)
Mom
ent (
kNm
)
EXP - Top Flange (Tension)
EXP - Bottom Flange (Compression)
FEA - Top Flange
FEA - Bottom Flange
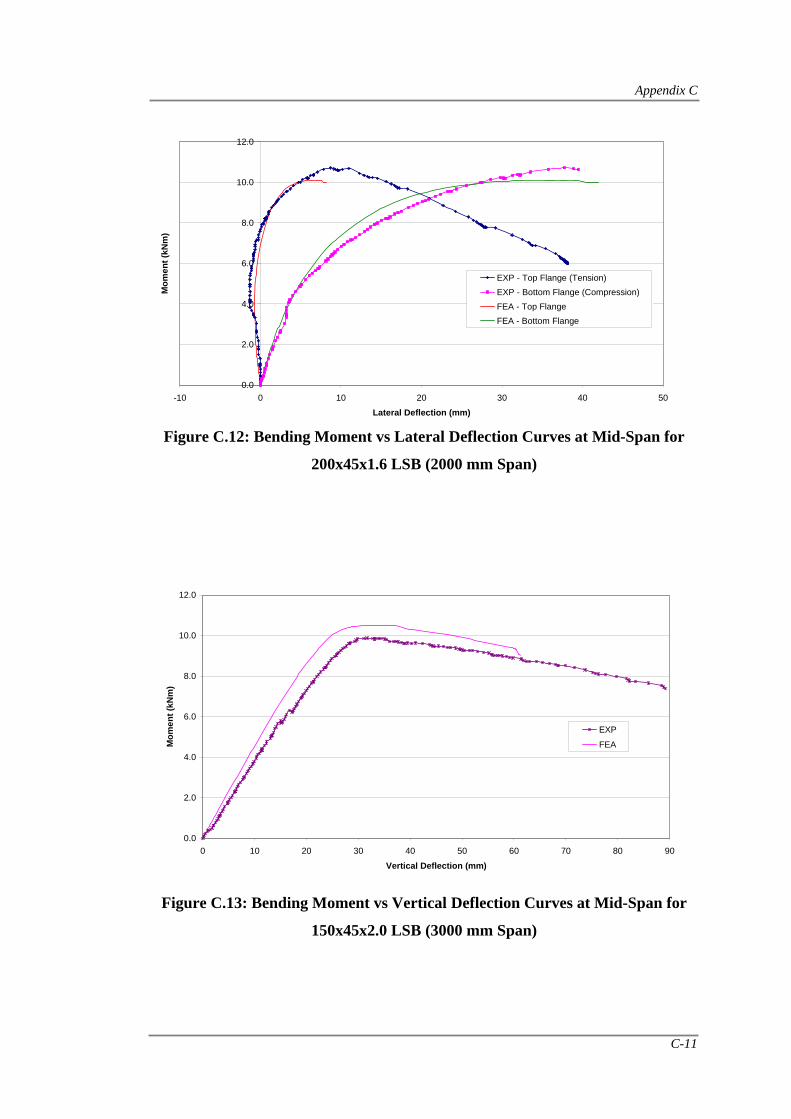
Appendix C
C-11
Figure C.12: Bending Moment vs Lateral Deflection Curves at Mid-Span for
200x45x1.6 LSB (2000 mm Span)
Figure C.13: Bending Moment vs Vertical Deflection Curves at Mid-Span for
150x45x2.0 LSB (3000 mm Span)
0.0
2.0
4.0
6.0
8.0
10.0
12.0
0 10 20 30 40 50 60 70 80 90
Vertical Deflection (mm)
Mom
ent (
kNm
)
EXP
FEA
0.0
2.0
4.0
6.0
8.0
10.0
12.0
-10 0 10 20 30 40 50
Lateral Deflection (mm)
Mom
ent (
kNm
)
EXP - Top Flange (Tension)EXP - Bottom Flange (Compression)FEA - Top FlangeFEA - Bottom Flange
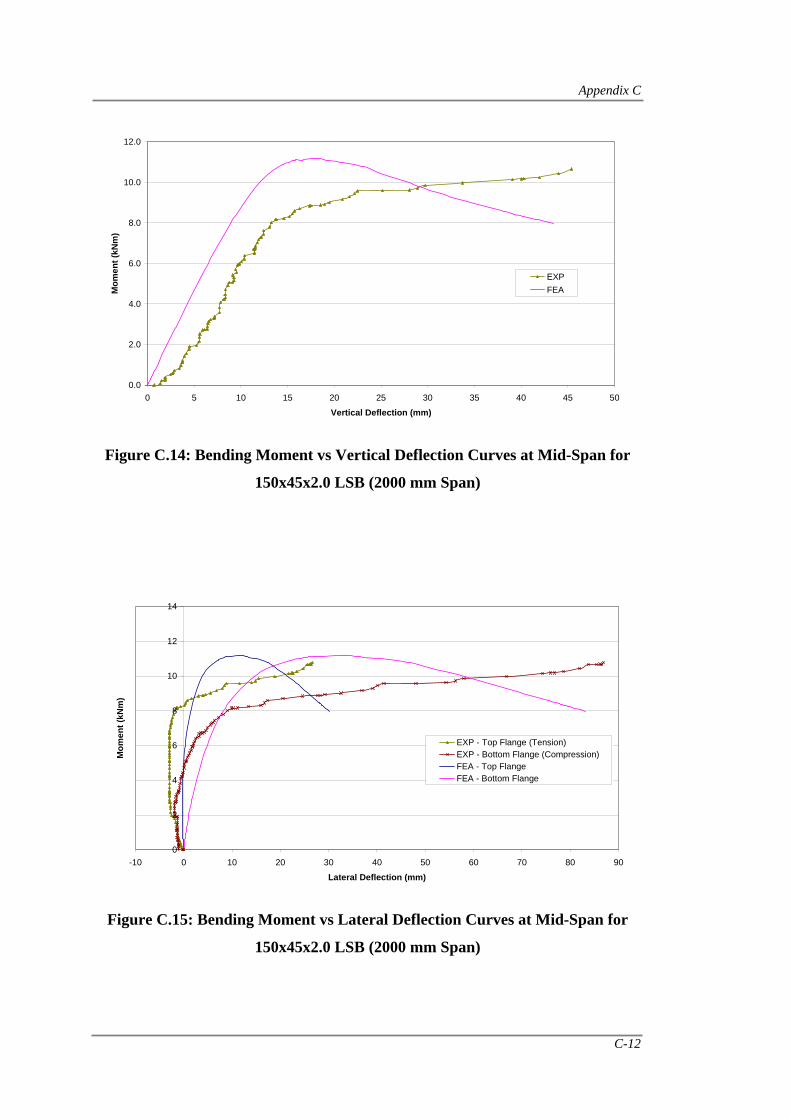
Appendix C
C-12
Figure C.14: Bending Moment vs Vertical Deflection Curves at Mid-Span for
150x45x2.0 LSB (2000 mm Span)
Figure C.15: Bending Moment vs Lateral Deflection Curves at Mid-Span for
150x45x2.0 LSB (2000 mm Span)
0.0
2.0
4.0
6.0
8.0
10.0
12.0
0 5 10 15 20 25 30 35 40 45 50
Vertical Deflection (mm)
Mom
ent (
kNm
)
EXPFEA
0
2
4
6
8
10
12
14
-10 0 10 20 30 40 50 60 70 80 90
Lateral Deflection (mm)
Mom
ent (
kNm
)
EXP - Top Flange (Tension)EXP - Bottom Flange (Compression)FEA - Top FlangeFEA - Bottom Flange
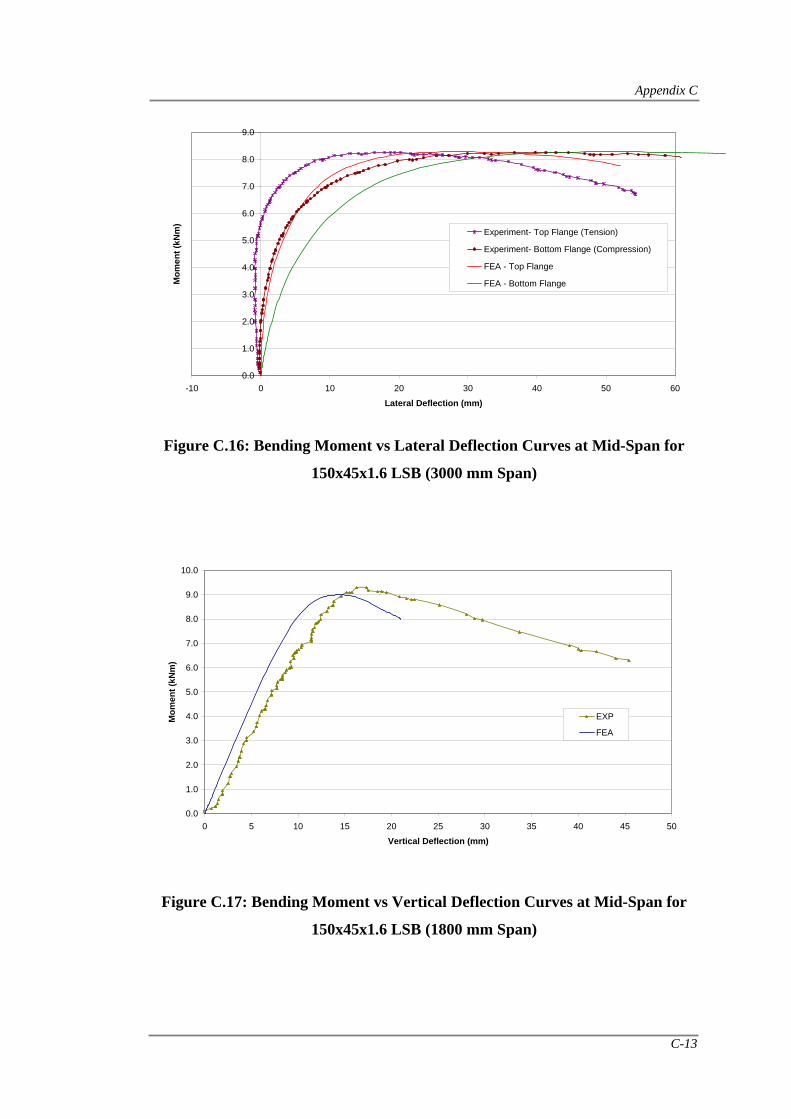
Appendix C
C-13
Figure C.16: Bending Moment vs Lateral Deflection Curves at Mid-Span for
150x45x1.6 LSB (3000 mm Span)
Figure C.17: Bending Moment vs Vertical Deflection Curves at Mid-Span for
150x45x1.6 LSB (1800 mm Span)
0.0
1.0
2.0
3.0
4.0
5.0
6.0
7.0
8.0
9.0
10.0
0 5 10 15 20 25 30 35 40 45 50
Vertical Deflection (mm)
Mom
ent (
kNm
)
EXP
FEA
0.0
1.0
2.0
3.0
4.0
5.0
6.0
7.0
8.0
9.0
-10 0 10 20 30 40 50 60
Lateral Deflection (mm)
Mom
ent (
kNm
)
Experiment- Top Flange (Tension)
Experiment- Bottom Flange (Compression)
FEA - Top Flange
FEA - Bottom Flange
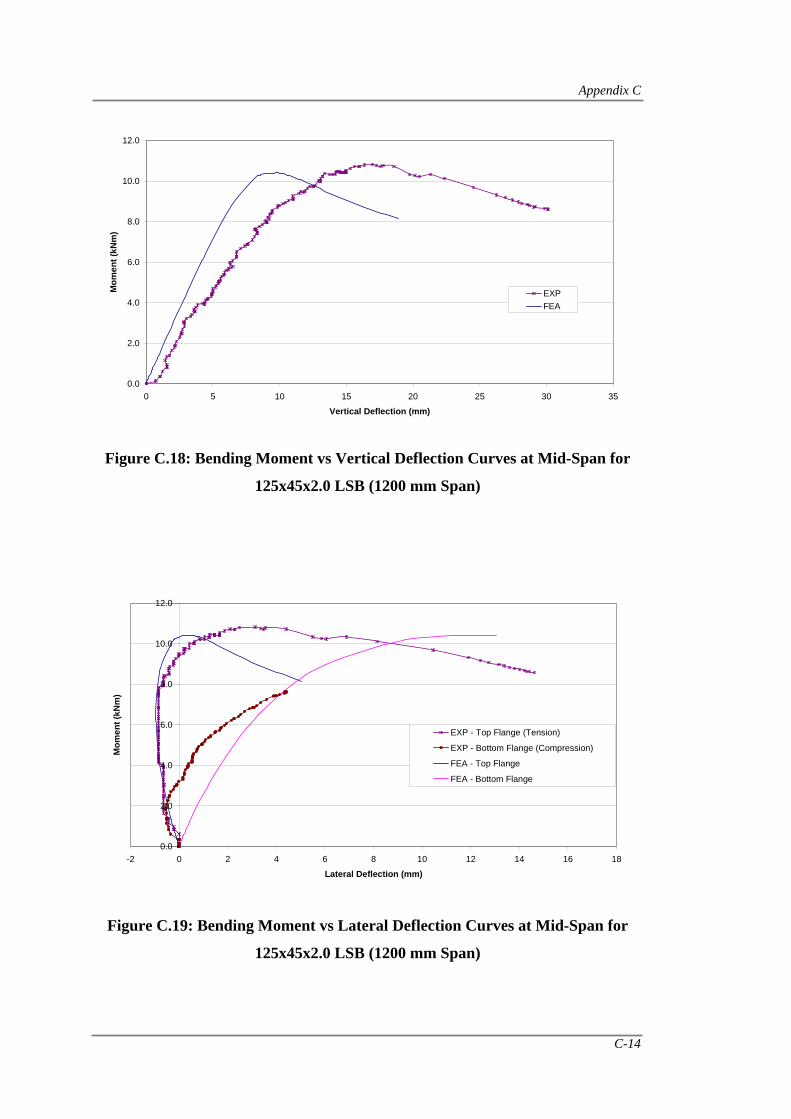
Appendix C
C-14
Figure C.18: Bending Moment vs Vertical Deflection Curves at Mid-Span for
125x45x2.0 LSB (1200 mm Span)
Figure C.19: Bending Moment vs Lateral Deflection Curves at Mid-Span for
125x45x2.0 LSB (1200 mm Span)
0.0
2.0
4.0
6.0
8.0
10.0
12.0
0 5 10 15 20 25 30 35
Vertical Deflection (mm)
Mom
ent (
kNm
)
EXPFEA
0.0
2.0
4.0
6.0
8.0
10.0
12.0
-2 0 2 4 6 8 10 12 14 16 18
Lateral Deflection (mm)
Mom
ent (
kNm
)
EXP - Top Flange (Tension)
EXP - Bottom Flange (Compression)
FEA - Top Flange
FEA - Bottom Flange
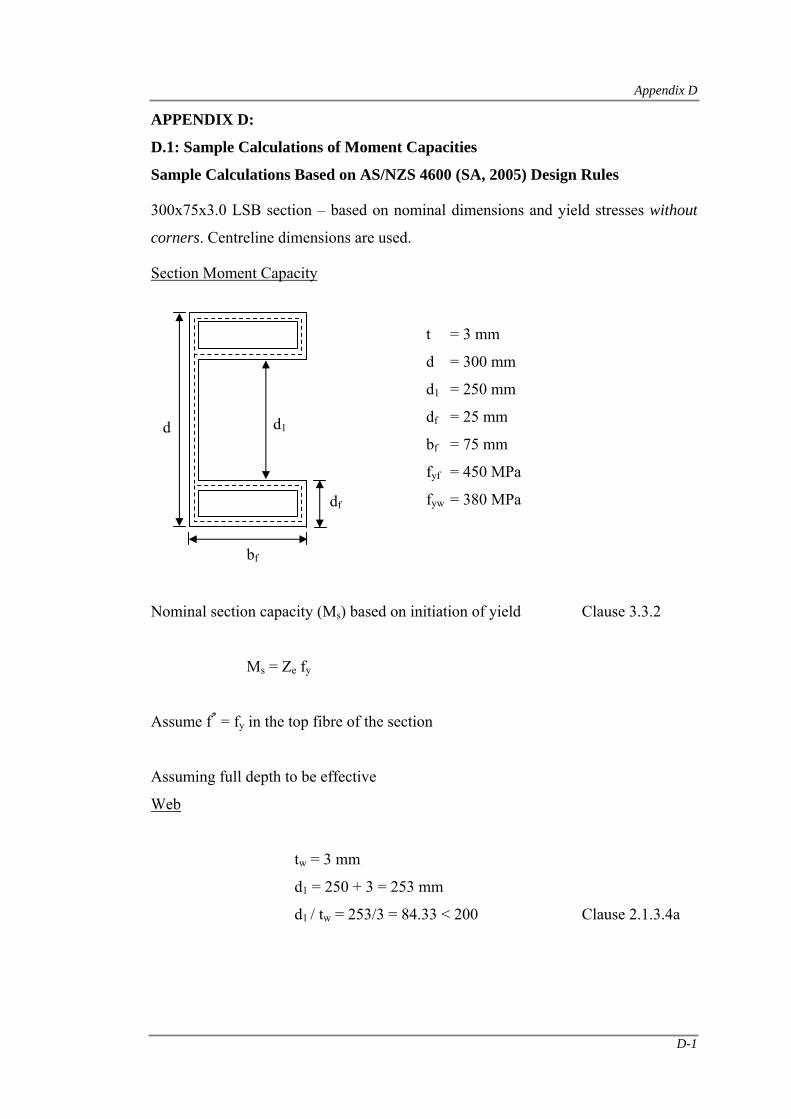
Appendix D
D-1
APPENDIX D:
D.1: Sample Calculations of Moment Capacities
Sample Calculations Based on AS/NZS 4600 (SA, 2005) Design Rules
300x75x3.0 LSB section – based on nominal dimensions and yield stresses without
corners. Centreline dimensions are used.
Section Moment Capacity
Nominal section capacity (Ms) based on initiation of yield Clause 3.3.2
Ms = Ze fy
Assume f* = fy in the top fibre of the section
Assuming full depth to be effective
Web
tw = 3 mm
d1 = 250 + 3 = 253 mm
d1 / tw = 253/3 = 84.33 < 200 Clause 2.1.3.4a
t = 3 mm
d = 300 mm
d1 = 250 mm
df = 25 mm
bf = 75 mm
fyf = 450 MPa
fyw = 380 MPa
bf
df
d d1
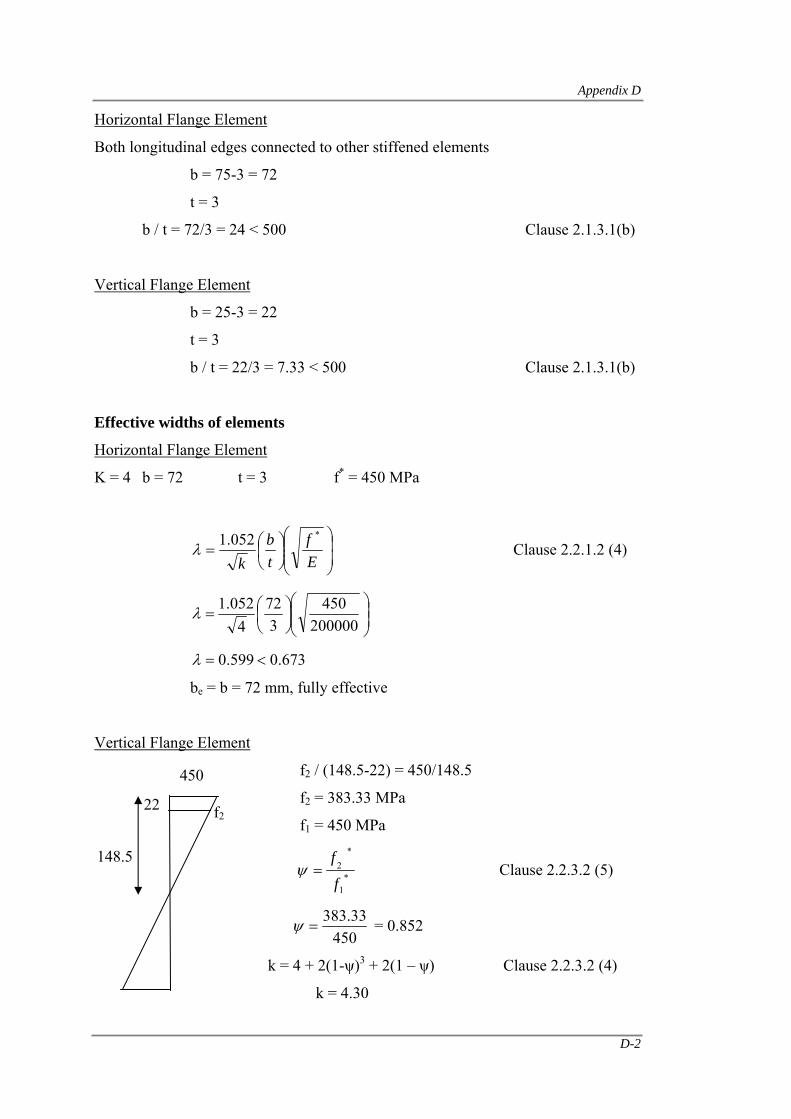
Appendix D
D-2
Horizontal Flange Element
Both longitudinal edges connected to other stiffened elements
b = 75-3 = 72
t = 3
b / t = 72/3 = 24 < 500 Clause 2.1.3.1(b)
Vertical Flange Element
b = 25-3 = 22
t = 3
b / t = 22/3 = 7.33 < 500 Clause 2.1.3.1(b)
Effective widths of elements
Horizontal Flange Element
K = 4 b = 72 t = 3 f* = 450 MPa
⎟⎟⎠
⎞⎜⎜⎝
⎛⎟⎠⎞
⎜⎝⎛=
Ef
tb
k
*052.1λ Clause 2.2.1.2 (4)
⎟⎟⎠
⎞⎜⎜⎝
⎛⎟⎠⎞
⎜⎝⎛=
200000450
372
4052.1λ
673.0599.0 <=λ
be = b = 72 mm, fully effective
Vertical Flange Element
f2 / (148.5-22) = 450/148.5
f2 = 383.33 MPa
f1 = 450 MPa
*1
*2
f
f=ψ Clause 2.2.3.2 (5)
450
33.383=ψ = 0.852
k = 4 + 2(1-ψ)3 + 2(1 – ψ) Clause 2.2.3.2 (4)
k = 4.30
f2
450
22
148.5
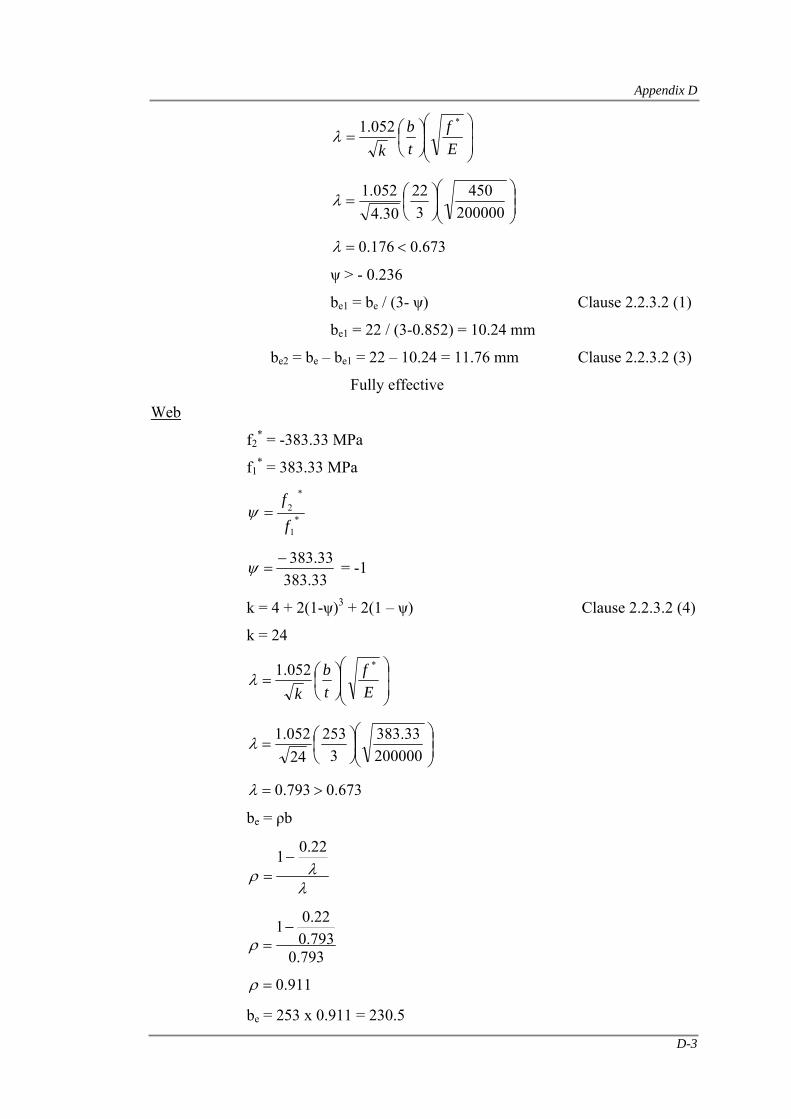
Appendix D
D-3
⎟⎟⎠
⎞⎜⎜⎝
⎛⎟⎠⎞
⎜⎝⎛=
Ef
tb
k
*052.1λ
⎟⎟⎠
⎞⎜⎜⎝
⎛⎟⎠⎞
⎜⎝⎛=
200000450
322
30.4052.1λ
673.0176.0 <=λ
ψ > - 0.236
be1 = be / (3- ψ) Clause 2.2.3.2 (1)
be1 = 22 / (3-0.852) = 10.24 mm
be2 = be – be1 = 22 – 10.24 = 11.76 mm Clause 2.2.3.2 (3)
Fully effective
Web
f2* = -383.33 MPa
f1* = 383.33 MPa
*1
*2
f
f=ψ
33.38333.383−
=ψ = -1
k = 4 + 2(1-ψ)3 + 2(1 – ψ) Clause 2.2.3.2 (4)
k = 24
⎟⎟⎠
⎞⎜⎜⎝
⎛⎟⎠⎞
⎜⎝⎛=
Ef
tb
k
*052.1λ
⎟⎟⎠
⎞⎜⎜⎝
⎛⎟⎠⎞
⎜⎝⎛=
20000033.383
3253
24052.1λ
673.0793.0 >=λ
be = ρb
λλρ
22.01−=
793.0
793.022.01−
=ρ
911.0=ρ
be = 253 x 0.911 = 230.5
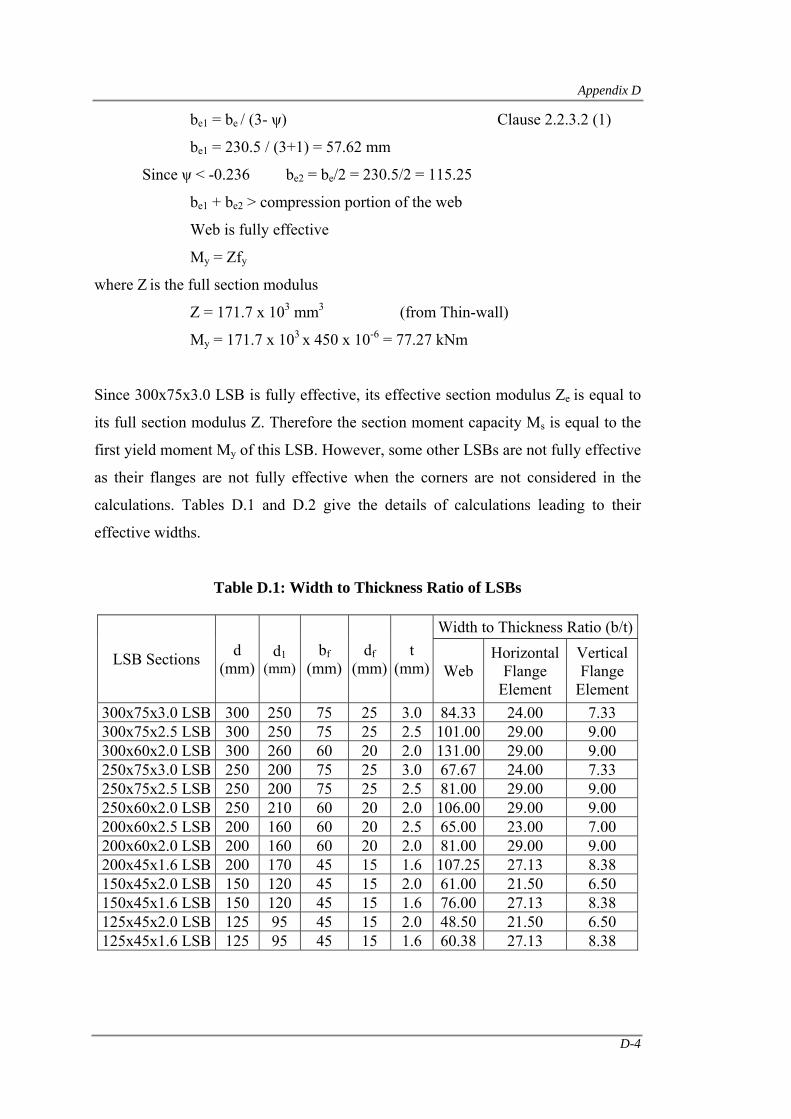
Appendix D
D-4
be1 = be / (3- ψ) Clause 2.2.3.2 (1)
be1 = 230.5 / (3+1) = 57.62 mm
Since ψ < -0.236 be2 = be/2 = 230.5/2 = 115.25
be1 + be2 > compression portion of the web
Web is fully effective
My = Zfy
where Z is the full section modulus
Z = 171.7 x 103 mm3 (from Thin-wall)
My = 171.7 x 103 x 450 x 10-6 = 77.27 kNm
Since 300x75x3.0 LSB is fully effective, its effective section modulus Ze is equal to
its full section modulus Z. Therefore the section moment capacity Ms is equal to the
first yield moment My of this LSB. However, some other LSBs are not fully effective
as their flanges are not fully effective when the corners are not considered in the
calculations. Tables D.1 and D.2 give the details of calculations leading to their
effective widths.
Table D.1: Width to Thickness Ratio of LSBs
LSB Sections d (mm)
d1 (mm)
bf (mm)
df (mm)
t (mm)
Width to Thickness Ratio (b/t)
Web Horizontal
Flange Element
Vertical Flange
Element 300x75x3.0 LSB 300 250 75 25 3.0 84.33 24.00 7.33 300x75x2.5 LSB 300 250 75 25 2.5 101.00 29.00 9.00 300x60x2.0 LSB 300 260 60 20 2.0 131.00 29.00 9.00 250x75x3.0 LSB 250 200 75 25 3.0 67.67 24.00 7.33 250x75x2.5 LSB 250 200 75 25 2.5 81.00 29.00 9.00 250x60x2.0 LSB 250 210 60 20 2.0 106.00 29.00 9.00 200x60x2.5 LSB 200 160 60 20 2.5 65.00 23.00 7.00 200x60x2.0 LSB 200 160 60 20 2.0 81.00 29.00 9.00 200x45x1.6 LSB 200 170 45 15 1.6 107.25 27.13 8.38 150x45x2.0 LSB 150 120 45 15 2.0 61.00 21.50 6.50 150x45x1.6 LSB 150 120 45 15 1.6 76.00 27.13 8.38 125x45x2.0 LSB 125 95 45 15 2.0 48.50 21.50 6.50 125x45x1.6 LSB 125 95 45 15 1.6 60.38 27.13 8.38
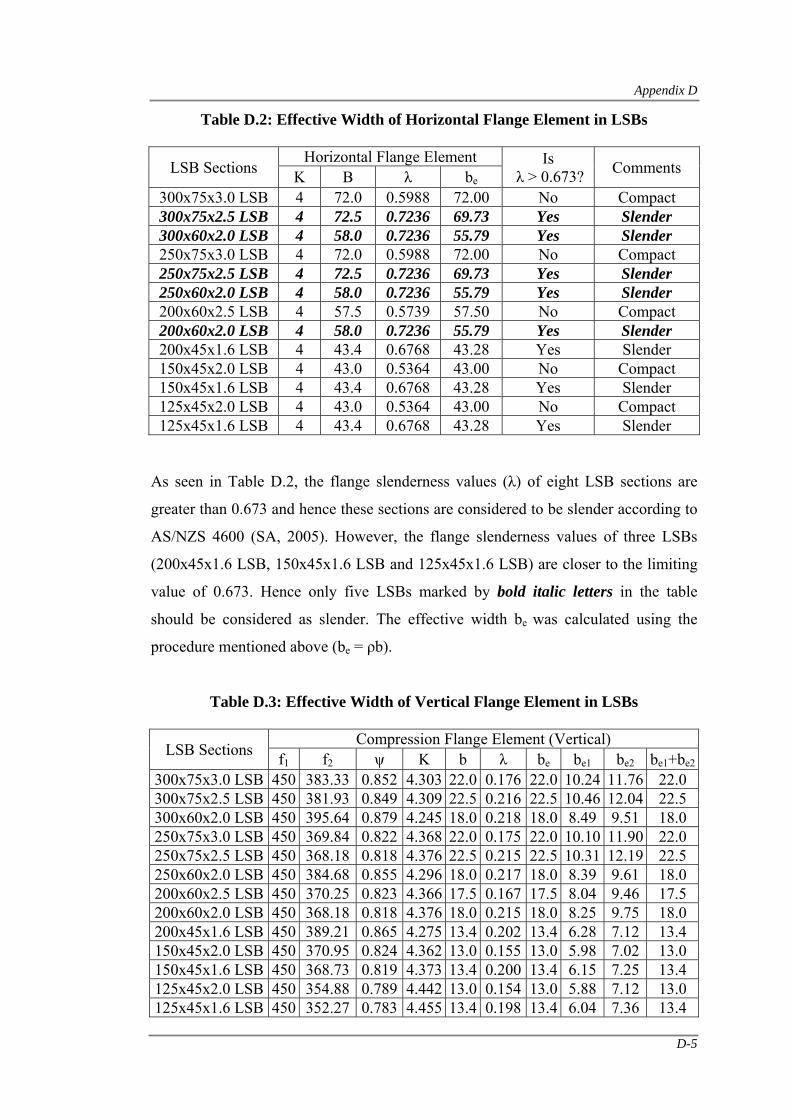
Appendix D
D-5
Table D.2: Effective Width of Horizontal Flange Element in LSBs
LSB Sections Horizontal Flange Element Is
λ > 0.673? Comments K B λ be 300x75x3.0 LSB 4 72.0 0.5988 72.00 No Compact 300x75x2.5 LSB 4 72.5 0.7236 69.73 Yes Slender 300x60x2.0 LSB 4 58.0 0.7236 55.79 Yes Slender 250x75x3.0 LSB 4 72.0 0.5988 72.00 No Compact 250x75x2.5 LSB 4 72.5 0.7236 69.73 Yes Slender 250x60x2.0 LSB 4 58.0 0.7236 55.79 Yes Slender 200x60x2.5 LSB 4 57.5 0.5739 57.50 No Compact 200x60x2.0 LSB 4 58.0 0.7236 55.79 Yes Slender 200x45x1.6 LSB 4 43.4 0.6768 43.28 Yes Slender 150x45x2.0 LSB 4 43.0 0.5364 43.00 No Compact 150x45x1.6 LSB 4 43.4 0.6768 43.28 Yes Slender 125x45x2.0 LSB 4 43.0 0.5364 43.00 No Compact 125x45x1.6 LSB 4 43.4 0.6768 43.28 Yes Slender
As seen in Table D.2, the flange slenderness values (λ) of eight LSB sections are
greater than 0.673 and hence these sections are considered to be slender according to
AS/NZS 4600 (SA, 2005). However, the flange slenderness values of three LSBs
(200x45x1.6 LSB, 150x45x1.6 LSB and 125x45x1.6 LSB) are closer to the limiting
value of 0.673. Hence only five LSBs marked by bold italic letters in the table
should be considered as slender. The effective width be was calculated using the
procedure mentioned above (be = ρb).
Table D.3: Effective Width of Vertical Flange Element in LSBs
LSB Sections Compression Flange Element (Vertical)
f1 f2 ψ K b λ be be1 be2 be1+be2
300x75x3.0 LSB 450 383.33 0.852 4.303 22.0 0.176 22.0 10.24 11.76 22.0 300x75x2.5 LSB 450 381.93 0.849 4.309 22.5 0.216 22.5 10.46 12.04 22.5 300x60x2.0 LSB 450 395.64 0.879 4.245 18.0 0.218 18.0 8.49 9.51 18.0 250x75x3.0 LSB 450 369.84 0.822 4.368 22.0 0.175 22.0 10.10 11.90 22.0 250x75x2.5 LSB 450 368.18 0.818 4.376 22.5 0.215 22.5 10.31 12.19 22.5 250x60x2.0 LSB 450 384.68 0.855 4.296 18.0 0.217 18.0 8.39 9.61 18.0 200x60x2.5 LSB 450 370.25 0.823 4.366 17.5 0.167 17.5 8.04 9.46 17.5 200x60x2.0 LSB 450 368.18 0.818 4.376 18.0 0.215 18.0 8.25 9.75 18.0 200x45x1.6 LSB 450 389.21 0.865 4.275 13.4 0.202 13.4 6.28 7.12 13.4 150x45x2.0 LSB 450 370.95 0.824 4.362 13.0 0.155 13.0 5.98 7.02 13.0 150x45x1.6 LSB 450 368.73 0.819 4.373 13.4 0.200 13.4 6.15 7.25 13.4 125x45x2.0 LSB 450 354.88 0.789 4.442 13.0 0.154 13.0 5.88 7.12 13.0 125x45x1.6 LSB 450 352.27 0.783 4.455 13.4 0.198 13.4 6.04 7.36 13.4
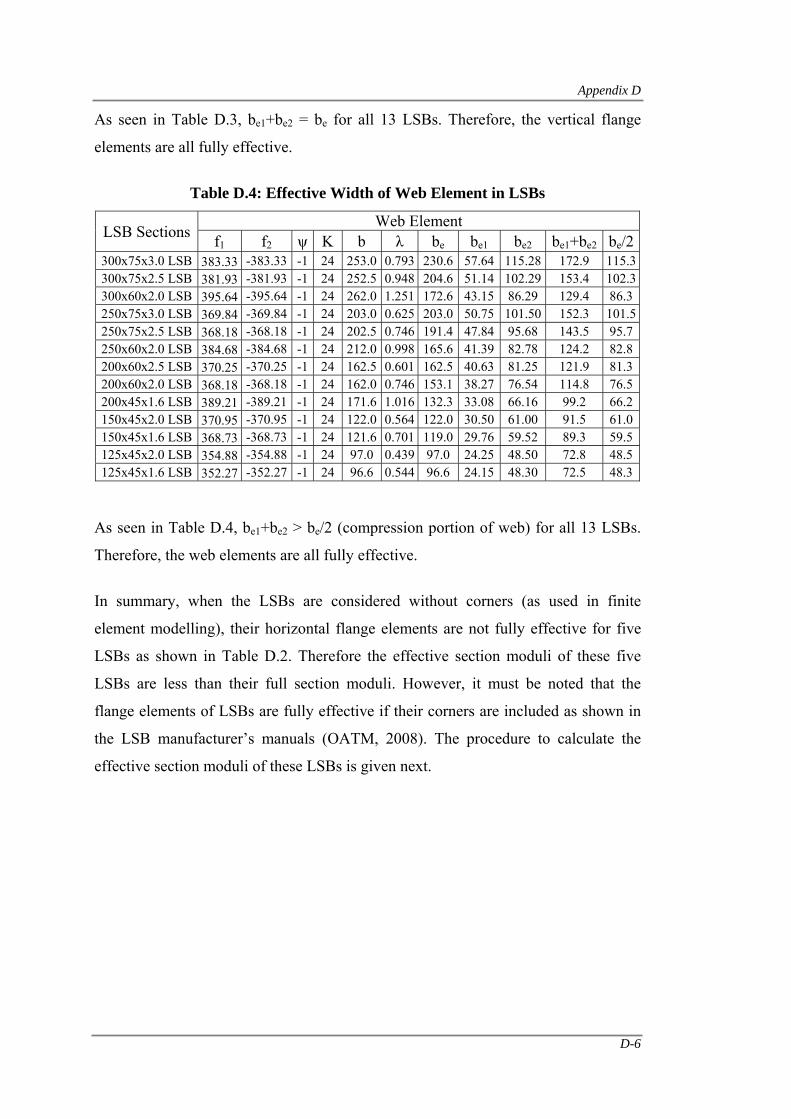
Appendix D
D-6
As seen in Table D.3, be1+be2 = be for all 13 LSBs. Therefore, the vertical flange
elements are all fully effective.
Table D.4: Effective Width of Web Element in LSBs
LSB Sections Web Element
f1 f2 ψ K b λ be be1 be2 be1+be2 be/2 300x75x3.0 LSB 383.33 -383.33 -1 24 253.0 0.793 230.6 57.64 115.28 172.9 115.3 300x75x2.5 LSB 381.93 -381.93 -1 24 252.5 0.948 204.6 51.14 102.29 153.4 102.3 300x60x2.0 LSB 395.64 -395.64 -1 24 262.0 1.251 172.6 43.15 86.29 129.4 86.3 250x75x3.0 LSB 369.84 -369.84 -1 24 203.0 0.625 203.0 50.75 101.50 152.3 101.5 250x75x2.5 LSB 368.18 -368.18 -1 24 202.5 0.746 191.4 47.84 95.68 143.5 95.7 250x60x2.0 LSB 384.68 -384.68 -1 24 212.0 0.998 165.6 41.39 82.78 124.2 82.8 200x60x2.5 LSB 370.25 -370.25 -1 24 162.5 0.601 162.5 40.63 81.25 121.9 81.3 200x60x2.0 LSB 368.18 -368.18 -1 24 162.0 0.746 153.1 38.27 76.54 114.8 76.5 200x45x1.6 LSB 389.21 -389.21 -1 24 171.6 1.016 132.3 33.08 66.16 99.2 66.2 150x45x2.0 LSB 370.95 -370.95 -1 24 122.0 0.564 122.0 30.50 61.00 91.5 61.0 150x45x1.6 LSB 368.73 -368.73 -1 24 121.6 0.701 119.0 29.76 59.52 89.3 59.5 125x45x2.0 LSB 354.88 -354.88 -1 24 97.0 0.439 97.0 24.25 48.50 72.8 48.5 125x45x1.6 LSB 352.27 -352.27 -1 24 96.6 0.544 96.6 24.15 48.30 72.5 48.3
As seen in Table D.4, be1+be2 > be/2 (compression portion of web) for all 13 LSBs.
Therefore, the web elements are all fully effective.
In summary, when the LSBs are considered without corners (as used in finite
element modelling), their horizontal flange elements are not fully effective for five
LSBs as shown in Table D.2. Therefore the effective section moduli of these five
LSBs are less than their full section moduli. However, it must be noted that the
flange elements of LSBs are fully effective if their corners are included as shown in
the LSB manufacturer’s manuals (OATM, 2008). The procedure to calculate the
effective section moduli of these LSBs is given next.
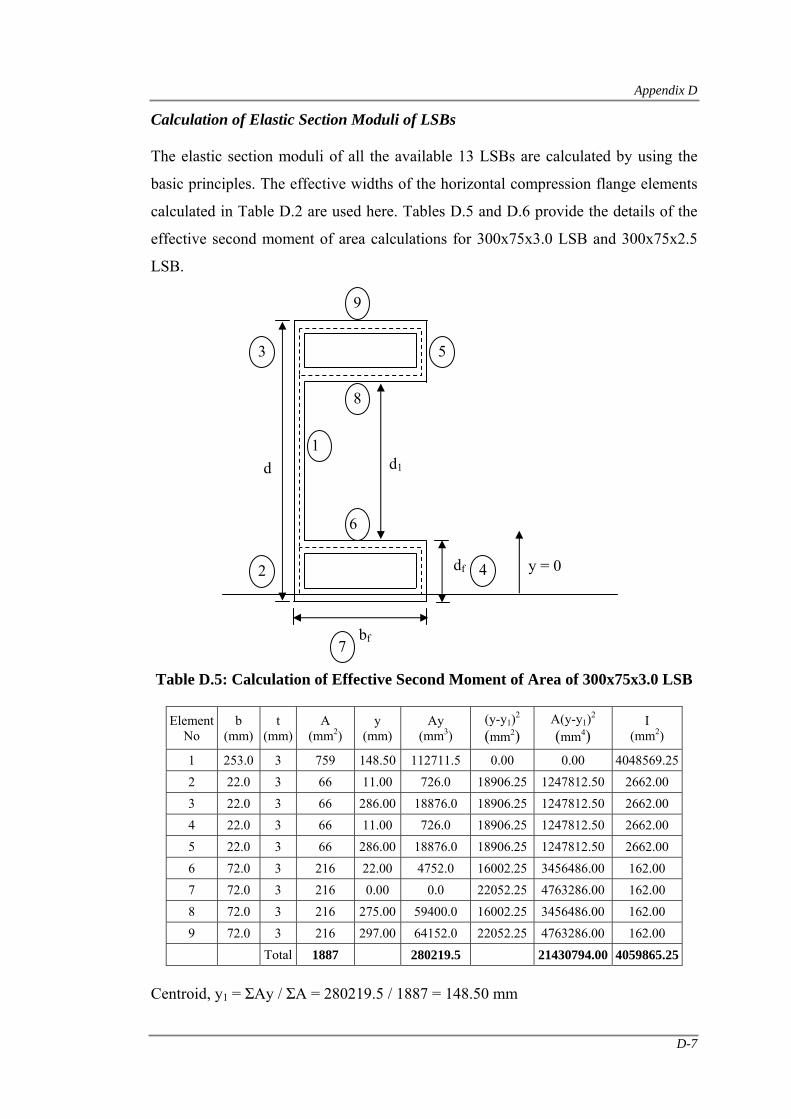
Appendix D
D-7
Calculation of Elastic Section Moduli of LSBs
The elastic section moduli of all the available 13 LSBs are calculated by using the
basic principles. The effective widths of the horizontal compression flange elements
calculated in Table D.2 are used here. Tables D.5 and D.6 provide the details of the
effective second moment of area calculations for 300x75x3.0 LSB and 300x75x2.5
LSB.
Table D.5: Calculation of Effective Second Moment of Area of 300x75x3.0 LSB
Element No
b (mm)
t (mm)
A (mm2)
y (mm)
Ay (mm3)
(y-y1)2 (mm2)
A(y-y1)2 (mm4)
I (mm2)
1 253.0 3 759 148.50 112711.5 0.00 0.00 4048569.252 22.0 3 66 11.00 726.0 18906.25 1247812.50 2662.00 3 22.0 3 66 286.00 18876.0 18906.25 1247812.50 2662.00 4 22.0 3 66 11.00 726.0 18906.25 1247812.50 2662.00 5 22.0 3 66 286.00 18876.0 18906.25 1247812.50 2662.00 6 72.0 3 216 22.00 4752.0 16002.25 3456486.00 162.00 7 72.0 3 216 0.00 0.0 22052.25 4763286.00 162.00 8 72.0 3 216 275.00 59400.0 16002.25 3456486.00 162.00 9 72.0 3 216 297.00 64152.0 22052.25 4763286.00 162.00 Total 1887 280219.5 21430794.00 4059865.25
Centroid, y1 = ΣAy / ΣA = 280219.5 / 1887 = 148.50 mm
bf
df
d d1
9
5
1
4
7
6
8
3
2 y = 0
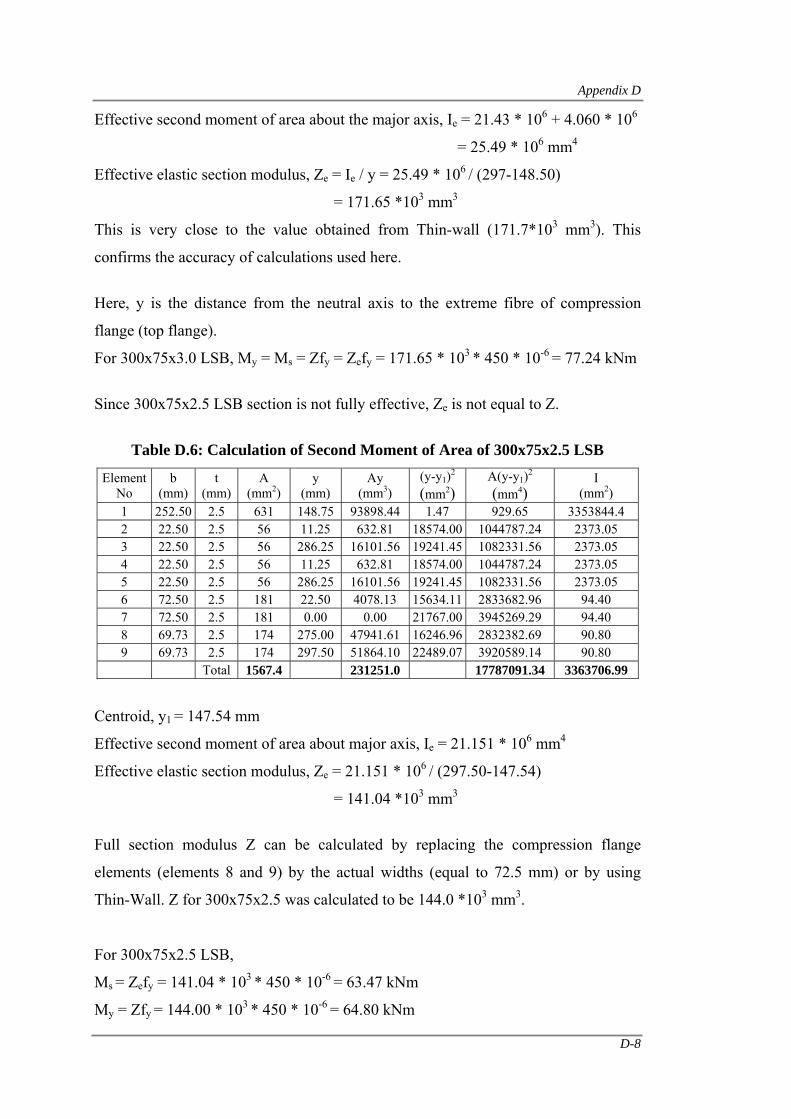
Appendix D
D-8
Effective second moment of area about the major axis, Ie = 21.43 * 106 + 4.060 * 106
= 25.49 * 106 mm4
Effective elastic section modulus, Ze = Ie / y = 25.49 * 106 / (297-148.50)
= 171.65 *103 mm3
This is very close to the value obtained from Thin-wall (171.7*103 mm3). This
confirms the accuracy of calculations used here.
Here, y is the distance from the neutral axis to the extreme fibre of compression
flange (top flange).
For 300x75x3.0 LSB, My = Ms = Zfy = Zefy = 171.65 * 103 * 450 * 10-6 = 77.24 kNm
Since 300x75x2.5 LSB section is not fully effective, Ze is not equal to Z.
Table D.6: Calculation of Second Moment of Area of 300x75x2.5 LSB
Element No
b (mm)
t (mm)
A (mm2)
y (mm)
Ay (mm3)
(y-y1)2
(mm2) A(y-y1)2
(mm4) I
(mm2) 1 252.50 2.5 631 148.75 93898.44 1.47 929.65 3353844.4 2 22.50 2.5 56 11.25 632.81 18574.00 1044787.24 2373.05 3 22.50 2.5 56 286.25 16101.56 19241.45 1082331.56 2373.05 4 22.50 2.5 56 11.25 632.81 18574.00 1044787.24 2373.05 5 22.50 2.5 56 286.25 16101.56 19241.45 1082331.56 2373.05 6 72.50 2.5 181 22.50 4078.13 15634.11 2833682.96 94.40 7 72.50 2.5 181 0.00 0.00 21767.00 3945269.29 94.40 8 69.73 2.5 174 275.00 47941.61 16246.96 2832382.69 90.80 9 69.73 2.5 174 297.50 51864.10 22489.07 3920589.14 90.80 Total 1567.4 231251.0 17787091.34 3363706.99
Centroid, y1 = 147.54 mm
Effective second moment of area about major axis, Ie = 21.151 * 106 mm4
Effective elastic section modulus, Ze = 21.151 * 106 / (297.50-147.54)
= 141.04 *103 mm3
Full section modulus Z can be calculated by replacing the compression flange
elements (elements 8 and 9) by the actual widths (equal to 72.5 mm) or by using
Thin-Wall. Z for 300x75x2.5 was calculated to be 144.0 *103 mm3.
For 300x75x2.5 LSB,
Ms = Zefy = 141.04 * 103 * 450 * 10-6 = 63.47 kNm
My = Zfy = 144.00 * 103 * 450 * 10-6 = 64.80 kNm
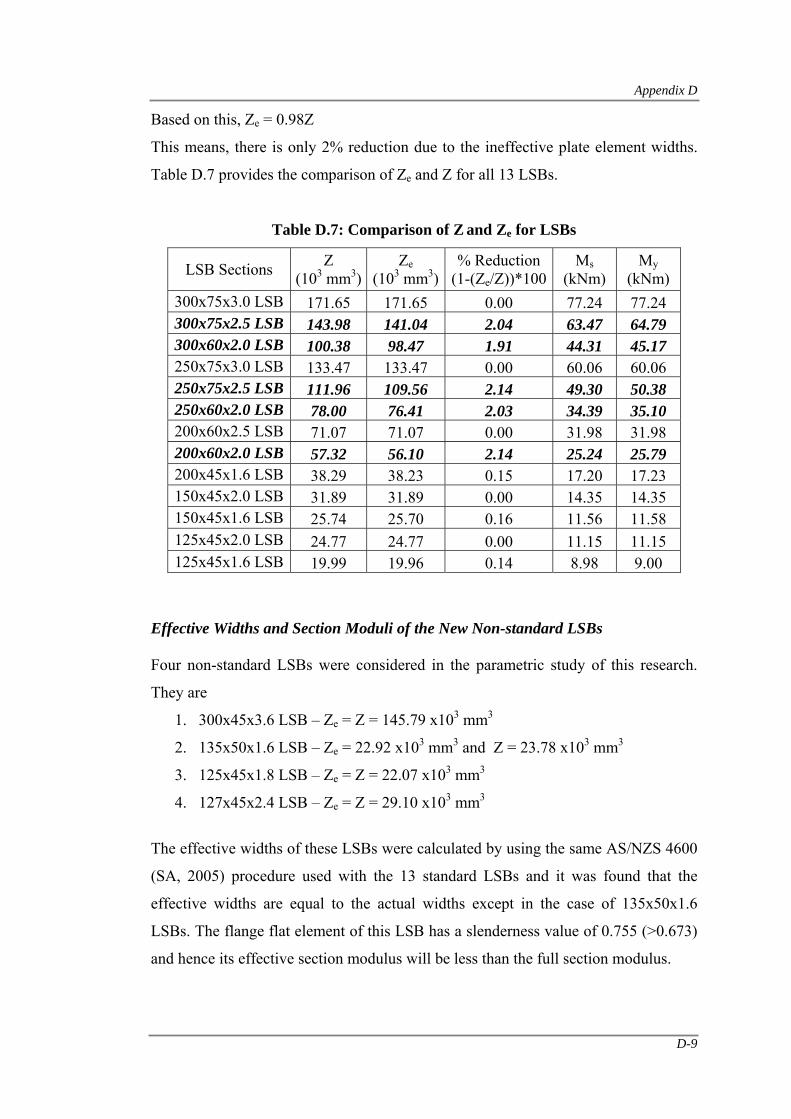
Appendix D
D-9
Based on this, Ze = 0.98Z
This means, there is only 2% reduction due to the ineffective plate element widths.
Table D.7 provides the comparison of Ze and Z for all 13 LSBs.
Table D.7: Comparison of Z and Ze for LSBs
LSB Sections Z (103 mm3)
Ze (103 mm3)
% Reduction (1-(Ze/Z))*100
Ms (kNm)
My (kNm)
300x75x3.0 LSB 171.65 171.65 0.00 77.24 77.24 300x75x2.5 LSB 143.98 141.04 2.04 63.47 64.79 300x60x2.0 LSB 100.38 98.47 1.91 44.31 45.17 250x75x3.0 LSB 133.47 133.47 0.00 60.06 60.06 250x75x2.5 LSB 111.96 109.56 2.14 49.30 50.38 250x60x2.0 LSB 78.00 76.41 2.03 34.39 35.10 200x60x2.5 LSB 71.07 71.07 0.00 31.98 31.98 200x60x2.0 LSB 57.32 56.10 2.14 25.24 25.79 200x45x1.6 LSB 38.29 38.23 0.15 17.20 17.23 150x45x2.0 LSB 31.89 31.89 0.00 14.35 14.35 150x45x1.6 LSB 25.74 25.70 0.16 11.56 11.58 125x45x2.0 LSB 24.77 24.77 0.00 11.15 11.15 125x45x1.6 LSB 19.99 19.96 0.14 8.98 9.00
Effective Widths and Section Moduli of the New Non-standard LSBs
Four non-standard LSBs were considered in the parametric study of this research.
They are
1. 300x45x3.6 LSB – Ze = Z = 145.79 x103 mm3
2. 135x50x1.6 LSB – Ze = 22.92 x103 mm3 and Z = 23.78 x103 mm3
3. 125x45x1.8 LSB – Ze = Z = 22.07 x103 mm3
4. 127x45x2.4 LSB – Ze = Z = 29.10 x103 mm3
The effective widths of these LSBs were calculated by using the same AS/NZS 4600
(SA, 2005) procedure used with the 13 standard LSBs and it was found that the
effective widths are equal to the actual widths except in the case of 135x50x1.6
LSBs. The flange flat element of this LSB has a slenderness value of 0.755 (>0.673)
and hence its effective section modulus will be less than the full section modulus.
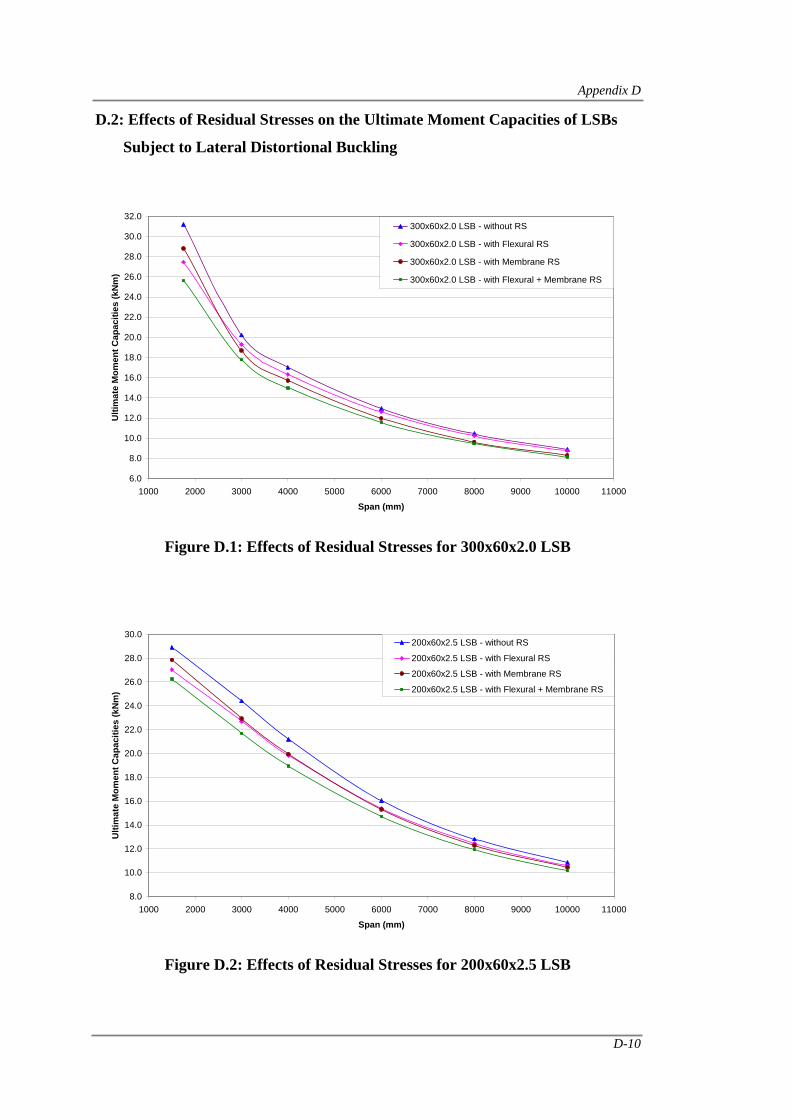
Appendix D
D-10
D.2: Effects of Residual Stresses on the Ultimate Moment Capacities of LSBs
Subject to Lateral Distortional Buckling
6.0
8.0
10.0
12.0
14.0
16.0
18.0
20.0
22.0
24.0
26.0
28.0
30.0
32.0
1000 2000 3000 4000 5000 6000 7000 8000 9000 10000 11000
Span (mm)
Ulti
mat
e M
omen
t Cap
aciti
es (k
Nm
)
300x60x2.0 LSB - without RS
300x60x2.0 LSB - with Flexural RS
300x60x2.0 LSB - with Membrane RS
300x60x2.0 LSB - with Flexural + Membrane RS
Figure D.1: Effects of Residual Stresses for 300x60x2.0 LSB
8.0
10.0
12.0
14.0
16.0
18.0
20.0
22.0
24.0
26.0
28.0
30.0
1000 2000 3000 4000 5000 6000 7000 8000 9000 10000 11000
Span (mm)
Ulti
mat
e M
omen
t Cap
aciti
es (k
Nm
)
200x60x2.5 LSB - without RS
200x60x2.5 LSB - with Flexural RS
200x60x2.5 LSB - with Membrane RS
200x60x2.5 LSB - with Flexural + Membrane RS
Figure D.2: Effects of Residual Stresses for 200x60x2.5 LSB
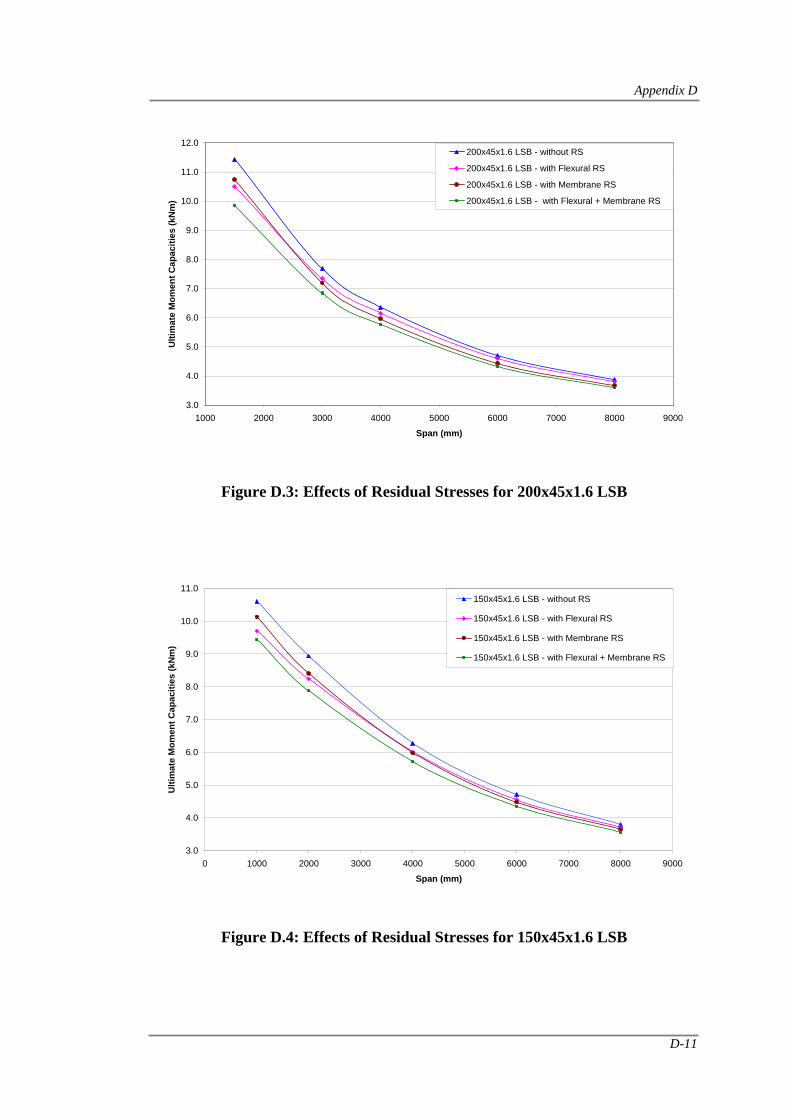
Appendix D
D-11
3.0
4.0
5.0
6.0
7.0
8.0
9.0
10.0
11.0
12.0
1000 2000 3000 4000 5000 6000 7000 8000 9000
Span (mm)
Ulti
mat
e M
omen
t Cap
aciti
es (k
Nm
)
200x45x1.6 LSB - without RS
200x45x1.6 LSB - with Flexural RS
200x45x1.6 LSB - with Membrane RS
200x45x1.6 LSB - with Flexural + Membrane RS
Figure D.3: Effects of Residual Stresses for 200x45x1.6 LSB
3.0
4.0
5.0
6.0
7.0
8.0
9.0
10.0
11.0
0 1000 2000 3000 4000 5000 6000 7000 8000 9000
Span (mm)
Ulti
mat
e M
omen
t Cap
aciti
es (k
Nm
)
150x45x1.6 LSB - without RS
150x45x1.6 LSB - with Flexural RS
150x45x1.6 LSB - with Membrane RS
150x45x1.6 LSB - with Flexural + Membrane RS
Figure D.4: Effects of Residual Stresses for 150x45x1.6 LSB
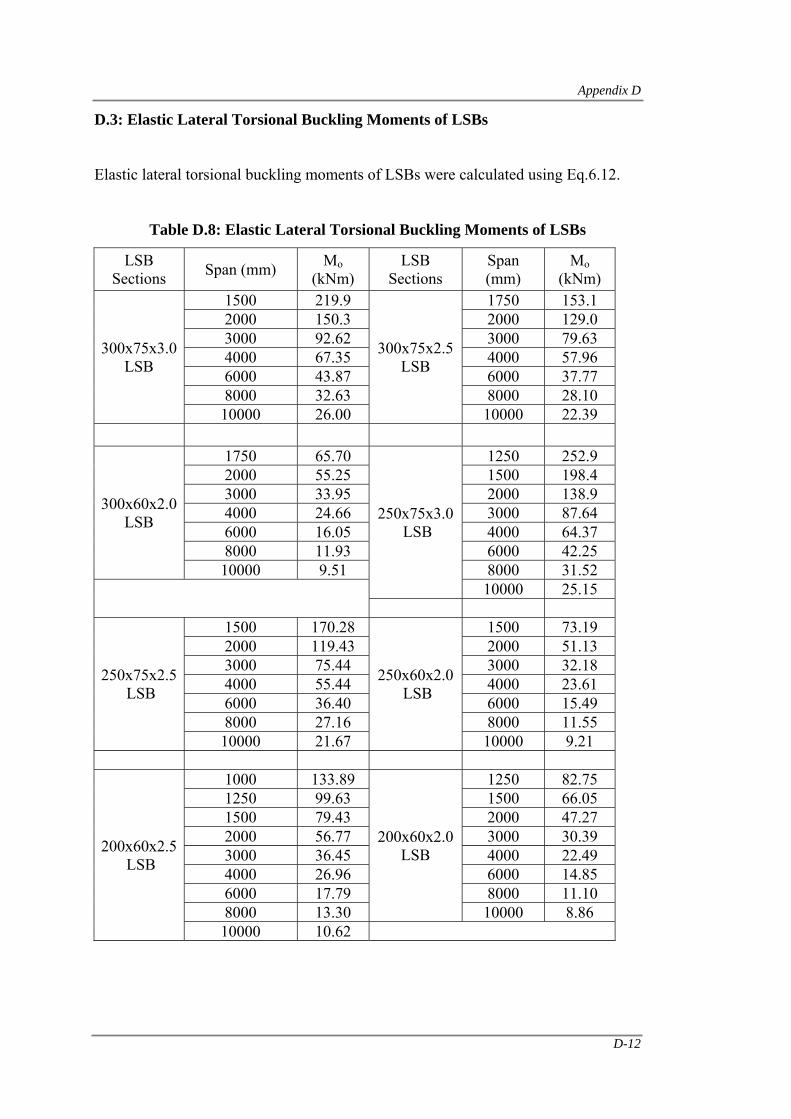
Appendix D
D-12
D.3: Elastic Lateral Torsional Buckling Moments of LSBs
Elastic lateral torsional buckling moments of LSBs were calculated using Eq.6.12.
Table D.8: Elastic Lateral Torsional Buckling Moments of LSBs
LSB Sections Span (mm) Mo
(kNm) LSB
Sections Span (mm)
Mo (kNm)
300x75x3.0 LSB
1500 219.9
300x75x2.5 LSB
1750 153.1 2000 150.3 2000 129.0 3000 92.62 3000 79.63 4000 67.35 4000 57.96 6000 43.87 6000 37.77 8000 32.63 8000 28.10 10000 26.00 10000 22.39
300x60x2.0 LSB
1750 65.70
250x75x3.0 LSB
1250 252.9 2000 55.25 1500 198.4 3000 33.95 2000 138.9 4000 24.66 3000 87.64 6000 16.05 4000 64.37 8000 11.93 6000 42.25 10000 9.51 8000 31.52
10000 25.15
250x75x2.5 LSB
1500 170.28
250x60x2.0 LSB
1500 73.19 2000 119.43 2000 51.13 3000 75.44 3000 32.18 4000 55.44 4000 23.61 6000 36.40 6000 15.49 8000 27.16 8000 11.55 10000 21.67 10000 9.21
200x60x2.5 LSB
1000 133.89
200x60x2.0 LSB
1250 82.75 1250 99.63 1500 66.05 1500 79.43 2000 47.27 2000 56.77 3000 30.39 3000 36.45 4000 22.49 4000 26.96 6000 14.85 6000 17.79 8000 11.10 8000 13.30 10000 8.86 10000 10.62
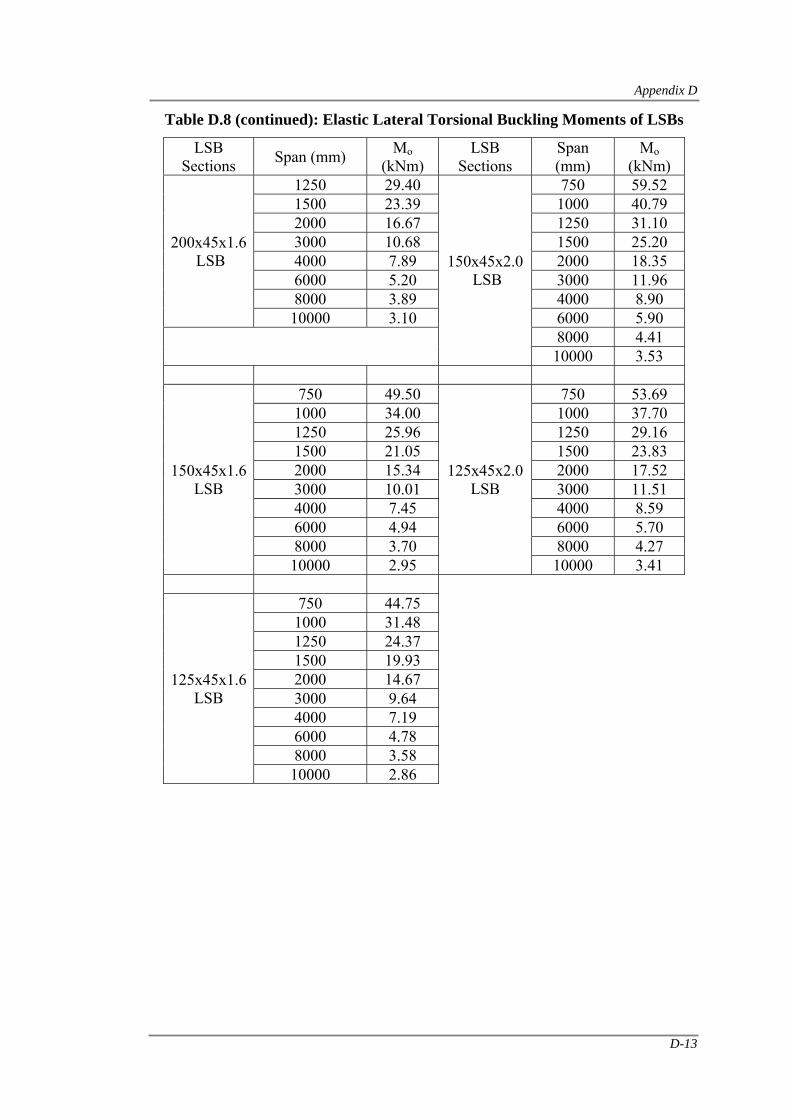
Appendix D
D-13
Table D.8 (continued): Elastic Lateral Torsional Buckling Moments of LSBs
LSB Sections Span (mm) Mo
(kNm) LSB
Sections Span (mm)
Mo (kNm)
200x45x1.6 LSB
1250 29.40
150x45x2.0 LSB
750 59.52 1500 23.39 1000 40.79 2000 16.67 1250 31.10 3000 10.68 1500 25.20 4000 7.89 2000 18.35 6000 5.20 3000 11.96 8000 3.89 4000 8.90 10000 3.10 6000 5.90
8000 4.41 10000 3.53
150x45x1.6 LSB
750 49.50
125x45x2.0 LSB
750 53.69 1000 34.00 1000 37.70 1250 25.96 1250 29.16 1500 21.05 1500 23.83 2000 15.34 2000 17.52 3000 10.01 3000 11.51 4000 7.45 4000 8.59 6000 4.94 6000 5.70 8000 3.70 8000 4.27 10000 2.95 10000 3.41
125x45x1.6 LSB
750 44.75 1000 31.48 1250 24.37 1500 19.93 2000 14.67 3000 9.64 4000 7.19 6000 4.78 8000 3.58 10000 2.86
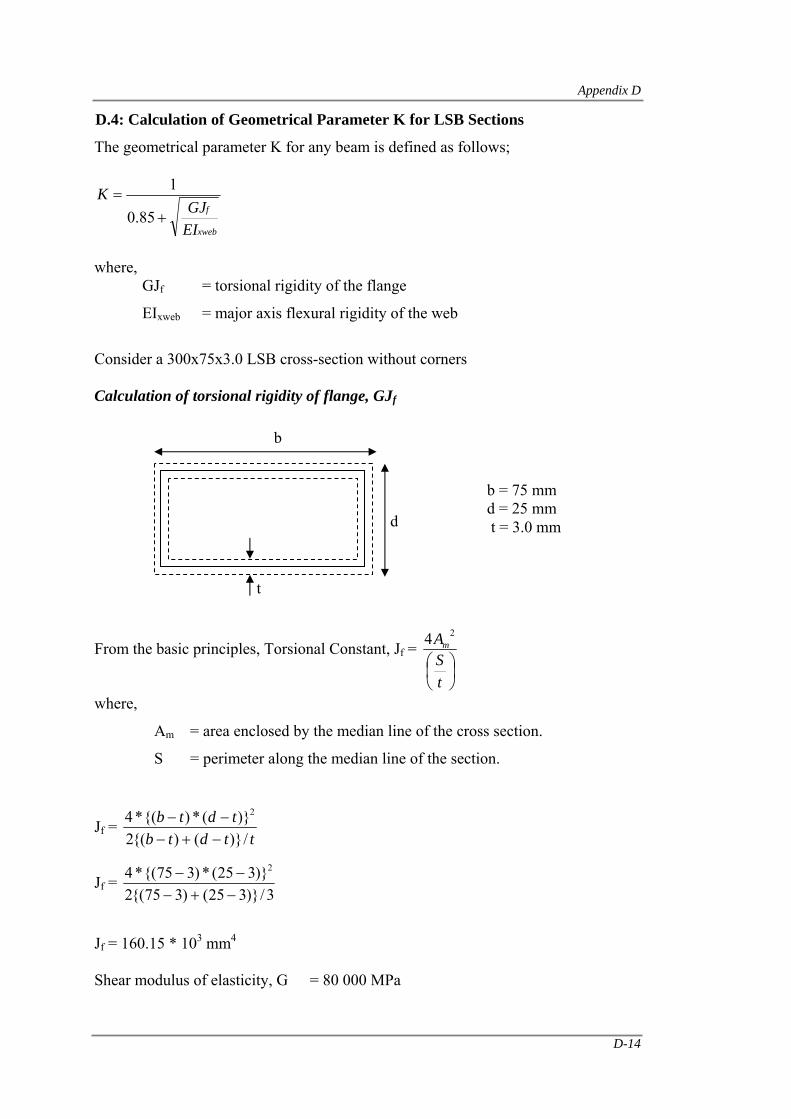
Appendix D
D-14
D.4: Calculation of Geometrical Parameter K for LSB Sections
The geometrical parameter K for any beam is defined as follows;
xweb
f
EIGJ
K+
=85.0
1
where, GJf = torsional rigidity of the flange
EIxweb = major axis flexural rigidity of the web
Consider a 300x75x3.0 LSB cross-section without corners Calculation of torsional rigidity of flange, GJf
From the basic principles, Torsional Constant, Jf = ⎟⎠⎞
⎜⎝⎛
tSAm
24
where,
Am = area enclosed by the median line of the cross section.
S = perimeter along the median line of the section.
Jf = ttdtb
tdtb/)}(){(2
)}(*){(*4 2
−+−−−
Jf = 3/)}325()375{(2
)}325(*)375{(*4 2
−+−−−
Jf = 160.15 * 103 mm4 Shear modulus of elasticity, G = 80 000 MPa
d
b
t
b = 75 mm d = 25 mm t = 3.0 mm
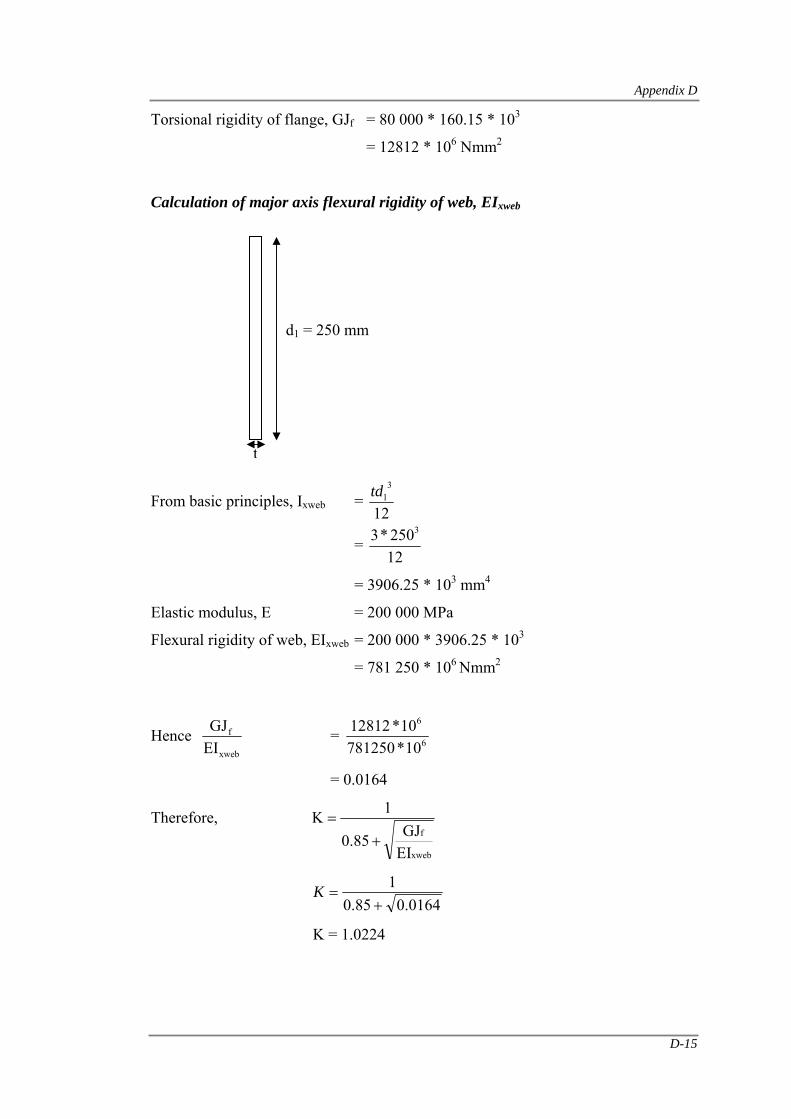
Appendix D
D-15
Torsional rigidity of flange, GJf = 80 000 * 160.15 * 103
= 12812 * 106 Nmm2
Calculation of major axis flexural rigidity of web, EIxweb
From basic principles, Ixweb = 12
31td
= 12250*3 3
= 3906.25 * 103 mm4
Elastic modulus, E = 200 000 MPa
Flexural rigidity of web, EIxweb = 200 000 * 3906.25 * 103
= 781 250 * 106 Nmm2
Hence xweb
f
EIGJ = 6
6
10*78125010*12812
= 0.0164
Therefore,
xweb
f
EIGJ85.0
1K+
=
0164.085.0
1+
=K
K = 1.0224
d1 = 250 mm
t
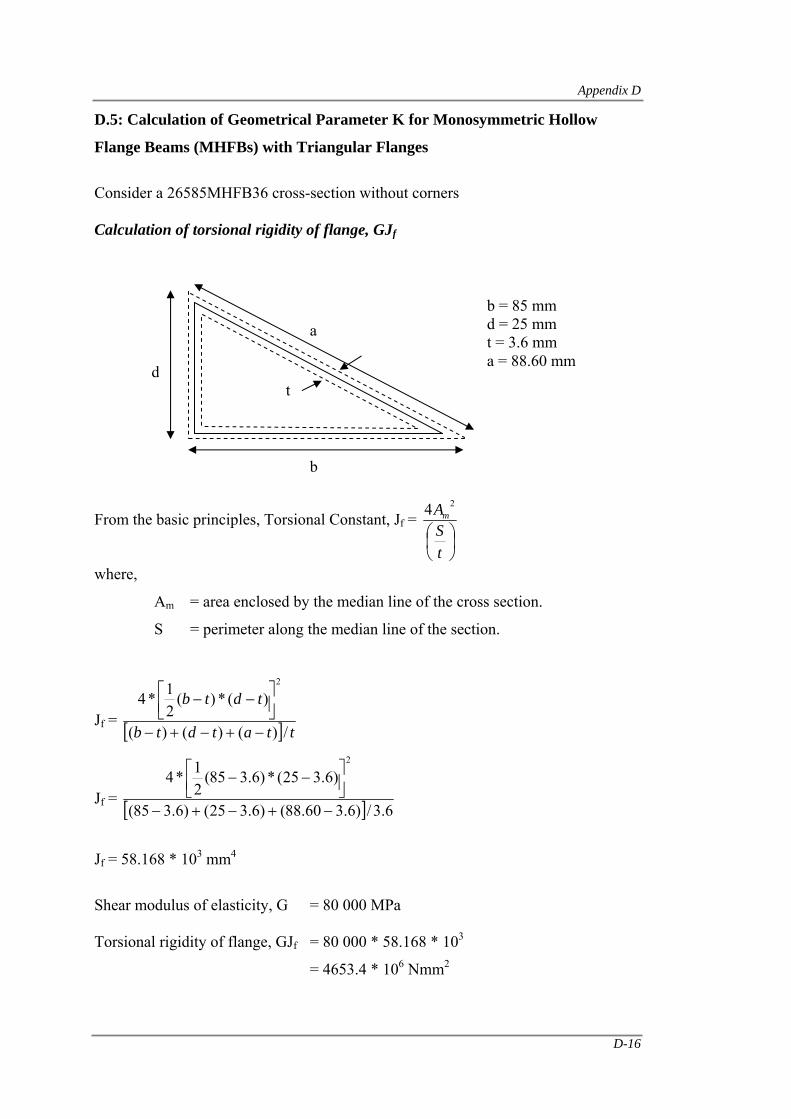
Appendix D
D-16
D.5: Calculation of Geometrical Parameter K for Monosymmetric Hollow
Flange Beams (MHFBs) with Triangular Flanges
Consider a 26585MHFB36 cross-section without corners Calculation of torsional rigidity of flange, GJf
From the basic principles, Torsional Constant, Jf = ⎟⎠⎞
⎜⎝⎛
tSAm
24
where,
Am = area enclosed by the median line of the cross section.
S = perimeter along the median line of the section.
Jf = [ ] ttatdtb
tdtb
/)()()(
)(*)(21*4
2
−+−+−
⎥⎦⎤
⎢⎣⎡ −−
Jf = [ ] 6.3/)6.360.88()6.325()6.385(
)6.325(*)6.385(21*4
2
−+−+−
⎥⎦⎤
⎢⎣⎡ −−
Jf = 58.168 * 103 mm4
Shear modulus of elasticity, G = 80 000 MPa Torsional rigidity of flange, GJf = 80 000 * 58.168 * 103
= 4653.4 * 106 Nmm2
b = 85 mm d = 25 mm t = 3.6 mm a = 88.60 mm
d
b
t
a
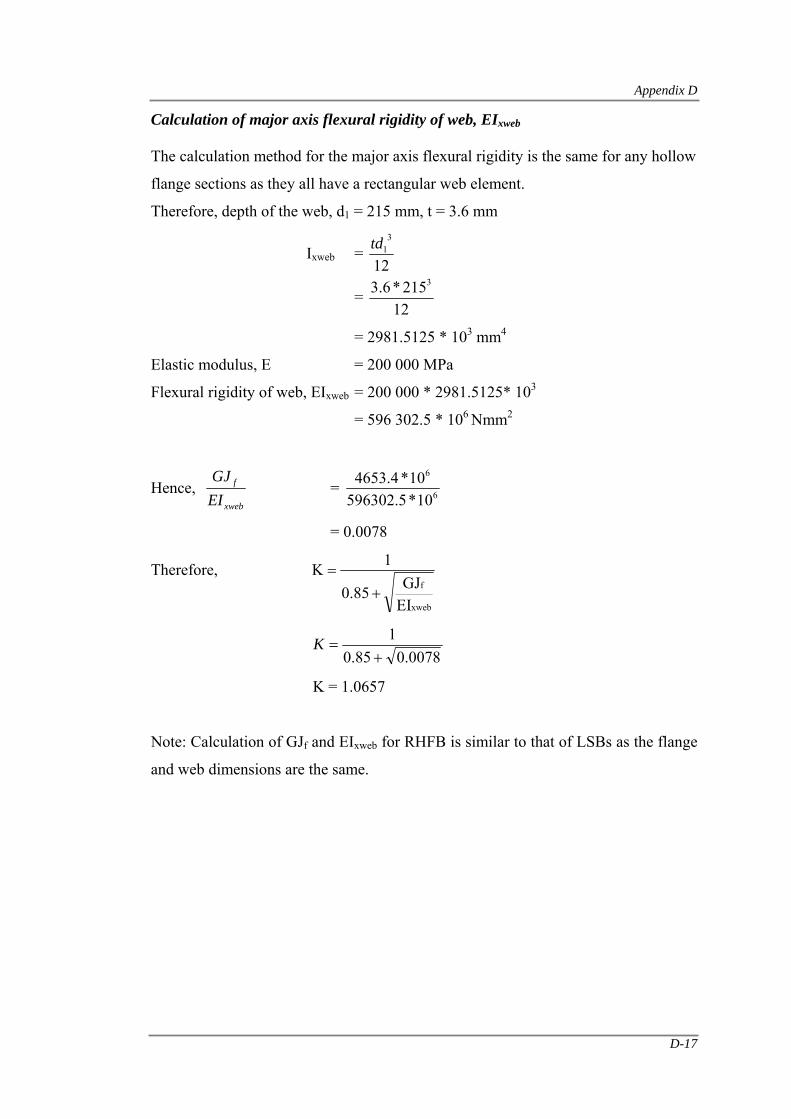
Appendix D
D-17
Calculation of major axis flexural rigidity of web, EIxweb The calculation method for the major axis flexural rigidity is the same for any hollow
flange sections as they all have a rectangular web element.
Therefore, depth of the web, d1 = 215 mm, t = 3.6 mm
Ixweb = 12
31td
= 12
215*6.3 3
= 2981.5125 * 103 mm4
Elastic modulus, E = 200 000 MPa
Flexural rigidity of web, EIxweb = 200 000 * 2981.5125* 103
= 596 302.5 * 106 Nmm2
Hence, xweb
f
EIGJ
= 6
6
10*5.59630210*4.4653
= 0.0078
Therefore,
xweb
f
EIGJ85.0
1K+
=
0078.085.0
1+
=K
K = 1.0657
Note: Calculation of GJf and EIxweb for RHFB is similar to that of LSBs as the flange
and web dimensions are the same.
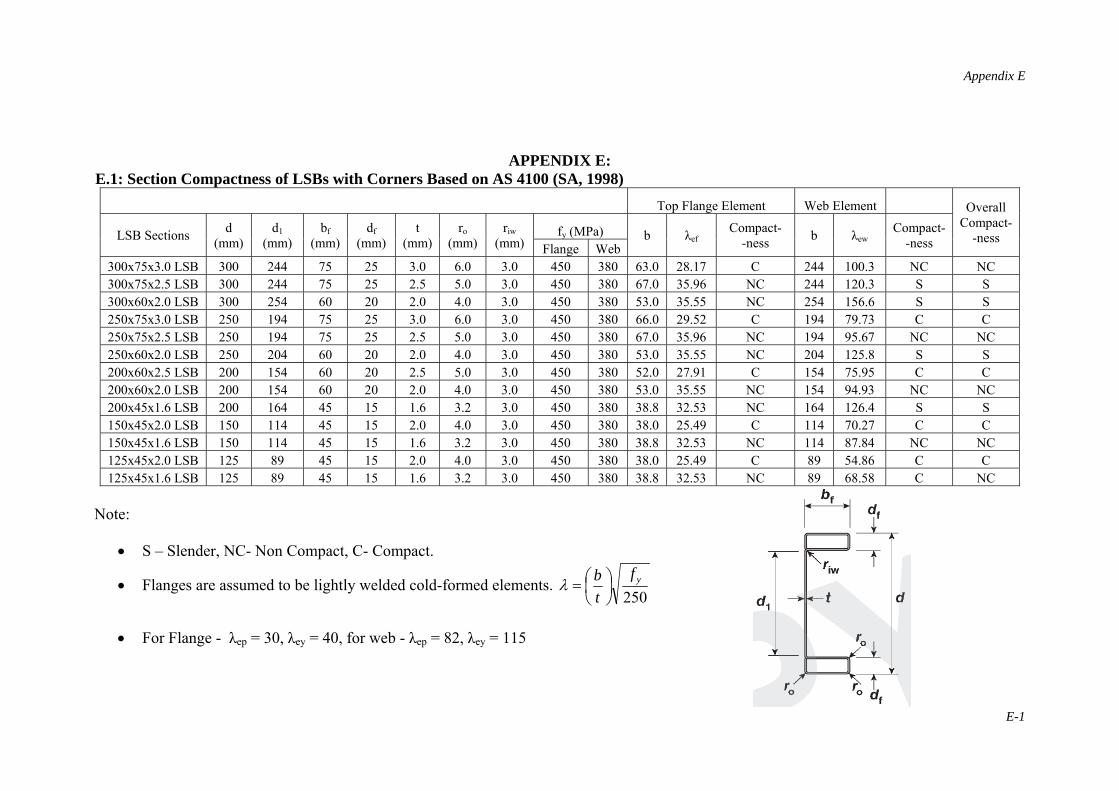
Appendix E
E-1
APPENDIX E: E.1: Section Compactness of LSBs with Corners Based on AS 4100 (SA, 1998)
Top Flange Element Web Element Overall Compact-
-ness LSB Sections d (mm)
d1 (mm)
bf (mm)
df (mm)
t (mm)
ro (mm)
riw (mm)
fy (MPa) b λef Compact-
-ness b λew Compact--ness Flange Web
300x75x3.0 LSB 300 244 75 25 3.0 6.0 3.0 450 380 63.0 28.17 C 244 100.3 NC NC 300x75x2.5 LSB 300 244 75 25 2.5 5.0 3.0 450 380 67.0 35.96 NC 244 120.3 S S 300x60x2.0 LSB 300 254 60 20 2.0 4.0 3.0 450 380 53.0 35.55 NC 254 156.6 S S 250x75x3.0 LSB 250 194 75 25 3.0 6.0 3.0 450 380 66.0 29.52 C 194 79.73 C C 250x75x2.5 LSB 250 194 75 25 2.5 5.0 3.0 450 380 67.0 35.96 NC 194 95.67 NC NC 250x60x2.0 LSB 250 204 60 20 2.0 4.0 3.0 450 380 53.0 35.55 NC 204 125.8 S S 200x60x2.5 LSB 200 154 60 20 2.5 5.0 3.0 450 380 52.0 27.91 C 154 75.95 C C 200x60x2.0 LSB 200 154 60 20 2.0 4.0 3.0 450 380 53.0 35.55 NC 154 94.93 NC NC 200x45x1.6 LSB 200 164 45 15 1.6 3.2 3.0 450 380 38.8 32.53 NC 164 126.4 S S 150x45x2.0 LSB 150 114 45 15 2.0 4.0 3.0 450 380 38.0 25.49 C 114 70.27 C C 150x45x1.6 LSB 150 114 45 15 1.6 3.2 3.0 450 380 38.8 32.53 NC 114 87.84 NC NC 125x45x2.0 LSB 125 89 45 15 2.0 4.0 3.0 450 380 38.0 25.49 C 89 54.86 C C 125x45x1.6 LSB 125 89 45 15 1.6 3.2 3.0 450 380 38.8 32.53 NC 89 68.58 C NC
Note:
• S – Slender, NC- Non Compact, C- Compact.
• Flanges are assumed to be lightly welded cold-formed elements. 250
yftb⎟⎠⎞
⎜⎝⎛=λ
• For Flange - λep = 30, λey = 40, for web - λep = 82, λey = 115
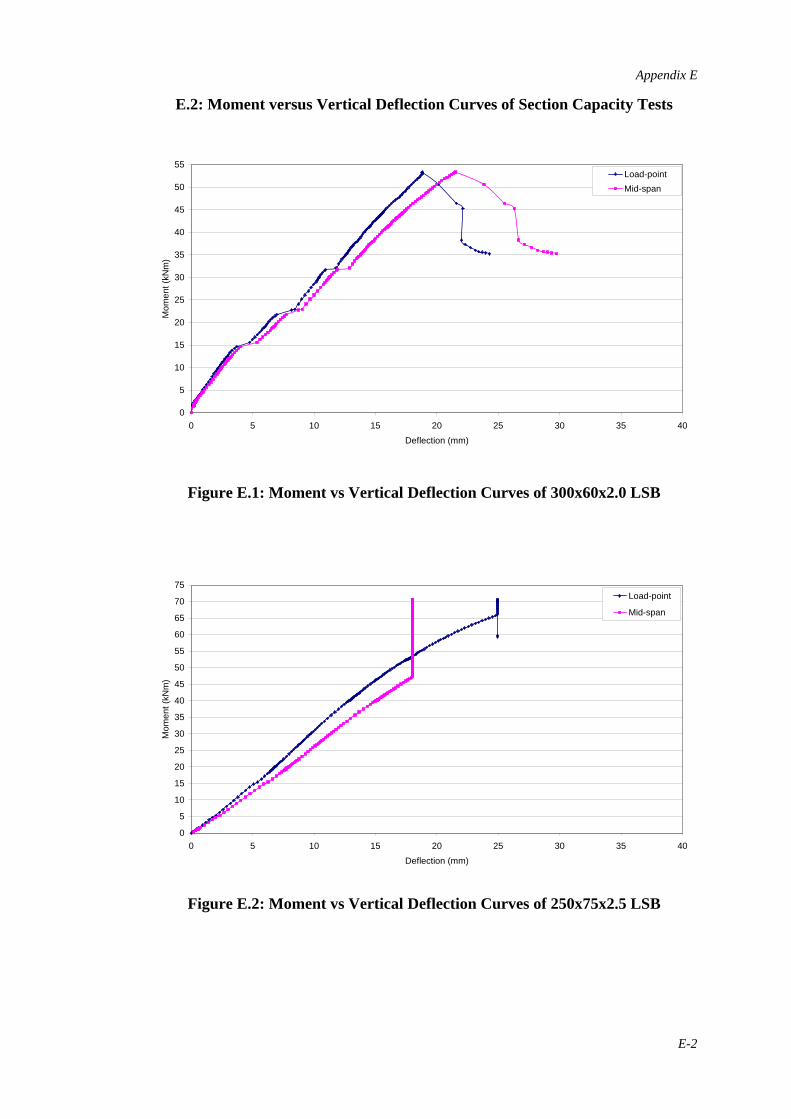
Appendix E
E-2
E.2: Moment versus Vertical Deflection Curves of Section Capacity Tests
0
5
10
15
20
25
30
35
40
45
50
55
0 5 10 15 20 25 30 35 40
Deflection (mm)
Mom
ent (
kNm
) Load-pointMid-span
Figure E.1: Moment vs Vertical Deflection Curves of 300x60x2.0 LSB
0
5
10
15
20
25
30
35
40
45
50
55
60
65
70
75
0 5 10 15 20 25 30 35 40
Deflection (mm)
Mom
ent (
kNm
)
Load-point
Mid-span
Figure E.2: Moment vs Vertical Deflection Curves of 250x75x2.5 LSB
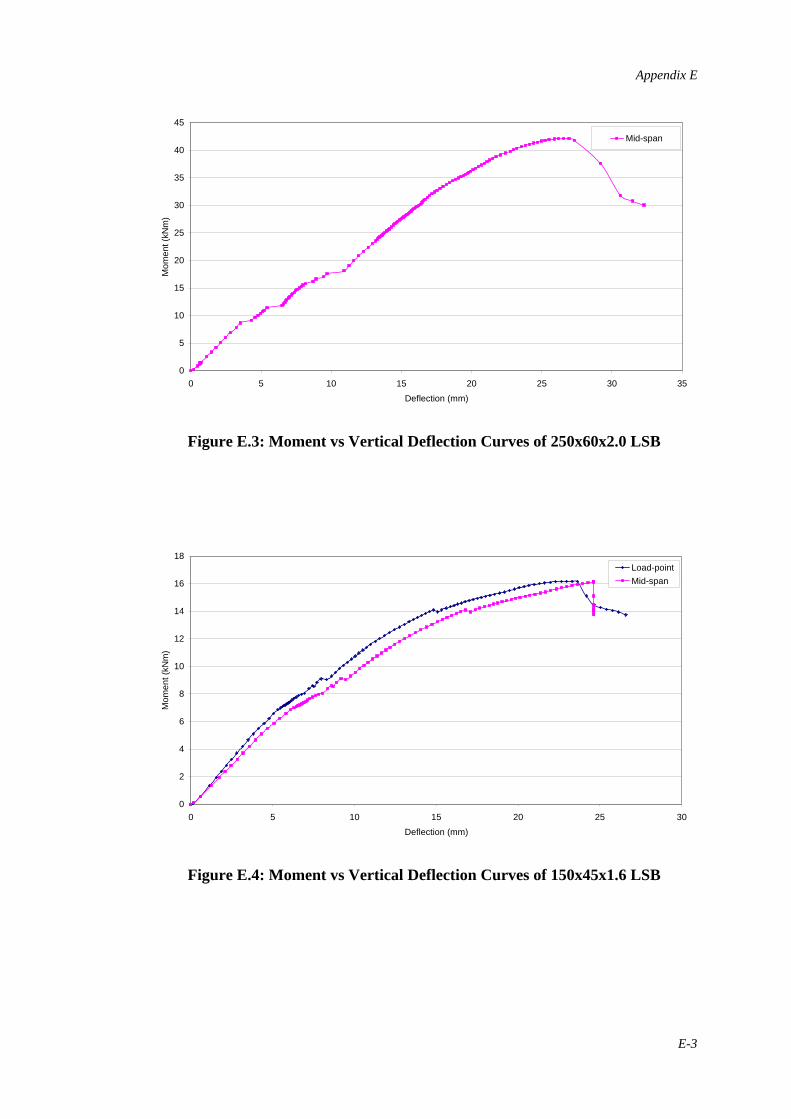
Appendix E
E-3
0
5
10
15
20
25
30
35
40
45
0 5 10 15 20 25 30 35
Deflection (mm)
Mom
ent (
kNm
)
Mid-span
Figure E.3: Moment vs Vertical Deflection Curves of 250x60x2.0 LSB
0
2
4
6
8
10
12
14
16
18
0 5 10 15 20 25 30
Deflection (mm)
Mom
ent (
kNm
)
Load-pointMid-span
Figure E.4: Moment vs Vertical Deflection Curves of 150x45x1.6 LSB
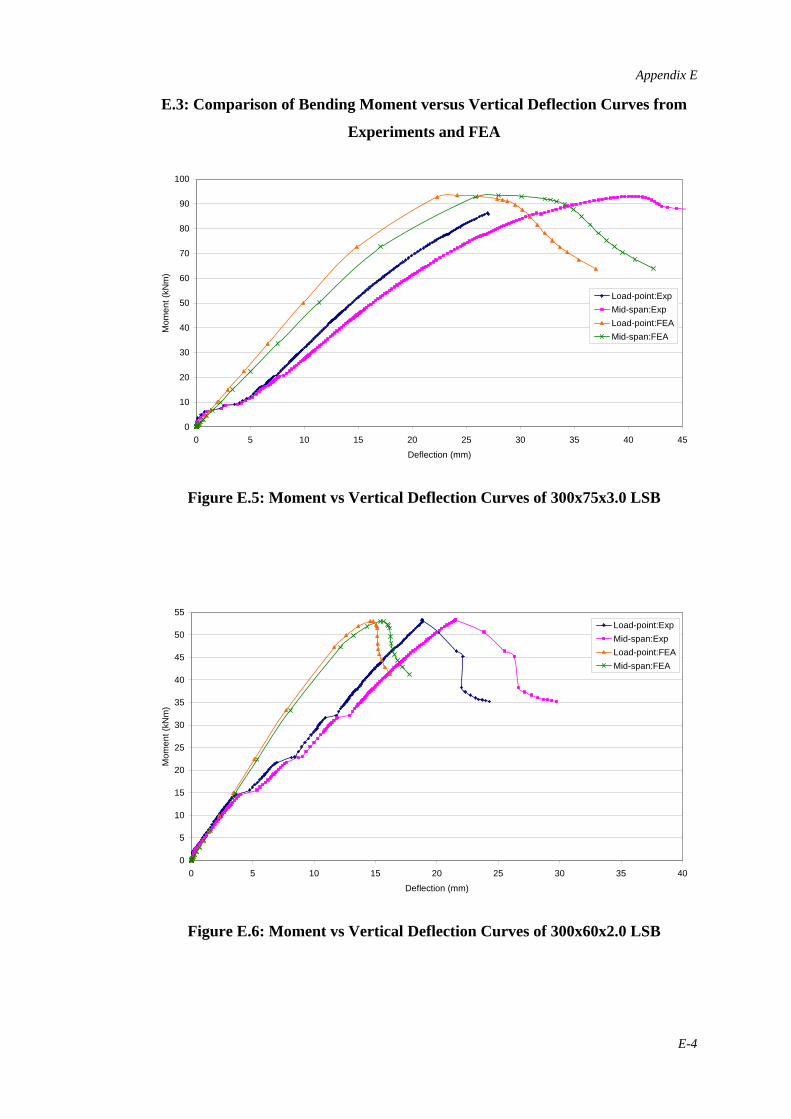
Appendix E
E-4
E.3: Comparison of Bending Moment versus Vertical Deflection Curves from
Experiments and FEA
0
10
20
30
40
50
60
70
80
90
100
0 5 10 15 20 25 30 35 40 45
Deflection (mm)
Mom
ent (
kNm
)
Load-point:ExpMid-span:ExpLoad-point:FEAMid-span:FEA
Figure E.5: Moment vs Vertical Deflection Curves of 300x75x3.0 LSB
0
5
10
15
20
25
30
35
40
45
50
55
0 5 10 15 20 25 30 35 40
Deflection (mm)
Mom
ent (
kNm
)
Load-point:ExpMid-span:ExpLoad-point:FEAMid-span:FEA
Figure E.6: Moment vs Vertical Deflection Curves of 300x60x2.0 LSB
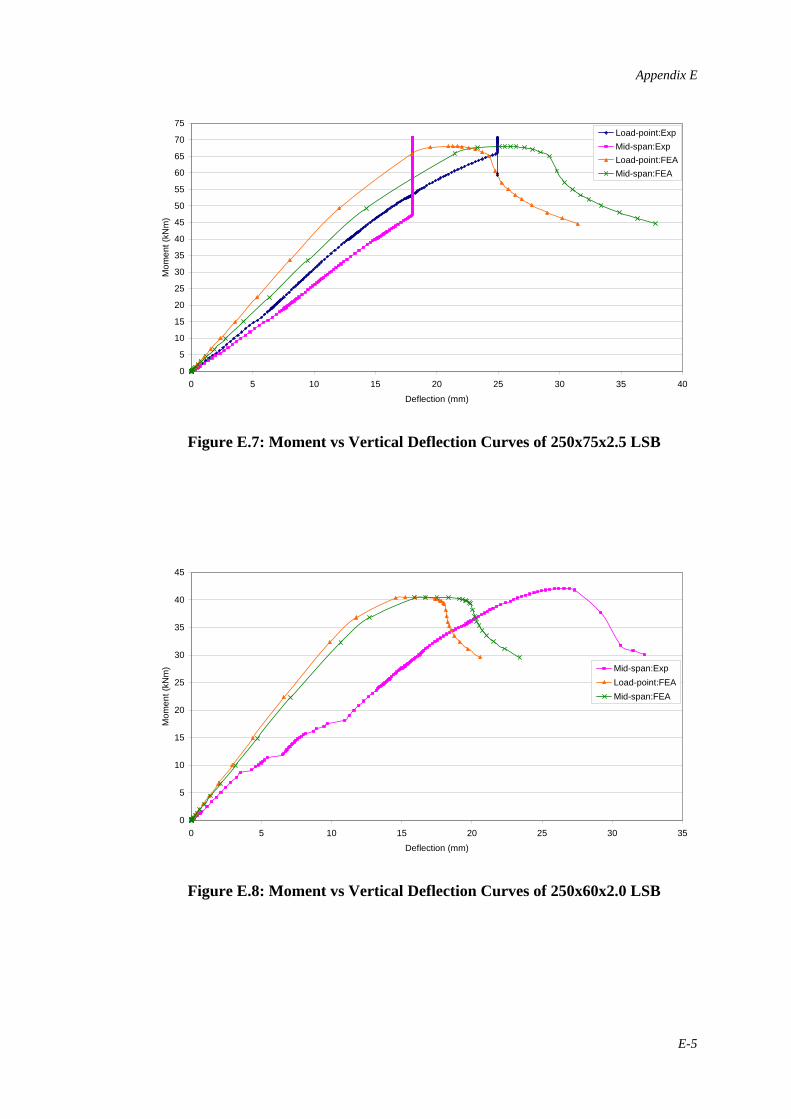
Appendix E
E-5
0
5
10
15
20
25
30
35
40
45
50
55
60
65
70
75
0 5 10 15 20 25 30 35 40
Deflection (mm)
Mom
ent (
kNm
)
Load-point:ExpMid-span:ExpLoad-point:FEAMid-span:FEA
Figure E.7: Moment vs Vertical Deflection Curves of 250x75x2.5 LSB
0
5
10
15
20
25
30
35
40
45
0 5 10 15 20 25 30 35
Deflection (mm)
Mom
ent (
kNm
) Mid-span:ExpLoad-point:FEAMid-span:FEA
Figure E.8: Moment vs Vertical Deflection Curves of 250x60x2.0 LSB
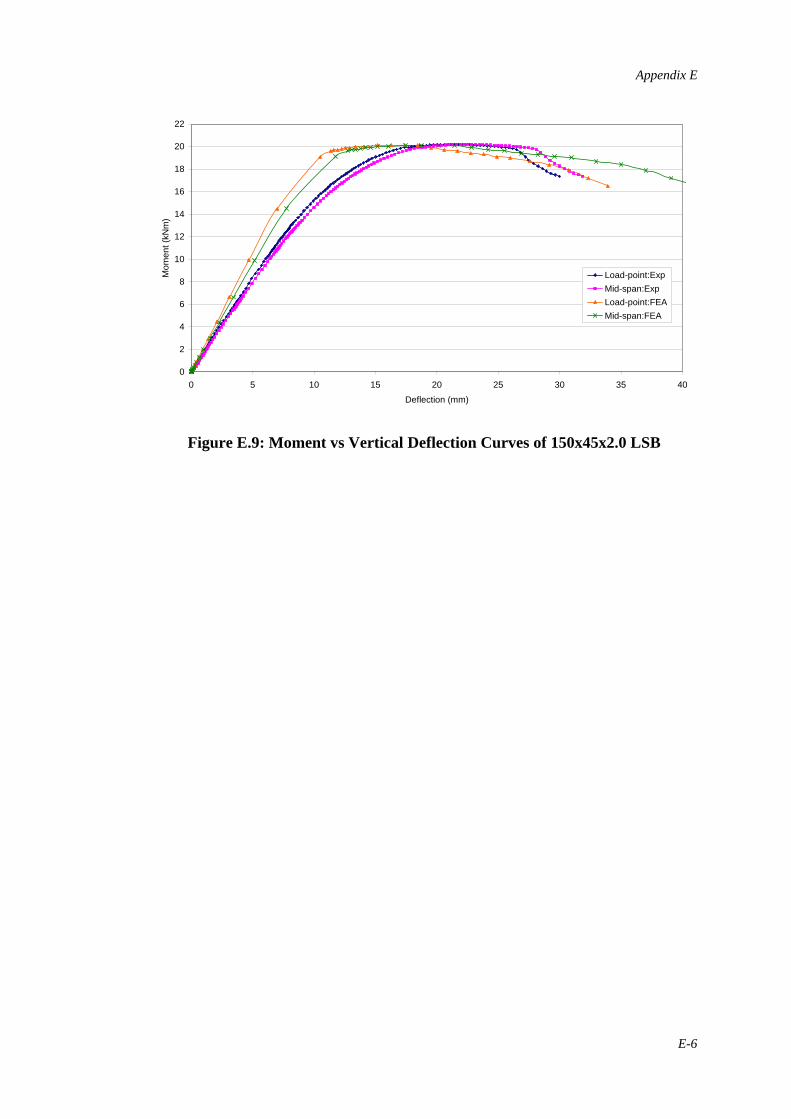
Appendix E
E-6
0
2
4
6
8
10
12
14
16
18
20
22
0 5 10 15 20 25 30 35 40
Deflection (mm)
Mom
ent (
kNm
)
Load-point:ExpMid-span:ExpLoad-point:FEAMid-span:FEA
Figure E.9: Moment vs Vertical Deflection Curves of 150x45x2.0 LSB
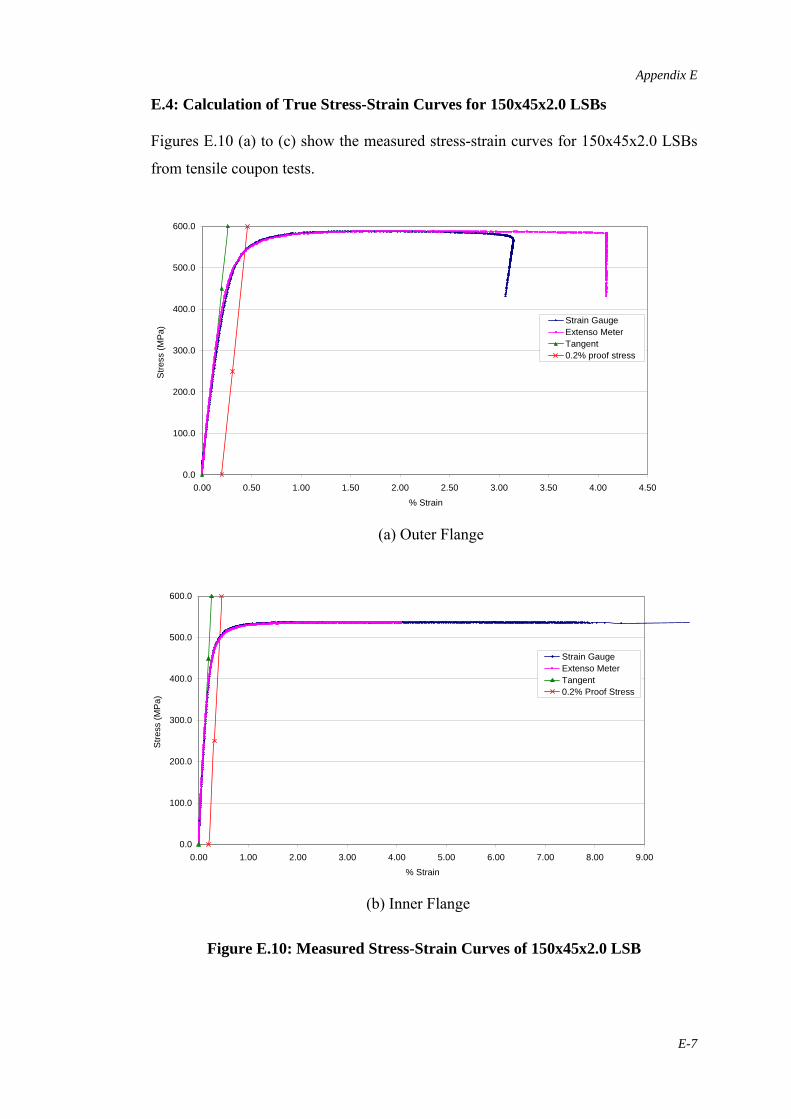
Appendix E
E-7
E.4: Calculation of True Stress-Strain Curves for 150x45x2.0 LSBs Figures E.10 (a) to (c) show the measured stress-strain curves for 150x45x2.0 LSBs
from tensile coupon tests.
Figure E.10: Measured Stress-Strain Curves of 150x45x2.0 LSB
(a) Outer Flange
0.0
100.0
200.0
300.0
400.0
500.0
600.0
0.00 0.50 1.00 1.50 2.00 2.50 3.00 3.50 4.00 4.50
% Strain
Stre
ss (M
Pa)
Strain GaugeExtenso MeterTangent0.2% proof stress
(b) Inner Flange
0.0
100.0
200.0
300.0
400.0
500.0
600.0
0.00 1.00 2.00 3.00 4.00 5.00 6.00 7.00 8.00 9.00
% Strain
Stre
ss (M
Pa)
Strain GaugeExtenso MeterTangent0.2% Proof Stress
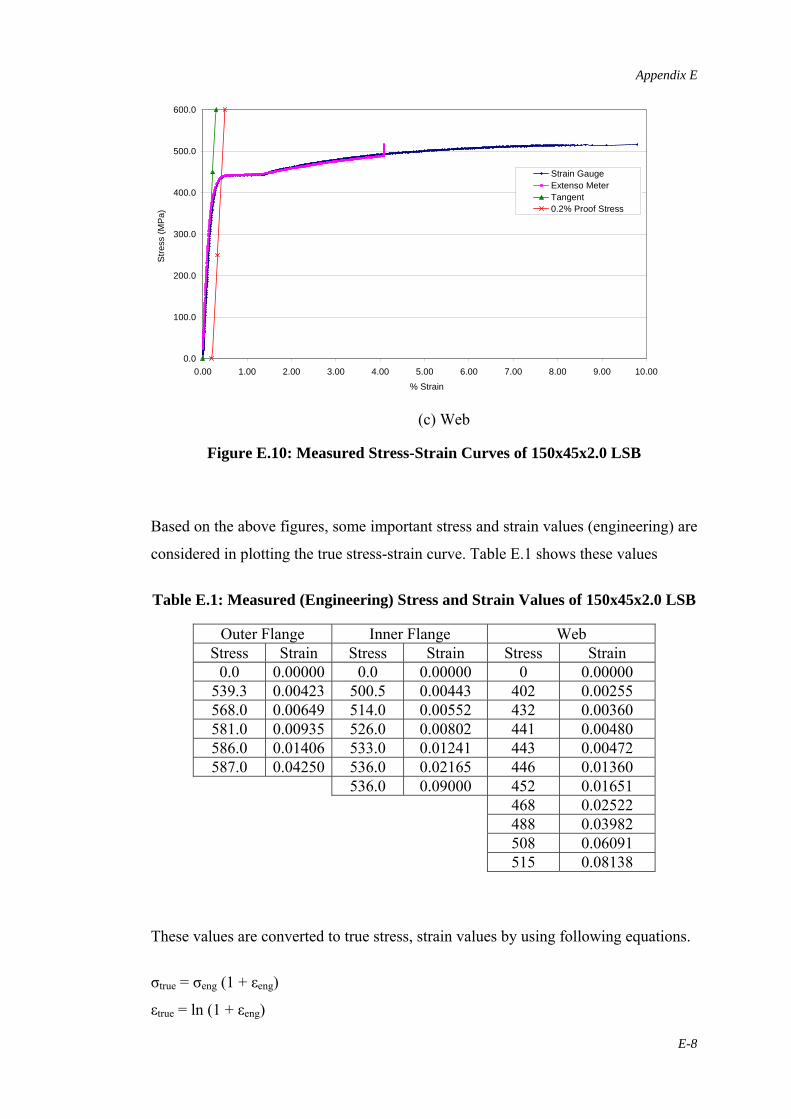
Appendix E
E-8
Figure E.10: Measured Stress-Strain Curves of 150x45x2.0 LSB Based on the above figures, some important stress and strain values (engineering) are
considered in plotting the true stress-strain curve. Table E.1 shows these values
Table E.1: Measured (Engineering) Stress and Strain Values of 150x45x2.0 LSB
Outer Flange Inner Flange Web Stress Strain Stress Strain Stress Strain
0.0 0.00000 0.0 0.00000 0 0.00000 539.3 0.00423 500.5 0.00443 402 0.00255 568.0 0.00649 514.0 0.00552 432 0.00360 581.0 0.00935 526.0 0.00802 441 0.00480 586.0 0.01406 533.0 0.01241 443 0.00472 587.0 0.04250 536.0 0.02165 446 0.01360
536.0 0.09000 452 0.01651 468 0.02522 488 0.03982 508 0.06091 515 0.08138
These values are converted to true stress, strain values by using following equations.
σtrue = σeng (1 + εeng)
εtrue = ln (1 + εeng)
0.0
100.0
200.0
300.0
400.0
500.0
600.0
0.00 1.00 2.00 3.00 4.00 5.00 6.00 7.00 8.00 9.00 10.00
% Strain
Stre
ss (M
Pa)
Strain GaugeExtenso MeterTangent0.2% Proof Stress
(c) Web
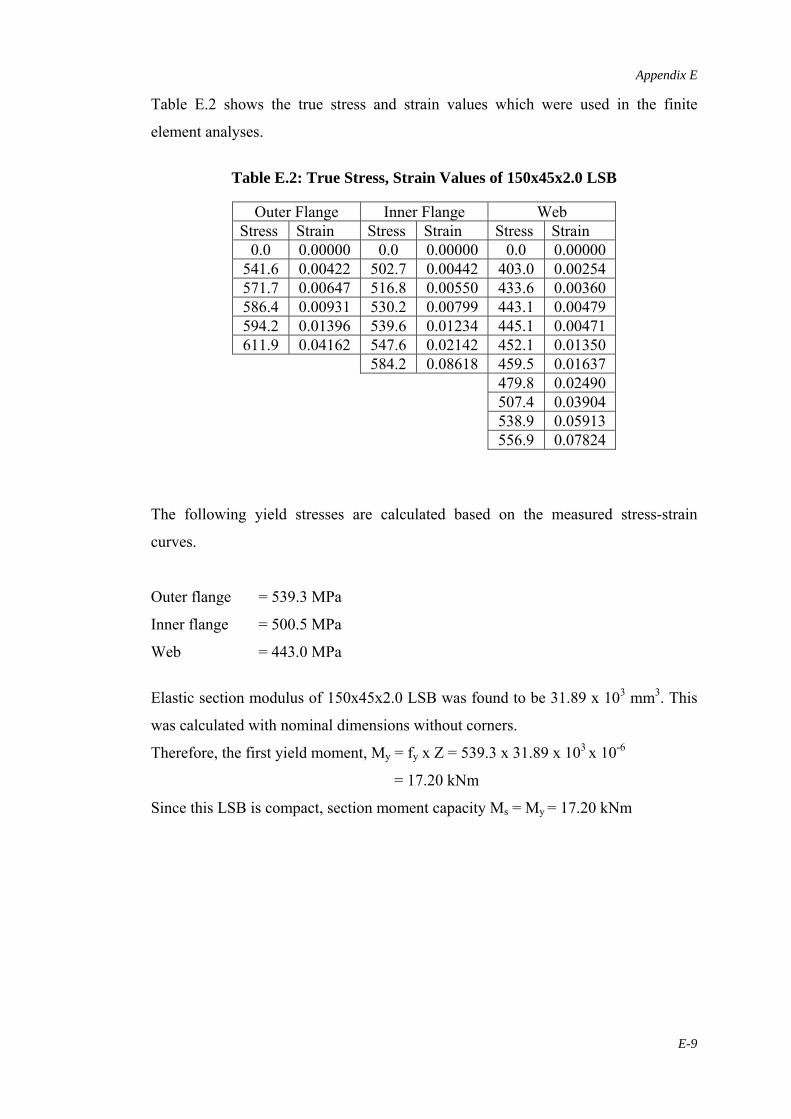
Appendix E
E-9
Table E.2 shows the true stress and strain values which were used in the finite
element analyses.
Table E.2: True Stress, Strain Values of 150x45x2.0 LSB
Outer Flange Inner Flange Web
Stress Strain Stress Strain Stress Strain 0.0 0.00000 0.0 0.00000 0.0 0.00000
541.6 0.00422 502.7 0.00442 403.0 0.00254 571.7 0.00647 516.8 0.00550 433.6 0.00360 586.4 0.00931 530.2 0.00799 443.1 0.00479 594.2 0.01396 539.6 0.01234 445.1 0.00471 611.9 0.04162 547.6 0.02142 452.1 0.01350 584.2 0.08618 459.5 0.01637
479.8 0.02490 507.4 0.03904 538.9 0.05913 556.9 0.07824
The following yield stresses are calculated based on the measured stress-strain
curves.
Outer flange = 539.3 MPa
Inner flange = 500.5 MPa
Web = 443.0 MPa
Elastic section modulus of 150x45x2.0 LSB was found to be 31.89 x 103 mm3. This
was calculated with nominal dimensions without corners.
Therefore, the first yield moment, My = fy x Z = 539.3 x 31.89 x 103 x 10-6
= 17.20 kNm
Since this LSB is compact, section moment capacity Ms = My = 17.20 kNm
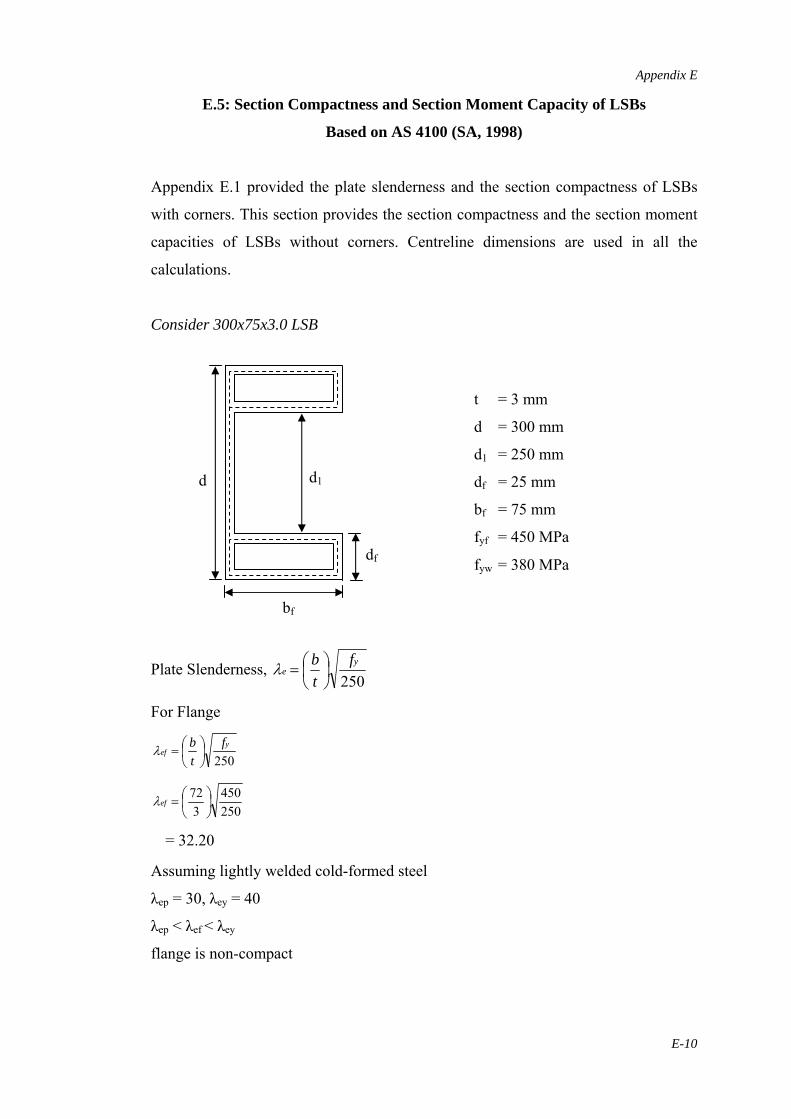
Appendix E
E-10
E.5: Section Compactness and Section Moment Capacity of LSBs
Based on AS 4100 (SA, 1998) Appendix E.1 provided the plate slenderness and the section compactness of LSBs
with corners. This section provides the section compactness and the section moment
capacities of LSBs without corners. Centreline dimensions are used in all the
calculations.
Consider 300x75x3.0 LSB
Plate Slenderness, 250
ye
ftb⎟⎠⎞
⎜⎝⎛=λ
For Flange
250y
eff
tb⎟⎠⎞
⎜⎝⎛=λ
250450
372
⎟⎠⎞
⎜⎝⎛=efλ
= 32.20
Assuming lightly welded cold-formed steel
λep = 30, λey = 40
λep < λef < λey
flange is non-compact
bf
df
d d1
t = 3 mm
d = 300 mm
d1 = 250 mm
df = 25 mm
bf = 75 mm
fyf = 450 MPa
fyw = 380 MPa
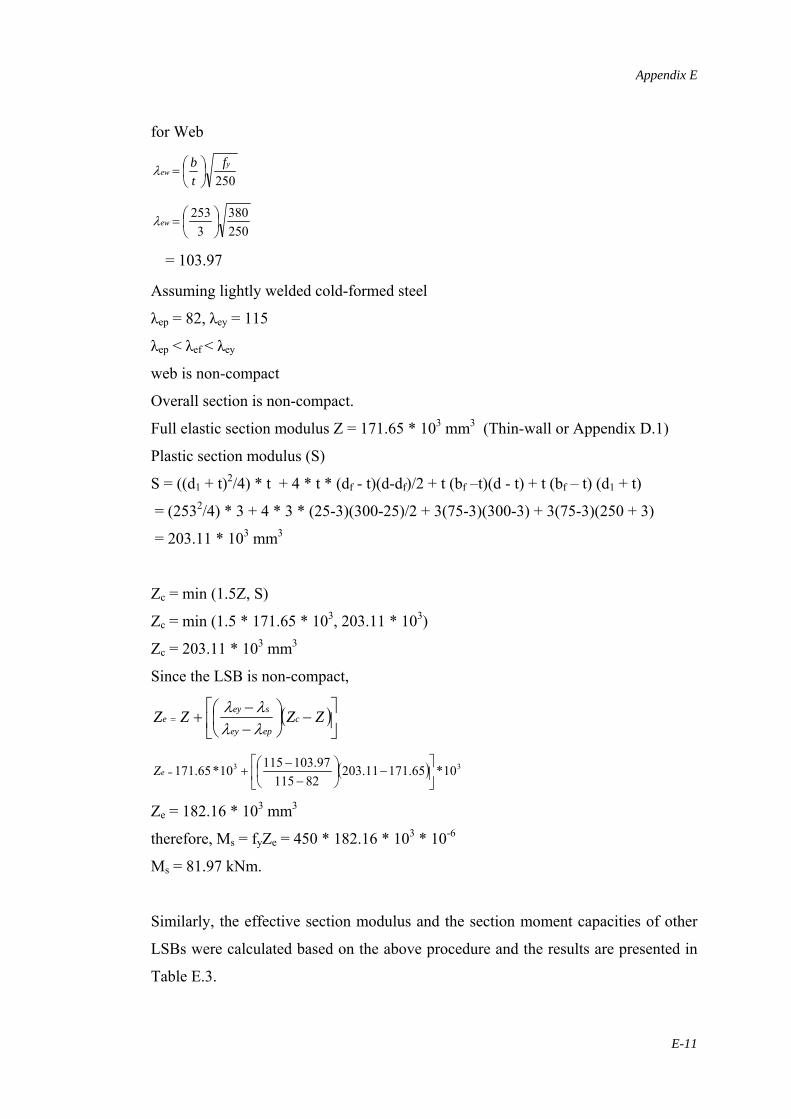
Appendix E
E-11
for Web
250y
ewf
tb⎟⎠⎞
⎜⎝⎛=λ
250380
3253
⎟⎠⎞
⎜⎝⎛=ewλ
= 103.97
Assuming lightly welded cold-formed steel
λep = 82, λey = 115
λep < λef < λey
web is non-compact
Overall section is non-compact.
Full elastic section modulus Z = 171.65 * 103 mm3 (Thin-wall or Appendix D.1)
Plastic section modulus (S)
S = ((d1 + t)2/4) * t + 4 * t * (df - t)(d-df)/2 + t (bf –t)(d - t) + t (bf – t) (d1 + t)
= (2532/4) * 3 + 4 * 3 * (25-3)(300-25)/2 + 3(75-3)(300-3) + 3(75-3)(250 + 3)
= 203.11 * 103 mm3
Zc = min (1.5Z, S)
Zc = min (1.5 * 171.65 * 103, 203.11 * 103)
Zc = 203.11 * 103 mm3
Since the LSB is non-compact,
( )⎥⎦
⎤⎢⎣
⎡−⎟
⎠⎞
⎜⎝⎛
−−
+= ZZZZ cepey
seye
λλλλ
( ) 33 10*65.17111.20382115
97.10311510*65.171 ⎥⎦
⎤⎢⎣
⎡−⎟
⎠⎞
⎜⎝⎛
−−
+=eZ
Ze = 182.16 * 103 mm3
therefore, Ms = fyZe = 450 * 182.16 * 103 * 10-6
Ms = 81.97 kNm.
Similarly, the effective section modulus and the section moment capacities of other
LSBs were calculated based on the above procedure and the results are presented in
Table E.3.
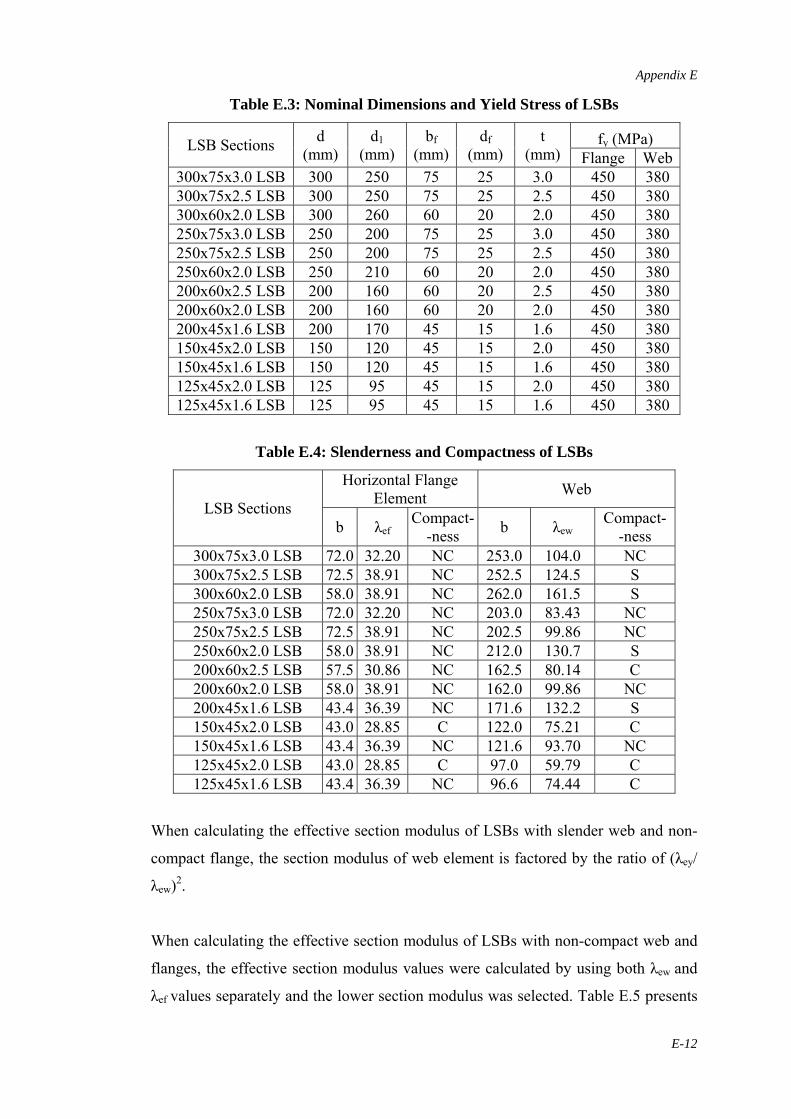
Appendix E
E-12
Table E.3: Nominal Dimensions and Yield Stress of LSBs
LSB Sections d (mm)
d1 (mm)
bf (mm)
df (mm)
t (mm)
fy (MPa) Flange Web
300x75x3.0 LSB 300 250 75 25 3.0 450 380 300x75x2.5 LSB 300 250 75 25 2.5 450 380 300x60x2.0 LSB 300 260 60 20 2.0 450 380 250x75x3.0 LSB 250 200 75 25 3.0 450 380 250x75x2.5 LSB 250 200 75 25 2.5 450 380 250x60x2.0 LSB 250 210 60 20 2.0 450 380 200x60x2.5 LSB 200 160 60 20 2.5 450 380 200x60x2.0 LSB 200 160 60 20 2.0 450 380 200x45x1.6 LSB 200 170 45 15 1.6 450 380 150x45x2.0 LSB 150 120 45 15 2.0 450 380 150x45x1.6 LSB 150 120 45 15 1.6 450 380 125x45x2.0 LSB 125 95 45 15 2.0 450 380 125x45x1.6 LSB 125 95 45 15 1.6 450 380
Table E.4: Slenderness and Compactness of LSBs
LSB Sections
Horizontal Flange Element Web
b λef Compact-
-ness b λew Compact--ness
300x75x3.0 LSB 72.0 32.20 NC 253.0 104.0 NC 300x75x2.5 LSB 72.5 38.91 NC 252.5 124.5 S 300x60x2.0 LSB 58.0 38.91 NC 262.0 161.5 S 250x75x3.0 LSB 72.0 32.20 NC 203.0 83.43 NC 250x75x2.5 LSB 72.5 38.91 NC 202.5 99.86 NC 250x60x2.0 LSB 58.0 38.91 NC 212.0 130.7 S 200x60x2.5 LSB 57.5 30.86 NC 162.5 80.14 C 200x60x2.0 LSB 58.0 38.91 NC 162.0 99.86 NC 200x45x1.6 LSB 43.4 36.39 NC 171.6 132.2 S 150x45x2.0 LSB 43.0 28.85 C 122.0 75.21 C 150x45x1.6 LSB 43.4 36.39 NC 121.6 93.70 NC 125x45x2.0 LSB 43.0 28.85 C 97.0 59.79 C 125x45x1.6 LSB 43.4 36.39 NC 96.6 74.44 C
When calculating the effective section modulus of LSBs with slender web and non-
compact flange, the section modulus of web element is factored by the ratio of (λey/
λew)2.
When calculating the effective section modulus of LSBs with non-compact web and
flanges, the effective section modulus values were calculated by using both λew and
λef values separately and the lower section modulus was selected. Table E.5 presents
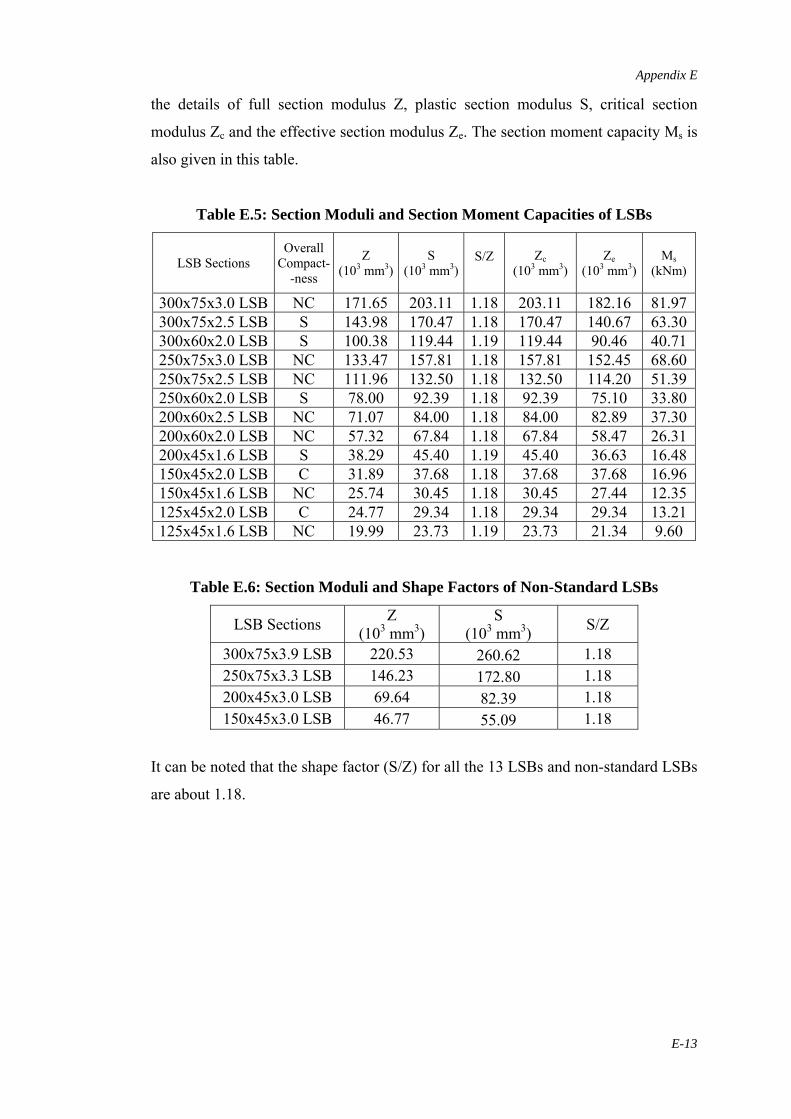
Appendix E
E-13
the details of full section modulus Z, plastic section modulus S, critical section
modulus Zc and the effective section modulus Ze. The section moment capacity Ms is
also given in this table.
Table E.5: Section Moduli and Section Moment Capacities of LSBs
LSB Sections Overall
Compact--ness
Z (103 mm3)
S (103 mm3)
S/Z Zc
(103 mm3) Ze
(103 mm3) Ms
(kNm)
300x75x3.0 LSB NC 171.65 203.11 1.18 203.11 182.16 81.97 300x75x2.5 LSB S 143.98 170.47 1.18 170.47 140.67 63.30 300x60x2.0 LSB S 100.38 119.44 1.19 119.44 90.46 40.71 250x75x3.0 LSB NC 133.47 157.81 1.18 157.81 152.45 68.60 250x75x2.5 LSB NC 111.96 132.50 1.18 132.50 114.20 51.39 250x60x2.0 LSB S 78.00 92.39 1.18 92.39 75.10 33.80 200x60x2.5 LSB NC 71.07 84.00 1.18 84.00 82.89 37.30 200x60x2.0 LSB NC 57.32 67.84 1.18 67.84 58.47 26.31 200x45x1.6 LSB S 38.29 45.40 1.19 45.40 36.63 16.48 150x45x2.0 LSB C 31.89 37.68 1.18 37.68 37.68 16.96 150x45x1.6 LSB NC 25.74 30.45 1.18 30.45 27.44 12.35 125x45x2.0 LSB C 24.77 29.34 1.18 29.34 29.34 13.21 125x45x1.6 LSB NC 19.99 23.73 1.19 23.73 21.34 9.60
Table E.6: Section Moduli and Shape Factors of Non-Standard LSBs
LSB Sections Z (103 mm3)
S (103 mm3) S/Z
300x75x3.9 LSB 220.53 260.62 1.18 250x75x3.3 LSB 146.23 172.80 1.18 200x45x3.0 LSB 69.64 82.39 1.18 150x45x3.0 LSB 46.77 55.09 1.18
It can be noted that the shape factor (S/Z) for all the 13 LSBs and non-standard LSBs
are about 1.18.
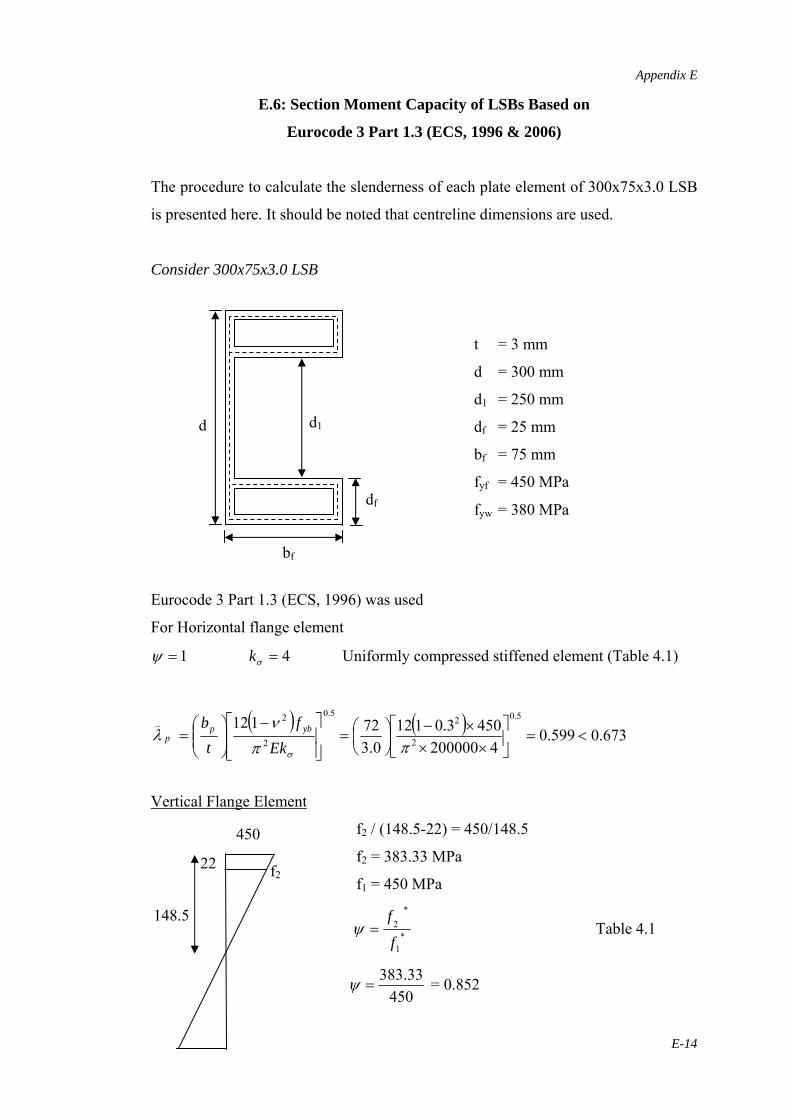
Appendix E
E-14
E.6: Section Moment Capacity of LSBs Based on
Eurocode 3 Part 1.3 (ECS, 1996 & 2006)
The procedure to calculate the slenderness of each plate element of 300x75x3.0 LSB
is presented here. It should be noted that centreline dimensions are used.
Consider 300x75x3.0 LSB
Eurocode 3 Part 1.3 (ECS, 1996) was used
For Horizontal flange element
1=ψ 4=σk Uniformly compressed stiffened element (Table 4.1)
p
_
λ ( ) 5.0
2
2112
⎥⎥⎦
⎤
⎢⎢⎣
⎡ −⎟⎟⎠
⎞⎜⎜⎝
⎛=
σπνEk
ft
b ybp ( ) 673.0599.04200000
4503.01120.3
725.0
2
2
<=⎥⎦
⎤⎢⎣
⎡××
×−⎟⎠⎞
⎜⎝⎛=
π
Vertical Flange Element
f2 / (148.5-22) = 450/148.5
f2 = 383.33 MPa
f1 = 450 MPa
*1
*2
f
f=ψ Table 4.1
450
33.383=ψ = 0.852
bf
df
d d1
t = 3 mm
d = 300 mm
d1 = 250 mm
df = 25 mm
bf = 75 mm
fyf = 450 MPa
fyw = 380 MPa
f2
450
22
148.5
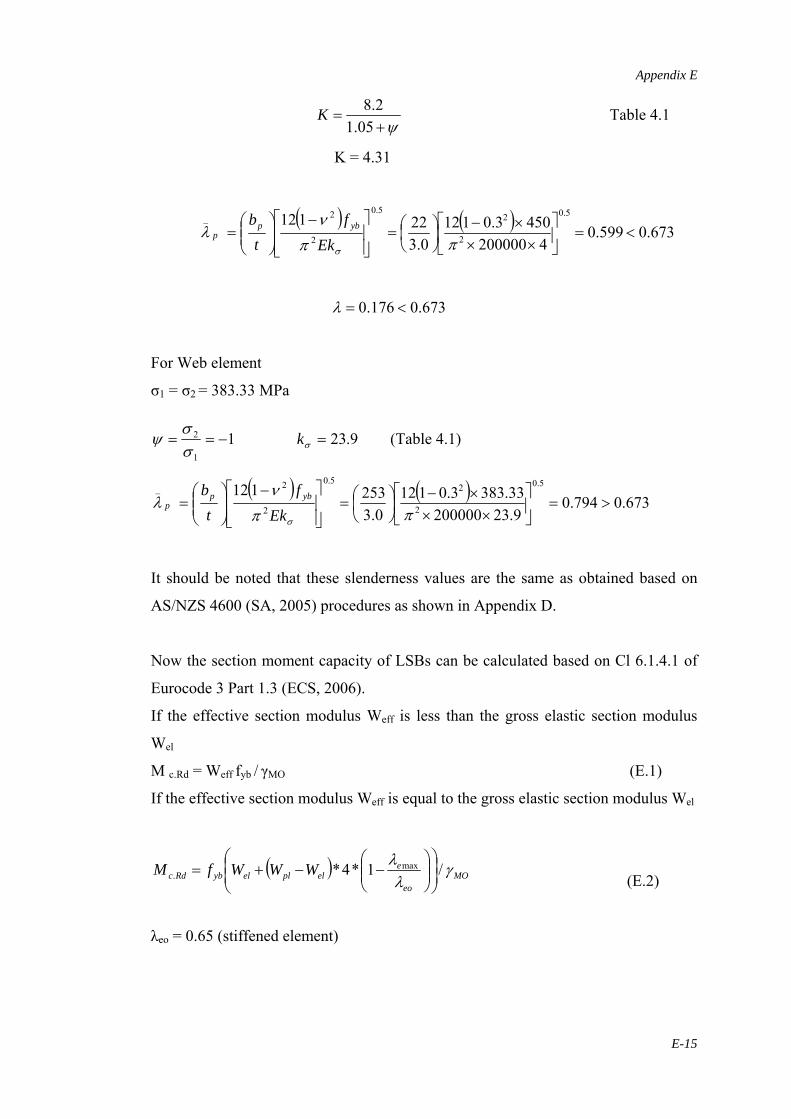
Appendix E
E-15
ψ+
=05.1
2.8K Table 4.1
K = 4.31
p
_
λ ( ) 5.0
2
2112
⎥⎥⎦
⎤
⎢⎢⎣
⎡ −⎟⎟⎠
⎞⎜⎜⎝
⎛=
σπνEk
ft
b ybp ( ) 673.0599.04200000
4503.01120.3
225.0
2
2
<=⎥⎦
⎤⎢⎣
⎡××
×−⎟⎠⎞
⎜⎝⎛=
π
673.0176.0 <=λ
For Web element
σ1 = σ2 = 383.33 MPa
11
2 −==σσ
ψ 9.23=σk (Table 4.1)
p
_
λ ( ) 5.0
2
2112
⎥⎥⎦
⎤
⎢⎢⎣
⎡ −⎟⎟⎠
⎞⎜⎜⎝
⎛=
σπνEk
ft
b ybp ( ) 673.0794.09.23200000
33.3833.01120.3
2535.0
2
2
>=⎥⎦
⎤⎢⎣
⎡××
×−⎟⎠⎞
⎜⎝⎛=
π
It should be noted that these slenderness values are the same as obtained based on
AS/NZS 4600 (SA, 2005) procedures as shown in Appendix D.
Now the section moment capacity of LSBs can be calculated based on Cl 6.1.4.1 of
Eurocode 3 Part 1.3 (ECS, 2006).
If the effective section modulus Weff is less than the gross elastic section modulus
Wel
M c.Rd = Weff fyb / γMO (E.1)
If the effective section modulus Weff is equal to the gross elastic section modulus Wel
(E.2)
λeo = 0.65 (stiffened element)
( ) MOeo
eelplelybRdc WWWfM γ
λλ /1*4* max
. ⎟⎟⎠
⎞⎜⎜⎝
⎛⎟⎟⎠
⎞⎜⎜⎝
⎛−−+=
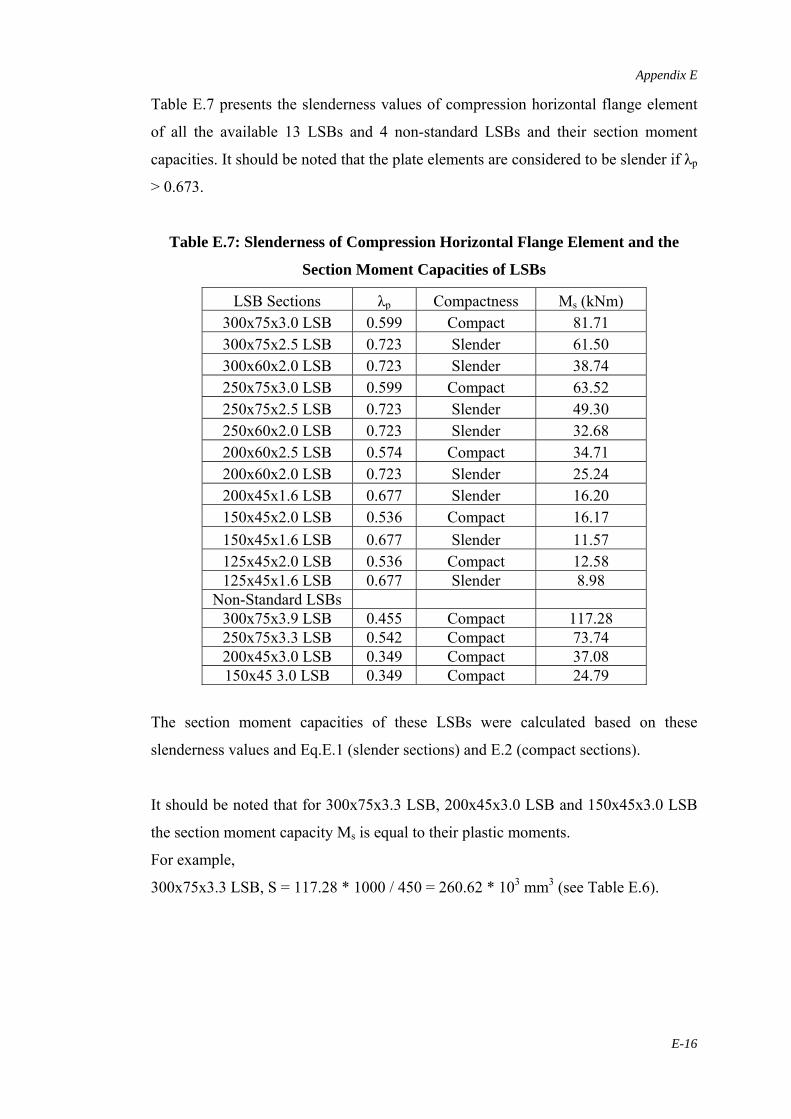
Appendix E
E-16
Table E.7 presents the slenderness values of compression horizontal flange element
of all the available 13 LSBs and 4 non-standard LSBs and their section moment
capacities. It should be noted that the plate elements are considered to be slender if λp
> 0.673.
Table E.7: Slenderness of Compression Horizontal Flange Element and the
Section Moment Capacities of LSBs
LSB Sections λp Compactness Ms (kNm) 300x75x3.0 LSB 0.599 Compact 81.71 300x75x2.5 LSB 0.723 Slender 61.50 300x60x2.0 LSB 0.723 Slender 38.74 250x75x3.0 LSB 0.599 Compact 63.52 250x75x2.5 LSB 0.723 Slender 49.30 250x60x2.0 LSB 0.723 Slender 32.68 200x60x2.5 LSB 0.574 Compact 34.71 200x60x2.0 LSB 0.723 Slender 25.24 200x45x1.6 LSB 0.677 Slender 16.20 150x45x2.0 LSB 0.536 Compact 16.17 150x45x1.6 LSB 0.677 Slender 11.57 125x45x2.0 LSB 0.536 Compact 12.58 125x45x1.6 LSB 0.677 Slender 8.98
Non-Standard LSBs 300x75x3.9 LSB 0.455 Compact 117.28 250x75x3.3 LSB 0.542 Compact 73.74 200x45x3.0 LSB 0.349 Compact 37.08 150x45 3.0 LSB 0.349 Compact 24.79
The section moment capacities of these LSBs were calculated based on these
slenderness values and Eq.E.1 (slender sections) and E.2 (compact sections).
It should be noted that for 300x75x3.3 LSB, 200x45x3.0 LSB and 150x45x3.0 LSB
the section moment capacity Ms is equal to their plastic moments.
For example,
300x75x3.3 LSB, S = 117.28 * 1000 / 450 = 260.62 * 103 mm3 (see Table E.6).
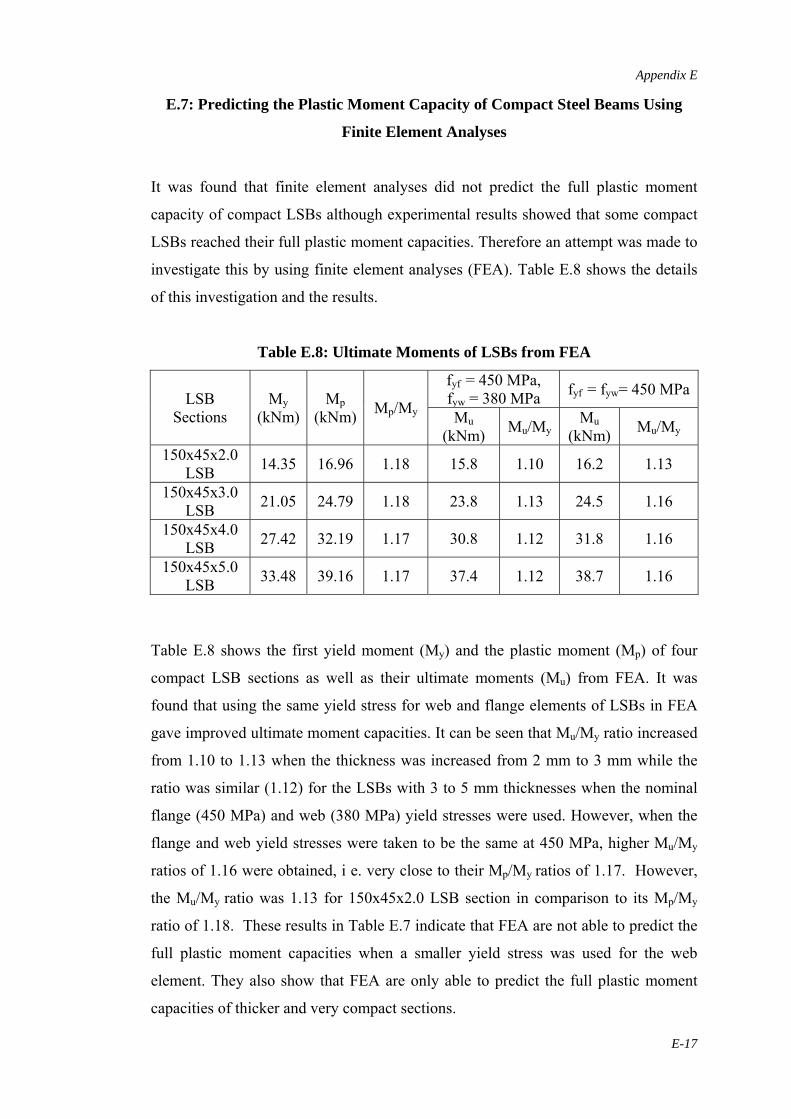
Appendix E
E-17
E.7: Predicting the Plastic Moment Capacity of Compact Steel Beams Using
Finite Element Analyses
It was found that finite element analyses did not predict the full plastic moment
capacity of compact LSBs although experimental results showed that some compact
LSBs reached their full plastic moment capacities. Therefore an attempt was made to
investigate this by using finite element analyses (FEA). Table E.8 shows the details
of this investigation and the results.
Table E.8: Ultimate Moments of LSBs from FEA
LSB Sections
My (kNm)
Mp (kNm) Mp/My
fyf = 450 MPa, fyw = 380 MPa fyf = fyw= 450 MPa
Mu (kNm) Mu/My
Mu (kNm) Mu/My
150x45x2.0 LSB 14.35 16.96 1.18 15.8 1.10 16.2 1.13
150x45x3.0 LSB 21.05 24.79 1.18 23.8 1.13 24.5 1.16
150x45x4.0 LSB 27.42 32.19 1.17 30.8 1.12 31.8 1.16
150x45x5.0 LSB 33.48 39.16 1.17 37.4 1.12 38.7 1.16
Table E.8 shows the first yield moment (My) and the plastic moment (Mp) of four
compact LSB sections as well as their ultimate moments (Mu) from FEA. It was
found that using the same yield stress for web and flange elements of LSBs in FEA
gave improved ultimate moment capacities. It can be seen that Mu/My ratio increased
from 1.10 to 1.13 when the thickness was increased from 2 mm to 3 mm while the
ratio was similar (1.12) for the LSBs with 3 to 5 mm thicknesses when the nominal
flange (450 MPa) and web (380 MPa) yield stresses were used. However, when the
flange and web yield stresses were taken to be the same at 450 MPa, higher Mu/My
ratios of 1.16 were obtained, i e. very close to their Mp/My ratios of 1.17. However,
the Mu/My ratio was 1.13 for 150x45x2.0 LSB section in comparison to its Mp/My
ratio of 1.18. These results in Table E.7 indicate that FEA are not able to predict the
full plastic moment capacities when a smaller yield stress was used for the web
element. They also show that FEA are only able to predict the full plastic moment
capacities of thicker and very compact sections.
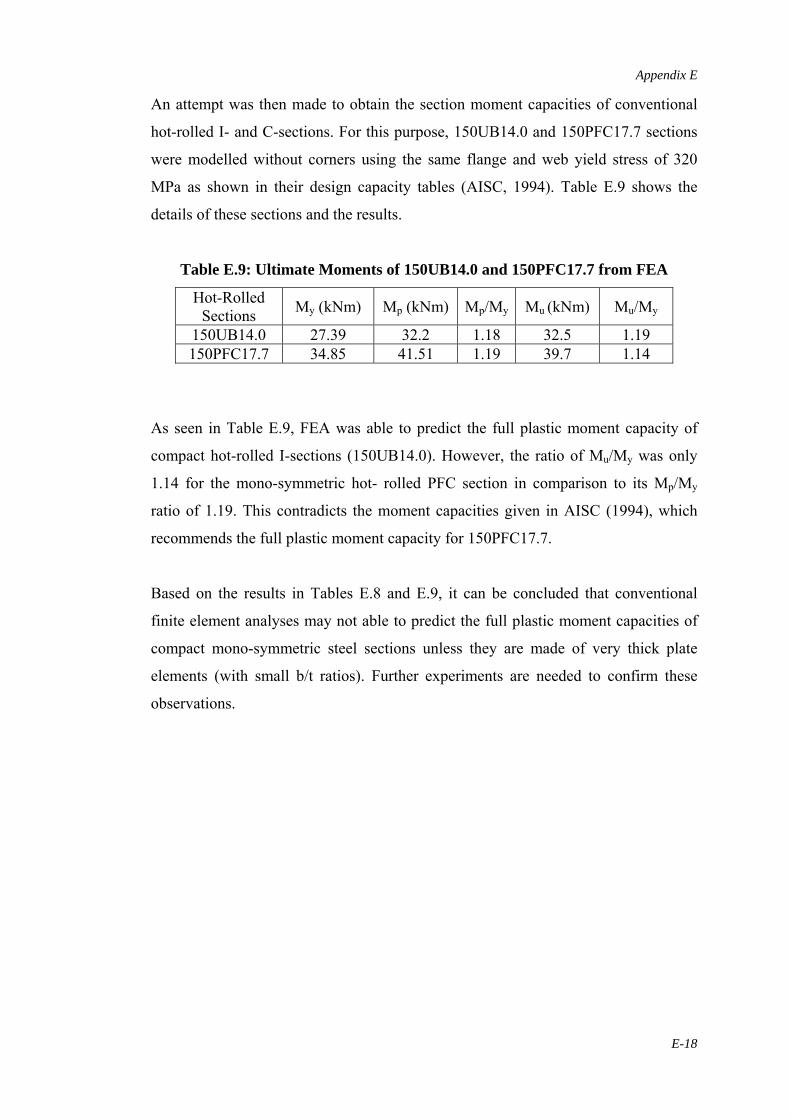
Appendix E
E-18
An attempt was then made to obtain the section moment capacities of conventional
hot-rolled I- and C-sections. For this purpose, 150UB14.0 and 150PFC17.7 sections
were modelled without corners using the same flange and web yield stress of 320
MPa as shown in their design capacity tables (AISC, 1994). Table E.9 shows the
details of these sections and the results.
Table E.9: Ultimate Moments of 150UB14.0 and 150PFC17.7 from FEA
Hot-Rolled Sections My (kNm) Mp (kNm) Mp/My Mu (kNm) Mu/My
150UB14.0 27.39 32.2 1.18 32.5 1.19 150PFC17.7 34.85 41.51 1.19 39.7 1.14
As seen in Table E.9, FEA was able to predict the full plastic moment capacity of
compact hot-rolled I-sections (150UB14.0). However, the ratio of Mu/My was only
1.14 for the mono-symmetric hot- rolled PFC section in comparison to its Mp/My
ratio of 1.19. This contradicts the moment capacities given in AISC (1994), which
recommends the full plastic moment capacity for 150PFC17.7.
Based on the results in Tables E.8 and E.9, it can be concluded that conventional
finite element analyses may not able to predict the full plastic moment capacities of
compact mono-symmetric steel sections unless they are made of very thick plate
elements (with small b/t ratios). Further experiments are needed to confirm these
observations.
References
R-1
REFERENCES
AISC (1994), “Design Capacity Tables for Structural Steel”, Australian Institute of
Steel Construction, Second Edition, Vol. 1, Sydney, Australia.
Akay, H. V., Johnson, C. P. and Will, K. M. (1977), “Lateral and Local Buckling of
Beams and Frames”, Journal of Structural Engineering, ASCE, Vol. 103, No. 9,
pp.1821-1832.
American Iron and Steel Institute (AISI) (2004), North American Specification for
the Design of Cold-Formed Steel Structural Members, Washington, D.C., USA.
American Iron and Steel Institute (AISI) (2006), “Direct Strength Method Design
Guide CF06-1”, North American Specification for the Design of Cold-Formed Steel
Structural Members, Washington DC, USA.
American Iron and Steel Institute (AISI) (2007), North American Specification for
the Design of Cold-Formed Steel Structural Members, Washington, D.C., USA.
Ashraf, M., Gardner, L. and Nethercot, D. A. (2006), “Finite Element Modelling of
Structural Stainless Steel Cross-Sections”, Thin-Walled Structures, Vol. 44, pp.1048-
1062.
Avery, P. and Mahendran, M. (1997), “Finite Element Analysis of Hollow Flange
Beams with Web Stiffeners”, Journal of Structural Engineering, ASCE, Vol. 123,
No.9, pp.1123-1129.
Avery, P., Mahendran, M. and Nasir, A. (2000a), “Flexural Capacity of Hollow
Flange Beams”, Physical Infrastructure Centre, QUT, Brisbane, Australia.
Avery, P., Mahendran, M. and Nasir, A. (2000b), “Flexural Capacity of Hollow
Flange Beams”, Journal of Construction Steel Research, Vol 53, pp201-223.
References
R-2
Avery, P., Mahendran, M. and Nasir, A. (1999a), “Flexural Capacity of Hollow
Flange Beams I: Description and Verification of Finite Element Model”, Research
Monograph No. 99-1, Physical Infrastructure Centre, QUT, Brisbane, Australia.
Avery, P., Mahendran, M. and Nasir, A. (1999b), “Flexural Capacity of Hollow
Flange Beams II: Design Curves”, Research Monograph No. 99-2, Physical
Infrastructure Centre, QUT, Brisbane, Australia.
British Standards Institution (BSI) (1998), Structural Use of Steelwork in Buidling,
BS 5950, Part 5 Code of Practice for Design of Cold-Formed Thin Gauge Sections,
London, UK.
Bradford, M. A. (1992), “Lateral Distortional Buckling of Steel I-Section Members”,
Journal of Construction Steel Research Vol. 23, pp. 97-116.
Dekker, N. W. and Kemp, A. R. (1998), “A simplified distortional buckling model
for doubly symmetrical I-sections”, Canadian Journal of Civil Engineering, Vol. 25,
No. 4, pp.718-727
Dempsey, R. I. (1990), “Structural Behaviour and Design of Hollow Flange Beams”,
Proceedings of the 2nd National Structural Engineering Conference, Institute of
Engineers, Barton, ACT, Australia, pp. 325-335.
Dempsey, R. I. (2001), “Hollow Flange Channel Development of the Product
Range”, Investigation Report, Warren Brown Associates, Brisbane, Australia.
Doan, V. and Mahendran, M. (1996), “A Residual Stress Model for Hollow Flange
Beams”, Research Report 96-39, Physical Infrastructure Centre, Queensland
University of Technology, Brisbane, Australia.
Eurocode 3 Part 1.3 (ECS, 1996), Design of Steel Structures, Part 1.3: General Rules
– Supplementary Rules for Cold-Formed Members and Sheeting, British Standard
Institution, London, UK.
References
R-3
Eurocode 3 Part 1.3 (ECS, 2006), Design of Steel Structures – Part 1.3: General
Rules – Supplementary Rules for Cold-Formed Thin Gauge Members and Sheeting,
British Standard Institution, London, UK.
Greiner, R. (2001), “Background Information on the Beam-Column Interaction
Formulae at Level 1”, ECCS TC 8, Ad-Hoc Working Group on Beam-Columns,
Paper No. TC8 – 2001, Technical University of Graz, Austria.
Hancock, G. J. (1997), “Design for Distortional Buckling of Flexural Members”,
Thin-Walled Structures, Vol. 27, No. 1, pp. 3-12.
Hancock, G. J. and Papangelis, J. P. (1994), THINWALL User’s Manual, Centre for
Advanced Structural Engineering, University of Sydney, Sydney, Australia.
Hancock, G. J., Kwon, Y. B. and Bernard, E. S. (1994), “Strength Design Curves for
Thin-Walled Sections Undergoing Distortional Buckling”, Journal of Construction
Steel Research, Vol. 3, pp.169-186.
Hancock, G. J., Murray, T. M. and Ellifritt, D.S. (2001), “Cold-Formed Steel
Structures to the AISI Specification, Marcel Dekker Inc, NY, USA.
Heldt, T. J. and Mahendran, M. (1992), “Distortional Buckling Analysis of Hollow
Flange Beams”, Res. Rep. No. 92-8, Queensland University of Technology,
Brisbane, Australia.
Hibbit Karisson and Sorensen (HKS), (2007), ABAQUS User’s Manual, Pawtucket,
RI., USA.
Jeyeragan, S. and Mahendran, M. (2009), “Parametric Studies and Development of
Design Rules for Back to Back LSB Sections”, Research Report, QUT, Brisbane,
Australia.
Kurniawan, C.W. (2005), “Lateral Buckling Tests of LiteSteel Beams with
Stiffeners”, BE thesis, QUT, Brisbane, Australia.
References
R-4
Kurniawan, C.W. (2007), “Lateral Buckling Behaviour and Design of the new
LiteSteel Beam”, ME Thesis, QUT, Brisbane, Australia.
Kurniawan, C.W. and Mahendran, M. (2009a), “Elastic Lateral Buckling of Simply
Supported LiteSteel Beams Subject to Transverse Loading”, Thin-Walled Structures,
Vol. 47, No. 01, pp.109-119.
Kurniawan, C.W. and Mahendran, M. (2009b), “Lateral Buckling Strength of Simply
Supported LiteSteel Beams Subject to Moment Gradient Effects”, Journal of
Structural Engineering, ASCE, Vol. 135, No. 9, pp.1058-1067.
Kwon, Y. B. and Hancock, G. J. (1991), “Strength Tests of Cold-Formed Channel
Sections Undergoing Local and Distortional Buckling”, Research Report No. R640,
Department of Civil Engineering, University of Sydney, Sydney, Australia.
Lau, S. C. W. and Hancock, G. J. (1987), “Distortional Buckling Formulae for
Channel Columns”, Journal of Structural Division, ASCE, Vol. 113, ST5, pp. 1063-
1078.
Lecce, M. and Rasmusen, J. R. (2005), “Experimental Investigation of the
Distortional Buckling of Cold-Formed Stainless Steel Sections”, Research Report
No. R844, Department of Civil Engineering, University of Sydney, Sydney,
Australia.
LiteSteel Technologies, OneSteel Australian Tube Mills, Queensland, Australia,
viewed 10 March 2008, <http://www.litesteelbeam.com>.
Ma, M. and Hughes, O. (1996), “Lateral Distortional Buckling of Monosymmetric I-
Beams under Distributed Vertical Load”, Thin-Walled Structures, Vol. 26, No. 2,
pp.123-145.
Mahaarachchi, D. and Mahendran, M. (2005a), “Lateral Buckling Tests of LiteSteel
Beam Sections”, Research Report No. 1, Queensland University of Technology,
Brisbane, Australia.
References
R-5
Mahaarachchi, D. and Mahendran, M. (2005b), “Section Capacity Tests of LiteSteel
Beam Sections”, Research Report No. 2, Queensland University of Technology,
Brisbane, Australia.
Mahaarachchi, D. and Mahendran, M. (2005c), “Finite Element Analysis of LiteSteel
Beam Sections”, Research Report No. 3, Queensland University of Technology,
Brisbane, Australia.
Mahaarachchi, D. and Mahendran, M. (2005(d), “Moment Capacity and Design of
LiteSteel Beam Sections”, Research Report No. 4, Queensland University of
Technology, Brisbane, Australia.
Mahaarachchi, D. and Mahendran, M. (2005e), “Material Properties, Residual
Stresses and Geometric Imperfections of LiteSteel Beam Sections”, Research Report
No. 5, Queensland University of Technology, Brisbane, Australia.
Mahendran, M. and Avery, P. (1997), “Bucking Experiments on Hollow Flange
Beams with Web Stiffeners”, Journal of Structural Engineering, ASCE, Vol. 123,
No.9, pp. 1130-1134.
Mahendran, M. and Doan, V. (1999), “Lateral Distortional Buckling Tests of Hollow
Flange Beams”, Research Monograph 99-3, Physical Infrastructure Centre, QUT,
Brisbane, Australia.
MD/Patran, (2008), Patran Version R2.1, MSC.Software Corporation, California,
USA.
MSC/Patran, (2008), Patran Version 2008 r1, MSC.Software Corporation,
California, USA.
OATM (2008), “Design Capacity Tables for LiteSteel Beams”, OneSteel Australian
Tube Mills, Brisbane, Australia.
References
R-6
Ojalvo, M. and Chambers, R. S. (1977), “Effects of Warping Restraints on I-Beam
Buckling”, ASCE, Journal of the Structural Division, Vol. 103, No. ST12, pp.2351-
2360.
Papangelis, J. P. and Trahair, N. S. (1987), “Flexural Torsional Buckling Tests on
Arches”, Journal of Structural Engineering, ASCE, Vol. 113, No. 7, pp.1433-1443.
Parsons, J. (2007a), “An Investigation in to the Lateral Distortional Buckling
Behaviour and Modelling of LiteSteel Beams”, BE Thesis, QUT, Brisbane,
Australia.
Parsons, J. (2007b), “Finite Element Analysis of LiteSteel Beams Subject to Lateral
Distortional Buckling”, BE Thesis, QUT, Brisbane, Australia.
Pi, Y.-L. and Trahair, N. S. (1992a), “Prebuckling Deflections and Lateral Buckling
– Theory”, Journal of Structural Engineering, ASCE, Vol. 118, No. 11, pp. 2949-
2966.
Pi, Y.-L. and Trahair, N. S. (1992b), “Prebuckling Deflections and Lateral Buckling
– Applications”, Journal of Structural Engineering, ASCE, Vol. 118, No. 11, pp.
2967-2985.
Pi, Y.-L. and Trahair, N. S. (1995), “Lateral Buckling Strengths of Cold-Formed
Rectangular Hollow Section”, Thin-Walled Structures, Vol. 22, pp. 71-95.
Pi, Y.-L. and Trahair, N. S. (1997), “Lateral Distortional Buckling of Hollow Flange
Beams”, Journal of Structural Engineering, ASCE, Vol. 123, No. 6, pp.695-702.
Pi, Y. L., Put, B. M. and Trahair, N. S. (1998), “Lateral Buckling Strengths of Cold-
Formed Channel Section Beams”, Journal of Structural Engineering, ASCE,
Vol.124, No.10, pp.1182-1191.
Pi, Y.-L., Put, B. M. and Trahair, N. S. (1999), “Lateral Buckling Strengths of Cold-
Formed Z-Section Beams”, Thin-Walled Structures, Vol. 34, pp.65-93.
References
R-7
Pi, Y.-L., and Trahair, N. S. (2000), “Distortion and Warping at Beam Supports”,
Journal of Structural Engineering, ASCE, Vol.126, No.11, pp.1279-1287.
Pokharel, N. and Mahendran, M. (2006), “Experimental Study of the Member
Capacity of LSB Floor Joists Containing Web Openings”, Research Report No. 2,
Queensland University of Technology, Brisbane, Australia.
Put, M. B., Pi, Y. L. and Trahair, N. S. (1999), ‘Lateral Buckling Tests on Cold-
Formed Channel Beams’, Journal of Structural Engineering, ASCE, Vol.125, No.5,
pp. 532-539.
Put, M. B., Pi, Y. L. and Trahair, N. S. (1998), “Lateral Buckling Tests on Cold-
Formed Z-Beams”, Research Report No. R775, Department of Civil Engineering,
University of Sydney, Sydney, Australia.
Reck, H. P., Pekoz, T. and Winter, G. (1975), “Inelastic Strength of Cold-Formed
Steel Beams”, Journal of the Structural Division, ASCE, Vol. 101, No. 11, pp.2193-
2203.
Roger, C.A. and Hancock, G.J. (1996), “Ductility of G550 Sheet Steels in Tension
Elongation Measurements and Perforated Tests”, Research Report R735, Dept. of
Civil Engineering, University of Sydney, Sydney, Australia.
Rogers, C. A. and Schuster, R. M. (1997), “Flange/Web Distortional Buckling of
Cold-Formed Steel Sections in Bending”, Thin-Walled Structures, Vol. 27, No. 1,
pp. 13-29.
Seo, J. K., Anapayan, T. and Mahendran, M. (2008), “Initial Imperfection
Characteristics of Mono-Symmetric LiteSteel Beams for Numerical Studies”,
Proceedings of the Fifth International Conference on Thin-Walled Structures,
Brisbane, Australia, pp. 451-460.
Schafer, B.W. (2006), “Direct Strength Method Design Guide”, American Iron and
Steel Institute, Washington, D.C., USA.
References
R-8
Schafer, B. W. and Pekoz, T. (1998), “Computational Modelling of Cold-Formed
Steel: Characterising Geometric Imperfections and Residual Stresses”, Journal of
Construction Steel Research, Vol. 47, pp.193-210.
Shifferaw, Y. and Schafer, B. (2008), “Inelastic Bending Capacity in Cold-Formed
Steel Members”, Research Report, Thin-walled Structures Research Group,
Department of Civil Engineering, Johns Hopkins University.
Standards Australia (SA, 1996), AS/NZS 4600-1996, “Cold-Formed Steel
Structures”, Sydney, Australia.
Standards Australia (SA, 1998), AS 4100-1998, “Steel Structures”, Sydney, Australia. Standards Australia (SA, 2005), AS/NZS 4600-2005, “Cold-Formed Steel
Structures”, Sydney, Australia.
Standards Australia (SA, 2007), AS 1391, Methods for Tensile Testing of Metals”,
Sydney, Australia.
Takabatake, H. (1988), “Lateral Buckling of I Beams with Web Stiffeners and Batten
Plates”, International Journal of Solid Structures, Vol. 24, No. 10, pp.1003-1019.
Tebedge, N., Alpsten, G. A. and Tall, L. (1973), “Residual Stress Measurement by
the Sectioning Method”, Experimental Mechanics, Feb, pp.88-96.
Theodore, V. and Galambos, M. (1963), “Inelastic Lateral Buckling of Beams”,
Journal of the Structural Division, ASCE, Vol. 89, No. ST5, pp.217-241.
Timoshenko, S. P. and Gere, G. M. (1961), “Theory of Elastic Stability”, 2nd Edition,
McGraw-Hill Book Co. Inc., New York, USA.
Trahair, N. S. (1969), ‘Elastic Stability of Continuous Beams”, Journal of Structural
Engineering, ASCE, Vol. 95, No. 6, pp.1295-1312.
References
R-9
Trahair, N. S. and Bradford, M. A. (1991), “The Behaviour and Design of Steel
Structures”, Chapman and Hall, London.
Trahair, N. S. (1993), “Flexural Torsional Buckling of Structures”, E and FN Spon,
London.
Trahair, N. S. (1995), “Stability and Design of Steel Beams and Arches”,
Proceedings of the International Conference on Structural Stability and Design,
Balkema, Rotterdam, pp. 3-12.
Trahair, N. S. (1995a), “Elastic Lateral Distortional Buckling of Hollow Flange
Beams”, Investigation Report No S1009, Centre for Advanced Structural
Engineering, University of Sydney, Sydney, Australia.
Trahair, N. S. (1997), “Multiple Design Curves for Beam Lateral Buckling”,
Proceedings of the 5th International Colloquium on Stability and Ductility of Steel
Structures, Nagoya, Japan, pp.33-44.
Trahair, N. S. and Hancock, G. J. (2004), “Steel Member Strength by Inelastic
Lateral Buckling”, Journal of Structural Engineering, ASCE, Vol. 130, No. 1, pp.64-
69.
Xiao-ting, C., Long-yuan Li, and Roger, K. (2004), “The Effects of Warping Stress
on the Lateral Torsional Buckling of Cold-Formed Zed-Purlins”, Journal of Applied
Mechanics, ASME, Vol. 71, pp.742-744.
Yang, C. H., Beedle, L. S. and Johnston, B. G. (1952), “Residual Stress and the
Yield Strength of Steel Beams”, Welding Journal, Vol. 31, No. 4, pp. 205-229.
Yener, M., Pekoz, T. (1983), “Limit Design in Cold-Formed Steel”, Journal of
Structural Engineering, ASCE, Vol. 109, No. 9, pp.2033-2047.
Yener, M., Pekoz, T. (1985), “Partial Stress Redistribution in Cold-Formed Steel”,
Journal of Structural Engineering, ASCE, Vol. 111, No. 6, pp.1169-1185.
References
R-10
Yu, W. W. (2000), “Cold-Formed Steel Design”, 3rd edition, John Wiley & Sons Inc., New York, USA.
Yu, C. Schafer, B.W. (2006), “Distortional Buckling Tests on Cold-Formed Steel
Beams”, Journal of Structural Engineering, ASCE, Vol. 132, No. 4, pp. 515-528.
Yuan, Z, (2004), “Advanced Analysis of Steel Frame Structures Subjected to Lateral
Torsional Buckling Effects”, PhD Thesis, QUT, Brisbane, Australia.
Zhao, X. L., Hancock, G. J. and Trahair, N. S. (1995), “Lateral Buckling Tests of
Cold-Formed RHS Beams”, Journal of Structural Engineering, ASCE, Vol.121,
No.11, pp. 1565-1573.
Related Documents