Open Journal of Modern Hydrology, 2017, 7, 209-222 http://www.scirp.org/journal/ojmh ISSN Online: 2163-0496 ISSN Print: 2163-0461 DOI: 10.4236/ojmh.2017.73012 Jul. 26, 2017 209 Open Journal of Modern Hydrology Fish-Zooplankton—A Predator-Prey Relations as a Key Factor for the Design of Zooplankton Distribution Sampling Program in Lake Kinneret, Israel Moshe Gophen Migal-Scientific Research Institute, Kiryat Shmone, Israel Abstract Long-term data record of Kinneret Epilimnetic Zooplankton biomass distri- bution and fish stock assessment was analyzed. The objective is aimed at de- fining the representativeness of the present sampling stations distribution for the measure of the entire Lake Kinneret zooplankton biomass. Previous stu- dies documented the preeminence of temperature and fish predation impacts on zooplankton density: water temperature through growth rate trait and fish predation. Acoustic surveys indicated that fish shoals are mostly inhabiting the Peripheral region and much less the central part of the Kinneret pelagial. Due to fish zooplanktivory, densities of planktonic crustacean in the Pelagial periphery presented by 5 - 7 sampling stations are low. Nevertheless, large central lake area with higher densities of zooplankton biomass is presented by only one station. Therefore, stations average is incorrect as is total lake mea- sure. The average result as indicated presently as total zooplankton biomass in lake Kinneret is, therefore, underestimated. Two optional corrective sugges- tions are concluded: 1) Additional sampling stations in the central part of the Pelagial region; 2) Usage of station value of aerial coefficient (promoter). Keywords Kinneret, Zooplankton, Fish, Sampling Program 1. Introduction The long-term Record of Zooplankton, as part of the scientific routine compre- hensive limnological research of the Lake Kinneret ecosystem [1], was started by the team of Kinneret Limnological Laboratory, Israel Oceanographic and Lim- How to cite this paper: Gophen, M. (2017) Fish-Zooplankton—A Predator-Prey Rela- tions as a Key Factor for the Design of Zooplankton Distribution Sampling Pro- gram in Lake Kinneret, Israel. Open Jour- nal of Modern Hydrology, 7, 209-222. https://doi.org/10.4236/ojmh.2017.73012 Received: May 22, 2017 Accepted: July 23, 2017 Published: July 26, 2017 Copyright © 2017 by author and Scientific Research Publishing Inc. This work is licensed under the Creative Commons Attribution International License (CC BY 4.0). http://creativecommons.org/licenses/by/4.0/ Open Access

Welcome message from author
This document is posted to help you gain knowledge. Please leave a comment to let me know what you think about it! Share it to your friends and learn new things together.
Transcript

Open Journal of Modern Hydrology, 2017, 7, 209-222 http://www.scirp.org/journal/ojmh
ISSN Online: 2163-0496 ISSN Print: 2163-0461
DOI: 10.4236/ojmh.2017.73012 Jul. 26, 2017 209 Open Journal of Modern Hydrology
Fish-Zooplankton—A Predator-Prey Relations as a Key Factor for the Design of Zooplankton Distribution Sampling Program in Lake Kinneret, Israel
Moshe Gophen
Migal-Scientific Research Institute, Kiryat Shmone, Israel
Abstract Long-term data record of Kinneret Epilimnetic Zooplankton biomass distri-bution and fish stock assessment was analyzed. The objective is aimed at de-fining the representativeness of the present sampling stations distribution for the measure of the entire Lake Kinneret zooplankton biomass. Previous stu-dies documented the preeminence of temperature and fish predation impacts on zooplankton density: water temperature through growth rate trait and fish predation. Acoustic surveys indicated that fish shoals are mostly inhabiting the Peripheral region and much less the central part of the Kinneret pelagial. Due to fish zooplanktivory, densities of planktonic crustacean in the Pelagial periphery presented by 5 - 7 sampling stations are low. Nevertheless, large central lake area with higher densities of zooplankton biomass is presented by only one station. Therefore, stations average is incorrect as is total lake mea- sure. The average result as indicated presently as total zooplankton biomass in lake Kinneret is, therefore, underestimated. Two optional corrective sugges-tions are concluded: 1) Additional sampling stations in the central part of the Pelagial region; 2) Usage of station value of aerial coefficient (promoter). Keywords Kinneret, Zooplankton, Fish, Sampling Program
1. Introduction
The long-term Record of Zooplankton, as part of the scientific routine compre-hensive limnological research of the Lake Kinneret ecosystem [1], was started by the team of Kinneret Limnological Laboratory, Israel Oceanographic and Lim-
How to cite this paper: Gophen, M. (2017) Fish-Zooplankton—A Predator-Prey Rela-tions as a Key Factor for the Design of Zooplankton Distribution Sampling Pro-gram in Lake Kinneret, Israel. Open Jour-nal of Modern Hydrology, 7, 209-222. https://doi.org/10.4236/ojmh.2017.73012 Received: May 22, 2017 Accepted: July 23, 2017 Published: July 26, 2017 Copyright © 2017 by author and Scientific Research Publishing Inc. This work is licensed under the Creative Commons Attribution International License (CC BY 4.0). http://creativecommons.org/licenses/by/4.0/
Open Access

M. Gophen
DOI: 10.4236/ojmh.2017.73012 210 Open Journal of Modern Hydrology
nological Research Company Ltd., in 1969. The responsibility of the author of this paper was the Zooplankton study. Location of sampling stations was fixed within the routine sampling program (Figure 1): the principal station at the deepest point and 5 - 7 other stations were fixed according to bathymetrical su-tures at 15 - 25 m and one at 10 m depth. Consideration was given to the Epi-limnion thickness during stable Thermal stratification and the Thermocline is allocated at the shallowest depth. When Thermocline is allocated at the shallow-est depth, hypolimnetic samples could be collected only at the central (A) and 1 or 2 other deep stations if WL is high enough. The reason for allocation of sam-pling stations was defined by bathymetry (depth contour lines) (Figure 1). Ad-ditional requirements were considered for allocation of sampling station, such as the Jordan River inlet and outlet or sub-lacustrine salty spring inflows or the In-take of the National Water Carrier. Nevertheless, fish distribution was not con-cluded in the consideration of the sampling station spatial distribution. More- over, the study of fish distribution in Lake Kinneret and stock assessment by Acoustic Technology was initiated almost 20 years later [2] [3]. In this paper, the impact of the relationships between the zooplankton biomass density (LKDB 1969-2016) and fish assemblage distribution on sampling program design is discussed. Two periods were analyzed: 1) 1969-1985; 2) 1986-1995. The reason for the split between these two periods is technical: the formal data set of the 1st period include partial Hypolimnetic sampling and it was necessary to remove hypolimnetic data (below Thermocline); after 1985 due to financial limitations
Figure 1. Sampling stations (A)-(G) in lake Kinneret.

M. Gophen
DOI: 10.4236/ojmh.2017.73012 211 Open Journal of Modern Hydrology
reduction of sampling stations was essential. Daily Spatial and Bathymetrical distributions of zooplankton in Lake Kinneret were previously studied as well as zooplankton ecological trait and diurnal migrations were previously documented [1] [4]-[11]. The present paper represents a long term (1969-2015) analysis of the related distributions of fish and zooplankton.
2. Material and Methods
The zooplankton sampling procedure is given in Gophen [11] and Gophen and Azoulay [12]. The data in tables 1 & 2 illustrate the sampling capacity and statis-tical evaluation (mean) of zooplankton (Table 1-annually; Table 2-monthly) in Lake Kinneret during 1969-1985. The spatial definitions of the station locations are Periphery: C, G, F, K, D, L; Center: A; North: F, G, C; South: K, D, L (Figure 1). All data discussed in this paper were due to a similar water layer thickness (Epilimnion) and are, therefore, feasibly comparative. The documented reports of the original zooplankton raw date were recorded and computerized on tapes Table 1. Annual means (all stations, all dates) of Zooplankton Biomass and annual means of C.V. (see text) and total number of sampled stations, in Lake Kinneret during 1969- 1985.
Year All Stations Annual Mean Zooplankton
Biomass (g(ww)/m2)
Total Number of Sampled Stations@
Annual Mean C.V. ×10−2 (see text)*
1969 42 204 50
1970 51 131 50
1971 41 109 42
1972 33 132 43
1973 39 105 42
1974 36 125 47
1975 28 95 40
1976 32 85 38
1977 35 74 41
1978 33 74 36
1979 33 71 33
1980 36 73 45
1981 27 69 48
1982 32 75 39
1983 23 102 49
1984 25 84 34
1985 19 157 59
Grand Mean 33 Total Number of Sampled
Stations:1765 Grand Mean 43
@Each sampled Station is a subsample removed from mixed 7 samples collected; total samples collected at fixed depth during 1969-1985 was app. 1765 × 7 = 12,355. *C.V. = Coefficient of Variation.
M. Gophen
DOI: 10.4236/ojmh.2017.73012 212 Open Journal of Modern Hydrology
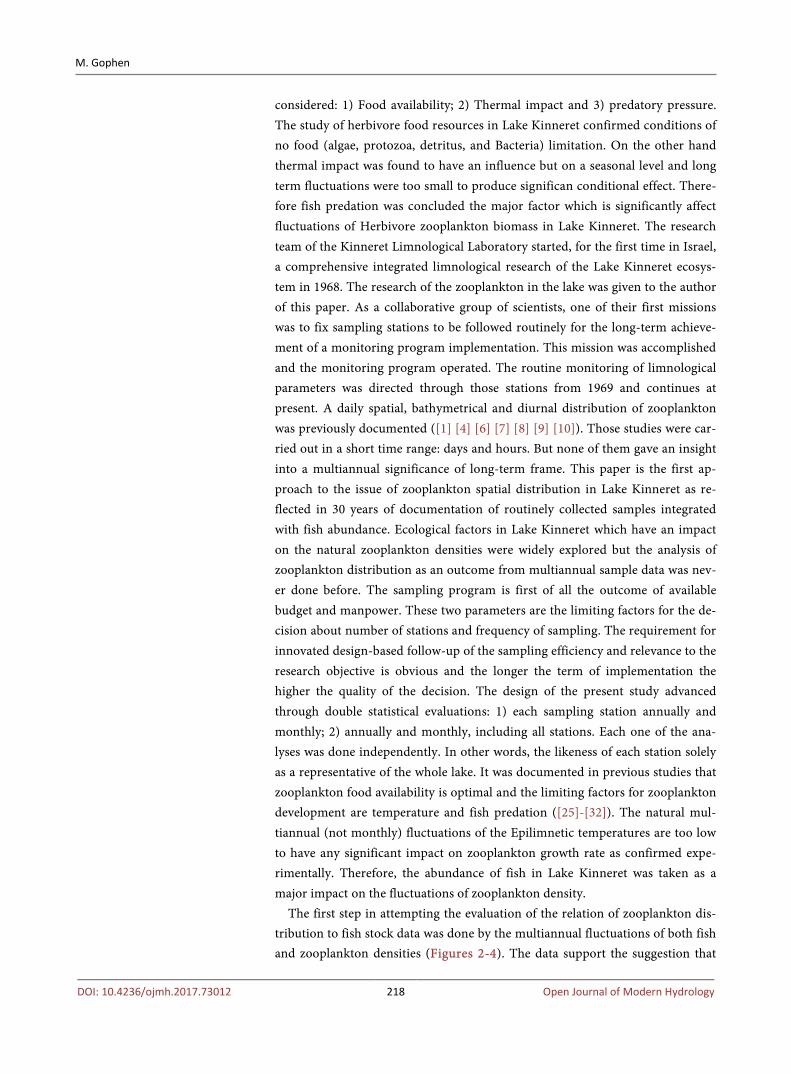
Table 2. Monthly means (all stations, all dates) of zooplankton biomass (g(ww)/m2) and C.V. values, during 1969-1985.
Month Biomass (g(ww)/m2) Mean C.V. ×10−2
1 40 50
2 43 45
3 48 44
4 38 48
5 40 51
6 32 44
7 22 36
8 26 40
9 28 41
10 23 36
11 17 38
12 32 45
Grand Mean 33 43
but only Epilimnetic data were filtered for the present study. Original zooplank-ton data presented here were converted into Biomass units (g(ww) per m2) [12]. The usage of biomass parameters of fish and its food consumption in an ecosys-tem with respect to long-term impacts is essential. Nevertheless, due to technical difficulties (calibration), fish data is not given by biomass but numerically. The biomass approach to the ecosystem long-term analysis of zooplankton-fish in-terrelation is essential because fish food (zooplankton) consumption rate is more biomass than numerically dependent. The study was restricted just to the Epi-limnion because neither zooplankton nor fish densities in the Hypolimnion are negligible.
Such a retrospective analysis of data, including numerous items, require suita-bility of statistical methods. Raw date was taped and mean values per station, per periodical intervals (monthly, annual), were computed using indicative parame-ters of Coefficient of Variation (C.V). CV parameter expresses the Relative Standard Variation (RSD), i.e. the Ratio of the Standard Deviation (SD) to the Mean (X). C.V. shows the extent of variability in relation to the Mean of the population:
C.V. SD X=
and:
C.V. 1 Low Variance< =
C.V. 1 High Variance> =
Comparative analysis between stations and periods was carried out by Test of significance known as “null hypothesis” which is assessing the strength of the evidence against it. The “null hypothesis” is a definition of “no effect” or “no

M. Gophen
DOI: 10.4236/ojmh.2017.73012 213 Open Journal of Modern Hydrology
difference”. The test of significance calculates the probability (p) of having an outcome at least as far from expected if “no difference” (null hypothesis; H0) was true, the computed value of p (probability) assuming H0 is true. Therefore, the smaller the p-value is, the stronger is the evidence against null hypothesis (H0) provided by the data. Practically, if p < 0.05, H0 is rejected, indicating that dif-ferences truly existed, and if p > 0.05, “no difference” is accepted.
3. Results
A summary of acoustic surveys carried out in Lake Kinneret during 1987-2005 [2] are presented in Figure 2 and in Figure 3 [3]. The documented data are due to the most (>95%) common fish size frequencies monitored as <40 - 60 dB Transducer Recordings. These size frequencies are mostly due to Sardine (Lav-nun; Mirogrex terraesanctae terraesanctae; Acanthobrama lissneri) and other
Figure 2. Acoustic surveys in Lake Kinneret during 1987-2005: Polynomial regression (p and r2 are given) between All Annual recordings of Fish number and years.
Figure 3. Acoustic surveys in lake Kinneret during 1987-2015: Polynomial regression (Confidence interval is indicated) between annual maximun rec-orded fish number and year.

M. Gophen
DOI: 10.4236/ojmh.2017.73012 214 Open Journal of Modern Hydrology
species fingerlings and sub-commercial body length. Larger size frequencies are due to sub-commercial and commercial fishes of about larger than 15 cm (Total Length) (TL). Zooplankton predation pressure is mostly operated by the small sizes including larvae, fingerlings of all species and adult Sardines [13]-[24]. Presently, some of the Tilapias partly consume zooplankton. The data about stock assessment of fish in Lake Kinneret is given in fish number qualified by Transducer, the acceptance of which is related to numerical density but not biomass. Calibration of dB to weight (Biomass) was partly carried out during 1987-2005 but not later. Therefore, the analysis of interrelationships between fish and zooplankton is parameterized as Biomass (Zoop.) Vs. Numerical (Fish) densities. Results of Polynomial regression shown in Figure 2 indicate a signifi-cant increase of fish densities (95% are small size frequencies) from the late 1980’s (App. 150 × 106/lake) to the early 2000’s (App. 900 × 106/lake). Detailed Data of Numerical Fish stock assessment based on Acoustic Survey [2] [3] do-cumented in the Annual Reports of The Kinneret Limnological Laboratory [2] [3] is given in Figure 1 and Figure 2. Fish stock assessment as recorded and calculated was monitored by two different Acoustic Systems with partial tem-poral overlap; therefore, results are presented in separate Figure 1 and Figure 2: prominent increase of the stock community of fish is indicated since the 2000’s. Information given in the Annual Reports of LKDB [1] [2] [3] clearly indicates that the highest densities of small size fishes (>40 - <60 dB) were recorded in the peripheral regions of the lake. Fish assemblages in Lake Kinneret inhabit mostly the peripheral (shallower) zones of the lake. The maps of fish density distribu-tion in Lake Kinneret confirm their very diluted density and they are mostly ab-sent in the pelagic zone of the central and deepest part of the lake [2] [3]. The long-term (1969-2015) record of zooplankton biomass (Figure 4, and [1]) prominently confirms a higher level during 1969-1980 and a decline later. The
Figure 4. Annual Means of all stations (A)-(G) of zooplankton biomass (g(ww)/m2). In the epilimnion of lake Kinneret during 1970-1995.

M. Gophen
DOI: 10.4236/ojmh.2017.73012 215 Open Journal of Modern Hydrology
lake (all stations) averages of zooplankton biomass during the two periods 1970-1982 and 1983-1995 were 35 (SD 6) and 21 (SD 2) g(ww)/m2, respectively. Consequently, there is an overlap between the time of the decline of zooplankton biomass and the time the fish stock increase is confirmed. As a result of these observations, a periodical and spatial (station locations) analysis of zooplankton biomass was carried out. Results shown in Figure 5 indicate higher biomass of zooplankton in the central zone than in the peripheral stations of the lake and higher biomass in the Northern region compared to the Southern zone during 1969-1985. The probability value (p) that resulted from a comparative t-test (p < 0.05) between North and South stations indicated clear dissimilarity between those two lake regions. Correlation coefficients (r2) between monthly means of zooplankton biomass in all stations (each station Vs. all others) and grand total average were varied within the range of 0.4 - 0.9. Those values of correlation and others shown in Figure 6 indicate mutual ecological parameters other than fish predation which has an impact on zooplankton development. Fractional Poly-nomial Regressions of station A vs. all other stations, as well as northern Vs southern stations, are significantly similar (left and lower panels Figure 6). Nev-ertheless, results shown in the upper-left panel (Figure 6) indicate the highest biomass in the central region and higher biomass in the north than in the south-ern parts of the lake. For the indication of temporal effect, a periodical compara-tive study of individual stations was carried out (Figures 7-9): Stations D and K (south) (Figure 7), Station A (center) and station G (north) (Figure 8), as well as Stations D, G, and K, (Figure 9 lower left panel) confirm higher biomass in 1969-1985 than in 1986-1995. Moreover, the zooplankton biomass as averaged for the whole lake (Figure 9 upper left panel) and separately (1970-1982 and 19873-1995) clearly indicates the decline of zooplankton biomass from mid-1980’s and onwards. Periodical (1:1972-1994; 2: 1995-2005) Linear regres-sion was tested between monthly lake means of zooplankton biomass (g(ww)/ m2: LKDB [1]) record and fish stock (106 fishes /lake; [2] [3]). The result indicates
Figure 5. Monthly mean of Epilimnetic zooplankton biomass (g(ww)/m2) during 1969-1985, in the Peripherial stations: South-ern-L, K, D; Northern-C, G, F. And A (Central). Left: A-Blue (upper), Peripherial-Brown (lower); Wright: Southern-Blue (lower), Northern-Brown (upper).

M. Gophen
DOI: 10.4236/ojmh.2017.73012 216 Open Journal of Modern Hydrology
Figure 6. Monthly mean of Epilimnetic zooplankton biomass (g(ww)/m2) during 1969-1985; Left: in the Peripherial stations: Southern-L, K, D; Northern-C, G, F. And in A (Central); and, Wright: Fractional Polynomial Regression of Station A Vs. all Peri-pherial stations. Lower: Northern (C, G, F) Vs. Southern (L, K, D).
Figure 7. Monthly mean of epilimnetic zooplankton biomass (g(ww)/m2) during 2 periods: 1969-1985 (Blue) and 1986-1995 (Brown) in two southern peripherial stations: left: station D and Wright station K.
non-significant (r2 = 0.0004) and significant (r2 = 0.5325) relations for the earlier and later periods, respectively. Diet composition for Bleak fishes of all ages in Lake Kinneret comprised mostly of Zooplankton. Feeding competition does not exist if food availability is not limited as occurred in the first period and conse-quently prey-predator stocks are not statistically related. On the contrary, during

M. Gophen
DOI: 10.4236/ojmh.2017.73012 217 Open Journal of Modern Hydrology
Figure 8. Monthly mean of epilimnetic zooplankton biomass (g(ww)/m2) during 2 periods: 1969-1985 (Blue) and 1986-1995 (Brown): Left: Station A (Central); Wright: Station G (Peripheral North).
Figure 9. Zooplankton biomass (g(ww)/m2). Wright: monthly means (all stations) of Epilimnetic zooplankton during two periods: Blue-1970-1982, Brown-1983-1995; Left: Monthly means in Peripherial Stations: Blue—1969-1985; Brown—1986-1995.
the 1995-2005 period, zooplankton biomass significantly declined and fish stock (mostly Bleaks) increased. It is likely that food source became limited and com-petition forcefully affected, making prey-predator relations significant in the second period.
4. Discussion
The inverse relation between Zooplankton Biomass and fish (mostly Bleaks) densities was widely documented in previous studies. An increase of fish densi-ties in the lake started from 1998 (Figure 2) when zooplankton (mostly prey fa-voured Cladocerans) started a decline [30], Figure 3). Moreover, during 1970- 1993 a significant high harvest (app. 1000 tons per annum) of bleaks was rec-orded. Probably reflecting a productive stock biomass producing intensive pres-sure on zooplankton which continuously declined. Nevertheless optimal condi-tions for zooplankton growth dynamics was indicated except fish predation. Three major factors affecting Zooplankton ecophysiology in Lake Kinneret were
M. Gophen
DOI: 10.4236/ojmh.2017.73012 218 Open Journal of Modern Hydrology
considered: 1) Food availability; 2) Thermal impact and 3) predatory pressure. The study of herbivore food resources in Lake Kinneret confirmed conditions of no food (algae, protozoa, detritus, and Bacteria) limitation. On the other hand thermal impact was found to have an influence but on a seasonal level and long term fluctuations were too small to produce significan conditional effect. There-fore fish predation was concluded the major factor which is significantly affect fluctuations of Herbivore zooplankton biomass in Lake Kinneret. The research team of the Kinneret Limnological Laboratory started, for the first time in Israel, a comprehensive integrated limnological research of the Lake Kinneret ecosys-tem in 1968. The research of the zooplankton in the lake was given to the author of this paper. As a collaborative group of scientists, one of their first missions was to fix sampling stations to be followed routinely for the long-term achieve-ment of a monitoring program implementation. This mission was accomplished and the monitoring program operated. The routine monitoring of limnological parameters was directed through those stations from 1969 and continues at present. A daily spatial, bathymetrical and diurnal distribution of zooplankton was previously documented ([1] [4] [6] [7] [8] [9] [10]). Those studies were car-ried out in a short time range: days and hours. But none of them gave an insight into a multiannual significance of long-term frame. This paper is the first ap-proach to the issue of zooplankton spatial distribution in Lake Kinneret as re-flected in 30 years of documentation of routinely collected samples integrated with fish abundance. Ecological factors in Lake Kinneret which have an impact on the natural zooplankton densities were widely explored but the analysis of zooplankton distribution as an outcome from multiannual sample data was nev-er done before. The sampling program is first of all the outcome of available budget and manpower. These two parameters are the limiting factors for the de-cision about number of stations and frequency of sampling. The requirement for innovated design-based follow-up of the sampling efficiency and relevance to the research objective is obvious and the longer the term of implementation the higher the quality of the decision. The design of the present study advanced through double statistical evaluations: 1) each sampling station annually and monthly; 2) annually and monthly, including all stations. Each one of the ana-lyses was done independently. In other words, the likeness of each station solely as a representative of the whole lake. It was documented in previous studies that zooplankton food availability is optimal and the limiting factors for zooplankton development are temperature and fish predation ([25]-[32]). The natural mul-tiannual (not monthly) fluctuations of the Epilimnetic temperatures are too low to have any significant impact on zooplankton growth rate as confirmed expe-rimentally. Therefore, the abundance of fish in Lake Kinneret was taken as a major impact on the fluctuations of zooplankton density.
The first step in attempting the evaluation of the relation of zooplankton dis-tribution to fish stock data was done by the multiannual fluctuations of both fish and zooplankton densities (Figures 2-4). The data support the suggestion that

M. Gophen
DOI: 10.4236/ojmh.2017.73012 219 Open Journal of Modern Hydrology
zooplankton decline was due to Fish stock enhancement. The relevance of the measured fish stock size comprises from >95% of the recorded targets to small and sub-commercial body sizes which are known as zooplanktivores. Figures 2-4 confirm the inverse relation between Zooplankton density and the docu-mented fish stock.
The second step of the study was an attempt aimed at spatial allocating of fish shoals and zooplankton population. The acoustic surveys clearly confirmed as-sembling of fish flocks in the peripheral parts of the Kinneret Pelagial. It is, therefore, suggested that zooplanktivory pressure is more intensive in the peri-pheral stations and lower in the central part of the lake. Consequently, zoop-lankton biomass is higher in the central parts of the Kinneret pelagial and lower in the peripheral zones. In all stations zooplkankton biomass in winter is higher than in summer. It is the result of the lower energy investment in winter by zooplankton and higher reproduction efficiency [12] [33] [34] together with the lower feeding rate of the fish.
The next step forward in the investigation was due to the dissimilarity of zooplankton density found between the northern and southern parts. Water Current and water-mass moving directions in Lake Kinneret were widely studied and documented as well as the distribution of the Jordan River input waters in the lake [35] [36]. The direction of the flow of the Jordan waters is mostly from the river mouth to the west interlocked in the dominant direction pattern which is anticlockwise. It is suggested that such a current pattern enhances higher den-sities of Jordan River fluxed suspended particles in the northern stations. Reduc-tion of water clarity by the enhanced concentration of suspended matter also reduces prey (zooplankters) visibility and consequently suppress fish zooplank-tivory [37]. The suggested lower concentration of suspended matter in the southern stations (Figure 1) probably enhances zooplankter vulnerability. The outcome is lower zooplankton biomass in the southern part of the Kinneret pe-lagial. The long-term data record of zooplankton biomass and fish distribution in Lake Kinneret clarified that the previous results are an underestimation. Mul-ti-variable complicated modeling attempts that were carried out aimed at a quantitative chart of energy flow pattern in the Kinneret ecosystem [14] [38] re-vealed underestimated zooplankton biomass values [31]. The previous data of zooplankton biomass density are based on sampled regions where fish density is high and, therefore, zooplankton predation is intensive. Weighting averages of 7 stations (or even less) where only one of them (Station A, central lake zone) represent most of the Kinneret Epilimnion is fairly unbalanced. Fish density in the central part of the Kinneret Epilimnion is low and the zooplankton biomass is, therefore, high. For a fairly justified representation of the entire lake value, additional sampling stations in the central zone are required. Conclusively, it is therefore suggested to distribute same number of sampling stations for zoop-lankton study in the peripherial and in the central parts of the Kinneret Pellagial. An alternative option is to give each station a value of aerial coefficient (promo-

M. Gophen
DOI: 10.4236/ojmh.2017.73012 220 Open Journal of Modern Hydrology
ter) for the calculation of total lake biomass.
5. Summary and Conclusions
The grand total average of zooplankton biomass in all sampling stations (A, C, F, D, G, K, L) indicates its low level in the peripheral stations and its even lower le-vels in the southern region of the lake. Conclusively, the design of sampling program aimed at representing the entire Kinneret Pelagial Epilimnion should include at least one station in the southern part (stations D, K, L). If not, the lake mean value will be higher than reality. Furthermore, if sampling program elimi-nates the central zone (station A) the resulting value will be lower than real.
A future suggestion aimed at improvement of zooplankton sampling design is leaving 3 northern and 3 southern peripheral stations and an additional sam-pling station in the central region south of station A where the depth is about 30 meters.
References [1] LKDB-1969-2015, Kinneret Limnological Laboratory, IOLR, Annual Reports.
[2] Walline, P. (1987-2005) Chapter: Fish Communities Survey, In: LKDB, Annual Re-ports.
[3] Ostrovsky, I. (2006-2015) Chapter: Fish Communities Survey. In: LKDB, Annual Reports.
[4] Gophen, M. (1972) Zooplankton Distribution in Lake Kinneret (Israel) 1969-1970. Israel Journal of Zoology, 21, 17-27.
[5] Gophen, M. (1979) Bathymetrical Distribution and Diurnal Migration of Zoop-lankton in Lake Kinneret (Israel) with Particular Emphasis on Mesocyclops leuckar-ti (claus). Hydrobiologia, 64, 199-208. https://doi.org/10.1007/BF00020520
[6] Kalikhman, I., Walline, P. and Gophen, M. (1992) Simultaneous Patterns of Tem-perature, Oxygen, Zooplankton and Fish Distribution in Lake Kinneret, Israel. Freshwater Biology, 28, 337-347. https://doi.org/10.1111/j.1365-2427.1992.tb00592.x
[7] Kalikhman, Y., Yacobi, Y.Z. and Gophen, M. (2003) Distribution Fields for Aquatic Ecosystem Components: Method of Optimization of Correlation Zones. ICES Jour- nal of Marine Science, 60, 1-10. https://doi.org/10.1006/jmsc.2002.1320
[8] Yacobi, Y.Z., Kalikhman, I., Gophen, M. and Walline, P. (1993) The Spatial Distri-bution of Temperature, Oxygen, Plankton and Fish Determined Simultaneously in Lake Kinneret, Israel. Journal of Plankton Research, 15, 589-601. https://doi.org/10.1093/plankt/15.6.589
[9] Easton, J. and Gophen, M. (2003) Diel Variations in the Vertical Distribution of Fish and Plankton in Lake Kinneret: A 24-h Study of Ecological Overlap. Hydrobi-ologia, 491, 91-100. https://doi.org/10.1023/A:1024466600402
[10] Gophen, M. (1978) Errors in the Estimation of Recruitment of Early Stages of Me-socyclops leuckarti (Claus) Caused by the Diurnal Periodicity of Egg Production. Hydrobiologia, 57, 59-64. https://doi.org/10.1007/BF00018628
[11] Gophen, M. (1978) The Productivity of Mesocyclops leuckarti (Claus) in Lake Kin-neret (Israel). Hydrobiologia, 60, 17-22. https://doi.org/10.1007/BF00018683
[12] Gophen, M. and Azoulay, B. (2002) The Trophic Status of Zooplankton Communi-

M. Gophen
DOI: 10.4236/ojmh.2017.73012 221 Open Journal of Modern Hydrology
ties in Lake Kinneret (Israel). Verhandlungen des Internationalen Verein Limnolo-gie, 28, 836-839.
[13] Gophen, M. and Landau, R. (1977) Trophic Interactions between Zooplankton and Sardine (Mirogrex terraesanctae) Populations in Lake Kinneret, Israel. Oikos, 29, 166-174. https://doi.org/10.2307/3543309
[14] Serruya, C., Gophen, M. and Pollingher, U. (1980) Lake Kinneret: Carbon Flow Patterns and Ecosystem Management. Archiv für Hydrobiologie, 88, 265-302.
[15] Drenner, R.W., Vinyard, G.L., Gophen, M. and McComas, S.R. (1982) Feeding Be-haviour of the Cichlid Sarotherodon galilaeus: Selective Predation on Lake Kinneret Zooplankton. Hydrobiologia, 87, 17-20. https://doi.org/10.1007/BF00016658
[16] Gophen, M., Drenner, R.W. and Vinyard, G.L. (1983) Cichlid Stocking and the De-cline of the Galilee St. Peter’s Fish (Sarotherodon galilaeus) in Lake Kinneret (Israel). Canadian Journal of Fisheries and Aquatic Sciences, 40, 983-986. https://doi.org/10.1139/f83-124
[17] Gophen, M. (1985) Effect of Fish Predation on Size Class Distribution of Cladoce-rans in Lake Kinneret. Verhandlungen des Internationalen Verein Limnologie, 22, 3104-3108.
[18] Gophen, M. and Pollingher, U. (1985) Relationships between Food Availability, Fish Predation and the Abundance of the Herbivorous Zooplankton Community in Lake Kinneret. Archiv für Hydrobiologie-Beiheft Ergebnisse der Limnologie, 21, 397-405.
[19] Vinyard, G.L., Drenner, R.W., Gophen, M., Pollingher, U., Winkleman, D.L. and Hambright, K.D. (1988) An Experimental Study of the Plankton Community Im-pacts of Two Filter-Feeding Cichlids, The Galilee Saint Peter’s Fish (Sarotherodon galilaeus) and Blue Tilapia (Tilapia aurea). Canadian Journal of Fisheries and Aqua-tic Sciences, 45, 685-690. https://doi.org/10.1139/f88-082
[20] Landau, R., Gophen, M. and Walline, P. (1988) Larval Mirogrex terraesanctae (Cy-prinidae) of Lake Kinneret (Israel): Growth Rate, Plankton Selectivities, Consump-tion Rates and Interactions with Rotifers. Hydrobiologia, 169, 91-106. https://doi.org/10.1007/BF00007937
[21] Gophen, M. and Threlkeld, S.T. (1989) An Experimental Study of Zooplankton Consumption by the Lake Kinneret Sardine. Archiv fur Hydrobiologie, 115, 91-95.
[22] Azoulay, B. and Gophen, M. (1992) Feeding Habits of Larval Mirograx terraesanc-tae (Steinitz 1952) in Lake Kinneret (Israel): I. Field Study. Hydrobiologia, 246, 243- 249. https://doi.org/10.1007/BF00005701
[23] Azoulay, B. and Gophen, M. (1992) Feeding Habits of Larval Mirograx terraesanc-tae (Steinitz 1952) in Lake Kinneret (Israel): II. Experimental Study. Hydrobiologia, 246, 251-258. https://doi.org/10.1007/BF00005702
[24] Easton, J. and Gophen, M. (2002) Trophic Relations between Zooplankton and Bleaks (Acanthobrama spp.) in Lake Kinneret (Israel). Verhandlungen des Interna-tionalen Verein Limnologie, 28, 1258-1261.
[25] Gophen, M. (1976) Temperature Dependence of Food Intake, Ammonia Excretion and Respiration in Ceriodaphnia reticulata (Jurine) (Lake Kinneret, Israel). Fresh-water Biology, 6, 451-455.
[26] Gophen, M. (1976) Temperature Effect on Lifespan, Metabolism and Development time of Mesocyclops leuckarti (Claus). Oecologia, 25, 271-277. https://doi.org/10.1007/BF00345104
[27] Gophen, M. (1992) Long-Term Changes of Plankton-Communities in Lake Kinne-ret, Israel. Asian Fisheries Science, 5, 291-302.

M. Gophen
DOI: 10.4236/ojmh.2017.73012 222 Open Journal of Modern Hydrology
[28] Gophen, M. (2013) The Impact of Temperature Elevation on the Decline of Cyclo-poid Population in Lake Kinneret (Israel). The Journal of Ecology Photon, 107, 223-239.
[29] Gophen, M. (2015) Thermal Preference by Mesocyclops ogunnus (Onabamiro 1957). Open Journal of Ecology, 5, 15-21. https://doi.org/10.4236/oje.2015.52002
[30] Gophen, M. (2015) Ecophysiology of Lake Kinneret (Israel) Zooplankton. Earth & Environmental Sciences, 5, 187-198. https://doi.org/10.4236/oje.2015.55016
[31] Gophen, M. (2016) Scientific Values Are Crucial for Lake Kinneret Management Design: Test Cases. Engineering Management Research, 5, 12-21. https://doi.org/10.5539/emr.v5n1p12
[32] Gophen, M. (2017) Search for Environmental Causation of the Cladoceran Dynam-ics in Lake Kinneret, Israel. Open Journal of Modern Hydrology, 7, 90-104. https://doi.org/10.4236/ojmh.2017.72005
[33] Gophen, M. (1978) Zooplankton. In: Serruya, C., Ed., Lake Kinneret, Monographiae Biologicae, Vol. 32, Dr. W. Junk Publishers, The Hague, 297-311. https://doi.org/10.1007/978-94-009-9954-1_11
[34] Gophen, M. (1981) Metabolic Activity of Herbivorous Zooplankton in Lake Kinne-ret (Israel) during 1972-1977. Journal of Plankton Research, 3, 15-24. https://doi.org/10.1093/plankt/3.1.15
[35] Serruya, S. (1974) The Mixing Pattern of the Jordan River in Lake Kinneret. Lim-nology and Oceanography, 19, 175-181. https://doi.org/10.4319/lo.1974.19.2.0175
[36] Serruya, S. (1978) Chapter: Water Motions. In: Serruya, C. Ed., Lake Kinneret, Mo-nographiae Biologicae, Vol. 32, Junk Publishers, The Hgue, Boston, London, 167- 172. https://doi.org/10.1007/978-94-009-9954-1
[37] Gophen, M. (2015) The Impact of Turbidity on Zooplanlkton Densities in Lake Kinneret (Israel). Open Journal of Modern Hydrology, 5, 87-94.
[38] Walline, P., Pizanty, S., Gophen, M. and Berman, T. (1990) The Ecosystem of Lake Kinneret, Israel. ICES.C.M. 1990/L:39, 1-8.
Submit or recommend next manuscript to SCIRP and we will provide best service for you:
Accepting pre-submission inquiries through Email, Facebook, LinkedIn, Twitter, etc. A wide selection of journals (inclusive of 9 subjects, more than 200 journals) Providing 24-hour high-quality service User-friendly online submission system Fair and swift peer-review system Efficient typesetting and proofreading procedure Display of the result of downloads and visits, as well as the number of cited articles Maximum dissemination of your research work
Submit your manuscript at: http://papersubmission.scirp.org/ Or contact [email protected]
Related Documents