First-principles calculations of optical and magneto-optical properties of Ga 1x Mn x As and MnAs M. Amft , T. Burkert 1 , B. Sanyal, P.M. Oppeneer Department of Physics and Materials Science, Uppsala University, Box 530, S-751 21 Uppsala, Sweden article info Article history: Received 9 April 2009 Received in revised form 12 June 2009 Accepted 17 June 2009 PACS: 75.50.Pp 78.20.Ls 71.20.b Keywords: Half-metallic ferromagnet Diluted magnetic semiconductor (DMS) Magneto-optical Kerr effect (MOKE) Magnetic circular dichroism (MCD) abstract We present a first-principles density-functional investigation of the optical and magneto-optical properties of Mn x Ga 1x As (with x ¼ 0; 0:0625, and 1) systems. Our calculated dielectric function, magneto-optical Kerr effect, and magnetic circular dichroism spectra agree reasonably well with existing experimental results. A comparison of the optical and magneto-optical spectra of MnAs in the naturally occurring hexagonal phase and in the cubic zinc-blende structure is made. The differences in the spectral properties of these two phases could aid detection of MnAs in the zinc-blende structure. & 2009 Elsevier B.V. All rights reserved. 1. Introduction Transition metal doped semiconductors are considered to be very interesting due to their possible applications in semicon- ductor spintronic devices [1]. The quest for a suitable, doped semiconducting material showing room temperature ferromag- netism is continuing. Mn-doped GaAs [2] is perhaps the most studied system among the whole class of diluted magnetic semiconductors (DMS) exhibiting ferromagnetism. Despite its low Curie temperature of around 170K, it has been investigated in quite some detail regarding its electronic structure and magnet- ism. Besides III–V DMS, there are also numerous reports of room- temperature ferromagnetism in II–VI DMS, e.g., in Co doped ZnO [3], but there is no unanimous consensus regarding the ferro- magnetism due to the occurrence of defects and secondary crystal phases in the samples. Mn-doped GaAs is a much better under- stood system since the effects of prominent defects, e.g., As antisites and interstitial Mn, have already been thoroughly studied (Ref. [2] and references therein). Some of the ferromagnetic DMS have been reported to show interesting magneto-optical behavior [4–11]. From an application point of view, materials with large magneto-optical effects are very appealing. Such materials can, for example, be used as optical isolators, which are important components for optical fiber networks. Also, for a theoretical understanding of the electronic structure and the magnetic interactions, optical and magneto- optical experiments are important. Magneto-optical measure- ments on Mn-doped GaAs have shown promising results [8–11]. These experiments have been done not only for DMS, but also for their counterpart at full doping, viz., half-metallic ferromagnets in zinc-blende (ZB) structure [12,13]. These compounds are very interesting as they show 100% spin polarization due to their half- metallic character. Ab initio calculations of magneto-optical effects of DMS are not abundant in the literature due to the challenging, high-precision, numerical computations. The challenges include, for instance, relativistic effects in band structure calculations and precise integration in the Brillouin zone over a large number of k-points. Recently, two works were reported [14,15] on studies of Mn-doped GaAs by density-functional full-potential linearized augmented plane wave calculations. In the paper by Stroppa et al. [14],a relatively large concentration of Mn was considered, in order to analyze the relationship between the band structure and the magneto-optical Kerr effect (MOKE). Picozzi et al. [15] studied the magneto-optics for both substitutional and interstitial Mn in GaAs. According to the latter calculations, the Kerr spectra was in better agreement with experiments in presence of interstitial Mn. ARTICLE IN PRESS Contents lists available at ScienceDirect journal homepage: www.elsevier.com/locate/physb Physica B 0921-4526/$ - see front matter & 2009 Elsevier B.V. All rights reserved. doi:10.1016/j.physb.2009.06.141 Corresponding author. Tel./fax: +46184715868. E-mail address: [email protected] (M. Amft). 1 Present address: Ericsson AB, S-164 83 Stockholm, Sweden. Physica B 404 (2009) 3782–3788

Welcome message from author
This document is posted to help you gain knowledge. Please leave a comment to let me know what you think about it! Share it to your friends and learn new things together.
Transcript
ARTICLE IN PRESS
Physica B 404 (2009) 3782–3788
Contents lists available at ScienceDirect
Physica B
0921-45
doi:10.1
� Corr
E-m1 Pr
journal homepage: www.elsevier.com/locate/physb
First-principles calculations of optical and magneto-optical propertiesof Ga1�xMnxAs and MnAs
M. Amft �, T. Burkert 1, B. Sanyal, P.M. Oppeneer
Department of Physics and Materials Science, Uppsala University, Box 530, S-751 21 Uppsala, Sweden
a r t i c l e i n f o
Article history:
Received 9 April 2009
Received in revised form
12 June 2009
Accepted 17 June 2009
PACS:
75.50.Pp
78.20.Ls
71.20.�b
Keywords:
Half-metallic ferromagnet
Diluted magnetic semiconductor (DMS)
Magneto-optical Kerr effect (MOKE)
Magnetic circular dichroism (MCD)
26/$ - see front matter & 2009 Elsevier B.V. A
016/j.physb.2009.06.141
esponding author. Tel./fax: +46 18 4715868.
ail address: [email protected] (M. Amft
esent address: Ericsson AB, S-164 83 Stockho
a b s t r a c t
We present a first-principles density-functional investigation of the optical and magneto-optical
properties of MnxGa1�xAs (with x ¼ 0;0:0625, and 1) systems. Our calculated dielectric function,
magneto-optical Kerr effect, and magnetic circular dichroism spectra agree reasonably well with
existing experimental results. A comparison of the optical and magneto-optical spectra of MnAs in the
naturally occurring hexagonal phase and in the cubic zinc-blende structure is made. The differences in
the spectral properties of these two phases could aid detection of MnAs in the zinc-blende structure.
& 2009 Elsevier B.V. All rights reserved.
1. Introduction
Transition metal doped semiconductors are considered to bevery interesting due to their possible applications in semicon-ductor spintronic devices [1]. The quest for a suitable, dopedsemiconducting material showing room temperature ferromag-netism is continuing. Mn-doped GaAs [2] is perhaps the moststudied system among the whole class of diluted magneticsemiconductors (DMS) exhibiting ferromagnetism. Despite itslow Curie temperature of around 170 K, it has been investigated inquite some detail regarding its electronic structure and magnet-ism. Besides III–V DMS, there are also numerous reports of room-temperature ferromagnetism in II–VI DMS, e.g., in Co doped ZnO[3], but there is no unanimous consensus regarding the ferro-magnetism due to the occurrence of defects and secondary crystalphases in the samples. Mn-doped GaAs is a much better under-stood system since the effects of prominent defects, e.g., Asantisites and interstitial Mn, have already been thoroughlystudied (Ref. [2] and references therein).
Some of the ferromagnetic DMS have been reported to showinteresting magneto-optical behavior [4–11]. From an application
ll rights reserved.
).
lm, Sweden.
point of view, materials with large magneto-optical effects arevery appealing. Such materials can, for example, be used as opticalisolators, which are important components for optical fibernetworks. Also, for a theoretical understanding of the electronicstructure and the magnetic interactions, optical and magneto-optical experiments are important. Magneto-optical measure-ments on Mn-doped GaAs have shown promising results [8–11].These experiments have been done not only for DMS, but also fortheir counterpart at full doping, viz., half-metallic ferromagnets inzinc-blende (ZB) structure [12,13]. These compounds are veryinteresting as they show 100% spin polarization due to their half-metallic character.
Ab initio calculations of magneto-optical effects of DMS are notabundant in the literature due to the challenging, high-precision,numerical computations. The challenges include, for instance,relativistic effects in band structure calculations and preciseintegration in the Brillouin zone over a large number of k-points.Recently, two works were reported [14,15] on studies of Mn-dopedGaAs by density-functional full-potential linearized augmentedplane wave calculations. In the paper by Stroppa et al. [14], arelatively large concentration of Mn was considered, in order toanalyze the relationship between the band structure and themagneto-optical Kerr effect (MOKE). Picozzi et al. [15] studiedthe magneto-optics for both substitutional and interstitial Mn inGaAs. According to the latter calculations, the Kerr spectra was inbetter agreement with experiments in presence of interstitial Mn.
ARTICLE IN PRESS
M. Amft et al. / Physica B 404 (2009) 3782–3788 3783
It is worthwhile mentioning that the presence of interstitial Mnaffects not only the hole concentration, but also decreases theeffective ferromagnetic coupling as the interstitial Mn atomscouple antiferromagnetically to the substitutional Mn atoms. Inorder to model a realistic situation, clusters containing substitu-tional and interstitial Mn atoms [16] should be taken into accountin the calculations of magneto-optical properties. But this wouldbe an enormously computer intensive calculation and may beeven beyond the scope of available computational facilities.
A systematic evolution of optical and magneto-optical proper-ties of DMS systems due to doping is not available in theliterature. The present work is motivated by this and starting frompure GaAs semiconductor, we investigate the change in propertiesdue to Mn doping for a dilute concentration as well as for fulldoping. The paper is organized in the following way: first, wedescribe the computational methods. In the results section, wefirst show the optical properties of pure GaAs and, subsequently,present the optical and magneto-optical properties of GaAs with6.25% Mn doping. After that we present electronic structuresof the MnAs system in both the cubic zinc-blende and hexagonalstructures and investigate the magneto-optical properties ofMnAs in these two phases in detail.
2. Computational methods
Magnetic spectroscopy, with its variety of different experi-mental setups, is a sensitive tool to investigate the electronicstructure of magnetic materials [17]. In this work we concentrateon two widely studied magneto-optical effects: the intrinsic polarmagneto-optical Kerr effect (P-MOKE) and the magnetic circulardichroism (MCD). Both effects, being linear in the magnetization,are to some extent complementary as P-MOKE is a polarizationanalysis measured in reflection, whereas MCD is an intensitymeasurement in transition. The Kohn–Sham density-functionaltheory (DFT) provides a theoretical framework for an accuratecalculation of ground state properties. A priori, excited stateproperties such as optical and magneto-optical spectra are notdescribed by the DFT. The appropriate starting point for excita-tion spectra is the Dyson equation for quasi-particle excitations,which contains the non-local, non-hermitian self-energy operatorSðr; r0; eÞ. If the DFT is used to compute excitation spectra, thequasi-particle excitation energies are consequently approximatedby the Kohn–Sham single-particle energies, which impliesSðr; r0; eÞ � dðr � r0ÞvxcðrÞ, i.e., the self-energy is replaced by theKohn–Sham exchange correlation potential vxc. Numerical inves-tigations showed that this approximation is surprisingly accurate,particularly for energies e close to the Fermi energy [18].Moreover, the Fermi level itself is correctly given by the DFT[19]. Consequently, the Kohn–Sham spectrum provides a goodapproximation for the quasi-particle spectrum of weakly corre-lated materials.
The Kohn–Sham optical spectrum can be evaluated by meansof the Kubo linear response theory [20], which provides anexpression for the complex optical conductivity tensor sijðoÞ interms of single-particle band energies and matrix elements ofmomentum operators. Relaxation processes can be taken intoaccount by including a (phenomenological) relaxation timet ¼ d�1, which was treated as state and energy independent inour approach [17,21].
A crucial point of a MOKE and MCD calculation is an accurateevaluation of the transition matrix elements and the k-integrationof the Brillouin zone (BZ). The latter can be achieved by theso-called analytical tetrahedron technique. An implementation ofthis ab initio scheme, which we applied to compute the necessarycomponents of s, has been described in Ref. [21]. Once the
complex optical conductivity tensor elements sijðoÞ are calcu-lated, the dielectric function eðoÞ can, for cubic materials, beobtained from
Re½e� ¼ 1�4po Im½sxx� and Im½e� ¼ 4p
o Re½sxx�: ð1Þ
The P-MOKE spectrum is given by the following expression [17]:
yK þ iZK ��sxy
sxx 1þ i4posxx
� �1=2; ð2Þ
where the angle yK is the Kerr rotation, ZK is the Kerr ellipticity,and o the circular frequency of the incident light.
Furthermore, the MCD spectrum, in transmission, can becalculated by
AMCD �do2c
Im½nþ � n�� �2pd
cIm
�sxy
1þ i4posxx
� �1=2
26664
37775; ð3Þ
where d is the thickness of the sample, c the speed of light, andn7 ¼ ðexx7exyÞ
1=2 is the refractive index for right (left, respec-tively) circularly polarized light.
Two sets of electronic structure calculations were performedusing density-functional theory. In one case, the electronicstructure of DMS Ga15Mn1As16 (6.25% Mn) was calculated inzinc-blende structure by means of a full-potential linear muffin-tin orbital code (FP-LMTO) [22] adopting the local spin-densityapproximation (LSDA). Self-consistency was obtained for 3456k-points in the irreducible BZ for the experimental lattice constant5:65
˚A of pure GaAs.
In another set of calculations, we used relativistic DFT withinthe LSDA to study the properties of GaAs and MnAs. In thesecalculations, the augmented spherical wave (ASW) basis functionswere used in the spherical potential approximation [23]. Twoempty atomic spheres have been introduced in the ZB structure,in order to obtain a good description of the potential. Self-consistency was obtained with 6552 k-points in the irreducibleBZ.
3. Results and discussion
3.1. GaAs
We are interested to study the gradual change in optical andmagneto-optical properties of pure GaAs to GaAs doped witha dilute concentration of Mn and finally to MnAs with 100% Mndoping. Let us first start with the optical properties of GaAs.
It is well known [24] that the band-gap of semiconductors,computed in the LDA, is systematically underestimated comparedto the experimental values. In fact, this problem persists even inthe (unknown) exact Kohn–Sham DFT [25,26]. It has been shownfor semiconducting Si that an evaluation of the quasi-particlespectrum on the basis of an approximated Dyson equation leadsto a better band-gap value [27]. However, it has also been foundthat the shape of the optical spectrum is better given byKohn–Sham DFT calculations, except for the value of the band-gap [27]. A practicable and commonly used way of treating theunderestimated band-gap is to apply a rigid energy shift of to thecomputed Kohn–Sham spectra (the so-called scissors operation).In case of GaAs, the experimental band-gap is 1.5 eV, whereas LDAcalculations give about half this value. This underestimation willbe treated by a rigid shift of the computed spectra.
In Fig. 1 we show the computed and experimental opticalspectra of GaAs. For the experimental GaAs lattice constant of
ARTICLE IN PRESS
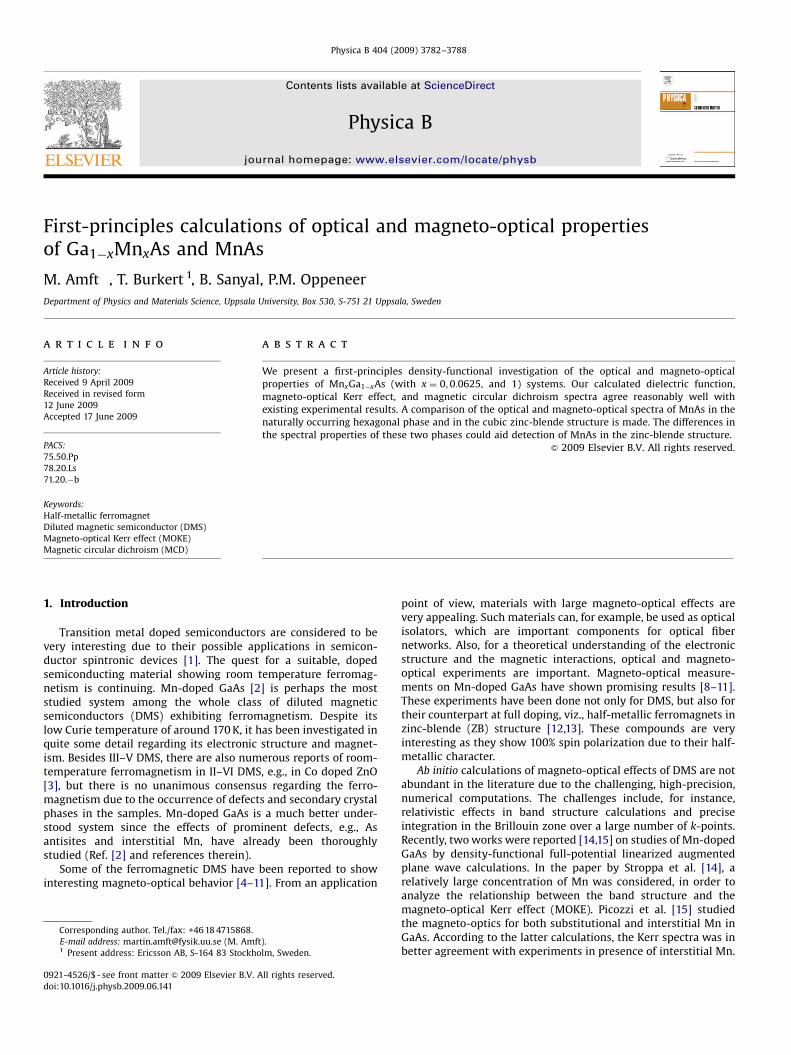
Fig. 1. Calculated diagonal optical conductivity sxxðoÞ (top panel) and dielectric
function eðoÞ of GaAs compared with experimental data [31] (open circles). The
energies of the calculated spectra were shifted by 0.7 eV towards higher energies,
cf. text.
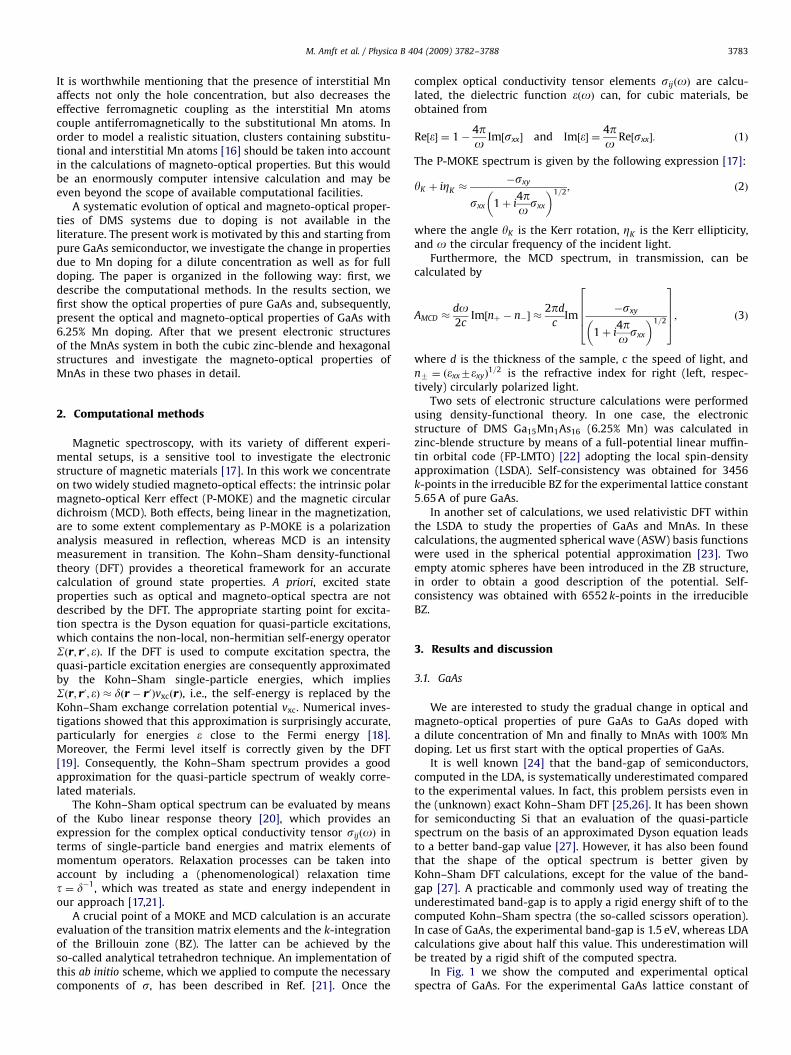
Fig. 2. Calculated spin-projected total DOS of Ga15Mn1As16 (divided by a factor of
5, solid lines); partial DOS for 3d Mn states (dotted lines) and its next neighbor 4p
As states (dashed lines). The Fermi energy EF corresponds to 0 eV.
M. Amft et al. / Physica B 404 (2009) 3782–37883784
5:65 A, the value of the band-gap turned out to be 0.8 eV.Therefore, the computed spectra of sxxðoÞ shown in Fig. 1 wereshifted by 0.7 eV towards higher energies in order to compensatefor the underestimated calculated band-gap. From these shiftedspectra, eðoÞ was calculated. The upper panel of Fig. 1 shows theresulting spectrum of the diagonal optical conductivity tensorelement sxx, computed for two constant relaxation rates, d ¼0:014 and 0.20 eV. From sxx the dielectric function eðoÞ wascomputed, which is shown in the middle and the lower panels ofFig. 1. The spectra are in good agreement with experiment [31].We note that no Drude term for the intraband transition wasincluded here. The good agreement with the experimental spectraindicate that the band structure of GaAs is reproduced precisely,except of course for the value of the band-gap. As we haveincluded the spin–orbit (SO) effects, the fine splittings in the bandstructure are also present. A difference between the experimentaland calculated spectra appear in the energy range of 4–5 eV,where the peak in the calculated ImðeÞ spectrum is smaller thanthe experimental peak, for the relaxation rate of 0.2 eV. Using asmaller relaxation rate ðd ¼ 0:014 eVÞ does not eliminate thisdifference, as it gives a steeper but also narrower peak, which doesnot match the experimental ImðeÞ spectrum. Also, as a relaxationrate of 0.2 eV can be considered to be realistic, this indicates asmall deviation between the LDA and experimental bandstructures.
3.2. Ga1�xMnxAs
Now we show the results of Mn doped GaAs with acomposition of Ga15Mn1As16 that corresponds to 6.25% Mndoping. Here, we have considered only substitutional doping.This situation can be achieved in experiments by annealing andthereby eliminating the interstitial Mn atoms from the sample [2].Fig. 2 shows the spin-projected total DOS as well as the partialDOS of the Mn 3d states and the nearest neighbor As 4p states.The features of the calculated DOS correspond quite well to that ofvarious LSDA based calculations reported in literature, e.g., in thepaper by Sanvito et al. [32]. However, it has been discussed thatLSDA is not the best choice for the description of electronic
structure in these systems due to the possible presence of strongelectron–electron correlation effects. It has been discussed [33]that LSDAþ U theory might be needed to describe better strongelectron correlations that could be present in the open Mn3d-shell. For the pure GaAs semiconductor, these strong electroncorrelations are not expected to be present, therefore LSDAþ U isnot expected to provide any improvement of the underestimatedband-gap. It is thus questionable if the LSDAþ U approach couldlead to improved optical spectra for Mn doped GaAs; we thereforereport here LSDA-based calculations. As reported in the literature,a strong hybridization between Mn 3d and As 4p states isobserved in the DOS at the Fermi energy. This corresponds to thesmall spin-up DOS peak at 0.4 eV binding energy in Fig. 2 and thepartial Mn and As DOS present around EF . A broad feature inthe Mn 3d states with substantial hybridization to As 4p isseen around 3 eV binding energy in the spin-up channel. Theunoccupied Mn 3d states do not show a particular hybridizationwith As 4p states, but instead with Ga (not shown).
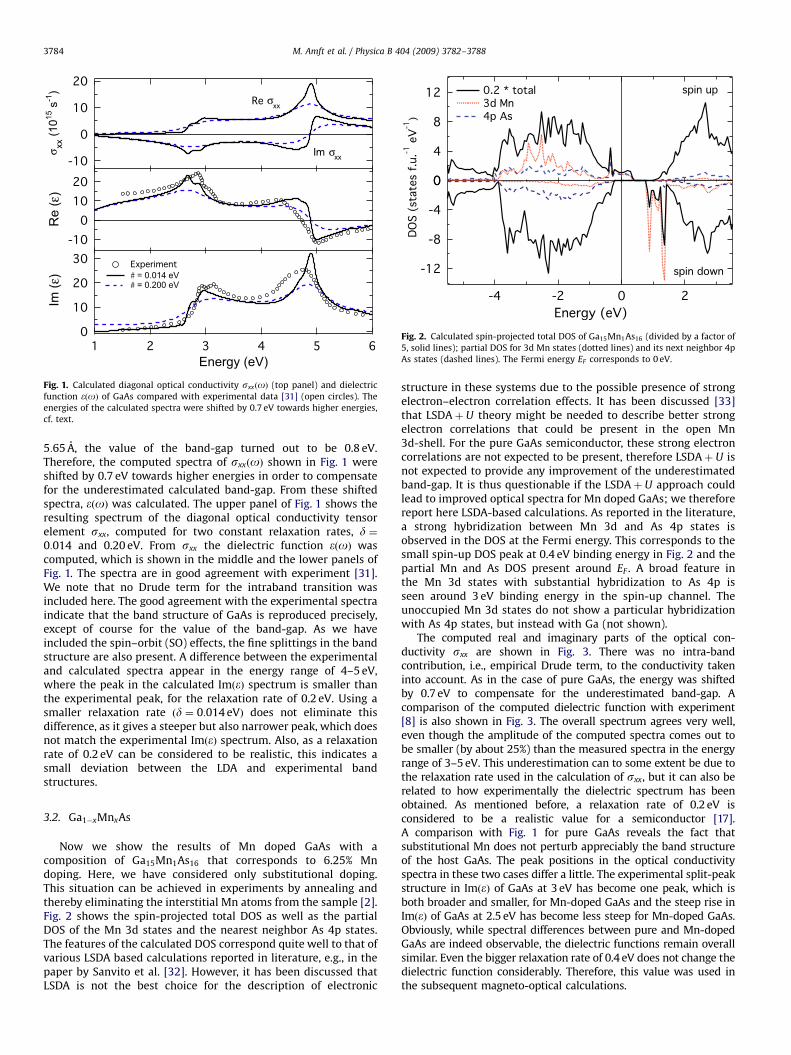
The computed real and imaginary parts of the optical con-ductivity sxx are shown in Fig. 3. There was no intra-bandcontribution, i.e., empirical Drude term, to the conductivity takeninto account. As in the case of pure GaAs, the energy was shiftedby 0.7 eV to compensate for the underestimated band-gap. Acomparison of the computed dielectric function with experiment[8] is also shown in Fig. 3. The overall spectrum agrees very well,even though the amplitude of the computed spectra comes out tobe smaller (by about 25%) than the measured spectra in the energyrange of 3–5 eV. This underestimation can to some extent be due tothe relaxation rate used in the calculation of sxx, but it can also berelated to how experimentally the dielectric spectrum has beenobtained. As mentioned before, a relaxation rate of 0.2 eV isconsidered to be a realistic value for a semiconductor [17].A comparison with Fig. 1 for pure GaAs reveals the fact thatsubstitutional Mn does not perturb appreciably the band structureof the host GaAs. The peak positions in the optical conductivityspectra in these two cases differ a little. The experimental split-peakstructure in ImðeÞ of GaAs at 3 eV has become one peak, which isboth broader and smaller, for Mn-doped GaAs and the steep rise inImðeÞ of GaAs at 2.5 eV has become less steep for Mn-doped GaAs.Obviously, while spectral differences between pure and Mn-dopedGaAs are indeed observable, the dielectric functions remain overallsimilar. Even the bigger relaxation rate of 0.4 eV does not change thedielectric function considerably. Therefore, this value was used inthe subsequent magneto-optical calculations.
ARTICLE IN PRESS
Fig. 4. Calculated off-diagonal optical conductivity sxy and polar Kerr spectra of
Ga15Mn1As16. In the middle panel the calculated Kerr rotation is compared with
the measured rotations (solid triangles, cf. [9] and open circles [10]). The lower
panel shows the comparison of the calculated and measured (solid triangles, cf.
[9]) Kerr ellipticity. The energies of the calculated spectra were shifted by 0.7 eV
towards higher energies, cf. text.
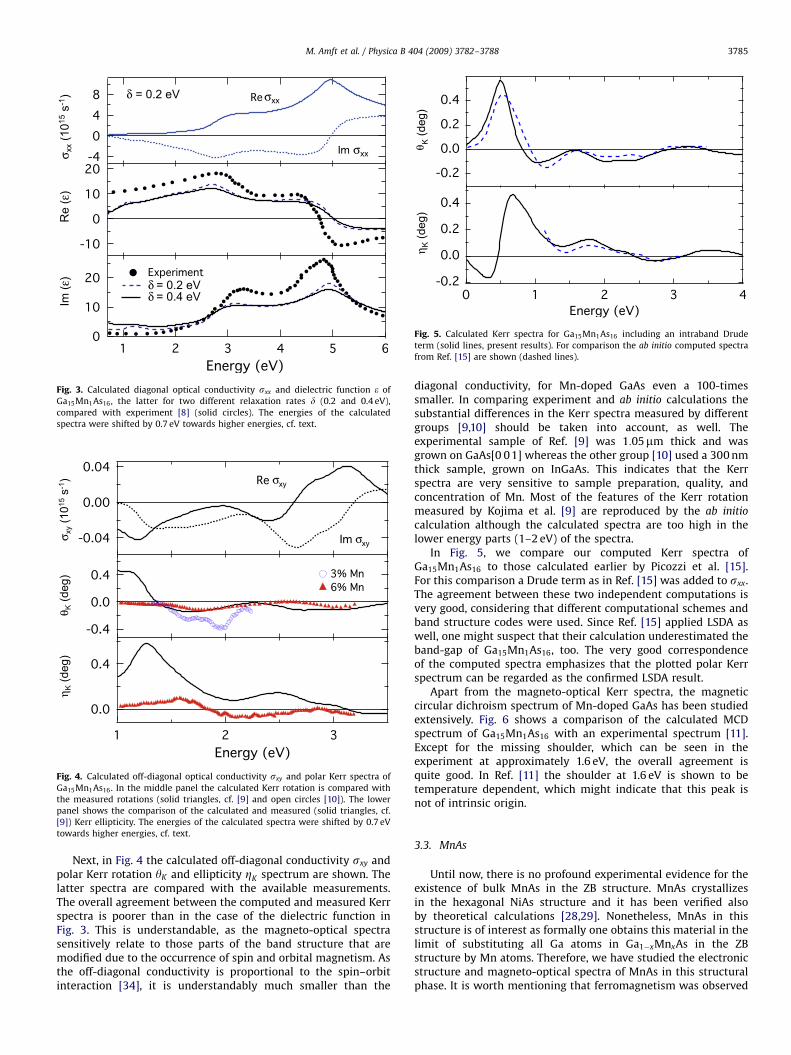
Fig. 5. Calculated Kerr spectra for Ga15Mn1As16 including an intraband Drude
term (solid lines, present results). For comparison the ab initio computed spectra
from Ref. [15] are shown (dashed lines).
Fig. 3. Calculated diagonal optical conductivity sxx and dielectric function e of
Ga15Mn1As16, the latter for two different relaxation rates d (0.2 and 0.4 eV),
compared with experiment [8] (solid circles). The energies of the calculated
spectra were shifted by 0.7 eV towards higher energies, cf. text.
M. Amft et al. / Physica B 404 (2009) 3782–3788 3785
Next, in Fig. 4 the calculated off-diagonal conductivity sxy andpolar Kerr rotation yK and ellipticity ZK spectrum are shown. Thelatter spectra are compared with the available measurements.The overall agreement between the computed and measured Kerrspectra is poorer than in the case of the dielectric function inFig. 3. This is understandable, as the magneto-optical spectrasensitively relate to those parts of the band structure that aremodified due to the occurrence of spin and orbital magnetism. Asthe off-diagonal conductivity is proportional to the spin–orbitinteraction [34], it is understandably much smaller than the
diagonal conductivity, for Mn-doped GaAs even a 100-timessmaller. In comparing experiment and ab initio calculations thesubstantial differences in the Kerr spectra measured by differentgroups [9,10] should be taken into account, as well. Theexperimental sample of Ref. [9] was 1:05mm thick and wasgrown on GaAs[0 0 1] whereas the other group [10] used a 300 nmthick sample, grown on InGaAs. This indicates that the Kerrspectra are very sensitive to sample preparation, quality, andconcentration of Mn. Most of the features of the Kerr rotationmeasured by Kojima et al. [9] are reproduced by the ab initio
calculation although the calculated spectra are too high in thelower energy parts (1–2 eV) of the spectra.
In Fig. 5, we compare our computed Kerr spectra ofGa15Mn1As16 to those calculated earlier by Picozzi et al. [15].For this comparison a Drude term as in Ref. [15] was added to sxx.The agreement between these two independent computations isvery good, considering that different computational schemes andband structure codes were used. Since Ref. [15] applied LSDA aswell, one might suspect that their calculation underestimated theband-gap of Ga15Mn1As16, too. The very good correspondenceof the computed spectra emphasizes that the plotted polar Kerrspectrum can be regarded as the confirmed LSDA result.
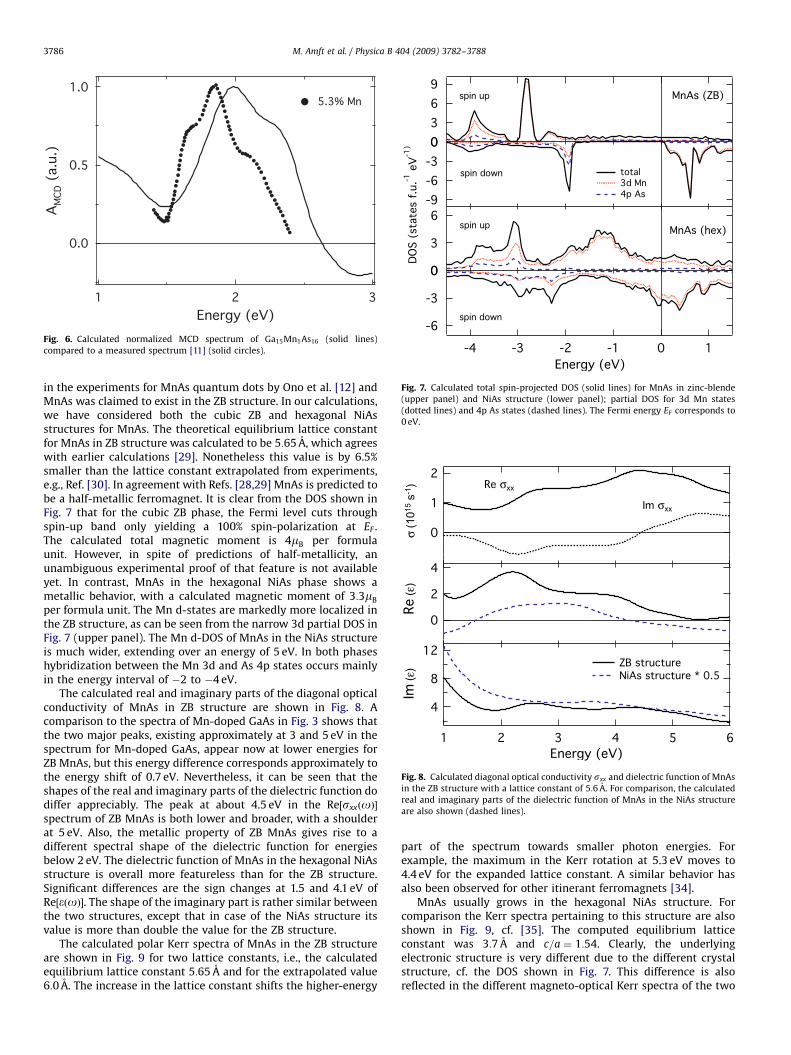
Apart from the magneto-optical Kerr spectra, the magneticcircular dichroism spectrum of Mn-doped GaAs has been studiedextensively. Fig. 6 shows a comparison of the calculated MCDspectrum of Ga15Mn1As16 with an experimental spectrum [11].Except for the missing shoulder, which can be seen in theexperiment at approximately 1.6 eV, the overall agreement isquite good. In Ref. [11] the shoulder at 1.6 eV is shown to betemperature dependent, which might indicate that this peak isnot of intrinsic origin.
3.3. MnAs
Until now, there is no profound experimental evidence for theexistence of bulk MnAs in the ZB structure. MnAs crystallizesin the hexagonal NiAs structure and it has been verified alsoby theoretical calculations [28,29]. Nonetheless, MnAs in thisstructure is of interest as formally one obtains this material in thelimit of substituting all Ga atoms in Ga1�xMnxAs in the ZBstructure by Mn atoms. Therefore, we have studied the electronicstructure and magneto-optical spectra of MnAs in this structuralphase. It is worth mentioning that ferromagnetism was observed
ARTICLE IN PRESS
Fig. 7. Calculated total spin-projected DOS (solid lines) for MnAs in zinc-blende
(upper panel) and NiAs structure (lower panel); partial DOS for 3d Mn states
(dotted lines) and 4p As states (dashed lines). The Fermi energy EF corresponds to
0 eV.
Fig. 8. Calculated diagonal optical conductivity sxx and dielectric function of MnAs
in the ZB structure with a lattice constant of 5:6 A. For comparison, the calculated
real and imaginary parts of the dielectric function of MnAs in the NiAs structure
are also shown (dashed lines).
Fig. 6. Calculated normalized MCD spectrum of Ga15Mn1As16 (solid lines)
compared to a measured spectrum [11] (solid circles).
M. Amft et al. / Physica B 404 (2009) 3782–37883786
in the experiments for MnAs quantum dots by Ono et al. [12] andMnAs was claimed to exist in the ZB structure. In our calculations,we have considered both the cubic ZB and hexagonal NiAsstructures for MnAs. The theoretical equilibrium lattice constantfor MnAs in ZB structure was calculated to be 5:65 A, which agreeswith earlier calculations [29]. Nonetheless this value is by 6.5%smaller than the lattice constant extrapolated from experiments,e.g., Ref. [30]. In agreement with Refs. [28,29] MnAs is predicted tobe a half-metallic ferromagnet. It is clear from the DOS shown inFig. 7 that for the cubic ZB phase, the Fermi level cuts throughspin-up band only yielding a 100% spin-polarization at EF .The calculated total magnetic moment is 4mB per formulaunit. However, in spite of predictions of half-metallicity, anunambiguous experimental proof of that feature is not availableyet. In contrast, MnAs in the hexagonal NiAs phase shows ametallic behavior, with a calculated magnetic moment of 3:3mB
per formula unit. The Mn d-states are markedly more localized inthe ZB structure, as can be seen from the narrow 3d partial DOS inFig. 7 (upper panel). The Mn d-DOS of MnAs in the NiAs structureis much wider, extending over an energy of 5 eV. In both phaseshybridization between the Mn 3d and As 4p states occurs mainlyin the energy interval of �2 to �4 eV.
The calculated real and imaginary parts of the diagonal opticalconductivity of MnAs in ZB structure are shown in Fig. 8. Acomparison to the spectra of Mn-doped GaAs in Fig. 3 shows thatthe two major peaks, existing approximately at 3 and 5 eV in thespectrum for Mn-doped GaAs, appear now at lower energies forZB MnAs, but this energy difference corresponds approximately tothe energy shift of 0.7 eV. Nevertheless, it can be seen that theshapes of the real and imaginary parts of the dielectric function dodiffer appreciably. The peak at about 4.5 eV in the Re½sxxðoÞ�spectrum of ZB MnAs is both lower and broader, with a shoulderat 5 eV. Also, the metallic property of ZB MnAs gives rise to adifferent spectral shape of the dielectric function for energiesbelow 2 eV. The dielectric function of MnAs in the hexagonal NiAsstructure is overall more featureless than for the ZB structure.Significant differences are the sign changes at 1.5 and 4.1 eV ofRe½eðoÞ�. The shape of the imaginary part is rather similar betweenthe two structures, except that in case of the NiAs structure itsvalue is more than double the value for the ZB structure.
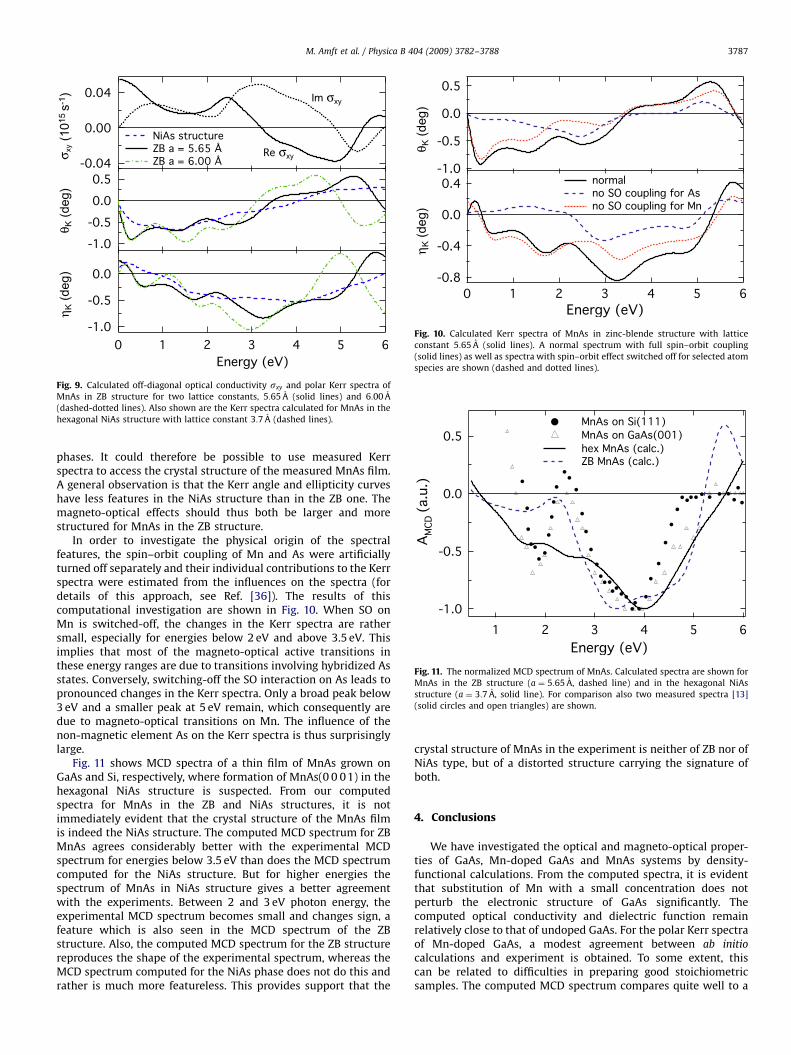
The calculated polar Kerr spectra of MnAs in the ZB structureare shown in Fig. 9 for two lattice constants, i.e., the calculatedequilibrium lattice constant 5:65 A and for the extrapolated value6:0 A. The increase in the lattice constant shifts the higher-energy
part of the spectrum towards smaller photon energies. Forexample, the maximum in the Kerr rotation at 5.3 eV moves to4.4 eV for the expanded lattice constant. A similar behavior hasalso been observed for other itinerant ferromagnets [34].
MnAs usually grows in the hexagonal NiAs structure. Forcomparison the Kerr spectra pertaining to this structure are alsoshown in Fig. 9, cf. [35]. The computed equilibrium latticeconstant was 3:7 A and c=a ¼ 1:54. Clearly, the underlyingelectronic structure is very different due to the different crystalstructure, cf. the DOS shown in Fig. 7. This difference is alsoreflected in the different magneto-optical Kerr spectra of the two
ARTICLE IN PRESS
Fig. 9. Calculated off-diagonal optical conductivity sxy and polar Kerr spectra of
MnAs in ZB structure for two lattice constants, 5:65 A (solid lines) and 6:00 A
(dashed-dotted lines). Also shown are the Kerr spectra calculated for MnAs in the
hexagonal NiAs structure with lattice constant 3:7 A (dashed lines).
Fig. 10. Calculated Kerr spectra of MnAs in zinc-blende structure with lattice
constant 5:65 A (solid lines). A normal spectrum with full spin–orbit coupling
(solid lines) as well as spectra with spin–orbit effect switched off for selected atom
species are shown (dashed and dotted lines).
Fig. 11. The normalized MCD spectrum of MnAs. Calculated spectra are shown for
MnAs in the ZB structure (a ¼ 5:65 A, dashed line) and in the hexagonal NiAs
structure (a ¼ 3:7 A, solid line). For comparison also two measured spectra [13]
(solid circles and open triangles) are shown.
M. Amft et al. / Physica B 404 (2009) 3782–3788 3787
phases. It could therefore be possible to use measured Kerrspectra to access the crystal structure of the measured MnAs film.A general observation is that the Kerr angle and ellipticity curveshave less features in the NiAs structure than in the ZB one. Themagneto-optical effects should thus both be larger and morestructured for MnAs in the ZB structure.
In order to investigate the physical origin of the spectralfeatures, the spin–orbit coupling of Mn and As were artificiallyturned off separately and their individual contributions to the Kerrspectra were estimated from the influences on the spectra (fordetails of this approach, see Ref. [36]). The results of thiscomputational investigation are shown in Fig. 10. When SO onMn is switched-off, the changes in the Kerr spectra are rathersmall, especially for energies below 2 eV and above 3.5 eV. Thisimplies that most of the magneto-optical active transitions inthese energy ranges are due to transitions involving hybridized Asstates. Conversely, switching-off the SO interaction on As leads topronounced changes in the Kerr spectra. Only a broad peak below3 eV and a smaller peak at 5 eV remain, which consequently aredue to magneto-optical transitions on Mn. The influence of thenon-magnetic element As on the Kerr spectra is thus surprisinglylarge.
Fig. 11 shows MCD spectra of a thin film of MnAs grown onGaAs and Si, respectively, where formation of MnAs(0 0 0 1) in thehexagonal NiAs structure is suspected. From our computedspectra for MnAs in the ZB and NiAs structures, it is notimmediately evident that the crystal structure of the MnAs filmis indeed the NiAs structure. The computed MCD spectrum for ZBMnAs agrees considerably better with the experimental MCDspectrum for energies below 3.5 eV than does the MCD spectrumcomputed for the NiAs structure. But for higher energies thespectrum of MnAs in NiAs structure gives a better agreementwith the experiments. Between 2 and 3 eV photon energy, theexperimental MCD spectrum becomes small and changes sign, afeature which is also seen in the MCD spectrum of the ZBstructure. Also, the computed MCD spectrum for the ZB structurereproduces the shape of the experimental spectrum, whereas theMCD spectrum computed for the NiAs phase does not do this andrather is much more featureless. This provides support that the
crystal structure of MnAs in the experiment is neither of ZB nor ofNiAs type, but of a distorted structure carrying the signature ofboth.
4. Conclusions
We have investigated the optical and magneto-optical proper-ties of GaAs, Mn-doped GaAs and MnAs systems by density-functional calculations. From the computed spectra, it is evidentthat substitution of Mn with a small concentration does notperturb the electronic structure of GaAs significantly. Thecomputed optical conductivity and dielectric function remainrelatively close to that of undoped GaAs. For the polar Kerr spectraof Mn-doped GaAs, a modest agreement between ab initio
calculations and experiment is obtained. To some extent, thiscan be related to difficulties in preparing good stoichiometricsamples. The computed MCD spectrum compares quite well to a
ARTICLE IN PRESS
M. Amft et al. / Physica B 404 (2009) 3782–37883788
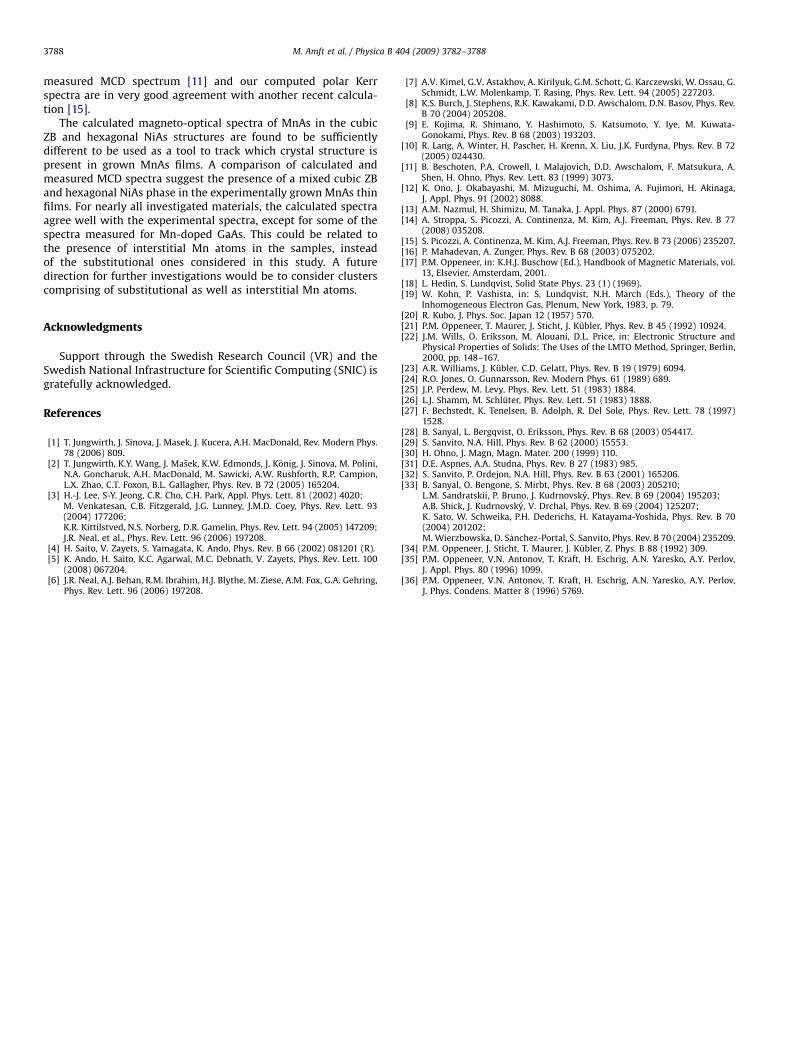
measured MCD spectrum [11] and our computed polar Kerrspectra are in very good agreement with another recent calcula-tion [15].
The calculated magneto-optical spectra of MnAs in the cubicZB and hexagonal NiAs structures are found to be sufficientlydifferent to be used as a tool to track which crystal structure ispresent in grown MnAs films. A comparison of calculated andmeasured MCD spectra suggest the presence of a mixed cubic ZBand hexagonal NiAs phase in the experimentally grown MnAs thinfilms. For nearly all investigated materials, the calculated spectraagree well with the experimental spectra, except for some of thespectra measured for Mn-doped GaAs. This could be related tothe presence of interstitial Mn atoms in the samples, insteadof the substitutional ones considered in this study. A futuredirection for further investigations would be to consider clusterscomprising of substitutional as well as interstitial Mn atoms.
Acknowledgments
Support through the Swedish Research Council (VR) and theSwedish National Infrastructure for Scientific Computing (SNIC) isgratefully acknowledged.
References
[1] T. Jungwirth, J. Sinova, J. Masek, J. Kucera, A.H. MacDonald, Rev. Modern Phys.78 (2006) 809.
[2] T. Jungwirth, K.Y. Wang, J. Masek, K.W. Edmonds, J. Konig, J. Sinova, M. Polini,N.A. Goncharuk, A.H. MacDonald, M. Sawicki, A.W. Rushforth, R.P. Campion,L.X. Zhao, C.T. Foxon, B.L. Gallagher, Phys. Rev. B 72 (2005) 165204.
[3] H.-J. Lee, S-Y. Jeong, C.R. Cho, C.H. Park, Appl. Phys. Lett. 81 (2002) 4020;M. Venkatesan, C.B. Fitzgerald, J.G. Lunney, J.M.D. Coey, Phys. Rev. Lett. 93(2004) 177206;K.R. Kittilstved, N.S. Norberg, D.R. Gamelin, Phys. Rev. Lett. 94 (2005) 147209;J.R. Neal, et al., Phys. Rev. Lett. 96 (2006) 197208.
[4] H. Saito, V. Zayets, S. Yamagata, K. Ando, Phys. Rev. B 66 (2002) 081201 (R).[5] K. Ando, H. Saito, K.C. Agarwal, M.C. Debnath, V. Zayets, Phys. Rev. Lett. 100
(2008) 067204.[6] J.R. Neal, A.J. Behan, R.M. Ibrahim, H.J. Blythe, M. Ziese, A.M. Fox, G.A. Gehring,
Phys. Rev. Lett. 96 (2006) 197208.
[7] A.V. Kimel, G.V. Astakhov, A. Kirilyuk, G.M. Schott, G. Karczewski, W. Ossau, G.Schmidt, L.W. Molenkamp, T. Rasing, Phys. Rev. Lett. 94 (2005) 227203.
[8] K.S. Burch, J. Stephens, R.K. Kawakami, D.D. Awschalom, D.N. Basov, Phys. Rev.B 70 (2004) 205208.
[9] E. Kojima, R. Shimano, Y. Hashimoto, S. Katsumoto, Y. Iye, M. Kuwata-Gonokami, Phys. Rev. B 68 (2003) 193203.
[10] R. Lang, A. Winter, H. Pascher, H. Krenn, X. Liu, J.K. Furdyna, Phys. Rev. B 72(2005) 024430.
[11] B. Beschoten, P.A. Crowell, I. Malajovich, D.D. Awschalom, F. Matsukura, A.Shen, H. Ohno, Phys. Rev. Lett. 83 (1999) 3073.
[12] K. Ono, J. Okabayashi, M. Mizuguchi, M. Oshima, A. Fujimori, H. Akinaga,J. Appl. Phys. 91 (2002) 8088.
[13] A.M. Nazmul, H. Shimizu, M. Tanaka, J. Appl. Phys. 87 (2000) 6791.[14] A. Stroppa, S. Picozzi, A. Continenza, M. Kim, A.J. Freeman, Phys. Rev. B 77
(2008) 035208.[15] S. Picozzi, A. Continenza, M. Kim, A.J. Freeman, Phys. Rev. B 73 (2006) 235207.[16] P. Mahadevan, A. Zunger, Phys. Rev. B 68 (2003) 075202.[17] P.M. Oppeneer, in: K.H.J. Buschow (Ed.), Handbook of Magnetic Materials, vol.
13, Elsevier, Amsterdam, 2001.[18] L. Hedin, S. Lundqvist, Solid State Phys. 23 (1) (1969).[19] W. Kohn, P. Vashista, in: S. Lundqvist, N.H. March (Eds.), Theory of the
Inhomogeneous Electron Gas, Plenum, New York, 1983, p. 79.[20] R. Kubo, J. Phys. Soc. Japan 12 (1957) 570.[21] P.M. Oppeneer, T. Maurer, J. Sticht, J. Kubler, Phys. Rev. B 45 (1992) 10924.[22] J.M. Wills, O. Eriksson, M. Alouani, D.L. Price, in: Electronic Structure and
Physical Properties of Solids: The Uses of the LMTO Method, Springer, Berlin,2000, pp. 148–167.
[23] A.R. Williams, J. Kubler, C.D. Gelatt, Phys. Rev. B 19 (1979) 6094.[24] R.O. Jones, O. Gunnarsson, Rev. Modern Phys. 61 (1989) 689.[25] J.P. Perdew, M. Levy, Phys. Rev. Lett. 51 (1983) 1884.[26] L.J. Shamm, M. Schluter, Phys. Rev. Lett. 51 (1983) 1888.[27] F. Bechstedt, K. Tenelsen, B. Adolph, R. Del Sole, Phys. Rev. Lett. 78 (1997)
1528.[28] B. Sanyal, L. Bergqvist, O. Eriksson, Phys. Rev. B 68 (2003) 054417.[29] S. Sanvito, N.A. Hill, Phys. Rev. B 62 (2000) 15553.[30] H. Ohno, J. Magn, Magn. Mater. 200 (1999) 110.[31] D.E. Aspnes, A.A. Studna, Phys. Rev. B 27 (1983) 985.[32] S. Sanvito, P. Ordejon, N.A. Hill, Phys. Rev. B 63 (2001) 165206.[33] B. Sanyal, O. Bengone, S. Mirbt, Phys. Rev. B 68 (2003) 205210;
L.M. Sandratskii, P. Bruno, J. Kudrnovsky, Phys. Rev. B 69 (2004) 195203;A.B. Shick, J. Kudrnovsky, V. Drchal, Phys. Rev. B 69 (2004) 125207;K. Sato, W. Schweika, P.H. Dederichs, H. Katayama-Yoshida, Phys. Rev. B 70(2004) 201202;M. Wierzbowska, D. S�anchez-Portal, S. Sanvito, Phys. Rev. B 70 (2004) 235209.
[34] P.M. Oppeneer, J. Sticht, T. Maurer, J. Kubler, Z. Phys. B 88 (1992) 309.[35] P.M. Oppeneer, V.N. Antonov, T. Kraft, H. Eschrig, A.N. Yaresko, A.Y. Perlov,
J. Appl. Phys. 80 (1996) 1099.[36] P.M. Oppeneer, V.N. Antonov, T. Kraft, H. Eschrig, A.N. Yaresko, A.Y. Perlov,
J. Phys. Condens. Matter 8 (1996) 5769.
Related Documents