Firm Dynamics, Job Creation and Entrepreneurship in the U.S. John Haltiwanger University of Maryland and NBER University of Maryland and NBER *Without implication, this presentation draws heavily on joint work with Steven Davis, Without implication, this presentation draws heavily on joint work with Steven Davis, Jason Faberman, Lucia Foster, Ron Jarmin, C.J. Krizan, Javier Miranda and Chad Syverson

Welcome message from author
This document is posted to help you gain knowledge. Please leave a comment to let me know what you think about it! Share it to your friends and learn new things together.
Transcript

Firm Dynamics, Job Creation and Entrepreneurship in the U.S.
John HaltiwangerUniversity of Maryland and NBERUniversity of Maryland and NBER
*Without implication, this presentation draws heavily on joint work with Steven Davis,Without implication, this presentation draws heavily on joint work with Steven Davis, Jason Faberman, Lucia Foster, Ron Jarmin, C.J. Krizan, Javier Mirandaand Chad Syverson
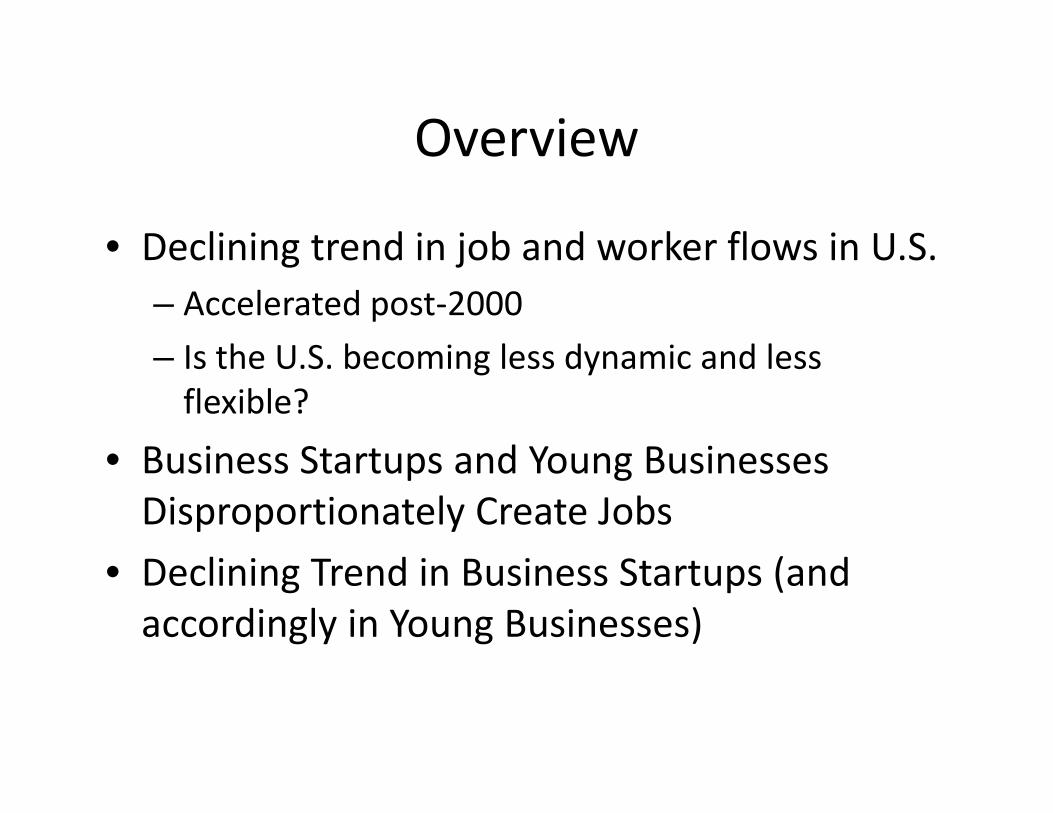
OverviewOverview
• Declining trend in job and worker flows in U SDeclining trend in job and worker flows in U.S.– Accelerated post‐2000Is the U S becoming less dynamic and less– Is the U.S. becoming less dynamic and less flexible?
• Business Startups and Young Businesses• Business Startups and Young Businesses Disproportionately Create JobsD li i T d i B i S ( d• Declining Trend in Business Startups (and accordingly in Young Businesses)

Remarks By Federal Reserve Chairman Ben kBernanke
One leading explanation for the strong U S productivity…One leading explanation for the strong U.S. productivity growth is that labor markets in the United States tend to be more flexible and competitive, market characteristics that have allowed the United States to realize greater economichave allowed the United States to realize greater economic benefits from new technologies. For example, taking full advantage of new information and communication technologies may require extensive reorganization of worktechnologies may require extensive reorganization of work practices, the reassignment and retraining of workers, and ultimately some reallocation of labor among firms and industriesindustries…
August 31, 2006

10.010.0 Percent of Employment
Quarterly Job Creation and Destruction Rates, U.S. Private Sector
9.09.0
8.08.0
6.0
7.0
6.0
7.0
5.0
6.0
5.0
6.0
Job Destruction
Job Creation
4.04.0
1990
1991
1992
1993
1994
1995
1996
1997
1998
1999
2000
2001
2002
2003
2004
2005
2006
2007
2008
2009
2010
2011
Source: BED and Davis, Faberman and Haltiwanger (2012)
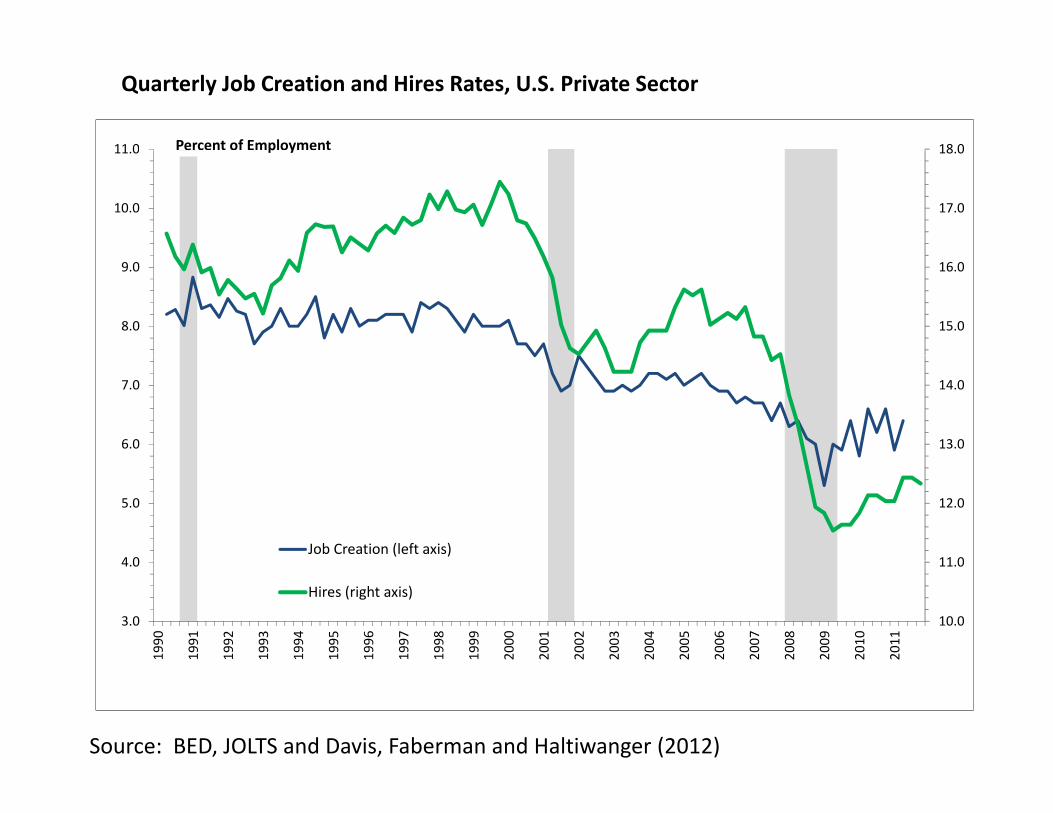
Quarterly Job Creation and Hires Rates, U.S. Private Sector
18 011 0 Percent of Employment
17.0
18.0
10.0
11.0 p y
15.0
16.0
8.0
9.0
13.0
14.0
6.0
7.0
11 0
12.0
4 0
5.0
Job Creation (left axis)
10.0
11.0
3.0
4.0
1990
1991
1992
1993
1994
1995
1996
1997
1998
1999
2000
2001
2002
2003
2004
2005
2006
2007
2008
2009
2010
2011
Hires (right axis)
Source: BED, JOLTS and Davis, Faberman and Haltiwanger (2012)

Quarterly Job Destruction, Layoffs and Quit Rates, U.S. Private Sector
10.010.0 Percent of Employment
9.09.0
8.08.0
6.0
7.0
6.0
7.0
5.05.0
Job Destruction
Layoffs
4.04.0
1990
1991
1992
1993
1994
1995
1996
1997
1998
1999
2000
2001
2002
2003
2004
2005
2006
2007
2008
2009
2010
2011
Quits
Source: BED, JOLTS and Davis, Faberman and Haltiwanger (2012)
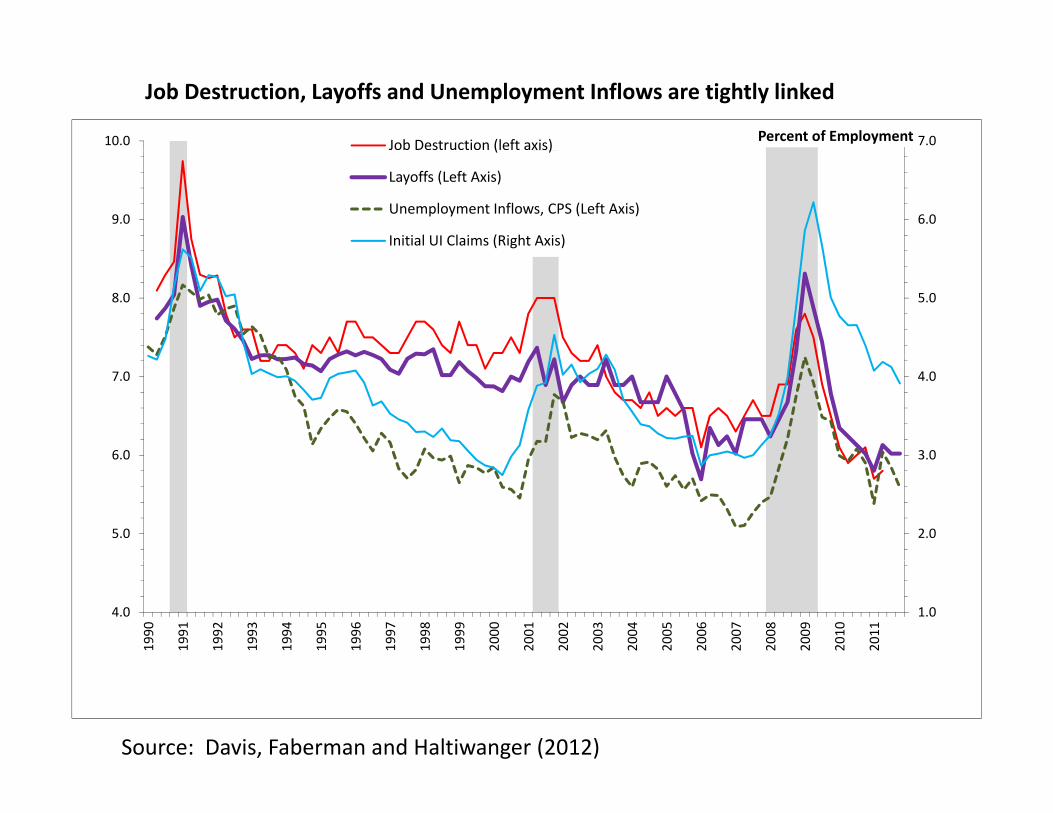
7.010.0 Percent of EmploymentJob Destruction (left axis)
Job Destruction, Layoffs and Unemployment Inflows are tightly linked
6.09.0
( )
Layoffs (Left Axis)
Unemployment Inflows, CPS (Left Axis)
Initial UI Claims (Right Axis)
5.08.0
3.0
4.0
6.0
7.0
2.0
3.0
5.0
6.0
1.04.0
1990
1991
1992
1993
1994
1995
1996
1997
1998
1999
2000
2001
2002
2003
2004
2005
2006
2007
2008
2009
2010
2011
Source: Davis, Faberman and Haltiwanger (2012)

Excess Worker Reallocation “Churn” and Job Reallocation
18 0
19.0
20.0 Percent of Employment
16.0
17.0
18.0
14.0
15.0
11.0
12.0
13.0 Job Reallocation
Excess Worker Reallocation
10.0
1990
1991
1992
1993
1994
1995
1996
1997
1998
1999
2000
2001
2002
2003
2004
2005
2006
2007
2008
2009
2010
2011
(Churn)
Source: BED and JOLTS – Tabulations from Davis, Faberman and Haltiwanger (2012)
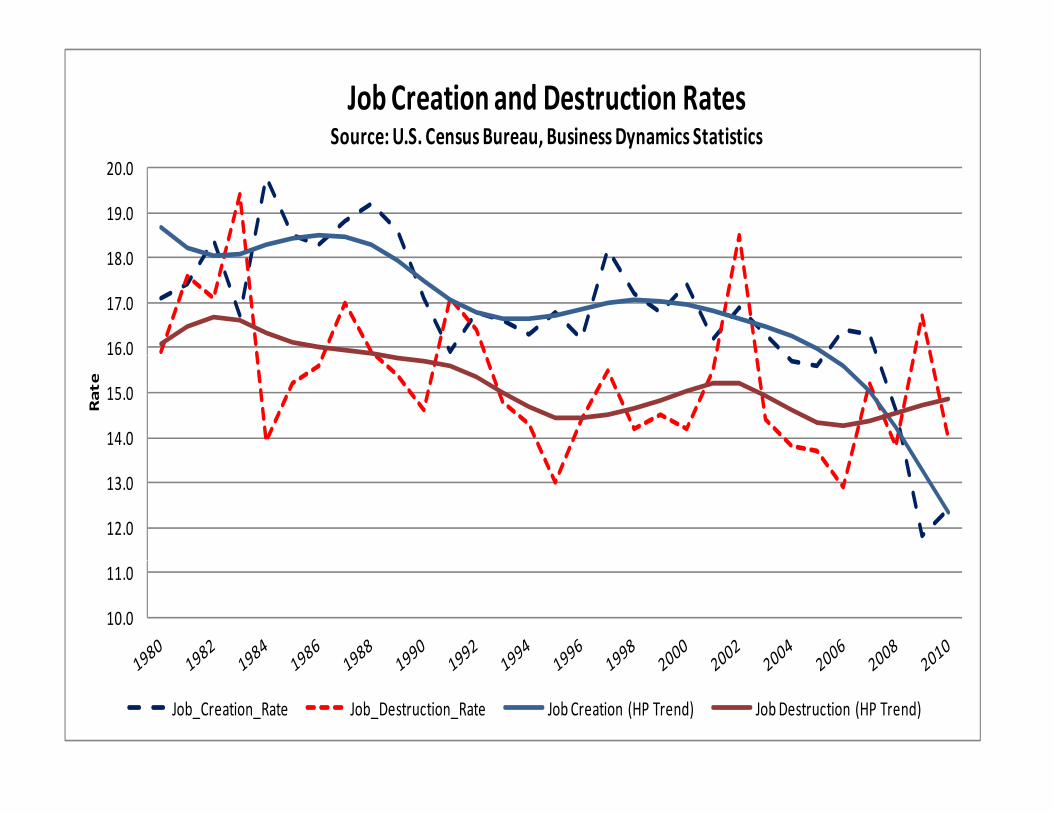
Job Creation and Destruction RatesSource: U.S. Census Bureau, Business Dynamics Statistics
18 0
19.0
20.0
16.0
17.0
18.0
14.0
15.0
Rate
12.0
13.0
10.0
11.0
Job_Creation_Rate Job_Destruction_Rate Job Creation (HP Trend) Job Destruction (HP Trend)

Net Job Creation by Firm Size and Firm Age, U.S. Private Sector, 2005
Firm Size (Base Year)
Firm Age a ) 1 to 4 b) 5 to 9c) 10 to
19d) 20 to
49e ) 50 to
99f) 100 to
249g) 250 to
499h) 500 to
999i) 1000 to
2499j) 2500 to
4999k) 5000 to
9999 l) 10000+ All) 0 731 515 503 644 498 317 553 181 313 511 292 348 157 120 151 518 186 087 131 178 D D 3 518 419a) 0 731,515 503,644 498,317 553,181 313,511 292,348 157,120 151,518 186,087 131,178 D D 3,518,419
b) 1 79,759 -12,547 -20,836 -47,837 -41,006 -57,188 -48,830 -5,476 -14,532 -20,131 211 -408 -188,821c) 2 26,506 -24,840 -31,883 -44,488 -26,738 -18,026 -9,049 -13,579 -23,615 -12,782 D D -178,494d) 3 7,535 -22,650 -26,855 -37,824 -15,918 -14,813 -8,981 -7,548 -11,581 -12,114 D D -150,749e) 4 20 456 18 442 23 212 29 616 641 9 816 4 301 5 436 298 4 011 D D 74 035e) 4 20,456 -18,442 -23,212 -29,616 641 -9,816 -4,301 -5,436 -298 -4,011 D D -74,035f) 5 4,808 -19,792 -24,392 -29,425 -14,870 -6,222 -2,449 -6,849 -293 -3,418 D D -102,902
g) 6 to 10 14,577 -71,332 -99,235 -110,111 -40,652 -1,324 -9,452 5,437 -20,693 -13,945 -9,903 17,928 -338,705h) 11 to 15 15,663 -47,730 -67,923 -81,876 -40,432 -27,666 -9,530 2,179 -2,028 22,441 6,140 69,409 -161,353i) 16 to 20 5 673 36 856 58 236 71 299 35 979 9 780 5 725 10 200 3 204 12 615 10 491 2 158 153 974i) 16 to 20 5,673 -36,856 -58,236 -71,299 -35,979 9,780 -5,725 10,200 3,204 12,615 10,491 2,158 -153,974j) 21 to 25 2,923 -28,173 -42,609 -51,490 -22,246 -13,346 3,901 10,269 36,484 10,075 9,889 -56,563 -140,886
k) 26+ 1,016 -38,599 -71,235 -107,390 -48,873 10,309 19,924 85,473 56,436 143,701 58,245 307,517 416,524m) ALL 910,431 182,683 31,901 -58,175 27,438 164,036 82,628 226,188 209,171 253,609 90,973 360,214 2,481,097
Source: U.S. Census Bureau, Business Dynamics Statistics at http://www.ces.census.gov/index.php/bds/bds_home
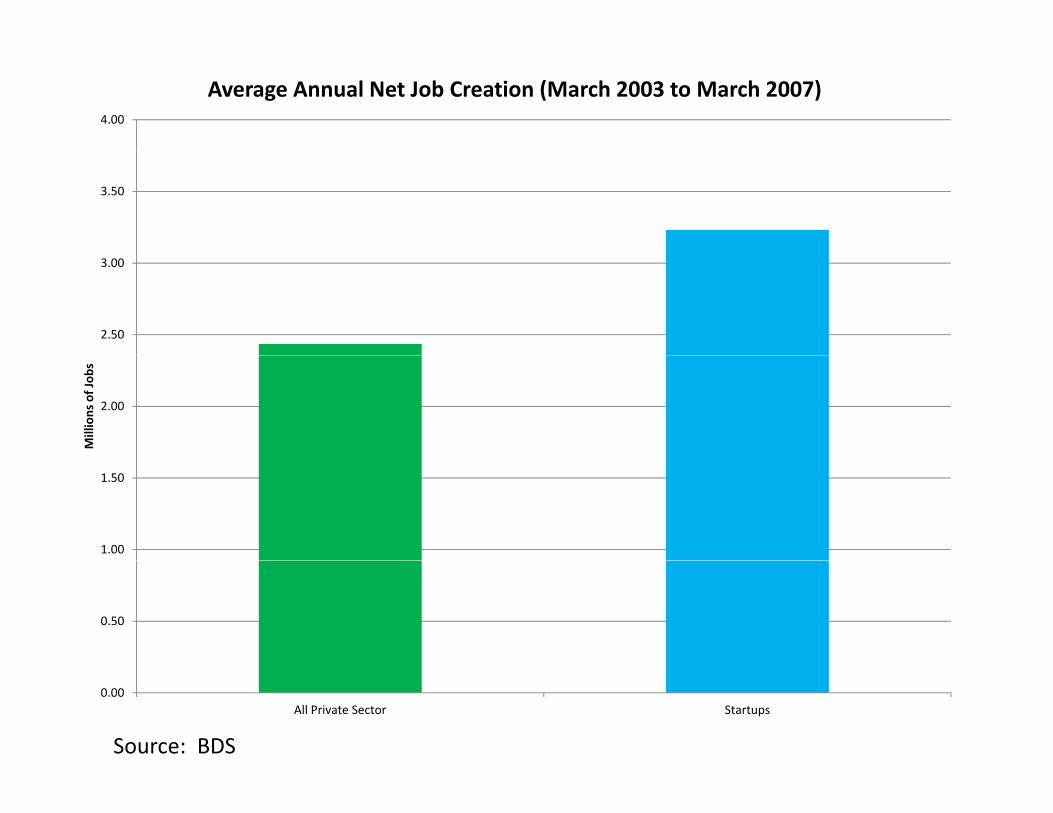
4.00
Average Annual Net Job Creation (March 2003 to March 2007)
3.50
2.50
3.00
2.00
Millions of Job
s
1.00
1.50
0.50
0.00All Private Sector Startups
Source: BDS

5
Job Creation from New Firms and New Establishments of Existing Firms (1980‐2010)
4
3
2
1
Source: BDS
0Avg Annual Job Creation from New Firms ("Startups") Avg Annual Job Creation from New Establishments of Existing Firms

0.2Up or Out Dynamics of Young U.S. Firms
0.15
0.1
0.05
0
Firm Age
Net Employment Growth (Continuing Firms) Job Destruction from Exit

1
90th and 10th Percentiles of Net Employment Growth Rates for Surviving U.S. Private Sector Firms by Firm Age
0.8
0.4
0.6
0
0.2
‐0.2
01 2 3 4 5 6 to 10 11 to 15 16+
‐0.6
‐0.4
Firm Age ClassFirm Age Class
10th Percentile 90th Percentile
Source: Firm‐level data used by Haltiwanger, Jarmin and Miranda (2011)

Industry as Predictor of Size and h fGrowth of Firms?
R‐squared from 6‐digit NAICS effects
Probability Firm has less than 20 employees 0.12
Net Firm Growth Rate (All Firms) 0.06( )
Net Firm Growth Rate (Small Firms) 0.06
Probability firm is a high growth firm (defined as Net_Rate>.2)
0.04
Probability firm is a high growth firm (defined as: Net_Rate > .2 and Net_Level > 10 )
0.03
Sample: All U.S. Private Sector Firms, 2003‐05

Share of Employment in Startups by Firm Size Class
0.25
0.2
0.1
0.15
Sh
are
0.05
0

0.200Net Employment Growth by Base Year Firm Size
0.150
0.1000.100
0.050
0.000
-0.050Base Year Size Base Year Size with Age Controls
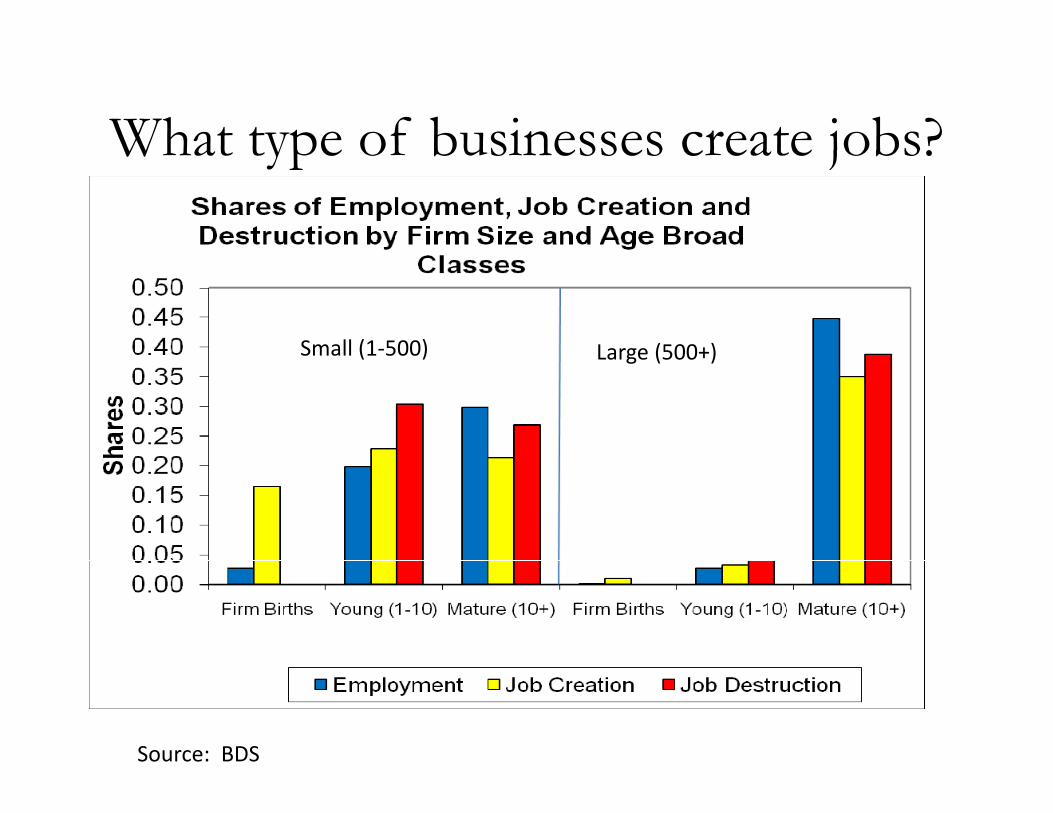
What type of businesses create jobs?What type of businesses create jobs?
Small (1‐500) Large (500+)Small (1 500) Large (500+)
Source: BDS

60
Startups and High Growth (Annual Growth>25 percent) Existing Firms Disproportionately Create Jobs, U.S. Private Sector
50
40
30
20
10
0Startups High Growth Existing Firms
Share of Firms Share of Job Creation
Source: Tabulations from Firm‐Level Data Used in Haltiwanger, Jarmin and Miranda (2011)
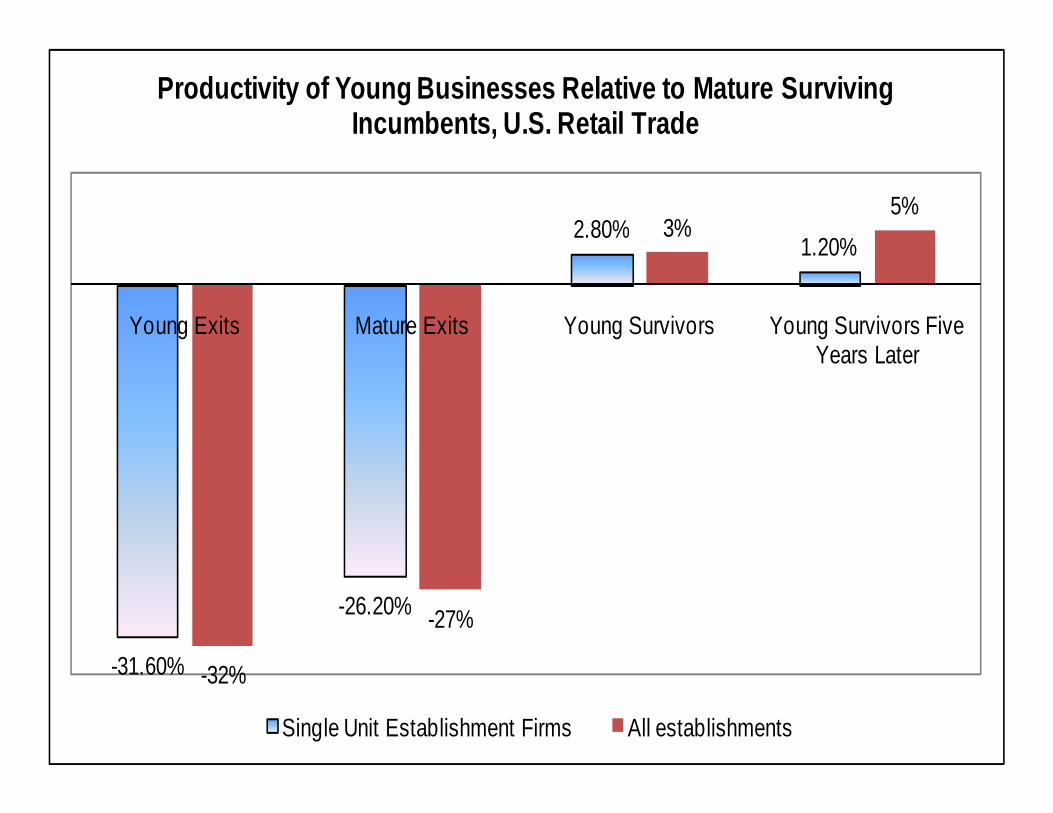
Productivity of Young Businesses Relative to Mature Surviving Incumbents, U.S. Retail Trade
2.80%1 20%
3%5%
1.20%
Young Exits Mature Exits Young Survivors Young Survivors Five Years LaterYears Later
31 60%
-26.20% -27%
-31.60% -32%
Single Unit Establishment Firms All establishments

5Annual Job Creation from Startups, U.S. Private Sector, BDS
4
3
e
2
Rate
1
0
Source: BDS
Job Creation Startups Startups (HP Trend)
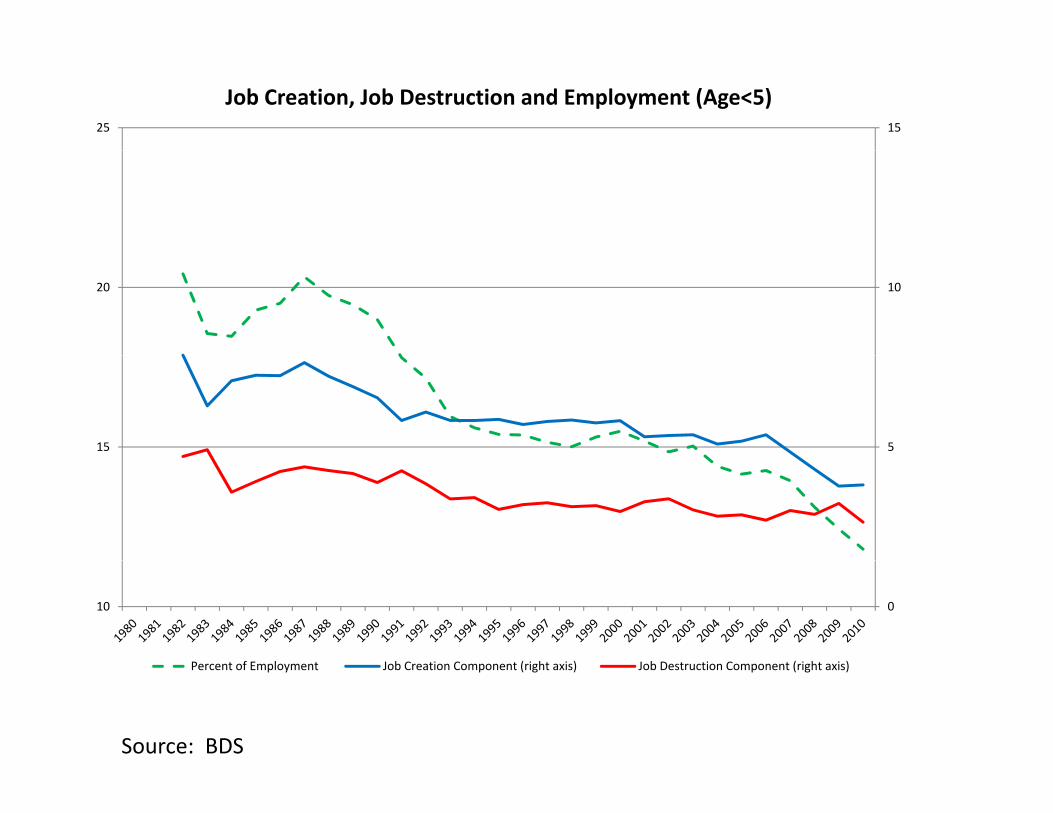
1525
Job Creation, Job Destruction and Employment (Age<5)
1020
515
010
P t f E l t J b C ti C t ( i ht i ) J b D t ti C t ( i ht i )
Source: BDS
Percent of Employment Job Creation Component (right axis) Job Destruction Component (right axis)
A I d t Si St t MU
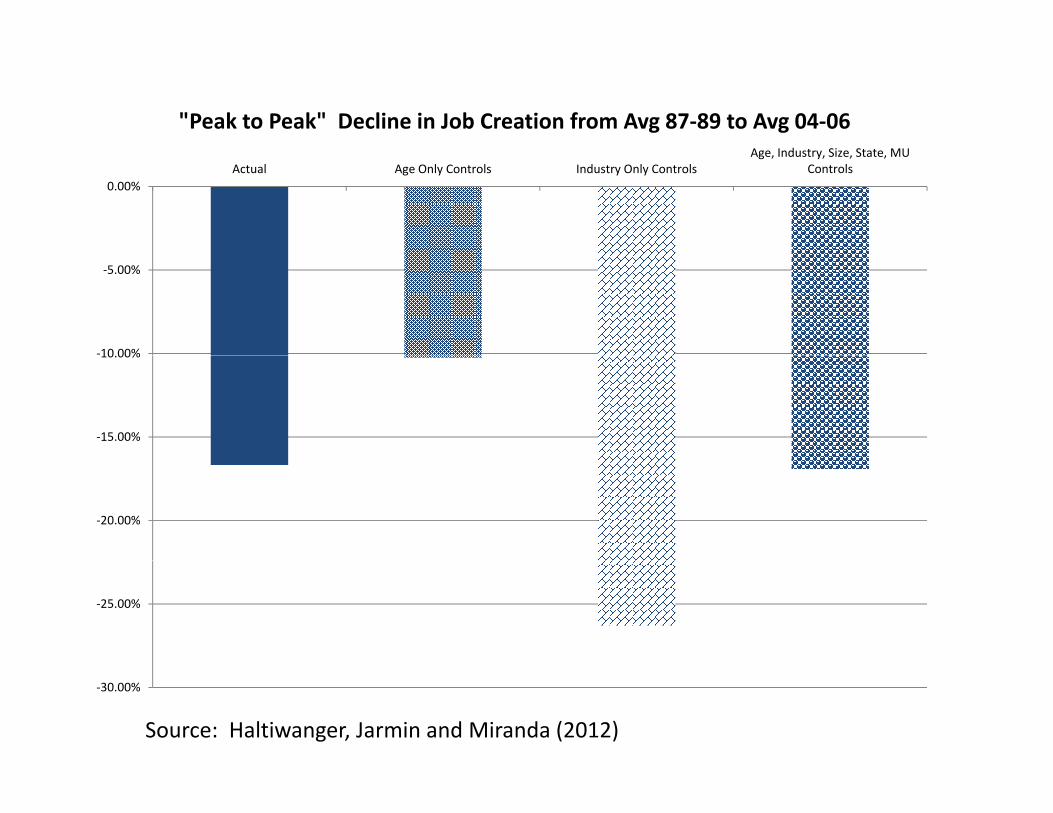
"Peak to Peak" Decline in Job Creation from Avg 87‐89 to Avg 04‐06
0.00%Actual Age Only Controls Industry Only Controls
Age, Industry, Size, State, MU Controls
‐10 00%
‐5.00%
‐15.00%
10.00%
‐20.00%
‐25.00%
Source: Haltiwanger, Jarmin and Miranda (2012)
‐30.00%

Peak to Peak Changes Within State (87/89 to 04/06)
WithiWithin State
Avg Change in Job Creation for Continuers (JC) 17 59%Avg Change in Job Creation for Continuers (JC) -17.59%
Avg Change in Startup Rate -25.01%
Avg Change in Job Destruction (JD) -19.34%
Std Dev of Change in JC 8.16%
Std Dev of Change inJD 10.75%
Std Dev of Change in Startup Rate 13 57%Std Dev of Change in Startup Rate 13.57%
Source: Haltiwanger, Jarmin and Miranda (2012)

BACKGROUND/EXTRA SLIDESBACKGROUND/EXTRA SLIDES

4.00.85MA(3) of CPS Unemployment Escape RateCPS Unemployment Inflow Rate
Unemployment Inflow and Escape Rates, Monthly, CPS
3.5
0.70
0.75
0.80 CPS Unemployment Inflow Rate
2.5
3.0
0.60
0.65
2.0
0.45
0.50
0.55
1.0
1.5
0.35
0.40
0.5
1.0
0 20
0.25
0.30
0.00.15
0.20
1967
1968
1969
1970
1971
1972
1973
1974
1975
1976
1977
1978
1979
1980
1981
1982
1983
1984
1985
1986
1987
1988
1989
1990
1991
1992
1993
1994
1995
1996
1997
1998
1999
2000
2001
2002
2003
2004
2005
2006
2007
2008
2009
2010
2011
2012

Gross Job Creation Levels by Employer Sizey p y
2.8
3.0
2.8
3.0
2.0
2.2
2.4
2.6
2.0
2.2
2.4
2.6
1.2
1.4
1.6
1.8
1.2
1.4
1.6
1.8
Job
Cre
atio
n(m
illion
s)
0.4
0.6
0.8
1.0
0.4
0.6
0.8
1.0
(1 19) (20 99)Size Class
0.0
0.2
0.0
0.2
1992
1993
1994
1995
1996
1997
1998
1999
2000
2001
2002
2003
2004
2005
2006
2007
2008
2009
2010
2011
2012
Quarter
(1-19) (20-99)
(100-499) (500+)
Source: BLS BED
Quarter
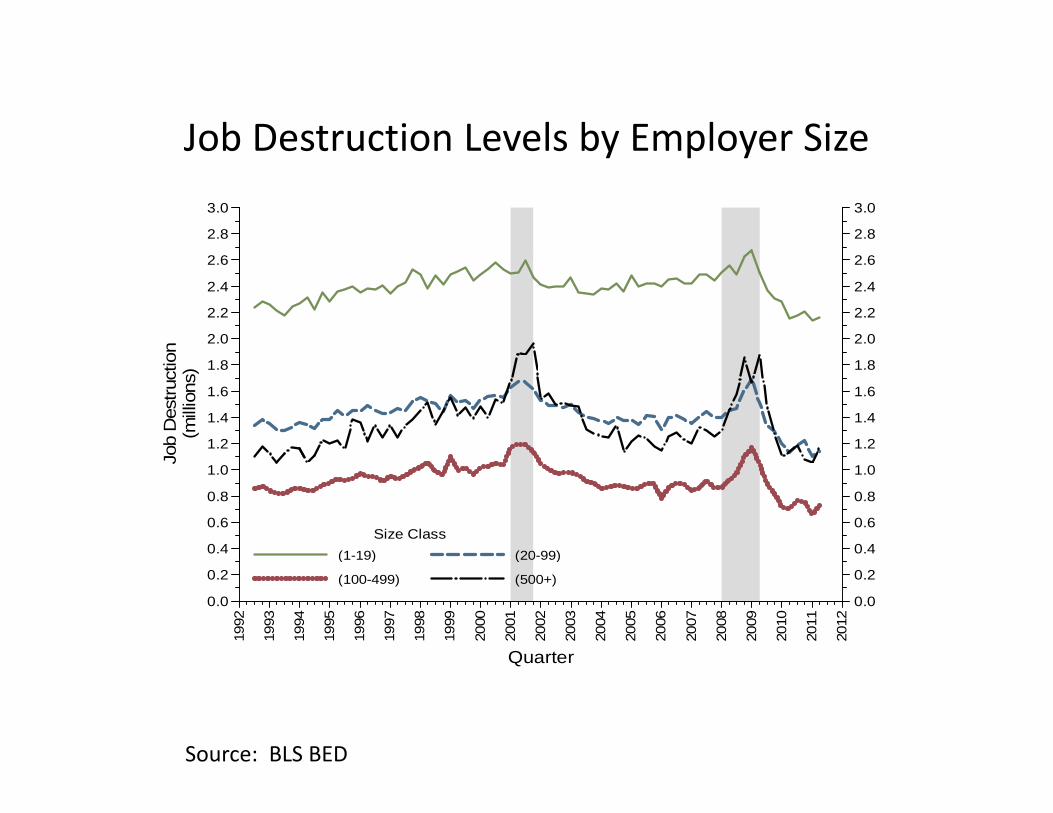
Job Destruction Levels by Employer SizeJob Destruction Levels by Employer Size
2.8
3.0
2.8
3.0
2.0
2.2
2.4
2.6
2.0
2.2
2.4
2.6
on
1.2
1.4
1.6
1.8
1.2
1.4
1.6
1.8
Job
Des
truct
io(m
illio
ns)
0.4
0.6
0.8
1.0
0.4
0.6
0.8
1.0
J
(1-19) (20-99)Size Class
0.0
0.2
0.0
0.2
1992
1993
1994
1995
1996
1997
1998
1999
2000
2001
2002
2003
2004
2005
2006
2007
2008
2009
2010
2011
2012
Quarter
( ) ( )
(100-499) (500+)
Source: BLS BED
Qua te

8000.08000.0Hires by Employer, Size Class, JOLTS (Cumulated to Quarter)
6000 06400.06800.07200.07600.0
6000 06400.06800.07200.07600.0
(1 - 9) (10 - 49)
(50 - 249) (250 - 999)
(1000 - 4999) (5000+)
Size Class
4400.04800.05200.05600.06000.0
4400.04800.05200.05600.06000.0
s ands
)
2400 02800.03200.03600.04000.0
2400 02800.03200.03600.04000.0
Hire
(thou
sa
800 01200.01600.02000.02400.0
800 01200.01600.02000.02400.0
0.0400.0800.0
0.0400.0800.0
2001
2002
2003
2004
2005
2006
2007
2008
2009
2010
2011
2012
QQuarter

Hires Rates by Employer, Size Class, JOLTS, Quarterly Avg of Monthly Rates
17 018.0
19.0
20.0
17 018.0
19.0
20.0
(1 - 9) (10 - 49)
(50 - 249) (250 - 999)
Size Class
13 0
14.0
15.0
16.0
17.0
13 0
14.0
15.0
16.0
17.0 (50 249) (250 999)
(1000 - 4999) (5000+)
9 0
10.0
11.0
12.013.0
9 0
10.0
11.0
12.013.0
Hire
s(r
ate)
0
6.0
7.0
8.0
9.0
0
6.0
7.0
8.0
9.0
3.0
4.0
5.0
3.0
4.0
5.0
2001
2002
2003
2004
2005
2006
2007
2008
2009
2010
2011
2012
2 2 2 2 2 2 2 2 2 2 2 2
Quarter
Related Documents