A monthly research report from the EBRI Education and Research Fund © 2013 Employee Benefit Research Institute December 2013 • No. 393 Findings from the 2013 EBRI/Greenwald & Associates Consumer Engagement in Health Care Survey By Paul Fronstin, Ph.D., Employee Benefit Research Institute AT A GLANCE The 2013 EBRI/Greenwald & Associates Consumer Engagement in Health Care Survey (CEHCS) finds continued slow growth in consumer-driven health plans (CDHPs): 9.7 percent of the population was enrolled in a CDHP, up from 9.6 percent in 2012, while enrollment in high-deductible health plans (HDHPs) increased from 16 percent in 2012 to 18 percent in 2013. Overall, 26.1 million individuals with private insurance, representing 15 percent of that market, were either in a CDHP, or in an HDHP that was eligible for a health savings account (HSA) but had not opened the account. Unlike in prior years, when health reimbursement arrangements (HRAs) and HSAs were examined separately, HRA enrollment fell, while HSA enrollment increased. The 2013 CEHCS also found that a growing share of the HDHP market was HSA-eligible. When examining only the number of people enrolled in HSA- or HSA-eligible plans, the overall number of individuals with an HSA or enrolled in an HSA-eligible plan increased from 17.5 million to 20.4 million, a 16 percent increase. This study finds evidence that adults in a CDHP and those in an HDHP were more likely than those in a traditional plan to exhibit a number of cost-conscious behaviors. Specifically, those in a CDHP were more likely than those with traditional coverage to say that they had checked whether the plan would cover care; asked for a generic drug instead of a brand name; talked to their doctors about prescription options and costs; talked to their doctors about other treatment options and costs; asked a doctor to recommend less costly prescriptions; developed a budget to manage health care expenses; checked the price of a service before getting care; and used an online cost-tracking tool provided by the health plan. There is also some evidence that adults in a CDHP were more likely than those in a traditional plan to be engaged in their choice of health plan: Those in a CDHP were more likely than those with traditional coverage to say that they had visited health plans’ websites to learn about their plans; attended a meeting where health plan choices were explained; used other websites to learn about health plan choices; and consulted with an insurance broker to understand plan choices. CDHP enrollees were more likely than traditional-plan enrollees to take advantage of various wellness programs, such as health-risk assessments, health-promotion programs, and biometric screenings. In addition, financial incentives mattered more to CDHP enrollees than to traditional-plan enrollees.

Welcome message from author
This document is posted to help you gain knowledge. Please leave a comment to let me know what you think about it! Share it to your friends and learn new things together.
Transcript
A monthly research report from the EBRI Education and Research Fund © 2013 Employee Benefit Research Institute
December 2013 • No. 393
Findings from the 2013 EBRI/Greenwald & Associates Consumer Engagement in Health Care Survey By Paul Fronstin, Ph.D., Employee Benefit Research Institute
A T A G L A N C E
The 2013 EBRI/Greenwald & Associates Consumer Engagement in Health Care Survey (CEHCS) finds continued slow growth in consumer-driven health plans (CDHPs): 9.7 percent of the population was enrolled in a CDHP, up from 9.6 percent in 2012, while enrollment in high-deductible health plans (HDHPs) increased from 16 percent in 2012 to 18 percent in 2013. Overall, 26.1 million individuals with private insurance, representing 15 percent of that market, were either in a CDHP, or in an HDHP that was eligible for a health savings account (HSA) but had not opened the account.
Unlike in prior years, when health reimbursement arrangements (HRAs) and HSAs were examined separately, HRA enrollment fell, while HSA enrollment increased. The 2013 CEHCS also found that a growing share of the HDHP market was HSA-eligible. When examining only the number of people enrolled in HSA- or HSA-eligible plans, the overall number of individuals with an HSA or enrolled in an HSA-eligible plan increased from 17.5 million to 20.4 million, a 16 percent increase.
This study finds evidence that adults in a CDHP and those in an HDHP were more likely than those in a traditional plan to exhibit a number of cost-conscious behaviors. Specifically, those in a CDHP were more likely than those with traditional coverage to say that they had checked whether the plan would cover care; asked for a generic drug instead of a brand name; talked to their doctors about prescription options and costs; talked to their doctors about other treatment options and costs; asked a doctor to recommend less costly prescriptions; developed a budget to manage health care expenses; checked the price of a service before getting care; and used an online cost-tracking tool provided by the health plan.
There is also some evidence that adults in a CDHP were more likely than those in a traditional plan to be engaged in their choice of health plan: Those in a CDHP were more likely than those with traditional coverage to say that they had visited health plans’ websites to learn about their plans; attended a meeting where health plan choices were explained; used other websites to learn about health plan choices; and consulted with an insurance broker to understand plan choices.
CDHP enrollees were more likely than traditional-plan enrollees to take advantage of various wellness programs, such as health-risk assessments, health-promotion programs, and biometric screenings. In addition, financial incentives mattered more to CDHP enrollees than to traditional-plan enrollees.

ebri.org Issue Brief • December 2013 • No. 393 2
Paul Fronstin is director of the Health Research and Education Program at the Employee Benefit Research Institute (EBRI). This Issue Brief was written with assistance from the Institute’s research and editorial staffs. Any views expressed in this report are those of the author and should not be ascribed to the officers, trustees, or other sponsors of EBRI, EBRI-ERF, or their staffs. Neither EBRI nor EBRI-ERF lobbies or takes positions on specific policy proposals. EBRI invites comment on this research.
Copyright Information: This report is copyrighted by the Employee Benefit Research Institute (EBRI). It may be used without permission but citation of the source is required.
Recommended Citation: Paul Fronstin, “Findings from the 2013 EBRI/Greenwald & Associates Consumer Engagement in Health Care Survey,” EBRI Issue Brief, no. 393 (December 2013).
Report availability: This report is available on the Internet at www.ebri.org
This survey was made possible with support from: Blue Cross and Blue Shield Association
Chevron
Deseret Mutual
HealthEquity
National Rural Electric Cooperative Association
Optum
Table of Contents Introduction .......................................................................................................................................................... 4
Enrollment in CDHPs and HDHPs ............................................................................................................................ 5
Familiarity With CDHP ............................................................................................................................................ 8
Cost-Conscious Behavior ........................................................................................................................................ 8
Health Plan Choice Decisions ................................................................................................................................ 10
Availability and Use of Cost Information ................................................................................................................ 10
Participation in Wellness Programs ........................................................................................................................ 11
Conclusion .......................................................................................................................................................... 16
Definitions .......................................................................................................................................................... 22
Consumer-Driven Health Plans .......................................................................................................................... 22
Health Savings Accounts .................................................................................................................................. 22
Eligibility ..................................................................................................................................................... 22
Contributions ............................................................................................................................................... 22
Distributions ................................................................................................................................................ 22
Health Reimbursement Arrangements ............................................................................................................... 23
Contributions ............................................................................................................................................... 23
Distributions ................................................................................................................................................ 23
References .......................................................................................................................................................... 24
Endnotes ............................................................................................................................................................ 24

ebri.org Issue Brief • December 2013 • No. 393 3
Figures Figure 1, Premium Increases Among Employers With 10 or More Employees, Worker Earnings and Inflation,
1988–2013 ............................................................................................................................................... 6
Figure 2, Distribution of Individuals Covered by Private Health Insurance, by Type of Health Plan, 2005–2013 ............. 6
Figure 3, HSA and HRA Enrollment Rates, 2007–2013 .............................................................................................. 7
Figure 4, Number of Years Covered by Current Health Plan, by Type of Health Plan, 2013 .......................................... 7
Figure 5, Length of Time With HRA or HSA, 2005‒2013 ........................................................................................... 9
Figure 6, Familiarity With Consumer-Driven Health Plans, 2013 ................................................................................. 9
Figure 7, Cost-Conscious Decision Making, by Type of Health Plan, 2013 ................................................................. 10
Figure 8, Trends in Cost-Conscious Decision Making, by Type of Health Plan, 2005–2013 ......................................... 11
Figure 9, Informed Decision Making for Health Plan Choice, by Type of Health Plan, 2013 ........................................ 13
Figure 10, Availability and Use of Cost Information, 2013 ....................................................................................... 13
Figure 11, Types of Cost Information Sought, by Type of Health Plan, 2013 ............................................................ 14
Figure 12, Employer Offers Wellness Program, by Type of Health Plan, 2013 ........................................................... 14
Figure 13, Individual Participates in Wellness Program Offered by Employer Among Those Offered a Wellness Program, by Type of Health Plan, 2013 ................................................................................................................... 15
Figure 14, Employer Offers Cash Incentive or Reward for Participating in Wellness Program, among Workers Whose Employer Offers Wellness Program, by Type of Plan, 2013 ......................................................................... 15
Figure 15, Reasons for Participating in Employer’s Wellness Program, 2013 ............................................................. 17
Figure 16, Reasons for Not Participating in Employer's Wellness Program among Those Offered but Not Participating in Program, 2013 ........................................................................................................................................ 17
Figure 17, Percentage of Individuals Reporting That They Would Probably Participate in Employer’s Wellness Program, by Various Financial Incentives and Type of Health Plan, 2013 ................................................................... 18
Figure 18, Percentage of Individuals Reporting That They Would Probably Participate in Employer’s Wellness Program, by Various Cost-Sharing Incentives and Type of Health Plan, 2013 ............................................................. 18
Figure 19, Percentage of Individuals Reporting That They Used an App More than Once for a Smartphone or Tablet, by Various Health-Related Purposes and Type of Health Plan, 2013 ............................................................ 19
Figure 20, Interest in Using an App for a Smartphone or Tablet, by Health-Related Function, 2013 ........................... 19
ebri.org Issue Brief • December 2013 • No. 393 4
Findings from the 2013 EBRI/Greenwald & Associates Consumer Engagement in Health Care Survey By Paul Fronstin, Ph.D., Employee Benefit Research Institute
Introduction
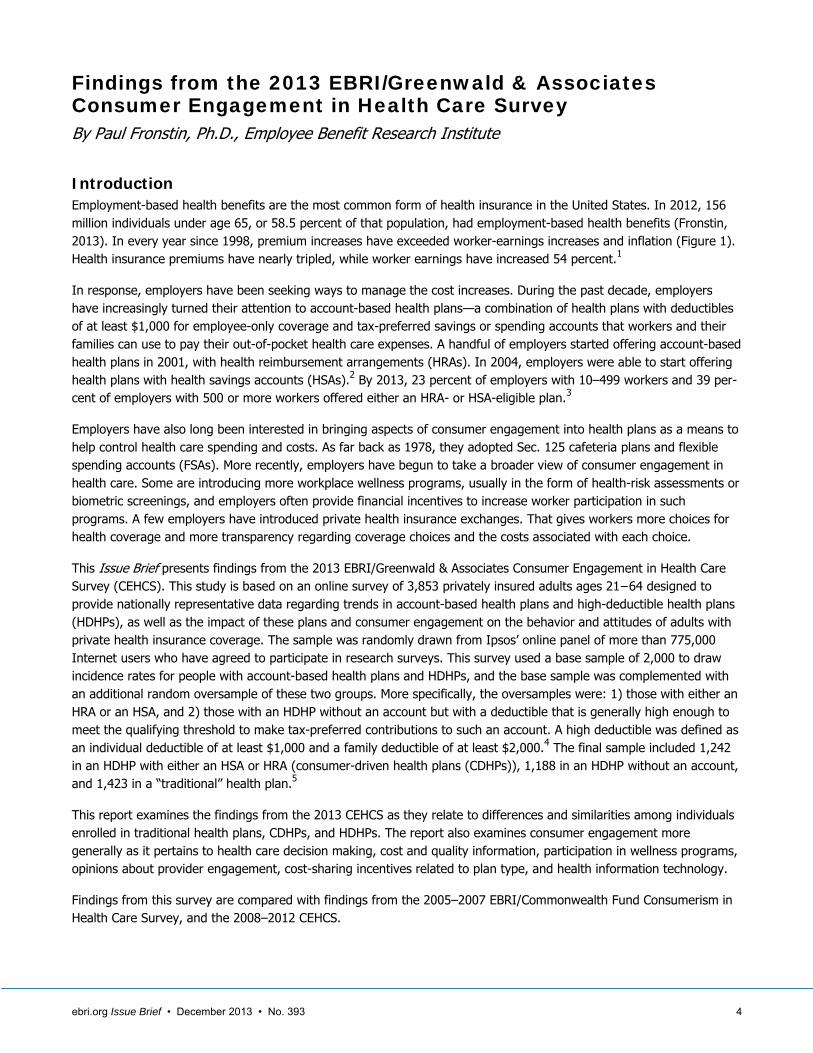
Employment-based health benefits are the most common form of health insurance in the United States. In 2012, 156 million individuals under age 65, or 58.5 percent of that population, had employment-based health benefits (Fronstin, 2013). In every year since 1998, premium increases have exceeded worker-earnings increases and inflation (Figure 1). Health insurance premiums have nearly tripled, while worker earnings have increased 54 percent.1
In response, employers have been seeking ways to manage the cost increases. During the past decade, employers have increasingly turned their attention to account-based health plans—a combination of health plans with deductibles of at least $1,000 for employee-only coverage and tax-preferred savings or spending accounts that workers and their families can use to pay their out-of-pocket health care expenses. A handful of employers started offering account-based health plans in 2001, with health reimbursement arrangements (HRAs). In 2004, employers were able to start offering health plans with health savings accounts (HSAs).2 By 2013, 23 percent of employers with 10‒499 workers and 39 per-cent of employers with 500 or more workers offered either an HRA- or HSA-eligible plan.3
Employers have also long been interested in bringing aspects of consumer engagement into health plans as a means to help control health care spending and costs. As far back as 1978, they adopted Sec. 125 cafeteria plans and flexible spending accounts (FSAs). More recently, employers have begun to take a broader view of consumer engagement in health care. Some are introducing more workplace wellness programs, usually in the form of health-risk assessments or biometric screenings, and employers often provide financial incentives to increase worker participation in such programs. A few employers have introduced private health insurance exchanges. That gives workers more choices for health coverage and more transparency regarding coverage choices and the costs associated with each choice.
This Issue Brief presents findings from the 2013 EBRI/Greenwald & Associates Consumer Engagement in Health Care Survey (CEHCS). This study is based on an online survey of 3,853 privately insured adults ages 21−64 designed to provide nationally representative data regarding trends in account-based health plans and high-deductible health plans (HDHPs), as well as the impact of these plans and consumer engagement on the behavior and attitudes of adults with private health insurance coverage. The sample was randomly drawn from Ipsos’ online panel of more than 775,000 Internet users who have agreed to participate in research surveys. This survey used a base sample of 2,000 to draw incidence rates for people with account-based health plans and HDHPs, and the base sample was complemented with an additional random oversample of these two groups. More specifically, the oversamples were: 1) those with either an HRA or an HSA, and 2) those with an HDHP without an account but with a deductible that is generally high enough to meet the qualifying threshold to make tax-preferred contributions to such an account. A high deductible was defined as an individual deductible of at least $1,000 and a family deductible of at least $2,000.4 The final sample included 1,242 in an HDHP with either an HSA or HRA (consumer-driven health plans (CDHPs)), 1,188 in an HDHP without an account, and 1,423 in a “traditional” health plan.5
This report examines the findings from the 2013 CEHCS as they relate to differences and similarities among individuals enrolled in traditional health plans, CDHPs, and HDHPs. The report also examines consumer engagement more generally as it pertains to health care decision making, cost and quality information, participation in wellness programs, opinions about provider engagement, cost-sharing incentives related to plan type, and health information technology.
Findings from this survey are compared with findings from the 2005‒2007 EBRI/Commonwealth Fund Consumerism in Health Care Survey, and the 2008‒2012 CEHCS.

ebri.org Issue Brief • December 2013 • No. 393 5
Enrollment in CDHPs and HDHPs Individuals with a deductible of at least $1,000 for individual coverage, or $2,000 for family coverage, who also have an HSA or HRA were assigned to the CDHP group in the CEHCS. Those with a deductible of at least $1,000 for individual coverage (or $2,000 for family coverage) who did not have an account were assigned to the HDHP group. Thus, the HDHP group includes individuals enrolled in an HSA-eligible health plan who had not opened the HSA. More detail about the methodology is provided in the appendix.
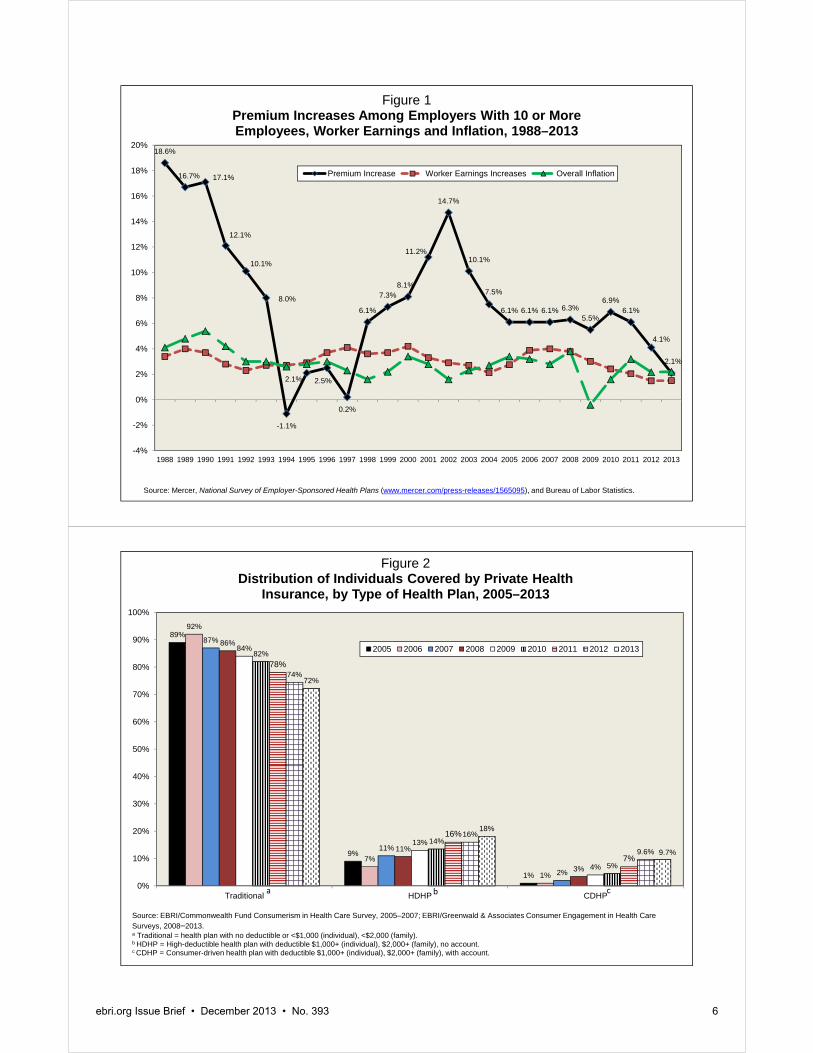
In 2013, 9.7 percent of the population was enrolled in a CDHP, about the same as in 2012 (9.6 percent); enrollment in HDHPs increased from 16 percent in 2012 to 18 percent in 2013 (Figure 2). The 9.7 percent of the population with a CDHP represents 11.8 million adults ages 21–64 with private insurance, while the 18 percent with an HDHP represents 22.1 million of those ages 21‒64 with private insurance. Among the 22.1 million individuals with an HDHP, 42 percent (or 9.3 million) reported that they were eligible for an HSA but did not have such an account. Thus, overall, 21.1 million adults ages 21–64 with private insurance, representing 17.3 percent of that market, were either in a CDHP or in an HDHP that was eligible for an HSA but had not opened the account. When their children are counted, 26.1 million individuals with private insurance, representing 15 percent of the market, were either in a CDHP or an HSA-eligible plan.
When HRAs and HSAs are examined separately in the CEHCS, it was found that HRA enrollment fell, while HSA enrollment increased (Figure 3). It was also found that a growing share of the HDHP market was HSA-eligible. When examining only those enrolled in HSA- or HSA-eligible plans, the overall number of individuals with an HSA or enrolled in an HSA-eligible plan increased 16 percent from 17.5 million to 20.4 million, according to the CEHCS.
By way of comparison, a number of other surveys track enrollment in CDHPs. America’s Health Insurance Plans (AHIP) found that the number of people enrolled in an HSA-eligible plan increased from 13.5 million to 15.5 million between January 2012 and January 2013, a 15 percent increase.6 Mercer found that the percentage of workers with employment-based coverage covered by a CDHP increased from 16 percent to 18 percent between 2012 and 2013, a 13 percent increase.7 The National Health Interview Survey (NHIS) found that the percentage of individuals with private insurance covered by a CDHP barely budged—from 10.8 percent in 2012 to 10.9 percent in 2013.8 The Kaiser Family Foundation (KFF) found that the percentage of workers with a CDHP increased from 19 percent to 20 percent between 2012 and 2013, a 5 percent increase.9
The increase tracked between 2012 and 2013 was similar in the CEHCS (16 percent), AHIP (15 percent), and Mercer (13 percent) surveys. Note that the Mercer survey combined HRA with HSA enrollment. Total enrollment estimates in the CEHCS were higher than AHIP’s census. The enrollment estimates in the CEHCS may have been higher for a number of reasons:
First, the surveys were conducted at different times. The CEHCS was conducted in August 2013, and the AHIP census was conducted in January 2013.
Second, the AHIP census was based on 91 companies. Some insurers may not be reporting HSA-eligible enrollment numbers to AHIP, which would mean that the AHIP census underestimates HSA-eligible enrollment.
Third, the CEHCS may be overestimating the percentage of individuals in an HSA-eligible plan, as it is based on self-reported eligibility status.
The detailed KFF estimates on HSAs and HRAs are different than the other surveys mentioned above. KFF found that offer rates for HSA-eligible plans fell from 26 percent to 17 percent between 2012 and 2013.10 The drop in offer rates was confined to firms with three to 199 workers and resulted in a drop in enrollment,11 but KFF also found a drop in enrollment among employers with 200‒999 workers (though the decline was not statistically significant).12 These results contrast with AHIP’s 15 percent increase and the CEHCS’ 16 percent increase in HSA-eligible enrollment between 2012 and 2013, as well as Mercer’s 13 percent overall increase for CDHPs.
18.6%
16.7% 17.1%
12.1%
10.1%
8.0%
-1.1%
2.1% 2.5%
0.2%
6.1%
7.3%8.1%
11.2%
14.7%
10.1%
7.5%
6.1% 6.1% 6.1% 6.3%5.5%
6.9%6.1%
4.1%
2.1%
-4%
-2%
0%
2%
4%
6%
8%
10%
12%
14%
16%
18%
20%
1988 1989 1990 1991 1992 1993 1994 1995 1996 1997 1998 1999 2000 2001 2002 2003 2004 2005 2006 2007 2008 2009 2010 2011 2012 2013
Figure 1Premium Increases Among Employers With 10 or More Employees, Worker Earnings and Inflation, 1988–2013
Premium Increase Worker Earnings Increases Overall Inflation
Source: Mercer, National Survey of Employer-Sponsored Health Plans (www.mercer.com/press-releases/1565095), and Bureau of Labor Statistics.
89%
9%
1%
92%
7%
1%
87%
11%
2%
86%
11%
3%
84%
13%
4%
82%
14%
5%
78%
16%
7%
74%
16%
9.6%
72%
18%
9.7%
0%
10%
20%
30%
40%
50%
60%
70%
80%
90%
100%
Traditional HDHP CDHP
Figure 2Distribution of Individuals Covered by Private Health
Insurance, by Type of Health Plan, 2005–2013
2005 2006 2007 2008 2009 2010 2011 2012 2013
Source: EBRI/Commonwealth Fund Consumerism in Health Care Survey, 2005–2007; EBRI/Greenwald & Associates Consumer Engagement in Health Care Surveys, 2008–2013.a Traditional = health plan with no deductible or <$1,000 (individual), <$2,000 (family).b HDHP = High-deductible health plan with deductible $1,000+ (individual), $2,000+ (family), no account.c CDHP = Consumer-driven health plan with deductible $1,000+ (individual), $2,000+ (family), with account.
a b c
ebri.org Issue Brief • December 2013 • No. 393 6

4.6%
1.3%
0.7%
4.5%
2.0%
1.4%
4.9%
2.1%1.9%
5.0%
2.3% 2.2%
6.1%
4.1%
2.9%
5.8%
5.4%
4.2%
7.6%
5.9%
3.8%
0%
1%
2%
3%
4%
5%
6%
7%
8%
HDHP: HSA-eligible CDHP: HSA CDHP: HRA
Figure 3HSA and HRA Enrollment Rates, 2007–2013
2007 2008 2009 2010 2011 2012 2013
Source: EBRI/Commonwealth Fund Consumerism in Health Care Survey, 2007; EBRI/Greenwald & Associates Consumer Engagement in Health Care Survey, 2008–2013.
14%
19%21%
44%
15%
25%*23%
36%*
17%
28%*27%*
28%*
0%
5%
10%
15%
20%
25%
30%
35%
40%
45%
50%
Less Than One Year 1–2 Years 3–4 Years 5 Years or More
Figure 4Number of Years Covered by Current Health Plan,
by Type of Health Plan, 2013
Traditional HDHP CDHP
Source: EBRI/Greenwald & Associates Consumer Engagement in Health Care Survey, 2013.a Traditional = health plan with no deductible or <$1,000 (individual), <$2,000 (family).b HDHP = High-deductible health plan with deductible $1,000+ (individual), $2,000+ (family), no account.c CDHP = Consumer-driven health plan w/ deductible $1,000+ (individual), $2,000+ (family), with account.* Difference between HDHP/CDHP and Traditional is statistically significant at the p ≤ 0.05 or better.
a b c
ebri.org Issue Brief • December 2013 • No. 393 7

ebri.org Issue Brief • December 2013 • No. 393 8
Length of Time in Health Plan
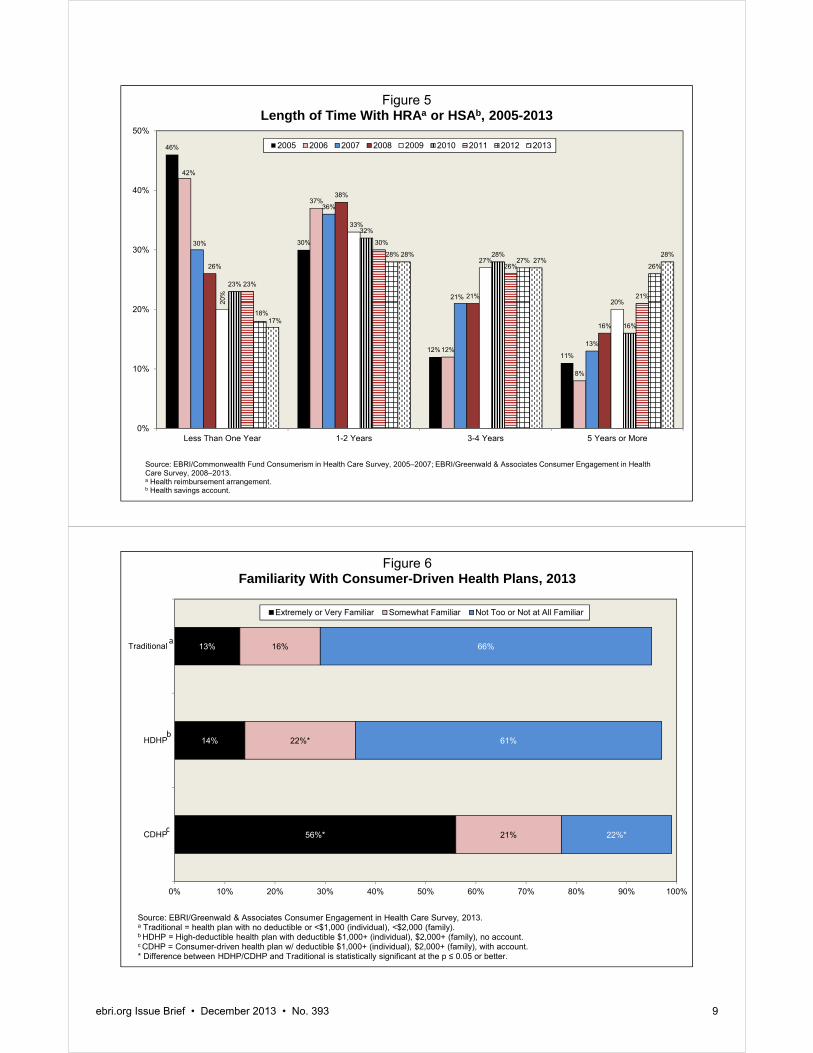
The amount of time individuals have been in a CDHP is shorter than others who have been enrolled in traditional coverage. Among individuals with traditional coverage, 21 percent had been in their plan for three to four years and 44 percent for five or more years. This compared with 27 percent and 28 percent, respectively, among those in a CDHP (Figure 4). While still lower than the percentage of individuals with traditional coverage, the number of people with a CDHP and the length of time they have been enrolled in a CDHP plan have been increasing. In 2013, 28 percent of CDHP enrollees reported that they had been in the health plan at least five years, up from 8 percent in 2006 (Figure 5).
Familiarity With CDHP Most people with a CDHP said they were familiar with the plan. Three-quarters (77 percent) of those with a CDHP were extremely, very, or somewhat familiar with it (Figure 6). In contrast, 29 percent of individuals with traditional coverage were extremely, very, or somewhat familiar with a CDHP, and 36 percent of individuals with an HDHP were extremely, very, or somewhat familiar with a CDHP.
Cost-Conscious Behavior The theory behind account-based plans and plans with higher deductibles is that the cost-sharing structure will be more likely to engage individuals in their health care spending and selection, compared with those enrolled in more traditional coverage. This study finds evidence that adults in a CDHP and those in an HDHP were, in fact, more likely than those in a traditional plan to exhibit a number of cost-conscious behaviors. Specifically, among privately-insured adults ages 21-64 who received health care in the past 12 months, those in a CDHP and those in an HDHP were more likely than those with traditional coverage to say that they had:
Checked whether the plan would cover care (57 percent CDHP and 49 percent HDHP vs. 39 percent traditional).
Asked for a generic drug instead of a brand name (50 percent CDHP and 47 percent HDHP vs. 37 percent traditional).
Talked to their doctors about prescription options and costs (40 percent CDHP and 34 percent HDHP vs. 28 percent traditional).
Talked to their doctors about other treatment options and costs (36 percent CDHP and 33 percent HDHP vs. 26 percent traditional).
Asked a doctor to recommend less costly prescriptions (38 percent CDHP and 36 percent HDHP vs. 27 percent traditional).
Developed a budget to manage health care expenses (28 percent CDHP vs. 15 percent traditional).
Checked the price of a service before getting care (39 percent CDHP and 33 percent HDHP vs. 26 percent traditional).
Used an online cost-tracking tool provided by the health plan (25 percent CDHP vs. 12 percent traditional) (Figure 7).
There has been no clear increase in the share of CDHP enrollees ages 21‒64 who received health care in the 12 months before the survey who reported cost-conscious decision-making over the nine years of the survey (Figure 8).
46%
30%
12%11%
42%
37%
12%
8%
30%
36%
21%
13%
26%
38%
21%
16%
20%
33%
27%
20%
23%
32%
28%
16%
23%
30%
26%
21%
18%
28%27%
26%
17%
28%27%
28%
0%
10%
20%
30%
40%
50%
Less Than One Year 1-2 Years 3-4 Years 5 Years or More
Figure 5Length of Time With HRAa or HSAb, 2005-2013
2005 2006 2007 2008 2009 2010 2011 2012 2013
Source: EBRI/Commonwealth Fund Consumerism in Health Care Survey, 2005–2007; EBRI/Greenwald & Associates Consumer Engagement in Health Care Survey, 2008–2013.a Health reimbursement arrangement.b Health savings account.
56%*
14%
13%
21%
22%*
16%
22%*
61%
66%
0% 10% 20% 30% 40% 50% 60% 70% 80% 90% 100%
CDHP
HDHP
Traditional
Figure 6Familiarity With Consumer-Driven Health Plans, 2013
Extremely or Very Familiar Somewhat Familiar Not Too or Not at All Familiar
Source: EBRI/Greenwald & Associates Consumer Engagement in Health Care Survey, 2013.a Traditional = health plan with no deductible or <$1,000 (individual), <$2,000 (family).b HDHP = High-deductible health plan with deductible $1,000+ (individual), $2,000+ (family), no account.c CDHP = Consumer-driven health plan w/ deductible $1,000+ (individual), $2,000+ (family), with account.* Difference between HDHP/CDHP and Traditional is statistically significant at the p ≤ 0.05 or better.
a
b
c
ebri.org Issue Brief • December 2013 • No. 393 9

ebri.org Issue Brief • December 2013 • No. 393 10
25%*
39%*
28%*
38%*
36%*
40%*
50%*
57%*
13%
33%*
17%
36%*
33%*
34%*
47%*
49%*
12%
26%
15%
27%
26%
28%
37%
39%
0% 10% 20% 30% 40% 50% 60%
Used online cost-tracking tool provided by health plan
Checked price of service before getting care
Developed budget to manage health care expenses
Asked doctor to recommend less costly prescription drug
Talked to doctor about treatment options and costs
Talked to doctor about prescription options and costs
Asked for generic drug instead of brand name drug
Checked whether plan would cover care
Figure 7Cost-Conscious Decision Making, by Type of Health Plan, 2013
(Percentage of Privately Insured Adults Ages 21–64 Who Received Health Care in Past 12 Months)
Traditional
HDHP
CDHP
Source: EBRI/Greenwald & Associates Consumer Engagement in Health Care Survey, 2013.a Traditional = health plan with no deductible or <$1,000 (individual), <$2,000 (family).b HDHP = High-deductible health plan with deductible $1,000+ (individual), $2,000+ (family), no account.c CDHP = Consumer-driven health plan with deductible $1,000+ (individual), $2,000+ (family), with account.* Difference between HDHP/CDHP and Traditional is statistically significant at p ≤ 0.05 or better.
a
b
c
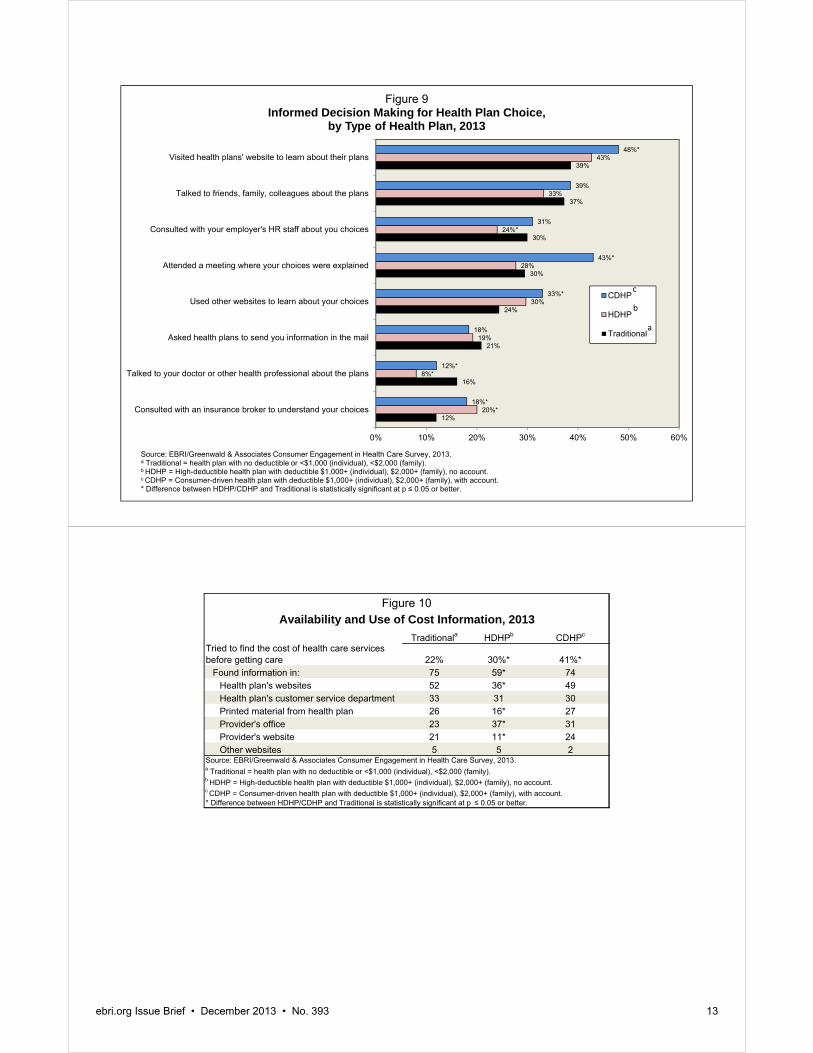
Health Plan Choice Decisions There is also some evidence that adults in a CDHP were more likely than those in a traditional plan to be engaged in their choice of health plan. Specifically, those in a CDHP were more likely than those with traditional coverage to say that they had visited health plans’ websites to learn about their plans (48 percent CDHP vs. 39 percent traditional); attended a meeting where health plan choices were explained (43 percent CDHP vs. 30 percent traditional); used other websites to learn about health plan choices (33 percent CDHP vs. 24 percent traditional); and consulted with an insurance broker to understand plan choices (18 percent CDHP vs. 12 percent traditional) (Figure 9). There were few differences between HDHP and traditional plan enrollees.
Availability and Use of Cost Information The incentives of CDHPs are designed to promote heightened sensitivity to cost in people’s decisions about their health care. Yet the ability of people to make informed decisions is highly dependent on the extent to which they have access to useful information.
CDHP enrollees and HDHP enrollees were more likely than traditional plan enrollees to report that they tried to find cost information before getting care (Figure 10). CDHP enrollees and traditional plan enrollees were equally likely to have found information from various sources.
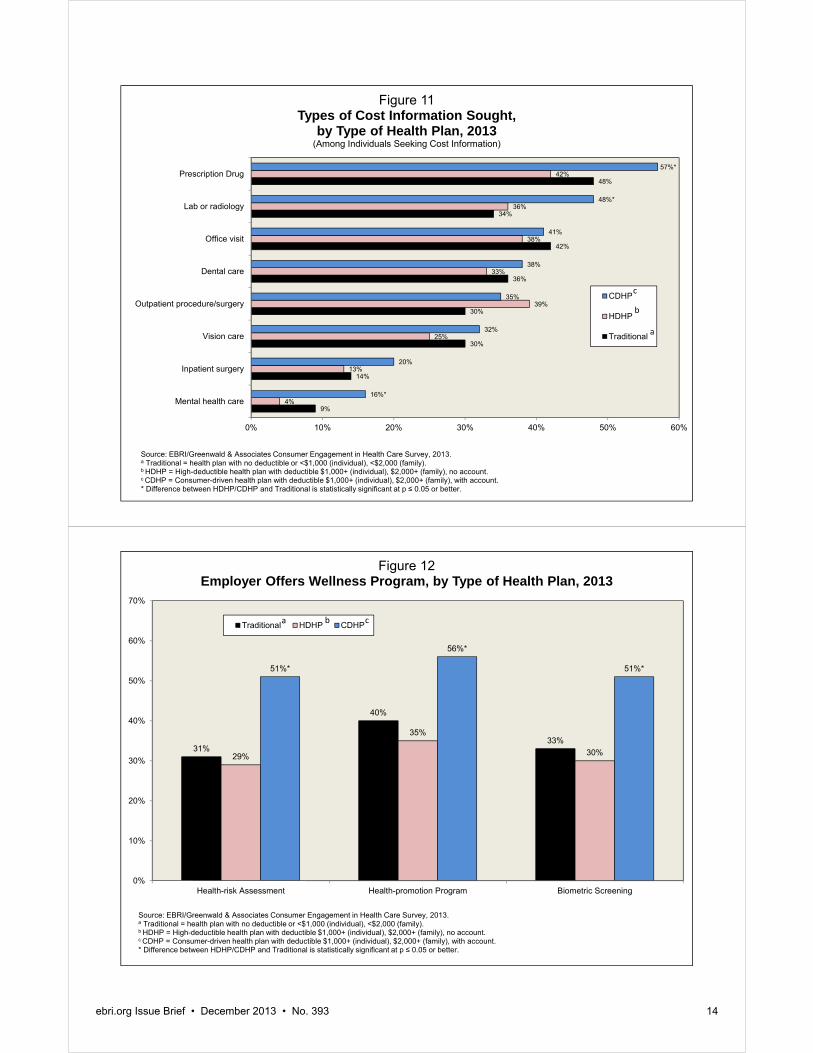
HDHP enrollees were less likely than traditional plan enrollees to have found information on the cost of health care services. Among individuals who sought cost information, CDHP enrollees were more likely than traditional plan enrollees to have sought cost information for prescription drugs, lab or radiology treatment, and mental health services (Figure 11).

2005 2006 2007 2008 2009 2010 2011 2012 2013Total Sample 953 1,363 1,794 1,548 1,651 1,601 1,509 1,474 1,423 Checked whether health plan would cover care 51% 58% 50%^ 55%^ 50%^ 47%^ 48% 45% 39%Asked for generic drug instead of brand-name drug n/a 48 46 50^ 46^ 44 46 41^ 37^Talked to doctor about prescription options and costs n/a n/a n/a n/a 35 35 37 30^ 28Talked to doctor about treatment options and costs 42 44 44 45 33^ 31 33 28^ 26Asked doctor to recommend less costly prescription drug 27 31 30 36^ 34 32 35 29^ 27Checked price of service before getting care 24 20 21 23^ 25 24 28^ 23^ 26Checked quality rating of doctor/hospital 18 21 20 25^ 24 24 27^ 26 n/aDeveloped budget to manage health care expenses n/a n/a n/a n/a 15 16 18 16 15Used online cost-tracking tool offered by health plan n/a 8 8 12^ 12 11 11 11 12
2005 2006 2007 2008 2009 2010 2011 2012 2013Total Sample 417 802 1,284 1,484 1,693 1,914 1,762 1,416 1,188 Checked whether health plan would cover care 61% 62% 61%* 61% 56%* 53%*^ 55%*^ 54%* 49%*^Asked for generic drug instead of brand-name drug n/a 60* 58* 58* 52*^ 50* 54*^ 52* 47*^Talked to doctor about prescription options and costs n/a n/a n/a n/a 42 40 41 39* 34*^Talked to doctor about treatment options and costs 56* 44^ 49*^ 49 37^ 36* 39*^ 35*^ 33*Asked doctor to recommend less costly prescription drug 46* 41* 43* 41 39* 39* 42* 38*^ 36*Checked price of service before getting care 35* 23^ 27*^ 23^ 29^ 29* 31^ 27*^ 33*^Checked quality rating of doctor/hospital 22 18 19 22 22 22 27^ 27 n/aDeveloped budget to manage health care expenses n/a n/a n/a n/a 18 17 20^ 18 17Used online cost-tracking tool offered by health plan n/a 6 9^ 10 9* 10 10 11 13
2005 2006 2007 2008 2009 2010 2011 2012 2013Total Sample 163 652 805 1,077 972 993 1,432 1,608 1,242 Checked whether health plan would cover care 60%* 62% 60%* 63%* 61%* 53%*^ 59%*^ 56%* 57%*Asked for generic drug instead of brand-name drug n/a 54 54* 58* 56* 51*^ 53* 53* 50*Talked to doctor about prescription options and costs n/a n/a n/a n/a 44 38 41* 38* 40*Talked to doctor about treatment options and costs 58* 46^ 47 46 40* 33^ 36^ 35* 36*Asked doctor to recommend less costly prescription drug 45* 39* 38* 36 39* 37 38 40* 38*Checked price of service before getting care 29 26* 27* 25 35*^ 27^ 34*^ 32* 39*^Checked quality rating of doctor/hospital 18 19 18 23^ 27* 22^ 27^ 30^ n/aDeveloped budget to manage health care expenses n/a n/a n/a n/a 32 25*^ 26* 26* 28*Used online cost-tracking tool offered by health plan n/a 17* 20*^ 20* 24* 20*^ 21* 23* 25*^
a Traditional = health plan with no deductible or <$1,000 (individual), <$2,000 (family).b HDHP = High-deductible health plan with deductible $1,000+ (individual), $2,000+ (family), no account.c CDHP = Consumer-driven health plan with deductible $1,000+ (individual), $2,000+ (family), with account.
* Difference between HDHP/CDHP and Traditional is statistically significant at p ≤ 0.05 or better.
^ Difference from prior year shown is statistically significant at p ≤ 0.05 or better.
Figure 8
Base: Adults Ages 21–64 Who Received Some Health Care in Past 12 Months
Source: EBRI/Commonwealth Fund Consumerism in Health Care Survey, 2005-2007; EBRI/Greenwald & Associates Consumer Engagement in Health Care Survey, 2008-2013.
Traditionala
HDHPb
CDHPc
Trends in Cost-Conscious Decision Making, by Type of Health Plan, 2005–2013
ebri.org Issue Brief • December 2013 • No. 393 11

ebri.org Issue Brief • December 2013 • No. 393 12
Participation in Wellness Programs Employers and insurers offer a number of different types of wellness benefits—programs designed to promote health and to prevent disease. The 2013 CEHCS examined availability and participation in three types of wellness programs: a health-risk assessment, a health-promotion program that included a number of different types of benefits, and a biometric screening.13
The survey found that CDHP enrollees were more likely than traditional-plan enrollees to report that they had the option to fill out a health-risk assessment. Specifically, 51 percent of CDHP enrollees reported that their employer offered a health-risk assessment, compared with 31 percent of traditional-plan enrollees and 29 percent of HDHP enrollees (Figure 12). Asked about the availability of health-promotion programs, 56 percent of CDHP enrollees and 40 percent of traditional-plan enrollees reported that their employer offered such a program. One-third (35 percent) of HDHP enrollees reported the availability of a health promotion program, significantly lower than offer rates among CDHP and traditional-plan enrollees. When asked about biometric-screening programs, 51 percent of CDHP enrollees reported that their employer offered such a program, compared with 33 percent among traditional-plan enrollees, and 30 percent among HDHP enrollees.
CDHP enrollees were more likely than traditional-plan enrollees to participate in health-risk assessments, health-promotion programs, and biometric screenings. Three-quarters (77 percent) of CDHP enrollees participated in a health-risk assessment, compared with 64 percent of traditional-plan enrollees (Figure 13). Over one-half (57 percent) of CDHP enrollees participated in a health-promotion program, compared with 46 percent of traditional-plan enrollees. Nearly four-fifths (78 percent) of CDHP enrollees participated in a biometric screening, compared with 63 percent of traditional-plan enrollees.
CDHP enrollees were also more likely than traditional-plan enrollees to report that their employer offered a cash incentive or reward for participating in a wellness program. Just over 70 percent reported a cash incentive or reward for participating in the health-risk assessment; two-thirds (64 percent) reported a cash incentive or reward for participating in a health-promotion program, and nearly 72 percent reported a cash incentive or reward for a biometric screening (Figure 14). The main reasons enrollees participated were to improve or maintain health (Figure 15). There were no differences found by plan type, so that information is not shown.
The survey also asked respondents their reasons for not participating in their employer’s wellness program. Nearly 70 percent responded that they did not participate because they could make changes on their own (Figure 16): 31 per-cent cited this as a major reason, and 38 percent cited it as a minor reason for not participating. Lack of time was the second-most-popular reason for not participating, with 23 percent reporting it as a major reason, and 33 percent reporting it as a minor reason. About one-half (53 percent) did not participate because they were already healthy (19 percent reported it as a major reason, and 34 percent reported it as a minor reason). For the most part, there were no differences in the answers to this series of questions by plan type.
Figures 17 and 18 contain findings from a series of questions related to the impact that financial incentives could have on participation in wellness programs. As in past years, there were very few differences by plan type. There were no differences between CDHP and traditional-plan enrollees when it came to time off (Figure 17). However, CDHP enrollees were more likely than traditional plan enrollees to report that they would probably participate if they were offered a $250 cash incentive, and both CDHP and HDHP enrollees were more likely than traditional plan enrollees to report that they would probably participate if they were offered a discounted premium. Reduced cost sharing may also result in greater participation rates. CDHP and HDHP enrollees were more likely than traditional plan enrollees to report that they would probably participate if it resulted in lower cost sharing for prescription drugs and lower cost sharing for office visits (Figure 18). Cost-sharing incentives to participate mattered to all individuals, regardless of plan type. It was found that between about 50 percent and about 70 percent of participants said they would participate in wellness programs if there was some type of financial incentive to do so.
12%
16%
21%
24%
30%
30%
37%
39%
20%*
8%*
19%
30%
28%
24%*
33%
43%
18%*
12%*
18%
33%*
43%*
31%
39%
48%*
0% 10% 20% 30% 40% 50% 60%
Consulted with an insurance broker to understand your choices
Talked to your doctor or other health professional about the plans
Asked health plans to send you information in the mail
Used other websites to learn about your choices
Attended a meeting where your choices were explained
Consulted with your employer's HR staff about you choices
Talked to friends, family, colleagues about the plans
Visited health plans' website to learn about their plans
Figure 9Informed Decision Making for Health Plan Choice,
by Type of Health Plan, 2013
CDHP
HDHP
Traditional
Source: EBRI/Greenwald & Associates Consumer Engagement in Health Care Survey, 2013.a Traditional = health plan with no deductible or <$1,000 (individual), <$2,000 (family).b HDHP = High-deductible health plan with deductible $1,000+ (individual), $2,000+ (family), no account.c CDHP = Consumer-driven health plan with deductible $1,000+ (individual), $2,000+ (family), with account.* Difference between HDHP/CDHP and Traditional is statistically significant at p ≤ 0.05 or better.
a
b
c
Traditionala HDHPb CDHPc
Tried to find the cost of health care services before getting care 22% 30%* 41%*
Found information in: 75 59* 74Health plan's websites 52 36* 49Health plan's customer service department 33 31 30Printed material from health plan 26 16* 27Provider's office 23 37* 31Provider's website 21 11* 24Other websites 5 5 2
Source: EBRI/Greenwald & Associates Consumer Engagement in Health Care Survey, 2013.a Traditional = health plan with no deductible or <$1,000 (individual), <$2,000 (family).b HDHP = High-deductible health plan with deductible $1,000+ (individual), $2,000+ (family), no account.c CDHP = Consumer-driven health plan with deductible $1,000+ (individual), $2,000+ (family), with account.* Difference between HDHP/CDHP and Traditional is statistically significant at p ≤ 0.05 or better.
Availability and Use of Cost Information, 2013Figure 10
ebri.org Issue Brief • December 2013 • No. 393 13
9%
14%
30%
30%
36%
42%
34%
48%
4%
13%
25%
39%
33%
38%
36%
42%
16%*
20%
32%
35%
38%
41%
48%*
57%*
0% 10% 20% 30% 40% 50% 60%
Mental health care
Inpatient surgery
Vision care
Outpatient procedure/surgery
Dental care
Office visit
Lab or radiology
Prescription Drug
Figure 11Types of Cost Information Sought,
by Type of Health Plan, 2013(Among Individuals Seeking Cost Information)
CDHP
HDHP
Traditional
Source: EBRI/Greenwald & Associates Consumer Engagement in Health Care Survey, 2013.a Traditional = health plan with no deductible or <$1,000 (individual), <$2,000 (family).b HDHP = High-deductible health plan with deductible $1,000+ (individual), $2,000+ (family), no account.c CDHP = Consumer-driven health plan with deductible $1,000+ (individual), $2,000+ (family), with account.* Difference between HDHP/CDHP and Traditional is statistically significant at p ≤ 0.05 or better.
a
b
c
31%
40%
33%
29%
35%
30%
51%*
56%*
51%*
0%
10%
20%
30%
40%
50%
60%
70%
Health-risk Assessment Health-promotion Program Biometric Screening
Figure 12Employer Offers Wellness Program, by Type of Health Plan, 2013
Traditional HDHP CDHP
Source: EBRI/Greenwald & Associates Consumer Engagement in Health Care Survey, 2013.a Traditional = health plan with no deductible or <$1,000 (individual), <$2,000 (family).b HDHP = High-deductible health plan with deductible $1,000+ (individual), $2,000+ (family), no account.c CDHP = Consumer-driven health plan with deductible $1,000+ (individual), $2,000+ (family), with account.* Difference between HDHP/CDHP and Traditional is statistically significant at p ≤ 0.05 or better.
cba
ebri.org Issue Brief • December 2013 • No. 393 14

64%
46%
63%66%
42%
65%
77%*
57%*
78%*
0%
10%
20%
30%
40%
50%
60%
70%
80%
90%
Health-risk Assessment Health-promotion Program Biometric Screening
Figure 13Individual Participates in Wellness Program Offered by Employer Among Those Offered a Wellness Program,
by Type of Health Plan, 2013
Traditional HDHP CDHP
Source: EBRI/Greenwald & Associates Consumer Engagement in Health Care Survey, 2013.a Traditional = health plan with no deductible or <$1,000 (individual), <$2,000 (family).b HDHP = High-deductible health plan with deductible $1,000+ (individual), $2,000+ (family), no account.c CDHP = Consumer-driven health plan with deductible $1,000+ (individual), $2,000+ (family), with account.* Difference between HDHP/CDHP and Traditional is statistically significant at p ≤ 0.05 or better.
a b c
55%
47%50%
53%
40%
50%
72%*
64%*
72%*
0%
10%
20%
30%
40%
50%
60%
70%
80%
90%
Health-risk Assessment Health-promotion Program Biometric Screening
Figure 14Employer Offers Cash Incentive or Reward for Participating in Wellness Program, among Workers Whose Employer Offers
Wellness Program, by Type of Plan, 2013
Traditional HDHP CDHP
Source: EBRI/Greenwald & Associates Consumer Engagement in Health Care Survey, 2013.a Traditional = health plan with no deductible or <$1,000 (individual), <$2,000 (family).b HDHP = High-deductible health plan with deductible $1,000+ (individual), $2,000+ (family), no account.c CDHP = Consumer-driven health plan with deductible $1,000+ (individual), $2,000+ (family), with account.* Difference between HDHP/CDHP and Traditional is statistically significant at p ≤ 0.05 or better.
a b c
ebri.org Issue Brief • December 2013 • No. 393 15
ebri.org Issue Brief • December 2013 • No. 393 16
Patient Use of Technology
In 2013, the CEHCS continued to ask about consumer use of technology to engage in health-related activities. The survey found that about 70 percent of the adult population with private health insurance had used a smartphone within the past year, and nearly 50 percent had used a tablet (up from about 60 percent and 40 percent, respectively, in 2012).
Among those who used a smartphone or tablet, 24–34 percent used an app for nutrition information; 22–29 percent used one for general health information; 19–26 percent used one for weight management or diets; and 22–29 percent used one for exercise programs (Figure 19). An app is a program that runs inside another service, such as a smartphone or tablet. Unlike findings from 2012, CDHP enrollees were more likely than traditional plan enrollees to report having used a smartphone or tablet for health-related purposes such as nutrition information, general health information, exercise programs, weight management or diet, prices for prescription drugs, contacting a health plan’s customer services, medical-claims history, and prices for medical care.
Among those who have never used an app for health-related purposes, about 35–45 percent are very or somewhat interested in using one for things like nutrition information, exercise programs, weight management or diets, prescription drug prices, medical-claims history, and general health information (Figure 20). Among individuals with a CDHP, 45 percent were very or somewhat interested in using an app to check the balance of the HSA or HRA.
Conclusion The 2013 EBRI/Greenwald & Associates Consumer Engagement in Health Care Survey (CEHCS) finds continued slow growth in consumer-driven health plans (CDHPs): 9.7 percent of the population was enrolled in a CDHP, up from 9.6 percent in 2012. Enrollment in high-deductible health plans (HDHPs) increased to 18 percent. Overall, 21.1 million adults ages 21–64 with private insurance, 17.3 percent of that market, were either in a CDHP or in an HDHP that was eligible for an HSA but had not opened the account. When their children are counted, 26.1 million individuals with private insurance, representing 15 percent of the market, were either in a CDHP or an HSA-eligible plan.
The 2013 CEHCS continued to find that CDHP enrollees are more cost conscious in their decision making than those in traditional plans. CDHP enrollees were more likely to use resources to pick their health plan and more likely to use cost information before getting health care services. CDHP enrollees were more likely than traditional-plan enrollees to take advantage of various wellness programs, such as health-risk assessments, health-promotion programs, and biometric screenings. In addition, financial incentives mattered more to CDHP enrollees than to traditional-plan enrollees.
It is not clear from the data whether the differences in consumer engagement can be attributed to plan-design differences or whether various plan designs attract certain kinds of individuals. Regardless, it is clear that the underlying characteristics of the populations enrolled in these plans are different: Adults in a CDHP were significantly more likely to report being in excellent or very good health. Adults in a CDHP were less likely to smoke than were adults in a traditional plan, and they were significantly more likely to exercise. People in a CDHP were also less likely to be obese compared with adults enrolled in a traditional health plan. CDHP and HDHP enrollees were also more likely than traditional-plan enrollees to be highly educated.
As the CDHP and HDHP markets continue to expand and more enrollees are enrolled for longer periods of time, the sustained impact that these plans are having on cost, quality, and access to health care services can be better understood. The nine years of consumer engagement surveys reported here provide unique data from which to measure future changes in this evolving type of health insurance.

24%
21%
31%
37%
33%
34%
29%
33%
41%
22%
26%
19%
18%
25%
36%
42%
42%
36%
0% 20% 40% 60% 80% 100%
Required by employer
To address specific health problem
To avoid premium increase
Reduced premiums
Offered incentive prizes
Convenient to work
Wanted to learn more about own health risks
To maintain current health status
Wanted to improve health
Figure 15Reasons for Participating in Employer's Wellness Program, 2013
Major Reason
Minor Reason
Source: EBRI/Greenwald & Associates Consumer Engagement in Health Care Survey, 2013.
13%
13%
16%
19%
23%
31%
20%
30%
27%
34%
33%
38%
0% 10% 20% 30% 40% 50% 60% 70% 80%
You are worried that your employer will know your personal healthinformation
You just do not know enough about the program
The program is not conveniently located for you
You do not need it because you are already healthy
You do not have enough time to participate
You can make changes on your own
Figure 16Reasons for Not Participating in Employer's Wellness Program among Those Offered but Not Participating in Program, 2013
Major Reason
Minor Reason
Source: EBRI/Greenwald & Associates Consumer Engagement in Health Care Survey, 2013.
ebri.org Issue Brief • December 2013 • No. 393 17

70%67%
64%
59%
64%
79%
67% 67%
78%*
63%
80%*
73%
68%
84%*
73%
87%
73%
0%
10%
20%
30%
40%
50%
60%
70%
80%
90%
100%
If employer offered$250 cash incentive
If required toparticipate to enrollin prefered health
plan
If employer offeredtime off
If employer offereddiscountedpremium
If employerincreased premiumfor non-participants
If employer madeadditional
contribution toHRA/HSA
If employer reducedcontribution to
HRA/HSA
Figure 17Percentage of Individuals Reporting That They Would Probably
Participate in Employer's Wellness Program, by Various Financial Incentives and Type of Health Plan, 2013
Traditional HDHP CDHP
Source: EBRI/Greenwald & Associates Consumer Engagement in Health Care Survey, 2013.a Traditional = health plan with no deductible or <$1,000 (individual), <$2,000 (family).b HDHP = High-deductible health plan with deductible $1,000+ (individual), $2,000+ (family), no account.c CDHP = Consumer-driven health plan w/ deductible $1,000+ (individual), $2,000+ (family), with account.* Difference between HDHP/CDHP and Traditional is statistically significant at p ≤ 0.05 or better.
cba
52%
61%
54%
61%
70%*
56%
72%*
59%
66%*63%
71%*69%
0%
10%
20%
30%
40%
50%
60%
70%
80%
Reduced drug cost sharing Increased drug cost sharing Reduced office-visit cost sharing Increased office-visit cost sharing
Figure 18Percentage of Individuals Reporting That They Would Probably
Participate in Employer's Wellness Program, by Various Cost-Sharing Incentives and Type of Health Plan, 2013
Traditional HDHP CDHP
Source: EBRI/Greenwald & Associates Consumer Engagement in Health Care Survey, 2013.a Traditional = health plan with no deductible or <$1,000 (individual), <$2,000 (family).b HDHP = High-deductible health plan with deductible $1,000+ (individual), $2,000+ (family), no account.c CDHP = Consumer-driven health plan with deductible $1,000+ (individual), $2,000+ (family), with account.* Difference between HDHP/CDHP and Traditional is statistically significant at p ≤ 0.05 or better.
a b c
ebri.org Issue Brief • December 2013 • No. 393 18

12%*
14%*
14%*
17%
17%
18%*
18%
26%*
29%*
29%*
34%*
6%
8%
7%
12%
13%
9%
21%
22%
24%
27%
7%
8%
10%
15%
14%
10%
19%
22%
22%
24%
0%* 5%* 10%* 15%* 20%* 25%* 30%* 35%* 40%*
Prices for medical care
Medical claims history
Contact health plan'scustomer service
Make an appointment
Check provider hours
Prices for prescriptiondrugs
Balance of HSA or HRA
Weight management ordiets
Exercise programs
General health information
Nutrition information
Figure 19Percentage of Individuals Reporting That They Used an App
More than Once for a Smartphone or Tablet, by Various Health-Related Purposes and Type of Health Plan, 2013
(Among Those Who Use a Smartphone or Tablet)
Traditional
HDHP
CDHP
Source: EBRI/Greenwald & Associates Consumer Engagement in Health Care Survey, 2013.a Traditional = health plan with no deductible or <$1,000 (individual), <$2,000 (family).b HDHP = High-deductible health plan with deductible $1,000+ (individual), $2,000+ (family), no account.c CDHP = Consumer-driven health plan with deductible $1,000+ (individual), $2,000+ (family), with account.* Difference between HDHP/CDHP and Traditional is statistically significant at p ≤ 0.05 or better.
a
b
c
10% 10% 10% 9%
13% 13%
9%
14%12%
16%
13%
32% 32%
27%
32%
26%29%
27%
31% 31% 30% 30%
59% 58%
64%
59%61%
59%
64%
55%
58%
54%56%
0%
10%
20%
30%
40%
50%
60%
70%
80%
Nutritioninformation
Exerciseprograms
Weightmanagement or
diets
General healthinformation
Prices forprescription
drugs
Prices for othermedical care
Medical claimshistory
Balance of HSAor HRA*
Contact healthplan's customer
service
Make anappointment
Check providerhours
Figure 20Interest in Using an App for a Smartphone or Tablet,
by Health-Related Function, 2013 (Among Those Who Never Used an App for a Smartphone or Tablet)
Very Interested Somewhat Interested Not Interested
Source: EBRI/Greenwald & Associates Consumer Engagement in Health Care Survey, 2013.* Asked of CDHP only.
ebri.org Issue Brief • December 2013 • No. 393 19

ebri.org Issue Brief • December 2013 • No. 393 20
Appendix—Methodology
The findings presented in this Issue Brief were derived from the 2013 EBRI/Greenwald & Associates Consumer Engagement in Health Care Survey (CEHCS), an online survey that examines issues surrounding consumer-directed health care, including the cost of insurance, the cost of care, satisfaction with health care, satisfaction with health care plans, reasons for choosing a plan, and sources of health information. It also presents findings from the 2005‒2007 EBRI/Commonwealth Fund Consumerism in Health Care Survey, and the 2008‒2012 CEHCS. The 2013 CEHCS was conducted within the United States between August 8 and August 20, 2013, through a 13-minute Internet survey. The national or base sample was drawn from Ipsos’ online panel of Internet users who have agreed to participate in research surveys. Two thousand adults ages 21−64 who had health insurance through an employer or who purchased directly from a carrier were drawn randomly from the Ipsos sample for this base sample. This sample was stratified by gender, age, region, income, and race. The response rate was 37.2 percent (32 percent for the base sample or national sample, and 44 percent for the oversample). As a non-probability sample, traditional survey margin-of-error estimates do not apply. However, had the survey used a probability sample, the margin of error for the national sample would have been ±2.2 percent.
To examine the issues mentioned above, the sample was divided into three groups: those with a consumer-driven health plan (CDHP), those with a high-deductible health plan (HDHP), and those with traditional health coverage. Individuals were assigned to the CDHP and HDHP groups if they had a deductible of at least $1,000 for individual coverage or $2,000 for family coverage. To be assigned to the CDHP group, they must also have had an account, such as a health savings account (HSA) or health reimbursement arrangement (HRA) with a rollover provision that they could use to pay for medical expenses or the ability to take their account with them should they change jobs. Individuals with only a flexible spending account (FSA) were not included in the CDHP group.
Individuals were assigned to the HDHP group if they did not have an account used for health care expenses with a rollover provision or portability if they changed jobs. This group included individuals with an HSA-eligible health plan but may also have included individuals with a high deductible who are not eligible to contribute to an HSA. The group with traditional health coverage included individuals in a broad range of plan types, including health maintenance organizations (HMOs), preferred provider organizations (PPOs), other managed care plans, and plans with a broad variety of cost-sharing arrangements. The shared characteristics of these group members were that they either had no deductible or a deductible that was below current thresholds for HSA tax preference and that they did not have an HRA-based plan.
Because the base sample (national sample) included only 180 individuals in a CDHP and 397 individuals with an HDHP, an oversample of individuals with a CDHP or HDHP was added. The oversample included 1,062 individuals with a CDHP and 791 individuals with an HDHP, resulting in a total sample (base plus oversample) of 1,242 for the CDHP group and 1,188 for the HDHP group. After factoring out the base sample—the 180 individuals with a CDHP and the 397 individuals with an HDHP—there were 1,423 individuals in the sample with traditional health coverage.
In addition to being stratified, the base sample was also weighted by gender, age, education, region, income, and race/ethnicity to reflect the actual proportions in the population ages 21–64 with private health insurance coverage.14 The CDHP and HDHP oversamples were weighted by gender, age, income and race/ethnicity, using the demographic profile of the CDHP and HDHP respondents to the omnibus survey described below.
To efficiently identify respondents who would qualify for the CDHP and HDHP oversamples, the study used Ipsos’s omnibus survey of more than 45,000 online panel members who met the study’s criteria (having private insurance and being ages 21–64). The following three questions were used in the omnibus survey running from July 10th to August 1st to identify likely CDHP and HDHP respondents:

ebri.org Issue Brief • December 2013 • No. 393 21
[ALL THREE QUESTIONS TO BE ASKED OF THOSE AGE 21−64]
1. Which of the following best describes your current health insurance status:
I have health insurance through a government plan such as Medicare, Medicaid, or Veterans benefits.................................................... 1
I have health insurance through my job or the job of another family member (such as spouse or parent) ................................ 2
I have health insurance that I purchase from a health insurance company ...................................................................................... 3
I have other health insurance (specify _______________) ............................... 4
I do not have health insurance currently ............................................................ 5
[IF Q1 = 1,5, SKIP THE OTHER 2 QUESTIONS]
2. Which of the following best describes your health plan's deductible:
[A deductible is the amount you have to pay before your insurance plan will start paying any part of your medical bills.]
No deductible
Individual or Single Coverage
My deductible is less than $1,000
My deductible is $1,000 or more
Don’t know amount of individual deductible
Family Coverage
My deductible is less than $2,000 for me and my family
My deductible is $2,000 or more for me and my family
Don’t know amount of family deductible
Don't know if have deductible
3. Do you have a special account or fund you can use to pay for medical expenses? The accounts are sometimes referred to as Health Savings Accounts (HSAs), Health Reimbursement Accounts (HRAs), Personal care accounts, Personal medical funds, or Choice funds, and are different from employer-provided Flexible Spending Accounts.
Yes
No
Not sure
While panel Internet surveys are nonrandom, studies have demonstrated that such surveys, when carefully designed, obtain results comparable with random-digit-dial telephone surveys. Taylor (2003), for example, provided the results from a number of surveys that were conducted at the same time using the same questionnaires both via telephone and online. He found that the use of demographic weighting alone was sufficient to bring almost all of the results from the online survey close to the replies from the parallel telephone survey. He also found that in some cases propensity weighting (meaning the propensity for a certain type of person to be online) reduced the remaining gaps, but in other cases it did not reduce the remaining gaps. Perhaps the most striking difference in demographics between telephone and online surveys was the under-representation of minorities in online samples.

ebri.org Issue Brief • December 2013 • No. 393 22
Definitions
Consumer-Driven Health Plans
These refer to account-based health plans that include either a health savings account (HSA) or a health reimbursement arrangement (HRA), described in more detail below.
Health Savings Accounts
A health savings account (HSA) is a tax-exempt trust or custodial account that an individual can use to pay for health care expenses. Contributions to the account are deductible from taxable income, even for individuals who do not itemize their taxes, and tax-free distributions for qualified medical expenses are not counted as taxable income. Tax-free distributions are also allowed for certain premiums.
The HSA is owned by the individual with the high-deductible health plan and is completely portable. There is no use-it-or-lose-it rule associated with an HSA, as any money left in the account at the end of the year automatically rolls over and is available in the following year. This contrasts with flexible spending accounts (FSAs), which impose time limits on when the spending/reimbursement can occur before forfeiting the account balance.
Eligibility
In order to qualify for tax-free contributions to an HSA, the individual must be covered by a health plan that has an annual deductible of not less than $1,250 for self-only coverage and $2,500 for family coverage (minimum deductible amounts are indexed to inflation). Certain preventive services can be covered in full and are not subject to the deductible. The out-of-pocket maximum may not exceed $6,250 for self-only coverage and $12,500 for family coverage, with the deductible counting toward this limit. The minimum allowable deductible and maximum out-of-pocket limit are indexed to inflation. A network plan may impose a higher deductible and an out-of-pocket limit for out-of-network services. Individuals can have a health plan with a deductible and maximum out-of-pocket limit that qualifies them to make a tax-free contribution to an HSA, but they are not required to make a contribution or to open an account.
To be eligible for an HSA, an individual may not be enrolled in other health coverage, such as a spouse’s plan, unless that plan is also a high-deductible health plan. However, individuals are allowed to have supplemental coverage without a high deductible for such things as vision care, dental care, specific diseases, and insurance that pays a fixed amount per day (or other period) for hospitalization.15 Individuals enrolled in Medicare are not eligible to make HSA contributions, although they are able to withdraw money from the HSA for qualified medical expenses and certain premiums.16 An individual also may not make an HSA contribution if he or she is claimed as a dependent on another person’s tax return.
Contributions
Both individuals and employers are allowed to contribute to an HSA. Contributions are excluded from taxable income if made by the employer and deductible from adjusted gross income if made by the individual. The maximum annual contribution is $3,250 for self-only coverage and $6,450 for family coverage in 2013.
Individuals who have reached age 55 and are not yet enrolled in Medicare may make catch-up contributions. In 2013, a $1,000 catch-up contribution was allowed. The catch-up contribution is not indexed to inflation.
Distributions
Distributions from an HSA can be made at any time. An individual need not be covered by a high-deductible health plan to withdraw money from the HSA (although he or she must have been covered by a high-deductible health plan at the time the funds were placed in the HSA). Distributions are excluded from taxable income if they are used to pay for qualified medical expenses as defined under Internal Revenue Code (IRC) Sec. 213(d). Distributions for premiums for
ebri.org Issue Brief • December 2013 • No. 393 23
the Consolidated Omnibus Budget Reconciliation Act of 1985 (COBRA), long-term care insurance, health insurance while receiving unemployment compensation, and insurance while eligible for Medicare other than for Medigap, are also tax free. This means that distributions used to pay Medicare Part A or B, Medicare Advantage plan premiums, and the employee share of the premium for employment-based retiree health benefits are allowed on a tax-free basis.
Distributions for nonqualified medical expenses are subject to regular income tax as well as a 20 percent penalty (increased from 10 percent in 2010 as a result of the Patient Protection and Affordable Care Act of 2010 (PPACA)), which is waived if the owner of the HSA dies, becomes disabled, or is eligible for Medicare.
Individuals are able to roll over funds from one HSA into another HSA without subjecting the distribution to income and penalty taxes as long as the rollover occurs within 60 days of the date funds are received. Rollover contributions from Archer Medical Savings Accounts (MSAs) are also permitted. Earnings on contributions are also not subject to income taxes.
Health Reimbursement Arrangements
A health reimbursement arrangement (HRA) is an employer-funded health plan that reimburses employees for qualified medical expenses. An HRA is typically combined with a high-deductible health plan, though this is not required. An HRA can also be offered on a stand-alone basis or with comprehensive insurance that does not use a high deductible. Employees are eligible for an HRA only when their employer offers such a health plan.
Employers have tremendous flexibility in designing health plans that incorporate an HRA. For example, the amount of money that is placed in the account, the level of the deductible, and the comprehensiveness of the health insurance are all subject to variation. Employers often cover certain preventive services in full, not subjecting them to the deductible. Employers can offer comprehensive health insurance that covers 100 percent of health care costs after the deductible has been met or they may offer coverage with cost sharing after the deductible is met. If employers choose to pay less than 100 percent of health care expenses after the deductible has been met, they then have the option of designing the plan with or without a maximum out-of-pocket limit.
There is no statutory requirement that an employee have a high-deductible health plan in order to also have an HRA. However, it is standard practice among employers that an employee must also choose a high-deductible health plan in order to have an HRA.
Contributions
HRAs are typically set up as notional arrangements and exist only on paper. An employee may view the account as if money was actually being deposited into an account, but an employer does not incur expenses associated with the arrangement until an employee incurs a claim. By contrast, were an employer to set up the HRA on a funded basis, the employer would incur the full expense at the time of the contribution, even if an employee had not incurred any expenses.
HRAs can be thought of as providing “first-dollar” coverage until funds in the account are exhausted. Leftover funds at the end of each year can be carried over to the following year (at the employer’s discretion), allowing employees to accumulate funds over time, and, in principle, creating the key incentive for individuals to make health care purchases responsibly. Employers can place restrictions on the amount that can be carried over.
Distributions
Distributions from an HRA for qualified medical expenses are made on a tax-favored basis. An employer can also let an employee use an HRA to purchase health insurance directly from an insurer. Since unused funds are allowed to roll over, an employee is able to accumulate funds over time. An employer can allow a former employee to use any leftover money in the HRA to continue to cover qualified medical expenses. Funds can be used for out-of-pocket expenses and premiums for insurance, long-term care, COBRA, and retiree health benefits. An employer is not required to make the unused balance available to a worker when he or she leaves.

ebri.org Issue Brief • December 2013 • No. 393 24
References Fronstin, Paul. Consumer-Driven Health Benefits: A Continuing Evolution? Washington, DC: Employee Benefit Research
Institute, 2002.
________. “Health Savings Accounts and Other Account-Based Health Plans.” EBRI Issue Brief, no. 273 (Employee Benefit Research Institute, September 2004).
________. “Sources of Health Insurance Coverage and Characteristics of the Uninsured: Analysis of the March 2013 Current Population Survey.” EBRI Issue Brief, no. 390 (Employee Benefit Research Institute, September 2013).
Taylor, Humphrey. “Does Internet Research ‘Work’? Comparing Online Survey Results With Telephone Surveys.” International Journal of Market Research. Vol. 42, no. 1 (August 2003).
Endnotes 1 Calculated from Figure 1.
2 More information about HRAs and HSAs can be found in the box on page 22 and in Fronstin (2002 and 2004).
3 See www.mercer.com/press-releases/1565095
4 See Appendix for more detail on the methodology.
5 Traditional plans include a broad range of plan types, including health maintenance organizations (HMOs), preferred provider organizations (PPOs), other managed care plans, and plans with a broad variety of cost-sharing arrangements. The shared characteristics of these plans are that they either have no deductibles or deductibles that are below current thresholds that would qualify for tax-preferred HSA contributions or that are generally associated with HRAs.
6 See www.aahp.org/hsa2013/
7 See Figure 6 in www.mercer.com/press-releases/1565095
8 See Figure 6 in www.cdc.gov/nchs/data/nhis/earlyrelease/insur201309.pdf
9 See Exhibit 5.1 in http://kaiserfamilyfoundation.files.wordpress.com/2013/08/8465-employer-health-benefits-20131.pdf
10 See Exhibit 8.1 in http://kaiserfamilyfoundation.files.wordpress.com/2013/08/8465-employer-health-benefits-20131.pdf
11 See Exhibit 8.3 in http://kaiserfamilyfoundation.files.wordpress.com/2013/08/8465-employer-health-benefits-20131.pdf
12 See Exhibit 8.4 in http://kaiserfamilyfoundation.files.wordpress.com/2013/08/8465-employer-health-benefits-20131.pdf
13 The specific question was as follows: Does your employer offer any of the following wellness programs?
Health-risk assessment, where you answer a questionnaire and then a medical professional examines your health history to identify any conditions you may have or that you might be at risk of developing.
Programs for improving your health, like for weight loss, walking or other exercise, nutrition, stress management, smoking cessation, and so on.
Biometric screenings, which are measurements or blood work to determine your health status including blood pressure, cholesterol, weight, height, etc.

ebri.org Issue Brief • December 2013 • No. 393 25
14 In theory, a random sample of 2,000 yields a statistical precision of plus or minus 2.2 percentage points (with 95-percent confidence) of what the results would be if the entire population ages 21–64 with private health insurance coverage were surveyed with complete accuracy. There are also other possible sources of error in all surveys that may be more serious than theoretical calculations of sampling error. These include refusals to be interviewed and other forms of nonresponse, the effects of question wording and question order, and screening. While attempts are made to minimize these factors, it is impossible to quantify the errors that may result from them.
15 Permitted insurance also includes workers’ compensation, tort liabilities, and liabilities related to ownership or the use of property (such as automobile insurance).
16 Only Medicare enrollees ages 65 and older are allowed to pay insurance premiums from an HSA. A Medicare enrollee under age 65 cannot use an HSA to pay insurance premiums.
1100 13th Street NW · Suite 878 Washington, DC 20005
(202) 659-0670 www.ebri.org
www.choosetosave.org
Where the world turns for the facts on U.S. employee benefits. Retirement and health benefits are at the heart of workers’, employers’, and our nation’s economic security. Founded in 1978, EBRI is the most authoritative and objective source of information on these critical, complex issues. EBRI focuses solely on employee benefits research — no lobbying or advocacy.
EBRI stands alone in employee benefits research as an independent, nonprofit, and nonpartisan organization. It analyzes and reports research data without spin or underlying agenda. All findings, whether on financial data, options, or trends, are revealing and reliable — the reason EBRI information is the gold standard for private analysts and decision makers, government policymakers, the media, and the public.
EBRI explores the breadth of employee benefits and related issues.
EBRI studies the world of health and retirement benefits — issues such as 401(k)s, IRAs, retirement income adequacy, consumer-driven benefits, Social Security, tax treatment of both retirement and health benefits, cost management, worker and employer attitudes, policy reform proposals, and pension assets and funding. There is widespread recognition that if employee benefits data exist, EBRI knows it.
EBRI delivers a steady stream of invaluable research and analysis.
EBRI publications include in-depth coverage of key issues and trends; summaries of research findings and policy developments; timely factsheets on hot topics; regular updates on legislative and regulatory developments; comprehensive reference resources on benefit programs and workforce issues; and major surveys of public attitudes.
EBRI meetings present and explore issues with thought leaders from all sectors. EBRI regularly provides congressional testimony, and briefs policymakers, member organizations,
and the media on employer benefits. EBRI issues press releases on newsworthy developments, and is among the most widely quoted
sources on employee benefits by all media. EBRI directs members and other constituencies to the information they need and undertakes new
research on an ongoing basis. EBRI maintains and analyzes the most comprehensive database of 401(k)-type programs in the
world. Its computer simulation analyses on Social Security reform and retirement income adequacy are unique.
EBRI makes information freely available to all.
EBRI assumes a public service responsibility to make its findings completely accessible at www.ebri.org — so that all decisions that relate to employee benefits, whether made in Congress or board rooms or families’ homes, are based on the highest quality, most dependable information. EBRI’s Web site posts all research findings, publications, and news alerts. EBRI also extends its education and public service role to improving Americans’ financial knowledge through its award-winning public service campaign ChoosetoSave® and the companion site www.choosetosave.org
EBRI is supported by organizations from all industries and sectors that appreciate the value of unbiased, reliable information on employee benefits. Visit www.ebri.org/about/join/ for more.

CHECK OUT EBRI’S WEB SITE! EBRI’s website is easy to use and packed with useful information! Look for these special features:
• EBRI’s entire library of research publications starts at the main Web page. Click on EBRI Issue Briefs and EBRI Notes for our in-depth and nonpartisan periodicals.
• Visit EBRI’s blog, or subscribe to the EBRIef e-letter.
• EBRI’s reliable health and retirement surveys are just a click away through the topic boxes at the top of the page.
• Need a number? Check out the EBRI Databook on Employee Benefits.
• Instantly get e-mail notifications of the latest EBRI data, surveys, publications, and meetings and seminars by clicking on the “Notify Me” or “RSS” buttons at the top of our home page.
There’s lots more!
Visit EBRI on-line today: www.ebri.org
EBRI Employee Benefit Research Institute Issue Brief (ISSN 0887137X) is published monthly by the Employee Benefit Research Institute, 1100 13th St. NW, Suite 878, Washington, DC, 20005-4051, at $300 per year or is included as part of a membership subscription. Periodi-cals postage rate paid in Washington, DC, and additional mailing offices. POSTMASTER: Send address changes to: EBRI Issue Brief, 1100 13th St. NW, Suite 878, Washington, DC, 20005-4051. Copyright 2013 by Employee Benefit Research Institute. All rights reserved. No. 393.
The Employee Benefit Research Institute (EBRI) was founded in 1978. Its mission is to contribute to, to encourage, and to enhance the development of sound employee benefit programs and sound public policy through objective research and education. EBRI is the only private, nonprofit, nonpartisan, Washington, DC-based organization committed exclusively to public policy research and education on economic security and employee benefit issues. EBRI’s membership includes a cross-section of pension funds; businesses; trade associations; labor unions; health care providers and insurers; government organizations; and service firms.
EBRI’s work advances knowledge and understanding of employee benefits and their importance to the nation’s economy among policymakers, the news media, and the public. It does this by conducting and publishing policy research, analysis, and special reports on employee benefits issues; holding educational briefings for EBRI members, congressional and federal agency staff, and the news media; and sponsoring public opinion surveys on employee benefit issues. EBRI’s Education and Research Fund (EBRI-ERF) performs the charitable, educational, and scientific functions of the Institute. EBRI-ERF is a tax-exempt organization supported by contributions and grants.
EBRI Issue Briefs is a monthly periodical with in-depth evaluation of employee benefit issues and trends, as well as critical analyses of employee benefit policies and proposals. EBRI Notes is a monthly periodical providing current information on a variety of employee benefit topics. EBRIef is a weekly roundup of EBRI research and insights, as well as updates on surveys, studies, litigation, legislation and regulation affecting employee benefit plans, while EBRI’s Blog supplements our regular publications, offering commentary on questions received from news reporters, policymakers, and others. EBRI Fundamentals of Employee Benefit Programs offers a straightforward, basic explanation of employee benefit programs in the private and public sectors. The EBRI Databook on Employee Benefits is a statistical reference work on employee benefit programs and work force-related issues.
Contact EBRI Publications, (202) 659-0670; fax publication orders to (202) 775-6312. Subscriptions to EBRI Issue Briefs are included as part of EBRI membership, or as part of a $199 annual subscription to EBRI Notes and EBRI Issue Briefs. Change of Address: EBRI, 1100 13th St. NW, Suite 878, Washington, DC, 20005-4051, (202) 659-0670; fax number, (202) 775-6312; e-mail: [email protected] Membership Information: Inquiries regarding EBRI membership and/or contributions to EBRI-ERF should be directed to EBRI President Dallas Salisbury at the above address, (202) 659-0670; e-mail: [email protected]
Editorial Board: Dallas L. Salisbury, publisher; Stephen Blakely, editor. Any views expressed in this publication and those of the authors should not be ascribed to the officers, trustees, members, or other sponsors of the Employee Benefit Research Institute, the EBRI Education and Research Fund, or their staffs. Nothing herein is to be construed as an attempt to aid or hinder the adoption of any pending legislation, regulation, or interpretative rule, or as legal, accounting, actuarial, or other such professional advice. www.ebri.org
EBRI Issue Brief is registered in the U.S. Patent and Trademark Office. ISSN: 0887137X/90 0887137X/90 $ .50+.50
© 2013, Employee Benefit Research InstituteEducation and Research Fund. All rights reserved.
Who we are
What we do
Our publications
Orders/ Subscriptions
Related Documents