Financial Time Series Forecasting with Deep Learning : A Systematic Literature Review: 2005-2019 Omer Berat Sezer a , M. Ugur Gudelek a , Ahmet Murat Ozbayoglu a a Department of Computer Engineering, TOBB University of Economics and Technology, Ankara, Turkey Abstract Financial time series forecasting is, without a doubt, the top choice of computational intel- ligence for finance researchers from both academia and financial industry due to its broad implementation areas and substantial impact. Machine Learning (ML) researchers came up with various models and a vast number of studies have been published accordingly. As such, a significant amount of surveys exist covering ML for financial time series forecast- ing studies. Lately, Deep Learning (DL) models started appearing within the field, with results that significantly outperform traditional ML counterparts. Even though there is a growing interest in developing models for financial time series forecasting research, there is a lack of review papers that were solely focused on DL for finance. Hence, our motivation in this paper is to provide a comprehensive literature review on DL studies for financial time series forecasting implementations. We not only categorized the studies according to their intended forecasting implementation areas, such as index, forex, commodity forecasting, but also grouped them based on their DL model choices, such as Convolutional Neural Networks (CNNs), Deep Belief Networks (DBNs), Long-Short Term Memory (LSTM). We also tried to envision the future for the field by highlighting the possible setbacks and opportunities, so the interested researchers can benefit. Keywords: deep learning, finance, computational intelligence, machine learning, time series forecasting, CNN, LSTM, RNN 1. Introduction The finance industry has always been interested in successful prediction of financial time series data. Numerous studies have been published that were based on ML models with relatively better performances compared to classical time series forecasting techniques. Meanwhile, the widespread application of automated electronic trading systems coupled with increasing demand for higher yields keeps forcing the researchers and practitioners to con- tinue working on searching for better models. Hence, new publications and implementations keep pouring into finance and computational intelligence literature. In the last few years, DL started emerging strongly as the best performing predictor class within the ML field in various implementation areas. Financial time series forecasting is no exception, as such, an increasing number of prediction models based on various DL techniques were introduced in the appropriate conferences and journals in recent years. Preprint submitted to Applied Soft Computing December 2, 2019 arXiv:1911.13288v1 [cs.LG] 29 Nov 2019

Welcome message from author
This document is posted to help you gain knowledge. Please leave a comment to let me know what you think about it! Share it to your friends and learn new things together.
Transcript
Financial Time Series Forecasting with Deep Learning : ASystematic Literature Review: 2005-2019
Omer Berat Sezera, M. Ugur Gudeleka, Ahmet Murat Ozbayoglua
aDepartment of Computer Engineering, TOBB University of Economics and Technology, Ankara, Turkey
Abstract
Financial time series forecasting is, without a doubt, the top choice of computational intel-ligence for finance researchers from both academia and financial industry due to its broadimplementation areas and substantial impact. Machine Learning (ML) researchers cameup with various models and a vast number of studies have been published accordingly. Assuch, a significant amount of surveys exist covering ML for financial time series forecast-ing studies. Lately, Deep Learning (DL) models started appearing within the field, withresults that significantly outperform traditional ML counterparts. Even though there is agrowing interest in developing models for financial time series forecasting research, there isa lack of review papers that were solely focused on DL for finance. Hence, our motivation inthis paper is to provide a comprehensive literature review on DL studies for financial timeseries forecasting implementations. We not only categorized the studies according to theirintended forecasting implementation areas, such as index, forex, commodity forecasting, butalso grouped them based on their DL model choices, such as Convolutional Neural Networks(CNNs), Deep Belief Networks (DBNs), Long-Short Term Memory (LSTM). We also triedto envision the future for the field by highlighting the possible setbacks and opportunities,so the interested researchers can benefit.Keywords: deep learning, finance, computational intelligence, machine learning, timeseries forecasting, CNN, LSTM, RNN
1. Introduction
The finance industry has always been interested in successful prediction of financialtime series data. Numerous studies have been published that were based on ML modelswith relatively better performances compared to classical time series forecasting techniques.Meanwhile, the widespread application of automated electronic trading systems coupled withincreasing demand for higher yields keeps forcing the researchers and practitioners to con-tinue working on searching for better models. Hence, new publications and implementationskeep pouring into finance and computational intelligence literature.
In the last few years, DL started emerging strongly as the best performing predictorclass within the ML field in various implementation areas. Financial time series forecastingis no exception, as such, an increasing number of prediction models based on various DLtechniques were introduced in the appropriate conferences and journals in recent years.Preprint submitted to Applied Soft Computing December 2, 2019
arX
iv:1
911.
1328
8v1
[cs
.LG
] 2
9 N
ov 2
019
Despite the existence of the vast amount of survey papers covering financial time seriesforecasting and trading systems using traditional soft computing techniques, to the best ofour knowledge, no reviews have been performed in literature for DL. Hence, we decidedto work on such a comprehensive study focusing on DL implementations of financial timeseries forecasting. Our motivation is two-fold such that we not only aimed at providing thestate-of-the-art snapshot of academic and industry perspectives of the developed DL modelsbut also pinpointing the important and distinctive characteristics of each studied model toprevent researchers and practitioners to make unsatisfactory choices during their systemdevelopment phase. We also wanted to envision where the industry is heading by indicatingpossible future directions.
Our fundamental motivation in this paper was to come up with answers for the followingresearch questions:
• Which DL models are used for financial time series forecasting ?
• How is the performance of DL models compared with traditional ML counterparts ?
• What is the future direction for DL research for financial time series forecasting ?
Our focus was solely on DL implementations for financial time series forecasting. Forother DL based financial applications such as risk assessment, portfolio management, etc.,interested readers can check the recent survey paper [1]. Since we singled out financialtime series prediction studies in our survey, we omitted other time series forecasting studiesthat were not focused on financial data. Meanwhile, we included time-series research papersthat had financial use cases or examples even though the papers themselves were not directlyintended for financial time series forecasting. Also, we decided to include algorithmic tradingpapers that were based on financial forecasting, but ignore the ones that did not have a timeseries forecasting component.
We reviewed journals and conferences for our survey, however, we also included Mastersand PhD theses, book chapters, arXiv papers and noteworthy technical publications thatcame up in web searches. We decided to only include the articles in the English language.
During our survey through the papers, we realized that most of the papers using the term“deep learning" in their description were published in the last 5 years. However, we alsoencountered some older studies that implemented deep models; such as Recurrent NeuralNetworks (RNNs), Jordan-Elman networks. However, at their time of publication, the term“deep learning" was not in common usage. So, we decided to also include those papers.
According to our findings, this will be one of the first comprehensive “financial timeseries forecasting" survey papers focusing on DL. A lot of ML reviews for financial timeseries forecasting exist in the literature, meanwhile, we have not encountered any study onDL. Hence, we wanted to fill this gap by analyzing the developed models and applicationsaccordingly. We hope, as a result of this paper, the researchers and model developers willhave a better idea of how they can implement DL models for their studies.
We structured the rest of the paper as follows. Following this brief introduction, inSection 2, the existing surveys that are focused on ML and soft computing studies for fi-nancial time series forecasting are mentioned. In Section 3, we will cover the existing DL
2
models that are used, such as CNN, LSTM, Deep Reinforcement Learning (DRL). Sec-tion 4 will focus on the various financial time series forecasting implementation areas usingDL, namely stock forecasting, index forecasting, trend forecasting, commodity forecasting,volatility forecasting, foreign exchange forecasting, cryptocurrency forecasting. In each sub-section, the problem definition will be given, followed by the particular DL implementations.In Section 5, overall statistical results about our findings will be presented including his-tograms about the yearly distribution of different subfields, models, publication types, etc.As a result, the state-of-the-art snapshot for financial time series forecasting studies willbe given through these statistics. At the same time, it will also show the areas that arealready mature, compared against promising or new areas that still have room for improve-ment. Section 6 will provide discussions about what has been done through academic andindustrial achievements and expectations through what might be needed in the future. Thesection will include highlights about the open areas that need further research. Finally, wewill conclude in Section 7 by summarizing our findings.
2. Financial Time Series Forecasting with ML
Financial time series forecasting and associated applications have been studied exten-sively for many years. When ML started gaining popularity, financial prediction applicationsbased on soft computing models also became available accordingly. Even though our focusis particularly on DL implementations of financial time series prediction studies, it will bebeneficial to briefly mention about the existing surveys covering ML-based financial timeseries forecasting studies in order to gain historical perspective.
In our study, we did not include any survey papers that were focused on specific financialapplication areas other than forecasting studies. However, we were faced with some reviewpublications that included not only financial time-series studies but also other financialapplications. We decided to include those papers in order to maintain the comprehensivenessof our coverage.
Examples of these aforementioned publications are provided here. There were publishedbooks on stock market forecasting [2], trading system development [3], practical examples offorex and market forecasting applications [4] using ML models like Artificial Neural Networks(ANNs), Evolutionary Computations (ECs), Genetic Programming (GP) and Agent-basedmodels [5].
There were also some existing journal and conference surveys. Bahrammirzaee et. al.[6] surveyed financial prediction and planning studies along with other financial applica-tions using various Artificial Intelligence (AI) techniques like ANN, Expert Systems, hybridmodels. The authors of [7] also compared ML methods in different financial applicationsincluding stock market prediction studies. In [8], soft computing models for the market,forex prediction and trading systems were analyzed. Mullainathan and Spies [9] surveyedthe prediction process in general from an econometric perspective.
There were also a number of survey papers concentrated on a single particular ML model.Even though these papers focused on one technique, the implementation areas generally
3
spanned various financial applications including financial time series forecasting studies.Among those soft computing methods, EC and ANN had the most overall interest.
For the EC studies, Chen wrote a book on Genetic Algorithms (GAs) and GP in Com-putational Finance [10]. Later, Multiobjective Evolutionary Algorithms (MOEAs) wereextensively surveyed on various financial applications including financial time series predic-tion [11, 12, 13]. Meanwhile, Rada reviewed EC applications along with Expert Systems forfinancial investing models [14].
For the ANN studies, Li and Ma reviewed implementations of ANN for stock priceforecasting and some other financial applications [15]. The authors of [16] surveyed differentimplementations of ANN in financial applications including stock price forecasting. Recently,Elmsili and Outtaj contained ANN applications in economics and management researchincluding economic time series forecasting in their survey [17].
There were also several text mining surveys focused on financial applications (whichincluded financial time series forecasting). Mittermayer and Knolmayer compared varioustext mining implementations that extract market response to news for prediction [18]. Theauthors of [19] focused on news analytics studies for prediction of abnormal returns fortrading strategies in their survey. Nassirtoussi et. al. reviewed text mining studies for stockor forex market prediction [20]. The authors of [21] also surveyed text mining-based timeseries forecasting and trading strategies using textual sentiment. Similarly, Kumar and Ravi[22] reviewed text mining studies for forex and stock market prediction. Lately, Xing et. al.[23] surveyed natural language-based financial forecasting studies.
Finally, there were application-specific survey papers that focused on particular financialtime series forecasting implementations. Among these studies, stock market forecasting hadthe most interest. A number of surveys were published for stock market forecasting studiesbased on various soft computing methods at different times [24, 25, 26, 27, 28, 29, 30, 31].Chatterjee et. al. [32] and Katarya and Mahajan [33] concentrated on ANN-based financialmarket prediction studies whereas Hu et. al. [34] focused on EC implementations forstock forecasting and algorithmic trading models. In a different time series forecastingapplication, researchers surveyed forex prediction studies using ANN [35] and various othersoft computing techniques [36].
Even though, many surveys exist for ML implementations of financial time series fore-casting, DL has not been surveyed comprehensively so far despite the existence of variousDL implementations in recent years. Hence, this was our main motivation for the survey.At this point, we would like to cover the various DL models used in financial time seriesforecasting studies.
3. Deep Learning
DL is a type of ANN that consists of multiple processing layers and enables high-levelabstraction to model data. The key advantage of DL models is extracting the good fea-tures of input data automatically using a general-purpose learning procedure. Therefore,in the literature, DL models are used in lots of applications: image, speech, video, audioreconstruction, natural language understanding (particularly topic classification), sentiment
4
analysis, question answering and language translation [37]. The historical improvements onDL models are surveyed in [38].
Financial time series forecasting has been very popular among ML researchers for morethan 40 years. The financial community got a new boost lately with the introduction of DLmodels for financial prediction research and a lot of new publications appeared accordingly.The success of DL over ML models is the major attractive point for the finance researchers.With more financial time series data and different deep architectures, new DL methods willbe proposed. In our survey, we found that in the vast majority of the studies, DL modelswere better than ML counterparts.
In literature, there are different kinds of DL models: Deep Multilayer Perceptron (DMLP),RNN, LSTM, CNN, Restricted Boltzmann Machines (RBMs), DBN, Autoencoder (AE), andDRL [37, 38]. Throughout the literature, financial time series forecasting was mostly con-sidered as a regression problem. However, there were also a significant number of studies,in particular trend prediction, that used classification models to tackle financial forecastingproblems. In Section 4, different DL implementations are provided along with their modelchoices.
3.1. Deep Multi Layer Perceptron (DMLP)DMLPs is one of the first developed ANNs. The difference from shallow nets is that
DMLP contains more layers. Even though particular model architectures might have vari-ations depending on different problem requirements, DMLP models consist of mainly threelayers: input, hidden and output. The number of neurons in each layer and the number oflayers are the hyperparameters of the network. In general, each neuron in the hidden layershas input (x), weight (w) and bias (b) terms. In addition, each neuron has a nonlinearactivation function which produces a cumulative output of the preceding neurons. Equa-tion 1 [39] illustrates an output of a single neuron in the Neural Network (NN). There aredifferent types of nonlinear activation functions. Most commonly used nonlinear activationfunctions are: sigmoid (Equation 2) [40], hyperbolic tangent (Equation 3) [41], RectifiedLinear Unit (ReLU) (Equation 4) [42], leaky-ReLU (Equation 5) [43], swish (Equation 6)[44], and softmax (Equation 7) [39]. The comparison of the nonlinear activations are studiedin [44].
yi = σ(∑i
Wixi + bi) (1)
σ(z) =1
1 + e−z(2)
tanh(z) =ez − e−z
ez + e−z(3)
R(z) = max (0, z) (4)
R(z) = 1(x < 0)(αx) + 1(x >= 0)(x) (5)5
f(x) = xσ(βx) (6)
softmax(zi) =exp zi∑j
exp zj(7)
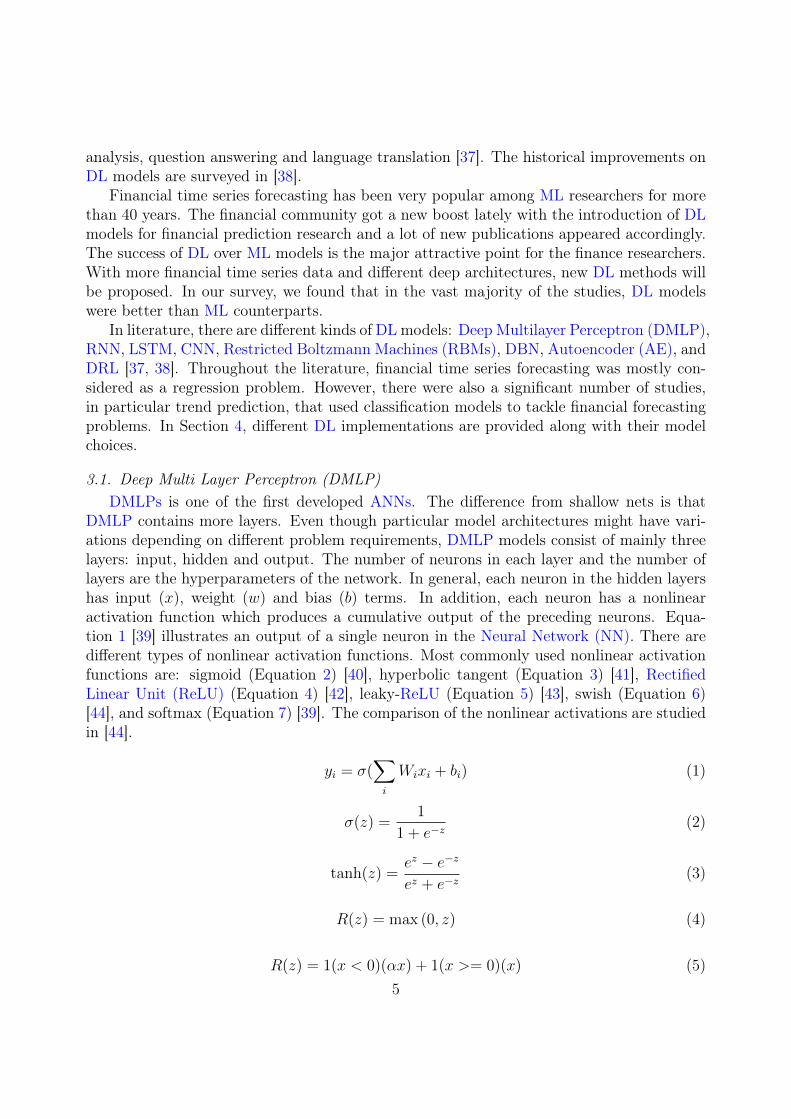
DMLP models have been appearing in various application areas [45, 37] . Using a DMLPmodel has advantages and disadvantages depending on the problem requirements. ThroughDMLP models, problems such as regression and classification can be solved by modeling theinput data [46]. However, if the number of the input features is increased (e.g. image asinput), the parameter size in the network will increase accordingly due to the fully connectednature of the model and it will jeopardize the computation performance and create storageproblems. To overcome this issue, different types of Deep Neural Network (DNN) methodsare proposed (such as CNN) [37]. With DMLP, much more efficient classification andregression processes are performed. In Figure 1, a DMLP model, layers, neurons in layers,weights between neurons are shown.
Figure 1: Deep Multi Layer Neural Network Forward Pass and Backpropagation [37]
DMLP learning stage is implemented through backpropagation. The amount of errorin the neurons in the output layer is propagated back to the preceeding layers. Opti-mization algorithms are used to find the optimum parameters/variables of the NNs. Theyare used to update the weights of the connections between the layers. There are differ-ent optimization algorithms that are developed: Stochastic Gradient Descent (SGD), SGDwith Momentum, Adaptive Gradient Algorithm (AdaGrad), Root Mean Square Propagation(RMSProp), Adaptive Moment Estimation (ADAM) [47, 48, 49, 50, 51]. Gradient descentis an iterative method to find optimum parameters of the function that minimizes the costfunction. SGD is an algorithm that randomly selects a few samples instead of the whole data
6
set for each iteration [47]. SGD with Momentum remembers the update in each iterationthat accelerates gradient descent method [48]. AdaGrad is a modified SGD that improvesconvergence performance over standard SGD algorithm [49]. RMSProp is an optimizationalgorithm that provides the adaptation of the learning rate for each of the parameters. InRMSProp, the learning rate is divided by a running average of the magnitudes of recentgradients for that weight [50]. ADAM is updated version of RMSProp that uses runningaverages of both the gradients and the second moments of the gradients. ADAM combinesadvantages of the RMSProp (works well in online and non-stationary settings) and AdaGrad(works well with sparse gradients) [51].
As shown in Figure 1, the effect of the backpropagation is transferred to the previouslayers. If the effect of SGD is gradually lost when the effect reaches the early layers duringbackpropagation, this problem is called vanishing gradient problem in the literature [52].In this case, updates between the early layers become unavailable and the learning processstops. The high number of layers in the neural network and the increasing complexity causethe vanishing gradient problem.
The important issue in the DMLP are the hyperparameters of the networks and methodof tuning these hyperparameters. Hyperparameters are the variables of the network thataffect the network architecture, and the performance of the networks. The number of hid-den layers, the number of units in each layer, regularization techniques (dropout, L1, L2),network weight initialization (zero, random, He [53], Xavier [54]), activation functions (Sig-moid, ReLU, hyperbolic tangent, etc.), learning rate, decay rate, momentum values, numberof epochs, batch size (minibatch size), and optimization algorithms (SGD, AdaGrad, RM-SProp, ADAM, etc.) are the hyperparameters of DMLP. Choosing better hyperparametervalues/variables for the network result in better performance. So, finding the best hyperpa-rameters for the network is a significant issue. In literature, there are different methods tofind best hyperparameters: Manual Search (MS), Grid Search (GS), RandomSearch (RS),Bayesian Methods (Sequential Model-Based Global Optimization (SMBGO), The GaussianProcess Approach (GPA), Tree-structured Parzen Estimator Approach (TSPEA)) [55, 56].
3.2. Recurrent Neural Network (RNN)RNN is another type of DL network that is used for time series or sequential data, such
as language and speech. RNNs are also used in traditional ML models (Back PropagationThrough Time (BPTT), Jordan-Elman networks, etc.), however, the time lengths in suchmodels are generally less than the models used in deep RNN models. Deep RNNs arepreferred due to their ability to include longer time periods. Unlike Fully Connected NeuralNetworks (FNNs), RNNs use internal memory to process incoming inputs. RNNs are used inthe analysis of time series data in various fields (handwriting recognition, speech recognition,etc. As stated in the literature, RNNs are good at predicting the next character in the text,language translation applications, sequential data processing [45, 37].
RNN model architecture consists of different number of layers and different type of unitsin each layer. The main difference between RNN and FNN is that each RNN unit takes thecurrent and previous input data at the same time. The output depends on the previous datain RNN model. The RNNs process input sequences one by one at any given time, during
7
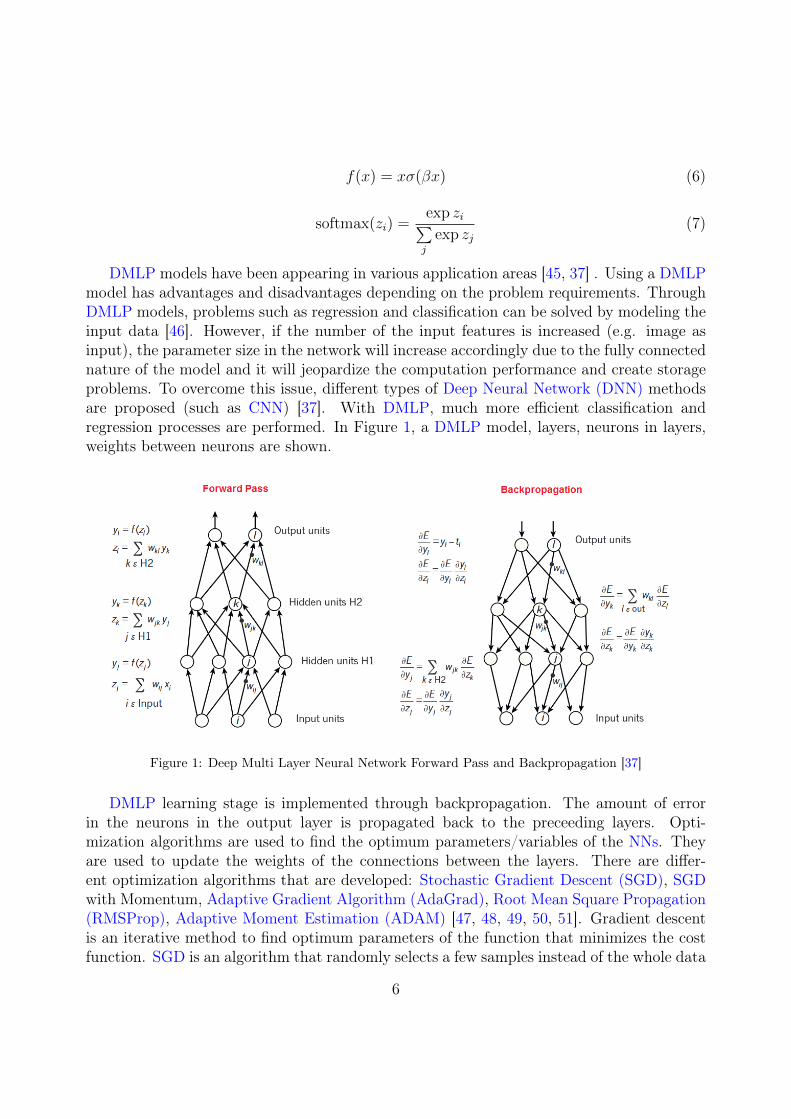
their operation. In the units on the hidden layer, they hold information about the history ofthe input in the “state vector". When the output of the units in the hidden layer is dividedinto different discrete time steps, the RNNs are converted into a DMLP [37]. In Figure 2,the information flow in the RNN’s hidden layer is divided into discrete times. The statusof the node S at different times of t is shown as st, the input value x at different times isxt, and the output value o at different times is shown as ot. Parameter values (U,W, V ) arealways used in the same step.
Figure 2: RNN cell through time[37]
RNNs can be trained using the BPTT algorithm. Optimization algorithms (SGD, RM-SProp, ADAM) are used for weight adjustment process. With the BPTT learning method,the error change at any t time is reflected in the input and weights of the previous t times.The difficulty of training RNN is due to the fact that the RNN structure has a backwarddependence over time. Therefore, RNNs become very complex in terms of the learning pe-riod. Although the main aim of using RNN is to learn long-term dependencies, studies inthe literature show that when knowledge is stored for long time periods, it is not easy tolearn with RNN (training difficulties on RNN) [57]. In order to solve this particular prob-lem, LSTMs with different structures of ANN were developed [37]. Equations 8, 9 illustratesimpler RNN formulations. Equation 10 shows the total error which is the sum of each errorat time step t1.
ht = Wf(ht−1) +W (hx)x[t] (8)
yt = W (S)f(ht) (9)
∂E
∂W=
T∑t=1
∂Et∂W
(10)
Hyperparameters of RNN also define the network architecture and the performance ofthe network is affected by the parameter choices as was in DMLP case. The number ofhidden layers, the number of units in each layer, regularization techniques, network weightinitialization, activation functions, learning rate, momentum values, number of epochs, batch
1Richard Socher, CS224d: Deep Learning for Natural Language Processing, Lecture Notes
8
size (minibatch size), decay rate, optimization algorithms, model of RNN (Vanilla RNN,Gated-Recurrent Unit (GRU), LSTM), sequence length for RNN are the hyperparametersof RNN. Finding the best hyperparameters for the network is a significant issue. In literature,there are different methods to find best hyperparameters: MS, GS, RS, Bayesian Methods(SMBGO, GPA, TSPEA) [55, 56].
3.3. Long Short Term Memory (LSTM)LSTM [58] is a type of RNN where the network can remember both short term and long
term values. LSTM networks are the preferred choice of many DL model developers whentackling complex problems like automatic speech recognition, and handwritten characterrecognition. LSTM models are mostly used with time-series data. It is used in differ-ent applications such as Natural Language Processing (NLP), language modeling, languagetranslation, speech recognition, sentiment analysis, predictive analysis, financial time seriesanalysis, etc. [59, 60]. With attention modules and AE structures, LSTM networks can bemore successful on time series data analysis such as language translation [59].
LSTM networks consist of LSTM units. Each LSTM unit merges to form an LSTM layer.An LSTM unit is composed of cells having input gate, output gate and forget gate. Threegates regulate the information flow. With these features, each cell remembers the desiredvalues over arbitrary time intervals. Equations 11-15 show the form of the forward pass ofthe LSTM unit [58] (xt: input vector to the LSTM unit, ft: forget gate’s activation vector,it: input gate’s activation vector, ot: output gate’s activation vector, ht: output vector of theLSTM unit, ct: cell state vector, σg: sigmoid function, σc , σh: hyperbolic tangent function,∗: element-wise (Hadamard) product, W , U : weight matrices that need to be learned, b:bias vector parameters that need to be learned) [60].
ft = σg(Wfxt + Ufht−1 + bf ) (11)
it = σg(Wixt + Uiht−1 + bi) (12)
ot = σg(Woxt + Uoht−1 + bo) (13)
ct = ft ∗ ct−1 + it ∗ σc(Wcxt + Ucht−1 + bc) (14)
ht = ot ∗ σh(ct) (15)LSTM is a specialized version of RNN. Therefore, the weight updates and preferred
optimization methods are the same. In addition, the hyperparameters of LSTM are justlike RNN: the number of hidden layers, the number of units in each layer, network weightinitialization, activation functions, learning rate, momentum values, the number of epochs,batch size (minibatch size), decay rate, optimization algorithms, sequence length for LSTM,gradient clipping , gradient normalization, and dropout[61, 60]. In order to find the besthyperparameters of LSTM, the hyperparameter optimization methods that are used forRNN are also applicable to LSTM [55, 56].
9
3.4. Convolutional Neural Networks (CNNs)CNN is a type of DNN that consists of convolutional layers that are based on the con-
volutional operation. Meanwhile, CNN is the most common model that is frequently usedfor vision or image processing based classification problems (image classification, object de-tection, image segmentation, etc.) [62, 63, 64]. The advantage of the usage of CNN isthe number of parameters when comparing the vanilla DL models such as DMLP. Filteringwith kernel window function gives an advantage of image processing to CNN architectureswith fewer parameters that are beneficial for computing and storage. In CNN architec-tures, there are different layers: convolutional, max-pooling, dropout and fully connectedMultilayer Perceptron (MLP) layer. The convolutional layer consists of the convolution (fil-tering) operation. Basic convolution operation is shown in Equation 16 (t denotes time, sdenotes feature map, w denotes kernel, x denotes input, a denotes variable). In addition,the convolution operation is implemented on two-dimensional images. Equation 17 showsthe convolution operation of two-dimensional image (I denotes input image, K denotes thekernel, m and n denote the dimension of images, i and j denote variables). Besides, consecu-tive convolutional and max-pooling layers construct the deep network. Equation 18 providesthe details about the NN architecture (W denotes weights, x denotes input, b denotes bias,z denotes the output of neurons). At the end of the network, the softmax function is usedto get the output. Equation 19 and 20 illustrate the softmax function (y denotes output)[39].
s(t) = (x ∗ w)(t) =∞∑
a=−∞
x(a)w(t− a) (16)
S(i, j) = (I ∗K)(i, j) =∑m
∑n
I(m,n)K(i−m, j − n). (17)
zi =∑j
Wi,j xj + bi. (18)
y = softmax(z) (19)
softmax(zi) =exp(zi)∑j
exp(zj)(20)
The backpropagation process is used for model learning of CNN. Most commonly usedoptimization algorithms (SGD, RMSProp) are used to find optimum parameters of CNN.Hyperparameters of CNN are similar to other DL model hyperparameters: the number ofhidden layers, the number of units in each layer, network weight initialization, activationfunctions, learning rate, momentum values, the number of epochs, batch size (minibatchsize), decay rate, optimization algorithms, dropout, kernel size, and filter size. In order tofind the best hyperparameters of CNN, usual search algorithms are used: MS, GS, RS, andBayesian Methods. [55, 56].
10
3.5. Restricted Boltzmann Machines (RBMs)RBM is a productive stochastic ANN that can learn probability distribution on the input
set [65]. RBMs are mostly used for unsupervised learning [66]. RBMs are used in applicationssuch as dimension reduction, classification, feature learning, collaborative filtering [67]. Theadvantage of the RBMs is to find hidden patterns with an unsupervised method. Thedisadvantage of RBMs is its difficult training process. “RBMs are tricky because althoughthere are good estimators of the log-likelihood gradient, there are no known cheap ways ofestimating the log-likelihood itself" [68].
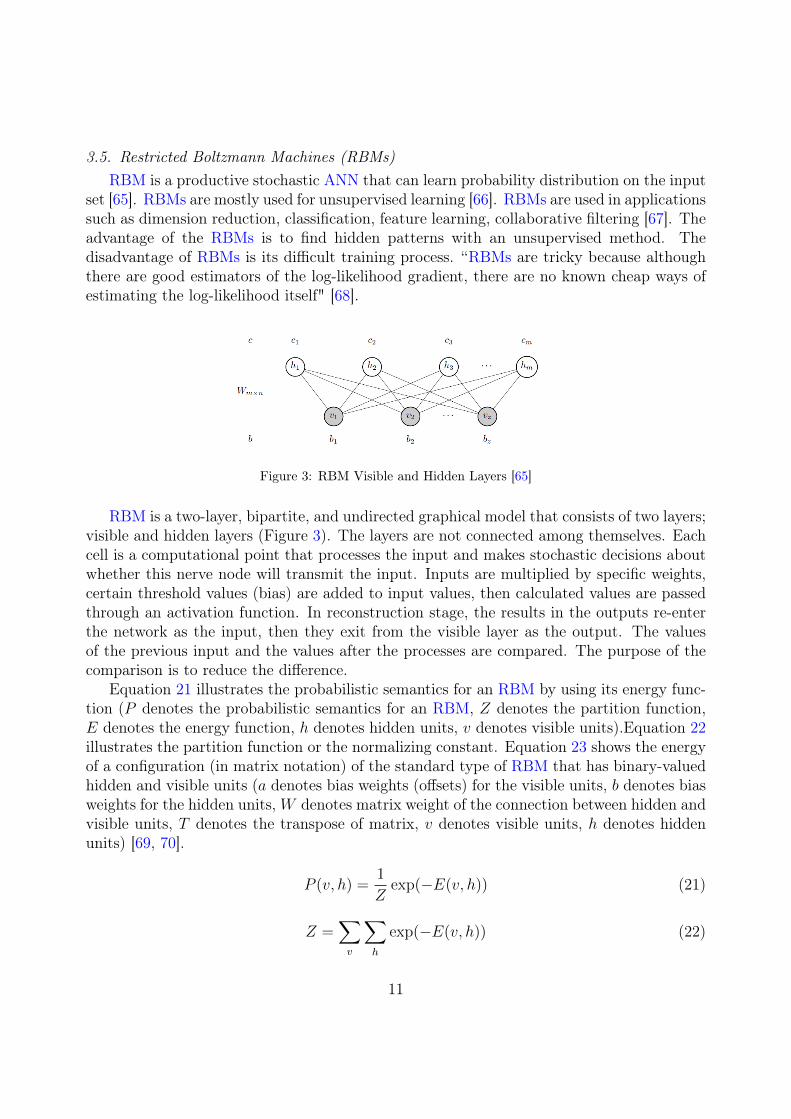
Figure 3: RBM Visible and Hidden Layers [65]
RBM is a two-layer, bipartite, and undirected graphical model that consists of two layers;visible and hidden layers (Figure 3). The layers are not connected among themselves. Eachcell is a computational point that processes the input and makes stochastic decisions aboutwhether this nerve node will transmit the input. Inputs are multiplied by specific weights,certain threshold values (bias) are added to input values, then calculated values are passedthrough an activation function. In reconstruction stage, the results in the outputs re-enterthe network as the input, then they exit from the visible layer as the output. The valuesof the previous input and the values after the processes are compared. The purpose of thecomparison is to reduce the difference.
Equation 21 illustrates the probabilistic semantics for an RBM by using its energy func-tion (P denotes the probabilistic semantics for an RBM, Z denotes the partition function,E denotes the energy function, h denotes hidden units, v denotes visible units).Equation 22illustrates the partition function or the normalizing constant. Equation 23 shows the energyof a configuration (in matrix notation) of the standard type of RBM that has binary-valuedhidden and visible units (a denotes bias weights (offsets) for the visible units, b denotes biasweights for the hidden units,W denotes matrix weight of the connection between hidden andvisible units, T denotes the transpose of matrix, v denotes visible units, h denotes hiddenunits) [69, 70].
P (v, h) =1
Zexp(−E(v, h)) (21)
Z =∑v
∑h
exp(−E(v, h)) (22)
11
E(v, h) = −aTv − bTh− vTWh (23)
The learning is performed multiple times on the network [65]. The training of RBMs isimplemented through minimizing the negative log-likelihood of the model and data. Con-trastive Divergence (CD) algorithm is used for the stochastic approximation algorithm whichreplaces the model expectation for an estimation using Gibbs Sampling with a limited num-ber of iterations [66]. In the CD algorithm, the Kullback Leibler Divergence (KL-Divergence)algorithm is used to measure the distance between its reconstructed probability distributionand the original probability distribution of the input [71].
Momentum, learning rate, weight-cost (decay rate), batch size (minibatch size), regu-larization method, the number of epochs, the number of layers, initialization of weights,size of visible units, size of hidden units, type of activation units (sigmoid, softmax, ReLU,Gaussian units, etc.), loss function, and optimization algorithms are the hyperparameters ofRBMs. Similar to the other deep networks, the hyperparameters are searched with MS, GS,RS, and bayesian methods (Gaussian process). In addition to these, Annealed ImportanceSampling (AIS) is used to estimate the partition function. CD algorithm is also used for theoptimization of RBMs [55, 56, 72, 73].
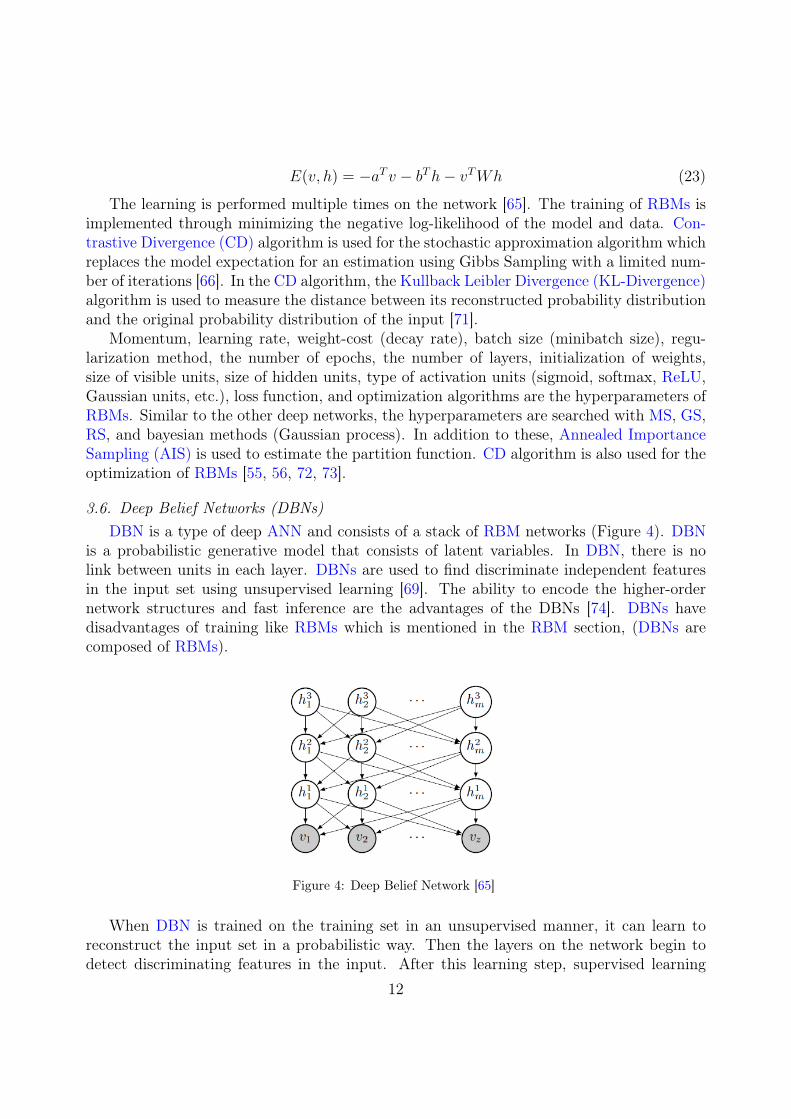
3.6. Deep Belief Networks (DBNs)DBN is a type of deep ANN and consists of a stack of RBM networks (Figure 4). DBN
is a probabilistic generative model that consists of latent variables. In DBN, there is nolink between units in each layer. DBNs are used to find discriminate independent featuresin the input set using unsupervised learning [69]. The ability to encode the higher-ordernetwork structures and fast inference are the advantages of the DBNs [74]. DBNs havedisadvantages of training like RBMs which is mentioned in the RBM section, (DBNs arecomposed of RBMs).
Figure 4: Deep Belief Network [65]
When DBN is trained on the training set in an unsupervised manner, it can learn toreconstruct the input set in a probabilistic way. Then the layers on the network begin todetect discriminating features in the input. After this learning step, supervised learning
12
is carried out to perform the classification [75]. Equation 24 illustrates the probability ofgenerating a visible vector (W : matrix weight of connection between hidden unit h andvisible unit v, p(h|W ): the prior distribution over hidden vectors) [69].
p(v) =∑h
p(h|W )p(v|h,W ) (24)
DBN training process can be divided into two steps: stacked RBM learning and back-propagation learning. In stacked RBM learning, iterative CD algorithm is used [66]. Inbackpropagation learning, optimization algorithms (SGD, RMSProp, ADAM) are used totrain network [74]. DBNs’ hyperparameters are similar to RBMs’ hyperparameters. Momen-tum, learning rate, weight-cost (decay rate), regularization method, batch size (minibatchsize), the number of epochs, the number of layers, initialization of weights, the number ofRBM stacks, size of visible units in RBMs’ layers, size of hidden units in RBMs’ layer, typeof units (sigmoid, softmax, rectified, Gaussian units, etc.), network weight initialization,and optimization algorithms are the hyperparameters of DBNs. Similar to the other deepnetworks, the hyperparameters are searched with MS, GS, RS, and Bayesian methods. CDalgorithm is also used for the optimization of DBNs [55, 56, 72, 73].
3.7. Autoencoders (AEs)AE networks are ANN types that are used as unsupervised learning models. In addition,
AE networks are commonly used in DL models, wherein they remap the inputs (features)such that the inputs are more representative for classification. In other words, AE networksperform an unsupervised feature learning process, which fits very well with the DL theme.A representation of a data set is learned by reducing the dimensionality with AEs. AEs aresimilar to Feedforward Neural Networks (FFNNs)’ architecture. They consist of an inputlayer, an output layer and one or more hidden layers that connect them together. Thenumber of nodes in the input layer and the number of nodes in the output layer are equal toeach other in AEs, and they have a symmetrical structure. The most notable advantages ofAEs are dimensionality reduction and feature learning. Meanwhile, reducing dimensionalityand feature extraction in AEs cause some drawbacks. Focusing on minimizing the loss ofdata relationship in encoding of AE cause the loss of some significant data relationships.Hence, this may be considered as a drawback of AEs[76].
In general, AEs contain two components: encoder and decoder. The input x ∈ [0, 1]d
is converted through function f(x) (W1 denotes a weight matrix of encoder, b1 denotes abias vector of encoder, σ1 element-wise sigmoid activation function of encoder). Output his the encoded part of AEs (code), latent variables, or latent representation. The inverseof function f(x), called function g(h), produces the reconstruction of output r (W2 denotesa weight matrix of decoder, b2 denotes a bias vector of decoder, σ2 element-wise sigmoidactivation function of decoder). Equations 25 and 26 illustrate the simple AE process [77].Equation 27 shows the loss function of the AE, the Mean Squared Error (MSE). In theliterature, AEs have been used for feature extraction and dimensionality reduction [39, 77].
h = f(x) = σ1(W1x+ b1) (25)13
r = g(h) = σ2(W2h+ b2) (26)
L(x, r) = ||x− r||2 (27)
AEs are a specialized version of FFNNs. The backpropagation learning is used forthe update of the weights in the network[39]. Optimization algorithms (SGD, RMSProp,ADAM) are used for the learning process of AEs. MSE is used as a loss function in AEs. Inaddition, recirculation algorithms may also be used for the training of the AEs [39]. AEs’hyperparameters are similar to DL hyperparameters. Learning rate, weight-cost (decayrate), dropout fraction, batch size (minibatch size), the number of epochs, the number oflayers, the number of nodes in each encoder layers, type of activation functions, number ofnodes in each decoder layers, network weight initialization, optimization algorithms, and thenumber of nodes in the code layer (size of latent representation) are the hyperparameters ofAEs. Similar to the other deep networks, the hyperparameters are searched with MS, GS,RS, and Bayesian methods [55, 56].
3.8. Deep Reinforcement Learning (DRL)Reinforcement learning (RL) is a type of learning method that differs from supervised
and unsupervised learning models. It does not need a preliminary data set which is labeledor clustered before. RL is an ML approach inspired by learning action/behavior, whichdeals with what actions should be taken by subjects to achieve the highest reward in an en-vironment. There are different application areas that are used: game theory, control theory,multi-agent systems, operations research, robotics, information theory, managing investmentportfolio, simulation-based optimization, playing Atari games, and statistics [78]. Some ofthe advantages of using RL for control problems are that an agent can be easily re-trainedto adapt to changes in the environment and that the system is continually improved whiletraining is constantly performed. An RL agent learns by interacting with its surroundingsand observing the results of these interactions. This learning method mimics the basic wayof how people learn.
RL is mainly based on Markov Decision Process (MDP). MDP is used to formalize theRL environment. MDP consists of five tuples: state (finite set of states), action (finiteset of actions), reward function (scalar feedback signal), state transition probability matrix(p(s′, r|s, a), s′ denotes next state, r denotes reward function, s denotes state, a denotesaction), discount factor (γ, present value of future rewards). The aim of the agent is tomaximize the cumulative reward. The return (Gt) is the total discounted reward. Equa-tion 28 illustrates the total return (Gt denotes total discounted reward, R denotes rewards,t denotes time, k denotes variable in time).
Gt = Rt+1 + γRt+2 + γ2Rt+3 + ... =∞∑k=0
γkRt+k+1 (28)
The value function is the prediction of the future values. It informs about how goodis state/action. Equation 29 illustrates the formulation of the value function (v(s) denotes
14
the value function, E[.] denotes the expectation function, Gt denotes the total discountedreward, s denotes the given state, R denotes the rewards, S denotes the set of states, tdenotes time).
v(s) = E[Gt|St = s] = E[Rt+1 + γv(St+1)|St = s] (29)
Policy (π) is the agent’s behavior strategy. It is like a map from state to action. There aretwo types of value functions to express the actions in the policy: state-value function (vπ(s)),action-value function (qπ(s, a)). The state-value function (Equation 30) is the expectedreturn of starting from s to following policy π (Eπ[.] denotes expectation function). Theaction-value function (Equation 31) is the expected return of starting from s, taking actiona to following policy π (A denotes the set of actions, a denotes the given action).
vπ(s) = Eπ[Gt|St = s] = Eπ[∞∑k=0
γkRt+k+1|St = s] (30)
qπ(s, a) = Eπ[Gt|St = s, At = a] (31)
The optimal state-value function (Equation 32) is the maximum value function over allpolicies. The optimal action-value function (Equation 33) is the maximum action-valuefunction over all policies.
v∗(s) = max(vπ(s)) (32)
q∗(s, a) = max(qπ(s, a)) (33)
The RL solutions and methods in the literature are too broad to review in this paper. So,we summarized the important issues of RL, important RL solutions and methods. RL meth-ods are mainly divided into two sections: Model-based methods and model-free methods.The model-based method uses a model that is known by the agent before, value/policy andexperience. The experience can be real (sample from the environment) or simulated (samplefrom the model). Model-based methods are mostly used in the application of robotics, andcontrol algorithms [79]. Model-free methods are mainly divided into two groups: Value-basedand policy-based methods. In value-based methods, a policy is produced directly from thevalue function (e.g. epsilon-greedy). In policy-based methods, the policy is parametrized di-rectly. In value-based methods, there are three main solutions for MDP problems: DynamicProgramming (DP), Monte Carlo (MC), and Temporal Difference (TD).
In DP method, problems are solved with optimal substructure and overlapping subprob-lems. The full model is known and it is used for planning in MDP. There are two iterations(learning algorithms) in DP: policy iteration and value iteration. MC method learns experi-ence directly by running an episode of game/simulation. MC is a type of model-free methodthat does not need MDP transitions/rewards. It collects states, returns and it gets meanof returns for the value function. TD is also a model-free method that learns the experi-ence directly by running the episode. In addition, TD learns incomplete episodes like the
15
DP method by using bootstrapping. TD method combines MC and DP methods. SARSA(state, action, reward, state, action; St, At, Rt, St+1, At+1) is a type of TD control algo-rithm. Q-value (action-value function) is updated with the agent actions. It is an on-policylearning model that learns from actions according to the current policy π. Equation 34illustrates the update of the action-value function in SARSA algorithm (St denotes currentstate, At denotes current action, t denotes time, R denotes reward, α denotes learning rate,γ denotes discount factor). Q-learning is another TD control algorithm. It is an off-policylearning model that learns from different actions that do not need the policy π at all. Equa-tion 35 illustrates the update of the action-value function in Q-Learning algorithm (Thewhole algorithms can be reached in [78], a′ denotes action).
Q(St, At) = Q(St, At) + α[R(t+ 1) + γQ(St+1, At+1)−Q(St, At)] (34)
Q(St, At) = Q(St, At) + α[R(t+ 1) + γmaxa′Q(St+1, a′)−Q(St, At)] (35)
In the value-based methods, a policy can be generated directly from the value function(e.g. using epsilon-greedy). The policy-based method uses the policy directly instead of usingthe value function. It has advantages and disadvantages over the value-based methods. Thepolicy-based methods are more effective in high-dimensional or continuous action spaces,and have better convergence properties when compared against the value-based methods. Itcan also learn the stochastic policies. On the other hand, the policy-based method evaluatesa policy that is typically inefficient and has high variance. It typically converges to a localrather than the global optimum. In the policy-based methods, there are also different solu-tions: Policy gradient, Reinforce (Monte-Carlo Policy Gradient), Actor-Critic [78] (Detailsof policy-based methods can be reached in [78]).
DRL methods contain NNs. Therefore, DRL hyperparameters are similar to DL hyperpa-rameters. Learning rate, weight-cost (decay rate), dropout fraction, regularization method,batch size (minibatch size), the number of epochs, the number of layers, the number ofnodes in each layer, type of activation functions, network weight initialization, optimizationalgorithms, discount factor, and the number of episodes are the hyperparameters of DRL.Similar to the other deep networks, the hyperparameters are searched with MS, GS, RS andbayesian methods [55, 56].
4. Financial Time Series Forecasting
The most widely studied financial application area is forecasting of a given financial timeseries, in particular asset price forecasting. Even though some variations exist, the mainfocus is on predicting the next movement of the underlying asset. More than half of theexisting implementations of DL were focused on this area. Even though there are severalsubtopics of this general problem including Stock price forecasting, Index prediction, forexprice prediction, commodity (oil, gold, etc) price prediction, bond price forecasting, volatilityforecasting, cryptocurrency price forecasting, the underlying dynamics are the same in allof these applications.
16
The studies can also be clustered into two main groups based on their expected outputs:price prediction and price movement (trend) prediction. Even though price forecasting isbasically a regression problem, in most of the financial time series forecasting applications,correct prediction of the price is not perceived as important as correctly identifying thedirectional movement. As a result, researchers consider trend prediction, i.e. forecastingwhich way the price will change, a more crucial study area compared with exact priceprediction. In that sense, trend prediction becomes a classification problem. In some studies,only up or down movements are taken into consideration (2-class problem), whereas up, downor neutral movements (3-class problem) also exist.
LSTM and its variations along with some hybrid models dominate the financial timeseries forecasting domain. LSTM, by its nature utilizes the temporal characteristics of anytime series signal, hence forecasting financial time series is a well-studied and successfulimplementation of LSTM. However, some researchers prefer to either extract appropriatefeatures from the time series or transform the time series in such a way that, the resultingfinancial data becomes stationary from a temporal perspective, meaning even if we shufflethe data order, we will still be able to properly train the model and achieve successful out-of-sample test performance. For those implementations, CNN and Deep Feedforward NeuralNetwork (DFNN) were the most commonly chosen DL models.
Various financial time series forecasting implementations using DL models exist in lit-erature. We will cover each of these aforementioned implementation areas in the followingsubsections. In this survey paper, we examined the papers using the following criteria:
• First, we grouped the articles according to their subjects.
• Then, we grouped the related papers according to their feature set.
• Finally, we grouped each subgroup according to DL models/methods.
For each implementation area, the related papers will be subgrouped and tabulated.Each table will have the following fields to provide the information about the implementationdetails for the papers within the group: Article (Art.) and Data Set are trivial, Period refersto the time period for training and testing. Feature Set lists the input features used in thestudy. Lag has the time length of the input vector (e.g. 30d means the input vector has a30 day window) and horizon shows how far out into the future is predicted by the model.Some abbreviations are used for these two aforementioned fields: min is minutes, h is hours,d is days, w is weeks, m is months, y is years, s is steps, * is mixed. Method shows theDL models that are used in the study. Performance criteria provides the evaluation metrics,and finally the Environment (Env.) lists the development framework/software/tools. Somecolumn values might be empty, indicating there was no relevant information in the paperfor the corresponding field.
4.1. Stock Price ForecastingPrice prediction of any given stock is the most studied financial application of all. We
observed the same trend within the DL implementations. Depending on the prediction time
17
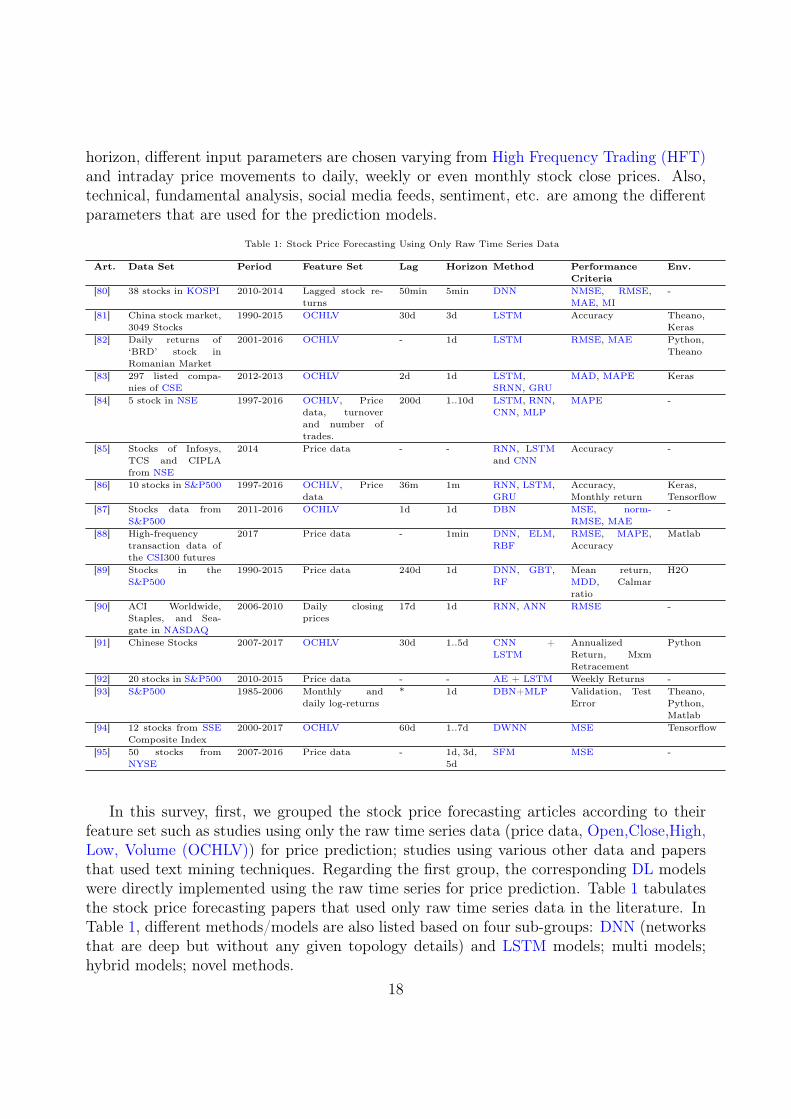
horizon, different input parameters are chosen varying from High Frequency Trading (HFT)and intraday price movements to daily, weekly or even monthly stock close prices. Also,technical, fundamental analysis, social media feeds, sentiment, etc. are among the differentparameters that are used for the prediction models.
Table 1: Stock Price Forecasting Using Only Raw Time Series Data
Art. Data Set Period Feature Set Lag Horizon Method PerformanceCriteria
Env.
[80] 38 stocks in KOSPI 2010-2014 Lagged stock re-turns
50min 5min DNN NMSE, RMSE,MAE, MI
-
[81] China stock market,3049 Stocks
1990-2015 OCHLV 30d 3d LSTM Accuracy Theano,Keras
[82] Daily returns of‘BRD’ stock inRomanian Market
2001-2016 OCHLV - 1d LSTM RMSE, MAE Python,Theano
[83] 297 listed compa-nies of CSE
2012-2013 OCHLV 2d 1d LSTM,SRNN, GRU
MAD, MAPE Keras
[84] 5 stock in NSE 1997-2016 OCHLV, Pricedata, turnoverand number oftrades.
200d 1..10d LSTM, RNN,CNN, MLP
MAPE -
[85] Stocks of Infosys,TCS and CIPLAfrom NSE
2014 Price data - - RNN, LSTMand CNN
Accuracy -
[86] 10 stocks in S&P500 1997-2016 OCHLV, Pricedata
36m 1m RNN, LSTM,GRU
Accuracy,Monthly return
Keras,Tensorflow
[87] Stocks data fromS&P500
2011-2016 OCHLV 1d 1d DBN MSE, norm-RMSE, MAE
-
[88] High-frequencytransaction data ofthe CSI300 futures
2017 Price data - 1min DNN, ELM,RBF
RMSE, MAPE,Accuracy
Matlab
[89] Stocks in theS&P500
1990-2015 Price data 240d 1d DNN, GBT,RF
Mean return,MDD, Calmarratio
H2O
[90] ACI Worldwide,Staples, and Sea-gate in NASDAQ
2006-2010 Daily closingprices
17d 1d RNN, ANN RMSE -
[91] Chinese Stocks 2007-2017 OCHLV 30d 1..5d CNN +LSTM
AnnualizedReturn, MxmRetracement
Python
[92] 20 stocks in S&P500 2010-2015 Price data - - AE + LSTM Weekly Returns -[93] S&P500 1985-2006 Monthly and
daily log-returns* 1d DBN+MLP Validation, Test
ErrorTheano,Python,Matlab
[94] 12 stocks from SSEComposite Index
2000-2017 OCHLV 60d 1..7d DWNN MSE Tensorflow
[95] 50 stocks fromNYSE
2007-2016 Price data - 1d, 3d,5d
SFM MSE -
In this survey, first, we grouped the stock price forecasting articles according to theirfeature set such as studies using only the raw time series data (price data, Open,Close,High,Low, Volume (OCHLV)) for price prediction; studies using various other data and papersthat used text mining techniques. Regarding the first group, the corresponding DL modelswere directly implemented using the raw time series for price prediction. Table 1 tabulatesthe stock price forecasting papers that used only raw time series data in the literature. InTable 1, different methods/models are also listed based on four sub-groups: DNN (networksthat are deep but without any given topology details) and LSTM models; multi models;hybrid models; novel methods.
18
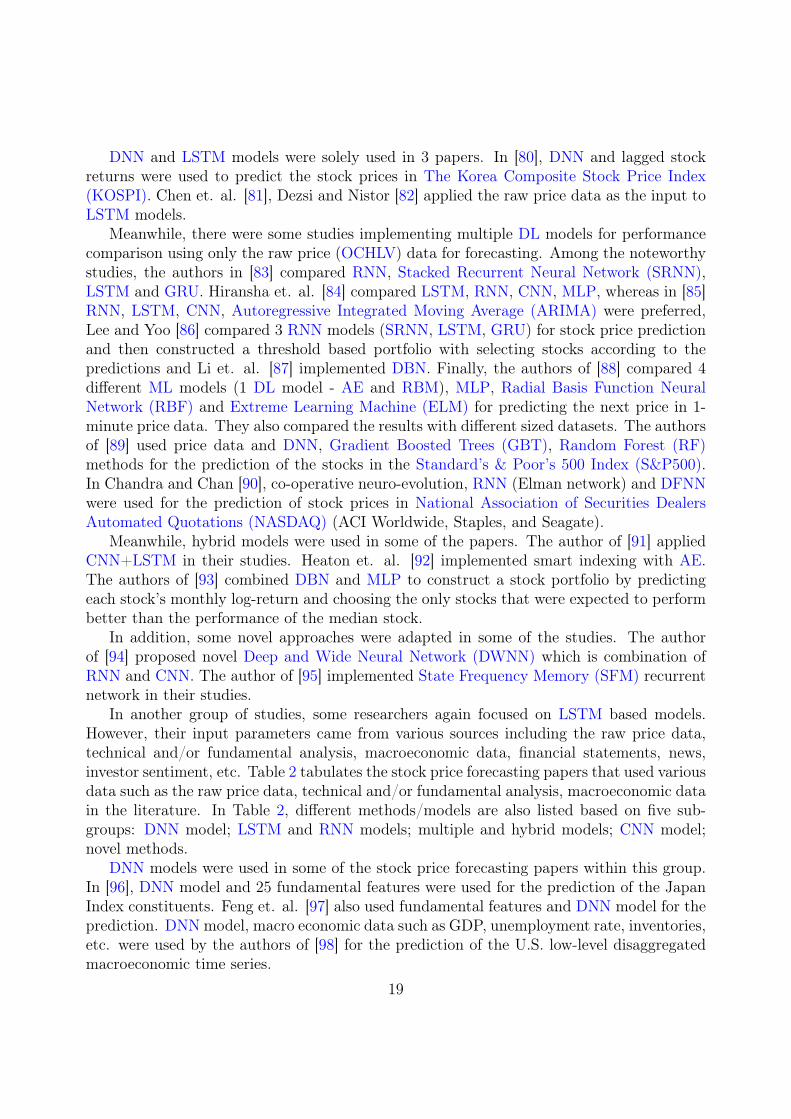
DNN and LSTM models were solely used in 3 papers. In [80], DNN and lagged stockreturns were used to predict the stock prices in The Korea Composite Stock Price Index(KOSPI). Chen et. al. [81], Dezsi and Nistor [82] applied the raw price data as the input toLSTM models.
Meanwhile, there were some studies implementing multiple DL models for performancecomparison using only the raw price (OCHLV) data for forecasting. Among the noteworthystudies, the authors in [83] compared RNN, Stacked Recurrent Neural Network (SRNN),LSTM and GRU. Hiransha et. al. [84] compared LSTM, RNN, CNN, MLP, whereas in [85]RNN, LSTM, CNN, Autoregressive Integrated Moving Average (ARIMA) were preferred,Lee and Yoo [86] compared 3 RNN models (SRNN, LSTM, GRU) for stock price predictionand then constructed a threshold based portfolio with selecting stocks according to thepredictions and Li et. al. [87] implemented DBN. Finally, the authors of [88] compared 4different ML models (1 DL model - AE and RBM), MLP, Radial Basis Function NeuralNetwork (RBF) and Extreme Learning Machine (ELM) for predicting the next price in 1-minute price data. They also compared the results with different sized datasets. The authorsof [89] used price data and DNN, Gradient Boosted Trees (GBT), Random Forest (RF)methods for the prediction of the stocks in the Standard’s & Poor’s 500 Index (S&P500).In Chandra and Chan [90], co-operative neuro-evolution, RNN (Elman network) and DFNNwere used for the prediction of stock prices in National Association of Securities DealersAutomated Quotations (NASDAQ) (ACI Worldwide, Staples, and Seagate).
Meanwhile, hybrid models were used in some of the papers. The author of [91] appliedCNN+LSTM in their studies. Heaton et. al. [92] implemented smart indexing with AE.The authors of [93] combined DBN and MLP to construct a stock portfolio by predictingeach stock’s monthly log-return and choosing the only stocks that were expected to performbetter than the performance of the median stock.
In addition, some novel approaches were adapted in some of the studies. The authorof [94] proposed novel Deep and Wide Neural Network (DWNN) which is combination ofRNN and CNN. The author of [95] implemented State Frequency Memory (SFM) recurrentnetwork in their studies.
In another group of studies, some researchers again focused on LSTM based models.However, their input parameters came from various sources including the raw price data,technical and/or fundamental analysis, macroeconomic data, financial statements, news,investor sentiment, etc. Table 2 tabulates the stock price forecasting papers that used variousdata such as the raw price data, technical and/or fundamental analysis, macroeconomic datain the literature. In Table 2, different methods/models are also listed based on five sub-groups: DNN model; LSTM and RNN models; multiple and hybrid models; CNN model;novel methods.
DNN models were used in some of the stock price forecasting papers within this group.In [96], DNN model and 25 fundamental features were used for the prediction of the JapanIndex constituents. Feng et. al. [97] also used fundamental features and DNN model for theprediction. DNN model, macro economic data such as GDP, unemployment rate, inventories,etc. were used by the authors of [98] for the prediction of the U.S. low-level disaggregatedmacroeconomic time series.
19
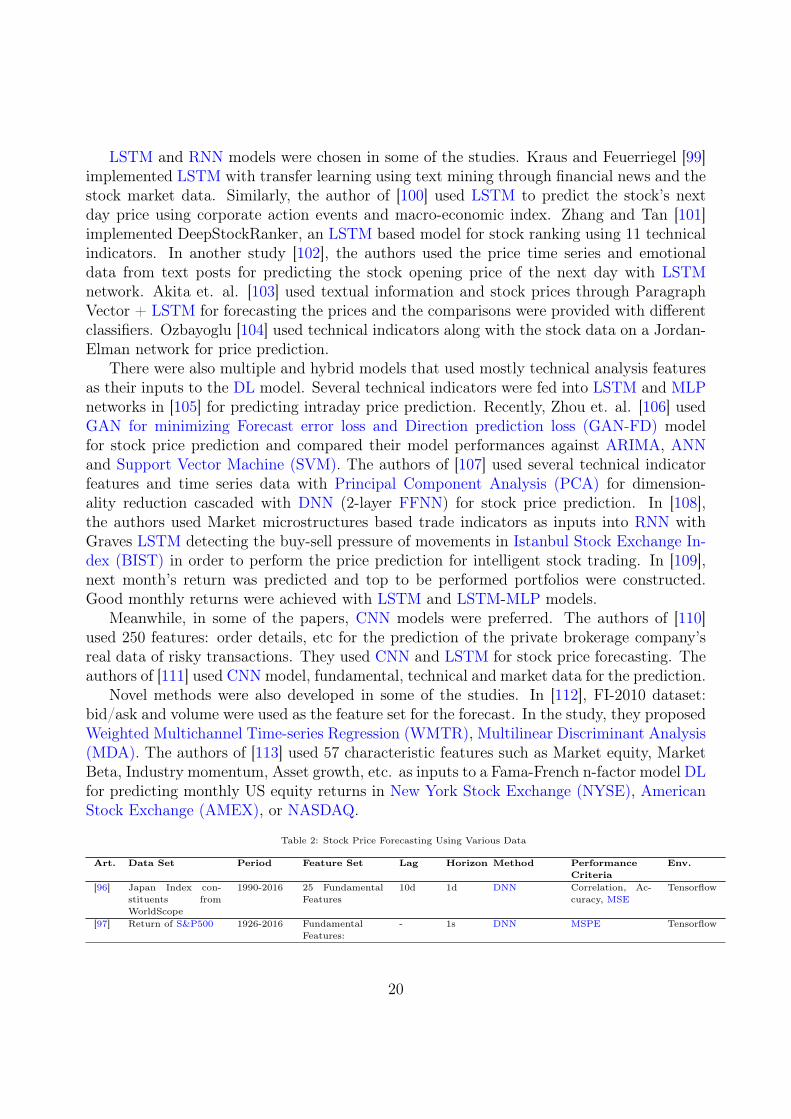
LSTM and RNN models were chosen in some of the studies. Kraus and Feuerriegel [99]implemented LSTM with transfer learning using text mining through financial news and thestock market data. Similarly, the author of [100] used LSTM to predict the stock’s nextday price using corporate action events and macro-economic index. Zhang and Tan [101]implemented DeepStockRanker, an LSTM based model for stock ranking using 11 technicalindicators. In another study [102], the authors used the price time series and emotionaldata from text posts for predicting the stock opening price of the next day with LSTMnetwork. Akita et. al. [103] used textual information and stock prices through ParagraphVector + LSTM for forecasting the prices and the comparisons were provided with differentclassifiers. Ozbayoglu [104] used technical indicators along with the stock data on a Jordan-Elman network for price prediction.
There were also multiple and hybrid models that used mostly technical analysis featuresas their inputs to the DL model. Several technical indicators were fed into LSTM and MLPnetworks in [105] for predicting intraday price prediction. Recently, Zhou et. al. [106] usedGAN for minimizing Forecast error loss and Direction prediction loss (GAN-FD) modelfor stock price prediction and compared their model performances against ARIMA, ANNand Support Vector Machine (SVM). The authors of [107] used several technical indicatorfeatures and time series data with Principal Component Analysis (PCA) for dimension-ality reduction cascaded with DNN (2-layer FFNN) for stock price prediction. In [108],the authors used Market microstructures based trade indicators as inputs into RNN withGraves LSTM detecting the buy-sell pressure of movements in Istanbul Stock Exchange In-dex (BIST) in order to perform the price prediction for intelligent stock trading. In [109],next month’s return was predicted and top to be performed portfolios were constructed.Good monthly returns were achieved with LSTM and LSTM-MLP models.
Meanwhile, in some of the papers, CNN models were preferred. The authors of [110]used 250 features: order details, etc for the prediction of the private brokerage company’sreal data of risky transactions. They used CNN and LSTM for stock price forecasting. Theauthors of [111] used CNN model, fundamental, technical and market data for the prediction.
Novel methods were also developed in some of the studies. In [112], FI-2010 dataset:bid/ask and volume were used as the feature set for the forecast. In the study, they proposedWeighted Multichannel Time-series Regression (WMTR), Multilinear Discriminant Analysis(MDA). The authors of [113] used 57 characteristic features such as Market equity, MarketBeta, Industry momentum, Asset growth, etc. as inputs to a Fama-French n-factor model DLfor predicting monthly US equity returns in New York Stock Exchange (NYSE), AmericanStock Exchange (AMEX), or NASDAQ.
Table 2: Stock Price Forecasting Using Various Data
Art. Data Set Period Feature Set Lag Horizon Method PerformanceCriteria
Env.
[96] Japan Index con-stituents fromWorldScope
1990-2016 25 FundamentalFeatures
10d 1d DNN Correlation, Ac-curacy, MSE
Tensorflow
[97] Return of S&P500 1926-2016 FundamentalFeatures:
- 1s DNN MSPE Tensorflow
20
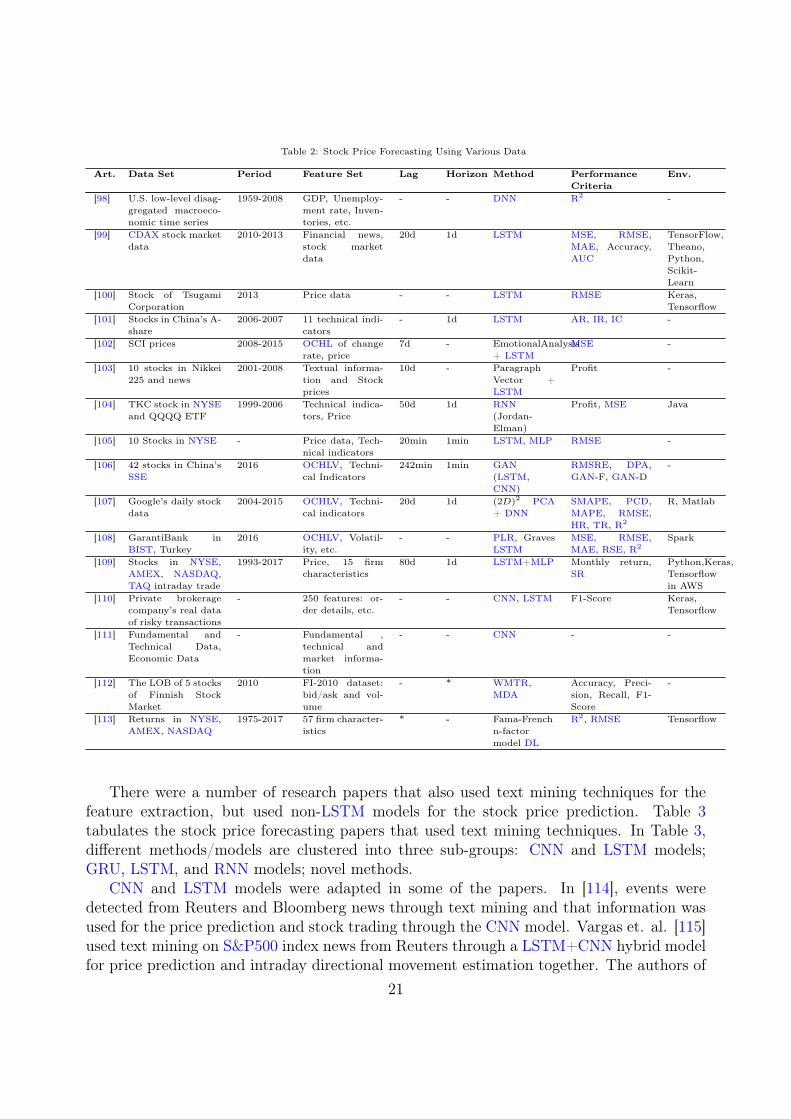
Table 2: Stock Price Forecasting Using Various Data
Art. Data Set Period Feature Set Lag Horizon Method PerformanceCriteria
Env.
[98] U.S. low-level disag-gregated macroeco-nomic time series
1959-2008 GDP, Unemploy-ment rate, Inven-tories, etc.
- - DNN R2 -
[99] CDAX stock marketdata
2010-2013 Financial news,stock marketdata
20d 1d LSTM MSE, RMSE,MAE, Accuracy,AUC
TensorFlow,Theano,Python,Scikit-Learn
[100] Stock of TsugamiCorporation
2013 Price data - - LSTM RMSE Keras,Tensorflow
[101] Stocks in China’s A-share
2006-2007 11 technical indi-cators
- 1d LSTM AR, IR, IC -
[102] SCI prices 2008-2015 OCHL of changerate, price
7d - EmotionalAnalysis+ LSTM
MSE -
[103] 10 stocks in Nikkei225 and news
2001-2008 Textual informa-tion and Stockprices
10d - ParagraphVector +LSTM
Profit -
[104] TKC stock in NYSEand QQQQ ETF
1999-2006 Technical indica-tors, Price
50d 1d RNN(Jordan-Elman)
Profit, MSE Java
[105] 10 Stocks in NYSE - Price data, Tech-nical indicators
20min 1min LSTM, MLP RMSE -
[106] 42 stocks in China’sSSE
2016 OCHLV, Techni-cal Indicators
242min 1min GAN(LSTM,CNN)
RMSRE, DPA,GAN-F, GAN-D
-
[107] Google’s daily stockdata
2004-2015 OCHLV, Techni-cal indicators
20d 1d (2D)2 PCA+ DNN
SMAPE, PCD,MAPE, RMSE,HR, TR, R2
R, Matlab
[108] GarantiBank inBIST, Turkey
2016 OCHLV, Volatil-ity, etc.
- - PLR, GravesLSTM
MSE, RMSE,MAE, RSE, R2
Spark
[109] Stocks in NYSE,AMEX, NASDAQ,TAQ intraday trade
1993-2017 Price, 15 firmcharacteristics
80d 1d LSTM+MLP Monthly return,SR
Python,Keras,Tensorflowin AWS
[110] Private brokeragecompany’s real dataof risky transactions
- 250 features: or-der details, etc.
- - CNN, LSTM F1-Score Keras,Tensorflow
[111] Fundamental andTechnical Data,Economic Data
- Fundamental ,technical andmarket informa-tion
- - CNN - -
[112] The LOB of 5 stocksof Finnish StockMarket
2010 FI-2010 dataset:bid/ask and vol-ume
- * WMTR,MDA
Accuracy, Preci-sion, Recall, F1-Score
-
[113] Returns in NYSE,AMEX, NASDAQ
1975-2017 57 firm character-istics
* - Fama-Frenchn-factormodel DL
R2, RMSE Tensorflow
There were a number of research papers that also used text mining techniques for thefeature extraction, but used non-LSTM models for the stock price prediction. Table 3tabulates the stock price forecasting papers that used text mining techniques. In Table 3,different methods/models are clustered into three sub-groups: CNN and LSTM models;GRU, LSTM, and RNN models; novel methods.
CNN and LSTM models were adapted in some of the papers. In [114], events weredetected from Reuters and Bloomberg news through text mining and that information wasused for the price prediction and stock trading through the CNN model. Vargas et. al. [115]used text mining on S&P500 index news from Reuters through a LSTM+CNN hybrid modelfor price prediction and intraday directional movement estimation together. The authors of
21
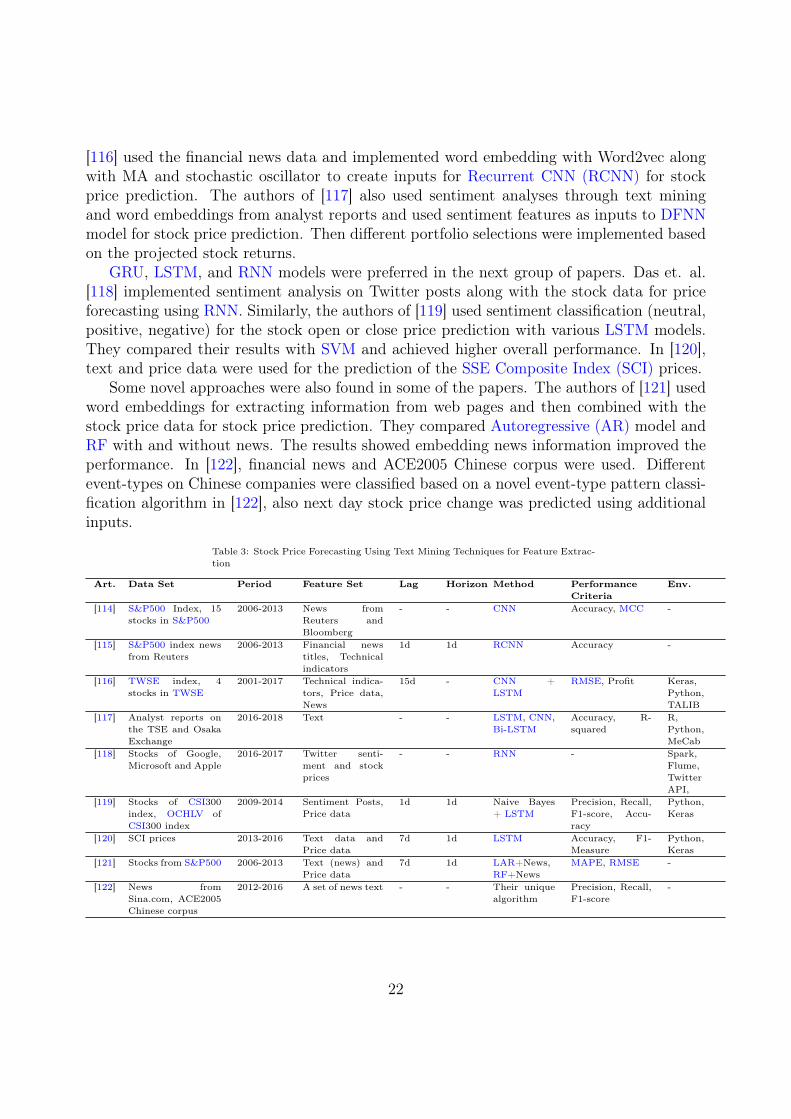
[116] used the financial news data and implemented word embedding with Word2vec alongwith MA and stochastic oscillator to create inputs for Recurrent CNN (RCNN) for stockprice prediction. The authors of [117] also used sentiment analyses through text miningand word embeddings from analyst reports and used sentiment features as inputs to DFNNmodel for stock price prediction. Then different portfolio selections were implemented basedon the projected stock returns.
GRU, LSTM, and RNN models were preferred in the next group of papers. Das et. al.[118] implemented sentiment analysis on Twitter posts along with the stock data for priceforecasting using RNN. Similarly, the authors of [119] used sentiment classification (neutral,positive, negative) for the stock open or close price prediction with various LSTM models.They compared their results with SVM and achieved higher overall performance. In [120],text and price data were used for the prediction of the SSE Composite Index (SCI) prices.
Some novel approaches were also found in some of the papers. The authors of [121] usedword embeddings for extracting information from web pages and then combined with thestock price data for stock price prediction. They compared Autoregressive (AR) model andRF with and without news. The results showed embedding news information improved theperformance. In [122], financial news and ACE2005 Chinese corpus were used. Differentevent-types on Chinese companies were classified based on a novel event-type pattern classi-fication algorithm in [122], also next day stock price change was predicted using additionalinputs.
Table 3: Stock Price Forecasting Using Text Mining Techniques for Feature Extrac-tion
Art. Data Set Period Feature Set Lag Horizon Method PerformanceCriteria
Env.
[114] S&P500 Index, 15stocks in S&P500
2006-2013 News fromReuters andBloomberg
- - CNN Accuracy, MCC -
[115] S&P500 index newsfrom Reuters
2006-2013 Financial newstitles, Technicalindicators
1d 1d RCNN Accuracy -
[116] TWSE index, 4stocks in TWSE
2001-2017 Technical indica-tors, Price data,News
15d - CNN +LSTM
RMSE, Profit Keras,Python,TALIB
[117] Analyst reports onthe TSE and OsakaExchange
2016-2018 Text - - LSTM, CNN,Bi-LSTM
Accuracy, R-squared
R,Python,MeCab
[118] Stocks of Google,Microsoft and Apple
2016-2017 Twitter senti-ment and stockprices
- - RNN - Spark,Flume,TwitterAPI,
[119] Stocks of CSI300index, OCHLV ofCSI300 index
2009-2014 Sentiment Posts,Price data
1d 1d Naive Bayes+ LSTM
Precision, Recall,F1-score, Accu-racy
Python,Keras
[120] SCI prices 2013-2016 Text data andPrice data
7d 1d LSTM Accuracy, F1-Measure
Python,Keras
[121] Stocks from S&P500 2006-2013 Text (news) andPrice data
7d 1d LAR+News,RF+News
MAPE, RMSE -
[122] News fromSina.com, ACE2005Chinese corpus
2012-2016 A set of news text - - Their uniquealgorithm
Precision, Recall,F1-score
-
22
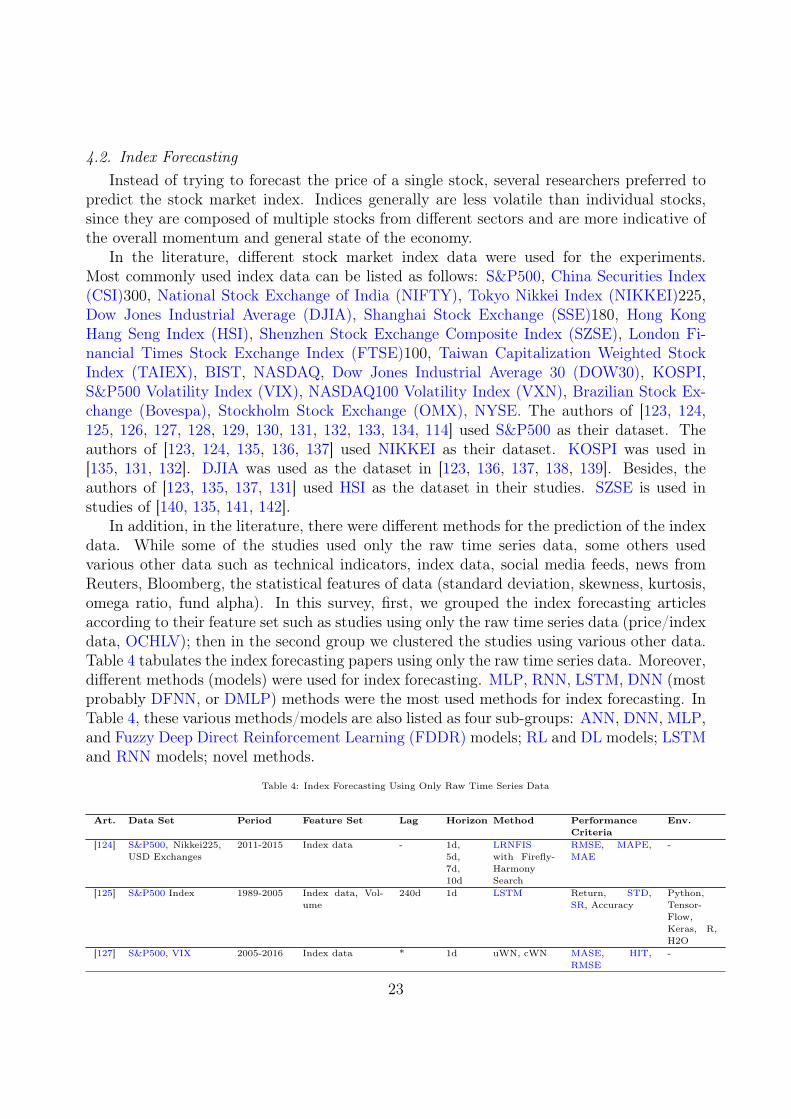
4.2. Index ForecastingInstead of trying to forecast the price of a single stock, several researchers preferred to
predict the stock market index. Indices generally are less volatile than individual stocks,since they are composed of multiple stocks from different sectors and are more indicative ofthe overall momentum and general state of the economy.
In the literature, different stock market index data were used for the experiments.Most commonly used index data can be listed as follows: S&P500, China Securities Index(CSI)300, National Stock Exchange of India (NIFTY), Tokyo Nikkei Index (NIKKEI)225,Dow Jones Industrial Average (DJIA), Shanghai Stock Exchange (SSE)180, Hong KongHang Seng Index (HSI), Shenzhen Stock Exchange Composite Index (SZSE), London Fi-nancial Times Stock Exchange Index (FTSE)100, Taiwan Capitalization Weighted StockIndex (TAIEX), BIST, NASDAQ, Dow Jones Industrial Average 30 (DOW30), KOSPI,S&P500 Volatility Index (VIX), NASDAQ100 Volatility Index (VXN), Brazilian Stock Ex-change (Bovespa), Stockholm Stock Exchange (OMX), NYSE. The authors of [123, 124,125, 126, 127, 128, 129, 130, 131, 132, 133, 134, 114] used S&P500 as their dataset. Theauthors of [123, 124, 135, 136, 137] used NIKKEI as their dataset. KOSPI was used in[135, 131, 132]. DJIA was used as the dataset in [123, 136, 137, 138, 139]. Besides, theauthors of [123, 135, 137, 131] used HSI as the dataset in their studies. SZSE is used instudies of [140, 135, 141, 142].
In addition, in the literature, there were different methods for the prediction of the indexdata. While some of the studies used only the raw time series data, some others usedvarious other data such as technical indicators, index data, social media feeds, news fromReuters, Bloomberg, the statistical features of data (standard deviation, skewness, kurtosis,omega ratio, fund alpha). In this survey, first, we grouped the index forecasting articlesaccording to their feature set such as studies using only the raw time series data (price/indexdata, OCHLV); then in the second group we clustered the studies using various other data.Table 4 tabulates the index forecasting papers using only the raw time series data. Moreover,different methods (models) were used for index forecasting. MLP, RNN, LSTM, DNN (mostprobably DFNN, or DMLP) methods were the most used methods for index forecasting. InTable 4, these various methods/models are also listed as four sub-groups: ANN, DNN, MLP,and Fuzzy Deep Direct Reinforcement Learning (FDDR) models; RL and DL models; LSTMand RNN models; novel methods.
Table 4: Index Forecasting Using Only Raw Time Series Data
Art. Data Set Period Feature Set Lag Horizon Method PerformanceCriteria
Env.
[124] S&P500, Nikkei225,USD Exchanges
2011-2015 Index data - 1d,5d,7d,10d
LRNFISwith Firefly-HarmonySearch
RMSE, MAPE,MAE
-
[125] S&P500 Index 1989-2005 Index data, Vol-ume
240d 1d LSTM Return, STD,SR, Accuracy
Python,Tensor-Flow,Keras, R,H2O
[127] S&P500, VIX 2005-2016 Index data * 1d uWN, cWN MASE, HIT,RMSE
-
23
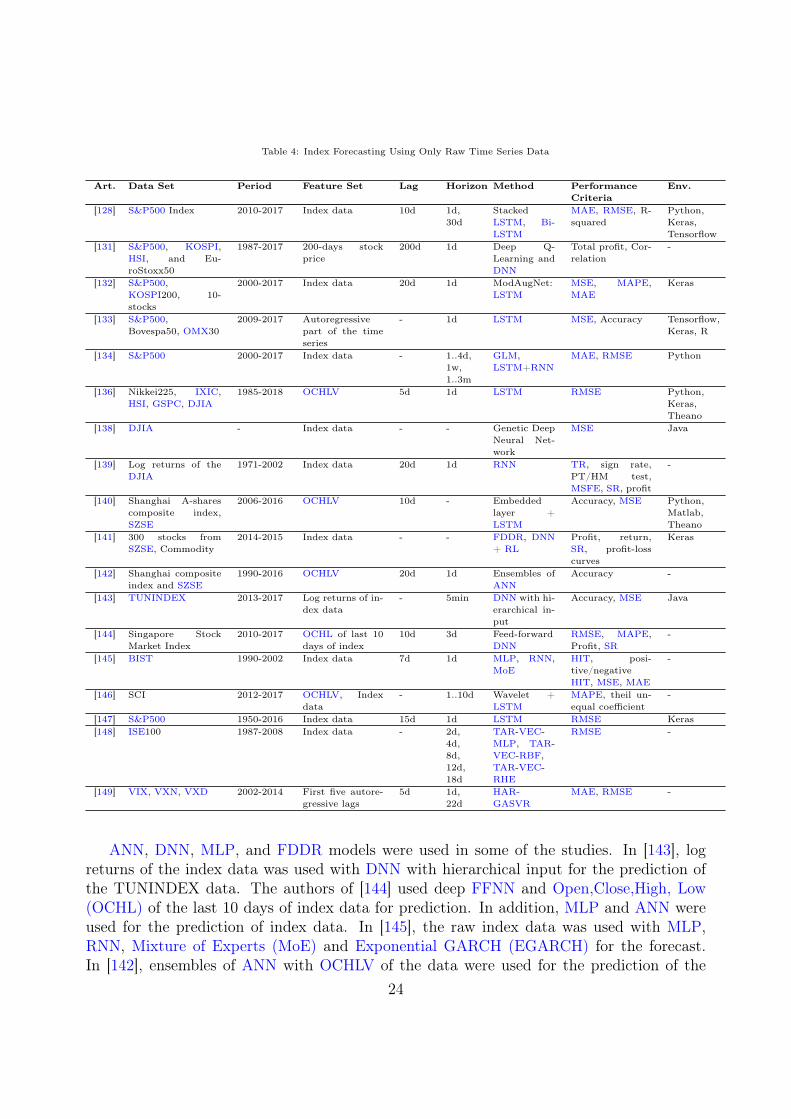
Table 4: Index Forecasting Using Only Raw Time Series Data
Art. Data Set Period Feature Set Lag Horizon Method PerformanceCriteria
Env.
[128] S&P500 Index 2010-2017 Index data 10d 1d,30d
StackedLSTM, Bi-LSTM
MAE, RMSE, R-squared
Python,Keras,Tensorflow
[131] S&P500, KOSPI,HSI, and Eu-roStoxx50
1987-2017 200-days stockprice
200d 1d Deep Q-Learning andDNN
Total profit, Cor-relation
-
[132] S&P500,KOSPI200, 10-stocks
2000-2017 Index data 20d 1d ModAugNet:LSTM
MSE, MAPE,MAE
Keras
[133] S&P500,Bovespa50, OMX30
2009-2017 Autoregressivepart of the timeseries
- 1d LSTM MSE, Accuracy Tensorflow,Keras, R
[134] S&P500 2000-2017 Index data - 1..4d,1w,1..3m
GLM,LSTM+RNN
MAE, RMSE Python
[136] Nikkei225, IXIC,HSI, GSPC, DJIA
1985-2018 OCHLV 5d 1d LSTM RMSE Python,Keras,Theano
[138] DJIA - Index data - - Genetic DeepNeural Net-work
MSE Java
[139] Log returns of theDJIA
1971-2002 Index data 20d 1d RNN TR, sign rate,PT/HM test,MSFE, SR, profit
-
[140] Shanghai A-sharescomposite index,SZSE
2006-2016 OCHLV 10d - Embeddedlayer +LSTM
Accuracy, MSE Python,Matlab,Theano
[141] 300 stocks fromSZSE, Commodity
2014-2015 Index data - - FDDR, DNN+ RL
Profit, return,SR, profit-losscurves
Keras
[142] Shanghai compositeindex and SZSE
1990-2016 OCHLV 20d 1d Ensembles ofANN
Accuracy -
[143] TUNINDEX 2013-2017 Log returns of in-dex data
- 5min DNN with hi-erarchical in-put
Accuracy, MSE Java
[144] Singapore StockMarket Index
2010-2017 OCHL of last 10days of index
10d 3d Feed-forwardDNN
RMSE, MAPE,Profit, SR
-
[145] BIST 1990-2002 Index data 7d 1d MLP, RNN,MoE
HIT, posi-tive/negativeHIT, MSE, MAE
-
[146] SCI 2012-2017 OCHLV, Indexdata
- 1..10d Wavelet +LSTM
MAPE, theil un-equal coefficient
-
[147] S&P500 1950-2016 Index data 15d 1d LSTM RMSE Keras[148] ISE100 1987-2008 Index data - 2d,
4d,8d,12d,18d
TAR-VEC-MLP, TAR-VEC-RBF,TAR-VEC-RHE
RMSE -
[149] VIX, VXN, VXD 2002-2014 First five autore-gressive lags
5d 1d,22d
HAR-GASVR
MAE, RMSE -
ANN, DNN, MLP, and FDDR models were used in some of the studies. In [143], logreturns of the index data was used with DNN with hierarchical input for the prediction ofthe TUNINDEX data. The authors of [144] used deep FFNN and Open,Close,High, Low(OCHL) of the last 10 days of index data for prediction. In addition, MLP and ANN wereused for the prediction of index data. In [145], the raw index data was used with MLP,RNN, Mixture of Experts (MoE) and Exponential GARCH (EGARCH) for the forecast.In [142], ensembles of ANN with OCHLV of the data were used for the prediction of the
24
Shanghai composite index.Furthermore, RL and DL methods were used together for the prediction of the index
data in some of the studies. In [141], FDDR, DNN and RL methods were used to predict300 stocks from SZSE index data and commodity prices. In [131], Deep Q-Learning andDNN methods and 200-days stock price dataset were used together for the prediction ofS&P500 index.
Most of the preferred methods for prediction of the index data using the raw time seriesdata were based on LSTM and RNN. In [139], RNN was used for prediction of the log returnsof DJIA index. In [125], LSTM was used to predict S&P500 Index data. The authors of [128]used stacked LSTM, Bidirectional LSTM (Bi-LSTM) methods for S&P500 Index forecasting.The authors of [146] used LSTM network to predict the next day closing price of Shanghaistock Index. In their study, they used wavelet decomposition to reconstruct the financialtime series for denoising and better learning. In [140], LSTM was used for the prediction ofShanghai A-shares composite index. The authors of [136] used LSTM to predict NIKKEI225,IXIC, HIS, GSPC and DJIA index data. In [147] and [132], LSTM was also used for theprediction of S&P500 and KOSPI200 index. The authors of [132] developed an LSTM basedstock index forecasting model called ModAugNet. The proposed method was able to beatBuy and Hold (B&H) in the long term with an overfitting prevention mechanism. Theauthors of [134] compared different ML models (linear model), Generalized Linear Model(GML) and several LSTM, RNN models for stock index price prediction. In [133], LSTMand autoregressive part of the time series index data were used for prediction of S&P500,Bovespa50, OMX30 indices.
Also, some studies adapted novel appraches. In [138], genetic DNN was used for DJIAindex forecasting. The authors of [127] proposed a new DNN model which is called Wavenetconvolutional net for time series forecasting. The authors of [148] proposed a (Threshold Au-toregressive (TAR)-Vector Error Correction model (VEC)-Recurrent Hybrid Elman (RHE))model for forex and stock index of return prediction and compared several models. The au-thors of [124] proposed a method that is called Locally Recurrent Neuro-fuzzy InformationSystem (LRNFIS) with Firefly Harmony Search Optimization (FHSO) Evolutionary Algo-rithm (EA) to predict S&P500, NIKKEI225 indices and USD Exchange price data. Theauthors of [149] proposed a Heterogeneous Autoregressive Process (HAR) with a GA witha SVR (GASVR) model that was called HAR-GASVR for prediction of VIX, VXN, DowJones Industrial Average Volatility Index (VXD) indices.
In the literature, some of the studies used various input data such as technical indicators,index data, social media news, news from Reuters, Bloomberg, the statistical features ofdata (standard deviation, skewness, kurtosis, omega ratio, fund alpha). Table 5 tabulatesthe index forecasting papers using these aforementioned various data. DNN, RNN, LSTM,CNN methods were the most commonly used models in index forecasting. In Table 5,different methods/models are also listed within four sub-groups: DNN model; RNN andLSTM models; CNN model; novel methods.
DNN was used as the classification model in some of the papers. In [150], DNN and someof the feature of the data (Return, Sharpe-ratio (SR), Standard Deviation (STD), Skewness,Kurtosis, Omega ratio, Fund alpha) were used for the prediction. In [126], DNN, RNN and
25
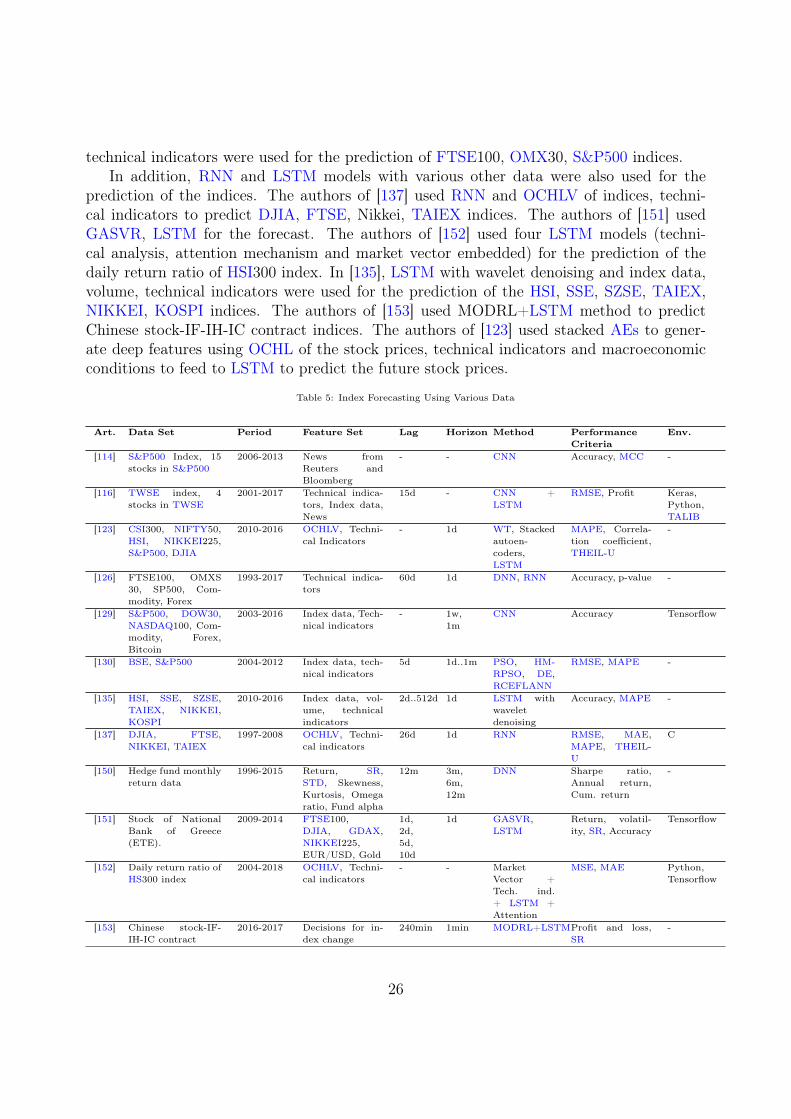
technical indicators were used for the prediction of FTSE100, OMX30, S&P500 indices.In addition, RNN and LSTM models with various other data were also used for the
prediction of the indices. The authors of [137] used RNN and OCHLV of indices, techni-cal indicators to predict DJIA, FTSE, Nikkei, TAIEX indices. The authors of [151] usedGASVR, LSTM for the forecast. The authors of [152] used four LSTM models (techni-cal analysis, attention mechanism and market vector embedded) for the prediction of thedaily return ratio of HSI300 index. In [135], LSTM with wavelet denoising and index data,volume, technical indicators were used for the prediction of the HSI, SSE, SZSE, TAIEX,NIKKEI, KOSPI indices. The authors of [153] used MODRL+LSTM method to predictChinese stock-IF-IH-IC contract indices. The authors of [123] used stacked AEs to gener-ate deep features using OCHL of the stock prices, technical indicators and macroeconomicconditions to feed to LSTM to predict the future stock prices.
Table 5: Index Forecasting Using Various Data
Art. Data Set Period Feature Set Lag Horizon Method PerformanceCriteria
Env.
[114] S&P500 Index, 15stocks in S&P500
2006-2013 News fromReuters andBloomberg
- - CNN Accuracy, MCC -
[116] TWSE index, 4stocks in TWSE
2001-2017 Technical indica-tors, Index data,News
15d - CNN +LSTM
RMSE, Profit Keras,Python,TALIB
[123] CSI300, NIFTY50,HSI, NIKKEI225,S&P500, DJIA
2010-2016 OCHLV, Techni-cal Indicators
- 1d WT, Stackedautoen-coders,LSTM
MAPE, Correla-tion coefficient,THEIL-U
-
[126] FTSE100, OMXS30, SP500, Com-modity, Forex
1993-2017 Technical indica-tors
60d 1d DNN, RNN Accuracy, p-value -
[129] S&P500, DOW30,NASDAQ100, Com-modity, Forex,Bitcoin
2003-2016 Index data, Tech-nical indicators
- 1w,1m
CNN Accuracy Tensorflow
[130] BSE, S&P500 2004-2012 Index data, tech-nical indicators
5d 1d..1m PSO, HM-RPSO, DE,RCEFLANN
RMSE, MAPE -
[135] HSI, SSE, SZSE,TAIEX, NIKKEI,KOSPI
2010-2016 Index data, vol-ume, technicalindicators
2d..512d 1d LSTM withwaveletdenoising
Accuracy, MAPE -
[137] DJIA, FTSE,NIKKEI, TAIEX
1997-2008 OCHLV, Techni-cal indicators
26d 1d RNN RMSE, MAE,MAPE, THEIL-U
C
[150] Hedge fund monthlyreturn data
1996-2015 Return, SR,STD, Skewness,Kurtosis, Omegaratio, Fund alpha
12m 3m,6m,12m
DNN Sharpe ratio,Annual return,Cum. return
-
[151] Stock of NationalBank of Greece(ETE).
2009-2014 FTSE100,DJIA, GDAX,NIKKEI225,EUR/USD, Gold
1d,2d,5d,10d
1d GASVR,LSTM
Return, volatil-ity, SR, Accuracy
Tensorflow
[152] Daily return ratio ofHS300 index
2004-2018 OCHLV, Techni-cal indicators
- - MarketVector +Tech. ind.+ LSTM +Attention
MSE, MAE Python,Tensorflow
[153] Chinese stock-IF-IH-IC contract
2016-2017 Decisions for in-dex change
240min 1min MODRL+LSTMProfit and loss,SR
-
26
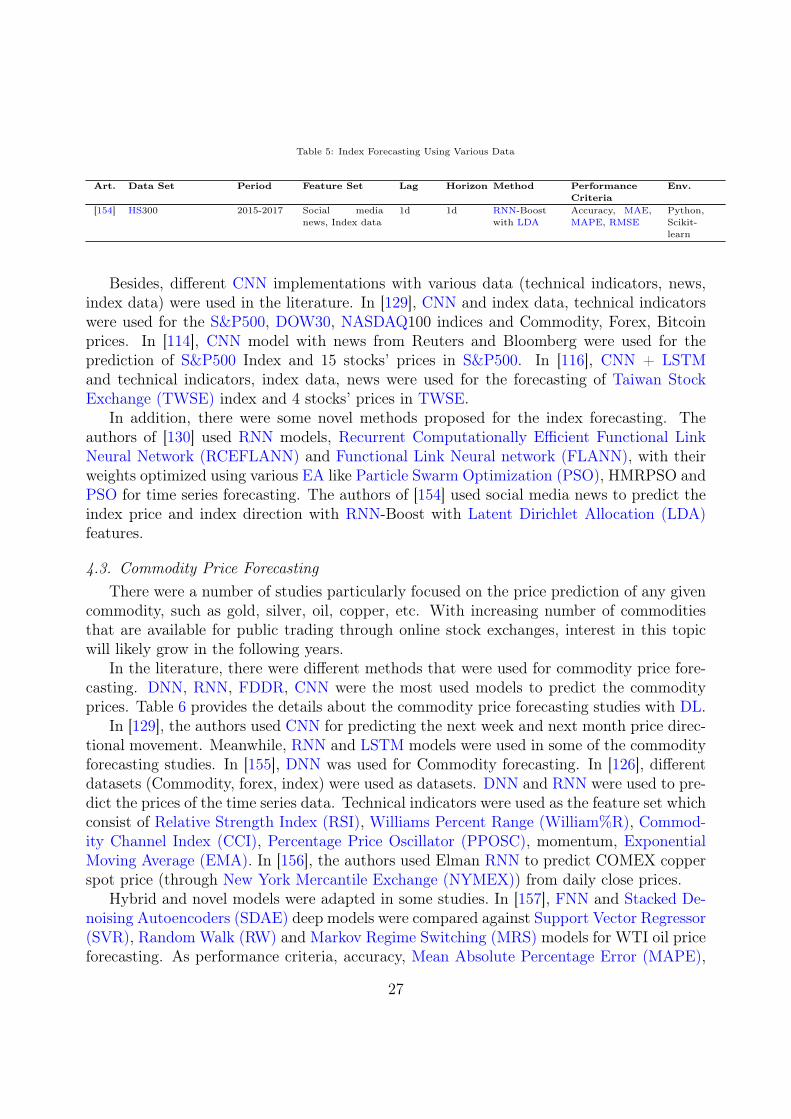
Table 5: Index Forecasting Using Various Data
Art. Data Set Period Feature Set Lag Horizon Method PerformanceCriteria
Env.
[154] HS300 2015-2017 Social medianews, Index data
1d 1d RNN-Boostwith LDA
Accuracy, MAE,MAPE, RMSE
Python,Scikit-learn
Besides, different CNN implementations with various data (technical indicators, news,index data) were used in the literature. In [129], CNN and index data, technical indicatorswere used for the S&P500, DOW30, NASDAQ100 indices and Commodity, Forex, Bitcoinprices. In [114], CNN model with news from Reuters and Bloomberg were used for theprediction of S&P500 Index and 15 stocks’ prices in S&P500. In [116], CNN + LSTMand technical indicators, index data, news were used for the forecasting of Taiwan StockExchange (TWSE) index and 4 stocks’ prices in TWSE.
In addition, there were some novel methods proposed for the index forecasting. Theauthors of [130] used RNN models, Recurrent Computationally Efficient Functional LinkNeural Network (RCEFLANN) and Functional Link Neural network (FLANN), with theirweights optimized using various EA like Particle Swarm Optimization (PSO), HMRPSO andPSO for time series forecasting. The authors of [154] used social media news to predict theindex price and index direction with RNN-Boost with Latent Dirichlet Allocation (LDA)features.
4.3. Commodity Price ForecastingThere were a number of studies particularly focused on the price prediction of any given
commodity, such as gold, silver, oil, copper, etc. With increasing number of commoditiesthat are available for public trading through online stock exchanges, interest in this topicwill likely grow in the following years.
In the literature, there were different methods that were used for commodity price fore-casting. DNN, RNN, FDDR, CNN were the most used models to predict the commodityprices. Table 6 provides the details about the commodity price forecasting studies with DL.
In [129], the authors used CNN for predicting the next week and next month price direc-tional movement. Meanwhile, RNN and LSTM models were used in some of the commodityforecasting studies. In [155], DNN was used for Commodity forecasting. In [126], differentdatasets (Commodity, forex, index) were used as datasets. DNN and RNN were used to pre-dict the prices of the time series data. Technical indicators were used as the feature set whichconsist of Relative Strength Index (RSI), Williams Percent Range (William%R), Commod-ity Channel Index (CCI), Percentage Price Oscillator (PPOSC), momentum, ExponentialMoving Average (EMA). In [156], the authors used Elman RNN to predict COMEX copperspot price (through New York Mercantile Exchange (NYMEX)) from daily close prices.
Hybrid and novel models were adapted in some studies. In [157], FNN and Stacked De-noising Autoencoders (SDAE) deep models were compared against Support Vector Regressor(SVR), Random Walk (RW) and Markov Regime Switching (MRS) models for WTI oil priceforecasting. As performance criteria, accuracy, Mean Absolute Percentage Error (MAPE),
27
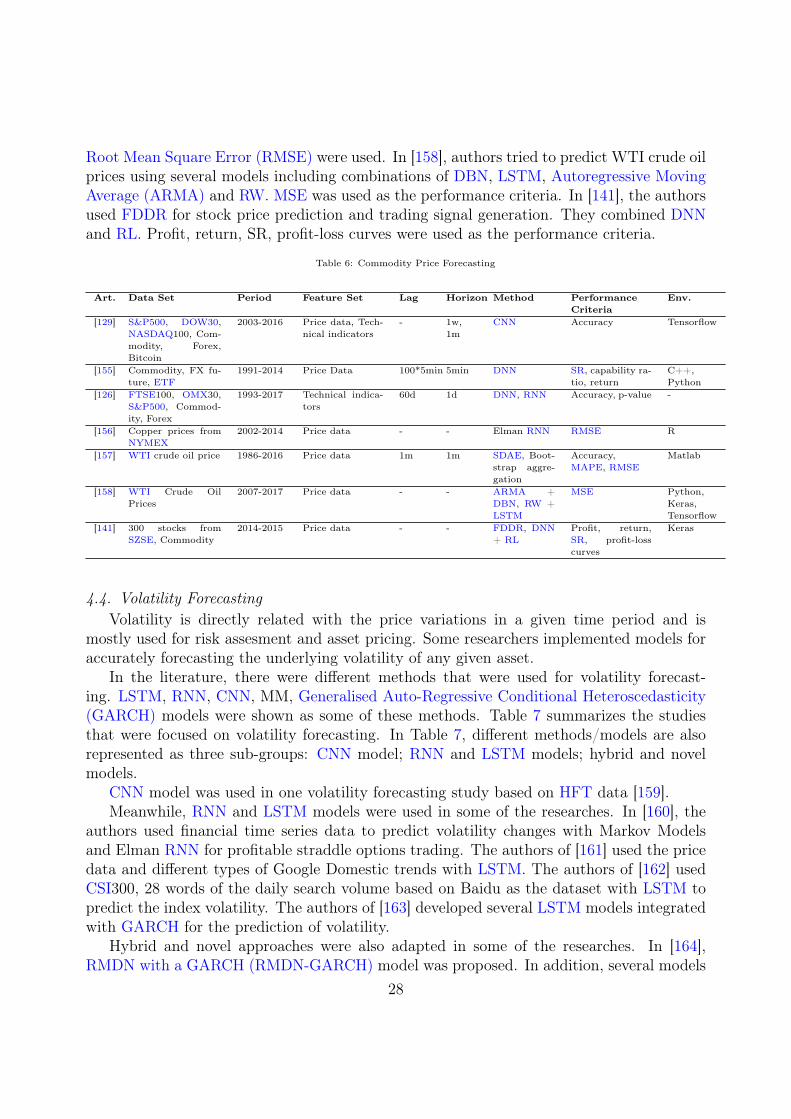
Root Mean Square Error (RMSE) were used. In [158], authors tried to predict WTI crude oilprices using several models including combinations of DBN, LSTM, Autoregressive MovingAverage (ARMA) and RW. MSE was used as the performance criteria. In [141], the authorsused FDDR for stock price prediction and trading signal generation. They combined DNNand RL. Profit, return, SR, profit-loss curves were used as the performance criteria.
Table 6: Commodity Price Forecasting
Art. Data Set Period Feature Set Lag Horizon Method PerformanceCriteria
Env.
[129] S&P500, DOW30,NASDAQ100, Com-modity, Forex,Bitcoin
2003-2016 Price data, Tech-nical indicators
- 1w,1m
CNN Accuracy Tensorflow
[155] Commodity, FX fu-ture, ETF
1991-2014 Price Data 100*5min 5min DNN SR, capability ra-tio, return
C++,Python
[126] FTSE100, OMX30,S&P500, Commod-ity, Forex
1993-2017 Technical indica-tors
60d 1d DNN, RNN Accuracy, p-value -
[156] Copper prices fromNYMEX
2002-2014 Price data - - Elman RNN RMSE R
[157] WTI crude oil price 1986-2016 Price data 1m 1m SDAE, Boot-strap aggre-gation
Accuracy,MAPE, RMSE
Matlab
[158] WTI Crude OilPrices
2007-2017 Price data - - ARMA +DBN, RW +LSTM
MSE Python,Keras,Tensorflow
[141] 300 stocks fromSZSE, Commodity
2014-2015 Price data - - FDDR, DNN+ RL
Profit, return,SR, profit-losscurves
Keras
4.4. Volatility ForecastingVolatility is directly related with the price variations in a given time period and is
mostly used for risk assesment and asset pricing. Some researchers implemented models foraccurately forecasting the underlying volatility of any given asset.
In the literature, there were different methods that were used for volatility forecast-ing. LSTM, RNN, CNN, MM, Generalised Auto-Regressive Conditional Heteroscedasticity(GARCH) models were shown as some of these methods. Table 7 summarizes the studiesthat were focused on volatility forecasting. In Table 7, different methods/models are alsorepresented as three sub-groups: CNN model; RNN and LSTM models; hybrid and novelmodels.
CNN model was used in one volatility forecasting study based on HFT data [159].Meanwhile, RNN and LSTM models were used in some of the researches. In [160], the
authors used financial time series data to predict volatility changes with Markov Modelsand Elman RNN for profitable straddle options trading. The authors of [161] used the pricedata and different types of Google Domestic trends with LSTM. The authors of [162] usedCSI300, 28 words of the daily search volume based on Baidu as the dataset with LSTM topredict the index volatility. The authors of [163] developed several LSTM models integratedwith GARCH for the prediction of volatility.
Hybrid and novel approaches were also adapted in some of the researches. In [164],RMDN with a GARCH (RMDN-GARCH) model was proposed. In addition, several models
28
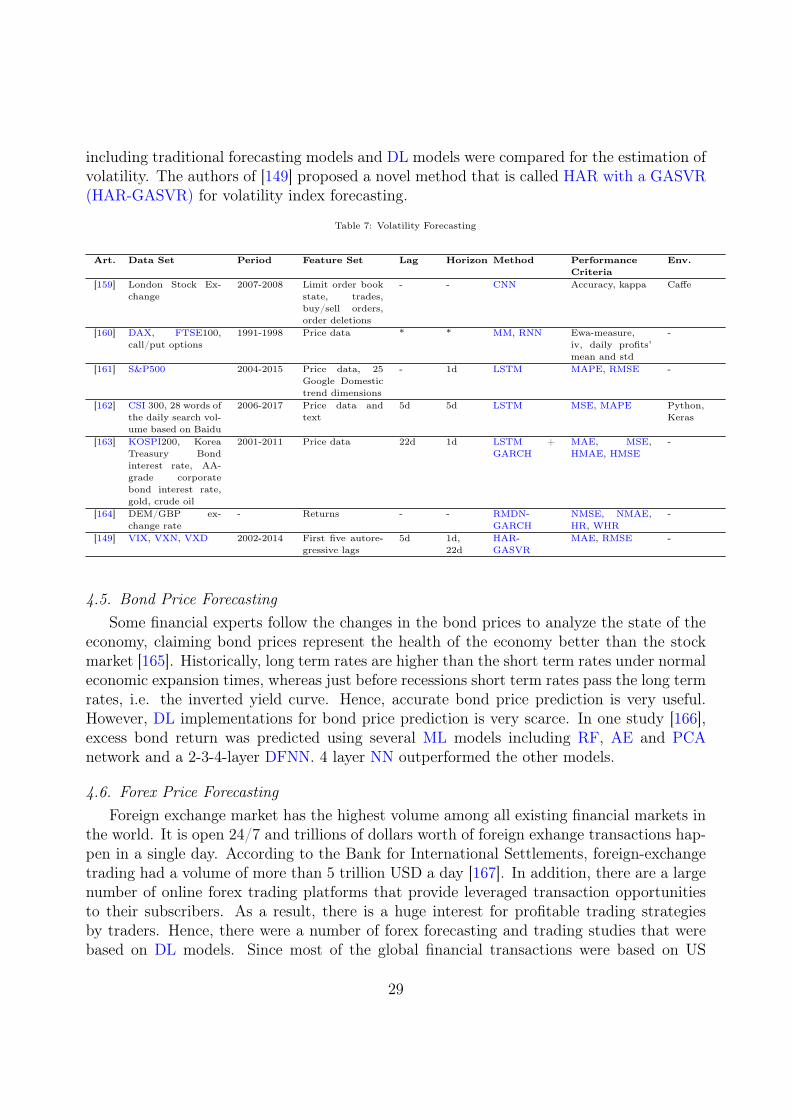
including traditional forecasting models and DL models were compared for the estimation ofvolatility. The authors of [149] proposed a novel method that is called HAR with a GASVR(HAR-GASVR) for volatility index forecasting.
Table 7: Volatility Forecasting
Art. Data Set Period Feature Set Lag Horizon Method PerformanceCriteria
Env.
[159] London Stock Ex-change
2007-2008 Limit order bookstate, trades,buy/sell orders,order deletions
- - CNN Accuracy, kappa Caffe
[160] DAX, FTSE100,call/put options
1991-1998 Price data * * MM, RNN Ewa-measure,iv, daily profits’mean and std
-
[161] S&P500 2004-2015 Price data, 25Google Domestictrend dimensions
- 1d LSTM MAPE, RMSE -
[162] CSI 300, 28 words ofthe daily search vol-ume based on Baidu
2006-2017 Price data andtext
5d 5d LSTM MSE, MAPE Python,Keras
[163] KOSPI200, KoreaTreasury Bondinterest rate, AA-grade corporatebond interest rate,gold, crude oil
2001-2011 Price data 22d 1d LSTM +GARCH
MAE, MSE,HMAE, HMSE
-
[164] DEM/GBP ex-change rate
- Returns - - RMDN-GARCH
NMSE, NMAE,HR, WHR
-
[149] VIX, VXN, VXD 2002-2014 First five autore-gressive lags
5d 1d,22d
HAR-GASVR
MAE, RMSE -
4.5. Bond Price ForecastingSome financial experts follow the changes in the bond prices to analyze the state of the
economy, claiming bond prices represent the health of the economy better than the stockmarket [165]. Historically, long term rates are higher than the short term rates under normaleconomic expansion times, whereas just before recessions short term rates pass the long termrates, i.e. the inverted yield curve. Hence, accurate bond price prediction is very useful.However, DL implementations for bond price prediction is very scarce. In one study [166],excess bond return was predicted using several ML models including RF, AE and PCAnetwork and a 2-3-4-layer DFNN. 4 layer NN outperformed the other models.
4.6. Forex Price ForecastingForeign exchange market has the highest volume among all existing financial markets in
the world. It is open 24/7 and trillions of dollars worth of foreign exhange transactions hap-pen in a single day. According to the Bank for International Settlements, foreign-exchangetrading had a volume of more than 5 trillion USD a day [167]. In addition, there are a largenumber of online forex trading platforms that provide leveraged transaction opportunitiesto their subscribers. As a result, there is a huge interest for profitable trading strategiesby traders. Hence, there were a number of forex forecasting and trading studies that werebased on DL models. Since most of the global financial transactions were based on US
29
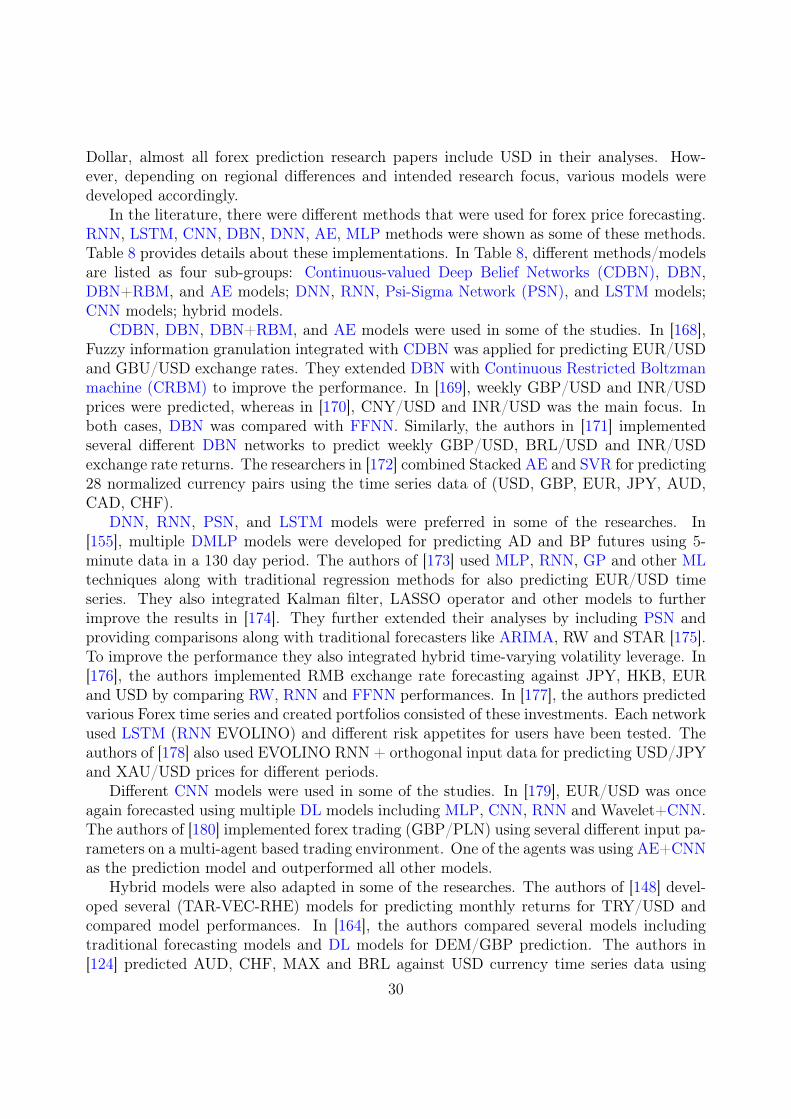
Dollar, almost all forex prediction research papers include USD in their analyses. How-ever, depending on regional differences and intended research focus, various models weredeveloped accordingly.
In the literature, there were different methods that were used for forex price forecasting.RNN, LSTM, CNN, DBN, DNN, AE, MLP methods were shown as some of these methods.Table 8 provides details about these implementations. In Table 8, different methods/modelsare listed as four sub-groups: Continuous-valued Deep Belief Networks (CDBN), DBN,DBN+RBM, and AE models; DNN, RNN, Psi-Sigma Network (PSN), and LSTM models;CNN models; hybrid models.
CDBN, DBN, DBN+RBM, and AE models were used in some of the studies. In [168],Fuzzy information granulation integrated with CDBN was applied for predicting EUR/USDand GBU/USD exchange rates. They extended DBN with Continuous Restricted Boltzmanmachine (CRBM) to improve the performance. In [169], weekly GBP/USD and INR/USDprices were predicted, whereas in [170], CNY/USD and INR/USD was the main focus. Inboth cases, DBN was compared with FFNN. Similarly, the authors in [171] implementedseveral different DBN networks to predict weekly GBP/USD, BRL/USD and INR/USDexchange rate returns. The researchers in [172] combined Stacked AE and SVR for predicting28 normalized currency pairs using the time series data of (USD, GBP, EUR, JPY, AUD,CAD, CHF).
DNN, RNN, PSN, and LSTM models were preferred in some of the researches. In[155], multiple DMLP models were developed for predicting AD and BP futures using 5-minute data in a 130 day period. The authors of [173] used MLP, RNN, GP and other MLtechniques along with traditional regression methods for also predicting EUR/USD timeseries. They also integrated Kalman filter, LASSO operator and other models to furtherimprove the results in [174]. They further extended their analyses by including PSN andproviding comparisons along with traditional forecasters like ARIMA, RW and STAR [175].To improve the performance they also integrated hybrid time-varying volatility leverage. In[176], the authors implemented RMB exchange rate forecasting against JPY, HKB, EURand USD by comparing RW, RNN and FFNN performances. In [177], the authors predictedvarious Forex time series and created portfolios consisted of these investments. Each networkused LSTM (RNN EVOLINO) and different risk appetites for users have been tested. Theauthors of [178] also used EVOLINO RNN + orthogonal input data for predicting USD/JPYand XAU/USD prices for different periods.
Different CNN models were used in some of the studies. In [179], EUR/USD was onceagain forecasted using multiple DL models including MLP, CNN, RNN and Wavelet+CNN.The authors of [180] implemented forex trading (GBP/PLN) using several different input pa-rameters on a multi-agent based trading environment. One of the agents was using AE+CNNas the prediction model and outperformed all other models.
Hybrid models were also adapted in some of the researches. The authors of [148] devel-oped several (TAR-VEC-RHE) models for predicting monthly returns for TRY/USD andcompared model performances. In [164], the authors compared several models includingtraditional forecasting models and DL models for DEM/GBP prediction. The authors in[124] predicted AUD, CHF, MAX and BRL against USD currency time series data using
30
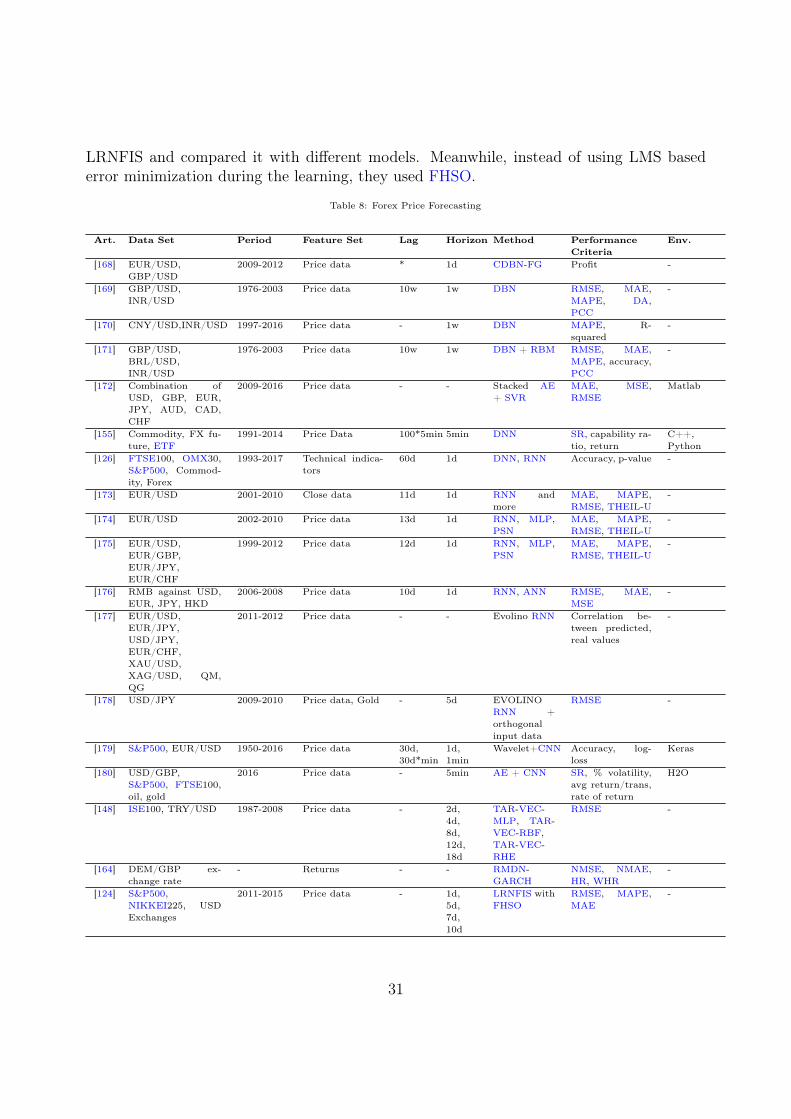
LRNFIS and compared it with different models. Meanwhile, instead of using LMS basederror minimization during the learning, they used FHSO.
Table 8: Forex Price Forecasting
Art. Data Set Period Feature Set Lag Horizon Method PerformanceCriteria
Env.
[168] EUR/USD,GBP/USD
2009-2012 Price data * 1d CDBN-FG Profit -
[169] GBP/USD,INR/USD
1976-2003 Price data 10w 1w DBN RMSE, MAE,MAPE, DA,PCC
-
[170] CNY/USD,INR/USD 1997-2016 Price data - 1w DBN MAPE, R-squared
-
[171] GBP/USD,BRL/USD,INR/USD
1976-2003 Price data 10w 1w DBN + RBM RMSE, MAE,MAPE, accuracy,PCC
-
[172] Combination ofUSD, GBP, EUR,JPY, AUD, CAD,CHF
2009-2016 Price data - - Stacked AE+ SVR
MAE, MSE,RMSE
Matlab
[155] Commodity, FX fu-ture, ETF
1991-2014 Price Data 100*5min 5min DNN SR, capability ra-tio, return
C++,Python
[126] FTSE100, OMX30,S&P500, Commod-ity, Forex
1993-2017 Technical indica-tors
60d 1d DNN, RNN Accuracy, p-value -
[173] EUR/USD 2001-2010 Close data 11d 1d RNN andmore
MAE, MAPE,RMSE, THEIL-U
-
[174] EUR/USD 2002-2010 Price data 13d 1d RNN, MLP,PSN
MAE, MAPE,RMSE, THEIL-U
-
[175] EUR/USD,EUR/GBP,EUR/JPY,EUR/CHF
1999-2012 Price data 12d 1d RNN, MLP,PSN
MAE, MAPE,RMSE, THEIL-U
-
[176] RMB against USD,EUR, JPY, HKD
2006-2008 Price data 10d 1d RNN, ANN RMSE, MAE,MSE
-
[177] EUR/USD,EUR/JPY,USD/JPY,EUR/CHF,XAU/USD,XAG/USD, QM,QG
2011-2012 Price data - - Evolino RNN Correlation be-tween predicted,real values
-
[178] USD/JPY 2009-2010 Price data, Gold - 5d EVOLINORNN +orthogonalinput data
RMSE -
[179] S&P500, EUR/USD 1950-2016 Price data 30d,30d*min
1d,1min
Wavelet+CNN Accuracy, log-loss
Keras
[180] USD/GBP,S&P500, FTSE100,oil, gold
2016 Price data - 5min AE + CNN SR, % volatility,avg return/trans,rate of return
H2O
[148] ISE100, TRY/USD 1987-2008 Price data - 2d,4d,8d,12d,18d
TAR-VEC-MLP, TAR-VEC-RBF,TAR-VEC-RHE
RMSE -
[164] DEM/GBP ex-change rate
- Returns - - RMDN-GARCH
NMSE, NMAE,HR, WHR
-
[124] S&P500,NIKKEI225, USDExchanges
2011-2015 Price data - 1d,5d,7d,10d
LRNFIS withFHSO
RMSE, MAPE,MAE
-
31
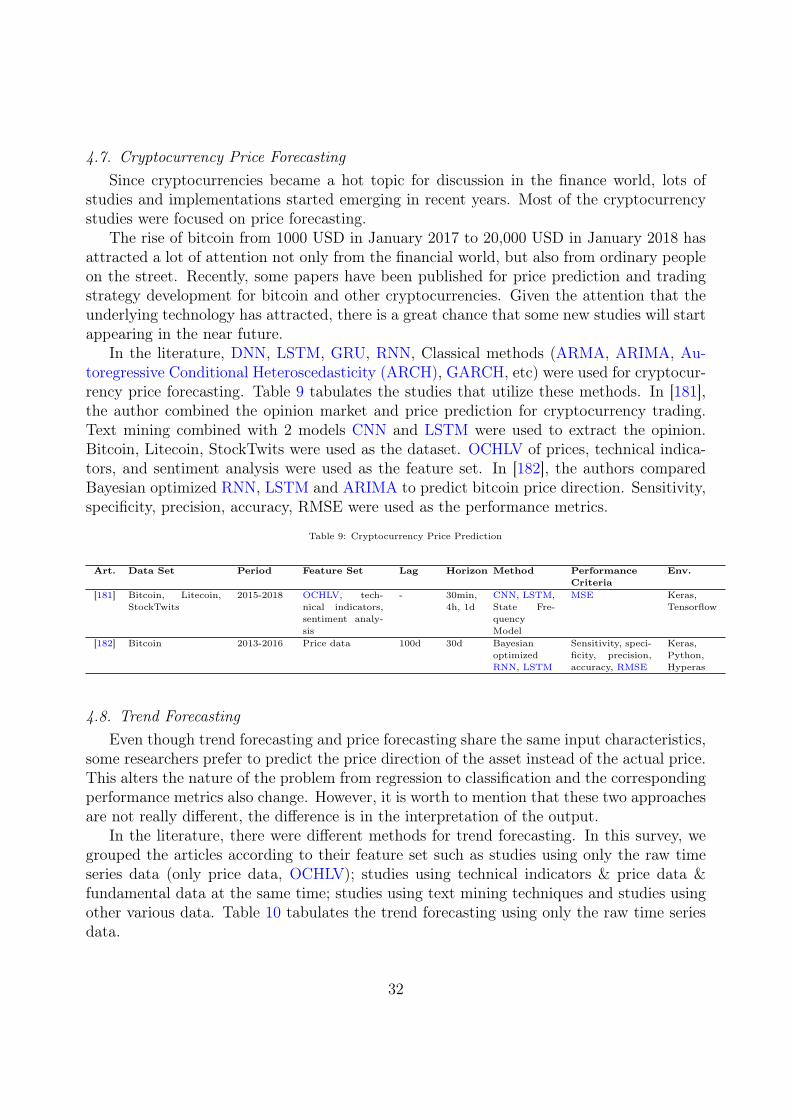
4.7. Cryptocurrency Price ForecastingSince cryptocurrencies became a hot topic for discussion in the finance world, lots of
studies and implementations started emerging in recent years. Most of the cryptocurrencystudies were focused on price forecasting.
The rise of bitcoin from 1000 USD in January 2017 to 20,000 USD in January 2018 hasattracted a lot of attention not only from the financial world, but also from ordinary peopleon the street. Recently, some papers have been published for price prediction and tradingstrategy development for bitcoin and other cryptocurrencies. Given the attention that theunderlying technology has attracted, there is a great chance that some new studies will startappearing in the near future.
In the literature, DNN, LSTM, GRU, RNN, Classical methods (ARMA, ARIMA, Au-toregressive Conditional Heteroscedasticity (ARCH), GARCH, etc) were used for cryptocur-rency price forecasting. Table 9 tabulates the studies that utilize these methods. In [181],the author combined the opinion market and price prediction for cryptocurrency trading.Text mining combined with 2 models CNN and LSTM were used to extract the opinion.Bitcoin, Litecoin, StockTwits were used as the dataset. OCHLV of prices, technical indica-tors, and sentiment analysis were used as the feature set. In [182], the authors comparedBayesian optimized RNN, LSTM and ARIMA to predict bitcoin price direction. Sensitivity,specificity, precision, accuracy, RMSE were used as the performance metrics.
Table 9: Cryptocurrency Price Prediction
Art. Data Set Period Feature Set Lag Horizon Method PerformanceCriteria
Env.
[181] Bitcoin, Litecoin,StockTwits
2015-2018 OCHLV, tech-nical indicators,sentiment analy-sis
- 30min,4h, 1d
CNN, LSTM,State Fre-quencyModel
MSE Keras,Tensorflow
[182] Bitcoin 2013-2016 Price data 100d 30d BayesianoptimizedRNN, LSTM
Sensitivity, speci-ficity, precision,accuracy, RMSE
Keras,Python,Hyperas
4.8. Trend ForecastingEven though trend forecasting and price forecasting share the same input characteristics,
some researchers prefer to predict the price direction of the asset instead of the actual price.This alters the nature of the problem from regression to classification and the correspondingperformance metrics also change. However, it is worth to mention that these two approachesare not really different, the difference is in the interpretation of the output.
In the literature, there were different methods for trend forecasting. In this survey, wegrouped the articles according to their feature set such as studies using only the raw timeseries data (only price data, OCHLV); studies using technical indicators & price data &fundamental data at the same time; studies using text mining techniques and studies usingother various data. Table 10 tabulates the trend forecasting using only the raw time seriesdata.
32
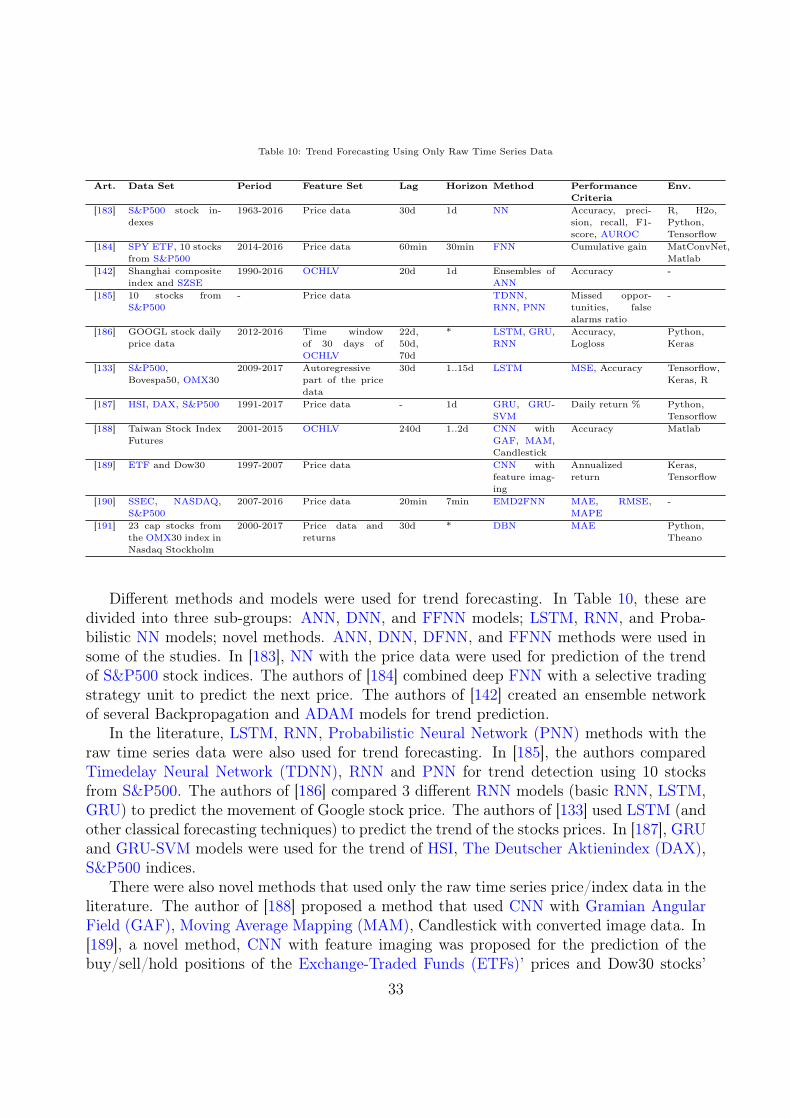
Table 10: Trend Forecasting Using Only Raw Time Series Data
Art. Data Set Period Feature Set Lag Horizon Method PerformanceCriteria
Env.
[183] S&P500 stock in-dexes
1963-2016 Price data 30d 1d NN Accuracy, preci-sion, recall, F1-score, AUROC
R, H2o,Python,Tensorflow
[184] SPY ETF, 10 stocksfrom S&P500
2014-2016 Price data 60min 30min FNN Cumulative gain MatConvNet,Matlab
[142] Shanghai compositeindex and SZSE
1990-2016 OCHLV 20d 1d Ensembles ofANN
Accuracy -
[185] 10 stocks fromS&P500
- Price data TDNN,RNN, PNN
Missed oppor-tunities, falsealarms ratio
-
[186] GOOGL stock dailyprice data
2012-2016 Time windowof 30 days ofOCHLV
22d,50d,70d
* LSTM, GRU,RNN
Accuracy,Logloss
Python,Keras
[133] S&P500,Bovespa50, OMX30
2009-2017 Autoregressivepart of the pricedata
30d 1..15d LSTM MSE, Accuracy Tensorflow,Keras, R
[187] HSI, DAX, S&P500 1991-2017 Price data - 1d GRU, GRU-SVM
Daily return % Python,Tensorflow
[188] Taiwan Stock IndexFutures
2001-2015 OCHLV 240d 1..2d CNN withGAF, MAM,Candlestick
Accuracy Matlab
[189] ETF and Dow30 1997-2007 Price data CNN withfeature imag-ing
Annualizedreturn
Keras,Tensorflow
[190] SSEC, NASDAQ,S&P500
2007-2016 Price data 20min 7min EMD2FNN MAE, RMSE,MAPE
-
[191] 23 cap stocks fromthe OMX30 index inNasdaq Stockholm
2000-2017 Price data andreturns
30d * DBN MAE Python,Theano
Different methods and models were used for trend forecasting. In Table 10, these aredivided into three sub-groups: ANN, DNN, and FFNN models; LSTM, RNN, and Proba-bilistic NN models; novel methods. ANN, DNN, DFNN, and FFNN methods were used insome of the studies. In [183], NN with the price data were used for prediction of the trendof S&P500 stock indices. The authors of [184] combined deep FNN with a selective tradingstrategy unit to predict the next price. The authors of [142] created an ensemble networkof several Backpropagation and ADAM models for trend prediction.
In the literature, LSTM, RNN, Probabilistic Neural Network (PNN) methods with theraw time series data were also used for trend forecasting. In [185], the authors comparedTimedelay Neural Network (TDNN), RNN and PNN for trend detection using 10 stocksfrom S&P500. The authors of [186] compared 3 different RNN models (basic RNN, LSTM,GRU) to predict the movement of Google stock price. The authors of [133] used LSTM (andother classical forecasting techniques) to predict the trend of the stocks prices. In [187], GRUand GRU-SVM models were used for the trend of HSI, The Deutscher Aktienindex (DAX),S&P500 indices.
There were also novel methods that used only the raw time series price/index data in theliterature. The author of [188] proposed a method that used CNN with Gramian AngularField (GAF), Moving Average Mapping (MAM), Candlestick with converted image data. In[189], a novel method, CNN with feature imaging was proposed for the prediction of thebuy/sell/hold positions of the Exchange-Traded Funds (ETFs)’ prices and Dow30 stocks’
33
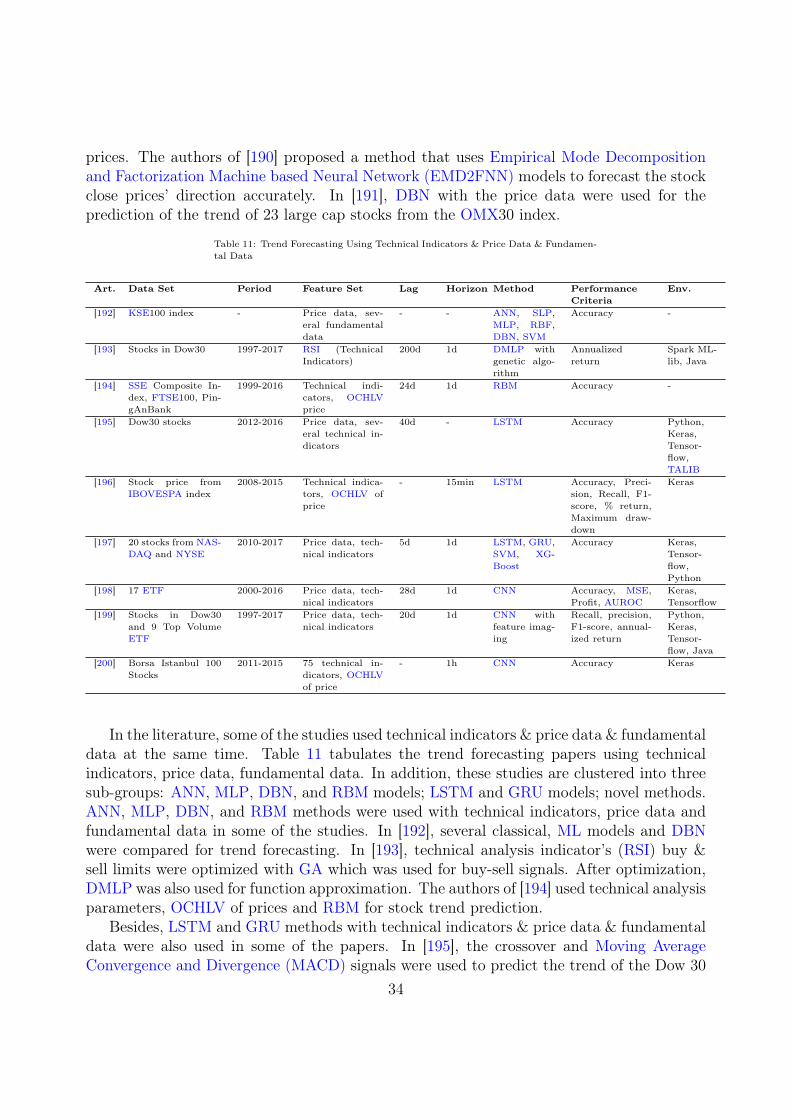
prices. The authors of [190] proposed a method that uses Empirical Mode Decompositionand Factorization Machine based Neural Network (EMD2FNN) models to forecast the stockclose prices’ direction accurately. In [191], DBN with the price data were used for theprediction of the trend of 23 large cap stocks from the OMX30 index.
Table 11: Trend Forecasting Using Technical Indicators & Price Data & Fundamen-tal Data
Art. Data Set Period Feature Set Lag Horizon Method PerformanceCriteria
Env.
[192] KSE100 index - Price data, sev-eral fundamentaldata
- - ANN, SLP,MLP, RBF,DBN, SVM
Accuracy -
[193] Stocks in Dow30 1997-2017 RSI (TechnicalIndicators)
200d 1d DMLP withgenetic algo-rithm
Annualizedreturn
Spark ML-lib, Java
[194] SSE Composite In-dex, FTSE100, Pin-gAnBank
1999-2016 Technical indi-cators, OCHLVprice
24d 1d RBM Accuracy -
[195] Dow30 stocks 2012-2016 Price data, sev-eral technical in-dicators
40d - LSTM Accuracy Python,Keras,Tensor-flow,TALIB
[196] Stock price fromIBOVESPA index
2008-2015 Technical indica-tors, OCHLV ofprice
- 15min LSTM Accuracy, Preci-sion, Recall, F1-score, % return,Maximum draw-down
Keras
[197] 20 stocks from NAS-DAQ and NYSE
2010-2017 Price data, tech-nical indicators
5d 1d LSTM, GRU,SVM, XG-Boost
Accuracy Keras,Tensor-flow,Python
[198] 17 ETF 2000-2016 Price data, tech-nical indicators
28d 1d CNN Accuracy, MSE,Profit, AUROC
Keras,Tensorflow
[199] Stocks in Dow30and 9 Top VolumeETF
1997-2017 Price data, tech-nical indicators
20d 1d CNN withfeature imag-ing
Recall, precision,F1-score, annual-ized return
Python,Keras,Tensor-flow, Java
[200] Borsa Istanbul 100Stocks
2011-2015 75 technical in-dicators, OCHLVof price
- 1h CNN Accuracy Keras
In the literature, some of the studies used technical indicators & price data & fundamentaldata at the same time. Table 11 tabulates the trend forecasting papers using technicalindicators, price data, fundamental data. In addition, these studies are clustered into threesub-groups: ANN, MLP, DBN, and RBM models; LSTM and GRU models; novel methods.ANN, MLP, DBN, and RBM methods were used with technical indicators, price data andfundamental data in some of the studies. In [192], several classical, ML models and DBNwere compared for trend forecasting. In [193], technical analysis indicator’s (RSI) buy &sell limits were optimized with GA which was used for buy-sell signals. After optimization,DMLP was also used for function approximation. The authors of [194] used technical analysisparameters, OCHLV of prices and RBM for stock trend prediction.
Besides, LSTM and GRU methods with technical indicators & price data & fundamentaldata were also used in some of the papers. In [195], the crossover and Moving AverageConvergence and Divergence (MACD) signals were used to predict the trend of the Dow 30
34
stocks prices. The authors of [196] used LSTM for stock price movement estimation. Theauthor of [197] used stock prices, technical analysis features and four different ML Models(LSTM, GRU, SVM and eXtreme Gradient Boosting (XGBoost)) to predict the trend ofthe stocks prices.
In addition, there were also novel and new methods that used CNN with the price dataand technical indicators. The authors of [198] converted the time series of price data to2-dimensional images using technical analysis and classified them with deep CNN. Similarly,the authors of [199] also proposed a novel technique that converted financial time series datathat consisted of technical analysis indicator outputs to 2-dimensional images and classifiedthese images using CNN to determine the trading signals. The authors of [200] proposed amethod that used CNN with correlated features combined together to predict the trend ofthe stocks prices.
Besides, there were also studies that used text mining techniques in the literature. Ta-ble 12 tabulates the trend forecasting papers using text mining techniques. Different meth-ods/models are represented within four sub-groups in that table: DNN, DMLP, and CNNwith text mining models; GRU model; LSTM, CNN, and LSTM+CNN models; novel meth-ods. In the first group of studies, DNN, DMLP, CNN with text mining were used for trendforecasting. In [201], the authors used different models that included Hidden Markov Model(HMM), DMLP and CNN using Twitter moods to predict the next days’ move. In [202], theauthors used the combination of text mining and word embeddings to extract informationfrom financial news and DNN model for prediction of the stock trends.
Moreover, GRUmethods with text mining techniques were also used for trend forecasting.The authors of [203] used financial news from Reuters, Bloomberg and stock prices data andBidirectional Gated Recurrent Unit (Bi-GRU) model to predict the stock movements inthe future. The authors of [204] used Stock2Vec and Two-stream GRU (TGRU) modelsto generate input data from financial news and stock prices. Then, they used the signdifference between the previous close and next open for the classification of the stock prices.The results were better than the state-of-the-art models.
LSTM, CNN and LSTM+CNN models were also used for trend forecasting. The authorsof [205] combined news data with financial data to classify the stock price movement andassessed them with certain factors. They used LSTM model as the NN architecture. Theauthors of [206] proposed a novel method that used character-based neural language modelusing financial news and LSTM for trend prediction. In [207], sentiment/mood predictionand price prediction based on sentiment, price prediction with text mining and DL models(LSTM, NN, CNN) were used for trend forecasting. The authors of [208] proposed a methodthat used two separate LSTM networks to construct an ensemble network. One of the LSTMmodels was used for word embeddings with word2Vec to create a matrix information as inputto CNN. The other one was used for price prediction using technical analysis features andstock prices.
In the literature, there were also novel and different methods to predict the trend of thetime series data. In [209], the authors proposed a novel method that uses a combinationof RBM, DBN and word embedding to create word vectors for RNN-RBM-DBN networkto predict the trend of stock prices. The authors of [210] proposed a novel method (called
35
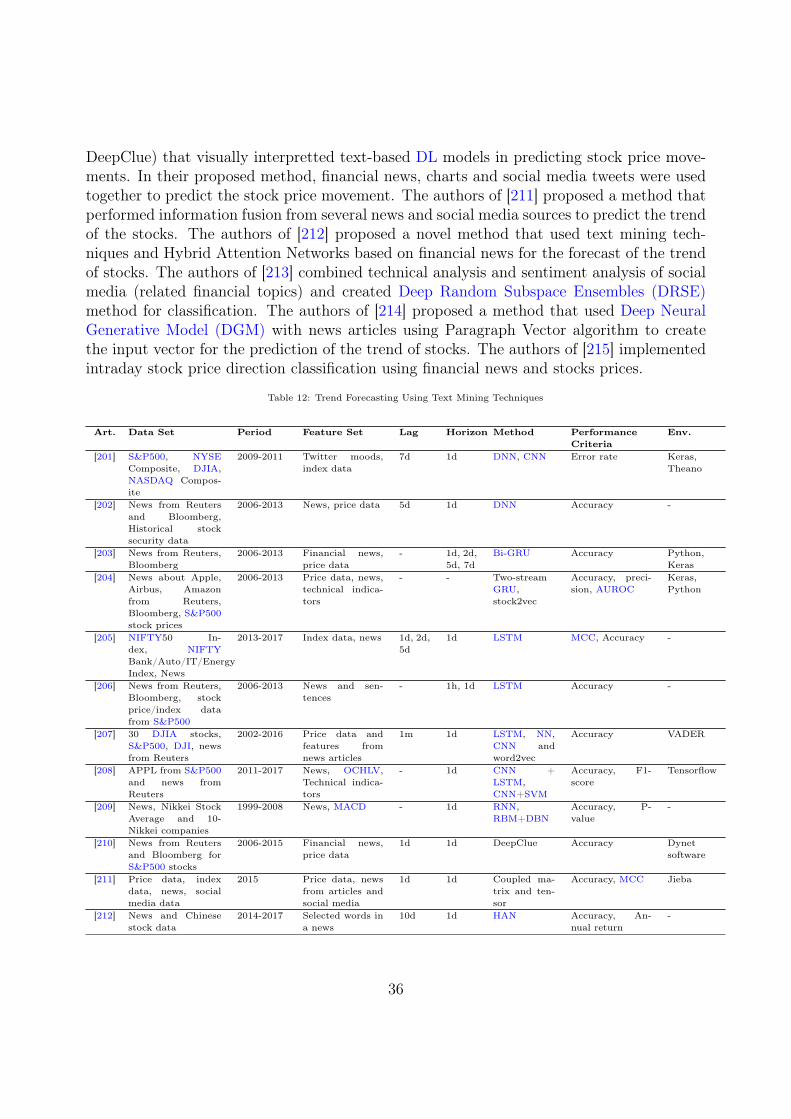
DeepClue) that visually interpretted text-based DL models in predicting stock price move-ments. In their proposed method, financial news, charts and social media tweets were usedtogether to predict the stock price movement. The authors of [211] proposed a method thatperformed information fusion from several news and social media sources to predict the trendof the stocks. The authors of [212] proposed a novel method that used text mining tech-niques and Hybrid Attention Networks based on financial news for the forecast of the trendof stocks. The authors of [213] combined technical analysis and sentiment analysis of socialmedia (related financial topics) and created Deep Random Subspace Ensembles (DRSE)method for classification. The authors of [214] proposed a method that used Deep NeuralGenerative Model (DGM) with news articles using Paragraph Vector algorithm to createthe input vector for the prediction of the trend of stocks. The authors of [215] implementedintraday stock price direction classification using financial news and stocks prices.
Table 12: Trend Forecasting Using Text Mining Techniques
Art. Data Set Period Feature Set Lag Horizon Method PerformanceCriteria
Env.
[201] S&P500, NYSEComposite, DJIA,NASDAQ Compos-ite
2009-2011 Twitter moods,index data
7d 1d DNN, CNN Error rate Keras,Theano
[202] News from Reutersand Bloomberg,Historical stocksecurity data
2006-2013 News, price data 5d 1d DNN Accuracy -
[203] News from Reuters,Bloomberg
2006-2013 Financial news,price data
- 1d, 2d,5d, 7d
Bi-GRU Accuracy Python,Keras
[204] News about Apple,Airbus, Amazonfrom Reuters,Bloomberg, S&P500stock prices
2006-2013 Price data, news,technical indica-tors
- - Two-streamGRU,stock2vec
Accuracy, preci-sion, AUROC
Keras,Python
[205] NIFTY50 In-dex, NIFTYBank/Auto/IT/EnergyIndex, News
2013-2017 Index data, news 1d, 2d,5d
1d LSTM MCC, Accuracy -
[206] News from Reuters,Bloomberg, stockprice/index datafrom S&P500
2006-2013 News and sen-tences
- 1h, 1d LSTM Accuracy -
[207] 30 DJIA stocks,S&P500, DJI, newsfrom Reuters
2002-2016 Price data andfeatures fromnews articles
1m 1d LSTM, NN,CNN andword2vec
Accuracy VADER
[208] APPL from S&P500and news fromReuters
2011-2017 News, OCHLV,Technical indica-tors
- 1d CNN +LSTM,CNN+SVM
Accuracy, F1-score
Tensorflow
[209] News, Nikkei StockAverage and 10-Nikkei companies
1999-2008 News, MACD - 1d RNN,RBM+DBN
Accuracy, P-value
-
[210] News from Reutersand Bloomberg forS&P500 stocks
2006-2015 Financial news,price data
1d 1d DeepClue Accuracy Dynetsoftware
[211] Price data, indexdata, news, socialmedia data
2015 Price data, newsfrom articles andsocial media
1d 1d Coupled ma-trix and ten-sor
Accuracy, MCC Jieba
[212] News and Chinesestock data
2014-2017 Selected words ina news
10d 1d HAN Accuracy, An-nual return
-
36
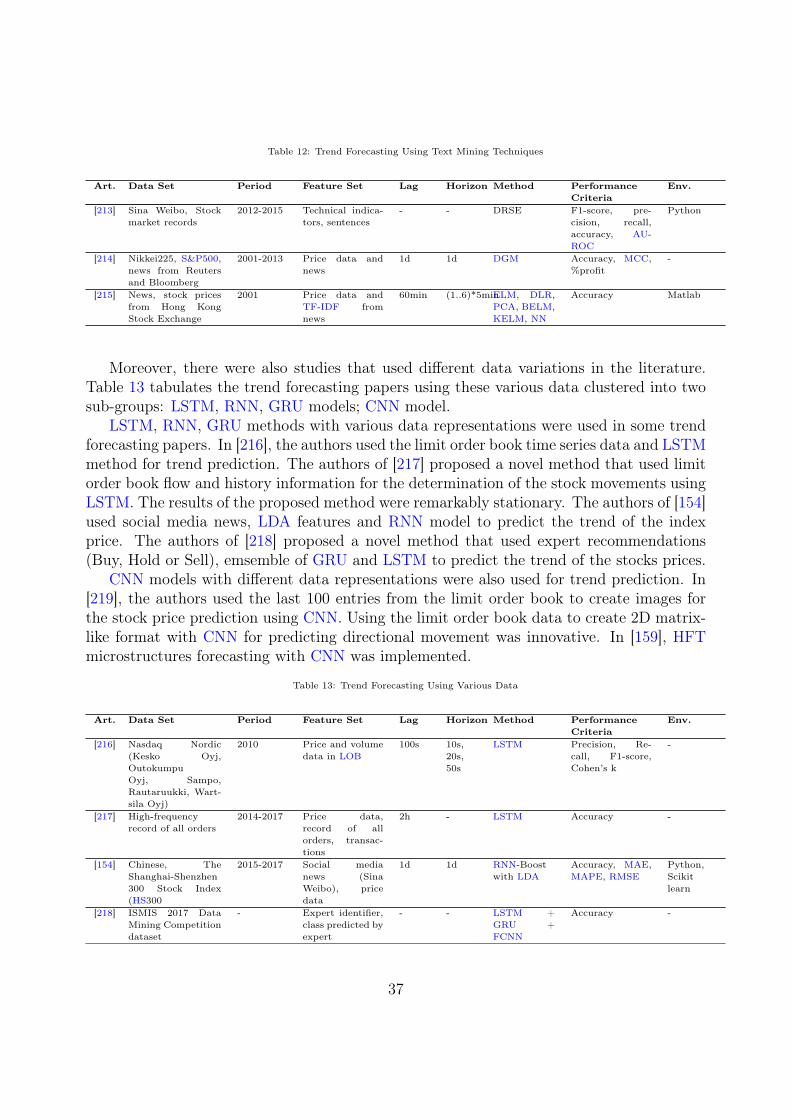
Table 12: Trend Forecasting Using Text Mining Techniques
Art. Data Set Period Feature Set Lag Horizon Method PerformanceCriteria
Env.
[213] Sina Weibo, Stockmarket records
2012-2015 Technical indica-tors, sentences
- - DRSE F1-score, pre-cision, recall,accuracy, AU-ROC
Python
[214] Nikkei225, S&P500,news from Reutersand Bloomberg
2001-2013 Price data andnews
1d 1d DGM Accuracy, MCC,%profit
-
[215] News, stock pricesfrom Hong KongStock Exchange
2001 Price data andTF-IDF fromnews
60min (1..6)*5minELM, DLR,PCA, BELM,KELM, NN
Accuracy Matlab
Moreover, there were also studies that used different data variations in the literature.Table 13 tabulates the trend forecasting papers using these various data clustered into twosub-groups: LSTM, RNN, GRU models; CNN model.
LSTM, RNN, GRU methods with various data representations were used in some trendforecasting papers. In [216], the authors used the limit order book time series data and LSTMmethod for trend prediction. The authors of [217] proposed a novel method that used limitorder book flow and history information for the determination of the stock movements usingLSTM. The results of the proposed method were remarkably stationary. The authors of [154]used social media news, LDA features and RNN model to predict the trend of the indexprice. The authors of [218] proposed a novel method that used expert recommendations(Buy, Hold or Sell), emsemble of GRU and LSTM to predict the trend of the stocks prices.
CNN models with different data representations were also used for trend prediction. In[219], the authors used the last 100 entries from the limit order book to create images forthe stock price prediction using CNN. Using the limit order book data to create 2D matrix-like format with CNN for predicting directional movement was innovative. In [159], HFTmicrostructures forecasting with CNN was implemented.
Table 13: Trend Forecasting Using Various Data
Art. Data Set Period Feature Set Lag Horizon Method PerformanceCriteria
Env.
[216] Nasdaq Nordic(Kesko Oyj,OutokumpuOyj, Sampo,Rautaruukki, Wart-sila Oyj)
2010 Price and volumedata in LOB
100s 10s,20s,50s
LSTM Precision, Re-call, F1-score,Cohen’s k
-
[217] High-frequencyrecord of all orders
2014-2017 Price data,record of allorders, transac-tions
2h - LSTM Accuracy -
[154] Chinese, TheShanghai-Shenzhen300 Stock Index(HS300
2015-2017 Social medianews (SinaWeibo), pricedata
1d 1d RNN-Boostwith LDA
Accuracy, MAE,MAPE, RMSE
Python,Scikitlearn
[218] ISMIS 2017 DataMining Competitiondataset
- Expert identifier,class predicted byexpert
- - LSTM +GRU +FCNN
Accuracy -
37
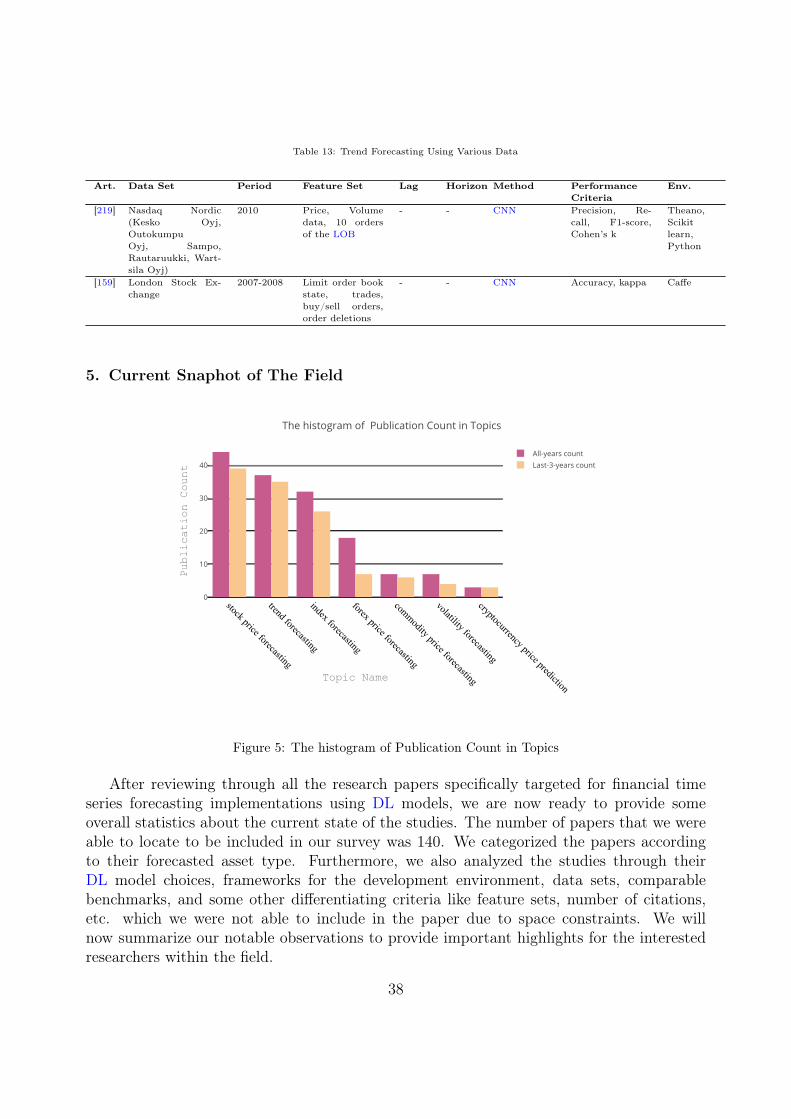
Table 13: Trend Forecasting Using Various Data
Art. Data Set Period Feature Set Lag Horizon Method PerformanceCriteria
Env.
[219] Nasdaq Nordic(Kesko Oyj,OutokumpuOyj, Sampo,Rautaruukki, Wart-sila Oyj)
2010 Price, Volumedata, 10 ordersof the LOB
- - CNN Precision, Re-call, F1-score,Cohen’s k
Theano,Scikitlearn,Python
[159] London Stock Ex-change
2007-2008 Limit order bookstate, trades,buy/sell orders,order deletions
- - CNN Accuracy, kappa Caffe
5. Current Snaphot of The Field
stock price forecasting
trend forecasting
index forecasting
forex price forecasting
commodity price forecasting
volatility forecasting
cryptocurrency price prediction
0
10
20
30
40All-years countLast-3-years count
The histogram of Publication Count in Topics
Topic Name
Publication Count
Figure 5: The histogram of Publication Count in Topics
After reviewing through all the research papers specifically targeted for financial timeseries forecasting implementations using DL models, we are now ready to provide someoverall statistics about the current state of the studies. The number of papers that we wereable to locate to be included in our survey was 140. We categorized the papers accordingto their forecasted asset type. Furthermore, we also analyzed the studies through theirDL model choices, frameworks for the development environment, data sets, comparablebenchmarks, and some other differentiating criteria like feature sets, number of citations,etc. which we were not able to include in the paper due to space constraints. We willnow summarize our notable observations to provide important highlights for the interestedresearchers within the field.
38
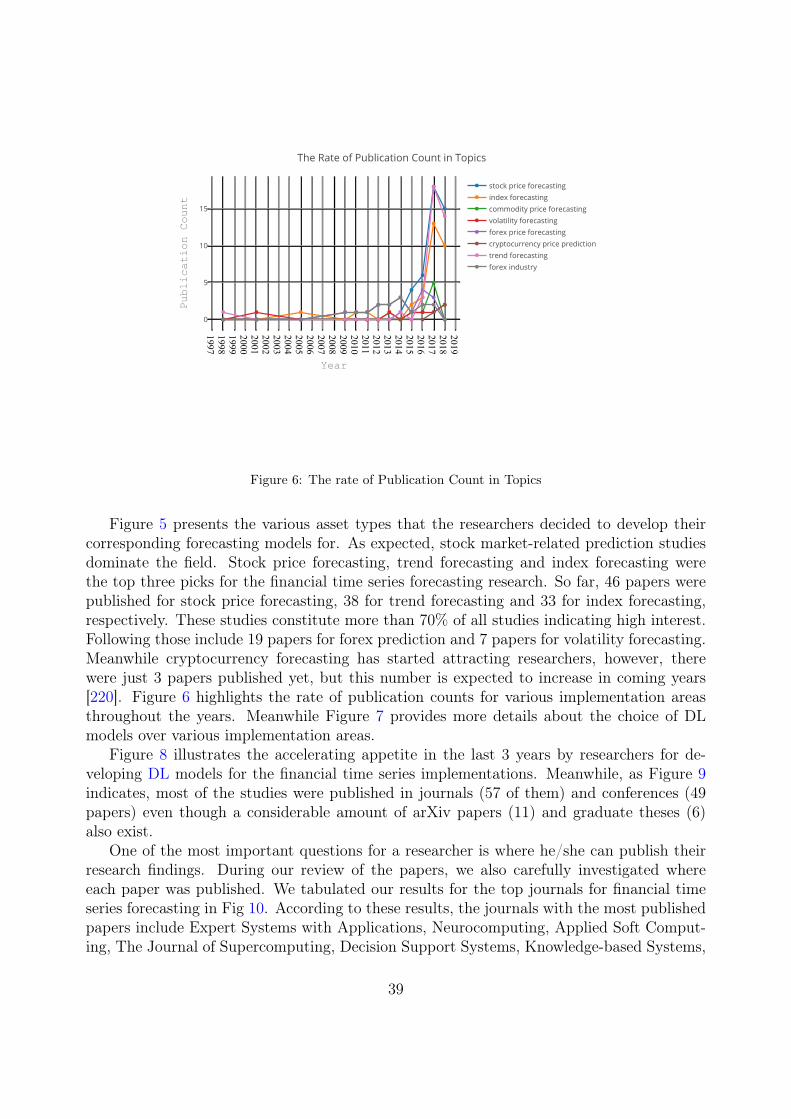
19971998199920002001200220032004200520062007200820092010201120122013201420152016201720182019
0
5
10
15
stock price forecastingindex forecastingcommodity price forecastingvolatility forecastingforex price forecastingcryptocurrency price predictiontrend forecastingforex industry
The Rate of Publication Count in Topics
Year
Publication Count
Figure 6: The rate of Publication Count in Topics
Figure 5 presents the various asset types that the researchers decided to develop theircorresponding forecasting models for. As expected, stock market-related prediction studiesdominate the field. Stock price forecasting, trend forecasting and index forecasting werethe top three picks for the financial time series forecasting research. So far, 46 papers werepublished for stock price forecasting, 38 for trend forecasting and 33 for index forecasting,respectively. These studies constitute more than 70% of all studies indicating high interest.Following those include 19 papers for forex prediction and 7 papers for volatility forecasting.Meanwhile cryptocurrency forecasting has started attracting researchers, however, therewere just 3 papers published yet, but this number is expected to increase in coming years[220]. Figure 6 highlights the rate of publication counts for various implementation areasthroughout the years. Meanwhile Figure 7 provides more details about the choice of DLmodels over various implementation areas.
Figure 8 illustrates the accelerating appetite in the last 3 years by researchers for de-veloping DL models for the financial time series implementations. Meanwhile, as Figure 9indicates, most of the studies were published in journals (57 of them) and conferences (49papers) even though a considerable amount of arXiv papers (11) and graduate theses (6)also exist.
One of the most important questions for a researcher is where he/she can publish theirresearch findings. During our review of the papers, we also carefully investigated whereeach paper was published. We tabulated our results for the top journals for financial timeseries forecasting in Fig 10. According to these results, the journals with the most publishedpapers include Expert Systems with Applications, Neurocomputing, Applied Soft Comput-ing, The Journal of Supercomputing, Decision Support Systems, Knowledge-based Systems,
39
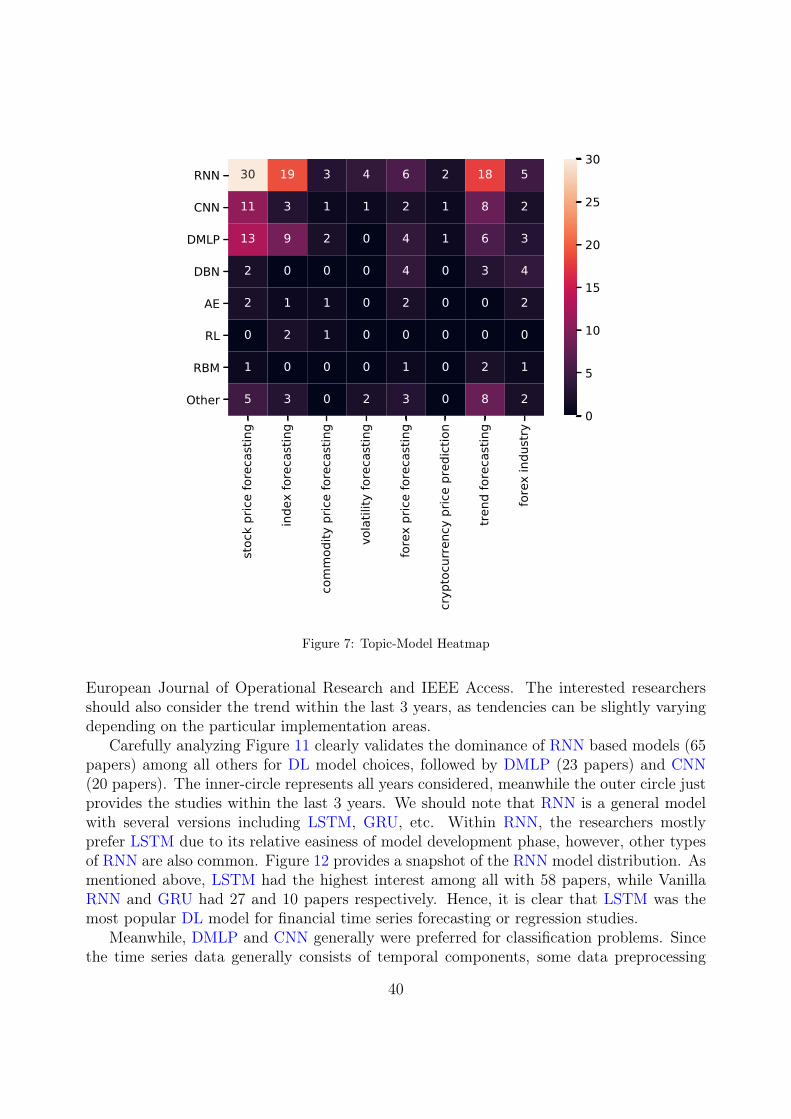
stoc
k pr
ice fo
reca
stin
g
inde
x fo
reca
stin
g
com
mod
ity p
rice
fore
cast
ing
vola
tility
fore
cast
ing
fore
x pr
ice fo
reca
stin
g
cryp
tocu
rrenc
y pr
ice p
redi
ctio
n
trend
fore
cast
ing
fore
x in
dust
ry
RNN
CNN
DMLP
DBN
AE
RL
RBM
Other
30 19 3 4 6 2 18 5
11 3 1 1 2 1 8 2
13 9 2 0 4 1 6 3
2 0 0 0 4 0 3 4
2 1 1 0 2 0 0 2
0 2 1 0 0 0 0 0
1 0 0 0 1 0 2 1
5 3 0 2 3 0 8 20
5
10
15
20
25
30
Figure 7: Topic-Model Heatmap
European Journal of Operational Research and IEEE Access. The interested researchersshould also consider the trend within the last 3 years, as tendencies can be slightly varyingdepending on the particular implementation areas.
Carefully analyzing Figure 11 clearly validates the dominance of RNN based models (65papers) among all others for DL model choices, followed by DMLP (23 papers) and CNN(20 papers). The inner-circle represents all years considered, meanwhile the outer circle justprovides the studies within the last 3 years. We should note that RNN is a general modelwith several versions including LSTM, GRU, etc. Within RNN, the researchers mostlyprefer LSTM due to its relative easiness of model development phase, however, other typesof RNN are also common. Figure 12 provides a snapshot of the RNN model distribution. Asmentioned above, LSTM had the highest interest among all with 58 papers, while VanillaRNN and GRU had 27 and 10 papers respectively. Hence, it is clear that LSTM was themost popular DL model for financial time series forecasting or regression studies.
Meanwhile, DMLP and CNN generally were preferred for classification problems. Sincethe time series data generally consists of temporal components, some data preprocessing
40
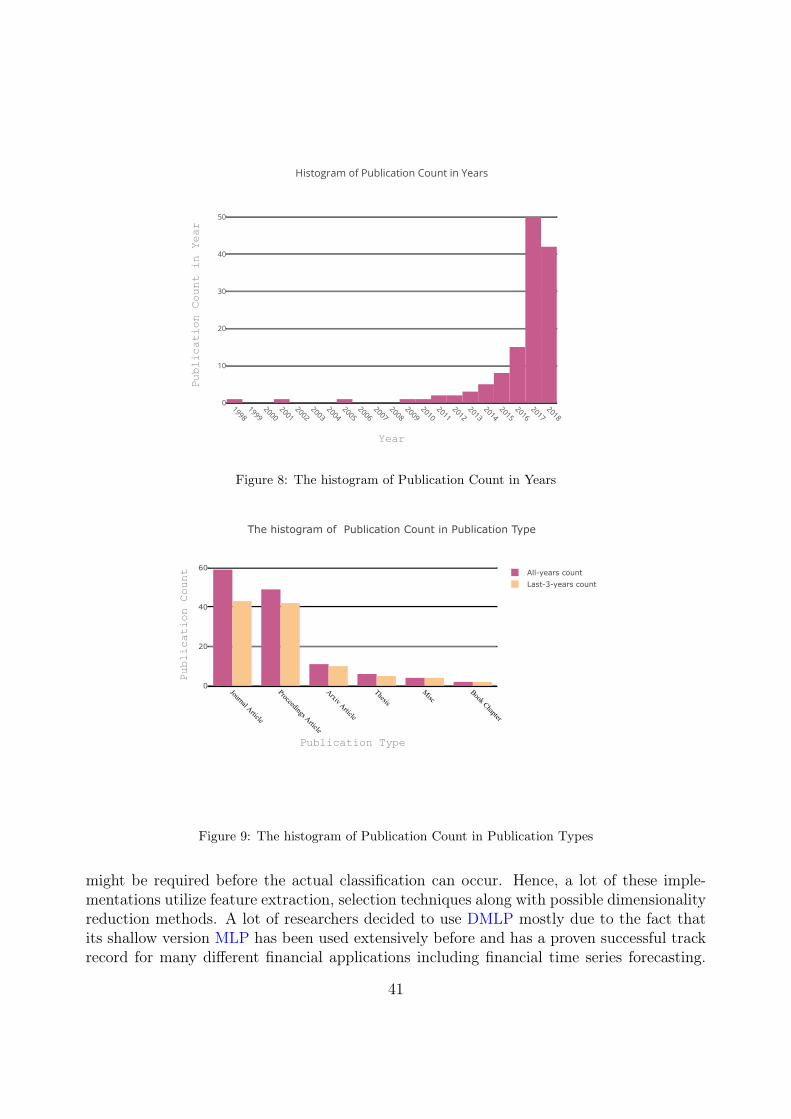
19981999
20002001
20022003
20042005
20062007
20082009
20102011
20122013
20142015
20162017
2018
0
10
20
30
40
50
Histogram of Publication Count in Years
Year
Publication Count in Year
Figure 8: The histogram of Publication Count in Years
Journal Article
Proceedings Article
Arxiv Article
ThesisMisc
Book Chapter
0
20
40
60All-years countLast-3-years count
The histogram of Publication Count in Publication Type
Publication Type
Publication Count
Figure 9: The histogram of Publication Count in Publication Types
might be required before the actual classification can occur. Hence, a lot of these imple-mentations utilize feature extraction, selection techniques along with possible dimensionalityreduction methods. A lot of researchers decided to use DMLP mostly due to the fact thatits shallow version MLP has been used extensively before and has a proven successful trackrecord for many different financial applications including financial time series forecasting.
41
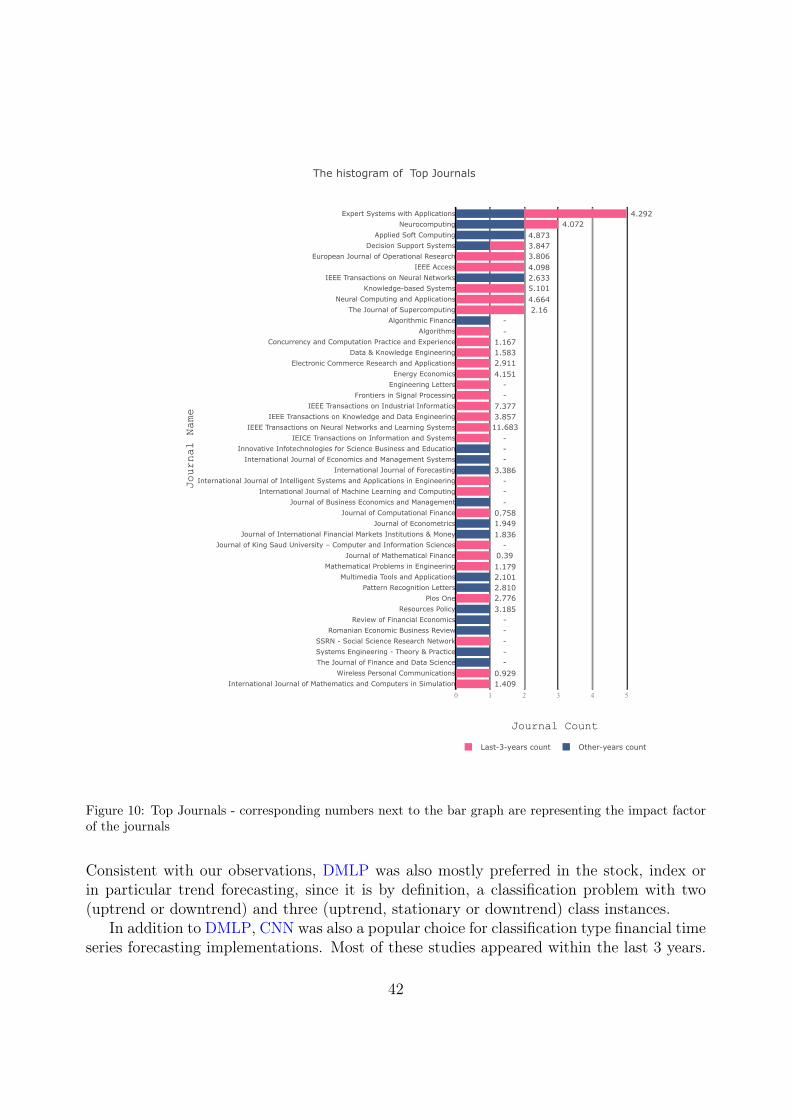
0 1 2 3 4 5International Journal of Mathematics and Computers in Simulation
Wireless Personal CommunicationsThe Journal of Finance and Data ScienceSystems Engineering - Theory & PracticeSSRN - Social Science Research Network
Romanian Economic Business ReviewReview of Financial Economics
Resources PolicyPlos One
Pattern Recognition LettersMultimedia Tools and Applications
Mathematical Problems in EngineeringJournal of Mathematical Finance
Journal of King Saud University – Computer and Information SciencesJournal of International Financial Markets Institutions & Money
Journal of EconometricsJournal of Computational Finance
Journal of Business Economics and ManagementInternational Journal of Machine Learning and Computing
International Journal of Intelligent Systems and Applications in EngineeringInternational Journal of Forecasting
International Journal of Economics and Management SystemsInnovative Infotechnologies for Science Business and Education
IEICE Transactions on Information and SystemsIEEE Transactions on Neural Networks and Learning Systems
IEEE Transactions on Knowledge and Data EngineeringIEEE Transactions on Industrial Informatics
Frontiers in Signal ProcessingEngineering LettersEnergy Economics
Electronic Commerce Research and ApplicationsData & Knowledge Engineering
Concurrency and Computation Practice and ExperienceAlgorithms
Algorithmic FinanceThe Journal of Supercomputing
Neural Computing and ApplicationsKnowledge-based Systems
IEEE Transactions on Neural NetworksIEEE Access
European Journal of Operational ResearchDecision Support Systems
Applied Soft ComputingNeurocomputing
Expert Systems with Applications
Last-3-years count Other-years count
The histogram of Top Journals
Journal Count
Journal Name
4.292 4.072
4.873 3.847 3.806 4.098 2.633 5.101 4.664 2.16
- -
1.167 1.583 2.911 4.151
- -
7.377 3.857 11.683
- - -
3.386 - - -
0.758 1.949 1.836
- 0.39 1.179 2.101 2.810 2.776 3.185
- - - - -
0.929 1.409
Figure 10: Top Journals - corresponding numbers next to the bar graph are representing the impact factorof the journals
Consistent with our observations, DMLP was also mostly preferred in the stock, index orin particular trend forecasting, since it is by definition, a classification problem with two(uptrend or downtrend) and three (uptrend, stationary or downtrend) class instances.
In addition to DMLP, CNN was also a popular choice for classification type financial timeseries forecasting implementations. Most of these studies appeared within the last 3 years.
42
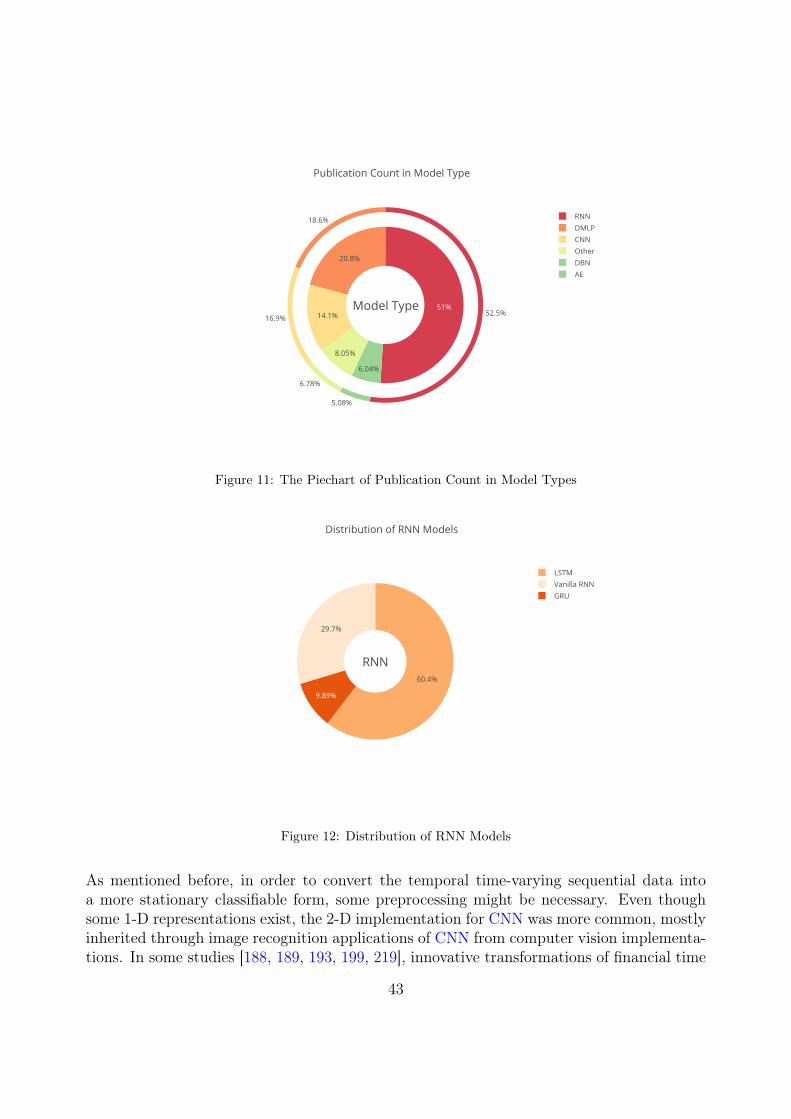
51%
20.8%
14.1%
8.05%
6.04%
52.5%
18.6%
16.9%
6.78%
5.08%
RNNDMLPCNNOtherDBNAE
Publication Count in Model Type
Model Type
Figure 11: The Piechart of Publication Count in Model Types
60.4%
29.7%
9.89%
LSTMVanilla RNNGRU
Distribution of RNN Models
RNN
Figure 12: Distribution of RNN Models
As mentioned before, in order to convert the temporal time-varying sequential data intoa more stationary classifiable form, some preprocessing might be necessary. Even thoughsome 1-D representations exist, the 2-D implementation for CNN was more common, mostlyinherited through image recognition applications of CNN from computer vision implementa-tions. In some studies [188, 189, 193, 199, 219], innovative transformations of financial time
43
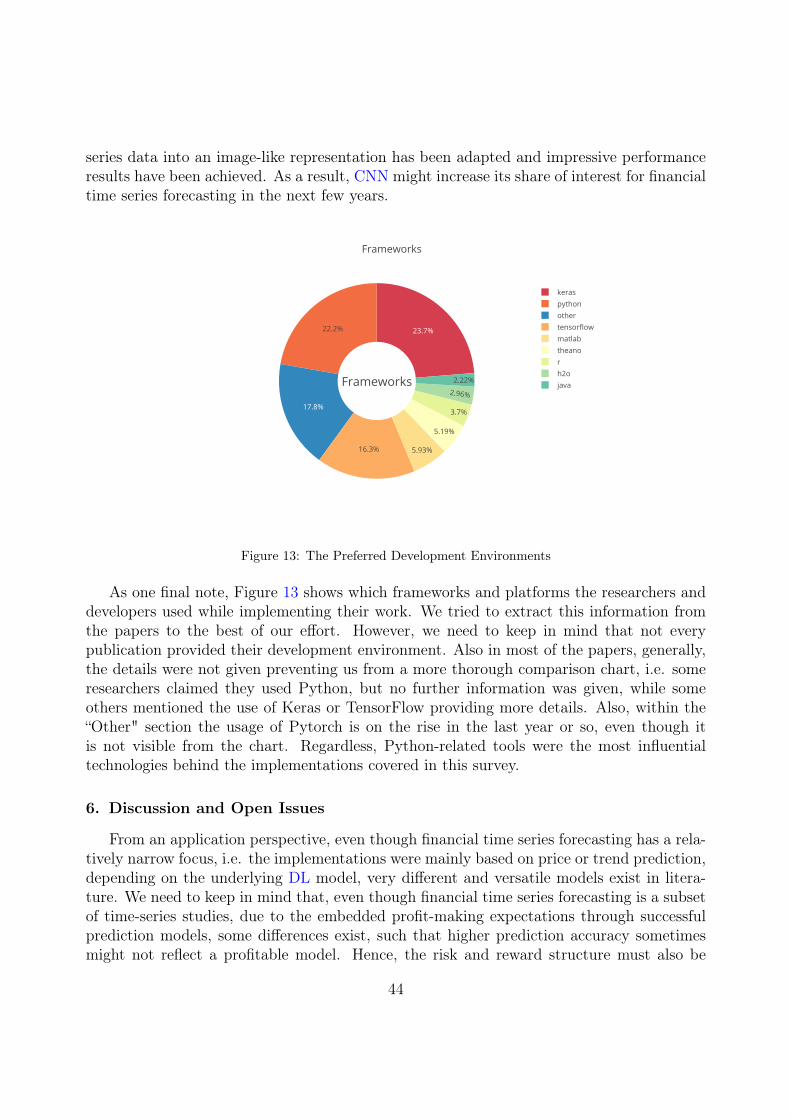
series data into an image-like representation has been adapted and impressive performanceresults have been achieved. As a result, CNN might increase its share of interest for financialtime series forecasting in the next few years.
23.7%22.2%
17.8%
16.3% 5.93%
5.19%
3.7%
2.96%
2.22%
keraspythonothertensorflowmatlabtheanorh2ojava
Frameworks
Frameworks
Figure 13: The Preferred Development Environments
As one final note, Figure 13 shows which frameworks and platforms the researchers anddevelopers used while implementing their work. We tried to extract this information fromthe papers to the best of our effort. However, we need to keep in mind that not everypublication provided their development environment. Also in most of the papers, generally,the details were not given preventing us from a more thorough comparison chart, i.e. someresearchers claimed they used Python, but no further information was given, while someothers mentioned the use of Keras or TensorFlow providing more details. Also, within the“Other" section the usage of Pytorch is on the rise in the last year or so, even though itis not visible from the chart. Regardless, Python-related tools were the most influentialtechnologies behind the implementations covered in this survey.
6. Discussion and Open Issues
From an application perspective, even though financial time series forecasting has a rela-tively narrow focus, i.e. the implementations were mainly based on price or trend prediction,depending on the underlying DL model, very different and versatile models exist in litera-ture. We need to keep in mind that, even though financial time series forecasting is a subsetof time-series studies, due to the embedded profit-making expectations through successfulprediction models, some differences exist, such that higher prediction accuracy sometimesmight not reflect a profitable model. Hence, the risk and reward structure must also be
44
taken into consideration. At this point, we will try to elaborate on our observations aboutthese differences in various model designs and implementations.
6.1. DL Models for financial time series forecastingAccording to the publication statistics, LSTM was the preferred choice of most re-
searchers for financial time series forecasting. LSTM and its variations utilized the time-varying data with feedback embedded representations, resulting in higher performances fortime series prediction implementations. Since most of the financial data, one way or another,included time-dependent components, LSTM was the natural choice in financial time seriesforecasting problems. Meanwhile, LSTM is a special DL model deriven from a more generalclassifier family, namely RNN.
Careful analysis of Figure 11 illustrates the dominance of RNN (which is highly consistedof LSTM). As a matter of fact, more than half of the published papers for time seriesforecasting studies fall into the RNN model category. Regardless of its problem type, priceor trend prediction, the ordinal nature of the data representation forced the researchersto consider RNN, GRU and LSTM as viable preferences for their model choices. Hence,RNN models were chosen, at least for benchmarking, in a lot of studies for performancecomparison against other developed models.
Meanwhile, other models were also used for time series forecasting problems. Amongthose, DMLP had the most interest due to the market dominance of its shallow cousin,MLP and its wide acceptance and long history within ML society. However, there is afundamental difference in how DMLP and RNN based models were used for financial timeseries prediction problems.
DMLP fits well for both regression and classification problems. However, in general, dataorder independence must be preserved for better utilizing the internal working dynamics ofsuch networks, even though through the learning algorithm configuration, some adjustmentscan be performed. In most cases, either trend components of the data need to be removedfrom the underlying time series, or some data transformations might be needed so thatthe resulting data becomes stationary. Regardless, some careful preprocessing might benecessary for the DMLP model to be successful. In contrast, RNN based models can directlywork with time-varying data, making it easier for researchers to develop DL models.
As a result, most of the DMLP implementations had embedded data preprocessing beforethe learning stage. However, this inconvenience did not prevent the researchers to use DMLPand its variations during their model development process. Instead, a lot of versatile datarepresentations were attempted in order to achieve higher overall prediction performances. Acombination of fundamental and/or technical analysis parameters along with other featureslike financial sentiment through text mining was embedded into such models. In most of theDMLP studies, the corresponding problem was treated as classification, especially in trendprediction models, whereas RNN based models directly predicted the next value of the timeseries. Both approaches had some success in beating the underlying benchmark; hence itis not possible to claim victory of one model type over the other. However, for the generalrule of thumb, researchers prefer RNN based models for time series regression and DMLPfor trend classification (or buy-sell point identification)
45
Another model that started becoming popular recently is CNN. CNN also works betterfor classification problems and unlike RNN based models, it is more suitable for eithernon-time varying or static data representations. The comments for DMLP are also mostlyvalid for CNN. Furthermore, unlike DMLP, CNN mostly requires locality within the datarepresentation for better-performing classification results. One particular implementationarea of CNN is image-based object recognition problems. In recent years, CNN based modelsdominated this field, handily outperforming all other models. Meanwhile, most financialdata is time-varying and it might not be easy to implement CNN directly for financialapplications. However, in some recent studies, various independent research groups followedan innovative transformation of 1-D time-varying financial data into 2-D mostly stationaryimage-like data so that they could utilize the power of CNN through adaptive filtering andimplicit dimensionality reduction. Hence, with that approach, they were able to come upwith successful models.
There is also a rising trend to use deep RL based financial algorithmic trading imple-mentations; these are mostly associated with various agent-based models where differentagents interact and learn from their interactions. This field even has more opportunitiesto offer with advancements in financial sentiment analysis through text mining to captureinvestor psychology; as a result, behavioral finance can benefit from these particular studiesassociated with RL based learning models coupled with agent-based studies.
Other models including DBN, AE and RBM also were used by several researchers andsuperior performances were reported in some of their work; but the interested readers needto check these studies case by case to see how they were modelled both from the datarepresentation and learning point of view.
6.2. Discussions on Selected FeaturesRegardless of the underlying forecasting problem, somehow the raw time series data was
almost always embedded directly or indirectly within the feature vector, which is particularlyvalid for RNN-based models. However, in most of the other model types, other features werealso included. Fundamental analysis and technical analysis features were among the mostfavorable choices for stock/index forecasting studies.
Meanwhile, in recent years, financial text mining is particularly getting more attention,mostly for extracting the investor/trader sentiment. The streaming flow of financial news,tweets, statements, blogs allowed the researchers to build better and more versatile predictionand evaluation models integrating numerical and textual data. The general methodologyinvolves in extracting financial sentiment analysis through text mining and combining thatinformation with fundamental/technical analysis data to achieve better overall performance.It is logical to assume that this trend will continue with the integration of more advancedtext and NLP techniques.
6.3. Discussions on Forecasted Asset TypesEven though forex price forecasting is always popular among the researchers and prac-
titioners, stock/index forecasting has always had the most interest among all asset groups.
46
Regardless, price/trend prediction and algo-trading models were mostly embedded withthese prediction studies.
These days, one other hot area to financial time series forecasting research is involvedwith cryptocurrencies. Cryptocurrency price prediction has an increasing demand fromthe financial community. Since the topic is fairly new, we might see more studies andimplementations coming in due to high expectations and promising rewards.
There were also a number of publications in commodity price forecasting research, inparticular, the price of oil. Oil price prediction is crucial due to its tremendous effect onworld economic activities and planning. Meanwhile, gold is considered a safe investmentand almost every investor, at one time, considers allocating some portion of their portfoliosfor gold-related investments. In times of political uncertainties, a lot of people turn to goldfor protecting their savings. Even though we have not encountered a noteworthy study forgold price forecasting, due to its historical importance, there might be opportunities in thisarea for the years to come.
6.4. Open Issues and Future WorkDespite the general motivation for financial time series forecasting remaining fairly un-
changed, the means of achieving the financial goals vary depending on the choices andtrade-off between the traditional techniques and newly developed models. Since our funda-mental focus is on the application of DL for financial time series studies, we will try to assesthe current state of the research and extrapolate that into the future.
6.4.1. Model Choices for the FutureThe dominance of RNN-based models for price/trend prediction will probably not disap-
pear anytime soon, mainly due to their easy adaptation to most asset forecasting problems.Meanwhile, some enhanced versions of the original LSTM or RNN models, generally in-tegrated with hybrid learning systems started becoming more common. Readers need tocheck individual studies and assess their performances to see which one fits the best fortheir particular needs and domain requirements.
We have observed the increasing interest in 2-D CNN implementations of financial fore-casting problems through converting the time series into an image-like data type. Thisinnovative methodology seems to work quite satisfactorily and provides promising opportu-nities. More studies of this kind will probably continue in the near future.
Nowadays, new models are generated through older models via modifying or enhancingthe existing models so that better performances can be achieved. Such topologies includeGenerative Adversarial Network (GAN), Capsule networks, etc. They have been used invarious non-financial studies, however, financial time series forecasting has not been investi-gated for those models yet. As such, there can be exciting opportunities both from researchand practical point of view.
Another DL model that is not investigated thoroughly is Graph CNN. Graphs can be usedto represent portfolios, social networks of financial communities, fundamental analysis data,etc. Even though graph algorithms can directly be applied to such configurations, differentgraph representations can also be implemented for the time series forecasting problems. Not
47
much has been done on this particular topic, however, through graph representations of thetime series data and implementing graph analysis algorithms, or implementing CNN throughthese graphs are among the possibilities that the researchers can choose.
As a final note for the future models, we believe deep RL and agent-based models offergreat opportunities for the researchers. HFT algorithms, robo-advisory systems highly de-pend on automated algorithmic trading systems that can decide what to buy and when tobuy without any human intervention. These aforementioned models can fit very well in suchchallenging environments. The rise of the machines will also lead to a technological (andalgorithmic) arms race between Fintech companies and quant funds to be the best in theirneverending search for “achieving alpha". New research in these areas can be just what thedoctor ordered.
6.4.2. Future Projections for Financial Time Series ForecastingMost probably, for the foreseeable future, the financial time series forecasting will have a
close research cooperation with the other financial application areas like algorithmic tradingand portfolio management, as it was the case before. However, changes in the available datacharacteristics and introduction of new asset classes might not only alter the forecastingstrategies of the developers, but also force the developers to look for new or alternativetechniques to better adapt to these new challenging working conditions. In addition, metricslike Continuous Ranked Probability Score (CRPS) for evaluating probability distributionsmight be included for more thorough analysis.
One rising trend, not only for financial time series forecasting, but for all intelligentdecision support systems, is the human-computer interaction and NLP research. Withinthat field, text mining and financial sentiment analysis areas are of particular importance tofinancial time series forecasting. Behavioral finance may benefit from the new advancementsin these fields.
In order to utilize the power of text mining, researchers started developing new datarepresentations like Stock2Vec [204] that can be useful for combining textual and numericaldata for better prediction models. Furthermore, NLP based ensemble models that integratedata semantics with time-series data might increase the accuracy of the existing models.
One area that can benefit a lot from the interconnected financial markets is the automatedstatistical arbitrage trading model development. It has been used in forex and commoditymarkets before. In addition, a lot of practitioners currently seek arbitrage opportunities inthe cryptocurrency markets [220], due to the existence of the huge number of coins availableon various marketplaces. Price disruptions, high volatility, bid-ask spread variations causearbitrage opportunities across different platforms. Some opportunists develop software mod-els that can track these price anomalies for the instant materialization of profits. Also, it ispossible to construct pairs trading portfolios across different asset classes using appropriatemodels. It is possible that DL models can learn (or predict) these opportunities faster andmore efficient than classical rule-based systems. This will also benefit HFT studies that areconstantly looking for faster and more efficient trading algorithms and embedded systemswith minimum latency. In order to achieve that, Graphics Processing Unit (GPU) or FieldProgrammable Gate Array (FPGA) based hardware solutions embedded with DL models
48
can be utilized. There is a lack of research accomplished on this hardware aspect of financialtime series forecasting and algorithmic trading. As long as there is enough computing poweravailable, it is worth investigating the possibilities for better algorithms, since the rewardsare high.
6.5. Responses to our Initial Research QuestionsWe are now ready to go back to our initially stated research questions. Our question
and answer pairs, through our observations, are as follows:
• Which DL models are used for financial time series forecasting ?
Response: RNN based models (in particular LSTM) are the most commonly usedmodels. Meanwhile, CNN and DMLP have been used extensively in classification typeimplementations (like trend classification) as long as appropriate data processing isapplied to the raw data.
• How is the performance of DL models compared with traditional machine learningcounterparts ?
Response: In the majority of the studies, DL models were better than ML. However,there were also many cases where their performances were comparable. There wereeven two particular studies ([82, 175] where ML models performed better than DLmodels. Meanwhile, appetite for preferrance of DL implementations over ML models isgrowing. Advances in computing power, availability of big data, superior performance,implicit feature learning capabilities and user friendly model development environmentfor DL models are among the main reasons for this migration.
• What is the future direction for DL research for financial time series forecasting ?
Response: NLP, semantics and text mining-based hybrid models ensembled with time-series data might be more common in the near future.
7. Conclusions
Financial time series forecasting has been very popular among ML researchers for morethan 40 years. The financial community got a new boost lately with the introduction ofDL implementations for financial prediction research and a lot of new publications appearedaccordingly. In our survey, we wanted to review the existing studies to provide a snapshotof the current research status of DL implementations for financial time series forecasting.We grouped the studies according to their intended asset class along with the preferred DLmodel associated with the problem. Our findings indicate, even though financial forecastinghas a long research history, overall interest within the DL community is on the rise throughutilizing new DL models; hence, a lot of opportunities exist for researchers.
49
8. Acknowledgement
This work is supported by Scientific and Technological Research Council of Turkey(TUBITAK) grant no 215E248.
Glossary
AdaGrad Adaptive Gradient Algorithm. 6, 7ADAM Adaptive Moment Estimation. 6–8, 13,
14, 33AE Autoencoder. 5, 9, 13, 14, 18, 19, 26, 29–31,
46AI Artificial Intelligence. 3AIS Annealed Importance Sampling. 12AMEX American Stock Exchange. 20, 21ANN Artificial Neural Network. 3–5, 8, 11–13, 18,
20, 23, 24, 31, 33, 34AR Active Return. 21AR Autoregressive. 22ARCH Autoregressive Conditional Heteroscedas-
ticity. 32ARIMA Autoregressive Integrated Moving Aver-
age. 19, 20, 30, 32ARMA Autoregressive Moving Average. 28, 32AUC Area Under the Curve. 21AUROC Area Under the Receiver Operating
Characteristics. 33, 34, 36, 37B&H Buy and Hold. 25BELM Basic Extreme Learning Machine. 37Bi-GRU Bidirectional Gated Recurrent Unit. 35,
36Bi-LSTM Bidirectional LSTM. 22, 24, 25BIST Istanbul Stock Exchange Index. 20, 21, 23,
24Bovespa Brazilian Stock Exchange. 23, 25BPTT Back Propagation Through Time. 7, 8BSE Bombay Stock Exchange. 26CCI Commodity Channel Index. 27CD Contrastive Divergence. 12, 13CDAX German Stock Market Index Calculated by
Deutsche Börse. 21CDBN Continuous-valued Deep Belief Networks.
30CDBN-FG Fuzzy Granulation with Continuous-
valued Deep Belief Networks. 31CNN Convolutional Neural Network. 1, 3, 5, 6,
10, 17–22, 25–38, 40, 42–44, 46–49CRBM Continuous Restricted Boltzman machine.
30CRPS Continuous Ranked Probability Score. 48
CSE Colombo Stock Exchange. 18CSI China Securities Index. 18, 22, 23, 26, 28, 29DA Direction Accuracy. 31DAX The Deutscher Aktienindex. 29, 33DBN Deep Belief Network. 1, 5, 12, 13, 18, 19, 28,
30, 31, 33–36, 46DE Differential Evolution. 26DFNN Deep Feedforward Neural Network. 17, 19,
22, 23, 29, 33DGM Deep Neural Generative Model. 36, 37DJI Dow Jones Index. 36DJIA Dow Jones Industrial Average. 23–26, 36DL Deep Learning. 1–5, 7, 9, 10, 13, 14, 16–21, 23,
25, 27, 29, 30, 35, 36, 38–40, 44, 45, 47–49DLR Deep Learning Representation. 37DMLP Deep Multilayer Perceptron. 5–8, 10, 23,
30, 34, 35, 40–42, 45, 46, 49DNN Deep Neural Network. 6, 10, 18–21, 23–28,
30–33, 35, 36DOW30 Dow Jones Industrial Average 30. 23, 26–
28DP Dynamic Programming. 15, 16DPA Direction Prediction Accuracy. 21DRL Deep Reinforcement Learning. 3, 5, 16DRSE Deep Random Subspace Ensembles. 36DWNN Deep and Wide Neural Network. 18, 19EA Evolutionary Algorithm. 25, 27EC Evolutionary Computation. 3, 4EGARCH Exponential GARCH. 24ELM Extreme Learning Machine. 18, 19, 37EMA Exponential Moving Average. 27EMD2FNN Empirical Mode Decomposition and
Factorization Machine based Neural Net-work. 33, 34
ETF Exchange-Traded Fund. 28, 31, 33, 34FCNN Fully Connected Neural Network. 37FDDR Fuzzy Deep Direct Reinforcement Learn-
ing. 23–25, 27, 28FFNN Feedforward Neural Network. 13, 14, 20,
24, 30, 33FHSO Firefly Harmony Search Optimization. 25,
31FLANN Functional Link Neural network. 27
50
FNN Fully Connected Neural Network. 7, 27, 33FTSE London Financial Times Stock Exchange In-
dex. 23, 26, 28, 29, 31, 34GA Genetic Algorithm. 4, 25, 34GAF Gramian Angular Field. 33GAN Generative Adversarial Network. 21, 47GAN-FD GAN for minimizing Forecast error loss
and Direction prediction loss. 20GARCH Generalised Auto-Regressive Condi-
tional Heteroscedasticity. 28, 29, 31, 32GASVR GA with a SVR. 25, 26, 29GBT Gradient Boosted Trees. 18, 19GDAX Global Digital Asset Exchange. 26GLM Generalized Linear Model. 24GML Generalized Linear Model. 25GP Genetic Programming. 3, 4, 30GPA The Gaussian Process Approach. 7, 9GRU Gated-Recurrent Unit. 9, 18, 19, 21, 22, 32–
37, 40, 45GS Grid Search. 7, 9, 10, 12–14, 16GSPC S&P500 Commodity Price Index. 24HAN Hybrid Attention Network. 36HAR Heterogeneous Autoregressive Process. 25,
29HAR-GASVR HAR with a GASVR. 24, 29HFT High Frequency Trading. 18, 28, 37, 48HIT Hit Rate. 23, 24HMAE Heteroscedasticity Adjusted MAE. 29HMM Hidden Markov Model. 35HMRPSO Modified Version of PSO. 26HMSE Heteroscedasticity Adjusted MSE. 29HR Hit Rate. 21, 29, 31HS China Shanghai Shenzhen Stock Index. 26, 27,
37HSI Hong Kong Hang Seng Index. 23, 24, 26, 33IBOVESPA Indice Bolsa de Valores de Sao Paulo.
34IC Information Coeffiencient. 21IR Information Ratio. 21ISE Istanbul Stock Exchange Index. 24, 31IXIC NASDAQ Composite Index. 24KELM Kernel Extreme Learning Machine. 37KL-Divergence Kullback Leibler Divergence. 12KOSPI The Korea Composite Stock Price Index.
18, 19, 23–26, 29KSE Korea Stock Exchange. 34LAR Linear Auto-regression Predictor. 22LDA Latent Dirichlet Allocation. 27, 37LOB Limit Order Book Data. 37, 38LRNFIS Locally Recurrent Neuro-fuzzy Informa-
tion System. 23, 25, 31
LSTM Long-Short Term Memory. 1, 3, 5, 8, 9,17–30, 32–37, 40, 45, 47, 49
MACD Moving Average Convergence and Diver-gence. 34, 36
MAD Mean Absolute Deviation. 18MAE Mean Absolute Error. 18, 21, 23, 24, 26, 27,
29, 31, 33, 37MAM Moving Average Mapping. 33MAPE Mean Absolute Percentage Error. 18, 21–
24, 26–29, 31, 33, 37MASE Mean Standard Deviation. 23MC Monte Carlo. 15, 16MCC Matthew Correlation Coefficient. 22, 26, 36,
37MDA Multilinear Discriminant Analysis. 20, 21MDD Maximum Drawdown. 18MDP Markov Decision Process. 14, 15MI Mutual Information. 18ML Machine Learning. 1–5, 7, 19, 25, 29, 30, 34,
35, 45, 49MLP Multilayer Perceptron. 10, 18–21, 23, 24, 30,
31, 34, 41, 45MM Markov Model. 29MODRL Multi-objective Deep Reinforcement
Learning. 26MoE Mixture of Experts. 24MOEA Multiobjective Evolutionary Algorithm. 4MRS Markov Regime Switching. 27MS Manual Search. 7, 9, 10, 12–14, 16MSE Mean Squared Error. 13, 14, 18, 20, 21, 24,
26, 28, 29, 31–34MSFE Mean Squared Forecast Error. 24MSPE Mean Squared Prediction Error. 20NASDAQ National Association of Securities Deal-
ers Automated Quotations. 18–21, 23, 26–28, 33, 34, 36
NIFTY National Stock Exchange of India. 23, 26,36
NIKKEI Tokyo Nikkei Index. 23, 25, 26, 31NLP Natural Language Processing. 9, 46, 48, 49NMAE Normalized Mean Absolute Error. 29, 31NMSE Normalized Mean Square Error. 18, 29, 31NN Neural Network. 5, 6, 10, 16, 29, 33, 35–37norm-RMSE Normalized RMSE. 18NSE National Stock Exchange of India. 18NYMEX New York Mercantile Exchange. 27, 28NYSE New York Stock Exchange. 18, 20, 21, 23,
34, 36OCHL Open,Close,High, Low. 21, 24, 26OCHLV Open,Close,High, Low, Volume. 18, 19,
21–24, 26, 32–34, 36
51
OMX Stockholm Stock Exchange. 23–26, 28, 31,33, 34
PCA Principal Component Analysis. 20, 21, 29,37
PCC Pearson’s Correlation Coefficient. 31PCD Percentage of Correct Direction. 21PLR Piecewise Linear Representation. 21PNN Probabilistic Neural Network. 33PPOSC Percentage Price Oscillator. 27PSN Psi-Sigma Network. 30, 31PSO Particle Swarm Optimization. 26, 27R2 Squared correlation, Non-linear regression mul-
tiple correlation. 21RBF Radial Basis Function Neural Network. 18,
19, 24, 31, 34RBM Restricted Boltzmann Machine. 5, 11–13,
19, 30, 31, 34–36, 46RCEFLANN Recurrent Computationally Effi-
cient Functional Link Neural Network. 26,27
RCNN Recurrent CNN. 22ReLU Rectified Linear Unit. 5, 7, 12RF Random Forest. 18, 19, 22, 29RHE Recurrent Hybrid Elman. 24, 25, 31RL Reinforcement learning. 14, 15, 23–25, 28, 46,
48RMDN Recurrent Mixture Density Network. 29,
31RMDN-GARCH RMDN with a GARCH. 29RMSE Root Mean Square Error. 18, 21–24, 26–29,
31–33, 37RMSProp Root Mean Square Propagation. 6–8,
10, 13, 14RMSRE Root Mean Square Relative Error. 21RNN Recurrent Neural Network. 2, 5, 7–9, 18–33,
35–37, 40, 45–47, 49RS RandomSearch. 7, 9, 10, 12–14, 16RSE Relative Squared Error. 21RSI Relative Strength Index. 27, 34RW Random Walk. 27, 28, 30S&P500 Standard’s & Poor’s 500 Index. 18–29,
31, 33, 36, 37SCI SSE Composite Index. 22SDAE Stacked Denoising Autoencoders. 27, 28SFM State Frequency Memory. 18, 19
SGD Stochastic Gradient Descent. 6–8, 10, 13, 14SLP Single Layer Perceptron. 34SMAPE Symmetric Mean Absolute Percentage
Error. 21SMBGO Sequential Model-Based Global Opti-
mization. 7, 9SPY SPDR S&P 500 ETF. 33SR Sharpe-ratio. 21, 23–26, 28, 31SRNN Stacked Recurrent Neural Network. 18, 19SSE Shanghai Stock Exchange. 18, 21, 23, 26, 34SSEC Shanghai Stock Exchange Composite. 33STD Standard Deviation. 23, 25, 26SVM Support Vector Machine. 20, 22, 33–36SVR Support Vector Regressor. 25, 27, 30, 31SZSE Shenzhen Stock Exchange Composite Index.
23–26, 28, 33TAIEX Taiwan Capitalization Weighted Stock In-
dex. 23, 26TALIB Technical Analysis Library Package. 26,
34TAQ Trade and Quote. 21TAR Threshold Autoregressive. 24, 25, 31TD Temporal Difference. 15, 16TDNN Timedelay Neural Network. 33TF-IDF Term Frequency-Inverse Document Fre-
quency. 37TGRU Two-stream GRU. 35THEIL-U Theil’s inequality coefficient. 26, 31TR Total Return. 21, 24TSPEA Tree-structured Parzen Estimator Ap-
proach. 7, 9TUNINDEX Tunisian Stock Market Index. 24TWSE Taiwan Stock Exchange. 22, 26, 27VEC Vector Error Correction model. 24, 25, 31VIX S&P500 Volatility Index. 23–25, 29VXD Dow Jones Industrial Average Volatility In-
dex. 24, 25, 29VXN NASDAQ100 Volatility Index. 23–25, 29WHR Weighted Hit Rate. 29, 31William%R Williams Percent Range. 27WMTR Weighted Multichannel Time-series Re-
gression. 20, 21WT Wavelet Transforms. 26WTI West Texas Intermediate. 28XGBoost eXtreme Gradient Boosting. 34, 35
52
References
[1] Ahmet Murat Ozbayoglu, Mehmet Ugur Gudelek, and Omer Berat Sezer. Deep learning for financialapplications: A survey. working paper, 2019.
[2] Rafik A. Aliev, Bijan Fazlollahi, and Rashad R. Aliev. Soft computing and its applications in businessand economics. In Studies in Fuzziness and Soft Computing, 2004.
[3] Ludmila Dymowa. Soft Computing in Economics and Finance. Springer Berlin Heidelberg, 2011.[4] Boris Kovalerchuk and Evgenii Vityaev. Data Mining in Finance: Advances in Relational and Hybrid
Methods. Kluwer Academic Publishers, Norwell, MA, USA, 2000.[5] Anthony Brabazon and Michael O’Neill, editors. Natural Computing in Computational Finance.
Springer Berlin Heidelberg, 2008.[6] Arash Bahrammirzaee. A comparative survey of artificial intelligence applications in finance: artificial
neural networks, expert system and hybrid intelligent systems. Neural Computing and Applications,19(8):1165–1195, June 2010.
[7] D. Zhang and L. Zhou. Discovering golden nuggets: Data mining in financial application. IEEETransactions on Systems, Man and Cybernetics, Part C (Applications and Reviews), 34(4):513–522,November 2004.
[8] Asunción Mochón, David Quintana, Yago Sáez, and Pedro Isasi Viñuela. Soft computing techniquesapplied to finance. Applied Intelligence, 29:111–115, 2007.
[9] Sendhil Mullainathan and Jann Spiess. Machine learning: An applied econometric approach. Journalof Economic Perspectives, 31(2):87–106, May 2017.
[10] Shu-Heng Chen, editor. Genetic Algorithms and Genetic Programming in Computational Finance.Springer US, 2002.
[11] Ma. Guadalupe Castillo Tapia and Carlos A. Coello Coello. Applications of multi-objective evolu-tionary algorithms in economics and finance: A survey. In 2007 IEEE Congress on EvolutionaryComputation. IEEE, September 2007.
[12] Antonin Ponsich, Antonio Lopez Jaimes, and Carlos A. Coello Coello. A survey on multiobjectiveevolutionary algorithms for the solution of the portfolio optimization problem and other finance andeconomics applications. IEEE Transactions on Evolutionary Computation, 17(3):321–344, June 2013.
[13] Ruben Aguilar-Rivera, Manuel Valenzuela-Rendon, and J.J. Rodriguez-Ortiz. Genetic algorithms anddarwinian approaches in financial applications: A survey. Expert Systems with Applications, 42(21):7684–7697, November 2015.
[14] Roy Rada. Expert systems and evolutionary computing for financial investing: A review. ExpertSystems with Applications, 34(4):2232–2240, 2008.
[15] Yuhong Li and Weihua Ma. Applications of artificial neural networks in financial economics: A survey.In 2010 International Symposium on Computational Intelligence and Design. IEEE, October 2010.
[16] Michal Tkáč and Robert Verner. Artificial neural networks in business: Two decades of research.Applied Soft Computing, 38:788 – 804, 2016.
[17] B. Elmsili and B. Outtaj. Artificial neural networks applications in economics and managementresearch: An exploratory literature review. In 2018 4th International Conference on Optimizationand Applications (ICOA), pages 1–6, April 2018.
[18] Marc-André Mittermayer and Gerhard F Knolmayer. Text mining systems for market response tonews: A survey. September 2006.
[19] Leela Mitra and Gautam Mitra. Applications of news analytics in finance: A review. In The Handbookof News Analytics in Finance, pages 1–39. John Wiley & Sons, Ltd., May 2012.
[20] Arman Khadjeh Nassirtoussi, Saeed Aghabozorgi, Teh Ying Wah, and David Chek Ling Ngo. Textmining for market prediction: A systematic review. Expert Systems with Applications, 41(16):7653–7670, November 2014.
[21] Colm Kearney and Sha Liu. Textual sentiment in finance: A survey of methods and models. Interna-tional Review of Financial Analysis, 33:171–185, May 2014.
[22] B. Shravan Kumar and Vadlamani Ravi. A survey of the applications of text mining in financialdomain. Knowledge-Based Systems, 114:128–147, December 2016.
53
[23] Frank Z. Xing, Erik Cambria, and Roy E. Welsch. Natural language based financial forecasting: asurvey. Artificial Intelligence Review, 50(1):49–73, October 2017.
[24] Bruce J Vanstone and Clarence Tan. A survey of the application of soft computing to investment andfinancial trading. In Brian C Lovell, Duncan A Campbell, Clinton B Fookes, and Anthony J Maeder,editors, Proceedings of the Eighth Australian and New Zealand Intelligent Information Systems Con-ference (ANZIIS 2003), pages 211–216. The Australian Pattern Recognition Society, 2003. CopyrightThe Australian Pattern Recognition Society 2003. All rights reserved. Permission granted.
[25] Ehsan Hajizadeh, H. Davari Ardakani, and Jamal Shahrabi. Application of data mining techniques instock markets : A survey. 2010.
[26] Binoy B. Nair and V.P. Mohandas. Artificial intelligence applications in financial forecasting – asurvey and some empirical results. Intelligent Decision Technologies, 9(2):99–140, December 2014.
[27] Rodolfo C. Cavalcante, Rodrigo C. Brasileiro, Victor L.F. Souza, Jarley P. Nobrega, and Adriano L.I.Oliveira. Computational intelligence and financial markets: A survey and future directions. ExpertSystems with Applications, 55:194–211, August 2016.
[28] Bjoern Krollner, Bruce J. Vanstone, and Gavin R. Finnie. Financial time series forecasting withmachine learning techniques: a survey. In ESANN, 2010.
[29] P. D. Yoo, M. H. Kim, and T. Jan. Machine learning techniques and use of event information forstock market prediction: A survey and evaluation. In International Conference on Computational In-telligence for Modelling, Control and Automation and International Conference on Intelligent Agents,Web Technologies and Internet Commerce (CIMCA-IAWTIC’06), volume 2, pages 835–841, November2005.
[30] G Preethi and B Santhi. Stock market forecasting techniques: A survey. Journal of Theoretical andApplied Information Technology, 46:24–30, December 2012.
[31] George S. Atsalakis and Kimon P. Valavanis. Surveying stock market forecasting techniques – part ii:Soft computing methods. Expert Systems with Applications, 36(3):5932–5941, April 2009.
[32] Amitava Chatterjee, O.Felix Ayadi, and Bryan E. Boone. Artificial neural network and the financialmarkets: A survey. Managerial Finance, 26(12):32–45, December 2000.
[33] R. Katarya and A. Mahajan. A survey of neural network techniques in market trend analysis. In 2017International Conference on Intelligent Sustainable Systems (ICISS), pages 873–877, December 2017.
[34] Yong Hu, Kang Liu, Xiangzhou Zhang, Lijun Su, E.W.T. Ngai, and Mei Liu. Application of evolu-tionary computation for rule discovery in stock algorithmic trading: A literature review. Applied SoftComputing, 36:534–551, November 2015.
[35] Wei Huang, K. K. Lai, Y. Nakamori, and Shouyang Wang. Forecasting foreign exchange rates withartificial neural networks: A review. International Journal of Information Technology & DecisionMaking, 03(01):145–165, 2004.
[36] Dadabada Pradeepkumar and Vadlamani Ravi. Soft computing hybrids for forex rate prediction: Acomprehensive review. Computers & Operations Research, 99:262 – 284, 2018.
[37] Yann LeCun, Yoshua Bengio, and Geoffrey Hinton. Deep learning. Nature, 521(7553):436–444, 2015.[38] Jürgen Schmidhuber. Deep learning in neural networks: An overview. Neural networks, 61:85–117,
2015.[39] Ian Goodfellow, Yoshua Bengio, and Aaron Courville. Deep Learning. MIT Press, 2016.
http://www.deeplearningbook.org.[40] George Cybenko. Approximation by superpositions of a sigmoidal function. Mathematics of control,
signals and systems, 2(4):303–314, 1989.[41] Barry L Kalman and Stan C Kwasny. Why tanh: choosing a sigmoidal function. In [Proceedings 1992]
IJCNN International Joint Conference on Neural Networks, volume 4, pages 578–581. IEEE, 1992.[42] Vinod Nair and Geoffrey E Hinton. Rectified linear units improve restricted boltzmann machines.
In Proceedings of the 27th international conference on machine learning (ICML-10), pages 807–814,2010.
[43] Andrew L Maas, Awni Y Hannun, and Andrew Y Ng. Rectifier nonlinearities improve neural networkacoustic models. In Proc. icml, volume 30, page 3, 2013.
54
[44] Prajit Ramachandran, Barret Zoph, and Quoc V Le. Searching for activation functions. arXiv preprintarXiv:1710.05941, 2017.
[45] Li Deng, Dong Yu, et al. Deep learning: methods and applications. Foundations and Trends R© inSignal Processing, 7(3–4):197–387, 2014.
[46] Matt W Gardner and SR Dorling. Artificial neural networks (the multilayer perceptron)—a review ofapplications in the atmospheric sciences. Atmospheric environment, 32(14-15):2627–2636, 1998.
[47] Herbert Robbins and Sutton Monro. A stochastic approximation method. The annals of mathematicalstatistics, pages 400–407, 1951.
[48] Ilya Sutskever, James Martens, George Dahl, and Geoffrey Hinton. On the importance of initializationand momentum in deep learning. In International conference on machine learning, pages 1139–1147,2013.
[49] John Duchi, Elad Hazan, and Yoram Singer. Adaptive subgradient methods for online learning andstochastic optimization. Journal of Machine Learning Research, 12(Jul):2121–2159, 2011.
[50] Tijmen Tieleman and Geoffrey Hinton. Lecture 6.5-rmsprop: Divide the gradient by a running averageof its recent magnitude. COURSERA: Neural networks for machine learning, 4(2):26–31, 2012.
[51] Diederik P Kingma and Jimmy Ba. Adam: A method for stochastic optimization. arXiv preprintarXiv:1412.6980, 2014.
[52] Yoshua Bengio, Patrice Simard, Paolo Frasconi, et al. Learning long-term dependencies with gradientdescent is difficult. IEEE transactions on neural networks, 5(2):157–166, 1994.
[53] Kaiming He, Xiangyu Zhang, Shaoqing Ren, and Jian Sun. Delving deep into rectifiers: Surpass-ing human-level performance on imagenet classification. In Proceedings of the IEEE internationalconference on computer vision, pages 1026–1034, 2015.
[54] Xavier Glorot and Yoshua Bengio. Understanding the difficulty of training deep feedforward neu-ral networks. In Proceedings of the thirteenth international conference on artificial intelligence andstatistics, pages 249–256, 2010.
[55] James S Bergstra, Rémi Bardenet, Yoshua Bengio, and Balázs Kégl. Algorithms for hyper-parameteroptimization. In Advances in neural information processing systems, pages 2546–2554, 2011.
[56] James Bergstra and Yoshua Bengio. Random search for hyper-parameter optimization. Journal ofMachine Learning Research, 13(Feb):281–305, 2012.
[57] Razvan Pascanu, Tomas Mikolov, and Yoshua Bengio. On the difficulty of training recurrent neuralnetworks. In International conference on machine learning, pages 1310–1318, 2013.
[58] Sepp Hochreiter and Jürgen Schmidhuber. Long short-term memory. Neural computation, 9(8):1735–1780, 1997.
[59] Yonghui Wu, Mike Schuster, Zhifeng Chen, Quoc V Le, Mohammad Norouzi, Wolfgang Macherey,Maxim Krikun, Yuan Cao, Qin Gao, Klaus Macherey, et al. Google’s neural machine translationsystem: Bridging the gap between human and machine translation. arXiv preprint arXiv:1609.08144,2016.
[60] Klaus Greff, Rupesh K Srivastava, Jan Koutník, Bas R Steunebrink, and Jürgen Schmidhuber. Lstm:A search space odyssey. IEEE transactions on neural networks and learning systems, 28(10):2222–2232, 2016.
[61] Nils Reimers and Iryna Gurevych. Optimal hyperparameters for deep lstm-networks for sequencelabeling tasks. arXiv preprint arXiv:1707.06799, 2017.
[62] Shuiwang Ji, Wei Xu, Ming Yang, and Kai Yu. 3d convolutional neural networks for human actionrecognition. IEEE transactions on pattern analysis and machine intelligence, 35(1):221–231, 2012.
[63] Christian Szegedy, Alexander Toshev, and Dumitru Erhan. Deep neural networks for object detection.In Advances in neural information processing systems, pages 2553–2561, 2013.
[64] Jonathan Long, Evan Shelhamer, and Trevor Darrell. Fully convolutional networks for semanticsegmentation. In Proceedings of the IEEE conference on computer vision and pattern recognition,pages 3431–3440, 2015.
[65] Xueheng Qiu, Le Zhang, Ye Ren, P. Suganthan, and Gehan Amaratunga. Ensemble deep learningfor regression and time series forecasting. In 2014 IEEE Symposium on Computational Intelligence in
55
Ensemble Learning (CIEL), pages 1–6, 2014.[66] Rafael Hrasko, André GC Pacheco, and Renato A Krohling. Time series prediction using restricted
boltzmann machines and backpropagation. Procedia Computer Science, 55:990–999, 2015.[67] Ruslan Salakhutdinov, Andriy Mnih, and Geoffrey Hinton. Restricted boltzmann machines for col-
laborative filtering. In Proceedings of the 24th international conference on Machine learning, pages791–798. ACM, 2007.
[68] Yoshua Bengio. Deep learning of representations for unsupervised and transfer learning. In Proceedingsof ICML workshop on unsupervised and transfer learning, pages 17–36, 2012.
[69] Abdel-rahman Mohamed, George Dahl, and Geoffrey Hinton. Deep belief networks for phone recog-nition. In Nips workshop on deep learning for speech recognition and related applications, volume 1,page 39. Vancouver, Canada, 2009.
[70] Honglak Lee, Roger Grosse, Rajesh Ranganath, and Andrew Y Ng. Convolutional deep belief networksfor scalable unsupervised learning of hierarchical representations. In Proceedings of the 26th annualinternational conference on machine learning, pages 609–616. ACM, 2009.
[71] Laurens Van Der Maaten. Learning a parametric embedding by preserving local structure. In ArtificialIntelligence and Statistics, pages 384–391, 2009.
[72] Chengwei Yao and Gencai Chen. Hyperparameters adaptation for restricted boltzmann machinesbased on free energy. In 2016 8th International Conference on Intelligent Human-Machine Systemsand Cybernetics (IHMSC), volume 2, pages 243–248. IEEE, 2016.
[73] Miguel A Carreira-Perpinan and Geoffrey E Hinton. On contrastive divergence learning. In Aistats,volume 10, pages 33–40. Citeseer, 2005.
[74] Prasanna Tamilselvan and Pingfeng Wang. Failure diagnosis using deep belief learning based healthstate classification. Reliability Engineering & System Safety, 115:124–135, 2013.
[75] Geoffrey E. Hinton, Simon Osindero, and Yee-Whye Teh. A fast learning algorithm for deep beliefnets. Neural Computation, 18(7):1527–1554, 2006.
[76] Qinxue Meng, Daniel Catchpoole, David Skillicom, and Paul J Kennedy. Relational autoencoderfor feature extraction. In 2017 International Joint Conference on Neural Networks (IJCNN), pages364–371. IEEE, 2017.
[77] Pascal Vincent, Hugo Larochelle, Yoshua Bengio, and Pierre-Antoine Manzagol. Extracting andcomposing robust features with denoising autoencoders. In Proceedings of the 25th internationalconference on Machine learning, pages 1096–1103. ACM, 2008.
[78] Richard S Sutton and Andrew G Barto. Introduction to reinforcement learning, volume 135. MITpress Cambridge, 1998.
[79] Duy Nguyen-Tuong and Jan Peters. Model learning for robot control: a survey. Cognitive processing,12(4):319–340, 2011.
[80] Eunsuk Chong, Chulwoo Han, and Frank C. Park. Deep learning networks for stock market analysisand prediction: Methodology, data representations, and case studies. Expert Systems with Applica-tions, 83:187–205, October 2017.
[81] Kai Chen, Yi Zhou, and Fangyan Dai. A lstm-based method for stock returns prediction: A casestudy of china stock market. In 2015 IEEE International Conference on Big Data (Big Data). IEEE,October 2015.
[82] Eva Dezsi and Ioan Alin Nistor. Can deep machine learning outsmart the market? a comparisonbetween econometric modelling and long- short term memory. Romanian Economic Business Review,11(4.1):54–73, December 2016.
[83] A.J.P. Samarawickrama and T.G.I. Fernando. A recurrent neural network approach in predicting dailystock prices an application to the sri lankan stock market. In 2017 IEEE International Conference onIndustrial and Information Systems (ICIIS). IEEE, December 2017.
[84] M Hiransha, E.A. Gopalakrishnan, Vijay Krishna Menon, and K.P. Soman. Nse stock market predic-tion using deep-learning models. Procedia Computer Science, 132:1351–1362, 2018.
[85] Sreelekshmy Selvin, R Vinayakumar, E. A Gopalakrishnan, Vijay Krishna Menon, and K. P. Soman.Stock price prediction using lstm, rnn and cnn-sliding window model. In 2017 International Conference
56
on Advances in Computing, Communications and Informatics (ICACCI). IEEE, September 2017.[86] Sang Il Lee and Seong Joon Yoo. Threshold-based portfolio: the role of the threshold and its appli-
cations. The Journal of Supercomputing, September 2018.[87] Xiumin Li, Lin Yang, Fangzheng Xue, and Hongjun Zhou. Time series prediction of stock price using
deep belief networks with intrinsic plasticity. In 2017 29th Chinese Control And Decision Conference(CCDC). IEEE, May 2017.
[88] Lin Chen, Zhilin Qiao, Minggang Wang, Chao Wang, Ruijin Du, and Harry Eugene Stanley. Whichartificial intelligence algorithm better predicts the chinese stock market? IEEE Access, 6:48625–48633,2018.
[89] Christopher Krauss, Xuan Anh Do, and Nicolas Huck. Deep neural networks, gradient-boosted trees,random forests: Statistical arbitrage on the s&p 500. European Journal of Operational Research, 259(2):689–702, June 2017.
[90] Rohitash Chandra and Shelvin Chand. Evaluation of co-evolutionary neural network architecturesfor time series prediction with mobile application in finance. Applied Soft Computing, 49:462–473,December 2016.
[91] Shuanglong Liu, Chao Zhang, and Jinwen Ma. Cnn-lstm neural network model for quantitative strat-egy analysis in stock markets. In Neural Information Processing, pages 198–206. Springer InternationalPublishing, 2017.
[92] J. B. Heaton, N. G. Polson, and J. H. Witte. Deep learning in finance, 2016.[93] Bilberto Batres-Estrada. Deep learning for multivariate financial time series. Master’s thesis, KTH,
Mathematical Statistics, 2015.[94] Zhaozheng Yuan, Ruixun Zhang, and Xiuli Shao. Deep and wide neural networks on multiple sets of
temporal data with correlation. In Proceedings of the 2018 International Conference on Computingand Data Engineering - ICCDE 2018. ACM Press, 2018.
[95] Liheng Zhang, Charu Aggarwal, and Guo-Jun Qi. Stock price prediction via discovering multi-frequency trading patterns. In Proceedings of the 23rd ACM SIGKDD International Conference onKnowledge Discovery and Data Mining - KDD17. ACM Press, 2017.
[96] Masaya Abe and Hideki Nakayama. Deep learning for forecasting stock returns in the cross-section. InAdvances in Knowledge Discovery and Data Mining, pages 273–284. Springer International Publishing,2018.
[97] Guanhao Feng, Jingyu He, and Nicholas G. Polson. Deep learning for predicting asset returns, 2018.[98] Jianqing Fan, Lingzhou Xue, and Jiawei Yao. Sufficient forecasting using factor models. SSRN
Electronic Journal, 2014.[99] Mathias Kraus and Stefan Feuerriegel. Decision support from financial disclosures with deep neural
networks and transfer learning. Decision Support Systems, 104:38–48, December 2017.[100] Shotaro Minami. Predicting equity price with corporate action events using lstm-rnn. Journal of
Mathematical Finance, 08(01):58–63, 2018.[101] Xiaolin Zhang and Ying Tan. Deep stock ranker: A lstm neural network model for stock selection. In
Data Mining and Big Data, pages 614–623. Springer International Publishing, 2018.[102] Qun Zhuge, Lingyu Xu, and Gaowei Zhang. Lstm neural network with emotional analysis for prediction
of stock price. 2017.[103] Ryo Akita, Akira Yoshihara, Takashi Matsubara, and Kuniaki Uehara. Deep learning for stock pre-
diction using numerical and textual information. In 2016 IEEE/ACIS 15th International Conferenceon Computer and Information Science (ICIS). IEEE, June 2016.
[104] A. Ozbayoglu. Neural based technical analysis in stock market forecasting. In Intelligent EngineeringSystems Through Artificial Neural Networks, Volume 17, pages 261–266. ASME, 2007.
[105] Kaustubh Khare, Omkar Darekar, Prafull Gupta, and V. Z. Attar. Short term stock price predictionusing deep learning. In 2017 2nd IEEE International Conference on Recent Trends in Electronics,Information & Communication Technology (RTEICT). IEEE, May 2017.
[106] Xingyu Zhou, Zhisong Pan, Guyu Hu, Siqi Tang, and Cheng Zhao. Stock market prediction on high-frequency data using generative adversarial nets. Mathematical Problems in Engineering, 2018:1–11,
57
2018.[107] Ritika Singh and Shashi Srivastava. Stock prediction using deep learning. Multimedia Tools and
Applications, 76(18):18569–18584, December 2016.[108] Sercan Karaoglu and Ugur Arpaci. A deep learning approach for optimization of systematic signal
detection in financial trading systems with big data. International Journal of Intelligent Systems andApplications in Engineering, SpecialIssue(SpecialIssue):31–36, July 2017.
[109] Bo Zhou. Deep learning and the cross-section of stock returns: Neural networks combining price andfundamental information. SSRN Electronic Journal, 2018.
[110] Narek Abroyan and. Neural networks for financial market risk classification. Frontiers in SignalProcessing, 1(2), August 2017.
[111] Google. System and method for computer managed funds to outperform benchmarks.[112] Dat Thanh Tran, Martin Magris, Juho Kanniainen, Moncef Gabbouj, and Alexandros Iosifidis. Tensor
representation in high-frequency financial data for price change prediction. In 2017 IEEE SymposiumSeries on Computational Intelligence (SSCI). IEEE, November 2017.
[113] Guanhao Feng, Nicholas G. Polson, and Jianeng Xu. Deep factor alpha, 2018.[114] Xiao Ding, Yue Zhang, Ting Liu, and Junwen Duan. Deep learning for event-driven stock prediction.
In Proceedings of the 24th International Conference on Artificial Intelligence, IJCAI’15, pages 2327–2333. AAAI Press, 2015.
[115] Manuel R. Vargas, Beatriz S. L. P. de Lima, and Alexandre G. Evsukoff. Deep learning for stock marketprediction from financial news articles. In 2017 IEEE International Conference on ComputationalIntelligence and Virtual Environments for Measurement Systems and Applications (CIVEMSA). IEEE,June 2017.
[116] Che-Yu Lee and Von-Wun Soo. Predict stock price with financial news based on recurrent convolu-tional neural networks. In 2017 Conference on Technologies and Applications of Artificial Intelligence(TAAI). IEEE, December 2017.
[117] Hitoshi Iwasaki and Ying Chen. Topic sentiment asset pricing with dnn supervised learning. SSRNElectronic Journal, 2018.
[118] Sushree Das, Ranjan Kumar Behera, Mukesh Kumar, and Santanu Kumar Rath. Real-time sentimentanalysis of twitter streaming data for stock prediction. Procedia Computer Science, 132:956–964, 2018.
[119] Jiahong Li, Hui Bu, and Junjie Wu. Sentiment-aware stock market prediction: A deep learningmethod. In 2017 International Conference on Service Systems and Service Management. IEEE, June2017.
[120] Zhongshengz. Measuring financial crisis index for risk warning through analysis of social network.Master’s thesis, 2018.
[121] Janderson B. Nascimento and Marco Cristo. The impact of structured event embeddings on scalablestock forecasting models. In Proceedings of the 21st Brazilian Symposium on Multimedia and the Web- WebMedia15. ACM Press, 2015.
[122] Songqiao Han, Xiaoling Hao, and Hailiang Huang. An event-extraction approach for business analysisfrom online chinese news. Electronic Commerce Research and Applications, 28:244–260, March 2018.
[123] Wei Bao, Jun Yue, and Yulei Rao. A deep learning framework for financial time series using stackedautoencoders and long-short term memory. PLOS ONE, 12(7):e0180944, July 2017.
[124] A.K. Parida, R. Bisoi, and P.K. Dash. Chebyshev polynomial functions based locally recurrent neuro-fuzzy information system for prediction of financial and energy market data. The Journal of Financeand Data Science, 2(3):202–223, September 2016.
[125] Thomas Fischer and Christopher Krauss. Deep learning with long short-term memory networks forfinancial market predictions. European Journal of Operational Research, 270(2):654–669, October2018.
[126] Philip Widegren. Deep learning-based forecasting of financial assets. Master’s thesis, KTH, Mathe-matical Statistics, 2017.
[127] Anastasia Borovykh, Sander Bohte, and Cornelis W. Oosterlee. Dilated convolutional neural networksfor time series forecasting. Journal of Computational Finance, October 2018.
58
[128] Khaled A. Althelaya, El-Sayed M. El-Alfy, and Salahadin Mohammed. Evaluation of bidirectional lstmfor short-and long-term stock market prediction. In 2018 9th International Conference on Informationand Communication Systems (ICICS). IEEE, April 2018.
[129] Alexiei Dingli and Karl Sant Fournier. Financial time series forecasting–a deep learning approach.Int. J. Mach. Learn. Comput, 7(5):118–122, 2017.
[130] Ajit Kumar Rout, P.K. Dash, Rajashree Dash, and Ranjeeta Bisoi. Forecasting financial time seriesusing a low complexity recurrent neural network and evolutionary learning approach. Journal of KingSaud University - Computer and Information Sciences, 29(4):536–552, October 2017.
[131] Gyeeun Jeong and Ha Young Kim. Improving financial trading decisions using deep q-learning: Pre-dicting the number of shares, action strategies, and transfer learning. Expert Systems with Applications,117:125–138, March 2019.
[132] Yujin Baek and Ha Young Kim. Modaugnet: A new forecasting framework for stock market indexvalue with an overfitting prevention lstm module and a prediction lstm module. Expert Systems withApplications, 113:457–480, December 2018.
[133] Magnus Hansson. On stock return prediction with lstm networks. 2017.[134] Aaron Elliot and Cheng Hua Hsu. Time series prediction : Predicting stock price, 2017.[135] Zhixi Li and Vincent Tam. Combining the real-time wavelet denoising and long-short-term-memory
neural network for predicting stock indexes. In 2017 IEEE Symposium Series on ComputationalIntelligence (SSCI). IEEE, November 2017.
[136] Sima Siami-Namini and Akbar Siami Namin. Forecasting economics and financial time series: Arimavs. lstm, 2018.
[137] Tsung-Jung Hsieh, Hsiao-Fen Hsiao, and Wei-Chang Yeh. Forecasting stock markets using wavelettransforms and recurrent neural networks: An integrated system based on artificial bee colony algo-rithm. Applied Soft Computing, 11(2):2510–2525, March 2011.
[138] Luna M. Zhang. Genetic deep neural networks using different activation functions for financial datamining. In 2015 IEEE International Conference on Big Data (Big Data). IEEE, October 2015.
[139] Stelios D. Bekiros. Irrational fads, short-term memory emulation, and asset predictability. Review ofFinancial Economics, 22(4):213–219, November 2013.
[140] Xiongwen Pang, Yanqiang Zhou, Pan Wang, Weiwei Lin, and Victor Chang. An innovative neuralnetwork approach for stock market prediction. The Journal of Supercomputing, January 2018.
[141] Yue Deng, Feng Bao, Youyong Kong, Zhiquan Ren, and Qionghai Dai. Deep direct reinforcementlearning for financial signal representation and trading. IEEE Transactions on Neural Networks andLearning Systems, 28(3):653–664, March 2017.
[142] Bing Yang, Zi-Jia Gong, and Wenqi Yang. Stock market index prediction using deep neural networkensemble. In 2017 36th Chinese Control Conference (CCC). IEEE, July 2017.
[143] Oussama Lachiheb and Mohamed Salah Gouider. A hierarchical deep neural network design for stockreturns prediction. Procedia Computer Science, 126:264–272, 2018.
[144] Bang Xiang Yong, Mohd Rozaini Abdul Rahim, and Ahmad Shahidan Abdullah. A stock markettrading system using deep neural network. In Communications in Computer and Information Science,pages 356–364. Springer Singapore, 2017.
[145] Serdar Yümlü, Fikret S. Gürgen, and Nesrin Okay. A comparison of global, recurrent and smoothed-piecewise neural models for istanbul stock exchange (ise) prediction. Pattern Recognition Letters, 26(13):2093–2103, October 2005.
[146] Hongju Yan and Hongbing Ouyang. Financial time series prediction based on deep learning. WirelessPersonal Communications, 102(2):683–700, December 2017.
[147] Takahashi. Long memory and predictability in financial markets. Annual Conference of the JapaneseSociety for Artificial Intelligence, 2017.
[148] Melike Bildirici, Elçin A. Alp, and Özgür Ö. Ersin. Tar-cointegration neural network model: Anempirical analysis of exchange rates and stock returns. Expert Systems with Applications, 37(1):2–11,January 2010.
[149] Ioannis Psaradellis and Georgios Sermpinis. Modelling and trading the u.s. implied volatility indices.
59
evidence from the vix, vxn and vxd indices. International Journal of Forecasting, 32(4):1268–1283,October 2016.
[150] Jiaqi Chen, Wenbo Wu, and Michael Tindall. Hedge fund return prediction and fund selection: Amachine-learning approach. Occasional Papers 16-4, Federal Reserve Bank of Dallas, November 2016.
[151] Marios Mourelatos, Christos Alexakos, Thomas Amorgianiotis, and Spiridon Likothanassis. Financialindices modelling and trading utilizing deep learning techniques: The athens se ftse/ase large cap usecase. In 2018 Innovations in Intelligent Systems and Applications (INISTA). IEEE, July 2018.
[152] Yuzhou Chen, Junji Wu, and Hui Bu. Stock market embedding and prediction: A deep learningmethod. In 2018 15th International Conference on Service Systems and Service Management (IC-SSSM). IEEE, July 2018.
[153] Weiyu Si, Jinke Li, Peng Ding, and Ruonan Rao. A multi-objective deep reinforcement learningapproach for stock index future’s intraday trading. In 2017 10th International Symposium on Com-putational Intelligence and Design (ISCID). IEEE, December 2017.
[154] Weiling Chen, Chai Kiat Yeo, Chiew Tong Lau, and Bu Sung Lee. Leveraging social media news topredict stock index movement using rnn-boost. Data & Knowledge Engineering, August 2018.
[155] Matthew Francis Dixon, Diego Klabjan, and Jin Hoon Bang. Classification-based financial marketsprediction using deep neural networks. SSRN Electronic Journal, 2016.
[156] Fernando Sánchez Lasheras, Francisco Javier de Cos Juez, Ana Suárez Sánchez, Alicja Krzemień, andPedro Riesgo Fernández. Forecasting the comex copper spot price by means of neural networks andarima models. Resources Policy, 45:37–43, September 2015.
[157] Yang Zhao, Jianping Li, and Lean Yu. A deep learning ensemble approach for crude oil price fore-casting. Energy Economics, 66:9–16, August 2017.
[158] Yanhui Chen, Kaijian He, and Geoffrey K.F. Tso. Forecasting crude oil prices: a deep learning basedmodel. Procedia Computer Science, 122:300–307, 2017.
[159] Jonathan Doering, Michael Fairbank, and Sheri Markose. Convolutional neural networks appliedto high-frequency market microstructure forecasting. In 2017 9th Computer Science and ElectronicEngineering (CEEC). IEEE, September 2017.
[160] P. Tino, C. Schittenkopf, and G. Dorffner. Financial volatility trading using recurrent neural networks.IEEE Transactions on Neural Networks, 12(4):865–874, July 2001.
[161] Ruoxuan Xiong, Eric P. Nichols, and Yuan Shen. Deep learning stock volatility with google domestictrends, 2015.
[162] Yu-Long Zhou, Ren-Jie Han, Qian Xu, and Wei-Ke Zhang. Long short-term memory networks forcsi300 volatility prediction with baidu search volume. 2018.
[163] Ha Young Kim and Chang Hyun Won. Forecasting the volatility of stock price index: A hybridmodel integrating lstm with multiple garch-type models. Expert Systems with Applications, 103:25–37, August 2018.
[164] Nikolay Nikolaev, Peter Tino, and Evgueni Smirnov. Time-dependent series variance learning withrecurrent mixture density networks. Neurocomputing, 122:501–512, December 2013.
[165] Campbell R. Harvey. Forecasts of economic growth from the bond and stock markets. FinancialAnalysts Journal, 45(5):38–45, 1989.
[166] Daniele Bianchi, Matthias Büchner, and Andrea Tamoni. Bond risk premia with machine learning.SSRN Electronic Journal, September 2018.
[167] Venketas Warren. Forex market size: A traders advantage, 2019.[168] Ren Zhang, Furao Shen, and Jinxi Zhao. A model with fuzzy granulation and deep belief networks
for exchange rate forecasting. In 2014 International Joint Conference on Neural Networks (IJCNN).IEEE, July 2014.
[169] Jing Chao, Furao Shen, and Jinxi Zhao. Forecasting exchange rate with deep belief networks. In The2011 International Joint Conference on Neural Networks. IEEE, July 2011.
[170] Jing Zheng, Xiao Fu, and Guijun Zhang. Research on exchange rate forecasting based on deep beliefnetwork. Neural Computing and Applications, May 2017.
[171] Furao Shen, Jing Chao, and Jinxi Zhao. Forecasting exchange rate using deep belief networks and
60
conjugate gradient method. Neurocomputing, 167:243–253, November 2015.[172] Hua Shen and Xun Liang. A time series forecasting model based on deep learning integrated algorithm
with stacked autoencoders and svr for fx prediction. In ICANN, 2016.[173] Georgios Sermpinis, Jason Laws, Andreas Karathanasopoulos, and Christian L. Dunis. Forecasting
and trading the eur/usd exchange rate with gene expression and psi sigma neural networks. ExpertSystems with Applications, 39(10):8865–8877, August 2012.
[174] Georgios Sermpinis, Christian Dunis, Jason Laws, and Charalampos Stasinakis. Forecasting and trad-ing the eur/usd exchange rate with stochastic neural network combination and time-varying leverage.Decision Support Systems, 54(1):316–329, December 2012.
[175] Georgios Sermpinis, Charalampos Stasinakis, and Christian Dunis. Stochastic and genetic neuralnetwork combinations in trading and hybrid time-varying leverage effects. Journal of InternationalFinancial Markets, Institutions and Money, 30:21–54, May 2014.
[176] Bo SUN and Chi XIE. Rmb exchange rate forecasting in the context of the financial crisis. SystemsEngineering - Theory & Practice, 29(12):53–64, December 2009.
[177] Nijole Maknickiene and Algirdas Maknickas. Financial market prediction system with evolino neuralnetwork and deplhi method. Journal of Business Economics and Management, 14(2):403–413, May2013.
[178] Nijole Maknickiene, Aleksandras Vytautas Rutkauskas, and Algirdas Maknickas. Investigation offinancial market prediction by recurrent neural network. 2014.
[179] Luca Di Persio and Oleksandr Honchar. Artificial neural networks approach to the forecast of stockmarket price movements. International Journal of Economics and Management Systems, (1):158–162,2016.
[180] Jerzy Korczak and Marcin Hernes. Deep learning for financial time series forecasting in a-tradersystem. In Proceedings of the 2017 Federated Conference on Computer Science and InformationSystems. IEEE, September 2017.
[181] Gonçalo Duarte Lima Freire Lopes. Deep learning for market forecasts. 2018.[182] Sean McNally, Jason Roche, and Simon Caton. Predicting the price of bitcoin using machine learn-
ing. In 2018 26th Euromicro International Conference on Parallel, Distributed and Network-basedProcessing (PDP). IEEE, March 2018.
[183] Sanjiv Das, Karthik Mokashi, and Robbie Culkin. Are markets truly efficient? experiments usingdeep learning algorithms for market movement prediction. Algorithms, 11(9):138, September 2018.
[184] Ariel Navon and Yosi Keller. Financial time series prediction using deep learning, 2017.[185] E.W. Saad, D.V. Prokhorov, and D.C. Wunsch. Comparative study of stock trend prediction using
time delay, recurrent and probabilistic neural networks. IEEE Transactions on Neural Networks, 9(6):1456–1470, 1998.
[186] Luca Di Persio and Oleksandr Honchar. Recurrent neural networks approach to the financial forecastof google assets. International Journal of Mathematics and Computers in Simulation, 11:713, 2017.
[187] Guizhu Shen, Qingping Tan, Haoyu Zhang, Ping Zeng, and Jianjun Xu. Deep learning with gatedrecurrent unit networks for financial sequence predictions. Procedia Computer Science, 131:895–903,2018.
[188] Jou-Fan Chen, Wei-Lun Chen, Chun-Ping Huang, Szu-Hao Huang, and An-Pin Chen. Financial time-series data analysis using deep convolutional neural networks. In 2016 7th International Conferenceon Cloud Computing and Big Data (CCBD). IEEE, November 2016.
[189] Omer Berat Sezer and Ahmet Murat Ozbayoglu. Financial trading model with stock bar chart imagetime series with deep convolutional neural networks. arXiv preprint arXiv:1903.04610, 2019.
[190] Feng Zhou, Hao min Zhou, Zhihua Yang, and Lihua Yang. Emd2fnn: A strategy combining empiricalmode decomposition and factorization machine based neural network for stock market trend prediction.Expert Systems with Applications, 115:136–151, 2019.
[191] Kristiina Ausmees, Slobodan Milovanovic, Fredrik Wrede, and Afshin Zafari. Taming deep beliefnetworks. 2017.
[192] Kamran Raza. Prediction of stock market performance by using machine learning techniques. In 2017
61
International Conference on Innovations in Electrical Engineering and Computational Technologies(ICIEECT). IEEE, April 2017.
[193] Omer Berat Sezer, Murat Ozbayoglu, and Erdogan Dogdu. A deep neural-network based stock tradingsystem based on evolutionary optimized technical analysis parameters. Procedia Computer Science,114:473–480, 2017.
[194] Qiubin Liang, Wenge Rong, Jiayi Zhang, Jingshuang Liu, and Zhang Xiong. Restricted boltzmannmachine based stock market trend prediction. In 2017 International Joint Conference on NeuralNetworks (IJCNN). IEEE, May 2017.
[195] Luigi Troiano, Elena Mejuto Villa, and Vincenzo Loia. Replicating a trading strategy by means oflstm for financial industry applications. IEEE Transactions on Industrial Informatics, 14(7):3226–3234, July 2018.
[196] David M. Q. Nelson, Adriano C. M. Pereira, and Renato A. de Oliveira. Stock markets price movementprediction with lstm neural networks. In 2017 International Joint Conference on Neural Networks(IJCNN). IEEE, May 2017.
[197] Yuan Song and Yingnian Wu. Stock trend prediction: Based on machine learning methods. Master’sthesis, 2018.
[198] M. Ugur Gudelek, S. Arda Boluk, and A. Murat Ozbayoglu. A deep learning based stock tradingmodel with 2-d cnn trend detection. In 2017 IEEE Symposium Series on Computational Intelligence(SSCI). IEEE, November 2017.
[199] Omer Berat Sezer and Ahmet Murat Ozbayoglu. Algorithmic financial trading with deep convolutionalneural networks: Time series to image conversion approach. Applied Soft Computing, 70:525–538,September 2018.
[200] Hakan Gunduz, Yusuf Yaslan, and Zehra Cataltepe. Intraday prediction of borsa istanbul using convo-lutional neural networks and feature correlations. Knowledge-Based Systems, 137:138–148, December2017.
[201] Yifu Huang, Kai Huang, Yang Wang, Hao Zhang, Jihong Guan, and Shuigeng Zhou. Exploiting twittermoods to boost financial trend prediction based on deep network models. In Intelligent ComputingMethodologies, pages 449–460. Springer International Publishing, 2016.
[202] Yangtuo Peng and Hui Jiang. Leverage financial news to predict stock price movements using wordembeddings and deep neural networks. In Proceedings of the 2016 Conference of the North AmericanChapter of the Association for Computational Linguistics: Human Language Technologies. Associationfor Computational Linguistics, 2016.
[203] Huy D. Huynh, L. Minh Dang, and Duc Duong. A new model for stock price movements predictionusing deep neural network. In Proceedings of the Eighth International Symposium on Information andCommunication Technology - SoICT 2017. ACM Press, 2017.
[204] L. Minh Dang, Abolghasem Sadeghi-Niaraki, Huy D. Huynh, Kyungbok Min, and Hyeonjoon Moon.Deep learning approach for short-term stock trends prediction based on two-stream gated recurrentunit network. IEEE Access, pages 1–1, 2018.
[205] Ishan Verma, Lipika Dey, and Hardik Meisheri. Detecting, quantifying and accessing impact of newsevents on indian stock indices. In Proceedings of the International Conference on Web Intelligence -WI17. ACM Press, 2017.
[206] Leonardo dos Santos Pinheiro and Mark Dras. Stock market prediction with deep learning: Acharacter-based neural language model for event-based trading. In Proceedings of the AustralasianLanguage Technology Association Workshop 2017, pages 6–15, 2017.
[207] Jordan Prosky, Xingyou Song, Andrew Tan, and Michael Zhao. Sentiment predictability for stocks.CoRR, abs/1712.05785, 2017.
[208] Yang Liu, Qingguo Zeng, Huanrui Yang, and Adrian Carrio. Stock price movement prediction fromfinancial news with deep learning and knowledge graph embedding. In Knowledge Management andAcquisition for Intelligent Systems, pages 102–113. Springer International Publishing, 2018.
[209] Akira Yoshihara, Kazuki Fujikawa, Kazuhiro Seki, and Kuniaki Uehara. Predicting stock markettrends by recurrent deep neural networks. In Lecture Notes in Computer Science, pages 759–769.
62
Springer International Publishing, 2014.[210] Lei Shi, Zhiyang Teng, Le Wang, Yue Zhang, and Alexander Binder. Deepclue: Visual interpretation
of text-based deep stock prediction. IEEE Transactions on Knowledge and Data Engineering, pages1–1, 2018.
[211] Xi Zhang, Yunjia Zhang, Senzhang Wang, Yuntao Yao, Binxing Fang, and Philip S. Yu. Improvingstock market prediction via heterogeneous information fusion. Knowledge-Based Systems, 143:236–247,March 2018.
[212] Ziniu Hu, Weiqing Liu, Jiang Bian, Xuanzhe Liu, and Tie-Yan Liu. Listening to chaotic whispers:A deep learning framework for news-oriented stock trend prediction. In Proceedings of the EleventhACM International Conference on Web Search and Data Mining, WSDM ’18, pages 261–269, NewYork, NY, USA, 2018. ACM.
[213] Qili Wang, Wei Xu, and Han Zheng. Combining the wisdom of crowds and technical analysis forfinancial market prediction using deep random subspace ensembles. Neurocomputing, 299:51–61, July2018.
[214] Takashi Matsubara, Ryo Akita, and Kuniaki Uehara. Stock price prediction by deep neural generativemodel of news articles. IEICE Transactions on Information and Systems, E101.D(4):901–908, 2018.
[215] Xiaodong Li, Jingjing Cao, and Zhaoqing Pan. Market impact analysis via deep learned architectures.Neural Computing and Applications, March 2018.
[216] Avraam Tsantekidis, Nikolaos Passalis, Anastasios Tefas, Juho Kanniainen, Moncef Gabbouj, andAlexandros Iosifidis. Using deep learning to detect price change indications in financial markets. In2017 25th European Signal Processing Conference (EUSIPCO). IEEE, August 2017.
[217] Justin Sirignano and Rama Cont. Universal features of price formation in financial markets: Perspec-tives from deep learning. SSRN Electronic Journal, 2018.
[218] Przemyslaw Buczkowski. Predicting stock trends based on expert recommendations using gru/lstmneural networks. In Lecture Notes in Computer Science, pages 708–717. Springer International Pub-lishing, 2017.
[219] Avraam Tsantekidis, Nikolaos Passalis, Anastasios Tefas, Juho Kanniainen, Moncef Gabbouj, andAlexandros Iosifidis. Forecasting stock prices from the limit order book using convolutional neuralnetworks. In 2017 IEEE 19th Conference on Business Informatics (CBI). IEEE, July 2017.
[220] Thomas G Thomas Günter Fischer, Christopher Krauss, and Alexander Deinert. Statistical arbitragein cryptocurrency markets. Journal of Risk and Financial Management, 12, 2019.
63
Related Documents