2021 Annual Comprehensive FINANCIAL REPORT For fiscal year ended August 31, 2021 Northside Independent School District San Antonio, Texas

Welcome message from author
This document is posted to help you gain knowledge. Please leave a comment to let me know what you think about it! Share it to your friends and learn new things together.
Transcript
2021Annual Comprehensive
FINANCIAL REPORTFor fiscal year ended August 31, 2021
Northside Independent School DistrictSan Antonio, Texas


NORTHSIDE INDEPENDENT SCHOOL DISTRICT San Antonio, Texas
ANNUAL COMPREHENSIVE FINANCIAL REPORT
Year Ended August 31, 2021
BOARD OF SCHOOL TRUSTEES
Karen Freeman President Gerald B. Lopez Vice-President Joseph H. Medina Secretary M’Lissa M. Chumbley Trustee Robert Blount, Jr. Trustee Corinne Saldana Trustee Carol Harle, Ph.D. Trustee
Prepared by the Office of Business and Finance
Dr. Rene Barajas
Deputy Superintendent Business and Finance
Tiffany Contreras
Assistant Superintendent Budget and Finance
Susan Rios, CPA
Director of Accounting

(This page intentionally left blank)
NORTHSIDE INDEPENDENT SCHOOL DISTRICT San Antonio, Texas
ANNUAL COMPREHENSIVE FINANCIAL REPORT August 31, 2021
Table of Contents
INTRODUCTORY SECTION Page Exhibit Transmittal Letter ............................................................................................................ i Certificate of Board…………………………………………….…… ........................... ….... viii Certificate of Achievement ............................................................................................... ix Administrative Organization ............................................................................................... x Appointed Officials and Advisors ...................................................................................... xi School Locator Map ........................................................................................................ xii FINANCIAL SECTION INDEPENDENT AUDITOR’S REPORT……………………… ............................... ………. 1 MANAGEMENT’S DISCUSSION AND ANALYSIS .......................................................... 4 BASIC FINANCIAL STATEMENTS Government-wide Financial Statements: Statement of Net Position ........................................................................................... 15 A-1 Statement of Activities ................................................................................................. 16 B-1 Governmental Fund Financial Statements: Balance Sheet – Governmental Funds ....................................................................... 18 C-1 Reconciliation of the Governmental Funds Balance Sheet to the Statement of Net Position ............................................................................ 21 C-2 Statement of Revenues, Expenditures and Changes in Fund Balance – Governmental Funds ................................................ 22 C-3 Reconciliation of the Governmental Funds Statement of Revenues, Expenditures, and Changes in Fund Balance
to the Statement of Activities ................................................................................. 24 C-4 Proprietary Fund Financial Statements: Statement of Net Position – Proprietary Funds .......................................................... 25 D-1 Statement of Revenues, Expenses, and Changes in Net Position – Proprietary Funds ....................................................................... 26 D-2 Statement of Cash Flows – Proprietary Funds ........................................................... 27 D-3 Fiduciary Fund Financial Statements: Statement of Fiduciary Assets and Liabilities ............................................................. 28 E-1 Statement of Changes in Fiduciary Net Position…………………………………….…. 29 E-2
NORTHSIDE INDEPENDENT SCHOOL DISTRICT San Antonio, Texas
ANNUAL COMPREHENSIVE FINANCIAL REPORT August 31, 2021
Table of Contents (Continued)
FINANCIAL SECTION – CONTINUED Page Exhibit Notes to Financial Statements ......................................................................................... 30 REQUIRED SUPPLEMENTARY INFORMATION Schedule of Revenues, Expenditures, and Changes in Fund Balance - Budget and Actual – General Fund ............................................... 68 F-1 Schedule of the District’s Proportionate Share of the Net Pension Liability Teacher Retirement System of Texas ........................................................... 70 F-2 Schedule of District Contributions Teacher Retirement System of Texas ......................................................................................................... 72 F-3 Schedule of the District’s Proportionate Share of the Net OPEB Liability of a Cost-sharing Multiple Employer OPEB Plan Teacher Retirement System of Texas ........................................................................ 74 F-4 Schedule of District Contributions to the OPEB Plan Teacher Retirement System of Texas ........................................................................ 75 F-5 OTHER SUPPLEMENTARY INFORMATION Schedule of Revenues, Expenditures, and Changes in Fund Balance - Budget and Actual – Debt Service Fund ....................................... 78 F-6 Schedule of Revenues, Expenditures, and Changes in Fund Balance - Budget and Actual – Child Nutrition Fund ..................................... 79 F-7 Schedule of Delinquent Taxes Receivable ...................................................................... 80 F-8 Schedule of Bonds Payable ............................................................................................. 82 F-9 COMBINING FINANCIAL STATEMENTS
NON-MAJOR GOVERNMENTAL FUNDS – Special Revenue Funds Combining Balance Sheet ..................................................................................... 88 G-1 Combining Statement of Revenues, Expenditures, and Changes in Fund Balances .............................................................................. 96 G-2
PROPRIETARY FUND TYPES Combining Statement of Net Position – Internal Service Funds ......................... 104 H-1 Combining Statement of Revenues, Expenses, and Changes in Net Position – Internal Service Funds ......................................... 106 H-2 Combining Statement of Cash Flows – Internal Service Funds .......................... 108 H-3

NORTHSIDE INDEPENDENT SCHOOL DISTRICT San Antonio, Texas
ANNUAL COMPREHENSIVE FINANCIAL REPORT August 31, 2021
Table of Contents (Continued)
STATISTICAL SECTION FINANCIAL TRENDS Net Position by Component ........................................................................................... 114 K-1 Changes in Net Position ................................................................................................. 116 K-2 Fund Balances, Governmental Funds ............................................................................. 118 K-3 Changes in Fund Balances, Governmental Funds ......................................................... 120 K-4 REVENUE CAPACITY Taxable Assessed Value of Property .............................................................................. 126 K-5 Tax Rates, Tax Levies, and Tax Collections ................................................................... 128 K-6 Schedule of Ten Principal Taxpayers ............................................................................. 130 K-7 Property Tax Rates – All Overlapping Governments ...................................................... 132 K-8 DEBT CAPACITY Ratio of Net General Obligation Bonded Debt to Assessed Value and Net General Obligation Bonded Debt per Average Daily Membership .......................................... 136 K-9 Ratio of Annual Debt Service Expenditures for General Obligation Bonded Debt to Total General Expenditures ............................................ 138 K-10 Computation of Direct and Estimated Overlapping Bonded Debt General Obligation Bonds .......................................................................................... 139 K-11 Computation of Legal Debt Margin General Obligation Bonds ....................................... 140 K-12
NORTHSIDE INDEPENDENT SCHOOL DISTRICT
San Antonio, Texas
ANNUAL COMPREHENSIVE FINANCIAL REPORT August 31, 2021
Table of Contents (Continued)
STATISTICAL SECTION - CONTINUED Page Exhibit DEMOGRAPHIC AND ECONOMIC INFORMATION Demographic Statistics .................................................................................................... 142 K-13 Demographic and Economic Statistics ............................................................................ 144 K-14 Schedule of Principal Employers. ................................................................................... 145 K-15 Average Daily Attendance and Average Daily Membership ........................................... 146 K-16 OPERATING INFORMATION Operating Statistics ......................................................................................................... 148 K-17 Construction and Property Value .................................................................................... 150 K-18 Miscellaneous Statistics .................................................................................................. 151 K-19 School Building Information ............................................................................................ 152 K-20 Full-Time Equivalents (FTEs) – Staff Information ........................................................... 161 K-21 FEDERAL AWARDS SECTION Independent Auditor’s Report on Internal Control Over Financial
Reporting and on Compliance and Other Matters Based on an Audit of Financial Statements Performed in Accordance With Government Auditing Standards…………………… ..................................... 165 Independent Auditor’s Report on Compliance for Each Major Federal Program and Report on Internal Control Over Compliance as Required by the Uniform Guidance ...................................................................... 167 Schedule of Findings and Questioned Costs…………………..……… ............................ 169 Schedule of Prior Audit Findings ..................................................................................... 170 Schedule of Expenditures of Federal Awards ................................................................. 171 L-1 Notes to the Schedule of Expenditures of Federal Awards ............................................ 175
INTRODUCTORY SECTION

January 25, 2022
Ms. Karen Freeman, President Members of the Board of School Trustees Northside Independent School District San Antonio, Texas
Dear Ms. Freeman and Board Members:
The Texas Education Code requires that all school districts file and publish a complete set of financial statements with the Texas Education Agency (“TEA”) within 150 days of the close of each fiscal year. The financial statements must be presented in conformity with accounting principles generally accepted in the United States of America. The financial statements must be audited by a firm of licensed certified public accountants in accordance with auditing standards generally accepted in the United States of America and the standards applicable to financial audits contained in Government Auditing Standards, issued by the Comptroller General of the United States. Pursuant to these requirements, we hereby issue the Annual Financial Report (AFR) of the Northside Independent School District (“District” or “Northside”) for the year ended August 31, 2021.
This report consists of management’s representations concerning the financial condition and operations of the District. Accordingly, management assumes full responsibility for the completeness and reliability of all of the information presented in this report. To provide a reasonable basis for making these representations, management of the District has established a comprehensive internal control framework that is designed both to help protect the District’s assets from loss, theft, or misuse and to compile sufficient reliable information for the presentation of the District’s financial statements in conformity with accounting principles generally accepted in the United States of America. Because the cost of internal controls should not outweigh their benefits, the District’s comprehensive framework of internal controls has been designed to provide reasonable rather than absolute assurance that the financial statements will be free from material misstatement.
Weaver and Tidwell, L.L.P., a firm of licensed certified public accountants, has audited the financial statements of the District. The goal of the independent audit was to provide reasonable assurance that the financial statements of the District for the fiscal year ended August 31, 2021 are free of material misstatement. The independent audit involved examining, on a test basis, evidence supporting the amounts and disclosures in the basic financial statements; assessing the accounting principles used and significant estimates made by management; and evaluating the overall basic financial statement presentation. The independent auditor concluded, based upon the audit, that there was reasonable basis for rendering an unmodified opinion that the District’s basic financial statements for the fiscal year ended August 31, 2021 are fairly presented in conformity with accounting principles generally accepted in the United States of America. The independent auditors’ report is presented as the first component of the financial section of this report.
The independent audit of the basic financial statements of the District was part of a broader, federally mandated “Single Audit” designed to meet the special needs of federal grantor agencies. The standards governing Single Audit engagements require the independent auditor to report not only on the fair presentation of the basic financial statements, but also on the audited government’s internal controls and compliance with legal requirements, with emphasis on the administration of federal awards. These reports are presented as part of the AFR’s Federal Awards Section. Findings associated with the Single Audit will be found in the Schedule of Findings and Questioned Costs along with a Corrective Action Plan from District Management.
The Governmental Accounting Standards Board (GASB) requires that management provide a narrative introduction, overview, and analysis to accompany the basic financial statements in the form of the Management’s Discussion and Analysis (“MD&A”). This letter of transmittal is designed to complement the MD&A and should be read in conjunction with it. The District’s MD&A can be found immediately following the Independent Auditor’s Report.
i

DISTRICT PROFILE
Established in 1949 by the consolidation of 12 rural schools, today, the District is the fourth largest school system in Texas. The District is located in the rapidly growing northwest quadrant of Bexar County and includes portions of Medina and Bandera counties and the City of San Antonio. The District includes 355 square miles of urban landscape, suburban growth, and rural Texas hill country.
Northside enrollment is 101,575 students for 2021-22. The District prides itself on its diversity. Student demographics for 2020-21 are: 68.50% Hispanic, 16.79% White, 6.85% African American, 3.57% Asian, 0.19% Native Hawaiian/Other Pacific Islander, 0.12% Native American, and 3.98% of two or more races. About 48.5% of students are considered economically disadvantaged.
Residents of the District elect members of the Board of Trustees to four-year terms from each of seven single-member districts. The Trustee seats are up for election on a rotating basis on the second Saturday in May. Vacancies may be filled by appointment until the next election. Trustees annually elect Board officers, including President, Vice President, and Secretary. The Trustees serve the citizens of San Antonio's largest school system without compensation.
The District provides a full range of educational services for grade levels Pre-K through 12, in addition to educational programs that begin at infancy for some children and extend through age 22 for others. These programs include regular and enriched academic education, special education for students with disabilities, occupational and vocational education, bilingual instruction for students with limited English proficiency, and specialized instruction for economically disadvantaged students.
Academically talented students may seek challenges in, pre-Advanced Placement, Advanced Placement, and dual credit courses in English, Mathematics, Social Studies, and Science and other subjects in grades 6-12. In addition, students may study five different foreign languages. The District provides programs for gifted students in a variety of settings in grades K-12 that focus on the development of higher-level and cognitive thinking skills.
• The District offers two middle school and eight high school magnet programs that provide specializedcurricula and career-oriented classes for students. The high school programs include Communication ArtsHigh School, Construction Careers Academy, Health Careers High School, John Jay Science andEngineering Academy, Marshall Law and Medical Services Magnet School, the Northside School ofInnovation, Technology, Entrepreneurship (NSITE) High School, Agriculture Science and TechnologyAcademy, and the CAST Teach High School. The district opened its first middle school magnet program, theSTEM-focused Jones Magnet School in 2020 and opened the second middle school magnet, Zachry MagnetSchool, in 2021.
In addition, the District is committed to life-long education and offers one of the largest adult and community education programs in Bexar County, as well as numerous outreach programs for students in special circumstances (i.e., teenage mothers, at-risk students, dropouts, and the homeless). More than 39,000 people are served by the Adult and Community Education Department, which also offers career advancement and Learning Tree after school care programs, and operates one of the largest summer education programs in San Antonio.
District Accomplishments
• More than 7,000 students received diplomas in June 2021 at 12 graduation ceremonies. The Class of 2021earned $170 million in college scholarships and 55,400 hours of college credit.
• Northside teachers and administrators are consistently recognized at local, state, and national levels.Gustavo Trevino, a Communication Applications teacher from Neff MS, was a 2021 winner of the Trinity Prizefor Excellence in Teaching. Miguel Mendez, a special education teacher from the Holmgreen Center, was afinalist for Texas Secondary Teacher of the Year. Fatima Aboueisha, a science teacher from Brandeis HS,was named a Texas finalist in the Presidential Awards for Math and Science Teaching Excellence. WilliamLee, a Latin teacher at Clark HS, was named the Texas Foreign Language Association Teacher of the Year.John Gunderson, an automotive technology teacher at Jay HS, was named a national winner in the HarborFreight Tools for Schools Prize for Teaching Excellence. Lou Medina, Stinson MS principal, was named theRegion 20 Middle School Principal of the Year by the Texas Association of Secondary Principals. Robert
ii
Harris, Harlan HS principal, was named Region 20 High School Principal of the Year by the Texas Association of Secondary Principals.
Innovative Initiatives
● Fifty-six elementary schools offer STEM Labs in the 2021-2022 school year. They’re staffed by certifiedteachers and serve all students on each campus on a rotating basis, similar to music, art, and physicaleducation.
● In the fall of 2021, 15,909 juniors took the PSAT for free during the school day at their home campus. Also,in the fall, 7,103 seniors took a free, school day SAT. It was the fifth year the Board-funded initiative wasoffered to District students.
● Northside ISD is committed to ensuring high-levels of teaching and learning and is focused on the continueduse of Professional Learning Communities district-wide.
Community Support
• Since 1995, voters have approved almost $4 billion in bonds to build new schools and make improvementsto existing schools. In May 2018, Northside voters approved an $848.91 million bond election, making it theeighth consecutive bond election voters have passed. Sixty-seven percent of the District’s $848.91 millionbond authorization will fund improvements to existing schools.
• The Northside Education Foundation (Foundation) was created in 1995. The mission of the Foundation is tofoster community involvement in innovative educational programs by generating and disbursing funds andother resources to provide enrichment for students of the Northside Independent School District. TheFoundation has been recognized as one of the Top 50 Education Foundations in the nation and has anendowment of $6.05 million.
• More than 39,000 people were served pre-COVID by the Adult and Community Education Department, whichalso offers career advancement and Learning Tree after school care programs, and operates one of thelargest summer education programs in San Antonio. During the fall and spring of school year 2021, all in-person activities ceased for the Adult and Community Education Department and offered only on-lineclasses. In the summer of 2021, in-person youth summer camps were offered serving a reduced number ofstudents. The Learning Tree After School program is serving approximately half of the students serviced pre-COVID.
Financial Stewardship
• The District is average in local tax commitment, above average in percent of budget devoted to instruction,and among the lowest in administrative cost-per student.
• The District has one of the lowest tax rates among Bexar County’s 16 school districts. With the passage ofHouse Bill 3 in the 2019 legislative session, state revenue for the District increased and the M&O rate for theDistrict decreased 7 cents. Even with the issuance of new debt, the District did not increase the I&S tax rate.
OUR MISSION
The Northside Independent School District and our community will provide innovative, high-quality, diverse learning experiences for all students in an ever-changing world.
OUR BELIEFS
• We believe public education is a bridge to creating productive members of society.
• We believe every individual is entitled to an emotionally and physically safe and respectful learningenvironment.
• We believe each student deserves equal and equitable access to a quality education.
• We believe a commitment to student success is a shared responsibility among students, parents, educators,and the community.
• We believe students learn best when they are active participants in their own learning.
iii
• We believe the more connected families are in the educational process, the more successful the student willbe.
• We believe meaningful relationships among parents, educators, and the community foster student success.
• We believe core academics, the arts, career & technology, electives, and extracurricular activities are crucialto a well-rounded education.
• We believe schools create conditions that prepare students to be critical thinkers and problem solvers.
FACTORS AFFECTING FINANCIAL CONDITION
The information presented in the financial statements is best understood when it is considered from the broader perspective of the specific environment within which the District operates.
Introduction
The District is located in the heart of a rapidly growing area in Bexar County. The District's appeal to families is due to factors such as excellent teachers, strong academics, and outstanding extracurricular programs. The District facilities provide functionality with aesthetically pleasing facades. As a family-friendly District, our emphasis is on children and families. The District also places great emphasis on a high quality work force and an employee-family culture.
Population
There are an estimated 676,000 people residing in the District and about 221,000 households. Enrollment in the District has been steadily growing since the 1990s, and recent trends show a stable enrollment around 103,151. Northside is the largest of 16 school districts in Bexar County.
San Antonio is the 7th largest city in the United States and boasts one of the fastest growing metropolitan areas. Bexar County population exceeded 1.7 million in the 2010 census, representing a 23% increase since 2000. This growth rate is also typical for the District and has resulted in opening more than 40 new schools in the last fifteen years.
Local Economy
The local economy prior to the pandemic remained strong with growth in major areas of the City’s high growth business sectors. The area economy maintained a history of in the aerospace, bioscience/healthcare, energy, information technology and manufacturing sectors. This growth had enabled unemployment rates in the area to remain below the state and national levels. Unemployment rates during the pandemic have increased but began to uptick near the end of the District’s fiscal year and trended above the national average.
Altogether, an estimated 9,200 large and small businesses are located in the District, including economic generators such as the South Texas Medical Center, which is home to dozens of hospitals, Valero Energy, USAA Texas based financial services organization, and Microsoft Corporation, the District’s largest taxpayer. Entertainment destinations, SeaWorld and Fiesta Texas, help draw tourists and residents to Northwest San Antonio.
The Westover Hills development includes major corporations like QVC, Citicorp, The American Funds Group, and Chase Manhattan. Ingram Park Mall, one of the area's largest shopping malls, with 1.1 million square feet, the sprawling and upscale Shops at La Cantera, and other major shopping centers are all located within the District. In addition, The Rim is a massive entertainment and shopping destination that brings thousands of visitors to the District and is still expanding. Northside’s major taxpayer resorts include the Hyatt Regency Hill Country Resort, The Eilan Hotel Resort and Spa, Hyatt Wild Oak Ranch, and La Cantera Hill Country Resort.
In addition to the 150 schools and facilities the District operates, northwest Bexar County is a higher education and research center magnet. The University of Texas at San Antonio, home to more than 34,000 undergraduate, graduate, and post-graduate students, is located in Northside. The University of Texas Health Science Center at San Antonio, with its medical, dental, nursing, and allied health schools, is also located in the District, as well as Northwest Vista College, part of the Alamo Community College District. Other large enterprises located within the District are the Southwest Research Institute, National Security Agency and the Texas Research Park.
iv
Access
The District has an excellent transportation system, with many major roads and highways traversing through it. Interstate Highway 10, which is the major east-west interstate highway in the southern United States, runs through the District. State Highway 151, which is a 10-mile, 4-lane, divided highway, also runs through the District. Both these highways provide quick access to Interstate Loop 410 and Texas State Highway Loop 1604 and link downtown San Antonio to the Northwest part of Bexar County. The Highway 151-Loop 1604 area is where most of the new housing within the District is being constructed.
THE REPORTING ENTITY
Northside Independent School District is an independent reporting entity clearly within the criteria established in Section 2100 of the Governmental Accounting Standards Board codification.
Internal and Budgetary Controls
The development and evaluation of the District's accounting system considers the adequacy of the internal control structure. The internal control structure is designed to provide reasonable, but not absolute, assurance regarding the safeguarding of assets against loss from unauthorized use or disposition, and the reliability of financial records for preparing financial statements and maintaining accountability for assets. The concept of reasonable assurance recognizes that the cost of controls should not exceed the benefits expected to be derived, and that the evaluation of costs and benefits requires estimates and judgments by management.
We believe that the District's accounting controls provide reasonable assurance that errors or irregularities that could be material to the financial statements are prevented or would be detected within a timely period by employees in the normal course of performing their assigned functions.
Budgetary controls are established by regulations of the Texas Education Agency and by District policy for all administrators with line item responsibility. TEA regulations set the level of budgetary control at the major functional expenditure level. Administrators have the responsibility to develop and manage their own program budgets once approved. Revisions within the categories are accepted upon request, but additions in amount or revisions between functions require recommendation of the Superintendent and approval by the Board of Trustees.
General Educational Functions
Principally, local taxes and state entitlements support general educational activities. Direct federal aid is nominal in the General Fund; however, the Special Revenue Fund receives most of its funding from Federal grants, which are distributed through the Texas Education Agency. General educational activities are accounted for in the General and Special Revenue Funds. State and federal grants or entitlements primarily support the Special Revenue Fund. They include support for the economically and academically disadvantaged, federal support for special and vocational education, and a variety of other projects as described in the Combining Statements.
Cash Management
The District’s cash position is reviewed daily and all idle cash is invested in accordance with the District’s investment policy. The District’s investment officers invest primarily in U.S. Government agency notes and local government investment pools. Total investments at August 31, 2021 were $733,234,212 and the average yield on investments was 0.12%. Yields on investments remain favorable compared to the three-month Treasury bill rate.
The District's investment policy is to protect principal and minimize credit and market risks while maintaining a competitive yield on its portfolio. Accordingly, deposits were either insured by federal depository insurance or collateralized. All collateral pledged to the District was held in the District’s name by the Federal Reserve in Boston, Massachusetts. Wells Fargo Securities holds investments owned by the District.
Risk Management
The purpose of Risk Management is to plan for the negative consequences of any decision, process, or action by using whatever means feasible to control the chance of financial loss. Effective risk management is a critical component of any sound organization. Every dollar spent on property damage, on-the-job injuries, liability claims, and insurance premiums is a dollar not spent for school district services.
The objectives of risk management are to:
1. ensure that District assets are protected and managed appropriately;
v
2. identify situations that may create liability and financial burden upon the District;
3. implement effective procedures to minimize and/or avoid loss exposures;
4. act as a resource and service center for all District employees.
The District also maintains a self-funded worker’s compensation program, property and casualty exposures and coverage, safety training and inspection program.
Worker’s Compensation Program
The District provides all employees with worker’s compensation coverage for injuries that occur in the course and scope of employment. Although the District is self-insured for this exposure, a third party administrator discharges the claims function of this program. The District also purchases excess worker’s compensation coverage through a commercial insurer in order to protect the District’s fund from catastrophic losses.
Property and Casualty Coverage
Commercial property and casualty policy (P&C) is purchased by the District to provide fire and extended coverage of all District permanent structures and their contents. Other P&C exposures insured are Boiler & Machinery, Underground Storage Tank Liability, Crime Coverage, Errors & Omissions Coverage, and numerous Fidelity Bonds. The District maintains self-insurance for Commercial Automobile Liability.
Safety Program
The District provides regular training to various campus personnel and employee groups throughout the District. Specific or targeted training is provided on the basis of need and at periodic intervals throughout the year. In addition, the use of inspections has allowed the District to identify unsafe acts or conditions, make necessary changes and prevent loss situations from occurring to others.
Northside Employee Benefits
Northside makes an array of benefits available through a Section 125 Cafeteria Plan to all regular employees who work 20 hours or more per week. Participation in the Cafeteria Plan allows for certain benefits to be deducted from the employee’s pay with tax-deferred money. Northside retirees are eligible for dental and vision benefits outside of the Section 125 Cafeteria Plan. The District subsidizes premiums for active employees based on the coverage tier selected (i.e., employee only, employee and spouse, employee and children, employee and family). The District does not subsidize retiree benefits.
Health Insurance Program The District offers its employees a suite of health benefit plans fully insured by UnitedHealthCare. A traditional PPO plan, an EPO plan, an HMO plan, and three high deductible plans are available. Employees who elect health coverage are also provided a $5,000 life insurance policy. Employees who do not elect health insurance are provided a $50,000 or $80,000 life insurance policy. Supplemental Employee Benefits
Other benefits offered are voluntary and supplemental in nature. The participant pays the total cost of these insurances. The supplemental benefits include dental, vision, employee/spouse/child term life, cancer, and critical illness insurance, as well as disability/income replacement, pre-paid legal, medical/dependent care, and health spending accounts.
Fiscal Strategic Planning
The District continues to be proactive in its strategic fiscal planning by requesting input from community members and staff. The priorities of the Strategic Plan focus on promoting community involvement; educating diverse learners; hiring, developing, and retaining quality staff; and promoting a safe environment for the students and staff.
Awards and Acknowledgments
The Government Finance Officers Association of the United States and Canada (GFOA) awarded a Certificate of Achievement for Excellence in Financial Reporting to Northside for the fiscal year ending August 31, 2020. This was the twenty-ninth consecutive year the District has received this award. In order to receive a Certificate of Achievement, a government unit must publish an easily readable and efficiently organized annual comprehensive
vi
financial report. This report must satisfy accounting principles generally accepted in the United States as well as applicable legal requirements.
A Certificate of Achievement is valid for a period of only one year. We believe our current annual comprehensive financial report continues to meet the Certificate of Achievement program's requirements, and we are submitting it to GFOA to determine its eligibility for another certificate.
Senate Bill 218 of the 77th Texas Legislature (2001) authorized the implementation of the Financial Integrity Rating System of Texas, officially known as Schools FIRST. This law requires each school district to prepare and distribute an annual financial management report and provide the public an opportunity to comment on the report at a public meeting. The primary goal of Schools FIRST is to improve the management of a school district's financial resources.
For seventeen years in a row, the District earned a “Superior Achievement” rating from the TEA. This is the highest possible rating under the Schools FIRST accountability system. Beginning in 2014-15, the TEA modified the ratings to a point system with a maximum of 100 points and a “Superior” rating for achieving a minimum of 90 points. In the latest FIRST report presented to the public in October 2021 for 2019-20, the District earned a “Superior” rating with a score of 96 points.
The timely preparation of this report could not have been accomplished without the assistance of the following departments: Resource Planning, Communications, and Business and Finance. We would like to acknowledge our independent auditors, Weaver and Tidwell, L.L.P., for their role in providing professional guidance and assistance in the preparation of this report.
Finally, without the interest, leadership and support of the Board of Trustees, preparation of this report would not have been possible.
Brian T. Woods, Ed.D. Rene Barajas, Ph.D. Superintendent of Schools Deputy Superintendent
Business and Finance
vii
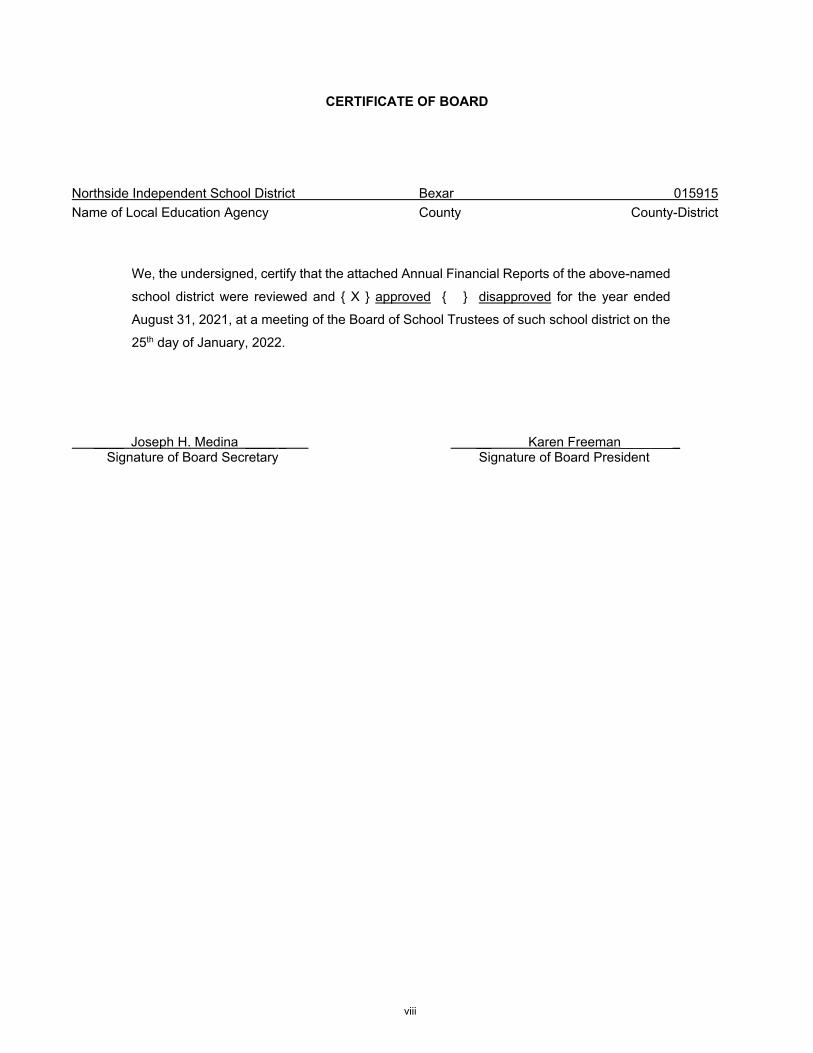
CERTIFICATE OF BOARD
Northside Independent School District Bexar 015915 Name of Local Education Agency County County-District
We, the undersigned, certify that the attached Annual Financial Reports of the above-named
school district were reviewed and { X } approved { } disapproved for the year ended
August 31, 2021, at a meeting of the Board of School Trustees of such school district on the
25th day of January, 2022.
____ Joseph H. Medina ____ _ __ Karen Freeman________ Signature of Board Secretary Signature of Board President
viii
Government Finance Officers Association
Certificate of Achievementfor Excellence
in Financial Reporting
Presented to
Northside Independent School DistrictTexas
For its Annual ComprehensiveFinancial Report
For the Fiscal Year Ended
August 31, 2020
Executive Director/CEO
ix

Sup
erin
tend
ent
Dr.
Bria
n T.
Woo
ds *
Exe
cutiv
e D
irec
tor
Com
mun
icat
ions
Bar
ry P
erez
*
Dep
uty
Sup
erin
tend
ent
Cur
ricu
lum
& I
nstr
ucti
onD
r. Ja
nis
Jord
an*
Dir.
Sch
ool-B
usin
ess-
Com
mun
ity
Par
tner
ship
sC
assa
ndra
Mir
anda
Dir
ecto
rIn
tern
al A
udit
Alis
a Th
ienp
ont
Ass
ista
nt S
upt.
Sec
onda
ry A
dmin
.S
teph
en D
anie
l
Ass
ista
nt S
upt.
Hum
an R
esou
rces
Patr
icia
Den
ham
Hill
*
Dep
uty
Sup
erin
tend
ent
Adm
inis
trat
ion
Ray
Gal
indo
*
Ass
ista
nt S
upt.
Hig
h Sc
h In
stru
ctio
nD
r. J
erry
Woo
ds
Sec
onda
ryP
rinc
ipal
s
Assi
stan
t Sup
t.Se
cond
ary
Adm
inis
tratio
nEr
ic T
obia
s
Exe
cutiv
e D
irec
tor
Seco
ndar
y Adm
inist
ratio
nVa
leri
e Si
sk
Exe
cutiv
e D
irec
tor
Elem
enta
ry A
dmin
istra
tion
San
dra
Bon
nett
Boa
rd o
f Tru
stee
s
Ass
ista
nt S
upt.
Faci
litie
s &
Ope
ratio
nsLe
roy
San
Mig
uel
*
Publ
ishe
d by
Com
mun
icat
ions
Dep
t.
Ass
ista
nt S
upt.
Tech
nolo
gy S
ervi
ces
Lori
Jon
es *
Dep
uty
Sup
erin
tend
ent
Bus
ines
s &
Fin
ance
Dr.
Ren
e B
araj
as * Ass
ista
nt S
upt.
Bud
get
& F
inan
ceTi
ffan
y C
ontr
eras
Exec
Dir.
Con
stru
ctio
n&
Engi
neer
ing
Jaco
b V
illar
real
Ele
men
tary
Pri
ncip
als
Exe
cutiv
e D
irec
tor
Ath
leti
csSt
an L
aing
Exe
cutiv
e D
irec
tor
Teac
hing
& L
earn
ing
Dia
na E
ly
Exec
. D
irec
tor
Tech
nolo
gy S
vcs
Kri
s Tr
ejo
Ass
ista
nt S
upt.
Mid
dle
Sch
Inst
ruct
ion
Deo
nna
Dea
n
Chi
ef o
f P
olic
eP
olic
e D
epar
tmen
tC
harl
ie C
arne
s
Ass
ista
nt S
upt.
Ele
men
tary
Adm
in.
Jess
ica
Pal
omar
es
Ass
ista
nt S
upt.
Elem
enta
ry In
stru
ctio
nPa
tti
Sanc
hez
Nor
thsi
de In
depe
nden
tSc
hool
Dis
tric
tA
dmin
istr
ativ
e O
rgan
izat
ion
Effe
ctiv
e Ju
ly 1
, 202
1Sh
aded
box
den
otes
Sup
erin
tend
ent’s
Cab
inet
.
*de
note
s Se
nior
Sta
ff
Nor
thsi
de IS
DC
omm
unity
Assi
stan
t Sup
erin
tend
ent
Con
tinu
ous
Impr
ovem
ent
Dr.
Bre
nda
War
d
Exe
cutiv
e D
irec
tor
Elem
enta
ry A
dmin
istra
tion
B
en M
uir
Exe
cutiv
e D
irec
tor
Elem
enta
ry A
dmin
istra
tion
Adr
iana
Gar
za
Exe
cutiv
e D
irec
tor
Stu
dent
Ser
vice
sTr
acy
Wer
nli
Exe
cutiv
e D
irec
tor
Who
le C
hild
Dr.
Kim
berl
y R
idgl
ey
x
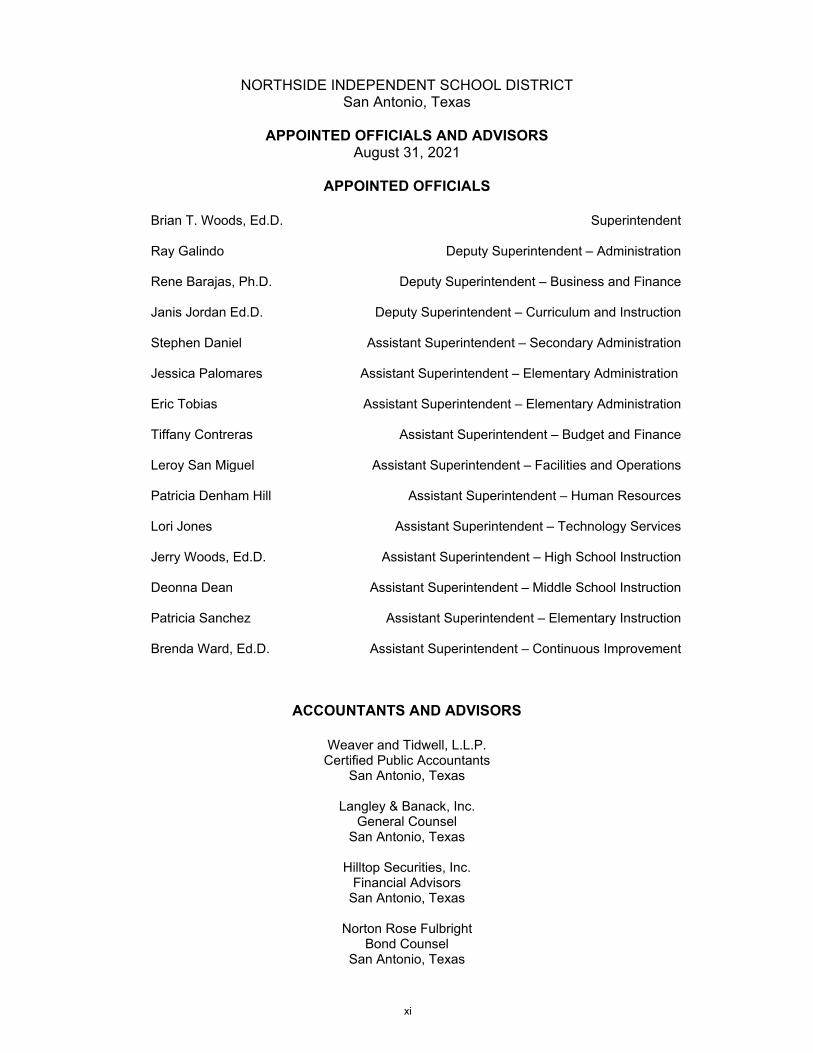
NORTHSIDE INDEPENDENT SCHOOL DISTRICT San Antonio, Texas
APPOINTED OFFICIALS AND ADVISORS August 31, 2021
APPOINTED OFFICIALS
Brian T. Woods, Ed.D. Superintendent
Ray Galindo Deputy Superintendent – Administration
Rene Barajas, Ph.D. Deputy Superintendent – Business and Finance
Janis Jordan Ed.D. Deputy Superintendent – Curriculum and Instruction
Stephen Daniel Assistant Superintendent – Secondary Administration
Jessica Palomares Assistant Superintendent – Elementary Administration
Eric Tobias Assistant Superintendent – Elementary Administration
Tiffany Contreras Assistant Superintendent – Budget and Finance
Leroy San Miguel Assistant Superintendent – Facilities and Operations
Patricia Denham Hill Assistant Superintendent – Human Resources
Lori Jones Assistant Superintendent – Technology Services
Jerry Woods, Ed.D. Assistant Superintendent – High School Instruction
Deonna Dean Assistant Superintendent – Middle School Instruction
Patricia Sanchez Assistant Superintendent – Elementary Instruction
Brenda Ward, Ed.D. Assistant Superintendent – Continuous Improvement
ACCOUNTANTS AND ADVISORS
Weaver and Tidwell, L.L.P. Certified Public Accountants
San Antonio, Texas
Langley & Banack, Inc. General Counsel
San Antonio, Texas
Hilltop Securities, Inc. Financial Advisors
San Antonio, Texas
Norton Rose Fulbright Bond Counsel
San Antonio, Texas
xi

^
^
^
^
^̂
^
^
^^
^^
^^ ^
^
^
^^
^ ^
!
!
! !
!
!
#
!
!
!
!!
!
!
!
!
#
!
!
"
#
!
!
#
!
"
"
!
!
!
!
!
!
#
!
!
"
!
#
!
!
"
!
!
"
"
!!
"
"
"
#
!
!
!
!
#
!
"
"
!
!
!
!
!
!
!
!
!
!
!
"
"
!
#
!
"
!
"
!
#
!
!
!
!
!
!
!
"
!
!
!
#
"
!
!
!
!
!
!
"
!
!
!
"
!
!
!
!
#
!
!
!
"
§̈¦10
§̈¦10
§̈¦410
§̈¦410
£¤90
¬«151
¬«16
¬«211
¬«211
")1604
")1604
")1604
")471
Medin
a Cou
ntyBe
xar C
ounty
Medin
a Cou
ntyBe
xar C
ounty
GovernmentCanyon
CampBullis
Aue
Leon Springs
BlattmanMay
GarciaBeard
Helotes
KuentzStinson
Brandeis
Rawlinson
ClarkLocke Hill
HobbyHowsman
ColoniesNorth
& DAEP
ScobeeSteubing
WankeBoone
Rudder
ThorntonMcDermott
MeadRhodes
Marshall /Marshall Law &
Medical Services
Oak HillsTerrace
Glenoaks
Krueger
HendersonScarborough Jefferson
Ward
Nichols
BrauchleBraun StationStevensonCarsonNorthwest
Crossing
Burke FernandezConnallyElrodTaft /
CommunicationsArts
Knowlton
Timberwilde
Leon Valley
Driggers
NeffGlass
Villarreal
Powell
Holmes / NSITE / EveningAcademy
Linton Ross
Esparza
Martin
Myers
CarlosCoon
RabaHoffmann
Briscoe
Brennan
LangleyLunaOtt
Galm
Behlau
Forester
Vale
Warren / Construction
Careers AcademyJordanEvers
MurninLewis
Stevens
Cody
Pease
Hatchett
Adams Hill
Fisher
Michael
MeadowVillage
Passmore
Jones / Jones STEM Magnet
Cable
Jay /Jay Science & Engineering Academy
Hull
WestwoodTerrace
Allen
RayburnValley Hi
Glenn
HealthCareers
Lieck
Mireles
Folks
McAndrew
Franklin
Holmgreen /SpEd Night School
Los Reyes
McClung TransportationStation
Rhodes Transportation Station
Dub FarrisAthleticComplex
NorthTransportationStation
Chavez Excel Academyand Alternative MS
Northside Child Nutrition& Maintenance Facilities
Northside Learning Center
Northside Human Resources,Student Services, & Police
AlternativeHigh School
Northside SupportServices Center
South Transportation Station
Culebra TransportationStation
Don Hardin AthleticComplex & NorthsideActivity Center
Central Office
Nellie M. Reddix Center
Ellison
Bernal
SmithTechnologyCenter
BELLA VISTA PLACE
POTRANCO RD
POTRANCO RD
FM 15
60 N
FM 1560 N
BABCOCK RD
GRISSOM RD
CULEBRA RD
CULEBRA RD
POTRANCO RD
ROUS
SEAU
CULEBRA RD
SILENT SUNRISE
BOERNE STAGE RD
KYLE
SEAL
E PKW
Y
NW MILITARY HWY
STILL
WATE
R PKW
Y
BANDERA RD
SONOMA PKWY
CHASE HILL BLVD
Northside Tennis Center
Boldt
Fields
Cole
Child NutritionWarehouse
!
Kallison
HarlanCULEBRA RD
Northside ISDFamily Engagement
Mora
AMERICANLOTUS
Carnahan
Wernli
Tomlinson
Straus
Zachry /Zachry Magnet
O'Connor / Agricultural Science & Technology Academy
BABCOCK RD
TALLEY RD
PRUE RD
TEZE
L RD
S CEN
ICLO
OP RD
BRAUN RD
W MILITARY DR
HUNT
LN
GALM RD
BENR
US
PINN R
D
WU RZBACH R D
MARBACH RD
BOE RNE S TAGE RD
UTSA BLVD
LOCKHILL-SELMA RD
W HAUSMAN RD
GROS
ENBA
CHER
RD
ECKHER T RD
M E DI CAL DR
DUGAS
N ELLISON DR
PUE R
D
WISEMAN BLVD
MAINLAN D
HU EBNER RD
BANDERA RD
LESLIE
RD
T OUTANT B EAUREGARD RD
NHU NT
LN
INGRAM RD
LONE
STAR
PKWY
TIMBERPAT H
W QUILL
REED RD
RAY ELLISON BLVD
ABE L
INCOL
N
HORA
L DR
HEUER M A NNRD
CAMP BUL LIS RD
COL ONY D R
HEATH RD
S ACM
E RD
PEMBROKE
HEMPHILL DR
ALAMO RANCH
SPRIN G TIME DR
FILLMORE DR
CLIFF
BRIER
OLD T
EZEL
RD
BRONCO LN
FREDERICKSBURG RD
INSPIRATION DR
OAK DR
CEDARHURST DR
SAXO
NHILL
DR
MEDINA BASE RD
SILICON DR
KRIE TRL
RAVEN FIELD DR
CARTWRIGHT TRL
ALAMO PK
WY
W COMMERCE ST
LIBERTY FIELD
EMORY PEAK
HOLLI
MON P
KWY
HORIZONHILL BLVD
CASTROVILLE RD
REID RA NCH
WESTCREEK VW
DE ZAVALA RD
PRESIDIO PKWY
INKS FARM
OLD P
RUE R
D
CALLAGHAN RD
SKYH
AWK D
R
EVERS RD
SOUTHERN SUNBONAVANTURA
DE ZAVALA RD
UTSA BLVD
HUNT LN
PUE R
D
M
LESLIE
RD
WURZBACH RD
CAMP BULL IS RD
W MILITARY DR
WISEMAN BLVD
HORAL DR
DUGAS
HUEBNER RD
^ Other Northside Facilities
Northside ISD Boundary! Elementary School" Middle School# High School
2021-22 School Locator Map
Schools and Facilities Map210-397-8589 (Attendance Area Information)
210-397-8500 (Main Switchboard)www.nisd.net
NorthsideIndependentSchool District
2/4/2021
xii

FINANCIAL SECTION


Weaver and Tidwell, L.L.P. 9311 San Pedro Avenue, Suite 1400 | San Antonio, Texas 78216
Main: 210.737.1042CPAs AND ADVISORS | WEAVER.COM
Independent Auditor’s Report
To the Board of Trustees of Northside Independent School District
Report on the Financial Statements
We have audited the accompanying financial statements of the governmental activities, the business-type activities, each major fund, and the aggregate remaining fund information of Northside Independent School District (the District), as of and for the year ended August 31, 2021, and the related notes to the financial statements, which collectively comprise the District’s basic financial statements as listed in the table of contents.
Management’s Responsibility for the Financial Statements
The District’s management is responsible for the preparation and fair presentation of these financial statements in accordance with accounting principles generally accepted in the United States of America; this includes the design, implementation, and maintenance of internal control relevant to the preparation and fair presentation of financial statements that are free from material misstatement, whether due to fraud or error.
Auditor’s Responsibility
Our responsibility is to express opinions on these financial statements based on our audit. We conducted our audit in accordance with auditing standards generally accepted in the United States of America and the standards applicable to financial audits contained in Government Auditing Standards, issued by the Comptroller General of the United States. Those standards require that we plan and perform the audit to obtain reasonable assurance about whether the financial statements are free from material misstatement.
An audit involves performing procedures to obtain audit evidence about the amounts and disclosures in the financial statements. The procedures selected depend on the auditor’s judgment, including the assessment of the risks of material misstatement of the financial statements, whether due to fraud or error. In making those risk assessments, the auditor considers internal control relevant to the entity’s preparation and fair presentation of the financial statements in order to design audit procedures that are appropriate in the circumstances, but not for the purpose of expressing an opinion on the effectiveness of the entity’s internal control. Accordingly, we express no such opinion. An audit also includes evaluating the appropriateness of accounting policies used and the reasonableness of significant accounting estimates made by management, as well as evaluating the overall presentation of the financial statements.
We believe that the audit evidence we have obtained is sufficient and appropriate to provide a basis for our audit opinions.
1
The Board of Trustees of Northside Independent School District
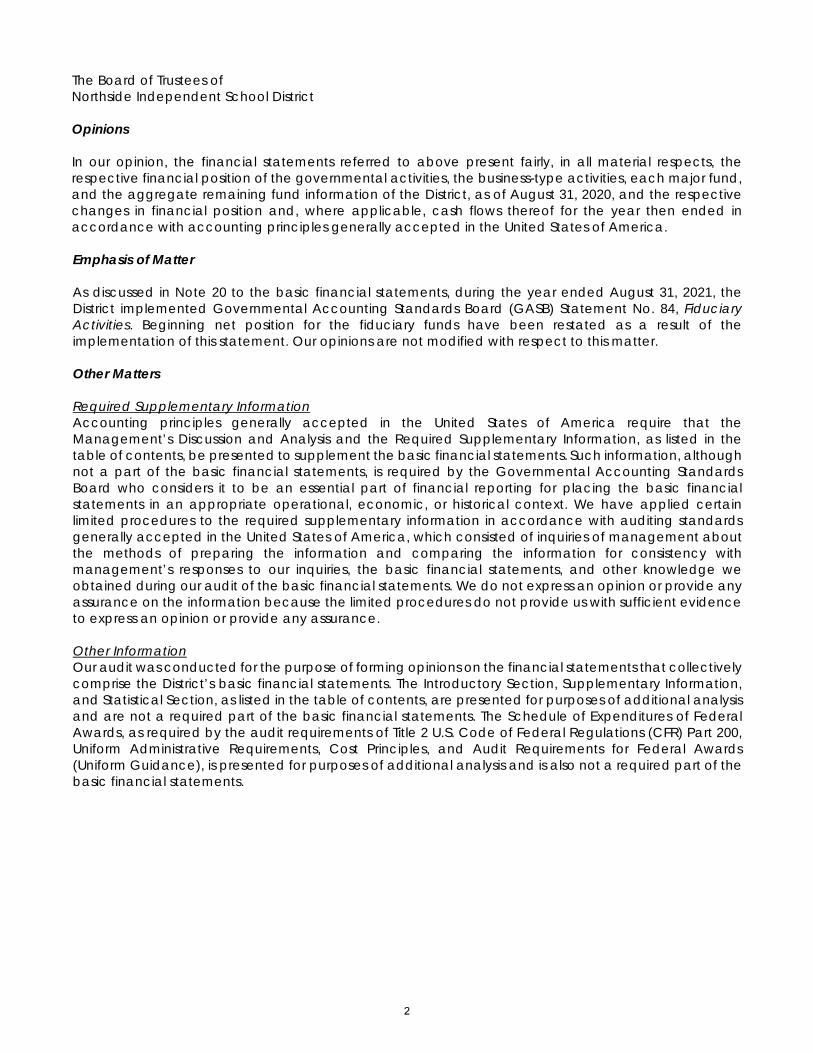
Opinions In our opinion, the financial statements referred to above present fairly, in all material respects, the respective financial position of the governmental activities, the business-type activities, each major fund, and the aggregate remaining fund information of the District, as of August 31, 2020, and the respective changes in financial position and, where applicable, cash flows thereof for the year then ended in accordance with accounting principles generally accepted in the United States of America. Emphasis of Matter As discussed in Note 20 to the basic financial statements, during the year ended August 31, 2021, the District implemented Governmental Accounting Standards Board (GASB) Statement No. 84, Fiduciary Activities. Beginning net position for the fiduciary funds have been restated as a result of the implementation of this statement. Our opinions are not modified with respect to this matter. Other Matters Required Supplementary Information Accounting principles generally accepted in the United States of America require that the Management’s Discussion and Analysis and the Required Supplementary Information, as listed in the table of contents, be presented to supplement the basic financial statements. Such information, although not a part of the basic financial statements, is required by the Governmental Accounting Standards Board who considers it to be an essential part of financial reporting for placing the basic financial statements in an appropriate operational, economic, or historical context. We have applied certain limited procedures to the required supplementary information in accordance with auditing standards generally accepted in the United States of America, which consisted of inquiries of management about the methods of preparing the information and comparing the information for consistency with management’s responses to our inquiries, the basic financial statements, and other knowledge we obtained during our audit of the basic financial statements. We do not express an opinion or provide any assurance on the information because the limited procedures do not provide us with sufficient evidence to express an opinion or provide any assurance. Other Information Our audit was conducted for the purpose of forming opinions on the financial statements that collectively comprise the District’s basic financial statements. The Introductory Section, Supplementary Information, and Statistical Section, as listed in the table of contents, are presented for purposes of additional analysis and are not a required part of the basic financial statements. The Schedule of Expenditures of Federal Awards, as required by the audit requirements of Title 2 U.S. Code of Federal Regulations (CFR) Part 200, Uniform Administrative Requirements, Cost Principles, and Audit Requirements for Federal Awards (Uniform Guidance), is presented for purposes of additional analysis and is also not a required part of the basic financial statements.
2
The Board of Trustees of Northside Independent School District
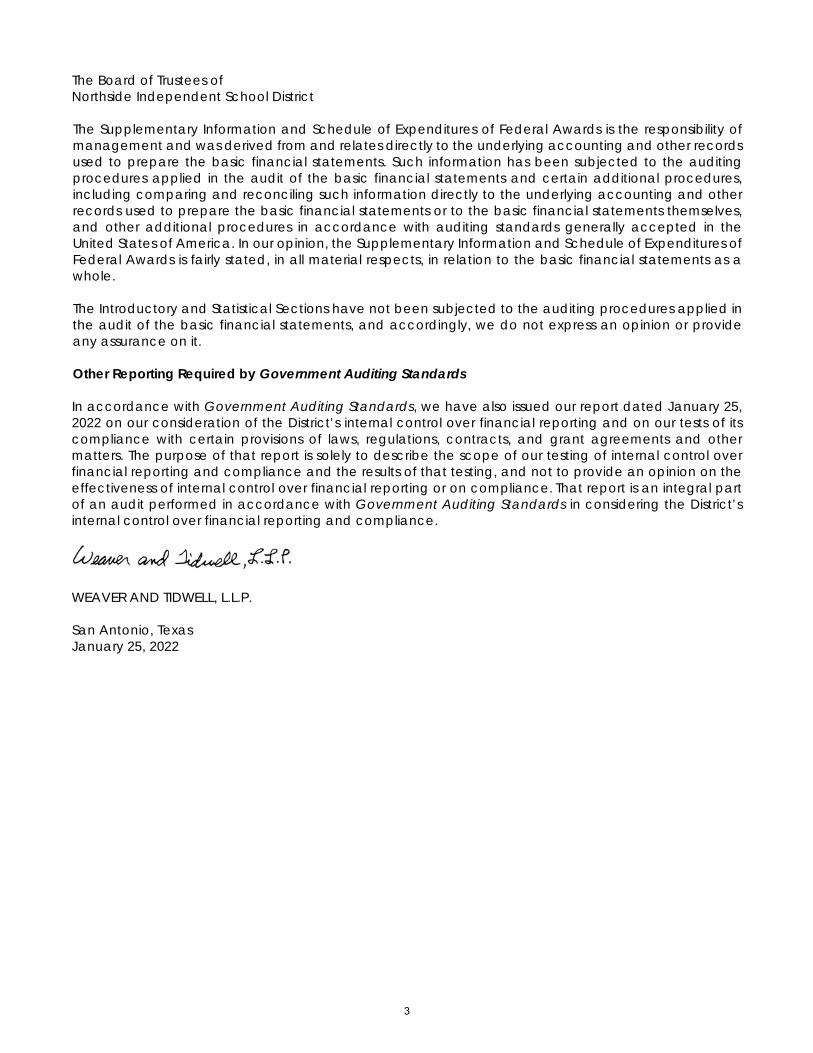
The Supplementary Information and Schedule of Expenditures of Federal Awards is the responsibility of management and was derived from and relates directly to the underlying accounting and other records used to prepare the basic financial statements. Such information has been subjected to the auditing procedures applied in the audit of the basic financial statements and certain additional procedures, including comparing and reconciling such information directly to the underlying accounting and other records used to prepare the basic financial statements or to the basic financial statements themselves, and other additional procedures in accordance with auditing standards generally accepted in the United States of America. In our opinion, the Supplementary Information and Schedule of Expenditures of Federal Awards is fairly stated, in all material respects, in relation to the basic financial statements as a whole. The Introductory and Statistical Sections have not been subjected to the auditing procedures applied in the audit of the basic financial statements, and accordingly, we do not express an opinion or provide any assurance on it. Other Reporting Required by Government Auditing Standards In accordance with Government Auditing Standards, we have also issued our report dated January 25, 2022 on our consideration of the District’s internal control over financial reporting and on our tests of its compliance with certain provisions of laws, regulations, contracts, and grant agreements and other matters. The purpose of that report is solely to describe the scope of our testing of internal control over financial reporting and compliance and the results of that testing, and not to provide an opinion on the effectiveness of internal control over financial reporting or on compliance. That report is an integral part of an audit performed in accordance with Government Auditing Standards in considering the District’s internal control over financial reporting and compliance.
WEAVER AND TIDWELL, L.L.P. San Antonio, Texas January 25, 2022
3
MANAGEMENT’S DISCUSSION AND ANALYSIS As management of the Northside Independent School District (the “District”), we offer readers of the District’s basic financial statements this narrative overview and analysis of the financial activities for the fiscal year ended August 31, 2021. The intent of this section is to look at the District’s financial performance as a whole. We encourage readers to consider the additional information presented in the transmittal letter, in the introductory section, and the notes to the basic financial statements in conjunction with this discussion and analysis to enhance their understanding of the District’s financial performance. FINANCIAL HIGHLIGHTS
• Liabilities and deferred inflows of resources of the District exceeded assets and deferred outflows of resources by $28,244,304 (net position). The District has $267,106,053 of negative unrestricted net position. The negative overall and unrestricted net position is primarily the result of liabilities associated with the Pension Obligation and Other Postemployment Obligations (OPEB) which is discussed extensively in Notes 10 and 11 of the Notes to the Financial Statements. Restricted net position consists of $57,447,877 for debt service, $5,663,638 for child nutrition services and $692,544 for grants.
• The District is reporting an increase in net position of $35,192,092.
• Tax collections increased $29,149,604 from 2020 and the tax levy increased by $28,632,771, as a result of the increase in the tax base.
• The ending fund balance of the District’s General Fund decreased $74,160,508 to $435,696,881. The unassigned portion of fund balance, $242,173,627 represents 26.12% of annual operating expenditures or about 68 days of operations (based on 260 annual operating days).
• In May 2014, the Northside community approved a $648.34 million bond proposal to build five new schools, design and engineer a sixth school, and make additions and improvements to existing schools and facilities. During the year, the District issued $69,100,000 in new funding from the 2014 bond authorization, which fully expends the May 2014 bond authorization.
• In May 2018, the Northside community approved a $848.91 million bond proposal to build one high school, one middle school, two elementary schools, and make additions and improvements to existing schools and facilities. During the year, the District did issue $130,900,000 from the 2018 bond authorization.
OVERVIEW OF THE BASIC FINANCIAL STATEMENTS
The Annual Comprehensive Financial Report (ACFR) consists of an Introductory Section, Financial Section, Statistical Section and a Federal Awards Section. The Financial Section consists of four parts - Management’s Discussion and Analysis (this section), the basic financial statements (with accompanying notes), required supplementary information, and an optional section that presents combining statements for non-major governmental funds, internal service funds, fiduciary funds and capital assets used in the operation of governmental funds. The statements are intended to be organized so that the reader can understand the District as an entire operating entity. The basic financial statements include two kinds of statements that present different views of the District in addition to the notes that explain some of the information in the basic financial statements and provide data that is more detailed:
1. The first two statements are government-wide financial statements, the Statement of Net Position and the Statement of Activities, which provide both long-term and short-term information about the District’s overall financial status.
2. The remaining statements are fund financial statements that focus on individual parts of the government, reporting the District’s operations in more detail than the government-wide
4
statements. The governmental funds statements tell how general government services were financed in the short term as well as what remains for future spending. Proprietary fund statements offer short and long-term financial information about the activities the government operates like businesses, such as printing services. Fiduciary fund statements provide information about the financial relationships in which the District acts solely as a trustee or agent for the benefit of others, to whom the resources in question belong.
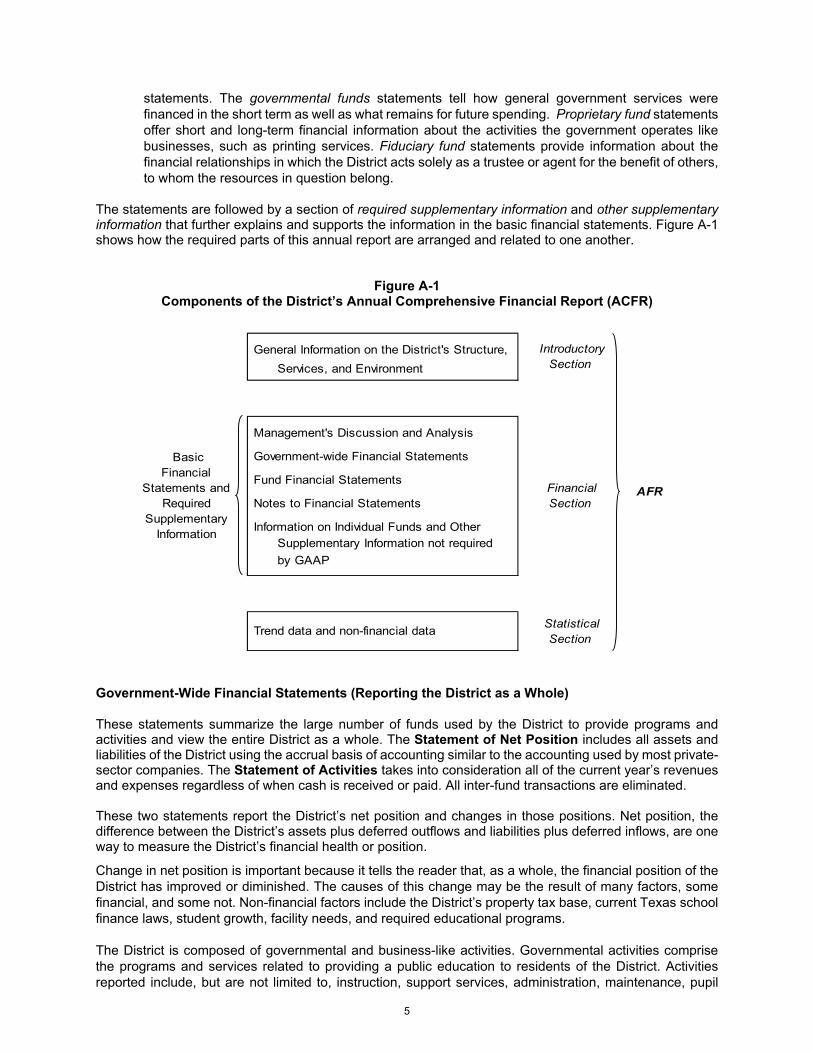
The statements are followed by a section of required supplementary information and other supplementary information that further explains and supports the information in the basic financial statements. Figure A-1 shows how the required parts of this annual report are arranged and related to one another.
Figure A-1 Components of the District’s Annual Comprehensive Financial Report (ACFR)
Government-Wide Financial Statements (Reporting the District as a Whole)
These statements summarize the large number of funds used by the District to provide programs and activities and view the entire District as a whole. The Statement of Net Position includes all assets and liabilities of the District using the accrual basis of accounting similar to the accounting used by most private-sector companies. The Statement of Activities takes into consideration all of the current year’s revenues and expenses regardless of when cash is received or paid. All inter-fund transactions are eliminated. These two statements report the District’s net position and changes in those positions. Net position, the difference between the District’s assets plus deferred outflows and liabilities plus deferred inflows, are one way to measure the District’s financial health or position. Change in net position is important because it tells the reader that, as a whole, the financial position of the District has improved or diminished. The causes of this change may be the result of many factors, some financial, and some not. Non-financial factors include the District’s property tax base, current Texas school finance laws, student growth, facility needs, and required educational programs. The District is composed of governmental and business-like activities. Governmental activities comprise the programs and services related to providing a public education to residents of the District. Activities reported include, but are not limited to, instruction, support services, administration, maintenance, pupil
General Information on the District's Structure, Services, and Environment
Management's Discussion and Analysis Government-wide Financial Statements Fund Financial Statements Notes to Financial Statements Information on Individual Funds and Other
Supplementary Information not required by GAAP
Basic Financial
Statements and Required
Supplementary Information
Financial Section
Statistical Section
Trend data and non-financial data
AFR
Introductory Section
5
transportation, extracurricular activities, technology services and security. Business-like activities comprise activities related to after-school and summer programs for elementary and middle school students. Fund Financial Statements (Reporting the School District’s Most Significant Funds)
Fund financial statements provide detailed information about the District’s major funds. The District uses many funds to account for a multitude of financial transactions that have been separated for specific activities or objectives. However, these fund financial statements focus on the District’s most significant funds. The District’s major governmental funds are the General Fund, Debt Service Fund, and the Capital Projects Fund. All the funds of the District can be described by three categories:
• Governmental Funds - Most of the District’s activities are reported in governmental funds, which focus on how money flows into and out of those funds and the balances left at year-end available for spending in the future periods. These funds are reported using an accounting method called modified accrual accounting, which measures cash and all other financial assets that can readily be converted to cash. The governmental fund statements provide a detailed short-term view of the District’s general operations and the basic services it provides. Governmental fund information helps you determine whether there are more or fewer financial resources that can be spent in the near future to finance educational programs. The relationship (or differences) between governmental activities (reported in the Statement of Net Position and the Statement of Activities) and governmental funds is reconciled in the basic financial statements.
• Proprietary Funds - Services for which the District self-charges customers a fee are generally reported in proprietary funds. Proprietary fund statements, like the government-wide statements, provide both long and short-term financial information. The Enterprise Fund reports the activities of the District’s after-school program. Internal Service Funds are used to report activities such as the District’s Worker’s Compensation Insurance, Unemployment Self Insurance, Armored Car Services, Equipment Replacement, and Printing Operations that provide supplies and services for the District’s other programs and activities.
• Fiduciary Funds - The District is the fiduciary for Textbook Waivers and Refunds, Student Activities, Northside Booster Association, and University Interscholastic League funds. All of the District's fiduciary activities are reported in a separate Statement of Fiduciary Net Position. These activities are excluded from the District's basic financial statements because the District cannot use these assets to finance its operations.
FINANCIAL ANALYSIS OF THE DISTRICT AS A WHOLE (Government–wide)
Net Position
The District’s net position was approximately $(28.2) million at August 31, 2021, which is a $35.2 million decrease from the August 31, 2020 net position of $(63.4) million.
6

Table A-1 summarizes the change in net position from August 31, 2020 to August 31, 2021.
Table A-1Net Position
(in millions of dollars)
08/31/21 08/31/20 08/31/21 08/31/20 08/31/21 08/31/20Assets
Current and Other Assets 773.28$ 650.53$ 1.15$ 3.71$ 774.43$ 654.24 Capital Assets 2,447.70 2,308.76 0.14 0.17 2,447.85 2,308.93 Total Assets 3,220.98 2,959.29 1.29 3.88 3,222.28 2,963.17
Total Deferred Outflows of Resources 181.99 227.10 - - 181.99 227.10
LiabilitiesCurrent and Other Liabilities 111.26 108.68 0.34 1.13 111.60 109.81 Long-term Liabilities 3,021.59 2,923.00 - - 3,021.59 2,923.00 Total Liabilities 3,132.85 3,031.68 0.34 1.13 3,133.19 3,032.81
Total Deferred Inflows of Resources 299.32 220.89 - - 299.32 220.89
Net PositionNet Investment in Capital Assets 174.91 74.40 0.14 0.17 175.06 74.57 Restricted 63.80 57.94 - - 63.80 57.94 Unrestricted (267.91) (198.52) 0.81 2.58 (267.11) (195.94) Total Net Position (29.20)$ (66.18)$ 0.95$ 2.75$ (28.24)$ (63.43)$
TotalGovernmental Activities Business-type Activities
• 94% percent of the District’s $774.43 million in Current and Other Assets are liquid, with $711.41 million in cash and cash equivalents and $20 million in government securities.
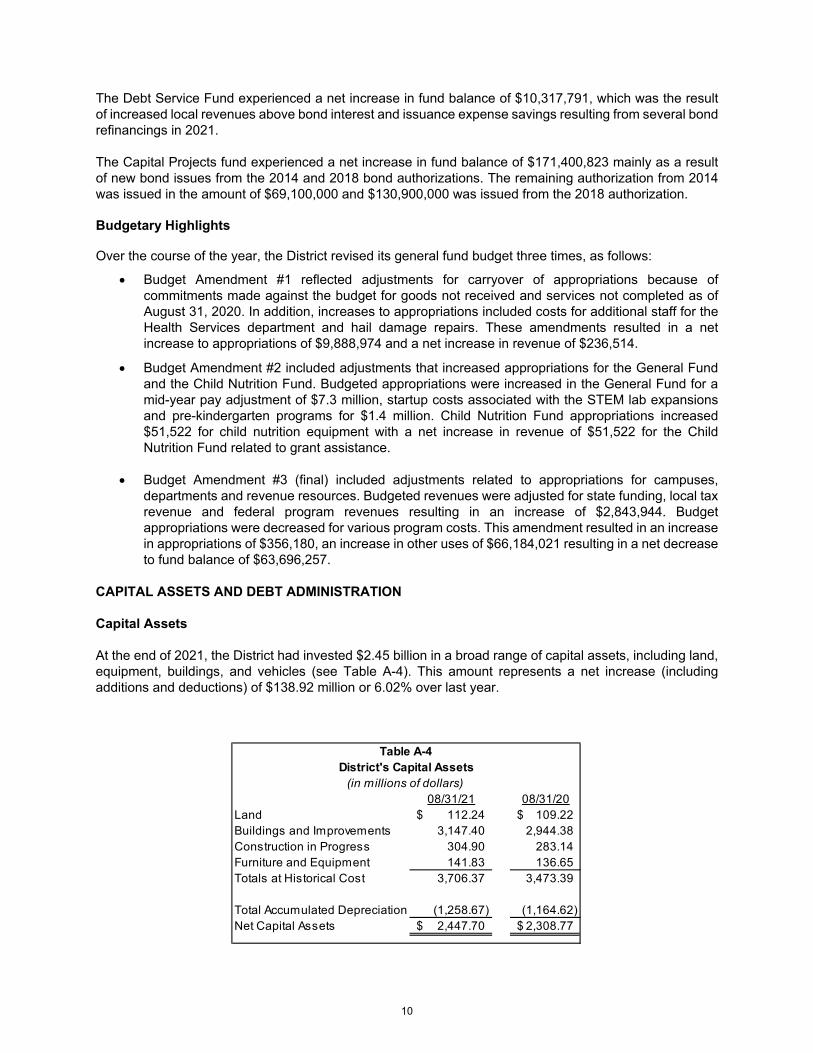
• Capital Assets reflect the District’s investment in land, construction in progress, buildings, and equipment, net of accumulated depreciation. The increase in Capital Assets is from the addition of new schools and other ongoing construction projects less the effect of changes in accumulated depreciation expense.
• Long-term Liabilities include the District’s outstanding voter-approved general obligation bonds, which were $2.265 billion. Long-term liabilities increased due to the issuance of several new debt obligations from the 2014 and 2018 bond authorizations.
• The increase in construction projects exceeded the increase in bond issuance activity, causing an increase in Net Investment in Capital Assets.
• Restricted net position is not available for general operations and includes $5.66 million for child nutrition services and $57.45 million for debt service at August 31, 2021.
Changes in Net Position The District’s revenues totaled $1.31 billion in 2020-21. A significant portion, 59.7%, of the District’s revenue came from property taxes, 19.2% from state aid – formula grants, 19.2% from operating grants. (See Figure A-2).
7
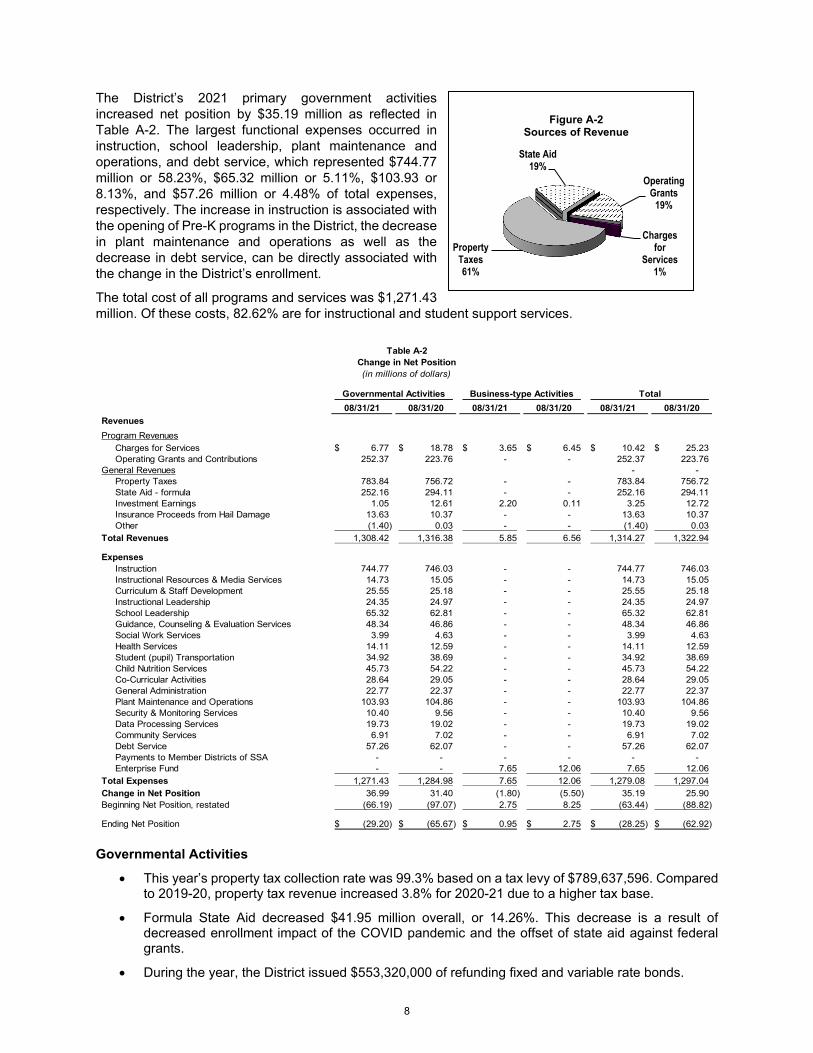
The District’s 2021 primary government activities increased net position by $35.19 million as reflected in Table A-2. The largest functional expenses occurred in instruction, school leadership, plant maintenance and operations, and debt service, which represented $744.77 million or 58.23%, $65.32 million or 5.11%, $103.93 or 8.13%, and $57.26 million or 4.48% of total expenses, respectively. The increase in instruction is associated with the opening of Pre-K programs in the District, the decrease in plant maintenance and operations as well as the decrease in debt service, can be directly associated with the change in the District’s enrollment. The total cost of all programs and services was $1,271.43 million. Of these costs, 82.62% are for instructional and student support services.
08/31/21 08/31/20 08/31/21 08/31/20 08/31/21 08/31/20RevenuesProgram Revenues
Charges for Services 6.77$ 18.78$ 3.65$ 6.45$ 10.42$ 25.23$ Operating Grants and Contributions 252.37 223.76 - - 252.37 223.76
General Revenues - - Property Taxes 783.84 756.72 - - 783.84 756.72 State Aid - formula 252.16 294.11 - - 252.16 294.11 Investment Earnings 1.05 12.61 2.20 0.11 3.25 12.72 Insurance Proceeds from Hail Damage 13.63 10.37 - - 13.63 10.37 Other (1.40) 0.03 - - (1.40) 0.03
Total Revenues 1,308.42 1,316.38 5.85 6.56 1,314.27 1,322.94 Expenses
Instruction 744.77 746.03 - - 744.77 746.03 Instructional Resources & Media Services 14.73 15.05 - - 14.73 15.05 Curriculum & Staff Development 25.55 25.18 - - 25.55 25.18 Instructional Leadership 24.35 24.97 - - 24.35 24.97 School Leadership 65.32 62.81 - - 65.32 62.81 Guidance, Counseling & Evaluation Services 48.34 46.86 - - 48.34 46.86 Social Work Services 3.99 4.63 - - 3.99 4.63 Health Services 14.11 12.59 - - 14.11 12.59 Student (pupil) Transportation 34.92 38.69 - - 34.92 38.69 Child Nutrition Services 45.73 54.22 - - 45.73 54.22 Co-Curricular Activities 28.64 29.05 - - 28.64 29.05 General Administration 22.77 22.37 - - 22.77 22.37 Plant Maintenance and Operations 103.93 104.86 - - 103.93 104.86 Security & Monitoring Services 10.40 9.56 - - 10.40 9.56 Data Processing Services 19.73 19.02 - - 19.73 19.02 Community Services 6.91 7.02 - - 6.91 7.02 Debt Service 57.26 62.07 - - 57.26 62.07 Payments to Member Districts of SSA - - - - - - Enterprise Fund - - 7.65 12.06 7.65 12.06
Total Expenses 1,271.43 1,284.98 7.65 12.06 1,279.08 1,297.04 Change in Net Position 36.99 31.40 (1.80) (5.50) 35.19 25.90 Beginning Net Position, restated (66.19) (97.07) 2.75 8.25 (63.44) (88.82) Ending Net Position (29.20)$ (65.67)$ 0.95$ 2.75$ (28.25)$ (62.92)$
Table A-2Change in Net Position(in millions of dollars)
TotalGovernmental Activities Business-type Activities
Governmental Activities
• This year’s property tax collection rate was 99.3% based on a tax levy of $789,637,596. Compared to 2019-20, property tax revenue increased 3.8% for 2020-21 due to a higher tax base.
• Formula State Aid decreased $41.95 million overall, or 14.26%. This decrease is a result of decreased enrollment impact of the COVID pandemic and the offset of state aid against federal grants.
• During the year, the District issued $553,320,000 of refunding fixed and variable rate bonds.
Property Taxes61%
State Aid19%
Operating Grants
19%
Charges for
Services1%
Figure A-2Sources of Revenue
8
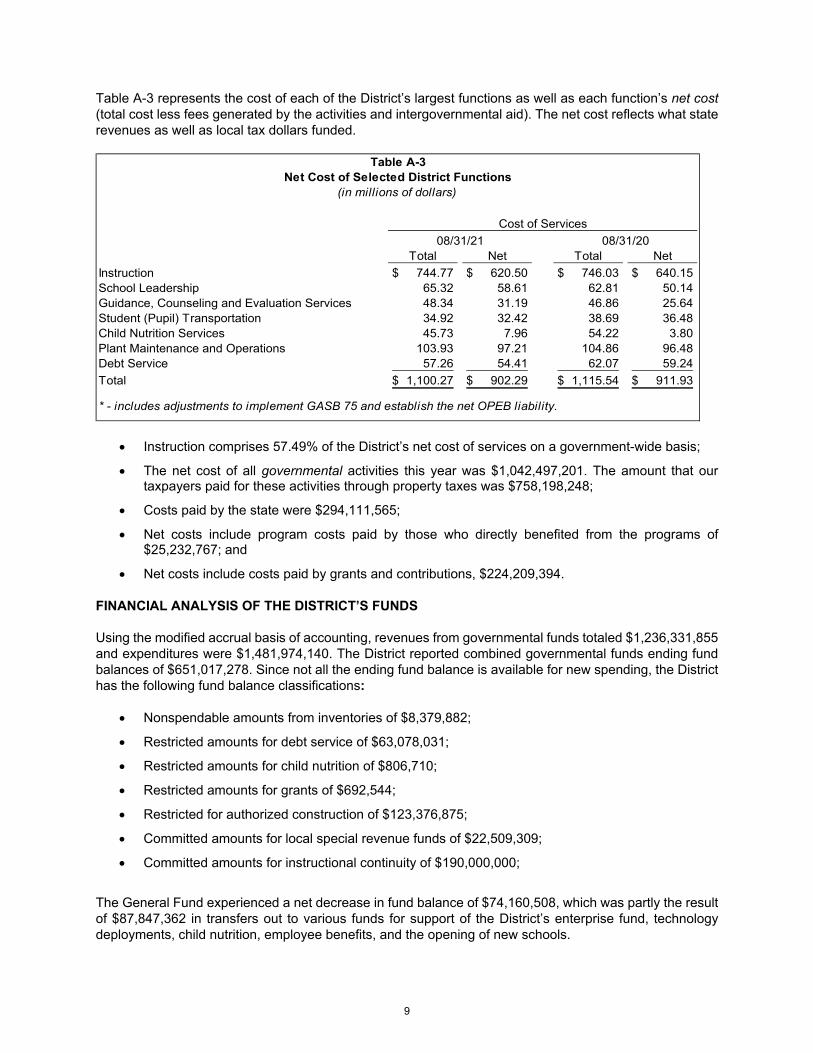
Table A-3 represents the cost of each of the District’s largest functions as well as each function’s net cost (total cost less fees generated by the activities and intergovernmental aid). The net cost reflects what state revenues as well as local tax dollars funded.
Table A-3Net Cost of Selected District Functions
(in millions of dollars)
Cost of Services08/31/21 08/31/20
Total Net Total NetInstruction 744.77$ 620.50$ 746.03$ 640.15$ School Leadership 65.32 58.61 62.81 50.14 Guidance, Counseling and Evaluation Services 48.34 31.19 46.86 25.64 Student (Pupil) Transportation 34.92 32.42 38.69 36.48 Child Nutrition Services 45.73 7.96 54.22 3.80 Plant Maintenance and Operations 103.93 97.21 104.86 96.48 Debt Service 57.26 54.41 62.07 59.24 Total 1,100.27$ 902.29$ 1,115.54$ 911.93$ * - includes adjustments to implement GASB 75 and establish the net OPEB liability.
• Instruction comprises 57.49% of the District’s net cost of services on a government-wide basis; • The net cost of all governmental activities this year was $1,042,497,201. The amount that our
taxpayers paid for these activities through property taxes was $758,198,248; • Costs paid by the state were $294,111,565; • Net costs include program costs paid by those who directly benefited from the programs of
$25,232,767; and • Net costs include costs paid by grants and contributions, $224,209,394.
FINANCIAL ANALYSIS OF THE DISTRICT’S FUNDS
Using the modified accrual basis of accounting, revenues from governmental funds totaled $1,236,331,855 and expenditures were $1,481,974,140. The District reported combined governmental funds ending fund balances of $651,017,278. Since not all the ending fund balance is available for new spending, the District has the following fund balance classifications:
• Nonspendable amounts from inventories of $8,379,882; • Restricted amounts for debt service of $63,078,031; • Restricted amounts for child nutrition of $806,710; • Restricted amounts for grants of $692,544; • Restricted for authorized construction of $123,376,875; • Committed amounts for local special revenue funds of $22,509,309; • Committed amounts for instructional continuity of $190,000,000;
The General Fund experienced a net decrease in fund balance of $74,160,508, which was partly the result of $87,847,362 in transfers out to various funds for support of the District’s enterprise fund, technology deployments, child nutrition, employee benefits, and the opening of new schools.
9
The Debt Service Fund experienced a net increase in fund balance of $10,317,791, which was the result of increased local revenues above bond interest and issuance expense savings resulting from several bond refinancings in 2021. The Capital Projects fund experienced a net increase in fund balance of $171,400,823 mainly as a result of new bond issues from the 2014 and 2018 bond authorizations. The remaining authorization from 2014 was issued in the amount of $69,100,000 and $130,900,000 was issued from the 2018 authorization. Budgetary Highlights Over the course of the year, the District revised its general fund budget three times, as follows:
• Budget Amendment #1 reflected adjustments for carryover of appropriations because of commitments made against the budget for goods not received and services not completed as of August 31, 2020. In addition, increases to appropriations included costs for additional staff for the Health Services department and hail damage repairs. These amendments resulted in a net increase to appropriations of $9,888,974 and a net increase in revenue of $236,514.
• Budget Amendment #2 included adjustments that increased appropriations for the General Fund and the Child Nutrition Fund. Budgeted appropriations were increased in the General Fund for a mid-year pay adjustment of $7.3 million, startup costs associated with the STEM lab expansions and pre-kindergarten programs for $1.4 million. Child Nutrition Fund appropriations increased $51,522 for child nutrition equipment with a net increase in revenue of $51,522 for the Child Nutrition Fund related to grant assistance.
• Budget Amendment #3 (final) included adjustments related to appropriations for campuses, departments and revenue resources. Budgeted revenues were adjusted for state funding, local tax revenue and federal program revenues resulting in an increase of $2,843,944. Budget appropriations were decreased for various program costs. This amendment resulted in an increase in appropriations of $356,180, an increase in other uses of $66,184,021 resulting in a net decrease to fund balance of $63,696,257.
CAPITAL ASSETS AND DEBT ADMINISTRATION
Capital Assets
At the end of 2021, the District had invested $2.45 billion in a broad range of capital assets, including land, equipment, buildings, and vehicles (see Table A-4). This amount represents a net increase (including additions and deductions) of $138.92 million or 6.02% over last year.
08/31/21 08/31/20Land 112.24$ 109.22$ Buildings and Improvements 3,147.40 2,944.38 Construction in Progress 304.90 283.14 Furniture and Equipment 141.83 136.65 Totals at Historical Cost 3,706.37 3,473.39
Total Accumulated Depreciation (1,258.67) (1,164.62) Net Capital Assets 2,447.70$ 2,308.77$
Table A-4District's Capital Assets
(in millions of dollars)
10

The District is continuing the capital improvement program being funded by the 2014 $648.3 million bond authorization. The 2014 authorization included $274.5 million for the construction of one high school and four elementary schools, $199.8 million for major additions and renovations, $71.8 million for infrastructure improvements, $47.0 million for technology, and $55.2 million for other projects. At August 31, 2021, $607 million has been spent on these projects. In May 5, 2018, the District was authorized to issue $848.9 million in bonds for the construction of one high, one middle school, two elementary schools, various renovations and upgrades to existing facilities, and equipment for technology and transportation. At August 31, 2021, $482.61 million has been spent on these projects. More information about the District’s capital assets is presented in Note 5 of the Notes to Financial Statements. Long-Term Debt The District continued its active debt management practice by refunding $257.260 million of fixed and variable rate debt to take advantage of lower interest rates. At year-end, the District had $2.92 billion in long-term debt outstanding as shown in Table A-5. More information about the District’s debt is presented in Note 7 in the Notes to Financial Statements.
Table A-5District's Long Term Debt
(in millions of dollars)
08/31/21 08/31/20Bonds payable 2,408.13$ 2,195.40$ Net Pension Liability 304.09 330.42 Net OPEB Liability 298.61 386.11 Liability for Compensated Absences 8.42 8.63 Workers Compensation 2.32 2.45
Total Long-Term Debt 3,021.57$ 2,923.01$
Long-term bonds are rated “AAA” by Moody's Investors Service, Inc. (“Moody's”) and Fitch Investors Service (“Fitch”) by virtue of the guarantee of the Permanent School Fund of the State of Texas. The current underlying credit rating from Fitch is AA+. The current underlying credit rating from Moody's is Aa1. The District’s short-term credit has been rated “VMIG 1” by Moody's. ECONOMIC FACTORS AND NEXT YEAR’S BUDGET AND TAX RATES
• Property values used for the 2021-22 budget preparation will be up an estimated $2.9 billion or 4.7% from 2021. The expected resulting increase in General Fund tax revenues of $15.5 million and increase Debt Service Fund tax revenues is $11.7 million.
• The District’s 2021-22 General Fund adopted budget included a projected enrollment of 104,772. Actual enrollment as of September 2021 was 102,639 and was below the projection by 2,133. A significant factor in this change in enrollment is due to COVID-19 pandemic and is consistent with patterns across the state.
• For 2021-22, the District appropriated $963.6 million in General Fund expenditures and estimated revenues just under $937 million. The adopted budget included $20.86 million for related costs of growth, new schools, and technology deployments.
11
CONTACTING THE DISTRICT’S FINANCIAL MANAGEMENT
This financial report is designed to provide our citizens, taxpayers, customers, investors and creditors with a general overview of the District’s finances and to demonstrate the District’s accountability for the funds it receives. If you have questions about this report or need additional financial information, contact the District’s Deputy Superintendent for Business and Finance at Northside ISD, 5900 Evers Road, San Antonio, TX 78238.
12

BASIC FINANCIAL STATEMENTS
13

(This page intentionally left blank)
14
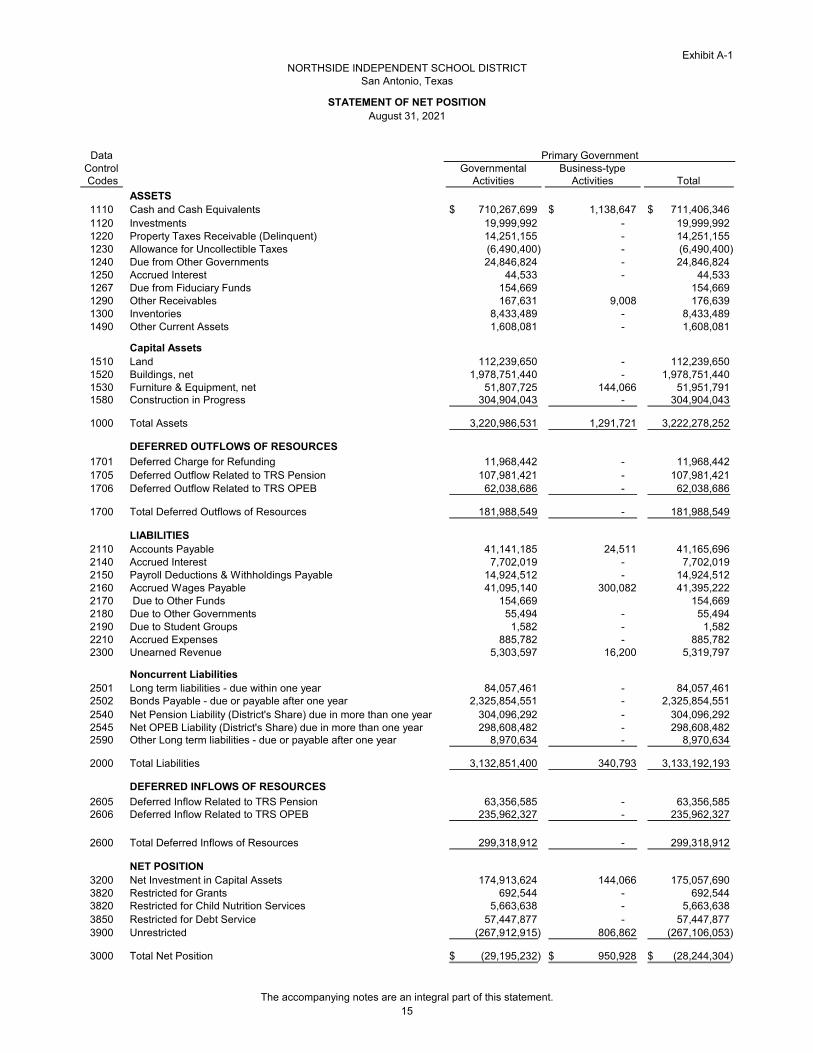
Exhibit A-1NORTHSIDE INDEPENDENT SCHOOL DISTRICT
San Antonio, Texas
STATEMENT OF NET POSITIONAugust 31, 2021
DataControl Governmental Business-type Codes Activities Activities Total
ASSETS1110 Cash and Cash Equivalents 710,267,699$ 1,138,647$ 711,406,346$ 1120 Investments 19,999,992 - 19,999,992 1220 Property Taxes Receivable (Delinquent) 14,251,155 - 14,251,155 1230 Allowance for Uncollectible Taxes (6,490,400) - (6,490,400) 1240 Due from Other Governments 24,846,824 - 24,846,824 1250 Accrued Interest 44,533 - 44,533 1267 Due from Fiduciary Funds 154,669 154,669 1290 Other Receivables 167,631 9,008 176,639 1300 Inventories 8,433,489 - 8,433,489 1490 Other Current Assets 1,608,081 - 1,608,081
Capital Assets1510 Land 112,239,650 - 112,239,650 1520 Buildings, net 1,978,751,440 - 1,978,751,440 1530 Furniture & Equipment, net 51,807,725 144,066 51,951,791 1580 Construction in Progress 304,904,043 - 304,904,043
1000 Total Assets 3,220,986,531 1,291,721 3,222,278,252
DEFERRED OUTFLOWS OF RESOURCES
1701 Deferred Charge for Refunding 11,968,442 - 11,968,442 1705 Deferred Outflow Related to TRS Pension 107,981,421 - 107,981,421 1706 Deferred Outflow Related to TRS OPEB 62,038,686 - 62,038,686
1700 Total Deferred Outflows of Resources 181,988,549 - 181,988,549
LIABILITIES2110 Accounts Payable 41,141,185 24,511 41,165,696 2140 Accrued Interest 7,702,019 - 7,702,019 2150 Payroll Deductions & Withholdings Payable 14,924,512 - 14,924,512 2160 Accrued Wages Payable 41,095,140 300,082 41,395,222 2170 Due to Other Funds 154,669 154,669 2180 Due to Other Governments 55,494 - 55,494 2190 Due to Student Groups 1,582 - 1,582 2210 Accrued Expenses 885,782 - 885,782 2300 Unearned Revenue 5,303,597 16,200 5,319,797
Noncurrent Liabilities2501 Long term liabilities - due within one year 84,057,461 - 84,057,461 2502 Bonds Payable - due or payable after one year 2,325,854,551 - 2,325,854,551 2540 Net Pension Liability (District's Share) due in more than one year 304,096,292 - 304,096,292 2545 Net OPEB Liability (District's Share) due in more than one year 298,608,482 - 298,608,482 2590 Other Long term liabilities - due or payable after one year 8,970,634 - 8,970,634
2000 Total Liabilities 3,132,851,400 340,793 3,133,192,193
DEFERRED INFLOWS OF RESOURCES
2605 Deferred Inflow Related to TRS Pension 63,356,585 - 63,356,585 2606 Deferred Inflow Related to TRS OPEB 235,962,327 - 235,962,327
2600 Total Deferred Inflows of Resources 299,318,912 - 299,318,912
NET POSITION3200 Net Investment in Capital Assets 174,913,624 144,066 175,057,690 3820 Restricted for Grants 692,544 - 692,544 3820 Restricted for Child Nutrition Services 5,663,638 - 5,663,638 3850 Restricted for Debt Service 57,447,877 - 57,447,877 3900 Unrestricted (267,912,915) 806,862 (267,106,053)
3000 Total Net Position (29,195,232)$ 950,928$ (28,244,304)$
The accompanying notes are an integral part of this statement.
Primary Government
15
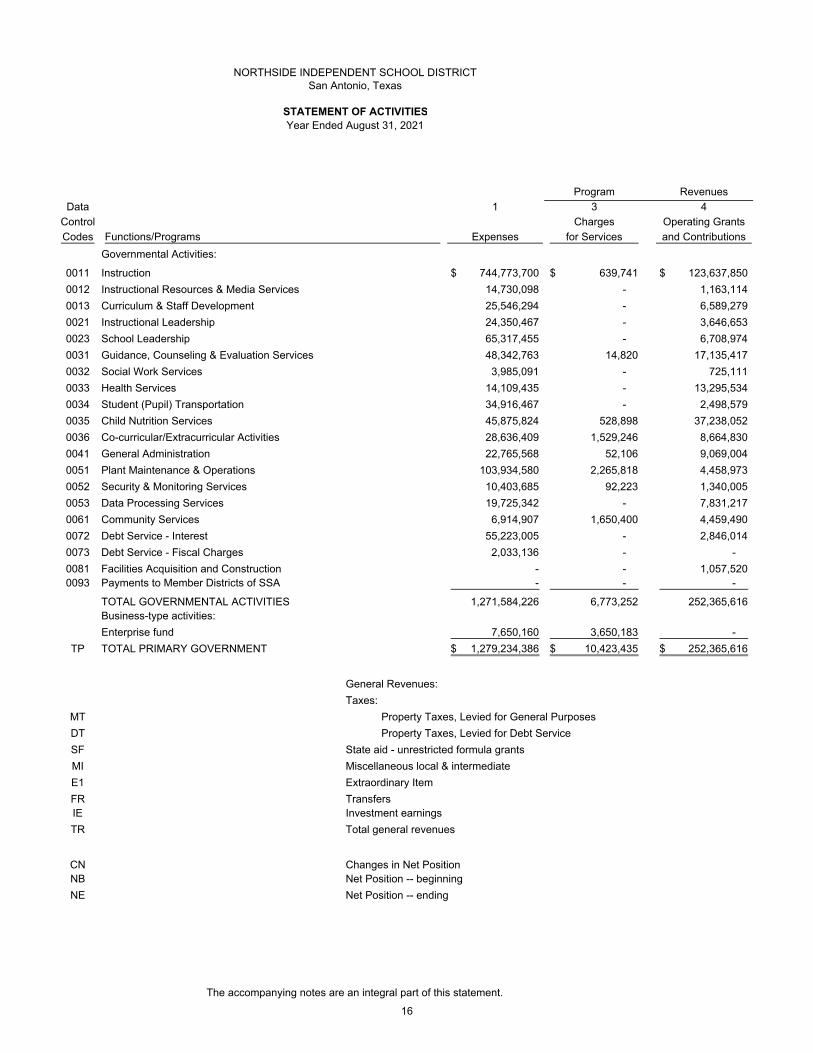
NORTHSIDE INDEPENDENT SCHOOL DISTRICTSan Antonio, Texas
STATEMENT OF ACTIVITIESYear Ended August 31, 2021
Program Revenues
Data 1 3 4
Control Charges Operating Grants
Codes Expenses for Services and Contributions
Governmental Activities:
0011 Instruction 744,773,700$ 639,741$ 123,637,850$
0012 Instructional Resources & Media Services 14,730,098 - 1,163,114
0013 Curriculum & Staff Development 25,546,294 - 6,589,279
0021 Instructional Leadership 24,350,467 - 3,646,653
0023 School Leadership 65,317,455 - 6,708,974
0031 Guidance, Counseling & Evaluation Services 48,342,763 14,820 17,135,417
0032 Social Work Services 3,985,091 - 725,111
0033 Health Services 14,109,435 - 13,295,534
0034 Student (Pupil) Transportation 34,916,467 - 2,498,579
0035 Child Nutrition Services 45,875,824 528,898 37,238,052
0036 Co-curricular/Extracurricular Activities 28,636,409 1,529,246 8,664,830
0041 General Administration 22,765,568 52,106 9,069,004
0051 Plant Maintenance & Operations 103,934,580 2,265,818 4,458,973
0052 Security & Monitoring Services 10,403,685 92,223 1,340,005
0053 Data Processing Services 19,725,342 - 7,831,217
0061 Community Services 6,914,907 1,650,400 4,459,490
0072 Debt Service - Interest 55,223,005 - 2,846,014
0073 Debt Service - Fiscal Charges 2,033,136 - -
0081 Facilities Acquisition and Construction - - 1,057,520 0093 Payments to Member Districts of SSA - - -
TOTAL GOVERNMENTAL ACTIVITIES 1,271,584,226 6,773,252 252,365,616 Business-type activities:
Enterprise fund 7,650,160 3,650,183 -
TP TOTAL PRIMARY GOVERNMENT 1,279,234,386$ 10,423,435$ 252,365,616$
General Revenues:
Taxes:
MT Property Taxes, Levied for General Purposes
DT Property Taxes, Levied for Debt Service
SF State aid - unrestricted formula grants
MI Miscellaneous local & intermediate
E1 Extraordinary Item
FR TransfersIE Investment earnings
TR Total general revenues
CN Changes in Net PositionNB Net Position -- beginning
NE Net Position -- ending
The accompanying notes are an integral part of this statement.
Functions/Programs
16

Exhibit B-1
6
Total Governmental Business-type Total Primary
Activities Activities Government
(620,496,109)$ (620,496,109)$
(13,566,984) (13,566,984)
(18,957,015) (18,957,015)
(20,703,814) (20,703,814)
(58,608,481) (58,608,481)
(31,192,526) (31,192,526)
(3,259,980) (3,259,980)
(813,901) (813,901)
(32,417,888) (32,417,888)
(8,108,874) (8,108,874)
(18,442,333) (18,442,333)
(13,644,458) (13,644,458)
(97,209,789) (97,209,789)
(8,971,457) (8,971,457)
(11,894,125) (11,894,125)
(805,017) (805,017)
(52,376,991) (52,376,991)
(2,033,136) (2,033,136)
1,057,520 1,057,520 - -
(1,012,445,358) (1,012,445,358)
- (3,999,977)$ (3,999,977)
(1,012,445,358)$ (3,999,977)$ (1,016,445,335)$
579,567,158 - 579,567,158
204,274,287 - 204,274,287
252,162,498 - 252,162,498
950,233 - 950,233
13,626,851 - 13,626,851
(2,200,000) 2,200,000 - 1,054,516 1,884 1,056,400
1,049,435,543 2,201,884 1,051,637,427
36,990,185 (1,798,093) 35,192,092 (66,185,417) 2,749,021 (63,436,396)
(29,195,232)$ 950,928$ (28,244,304)$
Net (Expense) Revenue and Changes in Net Position
17
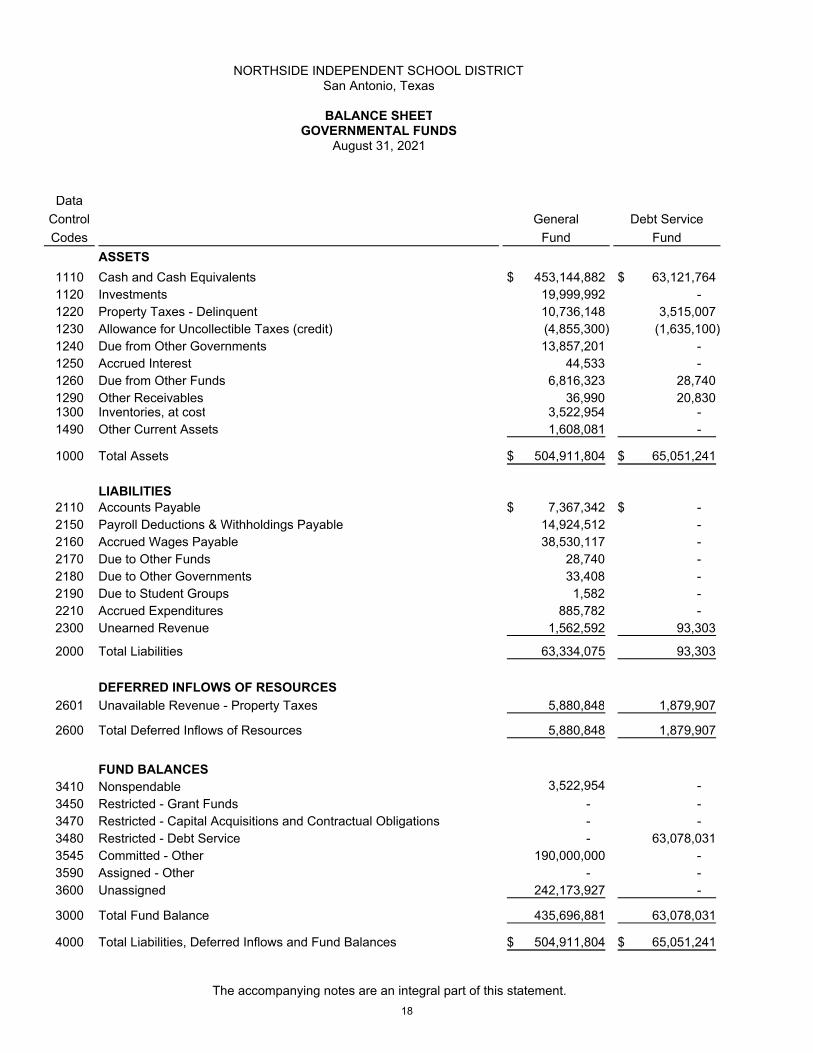
NORTHSIDE INDEPENDENT SCHOOL DISTRICTSan Antonio, Texas
BALANCE SHEETGOVERNMENTAL FUNDS
August 31, 2021
Data
Control
Codes
General
Fund
Debt Service
Fund
ASSETS
1110 Cash and Cash Equivalents 453,144,882$ 63,121,764$ 1120 Investments 19,999,992 - 1220 Property Taxes - Delinquent 10,736,148 3,515,007 1230 Allowance for Uncollectible Taxes (credit) (4,855,300) (1,635,100) 1240 Due from Other Governments 13,857,201 - 1250 Accrued Interest 44,533 - 1260 Due from Other Funds 6,816,323 28,740 1290 Other Receivables 36,990 20,830 1300 Inventories, at cost 3,522,954 - 1490 Other Current Assets 1,608,081 -
1000 Total Assets 504,911,804$ 65,051,241$
LIABILITIES2110 Accounts Payable 7,367,342$ -$ 2150 Payroll Deductions & Withholdings Payable 14,924,512 - 2160 Accrued Wages Payable 38,530,117 - 2170 Due to Other Funds 28,740 - 2180 Due to Other Governments 33,408 - 2190 Due to Student Groups 1,582 - 2210 Accrued Expenditures 885,782 - 2300 Unearned Revenue 1,562,592 93,303
2000 Total Liabilities 63,334,075 93,303
DEFERRED INFLOWS OF RESOURCES
2601 Unavailable Revenue - Property Taxes 5,880,848 1,879,907
2600 Total Deferred Inflows of Resources 5,880,848 1,879,907
FUND BALANCES3410 Nonspendable 3,522,954 -
3450 Restricted - Grant Funds - - 3470 Restricted - Capital Acquisitions and Contractual Obligations - - 3480 Restricted - Debt Service - 63,078,031 3545 Committed - Other 190,000,000 - 3590 Assigned - Other - - 3600 Unassigned 242,173,927 -
3000 Total Fund Balance 435,696,881 63,078,031
4000 Total Liabilities, Deferred Inflows and Fund Balances 504,911,804$ 65,051,241$
The accompanying notes are an integral part of this statement.
18
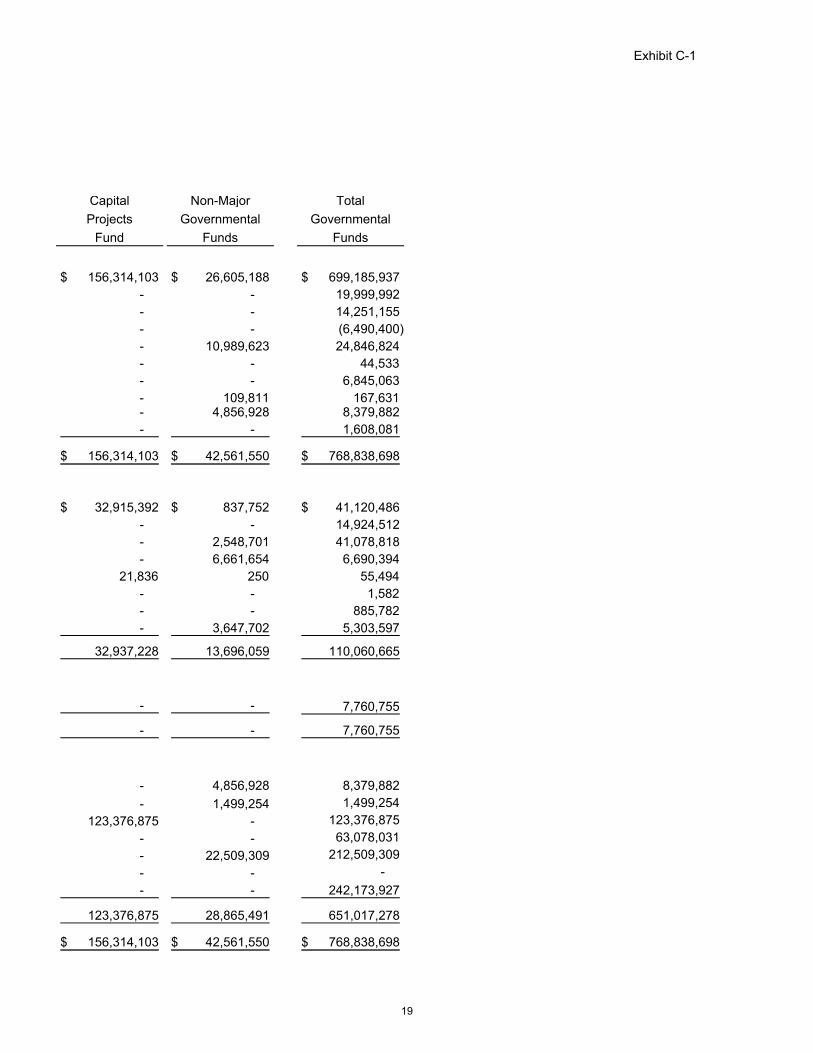
Exhibit C-1
Capital
Projects
Fund
Non-Major
Governmental
Funds
Total
Governmental
Funds
156,314,103$ 26,605,188$ 699,185,937$ - - 19,999,992 - - 14,251,155 - - (6,490,400) - 10,989,623 24,846,824 - - 44,533 - - 6,845,063 - 109,811 167,631 - 4,856,928 8,379,882 - - 1,608,081
156,314,103$ 42,561,550$ 768,838,698$
32,915,392$ 837,752$ 41,120,486$ - - 14,924,512 - 2,548,701 41,078,818 - 6,661,654 6,690,394
21,836 250 55,494 - - 1,582 - - 885,782 - 3,647,702 5,303,597
32,937,228 13,696,059 110,060,665
- - 7,760,755
- - 7,760,755
- 4,856,928 8,379,882
- 1,499,254 1,499,254
123,376,875 - 123,376,875
- - 63,078,031
- 22,509,309 212,509,309
- - -
- - 242,173,927
123,376,875 28,865,491 651,017,278
156,314,103$ 42,561,550$ 768,838,698$
19

(This page intentionally left blank)
20

Exhibit C-2NORTHSIDE INDEPENDENT SCHOOL DISTRICT
San Antonio, Texas
RECONCILIATION OF THE GOVERNMENTAL FUNDS BALANCE SHEET TO THESTATEMENT OF NET POSITION
August 31, 2021
Amounts reported for government activities in the Statement of Net Position are different because:
Total fund balances - governmental funds 651,017,278$
The District uses internal service funds to charge the costs of certain activities, such as printing, armored car service and self-insurance (worker's compensation, equipment and unemployment) to appropriate functions in other funds. The assets and liabilities of the internal service funds are included in the governmental activities in the statement of net position, including furniture and equipment and accumulated depreciation in the following amounts: 8,882,778
Furniture and Equipment 1,745,018$ Accumulated Depreciation - Furniture and Equipment (1,482,023)
Capital assets used in governmental activities are not financial resources, and therefore, arenot reported as assets in the governmental funds.
Land 112,239,650$ Buildings 3,147,399,417 Furniture and Equipment 140,082,277 Construction in Progress 304,904,043 3,704,625,387
Accumulated Depreciation - Buildings (1,168,647,977) Accumulated Depreciation - Furniture and Equipment (88,537,547) (1,257,185,524)
Long-term liabilities, including bonds payable, are not due and payable in the current period andtherefore, are not reported as liabilities in the funds. Unearned revenue is not reported as aliability in the government-wide financial statements, because the revenue is consideredearned.
Accrued Interest - Bonds (7,702,019)$ Bonds Payable - Long-term (2,265,280,000) Unamortized Bond Premiums (142,854,551) Other Long term Liability - Accrued Vacation (8,424,199) (2,424,260,769)
Unavailable revenue from property taxes and other items is not reported as a deferred inflow inthe government-wide financial statements, because the revenue is considered earned.
Property Taxes 7,760,755
Deferred Charge on Refunding Bonds is a deferred outflow and is not reported in the fundfinancial statements. 11,968,442
Included in the items related to long term debt, as required by GASB 68 and 75, are the District's proportionate share of the net pension liability (304,096,292)$ District's proportionate share of the net OPEB liability (298,608,482) Deferred resource inflow related to TRS pension (63,356,585) Deferred resource inflow related to TRS OPEB (235,962,327) Deferred resource outflow related to TRS pension 107,981,421 Deferred resource outflow related to TRS OPEB 62,038,686 (732,003,579)
Net Position - Governmental Activities (29,195,232)$
The accompanying notes are an integral part of this statement.
21
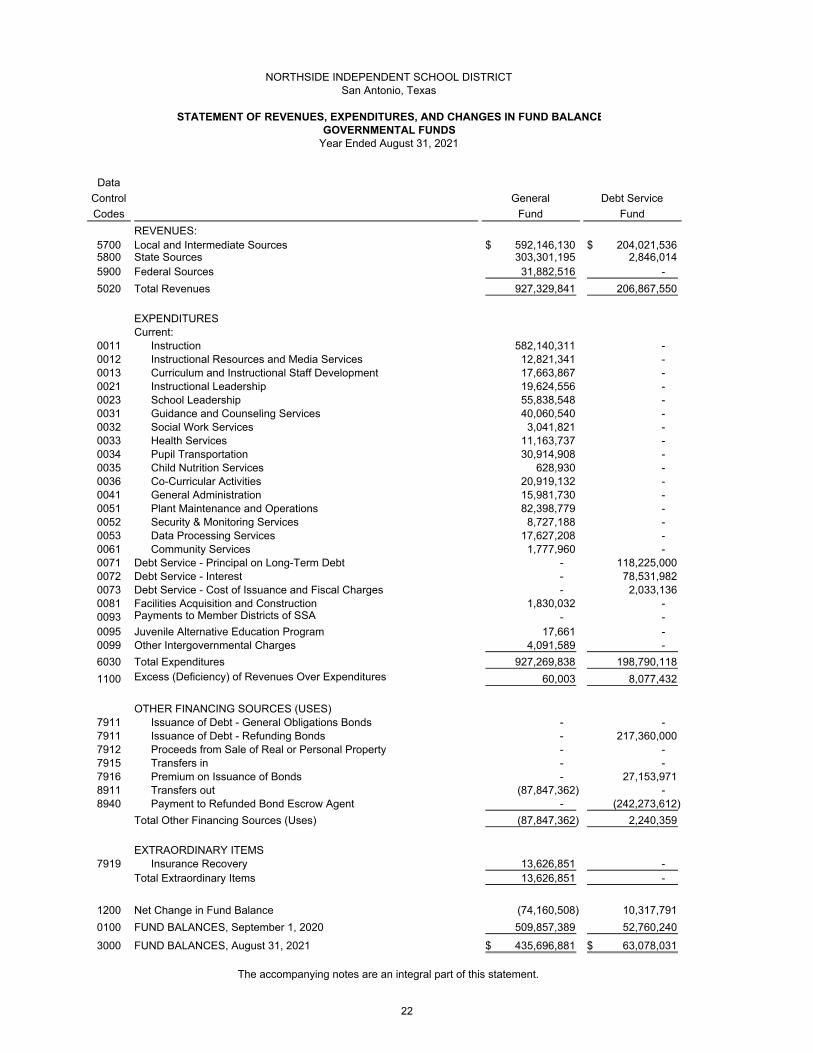
NORTHSIDE INDEPENDENT SCHOOL DISTRICTSan Antonio, Texas
STATEMENT OF REVENUES, EXPENDITURES, AND CHANGES IN FUND BALANCEGOVERNMENTAL FUNDS
Year Ended August 31, 2021
Data
Control
Codes
General
Fund
Debt Service
Fund
REVENUES:5700 Local and Intermediate Sources 592,146,130$ 204,021,536$ 5800 State Sources 303,301,195 2,846,014 5900 Federal Sources 31,882,516 -
5020 Total Revenues 927,329,841 206,867,550
EXPENDITURESCurrent:
0011 Instruction 582,140,311 - 0012 Instructional Resources and Media Services 12,821,341 - 0013 Curriculum and Instructional Staff Development 17,663,867 - 0021 Instructional Leadership 19,624,556 - 0023 School Leadership 55,838,548 - 0031 Guidance and Counseling Services 40,060,540 - 0032 Social Work Services 3,041,821 - 0033 Health Services 11,163,737 - 0034 Pupil Transportation 30,914,908 - 0035 Child Nutrition Services 628,930 - 0036 Co-Curricular Activities 20,919,132 - 0041 General Administration 15,981,730 - 0051 Plant Maintenance and Operations 82,398,779 - 0052 Security & Monitoring Services 8,727,188 - 0053 Data Processing Services 17,627,208 - 0061 Community Services 1,777,960 - 0071 Debt Service - Principal on Long-Term Debt - 118,225,000 0072 Debt Service - Interest - 78,531,982 0073 Debt Service - Cost of Issuance and Fiscal Charges - 2,033,136 0081 Facilities Acquisition and Construction 1,830,032 - 0093 Payments to Member Districts of SSA - - 0095 Juvenile Alternative Education Program 17,661 - 0099 Other Intergovernmental Charges 4,091,589 -
6030 Total Expenditures 927,269,838 198,790,118
1100 60,003 8,077,432
OTHER FINANCING SOURCES (USES)7911 Issuance of Debt - General Obligations Bonds - - 7911 Issuance of Debt - Refunding Bonds - 217,360,000 7912 Proceeds from Sale of Real or Personal Property - - 7915 Transfers in - - 7916 Premium on Issuance of Bonds - 27,153,971 8911 Transfers out (87,847,362) - 8940 Payment to Refunded Bond Escrow Agent - (242,273,612)
Total Other Financing Sources (Uses) (87,847,362) 2,240,359
EXTRAORDINARY ITEMS7919 Insurance Recovery 13,626,851 -
Total Extraordinary Items 13,626,851 -
1200 Net Change in Fund Balance (74,160,508) 10,317,791
0100 FUND BALANCES, September 1, 2020 509,857,389 52,760,240
3000 FUND BALANCES, August 31, 2021 435,696,881$ 63,078,031$
The accompanying notes are an integral part of this statement.
Excess (Deficiency) of Revenues Over Expenditures
22

Exhibit C-3
Capital
Projects
Fund
Other
Governmental
Funds
Total
Governmental
Funds
374,132$ 7,889,096$ 804,430,894$ - 8,062,604 314,209,813 - 85,808,632 117,691,148
374,132 101,760,332 1,236,331,855
- 47,273,231 629,413,542 - 19,887 12,841,228 - 3,971,435 21,635,302 - 1,275,421 20,899,977 - 189,529 56,028,077 - 1,336,493 41,397,033 - 421,548 3,463,369 - 976,141 12,139,878 - 6,994 30,921,902 - 38,296,968 38,925,898 - 4,463,355 25,382,487 - 1,155 15,982,885 - 3,167,211 85,565,990 - 607,798 9,334,986 - 49,926 17,677,134 - 3,104,458 4,882,418 - - 118,225,000 - - 78,531,982 - - 2,033,136
249,682,070 1,070,564 252,582,666 - - - - - 17,661 - - 4,091,589
249,682,070 106,232,114 1,481,974,140
(249,307,938) (4,471,782) (245,642,285)
200,000,000 - 200,000,000 135,960,000 - 353,320,000
89,920 - 89,920 83,497,362 15,704,751 99,202,113 14,866,230 - 42,020,201
(13,704,751) - (101,552,113) - - (242,273,612)
420,708,761 15,704,751 350,806,509
- - 13,626,851 - - 13,626,851
171,400,823 11,232,969 118,791,075
(48,023,948) 17,632,522 532,226,203
123,376,875$ 28,865,491$ 651,017,278$
23
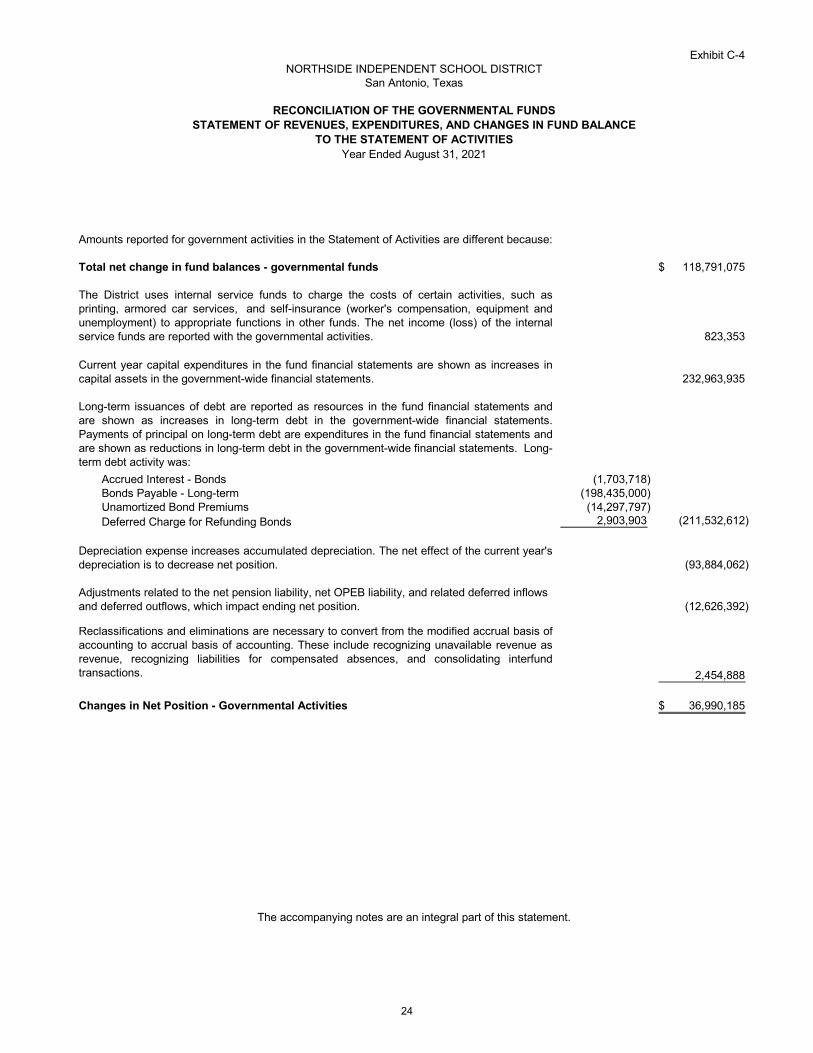
Exhibit C-4NORTHSIDE INDEPENDENT SCHOOL DISTRICT
San Antonio, Texas
RECONCILIATION OF THE GOVERNMENTAL FUNDSSTATEMENT OF REVENUES, EXPENDITURES, AND CHANGES IN FUND BALANCE
TO THE STATEMENT OF ACTIVITIESYear Ended August 31, 2021
Amounts reported for government activities in the Statement of Activities are different because:
Total net change in fund balances - governmental funds 118,791,075$
The District uses internal service funds to charge the costs of certain activities, such asprinting, armored car services, and self-insurance (worker's compensation, equipment andunemployment) to appropriate functions in other funds. The net income (loss) of the internalservice funds are reported with the governmental activities. 823,353
Current year capital expenditures in the fund financial statements are shown as increases incapital assets in the government-wide financial statements. 232,963,935
Long-term issuances of debt are reported as resources in the fund financial statements andare shown as increases in long-term debt in the government-wide financial statements.Payments of principal on long-term debt are expenditures in the fund financial statements andare shown as reductions in long-term debt in the government-wide financial statements. Long-term debt activity was:
Accrued Interest - Bonds (1,703,718) Bonds Payable - Long-term (198,435,000) Unamortized Bond Premiums (14,297,797) Deferred Charge for Refunding Bonds 2,903,903 (211,532,612)
Depreciation expense increases accumulated depreciation. The net effect of the current year'sdepreciation is to decrease net position. (93,884,062)
Adjustments related to the net pension liability, net OPEB liability, and related deferred inflows and deferred outflows, which impact ending net position. (12,626,392)
Reclassifications and eliminations are necessary to convert from the modified accrual basis ofaccounting to accrual basis of accounting. These include recognizing unavailable revenue asrevenue, recognizing liabilities for compensated absences, and consolidating interfundtransactions. 2,454,888
Changes in Net Position - Governmental Activities 36,990,185$
The accompanying notes are an integral part of this statement.
24
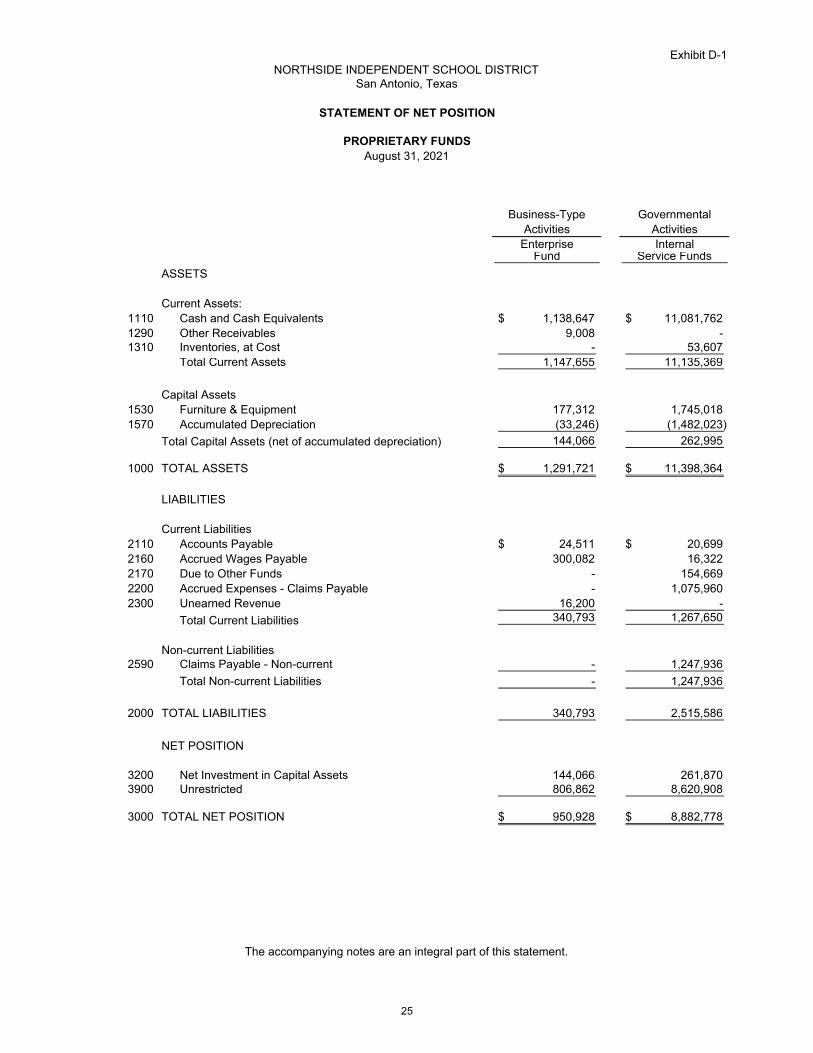
Exhibit D-1NORTHSIDE INDEPENDENT SCHOOL DISTRICT
San Antonio, Texas
STATEMENT OF NET POSITION
PROPRIETARY FUNDSAugust 31, 2021
Business-Type GovernmentalActivities Activities
Enterprise InternalFund Service Funds
ASSETS
Current Assets:1110 Cash and Cash Equivalents 1,138,647$ 11,081,762$ 1290 Other Receivables 9,008 - 1310 Inventories, at Cost - 53,607
Total Current Assets 1,147,655 11,135,369
Capital Assets1530 Furniture & Equipment 177,312 1,745,018 1570 Accumulated Depreciation (33,246) (1,482,023)
Total Capital Assets (net of accumulated depreciation) 144,066 262,995
1000 TOTAL ASSETS 1,291,721$ 11,398,364$
LIABILITIES
Current Liabilities2110 Accounts Payable 24,511$ 20,699$ 2160 Accrued Wages Payable 300,082 16,322 2170 Due to Other Funds - 154,669 2200 Accrued Expenses - Claims Payable - 1,075,960 2300 Unearned Revenue 16,200 -
Total Current Liabilities 340,793 1,267,650
Non-current Liabilities 2590 Claims Payable - Non-current - 1,247,936
Total Non-current Liabilities - 1,247,936
2000 TOTAL LIABILITIES 340,793 2,515,586
NET POSITION
3200 Net Investment in Capital Assets 144,066 261,870 3900 Unrestricted 806,862 8,620,908
3000 TOTAL NET POSITION 950,928$ 8,882,778$
The accompanying notes are an integral part of this statement.
25
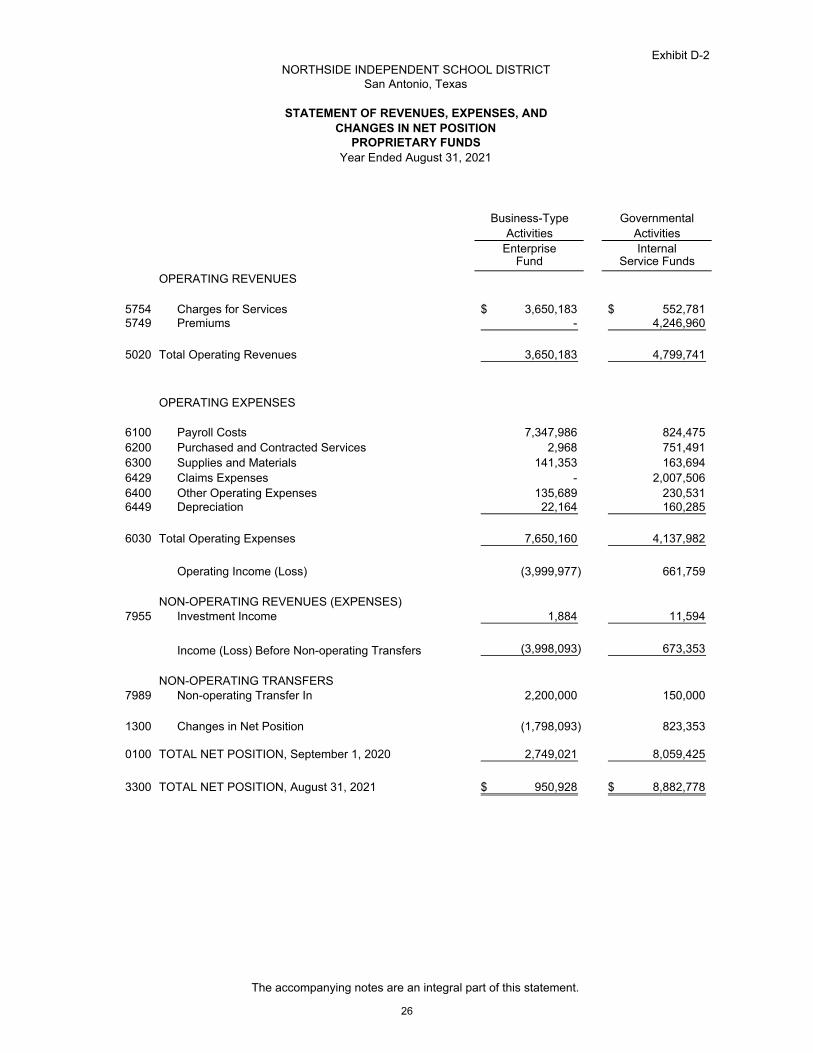
Exhibit D-2NORTHSIDE INDEPENDENT SCHOOL DISTRICT
San Antonio, Texas
STATEMENT OF REVENUES, EXPENSES, ANDCHANGES IN NET POSITION
PROPRIETARY FUNDSYear Ended August 31, 2021
Business-Type GovernmentalActivities Activities
Enterprise InternalFund Service Funds
OPERATING REVENUES
5754 Charges for Services 3,650,183$ 552,781$ 5749 Premiums - 4,246,960
5020 Total Operating Revenues 3,650,183 4,799,741
OPERATING EXPENSES
6100 Payroll Costs 7,347,986 824,475 6200 Purchased and Contracted Services 2,968 751,491 6300 Supplies and Materials 141,353 163,694 6429 Claims Expenses - 2,007,506 6400 Other Operating Expenses 135,689 230,531 6449 Depreciation 22,164 160,285
6030 Total Operating Expenses 7,650,160 4,137,982
Operating Income (Loss) (3,999,977) 661,759
NON-OPERATING REVENUES (EXPENSES)7955 Investment Income 1,884 11,594
Income (Loss) Before Non-operating Transfers (3,998,093) 673,353
NON-OPERATING TRANSFERS7989 Non-operating Transfer In 2,200,000 150,000
1300 Changes in Net Position (1,798,093) 823,353
0100 TOTAL NET POSITION, September 1, 2020 2,749,021 8,059,425
3300 TOTAL NET POSITION, August 31, 2021 950,928$ 8,882,778$
The accompanying notes are an integral part of this statement.
26

Exhibit D-3NORTHSIDE INDEPENDENT SCHOOL DISTRICT
San Antonio, Texas
STATEMENT OF CASH FLOWS
PROPRIETARY FUNDSYear Ended August 31, 2021
Business-Type GovernmentalActivities Activities
Enterprise InternalFund Service Funds
CASH FLOWS FROM OPERATING ACTIVITIES:Cash Received from Customers 3,114,263$ -$ Cash Received from Interfund Services Provided - 4,322,859 Cash Payments to Employees for Services (7,507,063) (822,875) Cash Payments to Suppliers (128,861) (963,669) Cash Payments for Insurance Claims - (2,129,284) Cash Payments for Other Operating Expenses (135,689) (230,531)
Net Cash Provided (Used) by Operating Activities (4,657,350) 176,500
CASH FLOWS FROM NONCAPITAL FINANCING ACTIVITIES:Nonoperating Transfers In (Out) 2,200,000 150,000
CASH FLOWS FROM CAPITAL AND RELATED FINANCING ACTIVITIES:Acquisition of Capital Assets - (22,497)
Net Cash Flows Provided (Used) by Capital and Related Financing Activities - (22,497)
CASH FLOWS FROM INVESTING ACTIVITIESInvestment Earnings 1,884 11,594 Net Cash Flows Provided (Used) by Investing Activities 1,884 11,594
Net Increase In Cash & Cash Equivalents (2,455,466) 315,597
CASH AND CASH EQUIVALENTS, September 1, 2020 3,594,113 10,766,165
CASH AND CASH EQUIVALENTS, August 31, 2021 1,138,647$ 11,081,762$
Reconciliation of Operating Income (Loss) to Net CashProvided (Used) by Operating Activities:
Operating Income (Loss) (3,999,977)$ 661,759$ Adjustments to Reconcile Operating Income to
Net Cash Provided (Used) by Operating Activities:Depreciation 22,164 160,285
Effect of Changes in Current Assets and Liabilities:(Increase) Decrease in Other Receivables 114,096 - (Increase) Decrease in Inventories - (14,158) Increase (Decrease) in Accounts Payable 15,460 (34,326) Increase (Decrease) in Due to Other Funds - (158,624) Increase (Decrease) in Due to Other Government Funds - (318,258) Increase (Decrease) in Claims Payable - (121,778) Increase (Decrease) in Unearned Revenue (650,016) - Increase (Decrease) in Accrued Wages (159,077) 1,600
Net Cash Provided (Used) by Operating Activities (4,657,350)$ 176,500$
The accompanying notes are an integral part of this statement.
27

Exhibit E-1NORTHSIDE INDEPENDENT SCHOOL DISTRICT
San Antonio, Texas
STATEMENT OF FIDUCIARY ASSETS AND LIABILITIES
FIDUCIARY FUNDAugust 31, 2021
CUSTODIALFUNDS
ASSETS
1110 Cash and cash equivalents 1,880,512$
1290 Receivables 17,119
1000 Total assets 1,897,631
LIABILITIES
2111 Accounts payable 255,378
2180 Due to other governments 559,241
2000 Total liabilities 814,619
NET POSITIONRestricted for:
2190 Student Groups 802,752 Individuals and organizations 280,260
TOTAL NET POSITION, August 31 (Ending) 1,897,631$
The accompanying notes are an integral part of this statement.
28

Exhibit E-2NORTHSIDE INDEPENDENT SCHOOL DISTRICT
San Antonio, Texas
STATEMENT OF CHANGES IN FIDUCIARY FUND NET POSITION
FIDUCIARY FUNDAugust 31, 2021
CUSTODIALFUNDS
ADDITIONS:
Received from Student Groups 652,349$
Concession Services Revenue 566,978
Contributions, Gifts, Donations, and Fees 243,103
Total Operating Revenues 1,462,430
DEDUCTIONS:
Professional and Contracted Services 499,902
Supplies and Materials 2,640,534
Other Deductions 657,196
Total Operating Expenses 3,797,632
Operating Transfer in from Governmental Funds
Changes in Fiduciary Net Position (2,335,202)
TOTAL NET POSITION, September 1 Adoption of GASB No. 84 4,232,833
TOTAL NET POSITION, August 31 (Ending) 1,897,631$
The accompanying notes are an integral part of this statement.
29
NORTHSIDE INDEPENDENT SCHOOL DISTRICT San Antonio, Texas
NOTES TO FINANCIAL STATEMENTS
August 31, 2021
1. SUMMARY OF SIGNIFICANT ACCOUNTING POLICIES
a. Reporting Entity
The Board of School Trustees (Board), a seven-member group, has governance responsibilitiesover all activities related to public elementary and secondary education within the jurisdiction of theNorthside Independent School District, San Antonio, Texas. Because members of the Board ofTrustees are elected by the public, have the authority to make decisions, appoint administratorsand managers, and significantly influence operations, and have the primary accountability for fiscalmatters, the District is not included in any other governmental "reporting entity" as defined byGovernmental Accounting Standards Board (GASB), Statement No. 14, "The Financial ReportingEntity”, and/or GASB Statements No. 39, No. 61, and No. 80, determining whether certainorganizations are component units. There are no component units included within the reportingentity. Since the District receives funding from local, state, and federal government sources, it mustcomply with the requirements of the entities providing those funds.
The accounting policies of the District substantially comply with the rules prescribed in the TexasEducation Agency Financial Accountability System Resource Guide (Resource Guide). Theaccounting policies included in the Resource Guide conform to accounting principles generallyaccepted in the United States of America applicable to state and local governmental units. TheGovernmental Accounting Standards Board (GASB) is the accepted body for establishinggovernmental accounting and financial reporting standards.
b. Government-wide and Fund Financial Statements
The government-wide financial statements (i.e. statement of net position and the statement ofactivities) display information about the District. These statements include the financial activities ofthe overall government, except for fiduciary activities. Consolidations have been made to minimizethe double counting of internal activities. Inter-fund services provided and used are not eliminatedin the process of consolidation. Governmental activities generally are financed through taxes,intergovernmental revenues, and other non-exchange transactions.
The statement of activities presents a comparison between direct expenses and program revenuesfor each function of the District’s governmental activities. Direct expenses are those that arespecifically associated with a program or function and, therefore, are clearly identifiable to aparticular function. Indirect expense allocations that have been made in the funds have beenreversed for the statement of activities. Program revenues include: (a) fees and charges paid bythe recipients of goods or services offered by the programs and (b) grants and contributionsthat are restricted to meeting the operational or capital requirements of a particular program.Property taxes, State aid - formula grants, and other items not included in program revenues arepresented as general revenues. Separate financial statements are provided for governmentalfunds, proprietary funds, and fiduciary funds, even though fiduciary funds are excluded from thegovernment-wide financial statements. Major individual governmental funds are reported asseparate columns in the fund financial statements. Proprietary funds distinguish operatingrevenues and expenses from nonoperating items. Operating revenues and expenses generallyresult from providing services and producing and delivering goods in connection with the LearningTree after school program, the internal service fund’s print shop and self-funded programs.Operating expenses include the cost of sales and services, administrative expenses, anddepreciation on capital assets. All other revenues and expenses are non-operating.
30

NORTHSIDE INDEPENDENT SCHOOL DISTRICT San Antonio, Texas
NOTES TO FINANCIAL STATEMENTS
August 31, 2021
1. SUMMARY OF SIGNIFICANT ACCOUNTING POLICIES (Continued)
c. Measurement Focus, Basis of Accounting, and Financial Statement Presentation
The government-wide financial statements are reported using the economic resources measurement focus and the accrual basis of accounting, as are the proprietary fund and fiduciary fund financial statements. Custodial funds have no economic resources measurement focus and are presented on the accrual basis of accounting. Revenues are recorded when earned and expenses are recorded at the time liabilities are incurred, regardless of when the related cash flows take place. Non-exchange transactions, in which the District gives (or receives) value without directly receiving (or giving) equal value in exchange, include property taxes, grants, entitlements, and donations. On an accrual basis, revenue from property taxes is recognized in the fiscal year for which the taxes are levied. Revenue from grants, entitlements, and donations is recognized in the fiscal year in which all eligibility requirements imposed by the provider have been met.
Governmental fund financial statements are reported using the current financial resources measurement focus and the modified accrual basis of accounting. Under this method, revenues are recognized when they are both measurable and available. For this purpose, the District considers all revenues to be available if the revenues are collected within sixty days after year-end. Expenditures generally are recorded when the related fund liability is incurred, if measurable, except for debt service expenditures, and compensated absences, which are recognized as expenditures only when payment is due. Property tax revenue, interest, and revenues received from the State are recognized under the susceptible to accrual concept. Only the portion of special assessments receivable due within the current fiscal period is considered to be susceptible to accrual as revenue of the current period. Miscellaneous revenues are recorded as revenues when received in cash because they are generally not measurable until actually received. Investment earnings are recorded as earned, since they are both measurable and available. General capital asset acquisitions are reported as expenditures in governmental funds.
Grants funds are recorded as revenues when all eligibility requirements are met, including any time requirements, and the amount is received during the period or within the availability period. Expenditure driven grants are recognized as revenue when the qualifying expenditures have been incurred and all other eligibility requirements have been met, and the amount has been received during the period or within the available period of this revenue source. All other revenue items are considered to be measurable and available only when cash is received by the District.
The proprietary fund types are accounted for on a flow of economic resources measurement focus and utilize the accrual basis of accounting. This basis of accounting recognizes revenues in the accounting period in which they are earned and become measurable. Expenses are recognized in the accounting period in which they are incurred and become measurable. With this measurement focus, all assets and all liabilities associated with the operation of these funds are included on the Statement of Net Position. The net position is segregated into net investment in capital assets, restricted net position, and unrestricted net position.
Under the terms of grant agreements, the District funds certain programs by a combination of specific cost-reimbursement grants, categorical block grants, and general revenues. Thus, when program expenses are incurred, there are both restricted and unrestricted net position available to finance the program. It is the District’s policy to apply block grants, followed by general revenues and then cost reimbursement grant resources.
31
NORTHSIDE INDEPENDENT SCHOOL DISTRICT San Antonio, Texas
NOTES TO FINANCIAL STATEMENTS
August 31, 2021
1. SUMMARY OF SIGNIFICANT ACCOUNTING POLICIES (Continued)
The District reports the following major governmental funds:
• General Fund - The General Fund accounts for financial resources used for the fundamental operations of the District. All revenues and expenditures not required to be accounted for in other funds are included here. It is a budgeted fund and unassigned fund balances are considered resources available for current operations. From year to year within unassigned fund balance are investments with a maturity of greater than one year from the date of the financial statements. The District has traditionally held investments to maturity and does not intend for those investments to be utilized for expenditures in the budget year following the date of the financial statements. All but one investment with a maturity greater than one year for the year ending August 31, 2021 which had call date features, were exercised prior to the issuance of this report. General Fund primary revenue sources include local property taxes and state funding.
• Debt Service Fund - The Debt Service Fund accounts for the accumulation of resources for, and the payment of bonded debt principal and interest. The primary revenue source is local property taxes levied specifically for debt service. The fund balance of this fund represents amounts that will be used for retirement of bonds and payment of interest in the future. The Debt Service Fund is a budgeted fund.
• Capital Projects Fund - The Capital Projects Fund was established to account for the proceeds from the sale of bonds including earnings on investments of the fund. Proceeds are used for acquiring school sites, constructing and equipping new school facilities, and renovating existing facilities.
Additionally, the District reports the following fund types:
• Special Revenue Funds - These funds are used to account for the majority of federal and state funded grants. These grants are awarded to the District with the purpose of accomplishing specific educational tasks. Funds are used primarily for math and reading improvement programs for the educationally deprived, special education programs involving learning disabilities and the physically handicapped, career and technology education programs, and a child nutrition program, in addition to campus supported activities. The District’s Special Revenue Funds use project accounting and budgeting for all funds.
• Enterprise Fund – This fund is used to account for after-school and summer programs for elementary and middle school students.
• Internal Service Funds – These funds are used to account for the financing of goods and services provided by one fund to other funds of the District, on a cost reimbursement basis. These activities include printing services, armored car services and the worker’s compensation self-funded insurance program of the District. These are not budgeted funds.
• Custodial Funds - These funds are used to account for assets held by the District as an agent for individuals, private organizations, other governmental units, which are not held in trust. These include funds set aside for scholarships and monies that are collected principally through fund raising efforts of the individual schools or school-sponsored groups (student activity funds).
32
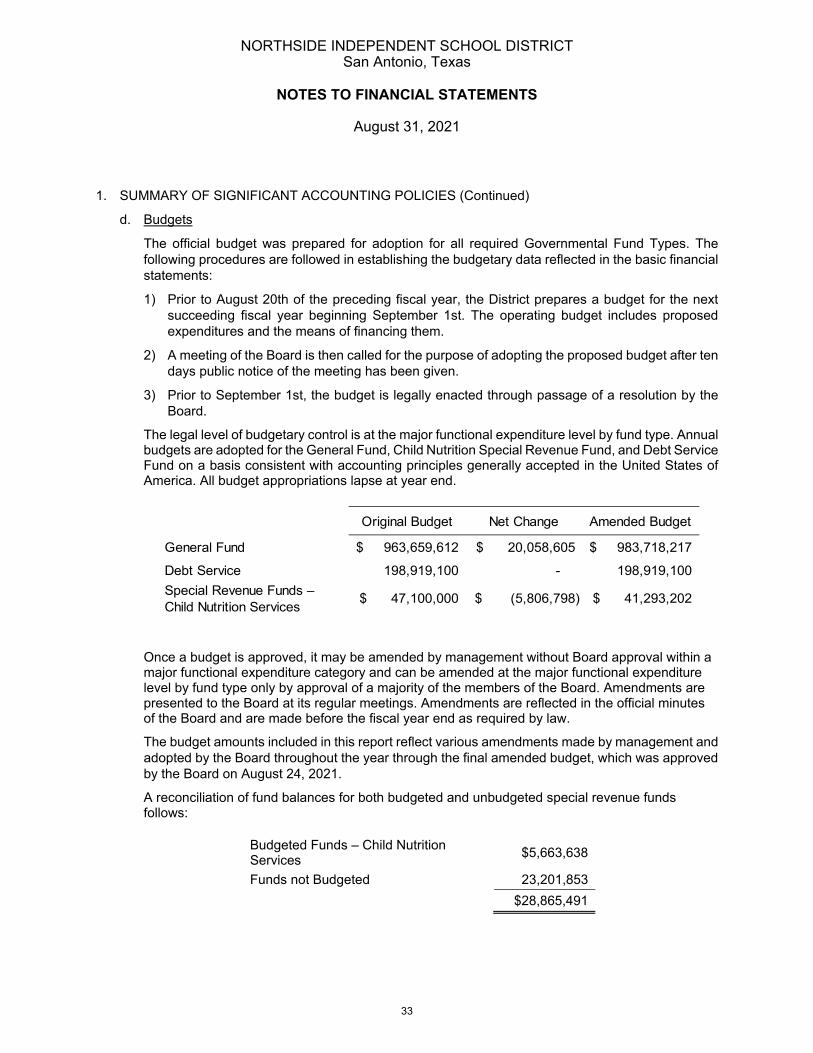
NORTHSIDE INDEPENDENT SCHOOL DISTRICT San Antonio, Texas
NOTES TO FINANCIAL STATEMENTS
August 31, 2021
1. SUMMARY OF SIGNIFICANT ACCOUNTING POLICIES (Continued)
d. Budgets
The official budget was prepared for adoption for all required Governmental Fund Types. The following procedures are followed in establishing the budgetary data reflected in the basic financial statements:
1) Prior to August 20th of the preceding fiscal year, the District prepares a budget for the next succeeding fiscal year beginning September 1st. The operating budget includes proposed expenditures and the means of financing them.
2) A meeting of the Board is then called for the purpose of adopting the proposed budget after ten days public notice of the meeting has been given.
3) Prior to September 1st, the budget is legally enacted through passage of a resolution by the Board.
The legal level of budgetary control is at the major functional expenditure level by fund type. Annual budgets are adopted for the General Fund, Child Nutrition Special Revenue Fund, and Debt Service Fund on a basis consistent with accounting principles generally accepted in the United States of America. All budget appropriations lapse at year end.
Original Budget Net Change Amended Budget
General Fund 963,659,612$ 20,058,605$ 983,718,217$
Debt Service 198,919,100 - 198,919,100 Special Revenue Funds – Child Nutrition Services 47,100,000$ (5,806,798)$ 41,293,202$
Once a budget is approved, it may be amended by management without Board approval within a major functional expenditure category and can be amended at the major functional expenditure level by fund type only by approval of a majority of the members of the Board. Amendments are presented to the Board at its regular meetings. Amendments are reflected in the official minutes of the Board and are made before the fiscal year end as required by law.
The budget amounts included in this report reflect various amendments made by management and adopted by the Board throughout the year through the final amended budget, which was approved by the Board on August 24, 2021.
A reconciliation of fund balances for both budgeted and unbudgeted special revenue funds follows:
Budgeted Funds – Child Nutrition Services $5,663,638
Funds not Budgeted 23,201,853 $28,865,491
33

NORTHSIDE INDEPENDENT SCHOOL DISTRICT San Antonio, Texas
NOTES TO FINANCIAL STATEMENTS
August 31, 2021
1. SUMMARY OF SIGNIFICANT ACCOUNTING POLICIES (Continued)
e. Encumbrances
An encumbrance system of accounting is maintained to account for commitments from approved purchase orders, work orders and contracts. Capital Projects Fund encumbrances represent significant construction commitments. Under Texas law, appropriations lapse at August 31, 2021, and encumbrances outstanding at the time are canceled or re-appropriated in the succeeding year's budget. End-of-year outstanding encumbrances that were provided for in the subsequent year’s budget are presented below:
General Fund 7,896,724$ Capital Projects Fund 123,376,875 Special Revenue Funds 3,040,820
f. Inventories
Inventories of supplies on the balance sheet are stated at cost, determined on the weighted average method, while inventories of food commodities are recorded at market values supplied by the Texas Department of Human Services on the date received. Inventories are maintained on a perpetual inventory system and adjusted at year end to physical count balances, if necessary. Inventory in governmental funds consist of expendable goods held for consumption. Reported inventories in these funds are equally offset by nonspendable fund balance. Expenditures are recorded when individual inventory items are distributed from the warehouse to campuses and District offices.
g. Long-Term Debt
In the government-wide financial statements and proprietary fund types in the fund financial statements, long-term debt and other long-term obligations are reported as liabilities in the applicable government activities or proprietary fund type statement of net position. Bond premiums and discounts are deferred and amortized over the life of the bonds using the effective interest method. Bonds payable are reported net of the applicable bond premium or discount. The amount of deferred charge for refunding transactions is reported as a deferred outflow of resources and amortized using the straight-line method over the shorter of the life of the new debt or the refunded debt.
In the fund financial statements, governmental fund types recognize bond premiums and discounts, as well as bond issuance costs during the period. The face amount of debt issued is reported as other financing sources. Premiums and discounts incurred on debt issuances are reported as other financing sources. Issuance costs, whether or not withheld from the actual debt proceeds received, are reported as debt service expenditures. Gains and losses resulting from bond refunding transactions are reported as other sources and other uses.
h. Capital Assets
Capital assets, which include land, buildings and improvements, furniture and equipment, and construction in progress, are reported in the government-wide financial statements. Capital assets are defined by the District as assets with an initial, individual cost of more than $5,000 and an estimated useful life of more than one year. Such assets are recorded at historical cost or estimated historical cost. Donated capital assets are recorded at their acquisition value at the date of donation. The cost of normal maintenance and repairs that do not add to the value of the asset or materially
34

NORTHSIDE INDEPENDENT SCHOOL DISTRICT San Antonio, Texas
NOTES TO FINANCIAL STATEMENTS
August 31, 2021
1. SUMMARY OF SIGNIFICANT ACCOUNTING POLICIES (Continued)
h. Capital Assets (continued)
extend asset lives is not capitalized. Capital assets are depreciated using the straight-line method over the following estimated useful lives:
Asset Class Estimated Useful LivesBuildings and Improvements 10 – 40 years
Automotive Equipment 7 – 18 years
Furniture and Equipment 5 – 15 years i. Fund Equity
In the governmental fund financial statements, fund balance amounts that are not available for appropriation or are legally restricted by outside parties for a specific purpose are designated as restricted, committed, assigned and non-spendable. Designations of fund balance for non-spendable amounts, commitments, and assignments have been eliminated from the government-wide financial statements. The unassigned fund balance represents that portion of the fund balance that is available for budgeting in future periods.
Commitments of fund balance may only be done by a resolution of the Board of Trustees. By Board of Trustees resolution, assignments of fund balance may be made by the Superintendent, or their designee, or the Deputy Superintendent for Business and Finance. Fund balance amounts that are restricted, committed, or assigned are considered to have been spent when the expenditure is incurred for the purpose for which the fund balance was restricted, committed, or assigned. Committed and assigned fund balances may also be relieved by Board resolution. If an expenditure meets the criteria in more than one fund balance category, then the District considers the fund balance relieved in the following order: restricted, committed, assigned, and then unassigned.
j. Net Position
In the government-wide financial statements, net position represents the difference between assets plus deferred outflows and liabilities plus deferred inflows. Net investment in capital assets consists of capital assets, net of accumulated depreciation, adjusted by outstanding debt related to the acquisition of those capital assets and any unspent bond proceeds. Net position is reported as restricted when there are limitations imposed on its use by external creditors or grantors. Any remaining net position is considered unrestricted.
k. Compensated Absences
Accumulated vacation and earned leave for eligible employees are expected to be liquidated with expendable available financial resources and are recognized as governmental fund liabilities, to the extent that they have matured.
The liability for compensated absences reported in the government-wide and proprietary fund statements consists of:
• Vacation leave earned by hourly non-exempt personnel is accrued when incurred and unused balances are distributed on termination from employment.
35

NORTHSIDE INDEPENDENT SCHOOL DISTRICT San Antonio, Texas
NOTES TO FINANCIAL STATEMENTS
August 31, 2021
1. SUMMARY OF SIGNIFICANT ACCOUNTING POLICIES (Continued)
k. Compensated Absences (continued)
• Compensatory time earned by salaried non-exempt personnel is accrued when earned. Unused balances are paid annually to the extent balances exceed 120 hours and the entire unused balance is paid on termination from employment. The liability has been calculated using the vesting method. Compensated absences typically have been liquidated in the general and the child nutrition funds.
• Accumulated State and Local leave earned by eligible employees is paid upon retirement under the Teacher’s Retirement System at a percentage of an established pay rate that increases based on years of service.
l. Cash and Cash Equivalents
Cash in bank, money market accounts, and external investment pools are reported as cash and cash equivalents in the financial statements. For the statement of cash flows, cash and cash equivalents consist of cash in banks, investment pool deposits, and securities with maturities of less than three months from the date purchased.
Investments
State statutes and Board policy authorize the District to invest any and all of its funds in fully collateralized certificates of deposit, direct debt securities of the United States of America or the state of Texas, other obligations the principal and interest of which are unconditionally guaranteed by the state of Texas or the United States, fully collateralized repurchase agreements, banker’s acceptances, public funds investment pools, money market mutual funds, commercial paper and other investments specifically allowed by Chapter 2256 of the Texas Government Code. The District participates in several local government investment pools and accrues interest based on the terms and interest rates of the pools. The District’s policy is to report local government investment pools that meet the criteria of GASB Statement No. 79, Certain External Investment Pools and Pool Participants, at the pool’s net asset value (NAV) which is based on amortized cost.
m. Accounting System
In accordance with Texas Education Code, Chapter 44, subchapter A, the District has adopted and installed an accounting system which meets at least the minimum requirements prescribed by the State Board of Education and approved by the State Auditor. Data Control codes refer to the account code structure prescribed by the Texas Education Agency in the Resource Guide.
n. Accrual of Foundation School Program Revenues
The State of Texas provides funding to Districts through the Foundation School Program based on instructional days, average daily attendance by fiscal year, and other factors. The academic year for the District typically begins after the fourth Monday in August and before the beginning of the subsequent fiscal year (September 1st). During this period, expenditures are incurred that relate directly to revenues received in the subsequent fiscal year. In the current fiscal year, the District accrued Foundation School revenues that would be received next year to match August days of instructional expenditures.
o. Unearned Revenue
Nonexchange revenues where resources are transmitted before the eligibility requirements are met are reported as unearned revenues on the balance sheet of the governmental funds.
36
NORTHSIDE INDEPENDENT SCHOOL DISTRICT San Antonio, Texas
NOTES TO FINANCIAL STATEMENTS
August 31, 2021
1. SUMMARY OF SIGNIFICANT ACCOUNTING POLICIES (Continued)
o. Unearned Revenue (continued)
Prepaid meals for the School Lunch Program and prepaid tuition for the Learning Tree enterprise fund are also recorded as unearned revenues.
p. Estimates
The preparation of financial statements in conformity with accounting principles generally accepted in the United States of America requires the District’s management to make estimates and assumptions that affect the reported amounts of assets, liabilities, deferred inflows and outflows, and disclosure of contingent liabilities at the date of the financial statements and the reported amounts of revenue and expenses/expenditures during the reported period. Actual results could differ from those estimates.
q. Indirect Expenses
School districts are required to report all expenses by function, except for certain indirect expenses – general administration and data processing services. These include expenses that are indirect and not allocated to other functions.
r. Arbitrage Payable
The Tax Reform Act of 1986 enacted section 148(f) of the Internal Revenue Code, relating to arbitrage rebate requirements, which generally provides that in order for interest on any issue of obligation to be excluded from gross income (i.e., tax-exempt), the issuer must rebate to the United States the excess of the amount earned on investments acquired from bond proceeds over the amount which would have been earned if such investments had been invested at a yield equal to the yield on the issue. This amount is determined based on current investment yields and is subject to change prior to the due date of the rebate. The due date of the rebate is five years from the date of issue. The District records the liability, which is currently payable, in the Capital Projects Fund. Arbitrage payable at August 31, 2021 is $21,836.
s. Deferred Outflows and Inflows of Resources
Deferred Outflows of Resources are reported between the assets and liabilities sections on the government-wide Statement of Net Position. These represent a consumption of net position that applies to a future period and will not be recognized until then. The District reports the deferred charge for refunding in this category, which is the difference between the carrying value of refunded debt and its reacquisition price. The District also reports deferred outflows related to pension and other post-employment benefit amounts. There are no deferred outflows of resources to report in the fund financial statements.
Deferred Inflows of Resources represent an acquisition of net position that applies to a future period and will not be recognized until then. The District reports unavailable revenue for property taxes and unavailable grant revenue in this category as these amounts are not anticipated to be available within 60 days of the fiscal year end. The Teacher Retirement system (TRS) pension and other post-employment benefits investment earnings are reported only on the Government-wide Statement of Net Position. These amounts are deferred and recognized as an inflow of resources in the period amounts become available.
37
NORTHSIDE INDEPENDENT SCHOOL DISTRICT San Antonio, Texas
NOTES TO FINANCIAL STATEMENTS
August 31, 2021
1. SUMMARY OF SIGNIFICANT ACCOUNTING POLICIES (Continued)
t. Pensions
The fiduciary net position of Teacher Retirement System (TRS) has been determined using the flow of economic resources measurement focus and full accrual basis of accounting. This includes for the purposes of measuring the net pension liability, deferred outflows of resources and deferred inflows of resources related to pensions, pension expense, and information about assets, liabilities and additions to/deductions from TRS’s fiduciary net position. Benefit payments (including refunds of employee contributions) are recognized when due and payable in accordance with the benefit terms. Investments are reported at fair value.
u. Other Post-Employment Benefits (OPEB)
The fiduciary net position of the Teacher Retirement System of Texas Care Plan has been determined using the flow of economic resources measurement focus and full accrual basis of accounting. This includes for purposes of measuring the net OPEB liability, deferred outflows of resources and deferred inflows of resources related to other post-employment benefits, OPEB expense, and information about assets, liabilities and additions to/deductions from TRS Care’s fiduciary net position. Benefit payments are recognized when due and payable in accordance with the benefit terms. There are no investments as this is a pay-as you-go plan and all cash is held in a cash account.
2. DEPOSITS AND INVESTMENTS
a. Cash Deposits
The District's funds are required to be deposited and invested under the terms of a depository contract pursuant to the School Depository Act. The depository bank deposits for safekeeping and trust with the District’s agent bank approved pledged securities in an amount sufficient to protect the District’s funds on a day-to-day basis during the period of the contract. The pledge of approved securities is waived only to the extent of the depository bank's dollar amount of Federal Deposit Insurance Corporation ("FDIC") insurance.
At August 31, 2021, the carrying amount of the District’s deposits (cash and interest bearing money market accounts) was $471,448 and the bank balance was $994,594. The District’s cash deposits at August 31, 2021 were covered by FDIC insurance and by pledged collateral held by the Federal Reserve in a book entry system in the name of the District.
In addition, the following is disclosed regarding coverage of combined balances on the date of highest deposit:
• Name of the bank: Wells Fargo Bank, N.A. • As of the date of the highest combined balance on deposit occurring during the month of May
2021, and the District’s cash deposits were partially covered by FDIC insurance and by pledged collateral.
• The largest combined balances of cash, savings, and time deposit accounts amount to $95,901,985 and occurred on May 26, 2021. The total amount of FDIC coverage at the time of the largest combined balance was $1,000,000. The amount of pledged collateral was $40,132,581. The negative collateral balance was due to the timing of proceeds from two bond refundings occurring on May 25 and May 26.
38

NORTHSIDE INDEPENDENT SCHOOL DISTRICT San Antonio, Texas
NOTES TO FINANCIAL STATEMENTS
August 31, 2021
2. DEPOSITS AND INVESTMENTS (Continued)
b. Investments
Public Funds Investment Pools
Public funds investment pools in Texas (“Pools”) are established under the authority of the Interlocal Cooperation Act, Chapter 79 of the Texas Government Code and are subject to the provisions of the Act, Chapter 2256 of the Texas Government Code. In addition to other provisions of the Act designed to promote liquidity and safety of principal, the Act requires Pools to: (1) have an advisory board composed of participants in the pool and other persons who do not have a business relationship with the pool and are qualified to advise the pool; (2) maintain a continuous rating of no lower than AAA or AAAm or an equivalent rating by at least one nationally recognized rating service; and (3) maintain the market value of its underlying investment portfolio within one half of one percent of the value of its shares.
State statutes authorize the District to invest in obligations of the U.S. Treasury, the State of Texas, certain United States agencies, certificates of deposit, money market savings accounts, repurchase agreements, no-load money market mutual funds and other investments specifically allowed by Chapter 2256 Public Funds Investment and Chapter 2257 Collateral for Public Funds of the Government Code. The District invests primarily in obligations of U.S. agencies, TexPool, LoneStar Investment Pool (“LoneStar”), the Texas Short Term Asset Reserve Program (TEXSTAR), Texas CLASS, and the Local Government Investment Cooperative (LOGIC).
The Comptroller of Public Accounts (Comptroller) exercises oversight responsibility over TexPool. Oversight includes the ability to significantly influence operations, designation of management and accountability for fiscal matters. Additionally, the Comptroller has established an advisory board composed of both participants in TexPool and other persons who do not have a business relationship with TexPool. The Advisory Board members review the investment policy and management fee structure.
LoneStar is governed by the Texas Association of School Boards. This entity has the responsibility of adopting and monitoring compliance with the investment advisor, custodian, investment consultant, administrator, and other service providers. The Board is also responsible for monitoring the performance of the Pool.
In September 2005, TEXSTAR and LOGIC merged. A separate board for each pool holds legal title to all money, investments, and assets and has the authority to employ personnel, contract for services, and engage in other administrative activities necessary or convenient to accomplish the objectives of TEXSTAR and LOGIC. The business and affairs of TEXSTAR and LOGIC are managed by their Boards in accordance with their bylaws. The Bylaws set forth procedures governing the selection of, and action taken by, the Board. Board oversight of TEXSTAR and LOGIC is maintained through daily, weekly, and monthly reporting requirements.
Texas CLASS is a local government investment pool. Texas CLASS invests in securities allowed by the Texas Public Funds Investment Act. The pool is governed by a board of trustees, elected annually by its participants.
39
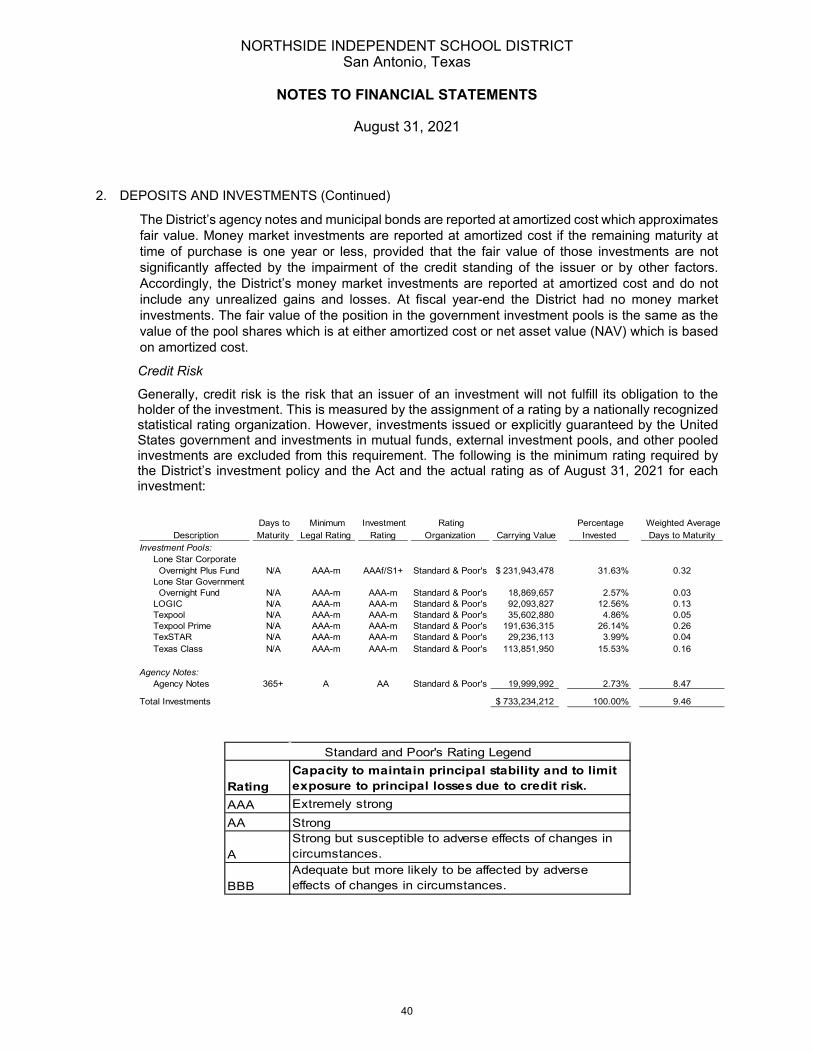
NORTHSIDE INDEPENDENT SCHOOL DISTRICT San Antonio, Texas
NOTES TO FINANCIAL STATEMENTS
August 31, 2021
2. DEPOSITS AND INVESTMENTS (Continued)
The District’s agency notes and municipal bonds are reported at amortized cost which approximates fair value. Money market investments are reported at amortized cost if the remaining maturity at time of purchase is one year or less, provided that the fair value of those investments are not significantly affected by the impairment of the credit standing of the issuer or by other factors. Accordingly, the District’s money market investments are reported at amortized cost and do not include any unrealized gains and losses. At fiscal year-end the District had no money market investments. The fair value of the position in the government investment pools is the same as the value of the pool shares which is at either amortized cost or net asset value (NAV) which is based on amortized cost.
Credit Risk
Generally, credit risk is the risk that an issuer of an investment will not fulfill its obligation to the holder of the investment. This is measured by the assignment of a rating by a nationally recognized statistical rating organization. However, investments issued or explicitly guaranteed by the United States government and investments in mutual funds, external investment pools, and other pooled investments are excluded from this requirement. The following is the minimum rating required by the District’s investment policy and the Act and the actual rating as of August 31, 2021 for each investment:
Description Days to Maturity
Minimum Legal Rating
Investment Rating
Rating Organization Carrying Value
Percentage Invested
Weighted Average Days to Maturity
Investment Pools:Lone Star Corporate Overnight Plus Fund N/A AAA-m AAAf/S1+ Standard & Poor's 231,943,478$ 31.63% 0.32Lone Star Government Overnight Fund N/A AAA-m AAA-m Standard & Poor's 18,869,657 2.57% 0.03LOGIC N/A AAA-m AAA-m Standard & Poor's 92,093,827 12.56% 0.13Texpool N/A AAA-m AAA-m Standard & Poor's 35,602,880 4.86% 0.05Texpool Prime N/A AAA-m AAA-m Standard & Poor's 191,636,315 26.14% 0.26TexSTAR N/A AAA-m AAA-m Standard & Poor's 29,236,113 3.99% 0.04Texas Class N/A AAA-m AAA-m Standard & Poor's 113,851,950 15.53% 0.16
Agency Notes:
Agency Notes 365+ A AA Standard & Poor's 19,999,992 2.73% 8.47
Total Investments 733,234,212$ 100.00% 9.46
RatingCapacity to maintain principal stability and to limit exposure to principal losses due to credit risk.
AAA Extremely strongAA Strong
AStrong but susceptible to adverse effects of changes in circumstances.
BBBAdequate but more likely to be affected by adverse effects of changes in circumstances.
Standard and Poor's Rating Legend
40

NORTHSIDE INDEPENDENT SCHOOL DISTRICT San Antonio, Texas
NOTES TO FINANCIAL STATEMENTS
August 31, 2021
2. DEPOSITS AND INVESTMENTS (Continued)
Concentration of Credit Risk The District is required to disclose investments in any one issuer that represents 5% or more of total investments. However, investments issued or explicitly guaranteed by the United States government and investments in mutual funds, external investment pools, and other pooled investments are excluded from this requirement. At August 31, 2021, the District had no investments that exceeded 5% total investments. Interest Rate Risk Interest rate risk is the risk that changes in market interest rates will adversely affect the fair value of an investment. Generally, the longer the maturity of an investment, the greater the sensitivity of its fair value to changes in market interest rates. As a means of limiting exposure to fair value losses due to rising interest rates, the District's investment policy states “To reduce exposure to changes in interest rates that could adversely affect the value of investments, the District shall use final and weighted-average-maturity limits and diversification. The District shall monitor interest rate risk using weighted average maturity and specific identification.” Custodial Credit Risk Custodial credit risk for investments is the risk that, in the event of the failure of the counterparty to a transaction, the District will not be able to recover the value of its investment or collateral securities that are in the possession of an outside third party. Investment securities are exposes to custodial risk if the securities are uninsured, are not register in the name of the district and are held by the counterparty, its trust or agent, but not in the District’s name. The District’s investment securities are not exposed to custodial credit risk because all securities held by the District’s custodial banks are in the District’s name. As of August 31, 2021, the District had $733,234,212 invested with a weighted average maturity of 9 days.
Fair Value Measurement The District categorizes its fair value measurements within the fair value hierarchy established by generally accepted accounting principles. The hierarchy is based on the valuation inputs used to measure the fair value of the asset.
Level 1 – inputs are quoted prices in active markets for identical assets. The District has no level 1 assets at August 31, 2021.
Level 2 – inputs are significant observable inputs, which may include quoted prices for similar assets in active markets, quoted prices of similar assets in non-active markets, and inputs other than quoted that are observable either directly or indirectly. Level 3 – inputs are unobservable and may include situations where there is minimal, if any, market activity. The District has no level 3 assets at August 31, 2021.
41

NORTHSIDE INDEPENDENT SCHOOL DISTRICT San Antonio, Texas
NOTES TO FINANCIAL STATEMENTS
August 31, 2021
2. DEPOSITS AND INVESTMENTS (Continued)
The District’s investments at August 31, 2021 are as follows:
August 31, 2021 Level 1 Level 2 Level 3Investments by fair value level:
Debt Securities:Federal Home Loan Mortgage Corporation $ 5,000,000 - $ 5,000,000 $ - Federal Farm Credit Bank System Bond 9,999,992 - 9,999,992 - Farmer Mac Agency Bond 5,000,000 - 5,000,000 -
Total Debt Securities 19,999,992 - 19,999,992 -
Total investments by fair value: $ 19,999,992 - $ 19,999,992 $ -
Investments measured at amortized cost:External Investment Pools:
Lone Star Corporate Overnight Plus Fund 231,943,478Lone Star Government Overnight Fund 18,869,657TexPool 35,602,880TexPool Prime 191,636,315
Total External Investment Pools 478,052,330
Total investments measured at amortized cost 478,052,330
Investments measured at net asset value ("NAV"):External Investment Pools:
LOGIC 92,093,827Tex STAR 29,236,113Texas Class 113,851,950
Total External Investment Pools 235,181,890
Total investments measured at NAV 235,181,890
Total Investments $ 733,234,212
The valuation method for investments measured at the NAV per share (or its equivalent) is presented on the following table.
Fair ValueUnfunded
CommitmentsRedemption Frequency
Redemption Notice Period
Investments measured at net asset value ("NAV"):External Investment Pools:
LOGIC $ 92,093,827 N/A Daily N/ATex STAR 29,236,113 N/A Daily N/ATexas Class 113,851,950 N/A Daily N/A
Total investments measured at NAV $ 235,181,890
GASB Statement Number 72 established a hierarchy that prioritizes the inputs used to measure fair value. Certain investment types utilized by the District are not required to be fair valued. Securities classified as Level 2 have used a number pricing methodologies including Treasury Desktop inputs. Since these are not prices quoted for identical securities quoted in active markets they are not classified as Level 1 inputs.
42
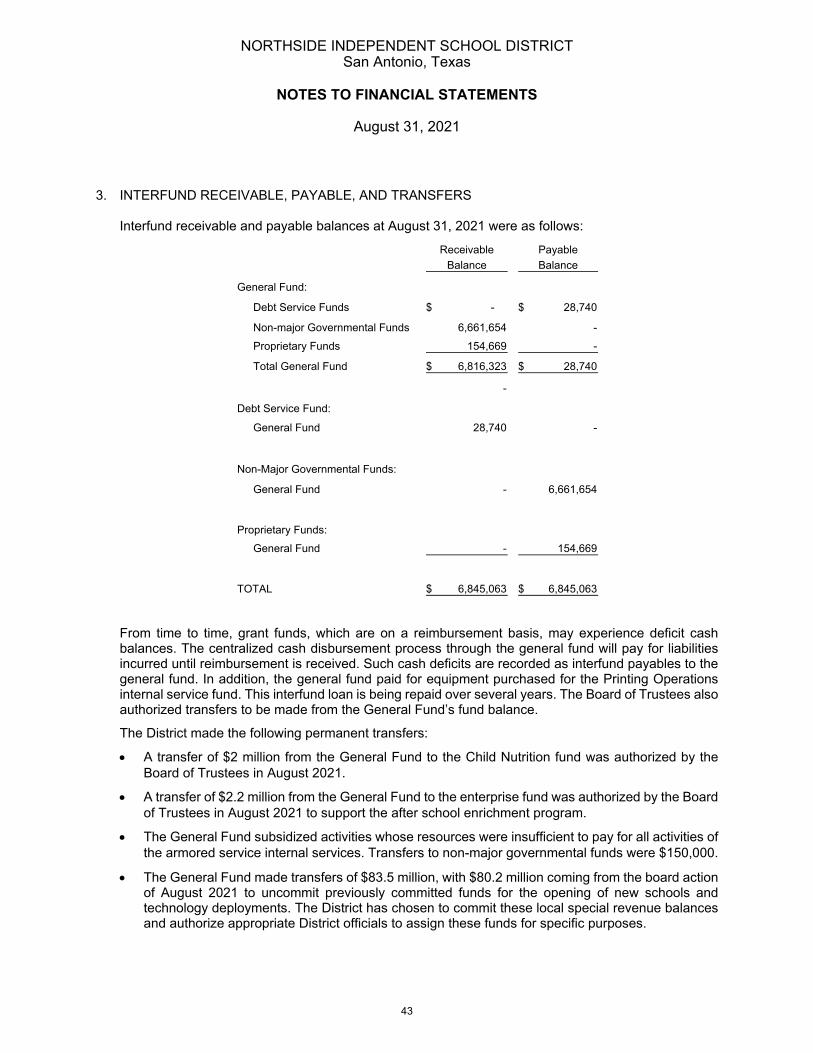
NORTHSIDE INDEPENDENT SCHOOL DISTRICT San Antonio, Texas
NOTES TO FINANCIAL STATEMENTS
August 31, 2021
3. INTERFUND RECEIVABLE, PAYABLE, AND TRANSFERS
Interfund receivable and payable balances at August 31, 2021 were as follows:
Receivable PayableBalance Balance
General Fund:
Debt Service Funds -$ 28,740$
Non-major Governmental Funds 6,661,654 - Proprietary Funds 154,669 -
Total General Fund 6,816,323$ 28,740$
-
Debt Service Fund:
General Fund 28,740 -
Non-Major Governmental Funds:
General Fund - 6,661,654
Proprietary Funds:General Fund - 154,669
TOTAL 6,845,063$ 6,845,063$
From time to time, grant funds, which are on a reimbursement basis, may experience deficit cash balances. The centralized cash disbursement process through the general fund will pay for liabilities incurred until reimbursement is received. Such cash deficits are recorded as interfund payables to the general fund. In addition, the general fund paid for equipment purchased for the Printing Operations internal service fund. This interfund loan is being repaid over several years. The Board of Trustees also authorized transfers to be made from the General Fund’s fund balance.
The District made the following permanent transfers:
• A transfer of $2 million from the General Fund to the Child Nutrition fund was authorized by the Board of Trustees in August 2021.
• A transfer of $2.2 million from the General Fund to the enterprise fund was authorized by the Board of Trustees in August 2021 to support the after school enrichment program.
• The General Fund subsidized activities whose resources were insufficient to pay for all activities of the armored service internal services. Transfers to non-major governmental funds were $150,000.
• The General Fund made transfers of $83.5 million, with $80.2 million coming from the board action of August 2021 to uncommit previously committed funds for the opening of new schools and technology deployments. The District has chosen to commit these local special revenue balances and authorize appropriate District officials to assign these funds for specific purposes.
43
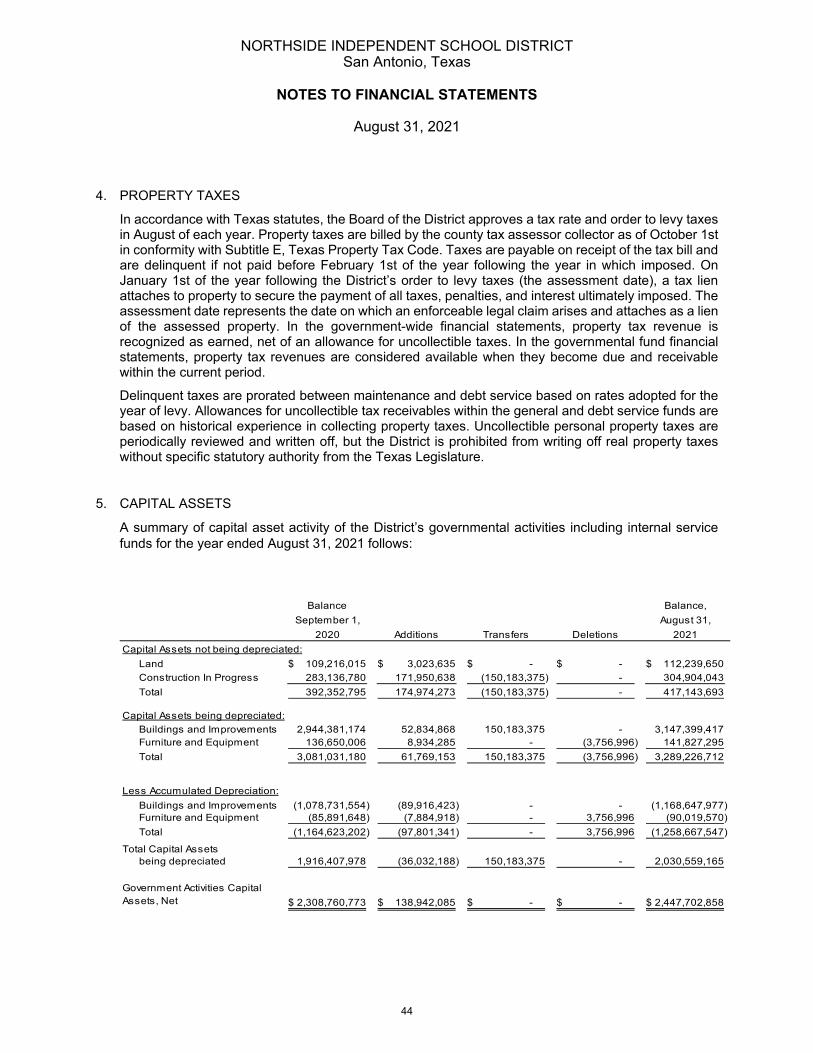
NORTHSIDE INDEPENDENT SCHOOL DISTRICT San Antonio, Texas
NOTES TO FINANCIAL STATEMENTS
August 31, 2021
4. PROPERTY TAXES
In accordance with Texas statutes, the Board of the District approves a tax rate and order to levy taxes in August of each year. Property taxes are billed by the county tax assessor collector as of October 1st in conformity with Subtitle E, Texas Property Tax Code. Taxes are payable on receipt of the tax bill and are delinquent if not paid before February 1st of the year following the year in which imposed. On January 1st of the year following the District’s order to levy taxes (the assessment date), a tax lien attaches to property to secure the payment of all taxes, penalties, and interest ultimately imposed. The assessment date represents the date on which an enforceable legal claim arises and attaches as a lien of the assessed property. In the government-wide financial statements, property tax revenue is recognized as earned, net of an allowance for uncollectible taxes. In the governmental fund financial statements, property tax revenues are considered available when they become due and receivable within the current period.
Delinquent taxes are prorated between maintenance and debt service based on rates adopted for the year of levy. Allowances for uncollectible tax receivables within the general and debt service funds are based on historical experience in collecting property taxes. Uncollectible personal property taxes are periodically reviewed and written off, but the District is prohibited from writing off real property taxes without specific statutory authority from the Texas Legislature.
5. CAPITAL ASSETS
A summary of capital asset activity of the District’s governmental activities including internal service funds for the year ended August 31, 2021 follows:
Balance Balance,September 1, August 31,
2020 Additions Transfers Deletions 2021Capital Assets not being depreciated:
Land 109,216,015$ 3,023,635$ -$ -$ 112,239,650$ Construction In Progress 283,136,780 171,950,638 (150,183,375) - 304,904,043 Total 392,352,795 174,974,273 (150,183,375) - 417,143,693
Capital Assets being depreciated:Buildings and Improvements 2,944,381,174 52,834,868 150,183,375 - 3,147,399,417 Furniture and Equipment 136,650,006 8,934,285 - (3,756,996) 141,827,295 Total 3,081,031,180 61,769,153 150,183,375 (3,756,996) 3,289,226,712
Less Accumulated Depreciation:Buildings and Improvements (1,078,731,554) (89,916,423) - - (1,168,647,977) Furniture and Equipment (85,891,648) (7,884,918) - 3,756,996 (90,019,570) Total (1,164,623,202) (97,801,341) - 3,756,996 (1,258,667,547)
Total Capital Assetsbeing depreciated 1,916,407,978 (36,032,188) 150,183,375 - 2,030,559,165
2,308,760,773$ 138,942,085$ -$ -$ 2,447,702,858$ Government Activities Capital Assets, Net
44
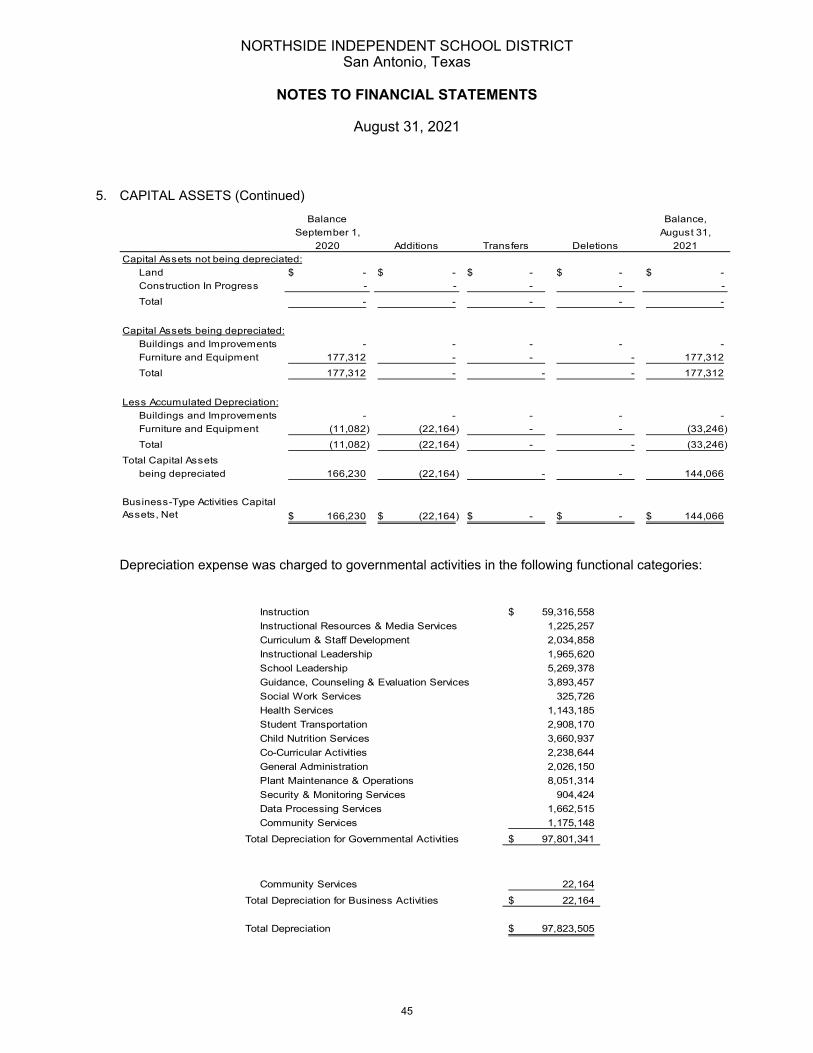
NORTHSIDE INDEPENDENT SCHOOL DISTRICT San Antonio, Texas
NOTES TO FINANCIAL STATEMENTS
August 31, 2021
5. CAPITAL ASSETS (Continued) Balance Balance,
September 1, August 31,2020 Additions Transfers Deletions 2021
Capital Assets not being depreciated:Land -$ -$ -$ -$ -$ Construction In Progress - - - - - Total - - - - -
Capital Assets being depreciated:Buildings and Improvements - - - - - Furniture and Equipment 177,312 - - - 177,312 Total 177,312 - - - 177,312
Less Accumulated Depreciation:Buildings and Improvements - - - - - Furniture and Equipment (11,082) (22,164) - - (33,246) Total (11,082) (22,164) - - (33,246)
Total Capital Assetsbeing depreciated 166,230 (22,164) - - 144,066
166,230$ (22,164)$ -$ -$ 144,066$ Business-Type Activities Capital Assets, Net
Depreciation expense was charged to governmental activities in the following functional categories:
Instruction 59,316,558$ Instructional Resources & Media Services 1,225,257 Curriculum & Staff Development 2,034,858 Instructional Leadership 1,965,620 School Leadership 5,269,378 Guidance, Counseling & Evaluation Services 3,893,457 Social Work Services 325,726 Health Services 1,143,185 Student Transportation 2,908,170 Child Nutrition Services 3,660,937 Co-Curricular Activities 2,238,644 General Administration 2,026,150 Plant Maintenance & Operations 8,051,314 Security & Monitoring Services 904,424 Data Processing Services 1,662,515 Community Services 1,175,148
Total Depreciation for Governmental Activities 97,801,341$
Community Services 22,164 Total Depreciation for Business Activities 22,164$
Total Depreciation 97,823,505$
45

NORTHSIDE INDEPENDENT SCHOOL DISTRICT San Antonio, Texas
NOTES TO FINANCIAL STATEMENTS
August 31, 2021
6. UNEARNED REVENUE
Unearned revenue consisted of the following:
General FundState Aid 1,562,592$
Total General Fund 1,562,592
Debt Service FundState Aid 93,303$
Total Debt Service Fund 93,303
Non-Major Governmental FundsPre-paid Meals 1,011,088 Grants 2,636,614
Total Non-Major Governmental Funds 3,647,702
Total Governmental Activities 5,303,597$
Enterprise Fund Learning Tree 16,200$
7. LONG-TERM LIABILITIES
Bonded Debt Payable
The District issues general obligation bonds for the governmental activities to provide funds for the acquisition and construction of major capital facilities. The bonds are supported by a pledge of the District's full faith and credit and require a levy and collection of taxes without limitation as to rate or amount on all property subject to taxation by the District sufficient in amount to pay the principal and interest on such bonds as they become due. The indentures also require that a debt service fund be created and administered by the District solely for paying principal and interest when due.
Bond indebtedness of the District is reflected in the government-wide financial statements, and current requirements for principal and interest expenditures are accounted for in the Debt Service Fund.
The following is a summary of general obligation bonds payable at August 31, 2021.
46
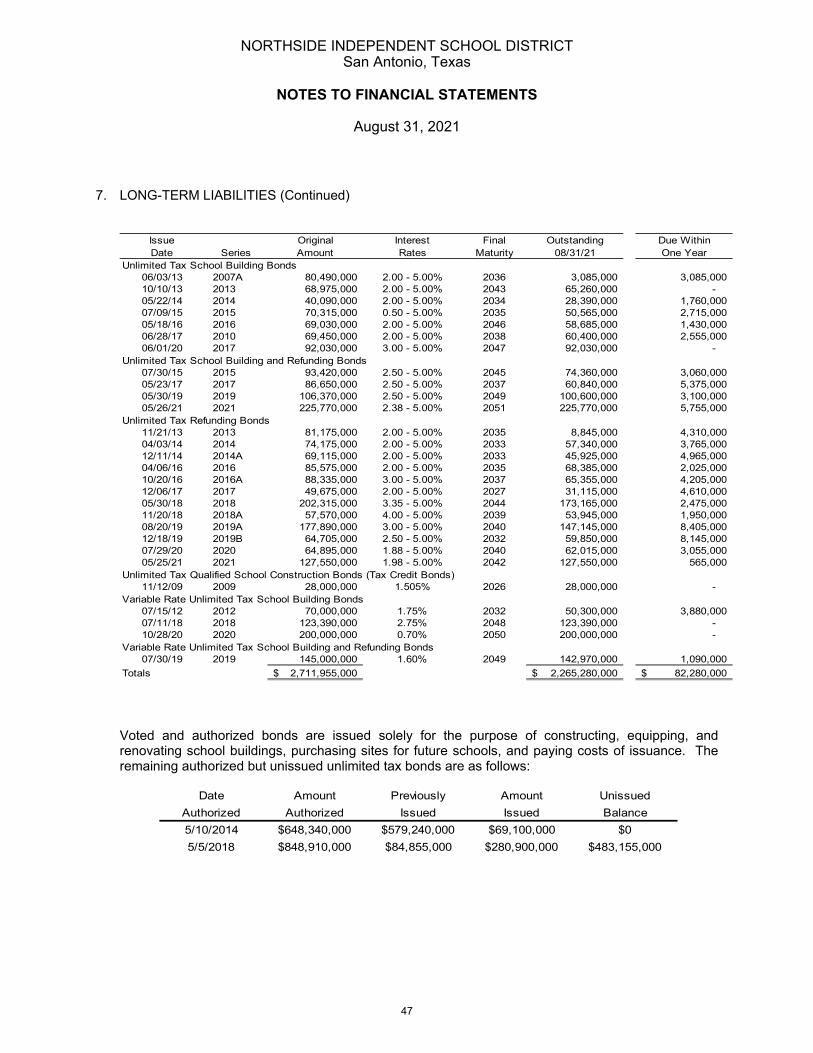
NORTHSIDE INDEPENDENT SCHOOL DISTRICT San Antonio, Texas
NOTES TO FINANCIAL STATEMENTS
August 31, 2021
7. LONG-TERM LIABILITIES (Continued)
Issue Original Interest Final Outstanding Due WithinDate Series Amount Rates Maturity 08/31/21 One Year
Unlimited Tax School Building Bonds06/03/13 2007A 80,490,000 2.00 - 5.00% 2036 3,085,000 3,085,000 10/10/13 2013 68,975,000 2.00 - 5.00% 2043 65,260,000 - 05/22/14 2014 40,090,000 2.00 - 5.00% 2034 28,390,000 1,760,000 07/09/15 2015 70,315,000 0.50 - 5.00% 2035 50,565,000 2,715,000 05/18/16 2016 69,030,000 2.00 - 5.00% 2046 58,685,000 1,430,000 06/28/17 2010 69,450,000 2.00 - 5.00% 2038 60,400,000 2,555,000 06/01/20 2017 92,030,000 3.00 - 5.00% 2047 92,030,000 -
Unlimited Tax School Building and Refunding Bonds07/30/15 2015 93,420,000 2.50 - 5.00% 2045 74,360,000 3,060,000 05/23/17 2017 86,650,000 2.50 - 5.00% 2037 60,840,000 5,375,000 05/30/19 2019 106,370,000 2.50 - 5.00% 2049 100,600,000 3,100,000 05/26/21 2021 225,770,000 2.38 - 5.00% 2051 225,770,000 5,755,000
Unlimited Tax Refunding Bonds11/21/13 2013 81,175,000 2.00 - 5.00% 2035 8,845,000 4,310,000 04/03/14 2014 74,175,000 2.00 - 5.00% 2033 57,340,000 3,765,000 12/11/14 2014A 69,115,000 2.00 - 5.00% 2033 45,925,000 4,965,000 04/06/16 2016 85,575,000 2.00 - 5.00% 2035 68,385,000 2,025,000 10/20/16 2016A 88,335,000 3.00 - 5.00% 2037 65,355,000 4,205,000 12/06/17 2017 49,675,000 2.00 - 5.00% 2027 31,115,000 4,610,000 05/30/18 2018 202,315,000 3.35 - 5.00% 2044 173,165,000 2,475,000 11/20/18 2018A 57,570,000 4.00 - 5.00% 2039 53,945,000 1,950,000 08/20/19 2019A 177,890,000 3.00 - 5.00% 2040 147,145,000 8,405,000 12/18/19 2019B 64,705,000 2.50 - 5.00% 2032 59,850,000 8,145,000 07/29/20 2020 64,895,000 1.88 - 5.00% 2040 62,015,000 3,055,000 05/25/21 2021 127,550,000 1.98 - 5.00% 2042 127,550,000 565,000
Unlimited Tax Qualified School Construction Bonds (Tax Credit Bonds)11/12/09 2009 28,000,000 1.505% 2026 28,000,000 -
Variable Rate Unlimited Tax School Building Bonds07/15/12 2012 70,000,000 1.75% 2032 50,300,000 3,880,000 07/11/18 2018 123,390,000 2.75% 2048 123,390,000 - 10/28/20 2020 200,000,000 0.70% 2050 200,000,000 -
Variable Rate Unlimited Tax School Building and Refunding Bonds07/30/19 2019 145,000,000 1.60% 2049 142,970,000 1,090,000
Totals 2,711,955,000$ 2,265,280,000$ 82,280,000$
Voted and authorized bonds are issued solely for the purpose of constructing, equipping, and renovating school buildings, purchasing sites for future schools, and paying costs of issuance. The remaining authorized but unissued unlimited tax bonds are as follows:
Date Amount Previously Amount UnissuedAuthorized Authorized Issued Issued Balance5/10/2014 $648,340,000 $579,240,000 $69,100,000 $0 5/5/2018 $848,910,000 $84,855,000 $280,900,000 $483,155,000
47

NORTHSIDE INDEPENDENT SCHOOL DISTRICT San Antonio, Texas
NOTES TO FINANCIAL STATEMENTS
August 31, 2021
7. LONG-TERM LIABILITIES (Continued) Annual debt service requirements of currently outstanding bonds are as follows:
Year Ending August 31, Principal Interest Total
2022 $ 82,280,000 $ 78,572,800 $ 160,852,800 2023 85,180,000 $ 74,748,646 159,928,6462024 87,935,000 $ 73,950,360 161,885,3602025 80,305,000 $ 75,317,579 155,622,5792026 102,855,000 $ 80,595,179 183,450,179
2027-31 485,555,000 $ 341,504,589 827,059,5892032-36 493,375,000 $ 234,987,697 728,362,6972037-41 372,635,000 $ 149,425,433 522,060,4332042-46 315,660,000 $ 75,541,430 391,201,4302047-51 159,500,000 $ 17,785,381 177,285,381
Total $ 2,265,280,000 $ 1,202,429,095 $ 3,467,709,095 There are a number of limitations and restrictions contained in the general obligation bond indentures. The District is in compliance with all significant limitations and restrictions at August 31, 2021. a. On October 28, 2020, the District issued $200,000,000 in Variable Rate Unlimited Tax School
Building Bonds, Series 2020. This issue represents the last issuance from the 2014 authorization and the third issuance from the 2018 authorization. The Bonds will bear interest at an Initial Rate from October 28, 2020 through May 31, 2025, with interest being payable initially on June 1, 2020 and will be payable on June 1 and December 1 thereafter through the initial rate period at the rate of 0.70%. Thereafter the bonds will convert to and bear interest a Term Rate determined by the Remarketing Agent provided that the interest rate mode on the Bonds may be changed from time to time to a Term Mode during which the Bonds bear interest at a Term Rate for a period of different duration, or converted to a Fixed Rate until stated maturity. Of these bonds, $69.1 million was issued pursuant to an election held on May 10, 2014 authorizing the issuance of $648.34 million and an Order adopted by the Board of Trustees on October 28, 2014. There was also $130.9 million issued pursuant to an election held on May 5, 2018 authorizing the issuance of $848.91 million and an Order adopted by the Board of Trustees on October 23, 2018. Proceeds from the sale of bonds will be used to acquire, construct, renovate, improve, equip various school facilities, purchase the necessary sites needed therefor, and pay the cost of issuance of the Bonds. The Bonds are subject to mandatory tender without the right of retention on the Conversion Date immediately following the end of the Initial Rate Period, which occurs on June 1, 2025. During the Initial Rate Period, the Bonds are not subject to the benefit of a liquidity facility provided by a third party. Accordingly, a failure by the Remarketing Agent to remarket Bonds subject to mandatory tender on the Conversion date at the end of Initial Rate Period will result in the rescission of the notice of mandatory tender with respect thereto and the District not having any obligation to purchase such bonds at that time. The occurrence of the foregoing will not result in an event of default under the Order. Until the District redeems or remarkets the bonds that have been unsuccessfully remarketed, such bonds shall bear interest at the “Stepped Rate”, which is defined herein to mean 7.00% per annum.
48

NORTHSIDE INDEPENDENT SCHOOL DISTRICT San Antonio, Texas
NOTES TO FINANCIAL STATEMENTS
August 31, 2021
7. LONG-TERM LIABILITIES (Continued)
June 1 Redemption June 1 Redemption2041 15,900,000$ 2046 20,295,000$ 2042 16,695,000 2047 21,310,000 2043 17,530,000 2048 22,375,000 2044 18,405,000 2049 23,495,000 2045 19,325,000 2050 24,670,000 *
*Scheduled final maturity.
The bonds are subject to mandatory redemtion prior to maturity as follows:
Series 2020, Mandatory Redemption Schedule
b. On May 25, 2021, the District issued $127,550,000 in Unlimited Tax Refunding Bonds, Taxable Series 2021, to refund $128,250,000 representing certain maturities of Variable Rate Unlimited Tax School Building Bonds, Series 2007A, Unlimited Tax School Building Bonds, Series 2012, and Unlimited Tax Refunding Bonds, Series 2013. The resulting economic gain of $18,809,460. The resulting net cash flows from the refunds are as follows:
Cash flow requirements to service old debt service 190,288,979$ Less: Cash flow requirements for new debt service 167,340,991 Net decreases in cash flow from refunding 22,947,988$
c. On May 26, 2021, the District issued $225,770,000 in Unlimited Tax School Building and Refunding Bonds, Series 2021. The bonds were issued pursuant to an election held on May 5, 2018 authorizing the issues of $848.91 million and an Order adopted by the Board of Trustees on October 27,2020. Proceeds from the sale of the Bonds will be used to design, acquire, construct, renovate, equip various school facilities, purchase school buses and refund $72,305,000 representing certain maturities of Unlimited Tax Refunding Bonds, and Series 2012, $72,105,000, and to pay cost of issuance of these Bonds. The resulting economic gain of $44,825,005. The resulting net cash flows from the refunds are as follows:
Cash flow requirements to service old debt service 226,846,385$ Less: Cash flow requirements for new debt service 161,345,507 Net decreases in cash flow from refunding 65,500,877$
Worker’s Compensation
All funds of the District participate in the Worker’s Compensation Insurance Fund and make payments to the Fund based on rates, which reflect historical claims experience. The claims payable of $2,323,896 reported in the Fund at August 31, 2021 is based on an actuarial study completed in August 2021.
49
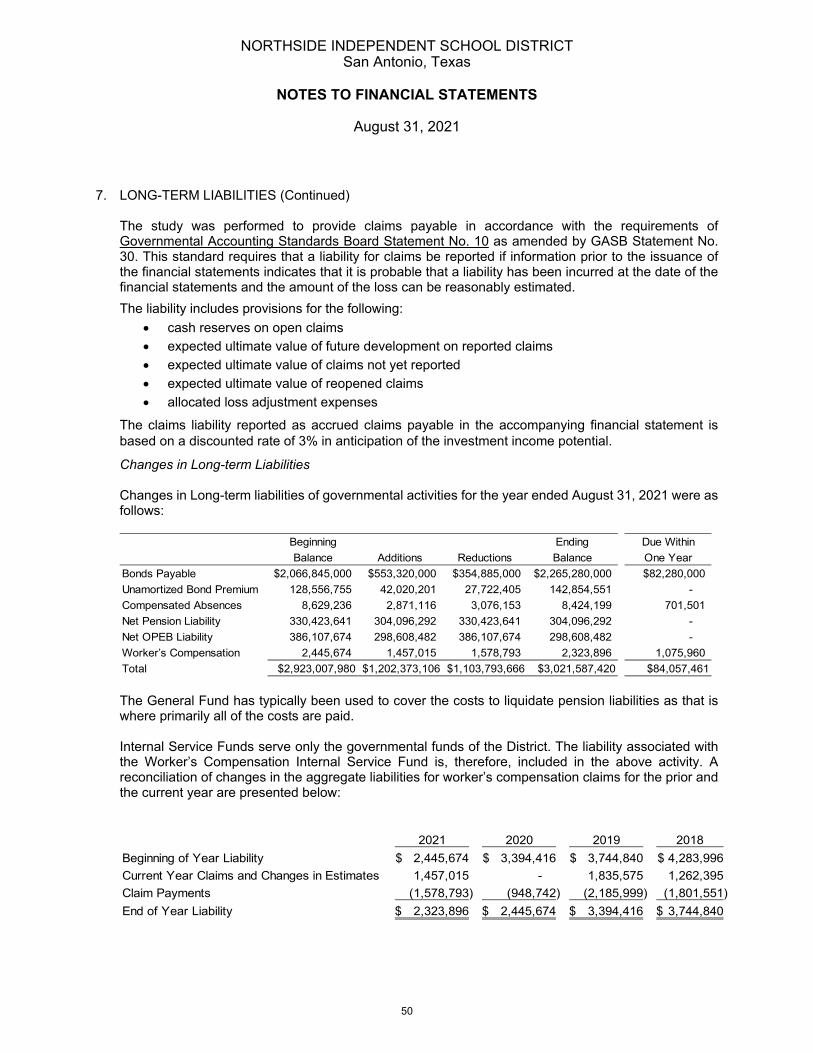
NORTHSIDE INDEPENDENT SCHOOL DISTRICT San Antonio, Texas
NOTES TO FINANCIAL STATEMENTS
August 31, 2021
7. LONG-TERM LIABILITIES (Continued)
The study was performed to provide claims payable in accordance with the requirements of Governmental Accounting Standards Board Statement No. 10 as amended by GASB Statement No. 30. This standard requires that a liability for claims be reported if information prior to the issuance of the financial statements indicates that it is probable that a liability has been incurred at the date of the financial statements and the amount of the loss can be reasonably estimated. The liability includes provisions for the following:
• cash reserves on open claims • expected ultimate value of future development on reported claims • expected ultimate value of claims not yet reported • expected ultimate value of reopened claims • allocated loss adjustment expenses
The claims liability reported as accrued claims payable in the accompanying financial statement is based on a discounted rate of 3% in anticipation of the investment income potential.
Changes in Long-term Liabilities Changes in Long-term liabilities of governmental activities for the year ended August 31, 2021 were as follows:
Beginning Ending Due WithinBalance Additions Reductions Balance One Year
Bonds Payable $2,066,845,000 $553,320,000 $354,885,000 $2,265,280,000 $82,280,000Unamortized Bond Premium 128,556,755 42,020,201 27,722,405 142,854,551 - Compensated Absences 8,629,236 2,871,116 3,076,153 8,424,199 701,501 Net Pension Liability 330,423,641 304,096,292 330,423,641 304,096,292 - Net OPEB Liability 386,107,674 298,608,482 386,107,674 298,608,482 - Worker’s Compensation 2,445,674 1,457,015 1,578,793 2,323,896 1,075,960 Total $2,923,007,980 $1,202,373,106 $1,103,793,666 $3,021,587,420 $84,057,461 The General Fund has typically been used to cover the costs to liquidate pension liabilities as that is where primarily all of the costs are paid. Internal Service Funds serve only the governmental funds of the District. The liability associated with the Worker’s Compensation Internal Service Fund is, therefore, included in the above activity. A reconciliation of changes in the aggregate liabilities for worker’s compensation claims for the prior and the current year are presented below:
2021 2020 2019 2018Beginning of Year Liability 2,445,674$ 3,394,416$ 3,744,840$ 4,283,996$ Current Year Claims and Changes in Estimates 1,457,015 - 1,835,575 1,262,395 Claim Payments (1,578,793) (948,742) (2,185,999) (1,801,551) End of Year Liability 2,323,896$ 2,445,674$ 3,394,416$ 3,744,840$
50
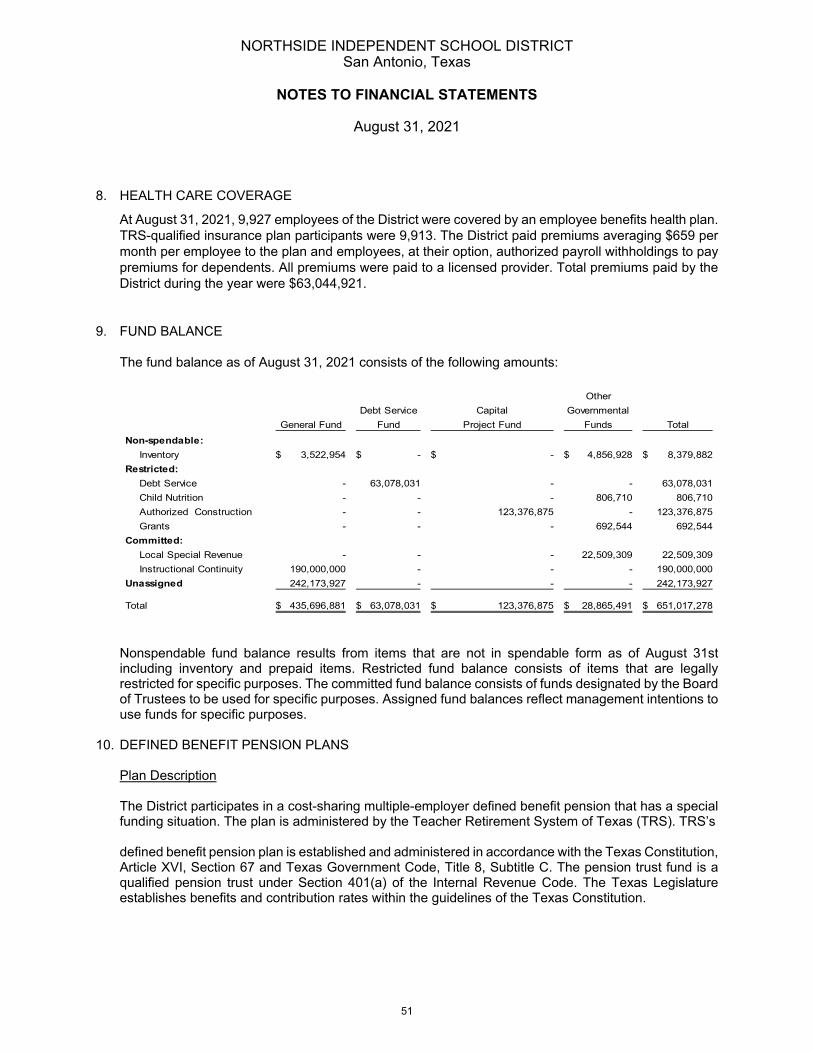
NORTHSIDE INDEPENDENT SCHOOL DISTRICT San Antonio, Texas
NOTES TO FINANCIAL STATEMENTS
August 31, 2021
8. HEALTH CARE COVERAGE
At August 31, 2021, 9,927 employees of the District were covered by an employee benefits health plan. TRS-qualified insurance plan participants were 9,913. The District paid premiums averaging $659 per month per employee to the plan and employees, at their option, authorized payroll withholdings to pay premiums for dependents. All premiums were paid to a licensed provider. Total premiums paid by the District during the year were $63,044,921.
9. FUND BALANCE The fund balance as of August 31, 2021 consists of the following amounts: Other
Debt Service Capital GovernmentalGeneral Fund Fund Project Fund Funds Total
Non-spendable:Inventory 3,522,954$ -$ -$ 4,856,928$ 8,379,882$
Restricted:Debt Service - 63,078,031 - - 63,078,031 Child Nutrition - - - 806,710 806,710 Authorized Construction - - 123,376,875 - 123,376,875 Grants - - - 692,544 692,544
Committed:Local Special Revenue - - - 22,509,309 22,509,309 Instructional Continuity 190,000,000 - - - 190,000,000
Unassigned 242,173,927 - - - 242,173,927
Total 435,696,881$ 63,078,031$ 123,376,875$ 28,865,491$ 651,017,278$ Nonspendable fund balance results from items that are not in spendable form as of August 31st including inventory and prepaid items. Restricted fund balance consists of items that are legally restricted for specific purposes. The committed fund balance consists of funds designated by the Board of Trustees to be used for specific purposes. Assigned fund balances reflect management intentions to use funds for specific purposes.
10. DEFINED BENEFIT PENSION PLANS
Plan Description The District participates in a cost-sharing multiple-employer defined benefit pension that has a special funding situation. The plan is administered by the Teacher Retirement System of Texas (TRS). TRS’s defined benefit pension plan is established and administered in accordance with the Texas Constitution, Article XVI, Section 67 and Texas Government Code, Title 8, Subtitle C. The pension trust fund is a qualified pension trust under Section 401(a) of the Internal Revenue Code. The Texas Legislature establishes benefits and contribution rates within the guidelines of the Texas Constitution.
51

NORTHSIDE INDEPENDENT SCHOOL DISTRICT San Antonio, Texas
NOTES TO FINANCIAL STATEMENTS
August 31, 2021
10. DEFINED BENEFIT PENSION PLANS (Continued)
The pension’s Board of Trustees does not have the authority to establish or amend benefit terms. All employees of public, state-supported educational institutions in Texas who are employed for one-half or more of the standard work load and who are not exempted from membership under Texas Government Code, Title 8, Section 822.002 are covered by the system. Pension Plan Fiduciary Net Position
Detail information about the Teacher Retirement System’s fiduciary net position is available in a separately-issued Comprehensive Annual Financial Report that includes financial statements and required supplementary information. That report may be obtained on the internet at https://www.trs.texas.gov/TRS%20Documents/cafr_2020.pdf, or by writing to TRS at 1000 Red River Street, Austin, TX. Benefits Provided TRS provides service and disability retirement, as well as death and survivor benefits, to eligible employees (and their beneficiaries) of public and higher education in Texas. The pension formula is calculated using 2.3% (multiplier) times the average of the five highest annual creditable salaries times years of credited service to arrive at the annual standard annuity except for members who are grandfathered, the three highest annual salaries are used. The normal service retirement is at age 65 with 5 years of credited service or when the sum of the member’s age and years of credited service equals 80 or more years. Early retirement is at age 55 with 5 years of service credit or earlier than 55 with 30 years of service credit. There are additional provisions for early retirement if the sum of the member’s age and years of service credit total at least 80, but the member is less than age 60 or 62 depending on date of employment, or if the member was grandfathered in under a previous rule. There are no automatic post-employment benefit changes; including automatic COLAs. Ad hoc post-employment benefit changes, including ad hoc COLAs can be granted by the Texas Legislature as noted in the Plan Description section above. Texas Government Code section 821.006 prohibits benefit improvements, if, as a result of the particular action, the time required to amortize TRS’ unfunded actuarial liabilities would be increased to a period that exceeds 31 years, or, if the amortization period already exceeds 31 years, the period would be increased by such action. Actuarial implications of the funding provided in the manner are determined by the System’s actuary. In May, 2019, the 86th Texas Legislature approved the TRS Pension Reform Bill (Senate Bill 12) that provides for gradual contribution increases from the state, participating employers and active employees to make the pension fund actuarially sound. This action causing the pension fund to be actuarially sound, allowed the legislature to approve funding for a 13th check in September 2019. All eligible members retired as of December 31, 2018, received an extra annuity check in either the matching amount of their monthly annuity or $2,000, whichever was less. Contributions Contribution requirements are established or amended pursuant to Article 16, section 67 of the Texas Constitution which requires the Texas legislature to establish a member contribution rate of not less than 6% of the member’s annual compensation and a state contribution rate of not less than 6% and
52
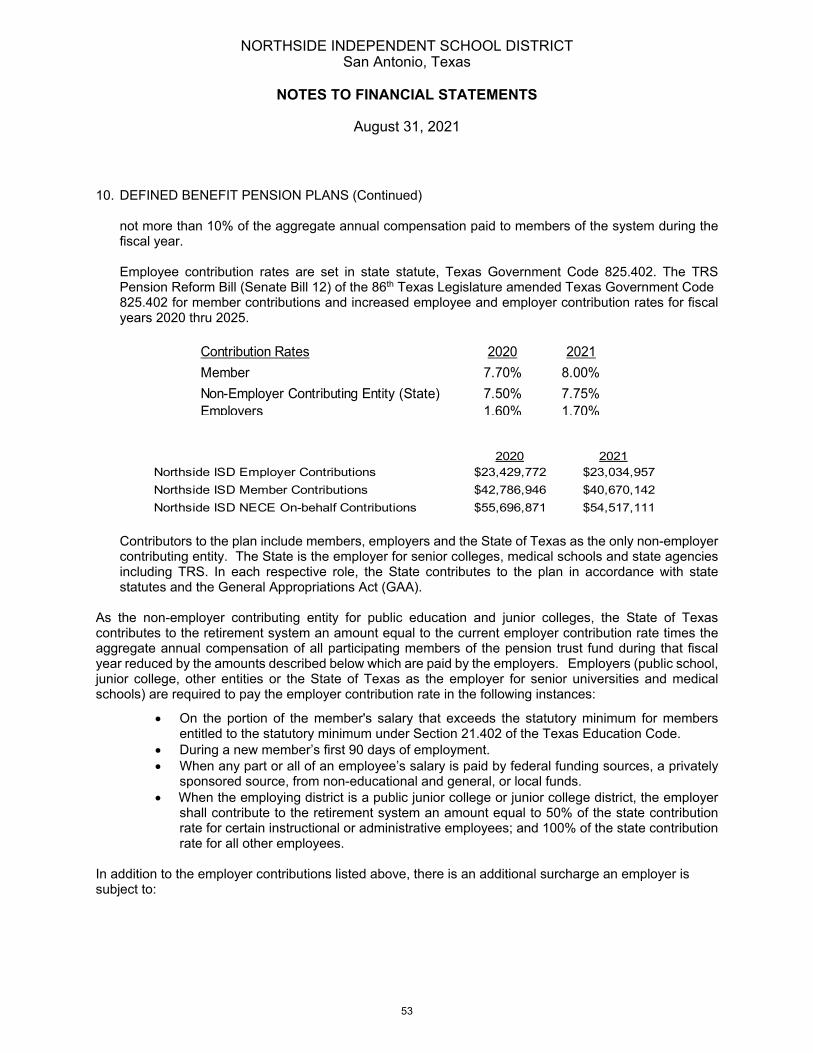
NORTHSIDE INDEPENDENT SCHOOL DISTRICT San Antonio, Texas
NOTES TO FINANCIAL STATEMENTS
August 31, 2021
10. DEFINED BENEFIT PENSION PLANS (Continued) not more than 10% of the aggregate annual compensation paid to members of the system during the fiscal year. Employee contribution rates are set in state statute, Texas Government Code 825.402. The TRS Pension Reform Bill (Senate Bill 12) of the 86th Texas Legislature amended Texas Government Code 825.402 for member contributions and increased employee and employer contribution rates for fiscal years 2020 thru 2025.
Contribution Rates 2020 2021Member 7.70% 8.00%Non-Employer Contributing Entity (State) 7.50% 7.75%Employers 1.60% 1.70%
2020 2021Northside ISD Employer Contributions $23,429,772 $23,034,957Northside ISD Member Contributions $42,786,946 $40,670,142Northside ISD NECE On-behalf Contributions $55,696,871 $54,517,111
Contributors to the plan include members, employers and the State of Texas as the only non-employer contributing entity. The State is the employer for senior colleges, medical schools and state agencies including TRS. In each respective role, the State contributes to the plan in accordance with state statutes and the General Appropriations Act (GAA).
As the non-employer contributing entity for public education and junior colleges, the State of Texas contributes to the retirement system an amount equal to the current employer contribution rate times the aggregate annual compensation of all participating members of the pension trust fund during that fiscal year reduced by the amounts described below which are paid by the employers. Employers (public school, junior college, other entities or the State of Texas as the employer for senior universities and medical schools) are required to pay the employer contribution rate in the following instances:
• On the portion of the member's salary that exceeds the statutory minimum for members entitled to the statutory minimum under Section 21.402 of the Texas Education Code.
• During a new member’s first 90 days of employment. • When any part or all of an employee’s salary is paid by federal funding sources, a privately
sponsored source, from non-educational and general, or local funds. • When the employing district is a public junior college or junior college district, the employer
shall contribute to the retirement system an amount equal to 50% of the state contribution rate for certain instructional or administrative employees; and 100% of the state contribution rate for all other employees.
In addition to the employer contributions listed above, there is an additional surcharge an employer is subject to:
53
NORTHSIDE INDEPENDENT SCHOOL DISTRICT San Antonio, Texas
NOTES TO FINANCIAL STATEMENTS
August 31, 2021
10. DEFINED BENEFIT PENSION PLANS (Continued)
• All public schools, charter schools, and regional educational service centers must contribute 1.5% of the member’s salary beginning in fiscal year 2020, gradually increasing to 2% in fiscal year 2025.
• When employing a retiree of the Teacher Retirement System the employer shall pay both the member contribution and the state contribution as an employment after retirement surcharge.
Actuarial Assumptions The total pension liability in the August 31, 2019 actuarial valuation was determined using the following actuarial assumptions:
Valuation Date August 31, 2019 rolled forward to August 31, 2020 Actuarial Cost Method Individual Entry Age Normal Asset Valuation Method Market Value Single Discount Rate 7.25% Long-term expected Investment Rate of Return 7.25% Inflation 2.3% Salary Increases including inflation 3.05% to 9.05% Ad hoc post-employment benefit changes None
The actuarial methods and assumptions are used in the determination of the total pension liability are the same assumptions used in the actuarial valuation as of August 31, 2019. For a full description of these assumptions please see the actuarial valuation report dated November 14, 2019. Discount Rate A single discount rate of 7.25% was used to measure the total pension liability. The single discount rate was based on the expected rate of return on plan investments of 7.25%. The projection of cash flows used to determine this single discount rate assumed that contributions from active members, employers and the non-employer contributing entity will be made at the rates set by the legislature during the 2019 session. It is assumed that future employer and state contributions will be 8.50% of payroll in fiscal year 2020 gradually increasing to 9.55% of payroll over the next several years. This includes all employer and state contributions for active and rehired retirees. Based on those assumptions, the pension plan’s fiduciary net position was projected to be available to make all future benefit payments of current plan members. Therefore, the long-term expected rate of return on pension plan investments was applied to all periods of projected benefit payments to determine the total pension liability. The long-term rate of return on pension plan investments is 7.25%. The long-term expected rate of return on pension plan investments was determined using a building-block method in which best-estimates ranges of expected future real rates of return (expected returns, net of pension plan investment expense and inflation) are developed for each major asset class. These ranges are
54

NORTHSIDE INDEPENDENT SCHOOL DISTRICT San Antonio, Texas
NOTES TO FINANCIAL STATEMENTS
August 31, 2021
10. DEFINED BENEFIT PENSION PLANS (Continued) combined to produce the long-term expected rate of return by weighting the expected future real rates of return by the target asset allocation percentage and by adding expected inflation. Best estimates of geometric real rates of return for each major asset class included in the Systems target asset allocation as of August 31, 2020, (see page 53 of the TRS ACFR) are summarized below:
Asset ClassFY 2020 Target
Allocation1 %
Long-Term Expected
Geometric Real Rate of Return2
Expected Contribution to
Long-Term Portfolio Returns
Global EquityUSA 18.0% 3.9% 0.99%Non-U.S. Developed 13.0 5.1 0.92Emerging Markets 9.0 5.6 0.83Private Equity 14.0 6.7 1.41
Stable ValueGovernment Bonds 16.0% (0.7)% (0.05)%Absolute Return (Including Credit Senstitive Investment) - 1.8 -Stable Value Hedge Funds 5.0 1.9 0.11
Real ReturnReal Estate 15.0% 4.6% 1.02%Energy, Natural Resources, and Infrastructure 6.0 6.0 0.42Commodities - 0.8 -
Risk ParityRisk Parity 8.0% 3.0% 0.30%
Asset Allocation LeverageCash 2.0% (1.5)% (0.03)%Asset Allocation Leverage (6.0) (1.3) 0.08
Inflation Expectation 2.00%Volatility Drag3 (0.67)%Expected Return 100% 7.33%
1Target allocations are based on the FY2020 policy model.2Capital Market Assumptions come from Aon Hewitt (as of 8/31/2020).3The volatility drag results from the conversion between arithmetic and geometric mean returns.
Discount Rate Sensitivity Analysis
The following table presents the Net Pension Liability of the plan using the discount rate of 7.25 percent, and what the net pension liability would be if it were calculated using a discount rate that is one percentage point lower (6.25 percent) or one percentage point higher (8.25 percent) than the current rate.
55

NORTHSIDE INDEPENDENT SCHOOL DISTRICT San Antonio, Texas
NOTES TO FINANCIAL STATEMENTS
August 31, 2021
10. DEFINED BENEFIT PENSION PLANS (Continued)
1% Decrease in Discount Rate (6.25%) Rate (7.25%)
1% Increase in Discount Rate (8.25%)
District’s proportionate share of the net pension liability: $468,911,041 $304,096,292 $170,187,920
Pension Liabilities, Pension Expense, and Deferred Outflows of Resources and Deferred Inflows of Resources Related to Pensions At August 31, 2021, the District reported a liability of $304,096,292 for its proportionate share of the TRS’s net pension liability. This liability reflects a reduction for State pension support provided to the District. The amount recognized by the District as its proportionate share of the net pension liability, the related State support, and the total portion of the net pension liability that was associated with the District were as follows:
$304,096,292 509,230,988
Total $813,327,280
District’s proportionate share of the collective net pension liability State’s proportionate share that is associated with District
The net pension liability was measured as of August 31, 2019 and rolled forward to August 31, 2020 and the total pension liability used to calculate the net pension liability was determined by an actuarial valuation as of that date. The employer’s proportion of the net pension liability was based on the employer’s contributions to the pension plan relative to the contributions of all employers to the plan for the period September 1, 2019 thru August 31, 2020.
At August 31, 2020, the District’s proportion of the collective net pension liability was 0.5677892% which was a decrease of 0.0006784% from its proportion measured as of August 31, 2019. Changes Since the Prior Actuarial Valuation There were no changes in assumptions since the prior measurement date.
For the year ended August 31, 2021, the District recognized pension expense of $61,249,181 and revenue of $61,249,181 for support provided by the State.
At August 31, 2021, the District reported its proportionate share of the TRS deferred outflows of resources and deferred inflows of resources related to pensions from the following sources:
56
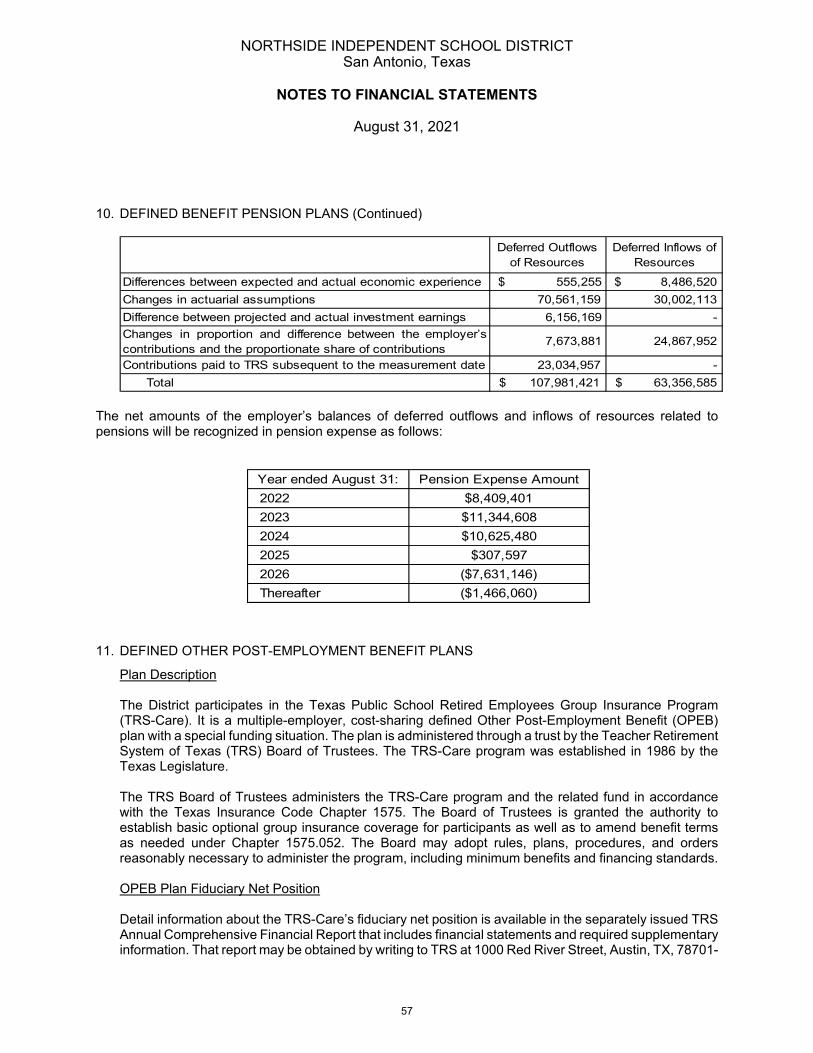
NORTHSIDE INDEPENDENT SCHOOL DISTRICT San Antonio, Texas
NOTES TO FINANCIAL STATEMENTS
August 31, 2021
10. DEFINED BENEFIT PENSION PLANS (Continued)
Deferred Outflows of Resources
Deferred Inflows of Resources
Differences between expected and actual economic experience $ 555,255 $ 8,486,520 Changes in actuarial assumptions 70,561,159 30,002,113 Difference between projected and actual investment earnings 6,156,169 - Changes in proportion and difference between the employer’scontributions and the proportionate share of contributions
7,673,881 24,867,952
Contributions paid to TRS subsequent to the measurement date 23,034,957 - Total $ 107,981,421 $ 63,356,585
The net amounts of the employer’s balances of deferred outflows and inflows of resources related to pensions will be recognized in pension expense as follows:
Year ended August 31: Pension Expense Amount2022 $8,409,401 2023 $11,344,608 2024 $10,625,480 2025 $307,597 2026 ($7,631,146)Thereafter ($1,466,060)
11. DEFINED OTHER POST-EMPLOYMENT BENEFIT PLANS
Plan Description The District participates in the Texas Public School Retired Employees Group Insurance Program (TRS-Care). It is a multiple-employer, cost-sharing defined Other Post-Employment Benefit (OPEB) plan with a special funding situation. The plan is administered through a trust by the Teacher Retirement System of Texas (TRS) Board of Trustees. The TRS-Care program was established in 1986 by the Texas Legislature. The TRS Board of Trustees administers the TRS-Care program and the related fund in accordance with the Texas Insurance Code Chapter 1575. The Board of Trustees is granted the authority to establish basic optional group insurance coverage for participants as well as to amend benefit terms as needed under Chapter 1575.052. The Board may adopt rules, plans, procedures, and orders reasonably necessary to administer the program, including minimum benefits and financing standards. OPEB Plan Fiduciary Net Position Detail information about the TRS-Care’s fiduciary net position is available in the separately issued TRS Annual Comprehensive Financial Report that includes financial statements and required supplementary information. That report may be obtained by writing to TRS at 1000 Red River Street, Austin, TX, 78701-
57
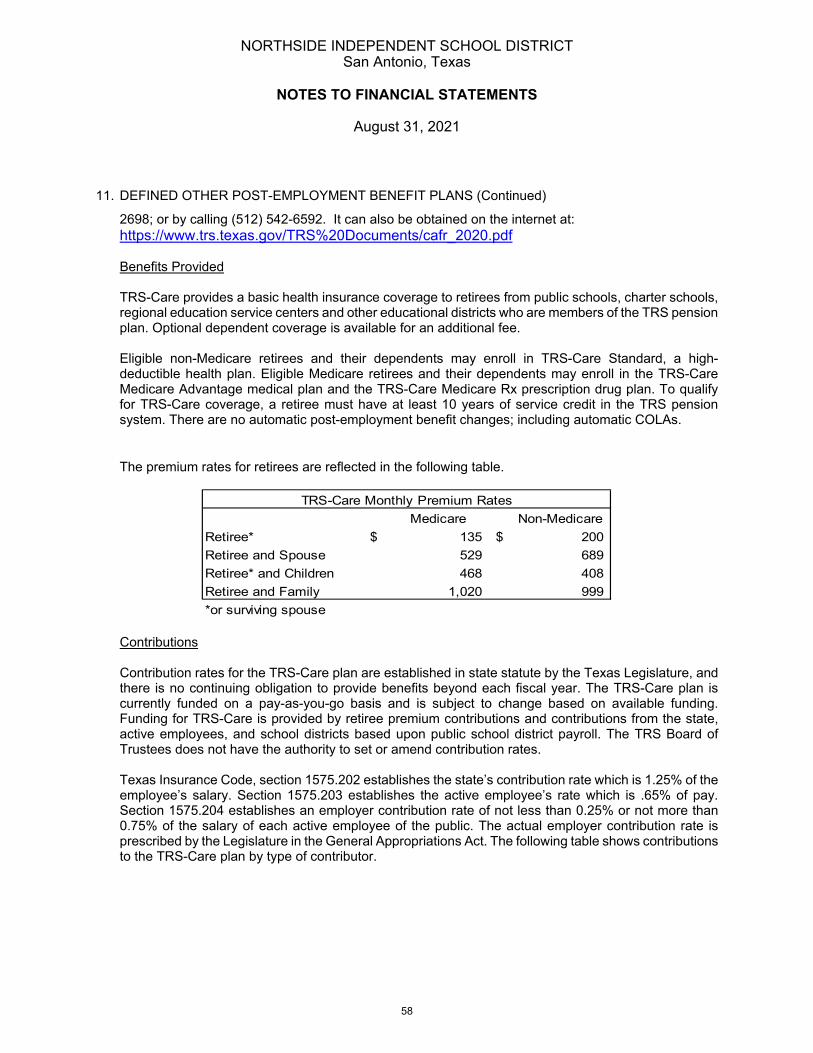
NORTHSIDE INDEPENDENT SCHOOL DISTRICT San Antonio, Texas
NOTES TO FINANCIAL STATEMENTS
August 31, 2021
11. DEFINED OTHER POST-EMPLOYMENT BENEFIT PLANS (Continued)
2698; or by calling (512) 542-6592. It can also be obtained on the internet at: https://www.trs.texas.gov/TRS%20Documents/cafr_2020.pdf Benefits Provided TRS-Care provides a basic health insurance coverage to retirees from public schools, charter schools, regional education service centers and other educational districts who are members of the TRS pension plan. Optional dependent coverage is available for an additional fee. Eligible non-Medicare retirees and their dependents may enroll in TRS-Care Standard, a high-deductible health plan. Eligible Medicare retirees and their dependents may enroll in the TRS-Care Medicare Advantage medical plan and the TRS-Care Medicare Rx prescription drug plan. To qualify for TRS-Care coverage, a retiree must have at least 10 years of service credit in the TRS pension system. There are no automatic post-employment benefit changes; including automatic COLAs.
The premium rates for retirees are reflected in the following table.
Medicare Non-MedicareRetiree* $ 135 $ 200 Retiree and Spouse 529 689 Retiree* and Children 468 408 Retiree and Family 1,020 999 *or surviving spouse
TRS-Care Monthly Premium Rates
Contributions Contribution rates for the TRS-Care plan are established in state statute by the Texas Legislature, and there is no continuing obligation to provide benefits beyond each fiscal year. The TRS-Care plan is currently funded on a pay-as-you-go basis and is subject to change based on available funding. Funding for TRS-Care is provided by retiree premium contributions and contributions from the state, active employees, and school districts based upon public school district payroll. The TRS Board of Trustees does not have the authority to set or amend contribution rates. Texas Insurance Code, section 1575.202 establishes the state’s contribution rate which is 1.25% of the employee’s salary. Section 1575.203 establishes the active employee’s rate which is .65% of pay. Section 1575.204 establishes an employer contribution rate of not less than 0.25% or not more than 0.75% of the salary of each active employee of the public. The actual employer contribution rate is prescribed by the Legislature in the General Appropriations Act. The following table shows contributions to the TRS-Care plan by type of contributor.
58
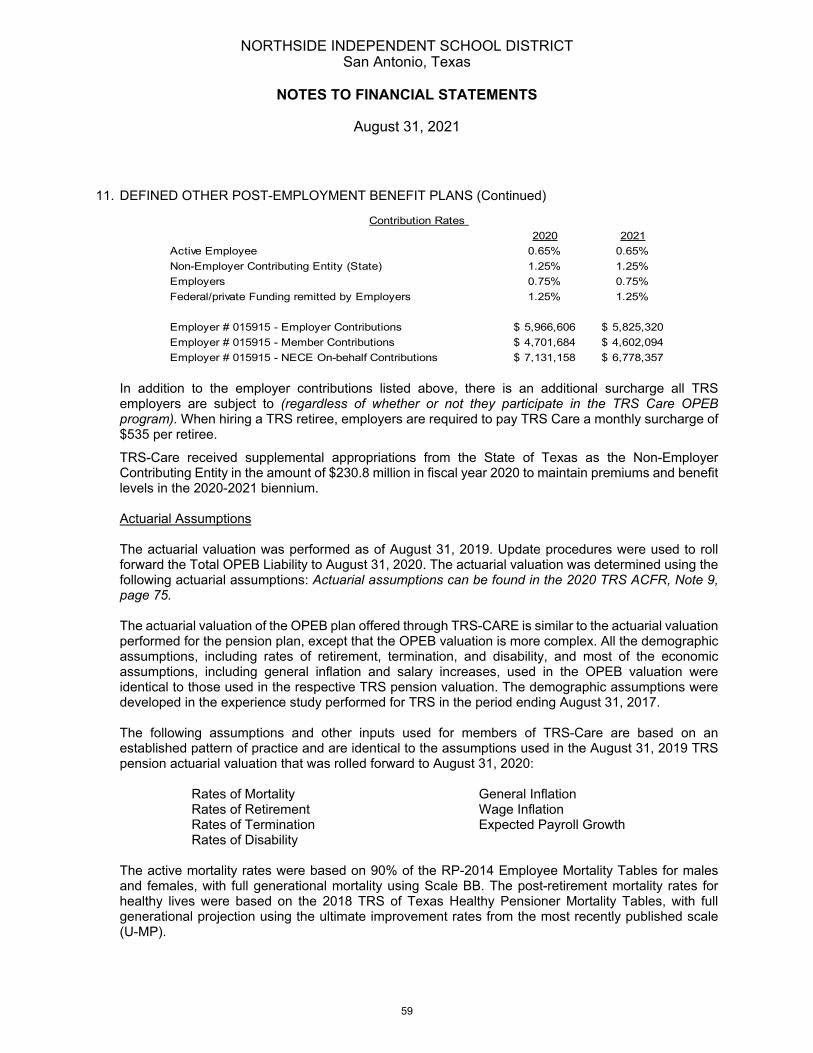
NORTHSIDE INDEPENDENT SCHOOL DISTRICT San Antonio, Texas
NOTES TO FINANCIAL STATEMENTS
August 31, 2021
11. DEFINED OTHER POST-EMPLOYMENT BENEFIT PLANS (Continued)
2020 2021Active Employee 0.65% 0.65%Non-Employer Contributing Entity (State) 1.25% 1.25%Employers 0.75% 0.75%Federal/private Funding remitted by Employers 1.25% 1.25%
Employer # 015915 - Employer Contributions 5,966,606$ 5,825,320$ Employer # 015915 - Member Contributions 4,701,684$ 4,602,094$ Employer # 015915 - NECE On-behalf Contributions 7,131,158$ 6,778,357$
Contribution Rates
In addition to the employer contributions listed above, there is an additional surcharge all TRS employers are subject to (regardless of whether or not they participate in the TRS Care OPEB program). When hiring a TRS retiree, employers are required to pay TRS Care a monthly surcharge of $535 per retiree.
TRS-Care received supplemental appropriations from the State of Texas as the Non-Employer Contributing Entity in the amount of $230.8 million in fiscal year 2020 to maintain premiums and benefit levels in the 2020-2021 biennium. Actuarial Assumptions The actuarial valuation was performed as of August 31, 2019. Update procedures were used to roll forward the Total OPEB Liability to August 31, 2020. The actuarial valuation was determined using the following actuarial assumptions: Actuarial assumptions can be found in the 2020 TRS ACFR, Note 9, page 75. The actuarial valuation of the OPEB plan offered through TRS-CARE is similar to the actuarial valuation performed for the pension plan, except that the OPEB valuation is more complex. All the demographic assumptions, including rates of retirement, termination, and disability, and most of the economic assumptions, including general inflation and salary increases, used in the OPEB valuation were identical to those used in the respective TRS pension valuation. The demographic assumptions were developed in the experience study performed for TRS in the period ending August 31, 2017. The following assumptions and other inputs used for members of TRS-Care are based on an established pattern of practice and are identical to the assumptions used in the August 31, 2019 TRS pension actuarial valuation that was rolled forward to August 31, 2020:
Rates of Mortality General Inflation Rates of Retirement Wage Inflation Rates of Termination Expected Payroll Growth Rates of Disability
The active mortality rates were based on 90% of the RP-2014 Employee Mortality Tables for males and females, with full generational mortality using Scale BB. The post-retirement mortality rates for healthy lives were based on the 2018 TRS of Texas Healthy Pensioner Mortality Tables, with full generational projection using the ultimate improvement rates from the most recently published scale (U-MP).
59

NORTHSIDE INDEPENDENT SCHOOL DISTRICT San Antonio, Texas
NOTES TO FINANCIAL STATEMENTS
August 31, 2021
11. DEFINED OTHER POST-EMPLOYMENT BENEFIT PLANS (Continued)
Additional Actuarial Methods and Assumptions:
Valuation Date August 31, 2019 rolled forward to August 31, 2020 Actuarial Cost Method Individual Entry Age Normal Inflation 2.30% Discount Rate 2.33% as of August 31, 2020 Aging Factors Based on plan specific experience Expenses Third party administrative expenses
related to the delivery of health care benefits are included in the age-adjusted claims costs.
Projected Salary Increases 3.05% to 9.05%, including inflation Healthcare Trend Rates 4.25% to 9.00%
Election Rates Normal retirement: 65% participation
prior to age 65 and 40% participation after age 65.
Ad hoc post-employment benefit changes None
Discount Rate A single discount rate of 2.33% was used to measure the Total OPEB Liability. There was a decrease of 0.30% in the discount rate since the previous year. The Discount Rate can be found in the 2020 TRS ACFR on page 76. Because the plan is essentially a “pay-as-you-go” plan, the single discount rate is equal to the prevailing municipal bond rate. The projection of cash flows used to determine the discount rate assumed that contributions from active members and those of the contributing employers and the non-employer contributing entity are made at the statutorily required rates. Based on those assumptions, the OPEB plan’s fiduciary net position was projected to not be able to make all future benefit payments of current plan members. Therefore, the municipal bond rate was used for the long-term rate of return and was applied to all periods of projected benefit payments to determine the total OPEB liability. The source of the municipal bond rate is the Fidelity “20-year Municipal GO AA Index” as of August 31, 2020 using the fixed-income municipal bonds with 20 years to maturity that include only federally tax-exempt municipal bonds. Discount Rate Sensitivity Analysis
The following schedule shows the impact of the Net OPEB Liability if the discount rate used was 1 percentage point lower than and 1 percentage point higher than the discount rate that was used (2.33%) in measuring the Net OPEB Liability.
60

NORTHSIDE INDEPENDENT SCHOOL DISTRICT San Antonio, Texas
NOTES TO FINANCIAL STATEMENTS
August 31, 2021
11. DEFINED OTHER POST-EMPLOYMENT BENEFIT PLANS (Continued)
1% Decrease in Discount Rate (1.33%)
Current Single Discount Rate
(2.33%)1% Increase in
Discount Rate (3.33%)District's proportionate share of the Net OPEB Liability: 358,329,495$ 298,608,482$ 251,437,453$
OPEB Liabilities, OPEB Expense, and Deferred Outflows of Resources and Deferred Inflows of Resources Related to OPEBs At August 31, 2021, the District reported a liability of $298,608,482 for its proportionate share of the TRS’s Net OPEB Liability. This liability reflects a reduction for State OPEB support provided to the District. The amount recognized by the District as its proportionate share of the net OPEB liability, the related State support, and the total portion of the net OPEB liability that was associated with the District were as follows:
$298,608,482 401,258,221
Total $699,866,703
District’s proportionate share of the collective net pension liability State’s proportionate share that is associated with District
The Net OPEB Liability was measured as of August 31, 2019 and rolled forward to August 31, 2020 and the Total OPEB Liability used to calculate the Net OPEB Liability was determined by an actuarial valuation as of that date. The District’s proportion of the Net OPEB Liability was based on the District’s contributions to OPEB relative to the contributions of all employers to the plan for the period September 1, 2019 thru August 31, 2020. At August 31, 2021 the District’s proportion of the collective Net OPEB Liability was 0.785511732% compared to 0.8164468% as of August 31, 2020. The following schedule shows the impact of the Net OPEB Liability if a healthcare trend rate that is 1% less than and 1% greater than the assumed rate is used.
1% Decrease in Healthcare Trend Rate
Current Healthcare Trend Rate
1% Increase in Healthcare Trend Rate
District's proportionate share of the Net OPEB Liability: 243,924,872$ 298,608,482$ 371,439,321$
Changes Since the Prior Actuarial Valuation – The following were changes to the actuarial assumptions or other inputs that affected measurement of the Total OPEB liability (TOL) since the prior measurement period: These can be found in the TRS ACFR on page 76.
• The discount rate changed from 2.63% as of August 31, 2019 to 2.33% as of August 31, 2020. This change increased the Total OPEB Liability.
• The participation rate for post-65 retirees was lowered from 50% to 40%. This change lowered the Total OPEB Liability.
• The ultimate health care trend rate assumption was lowered from 4.5% to 4.25
61
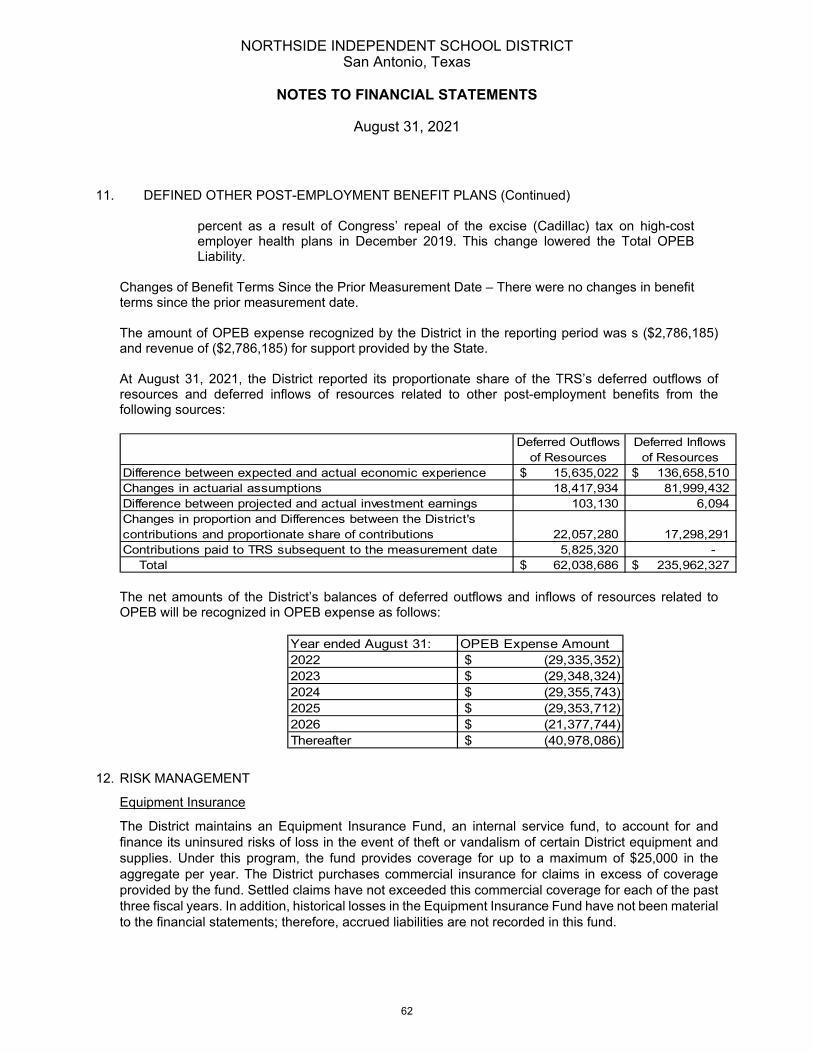
NORTHSIDE INDEPENDENT SCHOOL DISTRICT San Antonio, Texas
NOTES TO FINANCIAL STATEMENTS
August 31, 2021
11. DEFINED OTHER POST-EMPLOYMENT BENEFIT PLANS (Continued)
percent as a result of Congress’ repeal of the excise (Cadillac) tax on high-cost employer health plans in December 2019. This change lowered the Total OPEB Liability.
Changes of Benefit Terms Since the Prior Measurement Date – There were no changes in benefit terms since the prior measurement date. The amount of OPEB expense recognized by the District in the reporting period was s ($2,786,185) and revenue of ($2,786,185) for support provided by the State. At August 31, 2021, the District reported its proportionate share of the TRS’s deferred outflows of resources and deferred inflows of resources related to other post-employment benefits from the following sources:
Deferred Outflows of Resources
Deferred Inflows of Resources
Difference between expected and actual economic experience 15,635,022$ 136,658,510$ Changes in actuarial assumptions 18,417,934 81,999,432 Difference between projected and actual investment earnings 103,130 6,094 Changes in proportion and Differences between the District's contributions and proportionate share of contributions 22,057,280 17,298,291 Contributions paid to TRS subsequent to the measurement date 5,825,320 - Total 62,038,686$ 235,962,327$ The net amounts of the District’s balances of deferred outflows and inflows of resources related to OPEB will be recognized in OPEB expense as follows:
Year ended August 31: OPEB Expense Amount2022 (29,335,352)$ 2023 (29,348,324)$ 2024 (29,355,743)$ 2025 (29,353,712)$ 2026 (21,377,744)$ Thereafter (40,978,086)$
12. RISK MANAGEMENT
Equipment Insurance
The District maintains an Equipment Insurance Fund, an internal service fund, to account for and finance its uninsured risks of loss in the event of theft or vandalism of certain District equipment and supplies. Under this program, the fund provides coverage for up to a maximum of $25,000 in the aggregate per year. The District purchases commercial insurance for claims in excess of coverage provided by the fund. Settled claims have not exceeded this commercial coverage for each of the past three fiscal years. In addition, historical losses in the Equipment Insurance Fund have not been material to the financial statements; therefore, accrued liabilities are not recorded in this fund.
62
NORTHSIDE INDEPENDENT SCHOOL DISTRICT San Antonio, Texas
NOTES TO FINANCIAL STATEMENTS
August 31, 2021
12. RISK MANAGEMENT (Continued)
Unemployment Insurance
The District maintains an Unemployment Insurance Fund, an internal service fund, to account for and finance its uninsured risks of loss for unemployment compensation benefits. It is the District’s policy not to pay for unemployment insurance premiums for the risks of losses to which it is exposed. Instead, the District management believes it is more economical to manage its risks internally and set aside assets for unemployment compensation benefits in this fund. The District pays the Texas Workforce Commission on a reimbursement basis for unemployment compensations paid to qualifying employees. Historical losses in the unemployment insurance fund have not been material to the financial statements; therefore, accrued liabilities are not recorded in this fund.
Worker's Compensation
The District maintains a Worker’s Compensation Insurance Fund, an internal service fund, to account for and finance its uninsured risks of loss for worker’s compensation coverage. Under this program, the fund provides coverage for up to a maximum per occurrence of $500,000. The District purchases stop-loss coverage through a commercial insurer for claims in excess of coverage provided by the fund. Settled claims have not exceeded this stop-loss coverage for each of the past three fiscal years.
Casualty Liability
In July 2017, the District moved from a deductible insurance plan to a self-insured Plan for liability claims. Due to the change, the District maintains a Casualty Liability Insurance fund to account and finance its uninsured risks of loss pertaining to auto liability, educator’s legal liability and general liability. Under this program, the fund provides coverage for up to a maximum per occurrence of $50,000. The District purchases excess liability insurance through a commercial insurer for claims in excess of coverage provided by the fund. Settled claims have not exceeded this stop-loss coverage since inception of the self-insured program which is accounted for in the general fund.
13. CONTINGENCIES AND COMMITMENTS
Legal Proceedings
The District is a defendant in several lawsuits for claims filed against it. In the best judgment of the District's management in consultation with legal counsel, the accompanying financial statements will not be affected materially by the outcome of any of these proceedings and therefore no loss contingency has been recorded.
14. MEDICARE PART D
The Medicare Prescription Drug, Improvement, and Modernization Act of 2003, which was effective January 1, 2006, established prescription drug coverage for Medicare beneficiaries known as Medicare Part D. One provision of the law allows for the Texas Public School Retired Employee Group Insurance Program (TRS-Care) to receive retiree drug subsidy payments from the federal government to offset certain prescription drug expenditures for eligible participants. These payments totaled $3,148,632 $3,109,916, and $2,601,155 for fiscal years 2021, 2020, and 2019, respectively.
15. DUE FROM OTHER GOVERNMENTS
The District participates in a variety of federal and state programs from which it receives grants to partially or fully finance certain activities. In addition, the District receives entitlements from the State through the School Foundation and Per Capita Programs. Most federal grants shown below are passed
63
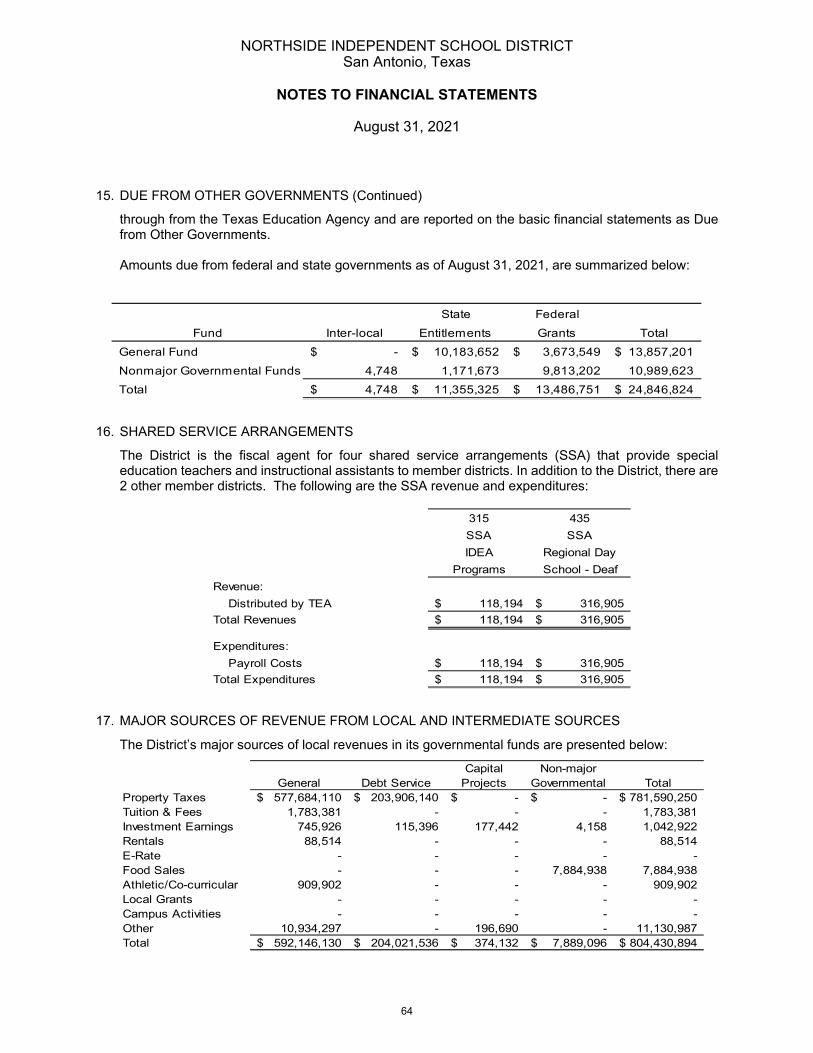
NORTHSIDE INDEPENDENT SCHOOL DISTRICT San Antonio, Texas
NOTES TO FINANCIAL STATEMENTS
August 31, 2021
15. DUE FROM OTHER GOVERNMENTS (Continued)
through from the Texas Education Agency and are reported on the basic financial statements as Due from Other Governments. Amounts due from federal and state governments as of August 31, 2021, are summarized below:
State FederalFund Inter-local Entitlements Grants Total
General Fund -$ 10,183,652$ 3,673,549$ 13,857,201$ Nonmajor Governmental Funds 4,748 1,171,673 9,813,202 10,989,623 Total 4,748$ 11,355,325$ 13,486,751$ 24,846,824$
16. SHARED SERVICE ARRANGEMENTS
The District is the fiscal agent for four shared service arrangements (SSA) that provide special education teachers and instructional assistants to member districts. In addition to the District, there are 2 other member districts. The following are the SSA revenue and expenditures:
315 435SSA SSAIDEA Regional Day
Programs School - DeafRevenue: Distributed by TEA 118,194$ 316,905$ Total Revenues 118,194$ 316,905$
Expenditures: Payroll Costs 118,194$ 316,905$ Total Expenditures 118,194$ 316,905$
17. MAJOR SOURCES OF REVENUE FROM LOCAL AND INTERMEDIATE SOURCES
The District’s major sources of local revenues in its governmental funds are presented below:
General Debt ServiceCapital
ProjectsNon-major
Governmental TotalProperty Taxes 577,684,110$ 203,906,140$ -$ -$ 781,590,250$ Tuition & Fees 1,783,381 - - - 1,783,381 Investment Earnings 745,926 115,396 177,442 4,158 1,042,922 Rentals 88,514 - - - 88,514 E-Rate - - - - - Food Sales - - - 7,884,938 7,884,938 Athletic/Co-curricular 909,902 - - - 909,902 Local Grants - - - - - Campus Activities - - - - - Other 10,934,297 - 196,690 - 11,130,987 Total 592,146,130$ 204,021,536$ 374,132$ 7,889,096$ 804,430,894$
64

NORTHSIDE INDEPENDENT SCHOOL DISTRICT San Antonio, Texas
NOTES TO FINANCIAL STATEMENTS
August 31, 2021
18. FEDERAL REVENUE RECORDED IN THE GENERAL FUND
Program Title Type Program AmountMedicaid School Health and Related Services Direct 21,955,587$ Impact Aid-P.L. 81-874 Direct 632,972 ROTC Direct 1,003,459 Prior Purchase Reimbursement Program Direct 6,269,972 CRF TDEM Reimbursement Direct 426,828 Teacher Placement Program Direct 6,800 Title IV, Part A, SSAEP Indirect 34,449 Natural Resources Conservation Services Indirect 712 Texas Hurricane Homeless Youth Indirect (1,362) Elementary and Secondary School Emergency Relief Fund (ESSER) Indirect 73,692 IDEA-B Discretionary (Deaf) Indirect 519 ESEA Title I, Part A Indirect 755,396 ESEA Title II, Part A Indirect 66,940 Title III, Part B, Homeless Children Indirect 5,238Instructional Continuity Indirect 4,862Title III, English Language Acquisition- LEP Indirect 52,769 Carl Perkins Basic Grant for Career & Technology Indirect 28,511 IDEA VI-B Formula Indirect 527,627 IDEA VI-B Preschool Formula Indirect 12,380 TANF Family Assistance Indirect 1,214 Adult Education Indirect 23,951
31,882,516$ 19. COMPLIANCE AND ACCOUNTABILITY
a. Finance Related Legal and Contractual Provisions In accordance with GASB Statement No. 38, “Certain Financial Statement Note Disclosures”, violations of finance-related legal and contractual provisions, if any, are reported below, along with actions taken to address such violations: Violation Action Taken None reported Not applicable
20. NEW ACCOUNTING PRONOUCEMENTS
GASB Statement No 84: Fiduciary Activities. This Statement establishes criteria for identifying fiduciary activities of all state and local governments. The focus of the criteria generally is on (1) whether a government is controlling the assets of the fiduciary activity and (2) the beneficiaries with whom a fiduciary relationship exists. Separate criteria are included to identify fiduciary component units and postemployment benefit arrangements that are fiduciary activities. An activity meeting the criteria should be reported in a fiduciary fund in the basic financial statements. Governments with activities meeting the criteria should present a statement of fiduciary net position and a statement of changes in fiduciary net position. This Statement became effective for the District in the current fiscal year and while the content of fiduciary statements will be modified, had no effect on the financial statements of the District.
65

NORTHSIDE INDEPENDENT SCHOOL DISTRICT San Antonio, Texas
NOTES TO FINANCIAL STATEMENTS
August 31, 2021
20. NEW ACCOUNTING PRONOUCEMENTS (Continued) GASB Statement No. 87: Leases. The objective of this Statement is to better meet the information needs of financial statement users by improving accounting and financial reporting for leases by governments. This Statement increases the usefulness of governments’ financial statements by requiring recognition of certain lease assets and liabilities for leases that previously were classified as operating leases and recognized as inflows of resources or outflows of resources based on the payment provisions of the contract. It establishes a single model for lease accounting based on the foundational principle that leases are financings of the right to use an underlying asset. Under this Statement, a lessee is required to recognize a lease liability and an intangible right-to-use lease asset, and a lessor is required to recognize a lease receivable and a deferred inflow of resources, thereby enhancing the relevance and consistency of information about governments’ leasing activities. This Statement will be effective for the District’s year ending August 31, 2022. The District is still evaluating its potential impact.
66
REQUIRED SUPPLEMENTARY INFORMATION
67
NORTHSIDE INDEPENDENT SCHOOL DISTRICTSan Antonio, Texas
SCHEDULE OF REVENUES, EXPENDITURES,AND CHANGES IN FUND BALANCE - BUDGET AND ACTUAL
GENERAL FUNDYear Ended August 31, 2021
ActualData Amounts
Control
Codes Original Final (GAAP Basis)
Variance with
Final Budget
REVENUES
5700 Local and Intermediate Sources 600,243,077$ 601,830,225$ 592,146,130$ (9,684,095)$ 5800 State Sources 309,158,751 310,121,759 303,301,195 (6,820,564) 5900 Federal Sources 27,533,965 28,064,267 31,882,516 3,818,249
5020 Total Revenues 936,935,793 940,016,251 927,329,841 (12,686,410)
EXPENDITURESCurrent:
0010 Instruction & Instructional Related Services:0011 Instruction 596,797,651 608,441,767 582,140,311 26,301,456 0012 Instructional Resources and Media Services 13,329,697 13,288,610 12,821,341 467,269 0013 Curriculum and Instructional Staff Development 18,786,301 19,213,549 17,663,867 1,549,682
Total Instruction & Instructional Related Services 628,913,649 640,943,926 612,625,519 28,318,407
0020 Instructional & School Leadership:0021 Instructional Leadership 22,818,920 20,256,288 19,624,556 631,732 0023 School Leadership 57,664,126 58,957,456 55,838,548 3,118,908
Total Instructional and School Leadership 80,483,046 79,213,744 75,463,104 3,750,640
0030 Support Services - Student:0031 Guidance and Counseling Services 41,235,146 41,668,595 40,060,540 1,608,055 0032 Social Work Services 3,405,946 3,367,786 3,041,821 325,965 0033 Health Services 10,541,716 12,710,291 11,163,737 1,546,554 0034 Pupil Transportation 35,984,086 36,246,419 30,914,908 5,331,511 0035 Child Nutrition Services 746,692 772,692 628,930 143,762 0036 Co-Curricular Activities 23,275,556 23,853,843 20,919,132 2,934,711
Total Support Services - Student 115,189,142 118,619,626 106,729,068 11,890,558
0040 Administration:0041 General Administration 15,703,841 17,355,777 15,981,730 1,374,047
Total Administration 15,703,841 17,355,777 15,981,730 1,374,047
0050 Support Services - Non-Student Based:0051 Plant Maintenance and Operations 84,652,751 85,884,255 82,398,779 3,485,476 0052 Security & Monitoring Services 9,270,232 9,411,586 8,727,188 684,398 0053 Data Processing Services 20,142,424 21,206,575 17,627,208 3,579,367
Total Support Services - Non-Student Based 114,065,407 116,502,416 108,753,175 7,749,241
0060 Ancillary Services:0061 Community Services 2,453,914 2,484,537 1,777,960 706,577
Total Ancillary Services 2,453,914 2,484,537 1,777,960 706,577
0080 Capital Outlay 0081 Facilities Acquisition and Construction 1,423,508 3,171,086 1,830,032 1,341,054
Total Capital Outlay 1,423,508 3,171,086 1,830,032 1,341,054
(Continued on next page.)
Budgeted Amounts
68

Exhibit F-1NORTHSIDE INDEPENDENT SCHOOL DISTRICT
San Antonio, Texas
SCHEDULE OF REVENUES, EXPENDITURES,AND CHANGES IN FUND BALANCE - BUDGET AND ACTUAL
GENERAL FUNDYear Ended August 31, 2021
ActualData Amounts
Control
Codes Original Final (GAAP Basis)
Variance with
Final Budget
EXPENDITURES (Continued)
0090 Intergovernmental Charges0095 Juvenile Alternative Education Program 182,040$ 182,040$ 17,661$ 164,379$ 0099 Other Intergovernmental Charges 5,245,065 5,245,065 4,091,589 1,153,476
Total Intergovernmental Charges 5,427,105 5,427,105 4,109,250 1,317,855
6030 Total Expenditures 963,659,612 983,718,217 927,269,838 56,448,379
1100 Excess (Deficiency) of Revenues Over Expenditures (26,723,819) (43,701,966) 60,003 43,761,969
Other Financing Sources (Uses):7919 Extraordinary Items - Insurance Proceeds - 13,626,851 13,626,851 - 8911 Other Uses (5,706,685) (87,847,362) (87,847,362) -
Total Other Financing Sources (Uses) (5,706,685) (74,220,511) (74,220,511) -
1200 Net Change in Fund Balance (32,430,504) (117,922,477) (74,160,508) 43,761,969
0100 FUND BALANCES, September 1, 2020 509,857,389 509,857,389 509,857,389 -
3000 FUND BALANCES, August 31, 2021 477,426,885$ 391,934,912$ 435,696,881$ 43,761,969$
Budgeted Amounts
69
2021 2020
District's Proportion of the Net Pension Liability (Asset) 0.567789164% 0.635636340%
District's Proportionate Share of Net Pension Liability (Asset) 304,096,292$ 330,423,641$
State's Proportionate Share of the Net Pension Liability (Asset) 509,230,988 473,203,648
associated with the District
Total 813,327,280$ 803,627,289$
District's Covered Payroll 708,014,427$ 723,335,987$
District's Proportionate Share of the Net Pension Liability (Asset)as a Percentage of its Covered Payroll 42.95% 45.68%
Plan Fiduciary Net Position as a Percentage of the Total Pension Liability 75.54% 75.24%
Note: Seven years of data are presented in accordance with GASB 68, Paragraph 138. "The information for all periods for the 10-year schedules that are required to be presented as required supplementary information may not be available initially. In these cases, during the transition period, that information should be presented for as many years as are available. The schedules should not include information that is not measured in accordance with the requirements of this Statement."
Note: GASB 68, 81.a.(2)(a) requires that the information on this schedule be data from the period corresponding with the period covered as of the measurement date of August 31, 2020 - the period from September 1, 2019 - August 31, 2020.
NORTHSIDE INDEPENDENT SCHOOL DISTRICTSan Antonio, Texas
SCHEDULE OF THE DISTRICT'S PROPORTIONATESHARE OF THE NET PENSION LIABILITY
TEACHER RETIREMENT SYSTEM OF TEXASYear Ended August 31, 2021
70
Exhibit F-2
2019 2018 2017 2016 2015
0.634933610% 0.633179746% 0.629787679% 0.653317300% 0.463126500%
349,482,869$ 202,456,772$ 237,987,399$ 230,938,970$ 123,707,492$
514,008,447 301,343,520 363,908,162 346,456,429 293,076,803
863,491,316$ 503,800,292$ 601,895,561$ 577,395,399$ 416,784,295$
692,630,183$ 671,910,694$ 649,054,807$ 631,085,132$ 606,189,117$
50.46% 30.13% 36.67% 36.59% 20.41%
73.74% 82.17% 78.00% 78.43% 83.25%
71
2021 2020
Contractually Required Contribution 23,034,957$ 23,429,772$
Contribution in Relation to the Contractually Required Contribution (23,034,957) (23,429,772) associated with the District
Contribution Deficiency (Excess) -$ -$
District's Covered Payroll 708,014,427$ 723,335,987$
Contributions as a Percentage of Covered Payroll 3.25% 3.24%
Note: Seven years of data are presented in accordance with GASB 68, Paragraph 138. "The information for all periods for the 10-year schedules that are required to be presented as required supplementary information may not be available initially. In these cases, during the transition period, that information should be presented for as many years as are available. The schedules should not include information that is not measured in accordance with the requirements of this Statement."
Note: GASB 68, Paragraph 81.b. requires that the data in this schedule be presented as of the District's current fiscal year end.
NORTHSIDE INDEPENDENT SCHOOL DISTRICTSan Antonio, Texas
SCHEDULE OF DISTRICT CONTRIBUTIONSTEACHER RETIREMENT SYSTEM OF TEXAS
Year Ended August 31, 2021
72

Exhibit F-3
2019 2018 2017 2016 2015
22,298,929$ 21,369,734$ 20,759,157$ 19,982,317$ 19,345,006$
(22,298,929) (21,369,734) (20,759,157) (19,982,317) (19,345,006)
-$ -$ -$ -$ -$
692,630,183$ 671,910,694$ 649,054,807$ 631,085,132$ 606,189,117$
3.22% 3.18% 3.20% 3.17% 3.19%
73
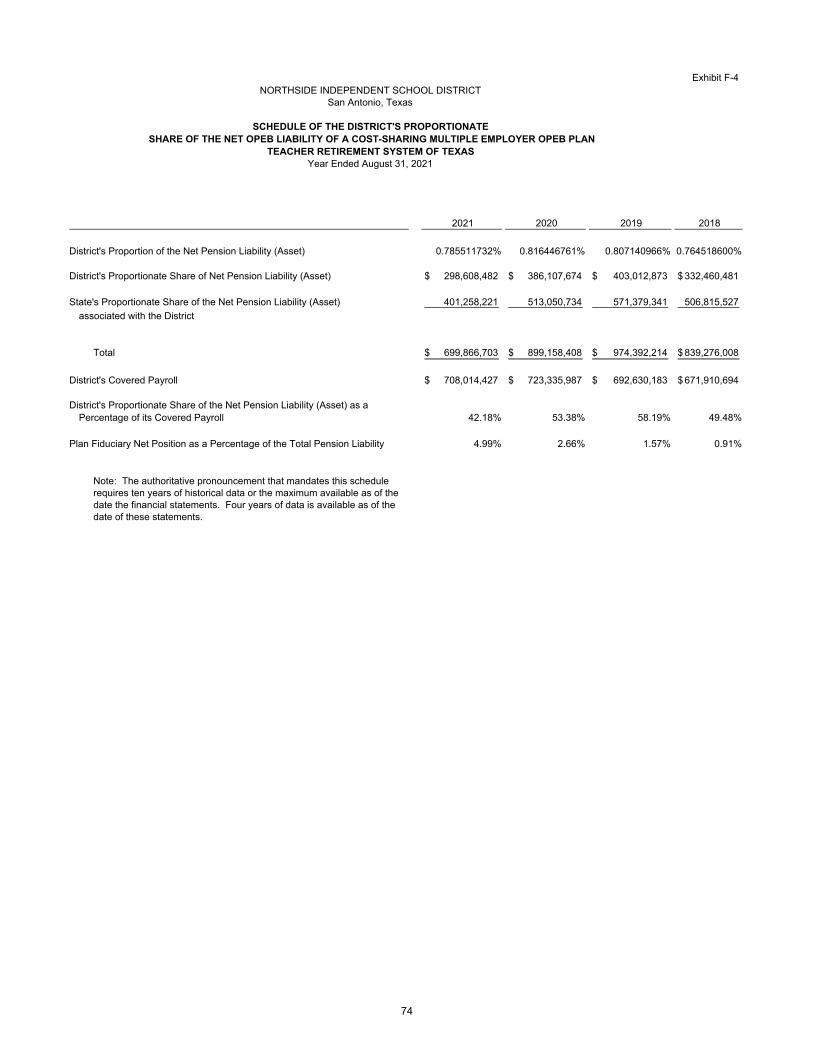
Exhibit F-4NORTHSIDE INDEPENDENT SCHOOL DISTRICT
San Antonio, Texas
SCHEDULE OF THE DISTRICT'S PROPORTIONATESHARE OF THE NET OPEB LIABILITY OF A COST-SHARING MULTIPLE EMPLOYER OPEB PLAN
TEACHER RETIREMENT SYSTEM OF TEXASYear Ended August 31, 2021
2021 2020 2019 2018
District's Proportion of the Net Pension Liability (Asset) 0.785511732% 0.816446761% 0.807140966% 0.764518600%
District's Proportionate Share of Net Pension Liability (Asset) 298,608,482$ 386,107,674$ 403,012,873$ 332,460,481$
State's Proportionate Share of the Net Pension Liability (Asset) 401,258,221 513,050,734 571,379,341 506,815,527
associated with the District
Total 699,866,703$ 899,158,408$ 974,392,214$ 839,276,008$
District's Covered Payroll 708,014,427$ 723,335,987$ 692,630,183$ 671,910,694$
District's Proportionate Share of the Net Pension Liability (Asset) as aPercentage of its Covered Payroll 42.18% 53.38% 58.19% 49.48%
Plan Fiduciary Net Position as a Percentage of the Total Pension Liability 4.99% 2.66% 1.57% 0.91%
Note: The authoritative pronouncement that mandates this schedule requires ten years of historical data or the maximum available as of the date the financial statements. Four years of data is available as of the date of these statements.
74
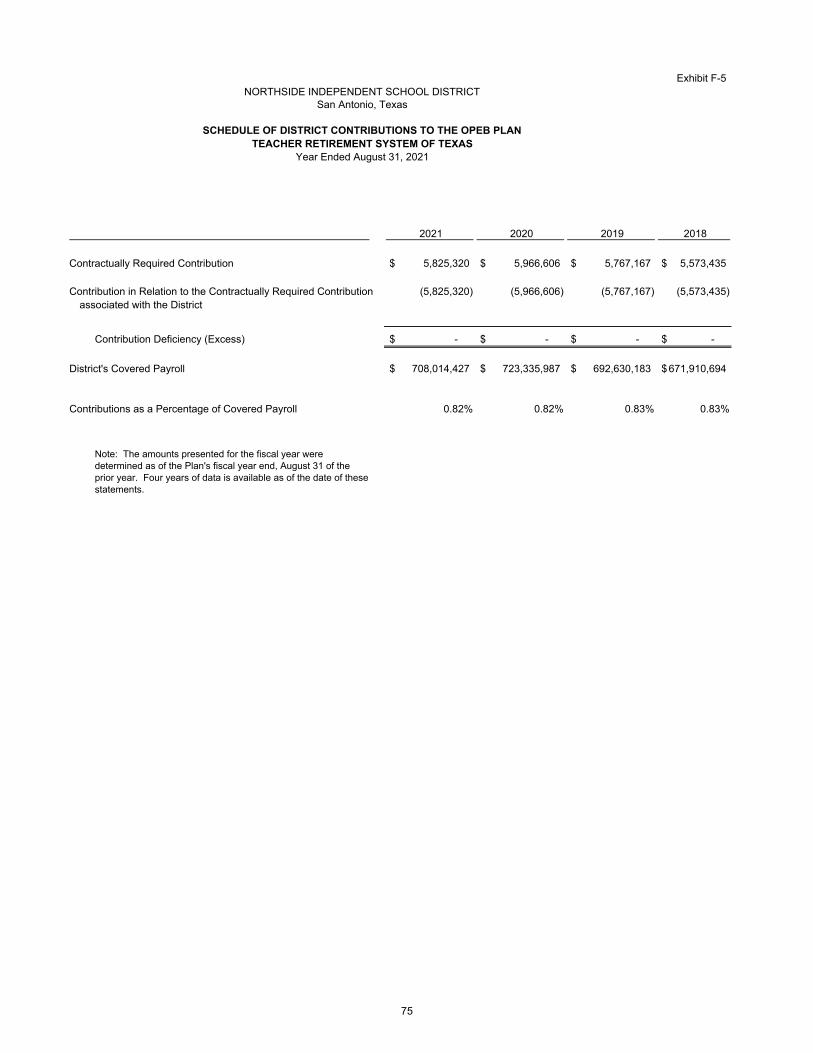
Exhibit F-5NORTHSIDE INDEPENDENT SCHOOL DISTRICT
San Antonio, Texas
SCHEDULE OF DISTRICT CONTRIBUTIONS TO THE OPEB PLANTEACHER RETIREMENT SYSTEM OF TEXAS
Year Ended August 31, 2021
2021 2020 2019 2018
Contractually Required Contribution 5,825,320$ 5,966,606$ 5,767,167$ 5,573,435$
Contribution in Relation to the Contractually Required Contribution (5,825,320) (5,966,606) (5,767,167) (5,573,435) associated with the District
Contribution Deficiency (Excess) -$ -$ -$ -$
District's Covered Payroll 708,014,427$ 723,335,987$ 692,630,183$ 671,910,694$
Contributions as a Percentage of Covered Payroll 0.82% 0.82% 0.83% 0.83%
Note: The amounts presented for the fiscal year were determined as of the Plan's fiscal year end, August 31 of the prior year. Four years of data is available as of the date of these statements.
75

(This page intentionally left blank)
76

OTHER SUPPLEMENTARY INFORMATION
77
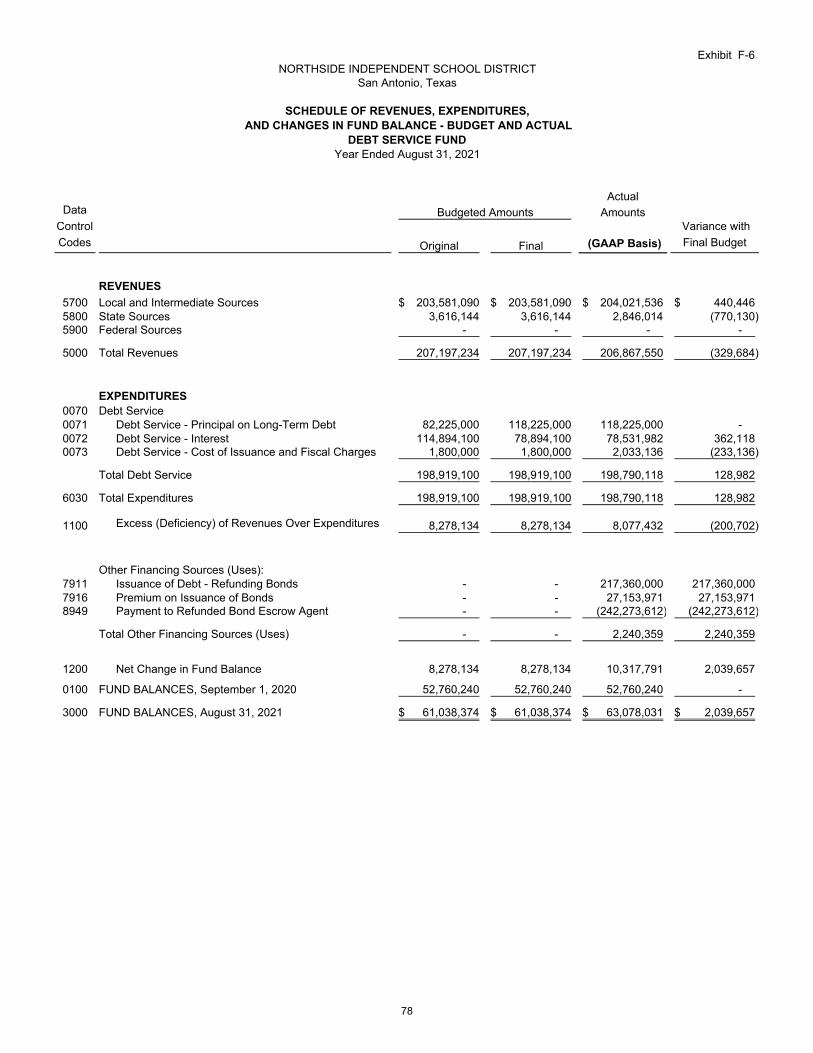
Exhibit F-6NORTHSIDE INDEPENDENT SCHOOL DISTRICT
San Antonio, Texas
SCHEDULE OF REVENUES, EXPENDITURES,AND CHANGES IN FUND BALANCE - BUDGET AND ACTUAL
DEBT SERVICE FUNDYear Ended August 31, 2021
ActualData Amounts
Control
Codes Original Final (GAAP Basis)
Variance with
Final Budget
REVENUES
5700 Local and Intermediate Sources 203,581,090$ 203,581,090$ 204,021,536$ 440,446$ 5800 State Sources 3,616,144 3,616,144 2,846,014 (770,130) 5900 Federal Sources - - - -
5000 Total Revenues 207,197,234 207,197,234 206,867,550 (329,684)
EXPENDITURES0070 Debt Service0071 Debt Service - Principal on Long-Term Debt 82,225,000 118,225,000 118,225,000 - 0072 Debt Service - Interest 114,894,100 78,894,100 78,531,982 362,118 0073 Debt Service - Cost of Issuance and Fiscal Charges 1,800,000 1,800,000 2,033,136 (233,136)
Total Debt Service 198,919,100 198,919,100 198,790,118 128,982
6030 Total Expenditures 198,919,100 198,919,100 198,790,118 128,982
1100 Excess (Deficiency) of Revenues Over Expenditures 8,278,134 8,278,134 8,077,432 (200,702)
Other Financing Sources (Uses):7911 Issuance of Debt - Refunding Bonds - - 217,360,000 217,360,000 7916 Premium on Issuance of Bonds - - 27,153,971 27,153,971 8949 Payment to Refunded Bond Escrow Agent - - (242,273,612) (242,273,612)
Total Other Financing Sources (Uses) - - 2,240,359 2,240,359
1200 Net Change in Fund Balance 8,278,134 8,278,134 10,317,791 2,039,657
0100 FUND BALANCES, September 1, 2020 52,760,240 52,760,240 52,760,240 -
3000 FUND BALANCES, August 31, 2021 61,038,374$ 61,038,374$ 63,078,031$ 2,039,657$
Budgeted Amounts
78

Exhibit F-7NORTHSIDE INDEPENDENT SCHOOL DISTRICT
San Antonio, Texas
SCHEDULE OF REVENUES, EXPENDITURES,AND CHANGES IN FUND BALANCE - BUDGET AND ACTUAL
CHILD NUTRITION FUNDYear Ended August 31, 2021
ActualData Amounts
Control
Codes Original Final (GAAP Basis)
Variance with
Final Budget
REVENUES
5700 Local and Intermediate Sources 8,594,938$ 599,095$ 593,553$ (5,542)$ 5800 State Sources 272,781 269,827 269,773 (54) 5900 Federal Sources 36,132,281 33,729,062 33,527,019 (202,043)
5000 Total Revenues 45,000,000 34,597,984 34,390,345 (207,639)
EXPENDITURES
Current:
0030 Support Services - Student:0035 Child Nutrition Services 44,520,371 38,286,442 38,296,968 (10,526)
Total Support Services - Student 44,520,371 38,286,442 38,296,968 (10,526)
0050 Support Services - Non-Student Based:
0051 Plant Maintenance and Operations 2,579,629 2,997,270 2,870,211 127,059 0052 Security and Monitoring Services - 9,490 7,798 1,692
Total Support Services - Non-Student Based - 9,490 7,798 1,692
6030 Total Expenditures 47,100,000 41,293,202 41,174,977 118,225
1100 Excess (Deficiency) of Revenues Over Expenditures (2,100,000) (6,695,218) (6,784,632) (89,414)
Other Financing Sources (Uses):7915 Transfers In - 2,000,000 2,000,000 -
Total Other Financing Sources (Uses) - 2,000,000 2,000,000 -
1200 Net Change in Fund Balance (2,100,000) (4,695,218) (4,784,632) (89,414)
0100 FUND BALANCES, September 1, 2020 14,001,729 14,001,729 10,448,270 (3,553,459)
3000 FUND BALANCES, August 31, 2021 11,901,729$ 9,306,511$ 5,663,638$ (3,642,873)$
Budgeted Amounts
79
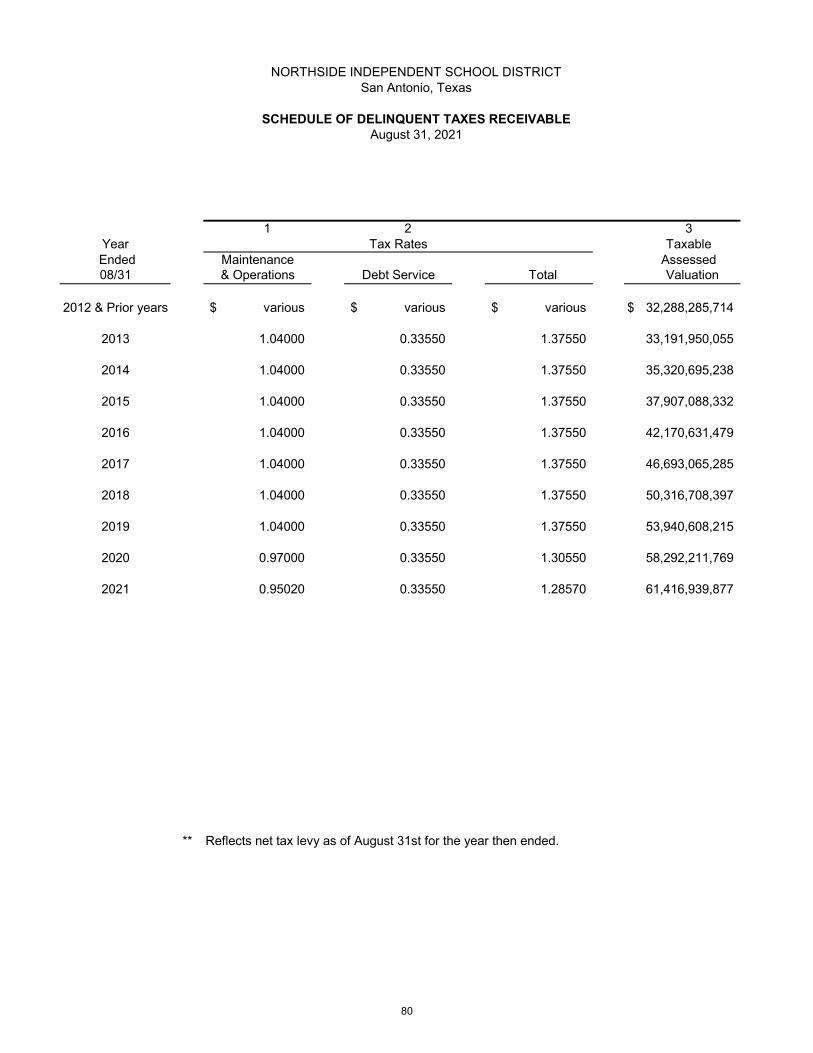
NORTHSIDE INDEPENDENT SCHOOL DISTRICTSan Antonio, Texas
SCHEDULE OF DELINQUENT TAXES RECEIVABLEAugust 31, 2021
1 2 3Year Tax Rates Taxable
Ended Maintenance Assessed08/31 & Operations Debt Service Total Valuation
2012 & Prior years $ various $ various $ various $ 32,288,285,714
2013 1.04000 0.33550 1.37550 33,191,950,055
2014 1.04000 0.33550 1.37550 35,320,695,238
2015 1.04000 0.33550 1.37550 37,907,088,332
2016 1.04000 0.33550 1.37550 42,170,631,479
2017 1.04000 0.33550 1.37550 46,693,065,285
2018 1.04000 0.33550 1.37550 50,316,708,397
2019 1.04000 0.33550 1.37550 53,940,608,215
2020 0.97000 0.33550 1.30550 58,292,211,769
2021 0.95020 0.33550 1.28570 61,416,939,877
** Reflects net tax levy as of August 31st for the year then ended.
80
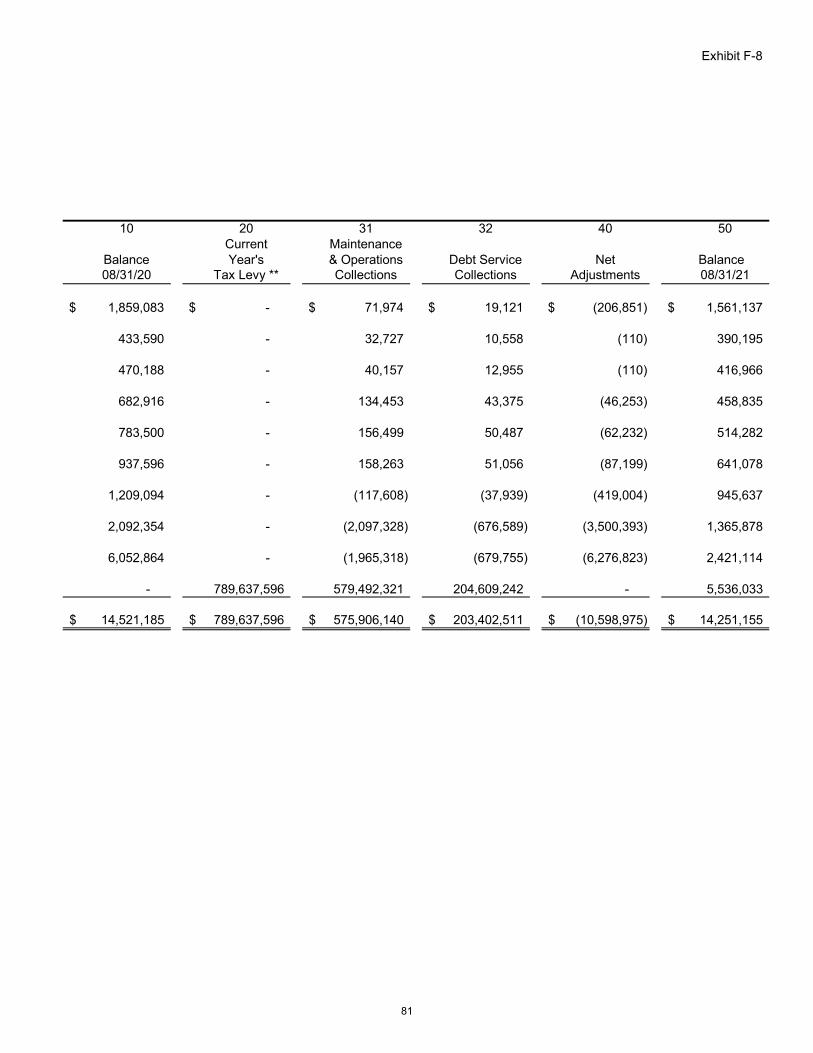
Exhibit F-8
10 20 31 32 40 50Current Maintenance
Balance Year's & Operations Debt Service Net Balance 08/31/20 Tax Levy ** Collections Collections Adjustments 08/31/21
$ 1,859,083 $ - $ 71,974 $ 19,121 $ (206,851) $ 1,561,137
433,590 - 32,727 10,558 (110) 390,195
470,188 - 40,157 12,955 (110) 416,966
682,916 - 134,453 43,375 (46,253) 458,835
783,500 - 156,499 50,487 (62,232) 514,282
937,596 - 158,263 51,056 (87,199) 641,078
1,209,094 - (117,608) (37,939) (419,004) 945,637
2,092,354 - (2,097,328) (676,589) (3,500,393) 1,365,878
6,052,864 - (1,965,318) (679,755) (6,276,823) 2,421,114
- 789,637,596 579,492,321 204,609,242 - 5,536,033
$ 14,521,185 $ 789,637,596 $ 575,906,140 $ 203,402,511 $ (10,598,975) $ 14,251,155
81
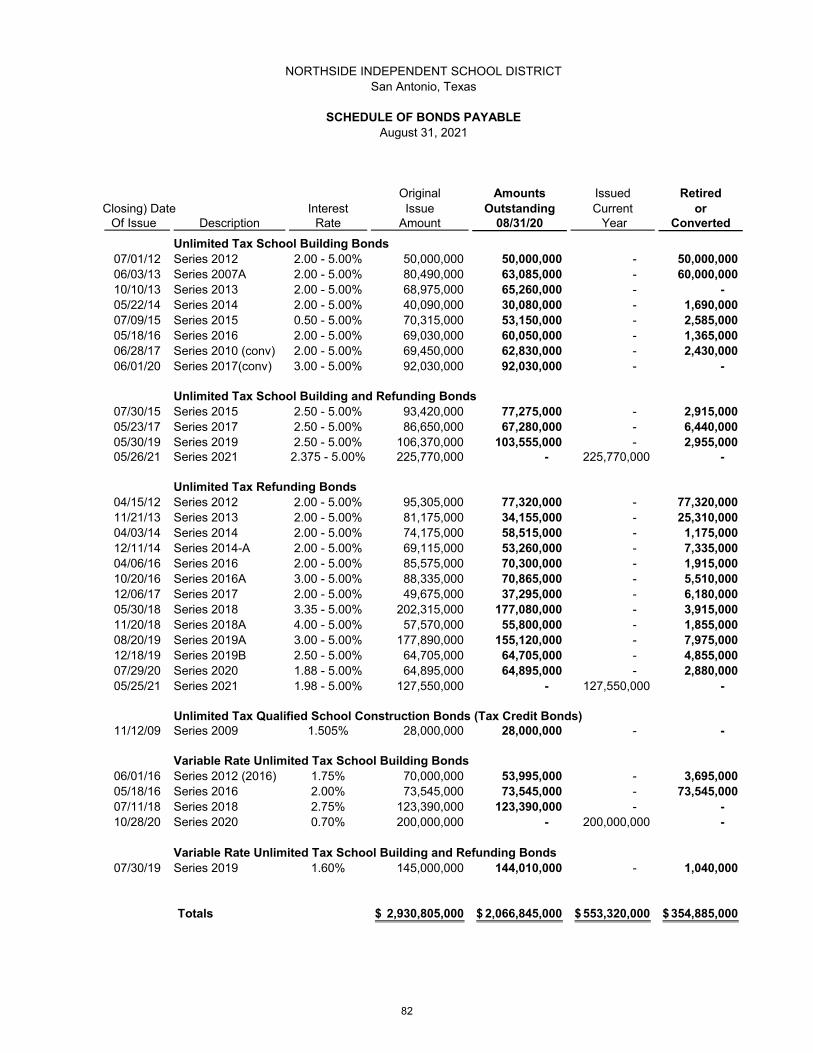
NORTHSIDE INDEPENDENT SCHOOL DISTRICTSan Antonio, Texas
SCHEDULE OF BONDS PAYABLEAugust 31, 2021
Original Amounts Issued RetiredClosing) Date Interest Issue Outstanding Current or
Of Issue Description Rate Amount 08/31/20 Year Converted
Unlimited Tax School Building Bonds07/01/12 Series 2012 2.00 - 5.00% 50,000,000 50,000,000 - 50,000,000 06/03/13 Series 2007A 2.00 - 5.00% 80,490,000 63,085,000 - 60,000,000 10/10/13 Series 2013 2.00 - 5.00% 68,975,000 65,260,000 - - 05/22/14 Series 2014 2.00 - 5.00% 40,090,000 30,080,000 - 1,690,000 07/09/15 Series 2015 0.50 - 5.00% 70,315,000 53,150,000 - 2,585,000 05/18/16 Series 2016 2.00 - 5.00% 69,030,000 60,050,000 - 1,365,000 06/28/17 Series 2010 (conv) 2.00 - 5.00% 69,450,000 62,830,000 - 2,430,000 06/01/20 Series 2017(conv) 3.00 - 5.00% 92,030,000 92,030,000 - -
Unlimited Tax School Building and Refunding Bonds07/30/15 Series 2015 2.50 - 5.00% 93,420,000 77,275,000 - 2,915,000 05/23/17 Series 2017 2.50 - 5.00% 86,650,000 67,280,000 - 6,440,000 05/30/19 Series 2019 2.50 - 5.00% 106,370,000 103,555,000 - 2,955,000 05/26/21 Series 2021 2.375 - 5.00% 225,770,000 - 225,770,000 -
Unlimited Tax Refunding Bonds04/15/12 Series 2012 2.00 - 5.00% 95,305,000 77,320,000 - 77,320,000 11/21/13 Series 2013 2.00 - 5.00% 81,175,000 34,155,000 - 25,310,000 04/03/14 Series 2014 2.00 - 5.00% 74,175,000 58,515,000 - 1,175,000 12/11/14 Series 2014-A 2.00 - 5.00% 69,115,000 53,260,000 - 7,335,000 04/06/16 Series 2016 2.00 - 5.00% 85,575,000 70,300,000 - 1,915,000 10/20/16 Series 2016A 3.00 - 5.00% 88,335,000 70,865,000 - 5,510,000 12/06/17 Series 2017 2.00 - 5.00% 49,675,000 37,295,000 - 6,180,000 05/30/18 Series 2018 3.35 - 5.00% 202,315,000 177,080,000 - 3,915,000 11/20/18 Series 2018A 4.00 - 5.00% 57,570,000 55,800,000 - 1,855,000 08/20/19 Series 2019A 3.00 - 5.00% 177,890,000 155,120,000 - 7,975,000 12/18/19 Series 2019B 2.50 - 5.00% 64,705,000 64,705,000 - 4,855,000 07/29/20 Series 2020 1.88 - 5.00% 64,895,000 64,895,000 - 2,880,000 05/25/21 Series 2021 1.98 - 5.00% 127,550,000 - 127,550,000 -
Unlimited Tax Qualified School Construction Bonds (Tax Credit Bonds)11/12/09 Series 2009 1.505% 28,000,000 28,000,000 - -
Variable Rate Unlimited Tax School Building Bonds06/01/16 Series 2012 (2016) 1.75% 70,000,000 53,995,000 - 3,695,000 05/18/16 Series 2016 2.00% 73,545,000 73,545,000 - 73,545,000 07/11/18 Series 2018 2.75% 123,390,000 123,390,000 - - 10/28/20 Series 2020 0.70% 200,000,000 - 200,000,000 -
Variable Rate Unlimited Tax School Building and Refunding Bonds07/30/19 Series 2019 1.60% 145,000,000 144,010,000 - 1,040,000
Totals 2,930,805,000$ 2,066,845,000$ 553,320,000$ 354,885,000$
82
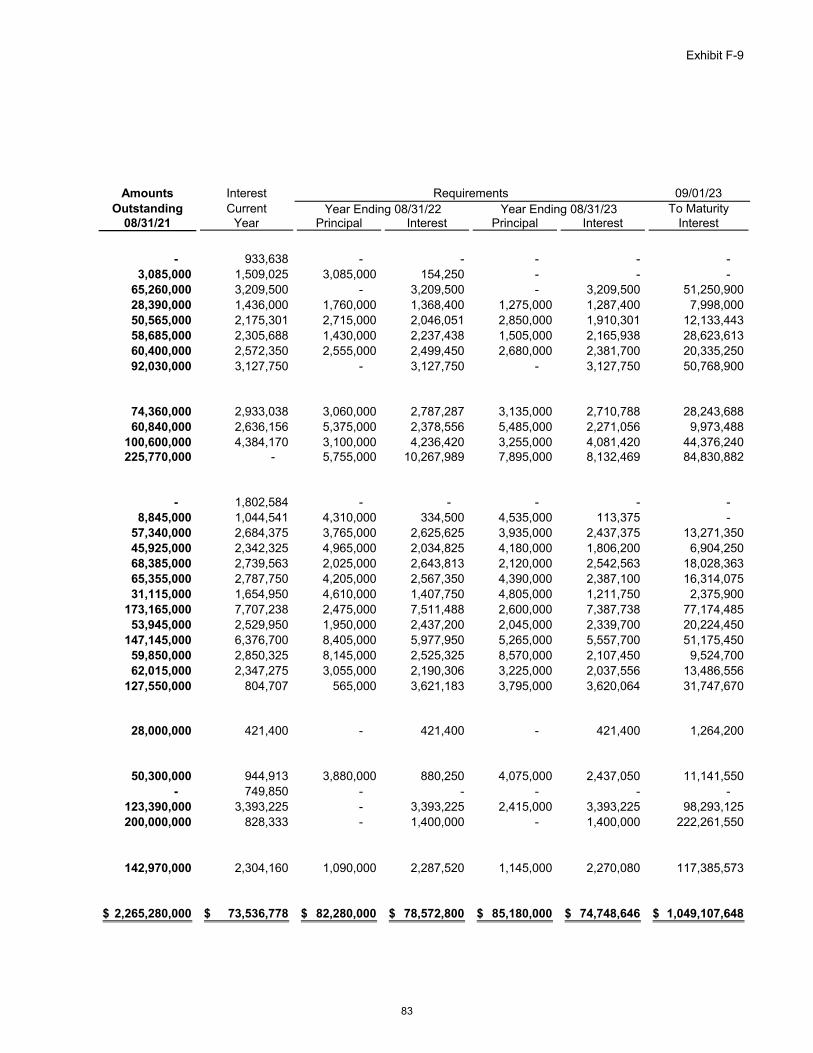
Exhibit F-9
Amounts Interest Requirements 09/01/23Outstanding Current Year Ending 08/31/22 Year Ending 08/31/23 To Maturity
08/31/21 Year Principal Interest Principal Interest Interest
- 933,638 - - - - - 3,085,000 1,509,025 3,085,000 154,250 - - -
65,260,000 3,209,500 - 3,209,500 - 3,209,500 51,250,900 28,390,000 1,436,000 1,760,000 1,368,400 1,275,000 1,287,400 7,998,000 50,565,000 2,175,301 2,715,000 2,046,051 2,850,000 1,910,301 12,133,443 58,685,000 2,305,688 1,430,000 2,237,438 1,505,000 2,165,938 28,623,613 60,400,000 2,572,350 2,555,000 2,499,450 2,680,000 2,381,700 20,335,250 92,030,000 3,127,750 - 3,127,750 - 3,127,750 50,768,900
74,360,000 2,933,038 3,060,000 2,787,287 3,135,000 2,710,788 28,243,688 60,840,000 2,636,156 5,375,000 2,378,556 5,485,000 2,271,056 9,973,488
100,600,000 4,384,170 3,100,000 4,236,420 3,255,000 4,081,420 44,376,240 225,770,000 - 5,755,000 10,267,989 7,895,000 8,132,469 84,830,882
- 1,802,584 - - - - - 8,845,000 1,044,541 4,310,000 334,500 4,535,000 113,375 -
57,340,000 2,684,375 3,765,000 2,625,625 3,935,000 2,437,375 13,271,350 45,925,000 2,342,325 4,965,000 2,034,825 4,180,000 1,806,200 6,904,250 68,385,000 2,739,563 2,025,000 2,643,813 2,120,000 2,542,563 18,028,363 65,355,000 2,787,750 4,205,000 2,567,350 4,390,000 2,387,100 16,314,075 31,115,000 1,654,950 4,610,000 1,407,750 4,805,000 1,211,750 2,375,900
173,165,000 7,707,238 2,475,000 7,511,488 2,600,000 7,387,738 77,174,485 53,945,000 2,529,950 1,950,000 2,437,200 2,045,000 2,339,700 20,224,450
147,145,000 6,376,700 8,405,000 5,977,950 5,265,000 5,557,700 51,175,450 59,850,000 2,850,325 8,145,000 2,525,325 8,570,000 2,107,450 9,524,700 62,015,000 2,347,275 3,055,000 2,190,306 3,225,000 2,037,556 13,486,556
127,550,000 804,707 565,000 3,621,183 3,795,000 3,620,064 31,747,670
28,000,000 421,400 - 421,400 - 421,400 1,264,200
50,300,000 944,913 3,880,000 880,250 4,075,000 2,437,050 11,141,550 - 749,850 - - - - -
123,390,000 3,393,225 - 3,393,225 2,415,000 3,393,225 98,293,125 200,000,000 828,333 - 1,400,000 - 1,400,000 222,261,550
142,970,000 2,304,160 1,090,000 2,287,520 1,145,000 2,270,080 117,385,573
2,265,280,000$ 73,536,778$ 82,280,000$ 78,572,800$ 85,180,000$ 74,748,646$ 1,049,107,648$
83
NON-MAJOR GOVERNMENTAL FUNDS SPECIAL REVENUE FUNDS
Special Revenue Funds are used to account for Federal, State, and locally funded grants. These grants, referred to as projects, are awarded to the Northside Independent School District with the purpose of accomplishing specific educational tasks.
TITLE III, PART B, STEWART B. MCKINNEY HOMELESS ASSISTANCE (206) provides for a variety of staff development and supplemental services, including in-service training, counseling, psychological services, and tutoring for homeless students. TITLE I, PART A, (211) accounts for two programs. Improving Basic Programs funds are allocated to provide opportunities for educationally disadvantaged children to acquire the knowledge and skills contained in the challenging State content standards and to meet the challenging State performance standards developed for all children. Campuses are supported in implementing either a schoolwide program or a targeted assistance program. Costs supplement, not replace, normal local effort. School Improvement Grant funds are for additional academic instruction that provides supplemental resources to LEAs to help schools with high concentrations of students from low-income families provide high-quality education, which will enable all children to meet the state student performance standards. School Improvement Grants provide funds to identified campuses and are supplemental to the Title I, Part A funds. ADULT BASIC EDUCATION GRANTS (220) are used to provide or support programs for educational services to adults who are beyond compulsory school attendance age, are not enrolled in school and function at less than secondary completion level. Educational services include basic education skills (reading, writing, speaking, and mathematics), English as a Second Language, secondary level competencies for acquisition of a high school diploma or equivalent, and site based workplace Literacy programs. TEMPORARY ASSISTANCE FOR NEEDY FAMILIES (TANF) (223) is granted to provide education services to undereducated adult recipients of cash assistance under Temporary Assistance for Needy Families (TANF). Recipients of benefits are required to participate in adult basic education or job training programs as a condition of eligibility. Educational services include basic educational skills (reading, writing, speaking, and mathematics), English as a Second Language instruction and secondary level competencies for acquisition of a high school diploma or its equivalent. IDEA - PART B, FORMULA (224) is granted to operate educational programs for children with disabilities. IDEA - PART B PRESCHOOL (225) is granted to operate programs to meet the special needs of preschool children with disabilities. NATIONAL BREAKFAST & LUNCH PROGRAM – CHILD NUTRITION (240) accounts for all food services activity of the District. Major revenue sources include National School Lunch and Breakfast program and U.S.D.A. donated commodities.
84

CARL D. PERKINS GRANTS (244) funds granted to provide career and technical education to develop new and/or improve career and technology education programs for paid and unpaid employment. Full participation in the basic grant is from individuals who are members of special populations at 1) a limited number of campuses (sites) or 2) a limited number of program areas. The Perkins V: Strengthening CTE for 21st Century Grant provides high school students modern, impactful, and rigorous, career and technical program which can serve to close performance caps while simultaneously preparing students for post-secondary success. TITLE II, PART A, (255) Supporting Effective Instruction funds are utilized for recruiting, hiring, and retaining effective teachers and principals. The Grant provide high quality training and personalized professional development for teachers, instructional leadership teams, and principals. Principal Preparation Grant funds seek to identify strong principal candidates from current staff, partner with an effective principal preparation program, and offer candidates authentic campus-based leadership experiences. TITLE III, PART A, ENGLISH LANGUAGE ACQUISITION & ENHANCEMENT GRANTS (263) provides supplemental resources to help ensure that children who are limited English proficient and immigrant children and youth attain English proficiency at high levels in core academic subjects and can meet state mandated achievement performance standards. 21ST CENTURY COMMUNITY LEARNING CENTERS (265) is granted to provide opportunities for communities to establish or expand activities in community learning centers that provide opportunities for academic enrichment to students and related educational development for families of students. ELEMENTARY AND SECONDARY SCHOOL EMERGENCY RELIEF (266) are funds awarded for the intent and purpose of the CARES Act education funding to prevent, prepare for, and respond to the coronavirus. MEDICAID ADMINISTRATIVE CLAIMING PROGRAM (272) is program funds authorized through the state’s Medicaid plan and are reimbursed for eligible administrative costs and allocated for approved Medicaid related expenditures. INSTRUCTIONAL CONTINUITY GRANT (276) are funds for supplemental resources to school districts to support improved student outcomes on targeted support and improvement campuses. The purpose of this grant is to increase the capacity of school districts to facilitate instructional continuity and distance, remote, and/or virtual learning for identified targeted support and improvement campuses that have been affected by campus closures due to COVID-19. CORONAVIRUS RELIEF FUND (CRF) - OPERATION CONNECTIVITY (277) are funds awarded for the intent and purpose of the CARES Act education funding to prevent, prepare for, and respond to the coronavirus. The Operation Connectivity Prior Purchase Reimbursement Program (PPRP) provides reimbursement funding to eligible school districts for technology-related purchases made to serve students and staff during the COVID-19 pandemic. The CRF Operation Connectivity Bulk-Purchase Local Match Reimbursement Program (LMRP) provides reimbursement funding to eligible school districts to facilitate distance learning, including technological improvements, in connection with school closings to enable compliance with COVID-19 precautions and for developing online learning capabilities necessary to continue educational instruction in response to COVID-19 related school closures.
85
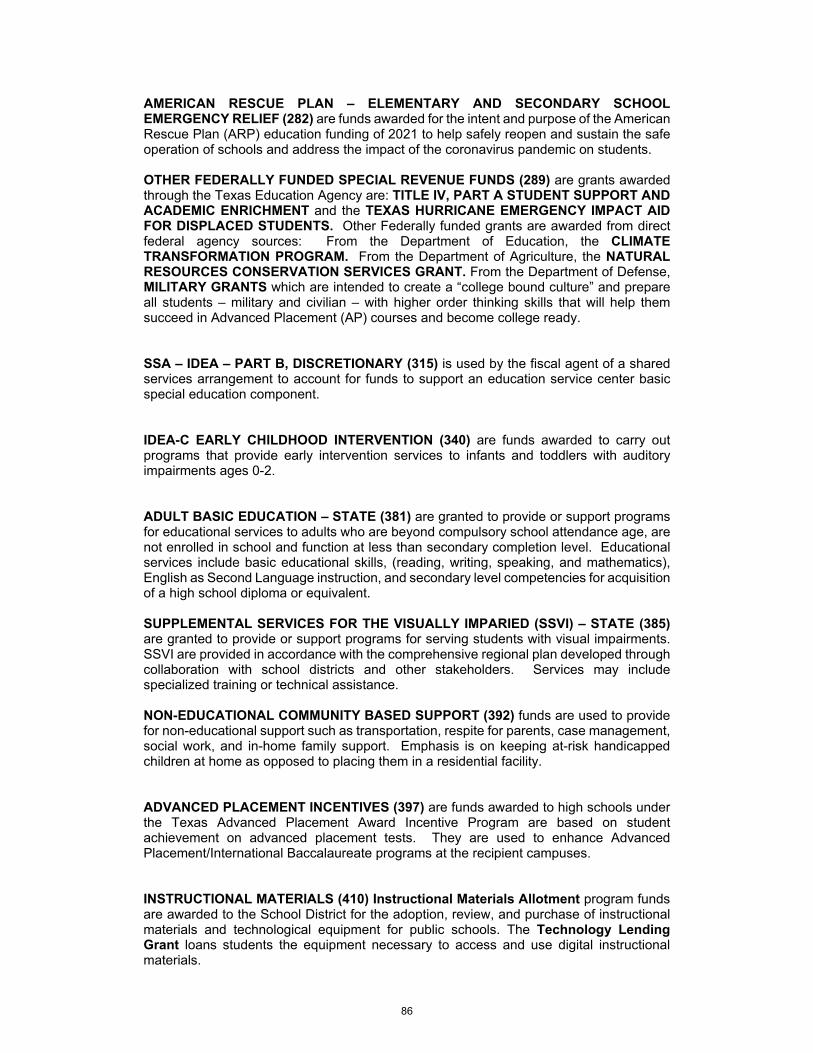
AMERICAN RESCUE PLAN – ELEMENTARY AND SECONDARY SCHOOL EMERGENCY RELIEF (282) are funds awarded for the intent and purpose of the American Rescue Plan (ARP) education funding of 2021 to help safely reopen and sustain the safe operation of schools and address the impact of the coronavirus pandemic on students. OTHER FEDERALLY FUNDED SPECIAL REVENUE FUNDS (289) are grants awarded through the Texas Education Agency are: TITLE IV, PART A STUDENT SUPPORT AND ACADEMIC ENRICHMENT and the TEXAS HURRICANE EMERGENCY IMPACT AID FOR DISPLACED STUDENTS. Other Federally funded grants are awarded from direct federal agency sources: From the Department of Education, the CLIMATE TRANSFORMATION PROGRAM. From the Department of Agriculture, the NATURAL RESOURCES CONSERVATION SERVICES GRANT. From the Department of Defense, MILITARY GRANTS which are intended to create a “college bound culture” and prepare all students – military and civilian – with higher order thinking skills that will help them succeed in Advanced Placement (AP) courses and become college ready. SSA – IDEA – PART B, DISCRETIONARY (315) is used by the fiscal agent of a shared services arrangement to account for funds to support an education service center basic special education component. IDEA-C EARLY CHILDHOOD INTERVENTION (340) are funds awarded to carry out programs that provide early intervention services to infants and toddlers with auditory impairments ages 0-2. ADULT BASIC EDUCATION – STATE (381) are granted to provide or support programs for educational services to adults who are beyond compulsory school attendance age, are not enrolled in school and function at less than secondary completion level. Educational services include basic educational skills, (reading, writing, speaking, and mathematics), English as Second Language instruction, and secondary level competencies for acquisition of a high school diploma or equivalent.
SUPPLEMENTAL SERVICES FOR THE VISUALLY IMPARIED (SSVI) – STATE (385) are granted to provide or support programs for serving students with visual impairments. SSVI are provided in accordance with the comprehensive regional plan developed through collaboration with school districts and other stakeholders. Services may include specialized training or technical assistance. NON-EDUCATIONAL COMMUNITY BASED SUPPORT (392) funds are used to provide for non-educational support such as transportation, respite for parents, case management, social work, and in-home family support. Emphasis is on keeping at-risk handicapped children at home as opposed to placing them in a residential facility. ADVANCED PLACEMENT INCENTIVES (397) are funds awarded to high schools under the Texas Advanced Placement Award Incentive Program are based on student achievement on advanced placement tests. They are used to enhance Advanced Placement/International Baccalaureate programs at the recipient campuses. INSTRUCTIONAL MATERIALS (410) Instructional Materials Allotment program funds are awarded to the School District for the adoption, review, and purchase of instructional materials and technological equipment for public schools. The Technology Lending Grant loans students the equipment necessary to access and use digital instructional materials.
86
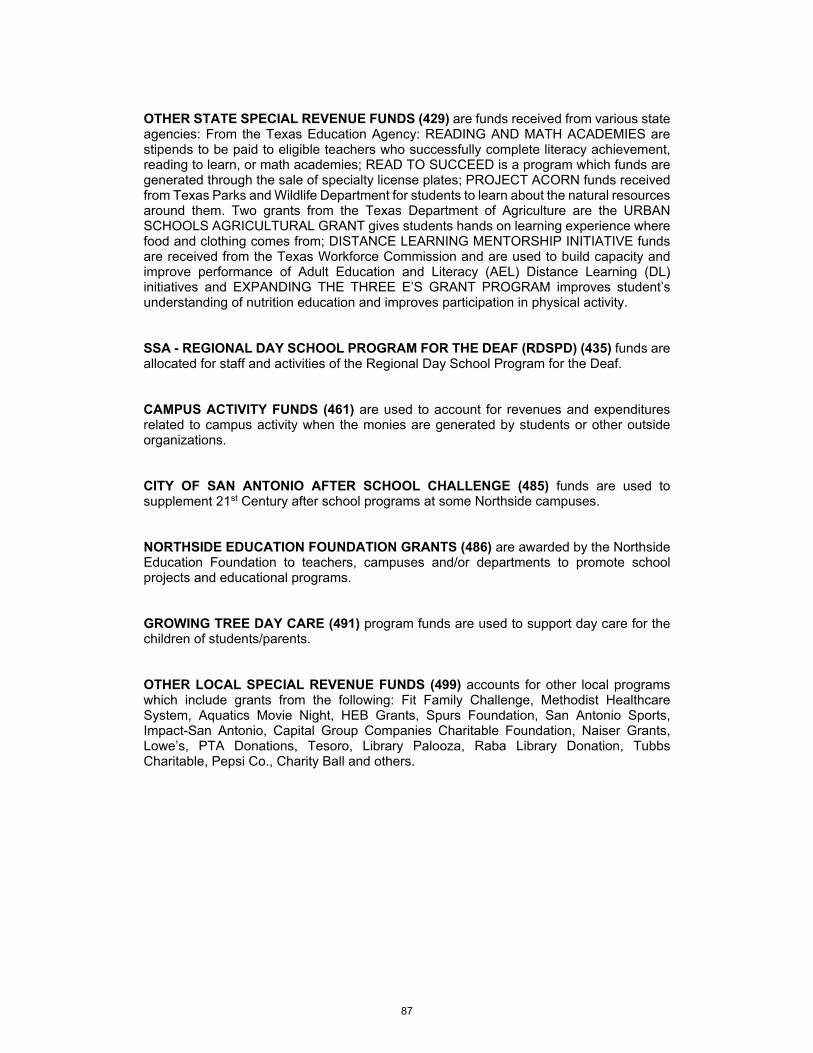
OTHER STATE SPECIAL REVENUE FUNDS (429) are funds received from various state agencies: From the Texas Education Agency: READING AND MATH ACADEMIES are stipends to be paid to eligible teachers who successfully complete literacy achievement, reading to learn, or math academies; READ TO SUCCEED is a program which funds are generated through the sale of specialty license plates; PROJECT ACORN funds received from Texas Parks and Wildlife Department for students to learn about the natural resources around them. Two grants from the Texas Department of Agriculture are the URBAN SCHOOLS AGRICULTURAL GRANT gives students hands on learning experience where food and clothing comes from; DISTANCE LEARNING MENTORSHIP INITIATIVE funds are received from the Texas Workforce Commission and are used to build capacity and improve performance of Adult Education and Literacy (AEL) Distance Learning (DL) initiatives and EXPANDING THE THREE E’S GRANT PROGRAM improves student’s understanding of nutrition education and improves participation in physical activity. SSA - REGIONAL DAY SCHOOL PROGRAM FOR THE DEAF (RDSPD) (435) funds are allocated for staff and activities of the Regional Day School Program for the Deaf. CAMPUS ACTIVITY FUNDS (461) are used to account for revenues and expenditures related to campus activity when the monies are generated by students or other outside organizations. CITY OF SAN ANTONIO AFTER SCHOOL CHALLENGE (485) funds are used to supplement 21st Century after school programs at some Northside campuses. NORTHSIDE EDUCATION FOUNDATION GRANTS (486) are awarded by the Northside Education Foundation to teachers, campuses and/or departments to promote school projects and educational programs. GROWING TREE DAY CARE (491) program funds are used to support day care for the children of students/parents. OTHER LOCAL SPECIAL REVENUE FUNDS (499) accounts for other local programs which include grants from the following: Fit Family Challenge, Methodist Healthcare System, Aquatics Movie Night, HEB Grants, Spurs Foundation, San Antonio Sports, Impact-San Antonio, Capital Group Companies Charitable Foundation, Naiser Grants, Lowe’s, PTA Donations, Tesoro, Library Palooza, Raba Library Donation, Tubbs Charitable, Pepsi Co., Charity Ball and others.
87
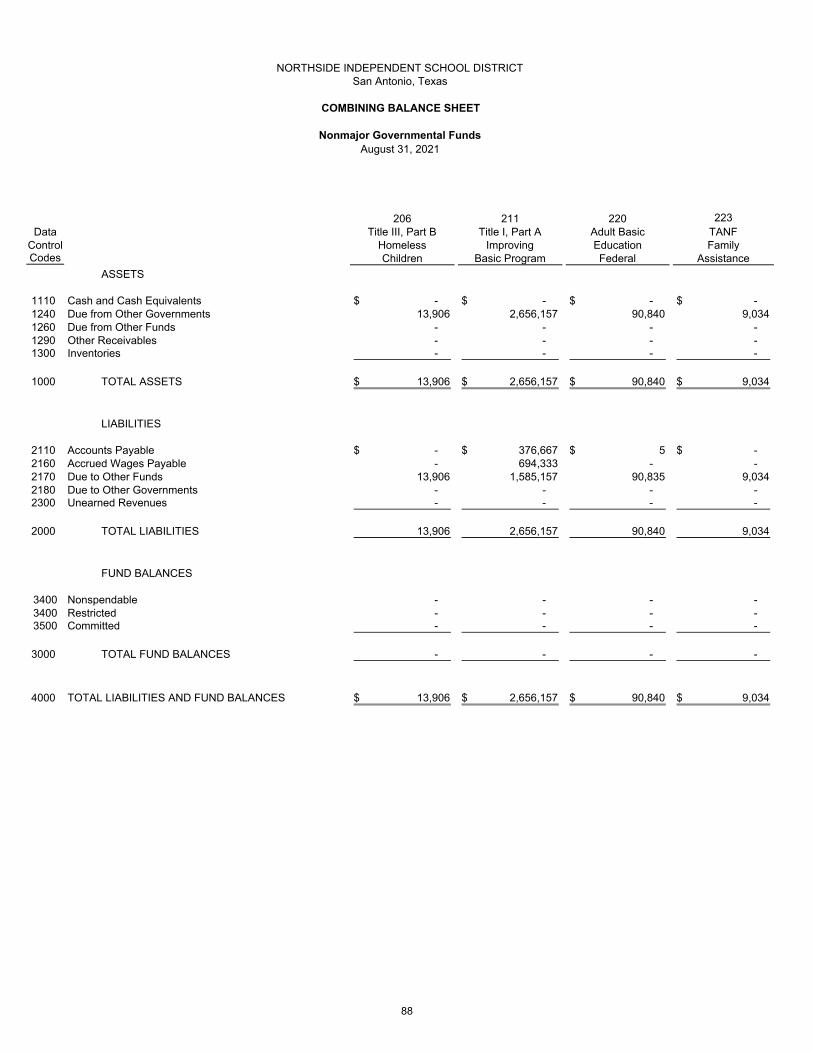
NORTHSIDE INDEPENDENT SCHOOL DISTRICTSan Antonio, Texas
COMBINING BALANCE SHEET
Nonmajor Governmental FundsAugust 31, 2021
206 211 220 223Data Title III, Part B Title I, Part A Adult Basic TANF
Control Homeless Improving Education FamilyCodes Children Basic Program Federal Assistance
ASSETS
1110 Cash and Cash Equivalents -$ -$ -$ -$ 1240 Due from Other Governments 13,906 2,656,157 90,840 9,034 1260 Due from Other Funds - - - - 1290 Other Receivables - - - - 1300 Inventories - - - -
1000 TOTAL ASSETS 13,906$ 2,656,157$ 90,840$ 9,034$
LIABILITIES
2110 Accounts Payable -$ 376,667$ 5$ -$ 2160 Accrued Wages Payable - 694,333 - - 2170 Due to Other Funds 13,906 1,585,157 90,835 9,034 2180 Due to Other Governments - - - - 2300 Unearned Revenues - - - -
2000 TOTAL LIABILITIES 13,906 2,656,157 90,840 9,034
FUND BALANCES
3400 Nonspendable - - - - 3400 Restricted - - - - 3500 Committed - - - -
3000 TOTAL FUND BALANCES - - - -
4000 TOTAL LIABILITIES AND FUND BALANCES 13,906$ 2,656,157$ 90,840$ 9,034$
88
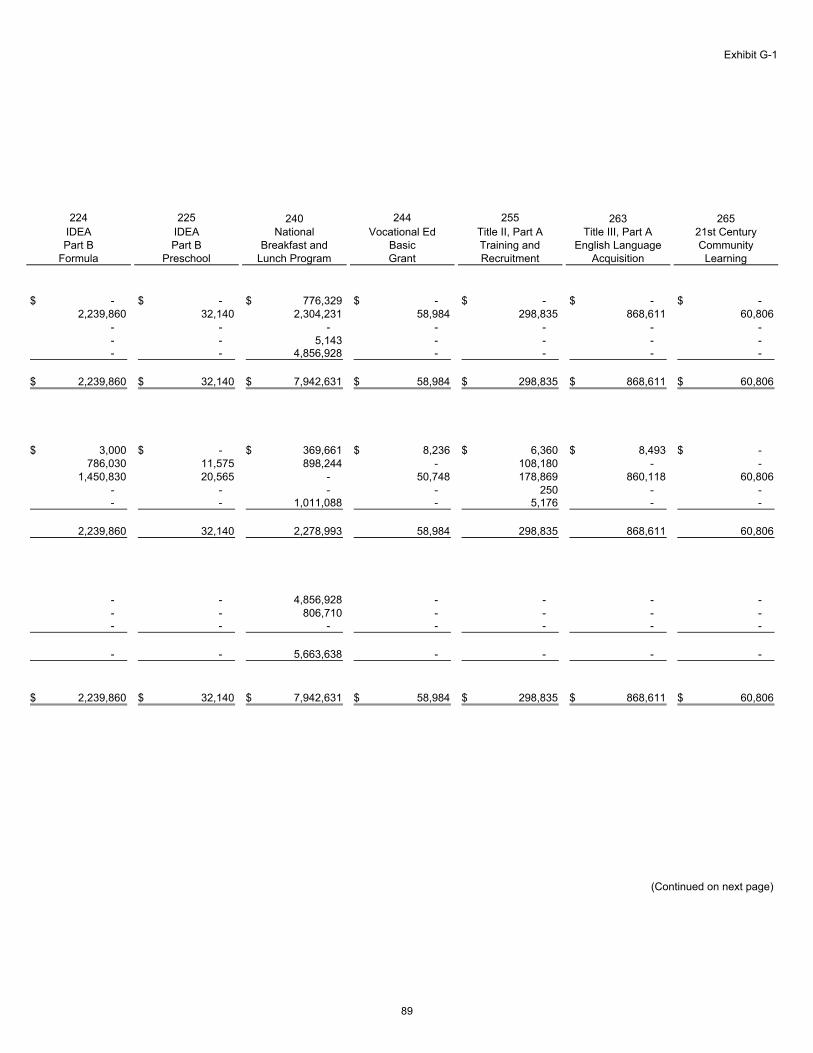
Exhibit G-1
224 225 240 244 255 263 265IDEA IDEA National Vocational Ed Title II, Part A Title III, Part A 21st CenturyPart B Part B Breakfast and Basic Training and English Language Community
Formula Preschool Lunch Program Grant Recruitment Acquisition Learning
-$ -$ 776,329$ -$ -$ -$ -$ 2,239,860 32,140 2,304,231 58,984 298,835 868,611 60,806
- - - - - - - - - 5,143 - - - - - - 4,856,928 - - - -
2,239,860$ 32,140$ 7,942,631$ 58,984$ 298,835$ 868,611$ 60,806$
3,000$ -$ 369,661$ 8,236$ 6,360$ 8,493$ -$ 786,030 11,575 898,244 - 108,180 - -
1,450,830 20,565 - 50,748 178,869 860,118 60,806 - - - - 250 - - - - 1,011,088 - 5,176 - -
2,239,860 32,140 2,278,993 58,984 298,835 868,611 60,806
- - 4,856,928 - - - - - - 806,710 - - - - - - - - - - -
- - 5,663,638 - - - -
2,239,860$ 32,140$ 7,942,631$ 58,984$ 298,835$ 868,611$ 60,806$
(Continued on next page)
89
NORTHSIDE INDEPENDENT SCHOOL DISTRICTSan Antonio, Texas
COMBINING BALANCE SHEET - Continued
Nonmajor Governmental FundsAugust 31, 2021
266 272 276 277Data Elementary and Medicaid Instructional Coronavirus
Control Secondary School Administrative Continuity Relief Fund (CRF)Codes Emergency Relief Claim Program Grant Operation Connectivity
ASSETS
1110 Cash and Cash Equivalents -$ 504,673$ -$ -$ 1240 Due from Other Governments 467,054 - 160,138 - 1260 Due from Other Funds - - - - 1290 Other Receivables - - - - 1300 Inventories - - - -
1000 TOTAL ASSETS 467,054$ 504,673$ 160,138$ -$
LIABILITIES
2110 Accounts Payable 3,813$ -$ -$ -$ 2160 Accrued Wages Payable - 28,898 - - 2170 Due to Other Funds 463,241 - 160,138 - 2180 Due to Other Governments - - - - 2300 Unearned Revenues - - - -
2000 TOTAL LIABILITIES 467,054 28,898 160,138 -
FUND BALANCES
3400 Nonspendable - - - - 3400 Restricted - 475,775 - - 3500 Committed - - - -
3000 TOTAL FUND BALANCES - 475,775 - -
4000 TOTAL LIABILITIES AND FUND BALANCES 467,054$ 504,673$ 160,138$ -$
90
Exhibit G-1
282 289 315 340 381 385 392ARP Act Elementary Other SSA - IDEA IDEA Part C Adult Basic Supplemental Non-Educational
and Secondary School Federal Special Part B Early Childhood Education Services for the CommunityEmergency Relief Revenue Funds Discretionary Intervention State Visually Impaired Based Support
-$ -$ -$ -$ -$ -$ -$ 3,991 526,092 12,160 101 5,490 - 4,772
- - - - - - - - - - - - - - - - - - - - -
3,991$ 526,092$ 12,160$ 101$ 5,490$ -$ 4,772$
-$ 18,184$ 98$ -$ -$ -$ -$ 3,991 - 4,813 - - - -
- 507,908 7,249 101 5,490 - 4,772 - - - - - - - - - - - - - -
3,991 526,092 12,160 101 5,490 - 4,772
- - - - - - - - - - - - - - - - - - - - -
- - - - - - -
3,991$ 526,092$ 12,160$ 101$ 5,490$ -$ 4,772$
(Continued on next page)
91
397 410 429Data Advanced Instructional Other State
Control Placement Materials Special RevenueCodes Incentives Allotment Funds
ASSETS
1110 Cash and Cash Equivalents 306,841$ 1,148,618$ -$ 1240 Due from Other Governments - 66,438 1,064,324 1260 Due from Other Funds - - - 1290 Other Receivables - - -
1300 Inventories - - -
1000 TOTAL ASSETS 306,841$ 1,215,056$ 1,064,324$
LIABILITIES
2110 Accounts Payable -$ 30,464$ -$ 2160 Accrued Wages Payable - - - 2170 Due to Other Funds - - 1,064,324 2180 Due to Other Governments - - - 2300 Unearned Revenues 90,072 1,184,592 -
2000 TOTAL LIABILITIES 90,072 1,215,056 1,064,324
FUND BALANCES
3400 Nonspendable - - - 3400 Restricted 216,769 - - 3500 Committed - - -
3000 TOTAL FUND BALANCES 216,769 - -
4000 TOTAL LIABILITIES AND FUND BALANCES 306,841$ 1,215,056$ 1,064,324$
Nonmajor Governmental FundsAugust 31, 2021
NORTHSIDE INDEPENDENT SCHOOL DISTRICTSan Antonio, Texas
COMBINING BALANCE SHEET - Continued
92
Exhibit G-1
435 461 485 486 491 499SSA Campus City of San Antonio Northside Growing Other Local
Regional Day Activity After School Education Tree SpecialSchool - Deaf Funds Challenge Foundation Grant Day Care Revenue Funds
-$ 8,558,236$ -$ -$ 258,913$ 15,051,578$ 40,911 - 4,748 - - -
- - - - - - - - 104,668 - -
- - - - - -
40,911$ 8,558,236$ 4,748$ 104,668$ 258,913$ 15,051,578$
-$ -$ -$ 10,127$ -$ 2,644$ 12,637 - - - - - 28,274 - 4,748 94,541 - -
- - - - - - - - - 133,464 1,223,310
40,911 - 4,748 104,668 133,464 1,225,954
- - - - - - - - - - - - - 8,558,236 - - 125,449 13,825,624
- 8,558,236 - - 125,449 13,825,624
40,911$ 8,558,236$ 4,748$ 104,668$ 258,913$ 15,051,578$
(Continued on next page)
93
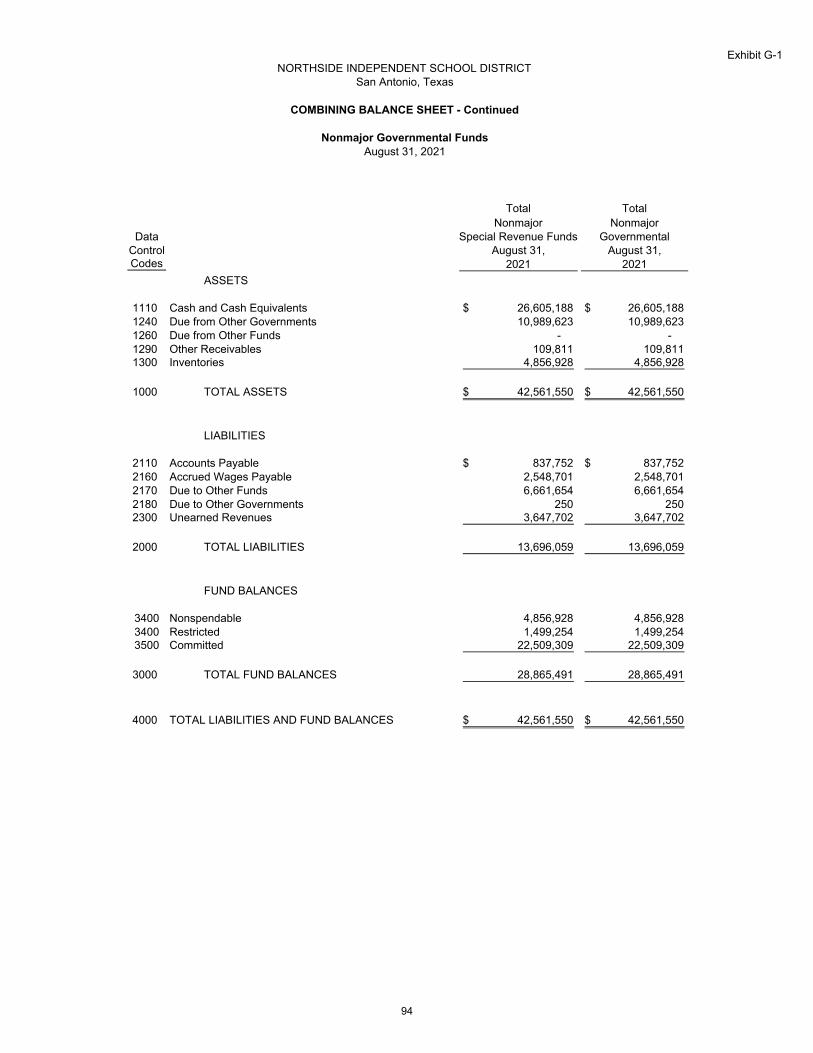
Exhibit G-1
Total TotalNonmajor Nonmajor
Data Special Revenue Funds GovernmentalControl August 31, August 31,Codes 2021 2021
ASSETS
1110 Cash and Cash Equivalents 26,605,188$ 26,605,188$ 1240 Due from Other Governments 10,989,623 10,989,623 1260 Due from Other Funds - - 1290 Other Receivables 109,811 109,811 1300 Inventories 4,856,928 4,856,928
1000 TOTAL ASSETS 42,561,550$ 42,561,550$
LIABILITIES
2110 Accounts Payable 837,752$ 837,752$ 2160 Accrued Wages Payable 2,548,701 2,548,701 2170 Due to Other Funds 6,661,654 6,661,654 2180 Due to Other Governments 250 250 2300 Unearned Revenues 3,647,702 3,647,702
2000 TOTAL LIABILITIES 13,696,059 13,696,059
FUND BALANCES
3400 Nonspendable 4,856,928 4,856,928 3400 Restricted 1,499,254 1,499,254 3500 Committed 22,509,309 22,509,309
3000 TOTAL FUND BALANCES 28,865,491 28,865,491
4000 TOTAL LIABILITIES AND FUND BALANCES 42,561,550$ 42,561,550$
NORTHSIDE INDEPENDENT SCHOOL DISTRICTSan Antonio, Texas
COMBINING BALANCE SHEET - Continued
Nonmajor Governmental FundsAugust 31, 2021
94

(This page intentionally left blank)
95

NORTHSIDE INDEPENDENT SCHOOL DISTRICTSan Antonio, Texas
COMBINING STATEMENT OF REVENUES, EXPENDITURES,AND CHANGES IN FUND BALANCES
Nonmajor Governmental FundsYear Ended August 31, 2021
206 211 220 223Data Title III, Part B Title I, Part A Adult Basic TANF
Control Homeless Improving Education FamilyCodes Children Basic Program Federal Assistance
REVENUES:5700 Local & Intermediate Sources -$ -$ -$ -$ 5800 State Program Revenues - - - - 5900 Federal Program Revenues 151,649 21,250,091 659,360 35,237
5020 Total Revenues 151,649 21,250,091 659,360 35,237
EXPENDITURES:0011 Instruction 3,701 16,229,665 466,923 35,237 0012 Instructional Resources & Media Services - - - - 0013 Curriculum & Inst'l Staff Development - 880,121 9,589 -
0010 Total Instruction & Instructional-Related Services 3,701 17,109,786 476,512 35,237
0021 Instructional Leadership - 588,620 132,922 - 0023 School Leadership - 160,079 - -
0020 Total Instructional & School Leadership - 748,699 132,922 -
0031 Guidance, Counseling & Evaluation Services - 1,082,542 - - 0032 Social Work Services 130,113 2,951 - - 0033 Health Services - - - - 0034 Student (Pupil) Transportation - - - - 0035 Child Nutrition Services - - - - 0036 Cocurricular/Extracurricular Activities - - - -
0030 Total Student Support Services 130,113 1,085,493 - -
0041 General Administration - - - -
0040 Total Administrative Support Services - - - -
0051 Plant Maintenance & Operations - - - - 0052 Security & Monitoring Services - - - - 0053 Data Processing Services - - 49,926 -
0050 Total Support Services Non-Student Based - - 49,926 -
0061 Community Services 17,835 2,306,113 - - 0081 Facilities Acquisition and Construction - - - - 0093 Payments to Member Districts of SSA - - - -
6030 Total Expenditures 151,649 21,250,091 659,360 35,237
1100 Excess (Deficiency) of Revenues Over Expenditures - - - -
7915 Transfers In - - - -
1200 Excess (Deficiency) Of Revenues and OtherResources Over Expenditures and Other Uses - - - -
0100 FUND BALANCE, September 1, 2020 - - - -
3000 FUND BALANCE, August 31, 2021 -$ -$ -$ -$
96
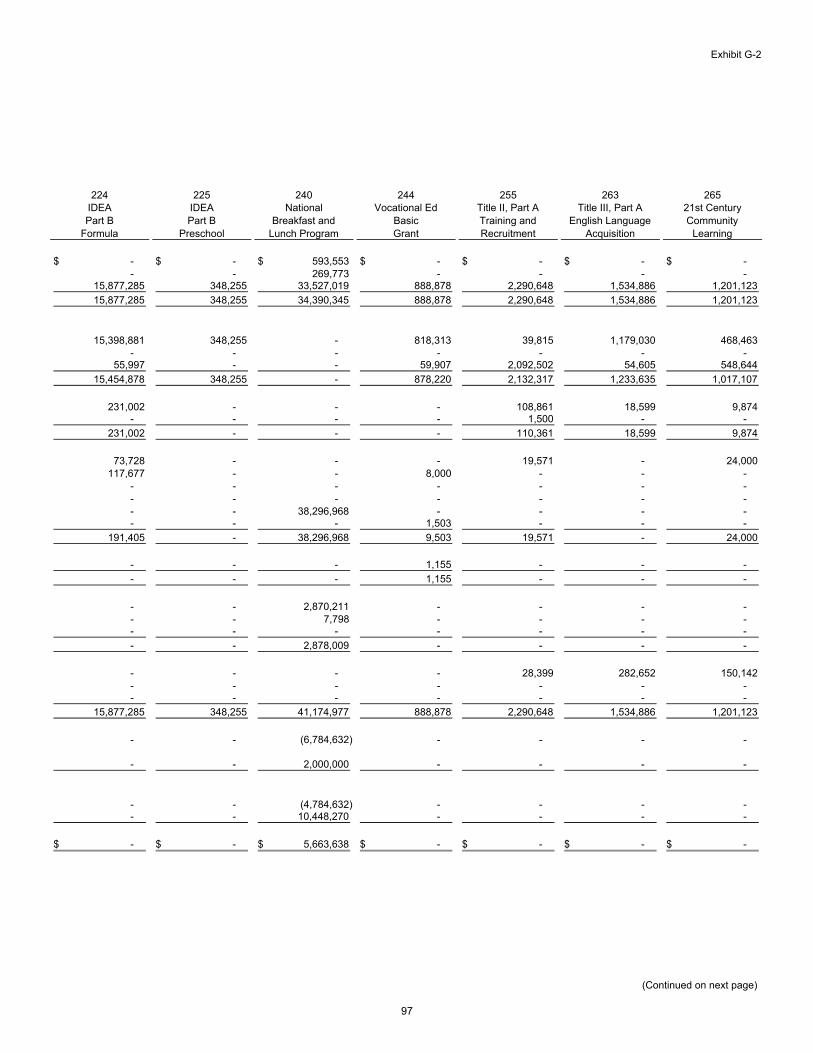
Exhibit G-2
224 225 240 244 255 263 265IDEA IDEA National Vocational Ed Title II, Part A Title III, Part A 21st CenturyPart B Part B Breakfast and Basic Training and English Language Community
Formula Preschool Lunch Program Grant Recruitment Acquisition Learning
-$ -$ 593,553$ -$ -$ -$ -$ - - 269,773 - - - -
15,877,285 348,255 33,527,019 888,878 2,290,648 1,534,886 1,201,123
15,877,285 348,255 34,390,345 888,878 2,290,648 1,534,886 1,201,123
15,398,881 348,255 - 818,313 39,815 1,179,030 468,463 - - - - - - -
55,997 - - 59,907 2,092,502 54,605 548,644
15,454,878 348,255 - 878,220 2,132,317 1,233,635 1,017,107
231,002 - - - 108,861 18,599 9,874 - - - - 1,500 - -
231,002 - - - 110,361 18,599 9,874
73,728 - - - 19,571 - 24,000 117,677 - - 8,000 - - -
- - - - - - - - - - - - - - - - 38,296,968 - - - - - - - 1,503 - - -
191,405 - 38,296,968 9,503 19,571 - 24,000
- - - 1,155 - - -
- - - 1,155 - - -
- - 2,870,211 - - - - - - 7,798 - - - - - - - - - - -
- - 2,878,009 - - - -
- - - - 28,399 282,652 150,142 - - - - - - - - - - - - - -
15,877,285 348,255 41,174,977 888,878 2,290,648 1,534,886 1,201,123
- - (6,784,632) - - - -
- - 2,000,000 - - - -
- - (4,784,632) - - - - - - 10,448,270 - - - -
-$ -$ 5,663,638$ -$ -$ -$ -$
(Continued on next page)
97
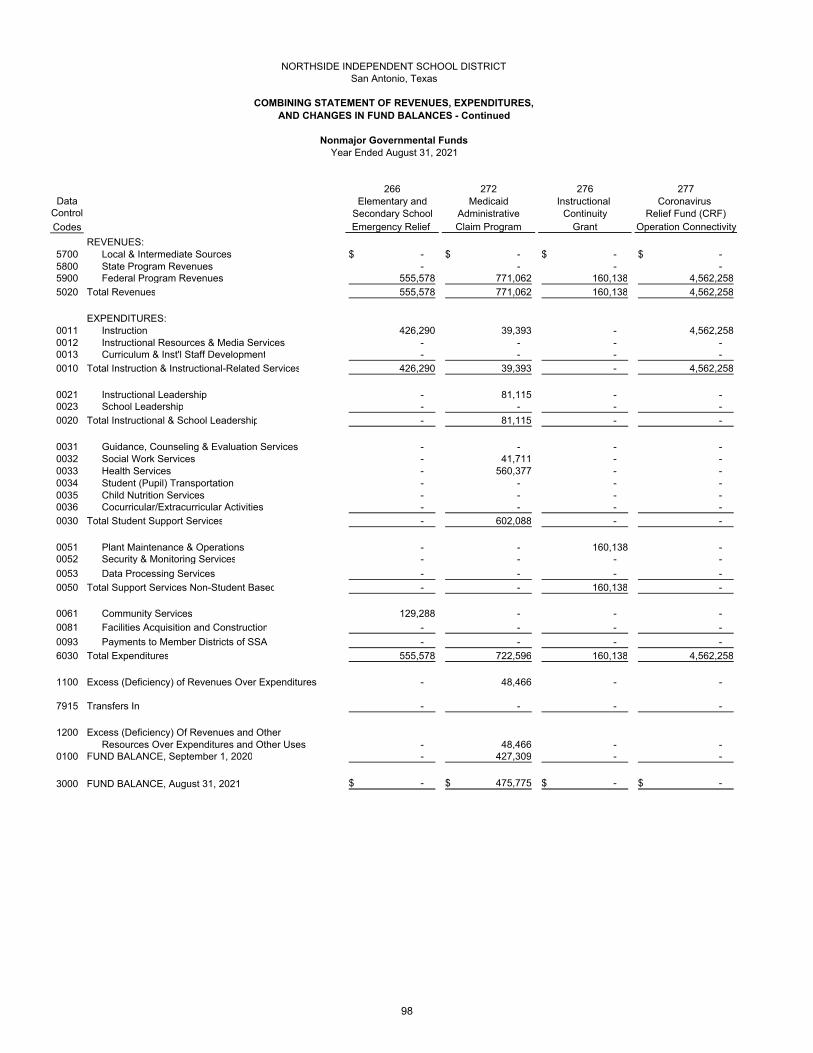
NORTHSIDE INDEPENDENT SCHOOL DISTRICTSan Antonio, Texas
COMBINING STATEMENT OF REVENUES, EXPENDITURES,AND CHANGES IN FUND BALANCES - Continued
Nonmajor Governmental FundsYear Ended August 31, 2021
266 272 276 277Data Elementary and Medicaid Instructional Coronavirus
Control Secondary School Administrative Continuity Relief Fund (CRF)Codes Emergency Relief Claim Program Grant Operation Connectivity
REVENUES:5700 Local & Intermediate Sources -$ -$ -$ -$ 5800 State Program Revenues - - - - 5900 Federal Program Revenues 555,578 771,062 160,138 4,562,258
5020 Total Revenues 555,578 771,062 160,138 4,562,258
EXPENDITURES:0011 Instruction 426,290 39,393 - 4,562,258 0012 Instructional Resources & Media Services - - - - 0013 Curriculum & Inst'l Staff Development - - - -
0010 Total Instruction & Instructional-Related Services 426,290 39,393 - 4,562,258
0021 Instructional Leadership - 81,115 - - 0023 School Leadership - - - -
0020 Total Instructional & School Leadership - 81,115 - -
0031 Guidance, Counseling & Evaluation Services - - - - 0032 Social Work Services - 41,711 - - 0033 Health Services - 560,377 - - 0034 Student (Pupil) Transportation - - - - 0035 Child Nutrition Services - - - - 0036 Cocurricular/Extracurricular Activities - - - -
0030 Total Student Support Services - 602,088 - -
0051 Plant Maintenance & Operations - - 160,138 - 0052 Security & Monitoring Services - - - -
0053 Data Processing Services - - - -
0050 Total Support Services Non-Student Based - - 160,138 -
0061 Community Services 129,288 - - -
0081 Facilities Acquisition and Construction - - - -
0093 Payments to Member Districts of SSA - - - -
6030 Total Expenditures 555,578 722,596 160,138 4,562,258
1100 Excess (Deficiency) of Revenues Over Expenditures - 48,466 - -
7915 Transfers In - - - -
1200 Excess (Deficiency) Of Revenues and OtherResources Over Expenditures and Other Uses - 48,466 - -
0100 FUND BALANCE, September 1, 2020 - 427,309 - -
3000 FUND BALANCE, August 31, 2021 -$ 475,775$ -$ -$
98
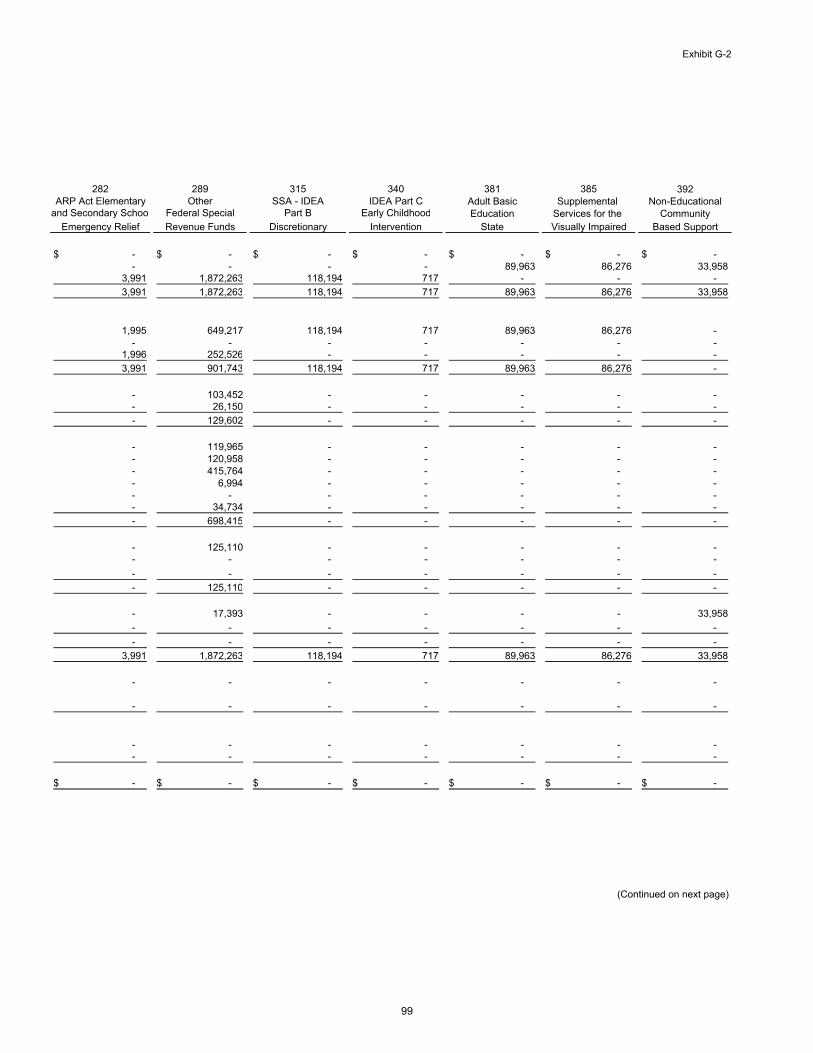
Exhibit G-2
282 289 315 340 381 385 392ARP Act Elementary Other SSA - IDEA IDEA Part C Adult Basic Supplemental Non-Educational
and Secondary School Federal Special Part B Early Childhood Education Services for the CommunityEmergency Relief Revenue Funds Discretionary Intervention State Visually Impaired Based Support
-$ -$ -$ -$ -$ -$ -$ - - - - 89,963 86,276 33,958
3,991 1,872,263 118,194 717 - - -
3,991 1,872,263 118,194 717 89,963 86,276 33,958
1,995 649,217 118,194 717 89,963 86,276 - - - - - - - -
1,996 252,526 - - - - -
3,991 901,743 118,194 717 89,963 86,276 -
- 103,452 - - - - - - 26,150 - - - - -
- 129,602 - - - - -
- 119,965 - - - - - - 120,958 - - - - - - 415,764 - - - - - - 6,994 - - - - - - - - - - - - - 34,734 - - - - -
- 698,415 - - - - -
- 125,110 - - - - - - - - - - - -
- - - - - - -
- 125,110 - - - - -
- 17,393 - - - - 33,958
- - - - - - -
- - - - - - -
3,991 1,872,263 118,194 717 89,963 86,276 33,958
- - - - - - -
- - - - - - -
- - - - - - - - - - - - - -
-$ -$ -$ -$ -$ -$ -$
(Continued on next page)
99
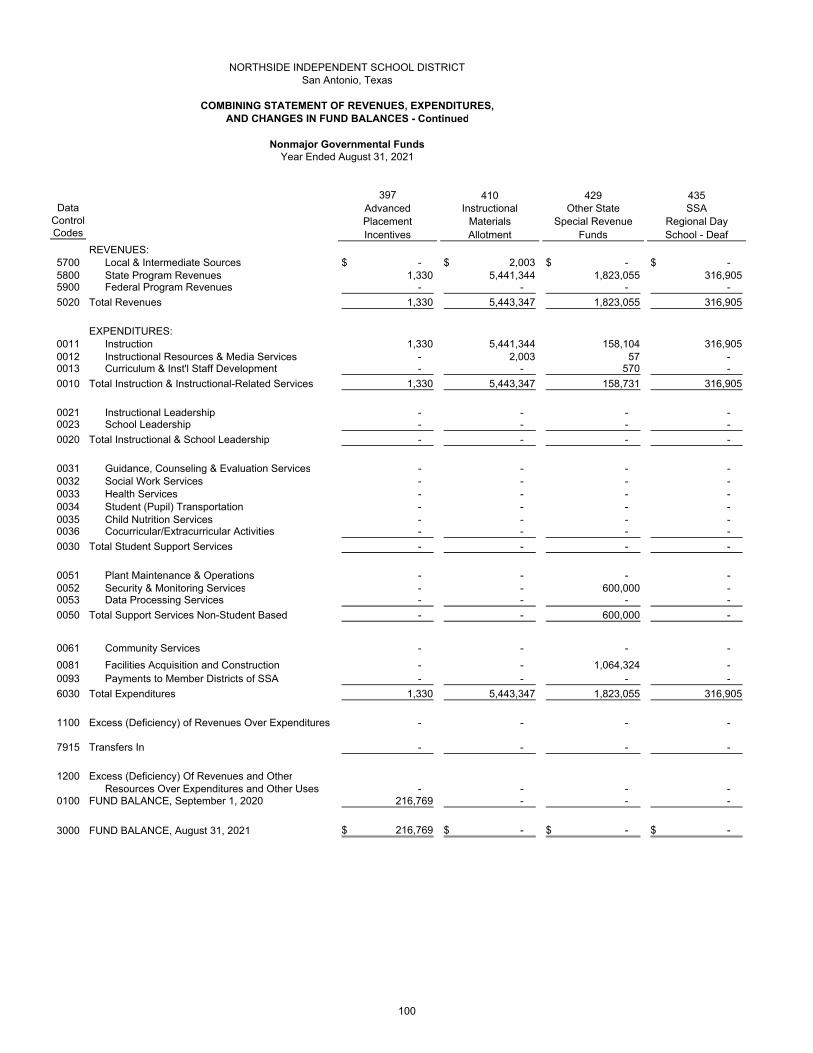
NORTHSIDE INDEPENDENT SCHOOL DISTRICTSan Antonio, Texas
COMBINING STATEMENT OF REVENUES, EXPENDITURES,AND CHANGES IN FUND BALANCES - Continued
Nonmajor Governmental FundsYear Ended August 31, 2021
397 410 429 435Data Advanced Instructional Other State SSA
Control Placement Materials Special Revenue Regional DayCodes Incentives Allotment Funds School - Deaf
REVENUES:5700 Local & Intermediate Sources -$ 2,003$ -$ -$ 5800 State Program Revenues 1,330 5,441,344 1,823,055 316,905 5900 Federal Program Revenues - - - -
5020 Total Revenues 1,330 5,443,347 1,823,055 316,905
EXPENDITURES:0011 Instruction 1,330 5,441,344 158,104 316,905 0012 Instructional Resources & Media Services - 2,003 57 - 0013 Curriculum & Inst'l Staff Development - - 570 -
0010 Total Instruction & Instructional-Related Services 1,330 5,443,347 158,731 316,905
0021 Instructional Leadership - - - - 0023 School Leadership - - - -
0020 Total Instructional & School Leadership - - - -
0031 Guidance, Counseling & Evaluation Services - - - - 0032 Social Work Services - - - - 0033 Health Services - - - - 0034 Student (Pupil) Transportation - - - - 0035 Child Nutrition Services - - - - 0036 Cocurricular/Extracurricular Activities - - - -
0030 Total Student Support Services - - - -
0051 Plant Maintenance & Operations - - - - 0052 Security & Monitoring Services - - 600,000 - 0053 Data Processing Services - - - -
0050 Total Support Services Non-Student Based - - 600,000 -
0061 Community Services - - - -
0081 Facilities Acquisition and Construction - - 1,064,324 - 0093 Payments to Member Districts of SSA - - - -
6030 Total Expenditures 1,330 5,443,347 1,823,055 316,905
1100 Excess (Deficiency) of Revenues Over Expenditures - - - -
7915 Transfers In - - - -
1200 Excess (Deficiency) Of Revenues and OtherResources Over Expenditures and Other Uses - - - -
0100 FUND BALANCE, September 1, 2020 216,769 - - -
3000 FUND BALANCE, August 31, 2021 216,769$ -$ -$ -$
100

Exhibit G-2
461 485 486 491 499Campus City of San Antonio Northside Growing Other LocalActivity After School Education Tree SpecialFunds Challenge Foundation Grant Day Care Revenue Funds
6,634,871$ 113,239$ 352,481$ 138$ 192,811$ - - - - - - - - - -
6,634,871 113,239 352,481 138 192,811
- - 282,561 - 110,401 - - 7,517 - 10,310 - - 14,502 - 476
- - 304,580 - 121,187
- - 952 - 24 - - - - 1,800
- - 952 - 1,824
- - 16,687 - - - - - 138 - - - - - - - - - - - - - - - -
4,372,410 - 25,523 - 29,185
4,372,410 - 42,210 138 29,185
- - - - 11,752 - - - - - - - - - -
- - - - 11,752
- 113,239 4,739 - 20,700
- - - - 6,240 - - - - -
4,372,410 113,239 352,481 138 190,888
2,262,461 - - - 1,923
- - - - 13,704,751
2,262,461 - - - 13,706,674 6,295,775 - - 125,449 118,950
8,558,236$ -$ -$ 125,449$ 13,825,624$
(Continued on next page)
101
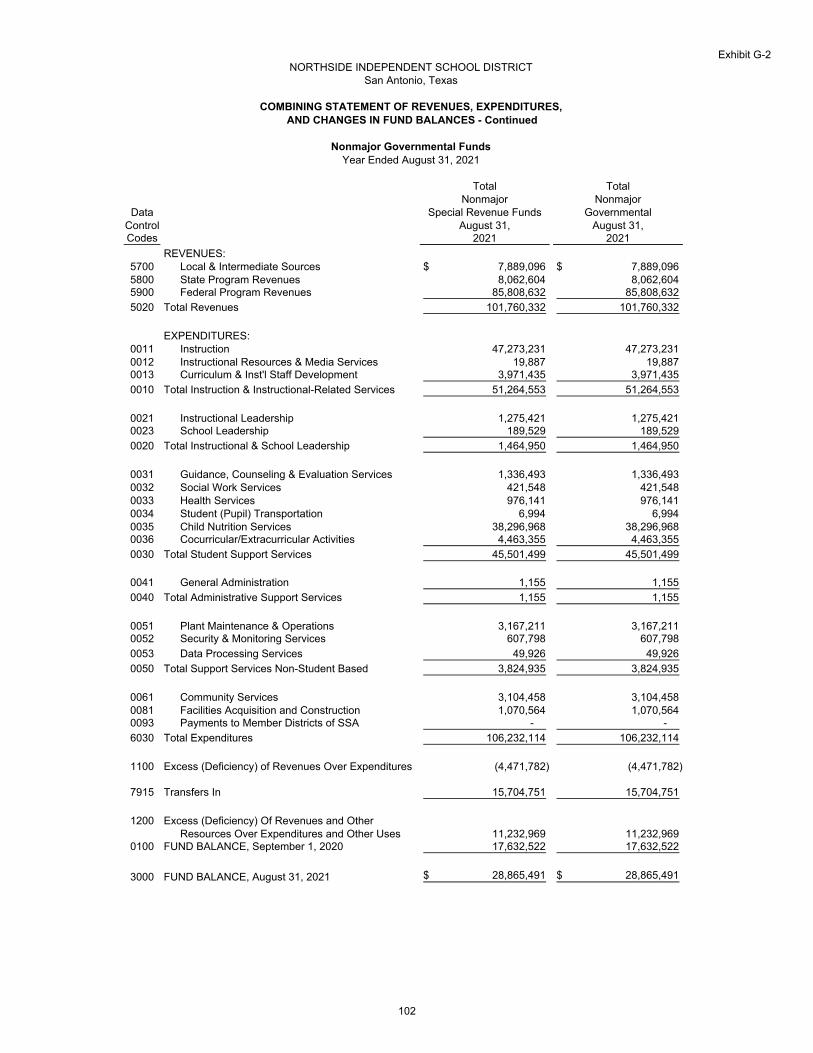
Exhibit G-2
Total TotalNonmajor Nonmajor
Data Special Revenue Funds GovernmentalControl August 31, August 31,Codes 2021 2021
REVENUES:5700 Local & Intermediate Sources 7,889,096$ 7,889,096$ 5800 State Program Revenues 8,062,604 8,062,604 5900 Federal Program Revenues 85,808,632 85,808,632
5020 Total Revenues 101,760,332 101,760,332
EXPENDITURES:0011 Instruction 47,273,231 47,273,231 0012 Instructional Resources & Media Services 19,887 19,887 0013 Curriculum & Inst'l Staff Development 3,971,435 3,971,435
0010 Total Instruction & Instructional-Related Services 51,264,553 51,264,553
0021 Instructional Leadership 1,275,421 1,275,421 0023 School Leadership 189,529 189,529
0020 Total Instructional & School Leadership 1,464,950 1,464,950
0031 Guidance, Counseling & Evaluation Services 1,336,493 1,336,493 0032 Social Work Services 421,548 421,548 0033 Health Services 976,141 976,141 0034 Student (Pupil) Transportation 6,994 6,994 0035 Child Nutrition Services 38,296,968 38,296,968 0036 Cocurricular/Extracurricular Activities 4,463,355 4,463,355
0030 Total Student Support Services 45,501,499 45,501,499
0041 General Administration 1,155 1,155
0040 Total Administrative Support Services 1,155 1,155
0051 Plant Maintenance & Operations 3,167,211 3,167,211 0052 Security & Monitoring Services 607,798 607,798
0053 Data Processing Services 49,926 49,926
0050 Total Support Services Non-Student Based 3,824,935 3,824,935
0061 Community Services 3,104,458 3,104,458 0081 Facilities Acquisition and Construction 1,070,564 1,070,564 0093 Payments to Member Districts of SSA - -
6030 Total Expenditures 106,232,114 106,232,114
1100 Excess (Deficiency) of Revenues Over Expenditures (4,471,782) (4,471,782)
7915 Transfers In 15,704,751 15,704,751
1200 Excess (Deficiency) Of Revenues and OtherResources Over Expenditures and Other Uses 11,232,969 11,232,969
0100 FUND BALANCE, September 1, 2020 17,632,522 17,632,522
3000 FUND BALANCE, August 31, 2021 28,865,491$ 28,865,491$
Year Ended August 31, 2021
NORTHSIDE INDEPENDENT SCHOOL DISTRICTSan Antonio, Texas
COMBINING STATEMENT OF REVENUES, EXPENDITURES,AND CHANGES IN FUND BALANCES - Continued
Nonmajor Governmental Funds
102
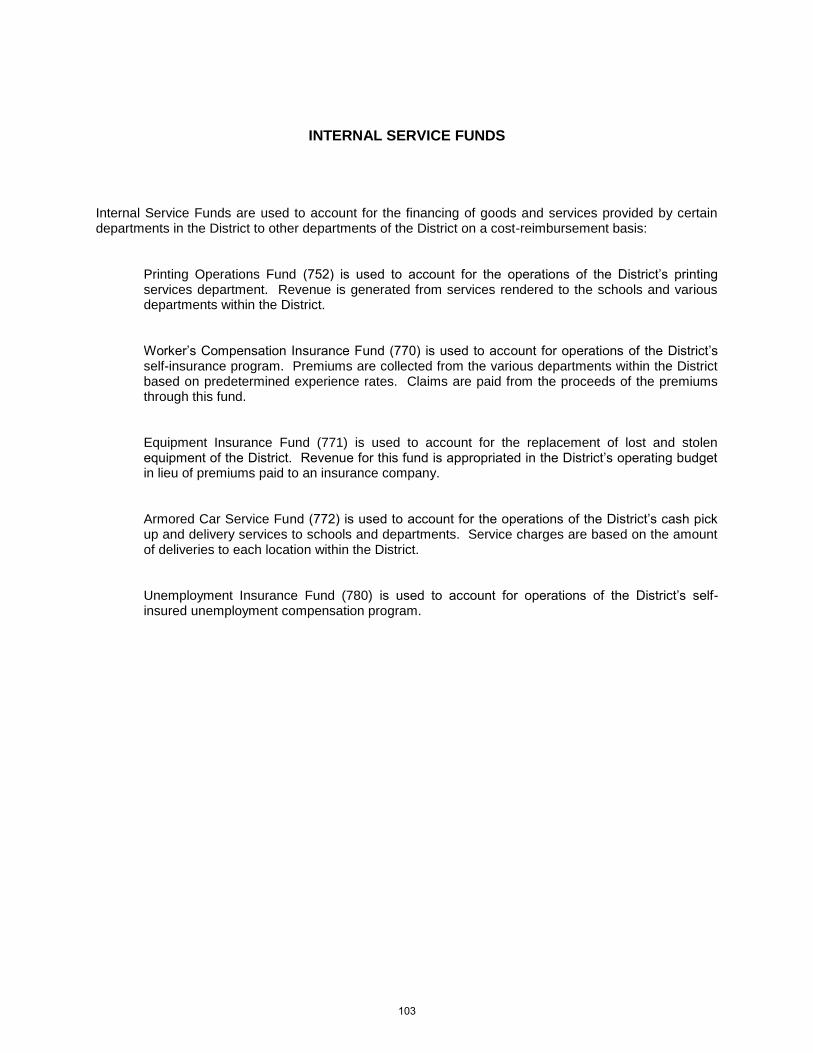
INTERNAL SERVICE FUNDS Internal Service Funds are used to account for the financing of goods and services provided by certain departments in the District to other departments of the District on a cost-reimbursement basis:
Printing Operations Fund (752) is used to account for the operations of the District’s printing services department. Revenue is generated from services rendered to the schools and various departments within the District.
Worker’s Compensation Insurance Fund (770) is used to account for operations of the District’s self-insurance program. Premiums are collected from the various departments within the District based on predetermined experience rates. Claims are paid from the proceeds of the premiums through this fund.
Equipment Insurance Fund (771) is used to account for the replacement of lost and stolen equipment of the District. Revenue for this fund is appropriated in the District’s operating budget in lieu of premiums paid to an insurance company.
Armored Car Service Fund (772) is used to account for the operations of the District’s cash pick up and delivery services to schools and departments. Service charges are based on the amount of deliveries to each location within the District. Unemployment Insurance Fund (780) is used to account for operations of the District’s self-insured unemployment compensation program.
103
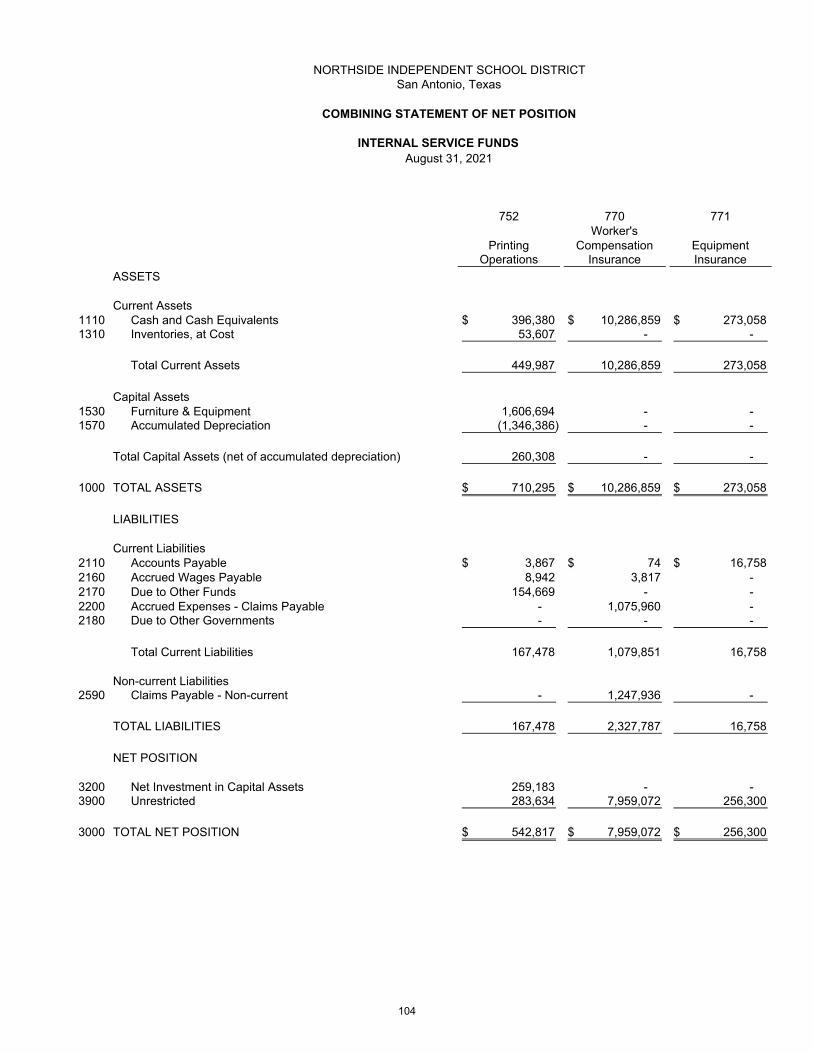
NORTHSIDE INDEPENDENT SCHOOL DISTRICTSan Antonio, Texas
COMBINING STATEMENT OF NET POSITION
August 31, 2021
752 770 771Worker's
Printing Compensation EquipmentOperations Insurance Insurance
ASSETS
Current Assets1110 Cash and Cash Equivalents 396,380$ 10,286,859$ 273,058$ 1310 Inventories, at Cost 53,607 - -
Total Current Assets 449,987 10,286,859 273,058
Capital Assets1530 Furniture & Equipment 1,606,694 - - 1570 Accumulated Depreciation (1,346,386) - -
Total Capital Assets (net of accumulated depreciation) 260,308 - -
1000 TOTAL ASSETS 710,295$ 10,286,859$ 273,058$
LIABILITIES
Current Liabilities2110 Accounts Payable 3,867$ 74$ 16,758$ 2160 Accrued Wages Payable 8,942 3,817 - 2170 Due to Other Funds 154,669 - - 2200 Accrued Expenses - Claims Payable - 1,075,960 - 2180 Due to Other Governments - - -
Total Current Liabilities 167,478 1,079,851 16,758
Non-current Liabilities2590 Claims Payable - Non-current - 1,247,936 -
TOTAL LIABILITIES 167,478 2,327,787 16,758
NET POSITION
3200 Net Investment in Capital Assets 259,183 - - 3900 Unrestricted 283,634 7,959,072 256,300
3000 TOTAL NET POSITION 542,817$ 7,959,072$ 256,300$
INTERNAL SERVICE FUNDS
104

Exhibit H-1
772 780Internal
Armored Car Unemployment Service FundsService Insurance Totals
1,593$ 123,872$ 11,081,762$ - - 53,607
1,593 123,872 11,135,369
138,324 - 1,745,018 (135,637) - (1,482,023)
2,687 - 262,995
4,280$ 123,872$ 11,398,364$
-$ -$ 20,699$ 3,563 - 16,322
- - 154,669 - - 1,075,960 - - -
3,563 - 1,267,650
- - 1,247,936
3,563 - 2,515,586
2,687 - 261,870 (1,970) 123,872 8,620,908
717$ 123,872$ 8,882,778$
105
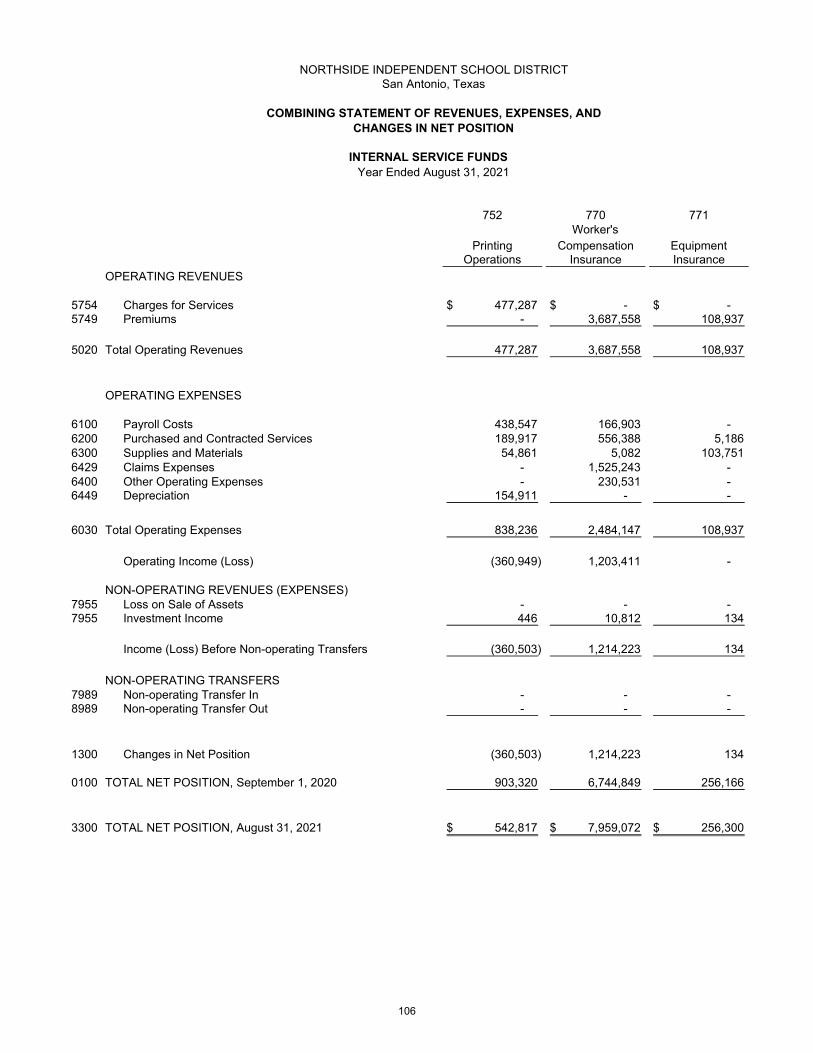
NORTHSIDE INDEPENDENT SCHOOL DISTRICTSan Antonio, Texas
COMBINING STATEMENT OF REVENUES, EXPENSES, ANDCHANGES IN NET POSITION
Year Ended August 31, 2021
752 770 771Worker's
Printing Compensation EquipmentOperations Insurance Insurance
OPERATING REVENUES
5754 Charges for Services 477,287$ -$ -$ 5749 Premiums - 3,687,558 108,937
5020 Total Operating Revenues 477,287 3,687,558 108,937
OPERATING EXPENSES
6100 Payroll Costs 438,547 166,903 - 6200 Purchased and Contracted Services 189,917 556,388 5,186 6300 Supplies and Materials 54,861 5,082 103,751 6429 Claims Expenses - 1,525,243 - 6400 Other Operating Expenses - 230,531 - 6449 Depreciation 154,911 - -
6030 Total Operating Expenses 838,236 2,484,147 108,937
Operating Income (Loss) (360,949) 1,203,411 -
NON-OPERATING REVENUES (EXPENSES)7955 Loss on Sale of Assets - - - 7955 Investment Income 446 10,812 134
Income (Loss) Before Non-operating Transfers (360,503) 1,214,223 134
NON-OPERATING TRANSFERS7989 Non-operating Transfer In - - - 8989 Non-operating Transfer Out - - -
1300 Changes in Net Position (360,503) 1,214,223 134
0100 TOTAL NET POSITION, September 1, 2020 903,320 6,744,849 256,166
3300 TOTAL NET POSITION, August 31, 2021 542,817$ 7,959,072$ 256,300$
INTERNAL SERVICE FUNDS
106

Exhibit H-2
772 780Internal
Armored Car Unemployment Service FundsService Insurance Totals
75,494$ -$ 552,781$ - 450,465 4,246,960
75,494 450,465 4,799,741
219,025 - 824,475 - - 751,491 - - 163,694 - 482,263 2,007,506 - - 230,531
5,374 - 160,285
224,399 482,263 4,137,982
(148,905) (31,798) 661,759
- - - - 202 11,594
(148,905) (31,596) 673,353
150,000 - 150,000 - - -
1,095 (31,596) 823,353
(378) 155,468 8,059,425
717$ 123,872$ 8,882,778$
107

NORTHSIDE INDEPENDENT SCHOOL DISTRICTSan Antonio, Texas
COMBINING STATEMENT OF CASH FLOWS
Year Ended August 31, 2021
752 770 771Worker's
Printing Compensation EquipmentOperations Insurance Insurance
CASH FLOWS FROM OPERATING ACTIVITIES:Cash Received from Interfund Services Provided 324,322$ 3,687,558$ 108,937$ Cash Payments to Employees for Services (438,028) (166,606) - Cash Payments to Suppliers (310,094) (561,396) (92,179) Cash Payments for Insurance Claims - (1,647,021) - Cash Payments for Other Operating Expenses - (230,531) -
Net Cash Provided (Used) by Operating Activities (423,800) 1,082,004 16,758
CASH FLOWS FROM NONCAPITAL FINANCING ACTIVITIES:Nonoperating Transfers In (Out) - - -
CASH FLOWS FROM CAPITAL AND RELATED FINANCING ACTIVITIES:Acquisition of Capital Assets (22,496) - - Net Cash Flows Provided (Used) by Capital and Related Financing Activities (22,496) - -
CASH FLOWS FROM INVESTING ACTIVITIESInvestment Earnings 446 10,812 134
Net Cash Flows Provided (Used) by Investing Activities 446 10,812 134
Net Increase (Decrease) In Cash & Cash Equivalents (445,850) 1,092,816 16,892
CASH AND CASH EQUIVALENTS, September 1, 2020 842,230 9,194,043 256,166
CASH AND CASH EQUIVALENTS, August 31, 2021 396,380$ 10,286,859$ 273,058$
Reconciliation of Operating Income (Loss) to Net Cash Provided (Used) by Operating Activities:
CASH FLOWS FROM OPERATING ACTIVITIES:Operating Income (Loss) (360,949)$ 1,203,411$ -$
Adjustments to Reconcile Operating Income to Net CashProvided (Used) by Operating Activities:Depreciation 154,911 - -
Effect of Changes in Current Assets and Liabilities:(Increase) Decrease in Inventories (14,158) - - Increase (Decrease) in Accounts Payable (51,158) 74 16,758 Increase (Decrease) in Due to Other Funds (152,965) - - Increase (Decrease) in Due to Other Government Funds - - - Increase (Decrease) in Claims Payable - (121,778) - Increase (Decrease) in Accrued Wages 519 297 -
Net Cash Provided (Used) by Operating Activities (423,800)$ 1,082,004$ 16,758$
INTERNAL SERVICE FUNDS
108

Exhibit H-3
772 780Internal
Armored Car Unemployment Service FundsService Insurance Totals
69,835$ 132,207$ 4,322,859$ (218,241) - (822,875)
- - (963,669) - (482,263) (2,129,284) - - (230,531)
(148,406) (350,056) 176,500
150,000 - 150,000
(1) - (22,497)
(1) - (22,497)
- 202 11,594
- 202 11,594
1,593 (349,854) 315,597
- 473,726 10,766,165
1,593$ 123,872$ 11,081,762$
(148,905)$ (31,798)$ 661,759$
5,374 - 160,285
- - (14,158) - - (34,326)
(5,659) - (158,624) - (318,258) (318,258) - - (121,778) 784 - 1,600
(148,406)$ (350,056)$ 176,500$
109

(This page intentionally left blank)
110

STATISTICAL
SECTION
111

112

FINANCIAL TRENDS
These schedules contain trend information to help the reader
understand how the District's financial performance and well-being
have changed over time.
113
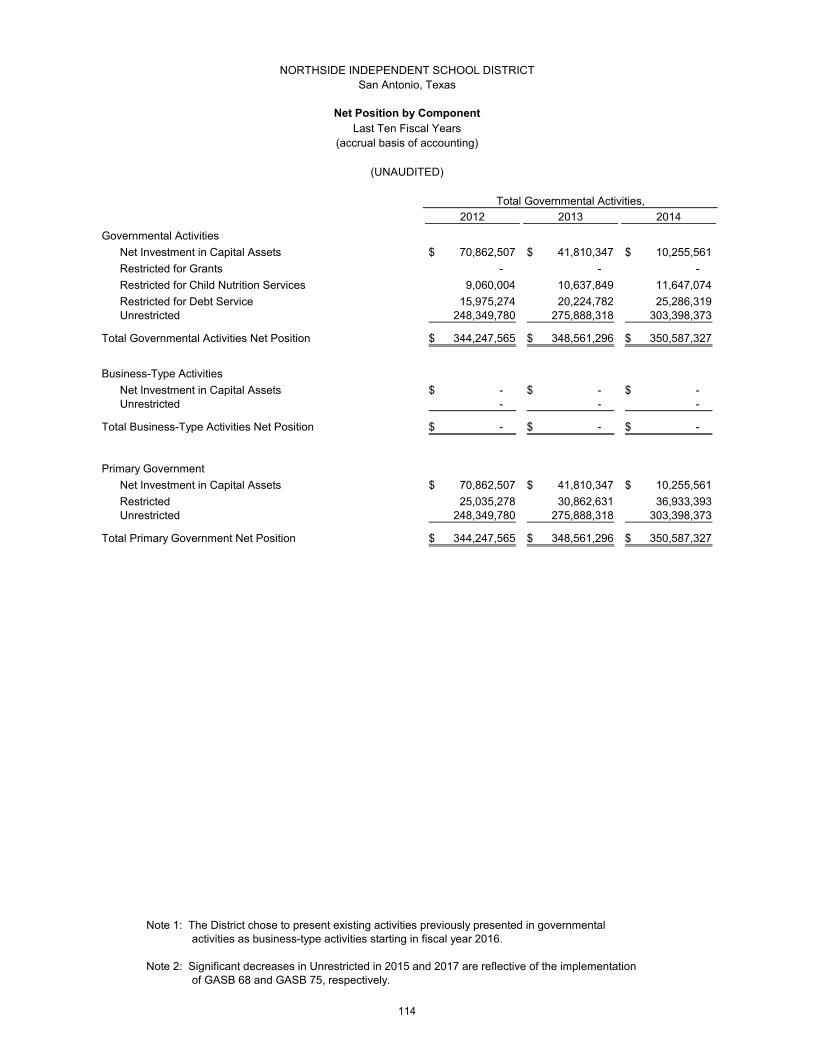
Total Governmental Activities,
2012 2013 2014
Governmental Activities
Net Investment in Capital Assets 70,862,507$ 41,810,347$ 10,255,561$
Restricted for Grants - - -
Restricted for Child Nutrition Services 9,060,004 10,637,849 11,647,074
Restricted for Debt Service 15,975,274 20,224,782 25,286,319Unrestricted 248,349,780 275,888,318 303,398,373
Total Governmental Activities Net Position 344,247,565$ 348,561,296$ 350,587,327$
Business-Type Activities
Net Investment in Capital Assets -$ -$ -$ Unrestricted - - -
Total Business-Type Activities Net Position -$ -$ -$
Primary Government
Net Investment in Capital Assets 70,862,507$ 41,810,347$ 10,255,561$
Restricted 25,035,278 30,862,631 36,933,393 Unrestricted 248,349,780 275,888,318 303,398,373
Total Primary Government Net Position 344,247,565$ 348,561,296$ 350,587,327$
activities as business-type activities starting in fiscal year 2016.
Note 2: Significant decreases in Unrestricted in 2015 and 2017 are reflective of the implementation of GASB 68 and GASB 75, respectively.
Note 1: The District chose to present existing activities previously presented in governmental
(UNAUDITED)
NORTHSIDE INDEPENDENT SCHOOL DISTRICTSan Antonio, Texas
Net Position by ComponentLast Ten Fiscal Years
(accrual basis of accounting)
114
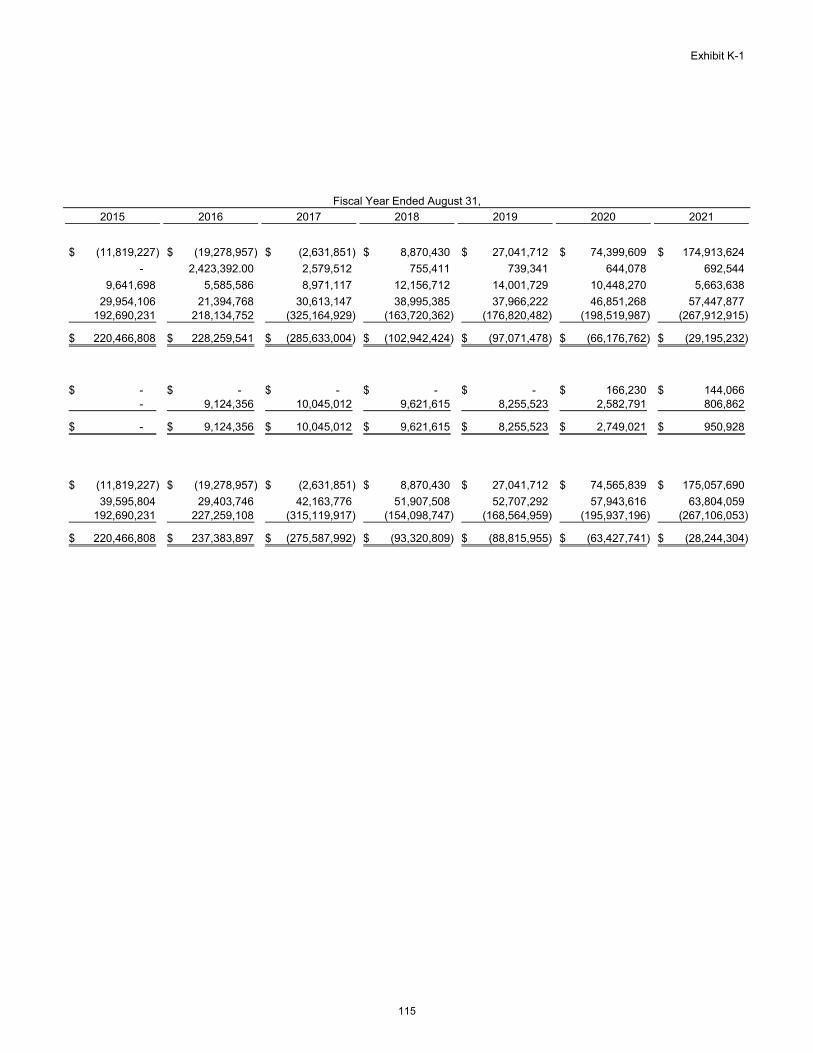
Exhibit K-1
Fiscal Year Ended August 31,
2015 2016 2017 2018 2019 2020 2021
(11,819,227)$ (19,278,957)$ (2,631,851)$ 8,870,430$ 27,041,712$ 74,399,609$ 174,913,624$
- 2,423,392.00 2,579,512 755,411 739,341 644,078 692,544
9,641,698 5,585,586 8,971,117 12,156,712 14,001,729 10,448,270 5,663,638
29,954,106 21,394,768 30,613,147 38,995,385 37,966,222 46,851,268 57,447,877192,690,231 218,134,752 (325,164,929) (163,720,362) (176,820,482) (198,519,987) (267,912,915)
220,466,808$ 228,259,541$ (285,633,004)$ (102,942,424)$ (97,071,478)$ (66,176,762)$ (29,195,232)$
-$ -$ -$ -$ -$ 166,230$ 144,066$ - 9,124,356 10,045,012 9,621,615 8,255,523 2,582,791 806,862
-$ 9,124,356$ 10,045,012$ 9,621,615$ 8,255,523$ 2,749,021$ 950,928$
(11,819,227)$ (19,278,957)$ (2,631,851)$ 8,870,430$ 27,041,712$ 74,565,839$ 175,057,690$
39,595,804 29,403,746 42,163,776 51,907,508 52,707,292 57,943,616 63,804,059 192,690,231 227,259,108 (315,119,917) (154,098,747) (168,564,959) (195,937,196) (267,106,053)
220,466,808$ 237,383,897$ (275,587,992)$ (93,320,809)$ (88,815,955)$ (63,427,741)$ (28,244,304)$
115

Total Governmental Activities,2012 2013 2014 2015 2016
Expenses:
Governmental Activities:
Instruction (494,991,136)$ (507,450,711)$ (569,111,930)$ (592,068,785)$ (623,033,069)$
Instructional Resources & Media Services (11,429,557) (11,699,471) (12,246,684) (13,147,210) (13,519,934)
Curriculum & Staff Development (16,452,744) (17,107,745) (18,267,954) (20,687,736) (19,974,598)
Instructional Leadership (16,542,361) (16,552,060) (18,037,461) (19,511,320) (20,391,625)
School Leadership (41,652,162) (43,896,833) (48,418,603) (50,254,795) (52,544,160)
Guidance, Counseling & Evaluation Services (27,316,298) (28,589,365) (31,699,085) (33,050,312) (36,721,237)
Social Work Services (2,427,772) (2,420,565) (2,932,108) (3,085,235) (3,233,713)
Health Services (7,291,480) (7,391,834) (8,569,869) (9,057,950) (9,642,287)
Student (Pupil) Transportation (27,530,946) (28,346,428) (29,815,002) (31,433,081) (32,468,535)
Child Nutrition Services (45,757,854) (50,771,525) (52,351,153) (54,054,297) (53,623,718)
Co-curricular/Extracurricular Activities (18,917,552) (21,274,001) (22,293,852) (26,174,474) (26,785,256)
General Administration (14,256,588) (15,031,622) (15,732,913) (17,224,104) (18,421,107)
Plant Maintenance & Operations (66,483,383) (68,758,166) (74,171,357) (76,476,147) (80,577,540)
Security & Monitoring Services (6,562,771) (6,340,818) (7,595,933) (7,951,372) (8,555,956)
Data Processing Services (10,871,050) (11,943,360) (12,088,100) (13,121,758) (14,208,441)
Community Services (5,243,623) (6,477,334) (8,421,466) (11,056,229) (5,330,434)
Debt Service - Interest (67,982,828) (69,512,356) (71,762,691) (70,421,475) (72,173,847) Debt Service - Fiscal Charges (468,437) (60,135) (573,620) (1,621,734) (1,650,734)
Facilities Acquisition and Construction - - - - - Payments to Member Districts of SSA - - - - -
Total Primary Government Expenses (882,178,542)$ (913,624,329)$ (1,004,089,781)$ (1,050,398,014)$ (1,092,856,191)$
Business-Type Activities:
Enterprise Fund - Learning Tree - - - - (7,465,660) Total Primary Government Expenses -$ -$ -$ -$ (1,100,321,851)$
Program Revenues:
Governmental Activities:
Charges for Services:Tuition 2,635,395$ 1,386,481$ 2,393,624$ 7,332,812$ 725,502$ Child Nutrition Services 15,697,687 16,659,767 17,201,571 14,902,214 14,888,325 Athletic Gate Receipts 2,886,304 2,979,393 2,825,309 3,096,773 3,006,100 Facilities Rental 2,160,034 1,833,597 4,533,552 4,284,204 5,581,570 Community Education 2,189,461 2,122,393 - - - Miscellaneous 78,127 - - - -
Operating Grants and Contributions 158,767,680 133,117,871 160,050,774 167,868,620 156,101,624 Total Governmental Activities Program Revenues 184,414,688$ 158,099,502$ 187,004,830$ 197,484,623$ 180,303,121$
Business-Type Activities:Charges for Services: - - - - 9,010,484
Total Primary Government Program Revenues -$ -$ -$ -$ 189,313,605$
Net (Expense) Revenue:Total Governmental Activities Net Expense (697,763,854)$ (755,524,827)$ (817,084,951)$ (852,913,391)$ (912,553,070)$ Total Business-Type Activities Net Expense - - - - 1,544,824 Total Primary Government Net Expense (697,763,854)$ (755,524,827)$ (817,084,951)$ (852,913,391)$ (911,008,246)$
General Revenues:Governmental Activities:
Property Taxes, Levied for General Purposes 336,629,684$ 346,770,359$ 371,655,491$ 393,882,332$ 440,464,044$ Property Taxes, Levied for Debt Service 108,452,556 111,640,910 119,635,575 127,012,311 142,030,106 State aid - formula grants 290,774,198 296,324,027 330,494,054 336,185,251 340,520,673 Miscellaneous local & intermediate 1,186,218 4,232,836 2,534,043 4,816,426 1,689,510 Insurance proceeds - - - - - Transfers - - - - - Investment earnings 1,498,868 870,426 764,322 1,057,662 3,192,526
Total Governmental Activities General Revenues 738,541,524$ 759,838,558$ 825,083,485$ 862,953,982$ 927,896,859$
Business-Type Activities:Transfer - - - - - Investment earnings - - - - 28,476
Total Primary Government General Revenues -$ -$ -$ -$ 927,925,335$
Change in Net Position 40,777,670$ 4,313,731$ 7,998,534$ 10,040,591$ 16,917,089$
NORTHSIDE INDEPENDENT SCHOOL DISTRICTSan Antonio, Texas
Changes in Net PositionLast Ten Fiscal Years
(accrual basis of accounting)
(UNAUDITED)
116
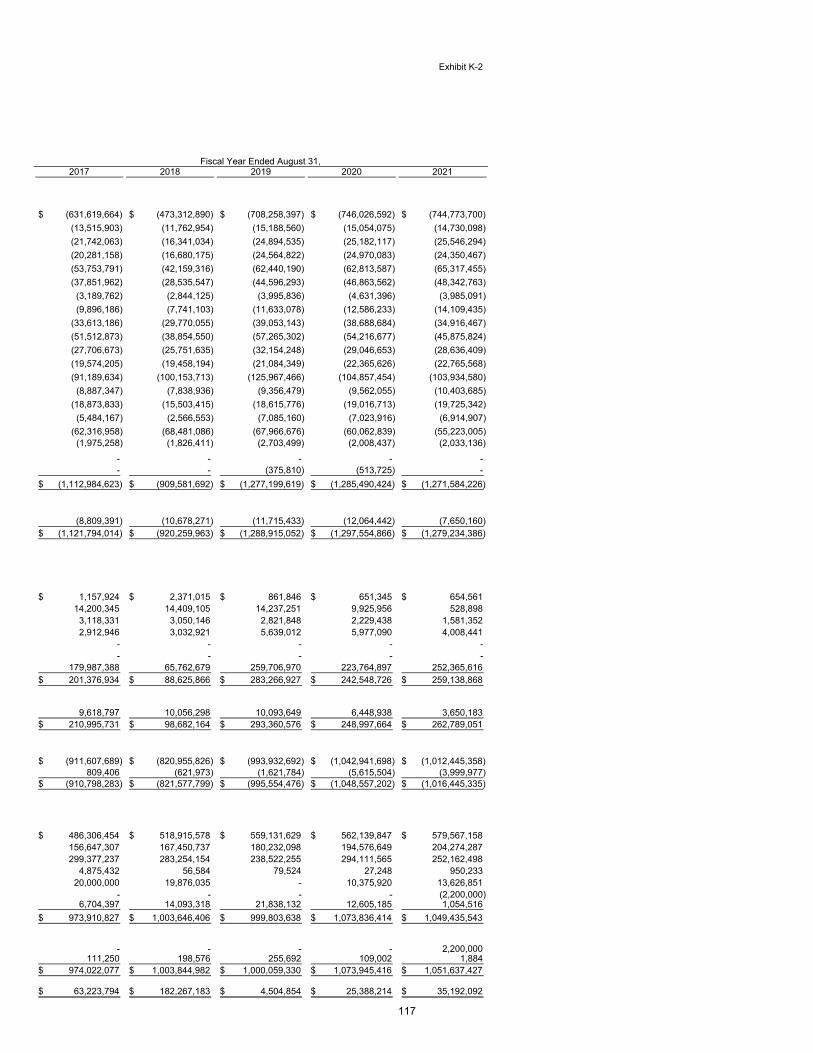
Exhibit K-2
2017 2018 2019 2020 2021
(631,619,664)$ (473,312,890)$ (708,258,397)$ (746,026,592)$ (744,773,700)$
(13,515,903) (11,762,954) (15,188,560) (15,054,075) (14,730,098)
(21,742,063) (16,341,034) (24,894,535) (25,182,117) (25,546,294)
(20,281,158) (16,680,175) (24,564,822) (24,970,083) (24,350,467)
(53,753,791) (42,159,316) (62,440,190) (62,813,587) (65,317,455)
(37,851,962) (28,535,547) (44,596,293) (46,863,562) (48,342,763)
(3,189,762) (2,844,125) (3,995,836) (4,631,396) (3,985,091)
(9,896,186) (7,741,103) (11,633,078) (12,586,233) (14,109,435)
(33,613,186) (29,770,055) (39,053,143) (38,688,684) (34,916,467)
(51,512,873) (38,854,550) (57,265,302) (54,216,677) (45,875,824)
(27,706,673) (25,751,635) (32,154,248) (29,046,653) (28,636,409)
(19,574,205) (19,458,194) (21,084,349) (22,365,626) (22,765,568)
(91,189,634) (100,153,713) (125,967,466) (104,857,454) (103,934,580)
(8,887,347) (7,838,936) (9,356,479) (9,562,055) (10,403,685)
(18,873,833) (15,503,415) (18,615,776) (19,016,713) (19,725,342)
(5,484,167) (2,566,553) (7,085,160) (7,023,916) (6,914,907)
(62,316,958) (68,481,086) (67,966,676) (60,062,839) (55,223,005) (1,975,258) (1,826,411) (2,703,499) (2,008,437) (2,033,136)
- - - - - - - (375,810) (513,725) -
(1,112,984,623)$ (909,581,692)$ (1,277,199,619)$ (1,285,490,424)$ (1,271,584,226)$
(8,809,391) (10,678,271) (11,715,433) (12,064,442) (7,650,160) (1,121,794,014)$ (920,259,963)$ (1,288,915,052)$ (1,297,554,866)$ (1,279,234,386)$
1,157,924$ 2,371,015$ 861,846$ 651,345$ 654,561$ 14,200,345 14,409,105 14,237,251 9,925,956 528,898
3,118,331 3,050,146 2,821,848 2,229,438 1,581,352 2,912,946 3,032,921 5,639,012 5,977,090 4,008,441
- - - - - - - - - -
179,987,388 65,762,679 259,706,970 223,764,897 252,365,616 201,376,934$ 88,625,866$ 283,266,927$ 242,548,726$ 259,138,868$
9,618,797 10,056,298 10,093,649 6,448,938 3,650,183 210,995,731$ 98,682,164$ 293,360,576$ 248,997,664$ 262,789,051$
(911,607,689)$ (820,955,826)$ (993,932,692)$ (1,042,941,698)$ (1,012,445,358)$ 809,406 (621,973) (1,621,784) (5,615,504) (3,999,977)
(910,798,283)$ (821,577,799)$ (995,554,476)$ (1,048,557,202)$ (1,016,445,335)$
486,306,454$ 518,915,578$ 559,131,629$ 562,139,847$ 579,567,158$ 156,647,307 167,450,737 180,232,098 194,576,649 204,274,287 299,377,237 283,254,154 238,522,255 294,111,565 252,162,498
4,875,432 56,584 79,524 27,248 950,233 20,000,000 19,876,035 - 10,375,920 13,626,851
- - - - (2,200,000) 6,704,397 14,093,318 21,838,132 12,605,185 1,054,516
973,910,827$ 1,003,646,406$ 999,803,638$ 1,073,836,414$ 1,049,435,543$
- - - - 2,200,000 111,250 198,576 255,692 109,002 1,884
974,022,077$ 1,003,844,982$ 1,000,059,330$ 1,073,945,416$ 1,051,637,427$
63,223,794$ 182,267,183$ 4,504,854$ 25,388,214$ 35,192,092$
Fiscal Year Ended August 31,
117
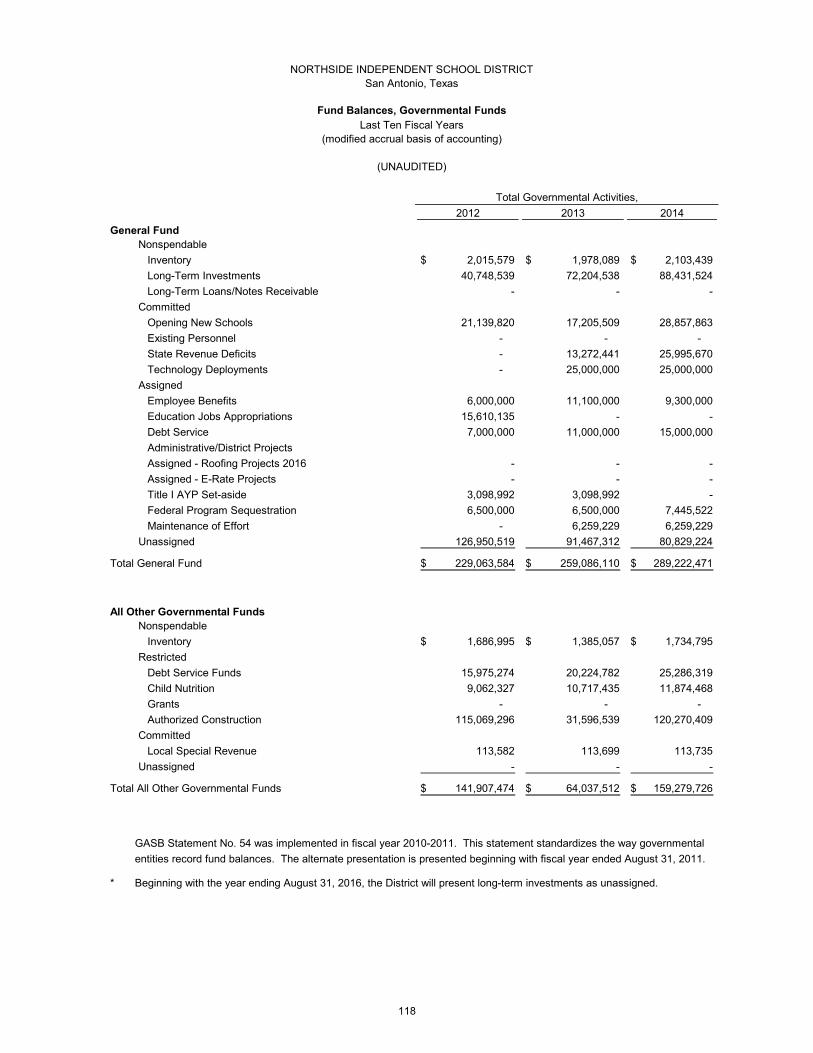
Total Governmental Activities,
2012 2013 2014
General FundNonspendable
Inventory 2,015,579$ 1,978,089$ 2,103,439$
Long-Term Investments 40,748,539 72,204,538 88,431,524
Long-Term Loans/Notes Receivable - - -
Committed
Opening New Schools 21,139,820 17,205,509 28,857,863
Existing Personnel - - -
State Revenue Deficits - 13,272,441 25,995,670
Technology Deployments - 25,000,000 25,000,000
Assigned
Employee Benefits 6,000,000 11,100,000 9,300,000
Education Jobs Appropriations 15,610,135 - -
Debt Service 7,000,000 11,000,000 15,000,000
Administrative/District Projects
Assigned - Roofing Projects 2016 - - -
Assigned - E-Rate Projects - - -
Title I AYP Set-aside 3,098,992 3,098,992 -
Federal Program Sequestration 6,500,000 6,500,000 7,445,522
Maintenance of Effort - 6,259,229 6,259,229
Unassigned 126,950,519 91,467,312 80,829,224
Total General Fund 229,063,584$ 259,086,110$ 289,222,471$
All Other Governmental FundsNonspendable
Inventory 1,686,995$ 1,385,057$ 1,734,795$
Restricted
Debt Service Funds 15,975,274 20,224,782 25,286,319
Child Nutrition 9,062,327 10,717,435 11,874,468
Grants - - -
Authorized Construction 115,069,296 31,596,539 120,270,409
Committed
Local Special Revenue 113,582 113,699 113,735
Unassigned - - -
Total All Other Governmental Funds 141,907,474$ 64,037,512$ 159,279,726$
GASB Statement No. 54 was implemented in fiscal year 2010-2011. This statement standardizes the way governmental
entities record fund balances. The alternate presentation is presented beginning with fiscal year ended August 31, 2011.
* Beginning with the year ending August 31, 2016, the District will present long-term investments as unassigned.
(UNAUDITED)
NORTHSIDE INDEPENDENT SCHOOL DISTRICTSan Antonio, Texas
Fund Balances, Governmental FundsLast Ten Fiscal Years
(modified accrual basis of accounting)
118

Exhibit K-3
Fiscal Year Ended August 31,
2015 2016* 2017 2018 2019 2020 2021
2,151,675$ 2,336,011$ 2,409,980$ 2,370,139$ 2,605,477$ 4,156,273$ 3,522,954$
74,653,970 - - - - - -
- - 613,565 460,600 307,634 154,669 -
26,693,135 25,612,694 15,821,356 29,834,907 27,871,515 28,536,489 -
- - - - - - -
51,569,237 76,398,690 76,818,135 130,670,871 135,415,019 177,180,954 190,000,000
24,470,577 17,450,738 12,037,039 36,784,915 36,722,937 51,652,937 -
12,500,000 10,700,000 15,436,524 15,436,524 18,831,334 11,629,236 -
- - - - - - -
10,000,000 10,000,000 10,000,000 10,000,000 10,000,000 10,000,000 -
3,346,762 1,294,438 8,884,158 8,054,254 3,951,633 -
- - 18,999,769 18,442,252 1,728,756 - -
- - 4,779,463 4,638,221 4,972,676 4,419,892 -
- 1,468,670 1,468,670 1,468,670 1,468,670 - -
7,445,522 5,976,852 5,976,852 5,976,852 5,976,852 - -
6,259,229 6,259,229 6,259,229 6,259,229 6,259,229 - -
93,303,320 192,007,917 240,498,572 183,900,775 206,767,411 218,175,306 242,173,927
309,046,665$ 351,557,563$ 412,413,592$ 455,128,113$ 466,981,764$ 509,857,389$ 435,696,881$
1,575,032$ 1,574,752$ 3,866,553$ 3,850,782$ 3,769,650$ 4,548,198$ 4,856,928$
29,954,106 27,286,923 36,149,568 46,012,360 43,624,838 52,760,240 63,078,031
9,874,686 9,445,911 5,104,564 8,305,930 10,232,079 5,900,072 806,710
- 2,423,392 2,579,512 755,411 739,341 644,078 692,544
161,952,257 136,415,915 154,842,028 158,454,962 150,917,354 - 123,376,875
113,786 114,068 6,291,448 6,322,309 6,688,639 6,540,174 22,509,309
- - - - - (48,023,948) -
203,469,867$ 177,260,961$ 208,833,673$ 223,701,754$ 215,971,901$ 22,368,814$ 215,320,397$
119
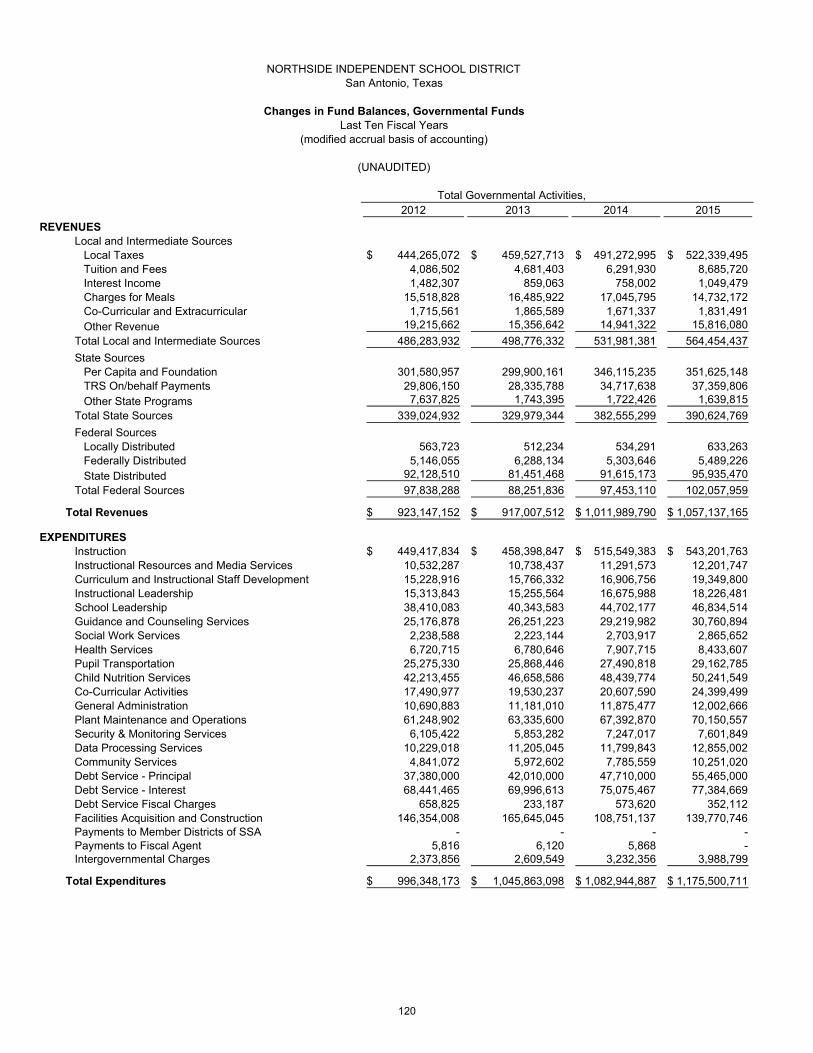
Total Governmental Activities,2012 2013 2014 2015
REVENUESLocal and Intermediate Sources
Local Taxes 444,265,072$ 459,527,713$ 491,272,995$ 522,339,495$ Tuition and Fees 4,086,502 4,681,403 6,291,930 8,685,720 Interest Income 1,482,307 859,063 758,002 1,049,479 Charges for Meals 15,518,828 16,485,922 17,045,795 14,732,172 Co-Curricular and Extracurricular 1,715,561 1,865,589 1,671,337 1,831,491 Other Revenue 19,215,662 15,356,642 14,941,322 15,816,080
Total Local and Intermediate Sources 486,283,932 498,776,332 531,981,381 564,454,437
State SourcesPer Capita and Foundation 301,580,957 299,900,161 346,115,235 351,625,148 TRS On/behalf Payments 29,806,150 28,335,788 34,717,638 37,359,806 Other State Programs 7,637,825 1,743,395 1,722,426 1,639,815
Total State Sources 339,024,932 329,979,344 382,555,299 390,624,769
Federal Sources Locally Distributed 563,723 512,234 534,291 633,263 Federally Distributed 5,146,055 6,288,134 5,303,646 5,489,226 State Distributed 92,128,510 81,451,468 91,615,173 95,935,470
Total Federal Sources 97,838,288 88,251,836 97,453,110 102,057,959
Total Revenues 923,147,152$ 917,007,512$ 1,011,989,790$ 1,057,137,165$
EXPENDITURESInstruction 449,417,834$ 458,398,847$ 515,549,383$ 543,201,763$ Instructional Resources and Media Services 10,532,287 10,738,437 11,291,573 12,201,747 Curriculum and Instructional Staff Development 15,228,916 15,766,332 16,906,756 19,349,800 Instructional Leadership 15,313,843 15,255,564 16,675,988 18,226,481 School Leadership 38,410,083 40,343,583 44,702,177 46,834,514 Guidance and Counseling Services 25,176,878 26,251,223 29,219,982 30,760,894 Social Work Services 2,238,588 2,223,144 2,703,917 2,865,652 Health Services 6,720,715 6,780,646 7,907,715 8,433,607 Pupil Transportation 25,275,330 25,868,446 27,490,818 29,162,785 Child Nutrition Services 42,213,455 46,658,586 48,439,774 50,241,549 Co-Curricular Activities 17,490,977 19,530,237 20,607,590 24,399,499 General Administration 10,690,883 11,181,010 11,875,477 12,002,666 Plant Maintenance and Operations 61,248,902 63,335,600 67,392,870 70,150,557 Security & Monitoring Services 6,105,422 5,853,282 7,247,017 7,601,849 Data Processing Services 10,229,018 11,205,045 11,799,843 12,855,002 Community Services 4,841,072 5,972,602 7,785,559 10,251,020 Debt Service - Principal 37,380,000 42,010,000 47,710,000 55,465,000 Debt Service - Interest 68,441,465 69,996,613 75,075,467 77,384,669 Debt Service Fiscal Charges 658,825 233,187 573,620 352,112 Facilities Acquisition and Construction 146,354,008 165,645,045 108,751,137 139,770,746 Payments to Member Districts of SSA - - - - Payments to Fiscal Agent 5,816 6,120 5,868 - Intergovernmental Charges 2,373,856 2,609,549 3,232,356 3,988,799
Total Expenditures 996,348,173$ 1,045,863,098$ 1,082,944,887$ 1,175,500,711$
NORTHSIDE INDEPENDENT SCHOOL DISTRICTSan Antonio, Texas
Changes in Fund Balances, Governmental FundsLast Ten Fiscal Years
(modified accrual basis of accounting)
(UNAUDITED)
120

Exhibit K-4
Fiscal Year Ended August 31,2016 2017 2018 2019 2020 2021
583,408,730$ 641,045,319$ 687,324,790$ 737,391,173$ 757,167,828$ 781,590,250$ 2,764,005 2,669,659 2,944,102 2,922,625 2,339,232 1,783,381 3,157,068 6,614,507 13,930,364 21,613,011 12,477,258 1,042,922
14,627,062 14,002,608 14,574,967 14,515,731 10,184,966 593,552 1,629,807 1,680,457 1,813,173 1,628,854 1,615,749 909,902
21,674,213 20,314,406 27,384,363 18,310,956 12,663,988 18,510,887
627,260,885 686,326,956 747,971,759 796,382,350 796,449,021 804,430,894
342,933,194 302,892,119 274,741,040 232,934,559 307,702,693 252,162,498 38,843,479 39,154,249 43,504,406 43,426,547 53,380,482 50,597,131 3,177,604 7,258,425 12,998,211 17,872,114 16,884,280 11,450,184
384,954,277 349,304,793 331,243,657 294,233,220 377,967,455 314,209,813
1,377,604 1,136,758 1,241,875 1,189,189 3,318,891 7,821,709 3,267,955 4,452,679 3,170,062 4,457,313 1,483,722 1,643,231
102,932,182 111,387,328 119,763,352 127,310,298 113,637,774 108,226,208
107,577,741 116,976,765 124,175,289 132,956,800 118,440,387 117,691,148
1,119,792,903$ 1,152,608,514$ 1,203,390,705$ 1,223,572,370$ 1,292,856,863$ 1,236,331,855$
558,836,390$ 562,874,186$ 584,763,844$ 597,188,721$ 628,163,762$ 629,413,542$ 12,510,966 12,291,650 12,824,256 13,162,773 13,103,108 12,841,228 18,281,212 19,720,931 20,912,403 20,906,433 21,318,518 21,635,302 18,775,937 18,466,113 19,925,286 21,062,386 21,501,651 20,899,977 48,131,868 48,520,901 51,091,482 53,031,439 53,716,604 56,028,077 33,569,055 34,162,196 36,345,376 37,710,761 40,043,837 41,397,033 2,966,806 2,891,643 3,259,083 3,478,898 4,072,131 3,463,369 8,808,867 8,925,249 9,784,833 9,813,141 10,750,969 12,139,878
30,046,691 30,655,742 31,757,378 34,334,724 34,226,923 30,921,902 48,853,937 46,865,312 47,497,957 49,070,711 46,567,396 38,925,898 24,699,123 25,435,000 27,144,951 27,858,198 25,206,082 25,382,487 12,673,272 13,242,220 14,361,913 13,914,046 14,723,655 15,982,885 74,331,657 77,966,024 81,747,180 82,623,866 81,707,700 85,565,990 8,351,876 8,262,742 8,551,733 8,331,619 8,726,142 9,334,986
14,231,765 18,199,430 16,199,791 16,678,681 17,046,109 17,677,134 4,303,436 4,256,647 4,807,473 4,302,038 4,296,835 4,882,418
68,860,000 72,995,000 83,405,000 101,640,000 109,240,000 118,225,000 79,848,280 81,287,700 81,682,651 84,475,578 79,281,105 78,531,982
317,958 560,803 1,826,411 2,703,499 2,008,437 2,033,136 180,911,832 153,188,615 147,434,377 146,806,728 233,803,400 252,582,666
- - - 375,810 513,725 - - - - - - -
4,340,201 4,624,823 5,048,309 4,740,147 4,973,644 4,109,250
1,253,651,129$ 1,245,392,927$ 1,290,371,687$ 1,334,210,197$ 1,454,991,733$ 1,481,974,140$
(Continued on next page)
121
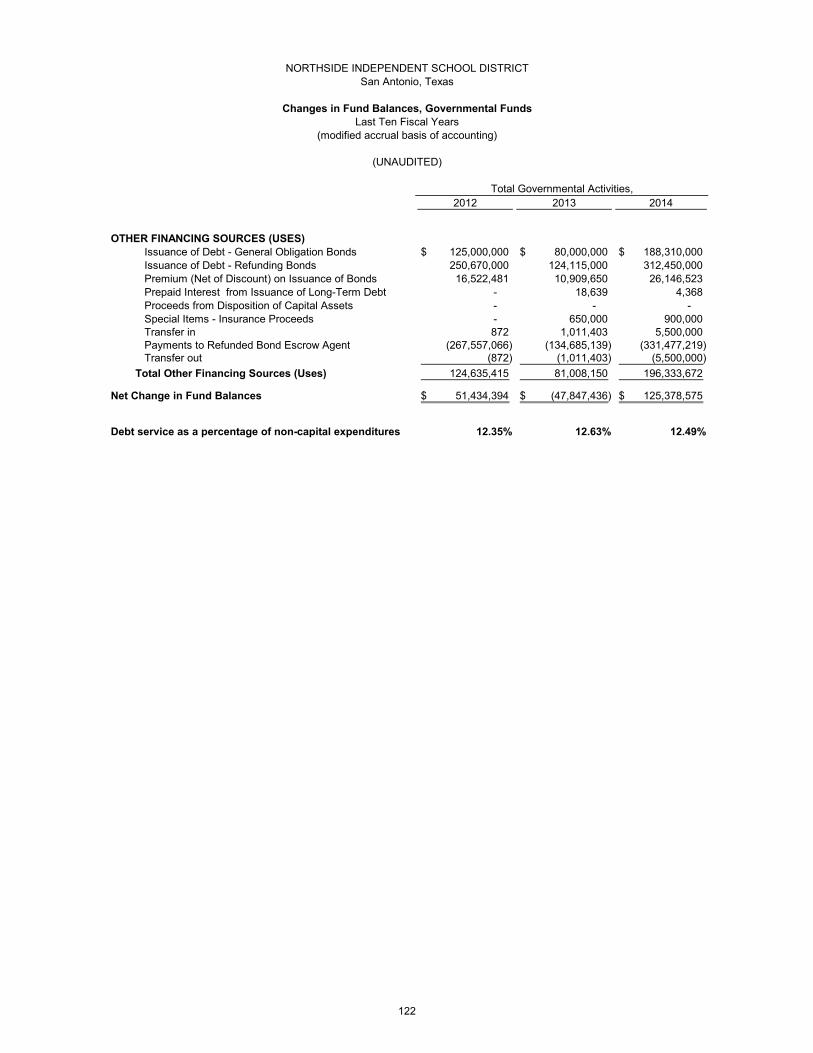
Total Governmental Activities,2012 2013 2014
OTHER FINANCING SOURCES (USES)Issuance of Debt - General Obligation Bonds 125,000,000$ 80,000,000$ 188,310,000$ Issuance of Debt - Refunding Bonds 250,670,000 124,115,000 312,450,000 Premium (Net of Discount) on Issuance of Bonds 16,522,481 10,909,650 26,146,523 Prepaid Interest from Issuance of Long-Term Debt - 18,639 4,368 Proceeds from Disposition of Capital Assets - - - Special Items - Insurance Proceeds - 650,000 900,000 Transfer in 872 1,011,403 5,500,000 Payments to Refunded Bond Escrow Agent (267,557,066) (134,685,139) (331,477,219) Transfer out (872) (1,011,403) (5,500,000)
Total Other Financing Sources (Uses) 124,635,415 81,008,150 196,333,672
Net Change in Fund Balances 51,434,394$ (47,847,436)$ 125,378,575$
Debt service as a percentage of non-capital expenditures 12.35% 12.63% 12.49%
NORTHSIDE INDEPENDENT SCHOOL DISTRICTSan Antonio, Texas
Changes in Fund Balances, Governmental FundsLast Ten Fiscal Years
(modified accrual basis of accounting)
(UNAUDITED)
122
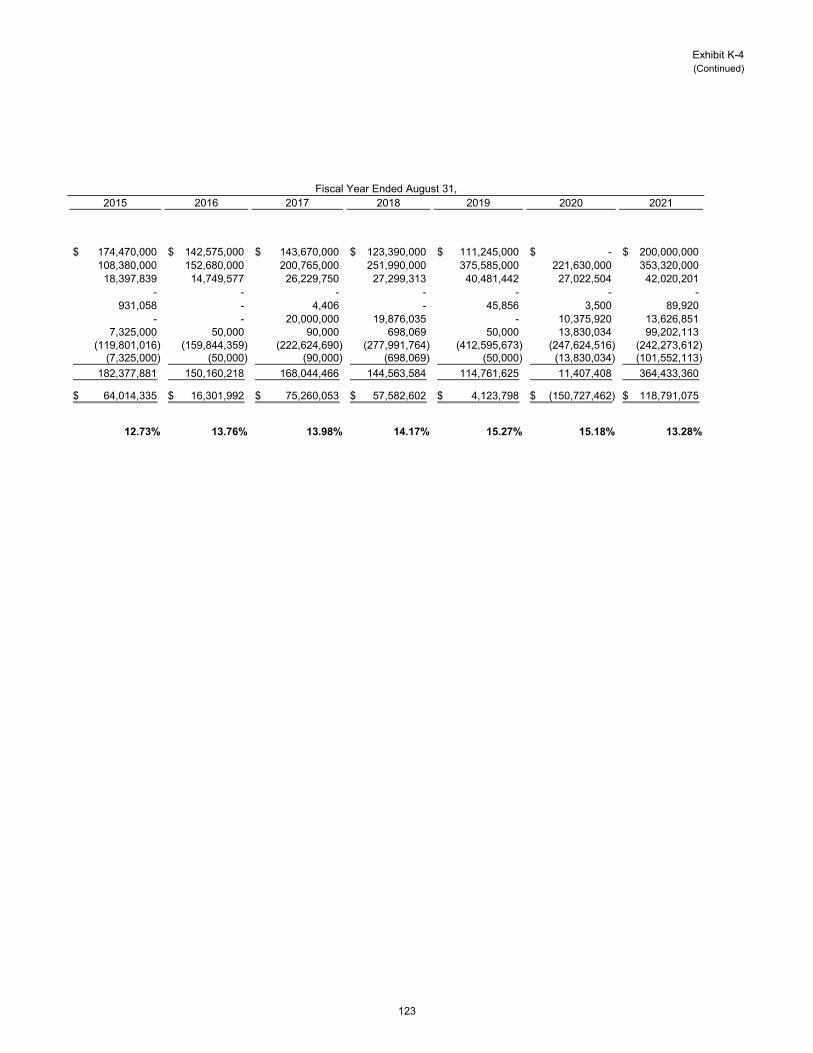
Exhibit K-4(Continued)
Fiscal Year Ended August 31,2015 2016 2017 2018 2019 2020 2021
174,470,000$ 142,575,000$ 143,670,000$ 123,390,000$ 111,245,000$ -$ 200,000,000$ 108,380,000 152,680,000 200,765,000 251,990,000 375,585,000 221,630,000 353,320,000 18,397,839 14,749,577 26,229,750 27,299,313 40,481,442 27,022,504 42,020,201
- - - - - - - 931,058 - 4,406 - 45,856 3,500 89,920
- - 20,000,000 19,876,035 - 10,375,920 13,626,851 7,325,000 50,000 90,000 698,069 50,000 13,830,034 99,202,113
(119,801,016) (159,844,359) (222,624,690) (277,991,764) (412,595,673) (247,624,516) (242,273,612) (7,325,000) (50,000) (90,000) (698,069) (50,000) (13,830,034) (101,552,113)
182,377,881 150,160,218 168,044,466 144,563,584 114,761,625 11,407,408 364,433,360
64,014,335$ 16,301,992$ 75,260,053$ 57,582,602$ 4,123,798$ (150,727,462)$ 118,791,075$
12.73% 13.76% 13.98% 14.17% 15.27% 15.18% 13.28%
123

(This page intentionally left blank)
124

REVENUE CAPACITY
These schedules contain information to help the reader assess the
District's most significant local revenue source, the property tax.
125
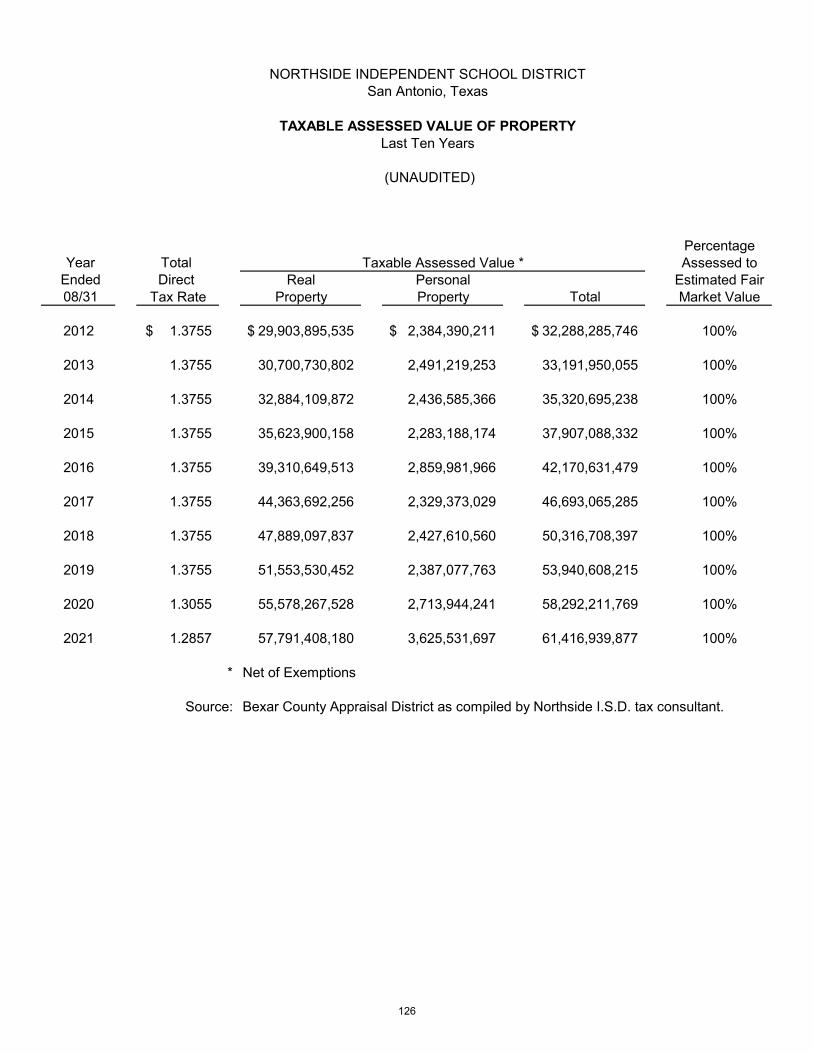
NORTHSIDE INDEPENDENT SCHOOL DISTRICTSan Antonio, Texas
TAXABLE ASSESSED VALUE OF PROPERTYLast Ten Years
(UNAUDITED)
Percentage Year Total Taxable Assessed Value * Assessed to
Ended Direct Real Personal Estimated Fair 08/31 Tax Rate Property Property Total Market Value
2012 1.3755$ 29,903,895,535$ 2,384,390,211$ 32,288,285,746$ 100%
2013 1.3755 30,700,730,802 2,491,219,253 33,191,950,055 100%
2014 1.3755 32,884,109,872 2,436,585,366 35,320,695,238 100%
2015 1.3755 35,623,900,158 2,283,188,174 37,907,088,332 100%
2016 1.3755 39,310,649,513 2,859,981,966 42,170,631,479 100%
2017 1.3755 44,363,692,256 2,329,373,029 46,693,065,285 100%
2018 1.3755 47,889,097,837 2,427,610,560 50,316,708,397 100%
2019 1.3755 51,553,530,452 2,387,077,763 53,940,608,215 100%
2020 1.3055 55,578,267,528 2,713,944,241 58,292,211,769 100%
2021 1.2857 57,791,408,180 3,625,531,697 61,416,939,877 100%
* Net of Exemptions
Source: Bexar County Appraisal District as compiled by Northside I.S.D. tax consultant.
126
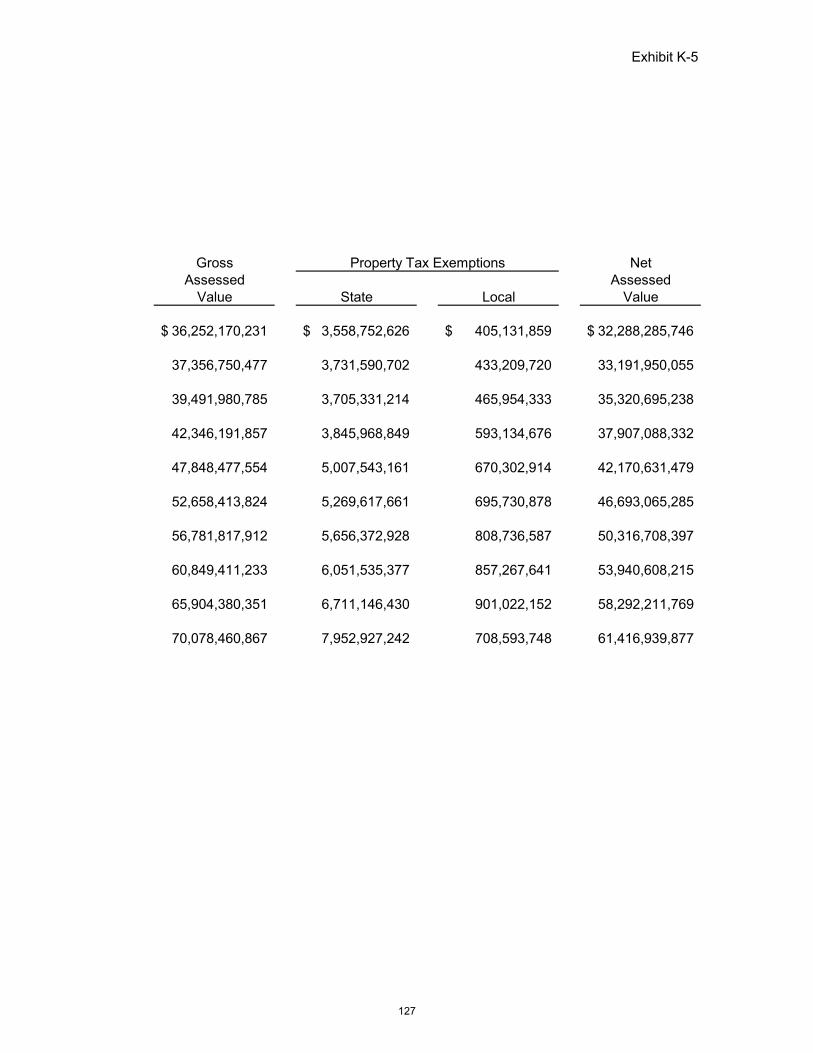
Exhibit K-5
Gross Property Tax Exemptions NetAssessed Assessed
Value State Local Value
36,252,170,231$ 3,558,752,626$ 405,131,859$ 32,288,285,746$
37,356,750,477 3,731,590,702 433,209,720 33,191,950,055
39,491,980,785 3,705,331,214 465,954,333 35,320,695,238
42,346,191,857 3,845,968,849 593,134,676 37,907,088,332
47,848,477,554 5,007,543,161 670,302,914 42,170,631,479
52,658,413,824 5,269,617,661 695,730,878 46,693,065,285
56,781,817,912 5,656,372,928 808,736,587 50,316,708,397
60,849,411,233 6,051,535,377 857,267,641 53,940,608,215
65,904,380,351 6,711,146,430 901,022,152 58,292,211,769
70,078,460,867 7,952,927,242 708,593,748 61,416,939,877
127
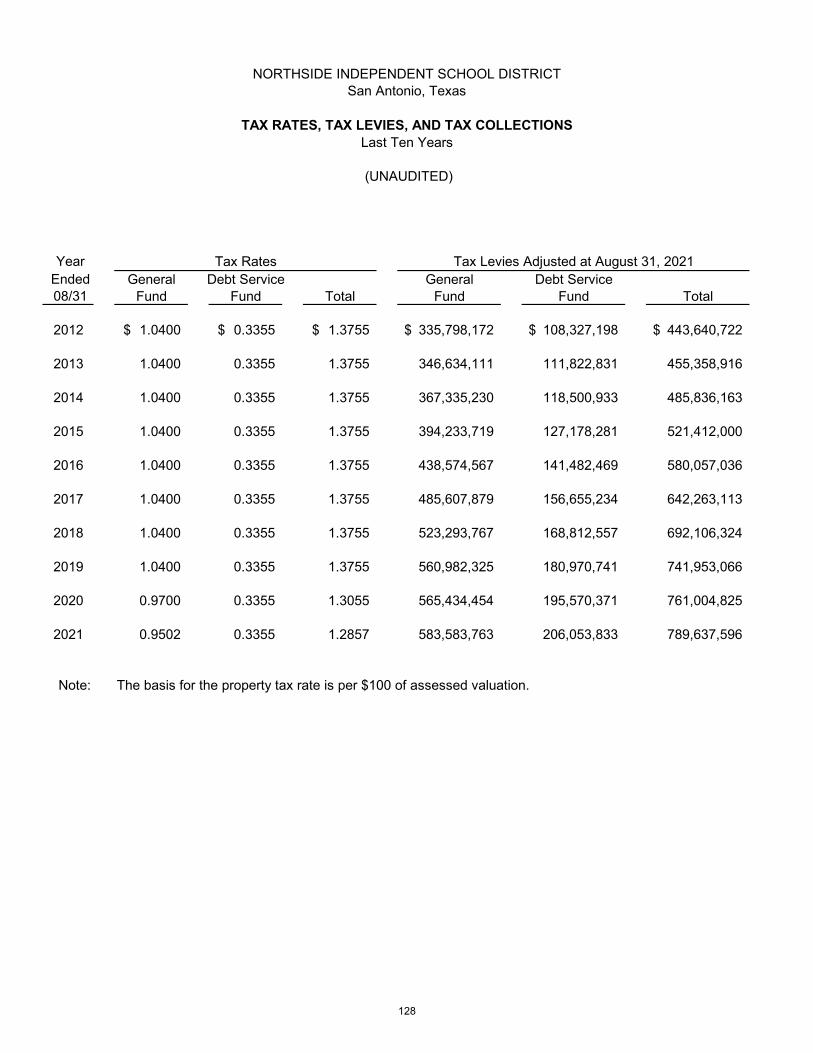
NORTHSIDE INDEPENDENT SCHOOL DISTRICTSan Antonio, Texas
TAX RATES, TAX LEVIES, AND TAX COLLECTIONSLast Ten Years
(UNAUDITED)
Year Ended General Debt Service General Debt Service 08/31 Fund Fund Total Fund Fund Total
2012 1.0400$ 0.3355$ 1.3755$ 335,798,172$ 108,327,198$ 443,640,722$
2013 1.0400 0.3355 1.3755 346,634,111 111,822,831 455,358,916
2014 1.0400 0.3355 1.3755 367,335,230 118,500,933 485,836,163
2015 1.0400 0.3355 1.3755 394,233,719 127,178,281 521,412,000
2016 1.0400 0.3355 1.3755 438,574,567 141,482,469 580,057,036
2017 1.0400 0.3355 1.3755 485,607,879 156,655,234 642,263,113
2018 1.0400 0.3355 1.3755 523,293,767 168,812,557 692,106,324
2019 1.0400 0.3355 1.3755 560,982,325 180,970,741 741,953,066
2020 0.9700 0.3355 1.3055 565,434,454 195,570,371 761,004,825
2021 0.9502 0.3355 1.2857 583,583,763 206,053,833 789,637,596
Note: The basis for the property tax rate is per $100 of assessed valuation.
Tax Rates Tax Levies Adjusted at August 31, 2021
128
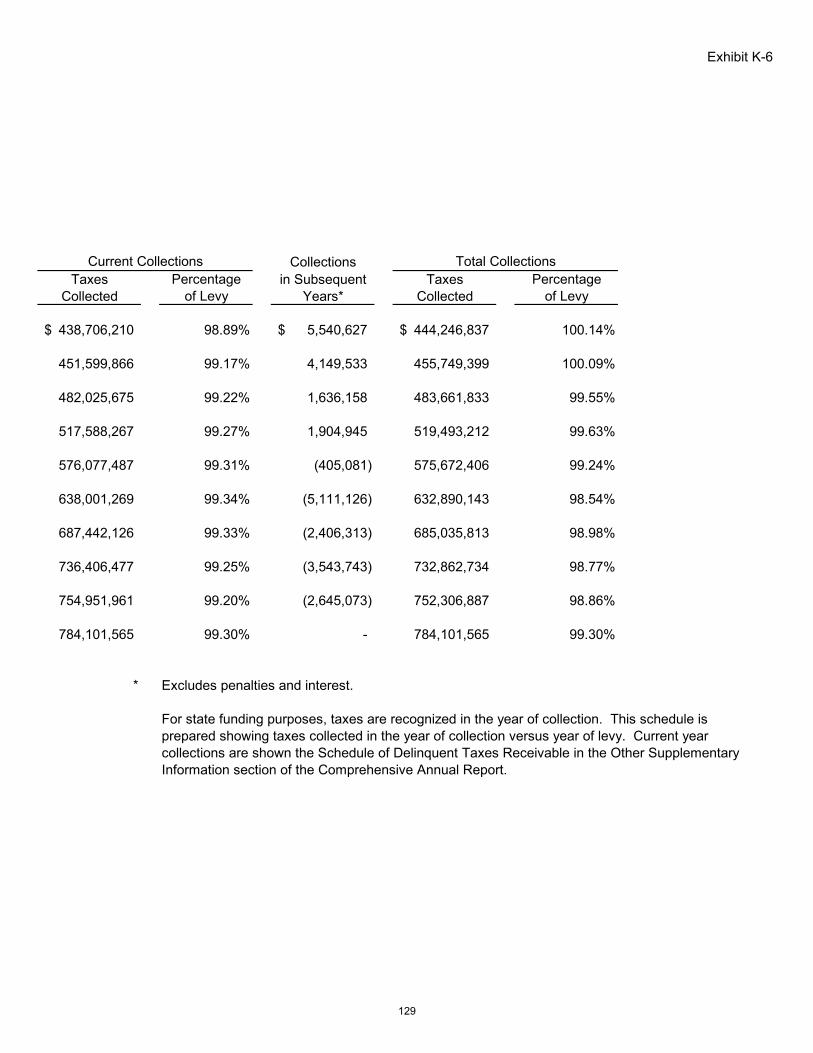
Exhibit K-6
Current Collections Collections Total CollectionsTaxes Percentage in Subsequent Taxes Percentage
Collected of Levy Years* Collected of Levy
438,706,210$ 98.89% 5,540,627$ 444,246,837$ 100.14%
451,599,866 99.17% 4,149,533 455,749,399 100.09%
482,025,675 99.22% 1,636,158 483,661,833 99.55%
517,588,267 99.27% 1,904,945 519,493,212 99.63%
576,077,487 99.31% (405,081) 575,672,406 99.24%
638,001,269 99.34% (5,111,126) 632,890,143 98.54%
687,442,126 99.33% (2,406,313) 685,035,813 98.98%
736,406,477 99.25% (3,543,743) 732,862,734 98.77%
754,951,961 99.20% (2,645,073) 752,306,887 98.86%
784,101,565 99.30% - 784,101,565 99.30%
* Excludes penalties and interest.
For state funding purposes, taxes are recognized in the year of collection. This schedule isprepared showing taxes collected in the year of collection versus year of levy. Current yearcollections are shown the Schedule of Delinquent Taxes Receivable in the Other Supplementary Information section of the Comprehensive Annual Report.
129

Exhibit K-7NORTHSIDE INDEPENDENT SCHOOL DISTRICT
San Antonio, Texas
SCHEDULE OF TEN PRINCIPAL TAXPAYERSAugust 31, 2021
(UNAUDITED)
Percentage Percentage2021 of Total 2011 of Total
Assessed Assessed Assessed AssessedName of Taxpayer Type of Property Valuation Valuation Valuation Valuation
Microsoft Corporation Technology 1,742,178,950$ 2.84% 340,011,880$ 1.05%
USAA Insurance 336,559,588 0.55% 299,353,120 0.93%
La Cantera Specialty Retail LP Shopping Center 329,650,700 0.54% 221,968,710 0.69%
Methodist Healthcare System of San Antonio LTD LLP Hospitals 380,364,000 0.62% 243,762,680 0.75%
Wal Mart Stores Inc # 2404 Mass Merchandising 241,823,740 0.39% 158,083,760 0.49%
HEB Grocery Company LP Grocery Store 280,389,160 0.46% 168,398,880 0.52%
Hines Global Reit San Antonio Retail I LP (formally the RIM) Shopping Center 184,945,290 0.30% -
Cyrusone LLC Data Center 243,735,020 0.40% -
Frost Bank Financial Services 146,393,417 0.24% -
Frankel Family Trust Multi-Dwelling Units 205,852,070 0.34% -
Southwestern Bell Telephone Telephone/Utility - 82,370,819 0.26%
Inland Western San Antonio Shopping Center - 89,675,770 0.28%
Central Rim LLC Shopping Center - 87,056,100 0.27%
Wereldhave USA-San Antonio LP Shopping Center - 169,317,000 0.52%
San Antonio Resorts, Ltd. Resorts - 83,603,742 0.26%
TOTALS 4,091,891,935$ 6.68% 1,943,602,461$ 6.02%
*Source: Bexar County Appraisal District
130
(This page intentionally left blank)
131
NORTHSIDE INDEPENDENT SCHOOL DISTRICTSan Antonio, Texas
PROPERTY TAX RATES - ALL OVERLAPPING GOVERNMENTS (Per $100 of Assessed Value)
Last Ten Years
(UNAUDITED)
Year Alamo University City of Ended Community Bandera Bexar Health Grey 08/31 College County County System Forest
2012 0.14162 0.67690 0.29619 0.27624 0.09353
2013 0.14915 0.67690 0.29619 0.27624 0.09353
2014 0.14915 0.67690 0.28382 0.27624 0.09353
2015 0.14915 0.67690 0.29750 0.27624 0.08844
2016 0.14915 0.67690 0.29325 0.27624 0.08844
2017 0.14915 0.67690 0.29123 0.27624 0.08844
2018 0.14915 0.67690 0.27743 0.27624 0.08844
2019 0.14915 0.67690 0.27743 0.27624 0.08844
2020 0.14915 0.67690 0.27743 0.27624 0.08844
2021 0.14915 0.67690 0.27633 0.27624 0.08560
Source: Tax Rates verified through various sources such as Bexar, Medina, and Bandera County websites as well as the Texas Comptroller website.
132
Exhibit K-8
City San Antonio City of City ofCity of of Leon Medina River San San Antonio ShavanoHelotes Valley County Authority Antonio MUD #1 Park
0.35500 0.57428 0.52900 0.01737 0.56569 0.69250 0.32000
0.35500 0.58292 0.52500 0.01780 0.56569 0.70320 0.32000
0.35000 0.57551 0.52500 0.01750 0.56569 0.68770 0.30962
0.35000 0.56162 0.55170 0.01729 0.55827 0.62770 0.28774
0.35000 0.55660 0.55170 0.01729 0.55827 0.63450 0.28774
0.35000 0.55660 0.55170 0.01729 0.55827 0.63770 0.28774
0.35000 0.54588 0.55170 0.01858 0.55827 0.59710 0.28774
0.35000 0.54359 0.55170 0.01858 0.55827 0.58890 0.28774
0.34652 0.53590 0.54730 0.01858 0.55827 0.53000 0.28774
0.34398 0.53410 0.52230 0.01858 0.55827 0.52500 0.28774
133
(This page intentionally left blank)
134
These schedules present information to help the reader assess
DEBT CAPACITY
the affordability of the District's current levels of outstanding debt
and the District's ability to issue additional debt in the future.
135

Year Ended 8/31
Average Daily Membership * Assessed Value Total Bonded Debt
Restricted for Debt Service
2012 95,402 32,288,285,746$ 1,865,082,384$ 15,975,274$
2013 97,356 33,191,950,055 1,901,721,331 20,224,782
2014 99,380 35,320,695,238 2,043,381,284 25,286,319
2015 101,009 37,907,088,332 2,164,930,727 29,954,106
2016 102,952 42,170,631,479 2,240,344,562 27,286,923
2017 103,651 46,693,065,285 2,297,306,652 36,149,568
2018 103,790 50,316,708,397 2,326,372,479 46,012,360
2019 104,116 53,940,608,215 2,324,590,195 43,624,838
2020 105,787 58,292,211,769 2,195,401,754 52,760,240
2021 100,948 61,416,939,877 2,408,134,551 63,078,031
* Average Daily Membership is the average daily membership of eligible enrollees,district-wide over the official number of instructional days.
NORTHSIDE INDEPENDENT SCHOOL DISTRICTSan Antonio, Texas
RATIO OF GENERAL OBLIGATION BONDED DEBTTO ASSESSED VALUE AND NET GENERAL OBLIGATION BONDED DEBT
PER AVERAGE DAILY MEMBERSHIPLast Ten Years
(UNAUDITED)
136

Exhibit K-9
Net Bonded Debt
Assessed Valuation to Net Bonded
Debt
Average Daily Membership to
Net Bonded Debt
Assessed Valuation to
Bonded Debt
Average Daily Membership to Bonded
Debt
1,849,107,110$ 5.73% 19,382$ 5.78% 19,550$
1,881,496,549 5.67% 19,326 5.73% 19,534
2,018,094,965 5.71% 20,307 5.79% 20,561
2,134,976,621 5.63% 21,136 5.71% 21,433
2,213,057,639 5.25% 21,496 5.31% 21,761
2,261,157,084 4.84% 21,815 4.92% 22,164
2,280,360,119 4.53% 21,971 4.62% 22,414
2,280,965,357 4.23% 21,908 4.31% 22,327
2,142,641,514 3.68% 20,254 3.77% 20,753
2,345,056,520 3.82% 23,230 3.92% 23,855
Ratio to Net Bonded Debt and Total Bonded Debt
137

Exhibit K-10NORTHSIDE INDEPENDENT SCHOOL DISTRICT
San Antonio, Texas
RATIO OF ANNUAL DEBT SERVICE EXPENDITURES FOR GENERAL OBLIGATIONBONDED DEBT TO TOTAL GENERAL EXPENDITURES
Last Ten Years
(UNAUDITED)
Year Total Total Debt Service Ended Interest and Debt General to General 08/31 Principal Fiscal Charges Service Expenditures Expenditures
2012 37,380,000$ 69,100,290$ 106,480,290$ 617,982,523$ 17.23%
2013 42,010,000 70,229,800 112,239,800 662,434,014 16.94%
2014 47,710,000 75,644,719 123,354,719 733,219,794 16.82%
2015 55,465,000 77,736,781 133,201,781 779,065,520 17.10%
2016 68,860,000 80,166,238 149,026,238 818,305,828 18.21%
2017 72,995,000 81,848,503 154,843,503 840,253,333 18.43%
2018 83,405,000 83,509,062 166,914,062 878,447,836 19.00%
2019 101,640,000 87,179,077 188,819,077 893,472,980 21.13%
2020 109,240,000 81,289,542 190,529,542 922,531,935 20.65%
2021 118,225,000 80,565,118 198,790,118 927,269,838 21.44%
Note: Does not include the debt service portion of the Public Property Financial Contractual
Obligations (PPFCOs) or Limited Maintenance Tax Notes which are payable from atax levied as part of the District's Maintenance & Operations tax rate (General Fund).
138
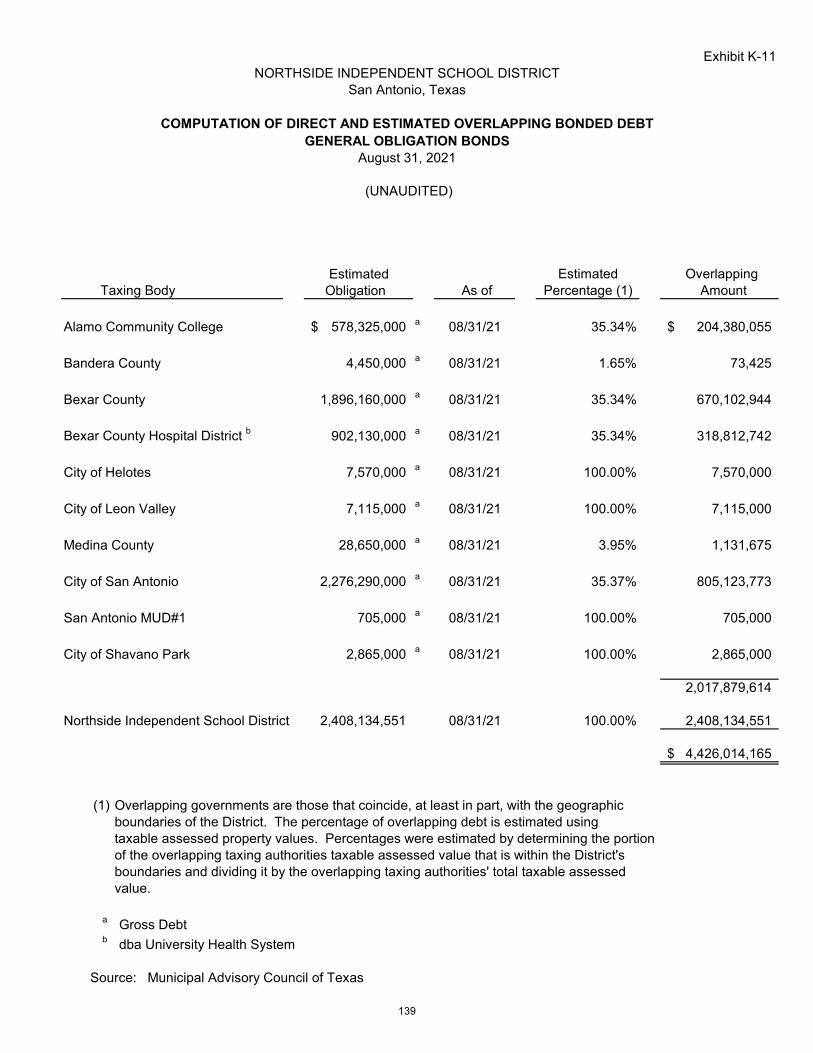
Exhibit K-11NORTHSIDE INDEPENDENT SCHOOL DISTRICT
San Antonio, Texas
COMPUTATION OF DIRECT AND ESTIMATED OVERLAPPING BONDED DEBTGENERAL OBLIGATION BONDS
August 31, 2021
(UNAUDITED)
Estimated Estimated Overlapping
Taxing Body Obligation As of Percentage (1) Amount
Alamo Community College 578,325,000$ a 08/31/21 35.34% 204,380,055$
Bandera County 4,450,000 a 08/31/21 1.65% 73,425
Bexar County 1,896,160,000 a 08/31/21 35.34% 670,102,944
Bexar County Hospital District b 902,130,000 a 08/31/21 35.34% 318,812,742
City of Helotes 7,570,000 a 08/31/21 100.00% 7,570,000
City of Leon Valley 7,115,000 a 08/31/21 100.00% 7,115,000
Medina County 28,650,000 a 08/31/21 3.95% 1,131,675
City of San Antonio 2,276,290,000 a 08/31/21 35.37% 805,123,773
San Antonio MUD#1 705,000 a 08/31/21 100.00% 705,000
City of Shavano Park 2,865,000 a 08/31/21 100.00% 2,865,000
2,017,879,614
Northside Independent School District 2,408,134,551 08/31/21 100.00% 2,408,134,551
4,426,014,165$
(1) Overlapping governments are those that coincide, at least in part, with the geographicboundaries of the District. The percentage of overlapping debt is estimated usingtaxable assessed property values. Percentages were estimated by determining the portionof the overlapping taxing authorities taxable assessed value that is within the District's boundaries and dividing it by the overlapping taxing authorities' total taxable assessed value.
a Gross Debtb dba University Health System
Source: Municipal Advisory Council of Texas
139

Exhibit K-12NORTHSIDE INDEPENDENT SCHOOL DISTRICT
San Antonio, Texas
COMPUTATION OF LEGAL DEBT MARGINGENERAL OBLIGATION BONDS
August 31, 2021
(UNAUDITED)
Assessed Valuation 2020 Tax Roll 61,416,939,877$
Debt Limit - 10% of Assessed Valuation 6,141,693,988$
General Obligation Bonds 2,408,134,551$
Deduct amount available in Debt Service Fund 63,078,031
Applicable Debt 2,345,056,520
Legal Debt Margin 3,796,637,468$
140
DEMOGRAPHIC AND ECONOMIC INFORMATION
These schedules offer demographic and economic indicators to help
the reader understand the environment within which the District's
financial activities take place.
141

NORTHSIDE INDEPENDENT SCHOOL DISTRICTSan Antonio, Texas
DEMOGRAPHIC STATISTICSLast Ten Years
(UNAUDITED)
(1) (2) (3) Year Estimated New Single Average Average
Ended Estimated Number of Family Daily Daily 08/31 Population Households Births Housing Attendance Membership
2012 557,000 195,000 7,965 2,902 90,924 95,402
2013 578,000 198,000 8,177 3,005 93,065 97,356
2014 592,000 201,000 8,506 2,979 95,203 99,380
2015 610,000 203,000 8,690 3,083 96,476 101,010
2016 627,000 207,000 8,804 3,392 97,952 102,952
2017 637,000 209,000 8,735 3,478 98,688 103,651
2018 647,000 212,000 8,702 3,848 98,628 104,380
2019 657,000 215,000 8,681 3,773 98,227 104,116
2020 666,000 232,000 N/A 4,101 98,854 105,787
2021 676,000 235,000 N/A 4,289 99,660 100,948
Source: Department of Resource Planning of Northside Independent School District
(1)
(2)
(3)
TEA notes for COVID
adjustments
All figures rounded to 1000s. All figures through 2017 are the mid year of the 5-yr ACS. 2020 is from PL 94-171. Then 2018 and 2019 were interpolated with 2021 based on recent 3-yr growth rate.
All figures rounded to 1000s. All figures through 2017 are the mid year of the 5-yr ACS. For 2018 and 2019 added 5-yr growth rate of 3,000 per year. 2020 is average of the atypical 2020 PL 94-171 figure of "246,000"
Birth figures come from the San Antonio Metropolitan Health District. The San Antonio Metropolitan Health District has not been able to provide births by census tract after 2017. Therefore, 2018 and 2019 are Resource Planning estimates of births from historical trends.
2019-20 TEA data adjusted for COVID Hold Harmless & ESSER Reduction figures: Hold Harmless = 98,854 ADA for Historical full 6 week ADA; ESSER Reduction = 96,342.957. ** 2020-21 PEIMS ADA = 97,552.996 (@96.5%), PEIMS CAP = 95,669.953 (0.947/.965 = 0.981) , HOLD HARMLESS = 99,660.171 , ESSER REDUCTION = 96,670.577
142
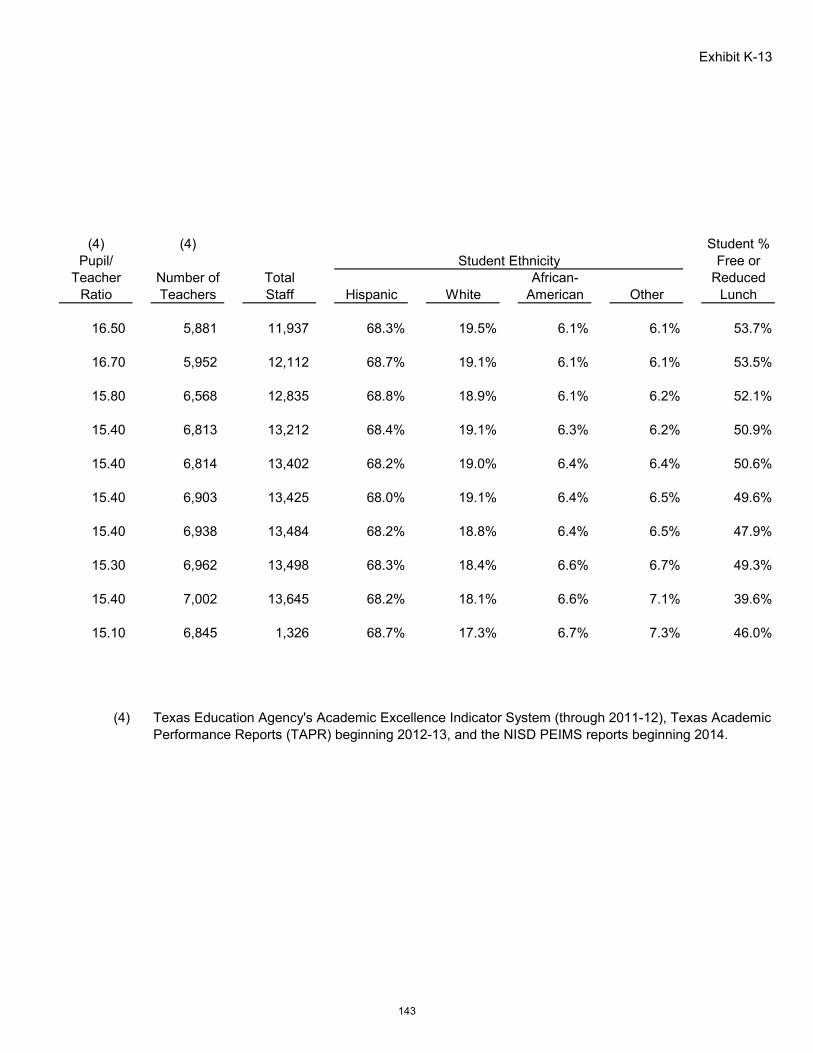
Exhibit K-13
(4) (4) Student %Pupil/ Student Ethnicity Free or
Teacher Number of Total African- ReducedRatio Teachers Staff Hispanic White American Other Lunch
16.50 5,881 11,937 68.3% 19.5% 6.1% 6.1% 53.7%
16.70 5,952 12,112 68.7% 19.1% 6.1% 6.1% 53.5%
15.80 6,568 12,835 68.8% 18.9% 6.1% 6.2% 52.1%
15.40 6,813 13,212 68.4% 19.1% 6.3% 6.2% 50.9%
15.40 6,814 13,402 68.2% 19.0% 6.4% 6.4% 50.6%
15.40 6,903 13,425 68.0% 19.1% 6.4% 6.5% 49.6%
15.40 6,938 13,484 68.2% 18.8% 6.4% 6.5% 47.9%
15.30 6,962 13,498 68.3% 18.4% 6.6% 6.7% 49.3%
15.40 7,002 13,645 68.2% 18.1% 6.6% 7.1% 39.6%
15.10 6,845 1,326 68.7% 17.3% 6.7% 7.3% 46.0%
(4) Texas Education Agency's Academic Excellence Indicator System (through 2011-12), Texas Academic Performance Reports (TAPR) beginning 2012-13, and the NISD PEIMS reports beginning 2014.
143
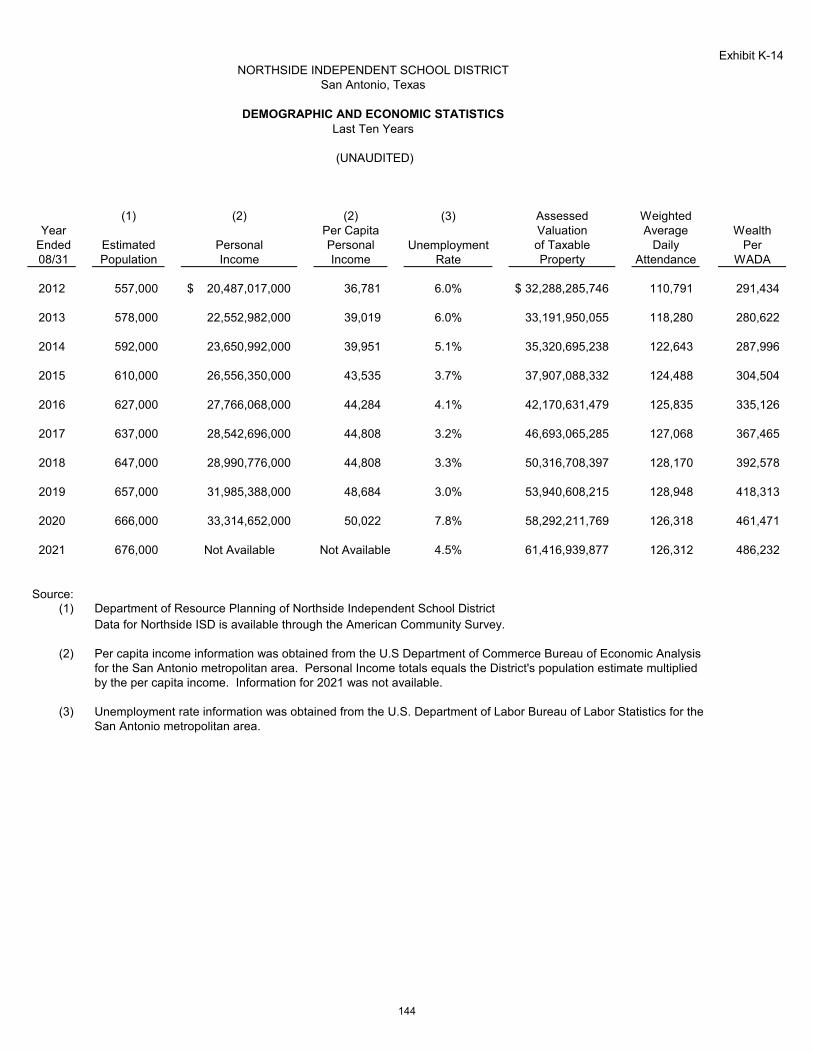
Exhibit K-14NORTHSIDE INDEPENDENT SCHOOL DISTRICT
San Antonio, Texas
DEMOGRAPHIC AND ECONOMIC STATISTICSLast Ten Years
(UNAUDITED)
(1) (2) (2) (3) Assessed Weighted Year Per Capita Valuation Average Wealth
Ended Estimated Personal Personal Unemployment of Taxable Daily Per 08/31 Population Income Income Rate Property Attendance WADA
2012 557,000 20,487,017,000$ 36,781 6.0% 32,288,285,746$ 110,791 291,434
2013 578,000 22,552,982,000 39,019 6.0% 33,191,950,055 118,280 280,622
2014 592,000 23,650,992,000 39,951 5.1% 35,320,695,238 122,643 287,996
2015 610,000 26,556,350,000 43,535 3.7% 37,907,088,332 124,488 304,504
2016 627,000 27,766,068,000 44,284 4.1% 42,170,631,479 125,835 335,126
2017 637,000 28,542,696,000 44,808 3.2% 46,693,065,285 127,068 367,465
2018 647,000 28,990,776,000 44,808 3.3% 50,316,708,397 128,170 392,578
2019 657,000 31,985,388,000 48,684 3.0% 53,940,608,215 128,948 418,313
2020 666,000 33,314,652,000 50,022 7.8% 58,292,211,769 126,318 461,471
2021 676,000 Not Available Not Available 4.5% 61,416,939,877 126,312 486,232
Source:(1) Department of Resource Planning of Northside Independent School District
Data for Northside ISD is available through the American Community Survey.
(2) Per capita income information was obtained from the U.S Department of Commerce Bureau of Economic Analysisfor the San Antonio metropolitan area. Personal Income totals equals the District's population estimate multipliedby the per capita income. Information for 2021 was not available.
(3) Unemployment rate information was obtained from the U.S. Department of Labor Bureau of Labor Statistics for theSan Antonio metropolitan area.
144
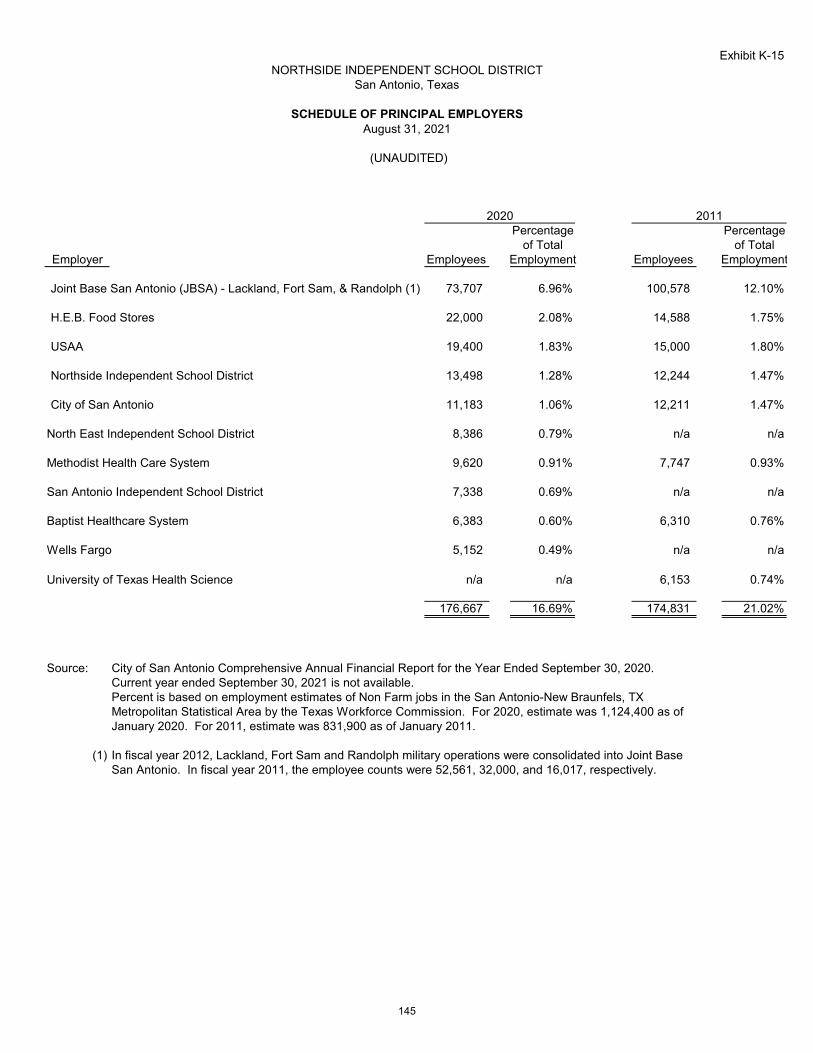
Exhibit K-15NORTHSIDE INDEPENDENT SCHOOL DISTRICT
San Antonio, Texas
SCHEDULE OF PRINCIPAL EMPLOYERSAugust 31, 2021
(UNAUDITED)
2020 2011Percentage Percentage
of Total of TotalEmployer Employees Employment Employees Employment
Joint Base San Antonio (JBSA) - Lackland, Fort Sam, & Randolph (1) 73,707 6.96% 100,578 12.10%
H.E.B. Food Stores 22,000 2.08% 14,588 1.75%
USAA 19,400 1.83% 15,000 1.80%
Northside Independent School District 13,498 1.28% 12,244 1.47%
City of San Antonio 11,183 1.06% 12,211 1.47%
North East Independent School District 8,386 0.79% n/a n/a
Methodist Health Care System 9,620 0.91% 7,747 0.93%
San Antonio Independent School District 7,338 0.69% n/a n/a
Baptist Healthcare System 6,383 0.60% 6,310 0.76%
Wells Fargo 5,152 0.49% n/a n/a
University of Texas Health Science n/a n/a 6,153 0.74%
176,667 16.69% 174,831 21.02%
Source: City of San Antonio Comprehensive Annual Financial Report for the Year Ended September 30, 2020.Current year ended September 30, 2021 is not available.Percent is based on employment estimates of Non Farm jobs in the San Antonio-New Braunfels, TX Metropolitan Statistical Area by the Texas Workforce Commission. For 2020, estimate was 1,124,400 as of January 2020. For 2011, estimate was 831,900 as of January 2011.
(1) In fiscal year 2012, Lackland, Fort Sam and Randolph military operations were consolidated into Joint BaseSan Antonio. In fiscal year 2011, the employee counts were 52,561, 32,000, and 16,017, respectively.
145

Exhibit K-16
Percentage Increase
Ratio of (Decrease) of* ** Average Daily Average Daily
Year Average Average Attendance to AttendanceEnded Daily Daily Average Daily Over 08/31 Attendance Membership Membership Prior Year
2012 90,924 95,402 95.31% 3.00%
2013 93,065 97,356 95.59% 2.35%
2014 95,203 99,380 95.80% 2.30%
2015 96,476 101,000 95.52% 1.34%
2016 97,952 102,952 95.14% 1.53%
2017 98,688 103,651 95.21% 0.75%
2018 98,628 104,380 94.49% -0.06%
2019 98,227 104,116 94.34% -0.41%
2020 98,854 105,787 93.45% 0.64%
2021 99,660 100,948 98.72% 0.82%
* Average Daily Attendance is the average daily attendance of eligible enrollees, district-wide, over the official number of instructional days.
** Average Daily Membership is the average daily enrollment of students, district-wide,over the official number of instructional days.
(UNAUDITED)
NORTHSIDE INDEPENDENT SCHOOL DISTRICTSan Antonio, Texas
AVERAGE DAILY ATTENDANCE AND AVERAGE DAILY MEMBERSHIP
Last Ten Years
146
OPERATING INFORMATION
the District provides and the activities it performs.
These schedules contain service and infrastructure
data to help the reader understand how the information
in the District's financial report relates to the services
147
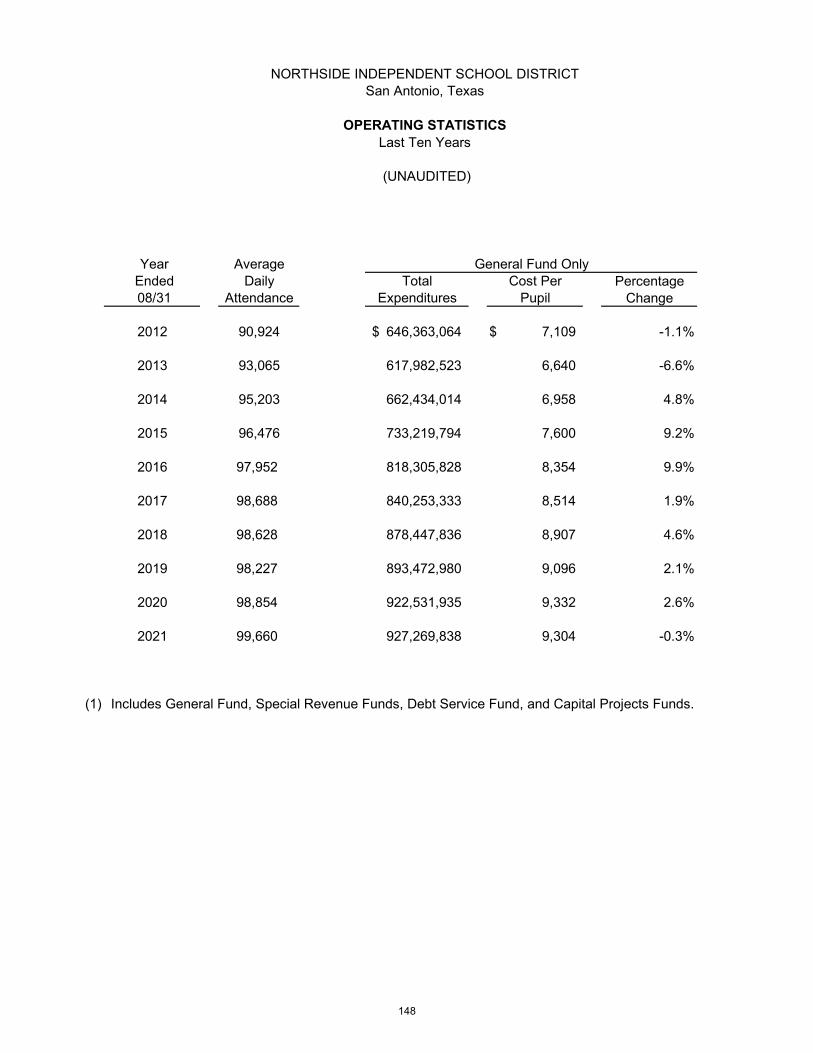
NORTHSIDE INDEPENDENT SCHOOL DISTRICTSan Antonio, Texas
OPERATING STATISTICSLast Ten Years
(UNAUDITED)
Year Average General Fund Only Ended Daily Total Cost Per Percentage 08/31 Attendance Expenditures Pupil Change
2012 90,924 646,363,064$ 7,109$ -1.1%
2013 93,065 617,982,523 6,640 -6.6%
2014 95,203 662,434,014 6,958 4.8%
2015 96,476 733,219,794 7,600 9.2%
2016 97,952 818,305,828 8,354 9.9%
2017 98,688 840,253,333 8,514 1.9%
2018 98,628 878,447,836 8,907 4.6%
2019 98,227 893,472,980 9,096 2.1%
2020 98,854 922,531,935 9,332 2.6%
2021 99,660 927,269,838 9,304 -0.3%
(1) Includes General Fund, Special Revenue Funds, Debt Service Fund, and Capital Projects Funds.
148
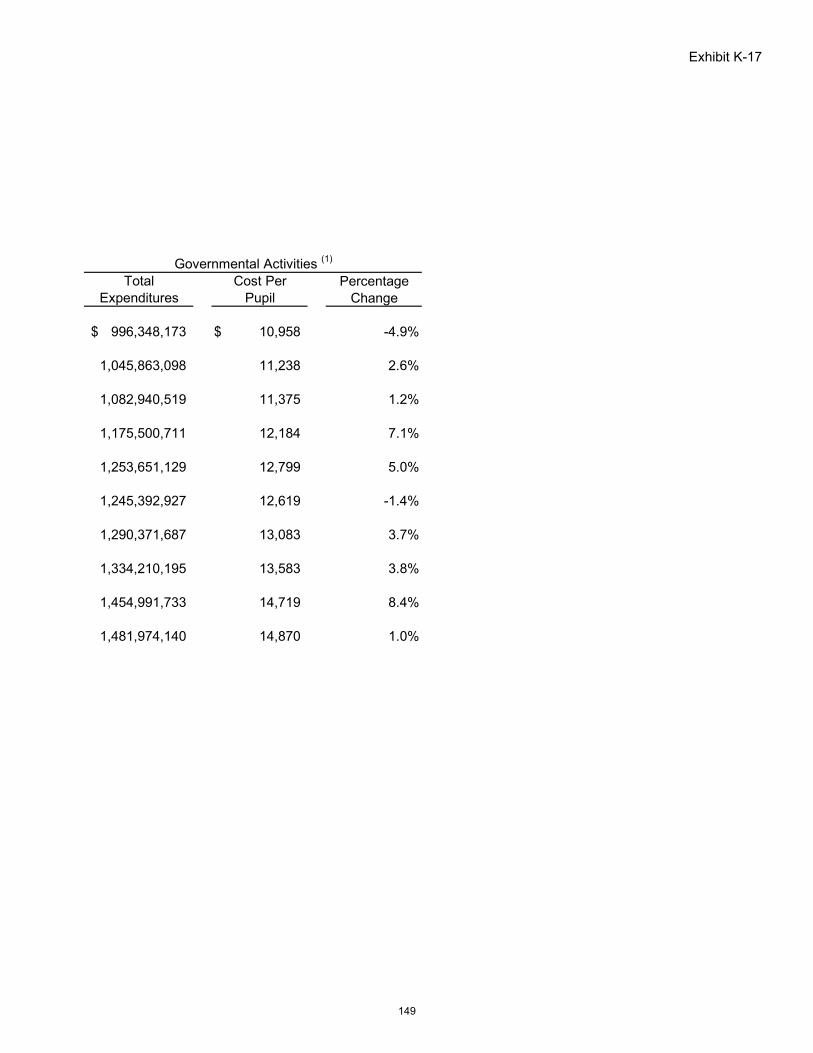
Exhibit K-17
Governmental Activities (1)
Total Cost Per PercentageExpenditures Pupil Change
996,348,173$ 10,958$ -4.9%
1,045,863,098 11,238 2.6%
1,082,940,519 11,375 1.2%
1,175,500,711 12,184 7.1%
1,253,651,129 12,799 5.0%
1,245,392,927 12,619 -1.4%
1,290,371,687 13,083 3.7%
1,334,210,195 13,583 3.8%
1,454,991,733 14,719 8.4%
1,481,974,140 14,870 1.0%
149

Exhibit K-18NORTHSIDE INDEPENDENT SCHOOL DISTRICT
San Antonio, Texas
CONSTRUCTION AND PROPERTY VALUE (1)Last Ten Years (In Thousands)
(UNAUDITED)
Commercial Construction Residential Construction TotalFiscal Number of Construction Number of Construction AssessedYear Permits Value Permits Value Value
2012 3,300 1,912,401 2,858 337,652 70,614,738
2013 2,666 1,241,176 1,991 346,921 71,754,024
2014 3,544 2,474,078 2,137 381,930 74,627,209
2015 3,542 1,933,053 2,273 413,905 79,209,534
2016 3,934 2,044,404 2,195 429,983 89,320,404
2017 3,787 1,795,546 2,507 481,690 97,963,193
2018 3,377 2,173,535 3,166 795,774 105,456,587
2019 3,537 1,869,188 3,537 546,886 111,648,203
2020 3,311 1,997,155 4,337 147,789 117,633,168
2021 2,008 7,682,493 4,854 16,124 116,782,849
(1) The information presented is for the City of San Antonio, Texas. Separate data for the Districtis not available.
Source: City of San Antonio, Texas
150

Exhibit K-19NORTHSIDE INDEPENDENT SCHOOL DISTRICT
San Antonio, Texas
MISCELLANEOUS STATISTICSAugust 31, 2021
(UNAUDITED)
Date Founded: June 14, 1955
Board of Trustees:
The District is governed by seven Trustees. Trustees represent single-member districts.Trustees serve staggered four-year terms.
Number of Regular Employees:
Teachers, Counselors, Librarians, and Nurses 7,350Administrative/Other Professionals 1,443Support and Classified personnel 4,533
Total 13,326
Number of Schools and Special Facilities:
High Schools 19 Middle Schools 21 Elementary Schools 81 Special Schools 4
Other Support Centers 14
Total 139
Other Demographics:
Student Enrollment 103,151
Average Daily Membership 100,948
Average Daily Attendance 99,660
Population (estimated) 676,000
Number of Households (estimated) 235,000
Area: Northwest quadrant of Bexar County - 355 square miles
151
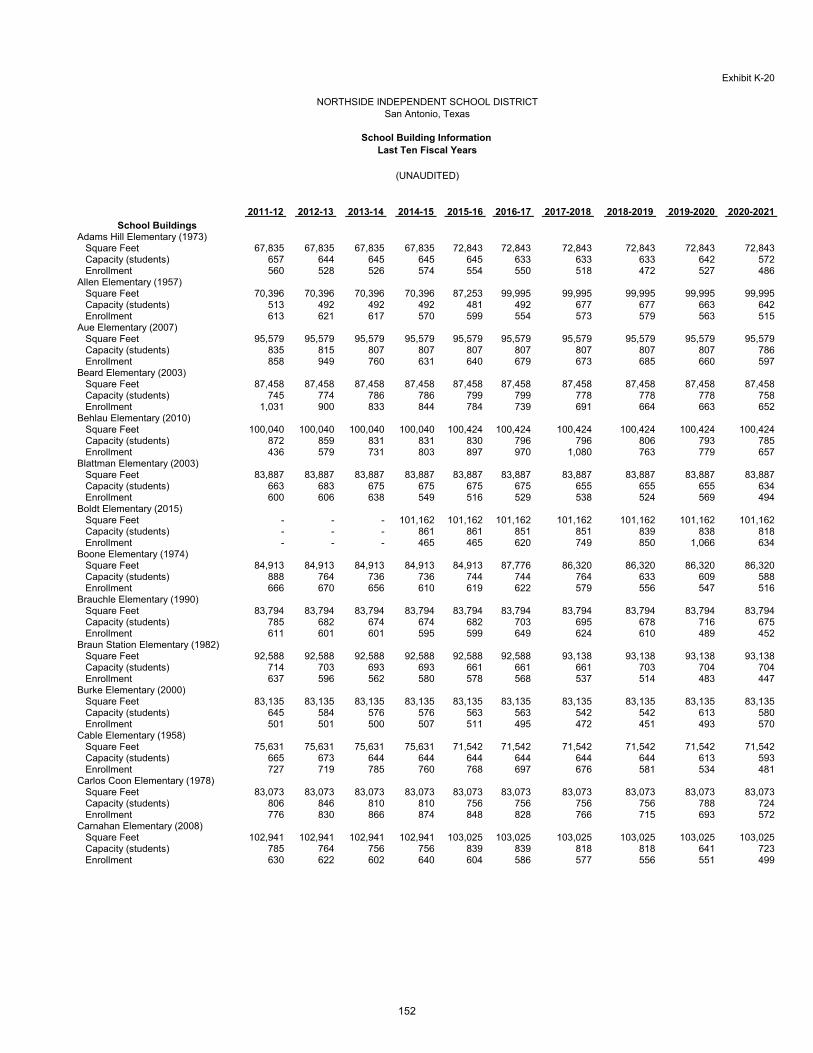
Exhibit K-20
2011-12 2012-13 2013-14 2014-15 2015-16 2016-17 2017-2018 2018-2019 2019-2020 2020-2021
School Buildings Adams Hill Elementary (1973) Square Feet 67,835 67,835 67,835 67,835 72,843 72,843 72,843 72,843 72,843 72,843 Capacity (students) 657 644 645 645 645 633 633 633 642 572 Enrollment 560 528 526 574 554 550 518 472 527 486 Allen Elementary (1957) Square Feet 70,396 70,396 70,396 70,396 87,253 99,995 99,995 99,995 99,995 99,995 Capacity (students) 513 492 492 492 481 492 677 677 663 642 Enrollment 613 621 617 570 599 554 573 579 563 515 Aue Elementary (2007) Square Feet 95,579 95,579 95,579 95,579 95,579 95,579 95,579 95,579 95,579 95,579 Capacity (students) 835 815 807 807 807 807 807 807 807 786 Enrollment 858 949 760 631 640 679 673 685 660 597 Beard Elementary (2003) Square Feet 87,458 87,458 87,458 87,458 87,458 87,458 87,458 87,458 87,458 87,458 Capacity (students) 745 774 786 786 799 799 778 778 778 758 Enrollment 1,031 900 833 844 784 739 691 664 663 652 Behlau Elementary (2010) Square Feet 100,040 100,040 100,040 100,040 100,424 100,424 100,424 100,424 100,424 100,424 Capacity (students) 872 859 831 831 830 796 796 806 793 785 Enrollment 436 579 731 803 897 970 1,080 763 779 657 Blattman Elementary (2003) Square Feet 83,887 83,887 83,887 83,887 83,887 83,887 83,887 83,887 83,887 83,887 Capacity (students) 663 683 675 675 675 675 655 655 655 634 Enrollment 600 606 638 549 516 529 538 524 569 494 Boldt Elementary (2015) Square Feet - - - 101,162 101,162 101,162 101,162 101,162 101,162 101,162 Capacity (students) - - - 861 861 851 851 839 838 818 Enrollment - - - 465 465 620 749 850 1,066 634 Boone Elementary (1974) Square Feet 84,913 84,913 84,913 84,913 84,913 87,776 86,320 86,320 86,320 86,320 Capacity (students) 888 764 736 736 744 744 764 633 609 588 Enrollment 666 670 656 610 619 622 579 556 547 516 Brauchle Elementary (1990) Square Feet 83,794 83,794 83,794 83,794 83,794 83,794 83,794 83,794 83,794 83,794 Capacity (students) 785 682 674 674 682 703 695 678 716 675 Enrollment 611 601 601 595 599 649 624 610 489 452 Braun Station Elementary (1982) Square Feet 92,588 92,588 92,588 92,588 92,588 92,588 93,138 93,138 93,138 93,138 Capacity (students) 714 703 693 693 661 661 661 703 704 704 Enrollment 637 596 562 580 578 568 537 514 483 447 Burke Elementary (2000) Square Feet 83,135 83,135 83,135 83,135 83,135 83,135 83,135 83,135 83,135 83,135 Capacity (students) 645 584 576 576 563 563 542 542 613 580 Enrollment 501 501 500 507 511 495 472 451 493 570 Cable Elementary (1958) Square Feet 75,631 75,631 75,631 75,631 71,542 71,542 71,542 71,542 71,542 71,542 Capacity (students) 665 673 644 644 644 644 644 644 613 593 Enrollment 727 719 785 760 768 697 676 581 534 481 Carlos Coon Elementary (1978) Square Feet 83,073 83,073 83,073 83,073 83,073 83,073 83,073 83,073 83,073 83,073 Capacity (students) 806 846 810 810 756 756 756 756 788 724 Enrollment 776 830 866 874 848 828 766 715 693 572 Carnahan Elementary (2008) Square Feet 102,941 102,941 102,941 102,941 103,025 103,025 103,025 103,025 103,025 103,025 Capacity (students) 785 764 756 756 839 839 818 818 641 723 Enrollment 630 622 602 640 604 586 577 556 551 499
NORTHSIDE INDEPENDENT SCHOOL DISTRICT San Antonio, Texas
School Building Information Last Ten Fiscal Years
(UNAUDITED)
152

Exhibit K-20
2011-12 2012-13 2013-14 2014-15 2015-16 2016-17 2017-2018 2018-2019 2019-2020 2020-2021
NORTHSIDE INDEPENDENT SCHOOL DISTRICT San Antonio, Texas
School Building Information Last Ten Fiscal Years
(UNAUDITED)
Carson Elementary (1998) Square Feet 83,135 83,135 83,135 83,135 83,135 83,135 83,135 83,135 83,135 83,135 Capacity (students) 683 683 683 683 696 679 659 655 655 634 Enrollment 698 694 647 630 620 589 572 561 580 529 Ed Cody Elementary (1982) Square Feet 83,150 83,150 83,150 83,150 83,150 83,150 83,150 83,150 83,150 83,150 Capacity (students) 858 858 858 858 858 820 832 800 774 753 Enrollment 758 731 758 738 669 630 611 628 621 541 Colby Glass Elementary (1956) Square Feet 55,437 55,437 55,437 55,437 55,437 55,437 55,437 55,437 55,437 55,437 Capacity (students) 538 538 522 522 522 522 522 522 469 461 Enrollment 638 645 610 593 577 600 613 560 536 455 Cole Elementary (2016) Square Feet - - - - 101,162 101,162 101,162 101,162 101,162 101,162 Capacity (students) - - - - 603 603 582 603 817 784 Enrollment - - - - 638 638 793 874 939 993 Colonies North Elementary (1966) Square Feet 78,706 78,706 78,706 78,706 78,706 78,706 78,706 78,706 78,706 78,706 Capacity (students) 695 652 644 644 624 603 582 603 572 531 Enrollment 556 592 677 726 660 665 734 625 636 581 Driggers Elementary (2007) Square Feet 91,511 91,511 91,511 91,511 91,511 91,511 91,511 91,511 91,511 91,511 Capacity (students) 703 661 653 653 674 674 653 633 612 568 Enrollment 643 629 627 628 621 609 574 566 589 488 Ellison Elementary (2014) Square Feet - - 102,699 102,699 102,699 102,699 102,699 102,699 102,699 102,699 Capacity (students) - - 851 851 839 839 839 839 850 830 Enrollment - - 462 462 505 531 575 617 671 707 Elrod Elementary (1988) Square Feet 67,334 67,334 67,334 67,334 67,334 67,334 67,334 67,334 67,334 67,334 Capacity (students) 550 538 530 530 530 530 530 509 509 477 Enrollment 568 540 552 557 492 521 456 436 433 374 Esparza Elementary (1974) Square Feet 80,151 80,151 80,151 80,151 80,151 80,151 80,151 80,151 80,151 80,151 Capacity (students) 768 768 760 760 748 707 707 740 647 639 Enrollment 764 756 738 710 693 674 650 581 525 467 Evers Elementary (1992) Square Feet 83,719 83,719 83,719 83,719 83,719 83,719 83,719 83,719 83,719 83,719 Capacity (students) 949 928 942 942 942 942 942 942 798 720 Enrollment 778 834 919 973 970 893 832 754 777 659 Fernandez Elementary (1990) Square Feet 80,664 80,664 80,664 80,664 80,664 80,664 80,664 80,664 80,664 80,664 Capacity (students) 806 744 728 728 707 711 711 707 707 655 Enrollment 711 684 636 647 625 591 600 608 586 532 Fields Elementary (2016) Square Feet - - - - 108,450 108,450 108,450 108,450 108,450 105,700 Capacity (students) - - - - 830 830 777 777 838 806 Enrollment - - - - 740 740 838 853 835 820 Fisher Elementary (2006) Square Feet 96,562 96,562 96,562 96,562 96,562 96,562 96,562 96,562 96,562 96,562 Capacity (students) 809 830 830 830 809 830 777 777 753 720 Enrollment 1,046 799 824 852 870 842 774 699 701 681 Forester Elementary (2008) Square Feet 99,503 99,503 99,503 99,503 99,503 99,503 99,503 99,503 99,503 99,503 Capacity (students) 858 871 863 863 867 830 818 809 788 778 Enrollment 836 880 946 975 979 975 922 861 873 809 Franklin Elementary (2013) Square Feet - 96,941 96,941 96,941 100,564 100,564 100,564 100,564 100,564 96,941 Capacity (students) - 703 715 715 695 715 715 703 723 695 Enrollment - 466 466 551 609 730 792 768 801 808
153

Exhibit K-20
2011-12 2012-13 2013-14 2014-15 2015-16 2016-17 2017-2018 2018-2019 2019-2020 2020-2021
NORTHSIDE INDEPENDENT SCHOOL DISTRICT San Antonio, Texas
School Building Information Last Ten Fiscal Years
(UNAUDITED)
Galm Elementary (1987) Square Feet 79,123 79,123 79,123 79,123 79,123 79,123 79,123 79,123 79,123 79,123 Capacity (students) 777 756 748 748 748 748 748 736 748 728 Enrollment 719 702 686 689 684 662 610 568 533 493 John Glenn Elementary (1962) Square Feet 85,854 85,854 85,854 85,854 85,854 92,292 91,926 91,926 91,926 91,926 Capacity (students) 723 714 706 706 685 706 747 624 588 539 Enrollment 717 675 677 674 629 609 579 544 542 484 Glenoaks Elementary (1961) Square Feet 62,441 62,441 62,441 62,441 62,441 62,441 73,341 74,431 74,431 73,341 Capacity (students) 521 554 521 521 521 541 521 500 444 382 Enrollment 684 654 594 653 681 672 619 684 512 527 Hatchett Elementary (2004) Square Feet 101,355 101,355 101,355 101,355 101,355 101,355 101,355 101,355 101,355 101,355 Capacity (students) 784 784 776 776 788 780 785 777 736 704 Enrollment 826 808 789 808 823 798 768 746 716 615 Helotes Elementary (1939) Square Feet 56,388 56,388 56,388 56,388 64,870 64,870 64,870 64,870 64,870 64,870 Capacity (students) 441 428 433 433 433 420 420 399 441 420 Enrollment 484 368 368 376 374 401 408 424 404 377 Henderson Elementary (2010) Square Feet 100,377 100,377 100,377 100,377 100,377 100,377 100,377 100,377 100,377 100,377 Capacity (students) 872 904 885 885 885 896 885 885 885 863 Enrollment 654 698 594 637 776 817 530 537 617 697 Hoffman Elementary (2009) Square Feet 104,600 104,600 104,600 104,600 104,600 104,600 104,600 104,600 104,600 104,660 Capacity (students) 835 815 839 839 859 798 818 818 818 818 Enrollment 602 656 749 871 995 945 999 974 980 822 Howsman Elementary (1969) Square Feet 61,340 61,340 61,340 61,340 61,340 61,340 61,340 61,340 61,340 61,340 Capacity (students) 624 624 604 604 604 604 604 588 588 568 Enrollment 694 691 718 727 735 747 716 696 741 692 Mary Hull Elementary (1963) Square Feet 75,750 75,750 75,750 75,750 75,750 75,750 75,750 75,750 75,750 87,434 Capacity (students) 661 673 644 644 633 633 633 633 629 547 Enrollment 588 633 674 647 624 610 545 488 531 414 Kallison Elementary (2017) Square Feet - - - - - 102,699 102,699 102,699 102,699 102,699 Capacity (students) - - - - - 864 864 851 830 786 Enrollment - - - - - 585 585 825 1,106 1,190 Knowlton Elementary (1985) Square Feet 76,977 76,977 76,977 76,977 76,977 77,409 77,409 77,409 77,409 77,409 Capacity (students) 809 830 801 801 788 801 747 735 747 724 Enrollment 751 743 733 695 679 656 669 612 603 645 Krueger Elementary (2005) Square Feet 100,800 100,800 100,800 100,800 100,800 100,800 100,800 100,800 100,800 100,800 Capacity (students) 798 818 810 810 810 818 818 818 818 786 Enrollment 1,053 1,089 1,057 1,072 1,055 821 745 714 693 611 Kuentz Elementary (2009) Square Feet 103,483 103,483 103,483 103,483 104,625 104,625 104,625 104,625 104,625 104,625 Capacity (students) 815 815 807 807 807 807 807 807 807 786 Enrollment 785 810 801 777 765 743 707 655 616 580 Langley Elementary (2009) Square Feet 101,572 101,572 101,572 101,572 101,572 101,572 101,572 101,572 101,572 101,572 Capacity (students) 871 879 871 871 871 859 859 859 830 809 Enrollment 566 613 676 755 486 438 457 444 483 569 Leon Springs Elementary (1991) Square Feet 69,698 69,698 69,698 69,698 69,698 69,698 69,698 69,698 69,698 69,698 Capacity (students) 593 593 585 585 585 585 585 585 585 564 Enrollment 571 575 571 391 395 466 487 526 514 477
154

Exhibit K-20
2011-12 2012-13 2013-14 2014-15 2015-16 2016-17 2017-2018 2018-2019 2019-2020 2020-2021
NORTHSIDE INDEPENDENT SCHOOL DISTRICT San Antonio, Texas
School Building Information Last Ten Fiscal Years
(UNAUDITED)
Leon Valley Elementary (1980) Square Feet 76,602 76,602 76,602 76,602 76,602 76,602 76,602 76,602 76,602 76,602 Capacity (students) 723 693 727 727 714 727 715 715 712 691 Enrollment 662 693 701 643 617 636 585 589 556 514 Lewis Elementary (2001) Square Feet 97,994 97,994 97,994 97,994 97,994 97,994 97,994 97,994 97,994 97,994 Capacity (students) 859 826 806 806 806 806 806 806 806 774 Enrollment 821 808 784 770 750 723 685 672 621 559 Lieck Elementary (2011) Square Feet 105,340 105,340 105,340 105,340 105,745 105,745 105,745 105,745 105,745 105,745 Capacity (students) 851 872 851 851 831 835 835 831 818 810 Enrollment 394 551 622 682 681 711 732 676 659 641 Linton Elementary (1980) Square Feet 76,261 76,261 76,261 76,261 76,261 76,261 76,261 76,261 76,261 76,261 Capacity (students) 673 673 665 665 706 695 695 653 629 588 Enrollment 603 612 554 616 592 550 541 481 514 428 Locke Hill Elementary (1975) Square Feet 74,990 74,990 74,990 74,990 74,990 74,990 74,990 74,990 74,990 74,990 Capacity (students) 682 682 650 650 661 663 650 674 650 617 Enrollment 668 668 674 651 677 647 627 627 625 542 Los Reyes Elementary (2012) Square Feet 105,616 105,616 105,616 105,616 105,616 105,616 105,616 105,616 105,616 105,616 Capacity (students) 859 859 839 839 851 839 839 839 839 818 Enrollment 356 356 412 443 498 521 579 570 582 569 Martin Elementary (2010) Square Feet 91,729 91,729 91,729 91,729 91,729 91,729 91,729 91,729 91,729 91,729 Capacity (students) 714 693 665 665 685 685 685 653 642 642 Enrollment 740 800 822 798 781 722 722 663 611 550 May Elementary (1997) Square Feet 80,931 80,931 80,931 80,931 80,931 80,931 80,931 80,931 80,931 80,931 Capacity (students) 677 698 679 679 679 683 670 687 645 625 Enrollment 596 670 686 536 580 606 554 508 507 429 McAndrew Elementary (2013) Square Feet - 90,285 90,285 90,285 90,285 90,285 90,285 90,285 90,285 90,285 Capacity (students) - 667 680 680 680 680 680 680 680 659 Enrollment - 234 234 248 278 295 327 338 344 299 McDermott Elementary (1992) Square Feet 86,610 86,610 86,610 86,610 86,610 86,610 86,610 86,610 86,610 86,610 Capacity (students) 847 834 826 826 826 847 826 785 877 818 Enrollment 812 818 733 804 826 801 669 673 830 728 Mead Elementary (2006) Square Feet 104,902 104,902 104,902 104,902 104,902 104,902 104,902 104,902 104,902 104,902 Capacity (students) 776 784 776 776 764 767 772 752 740 753 Enrollment 1,014 826 820 811 852 797 738 702 814 633 Meadow Village Elementary (1967) Square Feet 78,464 78,464 78,464 78,464 80,236 80,236 80,236 80,236 80,236 80,263 Capacity (students) 685 665 657 657 657 657 625 604 593 560 Enrollment 551 638 672 636 615 538 531 513 449 419 Michael Elementary (1999) Square Feet 93,634 93,634 93,634 93,634 94,222 94,222 94,222 94,222 94,222 94,222 Capacity (students) 674 839 842 842 814 814 818 818 794 774 Enrollment 523 799 825 827 854 763 745 689 699 630 Mireles Elementary (2011) Square Feet 102,680 102,680 102,680 102,680 102,680 102,680 102,680 102,680 102,680 102,680 Capacity (students) 872 831 823 823 851 810 810 810 809 776 Enrollment 514 702 862 976 1,113 889 931 960 952 930 Mora Elementary (2018) - - - - - - Square Feet - - - - - - 101,162 101,162 101,162 101,162 Capacity (students) - - - - - - 851 798 851 831 Enrollment - - - - - - 473 473 952 484
155

Exhibit K-20
2011-12 2012-13 2013-14 2014-15 2015-16 2016-17 2017-2018 2018-2019 2019-2020 2020-2021
NORTHSIDE INDEPENDENT SCHOOL DISTRICT San Antonio, Texas
School Building Information Last Ten Fiscal Years
(UNAUDITED)
Murnin Elementary (2006) Square Feet 110,500 110,500 110,500 110,500 110,500 110,500 110,500 110,500 110,500 110,500 Capacity (students) 859 838 818 818 839 822 802 798 764 753 Enrollment 913 876 910 892 886 896 871 884 813 743 Myers Elementary (1997) Square Feet 80,981 80,981 80,981 80,981 80,951 80,951 80,951 80,951 80,951 80,951 Capacity (students) 677 652 677 677 665 652 663 652 663 621 Enrollment 688 687 712 721 723 660 680 669 681 578 Nichols Elementary (2002) Square Feet 84,263 84,263 84,263 84,263 84,263 84,263 84,263 84,263 84,263 84,263 Capacity (students) 663 674 655 655 655 655 655 655 604 584 Enrollment 612 560 562 501 470 462 464 452 559 455 Northwest Crossing Elementary (1982) Square Feet 80,414 80,414 80,414 80,414 80,414 80,414 80,414 80,926 80,926 80,414 Capacity (students) 785 785 756 756 747 736 736 715 737 593 Enrollment 585 626 616 618 619 586 538 524 450 391 Oak Hills Terrace Elementary (1969) Square Feet 70,220 70,220 70,220 70,220 70,220 70,220 70,220 70,220 70,220 70,220 Capacity (students) 558 558 550 550 550 554 579 579 547 526 Enrollment 609 590 614 575 620 635 652 623 571 522 Ott Elementary (2004) Square Feet 99,350 99,350 99,350 99,350 99,350 99,350 99,350 99,350 99,350 99,350 Capacity (students) 847 847 839 839 818 822 822 822 839 786 Enrollment 805 803 818 753 754 721 692 703 667 623 Passmore Elementary (1970) Square Feet 79,714 79,714 79,714 79,714 79,714 79,714 79,714 79,714 79,714 79,714 Capacity (students) 706 644 698 698 644 633 612 612 621 477 Enrollment 591 597 573 580 555 550 551 531 493 438 Powell Elementary (1962) Square Feet 64,476 64,476 64,476 64,476 64,476 64,476 64,476 64,476 64,476 64,476 Capacity (students) 517 497 509 509 489 489 509 468 518 498 Enrollment 543 516 522 539 539 475 487 475 457 432 Raba Elementary (2000) Square Feet 92,530 92,530 92,530 92,530 92,841 92,841 92,841 92,841 92,841 92,841 Capacity (students) 756 744 756 756 756 756 736 736 736 704 Enrollment 812 754 727 758 698 730 765 740 707 630 Rhodes Elementary (2002) Square Feet 84,993 84,993 84,993 84,993 84,993 84,993 84,993 84,993 84,993 84,993 Capacity (students) 674 674 666 666 666 637 633 633 560 526 Enrollment 515 637 634 638 642 665 599 546 579 504 Scarborough Elementary (2008) Square Feet 105,021 105,021 105,021 105,021 105,021 105,021 105,021 105,021 105,021 105,021 Capacity (students) 847 826 830 830 809 822 802 818 817 776 Enrollment 676 801 677 762 915 807 895 998 997 853 Scobee Elementary (1987) Square Feet 86,262 86,262 86,262 86,262 86,262 86,262 86,262 86,262 86,262 86,262 Capacity (students) 838 806 798 798 798 798 798 798 798 715 Enrollment 617 597 546 587 572 593 564 521 534 502 Steubing Elementary (1997) Square Feet 80,981 80,981 80,981 80,981 80,981 80,981 80,981 80,981 80,981 80,981 Capacity (students) 645 637 617 617 637 616 616 616 604 584 Enrollment 521 527 530 513 498 505 509 471 472 455 Thornton Elementary (1989) Square Feet 80,990 80,990 80,990 80,990 80,990 80,990 80,990 80,990 80,990 80,990 Capacity (students) 785 806 798 798 798 788 756 756 732 712 Enrollment 699 716 690 690 687 630 592 603 573 514 Timberwilde Elementary (1980) Square Feet 80,042 80,042 80,042 80,042 80,042 80,702 80,702 80,702 80,702 80,702 Capacity (students) 818 858 850 850 839 830 809 788 774 753 Enrollment 756 783 770 775 714 695 630 593 609 521
156

Exhibit K-20
2011-12 2012-13 2013-14 2014-15 2015-16 2016-17 2017-2018 2018-2019 2019-2020 2020-2021
NORTHSIDE INDEPENDENT SCHOOL DISTRICT San Antonio, Texas
School Building Information Last Ten Fiscal Years
(UNAUDITED)
Valley-Hi Elementary (1963) Square Feet 47,331 47,331 47,331 47,331 47,331 47,331 47,331 47,331 47,331 47,331 Capacity (students) 249 229 221 221 221 221 221 208 197 209 Enrollment 468 462 439 424 399 413 408 389 376 349 Villarreal Elementary (1968) Square Feet 76,059 76,059 76,059 76,059 80,574 80,574 80,574 80,574 80,574 80,574 Capacity (students) 788 768 760 760 760 760 760 709 704 704 Enrollment 715 759 790 789 748 739 710 681 704 608 Wanke Elementary (2006) Square Feet 97,543 97,543 97,543 97,543 97,543 97,543 97,543 97,543 97,543 97,543 Capacity (students) 866 847 839 839 839 839 839 839 839 818 Enrollment 905 802 817 848 824 831 784 723 740 669 Wernli Elementary (2020) Square Feet - - - - - - - - 102,842 102,842 Capacity (students) - - - - - - - - 839 839 Enrollment - - - - - - - - 490 490 Ward Elementary (2003) Square Feet 99,274 99,274 99,274 99,274 105,550 105,550 105,550 105,550 105,550 105,550 Capacity (students) 785 818 831 831 839 839 839 839 858 818 Enrollment 1,029 990 945 897 877 857 859 838 857 757 Westwood Terrace Elementary (1961) Square Feet 76,034 76,034 76,034 76,034 76,034 76,034 76,034 76,034 76,034 76,034 Capacity (students) 595 657 624 624 624 624 592 892 580 333 Enrollment 660 663 655 615 591 543 552 503 509 462 Bernal Middle School (2014) Square Feet - - 196,800 196,800 196,800 196,800 196,800 196,800 196,800 196,800 Capacity (students) - - 1,285 1,285 1,265 1,247 1,225 1,204 1,206 1,148 Enrollment - - 618 618 727 828 894 1,010 1,117 1,247 Briscoe Middle School (2010) Square Feet 190,175 190,175 190,175 190,175 190,175 190,175 190,175 190,175 190,175 190,175 Capacity (students) 1,316 1,342 1,334 1,334 1,341 1,355 1,351 1,326 1,330 1,275 Enrollment 989 1,218 1,264 812 903 1,095 1,212 1,390 1,448 1,581 Connally Middle School (1998) Square Feet 165,332 165,332 165,332 165,332 165,332 165,332 165,332 165,332 165,332 165,332 Capacity (students) 1,151 1,195 1,159 1,159 1,162 1,142 1,158 1,131 1,140 1,086 Enrollment 1,074 1,086 1,070 1,047 1,023 981 949 954 933 862 Folks Middle School (2013) Square Feet - 199,594 199,594 199,594 199,594 199,594 199,594 199,594 199,594 199,594 Capacity (students) - 1,521 1,521 1,521 1,504 1,476 1,491 1,479 1,449 1,393 Enrollment - 561 561 697 814 1,000 1,210 1,503 1,772 1,783 Garcia Middle School (2009) Square Feet 192,725 192,725 192,725 192,725 192,725 192,725 192,725 192,725 192,725 192,725 Capacity (students) 1,494 1,483 1,483 1,483 1,462 1,460 1,464 1,452 1,422 1,377 Enrollment 1,416 1,486 1,474 1,481 1,513 1,473 1,470 1,489 1,578 1,540 Hobby Middle School (1972) Square Feet 129,574 129,574 129,574 129,574 141,857 141,857 141,857 141,857 141,857 141,857 Capacity (students) 1,129 1,136 1,133 1,133 1,162 1,127 1,143 1,134 1,148 1,110 Enrollment 1,101 1,095 1,008 992 1,011 1,035 1,037 935 935 921 Jefferson Middle School (2007) Square Feet 186,595 186,595 186,595 186,595 186,595 186,595 186,595 186,595 186,595 186,595 Capacity (students) 1,387 1,343 1,369 1,369 1,413 1,372 1,368 1,357 1,374 1,318 Enrollment 1,561 1,673 1,493 1,462 1,463 1,499 1,507 1,482 1,451 1,434 Jones/Jones Magnet Middle School (1993) Square Feet 171,522 171,522 171,522 171,522 171,522 171,522 171,522 171,522 171,522 171,522 Capacity (students) 1,354 1,255 1,365 1,365 1,326 1,303 1,279 1,352 1,259 744 Enrollment 1,151 1,162 1,181 1,202 1,215 1,118 1,071 1,011 968 1,071 Jordan Middle School (1990) Square Feet 163,947 163,947 163,947 163,947 163,947 163,947 163,947 163,947 163,947 163,947 Capacity (students) 1,436 1,459 1,447 1,447 1,408 1,468 1,456 1,173 1,164 1,352 Enrollment 1,262 1,311 1,364 1,351 1,325 1,327 1,300 1,259 1,258 1,238
157
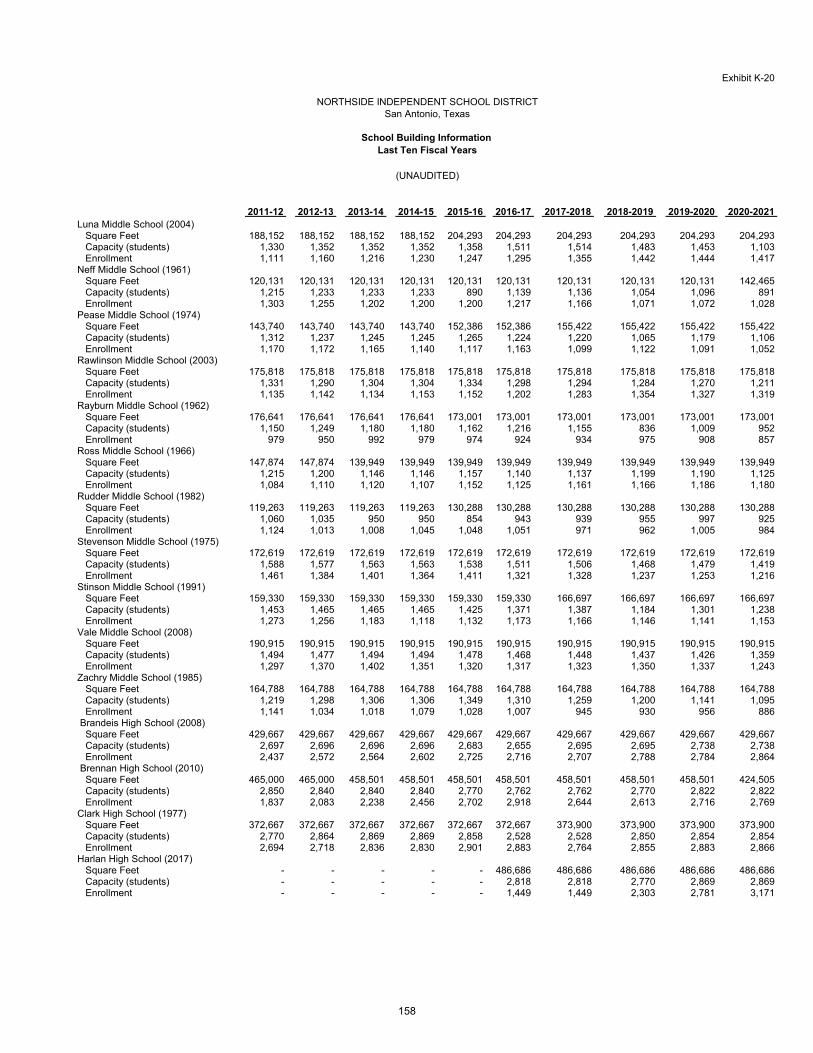
Exhibit K-20
2011-12 2012-13 2013-14 2014-15 2015-16 2016-17 2017-2018 2018-2019 2019-2020 2020-2021
NORTHSIDE INDEPENDENT SCHOOL DISTRICT San Antonio, Texas
School Building Information Last Ten Fiscal Years
(UNAUDITED)
Luna Middle School (2004) Square Feet 188,152 188,152 188,152 188,152 204,293 204,293 204,293 204,293 204,293 204,293 Capacity (students) 1,330 1,352 1,352 1,352 1,358 1,511 1,514 1,483 1,453 1,103 Enrollment 1,111 1,160 1,216 1,230 1,247 1,295 1,355 1,442 1,444 1,417 Neff Middle School (1961) Square Feet 120,131 120,131 120,131 120,131 120,131 120,131 120,131 120,131 120,131 142,465 Capacity (students) 1,215 1,233 1,233 1,233 890 1,139 1,136 1,054 1,096 891 Enrollment 1,303 1,255 1,202 1,200 1,200 1,217 1,166 1,071 1,072 1,028 Pease Middle School (1974) Square Feet 143,740 143,740 143,740 143,740 152,386 152,386 155,422 155,422 155,422 155,422 Capacity (students) 1,312 1,237 1,245 1,245 1,265 1,224 1,220 1,065 1,179 1,106 Enrollment 1,170 1,172 1,165 1,140 1,117 1,163 1,099 1,122 1,091 1,052 Rawlinson Middle School (2003) Square Feet 175,818 175,818 175,818 175,818 175,818 175,818 175,818 175,818 175,818 175,818 Capacity (students) 1,331 1,290 1,304 1,304 1,334 1,298 1,294 1,284 1,270 1,211 Enrollment 1,135 1,142 1,134 1,153 1,152 1,202 1,283 1,354 1,327 1,319 Rayburn Middle School (1962) Square Feet 176,641 176,641 176,641 176,641 173,001 173,001 173,001 173,001 173,001 173,001 Capacity (students) 1,150 1,249 1,180 1,180 1,162 1,216 1,155 836 1,009 952 Enrollment 979 950 992 979 974 924 934 975 908 857 Ross Middle School (1966) Square Feet 147,874 147,874 139,949 139,949 139,949 139,949 139,949 139,949 139,949 139,949 Capacity (students) 1,215 1,200 1,146 1,146 1,157 1,140 1,137 1,199 1,190 1,125 Enrollment 1,084 1,110 1,120 1,107 1,152 1,125 1,161 1,166 1,186 1,180 Rudder Middle School (1982) Square Feet 119,263 119,263 119,263 119,263 130,288 130,288 130,288 130,288 130,288 130,288 Capacity (students) 1,060 1,035 950 950 854 943 939 955 997 925 Enrollment 1,124 1,013 1,008 1,045 1,048 1,051 971 962 1,005 984 Stevenson Middle School (1975) Square Feet 172,619 172,619 172,619 172,619 172,619 172,619 172,619 172,619 172,619 172,619 Capacity (students) 1,588 1,577 1,563 1,563 1,538 1,511 1,506 1,468 1,479 1,419 Enrollment 1,461 1,384 1,401 1,364 1,411 1,321 1,328 1,237 1,253 1,216 Stinson Middle School (1991) Square Feet 159,330 159,330 159,330 159,330 159,330 159,330 166,697 166,697 166,697 166,697 Capacity (students) 1,453 1,465 1,465 1,465 1,425 1,371 1,387 1,184 1,301 1,238 Enrollment 1,273 1,256 1,183 1,118 1,132 1,173 1,166 1,146 1,141 1,153 Vale Middle School (2008) Square Feet 190,915 190,915 190,915 190,915 190,915 190,915 190,915 190,915 190,915 190,915 Capacity (students) 1,494 1,477 1,494 1,494 1,478 1,468 1,448 1,437 1,426 1,359 Enrollment 1,297 1,370 1,402 1,351 1,320 1,317 1,323 1,350 1,337 1,243 Zachry Middle School (1985) Square Feet 164,788 164,788 164,788 164,788 164,788 164,788 164,788 164,788 164,788 164,788 Capacity (students) 1,219 1,298 1,306 1,306 1,349 1,310 1,259 1,200 1,141 1,095 Enrollment 1,141 1,034 1,018 1,079 1,028 1,007 945 930 956 886 Brandeis High School (2008) Square Feet 429,667 429,667 429,667 429,667 429,667 429,667 429,667 429,667 429,667 429,667 Capacity (students) 2,697 2,696 2,696 2,696 2,683 2,655 2,695 2,695 2,738 2,738 Enrollment 2,437 2,572 2,564 2,602 2,725 2,716 2,707 2,788 2,784 2,864 Brennan High School (2010) Square Feet 465,000 465,000 458,501 458,501 458,501 458,501 458,501 458,501 458,501 424,505 Capacity (students) 2,850 2,840 2,840 2,840 2,770 2,762 2,762 2,770 2,822 2,822 Enrollment 1,837 2,083 2,238 2,456 2,702 2,918 2,644 2,613 2,716 2,769 Clark High School (1977) Square Feet 372,667 372,667 372,667 372,667 372,667 372,667 373,900 373,900 373,900 373,900 Capacity (students) 2,770 2,864 2,869 2,869 2,858 2,528 2,528 2,850 2,854 2,854 Enrollment 2,694 2,718 2,836 2,830 2,901 2,883 2,764 2,855 2,883 2,866 Harlan High School (2017) Square Feet - - - - - 486,686 486,686 486,686 486,686 486,686 Capacity (students) - - - - - 2,818 2,818 2,770 2,869 2,869 Enrollment - - - - - 1,449 1,449 2,303 2,781 3,171
158
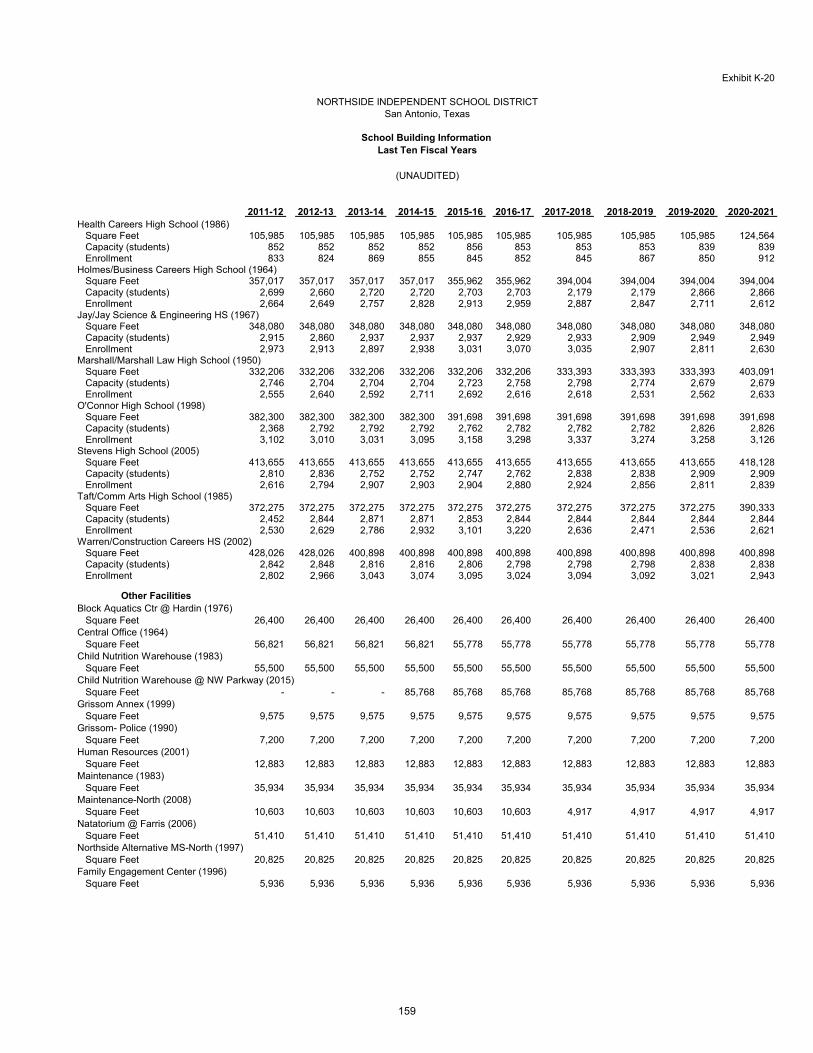
Exhibit K-20
2011-12 2012-13 2013-14 2014-15 2015-16 2016-17 2017-2018 2018-2019 2019-2020 2020-2021
NORTHSIDE INDEPENDENT SCHOOL DISTRICT San Antonio, Texas
School Building Information Last Ten Fiscal Years
(UNAUDITED)
Health Careers High School (1986) Square Feet 105,985 105,985 105,985 105,985 105,985 105,985 105,985 105,985 105,985 124,564 Capacity (students) 852 852 852 852 856 853 853 853 839 839 Enrollment 833 824 869 855 845 852 845 867 850 912 Holmes/Business Careers High School (1964) Square Feet 357,017 357,017 357,017 357,017 355,962 355,962 394,004 394,004 394,004 394,004 Capacity (students) 2,699 2,660 2,720 2,720 2,703 2,703 2,179 2,179 2,866 2,866 Enrollment 2,664 2,649 2,757 2,828 2,913 2,959 2,887 2,847 2,711 2,612 Jay/Jay Science & Engineering HS (1967) Square Feet 348,080 348,080 348,080 348,080 348,080 348,080 348,080 348,080 348,080 348,080 Capacity (students) 2,915 2,860 2,937 2,937 2,937 2,929 2,933 2,909 2,949 2,949 Enrollment 2,973 2,913 2,897 2,938 3,031 3,070 3,035 2,907 2,811 2,630 Marshall/Marshall Law High School (1950) Square Feet 332,206 332,206 332,206 332,206 332,206 332,206 333,393 333,393 333,393 403,091 Capacity (students) 2,746 2,704 2,704 2,704 2,723 2,758 2,798 2,774 2,679 2,679 Enrollment 2,555 2,640 2,592 2,711 2,692 2,616 2,618 2,531 2,562 2,633 O'Connor High School (1998) Square Feet 382,300 382,300 382,300 382,300 391,698 391,698 391,698 391,698 391,698 391,698 Capacity (students) 2,368 2,792 2,792 2,792 2,762 2,782 2,782 2,782 2,826 2,826 Enrollment 3,102 3,010 3,031 3,095 3,158 3,298 3,337 3,274 3,258 3,126 Stevens High School (2005) Square Feet 413,655 413,655 413,655 413,655 413,655 413,655 413,655 413,655 413,655 418,128 Capacity (students) 2,810 2,836 2,752 2,752 2,747 2,762 2,838 2,838 2,909 2,909 Enrollment 2,616 2,794 2,907 2,903 2,904 2,880 2,924 2,856 2,811 2,839 Taft/Comm Arts High School (1985) Square Feet 372,275 372,275 372,275 372,275 372,275 372,275 372,275 372,275 372,275 390,333 Capacity (students) 2,452 2,844 2,871 2,871 2,853 2,844 2,844 2,844 2,844 2,844 Enrollment 2,530 2,629 2,786 2,932 3,101 3,220 2,636 2,471 2,536 2,621 Warren/Construction Careers HS (2002) Square Feet 428,026 428,026 400,898 400,898 400,898 400,898 400,898 400,898 400,898 400,898 Capacity (students) 2,842 2,848 2,816 2,816 2,806 2,798 2,798 2,798 2,838 2,838 Enrollment 2,802 2,966 3,043 3,074 3,095 3,024 3,094 3,092 3,021 2,943
Other FacilitiesBlock Aquatics Ctr @ Hardin (1976) Square Feet 26,400 26,400 26,400 26,400 26,400 26,400 26,400 26,400 26,400 26,400 Central Office (1964) Square Feet 56,821 56,821 56,821 56,821 55,778 55,778 55,778 55,778 55,778 55,778 Child Nutrition Warehouse (1983) Square Feet 55,500 55,500 55,500 55,500 55,500 55,500 55,500 55,500 55,500 55,500 Child Nutrition Warehouse @ NW Parkway (2015) Square Feet - - - 85,768 85,768 85,768 85,768 85,768 85,768 85,768 Grissom Annex (1999) Square Feet 9,575 9,575 9,575 9,575 9,575 9,575 9,575 9,575 9,575 9,575 Grissom- Police (1990) Square Feet 7,200 7,200 7,200 7,200 7,200 7,200 7,200 7,200 7,200 7,200 Human Resources (2001) Square Feet 12,883 12,883 12,883 12,883 12,883 12,883 12,883 12,883 12,883 12,883 Maintenance (1983) Square Feet 35,934 35,934 35,934 35,934 35,934 35,934 35,934 35,934 35,934 35,934 Maintenance-North (2008) Square Feet 10,603 10,603 10,603 10,603 10,603 10,603 4,917 4,917 4,917 4,917 Natatorium @ Farris (2006) Square Feet 51,410 51,410 51,410 51,410 51,410 51,410 51,410 51,410 51,410 51,410 Northside Alternative MS-North (1997) Square Feet 20,825 20,825 20,825 20,825 20,825 20,825 20,825 20,825 20,825 20,825 Family Engagement Center (1996) Square Feet 5,936 5,936 5,936 5,936 5,936 5,936 5,936 5,936 5,936 5,936
159

Exhibit K-20
2011-12 2012-13 2013-14 2014-15 2015-16 2016-17 2017-2018 2018-2019 2019-2020 2020-2021
NORTHSIDE INDEPENDENT SCHOOL DISTRICT San Antonio, Texas
School Building Information Last Ten Fiscal Years
(UNAUDITED)
Northside Alternative HS (1982) Square Feet 10,050 10,050 10,050 10,050 12,587 12,587 12,587 12,587 12,587 12,587 N. Activities Center (1986) Square Feet 27,437 27,437 27,437 27,437 27,437 43,107 43,107 43,107 43,107 43,107 N. Children's Center Square Feet 19,216 19,216 19,216 19,216 19,216 19,216 19,305 19,305 19,305 19,305 N. Learning Center (1987) Square Feet 43,273 43,273 43,273 43,273 43,273 43,273 43,273 43,273 43,273 43,273 Northside Sports Gym (2017) Square Feet - - - - - 90,897 90,897 90,897 90,897 90,897 Northside Swim Center (2013) Square Feet - 18,824 18,824 18,824 18,824 18,824 18,824 18,824 18,824 18,824 Northside Tennis Center (2013) Square Feet - 2,540 2,540 2,540 2,540 2,540 2,540 2,540 2,540 2,540 O'Connor HS Agriculture Center (1998) Square Feet 79,862 79,862 79,862 79,862 79,862 79,862 79,862 79,862 79,862 79,862 Holmgreen Center (1987) Square Feet 43,695 43,695 43,695 43,695 43,695 43,695 43,695 43,695 43,695 43,695 Reddix Center (NVT, NHP) (1993) Square Feet 68,012 68,012 68,012 68,012 68,012 68,012 68,012 68,012 68,012 68,012 Smith Technology Center (2012) Square Feet 39,075 39,075 39,075 39,075 39,075 39,075 39,075 39,075 39,075 39,075 Teicher Student Services (2003) Square Feet 34,407 34,407 34,407 34,407 34,407 34,407 34,407 34,407 34,407 34,407 Northside Support Services Ctr. (2003) Square Feet 105,000 105,000 105,000 105,000 105,000 105,000 105,000 105,000 105,000 105,000 Paul Taylor Field House @ Hardin (1972) Square Feet 28,626 28,626 28,626 28,626 28,626 28,626 28,626 28,626 28,626 28,626 AnneMarie Tennis/ Soccer Ctr. @ Hardin (2001) Square Feet 1,841 1,841 1,841 1,841 1,841 1,841 1,841 1,841 1,841 1,841 Testing Warehouse @ Grissom (2003) Square Feet 9,500 9,500 9,500 9,500 9,500 9,500 9,500 9,500 9,500 9,500 Transportation- North (2004) Square Feet 19,330 19,330 19,330 19,330 19,330 19,330 19,330 19,330 19,330 19,330 Transportation- South (1975) Square Feet 15,105 15,105 15,105 15,105 15,105 15,105 15,105 15,105 15,105 15,105 Transportation- Culebra (2002) Square Feet 14,922 14,922 14,922 14,922 15,052 15,052 15,052 15,052 15,052 15,052 Transportation- McClung (2012) Square Feet 26,427 26,427 26,427 26,427 26,427 26,427 26,427 26,427 26,427 26,427 Transportation- Rhodes (1991) Square Feet 13,598 13,598 13,598 13,598 13,598 13,598 13,598 13,598 13,598 13,598 Stadium @ Farris (2003) Square Feet 22,654 22,654 22,654 22,654 22,654 22,654 22,654 22,654 22,654 22,654 Stadium @ Hardin (1968) Square Feet 26,255 26,255 26,255 26,255 26,255 26,255 26,255 26,255 26,255 26,255
160
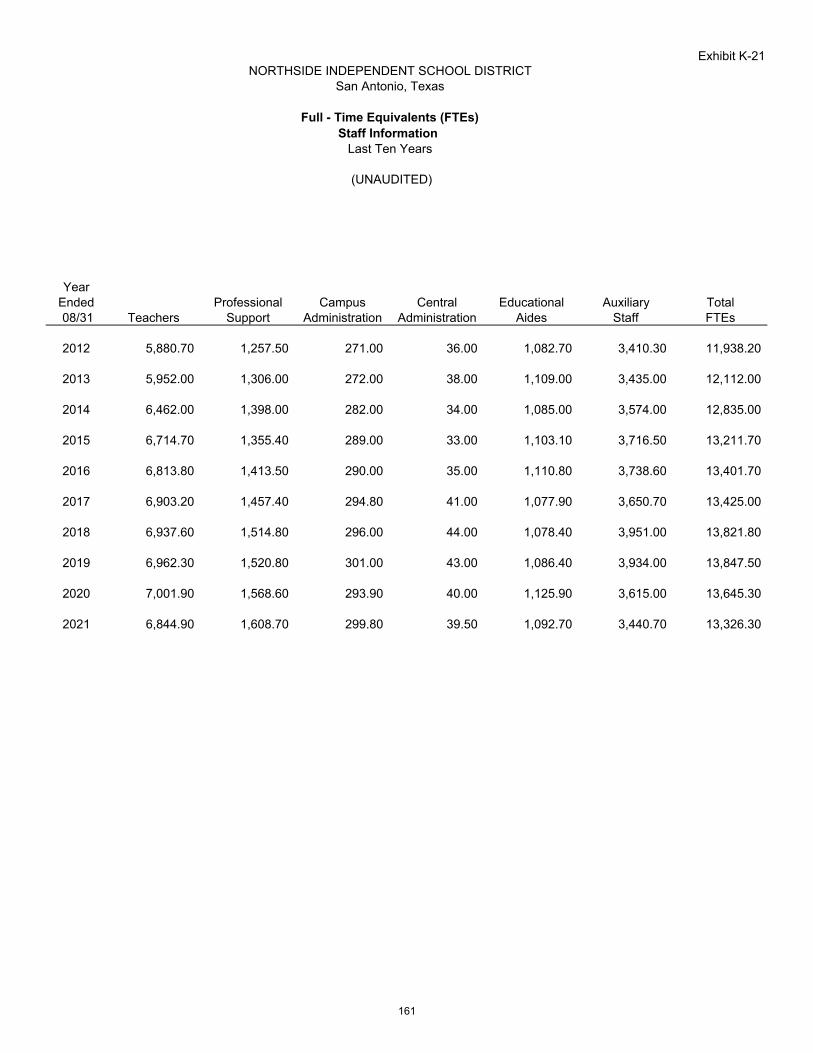
Exhibit K-21
YearEnded Professional Campus Central Educational Auxiliary Total 08/31 Teachers Support Administration Administration Aides Staff FTEs
2012 5,880.70 1,257.50 271.00 36.00 1,082.70 3,410.30 11,938.20
2013 5,952.00 1,306.00 272.00 38.00 1,109.00 3,435.00 12,112.00
2014 6,462.00 1,398.00 282.00 34.00 1,085.00 3,574.00 12,835.00
2015 6,714.70 1,355.40 289.00 33.00 1,103.10 3,716.50 13,211.70
2016 6,813.80 1,413.50 290.00 35.00 1,110.80 3,738.60 13,401.70
2017 6,903.20 1,457.40 294.80 41.00 1,077.90 3,650.70 13,425.00
2018 6,937.60 1,514.80 296.00 44.00 1,078.40 3,951.00 13,821.80
2019 6,962.30 1,520.80 301.00 43.00 1,086.40 3,934.00 13,847.50
2020 7,001.90 1,568.60 293.90 40.00 1,125.90 3,615.00 13,645.30
2021 6,844.90 1,608.70 299.80 39.50 1,092.70 3,440.70 13,326.30
NORTHSIDE INDEPENDENT SCHOOL DISTRICTSan Antonio, Texas
Full - Time Equivalents (FTEs)Staff Information
Last Ten Years
(UNAUDITED)
161

(This page intentionally left blank)
162
FEDERAL AWARDS
SECTION
163

164

Weaver and Tidwell, L.L.P. 9311 San Pedro Avenue, Suite 1400 | San Antonio, Texas 78216
Main: 210.737.1042CPAs AND ADVISORS | WEAVER.COM
Independent Auditor’s Report on Internal Control over
Financial Reporting and on Compliance and Other Matters Based on an Audit of Financial Statements Performed in Accordance with Government Auditing Standards
The Board of Trustees of Northside Independent School District We have audited, in accordance with auditing standards generally accepted in the United States of America and the standards applicable to financial audits contained in Government Auditing Standards issued by the Comptroller General of the United States, the financial statements of the governmental activities, the business-type activities, each major fund, and the aggregate remaining fund information of Northside Independent School District (the District) as of and for the year ended August 31, 2021, and the related notes to the financial statements, which collectively comprise the District’s basic financial statements, and have issued our report thereon dated January 25, 2022. Internal Control over Financial Reporting In planning and performing our audit of the financial statements, we considered the District’s internal control over financial reporting (internal control) to determine the audit procedures that are appropriate in the circumstances for the purpose of expressing our opinions on the financial statements, but not for the purpose of expressing an opinion on the effectiveness of the District’s internal control. Accordingly, we do not express an opinion on the effectiveness of the District’s internal control. A deficiency in internal control exists when the design or operation of a control does not allow management or employees in the normal course of performing their assigned functions, to prevent, or detect and correct misstatements on a timely basis. A material weakness is a deficiency, or a combination of deficiencies, in internal control, such that there is a reasonable possibility that a material misstatement of the entity’s financial statements will not be prevented, or detected and corrected on a timely basis. A significant deficiency is a deficiency, or a combination of deficiencies, in internal control that is less severe than a material weakness, yet important enough to merit attention by those charged with governance. Our consideration of internal control over financial reporting was for the limited purpose described in the first paragraph of this section and was not designed to identify all deficiencies in internal control over financial reporting that might be material weaknesses or significant deficiencies. Given these limitations, during our audit we did not identify any deficiencies in internal control over financial reporting that we consider to be material weaknesses. However, material weaknesses may exist that have not been identified. Compliance and Other Matters As part of obtaining reasonable assurance about whether the District’s financial statements are free from material misstatement, we performed tests of its compliance with certain provisions of laws, regulations, contracts, and grant agreements, noncompliance with which could have a direct and material effect on the determination of financial statement amounts. However, providing an opinion on compliance with those provisions was not an objective of our audit and, accordingly, we do not express such an opinion. The results of our tests disclosed no instances of noncompliance or other matters that are required to be reported under Government Auditing Standards.
165

The Board of Trustees of Northside Independent School District
Purpose of this Report The purpose of this report is solely to describe the scope of our testing of internal control and compliance and the results of that testing, and not to provide an opinion on the effectiveness of the entity’s internal control or on compliance. This report is an integral part of an audit performed in accordance with Government Auditing Standards in considering the entity’s internal control and compliance. Accordingly, this communication is not suitable for any other purpose.
WEAVER AND TIDWELL, L.L.P. San Antonio, Texas January 25, 2022
166
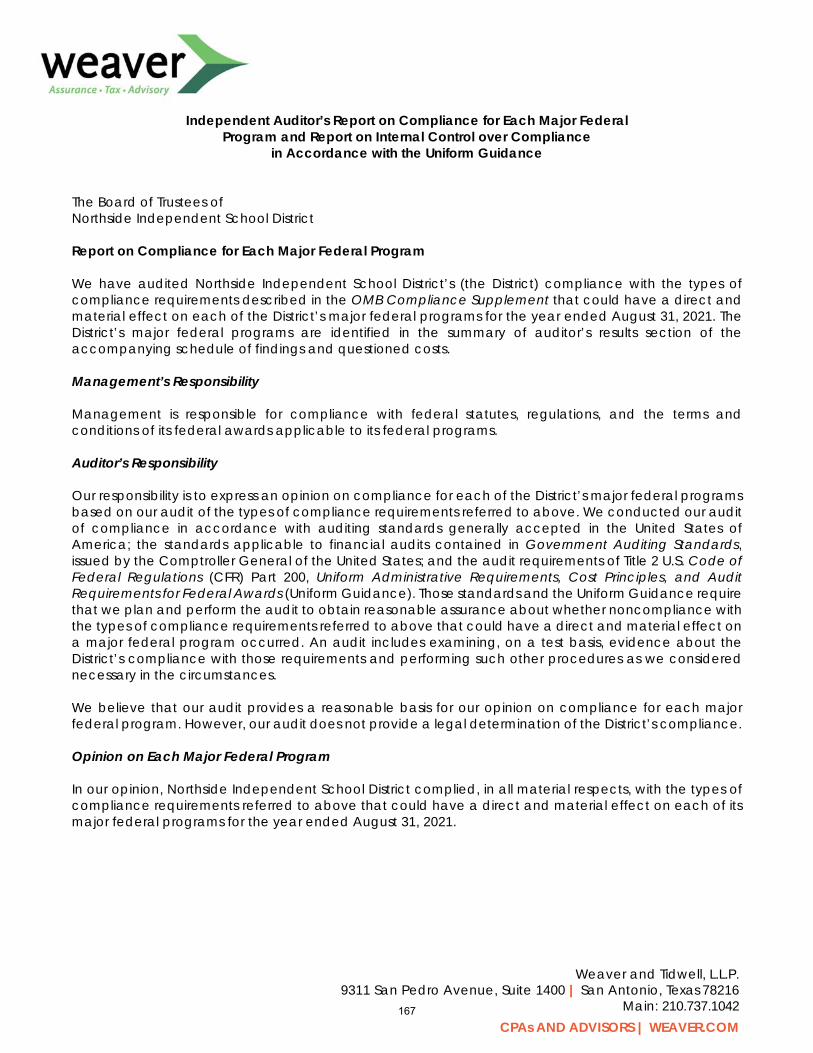
Weaver and Tidwell, L.L.P. 9311 San Pedro Avenue, Suite 1400 | San Antonio, Texas 78216
Main: 210.737.1042CPAs AND ADVISORS | WEAVER.COM
Independent Auditor’s Report on Compliance for Each Major Federal
Program and Report on Internal Control over Compliance in Accordance with the Uniform Guidance
The Board of Trustees of Northside Independent School District Report on Compliance for Each Major Federal Program We have audited Northside Independent School District’s (the District) compliance with the types of compliance requirements described in the OMB Compliance Supplement that could have a direct and material effect on each of the District’s major federal programs for the year ended August 31, 2021. The District’s major federal programs are identified in the summary of auditor’s results section of the accompanying schedule of findings and questioned costs. Management’s Responsibility Management is responsible for compliance with federal statutes, regulations, and the terms and conditions of its federal awards applicable to its federal programs. Auditor’s Responsibility Our responsibility is to express an opinion on compliance for each of the District’s major federal programs based on our audit of the types of compliance requirements referred to above. We conducted our audit of compliance in accordance with auditing standards generally accepted in the United States of America; the standards applicable to financial audits contained in Government Auditing Standards, issued by the Comptroller General of the United States; and the audit requirements of Title 2 U.S. Code of Federal Regulations (CFR) Part 200, Uniform Administrative Requirements, Cost Principles, and Audit Requirements for Federal Awards (Uniform Guidance). Those standards and the Uniform Guidance require that we plan and perform the audit to obtain reasonable assurance about whether noncompliance with the types of compliance requirements referred to above that could have a direct and material effect on a major federal program occurred. An audit includes examining, on a test basis, evidence about the District’s compliance with those requirements and performing such other procedures as we considered necessary in the circumstances. We believe that our audit provides a reasonable basis for our opinion on compliance for each major federal program. However, our audit does not provide a legal determination of the District’s compliance. Opinion on Each Major Federal Program In our opinion, Northside Independent School District complied, in all material respects, with the types of compliance requirements referred to above that could have a direct and material effect on each of its major federal programs for the year ended August 31, 2021.
167

The Board of Trustees of Northside Independent School District
Report on Internal Control over Compliance Management of the District is responsible for establishing and maintaining effective internal control over compliance with the types of compliance requirements referred to above. In planning and performing our audit of compliance, we considered the District’s internal control over compliance with the types of requirements that could have a direct and material effect on each major federal program to determine the auditing procedures that are appropriate in the circumstances for the purpose of expressing an opinion on compliance for each major federal program and to test and report on internal control over compliance in accordance with the Uniform Guidance, but not for the purpose of expressing an opinion on the effectiveness of internal control over compliance. Accordingly, we do not express an opinion on the effectiveness of the District’s internal control over compliance. A deficiency in internal control over compliance exists when the design or operation of a control over compliance does not allow management or employees, in the normal course of performing their assigned functions, to prevent, or detect and correct noncompliance with a type of compliance requirement of a federal program on a timely basis. A material weakness in internal control over compliance is a deficiency, or combination of deficiencies in internal control over compliance, such that there is a reasonable possibility that material noncompliance with a type of compliance requirement of a federal program will not be prevented, or detected and corrected on a timely basis. A significant deficiency in internal control over compliance is a deficiency, or a combination of deficiencies, in internal control over compliance with a type of compliance requirement of a federal program that is less severe than a material weakness in internal control over compliance, yet important enough to merit attention by those charged with governance. Our consideration of internal control over compliance was for the limited purpose described in the first paragraph of this section and was not designed to identify all deficiencies in internal control over compliance that might be material weaknesses or significant deficiencies. We did not identify any deficiencies in internal control over compliance that we consider to be material weaknesses. However, material weaknesses may exist that have not been identified.
The purpose of this report on internal control over compliance is solely to describe the scope of our testing of internal control over compliance and the results of that testing based on the requirements of the Uniform Guidance. Accordingly, this report is not suitable for any other purpose.
WEAVER AND TIDWELL, L.L.P. San Antonio, Texas January 25, 2022
168
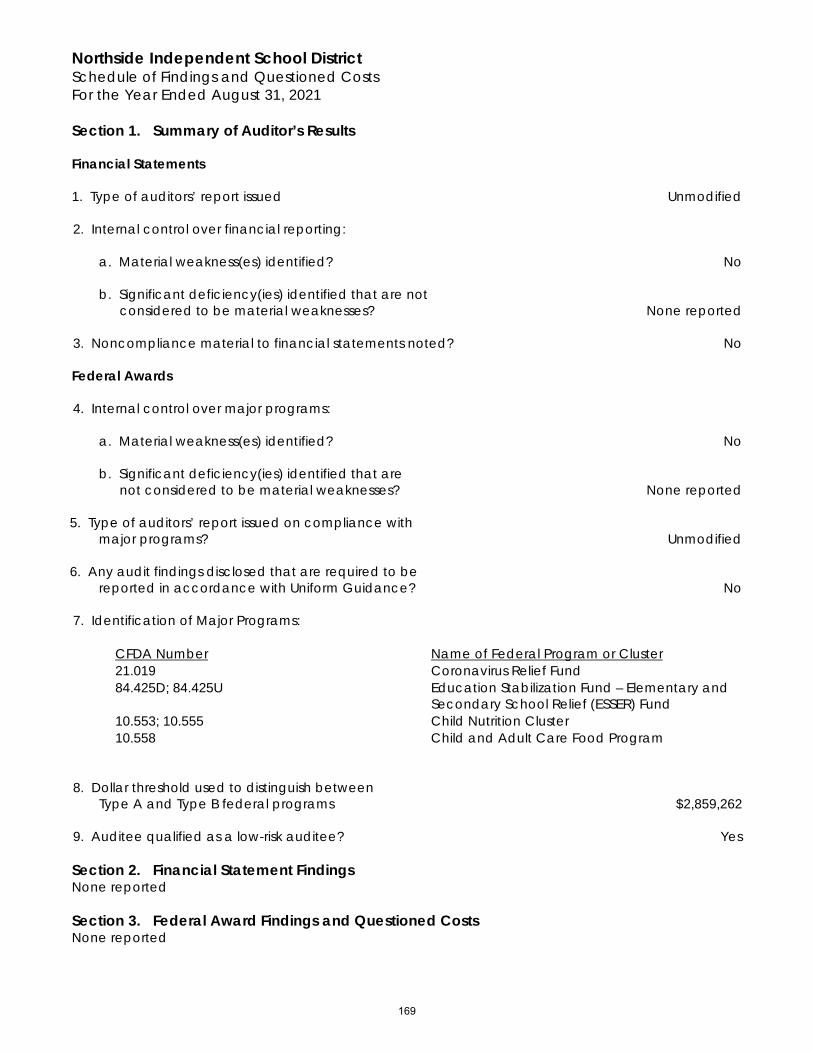
Northside Independent School District Schedule of Findings and Questioned Costs For the Year Ended August 31, 2021
Section 1. Summary of Auditor’s Results Financial Statements 1. Type of auditors’ report issued Unmodified 2. Internal control over financial reporting:
a. Material weakness(es) identified? No
b. Significant deficiency(ies) identified that are not
considered to be material weaknesses? None reported 3. Noncompliance material to financial statements noted? No Federal Awards 4. Internal control over major programs:
a. Material weakness(es) identified? No
b. Significant deficiency(ies) identified that are
not considered to be material weaknesses? None reported
5. Type of auditors’ report issued on compliance with major programs? Unmodified
6. Any audit findings disclosed that are required to be
reported in accordance with Uniform Guidance? No
7. Identification of Major Programs:
CFDA Number Name of Federal Program or Cluster 21.019 Coronavirus Relief Fund 84.425D; 84.425U Education Stabilization Fund – Elementary and
Secondary School Relief (ESSER) Fund 10.553; 10.555 Child Nutrition Cluster 10.558 Child and Adult Care Food Program
8. Dollar threshold used to distinguish between
Type A and Type B federal programs $2,859,262
9. Auditee qualified as a low-risk auditee? Yes
Section 2. Financial Statement Findings None reported Section 3. Federal Award Findings and Questioned Costs None reported
169
Northside Independent School District Summary Schedule of Prior Audit Findings For the Year Ended August 31, 2021
Prior Year Findings None reported
170
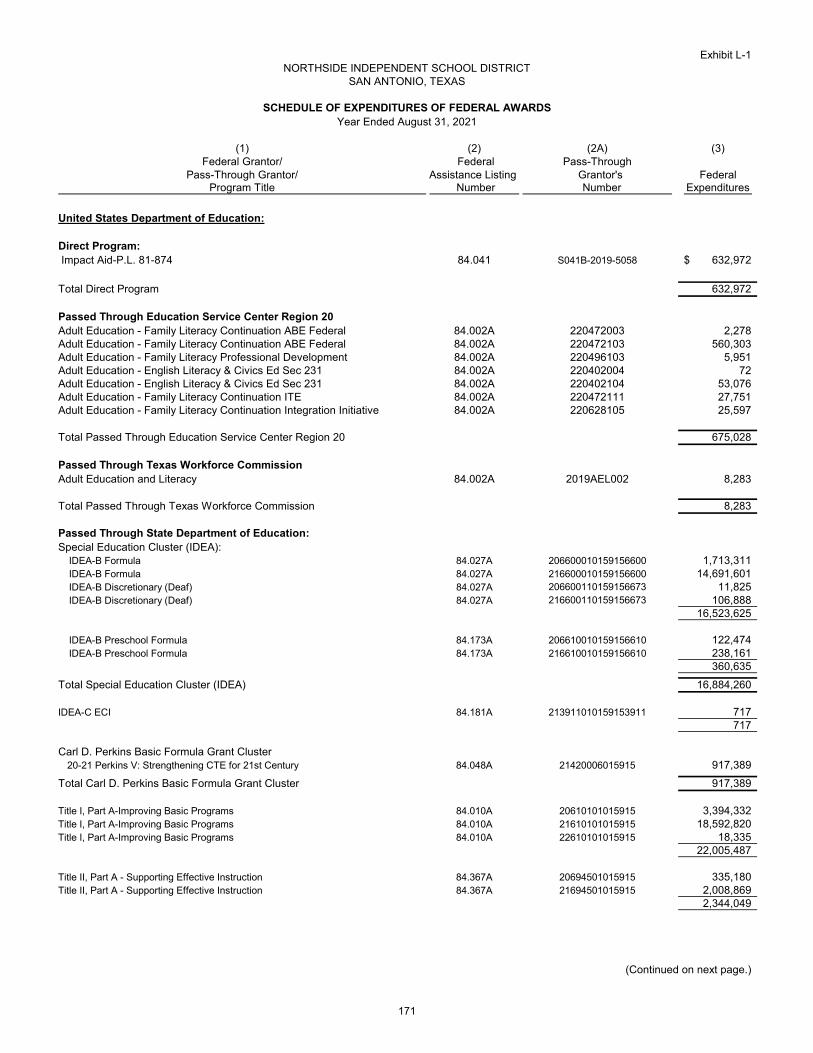
Exhibit L-1NORTHSIDE INDEPENDENT SCHOOL DISTRICT
SAN ANTONIO, TEXAS
SCHEDULE OF EXPENDITURES OF FEDERAL AWARDS
(1) (2) (2A) (3)Federal Grantor/ Federal Pass-Through
Pass-Through Grantor/ Assistance Listing Grantor's FederalProgram Title Number Number Expenditures
United States Department of Education:
Direct Program: Impact Aid-P.L. 81-874 84.041 S041B-2019-5058 632,972$
Total Direct Program 632,972
Passed Through Education Service Center Region 20Adult Education - Family Literacy Continuation ABE Federal 84.002A 220472003 2,278 Adult Education - Family Literacy Continuation ABE Federal 84.002A 220472103 560,303 Adult Education - Family Literacy Professional Development 84.002A 220496103 5,951 Adult Education - English Literacy & Civics Ed Sec 231 84.002A 220402004 72 Adult Education - English Literacy & Civics Ed Sec 231 84.002A 220402104 53,076 Adult Education - Family Literacy Continuation ITE 84.002A 220472111 27,751 Adult Education - Family Literacy Continuation Integration Initiative 84.002A 220628105 25,597
Total Passed Through Education Service Center Region 20 675,028
Passed Through Texas Workforce Commission Adult Education and Literacy 84.002A 2019AEL002 8,283
Total Passed Through Texas Workforce Commission 8,283
Passed Through State Department of Education:Special Education Cluster (IDEA): IDEA-B Formula 84.027A 206600010159156600 1,713,311 IDEA-B Formula 84.027A 216600010159156600 14,691,601 IDEA-B Discretionary (Deaf) 84.027A 206600110159156673 11,825 IDEA-B Discretionary (Deaf) 84.027A 216600110159156673 106,888
16,523,625
IDEA-B Preschool Formula 84.173A 206610010159156610 122,474 IDEA-B Preschool Formula 84.173A 216610010159156610 238,161
360,635
Total Special Education Cluster (IDEA) 16,884,260
IDEA-C ECI 84.181A 213911010159153911 717 717
Carl D. Perkins Basic Formula Grant Cluster20-21 Perkins V: Strengthening CTE for 21st Century 84.048A 21420006015915 917,389
Total Carl D. Perkins Basic Formula Grant Cluster 917,389
Title I, Part A-Improving Basic Programs 84.010A 20610101015915 3,394,332 Title I, Part A-Improving Basic Programs 84.010A 21610101015915 18,592,820 Title I, Part A-Improving Basic Programs 84.010A 22610101015915 18,335
22,005,487
Title II, Part A - Supporting Effective Instruction 84.367A 20694501015915 335,180 Title II, Part A - Supporting Effective Instruction 84.367A 21694501015915 2,008,869
2,344,049
(Continued on next page.)
Year Ended August 31, 2021
171

Exhibit L-1NORTHSIDE INDEPENDENT SCHOOL DISTRICT
SAN ANTONIO, TEXAS
SCHEDULE OF EXPENDITURES OF FEDERAL AWARDS -Continued
(1) (2) (2A) (3)Federal Grantor/ Federal Pass-Through
Pass-Through Grantor/ Assistance Listing Grantor's FederalProgram Title Number Number Expenditures
Title III, English Language Acquisition- ELA 84.365A 20671001015915 336,397 Title III, English Language Acquisition- ELA 84.365A 21671001015915 470,626 Title III, English Language Acquisition-Immigrant 84.365A 20671003015915 350,541 Title III, English Language Acquisition-Immigrant 84.365A 21671003015915 430,091
1,587,655
Title IV, Part A, SSAEP 84.424A 20680101015915 486,932 Title IV, Part A, SSAEP 84.424A 21680101015915 540,527
1,027,459
21ST Century Community Learning Centers - Cycle 9, Year 4 84.287C 206950247110018 159,803 Nita M. Lowey 21st CCLC Cycle 9 Year 5 84.287C 216950247110018 1,037,429 Nita M. Lowey 21st CCLC Cycle 11 Year 1 84.287C 226950247110029 3,891
1,201,123
COVID-19:Elementary and Secondary School Emergency Relief Fund (ESSER) 84.425D 20521001015915 629,270 COVID-19:ARP Elementary and Secondary School Emergency Relief ( ESSER III) 84.425U 21528001015915 3,991 COVID-19:Elementary and Secondary School Emergency Relief (PPRP) 84.425D 52102135 6,269,972
6,903,233
Texas Education for Homeless Children & Youth 84.196A 214600057110052 156,887
Texas Hurricane Homeless Youth 84.938B 19513701015915 (1,362)
Instructional Continuity 84.377A 17610740015915 165,000
Educator Assessments 84.367A 69451971 13,539
Total Passed Through State Department of Education 53,205,436
Total United States Department of Education 54,521,719
United States Department of TreasuryPassed Through Bexar CountyCOVID-19: Coronavirus Relief Fund (CRF) County Match 21.019 CA2014511003 300,000
Passed Through Region 4 Education Service CenterCOVID-19: Coronavirus Relief Fund (CRF) 21.019 52202002 4,202,258
(Continued on next page.)
Year Ended August 31, 2021
172
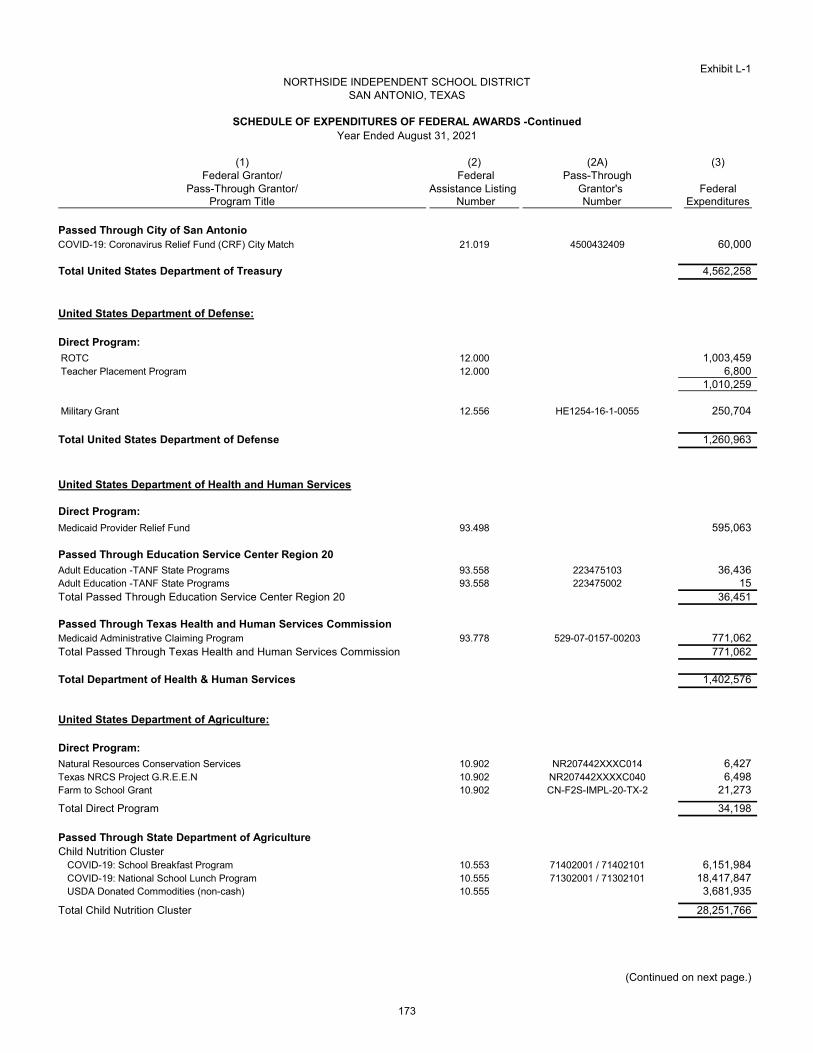
Exhibit L-1NORTHSIDE INDEPENDENT SCHOOL DISTRICT
SAN ANTONIO, TEXAS
SCHEDULE OF EXPENDITURES OF FEDERAL AWARDS -ContinuedYear Ended August 31, 2021
(1) (2) (2A) (3)Federal Grantor/ Federal Pass-Through
Pass-Through Grantor/ Assistance Listing Grantor's FederalProgram Title Number Number Expenditures
Passed Through City of San AntonioCOVID-19: Coronavirus Relief Fund (CRF) City Match 21.019 4500432409 60,000
Total United States Department of Treasury 4,562,258
United States Department of Defense:
Direct Program:
ROTC 12.000 1,003,459 Teacher Placement Program 12.000 6,800
1,010,259
Military Grant 12.556 HE1254-16-1-0055 250,704
Total United States Department of Defense 1,260,963
United States Department of Health and Human Services
Direct Program:
Medicaid Provider Relief Fund 93.498 595,063
Passed Through Education Service Center Region 20
Adult Education -TANF State Programs 93.558 223475103 36,436 Adult Education -TANF State Programs 93.558 223475002 15 Total Passed Through Education Service Center Region 20 36,451
Passed Through Texas Health and Human Services CommissionMedicaid Administrative Claiming Program 93.778 529-07-0157-00203 771,062 Total Passed Through Texas Health and Human Services Commission 771,062
Total Department of Health & Human Services 1,402,576
United States Department of Agriculture:
Direct Program:
Natural Resources Conservation Services 10.902 NR207442XXXC014 6,427 Texas NRCS Project G.R.E.E.N 10.902 NR207442XXXXC040 6,498 Farm to School Grant 10.902 CN-F2S-IMPL-20-TX-2 21,273
Total Direct Program 34,198
Passed Through State Department of AgricultureChild Nutrition Cluster
COVID-19: School Breakfast Program 10.553 71402001 / 71402101 6,151,984 COVID-19: National School Lunch Program 10.555 71302001 / 71302101 18,417,847 USDA Donated Commodities (non-cash) 10.555 3,681,935
Total Child Nutrition Cluster 28,251,766
(Continued on next page.)
173
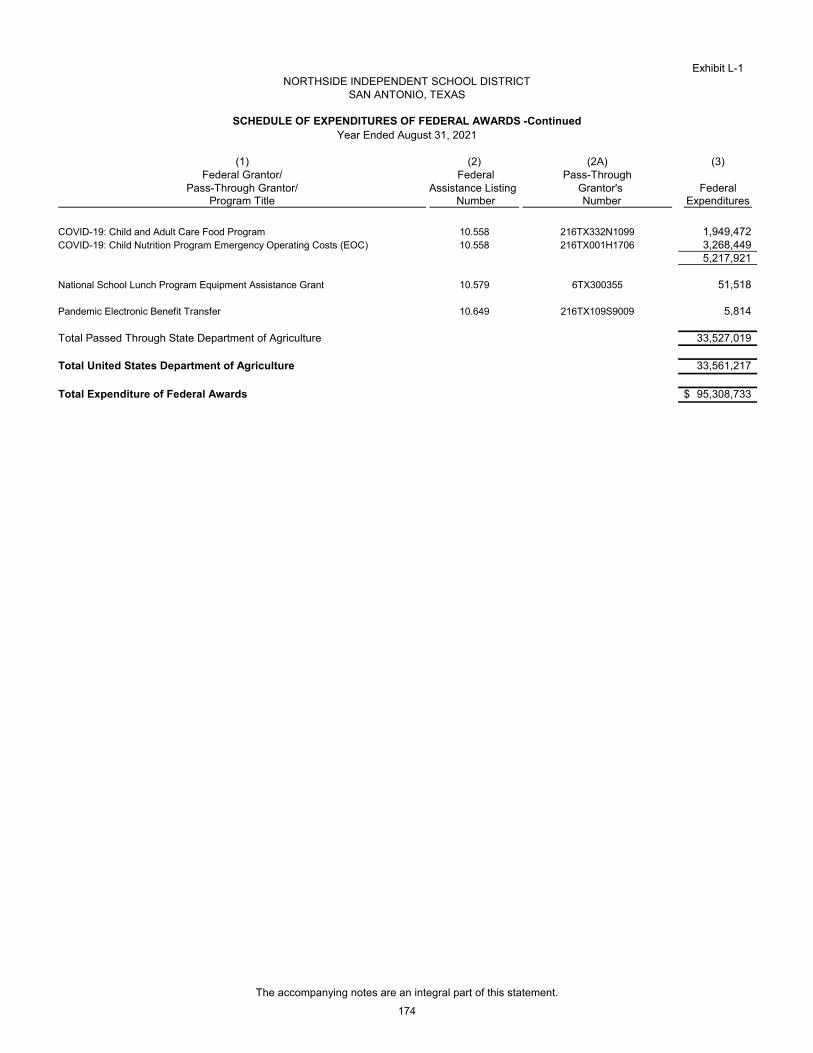
Exhibit L-1
SAN ANTONIO, TEXAS
SCHEDULE OF EXPENDITURES OF FEDERAL AWARDS -ContinuedYear Ended August 31, 2021
(1) (2) (2A) (3)Federal Grantor/ Federal Pass-Through
Pass-Through Grantor/ Assistance Listing Grantor's FederalProgram Title Number Number Expenditures
COVID-19: Child and Adult Care Food Program 10.558 216TX332N1099 1,949,472 COVID-19: Child Nutrition Program Emergency Operating Costs (EOC) 10.558 216TX001H1706 3,268,449
5,217,921
National School Lunch Program Equipment Assistance Grant 10.579 6TX300355 51,518
Pandemic Electronic Benefit Transfer 10.649 216TX109S9009 5,814
Total Passed Through State Department of Agriculture 33,527,019
Total United States Department of Agriculture 33,561,217
Total Expenditure of Federal Awards 95,308,733$
NORTHSIDE INDEPENDENT SCHOOL DISTRICT
The accompanying notes are an integral part of this statement.
174
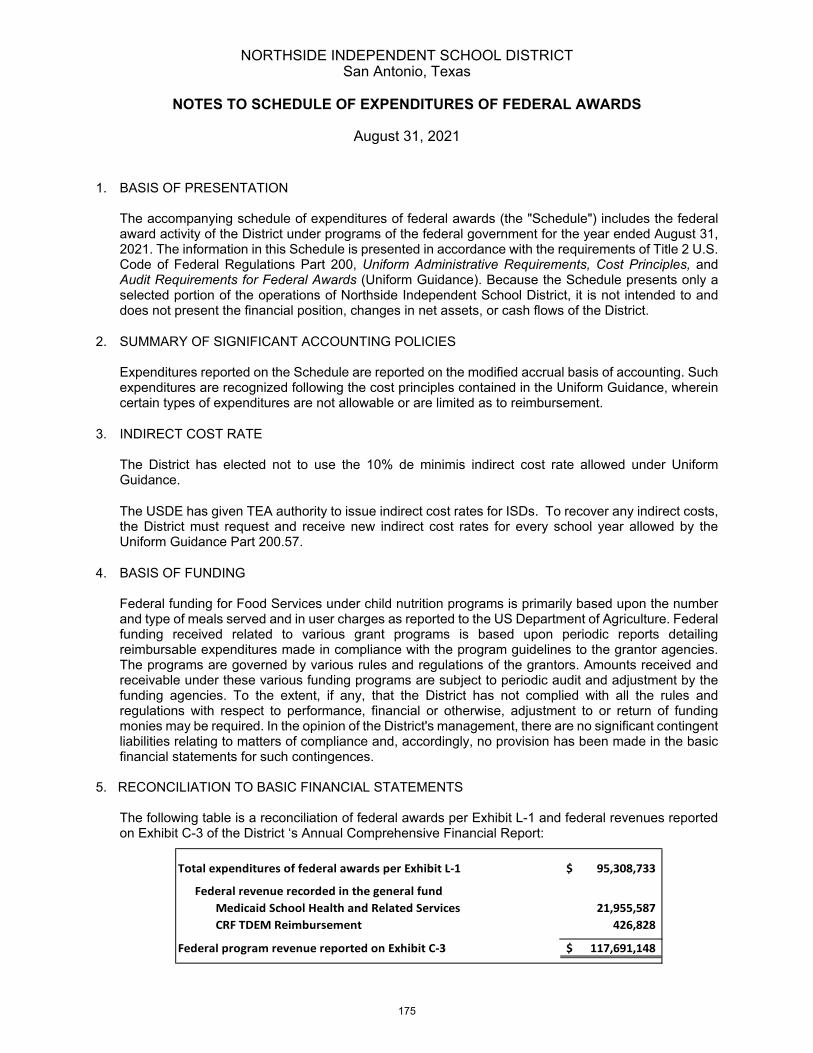
NORTHSIDE INDEPENDENT SCHOOL DISTRICT San Antonio, Texas
NOTES TO SCHEDULE OF EXPENDITURES OF FEDERAL AWARDS
August 31, 2021
1. BASIS OF PRESENTATION
The accompanying schedule of expenditures of federal awards (the "Schedule") includes the federalaward activity of the District under programs of the federal government for the year ended August 31,2021. The information in this Schedule is presented in accordance with the requirements of Title 2 U.S.Code of Federal Regulations Part 200, Uniform Administrative Requirements, Cost Principles, andAudit Requirements for Federal Awards (Uniform Guidance). Because the Schedule presents only aselected portion of the operations of Northside Independent School District, it is not intended to anddoes not present the financial position, changes in net assets, or cash flows of the District.
2. SUMMARY OF SIGNIFICANT ACCOUNTING POLICIES
Expenditures reported on the Schedule are reported on the modified accrual basis of accounting. Suchexpenditures are recognized following the cost principles contained in the Uniform Guidance, whereincertain types of expenditures are not allowable or are limited as to reimbursement.
3. INDIRECT COST RATE
The District has elected not to use the 10% de minimis indirect cost rate allowed under UniformGuidance.
The USDE has given TEA authority to issue indirect cost rates for ISDs. To recover any indirect costs,the District must request and receive new indirect cost rates for every school year allowed by theUniform Guidance Part 200.57.
4. BASIS OF FUNDING
Federal funding for Food Services under child nutrition programs is primarily based upon the numberand type of meals served and in user charges as reported to the US Department of Agriculture. Federalfunding received related to various grant programs is based upon periodic reports detailingreimbursable expenditures made in compliance with the program guidelines to the grantor agencies.The programs are governed by various rules and regulations of the grantors. Amounts received andreceivable under these various funding programs are subject to periodic audit and adjustment by thefunding agencies. To the extent, if any, that the District has not complied with all the rules andregulations with respect to performance, financial or otherwise, adjustment to or return of fundingmonies may be required. In the opinion of the District's management, there are no significant contingentliabilities relating to matters of compliance and, accordingly, no provision has been made in the basicfinancial statements for such contingences.
5. RECONCILIATION TO BASIC FINANCIAL STATEMENTS
The following table is a reconciliation of federal awards per Exhibit L-1 and federal revenues reportedon Exhibit C-3 of the District ‘s Annual Comprehensive Financial Report:
Total expenditures of federal awards per Exhibit L-1 95,308,733$
Federal revenue recorded in the general fundMedicaid School Health and Related Services 21,955,587 CRF TDEM Reimbursement 426,828
Federal program revenue reported on Exhibit C-3 117,691,148$
175
Related Documents


