Financial Report 1Q22

Welcome message from author
This document is posted to help you gain knowledge. Please leave a comment to let me know what you think about it! Share it to your friends and learn new things together.
Transcript
Financial Report 1Q22

Key metrics in / end of % change
1Q22 4Q21 1Q21 QoQ YoY
Credit Suisse (CHF million)
Net revenues 4,412 4,582 7,574 (4) (42)
Provision for credit losses (110) (20) 4,394 450 –
Total operating expenses 4,950 6,266 3,937 (21) 26
Loss before taxes (428) (1,664) (757) (74) (43)
Loss attributable to shareholders (273) (2,085) (252) (87) 8
Cost/income ratio (%) 112.2 136.8 52.0 – –
Effective tax rate (%) 35.3 (25.0) 69.5 – –
Basic loss per share (CHF) (0.10) (0.83) (0.10) (88) 0
Diluted loss per share (CHF) (0.10) (0.83) (0.10) (88) 0
Return on equity (%) (2.4) (18.7) (2.3) – –
Return on tangible equity (%) (2.6) (20.9) (2.6) – –
Assets under management and net new assets (CHF billion)
Assets under management 1,554.9 1,614.0 1,596.0 (3.7) (2.6)
Net new assets 7.9 1.6 28.4 393.8 (72.2)
Balance sheet statistics (CHF million)
Total assets 739,554 755,833 865,576 (2) (15)
Net loans 287,682 291,686 304,188 (1) (5)
Total shareholders’ equity 44,442 43,954 44,590 1 0
Tangible shareholders’ equity 41,204 40,761 39,707 1 4
Basel III regulatory capital and leverage statistics (%)
CET1 ratio 13.8 14.4 12.2 – –
CET1 leverage ratio 4.3 4.3 3.8 – –
Tier 1 leverage ratio 6.1 6.1 5.4 – –
Share information
Shares outstanding (million) 2,556.1 2,569.7 2,364.0 (1) 8
of which common shares issued 2,650.7 2,650.7 2,447.7 0 8
of which treasury shares (94.6) (81.0) (83.7) 17 13
Book value per share (CHF) 17.39 17.10 18.86 2 (8)
Tangible book value per share (CHF) 16.12 15.86 16.80 2 (4)
Market capitalization (CHF million) 19,272 23,295 24,009 (17) (20)
Number of employees (full-time equivalents)
Number of employees 51,030 50,390 49,520 1 3
See relevant tables and related narratives for additional information on these metrics.
1
Financial Report 1Q22
3 Credit Suisse results
37 Treasury, risk, balance sheet and off-balance sheet
63 Condensed consolidated financial statements – unaudited
140 List of abbreviations141 Investor information142 Financial calendar and contacts143 Cautionary statement regarding
forward-looking information
For purposes of this report, unless the context otherwise requires, the terms “Credit Suisse Group, “Credit Suisse,” the “Group,” “we,” “us” and “our” mean Credit Suisse Group AG and its consolidated subsidiaries. The business of Credit Suisse AG, the direct bank subsidiary of the Group, is substantially similar to the Group, and we use these terms to refer to both when the subject is the same or substantially similar. We use the term the “Bank” when we are only refer-ring to Credit Suisse AG and its consolidated subsidiaries. We use the term the “Bank parent company” when we are referring only to the standalone parent entity Credit Suisse AG. Abbreviations are explained in the List of abbreviations in the back of this report. Publications referenced in this report, whether via website links or otherwise, are not incorporated into this report. In various tables, use of “–” indicates not meaningful or not applicable.
2 Credit Suisse at a glance
Credit Suisse at a glance
Wealth Management The Wealth Management division offers comprehensive wealth management and investment solutions and tailored financing and advisory services to ultra-high-net-worth (UHNW) and high-net-worth (HNW) individuals and external asset managers. Our wealth management business is among the industry’s leaders in our target markets. We serve our clients along a client-centric and needs-based delivery model, utilizing the broad spectrum of Credit Suisse’s global capabilities, including those offered by the Investment Bank and Asset Management. We serve our clients through coverage areas addressing the geographies of Switzer-land, EMEA, Asia Pacific and Latin America.
Investment Bank The Investment Bank division offers a broad range of financial products and services focused on client-driven businesses and also supports Credit Suisse’s Wealth Management division and its clients. Our suite of products and services includes global secu-rities sales, trading and execution, capital raising and advisory services. Our clients include financial institutions, corporations, governments, sovereigns, UHNW and institutional investors, such as pension funds and hedge funds, financial sponsors and private individuals around the world. We deliver our investment banking capabilities globally through regional and local teams based in both major developed and emerging market centers. Our inte-grated business model enables us to deliver high value, custom-ized solutions that leverage the expertise offered across Credit Suisse and that help our clients unlock capital and value in order to achieve their strategic goals.
Swiss BankThe Swiss Bank division offers comprehensive advice and a wide range of financial solutions to private, corporate and institutional clients primarily domiciled in our home market of Switzerland. Our private clients business has a leading franchise in Switzerland, including HNW, affluent, retail and small business clients. In addi-tion, we provide consumer finance services through our subsid-iary BANK-now and the leading credit card brands through our investment in Swisscard AECS GmbH. Our corporate and insti-tutional clients business serves large corporate clients, small and medium-sized enterprises (SMEs), institutional clients, financial institutions and commodity traders.
Asset ManagementThe Asset Management division offers investment solutions and services globally to a broad range of clients, including pension funds, governments, foundations and endowments, corporations and individuals, with a strong presence in our Swiss home mar-ket. Backed by the Group’s global presence, Asset Management offers active and passive solutions in traditional investments as well as alternative investments. We apply environmental, social and governance (ESG) criteria at various points in the investment process with an active sustainability offering, which invests in line with the Credit Suisse Sustainable Investment Framework, and passive ESG index and exchange traded funds.
Credit SuisseOur strategy builds on Credit Suisse’s core strengths: its position as a global leader in Wealth Management, a global Investment Bank focused on advice and solutions, a leading universal bank in Switzerland and multi-specialist Asset Manager. We seek to follow a bal-anced approach with our wealth management activities, aiming to capitalize on both the large pool of wealth within mature markets as well as the significant growth in wealth in Asia Pacific and other emerging markets. Founded in 1856, we today have a global reach with operations in about 40 countries and 51,030 employees from over 150 different nations. Our broad footprint can help us to gen-erate a more geographically balanced stream of revenues and net new assets and allows us to capture growth opportunities around the world. We serve our clients through four divisions – Wealth Management, Investment Bank, Swiss Bank and Asset Management – and four geographic regions – Switzerland, Europe, Middle East and Africa (EMEA), Asia Pacific and Americas.
3
Operating environment 4
Credit Suisse 6
Wealth Management 16
Investment Bank 20
Swiss Bank 24
Asset Management 28
Corporate Center 31
Assets under management 34
I – Credit Suisse results
4 Operating environment
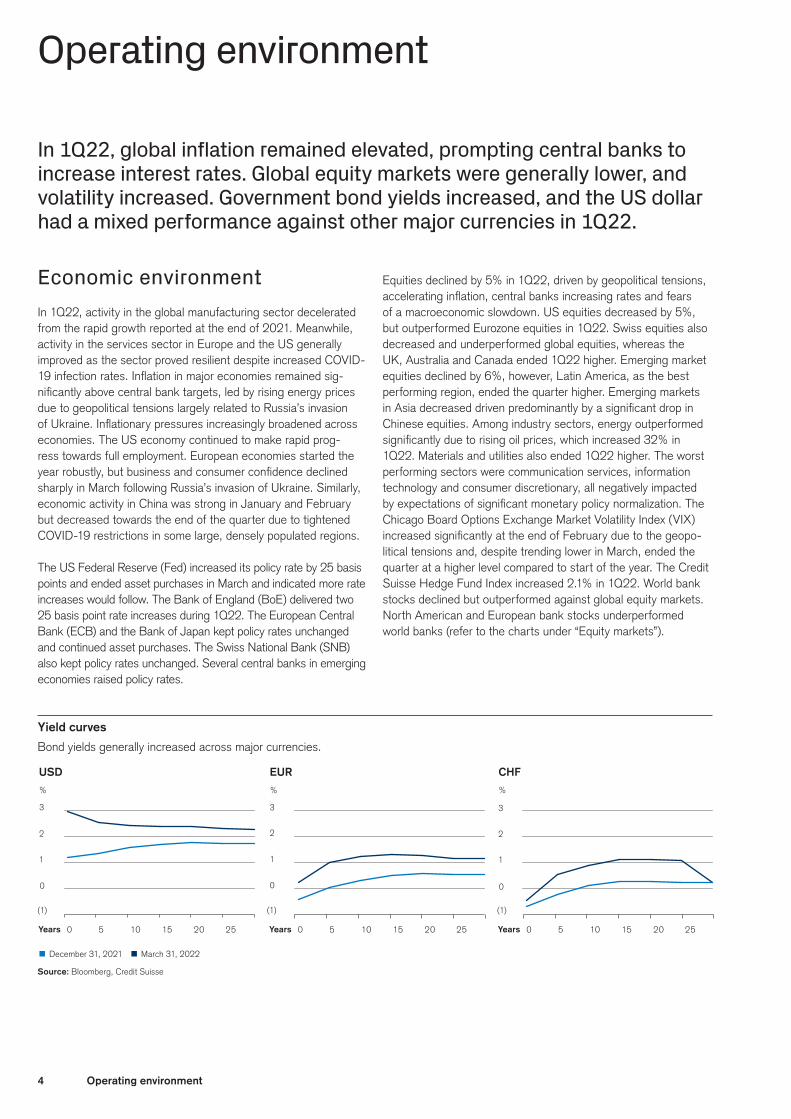
Yield curves
Bond yields generally increased across major currencies.
%
USD
0 5 10 15 20 25
0
1
2
3
Years
(1)
%
EUR
0 5 10 15 20 25Years
%
CHF
0 5 10 15 20 25
0
1
2
3
Years
0
1
2
3
(1) (1)
p December 31, 2021 p March 31, 2022
Source: Bloomberg, Credit Suisse
Operating environment
In 1Q22, global inflation remained elevated, prompting central banks to increase interest rates. Global equity markets were generally lower, and volatility increased. Government bond yields increased, and the US dollar had a mixed performance against other major currencies in 1Q22.
Economic environmentIn 1Q22, activity in the global manufacturing sector decelerated from the rapid growth reported at the end of 2021. Meanwhile, activity in the services sector in Europe and the US generally improved as the sector proved resilient despite increased COVID-19 infection rates. Inflation in major economies remained sig-nificantly above central bank targets, led by rising energy prices due to geopolitical tensions largely related to Russia’s invasion of Ukraine. Inflationary pressures increasingly broadened across economies. The US economy continued to make rapid prog-ress towards full employment. European economies started the year robustly, but business and consumer confidence declined sharply in March following Russia’s invasion of Ukraine. Similarly, economic activity in China was strong in January and February but decreased towards the end of the quarter due to tightened COVID-19 restrictions in some large, densely populated regions.
The US Federal Reserve (Fed) increased its policy rate by 25 basis points and ended asset purchases in March and indicated more rate increases would follow. The Bank of England (BoE) delivered two 25 basis point rate increases during 1Q22. The European Central Bank (ECB) and the Bank of Japan kept policy rates unchanged and continued asset purchases. The Swiss National Bank (SNB) also kept policy rates unchanged. Several central banks in emerging economies raised policy rates.
Equities declined by 5% in 1Q22, driven by geopolitical tensions, accelerating inflation, central banks increasing rates and fears of a macroeconomic slowdown. US equities decreased by 5%, but outperformed Eurozone equities in 1Q22. Swiss equities also decreased and underperformed global equities, whereas the UK, Australia and Canada ended 1Q22 higher. Emerging market equities declined by 6%, however, Latin America, as the best performing region, ended the quarter higher. Emerging markets in Asia decreased driven predominantly by a significant drop in Chinese equities. Among industry sectors, energy outperformed significantly due to rising oil prices, which increased 32% in 1Q22. Materials and utilities also ended 1Q22 higher. The worst performing sectors were communication services, information technology and consumer discretionary, all negatively impacted by expectations of significant monetary policy normalization. The Chicago Board Options Exchange Market Volatility Index (VIX) increased significantly at the end of February due to the geopo-litical tensions and, despite trending lower in March, ended the quarter at a higher level compared to start of the year. The Credit Suisse Hedge Fund Index increased 2.1% in 1Q22. World bank stocks declined but outperformed against global equity markets. North American and European bank stocks underperformed world banks (refer to the charts under “Equity markets”).
5Operating environment
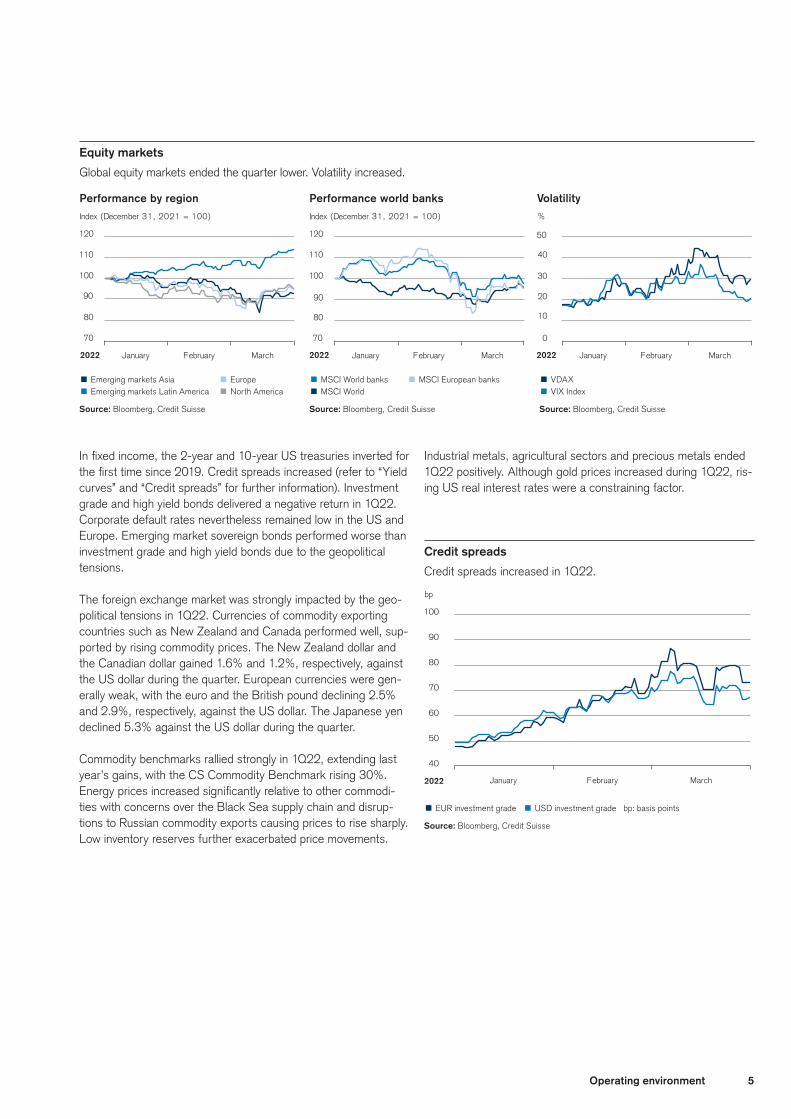
Equity markets
Global equity markets ended the quarter lower. Volatility increased.
p Emerging markets Asia p Europe p MSCI World banks p MSCI European banks p VDAX
p Emerging markets Latin America p North America p MSCI World p VIX Index
Source: Bloomberg, Credit Suisse Source: Bloomberg, Credit Suisse Source: Bloomberg, Credit Suisse
Index (December 31, 2021 = 100)
Performance by region
January February March January February March January February March2022
Index (December 31, 2021 = 100)
Performance world banks
2022 2022
%
Volatility
70
80
90
100
110
120
70
80
90
100
110
120
0
10
20
30
40
50
Credit spreads
Credit spreads increased in 1Q22.
p EUR investment grade p USD investment grade bp: basis points
Source: Bloomberg, Credit Suisse
January February March
bp
40
50
60
70
80
90
100
2022
In fixed income, the 2-year and 10-year US treasuries inverted for the first time since 2019. Credit spreads increased (refer to “Yield curves” and “Credit spreads” for further information). Investment grade and high yield bonds delivered a negative return in 1Q22. Corporate default rates nevertheless remained low in the US and Europe. Emerging market sovereign bonds performed worse than investment grade and high yield bonds due to the geopolitical tensions.
The foreign exchange market was strongly impacted by the geo-political tensions in 1Q22. Currencies of commodity exporting countries such as New Zealand and Canada performed well, sup-ported by rising commodity prices. The New Zealand dollar and the Canadian dollar gained 1.6% and 1.2%, respectively, against the US dollar during the quarter. European currencies were gen-erally weak, with the euro and the British pound declining 2.5% and 2.9%, respectively, against the US dollar. The Japanese yen declined 5.3% against the US dollar during the quarter.
Commodity benchmarks rallied strongly in 1Q22, extending last year’s gains, with the CS Commodity Benchmark rising 30%. Energy prices increased significantly relative to other commodi-ties with concerns over the Black Sea supply chain and disrup-tions to Russian commodity exports causing prices to rise sharply. Low inventory reserves further exacerbated price movements.
Industrial metals, agricultural sectors and precious metals ended 1Q22 positively. Although gold prices increased during 1Q22, ris-ing US real interest rates were a constraining factor.
6 Credit Suisse
Credit Suisse
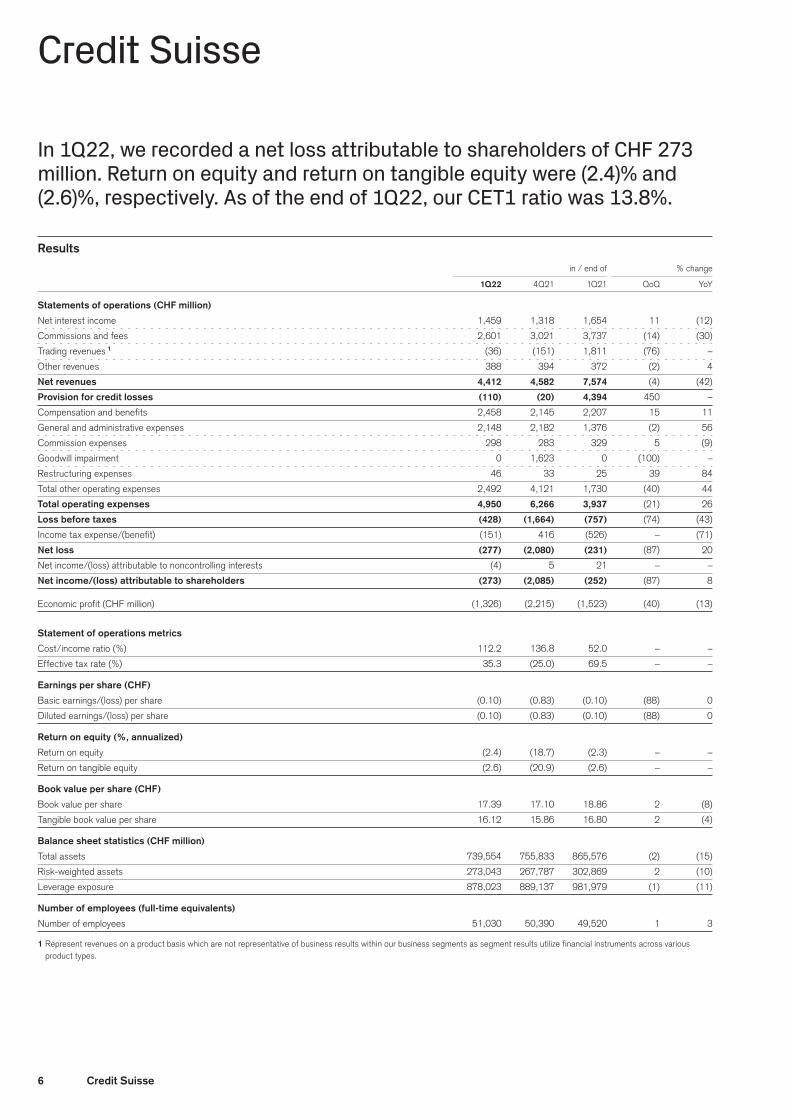
In 1Q22, we recorded a net loss attributable to shareholders of CHF 273 million. Return on equity and return on tangible equity were (2.4)% and (2.6)%, respectively. As of the end of 1Q22, our CET1 ratio was 13.8%.
Results in / end of % change
1Q22 4Q21 1Q21 QoQ YoY
Statements of operations (CHF million)
Net interest income 1,459 1,318 1,654 11 (12)
Commissions and fees 2,601 3,021 3,737 (14) (30)
Trading revenues 1 (36) (151) 1,811 (76) –
Other revenues 388 394 372 (2) 4
Net revenues 4,412 4,582 7,574 (4) (42)
Provision for credit losses (110) (20) 4,394 450 –
Compensation and benefits 2,458 2,145 2,207 15 11
General and administrative expenses 2,148 2,182 1,376 (2) 56
Commission expenses 298 283 329 5 (9)
Goodwill impairment 0 1,623 0 (100) –
Restructuring expenses 46 33 25 39 84
Total other operating expenses 2,492 4,121 1,730 (40) 44
Total operating expenses 4,950 6,266 3,937 (21) 26
Loss before taxes (428) (1,664) (757) (74) (43)
Income tax expense/(benefit) (151) 416 (526) – (71)
Net loss (277) (2,080) (231) (87) 20
Net income/(loss) attributable to noncontrolling interests (4) 5 21 – –
Net income/(loss) attributable to shareholders (273) (2,085) (252) (87) 8
Economic profit (CHF million) (1,326) (2,215) (1,523) (40) (13)
Statement of operations metrics
Cost/income ratio (%) 112.2 136.8 52.0 – –
Effective tax rate (%) 35.3 (25.0) 69.5 – –
Earnings per share (CHF)
Basic earnings/(loss) per share (0.10) (0.83) (0.10) (88) 0
Diluted earnings/(loss) per share (0.10) (0.83) (0.10) (88) 0
Return on equity (%, annualized)
Return on equity (2.4) (18.7) (2.3) – –
Return on tangible equity (2.6) (20.9) (2.6) – –
Book value per share (CHF)
Book value per share 17.39 17.10 18.86 2 (8)
Tangible book value per share 16.12 15.86 16.80 2 (4)
Balance sheet statistics (CHF million)
Total assets 739,554 755,833 865,576 (2) (15)
Risk-weighted assets 273,043 267,787 302,869 2 (10)
Leverage exposure 878,023 889,137 981,979 (1) (11)
Number of employees (full-time equivalents)
Number of employees 51,030 50,390 49,520 1 3
1 Represent revenues on a product basis which are not representative of business results within our business segments as segment results utilize financial instruments across various product types.
7Credit Suisse
Credit Suisse
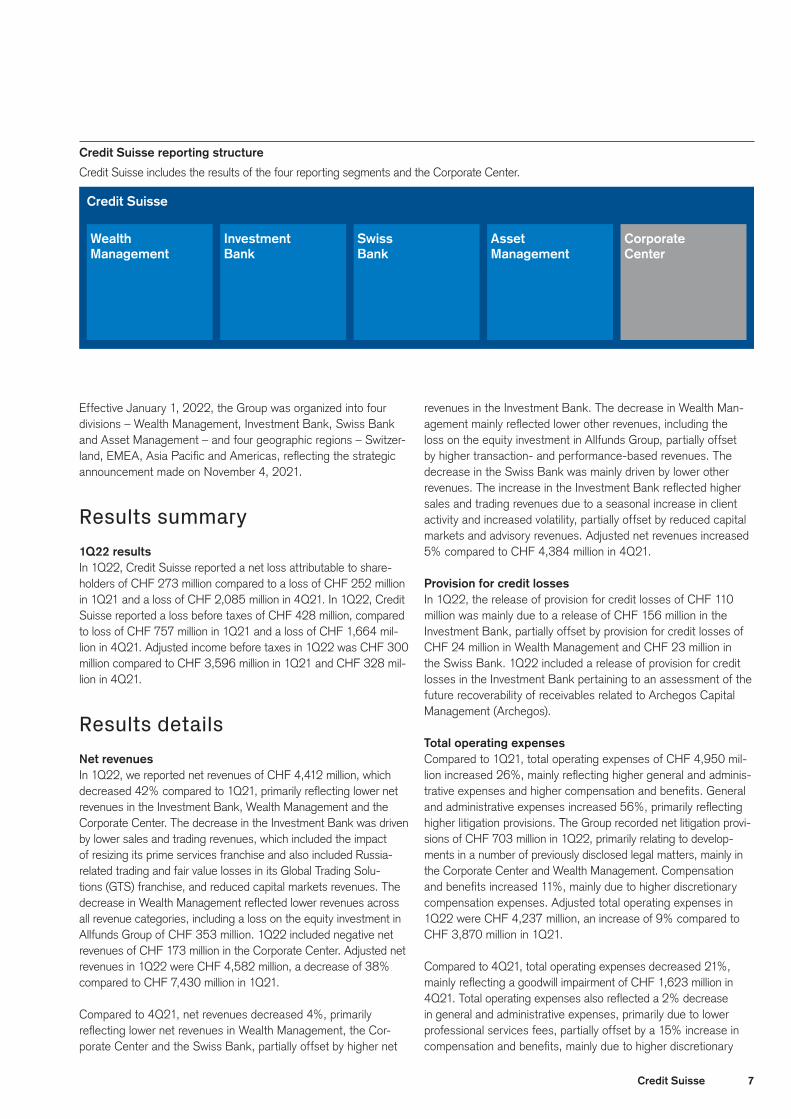
Credit Suisse reporting structure
Credit Suisse includes the results of the four reporting segments and the Corporate Center.
Wealth Management
Investment Bank
Swiss Bank
Asset Management
Corporate Center
Effective January 1, 2022, the Group was organized into four divisions – Wealth Management, Investment Bank, Swiss Bank and Asset Management – and four geographic regions – Switzer-land, EMEA, Asia Pacific and Americas, reflecting the strategic announcement made on November 4, 2021.
Results summary1Q22 resultsIn 1Q22, Credit Suisse reported a net loss attributable to share-holders of CHF 273 million compared to a loss of CHF 252 million in 1Q21 and a loss of CHF 2,085 million in 4Q21. In 1Q22, Credit Suisse reported a loss before taxes of CHF 428 million, compared to loss of CHF 757 million in 1Q21 and a loss of CHF 1,664 mil-lion in 4Q21. Adjusted income before taxes in 1Q22 was CHF 300 million compared to CHF 3,596 million in 1Q21 and CHF 328 mil-lion in 4Q21.
Results detailsNet revenuesIn 1Q22, we reported net revenues of CHF 4,412 million, which decreased 42% compared to 1Q21, primarily reflecting lower net revenues in the Investment Bank, Wealth Management and the Corporate Center. The decrease in the Investment Bank was driven by lower sales and trading revenues, which included the impact of resizing its prime services franchise and also included Russia-related trading and fair value losses in its Global Trading Solu-tions (GTS) franchise, and reduced capital markets revenues. The decrease in Wealth Management reflected lower revenues across all revenue categories, including a loss on the equity investment in Allfunds Group of CHF 353 million. 1Q22 included negative net revenues of CHF 173 million in the Corporate Center. Adjusted net revenues in 1Q22 were CHF 4,582 million, a decrease of 38% compared to CHF 7,430 million in 1Q21.
Compared to 4Q21, net revenues decreased 4%, primarily reflecting lower net revenues in Wealth Management, the Cor-porate Center and the Swiss Bank, partially offset by higher net
revenues in the Investment Bank. The decrease in Wealth Man-agement mainly reflected lower other revenues, including the loss on the equity investment in Allfunds Group, partially offset by higher transaction- and performance-based revenues. The decrease in the Swiss Bank was mainly driven by lower other revenues. The increase in the Investment Bank reflected higher sales and trading revenues due to a seasonal increase in client activity and increased volatility, partially offset by reduced capital markets and advisory revenues. Adjusted net revenues increased 5% compared to CHF 4,384 million in 4Q21.
Provision for credit lossesIn 1Q22, the release of provision for credit losses of CHF 110 million was mainly due to a release of CHF 156 million in the Investment Bank, partially offset by provision for credit losses of CHF 24 million in Wealth Management and CHF 23 million in the Swiss Bank. 1Q22 included a release of provision for credit losses in the Investment Bank pertaining to an assessment of the future recoverability of receivables related to Archegos Capital Management (Archegos).
Total operating expensesCompared to 1Q21, total operating expenses of CHF 4,950 mil-lion increased 26%, mainly reflecting higher general and adminis-trative expenses and higher compensation and benefits. General and administrative expenses increased 56%, primarily reflecting higher litigation provisions. The Group recorded net litigation provi-sions of CHF 703 million in 1Q22, primarily relating to develop-ments in a number of previously disclosed legal matters, mainly in the Corporate Center and Wealth Management. Compensation and benefits increased 11%, mainly due to higher discretionary compensation expenses. Adjusted total operating expenses in 1Q22 were CHF 4,237 million, an increase of 9% compared to CHF 3,870 million in 1Q21.
Compared to 4Q21, total operating expenses decreased 21%, mainly reflecting a goodwill impairment of CHF 1,623 million in 4Q21. Total operating expenses also reflected a 2% decrease in general and administrative expenses, primarily due to lower professional services fees, partially offset by a 15% increase in compensation and benefits, mainly due to higher discretionary
8 Credit Suisse
compensation expenses. Adjusted total operating expenses increased 4% compared to CHF 4,071 million in 4Q21.
Income taxIn 1Q22, the income tax benefit of CHF 151 million, resulting in an effective tax rate of 35.3% for the quarter, mainly reflected the estimated effective tax rate for the full year, as applied to the 1Q22 results. The main drivers of the full year estimated effective tax rate were the impact of the geographical mix of results, valuation allowances relating to current year earnings and the non-deductible funding costs. Additionally, the 1Q22 tax benefit was negatively impacted by non-deductible provisions relating to a previously dis-closed legal matter and a tax rate change in the UK, partially offset by the impact of the release of previously unrecognized tax ben-efits. Overall, net deferred tax assets increased CHF 306 million to CHF 3,259 million during 1Q22.
Regulatory capitalAs of the end of 1Q22, our Bank for International Settlements (BIS) common equity tier 1 (CET1) ratio was 13.8% and our risk-weighted assets (RWA) were CHF 273.0 billion.
> Refer to “Capital management” in II – Treasury, risk, balance sheet and off-balance sheet for further information on regulatory capital.
Other informationChanges to the Executive BoardOn April 27, 2022, we made the following announcements regarding changes to the Executive Board:p David Mathers, who has served as CFO since 2010 and as
CEO of Credit Suisse International since 2016, will step down from the Executive Board. He will continue with his responsi-bilities until suitable successors for both of his roles have been found.
p Francesca McDonagh will take over by October 1, 2022 as CEO of the EMEA region from Francesco De Ferrari, CEO of the Wealth Management division, who was CEO of the EMEA region on an ad interim basis since January 2022. She will also join the Executive Board.
p Helman Sitohang, who has served as CEO of the Asia Pacific region since 2014, will step down from the Executive Board on June 1, 2022. He will stay with Credit Suisse as a senior advisor to the Group CEO and will be succeeded by Edwin Low, who is currently the co-head of Investment Banking Asia Pacific and CEO for Southeast Asia.
p Romeo Cerutti, who has served as General Counsel since 2009, will retire from the Executive Board on July 1, 2022. He will be succeeded by Markus Diethelm, who most recently served as General Counsel at UBS Group.
Annual General Meeting On April 29, 2022, the shareholders of Credit Suisse Group AG approved all proposals of the Board of Directors (Board) at the Annual General Meeting (AGM) in Zurich, with the excep-tion of the discharge of the Board and Executive Board for the
2020 financial year. Shareholders elected Axel P. Lehmann as Chairman of the Board for a term until the end of the next AGM. Shareholders further elected Mirko Bianchi, Keyu Jin and Amanda Norton as non-executive members of the Board for a term until the end of the next AGM, and confirmed all other cur-rent members of the Board who stood for re-election for a term until the end of the next AGM. In addition, shareholders granted the Board and the Executive Board discharge for the 2021 financial year, excluding discharge in relation to the supply chain finance funds (SCFF) matter. Shareholders also approved the Board’s proposal to reintroduce authorized share capital amount-ing to a maximum of CHF 5 million (equivalent to 125,000,000 registered shares) in order to preserve strategic and financial flex-ibility, including for a further development of business activities, and to ensure a sufficient reserve of authorized capital, in line with regulatory expectations.
Russia’s invasion of UkraineIn late February 2022, the Russian government launched a military attack on Ukraine. In response to Russia’s military attack, the US, EU, UK, Switzerland and other countries across the world imposed severe sanctions against Russia’s financial system and on Rus-sian government officials and Russian business leaders. Sanctions beginning in February 2022 included limitations on the ability of certain Russian banks to access the SWIFT financial messaging service, restrictions on transactions with the Russian central bank, prohibitions on new investments in Russia, sanctions on Russian financial institutions, sanctions on critical major state-owned enter-prises, sanctions on certain Russian government officials and their family members, sanctions on business elites, capital markets-related restrictions and deposit-related limitations. With regard to our exposure to the impact of Russia’s invasion of Ukraine, our 1Q22 results were adversely affected by an aggregate amount of CHF 206 million of negative revenues, provisions for credit losses and trading losses. The Group continues to assess the impact of the sanctions already imposed, and potential future escalations, on its exposures and client relationships. As of March 31, 2022, the Group had a net credit exposure to Russia, after specific allow-ances and provisions for credit losses and valuation adjustments, of CHF 373 million, primarily related to financial institutions, cor-porates and individuals. In addition, Russian subsidiaries had a net asset value of approximately CHF 0.2 billion as of March 31, 2022. As of March 31, 2022, we had minimal total credit exposures towards specifically sanctioned individuals managed by our Wealth Management division. In 1Q22, CHF 10.4 billion of assets under management were reclassified to assets under custody due to the imposed sanctions, and less than 4% of assets under management in our wealth management-related businesses are linked to Russian clients. The Group is currently monitoring settlement risk on certain open transactions with Russian counterparties; market closures, the imposition of exchange controls, sanctions or other factors may limit the Group’s ability to settle existing transactions or realize on collateral, which could result in unexpected increases in exposures. The Group notes that these recent developments may continue to affect its financial performance, including credit loss estimates and potential asset impairments.
9Credit Suisse
Strategic Regulatory Remediation CommitteeIn April 2022, Credit Suisse established the Strategic Regula-tory Remediation Committee (SRRC) at the Executive Board level, chaired by the Chief Risk Officer. The SRRC will oversee the strategic regulatory remediation of Credit Suisse, which is intended to strengthen our organization and deliver on our regula-tory programs.
Supply chain finance funds matterAs previously reported, in early March 2021, the boards of four supply chain finance funds managed by certain Group subsidiar-ies decided to suspend redemptions and subscriptions of those funds to protect the interests of the funds’ investors, to terminate the SCFF and to proceed to their liquidation. Credit Suisse Asset Management (Schweiz) AG acts as the portfolio manager of the SCFF.
In March 2022, Credit Suisse received a proposal from Ethos Foundation and other shareholders requesting information and that a special audit be conducted in connection with the SCFF and “Suisse Secrets” matters. The Board responded to the request for information with answers, which were made publicly available on the Credit Suisse website. The answers included, among other things, details related to SCFF on the insurance coverage applied to the various funds, the amounts paid out by funds and the ongoing efforts to recover additional amounts through insurance claims and litigation, including a statement that it is expected that litigation will be necessary to enforce claims against individual debtors and the insurance companies, which may take around five years. The answers also included informa-tion on the “Suisse Secrets” matter.
Beginning in 4Q21, we introduced a fee waiver program for clients impacted by this matter wherein certain commissions and fees arising from current and future business transactions may be reim-bursed on a quarterly basis, provided certain conditions are met. We incurred negative revenues of CHF 29 million in 1Q22 relating to this fee waiver program, primarily in Wealth Management.
Significant negative consequences of the supply chain finance funds and Archegos mattersThere can be no assurance that any additional losses, damages, costs and expenses, as well as any further regulatory and other investigations and actions or any further downgrade of our credit ratings, will not be material to us, including from any impact on our business, financial condition, results of operations, prospects, liquidity or capital position.
> Refer to “Risk factors” in I – Information on the company and “Note 40 – Liti-gation” in VI – Consolidated financial statements – Credit Suisse Group in the Credit Suisse Annual Report 2021 and Note 33 – Litigation in III – Condensed consolidated financial statements – unaudited for further information on risks that may arise in relation to these matters and for a description of the regula-tory and legal developments relating to these matters.
Share buybackOn December 30, 2021, we completed the 2021 share buyback program. Shares repurchased in 2021 were originally expected to be cancelled by means of a capital reduction at the 2022 AGM. The Board decided to retain the shares but may propose their cancellation at a later AGM.
Performance measuresCredit Suisse measures firm-wide returns against total share-holders’ equity and tangible shareholders’ equity, a non-GAAP financial measure also known as tangible book value. Tangible shareholders’ equity is calculated by deducting goodwill and other intangible assets from total shareholders’ equity as presented in our balance sheet. In addition, Credit Suisse also measures the efficiency of the firm and its divisions with regard to the usage of regulatory capital. Regulatory capital is calculated as the average of 13.5% of RWA and 4.25% of leverage exposure and return on regulatory capital, a non-GAAP financial measure, is calculated using income/(loss) after tax and assumes a tax rate of 30% for periods prior to 2020 and 25% from 2020 onward. For the Investment Bank, return on regulatory capital is based on US dol-lar denominated numbers. Return on regulatory capital exclud-ing certain items included in our reported results is calculated using results excluding such items, applying the same methodol-ogy. Adjusted return on regulatory capital excluding certain items included in our reported results is calculated using results exclud-ing such items, applying the same methodology.
The Group’s economic profit is a non-GAAP financial measure, calculated using income/(loss) before tax applying a 25% tax rate less a capital charge. The capital charge is calculated based on the sum of (i) a cost of capital applied to the average regulatory capital of each of the four divisions; and (ii) a 10% cost of capital applied to the residual of the Group’s average tangible equity less the sum of the regulatory capital of the four divisions. The applied cost of capital for the divisions is 8% for Wealth Management, the Swiss Bank and Asset Management and 12% for the Invest-ment Bank. Adjusted economic profit excluding certain items included in our reported results is calculated using results exclud-ing such items, applying the same methodology.
Management believes that these metrics are meaningful as they are measures used and relied upon by industry analysts and investors to assess valuations and capital adequacy.
10 Credit Suisse
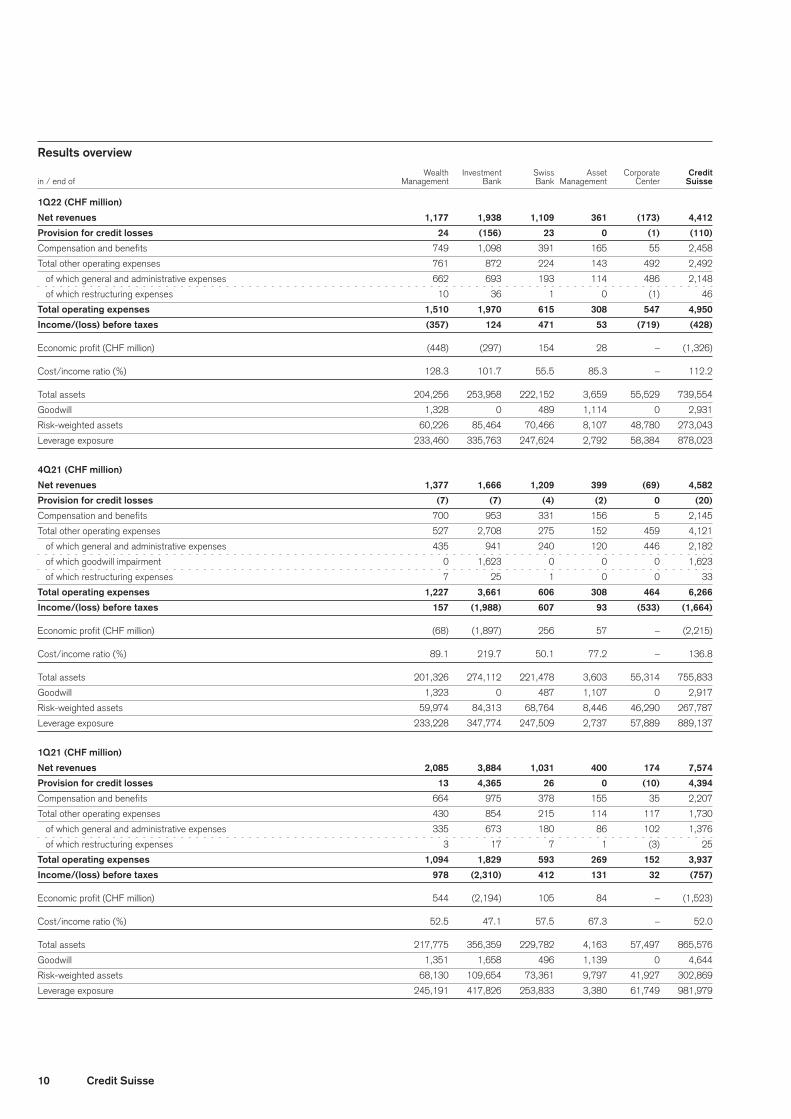
Results overview
Wealth Investment Swiss Asset Corporate Credit in / end of Management Bank Bank Management Center Suisse
1Q22 (CHF million)
Net revenues 1,177 1,938 1,109 361 (173) 4,412
Provision for credit losses 24 (156) 23 0 (1) (110)
Compensation and benefits 749 1,098 391 165 55 2,458
Total other operating expenses 761 872 224 143 492 2,492
of which general and administrative expenses 662 693 193 114 486 2,148
of which restructuring expenses 10 36 1 0 (1) 46
Total operating expenses 1,510 1,970 615 308 547 4,950
Income/(loss) before taxes (357) 124 471 53 (719) (428)
Economic profit (CHF million) (448) (297) 154 28 – (1,326)
Cost/income ratio (%) 128.3 101.7 55.5 85.3 – 112.2
Total assets 204,256 253,958 222,152 3,659 55,529 739,554
Goodwill 1,328 0 489 1,114 0 2,931
Risk-weighted assets 60,226 85,464 70,466 8,107 48,780 273,043
Leverage exposure 233,460 335,763 247,624 2,792 58,384 878,023
4Q21 (CHF million)
Net revenues 1,377 1,666 1,209 399 (69) 4,582
Provision for credit losses (7) (7) (4) (2) 0 (20)
Compensation and benefits 700 953 331 156 5 2,145
Total other operating expenses 527 2,708 275 152 459 4,121
of which general and administrative expenses 435 941 240 120 446 2,182
of which goodwill impairment 0 1,623 0 0 0 1,623
of which restructuring expenses 7 25 1 0 0 33
Total operating expenses 1,227 3,661 606 308 464 6,266
Income/(loss) before taxes 157 (1,988) 607 93 (533) (1,664)
Economic profit (CHF million) (68) (1,897) 256 57 – (2,215)
Cost/income ratio (%) 89.1 219.7 50.1 77.2 – 136.8
Total assets 201,326 274,112 221,478 3,603 55,314 755,833
Goodwill 1,323 0 487 1,107 0 2,917
Risk-weighted assets 59,974 84,313 68,764 8,446 46,290 267,787
Leverage exposure 233,228 347,774 247,509 2,737 57,889 889,137
1Q21 (CHF million)
Net revenues 2,085 3,884 1,031 400 174 7,574
Provision for credit losses 13 4,365 26 0 (10) 4,394
Compensation and benefits 664 975 378 155 35 2,207
Total other operating expenses 430 854 215 114 117 1,730
of which general and administrative expenses 335 673 180 86 102 1,376
of which restructuring expenses 3 17 7 1 (3) 25
Total operating expenses 1,094 1,829 593 269 152 3,937
Income/(loss) before taxes 978 (2,310) 412 131 32 (757)
Economic profit (CHF million) 544 (2,194) 105 84 – (1,523)
Cost/income ratio (%) 52.5 47.1 57.5 67.3 – 52.0
Total assets 217,775 356,359 229,782 4,163 57,497 865,576
Goodwill 1,351 1,658 496 1,139 0 4,644
Risk-weighted assets 68,130 109,654 73,361 9,797 41,927 302,869
Leverage exposure 245,191 417,826 253,833 3,380 61,749 981,979
11Credit Suisse
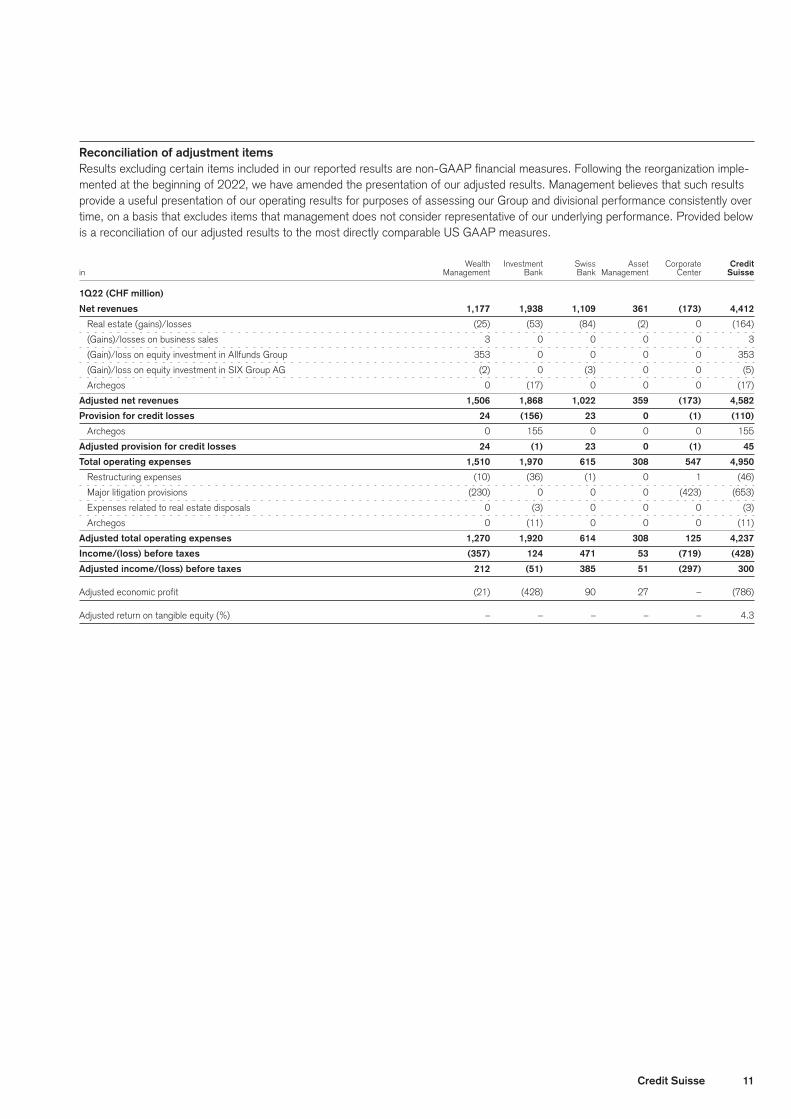
Reconciliation of adjustment itemsResults excluding certain items included in our reported results are non-GAAP financial measures. Following the reorganization imple-mented at the beginning of 2022, we have amended the presentation of our adjusted results. Management believes that such results provide a useful presentation of our operating results for purposes of assessing our Group and divisional performance consistently over time, on a basis that excludes items that management does not consider representative of our underlying performance. Provided below is a reconciliation of our adjusted results to the most directly comparable US GAAP measures.
Wealth Investment Swiss Asset Corporate Credit in Management Bank Bank Management Center Suisse
1Q22 (CHF million)
Net revenues 1,177 1,938 1,109 361 (173) 4,412
Real estate (gains)/losses (25) (53) (84) (2) 0 (164)
(Gains)/losses on business sales 3 0 0 0 0 3
(Gain)/loss on equity investment in Allfunds Group 353 0 0 0 0 353
(Gain)/loss on equity investment in SIX Group AG (2) 0 (3) 0 0 (5)
Archegos 0 (17) 0 0 0 (17)
Adjusted net revenues 1,506 1,868 1,022 359 (173) 4,582
Provision for credit losses 24 (156) 23 0 (1) (110)
Archegos 0 155 0 0 0 155
Adjusted provision for credit losses 24 (1) 23 0 (1) 45
Total operating expenses 1,510 1,970 615 308 547 4,950
Restructuring expenses (10) (36) (1) 0 1 (46)
Major litigation provisions (230) 0 0 0 (423) (653)
Expenses related to real estate disposals 0 (3) 0 0 0 (3)
Archegos 0 (11) 0 0 0 (11)
Adjusted total operating expenses 1,270 1,920 614 308 125 4,237
Income/(loss) before taxes (357) 124 471 53 (719) (428)
Adjusted income/(loss) before taxes 212 (51) 385 51 (297) 300
Adjusted economic profit (21) (428) 90 27 – (786)
Adjusted return on tangible equity (%) – – – – – 4.3

12 Credit Suisse
Reconciliation of adjustment items (continued) Wealth Investment Swiss Asset Corporate Credit in Management Bank Bank Management Center Suisse
4Q21 (CHF million)
Net revenues 1,377 1,666 1,209 399 (69) 4,582
Real estate (gains)/losses (19) 0 (205) 0 0 (224)
(Gains)/losses on business sales (17) 0 0 0 4 (13)
(Gain)/loss on equity investment in Allfunds Group (31) 0 0 0 0 (31)
(Gain)/loss on equity investment in SIX Group AG 35 0 35 0 0 70
Adjusted net revenues 1,345 1,666 1,039 399 (65) 4,384
Provision for credit losses (7) (7) (4) (2) 0 (20)
Archegos 0 5 0 0 0 5
Adjusted provision for credit losses (7) (2) (4) (2) 0 (15)
Total operating expenses 1,227 3,661 606 308 464 6,266
Goodwill impairment 0 (1,623) 0 0 0 (1,623)
Restructuring expenses (7) (25) (1) 0 0 (33)
Major litigation provisions (3) (149) 0 0 (362) (514)
Expenses related to real estate disposals (3) (8) 0 0 0 (11)
Archegos 0 (19) 0 0 5 (14)
Adjusted total operating expenses 1,214 1,837 605 308 107 4,071
Income/(loss) before taxes 157 (1,988) 607 93 (533) (1,664)
Adjusted income/(loss) before taxes 138 (169) 438 93 (172) 328
Adjusted economic profit (82) (533) 129 57 – (842)
Adjusted return on tangible equity (%) – – – – – (1.0)
1Q21 (CHF million)
Net revenues 2,085 3,884 1,031 400 174 7,574
(Gain)/loss on equity investment in Allfunds Group (144) 0 0 0 0 (144)
Adjusted net revenues 1,941 3,884 1,031 400 174 7,430
Provision for credit losses 13 4,365 26 0 (10) 4,394
Archegos 0 (4,430) 0 0 0 (4,430)
Adjusted provision for credit losses 13 (65) 26 0 (10) (36)
Total operating expenses 1,094 1,829 593 269 152 3,937
Restructuring expenses (3) (17) (7) (1) 3 (25)
Major litigation provisions 11 0 0 0 (15) (4)
Expenses related to real estate disposals (4) (33) 0 (1) 0 (38)
Adjusted total operating expenses 1,098 1,779 586 267 140 3,870
Income/(loss) before taxes 978 (2,310) 412 131 32 (757)
Adjusted income before taxes 830 2,170 419 133 44 3,596
Adjusted economic profit 433 1,165 111 86 – 1,726
Adjusted return on tangible equity (%) – – – – – 34.4
13Credit Suisse
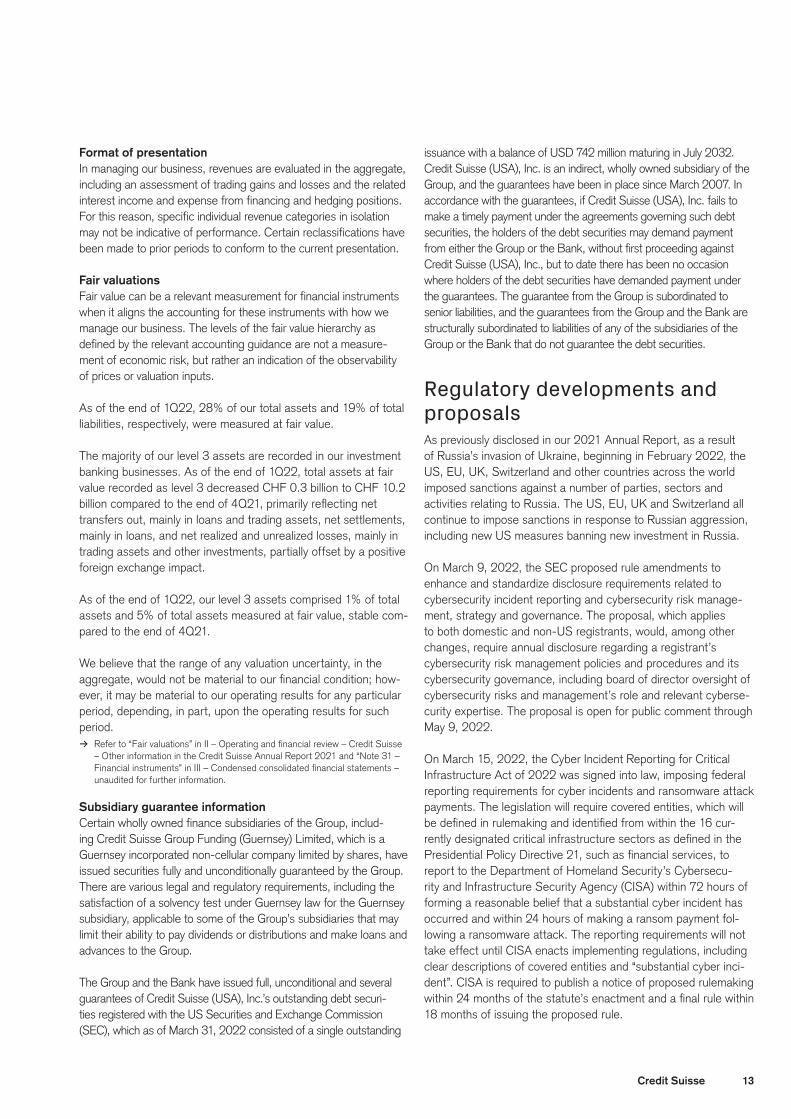
Format of presentationIn managing our business, revenues are evaluated in the aggregate, including an assessment of trading gains and losses and the related interest income and expense from financing and hedging positions. For this reason, specific individual revenue categories in isolation may not be indicative of performance. Certain reclassifications have been made to prior periods to conform to the current presentation.
Fair valuationsFair value can be a relevant measurement for financial instruments when it aligns the accounting for these instruments with how we manage our business. The levels of the fair value hierarchy as defined by the relevant accounting guidance are not a measure-ment of economic risk, but rather an indication of the observability of prices or valuation inputs.
As of the end of 1Q22, 28% of our total assets and 19% of total liabilities, respectively, were measured at fair value.
The majority of our level 3 assets are recorded in our investment banking businesses. As of the end of 1Q22, total assets at fair value recorded as level 3 decreased CHF 0.3 billion to CHF 10.2 billion compared to the end of 4Q21, primarily reflecting net transfers out, mainly in loans and trading assets, net settlements, mainly in loans, and net realized and unrealized losses, mainly in trading assets and other investments, partially offset by a positive foreign exchange impact.
As of the end of 1Q22, our level 3 assets comprised 1% of total assets and 5% of total assets measured at fair value, stable com-pared to the end of 4Q21.
We believe that the range of any valuation uncertainty, in the aggregate, would not be material to our financial condition; how-ever, it may be material to our operating results for any particular period, depending, in part, upon the operating results for such period.
> Refer to “Fair valuations” in II – Operating and financial review – Credit Suisse – Other information in the Credit Suisse Annual Report 2021 and “Note 31 – Financial instruments” in III – Condensed consolidated financial statements – unaudited for further information.
Subsidiary guarantee informationCertain wholly owned finance subsidiaries of the Group, includ-ing Credit Suisse Group Funding (Guernsey) Limited, which is a Guernsey incorporated non-cellular company limited by shares, have issued securities fully and unconditionally guaranteed by the Group. There are various legal and regulatory requirements, including the satisfaction of a solvency test under Guernsey law for the Guernsey subsidiary, applicable to some of the Group’s subsidiaries that may limit their ability to pay dividends or distributions and make loans and advances to the Group.
The Group and the Bank have issued full, unconditional and several guarantees of Credit Suisse (USA), Inc.’s outstanding debt securi-ties registered with the US Securities and Exchange Commission (SEC), which as of March 31, 2022 consisted of a single outstanding
issuance with a balance of USD 742 million maturing in July 2032. Credit Suisse (USA), Inc. is an indirect, wholly owned subsidiary of the Group, and the guarantees have been in place since March 2007. In accordance with the guarantees, if Credit Suisse (USA), Inc. fails to make a timely payment under the agreements governing such debt securities, the holders of the debt securities may demand payment from either the Group or the Bank, without first proceeding against Credit Suisse (USA), Inc., but to date there has been no occasion where holders of the debt securities have demanded payment under the guarantees. The guarantee from the Group is subordinated to senior liabilities, and the guarantees from the Group and the Bank are structurally subordinated to liabilities of any of the subsidiaries of the Group or the Bank that do not guarantee the debt securities.
Regulatory developments and proposalsAs previously disclosed in our 2021 Annual Report, as a result of Russia’s invasion of Ukraine, beginning in February 2022, the US, EU, UK, Switzerland and other countries across the world imposed sanctions against a number of parties, sectors and activities relating to Russia. The US, EU, UK and Switzerland all continue to impose sanctions in response to Russian aggression, including new US measures banning new investment in Russia.
On March 9, 2022, the SEC proposed rule amendments to enhance and standardize disclosure requirements related to cybersecurity incident reporting and cybersecurity risk manage-ment, strategy and governance. The proposal, which applies to both domestic and non-US registrants, would, among other changes, require annual disclosure regarding a registrant’s cybersecurity risk management policies and procedures and its cybersecurity governance, including board of director oversight of cybersecurity risks and management’s role and relevant cyberse-curity expertise. The proposal is open for public comment through May 9, 2022.
On March 15, 2022, the Cyber Incident Reporting for Critical Infrastructure Act of 2022 was signed into law, imposing federal reporting requirements for cyber incidents and ransomware attack payments. The legislation will require covered entities, which will be defined in rulemaking and identified from within the 16 cur-rently designated critical infrastructure sectors as defined in the Presidential Policy Directive 21, such as financial services, to report to the Department of Homeland Security’s Cybersecu-rity and Infrastructure Security Agency (CISA) within 72 hours of forming a reasonable belief that a substantial cyber incident has occurred and within 24 hours of making a ransom payment fol-lowing a ransomware attack. The reporting requirements will not take effect until CISA enacts implementing regulations, including clear descriptions of covered entities and “substantial cyber inci-dent”. CISA is required to publish a notice of proposed rulemaking within 24 months of the statute’s enactment and a final rule within 18 months of issuing the proposed rule.
14 Credit Suisse
On March 15, 2022, the United States enacted the Adjust-able Interest Rate (LIBOR) Act of 2021 (LIBOR Act). The fed-eral LIBOR Act preempts similar state legislation (including that enacted in New York) and provides one national approach for replacing US dollar London Interbank Offered Rate (LIBOR) as a reference interest rate in certain contracts, including those with no fallback provisions or with fallback provisions that identify nei-ther a specific replacement rate nor a “determining person” as defined in the legislation, once LIBOR is no longer published or is no longer representative. Under the LIBOR Act, references in certain contracts to the overnight, one-month, three-month, six-month and 12-month tenors of US dollar LIBOR will be automati-cally replaced by a Secured Overnight Financing Rate (SOFR)-based benchmark rate to be identified by the Board of Governors of the Federal Reserve System via regulations to be promulgated by September 11, 2022.
On March 21, 2022, the SEC proposed rule changes that would require registrants to include certain climate-related disclosures in their registration statements and periodic reports, including infor-mation about climate-related governance, risk, business impacts, targets and goals and other related disclosures, as well as a note to registrants’ audited financial statements providing certain climate-related metrics and impacts on a line-item basis. The pro-posal is open for public comment through May 20, 2022, and the SEC is expected to finalize the rule in 2022.
On March 21, 2022, two new agreements governing international data transfers from the UK came into force: the International Data Transfer Agreement (IDTA) and the Data Transfer Adden-dum (Addendum). The IDTA is a stand-alone agreement, whereas the Addendum supplements the European Commission Standard Contractual Clauses (SCCs) for transferring personal data from the EEA to third countries pursuant to the General Data Protec-tion Regulation (GDPR) approved by the European Commission on June 4, 2021 (New SCCs). Following a transitional period, the IDTA and the Addendum will fully replace the previous set of SCCs (Old SCCs), which still apply in the UK (as the New SCCs came into force after the UK’s withdrawal from the EU).
In June 2021, the Swiss Financial Market Supervisory Author-ity FINMA (FINMA) opened enforcement proceedings relating to the delayed implementation of a comprehensive overview of client relationships, which is one of the measures that FINMA ordered in September 2018 in connection with the conclusion of two enforcement procedures against Credit Suisse AG. FINMA appointed a monitor to oversee implementation and confirm effectiveness. In April 2022, FINMA issued an enforcement deci-sion generally accepting Credit Suisse’s submissions concern-ing the scope of the project and the related implementation and development work. FINMA found no breach of Swiss supervisory law nor imposed any reprimand and set a final deadline until the end of 2024 to finalize the implementation.
On April 5, 2022, a referendum was called against the Swiss withholding tax reform, which, as previously disclosed, would largely abolish the withholding tax on interest and remove the turnover tax on domestic bonds. Due to the referendum, the with-holding tax reform is expected to be subject to a national vote in the fall of 2022.
On December 17, 2021, the Swiss Parliament approved the revised Federal Act on Collective Investment Schemes (CIS), which, following an optional referendum period that ended on April 7, 2022 without a referendum called, will enter into force and introduce the Limited Qualified Investor Fund (L-QIF) into Swiss law. The L-QIF is a new fund category which is not subject to supervisory licensing or approval requirements of FINMA at the level of the fund. However, it is only open to qualified investors and must be managed by an institution approved and supervised by FINMA. The revised CIS is expected to enter into force in the second quarter of 2023.
> Refer to “Regulation and supervision” in I – Information on the company in the Credit Suisse Annual Report 2021 and “Regulatory framework” in II – Treasury, risk, balance sheet and off-balance sheet – Liquidity and funding management and Capital management for further information.
15Credit Suisse
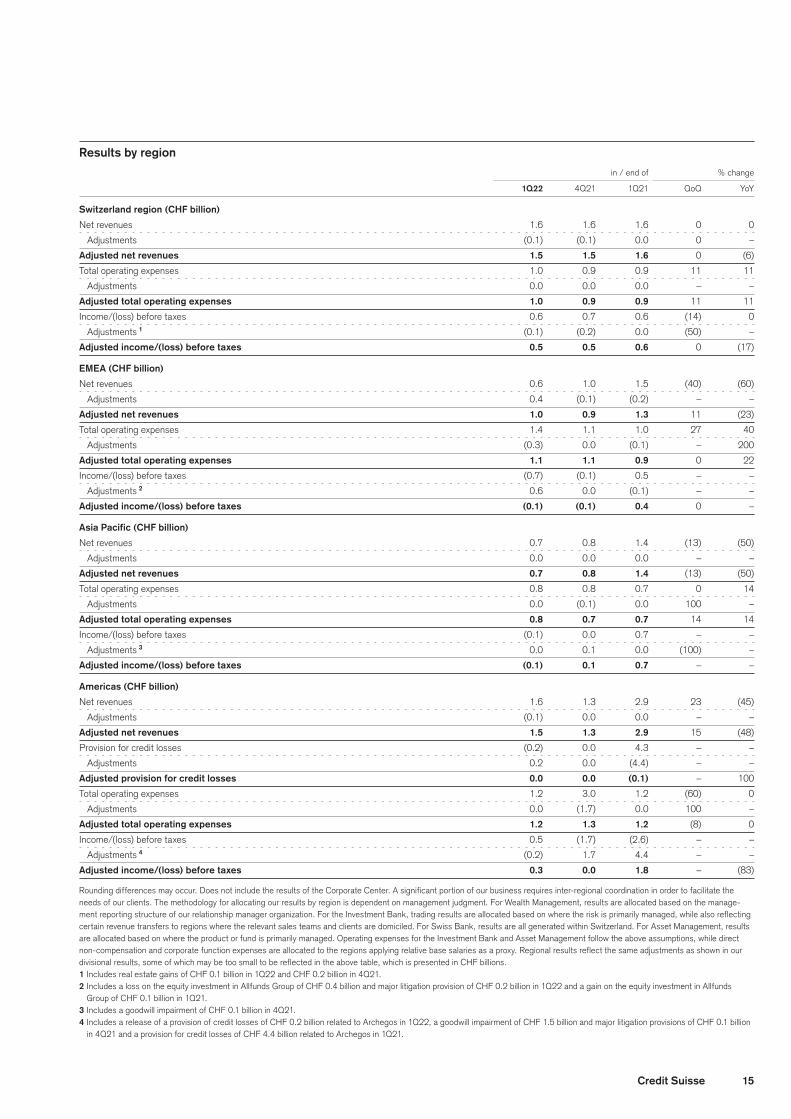
Results by region in / end of % change
1Q22 4Q21 1Q21 QoQ YoY
Switzerland region (CHF billion)
Net revenues 1.6 1.6 1.6 0 0
Adjustments (0.1) (0.1) 0.0 0 –
Adjusted net revenues 1.5 1.5 1.6 0 (6)
Total operating expenses 1.0 0.9 0.9 11 11
Adjustments 0.0 0.0 0.0 – –
Adjusted total operating expenses 1.0 0.9 0.9 11 11
Income/(loss) before taxes 0.6 0.7 0.6 (14) 0
Adjustments 1 (0.1) (0.2) 0.0 (50) –
Adjusted income/(loss) before taxes 0.5 0.5 0.6 0 (17)
EMEA (CHF billion)
Net revenues 0.6 1.0 1.5 (40) (60)
Adjustments 0.4 (0.1) (0.2) – –
Adjusted net revenues 1.0 0.9 1.3 11 (23)
Total operating expenses 1.4 1.1 1.0 27 40
Adjustments (0.3) 0.0 (0.1) – 200
Adjusted total operating expenses 1.1 1.1 0.9 0 22
Income/(loss) before taxes (0.7) (0.1) 0.5 – –
Adjustments 2 0.6 0.0 (0.1) – –
Adjusted income/(loss) before taxes (0.1) (0.1) 0.4 0 –
Asia Pacific (CHF billion)
Net revenues 0.7 0.8 1.4 (13) (50)
Adjustments 0.0 0.0 0.0 – –
Adjusted net revenues 0.7 0.8 1.4 (13) (50)
Total operating expenses 0.8 0.8 0.7 0 14
Adjustments 0.0 (0.1) 0.0 100 –
Adjusted total operating expenses 0.8 0.7 0.7 14 14
Income/(loss) before taxes (0.1) 0.0 0.7 – –
Adjustments 3 0.0 0.1 0.0 (100) –
Adjusted income/(loss) before taxes (0.1) 0.1 0.7 – –
Americas (CHF billion)
Net revenues 1.6 1.3 2.9 23 (45)
Adjustments (0.1) 0.0 0.0 – –
Adjusted net revenues 1.5 1.3 2.9 15 (48)
Provision for credit losses (0.2) 0.0 4.3 – –
Adjustments 0.2 0.0 (4.4) – –
Adjusted provision for credit losses 0.0 0.0 (0.1) – 100
Total operating expenses 1.2 3.0 1.2 (60) 0
Adjustments 0.0 (1.7) 0.0 100 –
Adjusted total operating expenses 1.2 1.3 1.2 (8) 0
Income/(loss) before taxes 0.5 (1.7) (2.6) – –
Adjustments 4 (0.2) 1.7 4.4 – –
Adjusted income/(loss) before taxes 0.3 0.0 1.8 – (83)
Rounding differences may occur. Does not include the results of the Corporate Center. A significant portion of our business requires inter-regional coordination in order to facilitate the needs of our clients. The methodology for allocating our results by region is dependent on management judgment. For Wealth Management, results are allocated based on the manage-ment reporting structure of our relationship manager organization. For the Investment Bank, trading results are allocated based on where the risk is primarily managed, while also reflecting certain revenue transfers to regions where the relevant sales teams and clients are domiciled. For Swiss Bank, results are all generated within Switzerland. For Asset Management, results are allocated based on where the product or fund is primarily managed. Operating expenses for the Investment Bank and Asset Management follow the above assumptions, while direct non-compensation and corporate function expenses are allocated to the regions applying relative base salaries as a proxy. Regional results reflect the same adjustments as shown in our divisional results, some of which may be too small to be reflected in the above table, which is presented in CHF billions.1 Includes real estate gains of CHF 0.1 billion in 1Q22 and CHF 0.2 billion in 4Q21.2 Includes a loss on the equity investment in Allfunds Group of CHF 0.4 billion and major litigation provision of CHF 0.2 billion in 1Q22 and a gain on the equity investment in Allfunds
Group of CHF 0.1 billion in 1Q21.3 Includes a goodwill impairment of CHF 0.1 billion in 4Q21.4 Includes a release of a provision of credit losses of CHF 0.2 billion related to Archegos in 1Q22, a goodwill impairment of CHF 1.5 billion and major litigation provisions of CHF 0.1 billion
in 4Q21 and a provision for credit losses of CHF 4.4 billion related to Archegos in 1Q21.
16 Wealth Management
Wealth Management
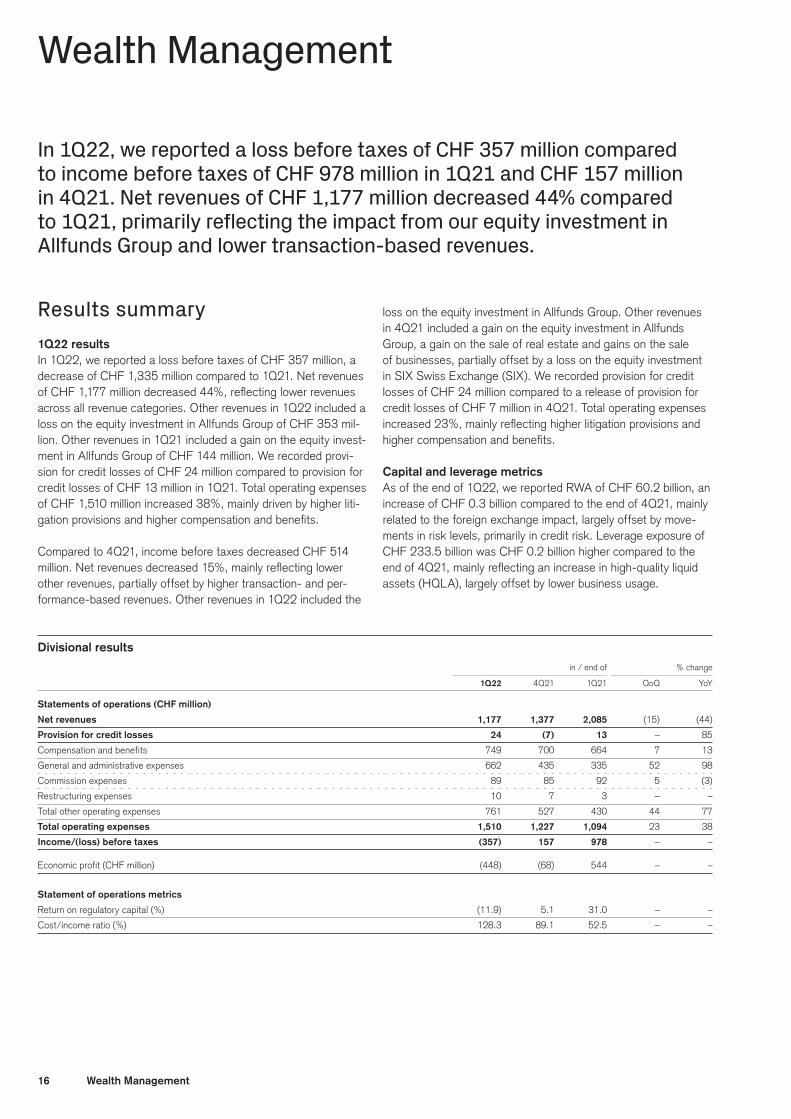
In 1Q22, we reported a loss before taxes of CHF 357 million compared to income before taxes of CHF 978 million in 1Q21 and CHF 157 million in 4Q21. Net revenues of CHF 1,177 million decreased 44% compared to 1Q21, primarily reflecting the impact from our equity investment in Allfunds Group and lower transaction-based revenues.
Results summary1Q22 resultsIn 1Q22, we reported a loss before taxes of CHF 357 million, a decrease of CHF 1,335 million compared to 1Q21. Net revenues of CHF 1,177 million decreased 44%, reflecting lower revenues across all revenue categories. Other revenues in 1Q22 included a loss on the equity investment in Allfunds Group of CHF 353 mil-lion. Other revenues in 1Q21 included a gain on the equity invest-ment in Allfunds Group of CHF 144 million. We recorded provi-sion for credit losses of CHF 24 million compared to provision for credit losses of CHF 13 million in 1Q21. Total operating expenses of CHF 1,510 million increased 38%, mainly driven by higher liti-gation provisions and higher compensation and benefits.
Compared to 4Q21, income before taxes decreased CHF 514 million. Net revenues decreased 15%, mainly reflecting lower other revenues, partially offset by higher transaction- and per-formance-based revenues. Other revenues in 1Q22 included the
loss on the equity investment in Allfunds Group. Other revenues in 4Q21 included a gain on the equity investment in Allfunds Group, a gain on the sale of real estate and gains on the sale of businesses, partially offset by a loss on the equity investment in SIX Swiss Exchange (SIX). We recorded provision for credit losses of CHF 24 million compared to a release of provision for credit losses of CHF 7 million in 4Q21. Total operating expenses increased 23%, mainly reflecting higher litigation provisions and higher compensation and benefits.
Capital and leverage metricsAs of the end of 1Q22, we reported RWA of CHF 60.2 billion, an increase of CHF 0.3 billion compared to the end of 4Q21, mainly related to the foreign exchange impact, largely offset by move-ments in risk levels, primarily in credit risk. Leverage exposure of CHF 233.5 billion was CHF 0.2 billion higher compared to the end of 4Q21, mainly reflecting an increase in high-quality liquid assets (HQLA), largely offset by lower business usage.
Divisional results in / end of % change
1Q22 4Q21 1Q21 QoQ YoY
Statements of operations (CHF million)
Net revenues 1,177 1,377 2,085 (15) (44)
Provision for credit losses 24 (7) 13 – 85
Compensation and benefits 749 700 664 7 13
General and administrative expenses 662 435 335 52 98
Commission expenses 89 85 92 5 (3)
Restructuring expenses 10 7 3 – –
Total other operating expenses 761 527 430 44 77
Total operating expenses 1,510 1,227 1,094 23 38
Income/(loss) before taxes (357) 157 978 – –
Economic profit (CHF million) (448) (68) 544 – –
Statement of operations metrics
Return on regulatory capital (%) (11.9) 5.1 31.0 – –
Cost/income ratio (%) 128.3 89.1 52.5 – –
17Wealth Management
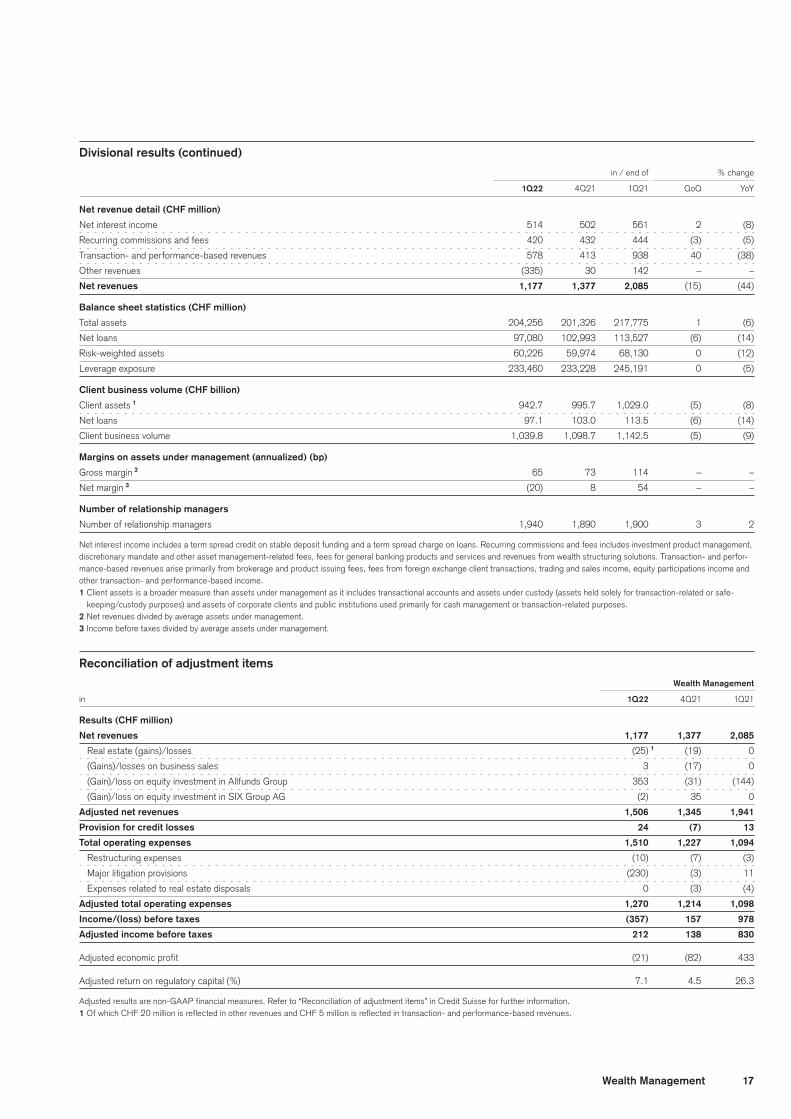
Divisional results (continued) in / end of % change
1Q22 4Q21 1Q21 QoQ YoY
Net revenue detail (CHF million)
Net interest income 514 502 561 2 (8)
Recurring commissions and fees 420 432 444 (3) (5)
Transaction- and performance-based revenues 578 413 938 40 (38)
Other revenues (335) 30 142 – –
Net revenues 1,177 1,377 2,085 (15) (44)
Balance sheet statistics (CHF million)
Total assets 204,256 201,326 217,775 1 (6)
Net loans 97,080 102,993 113,527 (6) (14)
Risk-weighted assets 60,226 59,974 68,130 0 (12)
Leverage exposure 233,460 233,228 245,191 0 (5)
Client business volume (CHF billion)
Client assets 1 942.7 995.7 1,029.0 (5) (8)
Net loans 97.1 103.0 113.5 (6) (14)
Client business volume 1,039.8 1,098.7 1,142.5 (5) (9)
Margins on assets under management (annualized) (bp)
Gross margin 2 65 73 114 – –
Net margin 3 (20) 8 54 – –
Number of relationship managers
Number of relationship managers 1,940 1,890 1,900 3 2
Net interest income includes a term spread credit on stable deposit funding and a term spread charge on loans. Recurring commissions and fees includes investment product management, discretionary mandate and other asset management-related fees, fees for general banking products and services and revenues from wealth structuring solutions. Transaction- and perfor-mance-based revenues arise primarily from brokerage and product issuing fees, fees from foreign exchange client transactions, trading and sales income, equity participations income and other transaction- and performance-based income.1 Client assets is a broader measure than assets under management as it includes transactional accounts and assets under custody (assets held solely for transaction-related or safe-
keeping/custody purposes) and assets of corporate clients and public institutions used primarily for cash management or transaction-related purposes.2 Net revenues divided by average assets under management.3 Income before taxes divided by average assets under management.
Reconciliation of adjustment items Wealth Management
in 1Q22 4Q21 1Q21
Results (CHF million)
Net revenues 1,177 1,377 2,085
Real estate (gains)/losses (25) 1 (19) 0
(Gains)/losses on business sales 3 (17) 0
(Gain)/loss on equity investment in Allfunds Group 353 (31) (144)
(Gain)/loss on equity investment in SIX Group AG (2) 35 0
Adjusted net revenues 1,506 1,345 1,941
Provision for credit losses 24 (7) 13
Total operating expenses 1,510 1,227 1,094
Restructuring expenses (10) (7) (3)
Major litigation provisions (230) (3) 11
Expenses related to real estate disposals 0 (3) (4)
Adjusted total operating expenses 1,270 1,214 1,098
Income/(loss) before taxes (357) 157 978
Adjusted income before taxes 212 138 830
Adjusted economic profit (21) (82) 433
Adjusted return on regulatory capital (%) 7.1 4.5 26.3
Adjusted results are non-GAAP financial measures. Refer to “Reconciliation of adjustment items” in Credit Suisse for further information.1 Of which CHF 20 million is reflected in other revenues and CHF 5 million is reflected in transaction- and performance-based revenues.
18 Wealth Management
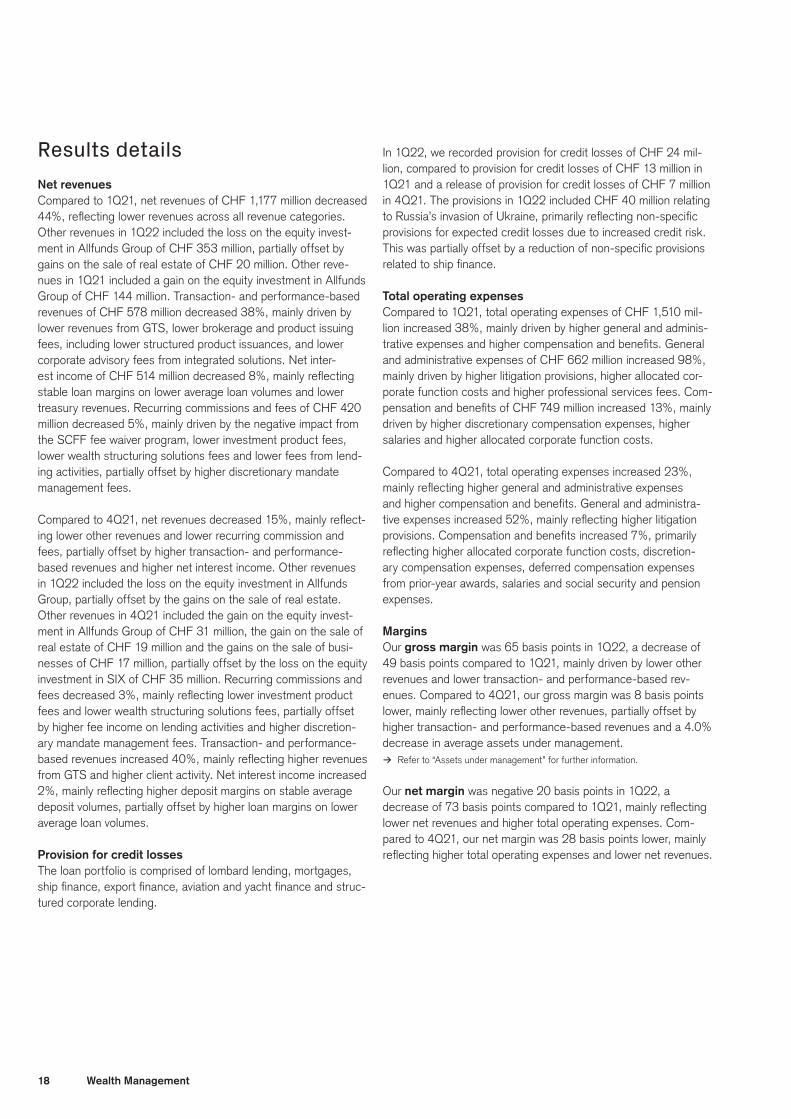
Results detailsNet revenuesCompared to 1Q21, net revenues of CHF 1,177 million decreased 44%, reflecting lower revenues across all revenue categories. Other revenues in 1Q22 included the loss on the equity invest-ment in Allfunds Group of CHF 353 million, partially offset by gains on the sale of real estate of CHF 20 million. Other reve-nues in 1Q21 included a gain on the equity investment in Allfunds Group of CHF 144 million. Transaction- and performance-based revenues of CHF 578 million decreased 38%, mainly driven by lower revenues from GTS, lower brokerage and product issuing fees, including lower structured product issuances, and lower corporate advisory fees from integrated solutions. Net inter-est income of CHF 514 million decreased 8%, mainly reflecting stable loan margins on lower average loan volumes and lower treasury revenues. Recurring commissions and fees of CHF 420 million decreased 5%, mainly driven by the negative impact from the SCFF fee waiver program, lower investment product fees, lower wealth structuring solutions fees and lower fees from lend-ing activities, partially offset by higher discretionary mandate management fees.
Compared to 4Q21, net revenues decreased 15%, mainly reflect-ing lower other revenues and lower recurring commission and fees, partially offset by higher transaction- and performance-based revenues and higher net interest income. Other revenues in 1Q22 included the loss on the equity investment in Allfunds Group, partially offset by the gains on the sale of real estate. Other revenues in 4Q21 included the gain on the equity invest-ment in Allfunds Group of CHF 31 million, the gain on the sale of real estate of CHF 19 million and the gains on the sale of busi-nesses of CHF 17 million, partially offset by the loss on the equity investment in SIX of CHF 35 million. Recurring commissions and fees decreased 3%, mainly reflecting lower investment product fees and lower wealth structuring solutions fees, partially offset by higher fee income on lending activities and higher discretion-ary mandate management fees. Transaction- and performance-based revenues increased 40%, mainly reflecting higher revenues from GTS and higher client activity. Net interest income increased 2%, mainly reflecting higher deposit margins on stable average deposit volumes, partially offset by higher loan margins on lower average loan volumes.
Provision for credit lossesThe loan portfolio is comprised of lombard lending, mortgages, ship finance, export finance, aviation and yacht finance and struc-tured corporate lending.
In 1Q22, we recorded provision for credit losses of CHF 24 mil-lion, compared to provision for credit losses of CHF 13 million in 1Q21 and a release of provision for credit losses of CHF 7 million in 4Q21. The provisions in 1Q22 included CHF 40 million relating to Russia’s invasion of Ukraine, primarily reflecting non-specific provisions for expected credit losses due to increased credit risk. This was partially offset by a reduction of non-specific provisions related to ship finance.
Total operating expensesCompared to 1Q21, total operating expenses of CHF 1,510 mil-lion increased 38%, mainly driven by higher general and adminis-trative expenses and higher compensation and benefits. General and administrative expenses of CHF 662 million increased 98%, mainly driven by higher litigation provisions, higher allocated cor-porate function costs and higher professional services fees. Com-pensation and benefits of CHF 749 million increased 13%, mainly driven by higher discretionary compensation expenses, higher salaries and higher allocated corporate function costs.
Compared to 4Q21, total operating expenses increased 23%, mainly reflecting higher general and administrative expenses and higher compensation and benefits. General and administra-tive expenses increased 52%, mainly reflecting higher litigation provisions. Compensation and benefits increased 7%, primarily reflecting higher allocated corporate function costs, discretion-ary compensation expenses, deferred compensation expenses from prior-year awards, salaries and social security and pension expenses.
MarginsOur gross margin was 65 basis points in 1Q22, a decrease of 49 basis points compared to 1Q21, mainly driven by lower other revenues and lower transaction- and performance-based rev-enues. Compared to 4Q21, our gross margin was 8 basis points lower, mainly reflecting lower other revenues, partially offset by higher transaction- and performance-based revenues and a 4.0% decrease in average assets under management.
> Refer to “Assets under management” for further information.
Our net margin was negative 20 basis points in 1Q22, a decrease of 73 basis points compared to 1Q21, mainly reflecting lower net revenues and higher total operating expenses. Com-pared to 4Q21, our net margin was 28 basis points lower, mainly reflecting higher total operating expenses and lower net revenues.
19Wealth Management
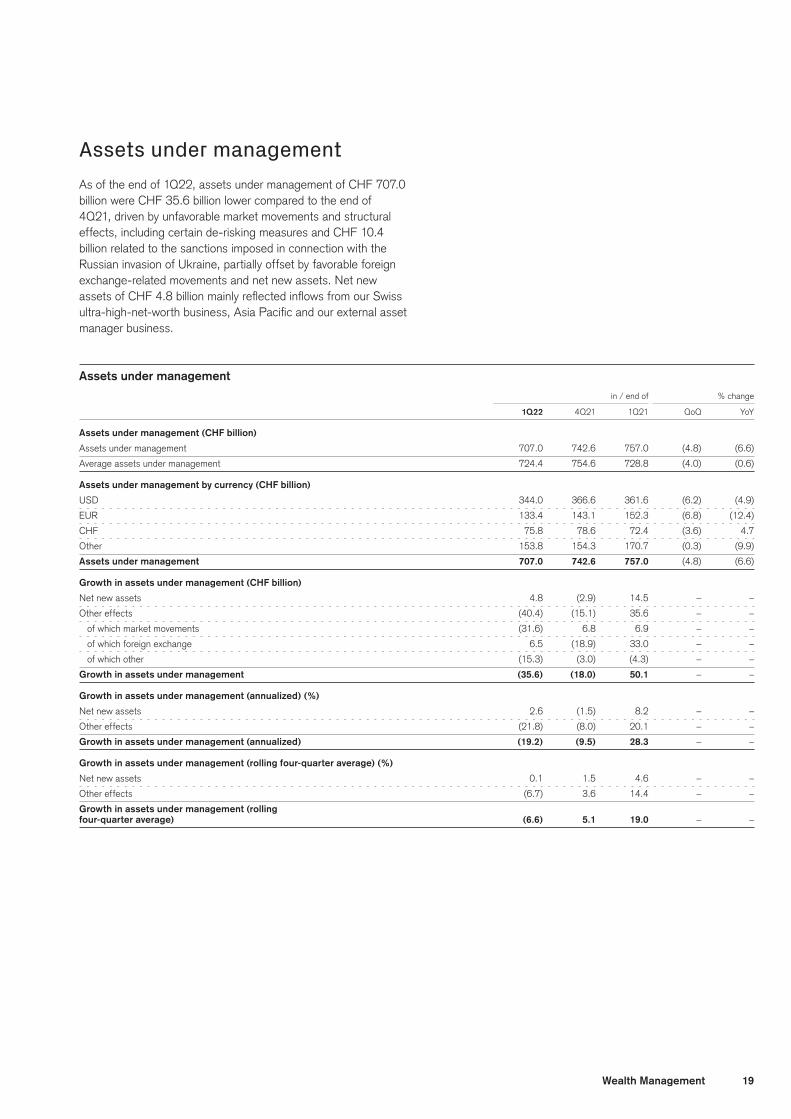
Assets under managementAs of the end of 1Q22, assets under management of CHF 707.0 billion were CHF 35.6 billion lower compared to the end of 4Q21, driven by unfavorable market movements and structural effects, including certain de-risking measures and CHF 10.4 billion related to the sanctions imposed in connection with the Russian invasion of Ukraine, partially offset by favorable foreign exchange-related movements and net new assets. Net new assets of CHF 4.8 billion mainly reflected inflows from our Swiss ultra-high-net-worth business, Asia Pacific and our external asset manager business.
Assets under management in / end of % change
1Q22 4Q21 1Q21 QoQ YoY
Assets under management (CHF billion)
Assets under management 707.0 742.6 757.0 (4.8) (6.6)
Average assets under management 724.4 754.6 728.8 (4.0) (0.6)
Assets under management by currency (CHF billion)
USD 344.0 366.6 361.6 (6.2) (4.9)
EUR 133.4 143.1 152.3 (6.8) (12.4)
CHF 75.8 78.6 72.4 (3.6) 4.7
Other 153.8 154.3 170.7 (0.3) (9.9)
Assets under management 707.0 742.6 757.0 (4.8) (6.6)
Growth in assets under management (CHF billion)
Net new assets 4.8 (2.9) 14.5 – –
Other effects (40.4) (15.1) 35.6 – –
of which market movements (31.6) 6.8 6.9 – –
of which foreign exchange 6.5 (18.9) 33.0 – –
of which other (15.3) (3.0) (4.3) – –
Growth in assets under management (35.6) (18.0) 50.1 – –
Growth in assets under management (annualized) (%)
Net new assets 2.6 (1.5) 8.2 – –
Other effects (21.8) (8.0) 20.1 – –
Growth in assets under management (annualized) (19.2) (9.5) 28.3 – –
Growth in assets under management (rolling four-quarter average) (%)
Net new assets 0.1 1.5 4.6 – –
Other effects (6.7) 3.6 14.4 – –
Growth in assets under management (rolling
four-quarter average) (6.6) 5.1 19.0 – –
20 Investment Bank
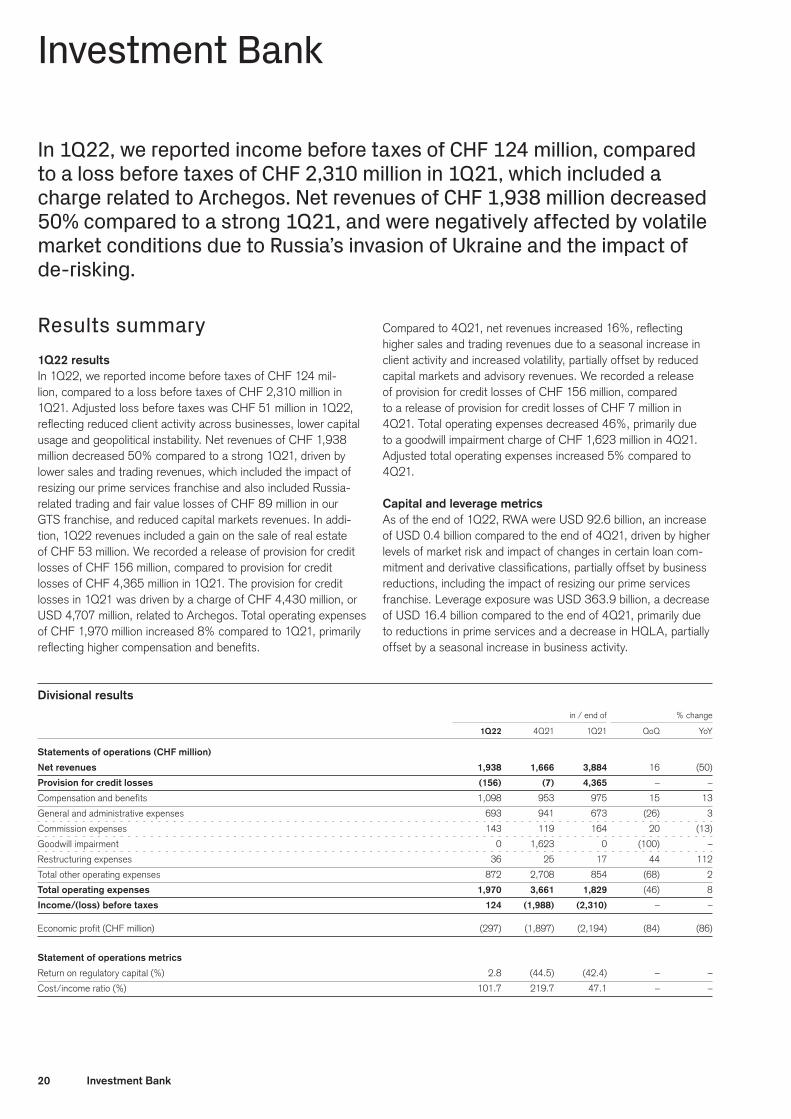
Investment Bank
In 1Q22, we reported income before taxes of CHF 124 million, compared to a loss before taxes of CHF 2,310 million in 1Q21, which included a charge related to Archegos. Net revenues of CHF 1,938 million decreased 50% compared to a strong 1Q21, and were negatively affected by volatile market conditions due to Russia’s invasion of Ukraine and the impact of de-risking.
Results summary1Q22 resultsIn 1Q22, we reported income before taxes of CHF 124 mil-lion, compared to a loss before taxes of CHF 2,310 million in 1Q21. Adjusted loss before taxes was CHF 51 million in 1Q22, reflecting reduced client activity across businesses, lower capital usage and geopolitical instability. Net revenues of CHF 1,938 million decreased 50% compared to a strong 1Q21, driven by lower sales and trading revenues, which included the impact of resizing our prime services franchise and also included Russia-related trading and fair value losses of CHF 89 million in our GTS franchise, and reduced capital markets revenues. In addi-tion, 1Q22 revenues included a gain on the sale of real estate of CHF 53 million. We recorded a release of provision for credit losses of CHF 156 million, compared to provision for credit losses of CHF 4,365 million in 1Q21. The provision for credit losses in 1Q21 was driven by a charge of CHF 4,430 million, or USD 4,707 million, related to Archegos. Total operating expenses of CHF 1,970 million increased 8% compared to 1Q21, primarily reflecting higher compensation and benefits.
Compared to 4Q21, net revenues increased 16%, reflecting higher sales and trading revenues due to a seasonal increase in client activity and increased volatility, partially offset by reduced capital markets and advisory revenues. We recorded a release of provision for credit losses of CHF 156 million, compared to a release of provision for credit losses of CHF 7 million in 4Q21. Total operating expenses decreased 46%, primarily due to a goodwill impairment charge of CHF 1,623 million in 4Q21. Adjusted total operating expenses increased 5% compared to 4Q21.
Capital and leverage metricsAs of the end of 1Q22, RWA were USD 92.6 billion, an increase of USD 0.4 billion compared to the end of 4Q21, driven by higher levels of market risk and impact of changes in certain loan com-mitment and derivative classifications, partially offset by business reductions, including the impact of resizing our prime services franchise. Leverage exposure was USD 363.9 billion, a decrease of USD 16.4 billion compared to the end of 4Q21, primarily due to reductions in prime services and a decrease in HQLA, partially offset by a seasonal increase in business activity.
Divisional results in / end of % change
1Q22 4Q21 1Q21 QoQ YoY
Statements of operations (CHF million)
Net revenues 1,938 1,666 3,884 16 (50)
Provision for credit losses (156) (7) 4,365 – –
Compensation and benefits 1,098 953 975 15 13
General and administrative expenses 693 941 673 (26) 3
Commission expenses 143 119 164 20 (13)
Goodwill impairment 0 1,623 0 (100) –
Restructuring expenses 36 25 17 44 112
Total other operating expenses 872 2,708 854 (68) 2
Total operating expenses 1,970 3,661 1,829 (46) 8
Income/(loss) before taxes 124 (1,988) (2,310) – –
Economic profit (CHF million) (297) (1,897) (2,194) (84) (86)
Statement of operations metrics
Return on regulatory capital (%) 2.8 (44.5) (42.4) – –
Cost/income ratio (%) 101.7 219.7 47.1 – –

21Investment Bank
Divisional results (continued) in / end of % change
1Q22 4Q21 1Q21 QoQ YoY
Net revenue detail (CHF million)
Fixed income sales and trading 741 460 1,469 61 (50)
Equity sales and trading 504 370 937 36 (46)
Capital markets 430 535 1,244 (20) (65)
Advisory and other fees 204 303 235 (33) (13)
Other revenues 1 59 (2) (1) – –
Net revenues 1,938 1,666 3,884 16 (50)
Balance sheet statistics (CHF million)
Total assets 253,958 274,112 356,359 (7) (29)
Net loans 26,725 26,291 24,051 2 11
Risk-weighted assets 85,464 84,313 109,654 1 (22)
Risk-weighted assets (USD) 92,632 92,193 116,527 0 (21)
Leverage exposure 335,763 347,774 417,826 (3) (20)
Leverage exposure (USD) 363,921 380,278 444,012 (4) (18)
1 Other revenues include treasury funding costs and changes in the carrying value of certain investments.
Reconciliation of adjustment items Investment Bank
in 1Q22 4Q21 1Q21
Results (CHF million)
Net revenues 1,938 1,666 3,884
Real estate (gains)/losses (53) 0 0
Archegos (17) 0 0
Adjusted net revenues 1,868 1,666 3,884
Provision for credit losses (156) (7) 4,365
Archegos 155 5 (4,430)
Adjusted provision for credit losses (1) (2) (65)
Total operating expenses 1,970 3,661 1,829
Goodwill impairment 0 (1,623) 0
Restructuring expenses (36) (25) (17)
Major litigation provisions 0 (149) 0
Expenses related to real estate disposals (3) (8) (33)
Archegos (11) (19) 0
Adjusted total operating expenses 1,920 1,837 1,779
Income/(loss) before taxes 124 (1,988) (2,310)
Adjusted income/(loss) before taxes (51) (169) 2,170
Adjusted economic profit (428) (533) 1,165
Adjusted return on regulatory capital (%) (1.2) (3.8) 42.2
Adjusted results are non-GAAP financial measures. Refer to “Reconciliation of adjustment items” in Credit Suisse for further information.
Results detailsFixed income sales and trading In 1Q22, fixed income revenues of CHF 741 million decreased 50% compared to a record 1Q21, reflecting lower revenues across products, including trading losses related to Russia’s invasion of Ukraine. Market conditions were characterized by higher levels of volatility due to geopolitical and macroeconomic uncertainties including increased interest rate volatility, high lev-els of inflation and increased energy prices. Securitized products
revenues decreased significantly compared to a strong prior year, driven by reduced agency and non-agency trading activity. Emerging markets revenues decreased significantly, driven by the trading losses related to Russia’s invasion of Ukraine. In addition, global credit products revenues decreased, reflecting lower lever-aged finance and investment grade trading revenues, particu-larly in the US due to high levels of volatility and reduced trading volumes. Macro products revenues declined, driven by lower revenues in our foreign exchange business, particularly in Turkey, and lower rates revenues.
22 Investment Bank
Compared to 4Q21, revenues increased 61%, reflecting a sea-sonal increase in client activity across securitized products and global credit products as well as an increase in macro revenues, partially offset by lower emerging markets revenues. Securi-tized products revenues increased, driven by higher agency and non-agency trading activity. In addition, global credit products revenues increased, reflecting higher leveraged finance trading activity due to increased volatility and trading volumes. Macro revenues increased, primarily due to higher revenues in our rates business, partially offset mainly by lower foreign exchange rev-enues in Turkey. These increases were partially offset by lower emerging markets revenues, primarily driven by the trading losses related to Russia’s invasion of Ukraine.
Equity sales and tradingIn 1Q22, equity sales and trading revenues of CHF 504 million decreased 46% compared to 1Q21, reflecting lower prime ser-vices, equity derivatives and cash equities results. Prime services revenues decreased, consistent with a decline in client balances in light of our strategy to resize our franchise. Equity derivatives revenues delivered strong results, albeit lower compared to a strong prior year, reflecting lower structured and corporate equity derivatives trading activity. Cash equities revenues decreased compared to a strong prior year, due to lower secondary trading revenues in Asia and the US.
Compared to 4Q21, revenues increased 36%, reflecting higher equity derivatives and cash equities trading activity driven by increased trading volumes and a seasonal increase in client activity, partially offset by lower prime services revenues. Equity derivatives revenues increased significantly, driven by increased structured equity and flow equity derivatives trading revenues due to high levels of volatility. In addition, cash equities revenues increased, driven by higher trading activity across regions. This was partially offset by lower prime services revenues, consistent with a decline in client balances in light of our strategy to resize our franchise.
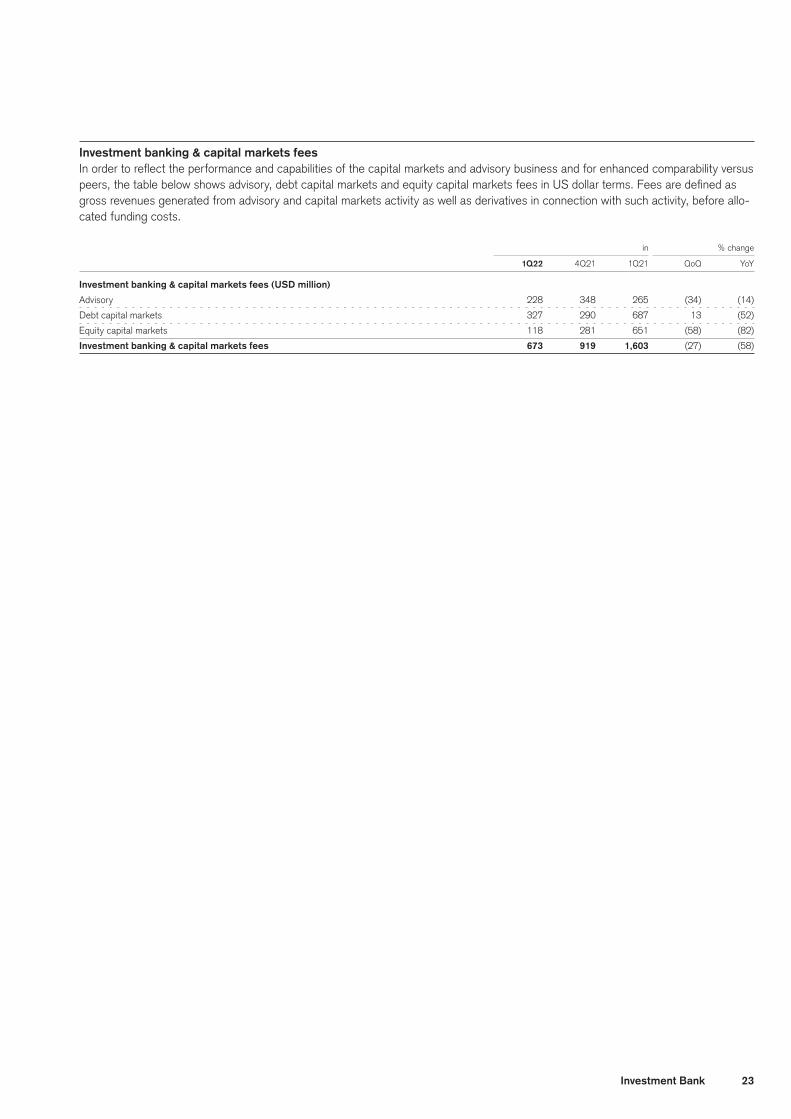
Capital marketsIn 1Q22, capital markets revenues of CHF 430 million decreased 65% compared to a strong 1Q21, reflecting significantly lower street fees across products. Equity capital markets revenues decreased, driven by significantly lower initial public offering (IPO) and follow-on issuance activity. In addition, debt capital markets revenues decreased, driven by lower leveraged finance and invest-ment grade issuance revenues.
Compared to 4Q21, revenues decreased 20%, driven by lower client activity in equity capital markets, partially offset by higher client activity in debt capital markets. Equity capital markets rev-enues decreased, driven by significantly reduced IPO issuance activity due to high levels of market volatility. Debt capital markets increased, reflecting a seasonal increase in client activity.
Advisory and other feesIn 1Q22, advisory revenues of CHF 204 million decreased 13% compared to 1Q21, driven by lower revenues from completed mergers and acquisitions (M&A) transactions.
Compared to 4Q21, revenues decreased 33%, reflecting lower revenues from completed M&A transactions.
Provision for credit lossesIn 1Q22, we recorded a release of provision for credit losses of CHF 156 million, compared to provision for credit losses of CHF 4,365 million in 1Q21 and a release of provision for credit losses of CHF 7 million in 4Q21. 1Q22 included a release of CHF 155 million pertaining to an assessment of the future recover-ability of receivables related to Archegos. The provision for credit losses in 1Q21 was driven by a charge of CHF 4,430 million, or USD 4,707 million, related to Archegos.
Total operating expensesIn 1Q22, total operating expenses of CHF 1,970 million increased 8% compared to 1Q21, primarily reflecting higher compensation and benefits. Compensation and benefits of CHF 1,098 million increased 13%, mainly reflecting higher dis-cretionary compensation expenses. General and administrative expenses of CHF 693 million increased 3%, driven by increased allocated corporate function costs and professional services fees, partially offset by decreased expenses related to real estate dis-posals and decreased revenue-related costs from capital markets transactions. In 1Q22, we incurred restructuring expenses of CHF 36 million.
Compared to 4Q21, total operating expenses decreased 46%, primarily due to the goodwill impairment charge of CHF 1,623 million in 4Q21. Adjusted total operating expenses increased 5% compared to 4Q21. Compensation and benefits increased 15%, mainly reflecting higher deferred compensation expenses from prior year awards. General and administrative expenses decreased 26%, reflecting lower litigation expenses, decreased revenue-related costs from capital markets transactions and decreased allocated corporate functions costs.
23Investment Bank
Investment banking & capital markets feesIn order to reflect the performance and capabilities of the capital markets and advisory business and for enhanced comparability versus peers, the table below shows advisory, debt capital markets and equity capital markets fees in US dollar terms. Fees are defined as gross revenues generated from advisory and capital markets activity as well as derivatives in connection with such activity, before allo-cated funding costs.
in % change
1Q22 4Q21 1Q21 QoQ YoY
Investment banking & capital markets fees (USD million)
Advisory 228 348 265 (34) (14)
Debt capital markets 327 290 687 13 (52)
Equity capital markets 118 281 651 (58) (82)
Investment banking & capital markets fees 673 919 1,603 (27) (58)
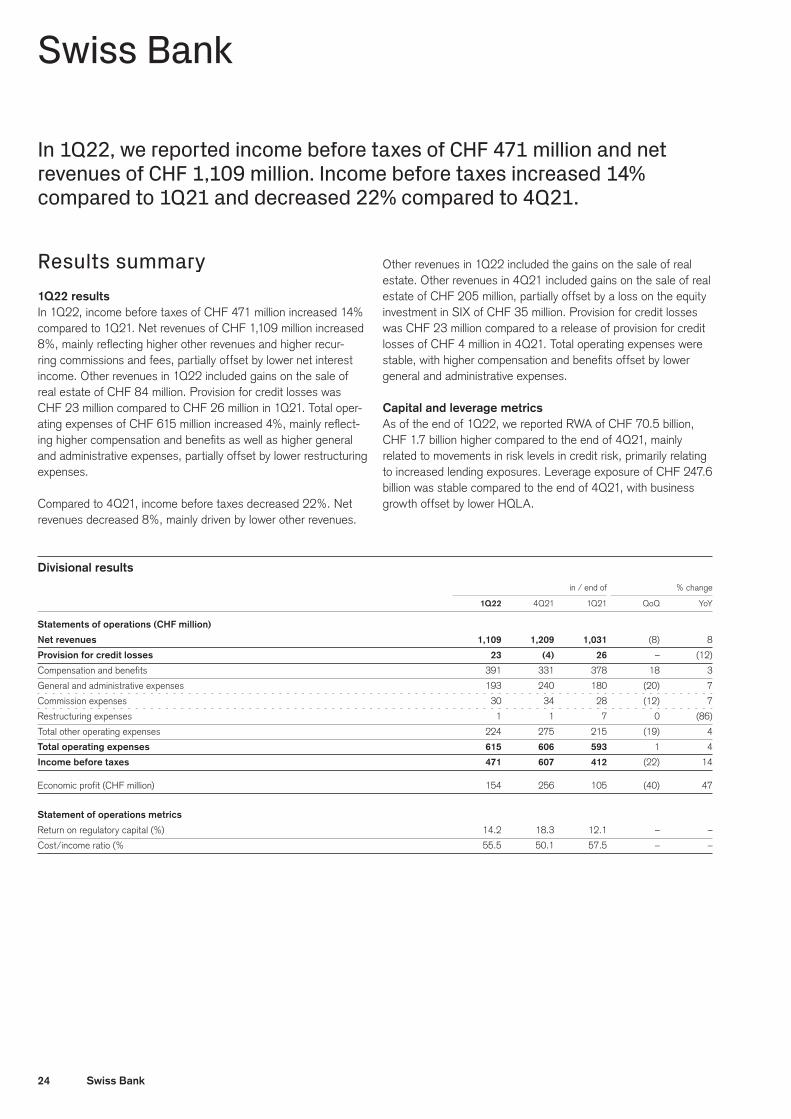
24 Swiss Bank
Swiss Bank
In 1Q22, we reported income before taxes of CHF 471 million and net revenues of CHF 1,109 million. Income before taxes increased 14% compared to 1Q21 and decreased 22% compared to 4Q21.
Results summary1Q22 resultsIn 1Q22, income before taxes of CHF 471 million increased 14% compared to 1Q21. Net revenues of CHF 1,109 million increased 8%, mainly reflecting higher other revenues and higher recur-ring commissions and fees, partially offset by lower net interest income. Other revenues in 1Q22 included gains on the sale of real estate of CHF 84 million. Provision for credit losses was CHF 23 million compared to CHF 26 million in 1Q21. Total oper-ating expenses of CHF 615 million increased 4%, mainly reflect-ing higher compensation and benefits as well as higher general and administrative expenses, partially offset by lower restructuring expenses.
Compared to 4Q21, income before taxes decreased 22%. Net revenues decreased 8%, mainly driven by lower other revenues.
Other revenues in 1Q22 included the gains on the sale of real estate. Other revenues in 4Q21 included gains on the sale of real estate of CHF 205 million, partially offset by a loss on the equity investment in SIX of CHF 35 million. Provision for credit losses was CHF 23 million compared to a release of provision for credit losses of CHF 4 million in 4Q21. Total operating expenses were stable, with higher compensation and benefits offset by lower general and administrative expenses.
Capital and leverage metricsAs of the end of 1Q22, we reported RWA of CHF 70.5 billion, CHF 1.7 billion higher compared to the end of 4Q21, mainly related to movements in risk levels in credit risk, primarily relating to increased lending exposures. Leverage exposure of CHF 247.6 billion was stable compared to the end of 4Q21, with business growth offset by lower HQLA.
Divisional results in / end of % change
1Q22 4Q21 1Q21 QoQ YoY
Statements of operations (CHF million)
Net revenues 1,109 1,209 1,031 (8) 8
Provision for credit losses 23 (4) 26 – (12)
Compensation and benefits 391 331 378 18 3
General and administrative expenses 193 240 180 (20) 7
Commission expenses 30 34 28 (12) 7
Restructuring expenses 1 1 7 0 (86)
Total other operating expenses 224 275 215 (19) 4
Total operating expenses 615 606 593 1 4
Income before taxes 471 607 412 (22) 14
Economic profit (CHF million) 154 256 105 (40) 47
Statement of operations metrics
Return on regulatory capital (%) 14.2 18.3 12.1 – –
Cost/income ratio (% 55.5 50.1 57.5 – –
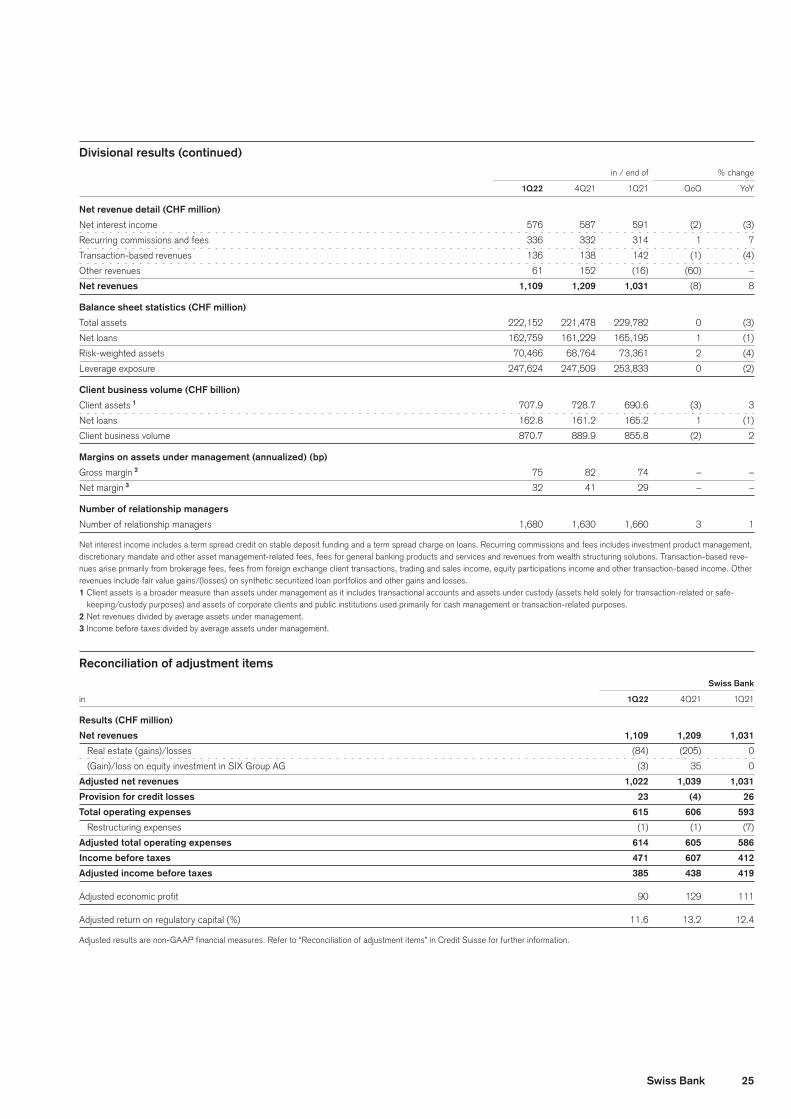
25Swiss Bank
Divisional results (continued) in / end of % change
1Q22 4Q21 1Q21 QoQ YoY
Net revenue detail (CHF million)
Net interest income 576 587 591 (2) (3)
Recurring commissions and fees 336 332 314 1 7
Transaction-based revenues 136 138 142 (1) (4)
Other revenues 61 152 (16) (60) –
Net revenues 1,109 1,209 1,031 (8) 8
Balance sheet statistics (CHF million)
Total assets 222,152 221,478 229,782 0 (3)
Net loans 162,759 161,229 165,195 1 (1)
Risk-weighted assets 70,466 68,764 73,361 2 (4)
Leverage exposure 247,624 247,509 253,833 0 (2)
Client business volume (CHF billion)
Client assets 1 707.9 728.7 690.6 (3) 3
Net loans 162.8 161.2 165.2 1 (1)
Client business volume 870.7 889.9 855.8 (2) 2
Margins on assets under management (annualized) (bp)
Gross margin 2 75 82 74 – –
Net margin 3 32 41 29 – –
Number of relationship managers
Number of relationship managers 1,680 1,630 1,660 3 1
Net interest income includes a term spread credit on stable deposit funding and a term spread charge on loans. Recurring commissions and fees includes investment product management, discretionary mandate and other asset management-related fees, fees for general banking products and services and revenues from wealth structuring solutions. Transaction-based reve-nues arise primarily from brokerage fees, fees from foreign exchange client transactions, trading and sales income, equity participations income and other transaction-based income. Other revenues include fair value gains/(losses) on synthetic securitized loan portfolios and other gains and losses.1 Client assets is a broader measure than assets under management as it includes transactional accounts and assets under custody (assets held solely for transaction-related or safe-
keeping/custody purposes) and assets of corporate clients and public institutions used primarily for cash management or transaction-related purposes.2 Net revenues divided by average assets under management.3 Income before taxes divided by average assets under management.
Reconciliation of adjustment items Swiss Bank
in 1Q22 4Q21 1Q21
Results (CHF million)
Net revenues 1,109 1,209 1,031
Real estate (gains)/losses (84) (205) 0
(Gain)/loss on equity investment in SIX Group AG (3) 35 0
Adjusted net revenues 1,022 1,039 1,031
Provision for credit losses 23 (4) 26
Total operating expenses 615 606 593
Restructuring expenses (1) (1) (7)
Adjusted total operating expenses 614 605 586
Income before taxes 471 607 412
Adjusted income before taxes 385 438 419
Adjusted economic profit 90 129 111
Adjusted return on regulatory capital (%) 11.6 13.2 12.4
Adjusted results are non-GAAP financial measures. Refer to “Reconciliation of adjustment items” in Credit Suisse for further information.
26 Swiss Bank
Results detailsNet revenuesCompared to 1Q21, net revenues of CHF 1,109 million increased 8%, mainly reflecting higher other revenues and higher recur-ring commissions and fees, partially offset by lower net interest income. Other revenues in 1Q22 included gains on the sale of real estate of CHF 84 million. Recurring commissions and fees of CHF 336 million increased 7%, mainly driven by higher revenues from our investment in Swisscard, higher discretionary mandate management fees, higher fees from lending activities and higher banking services fees. Net interest income of CHF 576 mil-lion decreased 3%, primarily reflecting lower treasury revenues and lower loan margins on stable average loan volumes, par-tially offset by higher deposit margins on slightly higher average deposit volumes. Transaction-based revenues of CHF 136 million decreased 4%, mainly driven by lower brokerage and product issuing fees, partially offset by higher fees from foreign exchange client business.
Compared to 4Q21, net revenues decreased 8%, mainly driven by lower other revenues. Other revenues in 1Q22 included the gains on the sale of real estate. Other revenues in 4Q21 included gains on the sale of real estate of CHF 205 million, partially offset by a loss on the equity investment in SIX of CHF 35 mil-lion. Net interest income decreased 2%, mainly reflecting lower treasury revenues and lower loan margins on stable average loan volumes, partially offset by higher deposit margins on stable aver-age deposit volumes. Transaction-based revenues were stable, with lower corporate advisory fees, offset by higher client activity. 4Q21 included a gain on the sale of an equity investment. Recur-ring commissions and fees were stable, with higher fees from lending activities, offset by lower investment product manage-ment fees.
Provision for credit lossesThe loan portfolio is substantially comprised of residential mort-gages in Switzerland, loans secured by real estate, securities and other financial collateral as well as unsecured loans to commercial clients and, to a lesser extent, consumer finance loans.
In 1Q22, we recorded provision for credit losses of CHF 23 mil-lion compared to provision for credit losses of CHF 26 million in 1Q21 and a release of provision for credit losses of CHF 4 million in 4Q21. The provisions in 1Q22 included CHF 14 million related to the sanctions imposed in connection with the Russian invasion of Ukraine as well as provisions related to our consumer finance business.
Total operating expensesCompared to 1Q21, total operating expenses of CHF 615 million increased 4%, mainly reflecting higher compensation and benefits as well as higher general and administrative expenses, partially offset by lower restructuring expenses. Compensation and ben-efits of CHF 391 million increased 3%, primarily reflecting higher allocated corporate function costs and higher deferred compen-sation expenses from prior-year awards. General and administra-tive expenses of CHF 193 million increased 7%, mainly driven by higher occupancy expenses, higher advertising and market-ing expenses as well as higher professional services fees. 1Q21 included restructuring expenses of CHF 7 million.
Compared to 4Q21, total operating expenses were stable, with higher compensation and benefits offset by lower general and administrative expenses. Compensation and benefits increased 18%, mainly driven by higher discretionary compensation expenses and higher allocated corporate function costs. General and administrative expenses decreased 20%, mainly reflecting lower allocated corporate function costs, lower professional ser-vices fees as well as lower advertising and marketing expenses.
MarginsOur gross margin was 75 basis points in 1Q22, an increase of one basis point compared to 1Q21, primarily reflecting higher other revenues, partially offset by a 5.1% increase in average assets under management. Compared to 4Q21, our gross margin was seven basis points lower, mainly driven by lower other rev-enues on stable average assets under management.
> Refer to “Assets under management” for further information.
Our net margin was 32 basis points in 1Q22, an increase of three basis points compared to 1Q21, driven by higher net reve-nues, partially offset by the higher average assets under manage-ment and higher total operating expenses. Compared to 4Q21, our net margin was nine basis points lower, driven by lower net revenues and higher provision for credit losses on stable average assets under management.
Assets under management As of the end of 1Q22, assets under management of CHF 582.5 billion were CHF 15.4 billion lower compared to the end of 4Q21, driven by unfavorable market movements, partially offset by net new assets. Net new assets of CHF 6.0 billion were driven by inflows from our institutional clients business.
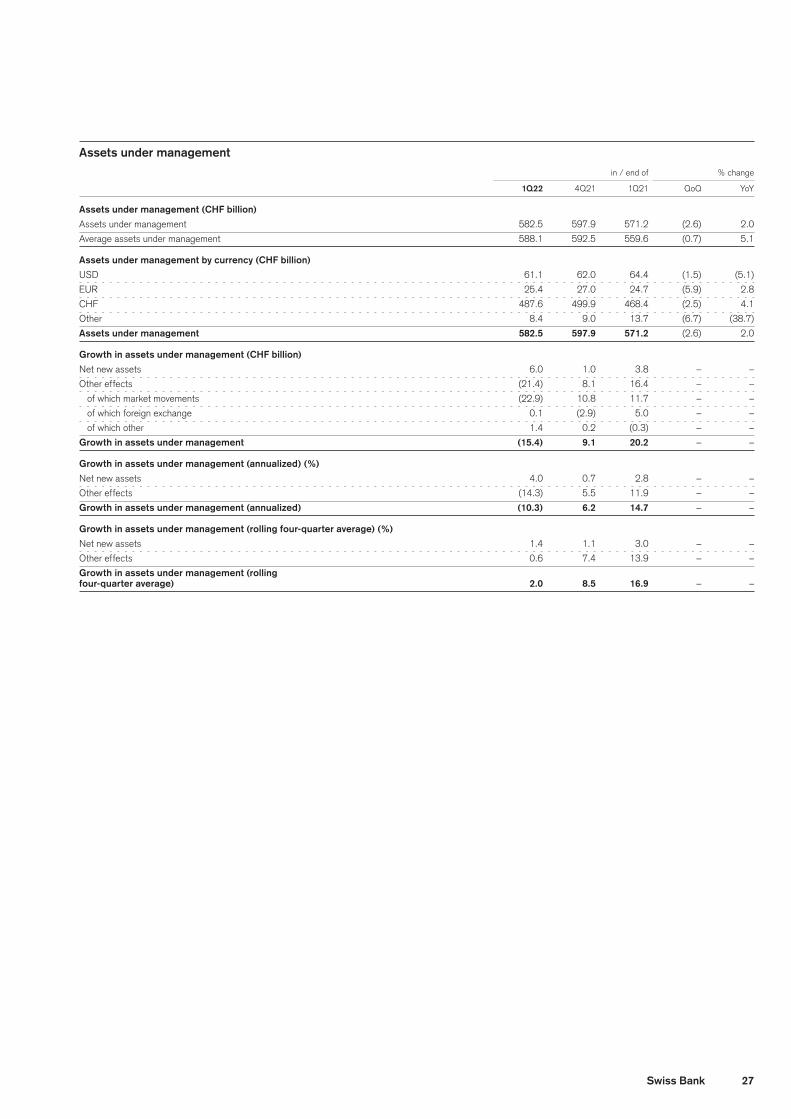
27Swiss Bank
Assets under management in / end of % change
1Q22 4Q21 1Q21 QoQ YoY
Assets under management (CHF billion)
Assets under management 582.5 597.9 571.2 (2.6) 2.0
Average assets under management 588.1 592.5 559.6 (0.7) 5.1
Assets under management by currency (CHF billion)
USD 61.1 62.0 64.4 (1.5) (5.1)
EUR 25.4 27.0 24.7 (5.9) 2.8
CHF 487.6 499.9 468.4 (2.5) 4.1
Other 8.4 9.0 13.7 (6.7) (38.7)
Assets under management 582.5 597.9 571.2 (2.6) 2.0
Growth in assets under management (CHF billion)
Net new assets 6.0 1.0 3.8 – –
Other effects (21.4) 8.1 16.4 – –
of which market movements (22.9) 10.8 11.7 – –
of which foreign exchange 0.1 (2.9) 5.0 – –
of which other 1.4 0.2 (0.3) – –
Growth in assets under management (15.4) 9.1 20.2 – –
Growth in assets under management (annualized) (%)
Net new assets 4.0 0.7 2.8 – –
Other effects (14.3) 5.5 11.9 – –
Growth in assets under management (annualized) (10.3) 6.2 14.7 – –
Growth in assets under management (rolling four-quarter average) (%)
Net new assets 1.4 1.1 3.0 – –
Other effects 0.6 7.4 13.9 – –
Growth in assets under management (rolling
four-quarter average) 2.0 8.5 16.9 – –
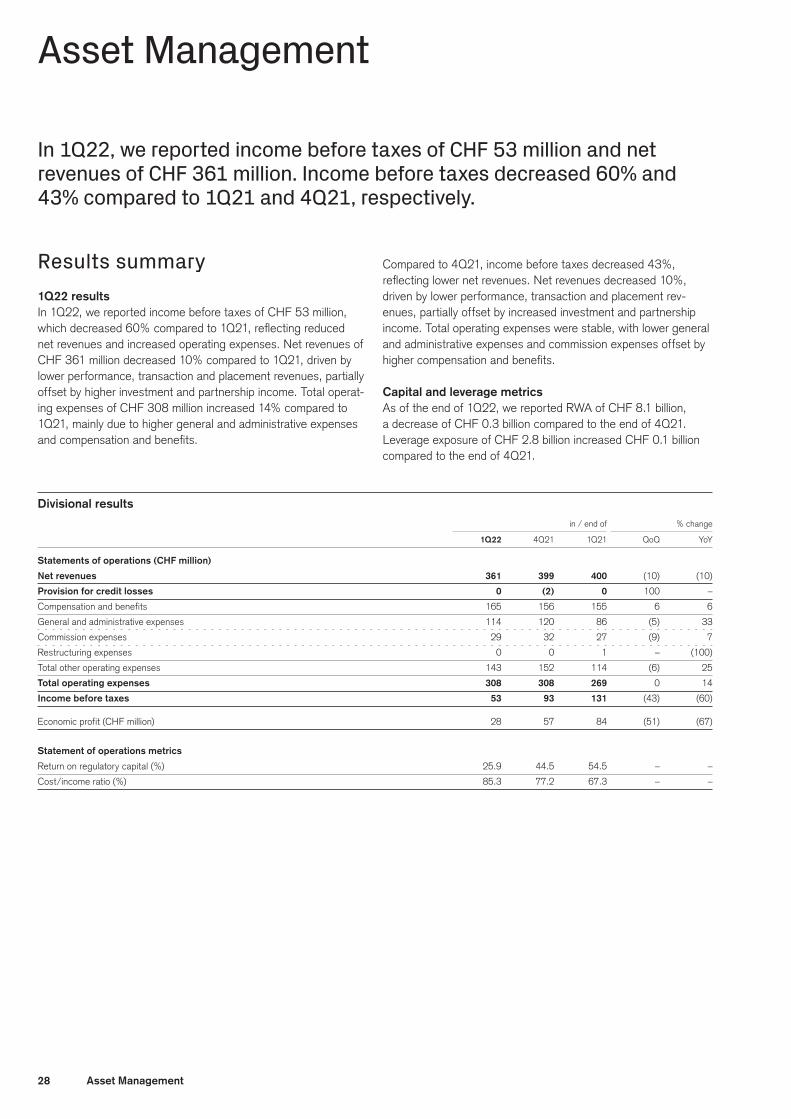
28 Asset Management
Asset Management
In 1Q22, we reported income before taxes of CHF 53 million and net revenues of CHF 361 million. Income before taxes decreased 60% and 43% compared to 1Q21 and 4Q21, respectively.
Results summary1Q22 resultsIn 1Q22, we reported income before taxes of CHF 53 million, which decreased 60% compared to 1Q21, reflecting reduced net revenues and increased operating expenses. Net revenues of CHF 361 million decreased 10% compared to 1Q21, driven by lower performance, transaction and placement revenues, partially offset by higher investment and partnership income. Total operat-ing expenses of CHF 308 million increased 14% compared to 1Q21, mainly due to higher general and administrative expenses and compensation and benefits.
Compared to 4Q21, income before taxes decreased 43%, reflecting lower net revenues. Net revenues decreased 10%, driven by lower performance, transaction and placement rev-enues, partially offset by increased investment and partnership income. Total operating expenses were stable, with lower general and administrative expenses and commission expenses offset by higher compensation and benefits.
Capital and leverage metrics As of the end of 1Q22, we reported RWA of CHF 8.1 billion, a decrease of CHF 0.3 billion compared to the end of 4Q21. Leverage exposure of CHF 2.8 billion increased CHF 0.1 billion compared to the end of 4Q21.
Divisional results in / end of % change
1Q22 4Q21 1Q21 QoQ YoY
Statements of operations (CHF million)
Net revenues 361 399 400 (10) (10)
Provision for credit losses 0 (2) 0 100 –
Compensation and benefits 165 156 155 6 6
General and administrative expenses 114 120 86 (5) 33
Commission expenses 29 32 27 (9) 7
Restructuring expenses 0 0 1 – (100)
Total other operating expenses 143 152 114 (6) 25
Total operating expenses 308 308 269 0 14
Income before taxes 53 93 131 (43) (60)
Economic profit (CHF million) 28 57 84 (51) (67)
Statement of operations metrics
Return on regulatory capital (%) 25.9 44.5 54.5 – –
Cost/income ratio (%) 85.3 77.2 67.3 – –
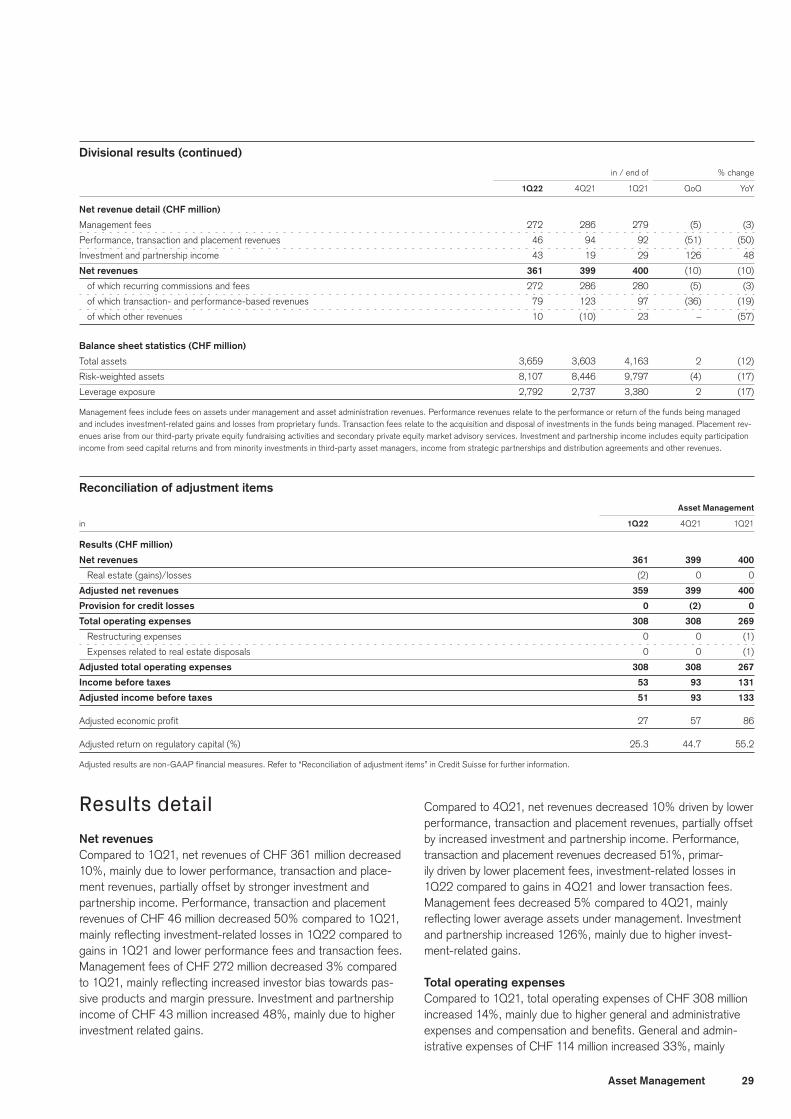
29Asset Management
Divisional results (continued) in / end of % change
1Q22 4Q21 1Q21 QoQ YoY
Net revenue detail (CHF million)
Management fees 272 286 279 (5) (3)
Performance, transaction and placement revenues 46 94 92 (51) (50)
Investment and partnership income 43 19 29 126 48
Net revenues 361 399 400 (10) (10)
of which recurring commissions and fees 272 286 280 (5) (3)
of which transaction- and performance-based revenues 79 123 97 (36) (19)
of which other revenues 10 (10) 23 – (57)
Balance sheet statistics (CHF million)
Total assets 3,659 3,603 4,163 2 (12)
Risk-weighted assets 8,107 8,446 9,797 (4) (17)
Leverage exposure 2,792 2,737 3,380 2 (17)
Management fees include fees on assets under management and asset administration revenues. Performance revenues relate to the performance or return of the funds being managed and includes investment-related gains and losses from proprietary funds. Transaction fees relate to the acquisition and disposal of investments in the funds being managed. Placement rev-enues arise from our third-party private equity fundraising activities and secondary private equity market advisory services. Investment and partnership income includes equity participation income from seed capital returns and from minority investments in third-party asset managers, income from strategic partnerships and distribution agreements and other revenues.
Reconciliation of adjustment items Asset Management
in 1Q22 4Q21 1Q21
Results (CHF million)
Net revenues 361 399 400
Real estate (gains)/losses (2) 0 0
Adjusted net revenues 359 399 400
Provision for credit losses 0 (2) 0
Total operating expenses 308 308 269
Restructuring expenses 0 0 (1)
Expenses related to real estate disposals 0 0 (1)
Adjusted total operating expenses 308 308 267
Income before taxes 53 93 131
Adjusted income before taxes 51 93 133
Adjusted economic profit 27 57 86
Adjusted return on regulatory capital (%) 25.3 44.7 55.2
Adjusted results are non-GAAP financial measures. Refer to “Reconciliation of adjustment items” in Credit Suisse for further information.
Results detail Net revenuesCompared to 1Q21, net revenues of CHF 361 million decreased 10%, mainly due to lower performance, transaction and place-ment revenues, partially offset by stronger investment and partnership income. Performance, transaction and placement revenues of CHF 46 million decreased 50% compared to 1Q21, mainly reflecting investment-related losses in 1Q22 compared to gains in 1Q21 and lower performance fees and transaction fees. Management fees of CHF 272 million decreased 3% compared to 1Q21, mainly reflecting increased investor bias towards pas-sive products and margin pressure. Investment and partnership income of CHF 43 million increased 48%, mainly due to higher investment related gains.
Compared to 4Q21, net revenues decreased 10% driven by lower performance, transaction and placement revenues, partially offset by increased investment and partnership income. Performance, transaction and placement revenues decreased 51%, primar-ily driven by lower placement fees, investment-related losses in 1Q22 compared to gains in 4Q21 and lower transaction fees. Management fees decreased 5% compared to 4Q21, mainly reflecting lower average assets under management. Investment and partnership increased 126%, mainly due to higher invest-ment-related gains.
Total operating expensesCompared to 1Q21, total operating expenses of CHF 308 million increased 14%, mainly due to higher general and administrative expenses and compensation and benefits. General and admin-istrative expenses of CHF 114 million increased 33%, mainly

30 Asset Management
reflecting increased professional services fees relating to the wind down and administration of our supply chain finance funds and higher Group-wide technology, risk and compliance costs. Com-pensation and benefits of CHF 165 million increased 6%, primar-ily driven by higher discretionary compensation expenses, partially offset by lower salary expenses, mainly related to the sale of a private equity investment of a fund in 1Q21.
Compared to 4Q21, total operating expenses were stable, with lower general and administrative expenses and commission expenses offset by higher compensation and benefits. Gen-eral and administrative expenses decreased 5%, mainly driven by lower professional services fees relating to the wind down and administration of our supply chain finance funds. Compensation and benefits increased 6%, primarily driven by higher deferred compensation expenses from prior-year awards.
Assets under managementAs of the end of 1Q22, assets under management of CHF 462.0 billion were CHF 14.8 billion lower compared to the end of 4Q21, reflecting unfavorable market movements and net asset outflows of CHF 0.6 billion, partially offset by favorable foreign exchange-related movements. Net asset outflows were mainly driven by outflows from alternative investments, partially offset by inflows from investments and partnerships, primarily related to an emerg-ing markets joint venture, and from traditional investments, pri-marily related to index solutions despite outflows in fixed income and equities.
Assets under management in / end of % change
1Q22 4Q21 1Q21 QoQ YoY
Assets under management (CHF billion)
Traditional investments 291.5 306.6 291.7 (4.9) (0.1)
Alternative investments 116.9 116.3 116.7 0.5 0.2
Investments and partnerships 53.6 53.9 49.6 (0.6) 8.1
Assets under management 462.0 476.8 458.0 (3.1) 0.9
Average assets under management 467.8 472.0 450.5 (0.9) 3.8
Assets under management by currency (CHF billion)
USD 114.0 120.8 126.7 (5.6) (10.0)
EUR 52.9 57.4 57.3 (7.8) (7.7)
CHF 234.7 238.7 219.9 (1.7) 6.7
Other 60.4 59.9 54.1 0.8 11.6
Assets under management 462.0 476.8 458.0 (3.1) 0.9
Growth in assets under management (CHF billion)
Net new assets 1 (0.6) 4.7 10.3 – –
Other effects (14.2) (2.6) 7.4 – –
of which market movements (15.0) 3.5 5.5 – –
of which foreign exchange 1.7 (6.2) 12.2 – –
of which other (0.9) 0.1 (10.3) 2 – –
Growth in assets under management (14.8) 2.1 17.7 – –
Growth in assets under management (annualized) (%)
Net new assets (0.5) 4.0 9.4 – –
Other effects (11.9) (2.2) 6.7 – –
Growth in assets under management (annualized) (12.4) 1.8 16.1 – –
Growth in assets under management (rolling four-quarter average) (%)
Net new assets 0.8 3.3 6.3 – –
Other effects 0.1 5.0 5.5 – –
Growth in assets under management (rolling
four-quarter average) 0.9 8.3 11.8 – –
1 Includes outflows for private equity assets reflecting realizations at cost and unfunded commitments on which a fee is no longer earned.2 Includes CHF 7.9 billion relating to the exit of our supply chain finance funds business.

31Corporate Center
Corporate Center
In 1Q22, we reported a loss before taxes of CHF 719 million compared to income before taxes of CHF 32 million in 1Q21 and a loss before taxes of CHF 533 million in 4Q21.
Corporate Center compositionCorporate Center includes parent company operations such as Group financing, expenses for projects sponsored by the Group, including costs associated with the evolution of our legal entity structure to meet developing and future regulatory requirements, and certain other expenses and revenues that have not been allocated to the segments. Corporate Center further includes consolidation and elimination adjustments required to eliminate intercompany revenues and expenses.
Treasury results include the impact of volatility in the valuations of certain central funding transactions such as structured notes issuances and swap transactions. Treasury results also include additional interest charges from transfer pricing to align funding costs to assets held in the Corporate Center and legacy funding costs. The Asset Resolution Unit is separately presented within our Corporate Center disclosures, including related asset fund-ing costs. Certain activities not linked to the underlying portfolio, such as legacy funding costs, legacy litigation provisions, a spe-cific client compliance function and noncontrolling interests with-out significant economic interest are recorded in the Corporate Center and are not reflected in the Asset Resolution Unit. Other revenues primarily include required elimination adjustments asso-ciated with trading in own shares, treasury commissions charged to divisions, the cost of certain hedging transactions executed in
connection with the Group’s RWA and valuation hedging impacts from long-dated legacy deferred compensation and retirement programs mainly relating to former employees.
Compensation and benefits include fair value adjustments on cer-tain deferred compensation plans not allocated to the segments and fair value adjustments on certain other long-dated legacy deferred compensation and retirement programs mainly relating to former employees.
Results summary1Q22 resultsIn 1Q22, we reported a loss before taxes of CHF 719 million compared to income before taxes of CHF 32 million in 1Q21 and a loss before taxes of CHF 533 million in 4Q21. Negative net revenues of CHF 173 million in 1Q22 were primarily driven by negative treasury results. Total operating expenses of CHF 547 million increased 260% compared to 1Q21, mainly due to higher general and administrative expenses, driven by higher litigation provisions of CHF 435 million in 1Q22, mainly legacy litigation provisions in connection with mortgage-related matters. Com-pared to 4Q21, total operating expenses increased 18%, mainly driven by higher compensation and benefits and higher general and administrative expenses.
Corporate Center results in / end of % change
1Q22 4Q21 1Q21 QoQ YoY
Statements of operations (CHF million)
Treasury results (254) (130) 129 95 –
Asset Resolution Unit 39 17 (33) 129 –
Other 42 44 78 (5) (46)
Net revenues (173) (69) 174 151 –
Provision for credit losses (1) 0 (10) – (90)
Compensation and benefits 55 5 35 – 57
General and administrative expenses 486 446 102 9 376
Commission expenses 7 13 18 (46) (61)
Restructuring expenses (1) 0 (3) – (67)
Total other operating expenses 492 459 117 7 321
Total operating expenses 547 464 152 18 260
Income/(loss) before taxes (719) (533) 32 35 –
of which Asset Resolution Unit 10 (10) (68) – –
Balance sheet statistics (CHF million)
Total assets 55,529 55,314 57,497 0 (3)
Risk-weighted assets 48,780 46,290 41,927 5 16
Leverage exposure 58,384 57,889 61,749 1 (5)
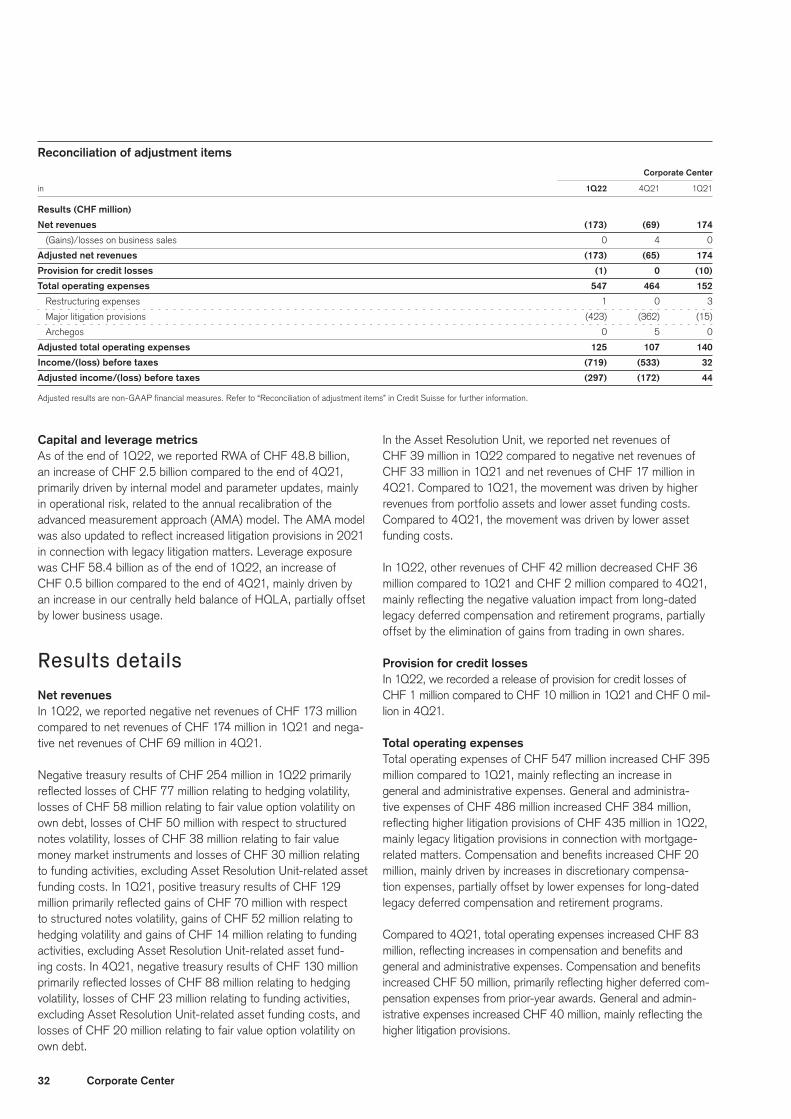
32 Corporate Center
Reconciliation of adjustment items Corporate Center
in 1Q22 4Q21 1Q21
Results (CHF million)
Net revenues (173) (69) 174
(Gains)/losses on business sales 0 4 0
Adjusted net revenues (173) (65) 174
Provision for credit losses (1) 0 (10)
Total operating expenses 547 464 152
Restructuring expenses 1 0 3
Major litigation provisions (423) (362) (15)
Archegos 0 5 0
Adjusted total operating expenses 125 107 140
Income/(loss) before taxes (719) (533) 32
Adjusted income/(loss) before taxes (297) (172) 44
Adjusted results are non-GAAP financial measures. Refer to “Reconciliation of adjustment items” in Credit Suisse for further information.
Capital and leverage metrics As of the end of 1Q22, we reported RWA of CHF 48.8 billion, an increase of CHF 2.5 billion compared to the end of 4Q21, primarily driven by internal model and parameter updates, mainly in operational risk, related to the annual recalibration of the advanced measurement approach (AMA) model. The AMA model was also updated to reflect increased litigation provisions in 2021 in connection with legacy litigation matters. Leverage exposure was CHF 58.4 billion as of the end of 1Q22, an increase of CHF 0.5 billion compared to the end of 4Q21, mainly driven by an increase in our centrally held balance of HQLA, partially offset by lower business usage.
Results detailsNet revenuesIn 1Q22, we reported negative net revenues of CHF 173 million compared to net revenues of CHF 174 million in 1Q21 and nega-tive net revenues of CHF 69 million in 4Q21.
Negative treasury results of CHF 254 million in 1Q22 primarily reflected losses of CHF 77 million relating to hedging volatility, losses of CHF 58 million relating to fair value option volatility on own debt, losses of CHF 50 million with respect to structured notes volatility, losses of CHF 38 million relating to fair value money market instruments and losses of CHF 30 million relating to funding activities, excluding Asset Resolution Unit-related asset funding costs. In 1Q21, positive treasury results of CHF 129 million primarily reflected gains of CHF 70 million with respect to structured notes volatility, gains of CHF 52 million relating to hedging volatility and gains of CHF 14 million relating to funding activities, excluding Asset Resolution Unit-related asset fund-ing costs. In 4Q21, negative treasury results of CHF 130 million primarily reflected losses of CHF 88 million relating to hedging volatility, losses of CHF 23 million relating to funding activities, excluding Asset Resolution Unit-related asset funding costs, and losses of CHF 20 million relating to fair value option volatility on own debt.
In the Asset Resolution Unit, we reported net revenues of CHF 39 million in 1Q22 compared to negative net revenues of CHF 33 million in 1Q21 and net revenues of CHF 17 million in 4Q21. Compared to 1Q21, the movement was driven by higher revenues from portfolio assets and lower asset funding costs. Compared to 4Q21, the movement was driven by lower asset funding costs.
In 1Q22, other revenues of CHF 42 million decreased CHF 36 million compared to 1Q21 and CHF 2 million compared to 4Q21, mainly reflecting the negative valuation impact from long-dated legacy deferred compensation and retirement programs, partially offset by the elimination of gains from trading in own shares.
Provision for credit lossesIn 1Q22, we recorded a release of provision for credit losses of CHF 1 million compared to CHF 10 million in 1Q21 and CHF 0 mil-lion in 4Q21.
Total operating expensesTotal operating expenses of CHF 547 million increased CHF 395 million compared to 1Q21, mainly reflecting an increase in general and administrative expenses. General and administra-tive expenses of CHF 486 million increased CHF 384 million, reflecting higher litigation provisions of CHF 435 million in 1Q22, mainly legacy litigation provisions in connection with mortgage-related matters. Compensation and benefits increased CHF 20 million, mainly driven by increases in discretionary compensa-tion expenses, partially offset by lower expenses for long-dated legacy deferred compensation and retirement programs.
Compared to 4Q21, total operating expenses increased CHF 83 million, reflecting increases in compensation and benefits and general and administrative expenses. Compensation and benefits increased CHF 50 million, primarily reflecting higher deferred com-pensation expenses from prior-year awards. General and admin-istrative expenses increased CHF 40 million, mainly reflecting the higher litigation provisions.
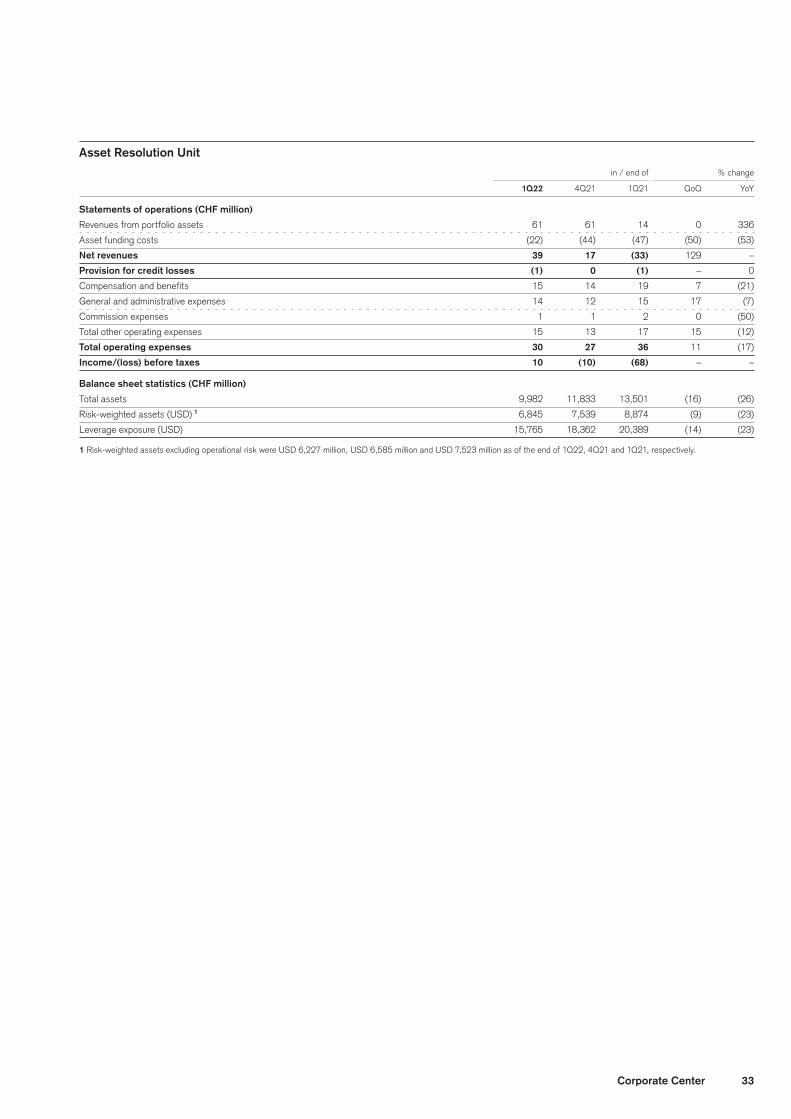
33Corporate Center
Asset Resolution Unit in / end of % change
1Q22 4Q21 1Q21 QoQ YoY
Statements of operations (CHF million)
Revenues from portfolio assets 61 61 14 0 336
Asset funding costs (22) (44) (47) (50) (53)
Net revenues 39 17 (33) 129 –
Provision for credit losses (1) 0 (1) – 0
Compensation and benefits 15 14 19 7 (21)
General and administrative expenses 14 12 15 17 (7)
Commission expenses 1 1 2 0 (50)
Total other operating expenses 15 13 17 15 (12)
Total operating expenses 30 27 36 11 (17)
Income/(loss) before taxes 10 (10) (68) – –
Balance sheet statistics (CHF million)
Total assets 9,982 11,833 13,501 (16) (26)
Risk-weighted assets (USD) 1 6,845 7,539 8,874 (9) (23)
Leverage exposure (USD) 15,765 18,362 20,389 (14) (23)
1 Risk-weighted assets excluding operational risk were USD 6,227 million, USD 6,585 million and USD 7,523 million as of the end of 1Q22, 4Q21 and 1Q21, respectively.
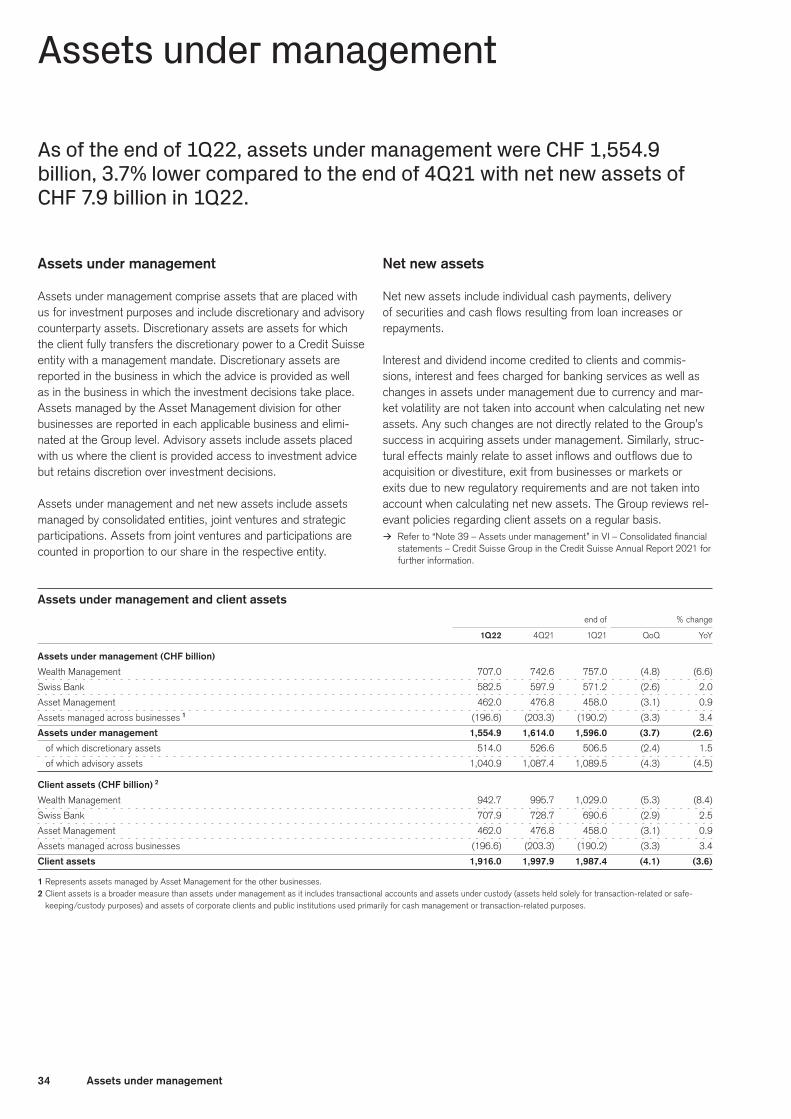
34 Assets under management
Assets under management
As of the end of 1Q22, assets under management were CHF 1,554.9 billion, 3.7% lower compared to the end of 4Q21 with net new assets of CHF 7.9 billion in 1Q22.
Assets under management
Assets under management comprise assets that are placed with us for investment purposes and include discretionary and advisory counterparty assets. Discretionary assets are assets for which the client fully transfers the discretionary power to a Credit Suisse entity with a management mandate. Discretionary assets are reported in the business in which the advice is provided as well as in the business in which the investment decisions take place. Assets managed by the Asset Management division for other businesses are reported in each applicable business and elimi-nated at the Group level. Advisory assets include assets placed with us where the client is provided access to investment advice but retains discretion over investment decisions.
Assets under management and net new assets include assets managed by consolidated entities, joint ventures and strategic participations. Assets from joint ventures and participations are counted in proportion to our share in the respective entity.
Net new assets
Net new assets include individual cash payments, delivery of securities and cash flows resulting from loan increases or repayments.
Interest and dividend income credited to clients and commis-sions, interest and fees charged for banking services as well as changes in assets under management due to currency and mar-ket volatility are not taken into account when calculating net new assets. Any such changes are not directly related to the Group’s success in acquiring assets under management. Similarly, struc-tural effects mainly relate to asset inflows and outflows due to acquisition or divestiture, exit from businesses or markets or exits due to new regulatory requirements and are not taken into account when calculating net new assets. The Group reviews rel-evant policies regarding client assets on a regular basis.
> Refer to “Note 39 – Assets under management” in VI – Consolidated financial statements – Credit Suisse Group in the Credit Suisse Annual Report 2021 for further information.
Assets under management and client assets end of % change
1Q22 4Q21 1Q21 QoQ YoY
Assets under management (CHF billion)
Wealth Management 707.0 742.6 757.0 (4.8) (6.6)
Swiss Bank 582.5 597.9 571.2 (2.6) 2.0
Asset Management 462.0 476.8 458.0 (3.1) 0.9
Assets managed across businesses 1 (196.6) (203.3) (190.2) (3.3) 3.4
Assets under management 1,554.9 1,614.0 1,596.0 (3.7) (2.6)
of which discretionary assets 514.0 526.6 506.5 (2.4) 1.5
of which advisory assets 1,040.9 1,087.4 1,089.5 (4.3) (4.5)
Client assets (CHF billion) 2
Wealth Management 942.7 995.7 1,029.0 (5.3) (8.4)
Swiss Bank 707.9 728.7 690.6 (2.9) 2.5
Asset Management 462.0 476.8 458.0 (3.1) 0.9
Assets managed across businesses (196.6) (203.3) (190.2) (3.3) 3.4
Client assets 1,916.0 1,997.9 1,987.4 (4.1) (3.6)
1 Represents assets managed by Asset Management for the other businesses.2 Client assets is a broader measure than assets under management as it includes transactional accounts and assets under custody (assets held solely for transaction-related or safe-
keeping/custody purposes) and assets of corporate clients and public institutions used primarily for cash management or transaction-related purposes.
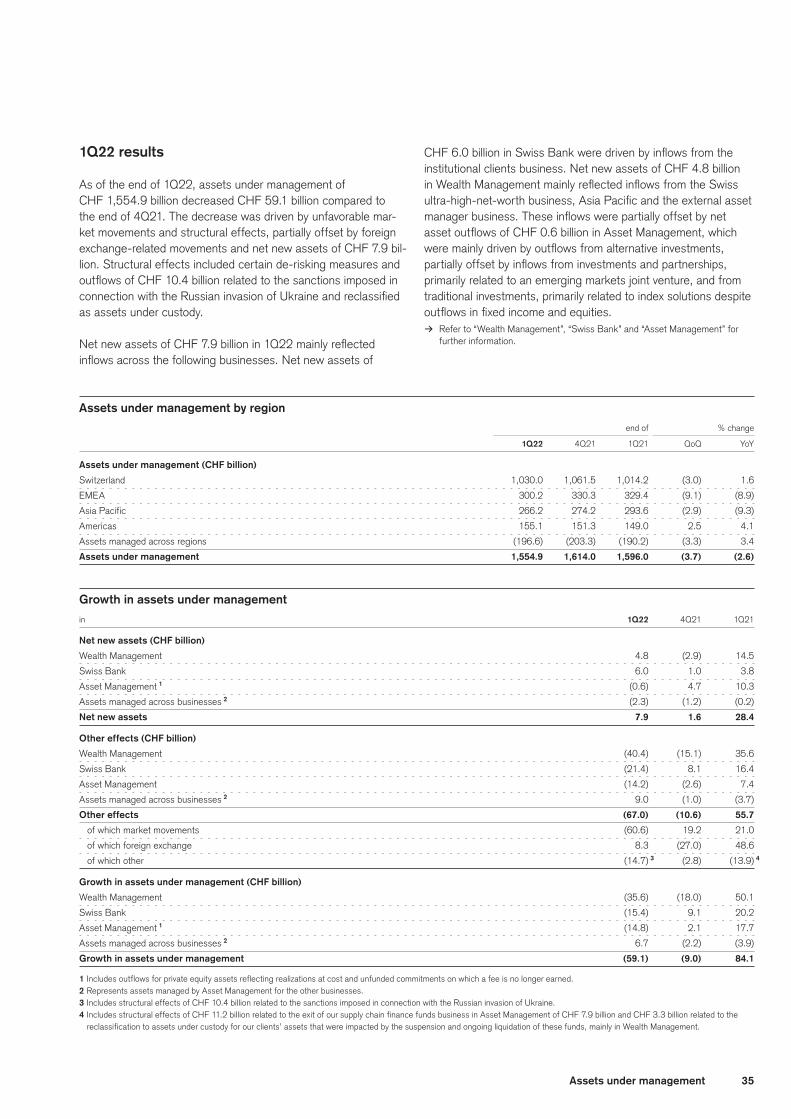
35Assets under management
1Q22 results
As of the end of 1Q22, assets under management of CHF 1,554.9 billion decreased CHF 59.1 billion compared to the end of 4Q21. The decrease was driven by unfavorable mar-ket movements and structural effects, partially offset by foreign exchange-related movements and net new assets of CHF 7.9 bil-lion. Structural effects included certain de-risking measures and outflows of CHF 10.4 billion related to the sanctions imposed in connection with the Russian invasion of Ukraine and reclassified as assets under custody.
Net new assets of CHF 7.9 billion in 1Q22 mainly reflected inflows across the following businesses. Net new assets of
CHF 6.0 billion in Swiss Bank were driven by inflows from the institutional clients business. Net new assets of CHF 4.8 billion in Wealth Management mainly reflected inflows from the Swiss ultra-high-net-worth business, Asia Pacific and the external asset manager business. These inflows were partially offset by net asset outflows of CHF 0.6 billion in Asset Management, which were mainly driven by outflows from alternative investments, partially offset by inflows from investments and partnerships, primarily related to an emerging markets joint venture, and from traditional investments, primarily related to index solutions despite outflows in fixed income and equities.
> Refer to “Wealth Management”, “Swiss Bank” and “Asset Management” for further information.
Assets under management by region end of % change
1Q22 4Q21 1Q21 QoQ YoY
Assets under management (CHF billion)
Switzerland 1,030.0 1,061.5 1,014.2 (3.0) 1.6
EMEA 300.2 330.3 329.4 (9.1) (8.9)
Asia Pacific 266.2 274.2 293.6 (2.9) (9.3)
Americas 155.1 151.3 149.0 2.5 4.1
Assets managed across regions (196.6) (203.3) (190.2) (3.3) 3.4
Assets under management 1,554.9 1,614.0 1,596.0 (3.7) (2.6)
Growth in assets under management
in 1Q22 4Q21 1Q21
Net new assets (CHF billion)
Wealth Management 4.8 (2.9) 14.5
Swiss Bank 6.0 1.0 3.8
Asset Management 1 (0.6) 4.7 10.3
Assets managed across businesses 2 (2.3) (1.2) (0.2)
Net new assets 7.9 1.6 28.4
Other effects (CHF billion)
Wealth Management (40.4) (15.1) 35.6
Swiss Bank (21.4) 8.1 16.4
Asset Management (14.2) (2.6) 7.4
Assets managed across businesses 2 9.0 (1.0) (3.7)
Other effects (67.0) (10.6) 55.7
of which market movements (60.6) 19.2 21.0
of which foreign exchange 8.3 (27.0) 48.6
of which other (14.7) 3 (2.8) (13.9) 4
Growth in assets under management (CHF billion)
Wealth Management (35.6) (18.0) 50.1
Swiss Bank (15.4) 9.1 20.2
Asset Management 1 (14.8) 2.1 17.7
Assets managed across businesses 2 6.7 (2.2) (3.9)
Growth in assets under management (59.1) (9.0) 84.1
1 Includes outflows for private equity assets reflecting realizations at cost and unfunded commitments on which a fee is no longer earned.2 Represents assets managed by Asset Management for the other businesses.3 Includes structural effects of CHF 10.4 billion related to the sanctions imposed in connection with the Russian invasion of Ukraine.4 Includes structural effects of CHF 11.2 billion related to the exit of our supply chain finance funds business in Asset Management of CHF 7.9 billion and CHF 3.3 billion related to the
reclassification to assets under custody for our clients’ assets that were impacted by the suspension and ongoing liquidation of these funds, mainly in Wealth Management.
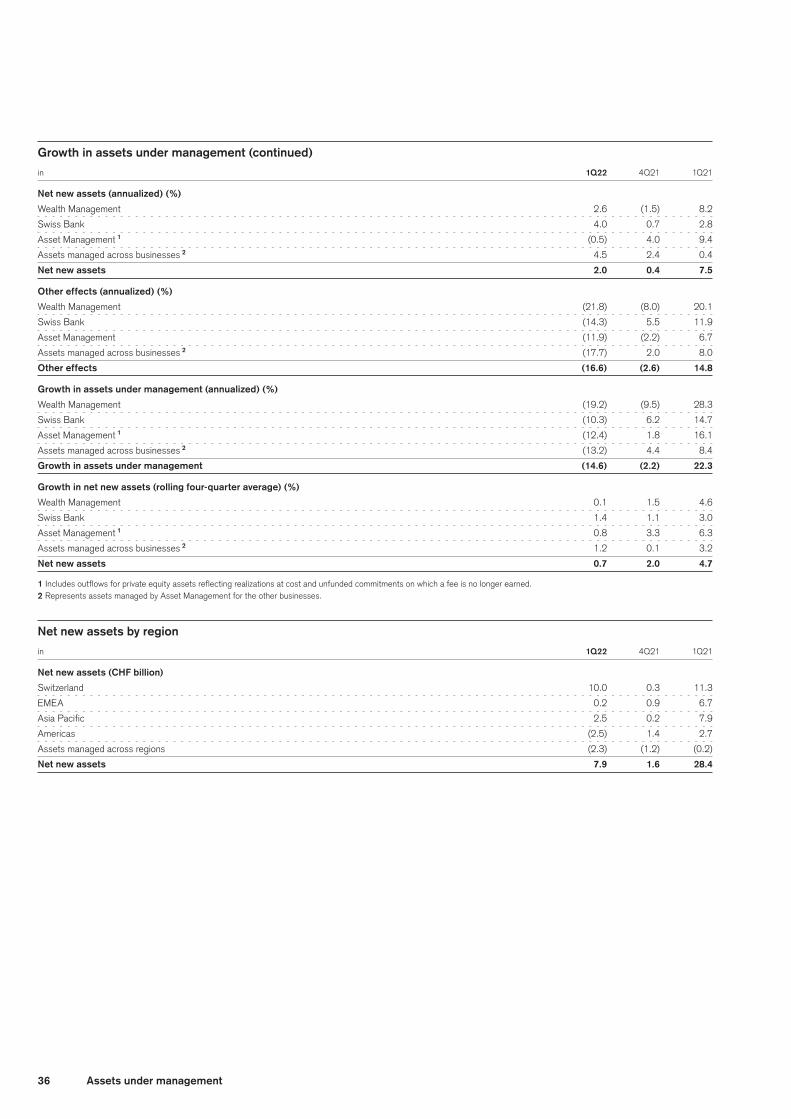
36 Assets under management
Growth in assets under management (continued)
in 1Q22 4Q21 1Q21
Net new assets (annualized) (%)
Wealth Management 2.6 (1.5) 8.2
Swiss Bank 4.0 0.7 2.8
Asset Management 1 (0.5) 4.0 9.4
Assets managed across businesses 2 4.5 2.4 0.4
Net new assets 2.0 0.4 7.5
Other effects (annualized) (%)
Wealth Management (21.8) (8.0) 20.1
Swiss Bank (14.3) 5.5 11.9
Asset Management (11.9) (2.2) 6.7
Assets managed across businesses 2 (17.7) 2.0 8.0
Other effects (16.6) (2.6) 14.8
Growth in assets under management (annualized) (%)
Wealth Management (19.2) (9.5) 28.3
Swiss Bank (10.3) 6.2 14.7
Asset Management 1 (12.4) 1.8 16.1
Assets managed across businesses 2 (13.2) 4.4 8.4
Growth in assets under management (14.6) (2.2) 22.3
Growth in net new assets (rolling four-quarter average) (%)
Wealth Management 0.1 1.5 4.6
Swiss Bank 1.4 1.1 3.0
Asset Management 1 0.8 3.3 6.3
Assets managed across businesses 2 1.2 0.1 3.2
Net new assets 0.7 2.0 4.7
1 Includes outflows for private equity assets reflecting realizations at cost and unfunded commitments on which a fee is no longer earned.2 Represents assets managed by Asset Management for the other businesses.
Net new assets by region
in 1Q22 4Q21 1Q21
Net new assets (CHF billion)
Switzerland 10.0 0.3 11.3
EMEA 0.2 0.9 6.7
Asia Pacific 2.5 0.2 7.9
Americas (2.5) 1.4 2.7
Assets managed across regions (2.3) (1.2) (0.2)
Net new assets 7.9 1.6 28.4
37
II – Treasury, risk, balance sheet and off-balance sheetLiquidity and funding management 38
Capital management 43
Risk management 52
Balance sheet and off-balance sheet 60

38 Liquidity and funding management
Liquidity and funding management
In 1Q22, we maintained a strong liquidity and funding position. The majority of our unsecured funding was generated from core customer deposits and long-term debt.
Liquidity management In response to regulatory reform, since 2015 we have primarily focused our issuance strategy on offering long-term debt securi-ties at the Group level for funding and capital purposes. Prior to that, securities for funding and capital purposes were primarily issued by the Bank, our principal operating subsidiary and a US registrant. We also issue short and medium-term debt securities at the Bank level for funding diversification. Our primary source of liquidity is funding through consolidated entities. Proceeds from issuances are lent to operating subsidiaries and affiliates on both a senior and subordinated basis, as needed; the latter typically to meet going and gone concern capital requirements and the for-mer as desired by management to support business initiatives and liquidity needs.
Our liquidity and funding profile reflects our strategy and risk appetite and is driven by business activity levels and the overall operating environment. We have adapted our liquidity and funding profile to reflect lessons learned from the financial crisis, the sub-sequent changes in our business strategy and regulatory devel-opments. We have been an active participant in regulatory and industry forums to promote best practice standards on quantita-tive and qualitative liquidity management. Our internal liquidity risk management framework is subject to review and monitoring by FINMA, other regulators and rating agencies.
> Refer to “Liquidity and funding management” in III – Treasury, Risk, Balance sheet and Off-balance sheet in the Credit Suisse Annual Report 2021 for fur-ther information.
Regulatory framework
BIS liquidity frameworkThe Basel Committee on Banking Supervision (BCBS) estab-lished the Basel framework for liquidity risk measurement, stan-dards and monitoring. The Basel framework includes a liquid-ity coverage ratio (LCR) and a net stable funding ratio (NSFR). Credit Suisse is subject to the Basel framework, as implemented in Switzerland, as well as Swiss legislation and regulations for systemically important banks.
The LCR addresses liquidity risk over a 30-day period. The LCR aims to ensure that banks have unencumbered high-quality liquid assets (HQLA) available to meet short-term liquidity needs under a severe stress scenario. The LCR is comprised of two compo-nents, the value of HQLA in stressed conditions and the total net cash outflows calculated according to specified scenario param-eters. Under the BCBS framework, the minimum required ratio of liquid assets over net cash outflows is 100%.
The NSFR establishes criteria for a minimum amount of stable funding based on the liquidity of a bank’s on- and off-balance sheet activities over a one-year horizon. The NSFR is a comple-mentary measure to the LCR and is structured to ensure that illiquid assets are funded with an appropriate amount of stable long-term funds. The NSFR is defined as the ratio of available stable funding over the amount of required stable funding and, once implemented by national regulators, should always be at least 100%.
Swiss liquidity requirementsThe Swiss Federal Council adopted a liquidity ordinance (Liquid-ity Ordinance) that implements Basel liquidity requirements into Swiss law. Under the Liquidity Ordinance, banks are subject to a minimum LCR requirement of 100% at all times and the associ-ated disclosure requirements.
Since July 1, 2021, banks have been subject to a minimum NSFR requirement of 100% at all times and the associated disclosure requirements. Based on the Liquidity Ordinance, Credit Suisse AG (Bank parent company) is allowed to fulfill the minimum NSFR of 100% by taking into consideration any excess funding of Credit Suisse (Schweiz) AG on a stand-alone basis, and the Bank parent has an NSFR requirement of at least 80% without taking into consideration any such excess funding. Credit Suisse (Schweiz) AG must always fulfill the NSFR of at least 100% on a stand-alone basis.
> Refer to credit-suisse.com/regulatorydisclosures for additional information.
Our liquidity principles and our liquidity risk management frame-work as agreed with FINMA are in line with the Basel III liquidity framework.
Regulatory developmentsFollowing a consultation period that has now ended, the Swiss Federal Department of Finance is expected to soon issue amend-ments to the Liquidity Ordinance with a proposed effective date of July 1, 2022 followed by a transition period. The revisions are intended to ensure that systemically important banks hold suf-ficient liquidity, in order to adequately absorb liquidity shocks and cover their liquidity needs in the event of restructuring or liquidation. The revisions are expected to increase the regulatory minimum liquidity requirements for systemically important banks, including Credit Suisse.
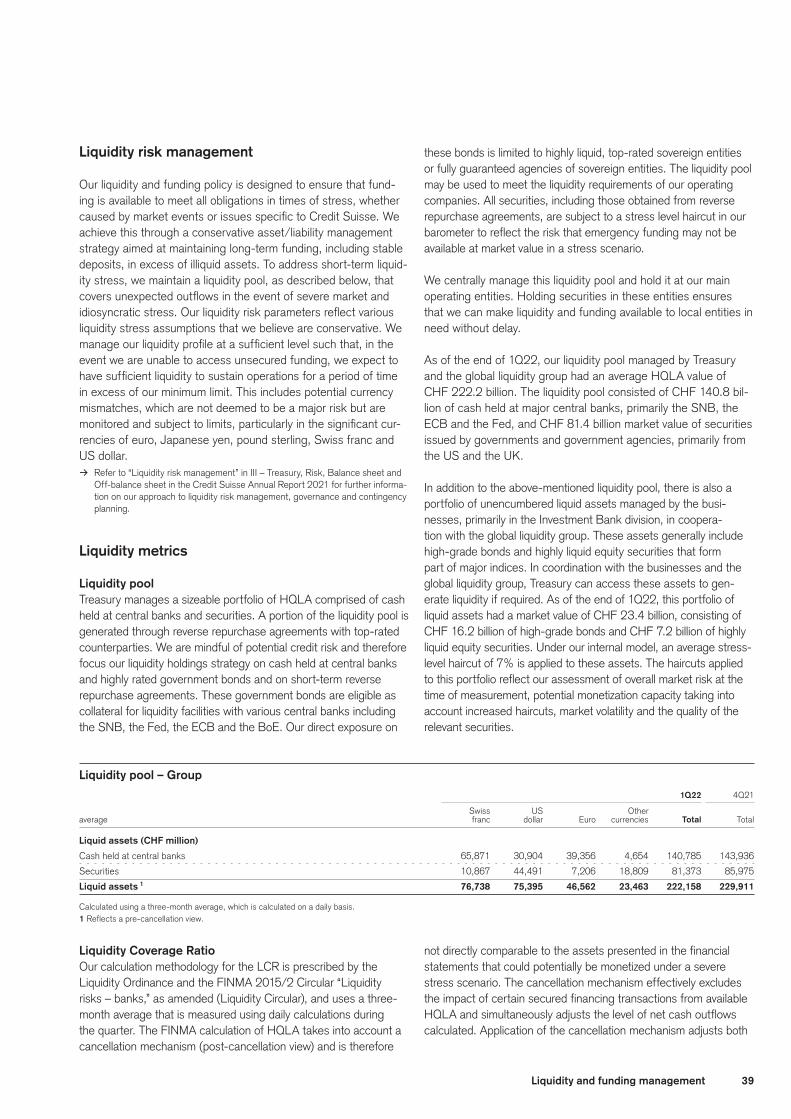
39Liquidity and funding management
Liquidity risk management
Our liquidity and funding policy is designed to ensure that fund-ing is available to meet all obligations in times of stress, whether caused by market events or issues specific to Credit Suisse. We achieve this through a conservative asset/liability management strategy aimed at maintaining long-term funding, including stable deposits, in excess of illiquid assets. To address short-term liquid-ity stress, we maintain a liquidity pool, as described below, that covers unexpected outflows in the event of severe market and idiosyncratic stress. Our liquidity risk parameters reflect various liquidity stress assumptions that we believe are conservative. We manage our liquidity profile at a sufficient level such that, in the event we are unable to access unsecured funding, we expect to have sufficient liquidity to sustain operations for a period of time in excess of our minimum limit. This includes potential currency mismatches, which are not deemed to be a major risk but are monitored and subject to limits, particularly in the significant cur-rencies of euro, Japanese yen, pound sterling, Swiss franc and US dollar.
> Refer to “Liquidity risk management” in III – Treasury, Risk, Balance sheet and Off-balance sheet in the Credit Suisse Annual Report 2021 for further informa-tion on our approach to liquidity risk management, governance and contingency planning.
Liquidity metrics
Liquidity pool Treasury manages a sizeable portfolio of HQLA comprised of cash held at central banks and securities. A portion of the liquidity pool is generated through reverse repurchase agreements with top-rated counterparties. We are mindful of potential credit risk and therefore focus our liquidity holdings strategy on cash held at central banks and highly rated government bonds and on short-term reverse repurchase agreements. These government bonds are eligible as collateral for liquidity facilities with various central banks including the SNB, the Fed, the ECB and the BoE. Our direct exposure on
these bonds is limited to highly liquid, top-rated sovereign entities or fully guaranteed agencies of sovereign entities. The liquidity pool may be used to meet the liquidity requirements of our operating companies. All securities, including those obtained from reverse repurchase agreements, are subject to a stress level haircut in our barometer to reflect the risk that emergency funding may not be available at market value in a stress scenario.
We centrally manage this liquidity pool and hold it at our main operating entities. Holding securities in these entities ensures that we can make liquidity and funding available to local entities in need without delay.
As of the end of 1Q22, our liquidity pool managed by Treasury and the global liquidity group had an average HQLA value of CHF 222.2 billion. The liquidity pool consisted of CHF 140.8 bil-lion of cash held at major central banks, primarily the SNB, the ECB and the Fed, and CHF 81.4 billion market value of securities issued by governments and government agencies, primarily from the US and the UK.
In addition to the above-mentioned liquidity pool, there is also a portfolio of unencumbered liquid assets managed by the busi-nesses, primarily in the Investment Bank division, in coopera-tion with the global liquidity group. These assets generally include high-grade bonds and highly liquid equity securities that form part of major indices. In coordination with the businesses and the global liquidity group, Treasury can access these assets to gen-erate liquidity if required. As of the end of 1Q22, this portfolio of liquid assets had a market value of CHF 23.4 billion, consisting of CHF 16.2 billion of high-grade bonds and CHF 7.2 billion of highly liquid equity securities. Under our internal model, an average stress-level haircut of 7% is applied to these assets. The haircuts applied to this portfolio reflect our assessment of overall market risk at the time of measurement, potential monetization capacity taking into account increased haircuts, market volatility and the quality of the relevant securities.
Liquidity pool – Group 1Q22 4Q21
Swiss US Other
average franc dollar Euro currencies Total Total
Liquid assets (CHF million)
Cash held at central banks 65,871 30,904 39,356 4,654 140,785 143,936
Securities 10,867 44,491 7,206 18,809 81,373 85,975
Liquid assets 1 76,738 75,395 46,562 23,463 222,158 229,911
Calculated using a three-month average, which is calculated on a daily basis.1 Reflects a pre-cancellation view.
Liquidity Coverage Ratio Our calculation methodology for the LCR is prescribed by the Liquidity Ordinance and the FINMA 2015/2 Circular “Liquidity risks – banks,” as amended (Liquidity Circular), and uses a three-month average that is measured using daily calculations during the quarter. The FINMA calculation of HQLA takes into account a cancellation mechanism (post-cancellation view) and is therefore
not directly comparable to the assets presented in the financial statements that could potentially be monetized under a severe stress scenario. The cancellation mechanism effectively excludes the impact of certain secured financing transactions from available HQLA and simultaneously adjusts the level of net cash outflows calculated. Application of the cancellation mechanism adjusts both
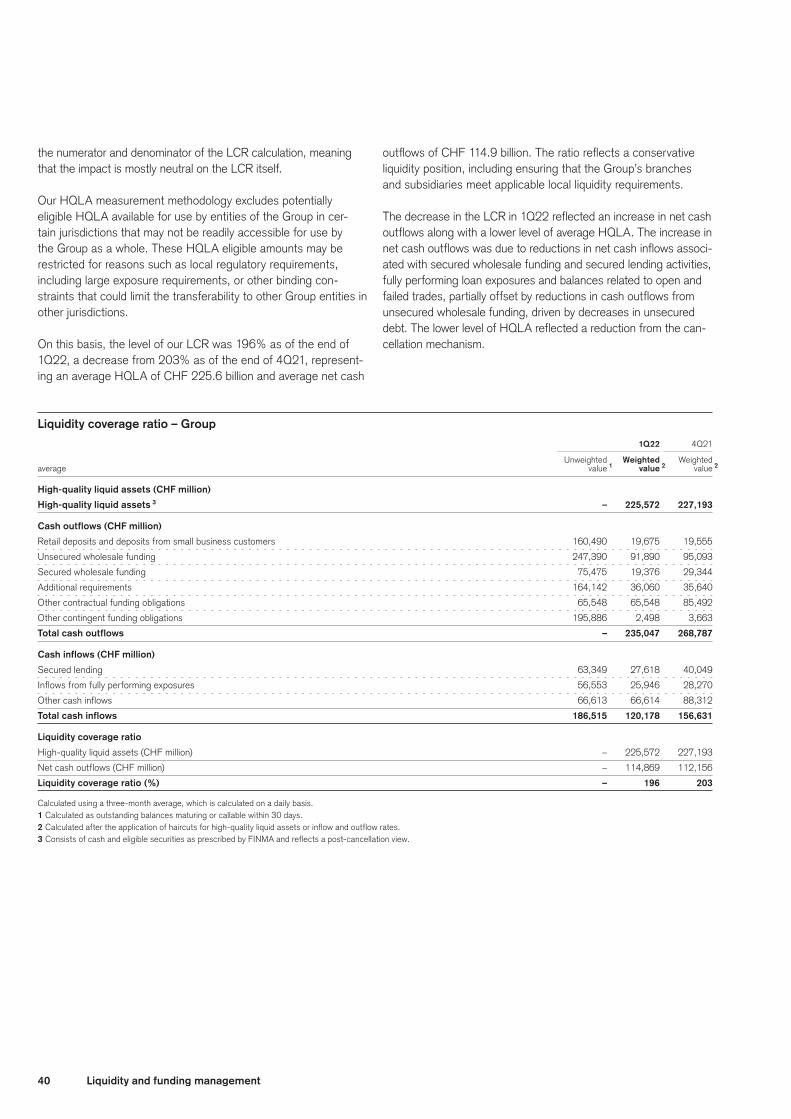
40 Liquidity and funding management
the numerator and denominator of the LCR calculation, meaning that the impact is mostly neutral on the LCR itself.
Our HQLA measurement methodology excludes potentially eligible HQLA available for use by entities of the Group in cer-tain jurisdictions that may not be readily accessible for use by the Group as a whole. These HQLA eligible amounts may be restricted for reasons such as local regulatory requirements, including large exposure requirements, or other binding con-straints that could limit the transferability to other Group entities in other jurisdictions.
On this basis, the level of our LCR was 196% as of the end of 1Q22, a decrease from 203% as of the end of 4Q21, represent-ing an average HQLA of CHF 225.6 billion and average net cash
outflows of CHF 114.9 billion. The ratio reflects a conservative liquidity position, including ensuring that the Group’s branches and subsidiaries meet applicable local liquidity requirements.
The decrease in the LCR in 1Q22 reflected an increase in net cash outflows along with a lower level of average HQLA. The increase in net cash outflows was due to reductions in net cash inflows associ-ated with secured wholesale funding and secured lending activities, fully performing loan exposures and balances related to open and failed trades, partially offset by reductions in cash outflows from unsecured wholesale funding, driven by decreases in unsecured debt. The lower level of HQLA reflected a reduction from the can-cellation mechanism.
Liquidity coverage ratio – Group 1Q22 4Q21
Unweighted Weighted Weighted
average value 1 value 2 value 2
High-quality liquid assets (CHF million)
High-quality liquid assets 3 – 225,572 227,193
Cash outflows (CHF million)
Retail deposits and deposits from small business customers 160,490 19,675 19,555
Unsecured wholesale funding 247,390 91,890 95,093
Secured wholesale funding 75,475 19,376 29,344
Additional requirements 164,142 36,060 35,640
Other contractual funding obligations 65,548 65,548 85,492
Other contingent funding obligations 195,886 2,498 3,663
Total cash outflows – 235,047 268,787
Cash inflows (CHF million)
Secured lending 63,349 27,618 40,049
Inflows from fully performing exposures 56,553 25,946 28,270
Other cash inflows 66,613 66,614 88,312
Total cash inflows 186,515 120,178 156,631
Liquidity coverage ratio
High-quality liquid assets (CHF million) – 225,572 227,193
Net cash outflows (CHF million) – 114,869 112,156
Liquidity coverage ratio (%) – 196 203
Calculated using a three-month average, which is calculated on a daily basis.1 Calculated as outstanding balances maturing or callable within 30 days.2 Calculated after the application of haircuts for high-quality liquid assets or inflow and outflow rates.3 Consists of cash and eligible securities as prescribed by FINMA and reflects a post-cancellation view.

41Liquidity and funding management
Balance sheet funding structure
as of March 31, 2022 (CHF billion)
46 Short-term borrowings2
36 Secured financing transactions3
Secured financing transactions1 103
Trading assets 88
14 Brokerage payables
35 All other liabilities
160 Long-term debt
44 Total equity
389 Deposits
time 116
demand 205
savings 68
Brokerage receivables 22
All other assets 70
Assets 740 740 Liabilities and Equity
16 Short positions
129% coverage
Following the introduction of the NSFR reporting in the third quarter of 2021,the balance sheet funding structure has been aligned to the NSFR framework.1 Reverse repurchase agreements including securities received as collateral.2 Includes certificates of deposit (CD), commercial paper (CP) and structured notes up to 1
year.3 Repurchase agreements including obligation to return securities received as collateral.
Cash & central bank reserves 156
Loans 301
Net Stable Funding RatioOur calculation methodology for the NSFR is prescribed by the Liquidity Ordinance and the Liquidity Circular including associ-ated disclosure requirements. At the end of 1Q22, the level of our NSFR was 128%, an increase from 127% as of end of 4Q21, representing available stable funding (ASF) of CHF 431 billion and required stable funding (RSF) of CHF 336 billion.
The increase in the NSFR compared to 4Q21 reflected a decrease in RSF, partially offset by a decrease in ASF. The decrease in RSF was mainly attributable to a decrease in our trading inventory (non-HQLA securities), our loan portfolio and our derivatives portfolio, partially offset by an increase in our reverse repurchase transactions backed by HQLA. The decrease in ASF was primarily a result of maturing certificates of deposit and commercial paper as well as a decrease in deposits from retail clients and non-financial corporates and in repurchase transactions, primarily with financial institutions.
Net stable funding ratio – Group
end of 1Q22 4Q21
Net stable funding ratio
Available stable funding (CHF million) 430,894 436,856
Required stable funding (CHF million) 335,546 342,870
Net stable funding ratio (%) 128 127
Funding management Funding sourcesWe fund our balance sheet primarily through core customer deposits, long-term debt, including structured notes, and share-holders’ equity. We monitor the funding sources, including their concentrations against certain limits, according to their counter-party, currency, tenor, geography and maturity, and whether they are secured or unsecured.
Our balance sheet funding structure diagram is aligned with the NSFR framework. Loans, which comprise the largest component of our illiquid assets, are funded by our core customer deposits, with an excess coverage of 29% as of the end of 1Q22, com-pared to 28% as of the end of 4Q21, reflecting a small decrease in loans. We fund other illiquid assets, including real estate, pri-vate equity and other long-term investments as well as the hair-cut for the illiquid portion of securities, with long-term debt and equity, in which we try to maintain a substantial funding buffer.
Our core customer deposits totalled CHF 389 billion as of the end of 1Q22, compared to CHF 391 billion as of the end of 4Q21, reflecting a small decrease in our customer deposit base in the private banking and corporate & institutional banking busi-nesses in 1Q22, mainly driven by a decrease in time and savings deposits. Core customer deposits are from clients with whom we have a broad and long-standing relationship. Core customer deposits exclude deposits from banks and certificates of deposit. We place a priority on maintaining and growing customer depos-its, as they have proven to be a stable and resilient source of funding even in difficult market conditions. Our core customer deposit funding is supplemented by the issuance of long-term debt.
> Refer to the chart “Balance sheet funding structure” and “Balance sheet” in Balance sheet and off-balance sheet for further information.
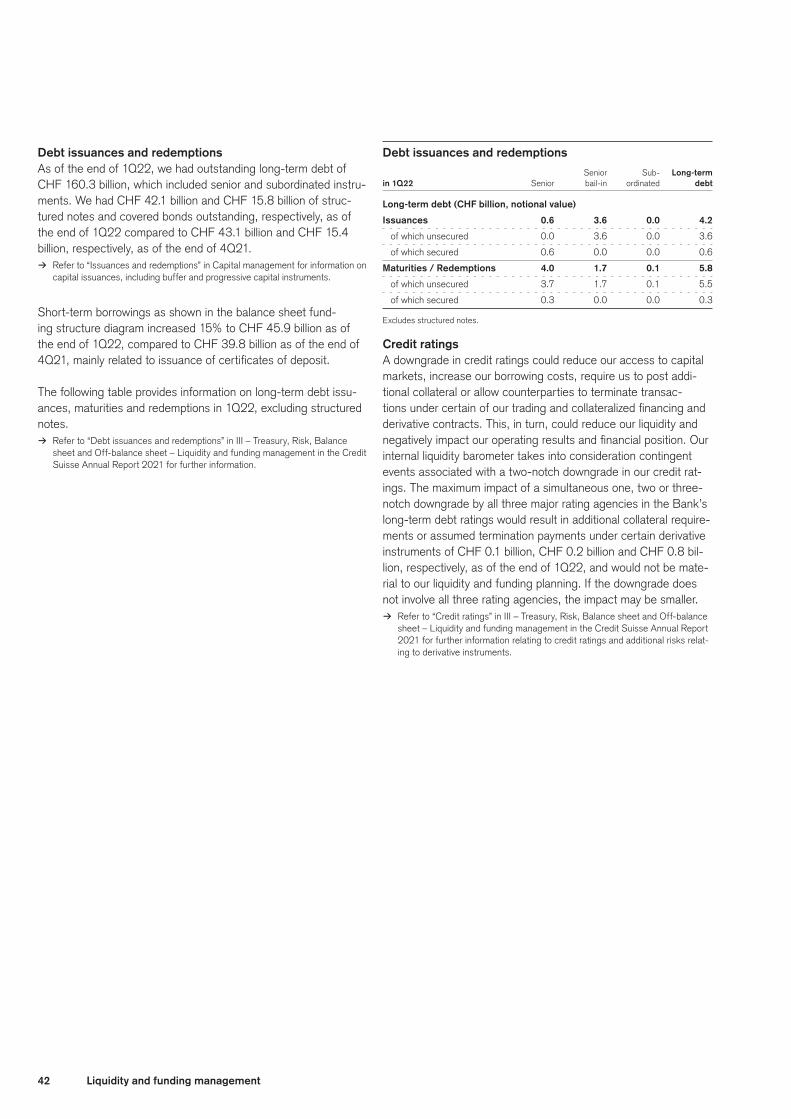
42 Liquidity and funding management
Debt issuances and redemptions As of the end of 1Q22, we had outstanding long-term debt of CHF 160.3 billion, which included senior and subordinated instru-ments. We had CHF 42.1 billion and CHF 15.8 billion of struc-tured notes and covered bonds outstanding, respectively, as of the end of 1Q22 compared to CHF 43.1 billion and CHF 15.4 billion, respectively, as of the end of 4Q21.
> Refer to “Issuances and redemptions” in Capital management for information on capital issuances, including buffer and progressive capital instruments.
Short-term borrowings as shown in the balance sheet fund-ing structure diagram increased 15% to CHF 45.9 billion as of the end of 1Q22, compared to CHF 39.8 billion as of the end of 4Q21, mainly related to issuance of certificates of deposit.
The following table provides information on long-term debt issu-ances, maturities and redemptions in 1Q22, excluding structured notes.
> Refer to “Debt issuances and redemptions” in III – Treasury, Risk, Balance sheet and Off-balance sheet – Liquidity and funding management in the Credit Suisse Annual Report 2021 for further information.
Debt issuances and redemptions Senior Sub- Long-term
in 1Q22 Senior bail-in ordinated debt
Long-term debt (CHF billion, notional value)
Issuances 0.6 3.6 0.0 4.2
of which unsecured 0.0 3.6 0.0 3.6
of which secured 0.6 0.0 0.0 0.6
Maturities / Redemptions 4.0 1.7 0.1 5.8
of which unsecured 3.7 1.7 0.1 5.5
of which secured 0.3 0.0 0.0 0.3
Excludes structured notes.
Credit ratingsA downgrade in credit ratings could reduce our access to capital markets, increase our borrowing costs, require us to post addi-tional collateral or allow counterparties to terminate transac-tions under certain of our trading and collateralized financing and derivative contracts. This, in turn, could reduce our liquidity and negatively impact our operating results and financial position. Our internal liquidity barometer takes into consideration contingent events associated with a two-notch downgrade in our credit rat-ings. The maximum impact of a simultaneous one, two or three-notch downgrade by all three major rating agencies in the Bank’s long-term debt ratings would result in additional collateral require-ments or assumed termination payments under certain derivative instruments of CHF 0.1 billion, CHF 0.2 billion and CHF 0.8 bil-lion, respectively, as of the end of 1Q22, and would not be mate-rial to our liquidity and funding planning. If the downgrade does not involve all three rating agencies, the impact may be smaller.
> Refer to “Credit ratings” in III – Treasury, Risk, Balance sheet and Off-balance sheet – Liquidity and funding management in the Credit Suisse Annual Report 2021 for further information relating to credit ratings and additional risks relat-ing to derivative instruments.
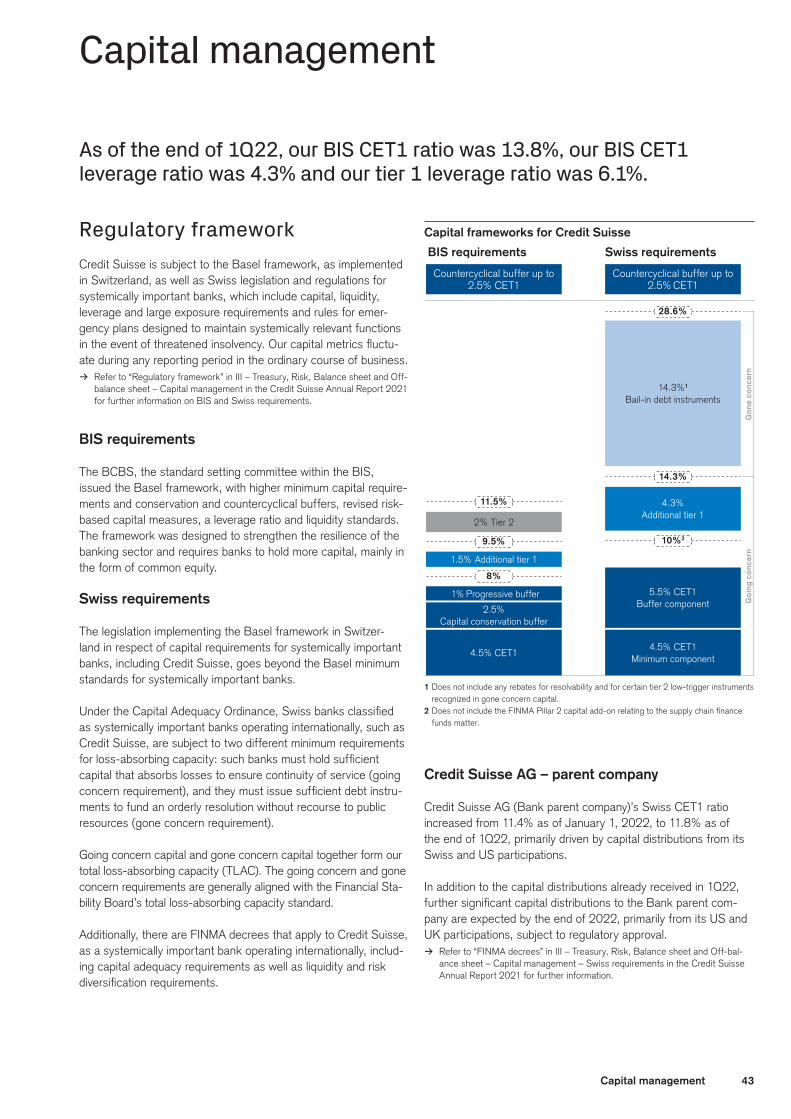
43Capital management
Capital frameworks for Credit Suisse
BIS requirements Swiss requirements
Countercyclical buffer up to 2.5% CET1
Countercyclical buffer up to 2.5% CET1
1 Does not include any rebates for resolvability and for certain tier 2 low-trigger instruments recognized in gone concern capital.
2 Does not include the FINMA Pillar 2 capital add-on relating to the supply chain finance funds matter.
4.5% CET14.5% CET1
Minimum component
2.5% Capital conservation buffer
1% Progressive buffer
1.5% Additional tier 1
2% Tier 2
11.5%
9.5% 10%2
14.3%
28.6%
8%
Goi
ng c
once
rn
4.3% Additional tier 1
Gon
e co
ncer
n
14.3%1 Bail-in debt instruments
5.5% CET1 Buffer component
Capital management
As of the end of 1Q22, our BIS CET1 ratio was 13.8%, our BIS CET1 leverage ratio was 4.3% and our tier 1 leverage ratio was 6.1%.
Regulatory frameworkCredit Suisse is subject to the Basel framework, as implemented in Switzerland, as well as Swiss legislation and regulations for systemically important banks, which include capital, liquidity, leverage and large exposure requirements and rules for emer-gency plans designed to maintain systemically relevant functions in the event of threatened insolvency. Our capital metrics fluctu-ate during any reporting period in the ordinary course of business.
> Refer to “Regulatory framework” in III – Treasury, Risk, Balance sheet and Off-balance sheet – Capital management in the Credit Suisse Annual Report 2021 for further information on BIS and Swiss requirements.
BIS requirements
The BCBS, the standard setting committee within the BIS, issued the Basel framework, with higher minimum capital require-ments and conservation and countercyclical buffers, revised risk-based capital measures, a leverage ratio and liquidity standards. The framework was designed to strengthen the resilience of the banking sector and requires banks to hold more capital, mainly in the form of common equity.
Swiss requirements
The legislation implementing the Basel framework in Switzer-land in respect of capital requirements for systemically important banks, including Credit Suisse, goes beyond the Basel minimum standards for systemically important banks.
Under the Capital Adequacy Ordinance, Swiss banks classified as systemically important banks operating internationally, such as Credit Suisse, are subject to two different minimum requirements for loss-absorbing capacity: such banks must hold sufficient capital that absorbs losses to ensure continuity of service (going concern requirement), and they must issue sufficient debt instru-ments to fund an orderly resolution without recourse to public resources (gone concern requirement).
Going concern capital and gone concern capital together form our total loss-absorbing capacity (TLAC). The going concern and gone concern requirements are generally aligned with the Financial Sta-bility Board’s total loss-absorbing capacity standard.
Additionally, there are FINMA decrees that apply to Credit Suisse, as a systemically important bank operating internationally, includ-ing capital adequacy requirements as well as liquidity and risk diversification requirements.
Credit Suisse AG – parent company
Credit Suisse AG (Bank parent company)’s Swiss CET1 ratio increased from 11.4% as of January 1, 2022, to 11.8% as of the end of 1Q22, primarily driven by capital distributions from its Swiss and US participations.
In addition to the capital distributions already received in 1Q22, further significant capital distributions to the Bank parent com-pany are expected by the end of 2022, primarily from its US and UK participations, subject to regulatory approval.
> Refer to “FINMA decrees” in III – Treasury, Risk, Balance sheet and Off-bal-ance sheet – Capital management – Swiss requirements in the Credit Suisse Annual Report 2021 for further information.
44 Capital management
Other regulatory disclosures
In connection with the Basel framework, certain regulatory dis-closures for the Group and certain of its subsidiaries are required. The Group’s Pillar 3 disclosure, regulatory disclosures, additional information on capital instruments, including the main features and terms and conditions of regulatory capital instruments and total loss-absorbing capacity-eligible instruments that form part of the eligible capital base and total loss-absorbing capacity resources, global sys-temically important bank financial indicators, reconciliation require-ments, leverage ratios and certain liquidity disclosures as well as regulatory disclosures for subsidiaries can be found on our website.
> Refer to “credit-suisse.com/regulatorydisclosures” for additional information.
Swiss capital and leverage requirements for Credit Suisse Capital Leverage
For 2022 ratio ratio
Capital components (%)
CET1 – minimum 4.5 1.5
Additional tier 1 – maximum 3.5 1.5
Minimum component 8.0 3.0
CET1 – minimum 5.5 2.0
Additional tier 1 – maximum 0.8 0.0
Buffer component 6.3 2.0
Going concern 14.3 5.0
of which base requirement 12.86 4.5
of which surcharge 1.44 0.5
Gone concern 14.3 5.0
of which base requirement 12.86 4.5
of which surcharge 1.44 0.5
Total loss-absorbing capacity 28.6 10.0
Does not include the FINMA Pillar 2 capital add-on of CHF 1.8 billion relating to the sup-ply chain finance funds matter, the effects of the countercyclical buffers and any rebates for resolvability and for certain tier 2 low-trigger instruments recognized in gone concern capital. As of the end of 1Q22, for the Group, the rebates for resolvability and for certain tier 2 low-trigger instruments for the capital ratios were 3.135% and 0.431%, respectively, and for the Bank, they were 3.135% and 0.432%, respectively. For the Group, the rebates for resolvability and for certain tier 2 low-trigger instruments for leverage ratios were 1.1% and 0.134%, respectively, and for the Bank, they were 1.1% and 0.133%, respectively. Net of these rebates, the gone concern ratio for capital and leverage for the Group were 10.734% and 3.766%, respectively, and for the Bank they were 10.733% and 3.767%, respectively.
Regulatory developmentsIn June 2021, FINMA announced its reassessment of rebates for resolvability relating to the gone concern requirement. The eligibil-ity for the rebates for resolvability is assessed on an annual basis. Effective July 1, 2021, for the Group and the Bank, the rebate for resolvability relating to the capital ratio was 3.135% and the rebate for resolvability relating to the leverage ratio was 1.1%. In March 2022, FINMA published the results of its annual assessment of the recovery and resolution planning of the Swiss systemically important financial institutions. In accordance with this assessment, effective July 1, 2022, the Group will be eligible for the maximum potential rebates for resolvability.
Capital instrumentsHigher Trigger Capital Amount
The capital ratio write-down triggers for certain of our outstanding capital instruments take into account the fact that other outstand-ing capital instruments that contain relatively higher capital ratios as part of their trigger feature are expected to convert into equity or be written down prior to the write-down of such capital instruments. The amount of additional capital that is expected to be contributed by such conversion into equity or write-down is referred to as the Higher Trigger Capital Amount.
With respect to the capital instruments that specify a trigger event if the CET1 ratio were to fall below 5.125%, the Higher Trigger Capital Amount was CHF 11.1 billion and the Higher Trigger Capital Ratio (i.e., the ratio of the Higher Trigger Capital Amount to the aggregate of all RWA of the Group) was 4.1%, both as of the end of 1Q22.
With respect to the capital instruments that specify a trigger event if the CET1 ratio were to fall below 5%, the Higher Trig-ger Capital Amount was CHF 15.5 billion and the Higher Trigger Capital Ratio was 5.7%, both as of the end of 1Q22.
> Refer to the table “BIS capital metrics” for further information on the BIS met-rics used to calculate such measures.
> Refer to “Higher Trigger Capital Amount” in III – Treasury, Risk, Balance sheet and Off-balance sheet – Capital management – Capital instruments in the Credit Suisse Annual Report 2021 for further information on the Higher Trig-ger Capital Amount.
45Capital management
Issuances and redemptions Par value at issuance Year of Currency (million) Coupon rate (%) Description maturity
Issuances – callable bail-in instruments
First quarter of 2022 EUR 1,500 2.875 Senior notes 2032
EUR 2,000 2.125 Senior notes 2026
April 2022 to date JPY 5,000 1.1 Senior notes 2028
Redemptions – bail-in instruments
First quarter of 2022 USD 1,750 3.574 Senior notes 2023 1
AUD 176 5.0 2 Senior notes 2038
April 2022 to date USD 100 floating rate Senior notes 2023 3
EUR 2,250 1.25 Senior notes 2022
1 On December 15, 2021, the Group elected to call the notes on the optional call date, January 9, 2022.2 The interest rate of these zero coupon annual accreting senior callable notes reflects the yield rate of the note. On January 27, 2022, the Group elected to call the notes on the first
optional call date, February 8, 2022.3 On March 22, 2022, the Group elected to call the notes on the optional call date, April 9, 2022.
BIS capital metrics
BIS capital metrics – Group % change
end of 1Q22 4Q21 QoQ
Capital and risk-weighted assets (CHF million)
CET1 capital 37,713 38,529 (2)
Tier 1 capital 53,204 54,373 (2)
Total eligible capital 53,676 54,852 (2)
Risk-weighted assets 273,043 267,787 2
Capital ratios (%)
CET1 ratio 13.8 14.4 –
Tier 1 ratio 19.5 20.3 –
Total capital ratio 19.7 20.5 –
Eligible capital – Group % change
end of 1Q22 4Q21 QoQ
Eligible capital (CHF million)
Total shareholders’ equity 44,442 43,954 1
Adjustments
Regulatory adjustments 1 70 157 (55)
Goodwill 2 (2,909) (2,893) 1
Other intangible assets 2 (49) (50) (2)
Deferred tax assets that rely on
future profitability (1,307) (881) 48
Shortfall of provisions to expected losses (254) (220) 15
(Gains)/losses due to changes in own
credit on fair-valued liabilities 1,065 2,144 (50)
Defined benefit pension assets 2 (3,403) (3,280) 4
Investments in own shares (523) (477) 10
Other adjustments 3 581 75 –
Total adjustments (6,729) (5,425) 24
CET1 capital 37,713 38,529 (2)
High-trigger capital instruments
(7% trigger) 11,135 11,399 (2)
Low-trigger capital instruments
(5.125% trigger) 4,356 4,445 (2)
Additional tier 1 capital 15,491 15,844 (2)
Tier 1 capital 53,204 54,373 (2)
Tier 2 low-trigger capital instruments
(5% trigger) 472 479 (1)
Tier 2 capital 472 479 4 (1)
Total eligible capital 53,676 54,852 4 (2)
1 Includes certain adjustments, such as a cumulative dividend accrual.2 Net of deferred tax liability.3 Includes reversals of cash flow hedge reserves.4 Amounts are shown on a look-through basis. Certain tier 2 instruments were subject to
phase out and are no longer eligible as of January 1, 2022. As of 4Q21, total eligible capital was CHF 55,074 million, including CHF 222 million of such instruments, and the total capital ratio was 20.6%.
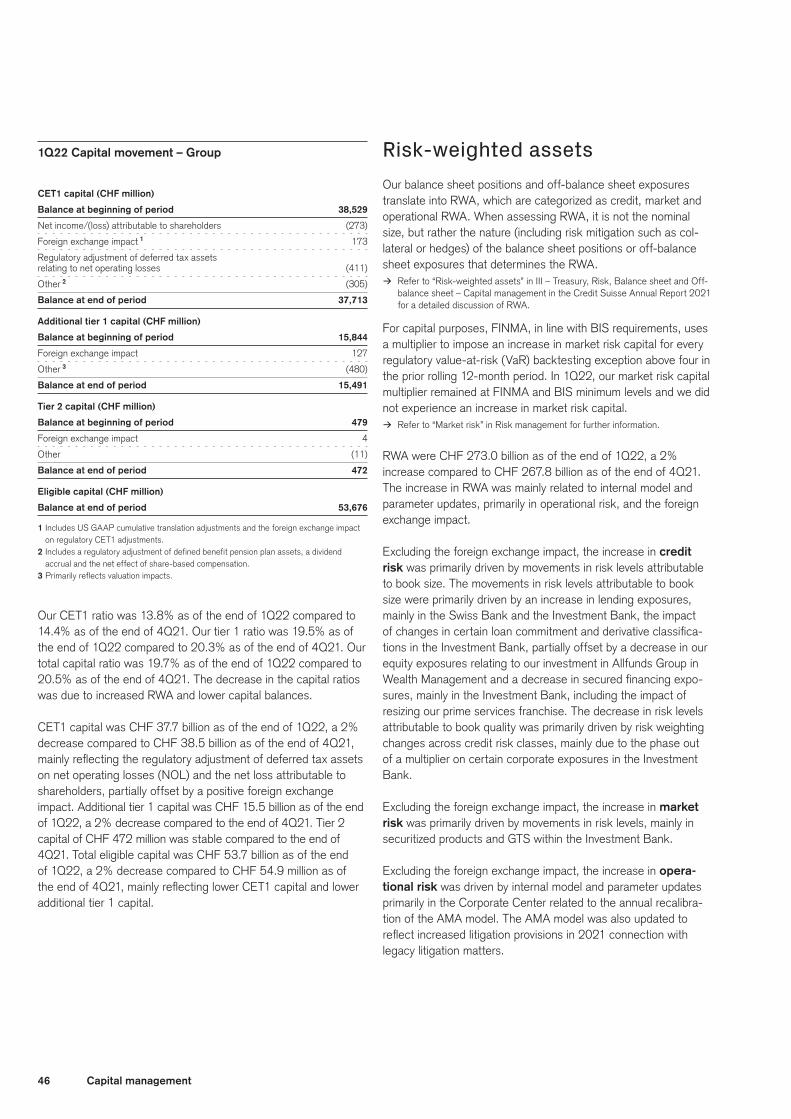
46 Capital management
1Q22 Capital movement – Group
CET1 capital (CHF million)
Balance at beginning of period 38,529
Net income/(loss) attributable to shareholders (273)
Foreign exchange impact 1 173
Regulatory adjustment of deferred tax assets
relating to net operating losses (411)
Other 2 (305)
Balance at end of period 37,713
Additional tier 1 capital (CHF million)
Balance at beginning of period 15,844
Foreign exchange impact 127
Other 3 (480)
Balance at end of period 15,491
Tier 2 capital (CHF million)
Balance at beginning of period 479
Foreign exchange impact 4
Other (11)
Balance at end of period 472
Eligible capital (CHF million)
Balance at end of period 53,676
1 Includes US GAAP cumulative translation adjustments and the foreign exchange impact on regulatory CET1 adjustments.
2 Includes a regulatory adjustment of defined benefit pension plan assets, a dividend accrual and the net effect of share-based compensation.
3 Primarily reflects valuation impacts.
Our CET1 ratio was 13.8% as of the end of 1Q22 compared to 14.4% as of the end of 4Q21. Our tier 1 ratio was 19.5% as of the end of 1Q22 compared to 20.3% as of the end of 4Q21. Our total capital ratio was 19.7% as of the end of 1Q22 compared to 20.5% as of the end of 4Q21. The decrease in the capital ratios was due to increased RWA and lower capital balances.
CET1 capital was CHF 37.7 billion as of the end of 1Q22, a 2% decrease compared to CHF 38.5 billion as of the end of 4Q21, mainly reflecting the regulatory adjustment of deferred tax assets on net operating losses (NOL) and the net loss attributable to shareholders, partially offset by a positive foreign exchange impact. Additional tier 1 capital was CHF 15.5 billion as of the end of 1Q22, a 2% decrease compared to the end of 4Q21. Tier 2 capital of CHF 472 million was stable compared to the end of 4Q21. Total eligible capital was CHF 53.7 billion as of the end of 1Q22, a 2% decrease compared to CHF 54.9 million as of the end of 4Q21, mainly reflecting lower CET1 capital and lower additional tier 1 capital.
Risk-weighted assetsOur balance sheet positions and off-balance sheet exposures translate into RWA, which are categorized as credit, market and operational RWA. When assessing RWA, it is not the nominal size, but rather the nature (including risk mitigation such as col-lateral or hedges) of the balance sheet positions or off-balance sheet exposures that determines the RWA.
> Refer to “Risk-weighted assets” in III – Treasury, Risk, Balance sheet and Off-balance sheet – Capital management in the Credit Suisse Annual Report 2021 for a detailed discussion of RWA.
For capital purposes, FINMA, in line with BIS requirements, uses a multiplier to impose an increase in market risk capital for every regulatory value-at-risk (VaR) backtesting exception above four in the prior rolling 12-month period. In 1Q22, our market risk capital multiplier remained at FINMA and BIS minimum levels and we did not experience an increase in market risk capital.
> Refer to “Market risk” in Risk management for further information.
RWA were CHF 273.0 billion as of the end of 1Q22, a 2% increase compared to CHF 267.8 billion as of the end of 4Q21. The increase in RWA was mainly related to internal model and parameter updates, primarily in operational risk, and the foreign exchange impact.
Excluding the foreign exchange impact, the increase in credit risk was primarily driven by movements in risk levels attributable to book size. The movements in risk levels attributable to book size were primarily driven by an increase in lending exposures, mainly in the Swiss Bank and the Investment Bank, the impact of changes in certain loan commitment and derivative classifica-tions in the Investment Bank, partially offset by a decrease in our equity exposures relating to our investment in Allfunds Group in Wealth Management and a decrease in secured financing expo-sures, mainly in the Investment Bank, including the impact of resizing our prime services franchise. The decrease in risk levels attributable to book quality was primarily driven by risk weighting changes across credit risk classes, mainly due to the phase out of a multiplier on certain corporate exposures in the Investment Bank.
Excluding the foreign exchange impact, the increase in market risk was primarily driven by movements in risk levels, mainly in securitized products and GTS within the Investment Bank.
Excluding the foreign exchange impact, the increase in opera-tional risk was driven by internal model and parameter updates primarily in the Corporate Center related to the annual recalibra-tion of the AMA model. The AMA model was also updated to reflect increased litigation provisions in 2021 connection with legacy litigation matters.
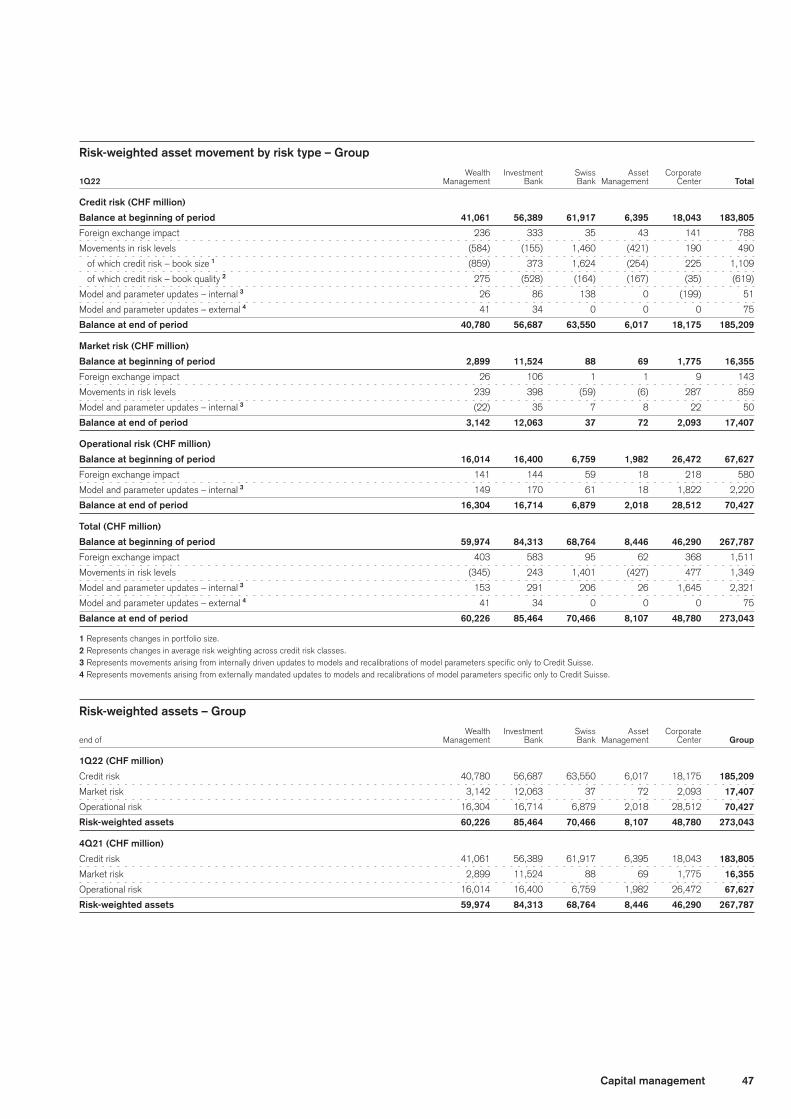
47Capital management
Risk-weighted asset movement by risk type – Group Wealth Investment Swiss Asset Corporate
1Q22 Management Bank Bank Management Center Total
Credit risk (CHF million)
Balance at beginning of period 41,061 56,389 61,917 6,395 18,043 183,805
Foreign exchange impact 236 333 35 43 141 788
Movements in risk levels (584) (155) 1,460 (421) 190 490
of which credit risk – book size 1 (859) 373 1,624 (254) 225 1,109
of which credit risk – book quality 2 275 (528) (164) (167) (35) (619)
Model and parameter updates – internal 3 26 86 138 0 (199) 51
Model and parameter updates – external 4 41 34 0 0 0 75
Balance at end of period 40,780 56,687 63,550 6,017 18,175 185,209
Market risk (CHF million)
Balance at beginning of period 2,899 11,524 88 69 1,775 16,355
Foreign exchange impact 26 106 1 1 9 143
Movements in risk levels 239 398 (59) (6) 287 859
Model and parameter updates – internal 3 (22) 35 7 8 22 50
Balance at end of period 3,142 12,063 37 72 2,093 17,407
Operational risk (CHF million)
Balance at beginning of period 16,014 16,400 6,759 1,982 26,472 67,627
Foreign exchange impact 141 144 59 18 218 580
Model and parameter updates – internal 3 149 170 61 18 1,822 2,220
Balance at end of period 16,304 16,714 6,879 2,018 28,512 70,427
Total (CHF million)
Balance at beginning of period 59,974 84,313 68,764 8,446 46,290 267,787
Foreign exchange impact 403 583 95 62 368 1,511
Movements in risk levels (345) 243 1,401 (427) 477 1,349
Model and parameter updates – internal 3 153 291 206 26 1,645 2,321
Model and parameter updates – external 4 41 34 0 0 0 75
Balance at end of period 60,226 85,464 70,466 8,107 48,780 273,043
1 Represents changes in portfolio size.2 Represents changes in average risk weighting across credit risk classes.3 Represents movements arising from internally driven updates to models and recalibrations of model parameters specific only to Credit Suisse.4 Represents movements arising from externally mandated updates to models and recalibrations of model parameters specific only to Credit Suisse.
Risk-weighted assets – Group Wealth Investment Swiss Asset Corporate
end of Management Bank Bank Management Center Group
1Q22 (CHF million)
Credit risk 40,780 56,687 63,550 6,017 18,175 185,209
Market risk 3,142 12,063 37 72 2,093 17,407
Operational risk 16,304 16,714 6,879 2,018 28,512 70,427
Risk-weighted assets 60,226 85,464 70,466 8,107 48,780 273,043
4Q21 (CHF million)
Credit risk 41,061 56,389 61,917 6,395 18,043 183,805
Market risk 2,899 11,524 88 69 1,775 16,355
Operational risk 16,014 16,400 6,759 1,982 26,472 67,627
Risk-weighted assets 59,974 84,313 68,764 8,446 46,290 267,787
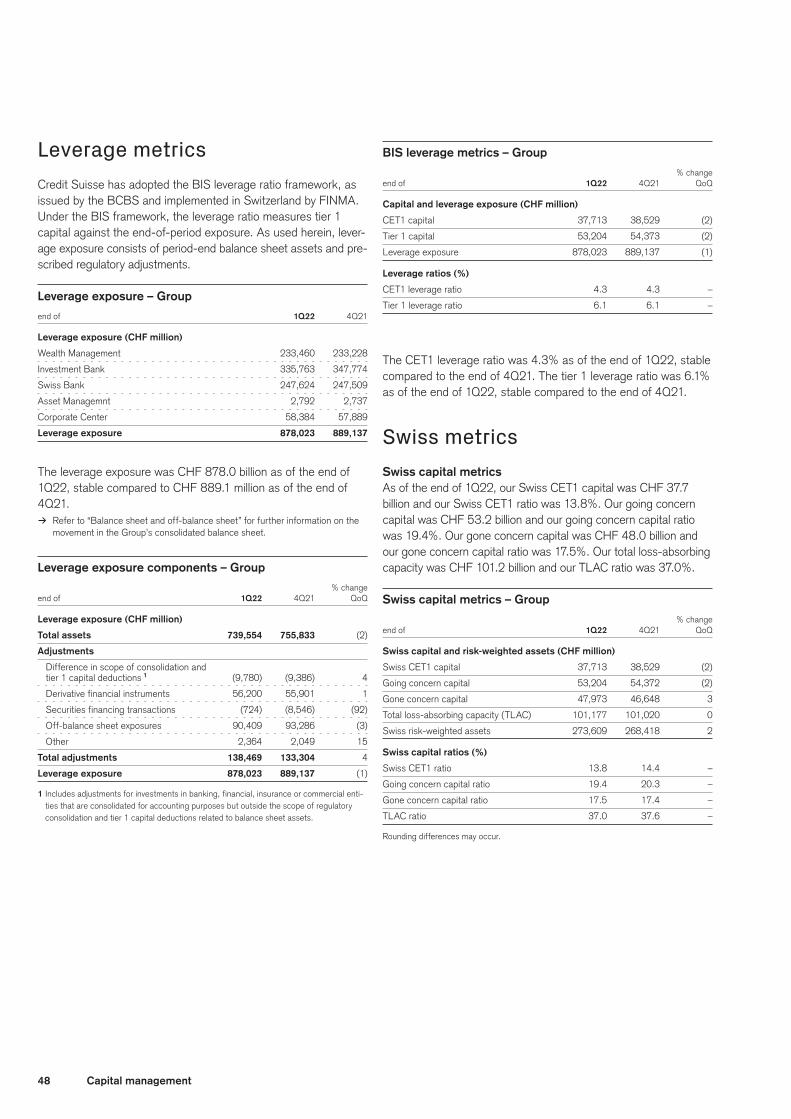
48 Capital management
Leverage metricsCredit Suisse has adopted the BIS leverage ratio framework, as issued by the BCBS and implemented in Switzerland by FINMA. Under the BIS framework, the leverage ratio measures tier 1 capital against the end-of-period exposure. As used herein, lever-age exposure consists of period-end balance sheet assets and pre-scribed regulatory adjustments.
Leverage exposure – Group
end of 1Q22 4Q21
Leverage exposure (CHF million)
Wealth Management 233,460 233,228
Investment Bank 335,763 347,774
Swiss Bank 247,624 247,509
Asset Managemnt 2,792 2,737
Corporate Center 58,384 57,889
Leverage exposure 878,023 889,137
The leverage exposure was CHF 878.0 billion as of the end of 1Q22, stable compared to CHF 889.1 million as of the end of 4Q21.
> Refer to “Balance sheet and off-balance sheet” for further information on the movement in the Group’s consolidated balance sheet.
Leverage exposure components – Group % change
end of 1Q22 4Q21 QoQ
Leverage exposure (CHF million)
Total assets 739,554 755,833 (2)
Adjustments
Difference in scope of consolidation and
tier 1 capital deductions 1 (9,780) (9,386) 4
Derivative financial instruments 56,200 55,901 1
Securities financing transactions (724) (8,546) (92)
Off-balance sheet exposures 90,409 93,286 (3)
Other 2,364 2,049 15
Total adjustments 138,469 133,304 4
Leverage exposure 878,023 889,137 (1)
1 Includes adjustments for investments in banking, financial, insurance or commercial enti-ties that are consolidated for accounting purposes but outside the scope of regulatory consolidation and tier 1 capital deductions related to balance sheet assets.
BIS leverage metrics – Group % change
end of 1Q22 4Q21 QoQ
Capital and leverage exposure (CHF million)
CET1 capital 37,713 38,529 (2)
Tier 1 capital 53,204 54,373 (2)
Leverage exposure 878,023 889,137 (1)
Leverage ratios (%)
CET1 leverage ratio 4.3 4.3 –
Tier 1 leverage ratio 6.1 6.1 –
The CET1 leverage ratio was 4.3% as of the end of 1Q22, stable compared to the end of 4Q21. The tier 1 leverage ratio was 6.1% as of the end of 1Q22, stable compared to the end of 4Q21.
Swiss metricsSwiss capital metricsAs of the end of 1Q22, our Swiss CET1 capital was CHF 37.7 billion and our Swiss CET1 ratio was 13.8%. Our going concern capital was CHF 53.2 billion and our going concern capital ratio was 19.4%. Our gone concern capital was CHF 48.0 billion and our gone concern capital ratio was 17.5%. Our total loss-absorbing capacity was CHF 101.2 billion and our TLAC ratio was 37.0%.
Swiss capital metrics – Group % change
end of 1Q22 4Q21 QoQ
Swiss capital and risk-weighted assets (CHF million)
Swiss CET1 capital 37,713 38,529 (2)
Going concern capital 53,204 54,372 (2)
Gone concern capital 47,973 46,648 3
Total loss-absorbing capacity (TLAC) 101,177 101,020 0
Swiss risk-weighted assets 273,609 268,418 2
Swiss capital ratios (%)
Swiss CET1 ratio 13.8 14.4 –
Going concern capital ratio 19.4 20.3 –
Gone concern capital ratio 17.5 17.4 –
TLAC ratio 37.0 37.6 –
Rounding differences may occur.
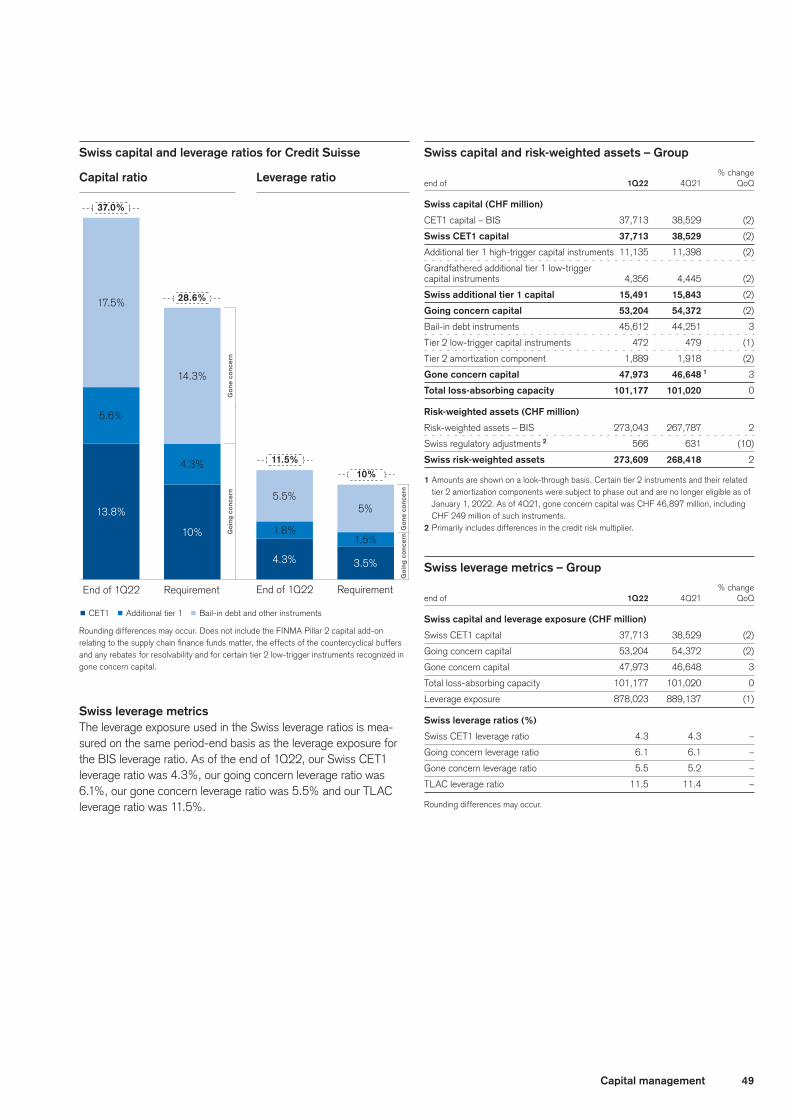
49Capital management
Swiss capital and leverage ratios for Credit Suisse
End of 1Q22 End of 1Q22Requirement Requirement
p CET1 p Additional tier 1 p Bail-in debt and other instruments
Rounding differences may occur. Does not include the FINMA Pillar 2 capital add-on relating to the supply chain finance funds matter, the effects of the countercyclical buffers and any rebates for resolvability and for certain tier 2 low-trigger instruments recognized in gone concern capital.
Goi
ng c
once
rnG
one
conc
ern
3.5%4.3%
5%5.5%
1.5%1.8%
10%
11.5%
10%
13.8%
17.5%
4.3%
5.6%
28.6%
37.0%
Capital ratio Leverage ratio
14.3%
Goi
ng c
once
rnG
one
conc
ern
Swiss leverage metricsThe leverage exposure used in the Swiss leverage ratios is mea-sured on the same period-end basis as the leverage exposure for the BIS leverage ratio. As of the end of 1Q22, our Swiss CET1 leverage ratio was 4.3%, our going concern leverage ratio was 6.1%, our gone concern leverage ratio was 5.5% and our TLAC leverage ratio was 11.5%.
Swiss capital and risk-weighted assets – Group % change
end of 1Q22 4Q21 QoQ
Swiss capital (CHF million)
CET1 capital – BIS 37,713 38,529 (2)
Swiss CET1 capital 37,713 38,529 (2)
Additional tier 1 high-trigger capital instruments 11,135 11,398 (2)
Grandfathered additional tier 1 low-trigger
capital instruments 4,356 4,445 (2)
Swiss additional tier 1 capital 15,491 15,843 (2)
Going concern capital 53,204 54,372 (2)
Bail-in debt instruments 45,612 44,251 3
Tier 2 low-trigger capital instruments 472 479 (1)
Tier 2 amortization component 1,889 1,918 (2)
Gone concern capital 47,973 46,648 1 3
Total loss-absorbing capacity 101,177 101,020 0
Risk-weighted assets (CHF million)
Risk-weighted assets – BIS 273,043 267,787 2
Swiss regulatory adjustments 2 566 631 (10)
Swiss risk-weighted assets 273,609 268,418 2
1 Amounts are shown on a look-through basis. Certain tier 2 instruments and their related tier 2 amortization components were subject to phase out and are no longer eligible as of January 1, 2022. As of 4Q21, gone concern capital was CHF 46,897 million, including CHF 249 million of such instruments.
2 Primarily includes differences in the credit risk multiplier.
Swiss leverage metrics – Group % change
end of 1Q22 4Q21 QoQ
Swiss capital and leverage exposure (CHF million)
Swiss CET1 capital 37,713 38,529 (2)
Going concern capital 53,204 54,372 (2)
Gone concern capital 47,973 46,648 3
Total loss-absorbing capacity 101,177 101,020 0
Leverage exposure 878,023 889,137 (1)
Swiss leverage ratios (%)
Swiss CET1 leverage ratio 4.3 4.3 –
Going concern leverage ratio 6.1 6.1 –
Gone concern leverage ratio 5.5 5.2 –
TLAC leverage ratio 11.5 11.4 –
Rounding differences may occur.
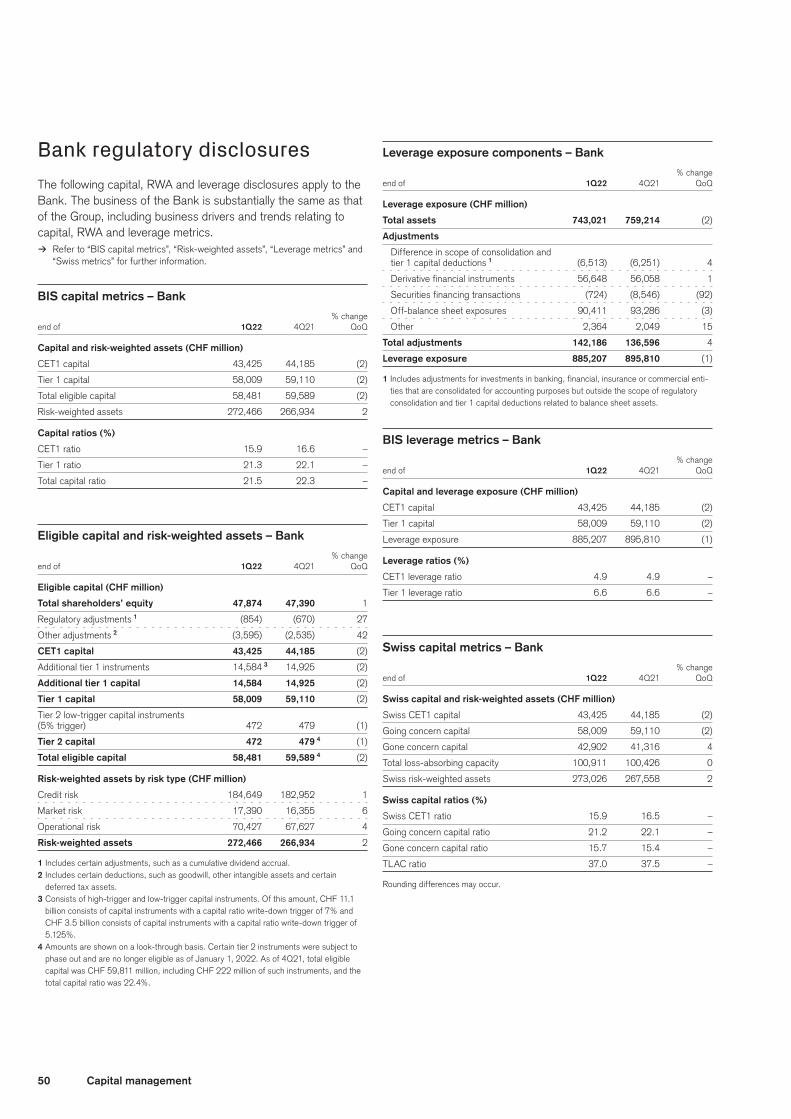
50 Capital management
Bank regulatory disclosuresThe following capital, RWA and leverage disclosures apply to the Bank. The business of the Bank is substantially the same as that of the Group, including business drivers and trends relating to capital, RWA and leverage metrics.
> Refer to “BIS capital metrics”, “Risk-weighted assets”, “Leverage metrics” and “Swiss metrics” for further information.
BIS capital metrics – Bank % change
end of 1Q22 4Q21 QoQ
Capital and risk-weighted assets (CHF million)
CET1 capital 43,425 44,185 (2)
Tier 1 capital 58,009 59,110 (2)
Total eligible capital 58,481 59,589 (2)
Risk-weighted assets 272,466 266,934 2
Capital ratios (%)
CET1 ratio 15.9 16.6 –
Tier 1 ratio 21.3 22.1 –
Total capital ratio 21.5 22.3 –
Eligible capital and risk-weighted assets – Bank % change
end of 1Q22 4Q21 QoQ
Eligible capital (CHF million)
Total shareholders’ equity 47,874 47,390 1
Regulatory adjustments 1 (854) (670) 27
Other adjustments 2 (3,595) (2,535) 42
CET1 capital 43,425 44,185 (2)
Additional tier 1 instruments 14,584 3 14,925 (2)
Additional tier 1 capital 14,584 14,925 (2)
Tier 1 capital 58,009 59,110 (2)
Tier 2 low-trigger capital instruments
(5% trigger) 472 479 (1)
Tier 2 capital 472 479 4 (1)
Total eligible capital 58,481 59,589 4 (2)
Risk-weighted assets by risk type (CHF million)
Credit risk 184,649 182,952 1
Market risk 17,390 16,355 6
Operational risk 70,427 67,627 4
Risk-weighted assets 272,466 266,934 2
1 Includes certain adjustments, such as a cumulative dividend accrual.2 Includes certain deductions, such as goodwill, other intangible assets and certain
deferred tax assets.3 Consists of high-trigger and low-trigger capital instruments. Of this amount, CHF 11.1
billion consists of capital instruments with a capital ratio write-down trigger of 7% and CHF 3.5 billion consists of capital instruments with a capital ratio write-down trigger of 5.125%.
4 Amounts are shown on a look-through basis. Certain tier 2 instruments were subject to phase out and are no longer eligible as of January 1, 2022. As of 4Q21, total eligible capital was CHF 59,811 million, including CHF 222 million of such instruments, and the total capital ratio was 22.4%.
Leverage exposure components – Bank % change
end of 1Q22 4Q21 QoQ
Leverage exposure (CHF million)
Total assets 743,021 759,214 (2)
Adjustments
Difference in scope of consolidation and
tier 1 capital deductions 1 (6,513) (6,251) 4
Derivative financial instruments 56,648 56,058 1
Securities financing transactions (724) (8,546) (92)
Off-balance sheet exposures 90,411 93,286 (3)
Other 2,364 2,049 15
Total adjustments 142,186 136,596 4
Leverage exposure 885,207 895,810 (1)
1 Includes adjustments for investments in banking, financial, insurance or commercial enti-ties that are consolidated for accounting purposes but outside the scope of regulatory consolidation and tier 1 capital deductions related to balance sheet assets.
BIS leverage metrics – Bank % change
end of 1Q22 4Q21 QoQ
Capital and leverage exposure (CHF million)
CET1 capital 43,425 44,185 (2)
Tier 1 capital 58,009 59,110 (2)
Leverage exposure 885,207 895,810 (1)
Leverage ratios (%)
CET1 leverage ratio 4.9 4.9 –
Tier 1 leverage ratio 6.6 6.6 –
Swiss capital metrics – Bank % change
end of 1Q22 4Q21 QoQ
Swiss capital and risk-weighted assets (CHF million)
Swiss CET1 capital 43,425 44,185 (2)
Going concern capital 58,009 59,110 (2)
Gone concern capital 42,902 41,316 4
Total loss-absorbing capacity 100,911 100,426 0
Swiss risk-weighted assets 273,026 267,558 2
Swiss capital ratios (%)
Swiss CET1 ratio 15.9 16.5 –
Going concern capital ratio 21.2 22.1 –
Gone concern capital ratio 15.7 15.4 –
TLAC ratio 37.0 37.5 –
Rounding differences may occur.
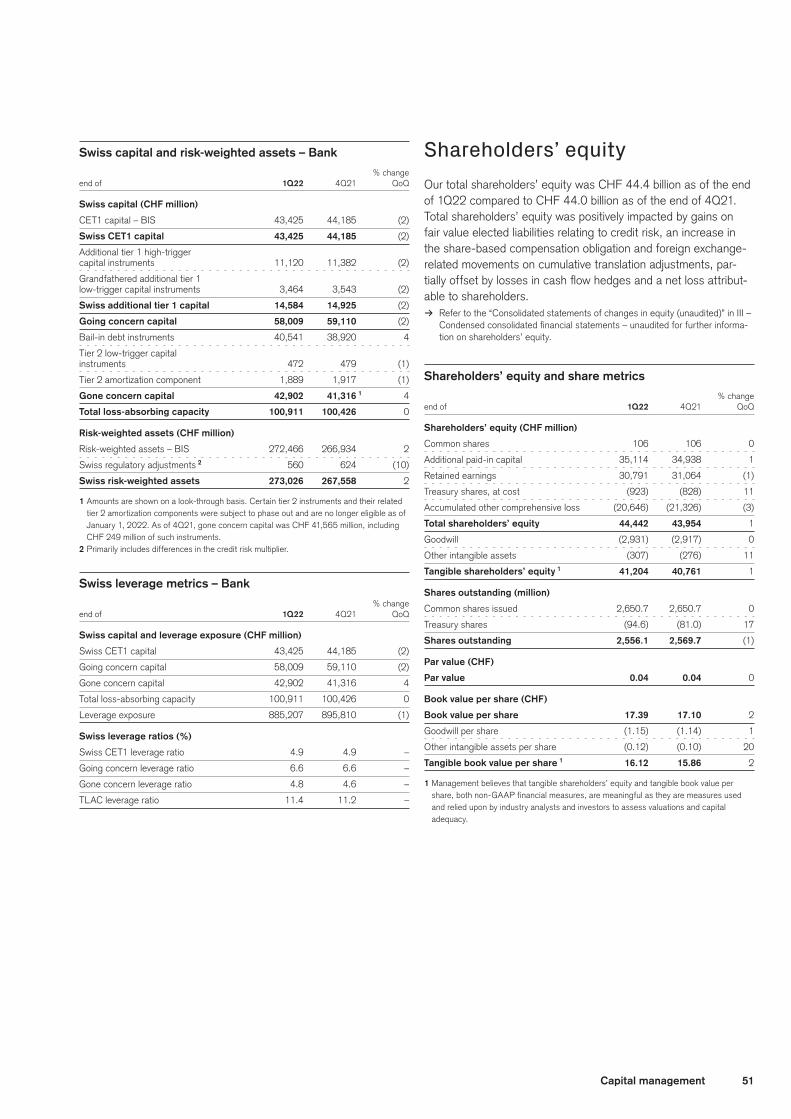
51Capital management
Swiss capital and risk-weighted assets – Bank % change
end of 1Q22 4Q21 QoQ
Swiss capital (CHF million)
CET1 capital – BIS 43,425 44,185 (2)
Swiss CET1 capital 43,425 44,185 (2)
Additional tier 1 high-trigger
capital instruments 11,120 11,382 (2)
Grandfathered additional tier 1
low-trigger capital instruments 3,464 3,543 (2)
Swiss additional tier 1 capital 14,584 14,925 (2)
Going concern capital 58,009 59,110 (2)
Bail-in debt instruments 40,541 38,920 4
Tier 2 low-trigger capital
instruments 472 479 (1)
Tier 2 amortization component 1,889 1,917 (1)
Gone concern capital 42,902 41,316 1 4
Total loss-absorbing capacity 100,911 100,426 0
Risk-weighted assets (CHF million)
Risk-weighted assets – BIS 272,466 266,934 2
Swiss regulatory adjustments 2 560 624 (10)
Swiss risk-weighted assets 273,026 267,558 2
1 Amounts are shown on a look-through basis. Certain tier 2 instruments and their related tier 2 amortization components were subject to phase out and are no longer eligible as of January 1, 2022. As of 4Q21, gone concern capital was CHF 41,565 million, including CHF 249 million of such instruments.
2 Primarily includes differences in the credit risk multiplier.
Swiss leverage metrics – Bank % change
end of 1Q22 4Q21 QoQ
Swiss capital and leverage exposure (CHF million)
Swiss CET1 capital 43,425 44,185 (2)
Going concern capital 58,009 59,110 (2)
Gone concern capital 42,902 41,316 4
Total loss-absorbing capacity 100,911 100,426 0
Leverage exposure 885,207 895,810 (1)
Swiss leverage ratios (%)
Swiss CET1 leverage ratio 4.9 4.9 –
Going concern leverage ratio 6.6 6.6 –
Gone concern leverage ratio 4.8 4.6 –
TLAC leverage ratio 11.4 11.2 –
Shareholders’ equityOur total shareholders’ equity was CHF 44.4 billion as of the end of 1Q22 compared to CHF 44.0 billion as of the end of 4Q21. Total shareholders’ equity was positively impacted by gains on fair value elected liabilities relating to credit risk, an increase in the share-based compensation obligation and foreign exchange-related movements on cumulative translation adjustments, par-tially offset by losses in cash flow hedges and a net loss attribut-able to shareholders.
> Refer to the “Consolidated statements of changes in equity (unaudited)” in III – Condensed consolidated financial statements – unaudited for further informa-tion on shareholders’ equity.
Shareholders’ equity and share metrics % change
end of 1Q22 4Q21 QoQ
Shareholders’ equity (CHF million)
Common shares 106 106 0
Additional paid-in capital 35,114 34,938 1
Retained earnings 30,791 31,064 (1)
Treasury shares, at cost (923) (828) 11
Accumulated other comprehensive loss (20,646) (21,326) (3)
Total shareholders’ equity 44,442 43,954 1
Goodwill (2,931) (2,917) 0
Other intangible assets (307) (276) 11
Tangible shareholders’ equity 1 41,204 40,761 1
Shares outstanding (million)
Common shares issued 2,650.7 2,650.7 0
Treasury shares (94.6) (81.0) 17
Shares outstanding 2,556.1 2,569.7 (1)
Par value (CHF)
Par value 0.04 0.04 0
Book value per share (CHF)
Book value per share 17.39 17.10 2
Goodwill per share (1.15) (1.14) 1
Other intangible assets per share (0.12) (0.10) 20
Tangible book value per share 1 16.12 15.86 2
1 Management believes that tangible shareholders’ equity and tangible book value per share, both non-GAAP financial measures, are meaningful as they are measures used and relied upon by industry analysts and investors to assess valuations and capital adequacy.
52 Risk management
Risk management
As of the end of 1Q22, the Group had a gross loan portfolio of CHF 289.1 billion, gross impaired loans of CHF 3.0 billion and, in 1Q22, an average risk management VaR of USD 54 million.
Key risk developmentsWe are closely monitoring the following key risk and global eco-nomic developments as well as the potential effects on our opera-tions and businesses, including through the reassessment of financial plans and the development of stress scenarios that take into account potential additional negative impacts.
Russia’s invasion of UkraineIn late February 2022, the Russian government launched a mili-tary attack on Ukraine. In response to Russia’s military attack, the US, EU, UK, Switzerland and other countries across the world imposed severe sanctions against Russia’s financial system and on Russian government officials and Russian business leaders. Sanctions beginning in February 2022 included limitations on the ability of certain Russian banks to access the SWIFT financial messaging service, restrictions on transactions with the Russian central bank, prohibitions on new investments in Russia, sanc-tions on Russian financial institutions, sanctions on critical major state-owned enterprises, sanctions on certain Russian govern-ment officials and their family members, sanctions on business elites, capital markets-related restrictions and deposit-related limitations. The Russian government has also imposed certain countermeasures, which include restrictions relating to foreign currency accounts and security transactions. These measures followed earlier sanctions that had already been imposed by the US, EU and UK in 2021 in response to alleged Russian activities related to Syria, cybersecurity, electoral interference and other matters, including the prohibition of US banks from participat-ing in the primary market for any Russian sovereign bonds or any lending to the Russian sovereign, as well as other restric-tions since 2014 relating to new debt or equity of certain Russian banks and energy companies. We are continuously assessing the impact of sanctions already imposed, Russian government countermeasures and potential future escalations, on our expo-sures and client relationships. The Executive Board is managing the Group’s ongoing crisis management response. Key priorities in this respect include taking measures to protect the safety and security of impacted staff, implementing the different sanc-tions and close monitoring of potential business interruptions and increased cyber threats.
> Refer to “Selected European credit risk exposures” in Risk portfolio analy-sis – Credit risk for further information on the Group’s credit risk exposure to Russia.
ChinaIn 1Q22 and into April, Hong Kong, followed by Shanghai and numerous other cities across China, struggled to contain a surge in COVID-19 infections caused by the Omicron variant which led to the imposition of severe economic activity restrictions and quarantine requirements. Investors were concerned that such lockdowns may further disrupt global supply chains and increase the upward pressure on inflation. In addition, liquidity and sol-vency concerns persisted in China’s property development sector in 1Q22, with potentially adverse impacts on China’s economy and on global markets. In 1Q22, to help mitigate these potentially adverse impacts, Chinese government policies pivoted further toward providing more support for its economy. We closely moni-tor the risk management implications of these developments on our lombard loan portfolio in China, our trading and lending book exposures to Chinese local government- and state-owned enter-prises as well as the accelerating default trend in the onshore corporate debt market.
Inflation concernsAnnual inflation rates increased in 2021 across all major econo-mies and moved even higher in 1Q22 as energy and food prices increased sharply, primarily as a result of supply chain disrup-tions which have been further exacerbated by Russia’s invasion of Ukraine and the implementation of wide-ranging sanctions against Russia. The Fed increased the federal funds rate in March 2022 and indicated to the markets that there would be further rate increases during the rest of 2022 and in 2023. Investors were concerned that early and aggressive rate increases may have potentially adverse impacts on major global equity and credit markets, as well as certain emerging market countries in coming quarters, and may bring a sharp economic activity slowdown or even deterioration into recession. A deep-dive assessment of the implications of sustained high inflation on Credit Suisse’s busi-nesses, portfolios and exposure concentrations was conducted and a stress test was developed and frequently applied to assess market risk vulnerabilities.
Swiss property marketProperty prices remained on an upward trend in 1Q22, and Swiss mortgage rates began increasing. As previously reported, the Swiss Federal Council at the request of the SNB also reacti-vated the Swiss countercyclical capital buffer in January 2022. We regularly monitor risks in our Swiss residential mortgage loan portfolio and apply risk mitigation measures.
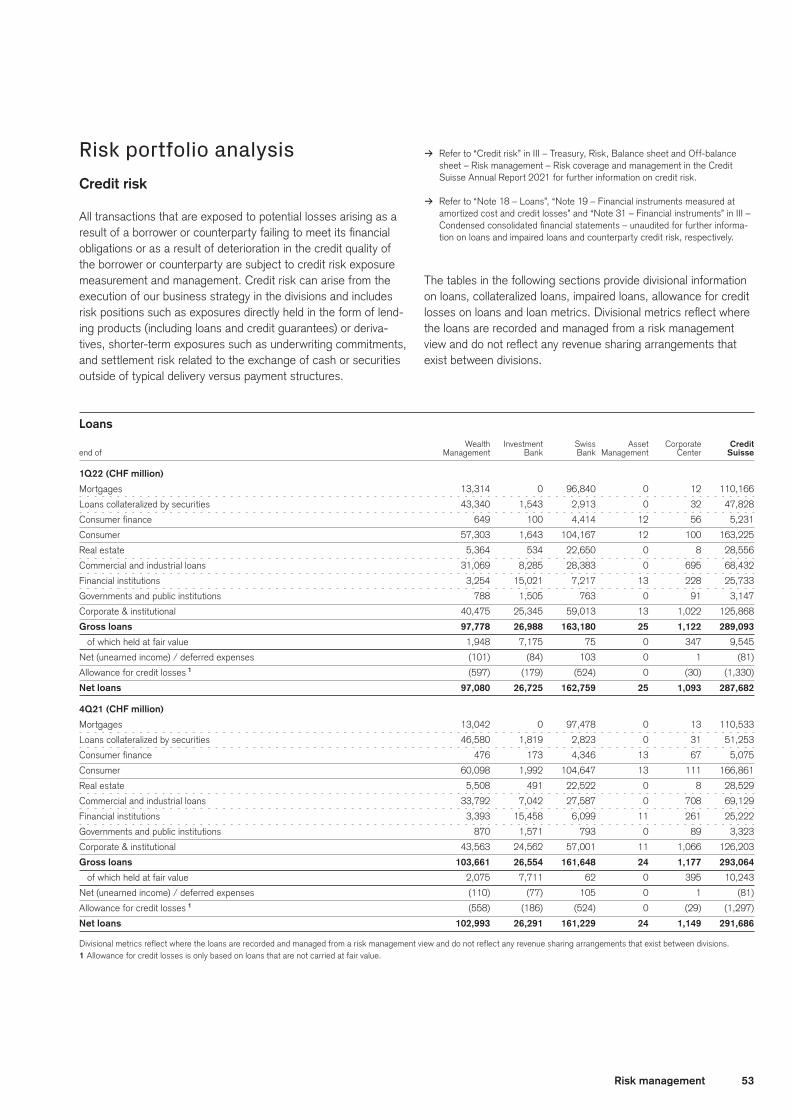
53Risk management
Risk portfolio analysisCredit risk
All transactions that are exposed to potential losses arising as a result of a borrower or counterparty failing to meet its financial obligations or as a result of deterioration in the credit quality of the borrower or counterparty are subject to credit risk exposure measurement and management. Credit risk can arise from the execution of our business strategy in the divisions and includes risk positions such as exposures directly held in the form of lend-ing products (including loans and credit guarantees) or deriva-tives, shorter-term exposures such as underwriting commitments, and settlement risk related to the exchange of cash or securities outside of typical delivery versus payment structures.
> Refer to “Credit risk” in III – Treasury, Risk, Balance sheet and Off-balance sheet – Risk management – Risk coverage and management in the Credit Suisse Annual Report 2021 for further information on credit risk.
> Refer to “Note 18 – Loans”, “Note 19 – Financial instruments measured at amortized cost and credit losses” and “Note 31 – Financial instruments” in III – Condensed consolidated financial statements – unaudited for further informa-tion on loans and impaired loans and counterparty credit risk, respectively.
The tables in the following sections provide divisional information on loans, collateralized loans, impaired loans, allowance for credit losses on loans and loan metrics. Divisional metrics reflect where the loans are recorded and managed from a risk management view and do not reflect any revenue sharing arrangements that exist between divisions.
Loans Wealth Investment Swiss Asset Corporate Credit end of Management Bank Bank Management Center Suisse
1Q22 (CHF million)
Mortgages 13,314 0 96,840 0 12 110,166
Loans collateralized by securities 43,340 1,543 2,913 0 32 47,828
Consumer finance 649 100 4,414 12 56 5,231
Consumer 57,303 1,643 104,167 12 100 163,225
Real estate 5,364 534 22,650 0 8 28,556
Commercial and industrial loans 31,069 8,285 28,383 0 695 68,432
Financial institutions 3,254 15,021 7,217 13 228 25,733
Governments and public institutions 788 1,505 763 0 91 3,147
Corporate & institutional 40,475 25,345 59,013 13 1,022 125,868
Gross loans 97,778 26,988 163,180 25 1,122 289,093
of which held at fair value 1,948 7,175 75 0 347 9,545
Net (unearned income) / deferred expenses (101) (84) 103 0 1 (81)
Allowance for credit losses 1 (597) (179) (524) 0 (30) (1,330)
Net loans 97,080 26,725 162,759 25 1,093 287,682
4Q21 (CHF million)
Mortgages 13,042 0 97,478 0 13 110,533
Loans collateralized by securities 46,580 1,819 2,823 0 31 51,253
Consumer finance 476 173 4,346 13 67 5,075
Consumer 60,098 1,992 104,647 13 111 166,861
Real estate 5,508 491 22,522 0 8 28,529
Commercial and industrial loans 33,792 7,042 27,587 0 708 69,129
Financial institutions 3,393 15,458 6,099 11 261 25,222
Governments and public institutions 870 1,571 793 0 89 3,323
Corporate & institutional 43,563 24,562 57,001 11 1,066 126,203
Gross loans 103,661 26,554 161,648 24 1,177 293,064
of which held at fair value 2,075 7,711 62 0 395 10,243
Net (unearned income) / deferred expenses (110) (77) 105 0 1 (81)
Allowance for credit losses 1 (558) (186) (524) 0 (29) (1,297)
Net loans 102,993 26,291 161,229 24 1,149 291,686
Divisional metrics reflect where the loans are recorded and managed from a risk management view and do not reflect any revenue sharing arrangements that exist between divisions.1 Allowance for credit losses is only based on loans that are not carried at fair value.
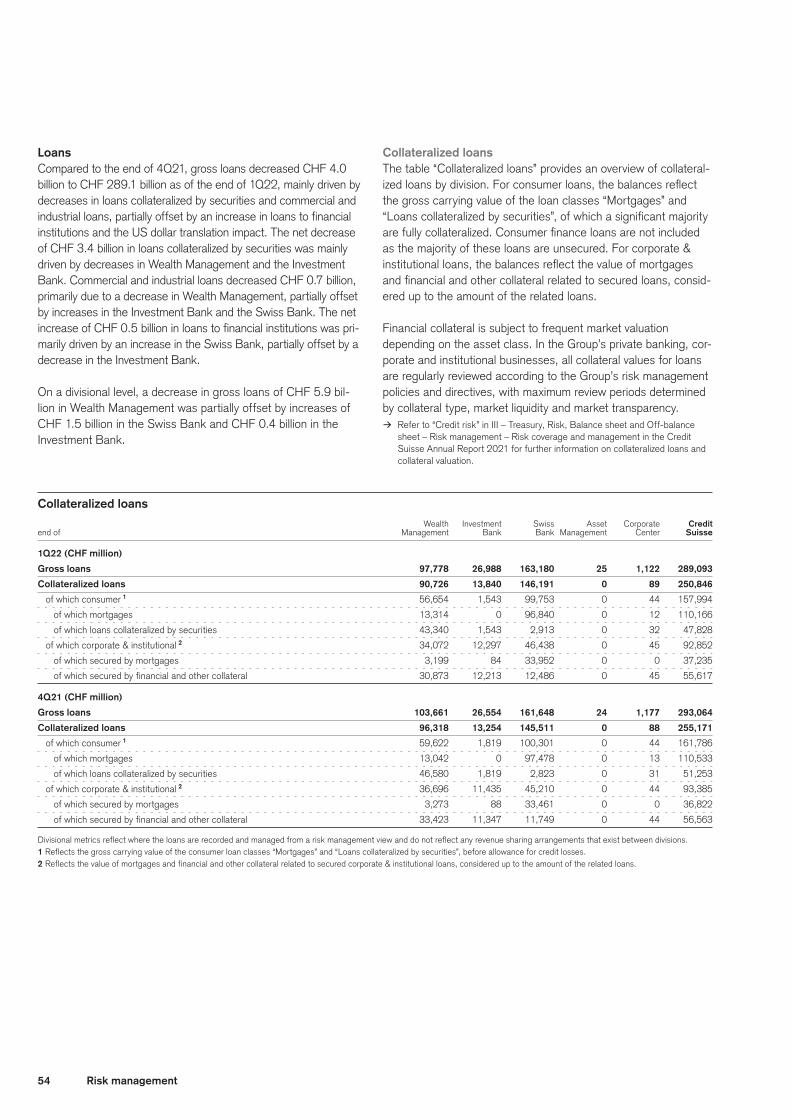
54 Risk management
LoansCompared to the end of 4Q21, gross loans decreased CHF 4.0 billion to CHF 289.1 billion as of the end of 1Q22, mainly driven by decreases in loans collateralized by securities and commercial and industrial loans, partially offset by an increase in loans to financial institutions and the US dollar translation impact. The net decrease of CHF 3.4 billion in loans collateralized by securities was mainly driven by decreases in Wealth Management and the Investment Bank. Commercial and industrial loans decreased CHF 0.7 billion, primarily due to a decrease in Wealth Management, partially offset by increases in the Investment Bank and the Swiss Bank. The net increase of CHF 0.5 billion in loans to financial institutions was pri-marily driven by an increase in the Swiss Bank, partially offset by a decrease in the Investment Bank.
On a divisional level, a decrease in gross loans of CHF 5.9 bil-lion in Wealth Management was partially offset by increases of CHF 1.5 billion in the Swiss Bank and CHF 0.4 billion in the Investment Bank.
Collateralized loansThe table “Collateralized loans” provides an overview of collateral-ized loans by division. For consumer loans, the balances reflect the gross carrying value of the loan classes “Mortgages” and “Loans collateralized by securities”, of which a significant majority are fully collateralized. Consumer finance loans are not included as the majority of these loans are unsecured. For corporate & institutional loans, the balances reflect the value of mortgages and financial and other collateral related to secured loans, consid-ered up to the amount of the related loans.
Financial collateral is subject to frequent market valuation depending on the asset class. In the Group’s private banking, cor-porate and institutional businesses, all collateral values for loans are regularly reviewed according to the Group’s risk management policies and directives, with maximum review periods determined by collateral type, market liquidity and market transparency.
> Refer to “Credit risk” in III – Treasury, Risk, Balance sheet and Off-balance sheet – Risk management – Risk coverage and management in the Credit Suisse Annual Report 2021 for further information on collateralized loans and collateral valuation.
Collateralized loans Wealth Investment Swiss Asset Corporate Credit end of Management Bank Bank Management Center Suisse
1Q22 (CHF million)
Gross loans 97,778 26,988 163,180 25 1,122 289,093
Collateralized loans 90,726 13,840 146,191 0 89 250,846
of which consumer 1 56,654 1,543 99,753 0 44 157,994
of which mortgages 13,314 0 96,840 0 12 110,166
of which loans collateralized by securities 43,340 1,543 2,913 0 32 47,828
of which corporate & institutional 2 34,072 12,297 46,438 0 45 92,852
of which secured by mortgages 3,199 84 33,952 0 0 37,235
of which secured by financial and other collateral 30,873 12,213 12,486 0 45 55,617
4Q21 (CHF million)
Gross loans 103,661 26,554 161,648 24 1,177 293,064
Collateralized loans 96,318 13,254 145,511 0 88 255,171
of which consumer 1 59,622 1,819 100,301 0 44 161,786
of which mortgages 13,042 0 97,478 0 13 110,533
of which loans collateralized by securities 46,580 1,819 2,823 0 31 51,253
of which corporate & institutional 2 36,696 11,435 45,210 0 44 93,385
of which secured by mortgages 3,273 88 33,461 0 0 36,822
of which secured by financial and other collateral 33,423 11,347 11,749 0 44 56,563
Divisional metrics reflect where the loans are recorded and managed from a risk management view and do not reflect any revenue sharing arrangements that exist between divisions.1 Reflects the gross carrying value of the consumer loan classes “Mortgages” and “Loans collateralized by securities”, before allowance for credit losses.2 Reflects the value of mortgages and financial and other collateral related to secured corporate & institutional loans, considered up to the amount of the related loans.
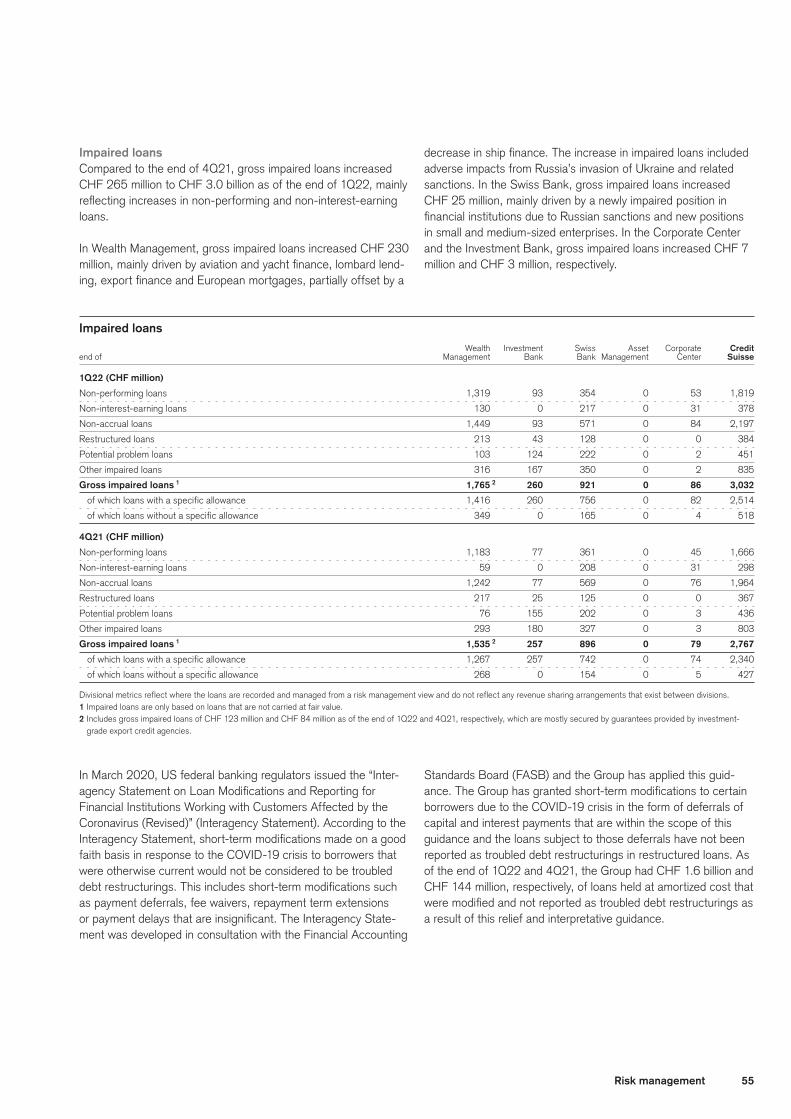
55Risk management
Impaired loansCompared to the end of 4Q21, gross impaired loans increased CHF 265 million to CHF 3.0 billion as of the end of 1Q22, mainly reflecting increases in non-performing and non-interest-earning loans.
In Wealth Management, gross impaired loans increased CHF 230 million, mainly driven by aviation and yacht finance, lombard lend-ing, export finance and European mortgages, partially offset by a
decrease in ship finance. The increase in impaired loans included adverse impacts from Russia’s invasion of Ukraine and related sanctions. In the Swiss Bank, gross impaired loans increased CHF 25 million, mainly driven by a newly impaired position in financial institutions due to Russian sanctions and new positions in small and medium-sized enterprises. In the Corporate Center and the Investment Bank, gross impaired loans increased CHF 7 million and CHF 3 million, respectively.
Impaired loans Wealth Investment Swiss Asset Corporate Credit end of Management Bank Bank Management Center Suisse
1Q22 (CHF million)
Non-performing loans 1,319 93 354 0 53 1,819
Non-interest-earning loans 130 0 217 0 31 378
Non-accrual loans 1,449 93 571 0 84 2,197
Restructured loans 213 43 128 0 0 384
Potential problem loans 103 124 222 0 2 451
Other impaired loans 316 167 350 0 2 835
Gross impaired loans 1 1,765 2 260 921 0 86 3,032
of which loans with a specific allowance 1,416 260 756 0 82 2,514
of which loans without a specific allowance 349 0 165 0 4 518
4Q21 (CHF million)
Non-performing loans 1,183 77 361 0 45 1,666
Non-interest-earning loans 59 0 208 0 31 298
Non-accrual loans 1,242 77 569 0 76 1,964
Restructured loans 217 25 125 0 0 367
Potential problem loans 76 155 202 0 3 436
Other impaired loans 293 180 327 0 3 803
Gross impaired loans 1 1,535 2 257 896 0 79 2,767
of which loans with a specific allowance 1,267 257 742 0 74 2,340
of which loans without a specific allowance 268 0 154 0 5 427
Divisional metrics reflect where the loans are recorded and managed from a risk management view and do not reflect any revenue sharing arrangements that exist between divisions.1 Impaired loans are only based on loans that are not carried at fair value.2 Includes gross impaired loans of CHF 123 million and CHF 84 million as of the end of 1Q22 and 4Q21, respectively, which are mostly secured by guarantees provided by investment-
grade export credit agencies.
In March 2020, US federal banking regulators issued the “Inter-agency Statement on Loan Modifications and Reporting for Financial Institutions Working with Customers Affected by the Coronavirus (Revised)” (Interagency Statement). According to the Interagency Statement, short-term modifications made on a good faith basis in response to the COVID-19 crisis to borrowers that were otherwise current would not be considered to be troubled debt restructurings. This includes short-term modifications such as payment deferrals, fee waivers, repayment term extensions or payment delays that are insignificant. The Interagency State-ment was developed in consultation with the Financial Accounting
Standards Board (FASB) and the Group has applied this guid-ance. The Group has granted short-term modifications to certain borrowers due to the COVID-19 crisis in the form of deferrals of capital and interest payments that are within the scope of this guidance and the loans subject to those deferrals have not been reported as troubled debt restructurings in restructured loans. As of the end of 1Q22 and 4Q21, the Group had CHF 1.6 billion and CHF 144 million, respectively, of loans held at amortized cost that were modified and not reported as troubled debt restructurings as a result of this relief and interpretative guidance.
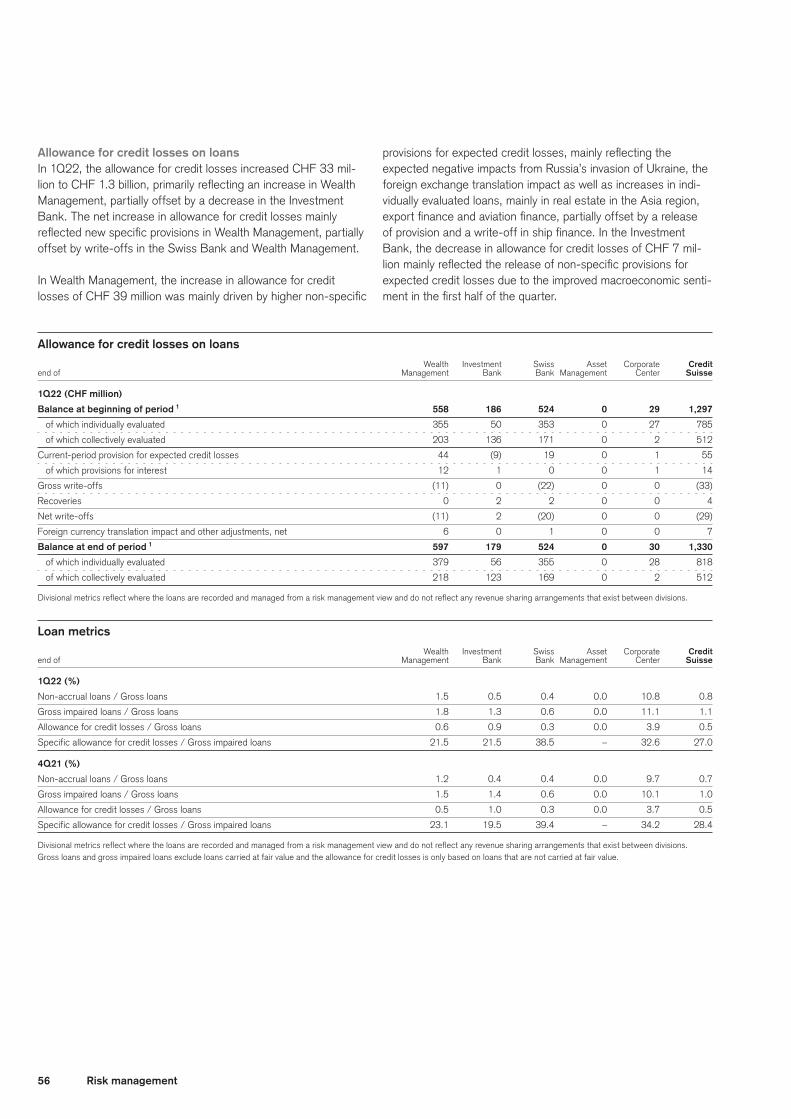
56 Risk management
Allowance for credit losses on loansIn 1Q22, the allowance for credit losses increased CHF 33 mil-lion to CHF 1.3 billion, primarily reflecting an increase in Wealth Management, partially offset by a decrease in the Investment Bank. The net increase in allowance for credit losses mainly reflected new specific provisions in Wealth Management, partially offset by write-offs in the Swiss Bank and Wealth Management.
In Wealth Management, the increase in allowance for credit losses of CHF 39 million was mainly driven by higher non-specific
provisions for expected credit losses, mainly reflecting the expected negative impacts from Russia’s invasion of Ukraine, the foreign exchange translation impact as well as increases in indi-vidually evaluated loans, mainly in real estate in the Asia region, export finance and aviation finance, partially offset by a release of provision and a write-off in ship finance. In the Investment Bank, the decrease in allowance for credit losses of CHF 7 mil-lion mainly reflected the release of non-specific provisions for expected credit losses due to the improved macroeconomic senti-ment in the first half of the quarter.
Allowance for credit losses on loans Wealth Investment Swiss Asset Corporate Credit end of Management Bank Bank Management Center Suisse
1Q22 (CHF million)
Balance at beginning of period 1 558 186 524 0 29 1,297
of which individually evaluated 355 50 353 0 27 785
of which collectively evaluated 203 136 171 0 2 512
Current-period provision for expected credit losses 44 (9) 19 0 1 55
of which provisions for interest 12 1 0 0 1 14
Gross write-offs (11) 0 (22) 0 0 (33)
Recoveries 0 2 2 0 0 4
Net write-offs (11) 2 (20) 0 0 (29)
Foreign currency translation impact and other adjustments, net 6 0 1 0 0 7
Balance at end of period 1 597 179 524 0 30 1,330
of which individually evaluated 379 56 355 0 28 818
of which collectively evaluated 218 123 169 0 2 512
Divisional metrics reflect where the loans are recorded and managed from a risk management view and do not reflect any revenue sharing arrangements that exist between divisions.
Loan metrics Wealth Investment Swiss Asset Corporate Credit end of Management Bank Bank Management Center Suisse
1Q22 (%)
Non-accrual loans / Gross loans 1.5 0.5 0.4 0.0 10.8 0.8
Gross impaired loans / Gross loans 1.8 1.3 0.6 0.0 11.1 1.1
Allowance for credit losses / Gross loans 0.6 0.9 0.3 0.0 3.9 0.5
Specific allowance for credit losses / Gross impaired loans 21.5 21.5 38.5 – 32.6 27.0
4Q21 (%)
Non-accrual loans / Gross loans 1.2 0.4 0.4 0.0 9.7 0.7
Gross impaired loans / Gross loans 1.5 1.4 0.6 0.0 10.1 1.0
Allowance for credit losses / Gross loans 0.5 1.0 0.3 0.0 3.7 0.5
Specific allowance for credit losses / Gross impaired loans 23.1 19.5 39.4 – 34.2 28.4
Divisional metrics reflect where the loans are recorded and managed from a risk management view and do not reflect any revenue sharing arrangements that exist between divisions.Gross loans and gross impaired loans exclude loans carried at fair value and the allowance for credit losses is only based on loans that are not carried at fair value.
57Risk management
Allowance for credit losses on other financial assetsIn 1Q22, the Investment Bank recorded a release of provision for credit losses of CHF 155 million, compared to a release of CHF 5 million in 4Q21, pertaining to an assessment of the future recoverability of receivables related to Archegos. On the Group’s consolidated balance sheet as of the end of 1Q22 and 4Q21, the related allowance is included in the allowance for credit losses on brokerage receivables of CHF 4,069 million and CHF 4,186 mil-lion, respectively.
> Refer to “Significant events in 2021” in II – Credit Suisse results – Credit Suisse and “Risk factors” in I – Information on the company in the Credit Suisse Annual Report 2021 for information on the Archegos matter.
> Refer to “Note 9 – Provision for credit losses” and “Note 19 – Financial instru-ments measured at amortized cost and credit losses” in III – Condensed con-solidated financial statements – unaudited for further information.
Selected European credit risk exposures > Refer to “Selected European credit risk exposures” in III – Treasury, Risk, Bal-
ance sheet and Off-balance sheet – Risk management – Risk portfolio analysis – Credit risk in the Credit Suisse Annual Report 2021 for further information on selected European credit risk exposures.
Russia credit risk exposureThe US, EU, UK, Switzerland and other countries across the world imposed severe sanctions against Russia’s financial system, government officials and business leaders following the Russian military attack on Ukraine in late February 2022.
Our gross credit risk exposure to Russia, before taking into account risk mitigation but net of specific allowances and provi-sions for credit losses and valuation adjustments, decreased 34% to CHF 1,041 million as of the end of 1Q22. Our net credit risk exposure to Russia decreased 56% to CHF 373 million, mainly reflecting exposure reductions to financial institutions.
The Group is currently monitoring settlement risk on certain open transactions with Russian counterparties; market closures, the imposition of exchange controls, sanctions or other factors may limit the Group’s ability to settle existing transactions or real-ize on collateral, which could result in unexpected increases in exposures.
> Refer to “Russia’s invasion of Ukraine” in Key risk developments for further information.
Market risk
Market risk is the risk of financial loss arising from movements in market risk factors. Market risks arise from both our trading and non-trading activities.
> Refer to “Market risk” in III – Treasury, Risk, Balance sheet and Off-balance sheet – Risk management – Risk coverage and management in the Credit Suisse Annual Report 2021 for further information on market risk including our VaR methodology.
Traded market riskMarket risks mainly arise from our trading activities, primarily in the Investment Bank (which includes Global Trading Solutions). Our trading activities typically include fair-valued positions and risks arising from our involvement in primary and secondary mar-ket activities, for client facilitation and market-making purposes, including derivatives markets.
The Group is active globally in the principal trading markets, using a wide range of trading and hedging products, including deriva-tives and structured products. Structured products are custom-ized transactions often using combinations of financial instru-ments and are executed to meet specific client or internal needs. As a result of our broad participation in products and markets, the Group’s trading strategies are correspondingly diverse and expo-sures are generally spread across a range of risks and locations.
VaR is a risk measure that quantifies the potential loss on a given portfolio of financial instruments over a certain holding period that is expected not to be exceeded at a certain confidence level. VaR is an important tool in risk management and is used for measur-ing quantifiable risks from our activities exposed to market risk on a daily basis. In addition, VaR is one of the main risk measures for limit monitoring, financial reporting, calculation of regulatory capi-tal and regulatory backtesting.
We regularly review our VaR model to ensure that it remains appro-priate given evolving market conditions and the composition of our trading portfolio. In 1Q22, there were no material changes to our VaR methodology.
We have approval from FINMA, as well as from other regulators for our subsidiaries, to use our regulatory VaR model in the calculation of market risk capital requirements. Ongoing enhancements to our VaR methodology are subject to regulatory approval or notification depending on their materiality, and the model is subject to regular reviews by regulators and the Group’s independent Model Risk Management function.
Information required under Pillar 3 of the Basel framework related to market risk is available on our website.
> Refer to “credit-suisse.com/regulatorydisclosures” for further information.
The tables entitled “One-day, 98% risk management VaR” and “Average one-day, 98% risk management VaR by division” show our traded market risk exposure, as measured by one-day, 98% risk management VaR in Swiss francs and US dollars. As we measure VaR for internal risk management purposes using the US dollar as the base currency, the VaR figures were trans-lated into Swiss francs using daily foreign exchange translation rates. VaR estimates are computed separately for each risk type and for the whole portfolio. The different risk types are grouped into five categories including interest rate, credit spread, foreign exchange, commodity and equity risks.

58 Risk management
One-day, 98% risk management VaR Diversi- Interest Credit Foreign fication
in / end of rate spread exchange Commodity Equity benefit 1 Total
CHF million
1Q22
Average 14 44 26 3 30 (67) 50
Minimum 10 37 18 3 25 – 2 42
Maximum 19 49 29 7 34 – 2 59
End of period 19 42 25 3 26 (70) 45
4Q21
Average 13 43 29 3 32 (72) 48
Minimum 10 37 24 2 30 – 2 44
Maximum 15 51 32 3 37 – 2 58
End of period 11 37 28 3 32 (66) 45
USD million
1Q22
Average 15 47 28 3 32 (71) 54
Minimum 10 40 19 3 27 – 2 46
Maximum 21 52 31 8 37 – 2 64
End of period 21 46 27 3 28 (77) 48
4Q21
Average 14 47 31 3 35 (77) 53
Minimum 11 40 26 3 32 – 2 48
Maximum 16 55 35 4 40 – 2 63
End of period 12 40 30 3 35 (71) 49
Excludes risks associated with counterparty and own credit exposures. Risk management VaR measures the Group’s risk exposure managed under the market risk framework and gener-ally includes the trading book positions and banking book positions held at fair value.1 Diversification benefit represents the reduction in risk that occurs when combining different, not perfectly correlated risk types in the same portfolio and is measured as the difference
between the sum of the individual risk types and the risk calculated on the combined portfolio.2 As the maximum and minimum occur on different days for different risk types, it is not meaningful to calculate a portfolio diversification benefit.
Average one-day, 98% risk management VaR by division Diversi- Wealth Investment Swiss Asset Corporate fication Credit in Management Bank Bank Management Center benefit 1 Suisse
CHF million
1Q22 11 46 0 0 4 (11) 50
4Q21 2 11 45 0 0 4 (12) 48
USD million
1Q22 12 50 0 0 5 (13) 54
4Q21 2 12 49 0 0 4 (12) 53
Excludes risks associated with counterparty and own credit exposures. Risk management VaR measures the Group’s risk exposure managed under the market risk framework and gener-ally includes the trading book positions and banking book positions held at fair value.1 Difference between the sum of the standalone VaR for each division and the VaR for the Group.2 The restatement of divisional historical average risk management VaR under the new organization required certain additional assumptions, which will not be required for future periods.
We measure VaR in US dollars, as the majority of our trading activities are conducted in US dollars.
Average risk management VaR of USD 54 million in 1Q22 increased 2% compared to 4Q21.
The chart entitled “Daily risk management VaR” shows the aggre-gated traded market risk on a consolidated basis.
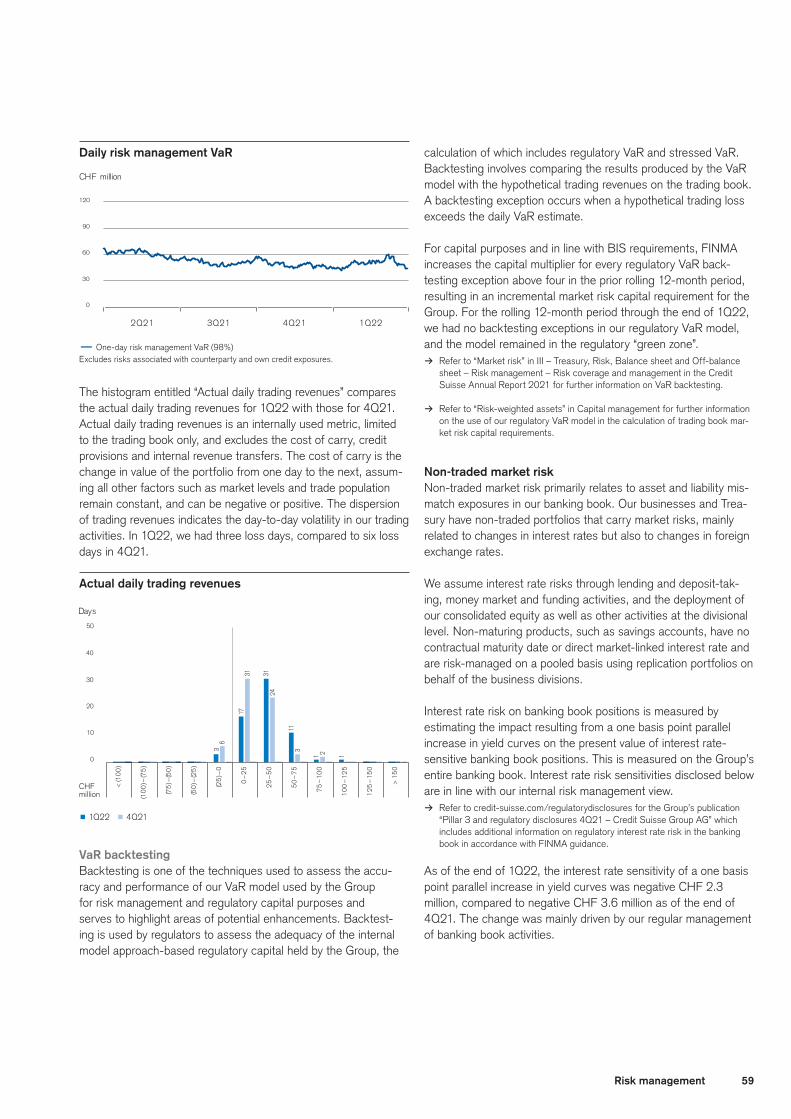
59Risk management
Daily risk management VaR
j One-day risk management VaR (98%) Excludes risks associated with counterparty and own credit exposures.
CHF million
0
30
60
90
120
2Q21 3Q21 4Q21 1Q22
Actual daily trading revenues
p 1Q22 p 4Q21
0
10
20
30
40
50
< (1
00
)
Days
(10
0)–
(75
)
(75
)–(5
0)
(50
)–(2
5)
(25
)–0
0–
25
25
–5
0
50
–7
5
75
–1
00
10
0–
12
5
12
5–
15
0
> 1
50
CHFmillion
1731
2431
2
63
11
113
The histogram entitled “Actual daily trading revenues” compares the actual daily trading revenues for 1Q22 with those for 4Q21. Actual daily trading revenues is an internally used metric, limited to the trading book only, and excludes the cost of carry, credit provisions and internal revenue transfers. The cost of carry is the change in value of the portfolio from one day to the next, assum-ing all other factors such as market levels and trade population remain constant, and can be negative or positive. The dispersion of trading revenues indicates the day-to-day volatility in our trading activities. In 1Q22, we had three loss days, compared to six loss days in 4Q21.
VaR backtestingBacktesting is one of the techniques used to assess the accu-racy and performance of our VaR model used by the Group for risk management and regulatory capital purposes and serves to highlight areas of potential enhancements. Backtest-ing is used by regulators to assess the adequacy of the internal model approach-based regulatory capital held by the Group, the
calculation of which includes regulatory VaR and stressed VaR. Backtesting involves comparing the results produced by the VaR model with the hypothetical trading revenues on the trading book. A backtesting exception occurs when a hypothetical trading loss exceeds the daily VaR estimate.
For capital purposes and in line with BIS requirements, FINMA increases the capital multiplier for every regulatory VaR back-testing exception above four in the prior rolling 12-month period, resulting in an incremental market risk capital requirement for the Group. For the rolling 12-month period through the end of 1Q22, we had no backtesting exceptions in our regulatory VaR model, and the model remained in the regulatory “green zone”.
> Refer to “Market risk” in III – Treasury, Risk, Balance sheet and Off-balance sheet – Risk management – Risk coverage and management in the Credit Suisse Annual Report 2021 for further information on VaR backtesting.
> Refer to “Risk-weighted assets” in Capital management for further information on the use of our regulatory VaR model in the calculation of trading book mar-ket risk capital requirements.
Non-traded market riskNon-traded market risk primarily relates to asset and liability mis-match exposures in our banking book. Our businesses and Trea-sury have non-traded portfolios that carry market risks, mainly related to changes in interest rates but also to changes in foreign exchange rates.
We assume interest rate risks through lending and deposit-tak-ing, money market and funding activities, and the deployment of our consolidated equity as well as other activities at the divisional level. Non-maturing products, such as savings accounts, have no contractual maturity date or direct market-linked interest rate and are risk-managed on a pooled basis using replication portfolios on behalf of the business divisions.
Interest rate risk on banking book positions is measured by estimating the impact resulting from a one basis point parallel increase in yield curves on the present value of interest rate-sensitive banking book positions. This is measured on the Group’s entire banking book. Interest rate risk sensitivities disclosed below are in line with our internal risk management view.
> Refer to credit-suisse.com/regulatorydisclosures for the Group’s publication “Pillar 3 and regulatory disclosures 4Q21 – Credit Suisse Group AG” which includes additional information on regulatory interest rate risk in the banking book in accordance with FINMA guidance.
As of the end of 1Q22, the interest rate sensitivity of a one basis point parallel increase in yield curves was negative CHF 2.3 million, compared to negative CHF 3.6 million as of the end of 4Q21. The change was mainly driven by our regular management of banking book activities.
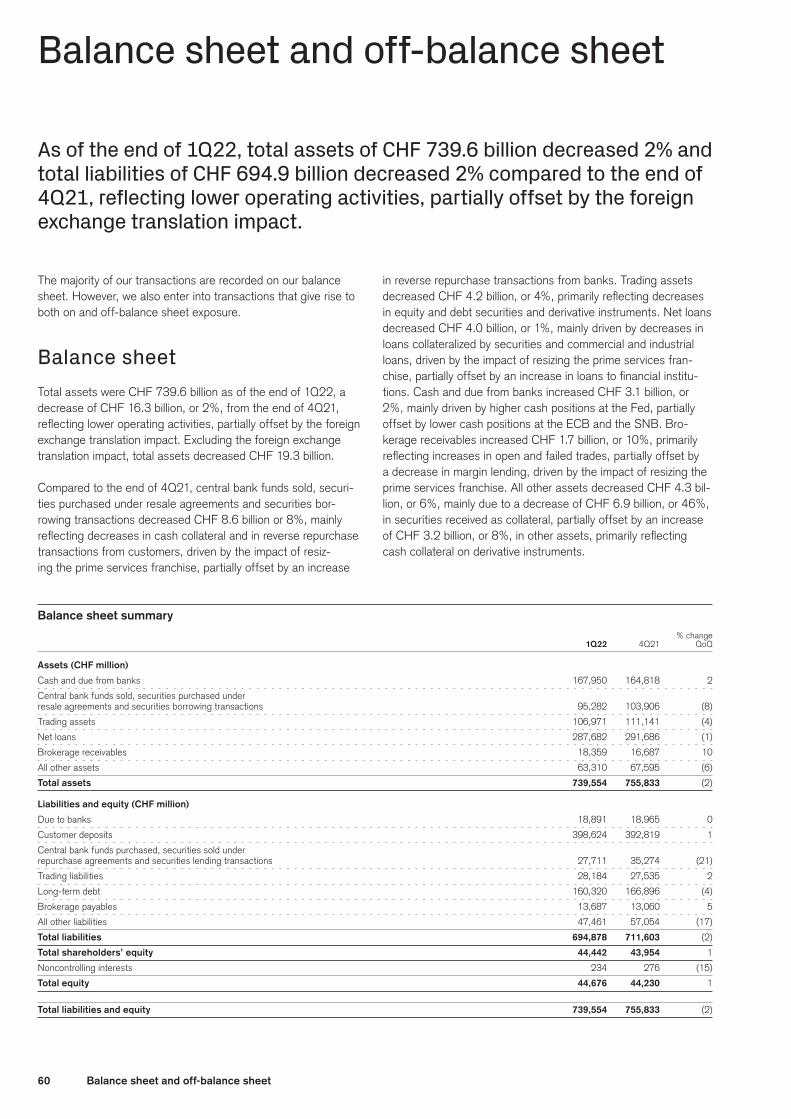
60 Balance sheet and off-balance sheet
Balance sheet and off-balance sheet
As of the end of 1Q22, total assets of CHF 739.6 billion decreased 2% and total liabilities of CHF 694.9 billion decreased 2% compared to the end of 4Q21, reflecting lower operating activities, partially offset by the foreign exchange translation impact.
The majority of our transactions are recorded on our balance sheet. However, we also enter into transactions that give rise to both on and off-balance sheet exposure.
Balance sheetTotal assets were CHF 739.6 billion as of the end of 1Q22, a decrease of CHF 16.3 billion, or 2%, from the end of 4Q21, reflecting lower operating activities, partially offset by the foreign exchange translation impact. Excluding the foreign exchange translation impact, total assets decreased CHF 19.3 billion.
Compared to the end of 4Q21, central bank funds sold, securi-ties purchased under resale agreements and securities bor-rowing transactions decreased CHF 8.6 billion or 8%, mainly reflecting decreases in cash collateral and in reverse repurchase transactions from customers, driven by the impact of resiz-ing the prime services franchise, partially offset by an increase
in reverse repurchase transactions from banks. Trading assets decreased CHF 4.2 billion, or 4%, primarily reflecting decreases in equity and debt securities and derivative instruments. Net loans decreased CHF 4.0 billion, or 1%, mainly driven by decreases in loans collateralized by securities and commercial and industrial loans, driven by the impact of resizing the prime services fran-chise, partially offset by an increase in loans to financial institu-tions. Cash and due from banks increased CHF 3.1 billion, or 2%, mainly driven by higher cash positions at the Fed, partially offset by lower cash positions at the ECB and the SNB. Bro-kerage receivables increased CHF 1.7 billion, or 10%, primarily reflecting increases in open and failed trades, partially offset by a decrease in margin lending, driven by the impact of resizing the prime services franchise. All other assets decreased CHF 4.3 bil-lion, or 6%, mainly due to a decrease of CHF 6.9 billion, or 46%, in securities received as collateral, partially offset by an increase of CHF 3.2 billion, or 8%, in other assets, primarily reflecting cash collateral on derivative instruments.
Balance sheet summary % change 1Q22 4Q21 QoQ
Assets (CHF million)
Cash and due from banks 167,950 164,818 2
Central bank funds sold, securities purchased under
resale agreements and securities borrowing transactions 95,282 103,906 (8)
Trading assets 106,971 111,141 (4)
Net loans 287,682 291,686 (1)
Brokerage receivables 18,359 16,687 10
All other assets 63,310 67,595 (6)
Total assets 739,554 755,833 (2)
Liabilities and equity (CHF million)
Due to banks 18,891 18,965 0
Customer deposits 398,624 392,819 1
Central bank funds purchased, securities sold under
repurchase agreements and securities lending transactions 27,711 35,274 (21)
Trading liabilities 28,184 27,535 2
Long-term debt 160,320 166,896 (4)
Brokerage payables 13,687 13,060 5
All other liabilities 47,461 57,054 (17)
Total liabilities 694,878 711,603 (2)
Total shareholders’ equity 44,442 43,954 1
Noncontrolling interests 234 276 (15)
Total equity 44,676 44,230 1
Total liabilities and equity 739,554 755,833 (2)
61Balance sheet and off-balance sheet
Total liabilities were CHF 694.9 billion as of the end of 1Q22, a decrease of CHF 16.7 billion, or 2%, from the end of 4Q21, reflecting lower operating activities, partially offset by the foreign exchange translation impact. Excluding the foreign exchange translation impact, total liabilities decreased CHF 20.0 billion.
Compared to the end of 4Q21, central bank funds purchased, securities sold under repurchase agreements and securities lend-ing transactions decreased CHF 7.6 billion, or 21%, primarily due to decreases in cash collateral and in repurchase transactions to customers, partially offset by an increase in repurchase transac-tions to banks. Long-term debt decreased CHF 6.6 billion, or 4%, primarily reflecting maturities and valuation adjustments in senior debt, mainly due to net redemptions of structured notes and treasury debt and maturities of treasury debt. Due to banks was stable. Customer deposits increased CHF 5.8 billion, or 1%, mainly due to an increase in certificates of deposits, partially off-set by a decrease in demand deposits. Trading liabilities increased CHF 0.6 billion, or 2%, mainly reflecting an increase in derivative instruments and the foreign exchange translation impact, par-tially offset by a decrease in short positions. Brokerage payables increased CHF 0.6 billion, or 5%, mainly due to increases in open and failed trades and the foreign exchange translation impact, partially offset by a decrease in margin lending. All other liabilities decreased CHF 9.6 billion, or 17%, mainly reflecting a decrease of CHF 6.9 billion, or 46%, in obligation to return securities received as collateral and a decrease of CHF 2.0 billion, or 10%, in short-term borrowings.
> Refer to “Funding sources” in Liquidity and funding management – Funding management and “Capital management” for further information, including our funding of the balance sheet and the leverage ratio.
Off-balance sheetWe enter into off-balance sheet arrangements in the normal course of business. Off-balance sheet arrangements are transac-tions or other contractual arrangements with, or for the benefit of, an entity that is not consolidated. These transactions include derivative instruments, guarantees and similar arrangements, retained or contingent interests in assets transferred to an uncon-solidated entity in connection with our involvement with special purpose entities (SPEs), and obligations and liabilities (including contingent obligations and liabilities) under variable interests in unconsolidated entities that provide financing, liquidity, credit and other support.
> Refer to “Balance sheet and off-balance sheet” in III – Treasury, Risk, Bal-ance sheet and Off-balance sheet in the Credit Suisse Annual Report 2021 and “Note 29 – Guarantees and commitments” and “Note 33 – Litigation” in III – Condensed consolidated financial statements – unaudited for further information.

62 Balance sheet and off-balance sheet
[this page intentionally left blank]
63
III – Condensed consolidated financial statements – unaudited Report of Independent Registered Public Accounting Firm 65
Condensed consolidated financialstatements–unaudited 67
Notes to the condensed consolidated financialstatements–unaudited 74
64 Condensedconsolidatedfinancialstatements–CreditSuisseGroup
Notestothecondensedconsolidatedfinancialstatements–unaudited
1 Summary of significant accounting policies .............................................................................742 Recently issued accounting standards.....................................................................................743 Business developments and subsequent events ......................................................................744 Segment information ............................................................................................................755 Net interest income ..............................................................................................................766 Commissions and fees...........................................................................................................767 Trading revenues ...................................................................................................................778 Other revenues .....................................................................................................................779 Provision for credit losses ......................................................................................................77
10 Compensation and benefits ...................................................................................................7711 General and administrative expenses ......................................................................................7812 Restructuring expenses .........................................................................................................7813 Earnings per share ................................................................................................................7914 Revenue from contracts with customers ................................................................................8015 Trading assets and liabilities ...................................................................................................8116 Investment securities .............................................................................................................8117 Other investments .................................................................................................................8318 Loans...................................................................................................................................8419 Financial instruments measured at amortized cost and credit losses .........................................8520 Goodwill ...............................................................................................................................9421 Other assets and other liabilities .............................................................................................9522 Long-term debt .....................................................................................................................9623 Accumulated other comprehensive income and additional share information ..............................9624 Offsetting of financial assets and financial liabilities ................................................................9825 Tax ....................................................................................................................................10226 Employee deferred compensation .........................................................................................10327 Pension and other post-retirement benefits ...........................................................................10528 Derivatives and hedging activities .........................................................................................10629 Guarantees and commitments .............................................................................................11130 Transfers of financial assets and variable interest entities .......................................................11331 Financial instruments ...........................................................................................................11932 Assets pledged and collateral ...............................................................................................13633 Litigation ............................................................................................................................137

65Condensedconsolidatedfinancialstatements–CreditSuisseGroup
PricewaterhouseCoopers AG, Birchstrasse 160, Postfach, CH-8050 Zurich, Switzerland T: +41 58 792 44 00, F: +41 58 792 44 10, www.pwc.ch PricewaterhouseCoopers AG is a member of the global PricewaterhouseCoopers network of firms, each of which is a separate and independent legal entity.
Report of Independent Registered Public Accounting Firm to the Board of Directors and shareholders of Credit Suisse Group AG
Results of Review of Interim Financial Statements We have reviewed the accompanying consolidated balance sheet of Credit Suisse Group AG and its subsidiaries (the “Group”) as of March 31, 2022, and the related consolidated statements of operations, comprehensive income, changes in equity and cash flows for the three-month periods ended March 31, 2022 and 2021, including the related notes (collectively referred to as the “interim financial statements”). Based on our reviews, we are not aware of any material modifications that should be made to the accompanying interim financial statements for them to be in conformity with accounting principles generally accepted in the United States of America.
We have previously audited, in accordance with the standards of the Public Company Accounting Oversight Board (United States) (PCAOB), the consolidated balance sheet of the Group as of December 31, 2021, and the related consolidated statements of operations, comprehensive income, changes in equity and cash flows for the year then ended (not presented herein), and in our report dated March 10, 2022, which included a paragraph regarding adjustments made to the 2021 and 2020 financial statements to reflect the change in the composition of reportable segments, we expressed an unqualified opinion on those consolidated financial statements. In our opinion, the information set forth in the accompanying consolidated balance sheet information as of December 31, 2021, is fairly stated, in all material respects, in relation to the consolidated balance sheet from which it has been derived.
Basis for opinion These interim financial statements are the responsibility of the Group’s management. We are a public accounting firm registered with the PCAOB and are required to be independent with respect to the Group in accordance with the U.S. federal securities laws and the applicable rules and regulations of the Securities and Exchange Commission and the PCAOB. We conducted our review in accordance with the standards of the PCAOB. A review of interim financial information consists principally of applying analytical procedures and making inquiries of persons responsible for financial and accounting matters. It is substantially less in scope than an audit conducted in accordance with the standards of the PCAOB, the objective of which is the expression of an opinion regarding the financial statements taken as a whole. Accordingly, we do not express such an opinion.
/s/ PricewaterhouseCoopers AG
Zurich, Switzerland May 5, 2022

66 Condensedconsolidatedfinancialstatements–CreditSuisseGroup
[this page intentionally left blank]
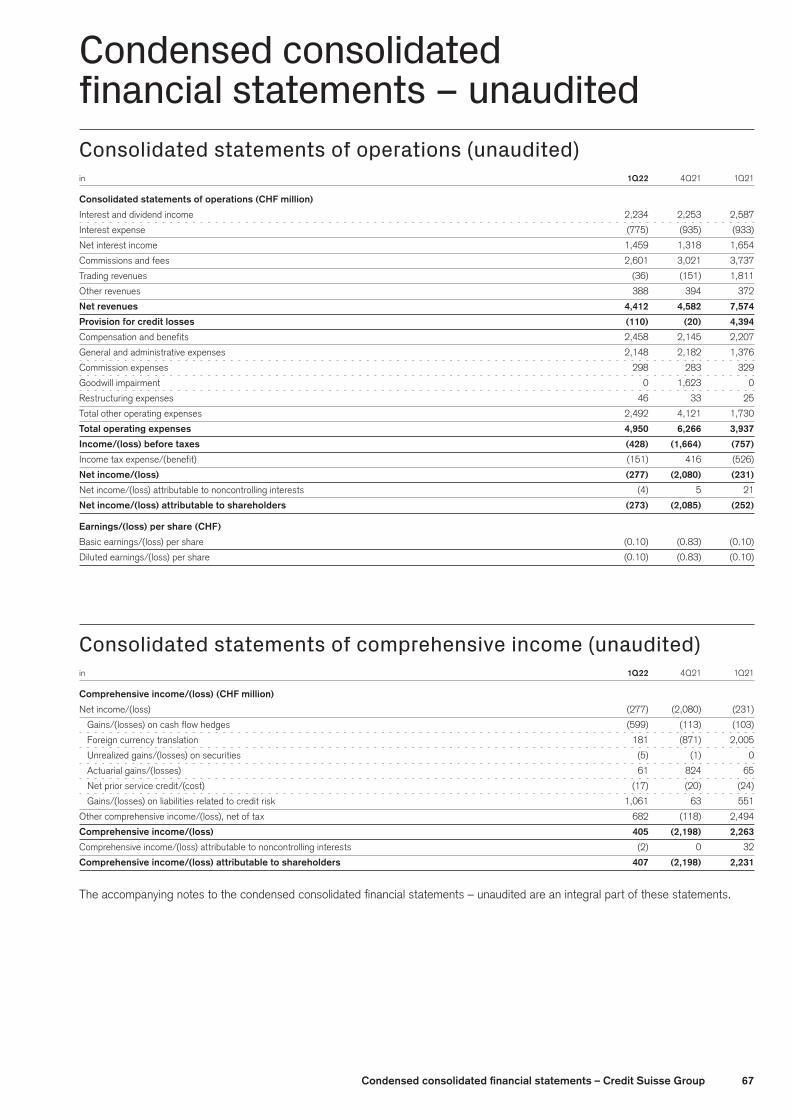
67Condensedconsolidatedfinancialstatements–CreditSuisseGroup
Condensed consolidated financial statements – unauditedConsolidated statements of operations (unaudited)in 1Q22 4Q21 1Q21
Consolidatedstatementsofoperations(CHFmillion)
Interest and dividend income 2,234 2,253 2,587
Interest expense (775) (935) (933)
Net interest income 1,459 1,318 1,654
Commissions and fees 2,601 3,021 3,737
Trading revenues (36) (151) 1,811
Other revenues 388 394 372
Net revenues 4,412 4,582 7,574
Provision for credit losses (110) (20) 4,394
Compensation and benefits 2,458 2,145 2,207
General and administrative expenses 2,148 2,182 1,376
Commission expenses 298 283 329
Goodwill impairment 0 1,623 0
Restructuring expenses 46 33 25
Total other operating expenses 2,492 4,121 1,730
Total operating expenses 4,950 6,266 3,937
Income/(loss)beforetaxes (428) (1,664) (757)
Income tax expense/(benefit) (151) 416 (526)
Netincome/(loss) (277) (2,080) (231)
Net income/(loss) attributable to noncontrolling interests (4) 5 21
Netincome/(loss)attributabletoshareholders (273) (2,085) (252)
Earnings/(loss)pershare(CHF)
Basic earnings/(loss) per share (0.10) (0.83) (0.10)
Diluted earnings/(loss) per share (0.10) (0.83) (0.10)
Consolidated statements of comprehensive income (unaudited)in 1Q22 4Q21 1Q21
Comprehensiveincome/(loss)(CHFmillion)
Net income/(loss) (277) (2,080) (231)
Gains/(losses) on cash flow hedges (599) (113) (103)
Foreign currency translation 181 (871) 2,005
Unrealized gains/(losses) on securities (5) (1) 0
Actuarial gains/(losses) 61 824 65
Net prior service credit/(cost) (17) (20) (24)
Gains/(losses) on liabilities related to credit risk 1,061 63 551
Other comprehensive income/(loss), net of tax 682 (118) 2,494
Comprehensiveincome/(loss) 405 (2,198) 2,263
Comprehensive income/(loss) attributable to noncontrolling interests (2) 0 32
Comprehensiveincome/(loss)attributabletoshareholders 407 (2,198) 2,231
The accompanying notes to the condensed consolidated financial statements – unaudited are an integral part of these statements.

68 Condensedconsolidatedfinancialstatements–CreditSuisseGroup
Consolidated balance sheets (unaudited)end of 1Q22 4Q21
Assets(CHFmillion)
Cash and due from banks 167,950 164,818
of which reported at fair value 148 308
of which reported from consolidated VIEs 122 108
Interest-bearing deposits with banks 998 1,323
Central bank funds sold, securities purchased under
resale agreements and securities borrowing transactions 95,282 103,906
of which reported at fair value 71,059 68,623
Securities received as collateral, at fair value 8,084 15,017
of which encumbered 5,899 8,455
Trading assets, at fair value 106,971 111,141
of which encumbered 31,721 30,092
of which reported from consolidated VIEs 1,841 1,822
Investment securities 809 1,005
of which reported at fair value 809 1,005
of which encumbered 503 516
Other investments 5,794 5,826
of which reported at fair value 4,019 4,094
of which reported from consolidated VIEs 946 1,015
Net loans 287,682 291,686
of which reported at fair value 9,545 10,243
of which encumbered 57 42
of which reported from consolidated VIEs 1,158 1,400
allowance for credit losses (1,330) (1,297)
Goodwill 2,931 2,917
Other intangible assets 307 276
of which reported at fair value 256 224
Brokerage receivables 18,359 16,687
allowance for credit losses (4,069) (4,186)
Other assets 44,387 41,231
of which reported at fair value 9,214 9,184
of which reported from consolidated VIEs 1,776 1,496
of which loans held-for-sale (amortized cost base) 894 588
allowance for credit losses – other assets held at amortized cost (30) (30)
Total assets 739,554 755,833
The accompanying notes to the condensed consolidated financial statements – unaudited are an integral part of these statements.
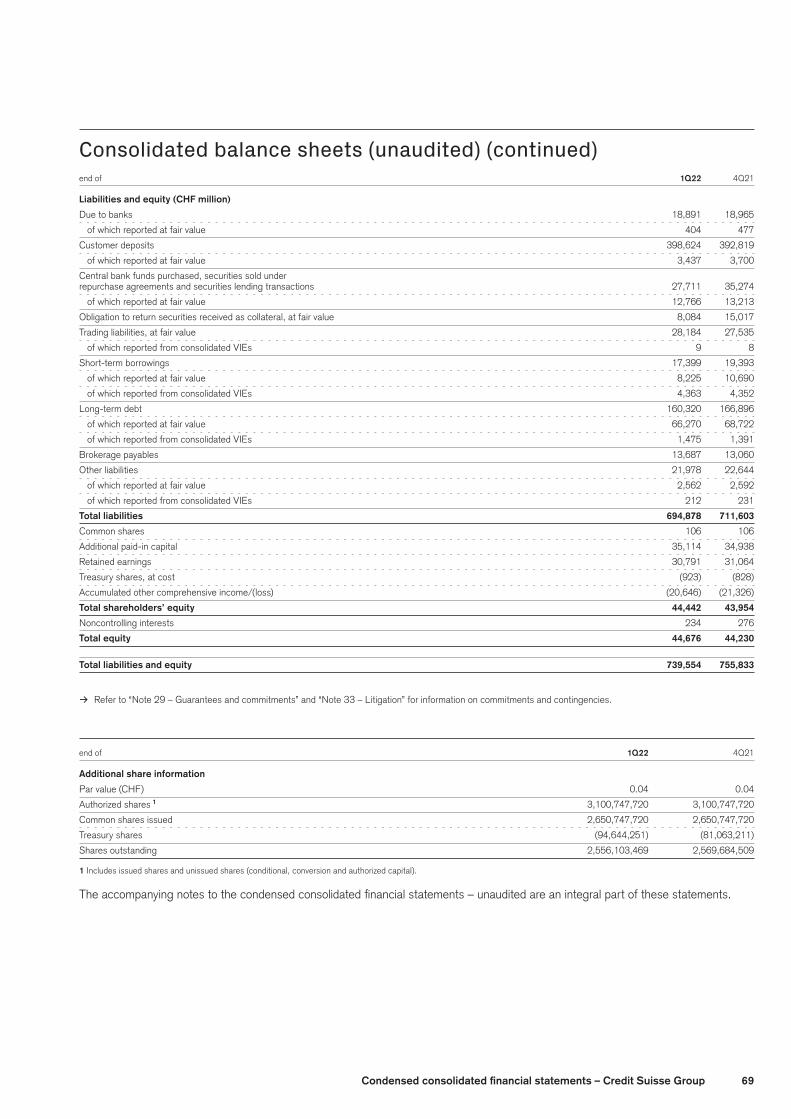
69Condensedconsolidatedfinancialstatements–CreditSuisseGroup
Consolidated balance sheets (unaudited) (continued)end of 1Q22 4Q21
Liabilitiesandequity(CHFmillion)
Due to banks 18,891 18,965
of which reported at fair value 404 477
Customer deposits 398,624 392,819
of which reported at fair value 3,437 3,700
Central bank funds purchased, securities sold under
repurchase agreements and securities lending transactions 27,711 35,274
of which reported at fair value 12,766 13,213
Obligation to return securities received as collateral, at fair value 8,084 15,017
Trading liabilities, at fair value 28,184 27,535
of which reported from consolidated VIEs 9 8
Short-term borrowings 17,399 19,393
of which reported at fair value 8,225 10,690
of which reported from consolidated VIEs 4,363 4,352
Long-term debt 160,320 166,896
of which reported at fair value 66,270 68,722
of which reported from consolidated VIEs 1,475 1,391
Brokerage payables 13,687 13,060
Other liabilities 21,978 22,644
of which reported at fair value 2,562 2,592
of which reported from consolidated VIEs 212 231
Total liabilities 694,878 711,603
Common shares 106 106
Additional paid-in capital 35,114 34,938
Retained earnings 30,791 31,064
Treasury shares, at cost (923) (828)
Accumulated other comprehensive income/(loss) (20,646) (21,326)
Total shareholders’ equity 44,442 43,954
Noncontrolling interests 234 276
Total equity 44,676 44,230
Total liabilities and equity 739,554 755,833
> Refer to “Note 29 – Guarantees and commitments” and “Note 33 – Litigation” for information on commitments and contingencies.
end of 1Q22 4Q21
Additionalshareinformation
Par value (CHF) 0.04 0.04
Authorized shares 1 3,100,747,720 3,100,747,720
Common shares issued 2,650,747,720 2,650,747,720
Treasury shares (94,644,251) (81,063,211)
Shares outstanding 2,556,103,469 2,569,684,509
1 Includes issued shares and unissued shares (conditional, conversion and authorized capital).
The accompanying notes to the condensed consolidated financial statements – unaudited are an integral part of these statements.
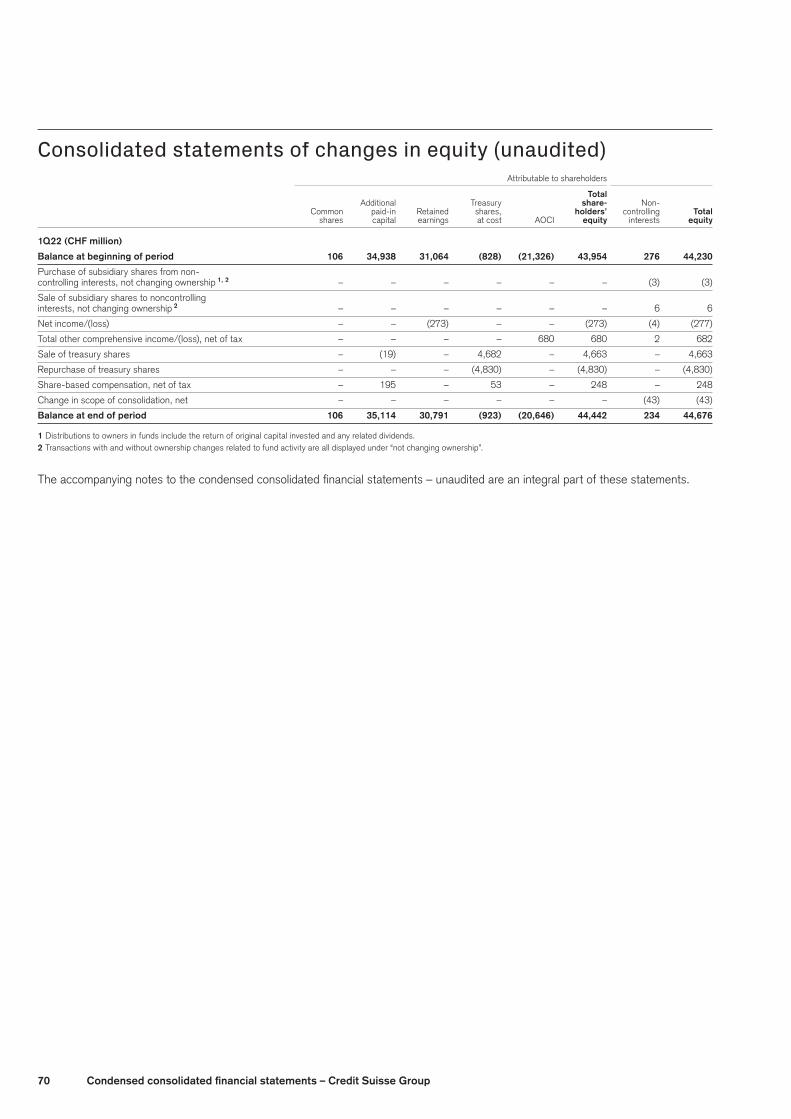
70 Condensedconsolidatedfinancialstatements–CreditSuisseGroup
Consolidated statements of changes in equity (unaudited) Attributable to shareholders
Total Additional Treasury share- Non- Common paid-in Retained shares, holders’ controlling Total shares capital earnings at cost AOCI equity interests equity
1Q22(CHFmillion)
Balance at beginning of period 106 34,938 31,064 (828) (21,326) 43,954 276 44,230
Purchase of subsidiary shares from non-
controlling interests, not changing ownership 1,2 – – – – – – (3) (3)
Sale of subsidiary shares to noncontrolling
interests, not changing ownership 2 – – – – – – 6 6
Net income/(loss) – – (273) – – (273) (4) (277)
Total other comprehensive income/(loss), net of tax – – – – 680 680 2 682
Sale of treasury shares – (19) – 4,682 – 4,663 – 4,663
Repurchase of treasury shares – – – (4,830) – (4,830) – (4,830)
Share-based compensation, net of tax – 195 – 53 – 248 – 248
Change in scope of consolidation, net – – – – – – (43) (43)
Balance at end of period 106 35,114 30,791 (923) (20,646) 44,442 234 44,676
1 Distributions to owners in funds include the return of original capital invested and any related dividends.2 Transactions with and without ownership changes related to fund activity are all displayed under “not changing ownership”.
The accompanying notes to the condensed consolidated financial statements – unaudited are an integral part of these statements.
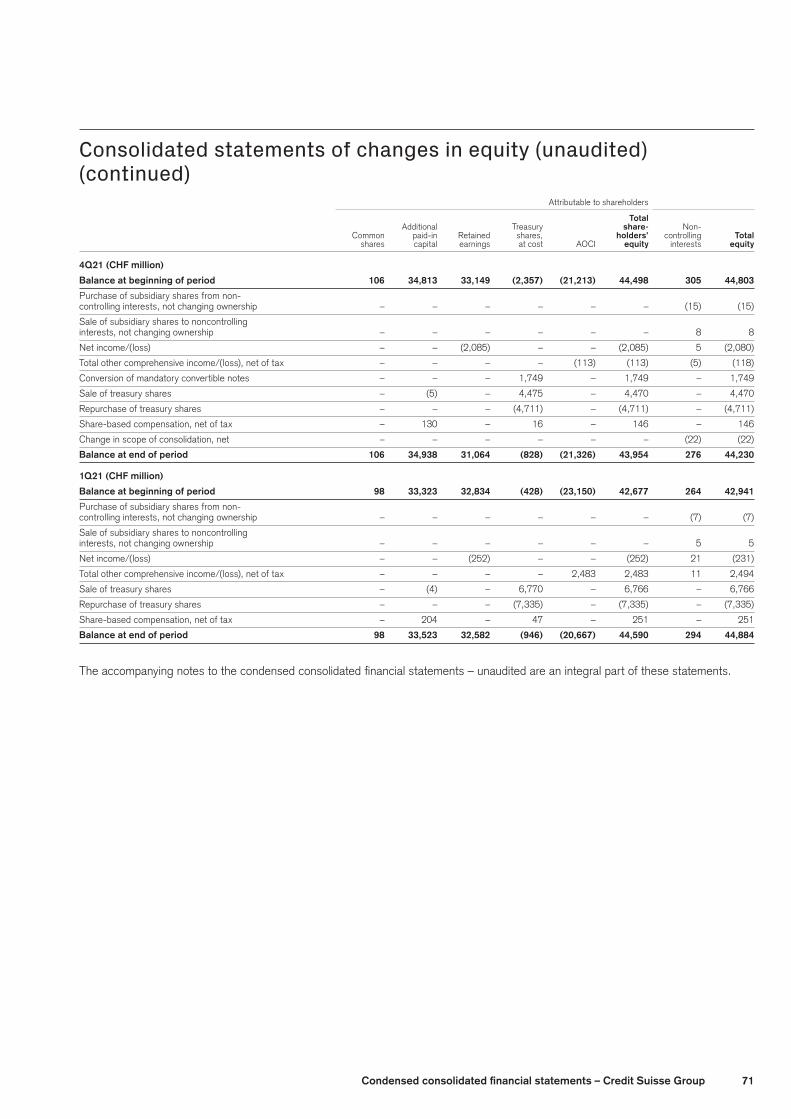
71Condensedconsolidatedfinancialstatements–CreditSuisseGroup
Consolidated statements of changes in equity (unaudited) (continued) Attributable to shareholders
Total Additional Treasury share- Non- Common paid-in Retained shares, holders’ controlling Total shares capital earnings at cost AOCI equity interests equity
4Q21(CHFmillion)
Balance at beginning of period 106 34,813 33,149 (2,357) (21,213) 44,498 305 44,803
Purchase of subsidiary shares from non-
controlling interests, not changing ownership – – – – – – (15) (15)
Sale of subsidiary shares to noncontrolling
interests, not changing ownership – – – – – – 8 8
Net income/(loss) – – (2,085) – – (2,085) 5 (2,080)
Total other comprehensive income/(loss), net of tax – – – – (113) (113) (5) (118)
Conversion of mandatory convertible notes – – – 1,749 – 1,749 – 1,749
Sale of treasury shares – (5) – 4,475 – 4,470 – 4,470
Repurchase of treasury shares – – – (4,711) – (4,711) – (4,711)
Share-based compensation, net of tax – 130 – 16 – 146 – 146
Change in scope of consolidation, net – – – – – – (22) (22)
Balance at end of period 106 34,938 31,064 (828) (21,326) 43,954 276 44,230
1Q21(CHFmillion)
Balance at beginning of period 98 33,323 32,834 (428) (23,150) 42,677 264 42,941
Purchase of subsidiary shares from non-
controlling interests, not changing ownership – – – – – – (7) (7)
Sale of subsidiary shares to noncontrolling
interests, not changing ownership – – – – – – 5 5
Net income/(loss) – – (252) – – (252) 21 (231)
Total other comprehensive income/(loss), net of tax – – – – 2,483 2,483 11 2,494
Sale of treasury shares – (4) – 6,770 – 6,766 – 6,766
Repurchase of treasury shares – – – (7,335) – (7,335) – (7,335)
Share-based compensation, net of tax – 204 – 47 – 251 – 251
Balance at end of period 98 33,523 32,582 (946) (20,667) 44,590 294 44,884
The accompanying notes to the condensed consolidated financial statements – unaudited are an integral part of these statements.
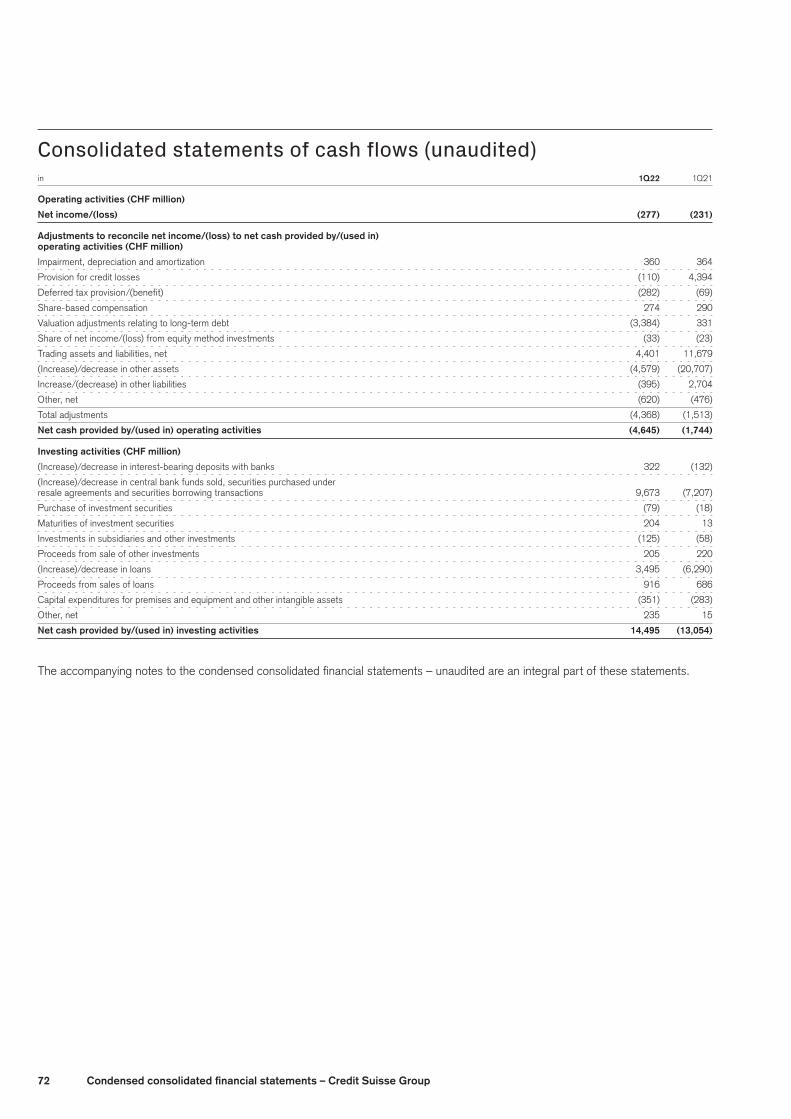
72 Condensedconsolidatedfinancialstatements–CreditSuisseGroup
Consolidated statements of cash flows (unaudited)in 1Q22 1Q21
Operatingactivities(CHFmillion)
Netincome/(loss) (277) (231)
Adjustmentstoreconcilenetincome/(loss)tonetcashprovidedby/(usedin)
operatingactivities(CHFmillion)
Impairment, depreciation and amortization 360 364
Provision for credit losses (110) 4,394
Deferred tax provision/(benefit) (282) (69)
Share-based compensation 274 290
Valuation adjustments relating to long-term debt (3,384) 331
Share of net income/(loss) from equity method investments (33) (23)
Trading assets and liabilities, net 4,401 11,679
(Increase)/decrease in other assets (4,579) (20,707)
Increase/(decrease) in other liabilities (395) 2,704
Other, net (620) (476)
Total adjustments (4,368) (1,513)
Netcashprovidedby/(usedin)operatingactivities (4,645) (1,744)
Investingactivities(CHFmillion)
(Increase)/decrease in interest-bearing deposits with banks 322 (132)
(Increase)/decrease in central bank funds sold, securities purchased under
resale agreements and securities borrowing transactions 9,673 (7,207)
Purchase of investment securities (79) (18)
Maturities of investment securities 204 13
Investments in subsidiaries and other investments (125) (58)
Proceeds from sale of other investments 205 220
(Increase)/decrease in loans 3,495 (6,290)
Proceeds from sales of loans 916 686
Capital expenditures for premises and equipment and other intangible assets (351) (283)
Other, net 235 15
Netcashprovidedby/(usedin)investingactivities 14,495 (13,054)
The accompanying notes to the condensed consolidated financial statements – unaudited are an integral part of these statements.
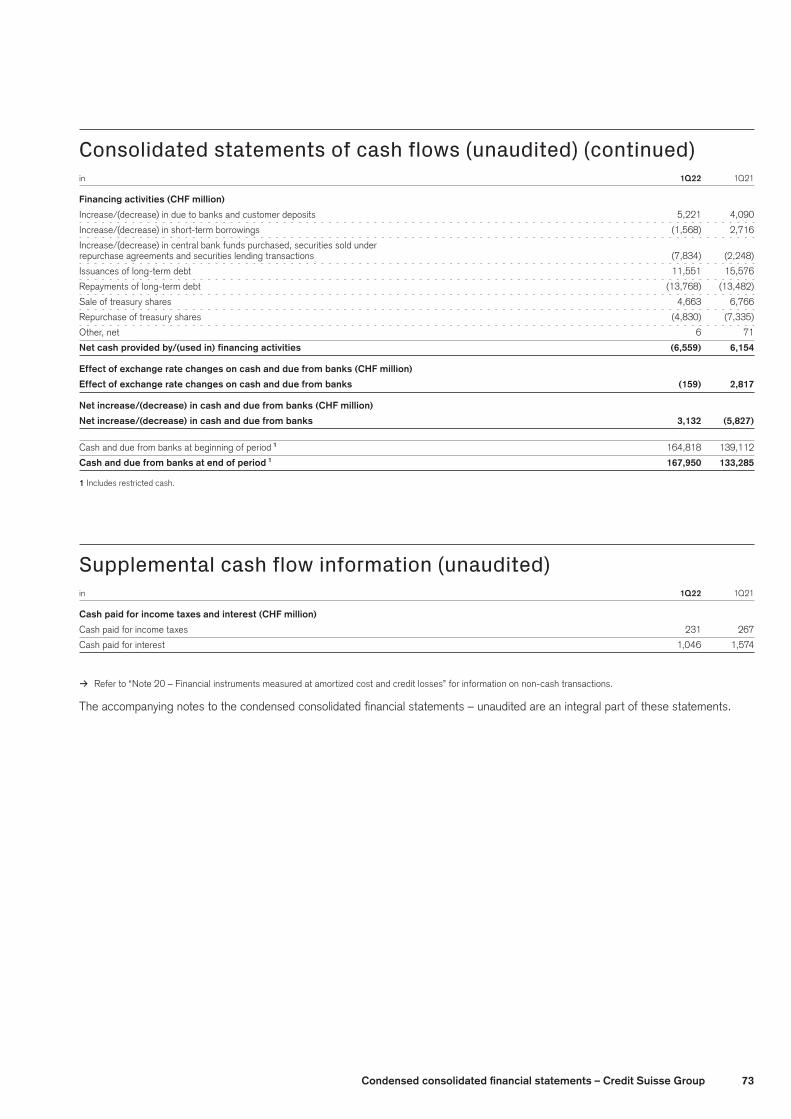
73Condensedconsolidatedfinancialstatements–CreditSuisseGroup
Consolidated statements of cash flows (unaudited) (continued)in 1Q22 1Q21
Financingactivities(CHFmillion)
Increase/(decrease) in due to banks and customer deposits 5,221 4,090
Increase/(decrease) in short-term borrowings (1,568) 2,716
Increase/(decrease) in central bank funds purchased, securities sold under
repurchase agreements and securities lending transactions (7,834) (2,248)
Issuances of long-term debt 11,551 15,576
Repayments of long-term debt (13,768) (13,482)
Sale of treasury shares 4,663 6,766
Repurchase of treasury shares (4,830) (7,335)
Other, net 6 71
Netcashprovidedby/(usedin)financingactivities (6,559) 6,154
Effectofexchangeratechangesoncashandduefrombanks(CHFmillion)
Effectofexchangeratechangesoncashandduefrombanks (159) 2,817
Netincrease/(decrease)incashandduefrombanks(CHFmillion)
Netincrease/(decrease)incashandduefrombanks 3,132 (5,827)
Cash and due from banks at beginning of period 1 164,818 139,112
Cashandduefrombanksatendofperiod 1 167,950 133,285
1 Includes restricted cash.
Supplemental cash flow information (unaudited)in 1Q22 1Q21
Cashpaidforincometaxesandinterest(CHFmillion)
Cash paid for income taxes 231 267
Cash paid for interest 1,046 1,574
> Refer to “Note 20 – Financial instruments measured at amortized cost and credit losses” for information on non-cash transactions.
The accompanying notes to the condensed consolidated financial statements – unaudited are an integral part of these statements.
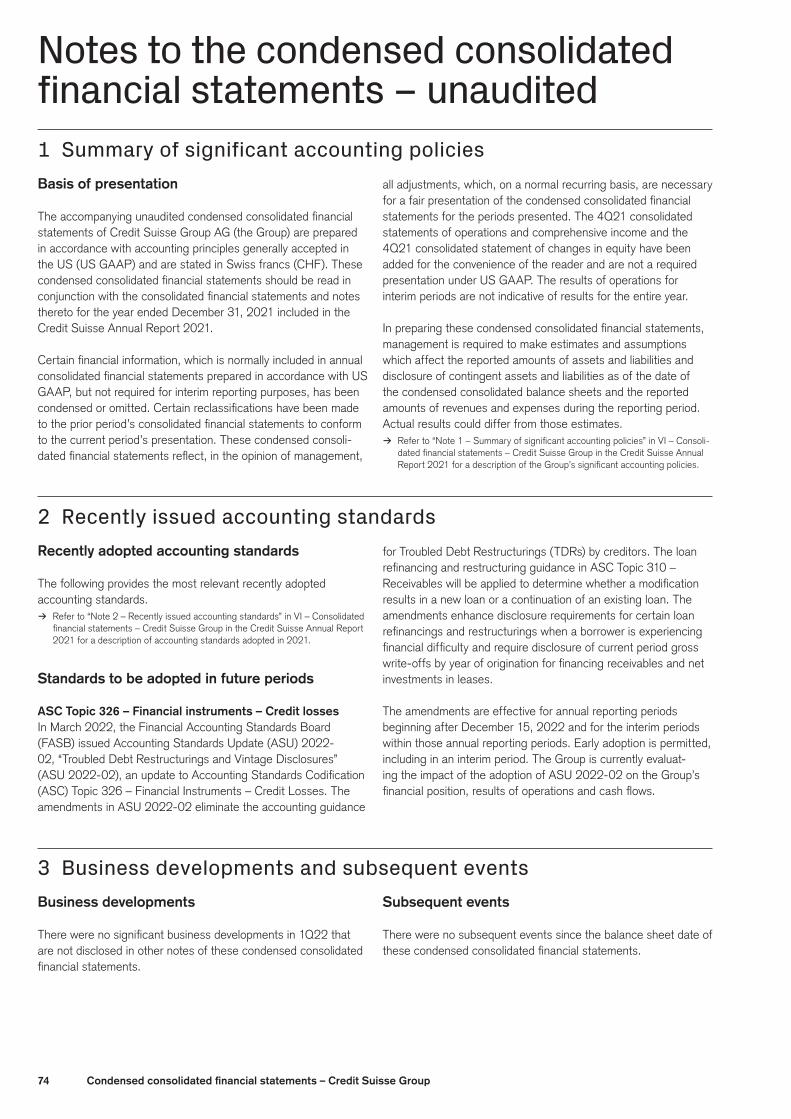
74 Condensedconsolidatedfinancialstatements–CreditSuisseGroup
Notes to the condensed consolidated financial statements – unaudited1 Summary of significant accounting policiesBasis of presentation
The accompanying unaudited condensed consolidated financial statements of Credit Suisse Group AG (the Group) are prepared in accordance with accounting principles generally accepted in the US (US GAAP) and are stated in Swiss francs (CHF). These condensed consolidated financial statements should be read in conjunction with the consolidated financial statements and notes thereto for the year ended December 31, 2021 included in the Credit Suisse Annual Report 2021.
Certain financial information, which is normally included in annual consolidated financial statements prepared in accordance with US GAAP, but not required for interim reporting purposes, has been condensed or omitted. Certain reclassifications have been made to the prior period’s consolidated financial statements to conform to the current period’s presentation. These condensed consoli-dated financial statements reflect, in the opinion of management,
all adjustments, which, on a normal recurring basis, are necessary for a fair presentation of the condensed consolidated financial statements for the periods presented. The 4Q21 consolidated statements of operations and comprehensive income and the 4Q21 consolidated statement of changes in equity have been added for the convenience of the reader and are not a required presentation under US GAAP. The results of operations for interim periods are not indicative of results for the entire year.
In preparing these condensed consolidated financial statements, management is required to make estimates and assumptions which affect the reported amounts of assets and liabilities and disclosure of contingent assets and liabilities as of the date of the condensed consolidated balance sheets and the reported amounts of revenues and expenses during the reporting period. Actual results could differ from those estimates.
> Refer to “Note 1 – Summary of significant accounting policies” in VI – Consoli-dated financial statements – Credit Suisse Group in the Credit Suisse Annual Report 2021 for a description of the Group’s significant accounting policies.
2 Recently issued accounting standardsRecently adopted accounting standards
The following provides the most relevant recently adopted accounting standards.
> Refer to “Note 2 – Recently issued accounting standards” in VI – Consolidated financial statements – Credit Suisse Group in the Credit Suisse Annual Report 2021 for a description of accounting standards adopted in 2021.
Standardstobeadoptedinfutureperiods
ASCTopic326–Financialinstruments–CreditlossesIn March 2022, the Financial Accounting Standards Board (FASB) issued Accounting Standards Update (ASU) 2022-02, “Troubled Debt Restructurings and Vintage Disclosures” (ASU 2022-02), an update to Accounting Standards Codification (ASC) Topic 326 – Financial Instruments – Credit Losses. The amendments in ASU 2022-02 eliminate the accounting guidance
for Troubled Debt Restructurings (TDRs) by creditors. The loan refinancing and restructuring guidance in ASC Topic 310 – Receivables will be applied to determine whether a modification results in a new loan or a continuation of an existing loan. The amendments enhance disclosure requirements for certain loan refinancings and restructurings when a borrower is experiencing financial difficulty and require disclosure of current period gross write-offs by year of origination for financing receivables and net investments in leases.
The amendments are effective for annual reporting periods beginning after December 15, 2022 and for the interim periods within those annual reporting periods. Early adoption is permitted, including in an interim period. The Group is currently evaluat-ing the impact of the adoption of ASU 2022-02 on the Group’s financial position, results of operations and cash flows.
3 Business developments and subsequent eventsBusinessdevelopments
There were no significant business developments in 1Q22 that are not disclosed in other notes of these condensed consolidated financial statements.
Subsequentevents
There were no subsequent events since the balance sheet date of these condensed consolidated financial statements.
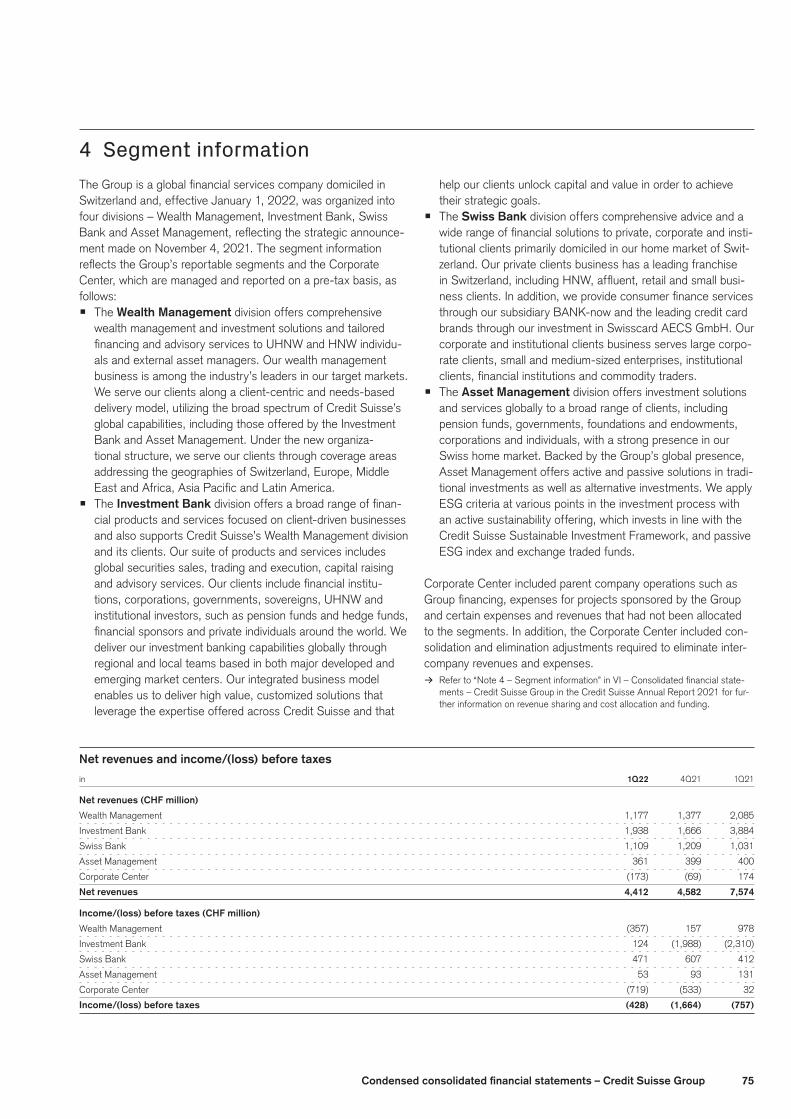
75Condensedconsolidatedfinancialstatements–CreditSuisseGroup
4 Segment information The Group is a global financial services company domiciled in Switzerland and, effective January 1, 2022, was organized into four divisions – Wealth Management, Investment Bank, Swiss Bank and Asset Management, reflecting the strategic announce-ment made on November 4, 2021. The segment information reflects the Group’s reportable segments and the Corporate Center, which are managed and reported on a pre-tax basis, as follows:p The WealthManagement division offers comprehensive
wealth management and investment solutions and tailored financing and advisory services to UHNW and HNW individu-als and external asset managers. Our wealth management business is among the industry’s leaders in our target markets. We serve our clients along a client-centric and needs-based delivery model, utilizing the broad spectrum of Credit Suisse’s global capabilities, including those offered by the Investment Bank and Asset Management. Under the new organiza-tional structure, we serve our clients through coverage areas addressing the geographies of Switzerland, Europe, Middle East and Africa, Asia Pacific and Latin America.
p The InvestmentBank division offers a broad range of finan-cial products and services focused on client-driven businesses and also supports Credit Suisse’s Wealth Management division and its clients. Our suite of products and services includes global securities sales, trading and execution, capital raising and advisory services. Our clients include financial institu-tions, corporations, governments, sovereigns, UHNW and institutional investors, such as pension funds and hedge funds, financial sponsors and private individuals around the world. We deliver our investment banking capabilities globally through regional and local teams based in both major developed and emerging market centers. Our integrated business model enables us to deliver high value, customized solutions that leverage the expertise offered across Credit Suisse and that
help our clients unlock capital and value in order to achieve their strategic goals.
p The SwissBank division offers comprehensive advice and a wide range of financial solutions to private, corporate and insti-tutional clients primarily domiciled in our home market of Swit-zerland. Our private clients business has a leading franchise in Switzerland, including HNW, affluent, retail and small busi-ness clients. In addition, we provide consumer finance services through our subsidiary BANK-now and the leading credit card brands through our investment in Swisscard AECS GmbH. Our corporate and institutional clients business serves large corpo-rate clients, small and medium-sized enterprises, institutional clients, financial institutions and commodity traders.
p The AssetManagement division offers investment solutions and services globally to a broad range of clients, including pension funds, governments, foundations and endowments, corporations and individuals, with a strong presence in our Swiss home market. Backed by the Group’s global presence, Asset Management offers active and passive solutions in tradi-tional investments as well as alternative investments. We apply ESG criteria at various points in the investment process with an active sustainability offering, which invests in line with the Credit Suisse Sustainable Investment Framework, and passive ESG index and exchange traded funds.
Corporate Center included parent company operations such as Group financing, expenses for projects sponsored by the Group and certain expenses and revenues that had not been allocated to the segments. In addition, the Corporate Center included con-solidation and elimination adjustments required to eliminate inter-company revenues and expenses.
> Refer to “Note 4 – Segment information” in VI – Consolidated financial state-ments – Credit Suisse Group in the Credit Suisse Annual Report 2021 for fur-ther information on revenue sharing and cost allocation and funding.
Netrevenuesandincome/(loss)beforetaxes
in 1Q22 4Q21 1Q21
Netrevenues(CHFmillion)
Wealth Management 1,177 1,377 2,085
Investment Bank 1,938 1,666 3,884
Swiss Bank 1,109 1,209 1,031
Asset Management 361 399 400
Corporate Center (173) (69) 174
Net revenues 4,412 4,582 7,574
Income/(loss)beforetaxes(CHFmillion)
Wealth Management (357) 157 978
Investment Bank 124 (1,988) (2,310)
Swiss Bank 471 607 412
Asset Management 53 93 131
Corporate Center (719) (533) 32
Income/(loss)beforetaxes (428) (1,664) (757)
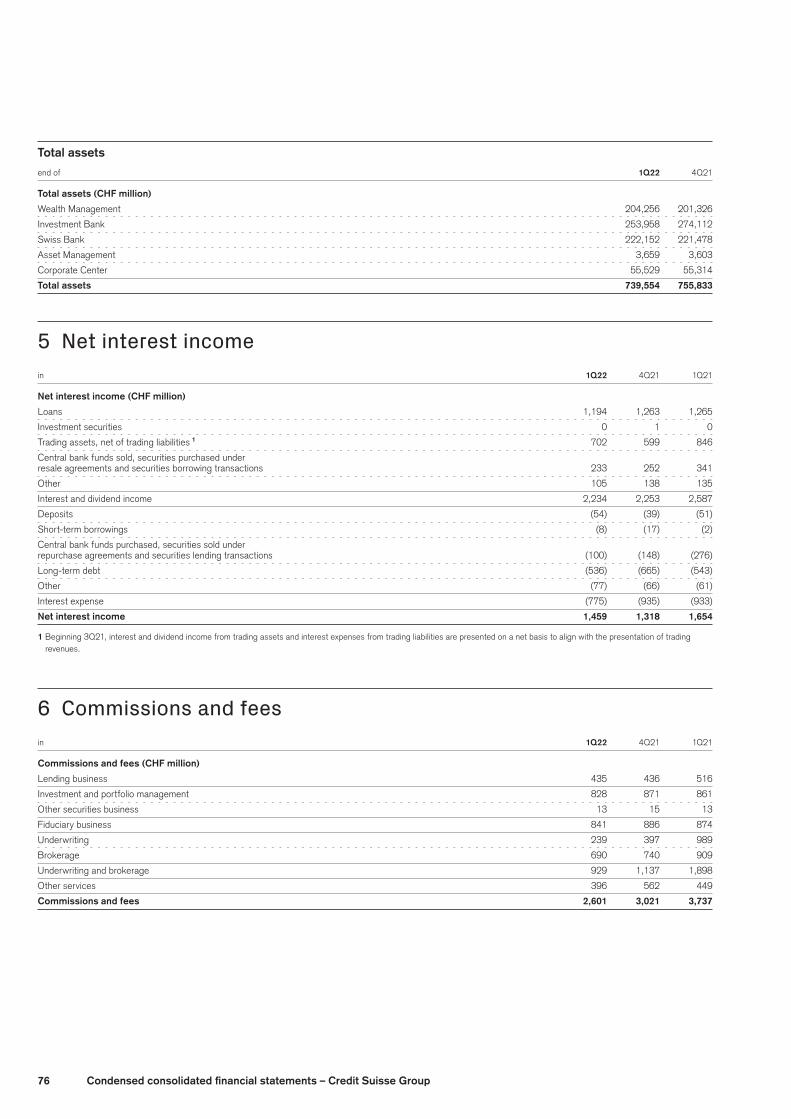
76 Condensedconsolidatedfinancialstatements–CreditSuisseGroup
Total assets
end of 1Q22 4Q21
Totalassets(CHFmillion)
Wealth Management 204,256 201,326
Investment Bank 253,958 274,112
Swiss Bank 222,152 221,478
Asset Management 3,659 3,603
Corporate Center 55,529 55,314
Total assets 739,554 755,833
5 Net interest income in 1Q22 4Q21 1Q21
Netinterestincome(CHFmillion)
Loans 1,194 1,263 1,265
Investment securities 0 1 0
Trading assets, net of trading liabilities 1 702 599 846
Central bank funds sold, securities purchased under
resale agreements and securities borrowing transactions 233 252 341
Other 105 138 135
Interest and dividend income 2,234 2,253 2,587
Deposits (54) (39) (51)
Short-term borrowings (8) (17) (2)
Central bank funds purchased, securities sold under
repurchase agreements and securities lending transactions (100) (148) (276)
Long-term debt (536) (665) (543)
Other (77) (66) (61)
Interest expense (775) (935) (933)
Netinterestincome 1,459 1,318 1,654
1 Beginning 3Q21, interest and dividend income from trading assets and interest expenses from trading liabilities are presented on a net basis to align with the presentation of trading revenues.
6 Commissions and feesin 1Q22 4Q21 1Q21
Commissionsandfees(CHFmillion)
Lending business 435 436 516
Investment and portfolio management 828 871 861
Other securities business 13 15 13
Fiduciary business 841 886 874
Underwriting 239 397 989
Brokerage 690 740 909
Underwriting and brokerage 929 1,137 1,898
Other services 396 562 449
Commissionsandfees 2,601 3,021 3,737
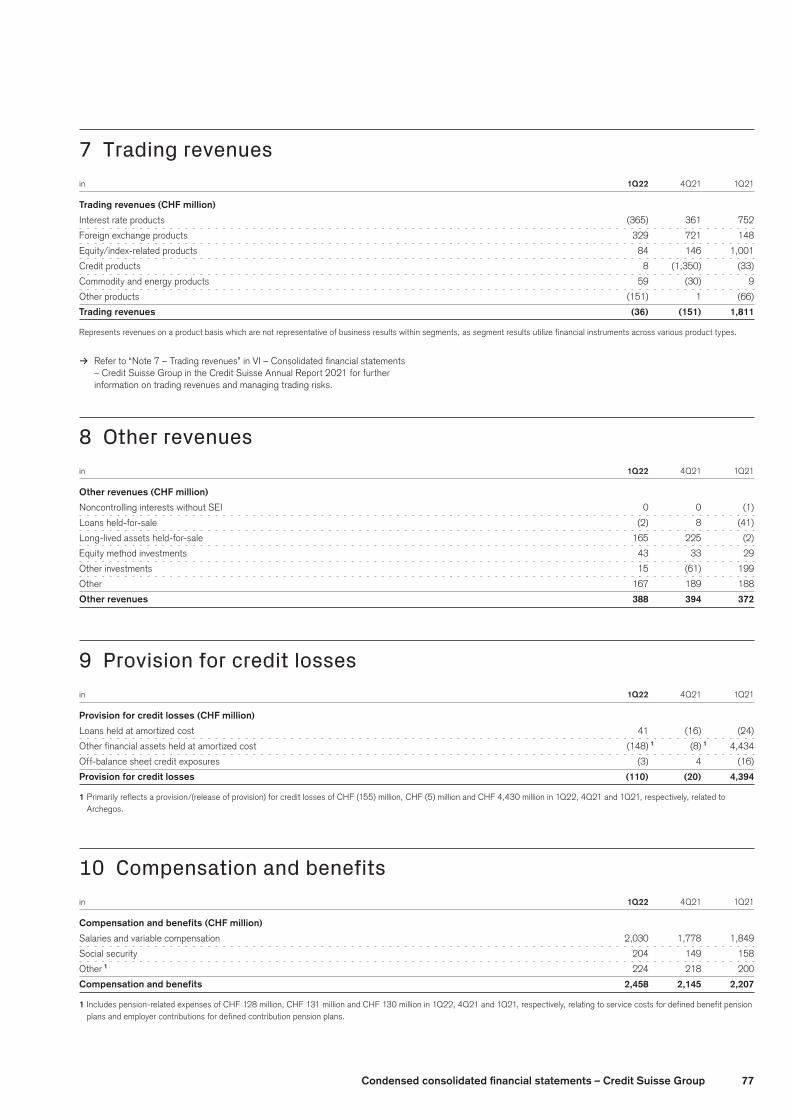
77Condensedconsolidatedfinancialstatements–CreditSuisseGroup
7 Trading revenuesin 1Q22 4Q21 1Q21
Tradingrevenues(CHFmillion)
Interest rate products (365) 361 752
Foreign exchange products 329 721 148
Equity/index-related products 84 146 1,001
Credit products 8 (1,350) (33)
Commodity and energy products 59 (30) 9
Other products (151) 1 (66)
Trading revenues (36) (151) 1,811
Represents revenues on a product basis which are not representative of business results within segments, as segment results utilize financial instruments across various product types.
> Refer to “Note 7 – Trading revenues” in VI – Consolidated financial statements – Credit Suisse Group in the Credit Suisse Annual Report 2021 for further information on trading revenues and managing trading risks.
8 Other revenuesin 1Q22 4Q21 1Q21
Otherrevenues(CHFmillion)
Noncontrolling interests without SEI 0 0 (1)
Loans held-for-sale (2) 8 (41)
Long-lived assets held-for-sale 165 225 (2)
Equity method investments 43 33 29
Other investments 15 (61) 199
Other 167 189 188
Other revenues 388 394 372
9 Provision for credit lossesin 1Q22 4Q21 1Q21
Provisionforcreditlosses(CHFmillion)
Loans held at amortized cost 41 (16) (24)
Other financial assets held at amortized cost (148) 1 (8) 1 4,434
Off-balance sheet credit exposures (3) 4 (16)
Provision for credit losses (110) (20) 4,394
1 Primarily reflects a provision/(release of provision) for credit losses of CHF (155) million, CHF (5) million and CHF 4,430 million in 1Q22, 4Q21 and 1Q21, respectively, related to Archegos.
10 Compensation and benefitsin 1Q22 4Q21 1Q21
Compensationandbenefits(CHFmillion)
Salaries and variable compensation 2,030 1,778 1,849
Social security 204 149 158
Other 1 224 218 200
Compensationandbenefits 2,458 2,145 2,207
1 Includes pension-related expenses of CHF 128 million, CHF 131 million and CHF 130 million in 1Q22, 4Q21 and 1Q21, respectively, relating to service costs for defined benefit pension plans and employer contributions for defined contribution pension plans.
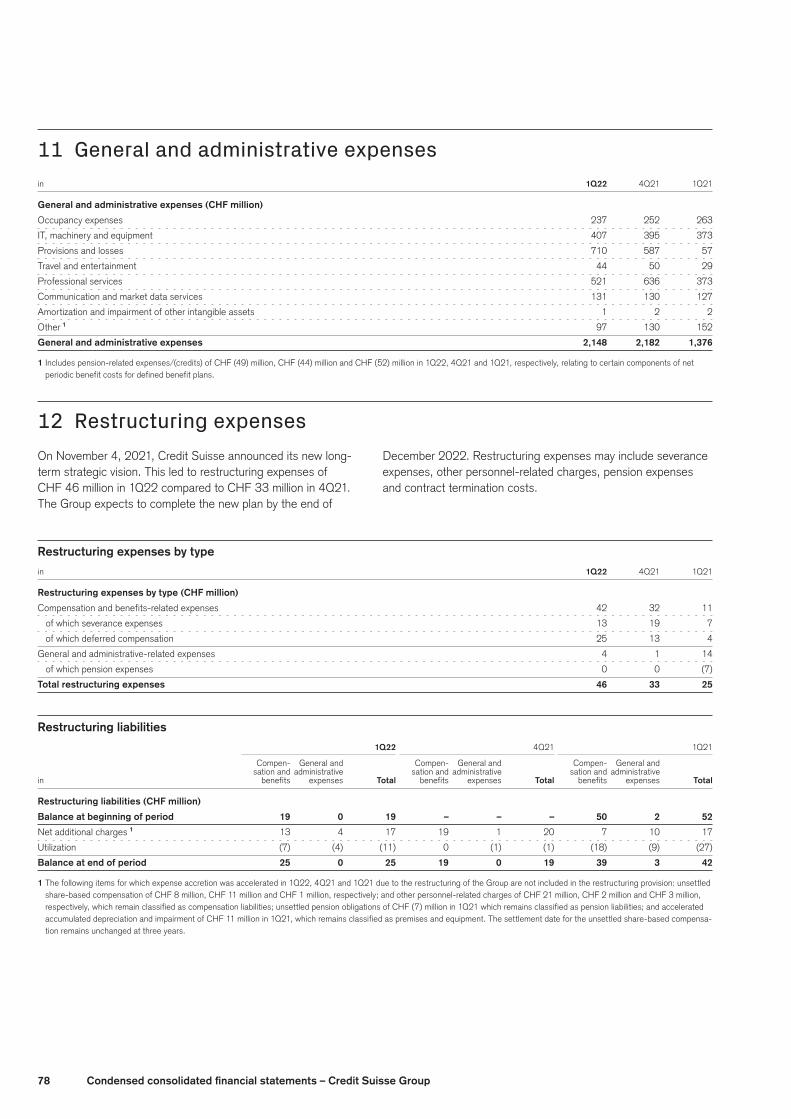
78 Condensedconsolidatedfinancialstatements–CreditSuisseGroup
11 General and administrative expensesin 1Q22 4Q21 1Q21
Generalandadministrativeexpenses(CHFmillion)
Occupancy expenses 237 252 263
IT, machinery and equipment 407 395 373
Provisions and losses 710 587 57
Travel and entertainment 44 50 29
Professional services 521 636 373
Communication and market data services 131 130 127
Amortization and impairment of other intangible assets 1 2 2
Other 1 97 130 152
Generalandadministrativeexpenses 2,148 2,182 1,376
1 Includes pension-related expenses/(credits) of CHF (49) million, CHF (44) million and CHF (52) million in 1Q22, 4Q21 and 1Q21, respectively, relating to certain components of net periodic benefit costs for defined benefit plans.
12 Restructuring expensesOn November 4, 2021, Credit Suisse announced its new long-term strategic vision. This led to restructuring expenses of CHF 46 million in 1Q22 compared to CHF 33 million in 4Q21. The Group expects to complete the new plan by the end of
December 2022. Restructuring expenses may include severance expenses, other personnel-related charges, pension expenses and contract termination costs.
Restructuring expenses by type
in 1Q22 4Q21 1Q21
Restructuringexpensesbytype(CHFmillion)
Compensation and benefits-related expenses 42 32 11
of which severance expenses 13 19 7
of which deferred compensation 25 13 4
General and administrative-related expenses 4 1 14
of which pension expenses 0 0 (7)
Total restructuring expenses 46 33 25
Restructuring liabilities 1Q22 4Q21 1Q21
Compen- General and Compen- General and Compen- General and sation and administrative sation and administrative sation and administrative
in benefits expenses Total benefits expenses Total benefits expenses Total
Restructuringliabilities(CHFmillion)
Balance at beginning of period 19 0 19 – – – 50 2 52
Net additional charges 1 13 4 17 19 1 20 7 10 17
Utilization (7) (4) (11) 0 (1) (1) (18) (9) (27)
Balance at end of period 25 0 25 19 0 19 39 3 42
1 The following items for which expense accretion was accelerated in 1Q22, 4Q21 and 1Q21 due to the restructuring of the Group are not included in the restructuring provision: unsettled share-based compensation of CHF 8 million, CHF 11 million and CHF 1 million, respectively; and other personnel-related charges of CHF 21 million, CHF 2 million and CHF 3 million, respectively, which remain classified as compensation liabilities; unsettled pension obligations of CHF (7) million in 1Q21 which remains classified as pension liabilities; and accelerated accumulated depreciation and impairment of CHF 11 million in 1Q21, which remains classified as premises and equipment. The settlement date for the unsettled share-based compensa-tion remains unchanged at three years.
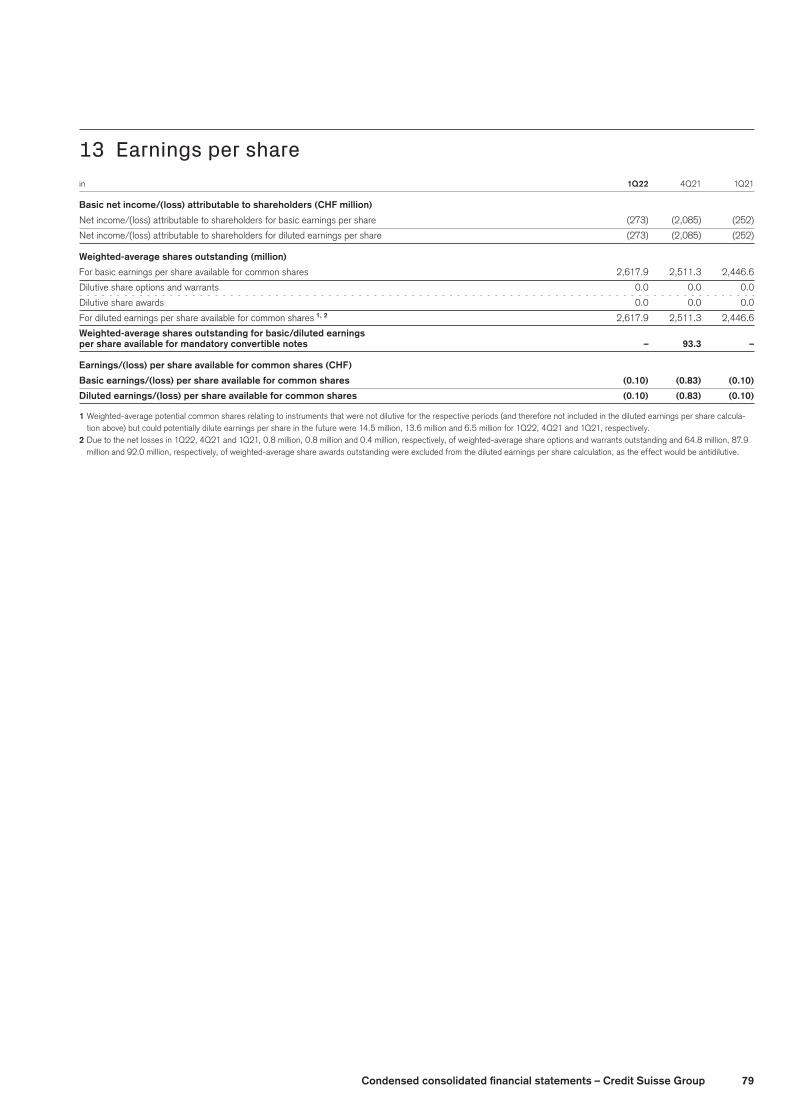
79Condensedconsolidatedfinancialstatements–CreditSuisseGroup
13 Earnings per sharein 1Q22 4Q21 1Q21
Basicnetincome/(loss)attributabletoshareholders(CHFmillion)
Net income/(loss) attributable to shareholders for basic earnings per share (273) (2,085) (252)
Net income/(loss) attributable to shareholders for diluted earnings per share (273) (2,085) (252)
Weighted-averagesharesoutstanding(million)
For basic earnings per share available for common shares 2,617.9 2,511.3 2,446.6
Dilutive share options and warrants 0.0 0.0 0.0
Dilutive share awards 0.0 0.0 0.0
For diluted earnings per share available for common shares 1,2 2,617.9 2,511.3 2,446.6
Weighted-averagesharesoutstandingforbasic/dilutedearnings
pershareavailableformandatoryconvertiblenotes – 93.3 –
Earnings/(loss)pershareavailableforcommonshares(CHF)
Basicearnings/(loss)pershareavailableforcommonshares (0.10) (0.83) (0.10)
Dilutedearnings/(loss)pershareavailableforcommonshares (0.10) (0.83) (0.10)
1 Weighted-average potential common shares relating to instruments that were not dilutive for the respective periods (and therefore not included in the diluted earnings per share calcula-tion above) but could potentially dilute earnings per share in the future were 14.5 million, 13.6 million and 6.5 million for 1Q22, 4Q21 and 1Q21, respectively.
2 Due to the net losses in 1Q22, 4Q21 and 1Q21, 0.8 million, 0.8 million and 0.4 million, respectively, of weighted-average share options and warrants outstanding and 64.8 million, 87.9 million and 92.0 million, respectively, of weighted-average share awards outstanding were excluded from the diluted earnings per share calculation, as the effect would be antidilutive.
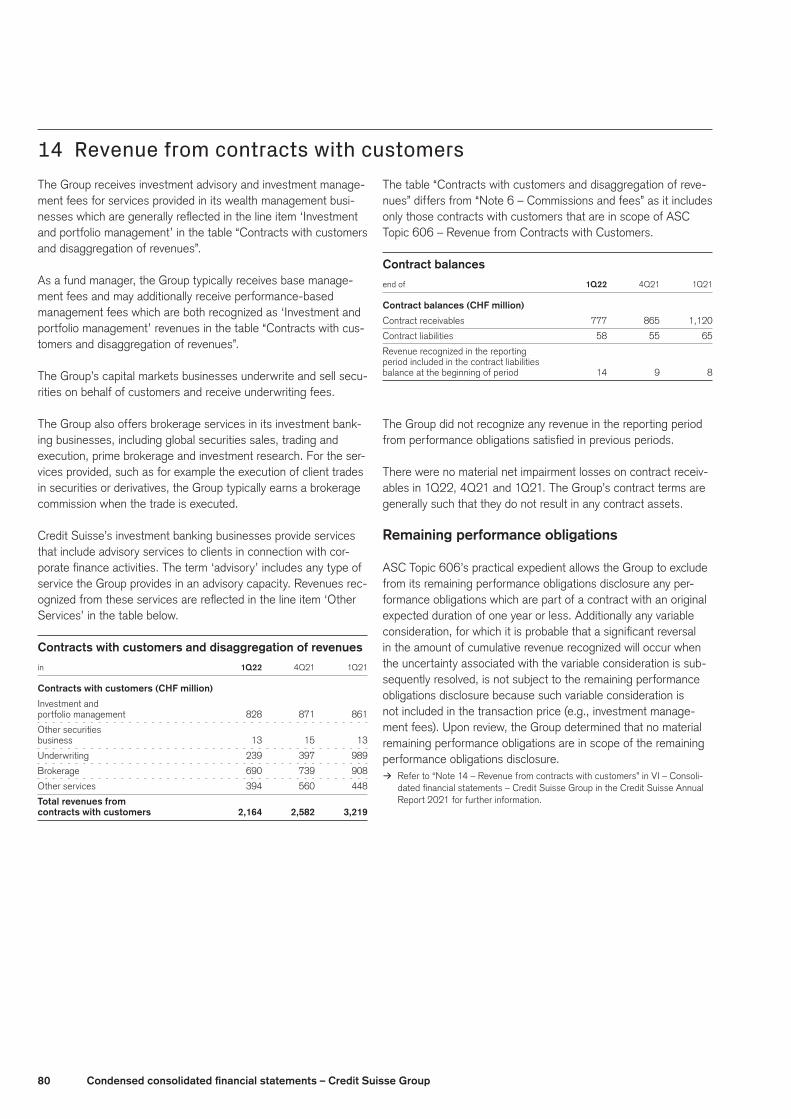
80 Condensedconsolidatedfinancialstatements–CreditSuisseGroup
14 Revenue from contracts with customers The Group receives investment advisory and investment manage-ment fees for services provided in its wealth management busi-nesses which are generally reflected in the line item ‘Investment and portfolio management’ in the table “Contracts with customers and disaggregation of revenues”.
As a fund manager, the Group typically receives base manage-ment fees and may additionally receive performance-based management fees which are both recognized as ‘Investment and portfolio management’ revenues in the table “Contracts with cus-tomers and disaggregation of revenues”.
The Group’s capital markets businesses underwrite and sell secu-rities on behalf of customers and receive underwriting fees.
The Group also offers brokerage services in its investment bank-ing businesses, including global securities sales, trading and execution, prime brokerage and investment research. For the ser-vices provided, such as for example the execution of client trades in securities or derivatives, the Group typically earns a brokerage commission when the trade is executed.
Credit Suisse’s investment banking businesses provide services that include advisory services to clients in connection with cor-porate finance activities. The term ‘advisory’ includes any type of service the Group provides in an advisory capacity. Revenues rec-ognized from these services are reflected in the line item ‘Other Services’ in the table below.
Contractswithcustomersanddisaggregationofrevenues
in 1Q22 4Q21 1Q21
Contractswithcustomers(CHFmillion)
Investment and
portfolio management 828 871 861
Other securities
business 13 15 13
Underwriting 239 397 989
Brokerage 690 739 908
Other services 394 560 448
Totalrevenuesfrom
contractswithcustomers 2,164 2,582 3,219
The table “Contracts with customers and disaggregation of reve-nues” differs from “Note 6 – Commissions and fees” as it includes only those contracts with customers that are in scope of ASC Topic 606 – Revenue from Contracts with Customers.
Contract balances
end of 1Q22 4Q21 1Q21
Contractbalances(CHFmillion)
Contract receivables 777 865 1,120
Contract liabilities 58 55 65
Revenue recognized in the reporting
period included in the contract liabilities
balance at the beginning of period 14 9 8
The Group did not recognize any revenue in the reporting period from performance obligations satisfied in previous periods.
There were no material net impairment losses on contract receiv-ables in 1Q22, 4Q21 and 1Q21. The Group’s contract terms are generally such that they do not result in any contract assets.
Remainingperformanceobligations
ASC Topic 606’s practical expedient allows the Group to exclude from its remaining performance obligations disclosure any per-formance obligations which are part of a contract with an original expected duration of one year or less. Additionally any variable consideration, for which it is probable that a significant reversal in the amount of cumulative revenue recognized will occur when the uncertainty associated with the variable consideration is sub-sequently resolved, is not subject to the remaining performance obligations disclosure because such variable consideration is not included in the transaction price (e.g., investment manage-ment fees). Upon review, the Group determined that no material remaining performance obligations are in scope of the remaining performance obligations disclosure.
> Refer to “Note 14 – Revenue from contracts with customers” in VI – Consoli-dated financial statements – Credit Suisse Group in the Credit Suisse Annual Report 2021 for further information.
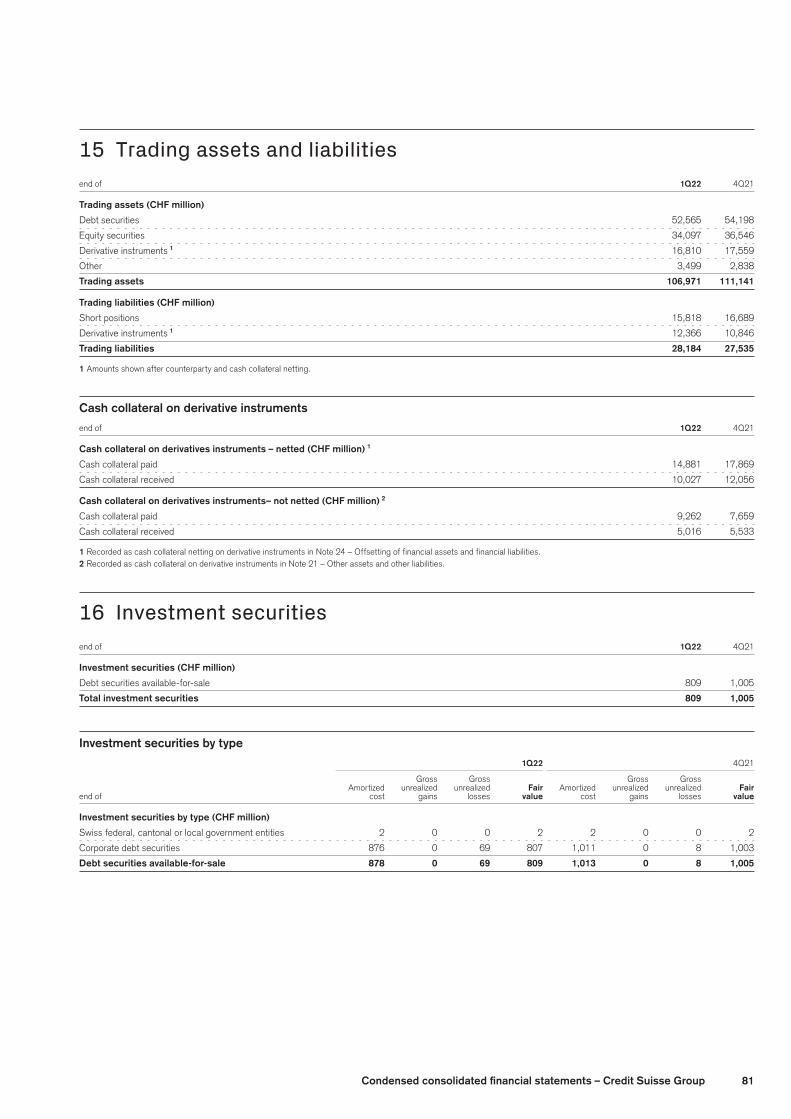
81Condensedconsolidatedfinancialstatements–CreditSuisseGroup
15 Trading assets and liabilitiesend of 1Q22 4Q21
Tradingassets(CHFmillion)
Debt securities 52,565 54,198
Equity securities 34,097 36,546
Derivative instruments 1 16,810 17,559
Other 3,499 2,838
Trading assets 106,971 111,141
Tradingliabilities(CHFmillion)
Short positions 15,818 16,689
Derivative instruments 1 12,366 10,846
Trading liabilities 28,184 27,535
1 Amounts shown after counterparty and cash collateral netting.
Cashcollateralonderivativeinstruments
end of 1Q22 4Q21
Cashcollateralonderivativesinstruments–netted(CHFmillion) 1
Cash collateral paid 14,881 17,869
Cash collateral received 10,027 12,056
Cashcollateralonderivativesinstruments–notnetted(CHFmillion) 2
Cash collateral paid 9,262 7,659
Cash collateral received 5,016 5,533
1 Recorded as cash collateral netting on derivative instruments in Note 24 – Offsetting of financial assets and financial liabilities.2 Recorded as cash collateral on derivative instruments in Note 21 – Other assets and other liabilities.
16 Investment securitiesend of 1Q22 4Q21
Investmentsecurities(CHFmillion)
Debt securities available-for-sale 809 1,005
Totalinvestmentsecurities 809 1,005
Investmentsecuritiesbytype 1Q22 4Q21
Gross Gross Gross Gross Amortized unrealized unrealized Fair Amortized unrealized unrealized Fair end of cost gains losses value cost gains losses value
Investmentsecuritiesbytype(CHFmillion)
Swiss federal, cantonal or local government entities 2 0 0 2 2 0 0 2
Corporate debt securities 876 0 69 807 1,011 0 8 1,003
Debt securities available-for-sale 878 0 69 809 1,013 0 8 1,005
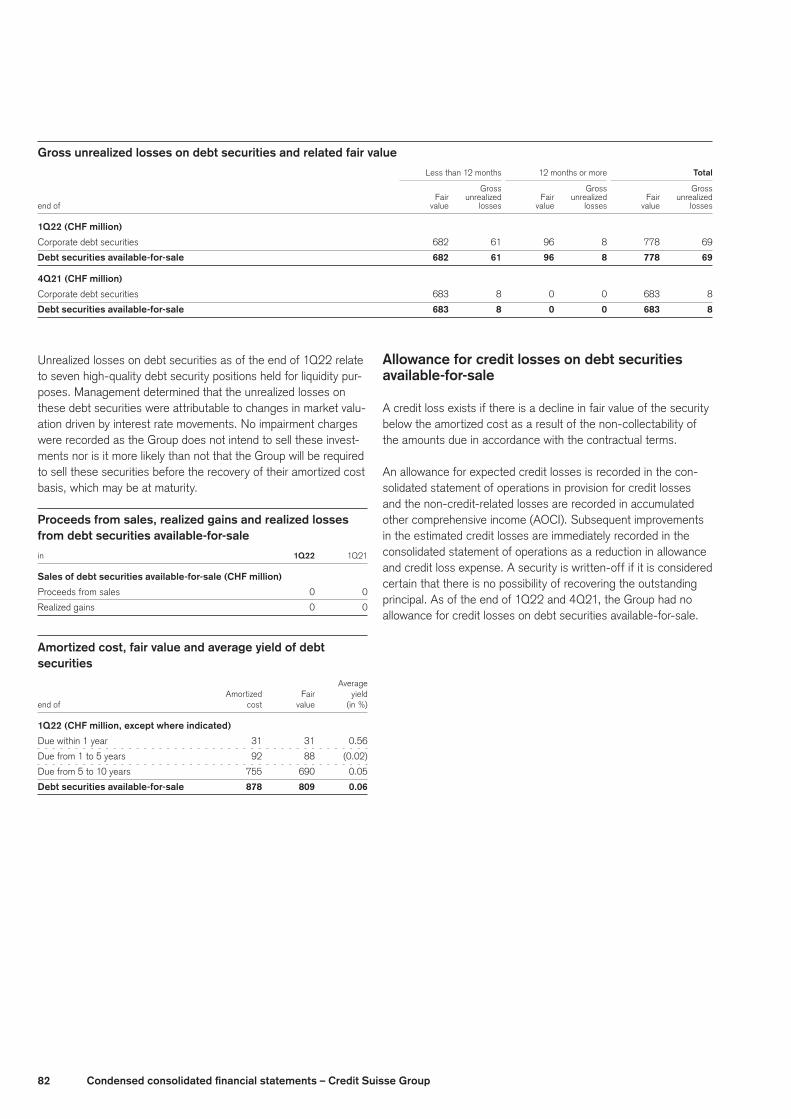
82 Condensedconsolidatedfinancialstatements–CreditSuisseGroup
Grossunrealizedlossesondebtsecuritiesandrelatedfairvalue Less than 12 months 12 months or more Total
Gross Gross Gross Fair unrealized Fair unrealized Fair unrealized
end of value losses value losses value losses
1Q22(CHFmillion)
Corporate debt securities 682 61 96 8 778 69
Debt securities available-for-sale 682 61 96 8 778 69
4Q21(CHFmillion)
Corporate debt securities 683 8 0 0 683 8
Debt securities available-for-sale 683 8 0 0 683 8
Unrealized losses on debt securities as of the end of 1Q22 relate to seven high-quality debt security positions held for liquidity pur-poses. Management determined that the unrealized losses on these debt securities were attributable to changes in market valu-ation driven by interest rate movements. No impairment charges were recorded as the Group does not intend to sell these invest-ments nor is it more likely than not that the Group will be required to sell these securities before the recovery of their amortized cost basis, which may be at maturity.
Proceedsfromsales,realizedgainsandrealizedlossesfromdebtsecuritiesavailable-for-sale
in 1Q22 1Q21
Salesofdebtsecuritiesavailable-for-sale(CHFmillion)
Proceeds from sales 0 0
Realized gains 0 0
Amortizedcost,fairvalueandaverageyieldofdebtsecurities Average
Amortized Fair yield
end of cost value (in %)
1Q22(CHFmillion,exceptwhereindicated)
Due within 1 year 31 31 0.56
Due from 1 to 5 years 92 88 (0.02)
Due from 5 to 10 years 755 690 0.05
Debt securities available-for-sale 878 809 0.06
Allowanceforcreditlossesondebtsecuritiesavailable-for-sale
A credit loss exists if there is a decline in fair value of the security below the amortized cost as a result of the non-collectability of the amounts due in accordance with the contractual terms.
An allowance for expected credit losses is recorded in the con-solidated statement of operations in provision for credit losses and the non-credit-related losses are recorded in accumulated other comprehensive income (AOCI). Subsequent improvements in the estimated credit losses are immediately recorded in the consolidated statement of operations as a reduction in allowance and credit loss expense. A security is written-off if it is considered certain that there is no possibility of recovering the outstanding principal. As of the end of 1Q22 and 4Q21, the Group had no allowance for credit losses on debt securities available-for-sale.
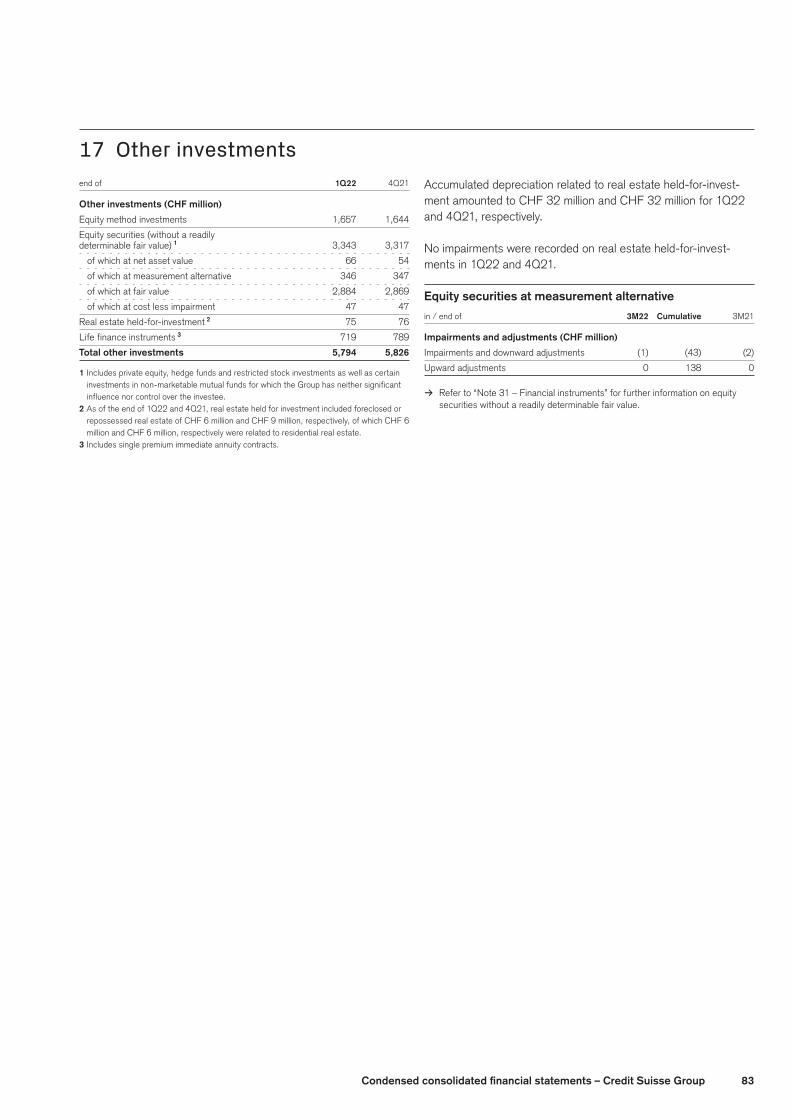
83Condensedconsolidatedfinancialstatements–CreditSuisseGroup
17 Other investmentsend of 1Q22 4Q21
Otherinvestments(CHFmillion)
Equity method investments 1,657 1,644
Equity securities (without a readily
determinable fair value) 1 3,343 3,317
of which at net asset value 66 54
of which at measurement alternative 346 347
of which at fair value 2,884 2,869
of which at cost less impairment 47 47
Real estate held-for-investment 2 75 76
Life finance instruments 3 719 789
Totalotherinvestments 5,794 5,826
1 Includes private equity, hedge funds and restricted stock investments as well as certain investments in non-marketable mutual funds for which the Group has neither significant influence nor control over the investee.
2 As of the end of 1Q22 and 4Q21, real estate held for investment included foreclosed or repossessed real estate of CHF 6 million and CHF 9 million, respectively, of which CHF 6 million and CHF 6 million, respectively were related to residential real estate.
3 Includes single premium immediate annuity contracts.
Accumulated depreciation related to real estate held-for-invest-ment amounted to CHF 32 million and CHF 32 million for 1Q22 and 4Q21, respectively.
No impairments were recorded on real estate held-for-invest-ments in 1Q22 and 4Q21.
Equitysecuritiesatmeasurementalternative
in / end of 3M22 Cumulative 3M21
Impairmentsandadjustments(CHFmillion)
Impairments and downward adjustments (1) (43) (2)
Upward adjustments 0 138 0
> Refer to “Note 31 – Financial instruments” for further information on equity
securities without a readily determinable fair value.

84 Condensedconsolidatedfinancialstatements–CreditSuisseGroup
18 LoansThe Group’s loan portfolio is classified into two portfolio seg-ments, consumer loans and corporate & institutional loans. Con-sumer loans are disaggregated into the classes of mortgages, loans collateralized by securities and consumer finance. Corporate & institutional loans are disaggregated into the classes of real estate, commercial and industrial loans, financial institutions, and governments and public institutions.
For financial reporting purposes, the carrying values of loans and related allowance for credit losses are presented in accordance with US GAAP and are not comparable with the regulatory credit risk exposures presented in our disclosures required under Pillar 3 of the Basel framework.
Loans
end of 1Q22 4Q21
Loans(CHFmillion)
Mortgages 110,166 110,533
Loans collateralized by securities 47,828 51,253
Consumer finance 5,231 5,075
Consumer 163,225 166,861
Real estate 28,556 28,529
Commercial and industrial loans 68,432 69,129
Financial institutions 25,733 25,222
Governments and public institutions 3,147 3,323
Corporate & institutional 125,868 126,203
Grossloans 289,093 293,064
of which held at amortized cost 279,548 282,821
of which held at fair value 9,545 10,243
Net (unearned income)/deferred expenses (81) (81)
Allowance for credit losses (1,330) (1,297)
Net loans 287,682 291,686
Grossloansbylocation(CHFmillion)
Switzerland 169,454 167,957
Foreign 119,639 125,107
Grossloans 289,093 293,064
Impairedloanportfolio(CHFmillion)
Non-performing loans 1,819 1,666
Non-interest-earning loans 378 298
Non-accrual loans 2,197 1,964
Restructured loans 384 367
Potential problem loans 451 436
Other impaired loans 835 803
Grossimpairedloans 1 3,032 2,767
1 As of the end of 1Q22 and 4Q21, CHF 184 million and CHF 130 million, respectively, were related to consumer mortgages secured by residential real estate for which formal foreclosure proceedings according to local requirements of the applicable jurisdiction were in process.
In accordance with Group policies, impaired loans include non-accrual loans, comprised of non-performing loans and non-inter-est-earning loans, as well as restructured loans and potential problem loans.
> Refer to “Loans” in Note 1 – Summary of significant accounting policies in VI – Consolidated financial statements – Credit Suisse Group in the Credit Suisse Annual Report 2021 for further information on loans and categories of impaired loans.
> Refer to “Note 19 – Financial instruments measured at amortized cost and credit losses” for further information on loans held at amortized cost.
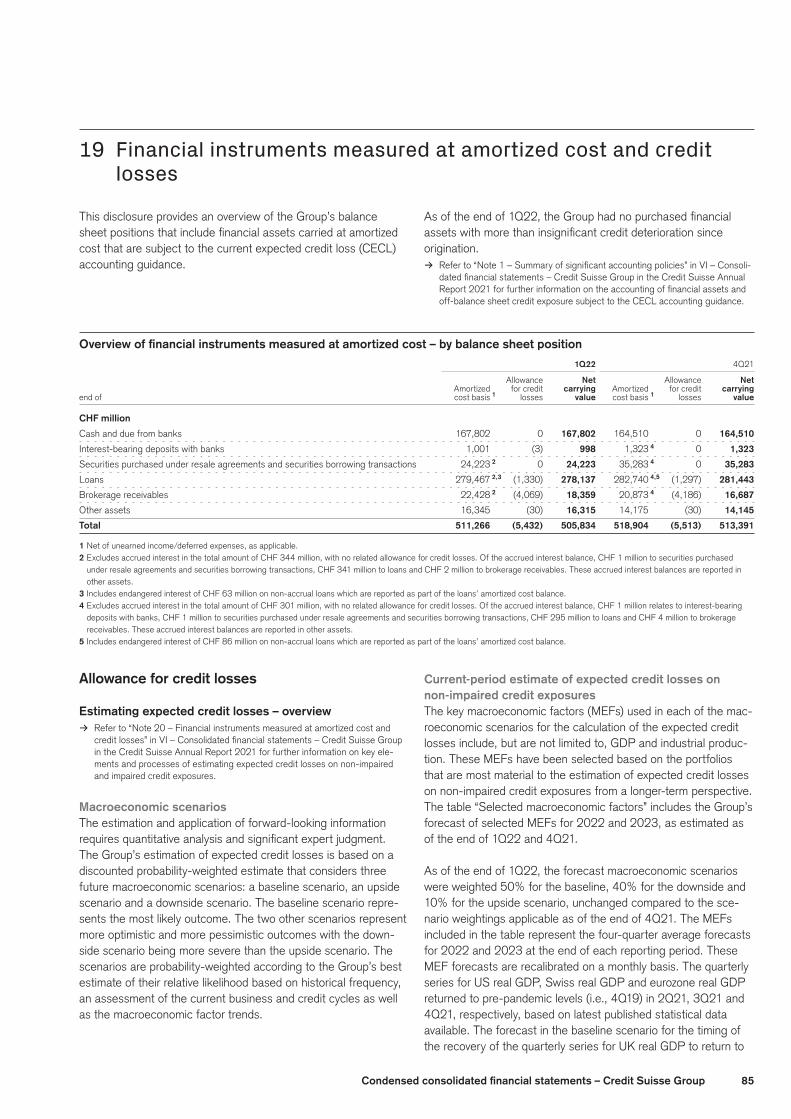
85Condensedconsolidatedfinancialstatements–CreditSuisseGroup
19 Financial instruments measured at amortized cost and credit losses
This disclosure provides an overview of the Group’s balance sheet positions that include financial assets carried at amortized cost that are subject to the current expected credit loss (CECL) accounting guidance.
As of the end of 1Q22, the Group had no purchased financial assets with more than insignificant credit deterioration since origination.
> Refer to “Note 1 – Summary of significant accounting policies” in VI – Consoli-dated financial statements – Credit Suisse Group in the Credit Suisse Annual Report 2021 for further information on the accounting of financial assets and off-balance sheet credit exposure subject to the CECL accounting guidance.
Overviewoffinancialinstrumentsmeasuredatamortizedcost–bybalancesheetposition 1Q22 4Q21
Allowance Net Allowance Net Amortized for credit carrying Amortized for credit carrying end of cost basis 1 losses value cost basis 1 losses value
CHFmillion
Cash and due from banks 167,802 0 167,802 164,510 0 164,510
Interest-bearing deposits with banks 1,001 (3) 998 1,323 4 0 1,323
Securities purchased under resale agreements and securities borrowing transactions 24,223 2 0 24,223 35,283 4 0 35,283
Loans 279,467 2,3 (1,330) 278,137 282,740 4,5 (1,297) 281,443
Brokerage receivables 22,428 2 (4,069) 18,359 20,873 4 (4,186) 16,687
Other assets 16,345 (30) 16,315 14,175 (30) 14,145
Total 511,266 (5,432) 505,834 518,904 (5,513) 513,391
1 Net of unearned income/deferred expenses, as applicable.2 Excludes accrued interest in the total amount of CHF 344 million, with no related allowance for credit losses. Of the accrued interest balance, CHF 1 million to securities purchased
under resale agreements and securities borrowing transactions, CHF 341 million to loans and CHF 2 million to brokerage receivables. These accrued interest balances are reported in other assets.
3 Includes endangered interest of CHF 63 million on non-accrual loans which are reported as part of the loans’ amortized cost balance.4 Excludes accrued interest in the total amount of CHF 301 million, with no related allowance for credit losses. Of the accrued interest balance, CHF 1 million relates to interest-bearing
deposits with banks, CHF 1 million to securities purchased under resale agreements and securities borrowing transactions, CHF 295 million to loans and CHF 4 million to brokerage receivables. These accrued interest balances are reported in other assets.
5 Includes endangered interest of CHF 86 million on non-accrual loans which are reported as part of the loans’ amortized cost balance.
Allowanceforcreditlosses
Estimatingexpectedcreditlosses–overview > Refer to “Note 20 – Financial instruments measured at amortized cost and
credit losses” in VI – Consolidated financial statements – Credit Suisse Group in the Credit Suisse Annual Report 2021 for further information on key ele-ments and processes of estimating expected credit losses on non-impaired and impaired credit exposures.
MacroeconomicscenariosThe estimation and application of forward-looking information requires quantitative analysis and significant expert judgment. The Group’s estimation of expected credit losses is based on a discounted probability-weighted estimate that considers three future macroeconomic scenarios: a baseline scenario, an upside scenario and a downside scenario. The baseline scenario repre-sents the most likely outcome. The two other scenarios represent more optimistic and more pessimistic outcomes with the down-side scenario being more severe than the upside scenario. The scenarios are probability-weighted according to the Group’s best estimate of their relative likelihood based on historical frequency, an assessment of the current business and credit cycles as well as the macroeconomic factor trends.
Current-periodestimateofexpectedcreditlossesonnon-impairedcreditexposuresThe key macroeconomic factors (MEFs) used in each of the mac-roeconomic scenarios for the calculation of the expected credit losses include, but are not limited to, GDP and industrial produc-tion. These MEFs have been selected based on the portfolios that are most material to the estimation of expected credit losses on non-impaired credit exposures from a longer-term perspective. The table “Selected macroeconomic factors” includes the Group’s forecast of selected MEFs for 2022 and 2023, as estimated as of the end of 1Q22 and 4Q21.
As of the end of 1Q22, the forecast macroeconomic scenarios were weighted 50% for the baseline, 40% for the downside and 10% for the upside scenario, unchanged compared to the sce-nario weightings applicable as of the end of 4Q21. The MEFs included in the table represent the four-quarter average forecasts for 2022 and 2023 at the end of each reporting period. These MEF forecasts are recalibrated on a monthly basis. The quarterly series for US real GDP, Swiss real GDP and eurozone real GDP returned to pre-pandemic levels (i.e., 4Q19) in 2Q21, 3Q21 and 4Q21, respectively, based on latest published statistical data available. The forecast in the baseline scenario for the timing of the recovery of the quarterly series for UK real GDP to return to

86 Condensedconsolidatedfinancialstatements–CreditSuisseGroup
pre-pandemic levels was 1Q22. The macroeconomic and market variable projections incorporate adjustments to reflect the impact of successive COVID-19 infection waves, the impact of accel-erated monetary policy tightening by the world’s major central banks and the impact on commodity prices and supply chains due to Russia’s invasion of Ukraine. While GDP and industrial produc-tion are significant inputs to the forecast models, a range of other inputs are also incorporated for all three scenarios to provide projections for future economic and market conditions. Given the complex nature of the forecasting process, no single economic variable is viewed in isolation or independently of other inputs.
Selectedmacroeconomicfactors 1Q22 4Q21
Forecast Forecast Forecast Forecast
end of 2022 2023 2022 2023
SwissrealGDPgrowthrate(%)
Downside 0.8 1.2 (0.4) 0.3
Baseline 2.5 1.6 2.5 1.9
Upside 2.9 2.2 4.3 2.8
EurozonerealGDPgrowthrate(%)
Downside 0.4 0.3 (0.7) 1.4
Baseline 3.3 2.5 3.8 2.3
Upside 3.6 3.0 4.2 2.7
USrealGDPgrowthrate(%)
Downside 0.9 0.4 0.1 1.4
Baseline 3.3 2.1 3.8 1.9
Upside 3.6 2.6 4.5 2.4
UKrealGDPgrowthrate(%)
Downside 1.1 (1.1) (0.9) 1.0
Baseline 4.0 1.7 5.0 3.3
Upside 4.6 2.2 7.8 3.9
Worldindustrialproduction(%)
Downside 0.8 2.2 0.0 2.0
Baseline 4.1 3.2 3.0 3.0
Upside 5.8 4.4 4.4 3.7
Forecasts represent the 4-quarter average estimate of the respective macroeconomic fac-tor as determined at the end of each reporting period.
For events which cannot be adequately reflected in CECL models due to a lack of historical experience the event may be embed-ded in the baseline scenario. In order to address circumstances where in management’s judgment the CECL model outputs are overly sensitive to the effect of economic inputs that lie outside of their historical range, model overlays are applied. Such over-lays are based on expert judgment and are applied in response to these circumstances to consider historical stressed losses and industry and counterparty credit level reviews. Overlays are also used to capture judgment on the economic uncertainty from global or regional developments or governmental actions with severe impacts on economies, such as the lockdowns and other actions directed towards managing the pandemic. As a result of such overlays, provisions for credit losses may not be primarily derived from MEF projections. The Group’s non-specific allow-ance for expected credit losses as of the end of 1Q22 was stable compared to the end of 4Q21 as the impact of a recalibration of qualitative overlays that reflected the positive market sentiment observable in the first half of the quarter was offset by the impact of additional stress overlays incorporated to account for potential losses due to Russia’s invasion of Ukraine. Overlays continued to be closely aligned with the macroeconomic forecasts and associ-ated scenario weightings.
LoansheldatamortizedcostThe Group’s loan portfolio is classified into two portfolio seg-ments, consumer loans and corporate & institutional loans.
> Refer to “Note 20 – Financial instruments measured at amortized cost and credit losses” in VI – Consolidated financial statements – Credit Suisse Group in the Credit Suisse Annual Report 2021 for further information on the main risk characteristics of the Group’s loans held at amortized cost.
Allowanceforcreditlosses–loansheldatamortizedcost 1Q22 4Q21 1Q21
Corporate & Corporate & Corporate & Consumer institutional Total Consumer institutional Total Consumer institutional Total
Allowanceforcreditlosses(CHFmillion)
Balance at beginning of period 357 940 1,297 351 1,012 1,363 318 1,218 1,536
Current-period provision for expected credit losses 22 33 55 17 (15) 2 12 (35) (23)
of which provisions for interest 1 5 9 14 11 7 18 1 0 1
Gross write-offs (15) (18) (33) (15) (38) (53) (14) (24) (38)
Recoveries 3 1 4 2 2 4 2 0 2
Net write-offs (12) (17) (29) (13) (36) (49) (12) (24) (36)
Foreign currency translation impact
and other adjustments, net 2 5 7 2 (21) (19) 11 39 50
Balance at end of period 369 961 1,330 357 940 1,297 329 1,198 1,527
of which individually evaluated 273 545 818 273 512 785 240 627 867
of which collectively evaluated 96 416 512 84 428 512 89 571 660
1 Represents the current-period net provision for accrued interest on non-accrual loans and lease financing transactions which is recognized as a reversal of interest income.
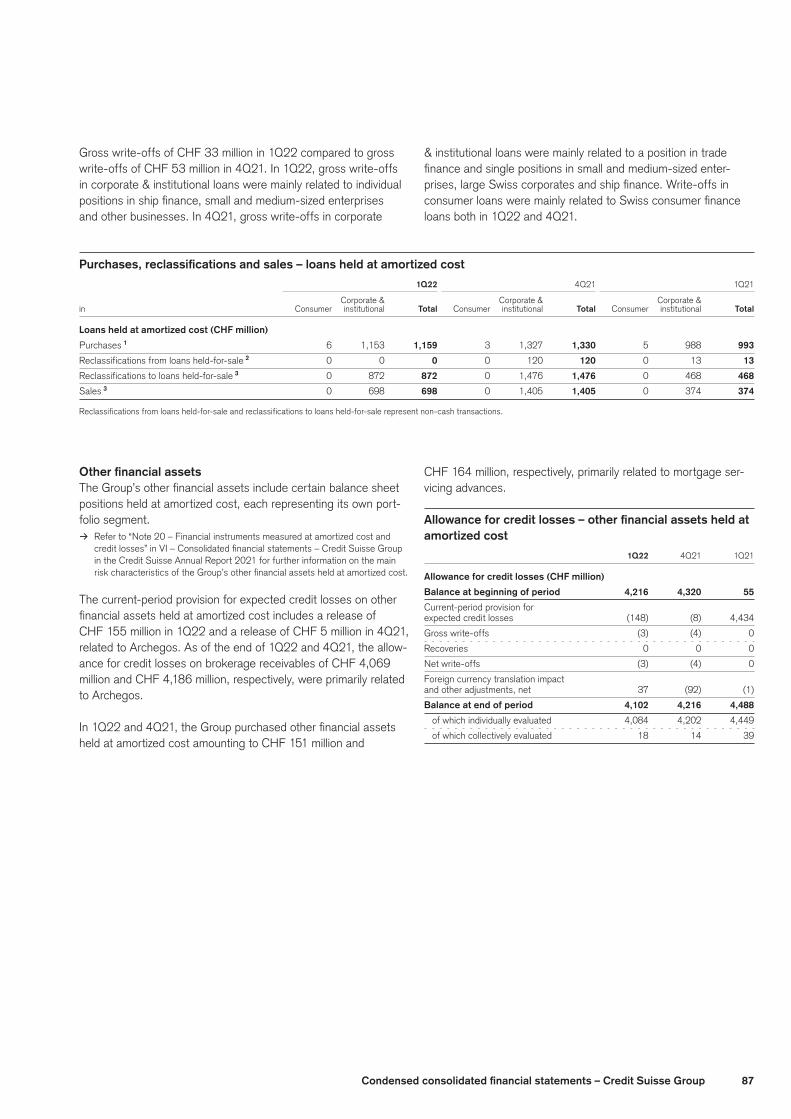
87Condensedconsolidatedfinancialstatements–CreditSuisseGroup
Gross write-offs of CHF 33 million in 1Q22 compared to gross write-offs of CHF 53 million in 4Q21. In 1Q22, gross write-offs in corporate & institutional loans were mainly related to individual positions in ship finance, small and medium-sized enterprises and other businesses. In 4Q21, gross write-offs in corporate
& institutional loans were mainly related to a position in trade finance and single positions in small and medium-sized enter-prises, large Swiss corporates and ship finance. Write-offs in consumer loans were mainly related to Swiss consumer finance loans both in 1Q22 and 4Q21.
Purchases,reclassificationsandsales–loansheldatamortizedcost 1Q22 4Q21 1Q21
Corporate & Corporate & Corporate &
in Consumer institutional Total Consumer institutional Total Consumer institutional Total
Loansheldatamortizedcost(CHFmillion)
Purchases 1 6 1,153 1,159 3 1,327 1,330 5 988 993
Reclassifications from loans held-for-sale 2 0 0 0 0 120 120 0 13 13
Reclassifications to loans held-for-sale 3 0 872 872 0 1,476 1,476 0 468 468
Sales 3 0 698 698 0 1,405 1,405 0 374 374
Reclassifications from loans held-for-sale and reclassifications to loans held-for-sale represent non-cash transactions.
OtherfinancialassetsThe Group’s other financial assets include certain balance sheet positions held at amortized cost, each representing its own port-folio segment.
> Refer to “Note 20 – Financial instruments measured at amortized cost and credit losses” in VI – Consolidated financial statements – Credit Suisse Group in the Credit Suisse Annual Report 2021 for further information on the main risk characteristics of the Group’s other financial assets held at amortized cost.
The current-period provision for expected credit losses on other financial assets held at amortized cost includes a release of CHF 155 million in 1Q22 and a release of CHF 5 million in 4Q21, related to Archegos. As of the end of 1Q22 and 4Q21, the allow-ance for credit losses on brokerage receivables of CHF 4,069 million and CHF 4,186 million, respectively, were primarily related to Archegos.
In 1Q22 and 4Q21, the Group purchased other financial assets held at amortized cost amounting to CHF 151 million and
CHF 164 million, respectively, primarily related to mortgage ser-vicing advances.
Allowanceforcreditlosses–otherfinancialassetsheldatamortizedcost 1Q22 4Q21 1Q21
Allowanceforcreditlosses(CHFmillion)
Balance at beginning of period 4,216 4,320 55
Current-period provision for
expected credit losses (148) (8) 4,434
Gross write-offs (3) (4) 0
Recoveries 0 0 0
Net write-offs (3) (4) 0
Foreign currency translation impact
and other adjustments, net 37 (92) (1)
Balance at end of period 4,102 4,216 4,488
of which individually evaluated 4,084 4,202 4,449
of which collectively evaluated 18 14 39
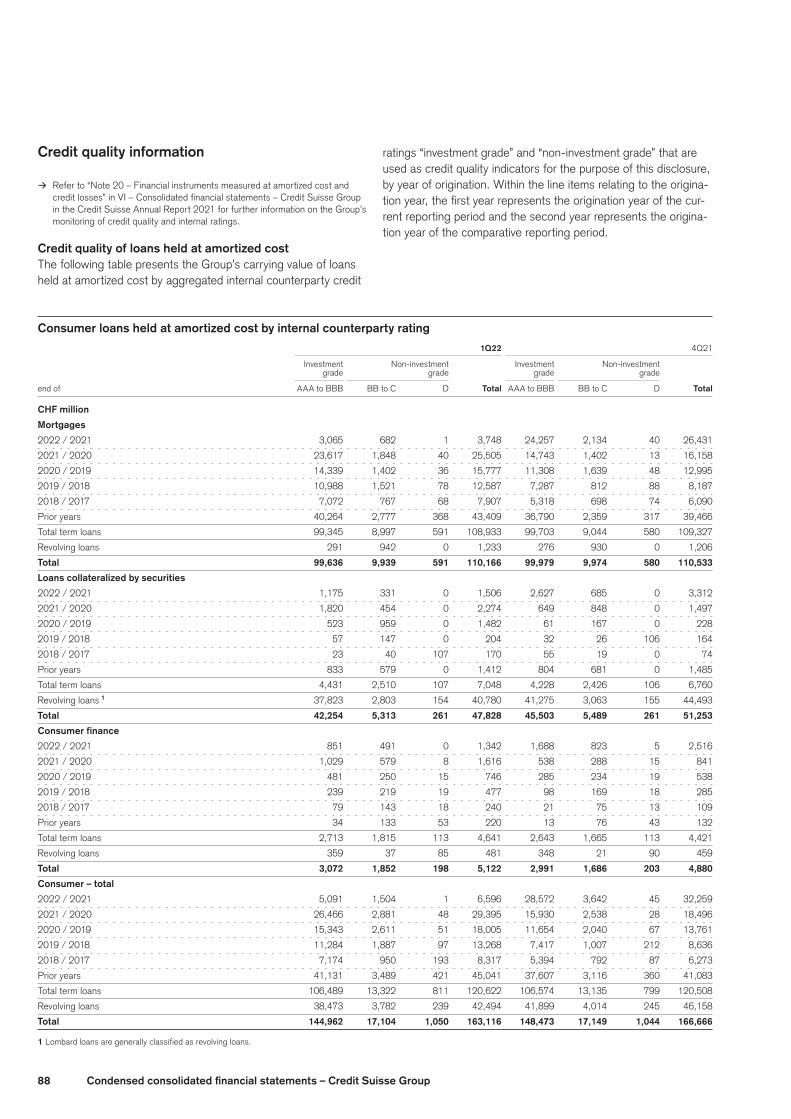
88 Condensedconsolidatedfinancialstatements–CreditSuisseGroup
Creditqualityinformation
> Refer to “Note 20 – Financial instruments measured at amortized cost and credit losses” in VI – Consolidated financial statements – Credit Suisse Group in the Credit Suisse Annual Report 2021 for further information on the Group’s monitoring of credit quality and internal ratings.
CreditqualityofloansheldatamortizedcostThe following table presents the Group’s carrying value of loans held at amortized cost by aggregated internal counterparty credit
ratings “investment grade” and “non-investment grade” that are used as credit quality indicators for the purpose of this disclosure, by year of origination. Within the line items relating to the origina-tion year, the first year represents the origination year of the cur-rent reporting period and the second year represents the origina-tion year of the comparative reporting period.
Consumerloansheldatamortizedcostbyinternalcounterpartyrating 1Q22 4Q21
Investment Non-investment Investment Non-investment grade grade grade grade
end of AAA to BBB BB to C D Total AAA to BBB BB to C D Total
CHFmillion
Mortgages
2022 / 2021 3,065 682 1 3,748 24,257 2,134 40 26,431
2021 / 2020 23,617 1,848 40 25,505 14,743 1,402 13 16,158
2020 / 2019 14,339 1,402 36 15,777 11,308 1,639 48 12,995
2019 / 2018 10,988 1,521 78 12,587 7,287 812 88 8,187
2018 / 2017 7,072 767 68 7,907 5,318 698 74 6,090
Prior years 40,264 2,777 368 43,409 36,790 2,359 317 39,466
Total term loans 99,345 8,997 591 108,933 99,703 9,044 580 109,327
Revolving loans 291 942 0 1,233 276 930 0 1,206
Total 99,636 9,939 591 110,166 99,979 9,974 580 110,533
Loanscollateralizedbysecurities
2022 / 2021 1,175 331 0 1,506 2,627 685 0 3,312
2021 / 2020 1,820 454 0 2,274 649 848 0 1,497
2020 / 2019 523 959 0 1,482 61 167 0 228
2019 / 2018 57 147 0 204 32 26 106 164
2018 / 2017 23 40 107 170 55 19 0 74
Prior years 833 579 0 1,412 804 681 0 1,485
Total term loans 4,431 2,510 107 7,048 4,228 2,426 106 6,760
Revolving loans 1 37,823 2,803 154 40,780 41,275 3,063 155 44,493
Total 42,254 5,313 261 47,828 45,503 5,489 261 51,253
Consumerfinance
2022 / 2021 851 491 0 1,342 1,688 823 5 2,516
2021 / 2020 1,029 579 8 1,616 538 288 15 841
2020 / 2019 481 250 15 746 285 234 19 538
2019 / 2018 239 219 19 477 98 169 18 285
2018 / 2017 79 143 18 240 21 75 13 109
Prior years 34 133 53 220 13 76 43 132
Total term loans 2,713 1,815 113 4,641 2,643 1,665 113 4,421
Revolving loans 359 37 85 481 348 21 90 459
Total 3,072 1,852 198 5,122 2,991 1,686 203 4,880
Consumer–total
2022 / 2021 5,091 1,504 1 6,596 28,572 3,642 45 32,259
2021 / 2020 26,466 2,881 48 29,395 15,930 2,538 28 18,496
2020 / 2019 15,343 2,611 51 18,005 11,654 2,040 67 13,761
2019 / 2018 11,284 1,887 97 13,268 7,417 1,007 212 8,636
2018 / 2017 7,174 950 193 8,317 5,394 792 87 6,273
Prior years 41,131 3,489 421 45,041 37,607 3,116 360 41,083
Total term loans 106,489 13,322 811 120,622 106,574 13,135 799 120,508
Revolving loans 38,473 3,782 239 42,494 41,899 4,014 245 46,158
Total 144,962 17,104 1,050 163,116 148,473 17,149 1,044 166,666
1 Lombard loans are generally classified as revolving loans.
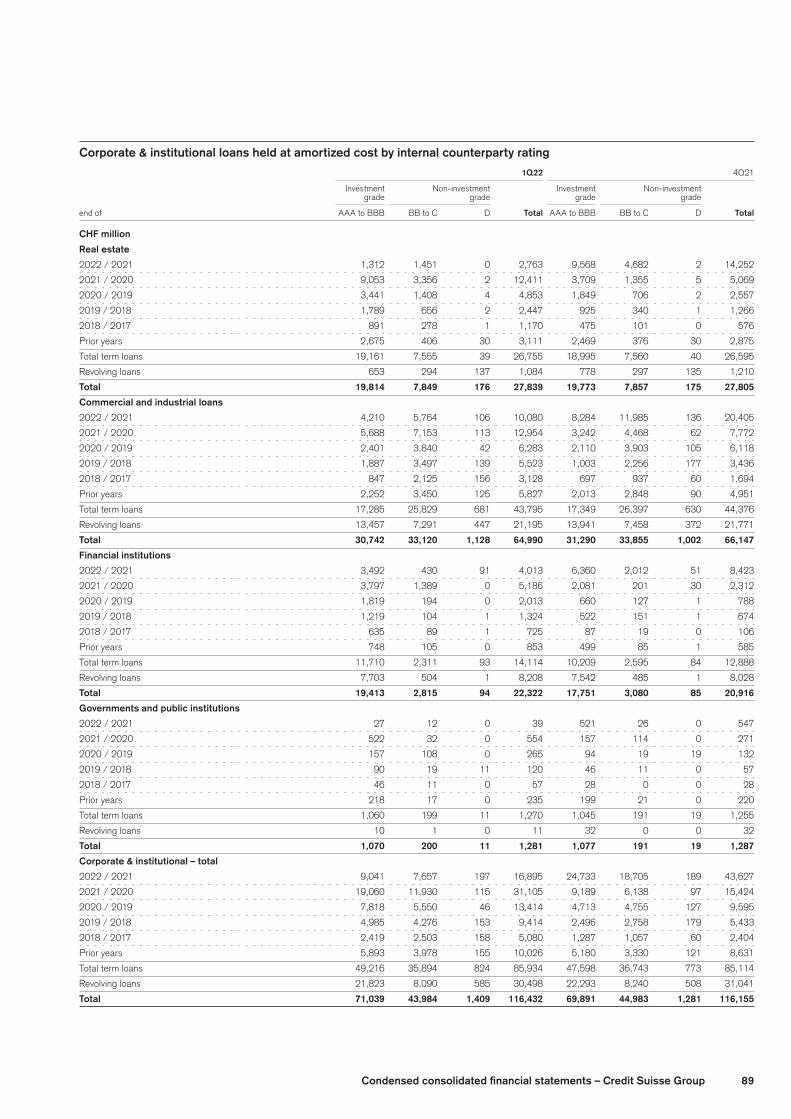
89Condensedconsolidatedfinancialstatements–CreditSuisseGroup
Corporate&institutionalloansheldatamortizedcostbyinternalcounterpartyrating 1Q22 4Q21
Investment Non-investment Investment Non-investment grade grade grade grade
end of AAA to BBB BB to C D Total AAA to BBB BB to C D Total
CHFmillion
Real estate
2022 / 2021 1,312 1,451 0 2,763 9,568 4,682 2 14,252
2021 / 2020 9,053 3,356 2 12,411 3,709 1,355 5 5,069
2020 / 2019 3,441 1,408 4 4,853 1,849 706 2 2,557
2019 / 2018 1,789 656 2 2,447 925 340 1 1,266
2018 / 2017 891 278 1 1,170 475 101 0 576
Prior years 2,675 406 30 3,111 2,469 376 30 2,875
Total term loans 19,161 7,555 39 26,755 18,995 7,560 40 26,595
Revolving loans 653 294 137 1,084 778 297 135 1,210
Total 19,814 7,849 176 27,839 19,773 7,857 175 27,805
Commercialandindustrialloans
2022 / 2021 4,210 5,764 106 10,080 8,284 11,985 136 20,405
2021 / 2020 5,688 7,153 113 12,954 3,242 4,468 62 7,772
2020 / 2019 2,401 3,840 42 6,283 2,110 3,903 105 6,118
2019 / 2018 1,887 3,497 139 5,523 1,003 2,256 177 3,436
2018 / 2017 847 2,125 156 3,128 697 937 60 1,694
Prior years 2,252 3,450 125 5,827 2,013 2,848 90 4,951
Total term loans 17,285 25,829 681 43,795 17,349 26,397 630 44,376
Revolving loans 13,457 7,291 447 21,195 13,941 7,458 372 21,771
Total 30,742 33,120 1,128 64,990 31,290 33,855 1,002 66,147
Financialinstitutions
2022 / 2021 3,492 430 91 4,013 6,360 2,012 51 8,423
2021 / 2020 3,797 1,389 0 5,186 2,081 201 30 2,312
2020 / 2019 1,819 194 0 2,013 660 127 1 788
2019 / 2018 1,219 104 1 1,324 522 151 1 674
2018 / 2017 635 89 1 725 87 19 0 106
Prior years 748 105 0 853 499 85 1 585
Total term loans 11,710 2,311 93 14,114 10,209 2,595 84 12,888
Revolving loans 7,703 504 1 8,208 7,542 485 1 8,028
Total 19,413 2,815 94 22,322 17,751 3,080 85 20,916
Governmentsandpublicinstitutions
2022 / 2021 27 12 0 39 521 26 0 547
2021 / 2020 522 32 0 554 157 114 0 271
2020 / 2019 157 108 0 265 94 19 19 132
2019 / 2018 90 19 11 120 46 11 0 57
2018 / 2017 46 11 0 57 28 0 0 28
Prior years 218 17 0 235 199 21 0 220
Total term loans 1,060 199 11 1,270 1,045 191 19 1,255
Revolving loans 10 1 0 11 32 0 0 32
Total 1,070 200 11 1,281 1,077 191 19 1,287
Corporate&institutional–total
2022 / 2021 9,041 7,657 197 16,895 24,733 18,705 189 43,627
2021 / 2020 19,060 11,930 115 31,105 9,189 6,138 97 15,424
2020 / 2019 7,818 5,550 46 13,414 4,713 4,755 127 9,595
2019 / 2018 4,985 4,276 153 9,414 2,496 2,758 179 5,433
2018 / 2017 2,419 2,503 158 5,080 1,287 1,057 60 2,404
Prior years 5,893 3,978 155 10,026 5,180 3,330 121 8,631
Total term loans 49,216 35,894 824 85,934 47,598 36,743 773 85,114
Revolving loans 21,823 8,090 585 30,498 22,293 8,240 508 31,041
Total 71,039 43,984 1,409 116,432 69,891 44,983 1,281 116,155
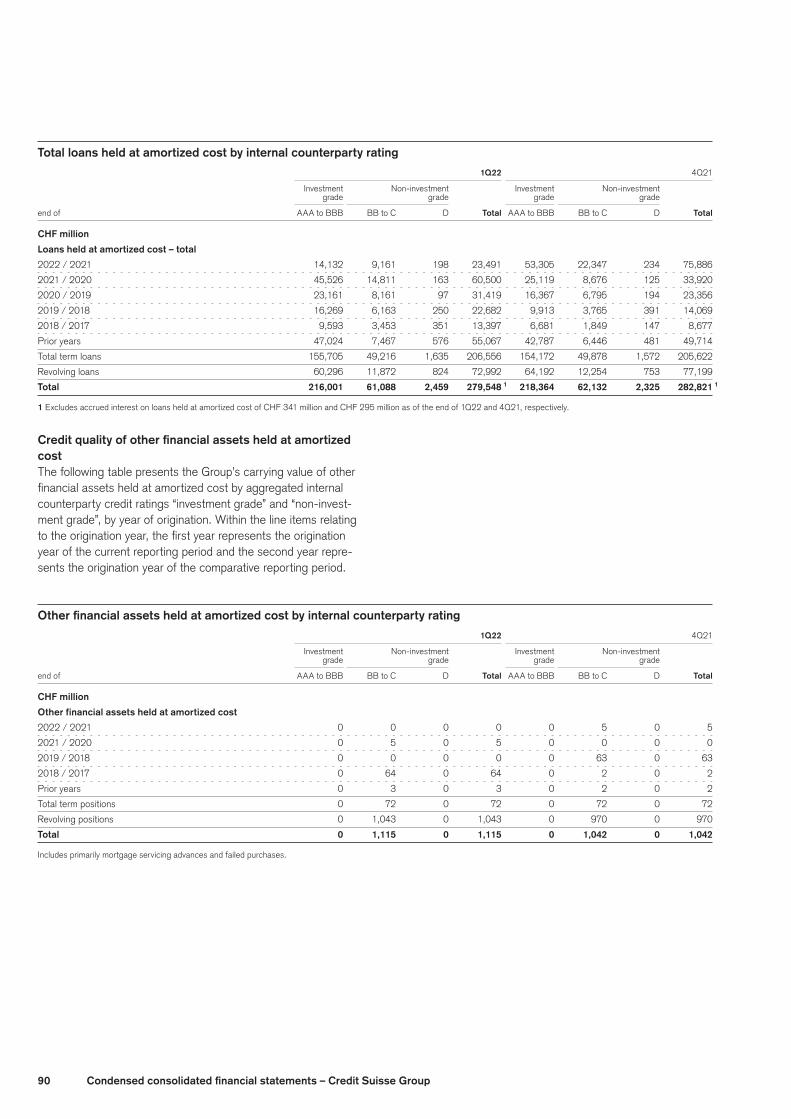
90 Condensedconsolidatedfinancialstatements–CreditSuisseGroup
Totalloansheldatamortizedcostbyinternalcounterpartyrating 1Q22 4Q21
Investment Non-investment Investment Non-investment grade grade grade grade
end of AAA to BBB BB to C D Total AAA to BBB BB to C D Total
CHFmillion
Loansheldatamortizedcost–total
2022 / 2021 14,132 9,161 198 23,491 53,305 22,347 234 75,886
2021 / 2020 45,526 14,811 163 60,500 25,119 8,676 125 33,920
2020 / 2019 23,161 8,161 97 31,419 16,367 6,795 194 23,356
2019 / 2018 16,269 6,163 250 22,682 9,913 3,765 391 14,069
2018 / 2017 9,593 3,453 351 13,397 6,681 1,849 147 8,677
Prior years 47,024 7,467 576 55,067 42,787 6,446 481 49,714
Total term loans 155,705 49,216 1,635 206,556 154,172 49,878 1,572 205,622
Revolving loans 60,296 11,872 824 72,992 64,192 12,254 753 77,199
Total 216,001 61,088 2,459 279,548 1 218,364 62,132 2,325 282,821 1
1 Excludes accrued interest on loans held at amortized cost of CHF 341 million and CHF 295 million as of the end of 1Q22 and 4Q21, respectively.
CreditqualityofotherfinancialassetsheldatamortizedcostThe following table presents the Group’s carrying value of other financial assets held at amortized cost by aggregated internal counterparty credit ratings “investment grade” and “non-invest-ment grade”, by year of origination. Within the line items relating to the origination year, the first year represents the origination year of the current reporting period and the second year repre-sents the origination year of the comparative reporting period.
Otherfinancialassetsheldatamortizedcostbyinternalcounterpartyrating 1Q22 4Q21
Investment Non-investment Investment Non-investment grade grade grade grade
end of AAA to BBB BB to C D Total AAA to BBB BB to C D Total
CHFmillion
Otherfinancialassetsheldatamortizedcost
2022 / 2021 0 0 0 0 0 5 0 5
2021 / 2020 0 5 0 5 0 0 0 0
2019 / 2018 0 0 0 0 0 63 0 63
2018 / 2017 0 64 0 64 0 2 0 2
Prior years 0 3 0 3 0 2 0 2
Total term positions 0 72 0 72 0 72 0 72
Revolving positions 0 1,043 0 1,043 0 970 0 970
Total 0 1,115 0 1,115 0 1,042 0 1,042
Includes primarily mortgage servicing advances and failed purchases.
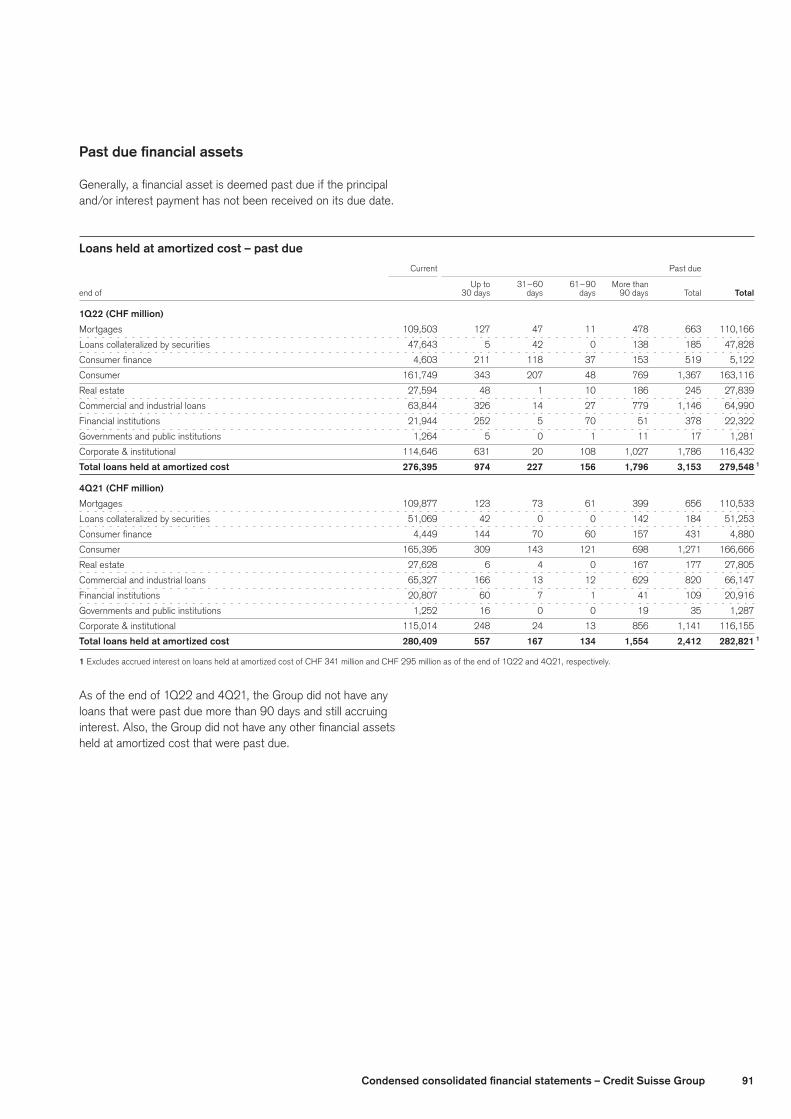
91Condensedconsolidatedfinancialstatements–CreditSuisseGroup
Pastduefinancialassets
Generally, a financial asset is deemed past due if the principal and/or interest payment has not been received on its due date.
Loansheldatamortizedcost–pastdue Current Past due
Up to 31 – 60 61 – 90 More than
end of 30 days days days 90 days Total Total
1Q22(CHFmillion)
Mortgages 109,503 127 47 11 478 663 110,166
Loans collateralized by securities 47,643 5 42 0 138 185 47,828
Consumer finance 4,603 211 118 37 153 519 5,122
Consumer 161,749 343 207 48 769 1,367 163,116
Real estate 27,594 48 1 10 186 245 27,839
Commercial and industrial loans 63,844 326 14 27 779 1,146 64,990
Financial institutions 21,944 252 5 70 51 378 22,322
Governments and public institutions 1,264 5 0 1 11 17 1,281
Corporate & institutional 114,646 631 20 108 1,027 1,786 116,432
Totalloansheldatamortizedcost 276,395 974 227 156 1,796 3,153 279,548 1
4Q21(CHFmillion)
Mortgages 109,877 123 73 61 399 656 110,533
Loans collateralized by securities 51,069 42 0 0 142 184 51,253
Consumer finance 4,449 144 70 60 157 431 4,880
Consumer 165,395 309 143 121 698 1,271 166,666
Real estate 27,628 6 4 0 167 177 27,805
Commercial and industrial loans 65,327 166 13 12 629 820 66,147
Financial institutions 20,807 60 7 1 41 109 20,916
Governments and public institutions 1,252 16 0 0 19 35 1,287
Corporate & institutional 115,014 248 24 13 856 1,141 116,155
Totalloansheldatamortizedcost 280,409 557 167 134 1,554 2,412 282,821 1
1 Excludes accrued interest on loans held at amortized cost of CHF 341 million and CHF 295 million as of the end of 1Q22 and 4Q21, respectively.
As of the end of 1Q22 and 4Q21, the Group did not have any loans that were past due more than 90 days and still accruing interest. Also, the Group did not have any other financial assets held at amortized cost that were past due.
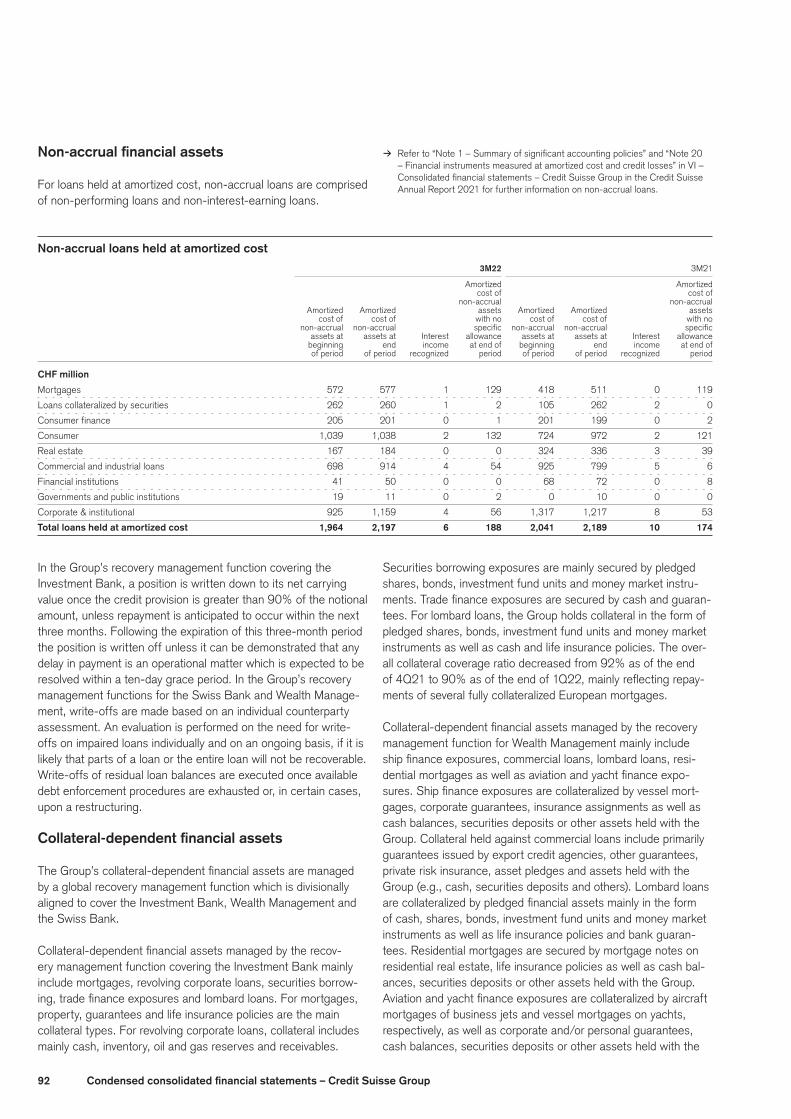
92 Condensedconsolidatedfinancialstatements–CreditSuisseGroup
Non-accrualfinancialassets
For loans held at amortized cost, non-accrual loans are comprised of non-performing loans and non-interest-earning loans.
> Refer to “Note 1 – Summary of significant accounting policies” and “Note 20 – Financial instruments measured at amortized cost and credit losses” in VI – Consolidated financial statements – Credit Suisse Group in the Credit Suisse Annual Report 2021 for further information on non-accrual loans.
Non-accrualloansheldatamortizedcost 3M22 3M21
Amortized Amortized cost of cost of non-accrual non-accrual Amortized Amortized assets Amortized Amortized assets cost of cost of with no cost of cost of with no non-accrual non-accrual specific non-accrual non-accrual specific assets at assets at Interest allowance assets at assets at Interest allowance beginning end income at end of beginning end income at end of of period of period recognized period of period of period recognized period
CHFmillion
Mortgages 572 577 1 129 418 511 0 119
Loans collateralized by securities 262 260 1 2 105 262 2 0
Consumer finance 205 201 0 1 201 199 0 2
Consumer 1,039 1,038 2 132 724 972 2 121
Real estate 167 184 0 0 324 336 3 39
Commercial and industrial loans 698 914 4 54 925 799 5 6
Financial institutions 41 50 0 0 68 72 0 8
Governments and public institutions 19 11 0 2 0 10 0 0
Corporate & institutional 925 1,159 4 56 1,317 1,217 8 53
Totalloansheldatamortizedcost 1,964 2,197 6 188 2,041 2,189 10 174
In the Group’s recovery management function covering the Investment Bank, a position is written down to its net carrying value once the credit provision is greater than 90% of the notional amount, unless repayment is anticipated to occur within the next three months. Following the expiration of this three-month period the position is written off unless it can be demonstrated that any delay in payment is an operational matter which is expected to be resolved within a ten-day grace period. In the Group’s recovery management functions for the Swiss Bank and Wealth Manage-ment, write-offs are made based on an individual counterparty assessment. An evaluation is performed on the need for write-offs on impaired loans individually and on an ongoing basis, if it is likely that parts of a loan or the entire loan will not be recoverable. Write-offs of residual loan balances are executed once available debt enforcement procedures are exhausted or, in certain cases, upon a restructuring.
Collateral-dependentfinancialassets
The Group’s collateral-dependent financial assets are managed by a global recovery management function which is divisionally aligned to cover the Investment Bank, Wealth Management and the Swiss Bank.
Collateral-dependent financial assets managed by the recov-ery management function covering the Investment Bank mainly include mortgages, revolving corporate loans, securities borrow-ing, trade finance exposures and lombard loans. For mortgages, property, guarantees and life insurance policies are the main collateral types. For revolving corporate loans, collateral includes mainly cash, inventory, oil and gas reserves and receivables.
Securities borrowing exposures are mainly secured by pledged shares, bonds, investment fund units and money market instru-ments. Trade finance exposures are secured by cash and guaran-tees. For lombard loans, the Group holds collateral in the form of pledged shares, bonds, investment fund units and money market instruments as well as cash and life insurance policies. The over-all collateral coverage ratio decreased from 92% as of the end of 4Q21 to 90% as of the end of 1Q22, mainly reflecting repay-ments of several fully collateralized European mortgages.
Collateral-dependent financial assets managed by the recovery management function for Wealth Management mainly include ship finance exposures, commercial loans, lombard loans, resi-dential mortgages as well as aviation and yacht finance expo-sures. Ship finance exposures are collateralized by vessel mort-gages, corporate guarantees, insurance assignments as well as cash balances, securities deposits or other assets held with the Group. Collateral held against commercial loans include primarily guarantees issued by export credit agencies, other guarantees, private risk insurance, asset pledges and assets held with the Group (e.g., cash, securities deposits and others). Lombard loans are collateralized by pledged financial assets mainly in the form of cash, shares, bonds, investment fund units and money market instruments as well as life insurance policies and bank guaran-tees. Residential mortgages are secured by mortgage notes on residential real estate, life insurance policies as well as cash bal-ances, securities deposits or other assets held with the Group. Aviation and yacht finance exposures are collateralized by aircraft mortgages of business jets and vessel mortgages on yachts, respectively, as well as corporate and/or personal guarantees, cash balances, securities deposits or other assets held with the
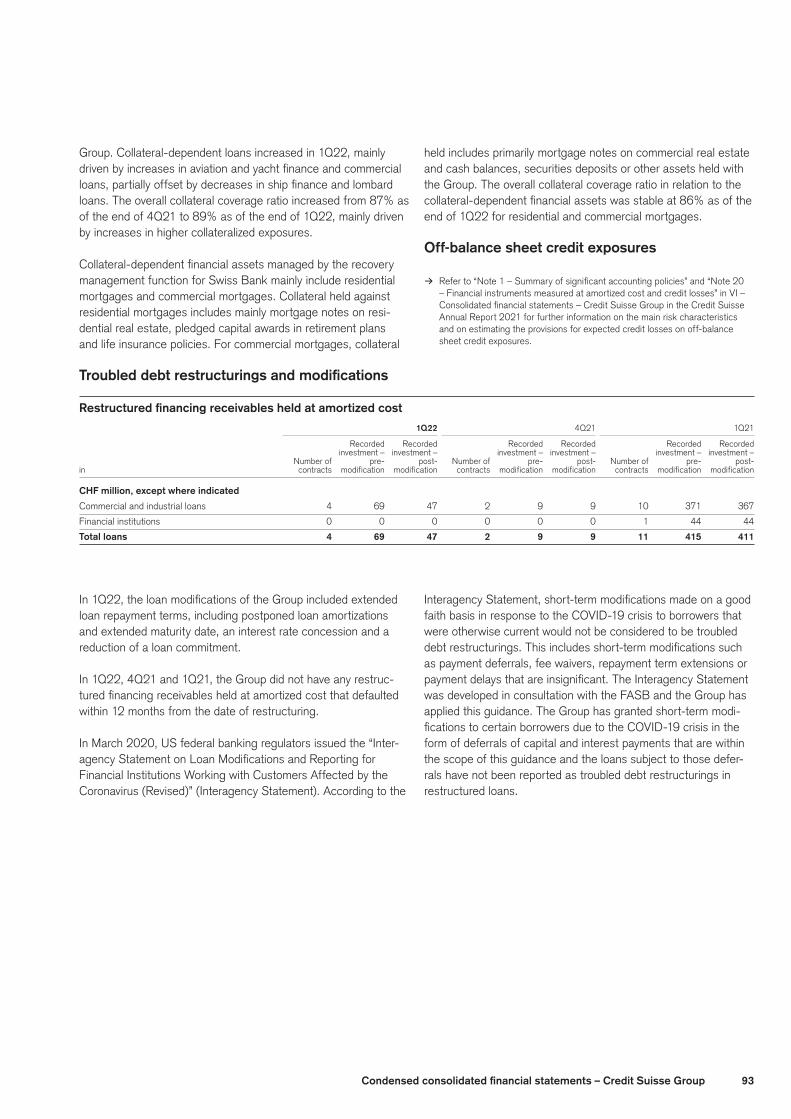
93Condensedconsolidatedfinancialstatements–CreditSuisseGroup
Group. Collateral-dependent loans increased in 1Q22, mainly driven by increases in aviation and yacht finance and commercial loans, partially offset by decreases in ship finance and lombard loans. The overall collateral coverage ratio increased from 87% as of the end of 4Q21 to 89% as of the end of 1Q22, mainly driven by increases in higher collateralized exposures.
Collateral-dependent financial assets managed by the recovery management function for Swiss Bank mainly include residential mortgages and commercial mortgages. Collateral held against residential mortgages includes mainly mortgage notes on resi-dential real estate, pledged capital awards in retirement plans and life insurance policies. For commercial mortgages, collateral
held includes primarily mortgage notes on commercial real estate and cash balances, securities deposits or other assets held with the Group. The overall collateral coverage ratio in relation to the collateral-dependent financial assets was stable at 86% as of the end of 1Q22 for residential and commercial mortgages.
Off-balance sheet credit exposures
> Refer to “Note 1 – Summary of significant accounting policies” and “Note 20 – Financial instruments measured at amortized cost and credit losses” in VI – Consolidated financial statements – Credit Suisse Group in the Credit Suisse Annual Report 2021 for further information on the main risk characteristics and on estimating the provisions for expected credit losses on off-balance sheet credit exposures.
Troubleddebtrestructuringsandmodifications
Restructuredfinancingreceivablesheldatamortizedcost 1Q22 4Q21 1Q21
Recorded Recorded Recorded Recorded Recorded Recorded investment – investment – investment – investment – investment – investment – Number of pre- post- Number of pre- post- Number of pre- post-
in contracts modification modification contracts modification modification contracts modification modification
CHFmillion,exceptwhereindicated
Commercial and industrial loans 4 69 47 2 9 9 10 371 367
Financial institutions 0 0 0 0 0 0 1 44 44
Total loans 4 69 47 2 9 9 11 415 411
In 1Q22, the loan modifications of the Group included extended loan repayment terms, including postponed loan amortizations and extended maturity date, an interest rate concession and a reduction of a loan commitment.
In 1Q22, 4Q21 and 1Q21, the Group did not have any restruc-tured financing receivables held at amortized cost that defaulted within 12 months from the date of restructuring.
In March 2020, US federal banking regulators issued the “Inter-agency Statement on Loan Modifications and Reporting for Financial Institutions Working with Customers Affected by the Coronavirus (Revised)” (Interagency Statement). According to the
Interagency Statement, short-term modifications made on a good faith basis in response to the COVID-19 crisis to borrowers that were otherwise current would not be considered to be troubled debt restructurings. This includes short-term modifications such as payment deferrals, fee waivers, repayment term extensions or payment delays that are insignificant. The Interagency Statement was developed in consultation with the FASB and the Group has applied this guidance. The Group has granted short-term modi-fications to certain borrowers due to the COVID-19 crisis in the form of deferrals of capital and interest payments that are within the scope of this guidance and the loans subject to those defer-rals have not been reported as troubled debt restructurings in restructured loans.
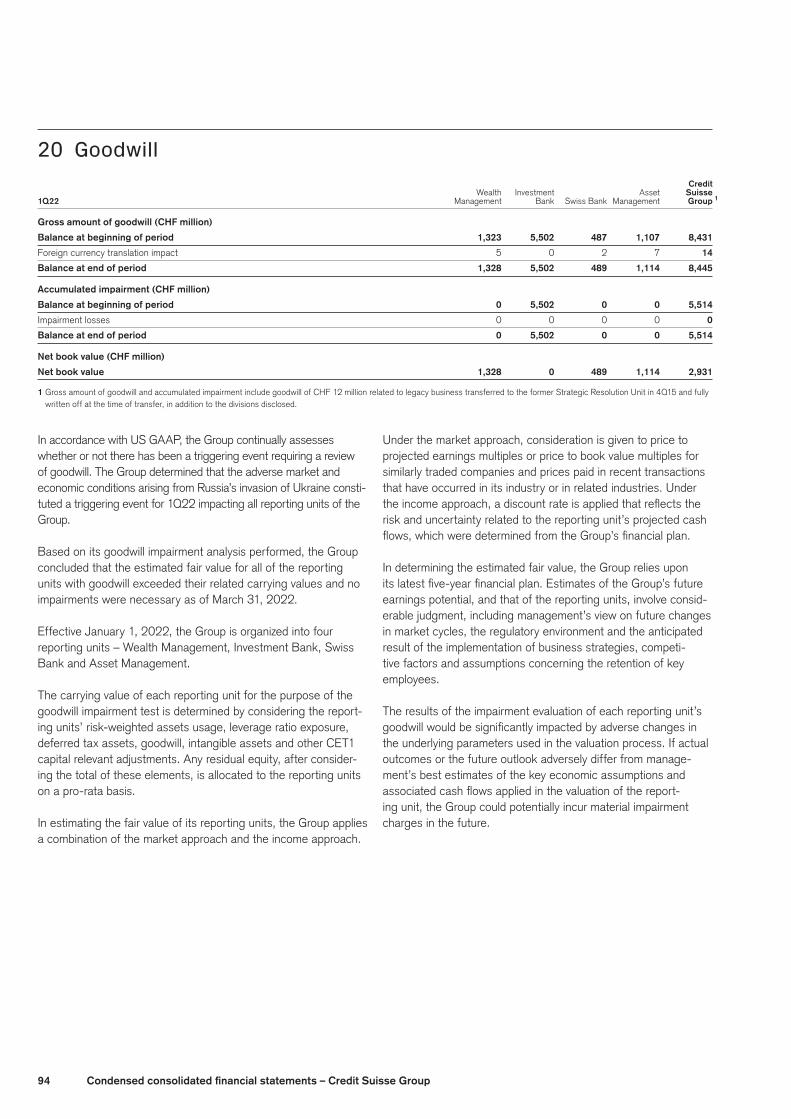
94 Condensedconsolidatedfinancialstatements–CreditSuisseGroup
20 Goodwill Credit Wealth Investment Asset Suisse
1Q22 Management Bank Swiss Bank Management Group 1
Grossamountofgoodwill(CHFmillion)
Balance at beginning of period 1,323 5,502 487 1,107 8,431
Foreign currency translation impact 5 0 2 7 14
Balance at end of period 1,328 5,502 489 1,114 8,445
Accumulatedimpairment(CHFmillion)
Balance at beginning of period 0 5,502 0 0 5,514
Impairment losses 0 0 0 0 0
Balance at end of period 0 5,502 0 0 5,514
Netbookvalue(CHFmillion)
Netbookvalue 1,328 0 489 1,114 2,931
1 Gross amount of goodwill and accumulated impairment include goodwill of CHF 12 million related to legacy business transferred to the former Strategic Resolution Unit in 4Q15 and fully written off at the time of transfer, in addition to the divisions disclosed.
In accordance with US GAAP, the Group continually assesses whether or not there has been a triggering event requiring a review of goodwill. The Group determined that the adverse market and economic conditions arising from Russia’s invasion of Ukraine consti-tuted a triggering event for 1Q22 impacting all reporting units of the Group.
Based on its goodwill impairment analysis performed, the Group concluded that the estimated fair value for all of the reporting units with goodwill exceeded their related carrying values and no impairments were necessary as of March 31, 2022.
Effective January 1, 2022, the Group is organized into four reporting units – Wealth Management, Investment Bank, Swiss Bank and Asset Management.
The carrying value of each reporting unit for the purpose of the goodwill impairment test is determined by considering the report-ing units’ risk-weighted assets usage, leverage ratio exposure, deferred tax assets, goodwill, intangible assets and other CET1 capital relevant adjustments. Any residual equity, after consider-ing the total of these elements, is allocated to the reporting units on a pro-rata basis.
In estimating the fair value of its reporting units, the Group applies a combination of the market approach and the income approach.
Under the market approach, consideration is given to price to projected earnings multiples or price to book value multiples for similarly traded companies and prices paid in recent transactions that have occurred in its industry or in related industries. Under the income approach, a discount rate is applied that reflects the risk and uncertainty related to the reporting unit’s projected cash flows, which were determined from the Group’s financial plan.
In determining the estimated fair value, the Group relies upon its latest five-year financial plan. Estimates of the Group’s future earnings potential, and that of the reporting units, involve consid-erable judgment, including management’s view on future changes in market cycles, the regulatory environment and the anticipated result of the implementation of business strategies, competi-tive factors and assumptions concerning the retention of key employees.
The results of the impairment evaluation of each reporting unit’s goodwill would be significantly impacted by adverse changes in the underlying parameters used in the valuation process. If actual outcomes or the future outlook adversely differ from manage-ment’s best estimates of the key economic assumptions and associated cash flows applied in the valuation of the report-ing unit, the Group could potentially incur material impairment charges in the future.
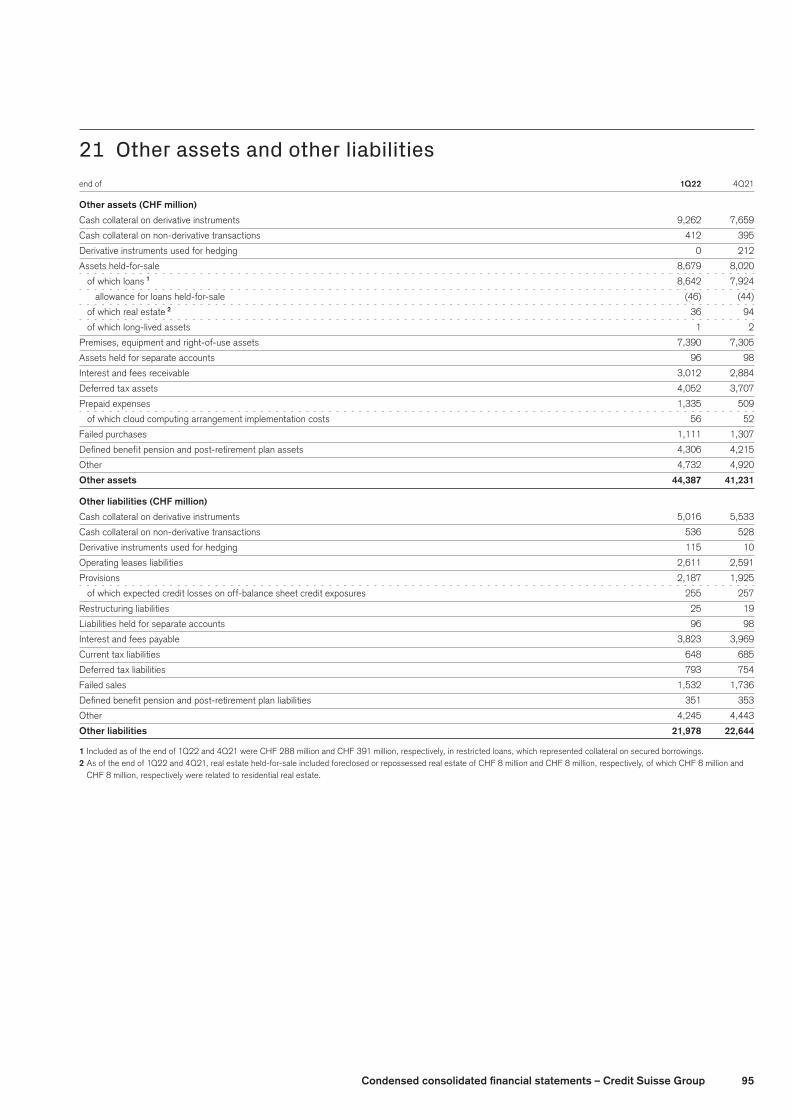
95Condensedconsolidatedfinancialstatements–CreditSuisseGroup
21 Other assets and other liabilitiesend of 1Q22 4Q21
Otherassets(CHFmillion)
Cash collateral on derivative instruments 9,262 7,659
Cash collateral on non-derivative transactions 412 395
Derivative instruments used for hedging 0 212
Assets held-for-sale 8,679 8,020
of which loans 1 8,642 7,924
allowance for loans held-for-sale (46) (44)
of which real estate 2 36 94
of which long-lived assets 1 2
Premises, equipment and right-of-use assets 7,390 7,305
Assets held for separate accounts 96 98
Interest and fees receivable 3,012 2,884
Deferred tax assets 4,052 3,707
Prepaid expenses 1,335 509
of which cloud computing arrangement implementation costs 56 52
Failed purchases 1,111 1,307
Defined benefit pension and post-retirement plan assets 4,306 4,215
Other 4,732 4,920
Other assets 44,387 41,231
Otherliabilities(CHFmillion)
Cash collateral on derivative instruments 5,016 5,533
Cash collateral on non-derivative transactions 536 528
Derivative instruments used for hedging 115 10
Operating leases liabilities 2,611 2,591
Provisions 2,187 1,925
of which expected credit losses on off-balance sheet credit exposures 255 257
Restructuring liabilities 25 19
Liabilities held for separate accounts 96 98
Interest and fees payable 3,823 3,969
Current tax liabilities 648 685
Deferred tax liabilities 793 754
Failed sales 1,532 1,736
Defined benefit pension and post-retirement plan liabilities 351 353
Other 4,245 4,443
Other liabilities 21,978 22,644
1 Included as of the end of 1Q22 and 4Q21 were CHF 288 million and CHF 391 million, respectively, in restricted loans, which represented collateral on secured borrowings.2 As of the end of 1Q22 and 4Q21, real estate held-for-sale included foreclosed or repossessed real estate of CHF 8 million and CHF 8 million, respectively, of which CHF 8 million and
CHF 8 million, respectively were related to residential real estate.
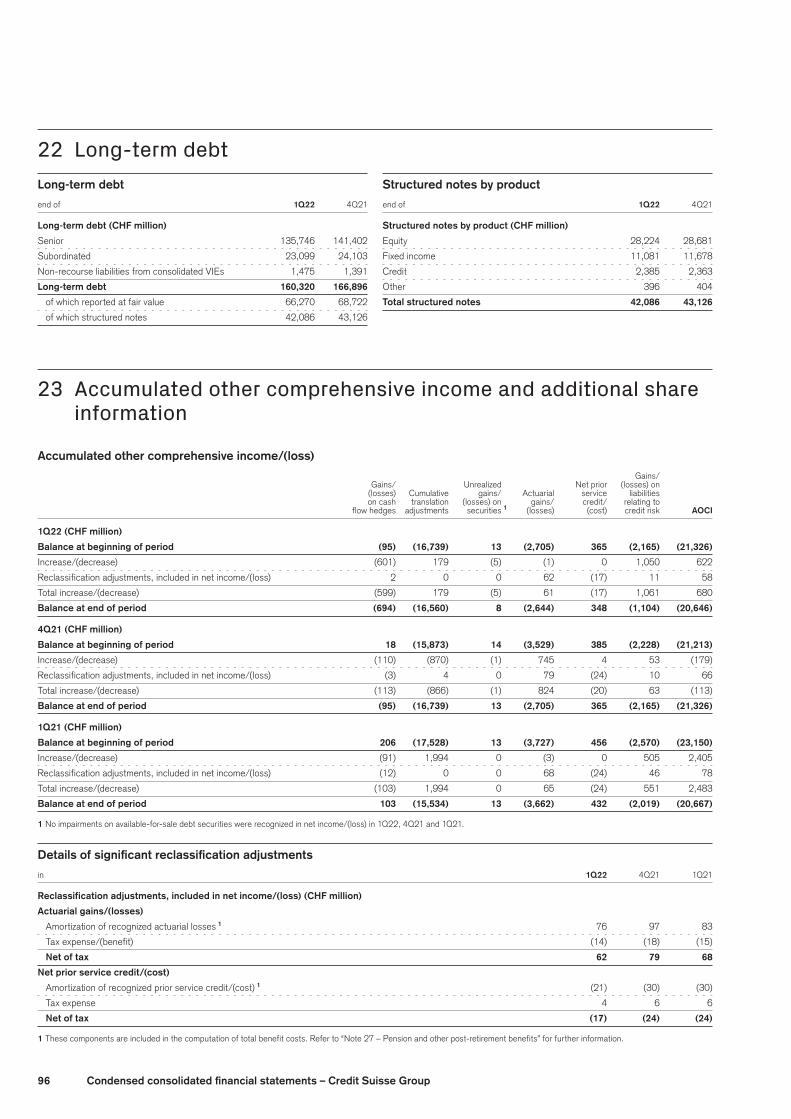
96 Condensedconsolidatedfinancialstatements–CreditSuisseGroup
22 Long-term debtLong-termdebt
end of 1Q22 4Q21
Long-termdebt(CHFmillion)
Senior 135,746 141,402
Subordinated 23,099 24,103
Non-recourse liabilities from consolidated VIEs 1,475 1,391
Long-termdebt 160,320 166,896
of which reported at fair value 66,270 68,722
of which structured notes 42,086 43,126
Structurednotesbyproduct
end of 1Q22 4Q21
Structurednotesbyproduct(CHFmillion)
Equity 28,224 28,681
Fixed income 11,081 11,678
Credit 2,385 2,363
Other 396 404
Total structured notes 42,086 43,126
23 Accumulated other comprehensive income and additional share information
Accumulatedothercomprehensiveincome/(loss) Gains/ Gains/ Unrealized Net prior (losses) on (losses) Cumulative gains/ Actuarial service liabilities on cash translation (losses) on gains/ credit/ relating to flow hedges adjustments securities 1 (losses) (cost) credit risk AOCI
1Q22(CHFmillion)
Balance at beginning of period (95) (16,739) 13 (2,705) 365 (2,165) (21,326)
Increase/(decrease) (601) 179 (5) (1) 0 1,050 622
Reclassification adjustments, included in net income/(loss) 2 0 0 62 (17) 11 58
Total increase/(decrease) (599) 179 (5) 61 (17) 1,061 680
Balance at end of period (694) (16,560) 8 (2,644) 348 (1,104) (20,646)
4Q21(CHFmillion)
Balance at beginning of period 18 (15,873) 14 (3,529) 385 (2,228) (21,213)
Increase/(decrease) (110) (870) (1) 745 4 53 (179)
Reclassification adjustments, included in net income/(loss) (3) 4 0 79 (24) 10 66
Total increase/(decrease) (113) (866) (1) 824 (20) 63 (113)
Balance at end of period (95) (16,739) 13 (2,705) 365 (2,165) (21,326)
1Q21(CHFmillion)
Balance at beginning of period 206 (17,528) 13 (3,727) 456 (2,570) (23,150)
Increase/(decrease) (91) 1,994 0 (3) 0 505 2,405
Reclassification adjustments, included in net income/(loss) (12) 0 0 68 (24) 46 78
Total increase/(decrease) (103) 1,994 0 65 (24) 551 2,483
Balance at end of period 103 (15,534) 13 (3,662) 432 (2,019) (20,667)
1 No impairments on available-for-sale debt securities were recognized in net income/(loss) in 1Q22, 4Q21 and 1Q21.
Detailsofsignificantreclassificationadjustments
in 1Q22 4Q21 1Q21
Reclassificationadjustments,includedinnetincome/(loss)(CHFmillion)
Actuarialgains/(losses)
Amortization of recognized actuarial losses 1 76 97 83
Tax expense/(benefit) (14) (18) (15)
Netoftax 62 79 68
Netpriorservicecredit/(cost)
Amortization of recognized prior service credit/(cost) 1 (21) (30) (30)
Tax expense 4 6 6
Netoftax (17) (24) (24)
1 These components are included in the computation of total benefit costs. Refer to “Note 27 – Pension and other post-retirement benefits” for further information.
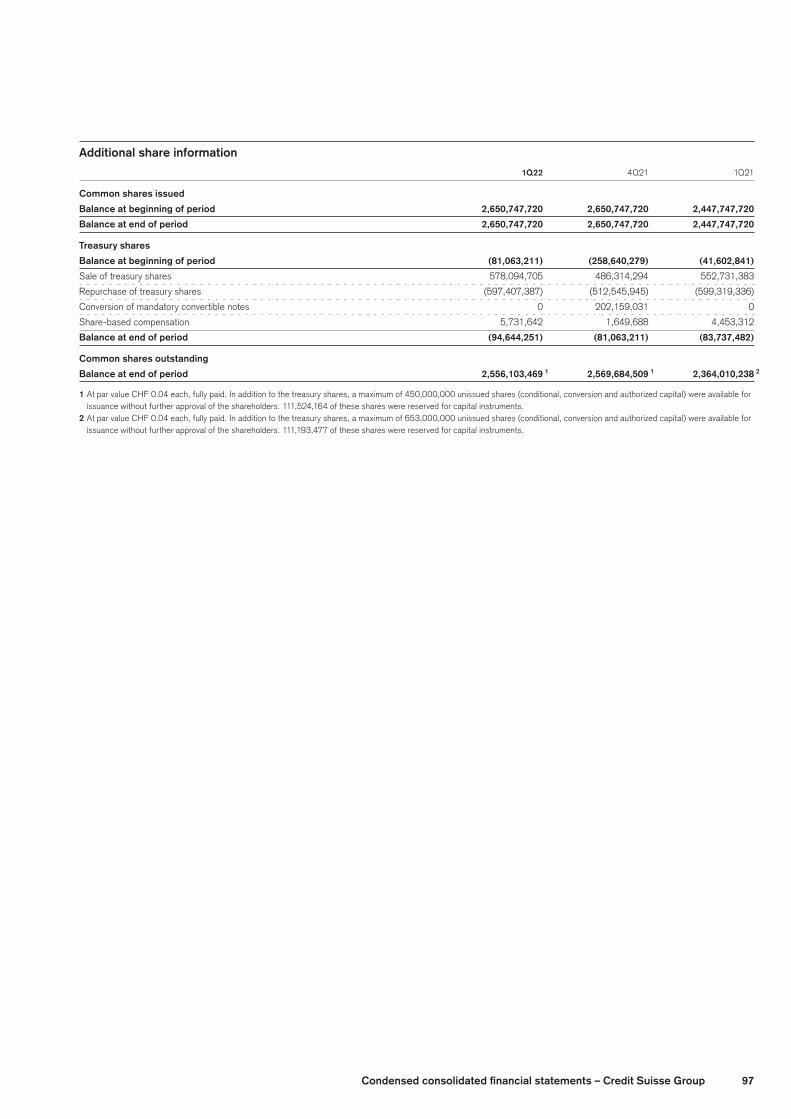
97Condensedconsolidatedfinancialstatements–CreditSuisseGroup
Additionalshareinformation 1Q22 4Q21 1Q21
Commonsharesissued
Balance at beginning of period 2,650,747,720 2,650,747,720 2,447,747,720
Balance at end of period 2,650,747,720 2,650,747,720 2,447,747,720
Treasury shares
Balance at beginning of period (81,063,211) (258,640,279) (41,602,841)
Sale of treasury shares 578,094,705 486,314,294 552,731,383
Repurchase of treasury shares (597,407,387) (512,545,945) (599,319,336)
Conversion of mandatory convertible notes 0 202,159,031 0
Share-based compensation 5,731,642 1,649,688 4,453,312
Balance at end of period (94,644,251) (81,063,211) (83,737,482)
Commonsharesoutstanding
Balance at end of period 2,556,103,469 1 2,569,684,509 1 2,364,010,238 2
1 At par value CHF 0.04 each, fully paid. In addition to the treasury shares, a maximum of 450,000,000 unissued shares (conditional, conversion and authorized capital) were available for issuance without further approval of the shareholders. 111,524,164 of these shares were reserved for capital instruments.
2 At par value CHF 0.04 each, fully paid. In addition to the treasury shares, a maximum of 653,000,000 unissued shares (conditional, conversion and authorized capital) were available for issuance without further approval of the shareholders. 111,193,477 of these shares were reserved for capital instruments.
98 Condensedconsolidatedfinancialstatements–CreditSuisseGroup
24 Offsetting of financial assets and financial liabilities The disclosures set out in the tables below include derivatives, reverse repurchase and repurchase agreements, and securities lending and borrowing transactions that:p are offset in the Group’s consolidated balance sheets; orp are subject to an enforceable master netting agreement or
similar agreement (enforceable master netting agreements), irrespective of whether they are offset in the Group’s consoli-dated balance sheets.
Similar agreements include derivative clearing agreements, global master repurchase agreements and global master securities lend-ing agreements.
Derivatives
The Group transacts bilateral over-the-counter (OTC) deriva-tives (OTC derivatives) mainly under International Swaps and Derivatives Association (ISDA) Master Agreements and Swiss Master Agreements for OTC derivative instruments. These agree-ments provide for the net settlement of all transactions under the agreement through a single payment in the event of default or termination under the agreement. They allow the Group to off-set balances from derivative assets and liabilities as well as the receivables and payables to related cash collateral transacted with the same counterparty. Collateral for OTC derivatives is received and provided in the form of cash and marketable secu-rities. Such collateral may be subject to the standard industry terms of an ISDA Credit Support Annex. The terms of an ISDA Credit Support Annex provide that securities received or provided as collateral may be pledged or sold during the term of the trans-actions and must be returned upon maturity of the transaction. These terms also give each counterparty the right to terminate the related transactions upon the other counterparty’s failure to post collateral. Financial collateral received or pledged for OTC derivatives may also be subject to collateral agreements which restrict the use of financial collateral.
For derivatives transacted with exchanges (exchange-traded derivatives) and central clearing counterparties (OTC-cleared derivatives), positive and negative replacement values (PRV/NRV) and related cash collateral may be offset if the terms of the rules and regulations governing these exchanges and central clearing counterparties permit such netting and offset.
Where no such agreements or terms exist, fair values are recorded on a gross basis.
Exchange-traded derivatives or OTC-cleared derivatives, which are fully margined and for which the daily margin payments con-stitute settlement of the outstanding exposure, are not included in the offsetting disclosures because they are not subject to off-setting due to the daily settlement. The daily margin payments, which are not settled until the next settlement cycle is conducted, are presented in brokerage receivables or brokerage payables. The notional amount for these daily settled derivatives is included in the fair value of derivative instruments table in “Note 28 – Derivatives and hedging activities”.
Under US GAAP, the Group elected to account for substantially all financial instruments with an embedded derivative that is not considered clearly and closely related to the host contract at fair value. There is an exception for certain bifurcatable hybrid debt instruments which the Group did not elect to account for at fair value. However, these bifurcated embedded derivatives are gen-erally not subject to enforceable master netting agreements and are not recorded as derivative instruments under trading assets and liabilities or other assets and other liabilities. Information on bifurcated embedded derivatives has therefore not been included in the offsetting disclosures.
The following table presents the gross amount of derivatives sub-ject to enforceable master netting agreements by contract and transaction type, the amount of offsetting, the amount of deriva-tives not subject to enforceable master netting agreements and the net amount presented in the consolidated balance sheets.
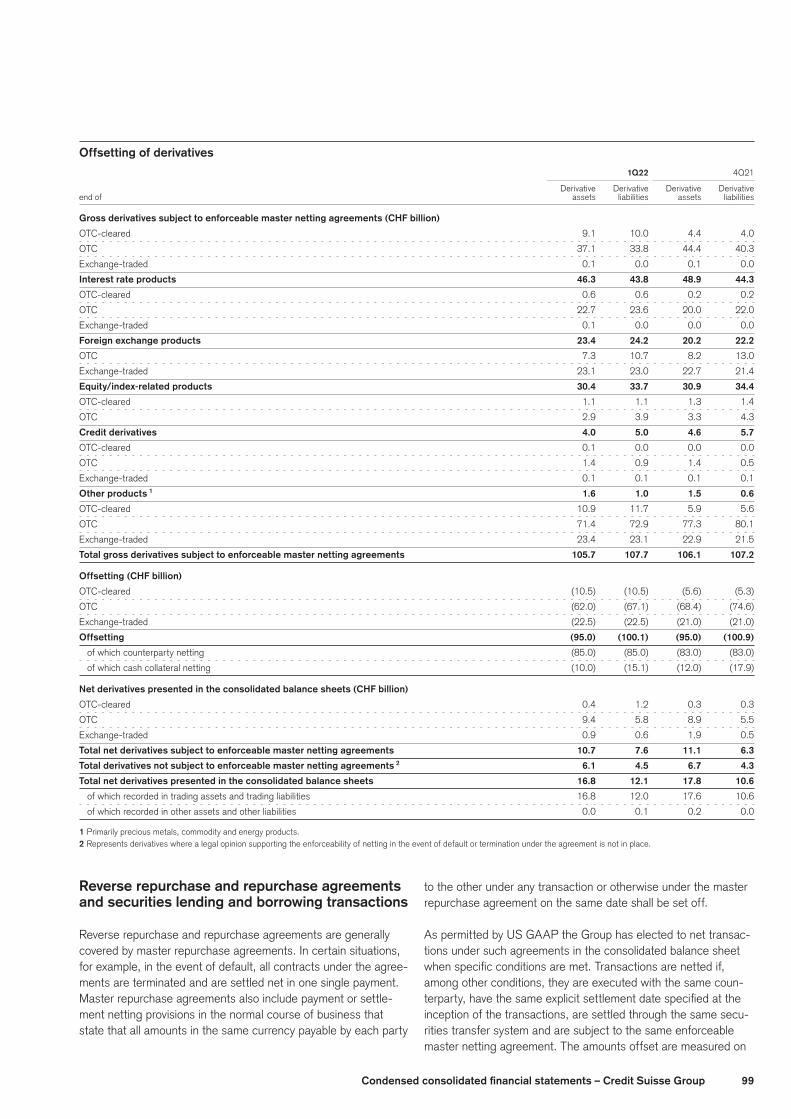
99Condensedconsolidatedfinancialstatements–CreditSuisseGroup
Offsetting of derivatives 1Q22 4Q21
Derivative Derivative Derivative Derivative
end of assets liabilities assets liabilities
Grossderivativessubjecttoenforceablemasternettingagreements(CHFbillion)
OTC-cleared 9.1 10.0 4.4 4.0
OTC 37.1 33.8 44.4 40.3
Exchange-traded 0.1 0.0 0.1 0.0
Interest rate products 46.3 43.8 48.9 44.3
OTC-cleared 0.6 0.6 0.2 0.2
OTC 22.7 23.6 20.0 22.0
Exchange-traded 0.1 0.0 0.0 0.0
Foreignexchangeproducts 23.4 24.2 20.2 22.2
OTC 7.3 10.7 8.2 13.0
Exchange-traded 23.1 23.0 22.7 21.4
Equity/index-relatedproducts 30.4 33.7 30.9 34.4
OTC-cleared 1.1 1.1 1.3 1.4
OTC 2.9 3.9 3.3 4.3
Credit derivatives 4.0 5.0 4.6 5.7
OTC-cleared 0.1 0.0 0.0 0.0
OTC 1.4 0.9 1.4 0.5
Exchange-traded 0.1 0.1 0.1 0.1
Other products 1 1.6 1.0 1.5 0.6
OTC-cleared 10.9 11.7 5.9 5.6
OTC 71.4 72.9 77.3 80.1
Exchange-traded 23.4 23.1 22.9 21.5
Totalgrossderivativessubjecttoenforceablemasternettingagreements 105.7 107.7 106.1 107.2
Offsetting(CHFbillion)
OTC-cleared (10.5) (10.5) (5.6) (5.3)
OTC (62.0) (67.1) (68.4) (74.6)
Exchange-traded (22.5) (22.5) (21.0) (21.0)
Offsetting (95.0) (100.1) (95.0) (100.9)
of which counterparty netting (85.0) (85.0) (83.0) (83.0)
of which cash collateral netting (10.0) (15.1) (12.0) (17.9)
Netderivativespresentedintheconsolidatedbalancesheets(CHFbillion)
OTC-cleared 0.4 1.2 0.3 0.3
OTC 9.4 5.8 8.9 5.5
Exchange-traded 0.9 0.6 1.9 0.5
Totalnetderivativessubjecttoenforceablemasternettingagreements 10.7 7.6 11.1 6.3
Totalderivativesnotsubjecttoenforceablemasternettingagreements 2 6.1 4.5 6.7 4.3
Total net derivatives presented in the consolidated balance sheets 16.8 12.1 17.8 10.6
of which recorded in trading assets and trading liabilities 16.8 12.0 17.6 10.6
of which recorded in other assets and other liabilities 0.0 0.1 0.2 0.0
1 Primarily precious metals, commodity and energy products.2 Represents derivatives where a legal opinion supporting the enforceability of netting in the event of default or termination under the agreement is not in place.
Reverserepurchaseandrepurchaseagreementsandsecuritieslendingandborrowingtransactions
Reverse repurchase and repurchase agreements are generally covered by master repurchase agreements. In certain situations, for example, in the event of default, all contracts under the agree-ments are terminated and are settled net in one single payment. Master repurchase agreements also include payment or settle-ment netting provisions in the normal course of business that state that all amounts in the same currency payable by each party
to the other under any transaction or otherwise under the master repurchase agreement on the same date shall be set off.
As permitted by US GAAP the Group has elected to net transac-tions under such agreements in the consolidated balance sheet when specific conditions are met. Transactions are netted if, among other conditions, they are executed with the same coun-terparty, have the same explicit settlement date specified at the inception of the transactions, are settled through the same secu-rities transfer system and are subject to the same enforceable master netting agreement. The amounts offset are measured on
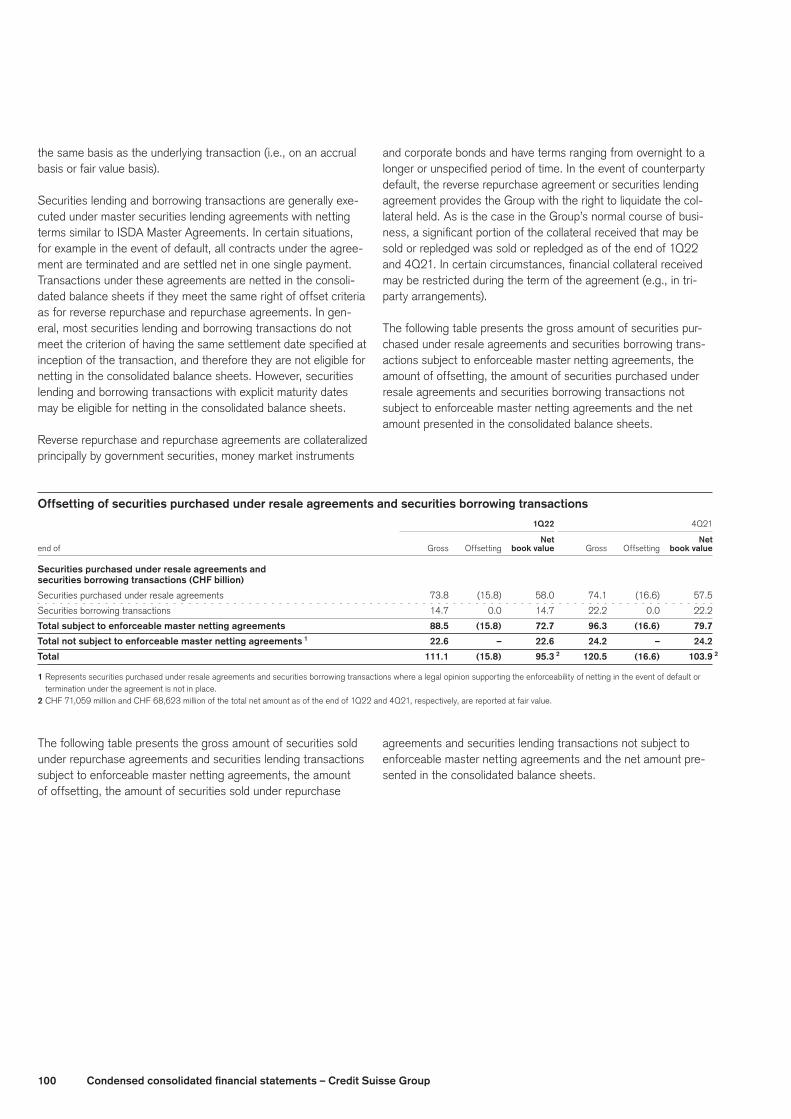
100 Condensedconsolidatedfinancialstatements–CreditSuisseGroup
the same basis as the underlying transaction (i.e., on an accrual basis or fair value basis).
Securities lending and borrowing transactions are generally exe-cuted under master securities lending agreements with netting terms similar to ISDA Master Agreements. In certain situations, for example in the event of default, all contracts under the agree-ment are terminated and are settled net in one single payment. Transactions under these agreements are netted in the consoli-dated balance sheets if they meet the same right of offset criteria as for reverse repurchase and repurchase agreements. In gen-eral, most securities lending and borrowing transactions do not meet the criterion of having the same settlement date specified at inception of the transaction, and therefore they are not eligible for netting in the consolidated balance sheets. However, securities lending and borrowing transactions with explicit maturity dates may be eligible for netting in the consolidated balance sheets.
Reverse repurchase and repurchase agreements are collateralized principally by government securities, money market instruments
and corporate bonds and have terms ranging from overnight to a longer or unspecified period of time. In the event of counterparty default, the reverse repurchase agreement or securities lending agreement provides the Group with the right to liquidate the col-lateral held. As is the case in the Group’s normal course of busi-ness, a significant portion of the collateral received that may be sold or repledged was sold or repledged as of the end of 1Q22 and 4Q21. In certain circumstances, financial collateral received may be restricted during the term of the agreement (e.g., in tri-party arrangements).
The following table presents the gross amount of securities pur-chased under resale agreements and securities borrowing trans-actions subject to enforceable master netting agreements, the amount of offsetting, the amount of securities purchased under resale agreements and securities borrowing transactions not subject to enforceable master netting agreements and the net amount presented in the consolidated balance sheets.
Offsettingofsecuritiespurchasedunderresaleagreementsandsecuritiesborrowingtransactions 1Q22 4Q21
Net Net end of Gross Offsetting bookvalue Gross Offsetting bookvalue
Securitiespurchasedunderresaleagreementsand
securitiesborrowingtransactions(CHFbillion)
Securities purchased under resale agreements 73.8 (15.8) 58.0 74.1 (16.6) 57.5
Securities borrowing transactions 14.7 0.0 14.7 22.2 0.0 22.2
Totalsubjecttoenforceablemasternettingagreements 88.5 (15.8) 72.7 96.3 (16.6) 79.7
Totalnotsubjecttoenforceablemasternettingagreements 1 22.6 – 22.6 24.2 – 24.2
Total 111.1 (15.8) 95.3 2 120.5 (16.6) 103.9 2
1 Represents securities purchased under resale agreements and securities borrowing transactions where a legal opinion supporting the enforceability of netting in the event of default or termination under the agreement is not in place.
2 CHF 71,059 million and CHF 68,623 million of the total net amount as of the end of 1Q22 and 4Q21, respectively, are reported at fair value.
The following table presents the gross amount of securities sold under repurchase agreements and securities lending transactions subject to enforceable master netting agreements, the amount of offsetting, the amount of securities sold under repurchase
agreements and securities lending transactions not subject to enforceable master netting agreements and the net amount pre-sented in the consolidated balance sheets.

101Condensedconsolidatedfinancialstatements–CreditSuisseGroup
Offsettingofsecuritiessoldunderrepurchaseagreementsandsecuritieslendingtransactions 1Q22 4Q21
Net Net end of Gross Offsetting bookvalue Gross Offsetting bookvalue
Securitiessoldunderrepurchaseagreementsand
securitieslendingtransactions(CHFbillion)
Securities sold under repurchase agreements 29.7 (15.8) 13.9 32.2 (16.6) 15.6
Securities lending transactions 8.8 0.0 8.8 15.4 0.0 15.4
Obligation to return securities received as collateral, at fair value 7.9 0.0 7.9 14.7 0.0 14.7
Totalsubjecttoenforceablemasternettingagreements 46.4 (15.8) 30.6 62.3 (16.6) 45.7
Totalnotsubjecttoenforceablemasternettingagreements 1 5.2 – 5.2 4.6 – 4.6
Total 51.6 (15.8) 35.8 66.9 (16.6) 50.3
of which securities sold under repurchase agreements and securities
lending transactions 43.5 (15.8) 27.7 2 51.9 (16.6) 35.3 2
of which obligation to return securities received as collateral, at fair value 8.1 0.0 8.1 15.0 0.0 15.0
1 Represents securities sold under repurchase agreements and securities lending transactions where a legal opinion supporting the enforceability of netting in the event of default or termi-nation under the agreement is not in place.
2 CHF 12,766 million and CHF 13,213 million of the total net amount as of the end of 1Q22 and 4Q21, respectively, are reported at fair value.
The following table presents the net amount presented in the consolidated balance sheets of financial assets and liabilities subject to enforceable master netting agreements and the gross amount of financial instruments and cash collateral not offset in the consolidated balance sheets. The table excludes derivatives, reverse repurchase and repurchase agreements and securities
lending and borrowing transactions not subject to enforceable master netting agreements where a legal opinion supporting the enforceability of netting in the event of default or termination under the agreement is not in place. Net exposure reflects risk mitigation in the form of collateral.
Amountsnotoffsetintheconsolidatedbalancesheets 1Q22 4Q21
Cash Cash collateral collateral Net Financial received/ Net Net Financial received/ Net end of book value instruments 1 pledged 1 exposure book value instruments 1 pledged 1 exposure
Financialassetssubjecttoenforceablemaster
nettingagreements(CHFbillion)
Derivatives 10.7 4.3 0.1 6.3 11.1 4.5 0.0 6.6
Securities purchased under resale agreements 58.0 58.0 0.0 0.0 57.5 57.5 0.0 0.0
Securities borrowing transactions 14.7 14.0 0.0 0.7 22.2 21.9 0.0 0.3
Totalfinancialassetssubjecttoenforceable
masternettingagreements 83.4 76.3 0.1 7.0 90.8 83.9 0.0 6.9
Financialliabilitiessubjecttoenforceablemaster
nettingagreements(CHFbillion)
Derivatives 7.6 2.9 0.0 4.7 6.3 1.3 0.0 5.0
Securities sold under repurchase agreements 13.9 13.8 0.1 0.0 15.6 15.5 0.1 0.0
Securities lending transactions 8.8 8.7 0.0 0.1 15.4 15.3 0.0 0.1
Obligation to return securities received as collateral, at fair value 7.9 7.5 0.0 0.4 14.7 13.0 0.0 1.7
Totalfinancialliabilitiessubjecttoenforceable
masternettingagreements 38.2 32.9 0.1 5.2 52.0 45.1 0.1 6.8
1 The total amount reported in financial instruments (recognized financial assets and financial liabilities and non-cash financial collateral) and cash collateral is limited to the amount of the related instruments presented in the consolidated balance sheets and therefore any over-collateralization of these positions is not included.
Net exposure is subject to further credit mitigation through the transfer of the exposure to other market counterparties by the use of credit default swaps and credit insurance contracts. Therefore,
the net exposure presented in the table above is not representa-tive of the Group’s counterparty exposure.
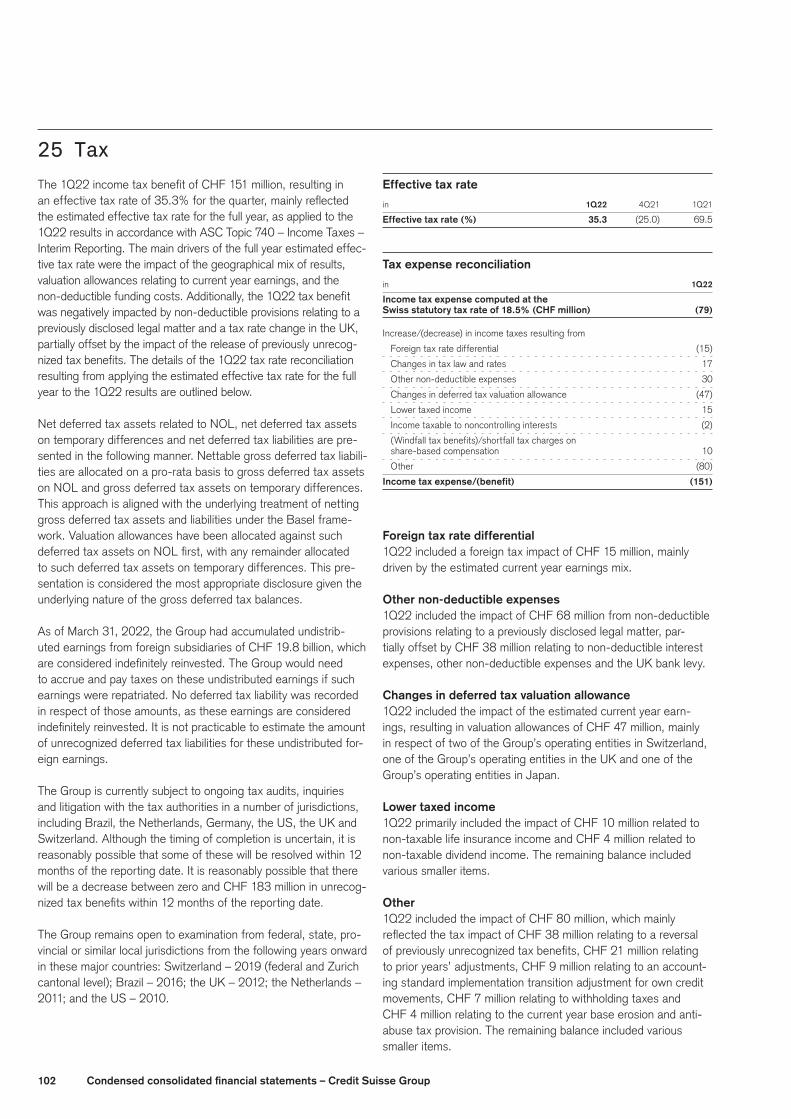
102 Condensedconsolidatedfinancialstatements–CreditSuisseGroup
25 TaxThe 1Q22 income tax benefit of CHF 151 million, resulting in an effective tax rate of 35.3% for the quarter, mainly reflected the estimated effective tax rate for the full year, as applied to the 1Q22 results in accordance with ASC Topic 740 – Income Taxes – Interim Reporting. The main drivers of the full year estimated effec-tive tax rate were the impact of the geographical mix of results, valuation allowances relating to current year earnings, and the non-deductible funding costs. Additionally, the 1Q22 tax benefit was negatively impacted by non-deductible provisions relating to a previously disclosed legal matter and a tax rate change in the UK, partially offset by the impact of the release of previously unrecog-nized tax benefits. The details of the 1Q22 tax rate reconciliation resulting from applying the estimated effective tax rate for the full year to the 1Q22 results are outlined below.
Net deferred tax assets related to NOL, net deferred tax assets on temporary differences and net deferred tax liabilities are pre-sented in the following manner. Nettable gross deferred tax liabili-ties are allocated on a pro-rata basis to gross deferred tax assets on NOL and gross deferred tax assets on temporary differences. This approach is aligned with the underlying treatment of netting gross deferred tax assets and liabilities under the Basel frame-work. Valuation allowances have been allocated against such deferred tax assets on NOL first, with any remainder allocated to such deferred tax assets on temporary differences. This pre-sentation is considered the most appropriate disclosure given the underlying nature of the gross deferred tax balances.
As of March 31, 2022, the Group had accumulated undistrib-uted earnings from foreign subsidiaries of CHF 19.8 billion, which are considered indefinitely reinvested. The Group would need to accrue and pay taxes on these undistributed earnings if such earnings were repatriated. No deferred tax liability was recorded in respect of those amounts, as these earnings are considered indefinitely reinvested. It is not practicable to estimate the amount of unrecognized deferred tax liabilities for these undistributed for-eign earnings.
The Group is currently subject to ongoing tax audits, inquiries and litigation with the tax authorities in a number of jurisdictions, including Brazil, the Netherlands, Germany, the US, the UK and Switzerland. Although the timing of completion is uncertain, it is reasonably possible that some of these will be resolved within 12 months of the reporting date. It is reasonably possible that there will be a decrease between zero and CHF 183 million in unrecog-nized tax benefits within 12 months of the reporting date.
The Group remains open to examination from federal, state, pro-vincial or similar local jurisdictions from the following years onward in these major countries: Switzerland – 2019 (federal and Zurich cantonal level); Brazil – 2016; the UK – 2012; the Netherlands – 2011; and the US – 2010.
Effective tax rate
in 1Q22 4Q21 1Q21
Effectivetaxrate(%) 35.3 (25.0) 69.5
Tax expense reconciliation
in 1Q22
Incometaxexpensecomputedatthe
Swissstatutorytaxrateof18.5%(CHFmillion) (79)
Increase/(decrease) in income taxes resulting from
Foreign tax rate differential (15)
Changes in tax law and rates 17
Other non-deductible expenses 30
Changes in deferred tax valuation allowance (47)
Lower taxed income 15
Income taxable to noncontrolling interests (2)
(Windfall tax benefits)/shortfall tax charges on
share-based compensation 10
Other (80)
Incometaxexpense/(benefit) (151)
Foreigntaxratedifferential1Q22 included a foreign tax impact of CHF 15 million, mainly driven by the estimated current year earnings mix.
Other non-deductible expenses1Q22 included the impact of CHF 68 million from non-deductible provisions relating to a previously disclosed legal matter, par-tially offset by CHF 38 million relating to non-deductible interest expenses, other non-deductible expenses and the UK bank levy.
Changesindeferredtaxvaluationallowance1Q22 included the impact of the estimated current year earn-ings, resulting in valuation allowances of CHF 47 million, mainly in respect of two of the Group’s operating entities in Switzerland, one of the Group’s operating entities in the UK and one of the Group’s operating entities in Japan.
Lowertaxedincome1Q22 primarily included the impact of CHF 10 million related to non-taxable life insurance income and CHF 4 million related to non-taxable dividend income. The remaining balance included various smaller items.
Other1Q22 included the impact of CHF 80 million, which mainly reflected the tax impact of CHF 38 million relating to a reversal of previously unrecognized tax benefits, CHF 21 million relating to prior years’ adjustments, CHF 9 million relating to an account-ing standard implementation transition adjustment for own credit movements, CHF 7 million relating to withholding taxes and CHF 4 million relating to the current year base erosion and anti-abuse tax provision. The remaining balance included various smaller items.
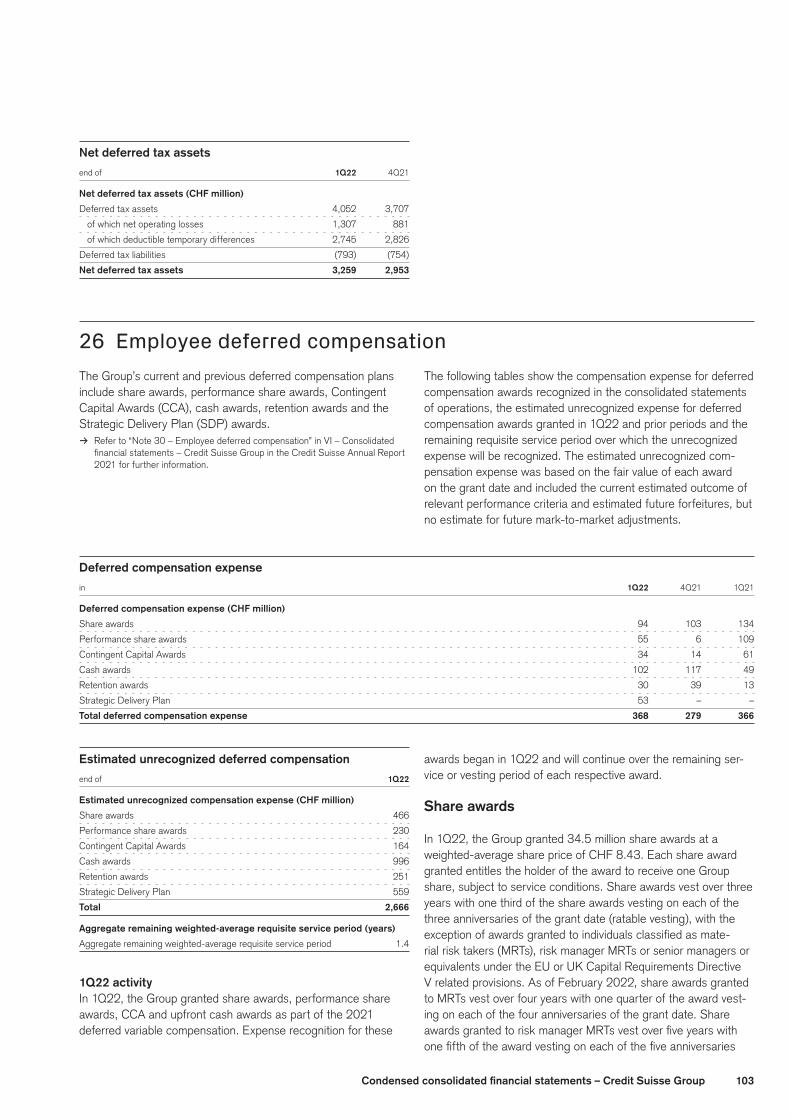
103Condensedconsolidatedfinancialstatements–CreditSuisseGroup
Net deferred tax assets
end of 1Q22 4Q21
Netdeferredtaxassets(CHFmillion)
Deferred tax assets 4,052 3,707
of which net operating losses 1,307 881
of which deductible temporary differences 2,745 2,826
Deferred tax liabilities (793) (754)
Net deferred tax assets 3,259 2,953
26 Employee deferred compensationThe Group’s current and previous deferred compensation plans include share awards, performance share awards, Contingent Capital Awards (CCA), cash awards, retention awards and the Strategic Delivery Plan (SDP) awards.
> Refer to “Note 30 – Employee deferred compensation” in VI – Consolidated financial statements – Credit Suisse Group in the Credit Suisse Annual Report 2021 for further information.
The following tables show the compensation expense for deferred compensation awards recognized in the consolidated statements of operations, the estimated unrecognized expense for deferred compensation awards granted in 1Q22 and prior periods and the remaining requisite service period over which the unrecognized expense will be recognized. The estimated unrecognized com-pensation expense was based on the fair value of each award on the grant date and included the current estimated outcome of relevant performance criteria and estimated future forfeitures, but no estimate for future mark-to-market adjustments.
Deferredcompensationexpense
in 1Q22 4Q21 1Q21
Deferredcompensationexpense(CHFmillion)
Share awards 94 103 134
Performance share awards 55 6 109
Contingent Capital Awards 34 14 61
Cash awards 102 117 49
Retention awards 30 39 13
Strategic Delivery Plan 53 – –
Totaldeferredcompensationexpense 368 279 366
Estimatedunrecognizeddeferredcompensation
end of 1Q22
Estimatedunrecognizedcompensationexpense(CHFmillion)
Share awards 466
Performance share awards 230
Contingent Capital Awards 164
Cash awards 996
Retention awards 251
Strategic Delivery Plan 559
Total 2,666
Aggregateremainingweighted-averagerequisiteserviceperiod(years)
Aggregate remaining weighted-average requisite service period 1.4
1Q22 activityIn 1Q22, the Group granted share awards, performance share awards, CCA and upfront cash awards as part of the 2021 deferred variable compensation. Expense recognition for these
awards began in 1Q22 and will continue over the remaining ser-vice or vesting period of each respective award.
Shareawards
In 1Q22, the Group granted 34.5 million share awards at a weighted-average share price of CHF 8.43. Each share award granted entitles the holder of the award to receive one Group share, subject to service conditions. Share awards vest over three years with one third of the share awards vesting on each of the three anniversaries of the grant date (ratable vesting), with the exception of awards granted to individuals classified as mate-rial risk takers (MRTs), risk manager MRTs or senior managers or equivalents under the EU or UK Capital Requirements Directive V related provisions. As of February 2022, share awards granted to MRTs vest over four years with one quarter of the award vest-ing on each of the four anniversaries of the grant date. Share awards granted to risk manager MRTs vest over five years with one fifth of the award vesting on each of the five anniversaries
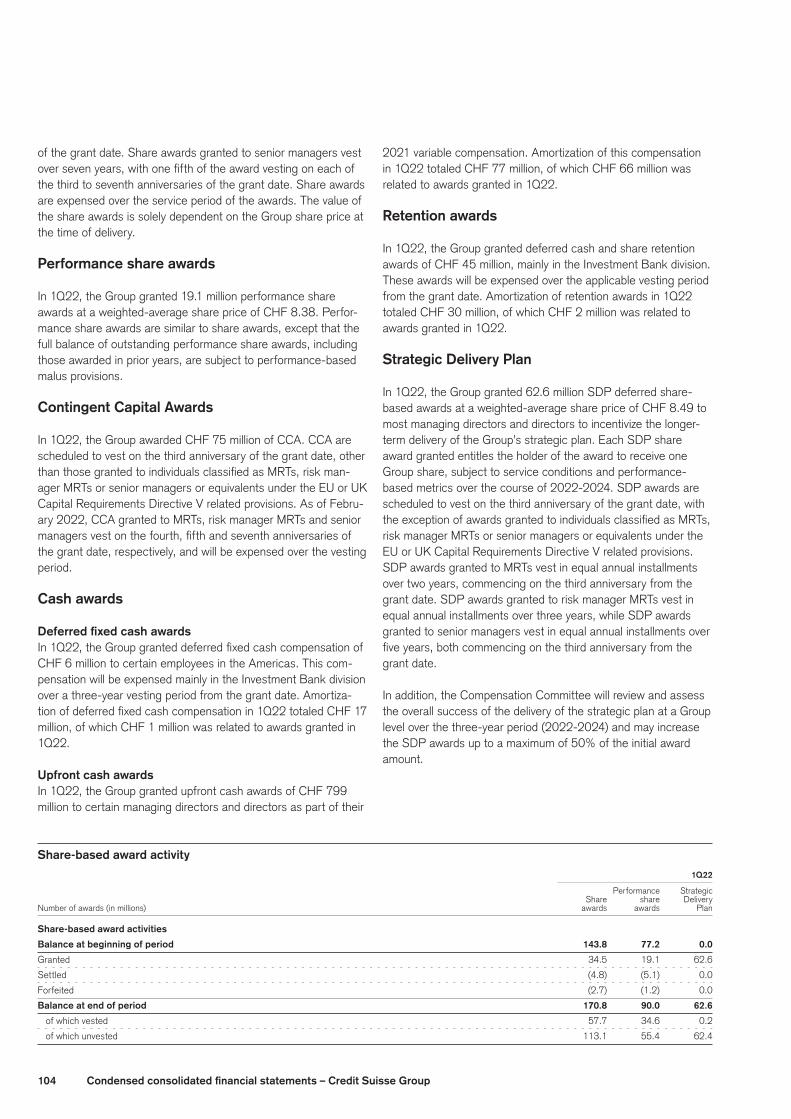
104 Condensedconsolidatedfinancialstatements–CreditSuisseGroup
of the grant date. Share awards granted to senior managers vest over seven years, with one fifth of the award vesting on each of the third to seventh anniversaries of the grant date. Share awards are expensed over the service period of the awards. The value of the share awards is solely dependent on the Group share price at the time of delivery.
Performanceshareawards
In 1Q22, the Group granted 19.1 million performance share awards at a weighted-average share price of CHF 8.38. Perfor-mance share awards are similar to share awards, except that the full balance of outstanding performance share awards, including those awarded in prior years, are subject to performance-based malus provisions.
ContingentCapitalAwards
In 1Q22, the Group awarded CHF 75 million of CCA. CCA are scheduled to vest on the third anniversary of the grant date, other than those granted to individuals classified as MRTs, risk man-ager MRTs or senior managers or equivalents under the EU or UK Capital Requirements Directive V related provisions. As of Febru-ary 2022, CCA granted to MRTs, risk manager MRTs and senior managers vest on the fourth, fifth and seventh anniversaries of the grant date, respectively, and will be expensed over the vesting period.
Cashawards
DeferredfixedcashawardsIn 1Q22, the Group granted deferred fixed cash compensation of CHF 6 million to certain employees in the Americas. This com-pensation will be expensed mainly in the Investment Bank division over a three-year vesting period from the grant date. Amortiza-tion of deferred fixed cash compensation in 1Q22 totaled CHF 17 million, of which CHF 1 million was related to awards granted in 1Q22.
UpfrontcashawardsIn 1Q22, the Group granted upfront cash awards of CHF 799 million to certain managing directors and directors as part of their
2021 variable compensation. Amortization of this compensation in 1Q22 totaled CHF 77 million, of which CHF 66 million was related to awards granted in 1Q22.
Retentionawards
In 1Q22, the Group granted deferred cash and share retention awards of CHF 45 million, mainly in the Investment Bank division. These awards will be expensed over the applicable vesting period from the grant date. Amortization of retention awards in 1Q22 totaled CHF 30 million, of which CHF 2 million was related to awards granted in 1Q22.
StrategicDeliveryPlan
In 1Q22, the Group granted 62.6 million SDP deferred share-based awards at a weighted-average share price of CHF 8.49 to most managing directors and directors to incentivize the longer-term delivery of the Group’s strategic plan. Each SDP share award granted entitles the holder of the award to receive one Group share, subject to service conditions and performance-based metrics over the course of 2022-2024. SDP awards are scheduled to vest on the third anniversary of the grant date, with the exception of awards granted to individuals classified as MRTs, risk manager MRTs or senior managers or equivalents under the EU or UK Capital Requirements Directive V related provisions. SDP awards granted to MRTs vest in equal annual installments over two years, commencing on the third anniversary from the grant date. SDP awards granted to risk manager MRTs vest in equal annual installments over three years, while SDP awards granted to senior managers vest in equal annual installments over five years, both commencing on the third anniversary from the grant date.
In addition, the Compensation Committee will review and assess the overall success of the delivery of the strategic plan at a Group level over the three-year period (2022-2024) and may increase the SDP awards up to a maximum of 50% of the initial award amount.
Share-basedawardactivity 1Q22
Performance Strategic Share share Delivery
Number of awards (in millions) awards awards Plan
Share-basedawardactivities
Balance at beginning of period 143.8 77.2 0.0
Granted 34.5 19.1 62.6
Settled (4.8) (5.1) 0.0
Forfeited (2.7) (1.2) 0.0
Balance at end of period 170.8 90.0 62.6
of which vested 57.7 34.6 0.2
of which unvested 113.1 55.4 62.4

105Condensedconsolidatedfinancialstatements–CreditSuisseGroup
27 Pension and other post-retirement benefitsThe Group sponsors defined contribution pension plans, defined benefit pension plans and other post-retirement defined ben-efit plans. The Group recognized expenses of CHF 63 million, CHF 71 million and CHF 70 million, related to its defined contri-bution pension plans in 1Q22, 4Q21 and 1Q21, respectively.
> Refer to “Note 32 – Pension and other post-retirement benefits” in VI – Con-solidated financial statements – Credit Suisse Group in the Credit Suisse Annual Report 2021 for further information.
The Group expects to contribute CHF 284 million to the Swiss and international defined benefit plans and other post-retirement defined benefit plans in 2022. As of the end of 1Q22, CHF 76 million of contributions have been made.
Componentsofnetperiodicbenefitcosts
in 1Q22 4Q21 1Q21
Netperiodicbenefitcosts/(credits)(CHFmillion)
Service costs on benefit obligation 65 60 60
Interest costs on benefit obligation 25 16 15
Expected return on plan assets (126) (121) (123)
Amortization of recognized prior service cost/(credit) (21) (30) (29)
Amortization of recognized actuarial losses 73 91 93
Settlement losses/(gains) 3 6 (10)
Curtailment losses/(gains) 0 0 (1)
Special termination benefits 1 1 10
Net periodic benefit costs 20 23 15
Service costs on benefit obligation are reflected in compensation and benefits. Other components of net periodic benefit costs are reflected in general and administrative expenses or in restructuring expenses.

106 Condensedconsolidatedfinancialstatements–CreditSuisseGroup
28 Derivatives and hedging activities > Refer to “Note 33 – Derivatives and hedging activities” in VI – Consolidated
financial statements – Credit Suisse Group in the Credit Suisse Annual Report 2021 for further information.
Fairvalueofderivativeinstruments
The tables below present gross derivative replacement values by type of contract and balance sheet location and whether the derivative is used for trading purposes or in a qualifying hedging
relationship. Notional amounts have also been provided as an indication of the volume of derivative activity within the Group.
Information on bifurcated embedded derivatives has not been included in these tables. Under US GAAP, the Group elected to account for substantially all financial instruments with an embed-ded derivative that is not considered clearly and closely related to the host contract at fair value.
> Refer to “Note 31 – Financial instruments” for further information.
Fairvalueofderivativeinstruments Trading Hedging 1
Positive Negative Positive Negative Notional replacement replacement Notional replacement replacement end of 1Q22 amount value (PRV) value (NRV) amount value (PRV) value (NRV)
Derivativeinstruments(CHFbillion)
Forwards and forward rate agreements 1,929.3 6.4 6.2 0.0 0.0 0.0
Swaps 9,074.5 31.5 28.2 130.7 0.1 0.9
Options bought and sold (OTC) 704.7 9.9 9.6 0.0 0.0 0.0
Futures 161.7 0.0 0.0 0.0 0.0 0.0
Options bought and sold (exchange-traded) 39.7 0.1 0.0 0.0 0.0 0.0
Interest rate products 11,909.9 47.9 44.0 130.7 0.1 0.9
Forwards 1,011.6 9.9 9.8 15.9 0.1 0.1
Swaps 346.2 11.8 12.6 0.0 0.0 0.0
Options bought and sold (OTC) 195.8 2.5 2.5 0.0 0.0 0.0
Futures 14.3 0.0 0.0 0.0 0.0 0.0
Options bought and sold (exchange-traded) 2.9 0.0 0.0 0.0 0.0 0.0
Foreignexchangeproducts 1,570.8 24.2 24.9 15.9 0.1 0.1
Forwards 1.1 0.1 0.1 0.0 0.0 0.0
Swaps 63.1 1.7 1.6 0.0 0.0 0.0
Options bought and sold (OTC) 232.5 8.4 10.9 0.0 0.0 0.0
Futures 45.4 0.0 0.0 0.0 0.0 0.0
Options bought and sold (exchange-traded) 552.0 23.2 23.0 0.0 0.0 0.0
Equity/index-relatedproducts 894.1 33.4 35.6 0.0 0.0 0.0
Credit derivatives 2 620.5 4.4 5.6 0.0 0.0 0.0
Forwards 12.9 0.1 0.1 0.0 0.0 0.0
Swaps 11.7 1.2 0.8 0.0 0.0 0.0
Options bought and sold (OTC) 11.2 0.2 0.1 0.0 0.0 0.0
Futures 14.4 0.0 0.0 0.0 0.0 0.0
Options bought and sold (exchange-traded) 11.4 0.2 0.1 0.0 0.0 0.0
Other products 3 61.6 1.7 1.1 0.0 0.0 0.0
Totalderivativeinstruments 15,056.9 111.6 111.2 146.6 0.2 1.0
The notional amount, PRV and NRV (trading and hedging) was CHF 15,203.5 billion, CHF 111.8 billion and CHF 112.2 billion, respectively, as of March 31, 2022.1 Relates to derivative contracts that qualify for hedge accounting under US GAAP.2 Primarily credit default swaps.3 Primarily precious metals, commodity and energy products.
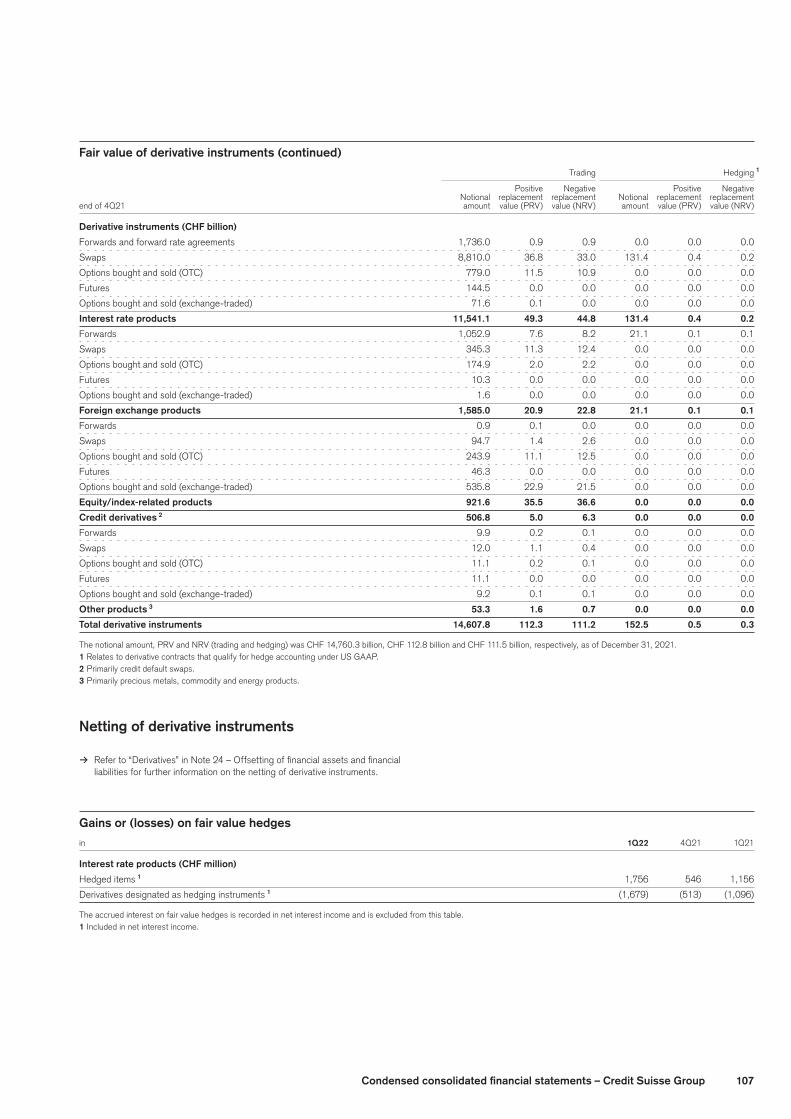
107Condensedconsolidatedfinancialstatements–CreditSuisseGroup
Fairvalueofderivativeinstruments(continued) Trading Hedging 1
Positive Negative Positive Negative Notional replacement replacement Notional replacement replacement end of 4Q21 amount value (PRV) value (NRV) amount value (PRV) value (NRV)
Derivativeinstruments(CHFbillion)
Forwards and forward rate agreements 1,736.0 0.9 0.9 0.0 0.0 0.0
Swaps 8,810.0 36.8 33.0 131.4 0.4 0.2
Options bought and sold (OTC) 779.0 11.5 10.9 0.0 0.0 0.0
Futures 144.5 0.0 0.0 0.0 0.0 0.0
Options bought and sold (exchange-traded) 71.6 0.1 0.0 0.0 0.0 0.0
Interest rate products 11,541.1 49.3 44.8 131.4 0.4 0.2
Forwards 1,052.9 7.6 8.2 21.1 0.1 0.1
Swaps 345.3 11.3 12.4 0.0 0.0 0.0
Options bought and sold (OTC) 174.9 2.0 2.2 0.0 0.0 0.0
Futures 10.3 0.0 0.0 0.0 0.0 0.0
Options bought and sold (exchange-traded) 1.6 0.0 0.0 0.0 0.0 0.0
Foreignexchangeproducts 1,585.0 20.9 22.8 21.1 0.1 0.1
Forwards 0.9 0.1 0.0 0.0 0.0 0.0
Swaps 94.7 1.4 2.6 0.0 0.0 0.0
Options bought and sold (OTC) 243.9 11.1 12.5 0.0 0.0 0.0
Futures 46.3 0.0 0.0 0.0 0.0 0.0
Options bought and sold (exchange-traded) 535.8 22.9 21.5 0.0 0.0 0.0
Equity/index-relatedproducts 921.6 35.5 36.6 0.0 0.0 0.0
Credit derivatives 2 506.8 5.0 6.3 0.0 0.0 0.0
Forwards 9.9 0.2 0.1 0.0 0.0 0.0
Swaps 12.0 1.1 0.4 0.0 0.0 0.0
Options bought and sold (OTC) 11.1 0.2 0.1 0.0 0.0 0.0
Futures 11.1 0.0 0.0 0.0 0.0 0.0
Options bought and sold (exchange-traded) 9.2 0.1 0.1 0.0 0.0 0.0
Other products 3 53.3 1.6 0.7 0.0 0.0 0.0
Totalderivativeinstruments 14,607.8 112.3 111.2 152.5 0.5 0.3
The notional amount, PRV and NRV (trading and hedging) was CHF 14,760.3 billion, CHF 112.8 billion and CHF 111.5 billion, respectively, as of December 31, 2021.1 Relates to derivative contracts that qualify for hedge accounting under US GAAP.2 Primarily credit default swaps.3 Primarily precious metals, commodity and energy products.
Nettingofderivativeinstruments
> Refer to “Derivatives” in Note 24 – Offsetting of financial assets and financial liabilities for further information on the netting of derivative instruments.
Gainsor(losses)onfairvaluehedges
in 1Q22 4Q21 1Q21
Interestrateproducts(CHFmillion)
Hedged items 1 1,756 546 1,156
Derivatives designated as hedging instruments 1 (1,679) (513) (1,096)
The accrued interest on fair value hedges is recorded in net interest income and is excluded from this table.1 Included in net interest income.

108 Condensedconsolidatedfinancialstatements–CreditSuisseGroup
Hedgeditemsinfairvaluehedges 3M22 3M21
Hedged items Hedged items
Carrying Hedging Discontinued Carrying Hedging Discontinued end of amount adjustments 1 hedges 2 amount adjustments 1 hedges 2
Assets(CHFbillion)
Investment securities 0.8 (0.1) 0.0 0.5 0.0 0.0
Net loans 18.6 (0.9) 0.1 22.7 (0.1) 0.5
Liabilities(CHFbillion)
Long-term debt 68.2 (1.6) (0.5) 72.2 0.9 0.4
1 Relates to the cumulative amount of fair value hedging adjustments included in the carrying amount.2 Relates to the cumulative amount of fair value hedging adjustments remaining for any hedged items for which hedge accounting has been discontinued.
Cashflowhedges
in 1Q22 4Q21 1Q21
Interestrateproducts(CHFmillion)
Gains/(losses) recognized in AOCI on derivatives (650) (163) (96)
Gains/(losses) reclassified from AOCI into interest and dividend income 4 1 3
Foreignexchangeproducts(CHFmillion)
Gains/(losses) recognized in AOCI on derivatives (14) 1 4
Total other operating expenses (6) 2 10
Gains/(losses) reclassified from AOCI into income (6) 2 10
Gains/(losses) excluded from the assessment of effectiveness reported in trading revenues 0 0 0
1 Related to the forward points of a foreign currency forward.
As of the end of 1Q22, the maximum length of time over which the Group hedged its exposure to the variability in future cash flows for forecasted transactions, excluding those forecasted transactions related to the payment of variable interest on existing financial instruments, was 12 months.
The net loss associated with cash flow hedges expected to be reclassified from AOCI within the next 12 months is CHF 275 million.
Netinvestmenthedges
in 1Q22 4Q21 1Q21
Foreignexchangeproducts(CHFmillion)
Gains/(losses) recognized in the cumulative translation adjustments section of AOCI (122) 123 (262)
Gains/(losses) reclassified from the cumulative translation adjustments section of AOCI into other revenues 0 (1) 0
The Group includes all derivative instruments not included in hedge accounting relationships in its trading activities.
> Refer to “Note 7 – Trading revenues” for gains and losses on trading activities by product type.
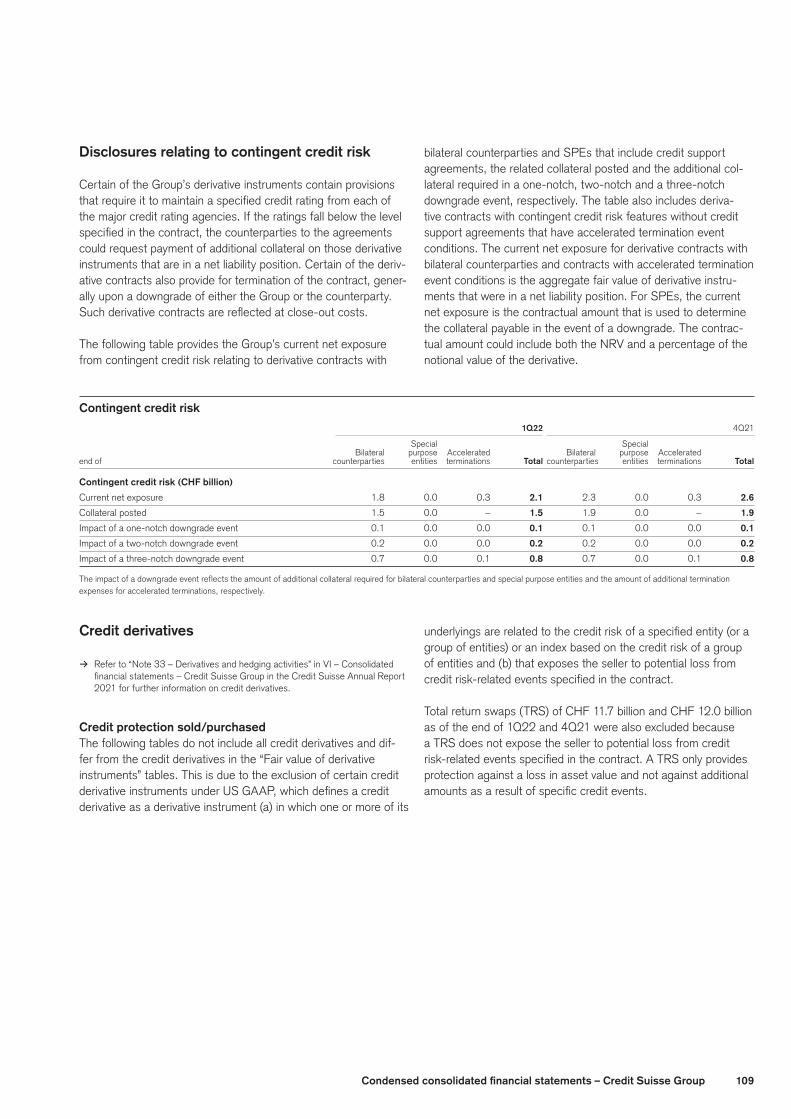
109Condensedconsolidatedfinancialstatements–CreditSuisseGroup
Disclosuresrelatingtocontingentcreditrisk
Certain of the Group’s derivative instruments contain provisions that require it to maintain a specified credit rating from each of the major credit rating agencies. If the ratings fall below the level specified in the contract, the counterparties to the agreements could request payment of additional collateral on those derivative instruments that are in a net liability position. Certain of the deriv-ative contracts also provide for termination of the contract, gener-ally upon a downgrade of either the Group or the counterparty. Such derivative contracts are reflected at close-out costs.
The following table provides the Group’s current net exposure from contingent credit risk relating to derivative contracts with
bilateral counterparties and SPEs that include credit support agreements, the related collateral posted and the additional col-lateral required in a one-notch, two-notch and a three-notch downgrade event, respectively. The table also includes deriva-tive contracts with contingent credit risk features without credit support agreements that have accelerated termination event conditions. The current net exposure for derivative contracts with bilateral counterparties and contracts with accelerated termination event conditions is the aggregate fair value of derivative instru-ments that were in a net liability position. For SPEs, the current net exposure is the contractual amount that is used to determine the collateral payable in the event of a downgrade. The contrac-tual amount could include both the NRV and a percentage of the notional value of the derivative.
Contingentcreditrisk 1Q22 4Q21
Special Special Bilateral purpose Accelerated Bilateral purpose Accelerated
end of counterparties entities terminations Total counterparties entities terminations Total
Contingentcreditrisk(CHFbillion)
Current net exposure 1.8 0.0 0.3 2.1 2.3 0.0 0.3 2.6
Collateral posted 1.5 0.0 – 1.5 1.9 0.0 – 1.9
Impact of a one-notch downgrade event 0.1 0.0 0.0 0.1 0.1 0.0 0.0 0.1
Impact of a two-notch downgrade event 0.2 0.0 0.0 0.2 0.2 0.0 0.0 0.2
Impact of a three-notch downgrade event 0.7 0.0 0.1 0.8 0.7 0.0 0.1 0.8
The impact of a downgrade event reflects the amount of additional collateral required for bilateral counterparties and special purpose entities and the amount of additional termination expenses for accelerated terminations, respectively.
Credit derivatives
> Refer to “Note 33 – Derivatives and hedging activities” in VI – Consolidated financial statements – Credit Suisse Group in the Credit Suisse Annual Report 2021 for further information on credit derivatives.
Creditprotectionsold/purchasedThe following tables do not include all credit derivatives and dif-fer from the credit derivatives in the “Fair value of derivative instruments” tables. This is due to the exclusion of certain credit derivative instruments under US GAAP, which defines a credit derivative as a derivative instrument (a) in which one or more of its
underlyings are related to the credit risk of a specified entity (or a group of entities) or an index based on the credit risk of a group of entities and (b) that exposes the seller to potential loss from credit risk-related events specified in the contract.
Total return swaps (TRS) of CHF 11.7 billion and CHF 12.0 billion as of the end of 1Q22 and 4Q21 were also excluded because a TRS does not expose the seller to potential loss from credit risk-related events specified in the contract. A TRS only provides protection against a loss in asset value and not against additional amounts as a result of specific credit events.
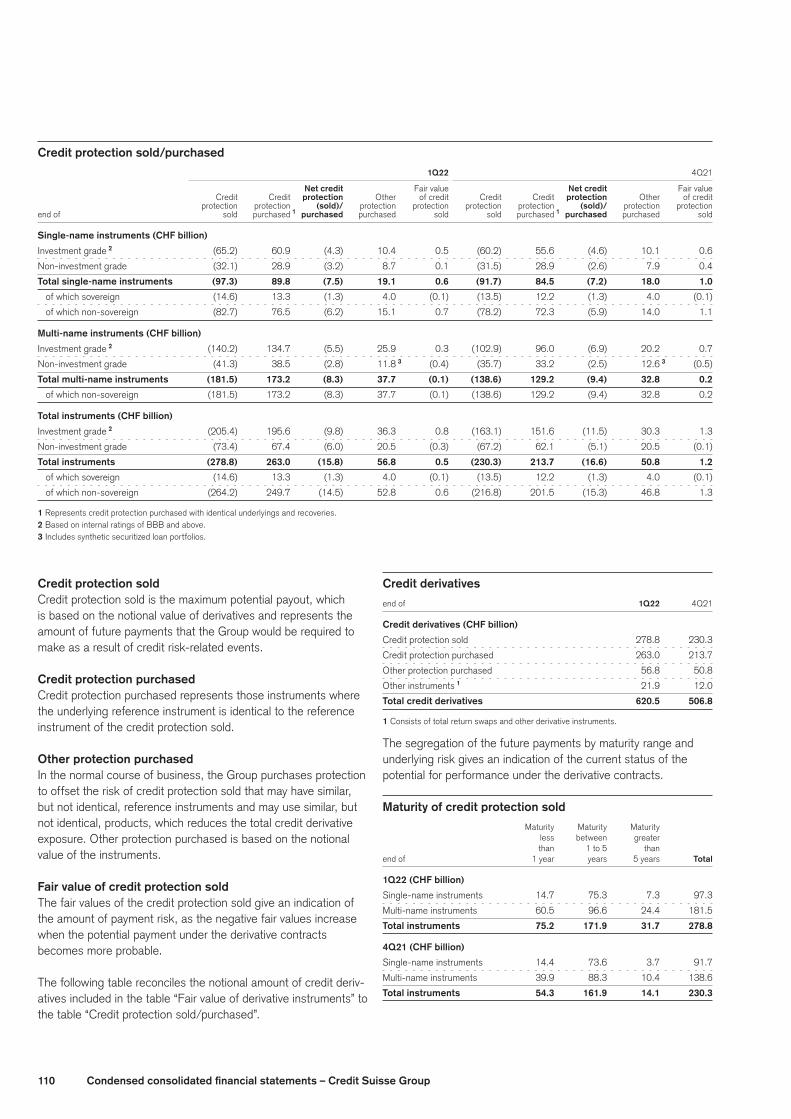
110 Condensedconsolidatedfinancialstatements–CreditSuisseGroup
Creditprotectionsold/purchased 1Q22 4Q21
Net credit Fair value Net credit Fair value Credit Credit protection Other of credit Credit Credit protection Other of credit protection protection (sold)/ protection protection protection protection (sold)/ protection protection end of sold purchased 1 purchased purchased sold sold purchased 1 purchased purchased sold
Single-nameinstruments(CHFbillion)
Investment grade 2 (65.2) 60.9 (4.3) 10.4 0.5 (60.2) 55.6 (4.6) 10.1 0.6
Non-investment grade (32.1) 28.9 (3.2) 8.7 0.1 (31.5) 28.9 (2.6) 7.9 0.4
Totalsingle-nameinstruments (97.3) 89.8 (7.5) 19.1 0.6 (91.7) 84.5 (7.2) 18.0 1.0
of which sovereign (14.6) 13.3 (1.3) 4.0 (0.1) (13.5) 12.2 (1.3) 4.0 (0.1)
of which non-sovereign (82.7) 76.5 (6.2) 15.1 0.7 (78.2) 72.3 (5.9) 14.0 1.1
Multi-nameinstruments(CHFbillion)
Investment grade 2 (140.2) 134.7 (5.5) 25.9 0.3 (102.9) 96.0 (6.9) 20.2 0.7
Non-investment grade (41.3) 38.5 (2.8) 11.8 3 (0.4) (35.7) 33.2 (2.5) 12.6 3 (0.5)
Totalmulti-nameinstruments (181.5) 173.2 (8.3) 37.7 (0.1) (138.6) 129.2 (9.4) 32.8 0.2
of which non-sovereign (181.5) 173.2 (8.3) 37.7 (0.1) (138.6) 129.2 (9.4) 32.8 0.2
Totalinstruments(CHFbillion)
Investment grade 2 (205.4) 195.6 (9.8) 36.3 0.8 (163.1) 151.6 (11.5) 30.3 1.3
Non-investment grade (73.4) 67.4 (6.0) 20.5 (0.3) (67.2) 62.1 (5.1) 20.5 (0.1)
Totalinstruments (278.8) 263.0 (15.8) 56.8 0.5 (230.3) 213.7 (16.6) 50.8 1.2
of which sovereign (14.6) 13.3 (1.3) 4.0 (0.1) (13.5) 12.2 (1.3) 4.0 (0.1)
of which non-sovereign (264.2) 249.7 (14.5) 52.8 0.6 (216.8) 201.5 (15.3) 46.8 1.3
1 Represents credit protection purchased with identical underlyings and recoveries.2 Based on internal ratings of BBB and above.3 Includes synthetic securitized loan portfolios.
Credit protection soldCredit protection sold is the maximum potential payout, which is based on the notional value of derivatives and represents the amount of future payments that the Group would be required to make as a result of credit risk-related events.
Credit protection purchasedCredit protection purchased represents those instruments where the underlying reference instrument is identical to the reference instrument of the credit protection sold.
Other protection purchasedIn the normal course of business, the Group purchases protection to offset the risk of credit protection sold that may have similar, but not identical, reference instruments and may use similar, but not identical, products, which reduces the total credit derivative exposure. Other protection purchased is based on the notional value of the instruments.
FairvalueofcreditprotectionsoldThe fair values of the credit protection sold give an indication of the amount of payment risk, as the negative fair values increase when the potential payment under the derivative contracts becomes more probable.
The following table reconciles the notional amount of credit deriv-atives included in the table “Fair value of derivative instruments” to the table “Credit protection sold/purchased”.
Credit derivatives
end of 1Q22 4Q21
Creditderivatives(CHFbillion)
Credit protection sold 278.8 230.3
Credit protection purchased 263.0 213.7
Other protection purchased 56.8 50.8
Other instruments 1 21.9 12.0
Total credit derivatives 620.5 506.8
1 Consists of total return swaps and other derivative instruments. The segregation of the future payments by maturity range and underlying risk gives an indication of the current status of the potential for performance under the derivative contracts.
Maturity of credit protection sold Maturity Maturity Maturity
less between greater
than 1 to 5 than
end of 1 year years 5 years Total
1Q22(CHFbillion)
Single-name instruments 14.7 75.3 7.3 97.3
Multi-name instruments 60.5 96.6 24.4 181.5
Totalinstruments 75.2 171.9 31.7 278.8
4Q21(CHFbillion)
Single-name instruments 14.4 73.6 3.7 91.7
Multi-name instruments 39.9 88.3 10.4 138.6
Totalinstruments 54.3 161.9 14.1 230.3
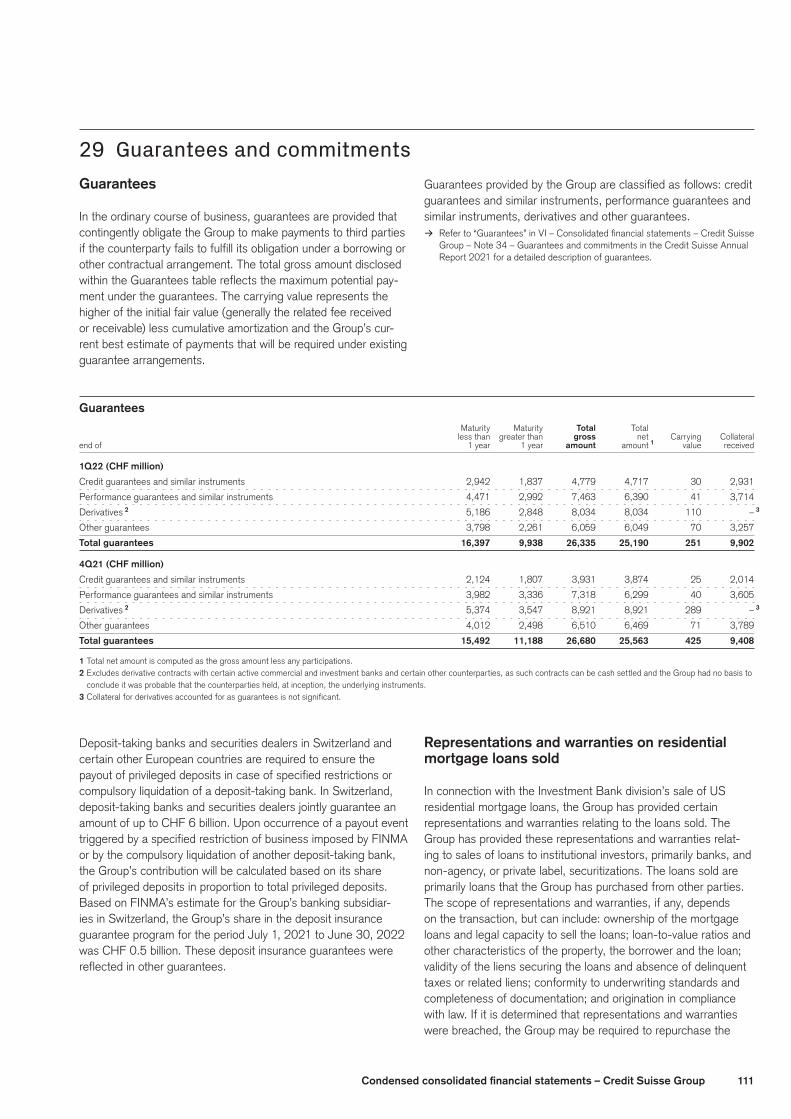
111Condensedconsolidatedfinancialstatements–CreditSuisseGroup
29 Guarantees and commitmentsGuarantees
In the ordinary course of business, guarantees are provided that contingently obligate the Group to make payments to third parties if the counterparty fails to fulfill its obligation under a borrowing or other contractual arrangement. The total gross amount disclosed within the Guarantees table reflects the maximum potential pay-ment under the guarantees. The carrying value represents the higher of the initial fair value (generally the related fee received or receivable) less cumulative amortization and the Group’s cur-rent best estimate of payments that will be required under existing guarantee arrangements.
Guarantees provided by the Group are classified as follows: credit guarantees and similar instruments, performance guarantees and similar instruments, derivatives and other guarantees.
> Refer to “Guarantees” in VI – Consolidated financial statements – Credit Suisse Group – Note 34 – Guarantees and commitments in the Credit Suisse Annual Report 2021 for a detailed description of guarantees.
Guarantees Maturity Maturity Total Total less than greater than gross net Carrying Collateral end of 1 year 1 year amount amount 1 value received
1Q22(CHFmillion)
Credit guarantees and similar instruments 2,942 1,837 4,779 4,717 30 2,931
Performance guarantees and similar instruments 4,471 2,992 7,463 6,390 41 3,714
Derivatives 2 5,186 2,848 8,034 8,034 110 – 3
Other guarantees 3,798 2,261 6,059 6,049 70 3,257
Total guarantees 16,397 9,938 26,335 25,190 251 9,902
4Q21(CHFmillion)
Credit guarantees and similar instruments 2,124 1,807 3,931 3,874 25 2,014
Performance guarantees and similar instruments 3,982 3,336 7,318 6,299 40 3,605
Derivatives 2 5,374 3,547 8,921 8,921 289 – 3
Other guarantees 4,012 2,498 6,510 6,469 71 3,789
Total guarantees 15,492 11,188 26,680 25,563 425 9,408
1 Total net amount is computed as the gross amount less any participations.2 Excludes derivative contracts with certain active commercial and investment banks and certain other counterparties, as such contracts can be cash settled and the Group had no basis to
conclude it was probable that the counterparties held, at inception, the underlying instruments.3 Collateral for derivatives accounted for as guarantees is not significant.
Deposit-taking banks and securities dealers in Switzerland and certain other European countries are required to ensure the payout of privileged deposits in case of specified restrictions or compulsory liquidation of a deposit-taking bank. In Switzerland, deposit-taking banks and securities dealers jointly guarantee an amount of up to CHF 6 billion. Upon occurrence of a payout event triggered by a specified restriction of business imposed by FINMA or by the compulsory liquidation of another deposit-taking bank, the Group’s contribution will be calculated based on its share of privileged deposits in proportion to total privileged deposits. Based on FINMA’s estimate for the Group’s banking subsidiar-ies in Switzerland, the Group’s share in the deposit insurance guarantee program for the period July 1, 2021 to June 30, 2022 was CHF 0.5 billion. These deposit insurance guarantees were reflected in other guarantees.
Representationsandwarrantiesonresidentialmortgageloanssold
In connection with the Investment Bank division’s sale of US residential mortgage loans, the Group has provided certain representations and warranties relating to the loans sold. The Group has provided these representations and warranties relat-ing to sales of loans to institutional investors, primarily banks, and non-agency, or private label, securitizations. The loans sold are primarily loans that the Group has purchased from other parties. The scope of representations and warranties, if any, depends on the transaction, but can include: ownership of the mortgage loans and legal capacity to sell the loans; loan-to-value ratios and other characteristics of the property, the borrower and the loan; validity of the liens securing the loans and absence of delinquent taxes or related liens; conformity to underwriting standards and completeness of documentation; and origination in compliance with law. If it is determined that representations and warranties were breached, the Group may be required to repurchase the
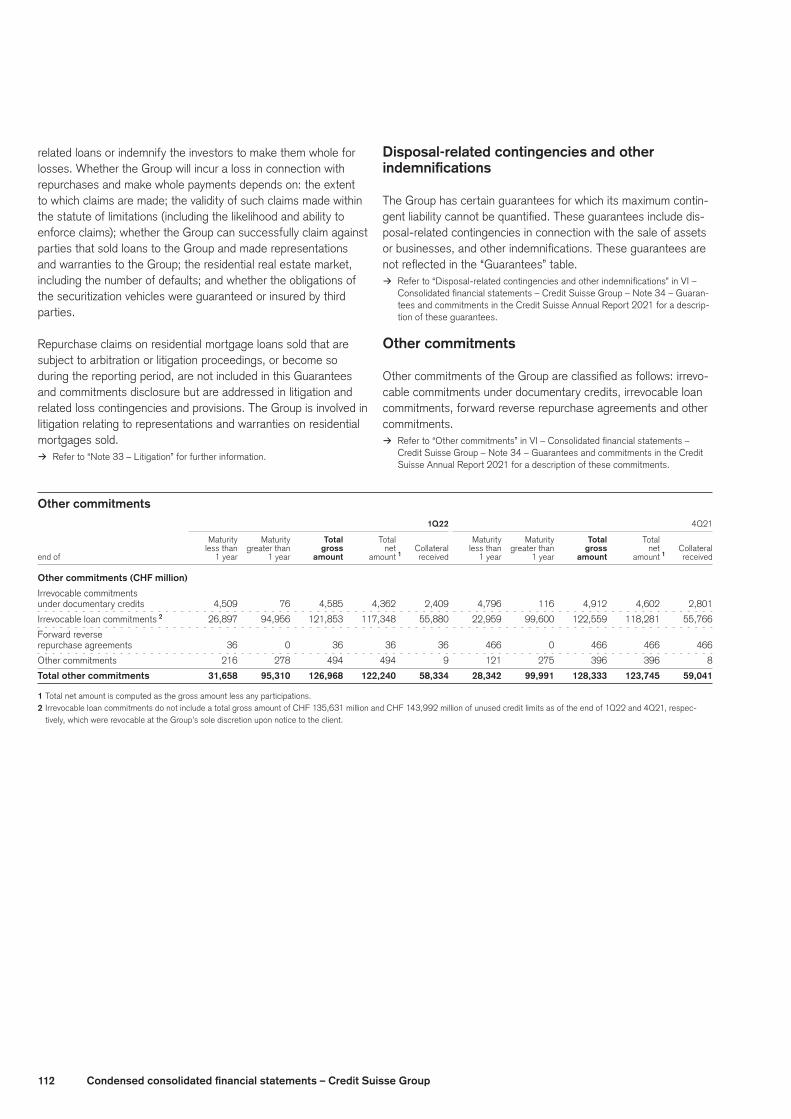
112 Condensedconsolidatedfinancialstatements–CreditSuisseGroup
related loans or indemnify the investors to make them whole for losses. Whether the Group will incur a loss in connection with repurchases and make whole payments depends on: the extent to which claims are made; the validity of such claims made within the statute of limitations (including the likelihood and ability to enforce claims); whether the Group can successfully claim against parties that sold loans to the Group and made representations and warranties to the Group; the residential real estate market, including the number of defaults; and whether the obligations of the securitization vehicles were guaranteed or insured by third parties.
Repurchase claims on residential mortgage loans sold that are subject to arbitration or litigation proceedings, or become so during the reporting period, are not included in this Guarantees and commitments disclosure but are addressed in litigation and related loss contingencies and provisions. The Group is involved in litigation relating to representations and warranties on residential mortgages sold.
> Refer to “Note 33 – Litigation” for further information.
Disposal-related contingencies and other indemnifications
The Group has certain guarantees for which its maximum contin-gent liability cannot be quantified. These guarantees include dis-posal-related contingencies in connection with the sale of assets or businesses, and other indemnifications. These guarantees are not reflected in the “Guarantees” table.
> Refer to “Disposal-related contingencies and other indemnifications” in VI – Consolidated financial statements – Credit Suisse Group – Note 34 – Guaran-tees and commitments in the Credit Suisse Annual Report 2021 for a descrip-tion of these guarantees.
Othercommitments
Other commitments of the Group are classified as follows: irrevo-cable commitments under documentary credits, irrevocable loan commitments, forward reverse repurchase agreements and other commitments.
> Refer to “Other commitments” in VI – Consolidated financial statements – Credit Suisse Group – Note 34 – Guarantees and commitments in the Credit Suisse Annual Report 2021 for a description of these commitments.
Othercommitments 1Q22 4Q21
Maturity Maturity Total Total Maturity Maturity Total Total less than greater than gross net Collateral less than greater than gross net Collateral end of 1 year 1 year amount amount 1 received 1 year 1 year amount amount 1 received
Othercommitments(CHFmillion)
Irrevocable commitments
under documentary credits 4,509 76 4,585 4,362 2,409 4,796 116 4,912 4,602 2,801
Irrevocable loan commitments 2 26,897 94,956 121,853 117,348 55,880 22,959 99,600 122,559 118,281 55,766
Forward reverse
repurchase agreements 36 0 36 36 36 466 0 466 466 466
Other commitments 216 278 494 494 9 121 275 396 396 8
Totalothercommitments 31,658 95,310 126,968 122,240 58,334 28,342 99,991 128,333 123,745 59,041
1 Total net amount is computed as the gross amount less any participations.2 Irrevocable loan commitments do not include a total gross amount of CHF 135,631 million and CHF 143,992 million of unused credit limits as of the end of 1Q22 and 4Q21, respec-
tively, which were revocable at the Group’s sole discretion upon notice to the client.
113Condensedconsolidatedfinancialstatements–CreditSuisseGroup
30 Transfers of financial assets and variable interest entitiesIn the normal course of business, the Group enters into transac-tions with, and makes use of, SPEs. An SPE is an entity in the form of a trust or other legal structure designed to fulfill a specific limited need of the company that organized it and is generally structured to isolate the SPE’s assets from creditors of other entities, including the Group. The principal uses of SPEs are to assist the Group and its clients in securitizing financial assets and creating investment products. The Group also uses SPEs for other client-driven activity, such as to facilitate financings, and for Group tax or regulatory purposes.
Transfers of financial assetsSecuritizations
The majority of the Group’s securitization activities involve mort-gages and mortgage-related securities and are predominantly transacted using SPEs. In a typical securitization, the SPE pur-chases assets financed by proceeds received from the SPE’s issuance of debt and equity instruments, certificates, commer-cial paper (CP) and other notes of indebtedness. These assets and liabilities are recorded on the balance sheet of the SPE and not reflected on the Group’s consolidated balance sheet, unless either the Group sold the assets to the entity and the accounting requirements for sale were not met or the Group consolidates the SPE.
The Group purchases commercial and residential mortgages for the purpose of securitization and sells these mortgage loans to SPEs. These SPEs issue commercial mortgage-backed securi-ties (CMBS), residential mortgage-backed securities (RMBS) and asset-backed securities (ABS) that are collateralized by the assets transferred to the SPE and that pay a return based on the returns on those assets. Investors in these mortgage-backed securities or ABS typically have recourse to the assets in the SPEs. Third-party guarantees may further enhance the credit-worthiness of the assets. The investors and the SPEs have no recourse to the Group’s assets. The Group is typically an under-writer of, and makes a market in, these securities.
The Group also transacts in re-securitizations of previously issued RMBS. Typically, certificates issued out of an existing securitiza-tion vehicle are sold into a newly created and separate securitiza-tion vehicle. Often, these re-securitizations are initiated in order
to re-securitize an existing security to give the investor an invest-ment with different risk ratings or characteristics.
The Group also uses SPEs for other asset-backed financings relating to client-driven activity and for Group tax or regulatory purposes. Types of structures included in this category include managed collateralized loan obligations (CLOs), CLOs, lever-aged finance, repack and other types of transactions, includ-ing life insurance structures, emerging market structures set up for financing, loan participation or loan origination purposes, and other alternative structures created for the purpose of invest-ing in venture capital-like investments. CLOs are collateralized by loans transferred to the CLO vehicle and pay a return based on the returns on the loans. Leveraged finance structures are used to assist in the syndication of certain loans held by the Group, while repack structures are designed to give a client collateralized exposure to specific cash flows or credit risk backed by collat-eral purchased from the Group. In these asset-backed financing structures, investors typically only have recourse to the collateral of the SPE and do not have recourse to the Group’s assets.
When the Group transfers assets into an SPE, it must assess whether that transfer is accounted for as a sale of the assets. Transfers of assets may not meet sale requirements if the assets have not been legally isolated from the Group and/or if the Group’s continuing involvement is deemed to give it effective control over the assets. If the transfer is not deemed a sale, it is instead accounted for as a secured borrowing, with the trans-ferred assets as collateral.
Gains and losses on securitization transactions depend, in part, on the carrying values of mortgages and loans involved in the transfer and are allocated between the assets sold and any ben-eficial interests retained according to the relative fair values at the date of sale.
The Group does not retain material servicing responsibilities from securitization activities.
The following table provides the gains or losses and proceeds from the transfer of assets relating to 1Q22 and 1Q21 securi-tizations of financial assets that qualify for sale accounting and subsequent derecognition, along with the cash flows between the Group and the SPEs used in any securitizations in which the Group still has continuing involvement, regardless of when the securitization occurred.
114 Condensedconsolidatedfinancialstatements–CreditSuisseGroup
Securitizations
in 1Q22 1Q21
Gains/(losses)andcashflows(CHFmillion)
CMBS
Net gain 1 4 0
Proceeds from transfer of assets 1,451 823
Cash received on interests that continue to be held 9 17
RMBS
Net gain 1 0 31
Proceeds from transfer of assets 4,948 10,306
Purchases of previously transferred financial assets
or its underlying collateral 0 (591)
Servicing fees 0 1
Cash received on interests that continue to be held 320 130
Otherasset-backedfinancings
Net gain 1 10 20
Proceeds from transfer of assets 1,590 4,692
Purchases of previously transferred financial assets
or its underlying collateral (695) (497)
Fees 2 49 40
Cash received on interests that continue to be held 6 4
1 Includes underwriting revenues, deferred origination fees, gains or losses on the sale of collateral to the SPE and gains or losses on the sale of newly issued securities to third parties, but excludes net interest income on assets prior to the securitization. The gains or losses on the sale of the collateral is the difference between the fair value on the day prior to the securitization pricing date and the sale price of the loans.
2 Represents management fees and performance fees earned for investment management services provided to managed CLOs.
ContinuinginvolvementintransferredfinancialassetsThe Group may have continuing involvement in the financial assets that are transferred to an SPE, which may take several forms, including, but not limited to, servicing, recourse and guarantee arrangements, agreements to purchase or redeem transferred assets, derivative instruments, pledges of collateral and beneficial interests in the transferred assets.
> Refer to “Transfers of financial assets” in VI – Consolidated financial state-ments – Credit Suisse Group – Note 35 – Transfers of financial assets and variable interest entities in the Credit Suisse Annual Report 2021 for further information.
The following table provides the outstanding principal balance of assets to which the Group continued to be exposed after the transfer of the financial assets to any SPE and the total assets of the SPE as of the end of 1Q22 and 4Q21, regardless of when the transfer of assets occurred.
PrincipalamountsoutstandingandtotalassetsofSPEsresultingfromcontinuinginvolvement
end of 1Q22 4Q21
CHFmillion
CMBS
Principal amount outstanding 18,760 15,428
Total assets of SPE 35,772 23,205
RMBS
Principal amount outstanding 53,984 56,990
Total assets of SPE 53,984 56,990
Otherasset-backedfinancings
Principal amount outstanding 23,578 24,856
Total assets of SPE 56,525 57,797
Principal amount outstanding relates to assets transferred from the Group and does not include principal amounts for assets transferred from third parties.
FairvalueofbeneficialinterestsThe fair value measurement of the beneficial interests held at the time of transfer and as of the reporting date that result from any continuing involvement is determined using fair value estimation techniques, such as the present value of estimated future cash flows that incorporate assumptions that market participants cus-tomarily use in these valuation techniques. The fair value of the assets or liabilities that result from any continuing involvement does not include any benefits from financial instruments that the Group may utilize to hedge the inherent risks.
Keyeconomicassumptionsatthetimeoftransfer > Refer to “Note 31 – Financial instruments” for further information on the fair
value hierarchy.
Keyeconomicassumptionsusedinmeasuringfairvalueofbeneficialinterestsattimeoftransfer
1Q22 1Q21
at time of transfer, in CMBS RMBS CMBS RMBS
CHFmillion,exceptwhereindicated
Fair value of beneficial interests 172 329 60 778
of which level 2 133 272 50 595
of which level 3 39 57 10 183
Weighted-average life, in years 6.0 9.8 5.2 6.3
Prepayment speed assumption (rate per annum), in % 1 – 2 5.0–22.2 – 2 3.0–32.8
Cash flow discount rate (rate per annum), in % 3 3.5–7.5 2.8–43.6 3.6–4.5 1.0–15.3
Expected credit losses (rate per annum), in % 4 2.7–2.7 1.3–41.1 3.9–3.9 0.1–13.5
Transfers of assets in which the Group does not have beneficial interests are not included in this table.1 Prepayment speed assumption (PSA) is an industry standard prepayment speed metric used for projecting prepayments over the life of a residential mortgage loan. PSA utilizes the con-
stant prepayment rate (CPR) assumptions. A 100% prepayment assumption assumes a prepayment rate of 0.2% per annum of the outstanding principal balance of mortgage loans in the first month. This increases by 0.2 percentage points thereafter during the term of the mortgage loan, leveling off to a CPR of 6% per annum beginning in the 30th month and each month thereafter during the term of the mortgage loan. 100 PSA equals 6 CPR.
2 To deter prepayment, commercial mortgage loans typically have prepayment protection in the form of prepayment lockouts and yield maintenances.3 The rate is based on the weighted-average yield on the beneficial interests.4 The range of expected credit losses only reflects instruments with an expected credit loss greater than zero unless all of the instruments have an expected credit loss of zero.
115Condensedconsolidatedfinancialstatements–CreditSuisseGroup
KeyeconomicassumptionsasofthereportingdateThe following table provides the sensitivity analysis of key eco-nomic assumptions used in measuring the fair value of beneficial interests held in SPEs as of the end of 1Q22 and 4Q21.
KeyeconomicassumptionsusedinmeasuringfairvalueofbeneficialinterestsheldinSPEs 1Q22 4Q21
Other asset- Other asset- backed backed financing financing
end of CMBS 1 RMBS activities 2 CMBS 1 RMBS activities 2
CHFmillion,exceptwhereindicated
Fair value of beneficial interests 436 2,099 399 281 2,310 402
of which non-investment grade 71 282 26 55 370 27
Weighted-average life, in years 4.3 6.2 5.1 3.9 4.7 5.5
Prepayment speed assumption (rate per annum), in % 3 – 4.8–36.7 – – 5.1–41.9 –
Impact on fair value from 10% adverse change – (33.3) – – (31.1) –
Impact on fair value from 20% adverse change – (64.5) – – (59.8) –
Cash flow discount rate (rate per annum), in % 4 3.1–52.5 0.8–43.6 0.6–29.4 1.7–50.7 0.7–35.5 0.3–14.7
Impact on fair value from 10% adverse change (6.7) (48.4) (6.2) (3.5) (38.1) (4.9)
Impact on fair value from 20% adverse change (13.2) (93.6) (12.1) (6.8) (73.3) (9.7)
Expected credit losses (rate per annum), in % 5 0.9–9.6 0.7–41.1 0.5–26.9 0.6–8.4 0.4–34.2 0.7–13.3
Impact on fair value from 10% adverse change (3.6) (27.2) (4.5) (2.5) (28.5) (4.3)
Impact on fair value from 20% adverse change (6.9) (52.8) (8.6) (4.9) (54.8) (8.4)
1 To deter prepayment, commercial mortgage loans typically have prepayment protection in the form of prepayment lockouts and yield maintenances.2 CDOs and CLOs within this category are generally structured to be protected from prepayment risk.3 PSA is an industry standard prepayment speed metric used for projecting prepayments over the life of a residential mortgage loan. PSA utilizes the CPR assumptions. A 100% prepay-
ment assumption assumes a prepayment rate of 0.2% per annum of the outstanding principal balance of mortgage loans in the first month. This increases by 0.2 percentage points thereafter during the term of the mortgage loan, leveling off to a CPR of 6% per annum beginning in the 30th month and each month thereafter during the term of the mortgage loan. 100 PSA equals 6 CPR.
4 The rate is based on the weighted-average yield on the beneficial interests.5 The range of expected credit losses only reflects instruments with an expected credit loss greater than zero unless all of the instruments have an expected credit loss of zero.
These sensitivities are hypothetical and do not reflect economic hedging activities. Changes in fair value based on a 10% or 20% variation in assumptions generally cannot be extrapolated because the relationship of the change in assumption to the change in fair value may not be linear. Also, the effect of a varia-tion in a particular assumption on the fair value of the beneficial interests is calculated without changing any other assumption. In practice, changes in one assumption may result in changes in other assumptions (for example, increases in market interest rates may result in lower prepayments and increased credit losses), which might magnify or counteract the sensitivities.
TransfersoffinancialassetswheresaletreatmentwasnotachievedThe following table provides the carrying amounts of transferred financial assets and the related liabilities where sale treatment was not achieved as of the end of 1Q22 and 4Q21.
> Refer to “Note 32 – Assets pledged and collateral” for further information.
Carryingamountsoftransferredfinancialassetsandliabilitieswheresaletreatmentwasnotachieved
end of 1Q22 4Q21
CHFmillion
RMBS
Other assets 259 257
Liability to SPE, included in other liabilities (259) (257)
Otherasset-backedfinancings
Trading assets 498 557
Other assets 148 200
Liability to SPE, included in other liabilities (646) (757)
Securitiessoldunderrepurchaseagreementsand securities lending transactions accounted for assecuredborrowings
For securities sold under repurchase agreements and securities lending transactions accounted for as secured borrowings, US GAAP requires the disclosure of the collateral pledged and the associated risks to which a transferor continues to be exposed after the transfer. This provides an understanding of the nature and risks of short-term collateralized financing obtained through these types of transactions.
116 Condensedconsolidatedfinancialstatements–CreditSuisseGroup
Securities sold under repurchase agreements and securities lend-ing transactions represent collateralized financing transactions used to earn net interest income, increase liquidity or facilitate trading activities. These transactions are collateralized principally by government debt securities, corporate debt securities, asset-backed securities, equity securities and other collateral and have terms ranging from on demand to a longer period of time.
In the event of the Group’s default or a decline in fair value of col-lateral pledged, the repurchase agreement provides the counter-party with the right to liquidate the collateral held or request addi-tional collateral. Similarly, in the event of the Group’s default, the securities lending transaction provides the counterparty the right to liquidate the securities borrowed.
The following tables provide the gross obligation relating to secu-rities sold under repurchase agreements, securities lending trans-actions and obligation to return securities received as collateral by the class of collateral pledged and by remaining contractual matu-rity as of the end of 1Q22 and 4Q21.
Securitiessoldunderrepurchaseagreements,securitieslending transactions and obligation to return securities receivedascollateral–byclassofcollateralpledged
end of 1Q22 4Q21
CHFbillion
Government debt securities 18.8 15.9
Corporate debt securities 9.6 9.6
Asset-backed securities 2.2 4.6
Equity securities 0.5 0.5
Other 3.5 5.6
Securitiessoldunderrepurchaseagreements 34.6 36.2
Government debt securities 8.1 13.9
Corporate debt securities 0.3 0.3
Asset-backed securities 0.0 0.3
Equity securities 0.5 1.0
Other 0.0 0.2
Securitieslendingtransactions 8.9 15.7
Government debt securities 4.3 3.6
Corporate debt securities 1.0 0.6
Equity securities 2.8 10.8
Obligation to return securities received
ascollateral,atfairvalue 8.1 15.0
Total 51.6 66.9
Securitiessoldunderrepurchaseagreements,securitieslendingtransactionsandobligationtoreturnsecuritiesreceivedascollateral–byremainingcontractualmaturity Remaining contractual maturities
No stated Up to 31 – 90 More than
end of maturity 1 30 days 2 days 90 days Total
1Q22(CHFbillion)
Securities sold under repurchase agreements 6.2 16.1 4.3 8.0 34.6
Securities lending transactions 0.9 0.3 1.5 6.2 8.9
Obligation to return securities received as collateral, at fair value 8.1 0.0 0.0 0.0 8.1
Total 15.2 16.4 5.8 14.2 51.6
4Q21(CHFbillion)
Securities sold under repurchase agreements 5.2 15.7 6.0 9.3 36.2
Securities lending transactions 2.3 1.7 1.6 10.1 15.7
Obligation to return securities received as collateral, at fair value 15.0 0.0 0.0 0.0 15.0
Total 22.5 17.4 7.6 19.4 66.9
1 Includes contracts with no contractual maturity that may contain termination arrangements subject to a notice period.2 Includes overnight transactions.
> Refer to “Note 24 – Offsetting of financial assets and financial liabilities” for further information on the gross amount of securities sold under repurchase agreements, securities lending transactions and obligation to return securities received as collateral and the net amounts disclosed in the consolidated bal-ance sheets.
117Condensedconsolidatedfinancialstatements–CreditSuisseGroup
Variable interest entitiesAs a normal part of its business, the Group engages in various transactions that include entities that are considered variable interest entities (VIEs) and are grouped into three primary catego-ries: collateralized debt obligations (CDOs)/CLOs, CP conduits and financial intermediation.
> Refer to “Variable interest entities” in VI – Consolidated financial statements – Credit Suisse Group – Note 35 – Transfers of financial assets and vari-able interest entities in the Credit Suisse Annual Report 2021 for a detailed description of VIEs, CDO/CLOs, CP conduit or financial intermediation.
Collateralizeddebtandloanobligations
The Group engages in CDO/CLO transactions to meet client and investor needs, earn fees and sell financial assets and, in the case of CLOs, loans. The Group may act as underwriter, place-ment agent or asset manager and may warehouse assets prior to the closing of a transaction.
Commercialpaperconduit
The Group acts as the administrator and provider of liquidity and credit enhancement facilities for Alpine Securitization Ltd (Alpine), a multi-seller asset-backed CP conduit used for client and Group financing purposes. Alpine discloses to CP investors certain port-folio and asset data and submits its portfolio to rating agencies for public ratings on its CP. This CP conduit purchases assets such as loans and receivables or enters into reverse repurchase agreements and finances such activities through the issuance of CP backed by these assets. In addition to CP, Alpine may also issue term notes with maturities up to 30 months. The Group (including Alpine) can enter into liquidity facilities with third-party entities pursuant to which it may be required to purchase assets from these entities to provide them with liquidity and credit sup-port. The financing transactions are structured to provide credit support in the form of over-collateralization and other asset-spe-cific enhancements. Alpine is a separate legal entity that is wholly owned by the Group. However, its assets are available to satisfy only the claims of its creditors. In addition, the Group, as adminis-trator and liquidity facility provider, has significant exposure to and power over the activities of Alpine. Alpine is considered a VIE for accounting purposes and the Group is deemed the primary ben-eficiary and consolidates this entity.
The overall average maturity of Alpine’s outstanding CP was approximately 178 days as of the end of 1Q22. Alpine’s CP was rated A-1(sf) by Standard & Poor’s and P-1(sf) by Moody’s and had exposures mainly in reverse repurchase agreements with a Group entity, consumer loans, solar loans and leases and aircraft loans and leases.
The Group’s financial commitment to this CP conduit consists of obligations under liquidity agreements. The liquidity agree-ments are asset-specific arrangements, which require the Group
to provide short-term financing to the CP conduit or to purchase assets from the CP conduit in certain circumstances, includ-ing, but not limited to, a lack of liquidity in the CP market such that the CP conduit cannot refinance its obligations or a default of an underlying asset. The asset-specific credit enhancements provided by the client seller of the assets remain unchanged as a result of such a purchase. In entering into such agreements, the Group reviews the credit risk associated with these transactions on the same basis that would apply to other extensions of credit.
The Group enters into liquidity facilities with CP conduits admin-istrated and sponsored by third parties. These third-party CP conduits are considered to be VIEs for accounting purposes. The Group is not the primary beneficiary and does not consolidate these third-party CP conduits. The Group’s financial commitment to these third-party CP conduits consists of obligations under liquidity agreements. The liquidity agreements are asset-specific arrangements, which require the Group to provide short-term financing to the third-party CP conduits or to purchase assets from these CP conduits in certain circumstances, including, but not limited to, a lack of liquidity in the CP market such that the CP conduits cannot refinance their obligations or a default of an underlying asset. The asset-specific credit enhancements, if any, provided by the client seller of the assets remain unchanged as a result of such a purchase. In entering into such agreements, the Group reviews the credit risk associated with these transactions on the same basis that would apply to other extensions of credit. In some situations, the Group can enter into liquidity facilities with these third-party CP conduits through Alpine.
The Group’s economic risks associated with the Alpine CP con-duit and the third-party CP conduits are included in the Group’s risk management framework including counterparty, economic risk capital and scenario analysis.
Financialintermediation
The Group has significant involvement with VIEs in its role as a financial intermediary on behalf of clients.
Financial intermediation consists of securitizations, funds, loans and other vehicles.
Consolidated VIEs
The Group has significant involvement with VIEs in its role as a financial intermediary on behalf of clients. The Group consolidates all VIEs related to financial intermediation for which it is the pri-mary beneficiary.
The consolidated VIEs table provides the carrying amounts and classifications of the assets and liabilities of consolidated VIEs as of the end of 1Q22 and 4Q21.
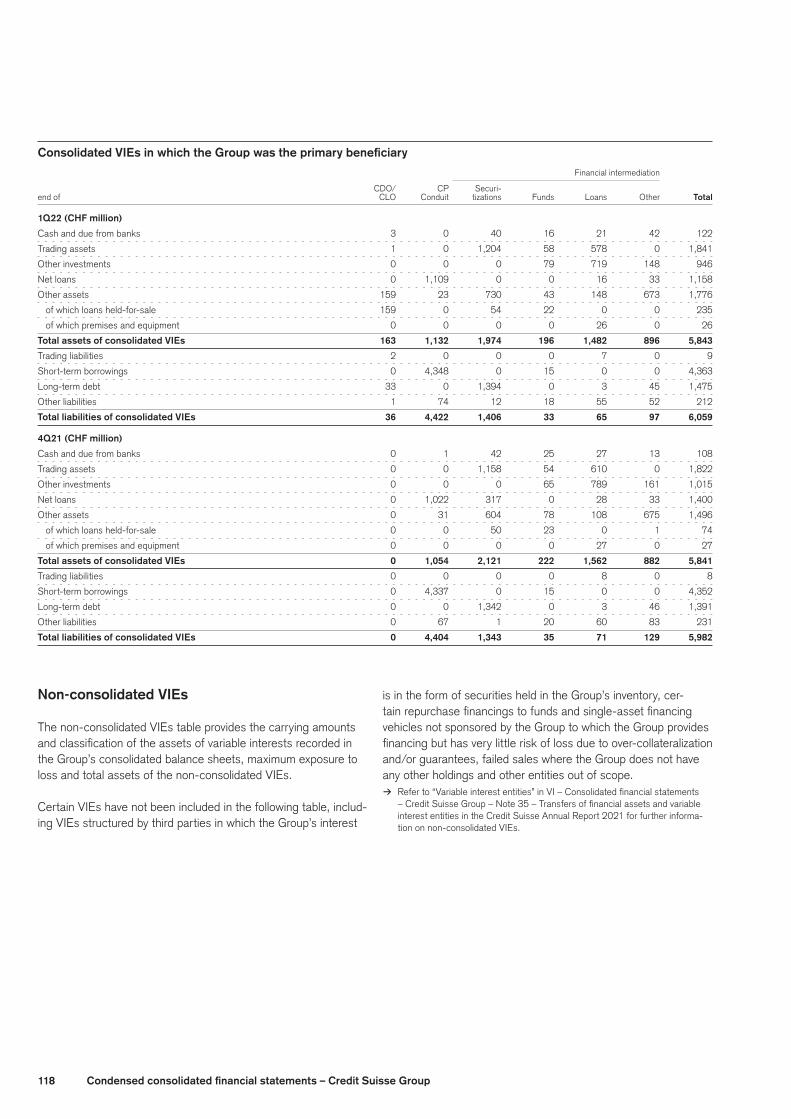
118 Condensedconsolidatedfinancialstatements–CreditSuisseGroup
ConsolidatedVIEsinwhichtheGroupwastheprimarybeneficiary Financial intermediation
CDO/ CP Securi-
end of CLO Conduit tizations Funds Loans Other Total
1Q22(CHFmillion)
Cash and due from banks 3 0 40 16 21 42 122
Trading assets 1 0 1,204 58 578 0 1,841
Other investments 0 0 0 79 719 148 946
Net loans 0 1,109 0 0 16 33 1,158
Other assets 159 23 730 43 148 673 1,776
of which loans held-for-sale 159 0 54 22 0 0 235
of which premises and equipment 0 0 0 0 26 0 26
Total assets of consolidated VIEs 163 1,132 1,974 196 1,482 896 5,843
Trading liabilities 2 0 0 0 7 0 9
Short-term borrowings 0 4,348 0 15 0 0 4,363
Long-term debt 33 0 1,394 0 3 45 1,475
Other liabilities 1 74 12 18 55 52 212
Total liabilities of consolidated VIEs 36 4,422 1,406 33 65 97 6,059
4Q21(CHFmillion)
Cash and due from banks 0 1 42 25 27 13 108
Trading assets 0 0 1,158 54 610 0 1,822
Other investments 0 0 0 65 789 161 1,015
Net loans 0 1,022 317 0 28 33 1,400
Other assets 0 31 604 78 108 675 1,496
of which loans held-for-sale 0 0 50 23 0 1 74
of which premises and equipment 0 0 0 0 27 0 27
Total assets of consolidated VIEs 0 1,054 2,121 222 1,562 882 5,841
Trading liabilities 0 0 0 0 8 0 8
Short-term borrowings 0 4,337 0 15 0 0 4,352
Long-term debt 0 0 1,342 0 3 46 1,391
Other liabilities 0 67 1 20 60 83 231
Total liabilities of consolidated VIEs 0 4,404 1,343 35 71 129 5,982
Non-consolidated VIEs
The non-consolidated VIEs table provides the carrying amounts and classification of the assets of variable interests recorded in the Group’s consolidated balance sheets, maximum exposure to loss and total assets of the non-consolidated VIEs.
Certain VIEs have not been included in the following table, includ-ing VIEs structured by third parties in which the Group’s interest
is in the form of securities held in the Group’s inventory, cer-tain repurchase financings to funds and single-asset financing vehicles not sponsored by the Group to which the Group provides financing but has very little risk of loss due to over-collateralization and/or guarantees, failed sales where the Group does not have any other holdings and other entities out of scope.
> Refer to “Variable interest entities” in VI – Consolidated financial statements – Credit Suisse Group – Note 35 – Transfers of financial assets and variable interest entities in the Credit Suisse Annual Report 2021 for further informa-tion on non-consolidated VIEs.

119Condensedconsolidatedfinancialstatements–CreditSuisseGroup
Non-consolidated VIEs Financial intermediation
CDO/ CP Securi-
end of CLO Conduit 1 tizations Funds Loans Other Total
1Q22(CHFmillion)
Trading assets 254 0 4,923 891 13 2,460 8,541
Net loans 675 1,091 936 2,808 8,399 2,184 16,093
Other assets 7 0 20 105 0 700 832
Total variable interest assets 936 1,091 5,879 3,804 8,412 5,344 25,466
Maximumexposuretoloss 1,378 7,306 7,690 3,804 12,549 5,925 38,652
Total assets of non-consolidated VIEs 11,581 14,287 109,038 152,459 38,334 21,334 347,033
4Q21(CHFmillion)
Trading assets 257 0 4,526 932 13 5,494 11,222
Net loans 268 1,005 940 2,403 8,774 1,986 15,376
Other assets 6 0 22 112 0 628 768
Total variable interest assets 531 1,005 5,488 3,447 8,787 8,108 27,366
Maximumexposuretoloss 774 7,625 8,036 3,447 13,068 8,637 41,587
Total assets of non-consolidated VIEs 10,266 14,948 108,942 103,179 36,428 24,945 298,708
1 Includes liquidity facilities provided to third-party CP conduits through Alpine.
31 Financial instrumentsThe disclosure of the Group’s financial instruments includes the following sections:p Concentration of credit risk;p Fair value measurement (including fair value hierarchy; level 3
reconciliation; transfers in and out of level 3; quantitative dis-closures of valuation techniques; and qualitative discussion of significant unobservable inputs);
p Fair value option; andp Financial instruments not carried at fair value.
Concentrationofcreditrisk
Credit risk concentrations arise when a number of counterparties are engaged in similar business activities, are located in the same geographic region or when there are similar economic features that would cause their ability to meet contractual obligations to be similarly impacted by changes in economic conditions.
> Refer to “Note 36 – Financial instruments” in VI – Consolidated financial state-ments – Credit Suisse Group in the Credit Suisse Annual Report 2021 for fur-ther information on the Group’s concentration of credit risk.
Fairvaluemeasurement
A significant portion of the Group’s financial instruments is carried at fair value. Deterioration of financial markets could significantly impact the fair value of these financial instruments and the results of operations.
> Refer to “Note 36 – Financial instruments” in VI – Consolidated financial state-ments – Credit Suisse Group in the Credit Suisse Annual Report 2021 for further information on fair value measurement of financial instruments and the definition of the levels of the fair value hierarchy.
Qualitative disclosures of valuation techniques
Information on the valuation techniques and significant unobserv-able inputs of the various financial instruments and the section “Uncertainty of fair value measurements at the reporting date from the use of significant unobservable inputs” should be read in conjunction with the tables “Assets and liabilities measured at fair value on a recurring basis”, “Quantitative information about level 3 assets measured at fair value on a recurring basis” and “Quantita-tive information about level 3 liabilities measured at fair value on a recurring basis”.
> Refer to “Note 36 – Financial instruments” in VI – Consolidated financial state-ments – Credit Suisse Group in the Credit Suisse Annual Report 2021 for fur-ther information on the Group’s valuation techniques.
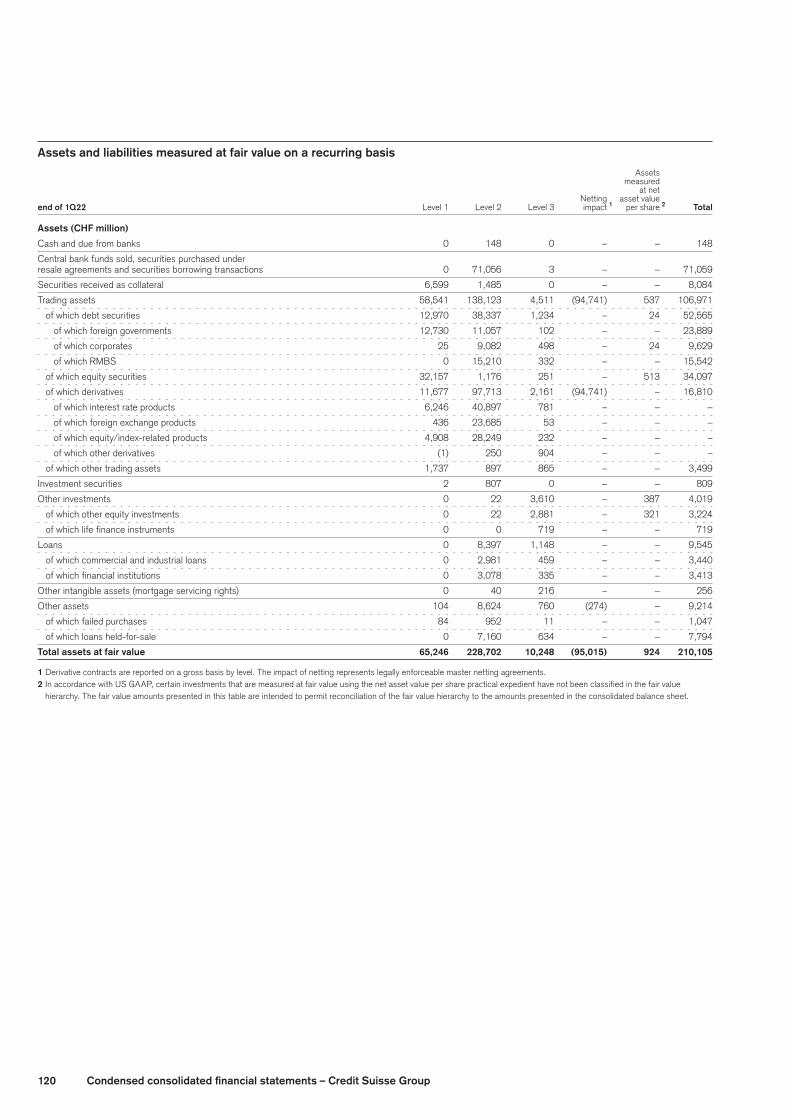
120 Condensedconsolidatedfinancialstatements–CreditSuisseGroup
Assetsandliabilitiesmeasuredatfairvalueonarecurringbasis Assets measured at net Netting asset value
end of 1Q22 Level 1 Level 2 Level 3 impact 1 per share 2 Total
Assets(CHFmillion)
Cash and due from banks 0 148 0 – – 148
Central bank funds sold, securities purchased under
resale agreements and securities borrowing transactions 0 71,056 3 – – 71,059
Securities received as collateral 6,599 1,485 0 – – 8,084
Trading assets 58,541 138,123 4,511 (94,741) 537 106,971
of which debt securities 12,970 38,337 1,234 – 24 52,565
of which foreign governments 12,730 11,057 102 – – 23,889
of which corporates 25 9,082 498 – 24 9,629
of which RMBS 0 15,210 332 – – 15,542
of which equity securities 32,157 1,176 251 – 513 34,097
of which derivatives 11,677 97,713 2,161 (94,741) – 16,810
of which interest rate products 6,246 40,897 781 – – –
of which foreign exchange products 436 23,685 53 – – –
of which equity/index-related products 4,908 28,249 232 – – –
of which other derivatives (1) 250 904 – – –
of which other trading assets 1,737 897 865 – – 3,499
Investment securities 2 807 0 – – 809
Other investments 0 22 3,610 – 387 4,019
of which other equity investments 0 22 2,881 – 321 3,224
of which life finance instruments 0 0 719 – – 719
Loans 0 8,397 1,148 – – 9,545
of which commercial and industrial loans 0 2,981 459 – – 3,440
of which financial institutions 0 3,078 335 – – 3,413
Other intangible assets (mortgage servicing rights) 0 40 216 – – 256
Other assets 104 8,624 760 (274) – 9,214
of which failed purchases 84 952 11 – – 1,047
of which loans held-for-sale 0 7,160 634 – – 7,794
Total assets at fair value 65,246 228,702 10,248 (95,015) 924 210,105
1 Derivative contracts are reported on a gross basis by level. The impact of netting represents legally enforceable master netting agreements.2 In accordance with US GAAP, certain investments that are measured at fair value using the net asset value per share practical expedient have not been classified in the fair value
hierarchy. The fair value amounts presented in this table are intended to permit reconciliation of the fair value hierarchy to the amounts presented in the consolidated balance sheet.
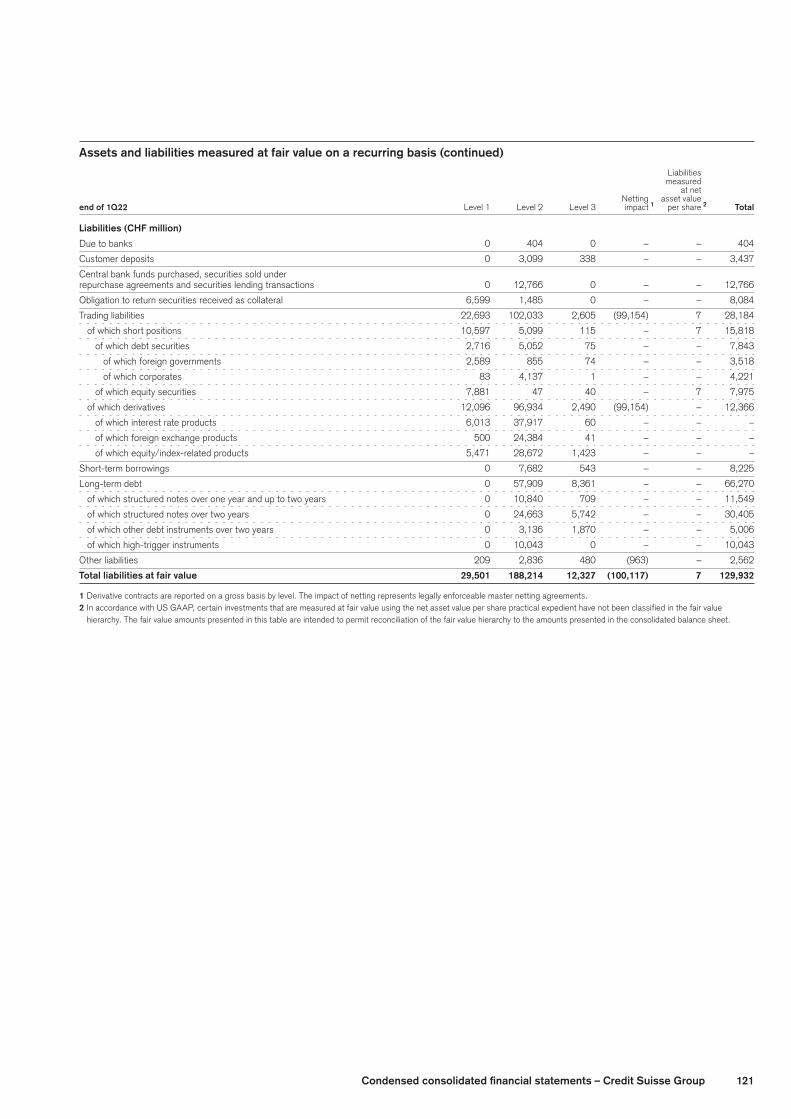
121Condensedconsolidatedfinancialstatements–CreditSuisseGroup
Assetsandliabilitiesmeasuredatfairvalueonarecurringbasis(continued) Liabilities measured at net Netting asset value
end of 1Q22 Level 1 Level 2 Level 3 impact 1 per share 2 Total
Liabilities(CHFmillion)
Due to banks 0 404 0 – – 404
Customer deposits 0 3,099 338 – – 3,437
Central bank funds purchased, securities sold under
repurchase agreements and securities lending transactions 0 12,766 0 – – 12,766
Obligation to return securities received as collateral 6,599 1,485 0 – – 8,084
Trading liabilities 22,693 102,033 2,605 (99,154) 7 28,184
of which short positions 10,597 5,099 115 – 7 15,818
of which debt securities 2,716 5,052 75 – – 7,843
of which foreign governments 2,589 855 74 – – 3,518
of which corporates 83 4,137 1 – – 4,221
of which equity securities 7,881 47 40 – 7 7,975
of which derivatives 12,096 96,934 2,490 (99,154) – 12,366
of which interest rate products 6,013 37,917 60 – – –
of which foreign exchange products 500 24,384 41 – – –
of which equity/index-related products 5,471 28,672 1,423 – – –
Short-term borrowings 0 7,682 543 – – 8,225
Long-term debt 0 57,909 8,361 – – 66,270
of which structured notes over one year and up to two years 0 10,840 709 – – 11,549
of which structured notes over two years 0 24,663 5,742 – – 30,405
of which other debt instruments over two years 0 3,136 1,870 – – 5,006
of which high-trigger instruments 0 10,043 0 – – 10,043
Other liabilities 209 2,836 480 (963) – 2,562
Total liabilities at fair value 29,501 188,214 12,327 (100,117) 7 129,932
1 Derivative contracts are reported on a gross basis by level. The impact of netting represents legally enforceable master netting agreements.2 In accordance with US GAAP, certain investments that are measured at fair value using the net asset value per share practical expedient have not been classified in the fair value
hierarchy. The fair value amounts presented in this table are intended to permit reconciliation of the fair value hierarchy to the amounts presented in the consolidated balance sheet.
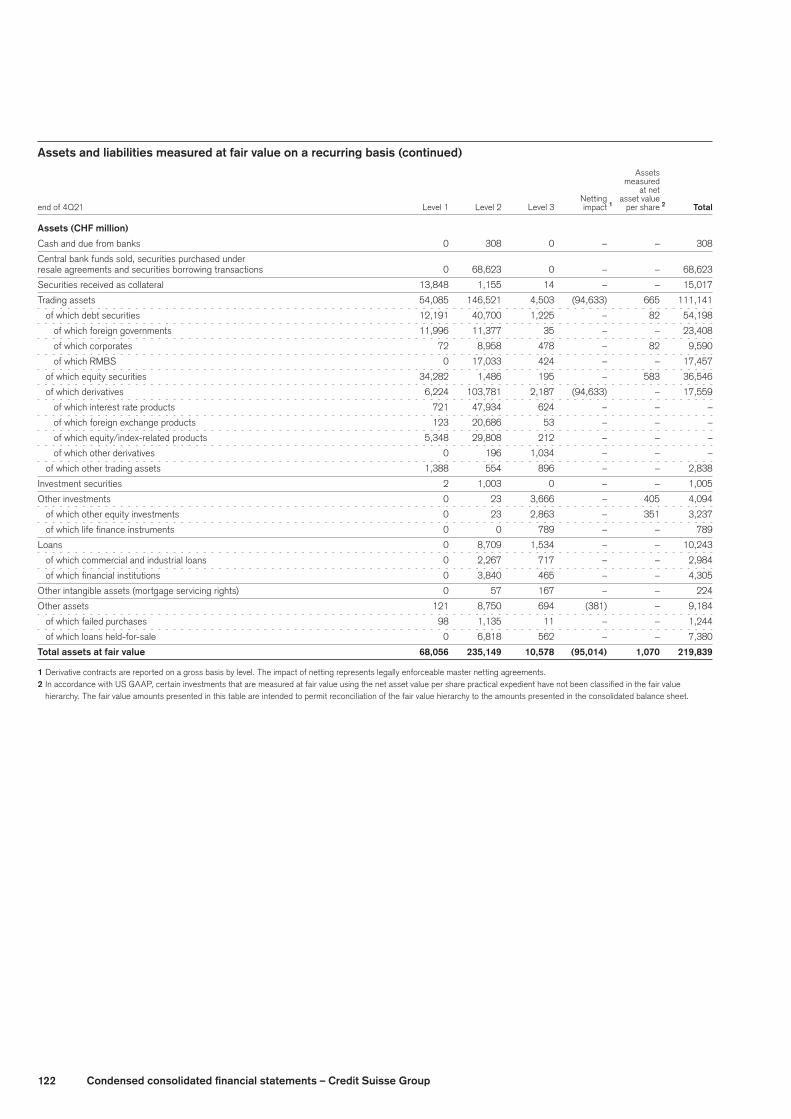
122 Condensedconsolidatedfinancialstatements–CreditSuisseGroup
Assetsandliabilitiesmeasuredatfairvalueonarecurringbasis(continued) Assets measured at net Netting asset value
end of 4Q21 Level 1 Level 2 Level 3 impact 1 per share 2 Total
Assets(CHFmillion)
Cash and due from banks 0 308 0 – – 308
Central bank funds sold, securities purchased under
resale agreements and securities borrowing transactions 0 68,623 0 – – 68,623
Securities received as collateral 13,848 1,155 14 – – 15,017
Trading assets 54,085 146,521 4,503 (94,633) 665 111,141
of which debt securities 12,191 40,700 1,225 – 82 54,198
of which foreign governments 11,996 11,377 35 – – 23,408
of which corporates 72 8,958 478 – 82 9,590
of which RMBS 0 17,033 424 – – 17,457
of which equity securities 34,282 1,486 195 – 583 36,546
of which derivatives 6,224 103,781 2,187 (94,633) – 17,559
of which interest rate products 721 47,934 624 – – –
of which foreign exchange products 123 20,686 53 – – –
of which equity/index-related products 5,348 29,808 212 – – –
of which other derivatives 0 196 1,034 – – –
of which other trading assets 1,388 554 896 – – 2,838
Investment securities 2 1,003 0 – – 1,005
Other investments 0 23 3,666 – 405 4,094
of which other equity investments 0 23 2,863 – 351 3,237
of which life finance instruments 0 0 789 – – 789
Loans 0 8,709 1,534 – – 10,243
of which commercial and industrial loans 0 2,267 717 – – 2,984
of which financial institutions 0 3,840 465 – – 4,305
Other intangible assets (mortgage servicing rights) 0 57 167 – – 224
Other assets 121 8,750 694 (381) – 9,184
of which failed purchases 98 1,135 11 – – 1,244
of which loans held-for-sale 0 6,818 562 – – 7,380
Total assets at fair value 68,056 235,149 10,578 (95,014) 1,070 219,839
1 Derivative contracts are reported on a gross basis by level. The impact of netting represents legally enforceable master netting agreements.2 In accordance with US GAAP, certain investments that are measured at fair value using the net asset value per share practical expedient have not been classified in the fair value
hierarchy. The fair value amounts presented in this table are intended to permit reconciliation of the fair value hierarchy to the amounts presented in the consolidated balance sheet.

123Condensedconsolidatedfinancialstatements–CreditSuisseGroup
Assetsandliabilitiesmeasuredatfairvalueonarecurringbasis(continued) Liabilities measured at net Netting asset value
end of 4Q21 Level 1 Level 2 Level 3 impact 1 per share 2 Total
Liabilities(CHFmillion)
Due to banks 0 477 0 – – 477
Customer deposits 0 3,306 394 – – 3,700
Central bank funds purchased, securities sold under
repurchase agreements and securities lending transactions 0 13,213 0 – – 13,213
Obligation to return securities received as collateral 13,848 1,155 14 – – 15,017
Trading liabilities 19,419 105,828 2,809 (100,522) 1 27,535
of which short positions 11,689 4,974 25 – 1 16,689
of which debt securities 2,809 4,865 3 – – 7,677
of which foreign governments 2,667 968 0 – – 3,635
of which corporates 113 3,839 3 – – 3,955
of which equity securities 8,880 109 22 – 1 9,012
of which derivatives 7,730 100,854 2,784 (100,522) – 10,846
of which interest rate products 776 44,003 26 – – –
of which foreign exchange products 133 22,646 57 – – –
of which equity/index-related products 6,812 27,919 1,787 – – –
Short-term borrowings 0 9,658 1,032 – – 10,690
Long-term debt 0 59,046 9,676 – – 68,722
of which structured notes over one year and up to two years 0 11,036 1,464 – – 12,500
of which structured notes over two years 0 24,168 6,318 – – 30,486
of which other debt instruments over two years 0 3,223 1,854 – – 5,077
of which high-trigger instruments 0 10,702 0 – – 10,702
Other liabilities 348 2,031 518 (305) – 2,592
Total liabilities at fair value 33,615 194,714 14,443 (100,827) 1 141,946
1 Derivative contracts are reported on a gross basis by level. The impact of netting represents legally enforceable master netting agreements.2 In accordance with US GAAP, certain investments that are measured at fair value using the net asset value per share practical expedient have not been classified in the fair value
hierarchy. The fair value amounts presented in this table are intended to permit reconciliation of the fair value hierarchy to the amounts presented in the consolidated balance sheet.
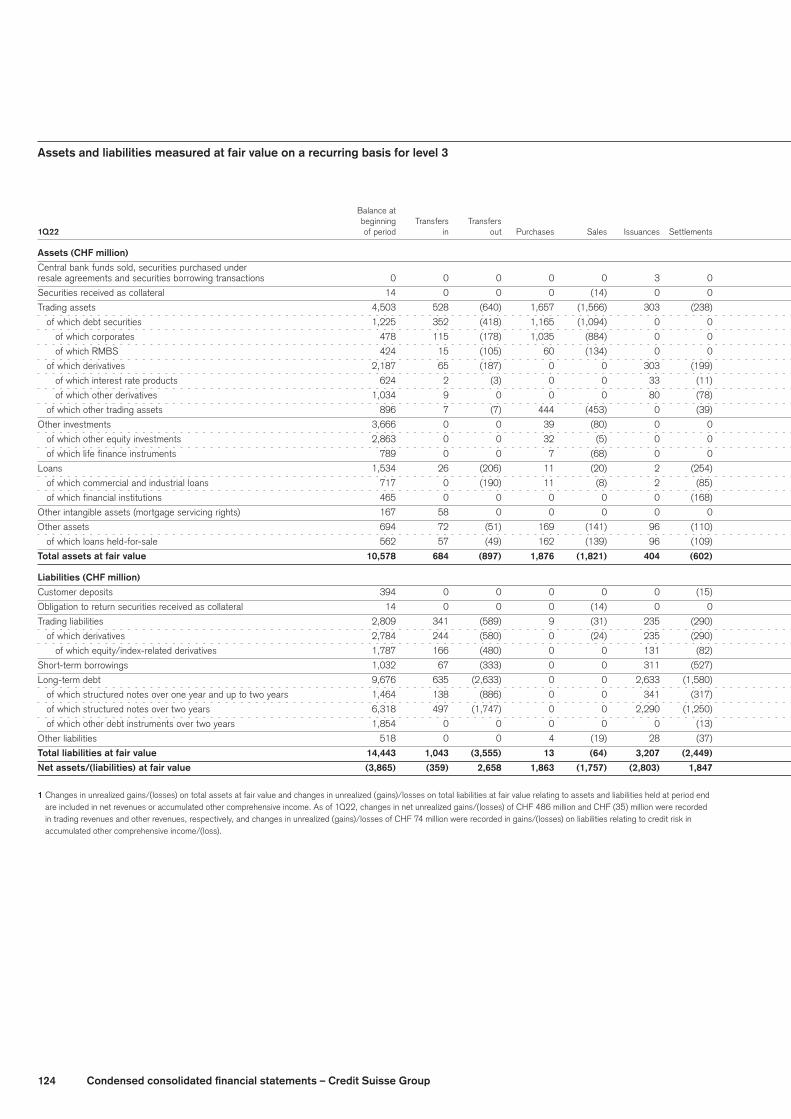
124 Condensedconsolidatedfinancialstatements–CreditSuisseGroup
Assetsandliabilitiesmeasuredatfairvalueonarecurringbasisforlevel3 Accumulated other Trading revenues Other revenues comprehensive income
Foreign Balance at On On On currency Balance Changes in beginning Transfers Transfers transfers On all transfers On all transfers On all translation at end unrealized
1Q22 of period in out Purchases Sales Issuances Settlements out other out other out other impact of period gains/losses 1
Assets(CHFmillion)
Central bank funds sold, securities purchased under
resale agreements and securities borrowing transactions 0 0 0 0 0 3 0 0 0 0 0 0 0 0 3 0
Securities received as collateral 14 0 0 0 (14) 0 0 0 0 0 0 0 0 0 0 0
Trading assets 4,503 528 (640) 1,657 (1,566) 303 (238) 15 (111) 0 (2) 0 0 62 4,511 448
of which debt securities 1,225 352 (418) 1,165 (1,094) 0 0 (24) 5 0 (2) 0 0 25 1,234 337
of which corporates 478 115 (178) 1,035 (884) 0 0 (35) (51) 0 0 0 0 18 498 309
of which RMBS 424 15 (105) 60 (134) 0 0 5 63 0 0 0 0 4 332 34
of which derivatives 2,187 65 (187) 0 0 303 (199) 36 (69) 0 0 0 0 25 2,161 132
of which interest rate products 624 2 (3) 0 0 33 (11) (1) 133 0 0 0 0 4 781 169
of which other derivatives 1,034 9 0 0 0 80 (78) 1 (149) 0 0 0 0 7 904 (139)
of which other trading assets 896 7 (7) 444 (453) 0 (39) 0 9 0 0 0 0 8 865 (17)
Other investments 3,666 0 0 39 (80) 0 0 0 (34) 0 (6) 0 0 25 3,610 (36)
of which other equity investments 2,863 0 0 32 (5) 0 0 0 (18) 0 (9) 0 0 18 2,881 (35)
of which life finance instruments 789 0 0 7 (68) 0 0 0 (16) 0 0 0 0 7 719 (1)
Loans 1,534 26 (206) 11 (20) 2 (254) 21 (7) 0 0 0 0 41 1,148 (35)
of which commercial and industrial loans 717 0 (190) 11 (8) 2 (85) 11 (24) 0 0 0 0 25 459 (29)
of which financial institutions 465 0 0 0 0 0 (168) 0 25 0 0 0 0 13 335 1
Other intangible assets (mortgage servicing rights) 167 58 0 0 0 0 0 0 (10) 0 0 0 0 1 216 (10)
Other assets 694 72 (51) 169 (141) 96 (110) (6) (10) 0 0 0 0 47 760 (1)
of which loans held-for-sale 562 57 (49) 162 (139) 96 (109) 2 6 0 0 0 0 46 634 13
Total assets at fair value 10,578 684 (897) 1,876 (1,821) 404 (602) 30 (172) 0 (8) 0 0 176 10,248 366
Liabilities(CHFmillion)
Customer deposits 394 0 0 0 0 0 (15) 0 (16) 0 0 0 (14) (11) 338 (50)
Obligation to return securities received as collateral 14 0 0 0 (14) 0 0 0 0 0 0 0 0 0 0 0
Trading liabilities 2,809 341 (589) 9 (31) 235 (290) (9) 102 0 0 0 0 28 2,605 171
of which derivatives 2,784 244 (580) 0 (24) 235 (290) (8) 102 0 0 0 0 27 2,490 166
of which equity/index-related derivatives 1,787 166 (480) 0 0 131 (82) (17) (103) 0 0 0 0 21 1,423 8
Short-term borrowings 1,032 67 (333) 0 0 311 (527) (27) 8 0 0 0 0 12 543 32
Long-term debt 9,676 635 (2,633) 0 0 2,633 (1,580) (184) (259) 0 0 (8) (56) 137 8,361 (305)
of which structured notes over one year and up to two years 1,464 138 (886) 0 0 341 (317) (46) 3 0 0 (1) 0 13 709 (5)
of which structured notes over two years 6,318 497 (1,747) 0 0 2,290 (1,250) (137) (274) 0 0 (8) (55) 108 5,742 (300)
of which other debt instruments over two years 1,854 0 0 0 0 0 (13) 0 12 0 0 0 0 17 1,870 0
Other liabilities 518 0 0 4 (19) 28 (37) 0 (1) 0 (19) 0 0 6 480 (7)
Total liabilities at fair value 14,443 1,043 (3,555) 13 (64) 3,207 (2,449) (220) (166) 0 (19) (8) (70) 172 12,327 (159)
Netassets/(liabilities)atfairvalue (3,865) (359) 2,658 1,863 (1,757) (2,803) 1,847 250 (6) 0 11 8 70 4 (2,079) 525
1 Changes in unrealized gains/(losses) on total assets at fair value and changes in unrealized (gains)/losses on total liabilities at fair value relating to assets and liabilities held at period end are included in net revenues or accumulated other comprehensive income. As of 1Q22, changes in net unrealized gains/(losses) of CHF 486 million and CHF (35) million were recorded in trading revenues and other revenues, respectively, and changes in unrealized (gains)/losses of CHF 74 million were recorded in gains/(losses) on liabilities relating to credit risk in accumulated other comprehensive income/(loss).
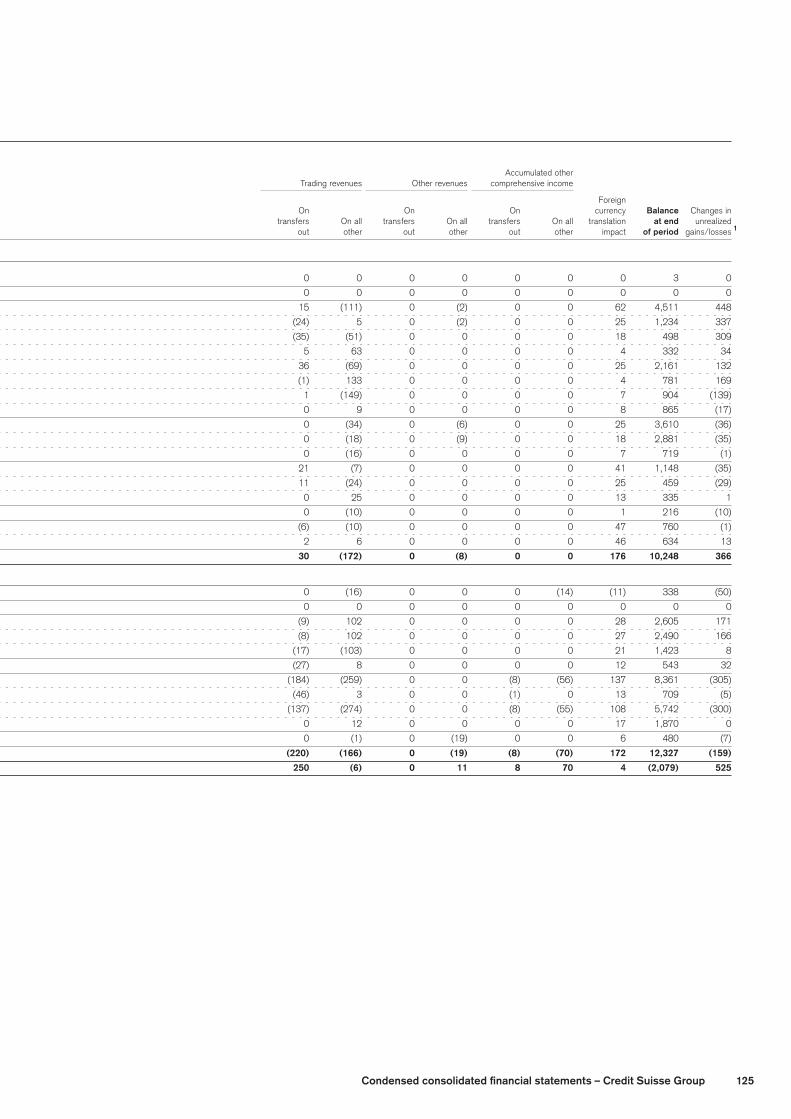
125Condensedconsolidatedfinancialstatements–CreditSuisseGroup
Assetsandliabilitiesmeasuredatfairvalueonarecurringbasisforlevel3 Accumulated other Trading revenues Other revenues comprehensive income
Foreign Balance at On On On currency Balance Changes in beginning Transfers Transfers transfers On all transfers On all transfers On all translation at end unrealized
1Q22 of period in out Purchases Sales Issuances Settlements out other out other out other impact of period gains/losses 1
Assets(CHFmillion)
Central bank funds sold, securities purchased under
resale agreements and securities borrowing transactions 0 0 0 0 0 3 0 0 0 0 0 0 0 0 3 0
Securities received as collateral 14 0 0 0 (14) 0 0 0 0 0 0 0 0 0 0 0
Trading assets 4,503 528 (640) 1,657 (1,566) 303 (238) 15 (111) 0 (2) 0 0 62 4,511 448
of which debt securities 1,225 352 (418) 1,165 (1,094) 0 0 (24) 5 0 (2) 0 0 25 1,234 337
of which corporates 478 115 (178) 1,035 (884) 0 0 (35) (51) 0 0 0 0 18 498 309
of which RMBS 424 15 (105) 60 (134) 0 0 5 63 0 0 0 0 4 332 34
of which derivatives 2,187 65 (187) 0 0 303 (199) 36 (69) 0 0 0 0 25 2,161 132
of which interest rate products 624 2 (3) 0 0 33 (11) (1) 133 0 0 0 0 4 781 169
of which other derivatives 1,034 9 0 0 0 80 (78) 1 (149) 0 0 0 0 7 904 (139)
of which other trading assets 896 7 (7) 444 (453) 0 (39) 0 9 0 0 0 0 8 865 (17)
Other investments 3,666 0 0 39 (80) 0 0 0 (34) 0 (6) 0 0 25 3,610 (36)
of which other equity investments 2,863 0 0 32 (5) 0 0 0 (18) 0 (9) 0 0 18 2,881 (35)
of which life finance instruments 789 0 0 7 (68) 0 0 0 (16) 0 0 0 0 7 719 (1)
Loans 1,534 26 (206) 11 (20) 2 (254) 21 (7) 0 0 0 0 41 1,148 (35)
of which commercial and industrial loans 717 0 (190) 11 (8) 2 (85) 11 (24) 0 0 0 0 25 459 (29)
of which financial institutions 465 0 0 0 0 0 (168) 0 25 0 0 0 0 13 335 1
Other intangible assets (mortgage servicing rights) 167 58 0 0 0 0 0 0 (10) 0 0 0 0 1 216 (10)
Other assets 694 72 (51) 169 (141) 96 (110) (6) (10) 0 0 0 0 47 760 (1)
of which loans held-for-sale 562 57 (49) 162 (139) 96 (109) 2 6 0 0 0 0 46 634 13
Total assets at fair value 10,578 684 (897) 1,876 (1,821) 404 (602) 30 (172) 0 (8) 0 0 176 10,248 366
Liabilities(CHFmillion)
Customer deposits 394 0 0 0 0 0 (15) 0 (16) 0 0 0 (14) (11) 338 (50)
Obligation to return securities received as collateral 14 0 0 0 (14) 0 0 0 0 0 0 0 0 0 0 0
Trading liabilities 2,809 341 (589) 9 (31) 235 (290) (9) 102 0 0 0 0 28 2,605 171
of which derivatives 2,784 244 (580) 0 (24) 235 (290) (8) 102 0 0 0 0 27 2,490 166
of which equity/index-related derivatives 1,787 166 (480) 0 0 131 (82) (17) (103) 0 0 0 0 21 1,423 8
Short-term borrowings 1,032 67 (333) 0 0 311 (527) (27) 8 0 0 0 0 12 543 32
Long-term debt 9,676 635 (2,633) 0 0 2,633 (1,580) (184) (259) 0 0 (8) (56) 137 8,361 (305)
of which structured notes over one year and up to two years 1,464 138 (886) 0 0 341 (317) (46) 3 0 0 (1) 0 13 709 (5)
of which structured notes over two years 6,318 497 (1,747) 0 0 2,290 (1,250) (137) (274) 0 0 (8) (55) 108 5,742 (300)
of which other debt instruments over two years 1,854 0 0 0 0 0 (13) 0 12 0 0 0 0 17 1,870 0
Other liabilities 518 0 0 4 (19) 28 (37) 0 (1) 0 (19) 0 0 6 480 (7)
Total liabilities at fair value 14,443 1,043 (3,555) 13 (64) 3,207 (2,449) (220) (166) 0 (19) (8) (70) 172 12,327 (159)
Netassets/(liabilities)atfairvalue (3,865) (359) 2,658 1,863 (1,757) (2,803) 1,847 250 (6) 0 11 8 70 4 (2,079) 525
1 Changes in unrealized gains/(losses) on total assets at fair value and changes in unrealized (gains)/losses on total liabilities at fair value relating to assets and liabilities held at period end are included in net revenues or accumulated other comprehensive income. As of 1Q22, changes in net unrealized gains/(losses) of CHF 486 million and CHF (35) million were recorded in trading revenues and other revenues, respectively, and changes in unrealized (gains)/losses of CHF 74 million were recorded in gains/(losses) on liabilities relating to credit risk in accumulated other comprehensive income/(loss).
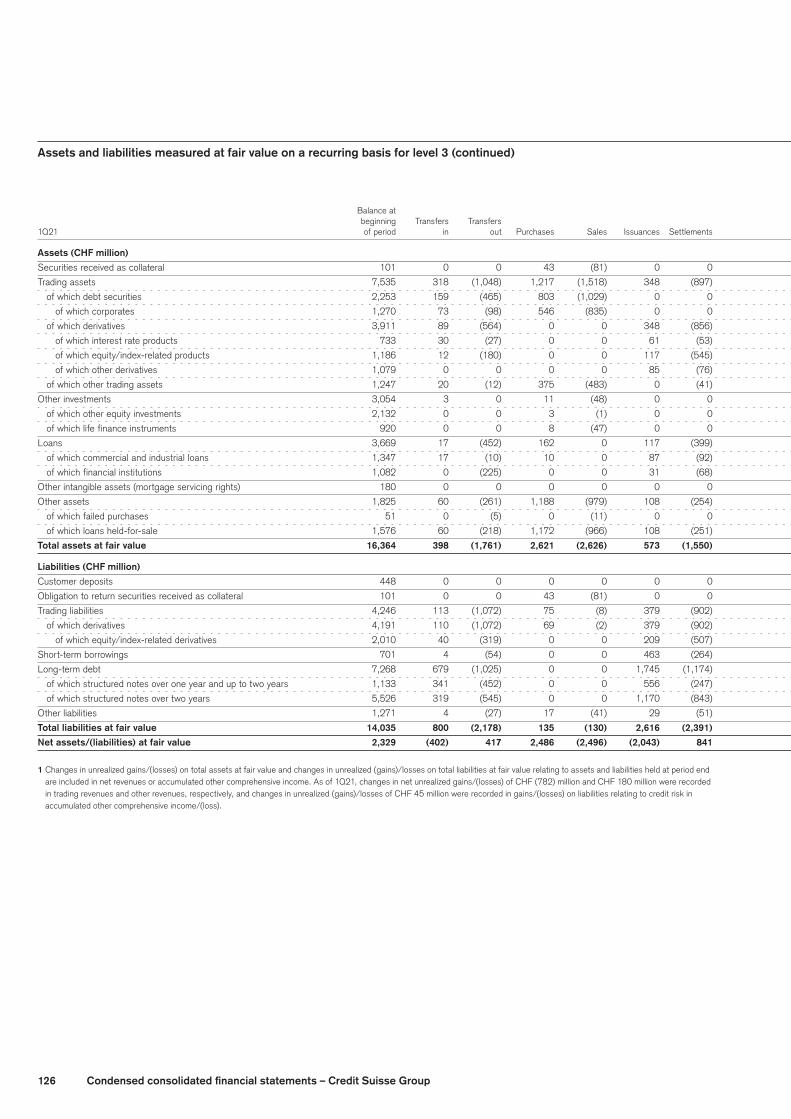
126 Condensedconsolidatedfinancialstatements–CreditSuisseGroup
Assetsandliabilitiesmeasuredatfairvalueonarecurringbasisforlevel3(continued) Accumulated other Trading revenues Other revenues comprehensive income
Foreign Balance at On On On currency Balance Changes in beginning Transfers Transfers transfers On all transfers On all transfers On all translation at end unrealized
1Q21 of period in out Purchases Sales Issuances Settlements out other out other out other impact of period gains/losses 1
Assets(CHFmillion)
Securities received as collateral 101 0 0 43 (81) 0 0 0 0 0 0 0 0 4 67 0
Trading assets 7,535 318 (1,048) 1,217 (1,518) 348 (897) 57 (1) 0 1 0 0 464 6,476 (364)
of which debt securities 2,253 159 (465) 803 (1,029) 0 0 6 130 0 0 0 0 166 2,023 78
of which corporates 1,270 73 (98) 546 (835) 0 0 4 103 0 0 0 0 104 1,167 85
of which derivatives 3,911 89 (564) 0 0 348 (856) 45 (77) 0 1 0 0 211 3,108 (361)
of which interest rate products 733 30 (27) 0 0 61 (53) 0 89 0 1 0 0 33 867 138
of which equity/index-related products 1,186 12 (180) 0 0 117 (545) 46 (81) 0 0 0 0 50 605 (455)
of which other derivatives 1,079 0 0 0 0 85 (76) (1) (105) 0 0 0 0 70 1,052 (113)
of which other trading assets 1,247 20 (12) 375 (483) 0 (41) 1 (56) 0 0 0 0 76 1,127 (90)
Other investments 3,054 3 0 11 (48) 0 0 0 (25) 0 161 0 0 99 3,255 174
of which other equity investments 2,132 0 0 3 (1) 0 0 0 1 0 161 0 0 38 2,334 178
of which life finance instruments 920 0 0 8 (47) 0 0 0 (26) 0 0 0 0 61 916 (6)
Loans 3,669 17 (452) 162 0 117 (399) (8) (9) 0 1 0 0 195 3,293 (30)
of which commercial and industrial loans 1,347 17 (10) 10 0 87 (92) 1 21 0 1 0 0 66 1,448 2
of which financial institutions 1,082 0 (225) 0 0 31 (68) 3 (15) 0 0 0 0 46 854 (15)
Other intangible assets (mortgage servicing rights) 180 0 0 0 0 0 0 0 0 0 (11) 0 0 12 181 (11)
Other assets 1,825 60 (261) 1,188 (979) 108 (254) 9 (59) 0 0 0 0 100 1,737 (54)
of which failed purchases 51 0 (5) 0 (11) 0 0 0 (3) 0 0 0 0 5 37 (3)
of which loans held-for-sale 1,576 60 (218) 1,172 (966) 108 (251) 7 (17) 0 0 0 0 84 1,555 (31)
Total assets at fair value 16,364 398 (1,761) 2,621 (2,626) 573 (1,550) 58 (94) 0 152 0 0 874 15,009 (285)
Liabilities(CHFmillion)
Customer deposits 448 0 0 0 0 0 0 0 (7) 0 0 0 (14) 12 439 8
Obligation to return securities received as collateral 101 0 0 43 (81) 0 0 0 0 0 0 0 0 4 67 0
Trading liabilities 4,246 113 (1,072) 75 (8) 379 (902) 57 42 0 1 0 0 268 3,199 360
of which derivatives 4,191 110 (1,072) 69 (2) 379 (902) 57 50 0 1 0 0 265 3,146 363
of which equity/index-related derivatives 2,010 40 (319) 0 0 209 (507) 56 115 0 0 0 0 126 1,730 (6)
Short-term borrowings 701 4 (54) 0 0 463 (264) (4) 34 0 0 0 0 55 935 16
Long-term debt 7,268 679 (1,025) 0 0 1,745 (1,174) 8 (275) 0 6 (3) (51) 495 7,673 (114)
of which structured notes over one year and up to two years 1,133 341 (452) 0 0 556 (247) 15 (17) 0 0 0 (1) 89 1,417 27
of which structured notes over two years 5,526 319 (545) 0 0 1,170 (843) (6) (240) 0 0 (3) (49) 376 5,705 (122)
Other liabilities 1,271 4 (27) 17 (41) 29 (51) 3 (22) 0 67 0 0 77 1,327 2
Total liabilities at fair value 14,035 800 (2,178) 135 (130) 2,616 (2,391) 64 (228) 0 74 (3) (65) 911 13,640 272
Netassets/(liabilities)atfairvalue 2,329 (402) 417 2,486 (2,496) (2,043) 841 (6) 134 0 78 3 65 (37) 1,369 (557)
1 Changes in unrealized gains/(losses) on total assets at fair value and changes in unrealized (gains)/losses on total liabilities at fair value relating to assets and liabilities held at period end are included in net revenues or accumulated other comprehensive income. As of 1Q21, changes in net unrealized gains/(losses) of CHF (782) million and CHF 180 million were recorded in trading revenues and other revenues, respectively, and changes in unrealized (gains)/losses of CHF 45 million were recorded in gains/(losses) on liabilities relating to credit risk in accumulated other comprehensive income/(loss).

127Condensedconsolidatedfinancialstatements–CreditSuisseGroup
Assetsandliabilitiesmeasuredatfairvalueonarecurringbasisforlevel3(continued) Accumulated other Trading revenues Other revenues comprehensive income
Foreign Balance at On On On currency Balance Changes in beginning Transfers Transfers transfers On all transfers On all transfers On all translation at end unrealized
1Q21 of period in out Purchases Sales Issuances Settlements out other out other out other impact of period gains/losses 1
Assets(CHFmillion)
Securities received as collateral 101 0 0 43 (81) 0 0 0 0 0 0 0 0 4 67 0
Trading assets 7,535 318 (1,048) 1,217 (1,518) 348 (897) 57 (1) 0 1 0 0 464 6,476 (364)
of which debt securities 2,253 159 (465) 803 (1,029) 0 0 6 130 0 0 0 0 166 2,023 78
of which corporates 1,270 73 (98) 546 (835) 0 0 4 103 0 0 0 0 104 1,167 85
of which derivatives 3,911 89 (564) 0 0 348 (856) 45 (77) 0 1 0 0 211 3,108 (361)
of which interest rate products 733 30 (27) 0 0 61 (53) 0 89 0 1 0 0 33 867 138
of which equity/index-related products 1,186 12 (180) 0 0 117 (545) 46 (81) 0 0 0 0 50 605 (455)
of which other derivatives 1,079 0 0 0 0 85 (76) (1) (105) 0 0 0 0 70 1,052 (113)
of which other trading assets 1,247 20 (12) 375 (483) 0 (41) 1 (56) 0 0 0 0 76 1,127 (90)
Other investments 3,054 3 0 11 (48) 0 0 0 (25) 0 161 0 0 99 3,255 174
of which other equity investments 2,132 0 0 3 (1) 0 0 0 1 0 161 0 0 38 2,334 178
of which life finance instruments 920 0 0 8 (47) 0 0 0 (26) 0 0 0 0 61 916 (6)
Loans 3,669 17 (452) 162 0 117 (399) (8) (9) 0 1 0 0 195 3,293 (30)
of which commercial and industrial loans 1,347 17 (10) 10 0 87 (92) 1 21 0 1 0 0 66 1,448 2
of which financial institutions 1,082 0 (225) 0 0 31 (68) 3 (15) 0 0 0 0 46 854 (15)
Other intangible assets (mortgage servicing rights) 180 0 0 0 0 0 0 0 0 0 (11) 0 0 12 181 (11)
Other assets 1,825 60 (261) 1,188 (979) 108 (254) 9 (59) 0 0 0 0 100 1,737 (54)
of which failed purchases 51 0 (5) 0 (11) 0 0 0 (3) 0 0 0 0 5 37 (3)
of which loans held-for-sale 1,576 60 (218) 1,172 (966) 108 (251) 7 (17) 0 0 0 0 84 1,555 (31)
Total assets at fair value 16,364 398 (1,761) 2,621 (2,626) 573 (1,550) 58 (94) 0 152 0 0 874 15,009 (285)
Liabilities(CHFmillion)
Customer deposits 448 0 0 0 0 0 0 0 (7) 0 0 0 (14) 12 439 8
Obligation to return securities received as collateral 101 0 0 43 (81) 0 0 0 0 0 0 0 0 4 67 0
Trading liabilities 4,246 113 (1,072) 75 (8) 379 (902) 57 42 0 1 0 0 268 3,199 360
of which derivatives 4,191 110 (1,072) 69 (2) 379 (902) 57 50 0 1 0 0 265 3,146 363
of which equity/index-related derivatives 2,010 40 (319) 0 0 209 (507) 56 115 0 0 0 0 126 1,730 (6)
Short-term borrowings 701 4 (54) 0 0 463 (264) (4) 34 0 0 0 0 55 935 16
Long-term debt 7,268 679 (1,025) 0 0 1,745 (1,174) 8 (275) 0 6 (3) (51) 495 7,673 (114)
of which structured notes over one year and up to two years 1,133 341 (452) 0 0 556 (247) 15 (17) 0 0 0 (1) 89 1,417 27
of which structured notes over two years 5,526 319 (545) 0 0 1,170 (843) (6) (240) 0 0 (3) (49) 376 5,705 (122)
Other liabilities 1,271 4 (27) 17 (41) 29 (51) 3 (22) 0 67 0 0 77 1,327 2
Total liabilities at fair value 14,035 800 (2,178) 135 (130) 2,616 (2,391) 64 (228) 0 74 (3) (65) 911 13,640 272
Netassets/(liabilities)atfairvalue 2,329 (402) 417 2,486 (2,496) (2,043) 841 (6) 134 0 78 3 65 (37) 1,369 (557)
1 Changes in unrealized gains/(losses) on total assets at fair value and changes in unrealized (gains)/losses on total liabilities at fair value relating to assets and liabilities held at period end are included in net revenues or accumulated other comprehensive income. As of 1Q21, changes in net unrealized gains/(losses) of CHF (782) million and CHF 180 million were recorded in trading revenues and other revenues, respectively, and changes in unrealized (gains)/losses of CHF 45 million were recorded in gains/(losses) on liabilities relating to credit risk in accumulated other comprehensive income/(loss).
128 Condensedconsolidatedfinancialstatements–CreditSuisseGroup
Both observable and unobservable inputs may be used to deter-mine the fair value of positions that have been classified within level 3. As a result, the unrealized gains and losses for assets and liabilities within level 3 presented in the tables above may include changes in fair value that were attributable to both observable and unobservable inputs.
The Group employs various economic hedging techniques in order to manage risks, including risks in level 3 positions. Such tech-niques may include the purchase or sale of financial instruments that are classified in levels 1 and/or 2. The realized and unrealized gains and losses for assets and liabilities in level 3 presented in the tables above do not reflect the related realized or unrealized gains and losses arising on economic hedging instruments classi-fied in levels 1 and/or 2.
The Group typically uses nonfinancial assets measured at fair value on a recurring or nonrecurring basis in a manner that reflects their highest and best use.
Transfers in and out of level 3Transfers into level 3 assets during 1Q22 were CHF 684 mil-lion, primarily from trading assets. These transfers were primarily in the GTS and securitized products businesses, due to limited observability of pricing data and reduced pricing information from external providers. Transfers out of level 3 assets during 1Q22 were CHF 897 million, primarily in trading assets and loans. These transfers were mainly related to GTS and securitized prod-ucts businesses, due to improved observability of pricing data and increased availability of pricing information from external providers.
Transfers out of level 3 liabilities of CHF 3,555 million in 1Q22 primarily reflected transfers of structured notes arising from a change in the observability of pricing data.
UncertaintyoffairvaluemeasurementsatthereportingdatefromtheuseofsignificantunobservableinputsFor level 3 assets with significant unobservable inputs of buyback probability, contingent probability, dividend yield, mean reversion, mortality rate, price, recovery rate, volatility or unadjusted NAV, in general, an increase in the significant unobservable input would increase the fair value. For level 3 assets with significant unob-servable inputs of correlation, credit spread, default rate, discount rate, fund gap risk, gap risk, market implied life expectancy (for life settlement and premium finance instruments), prepayment rate or tax swap rate, in general, an increase in the significant unobservable input would decrease the fair value.
For level 3 liabilities, in general, an increase in the related signifi-cant unobservable inputs would have an inverse impact on fair value. An increase in the significant unobservable inputs contin-gent probability, credit spread, discount rate, fund gap risk, gap risk, market implied life expectancy, mortality rate or price would increase the fair value. An increase in the significant unobserv-able inputs of buyback probability, correlation, dividend yield, mean reversion, prepayment rate, price, unadjusted NAV or vola-tility would decrease the fair value.
InterrelationshipsbetweensignificantunobservableinputsExcept as noted above, there are no material interrelationships between the significant unobservable inputs for the financial instruments. As the significant unobservable inputs move inde-pendently, generally an increase or decrease in one significant unobservable input will have no impact on the other significant unobservable inputs.
Quantitative disclosures of valuation techniques
The following tables provide the representative range of minimum and maximum values and the associated weighted averages of each significant unobservable input for level 3 assets and liabili-ties by the related valuation technique most significant to the related financial instrument.
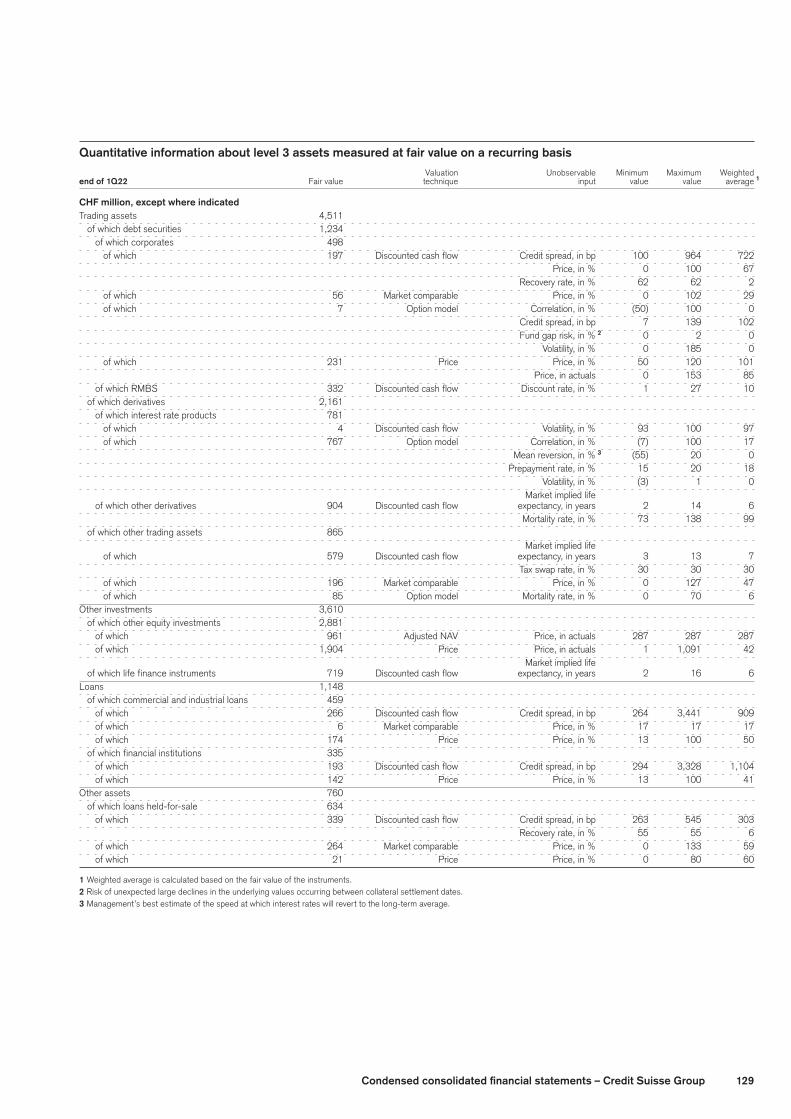
129Condensedconsolidatedfinancialstatements–CreditSuisseGroup
Quantitativeinformationaboutlevel 3assetsmeasuredatfairvalueonarecurringbasis Valuation Unobservable Minimum Maximum Weighted
end of 1Q22 Fair value technique input value value average 1
CHFmillion,exceptwhereindicated Trading assets 4,511
of which debt securities 1,234
of which corporates 498
of which 197 Discounted cash flow Credit spread, in bp 100 964 722
Price, in % 0 100 67
Recovery rate, in % 62 62 2
of which 56 Market comparable Price, in % 0 102 29
of which 7 Option model Correlation, in % (50) 100 0
Credit spread, in bp 7 139 102
Fund gap risk, in % 2 0 2 0
Volatility, in % 0 185 0
of which 231 Price Price, in % 50 120 101
Price, in actuals 0 153 85
of which RMBS 332 Discounted cash flow Discount rate, in % 1 27 10
of which derivatives 2,161
of which interest rate products 781
of which 4 Discounted cash flow Volatility, in % 93 100 97
of which 767 Option model Correlation, in % (7) 100 17
Mean reversion, in % 3 (55) 20 0
Prepayment rate, in % 15 20 18
Volatility, in % (3) 1 0
Market implied life
of which other derivatives 904 Discounted cash flow expectancy, in years 2 14 6
Mortality rate, in % 73 138 99
of which other trading assets 865
Market implied life
of which 579 Discounted cash flow expectancy, in years 3 13 7
Tax swap rate, in % 30 30 30
of which 196 Market comparable Price, in % 0 127 47
of which 85 Option model Mortality rate, in % 0 70 6
Other investments 3,610
of which other equity investments 2,881
of which 961 Adjusted NAV Price, in actuals 287 287 287
of which 1,904 Price Price, in actuals 1 1,091 42
Market implied life
of which life finance instruments 719 Discounted cash flow expectancy, in years 2 16 6
Loans 1,148
of which commercial and industrial loans 459
of which 266 Discounted cash flow Credit spread, in bp 264 3,441 909
of which 6 Market comparable Price, in % 17 17 17
of which 174 Price Price, in % 13 100 50
of which financial institutions 335
of which 193 Discounted cash flow Credit spread, in bp 294 3,328 1,104
of which 142 Price Price, in % 13 100 41
Other assets 760
of which loans held-for-sale 634
of which 339 Discounted cash flow Credit spread, in bp 263 545 303
Recovery rate, in % 55 55 6
of which 264 Market comparable Price, in % 0 133 59
of which 21 Price Price, in % 0 80 60
1 Weighted average is calculated based on the fair value of the instruments.2 Risk of unexpected large declines in the underlying values occurring between collateral settlement dates.3 Management’s best estimate of the speed at which interest rates will revert to the long-term average.
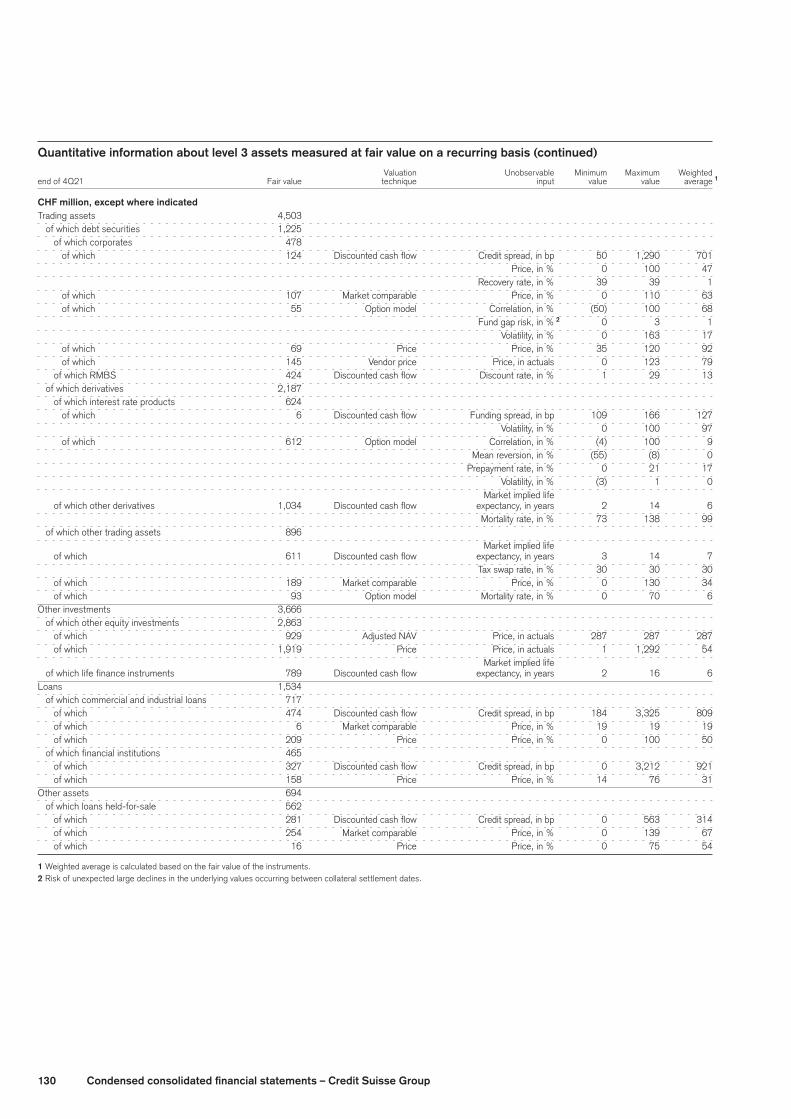
130 Condensedconsolidatedfinancialstatements–CreditSuisseGroup
Quantitativeinformationaboutlevel 3assetsmeasuredatfairvalueonarecurringbasis(continued) Valuation Unobservable Minimum Maximum Weighted
end of 4Q21 Fair value technique input value value average 1
CHFmillion,exceptwhereindicated Trading assets 4,503
of which debt securities 1,225
of which corporates 478
of which 124 Discounted cash flow Credit spread, in bp 50 1,290 701
Price, in % 0 100 47
Recovery rate, in % 39 39 1
of which 107 Market comparable Price, in % 0 110 63
of which 55 Option model Correlation, in % (50) 100 68
Fund gap risk, in % 2 0 3 1
Volatility, in % 0 163 17
of which 69 Price Price, in % 35 120 92
of which 145 Vendor price Price, in actuals 0 123 79
of which RMBS 424 Discounted cash flow Discount rate, in % 1 29 13
of which derivatives 2,187
of which interest rate products 624
of which 6 Discounted cash flow Funding spread, in bp 109 166 127
Volatility, in % 0 100 97
of which 612 Option model Correlation, in % (4) 100 9
Mean reversion, in % (55) (8) 0
Prepayment rate, in % 0 21 17
Volatility, in % (3) 1 0
Market implied life
of which other derivatives 1,034 Discounted cash flow expectancy, in years 2 14 6
Mortality rate, in % 73 138 99
of which other trading assets 896
Market implied life
of which 611 Discounted cash flow expectancy, in years 3 14 7
Tax swap rate, in % 30 30 30
of which 189 Market comparable Price, in % 0 130 34
of which 93 Option model Mortality rate, in % 0 70 6
Other investments 3,666
of which other equity investments 2,863
of which 929 Adjusted NAV Price, in actuals 287 287 287
of which 1,919 Price Price, in actuals 1 1,292 54
Market implied life
of which life finance instruments 789 Discounted cash flow expectancy, in years 2 16 6
Loans 1,534
of which commercial and industrial loans 717
of which 474 Discounted cash flow Credit spread, in bp 184 3,325 809
of which 6 Market comparable Price, in % 19 19 19
of which 209 Price Price, in % 0 100 50
of which financial institutions 465
of which 327 Discounted cash flow Credit spread, in bp 0 3,212 921
of which 158 Price Price, in % 14 76 31
Other assets 694
of which loans held-for-sale 562
of which 281 Discounted cash flow Credit spread, in bp 0 563 314
of which 254 Market comparable Price, in % 0 139 67
of which 16 Price Price, in % 0 75 54
1 Weighted average is calculated based on the fair value of the instruments.2 Risk of unexpected large declines in the underlying values occurring between collateral settlement dates.

131Condensedconsolidatedfinancialstatements–CreditSuisseGroup
Quantitativeinformationaboutlevel 3liabilitiesmeasuredatfairvalueonarecurringbasis Valuation Unobservable Minimum Maximum Weighted
end of 1Q22 Fair value technique input value value average 1
CHFmillion,exceptwhereindicated
Trading liabilities 2,605
of which derivatives 2,490
of which equity/index-related derivatives 1,423
of which 1,328 Option model Buyback probability, in % 2 50 100 75
Correlation, in % (50) 100 66
Dividend yield, in % 0 9 5
Unadjusted NAV, in actuals 101 431 337
Volatility, in % (1) 185 14
of which 65 Price Price, in actuals 0 1,447 33
Short-term borrowings 543
of which 25 Discounted cash flow Credit spread, in bp 50 198 32
of which 432 Option model Buyback probability, in % 2 50 100 75
Correlation, in % (50) 100 68
Fund gap risk, in % 3 0 2 1
Gap risk, in % 3 0 3 1
Volatility, in % 0 185 9
of which 78 Price Price, in % 19 120 96
Long-term debt 8,361
of which structured notes over one year and
up to two years 709
of which 2 Discounted cash flow Credit spread, in bp 198 198 99
of which 707 Option model Buyback probability, in % 2 50 100 75
Correlation, in % (50) 100 68
Fund gap risk, in % 3 0 2 1
Gap risk, in % 3 0 3 1
Mean revision, in % 4 15 15 15
Volatility, in % 0 185 13
of which structured notes over two years 5,742
of which 482 Discounted cash flow Credit spread, in bp 8 1,657 73
of which 5,224 Option model Buyback probability, in % 2 50 100 75
Correlation, in % (50) 100 68
Credit spread, in bp 7 139 102
Fund gap risk, in % 3 0 2 1
Mean reversion, in % 4 15 15 7
Unadjusted NAV, in actuals 101 431 337
Volatility, in % 0 185 11
of which 9 Price Price, in % 26 26 26
of which other debt instruments over two years 1,870
of which 377 Option model Buyback probability, in % 2 50 100 75
Correlation, in % 16 30 24
Price, in actuals 9 9 9
of which 1,492 Price Price, in actuals 9 9 9
1 Weighted average is calculated based on the fair value of the instruments.2 Estimate of probability of structured notes being put back to the Group at the option of the investor over the remaining life of the financial instruments.3 Risk of unexpected large declines in the underlying values occurring between collateral settlement dates.4 Management’s best estimate of the speed at which interest rates will revert to the long-term average.
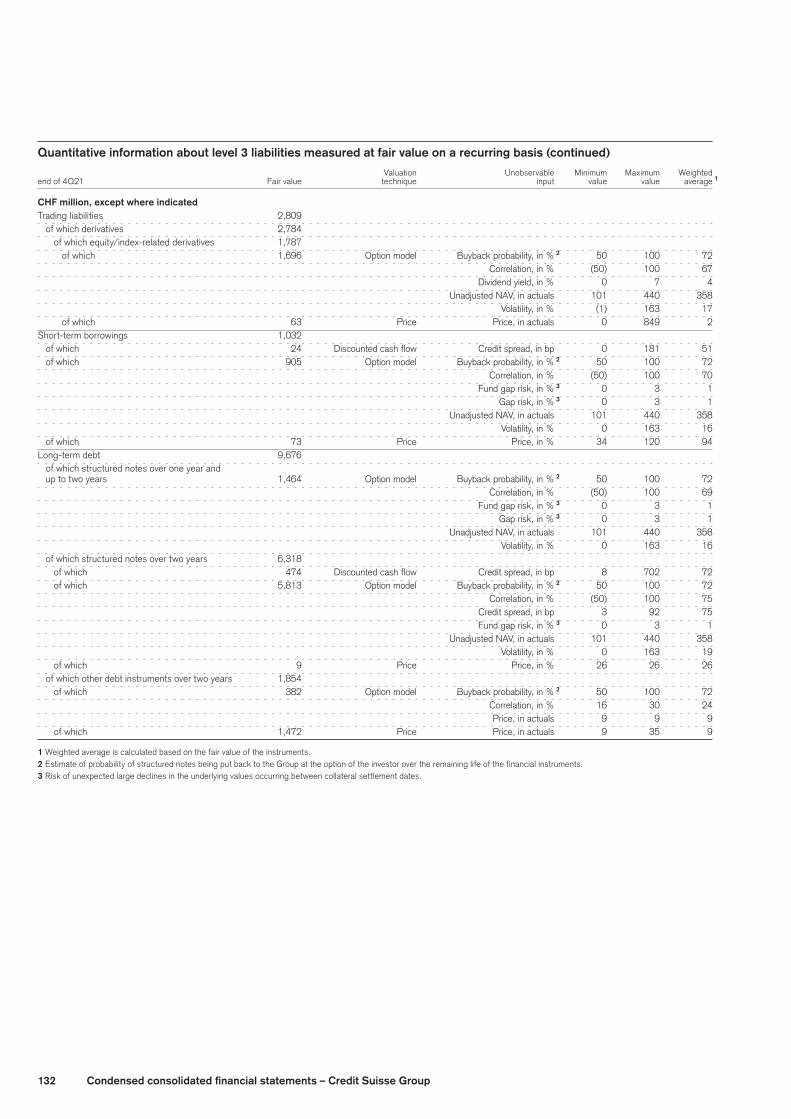
132 Condensedconsolidatedfinancialstatements–CreditSuisseGroup
Quantitativeinformationaboutlevel 3liabilitiesmeasuredatfairvalueonarecurringbasis(continued) Valuation Unobservable Minimum Maximum Weighted
end of 4Q21 Fair value technique input value value average 1
CHFmillion,exceptwhereindicated
Trading liabilities 2,809
of which derivatives 2,784
of which equity/index-related derivatives 1,787
of which 1,696 Option model Buyback probability, in % 2 50 100 72
Correlation, in % (50) 100 67
Dividend yield, in % 0 7 4
Unadjusted NAV, in actuals 101 440 358
Volatility, in % (1) 163 17
of which 63 Price Price, in actuals 0 849 2
Short-term borrowings 1,032
of which 24 Discounted cash flow Credit spread, in bp 0 181 51
of which 905 Option model Buyback probability, in % 2 50 100 72
Correlation, in % (50) 100 70
Fund gap risk, in % 3 0 3 1
Gap risk, in % 3 0 3 1
Unadjusted NAV, in actuals 101 440 358
Volatility, in % 0 163 16
of which 73 Price Price, in % 34 120 94
Long-term debt 9,676
of which structured notes over one year and
up to two years 1,464 Option model Buyback probability, in % 2 50 100 72
Correlation, in % (50) 100 69
Fund gap risk, in % 3 0 3 1
Gap risk, in % 3 0 3 1
Unadjusted NAV, in actuals 101 440 358
Volatility, in % 0 163 16
of which structured notes over two years 6,318
of which 474 Discounted cash flow Credit spread, in bp 8 702 72
of which 5,813 Option model Buyback probability, in % 2 50 100 72
Correlation, in % (50) 100 75
Credit spread, in bp 3 92 75
Fund gap risk, in % 3 0 3 1
Unadjusted NAV, in actuals 101 440 358
Volatility, in % 0 163 19
of which 9 Price Price, in % 26 26 26
of which other debt instruments over two years 1,854
of which 382 Option model Buyback probability, in % 2 50 100 72
Correlation, in % 16 30 24
Price, in actuals 9 9 9
of which 1,472 Price Price, in actuals 9 35 9
1 Weighted average is calculated based on the fair value of the instruments.2 Estimate of probability of structured notes being put back to the Group at the option of the investor over the remaining life of the financial instruments.3 Risk of unexpected large declines in the underlying values occurring between collateral settlement dates.

133Condensedconsolidatedfinancialstatements–CreditSuisseGroup
Qualitativediscussionoftherangesofsignificantunobservable inputsThe level of aggregation and diversity within the financial instru-ments disclosed in the tables above results in certain ranges of significant inputs being wide and unevenly distributed across asset and liability categories.
> Refer to “Note 36 – Financial instruments” in VI – Consolidated financial state-ments – Credit Suisse Group in the Credit Suisse Annual Report 2021 for further information on the Group’s qualitative discussion of the ranges of signi-fication unobservable inputs.
InvestmentfundsmeasuredatnetassetvaluepershareCertain investment funds are measured at net asset value per share.
> Refer to “Note 36 – Financial instruments” in VI – Consolidated financial state-ments – Credit Suisse Group in the Credit Suisse Annual Report 2021 for fur-ther information on investment funds measured at net asset value per share.
Assetsandliabilitiesmeasuredatfairvalueonanonre-curring basisCertain assets and liabilities are measured at fair value on a non-recurring basis; that is, they are not measured at fair value on an
ongoing basis but are subject to fair value adjustments in certain circumstances.
> Refer to “Note 36 – Financial instruments” in VI – Consolidated financial state-ments – Credit Suisse Group in the Credit Suisse Annual Report 2021 for further information on assets and liabilities measured at fair value on a nonre-curring basis.
Fairvalueoption
The Group has availed itself of the simplification in accounting offered under the fair value option. This has been accomplished generally by electing the fair value option, both at initial adoption and for subsequent transactions, on items impacted by the hedge accounting requirements of US GAAP. For instruments for which hedge accounting could not be achieved but for which the Group is economically hedged, the Group has generally elected the fair value option. Where the Group manages an activity on a fair value basis but previously has been unable to achieve fair value accounting, the Group has generally utilized the fair value option to align its financial accounting to its risk management reporting.
> Refer to “Note 36 – Financial instruments” in VI – Consolidated financial state-ments – Credit Suisse Group in the Credit Suisse Annual Report 2021 for fur-ther information on the Group’s election of the fair value option.
Differencebetweentheaggregatefairvalueandunpaidprincipalbalancesoffairvalueoption-electedfinancialinstruments 1Q22 4Q21
Aggregate Aggregate Aggregate Aggregate fair unpaid fair unpaid
end of value principal Difference value principal Difference
Financialinstruments(CHFmillion)
Central bank funds sold, securities purchased under
resale agreements and securities borrowing transactions 71,059 70,985 74 68,623 68,565 58
Loans 9,545 10,342 (797) 10,243 11,035 (792)
Other assets 1 8,842 11,098 (2,256) 8,624 10,777 (2,153)
Due to banks and customer deposits (441) (490) 49 (493) (442) (51)
Central bank funds purchased, securities sold under
repurchase agreements and securities lending transactions (12,766) (12,765) (1) (13,213) (13,212) (1)
Short-term borrowings (8,225) (8,655) 430 (10,690) (10,996) 306
Long-term debt 2 (66,270) (72,610) 6,340 (68,722) (71,833) 3,111
Other liabilities (1,078) (1,319) 241 (1,170) (1,403) 233
Non-performing and non-interest-earning loans 3 826 2,948 (2,122) 843 2,657 (1,814)
1 Primarily loans held-for-sale.2 Long-term debt includes both principal-protected and non-principal protected instruments. For non-principal-protected instruments, the original notional amount has been reported in the
aggregate unpaid principal.3 Included in loans or other assets.
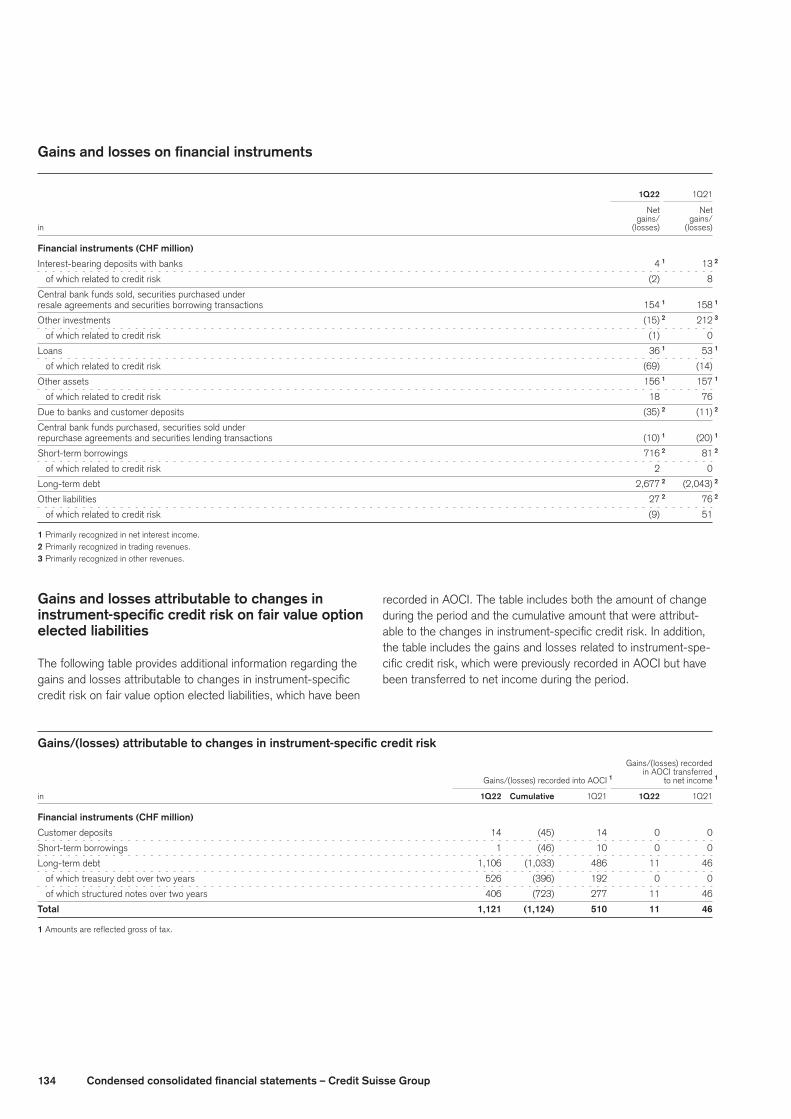
134 Condensedconsolidatedfinancialstatements–CreditSuisseGroup
Gainsandlossesonfinancialinstruments
1Q22 1Q21
Net Net gains/ gains/
in (losses) (losses)
Financialinstruments(CHFmillion)
Interest-bearing deposits with banks 4 1 13 2
of which related to credit risk (2) 8
Central bank funds sold, securities purchased under
resale agreements and securities borrowing transactions 154 1 158 1
Other investments (15) 2 212 3
of which related to credit risk (1) 0
Loans 36 1 53 1
of which related to credit risk (69) (14)
Other assets 156 1 157 1
of which related to credit risk 18 76
Due to banks and customer deposits (35) 2 (11) 2
Central bank funds purchased, securities sold under
repurchase agreements and securities lending transactions (10) 1 (20) 1
Short-term borrowings 716 2 81 2
of which related to credit risk 2 0
Long-term debt 2,677 2 (2,043) 2
Other liabilities 27 2 76 2
of which related to credit risk (9) 51
1 Primarily recognized in net interest income.2 Primarily recognized in trading revenues.3 Primarily recognized in other revenues.
Gainsandlossesattributabletochangesininstrument-specificcreditriskonfairvalueoptionelected liabilities
The following table provides additional information regarding the gains and losses attributable to changes in instrument-specific credit risk on fair value option elected liabilities, which have been
recorded in AOCI. The table includes both the amount of change during the period and the cumulative amount that were attribut-able to the changes in instrument-specific credit risk. In addition, the table includes the gains and losses related to instrument-spe-cific credit risk, which were previously recorded in AOCI but have been transferred to net income during the period.
Gains/(losses)attributabletochangesininstrument-specificcreditrisk Gains/(losses) recorded in AOCI transferred Gains/(losses) recorded into AOCI 1 to net income 1
in 1Q22 Cumulative 1Q21 1Q22 1Q21
Financialinstruments(CHFmillion)
Customer deposits 14 (45) 14 0 0
Short-term borrowings 1 (46) 10 0 0
Long-term debt 1,106 (1,033) 486 11 46
of which treasury debt over two years 526 (396) 192 0 0
of which structured notes over two years 406 (723) 277 11 46
Total 1,121 (1,124) 510 11 46
1 Amounts are reflected gross of tax.
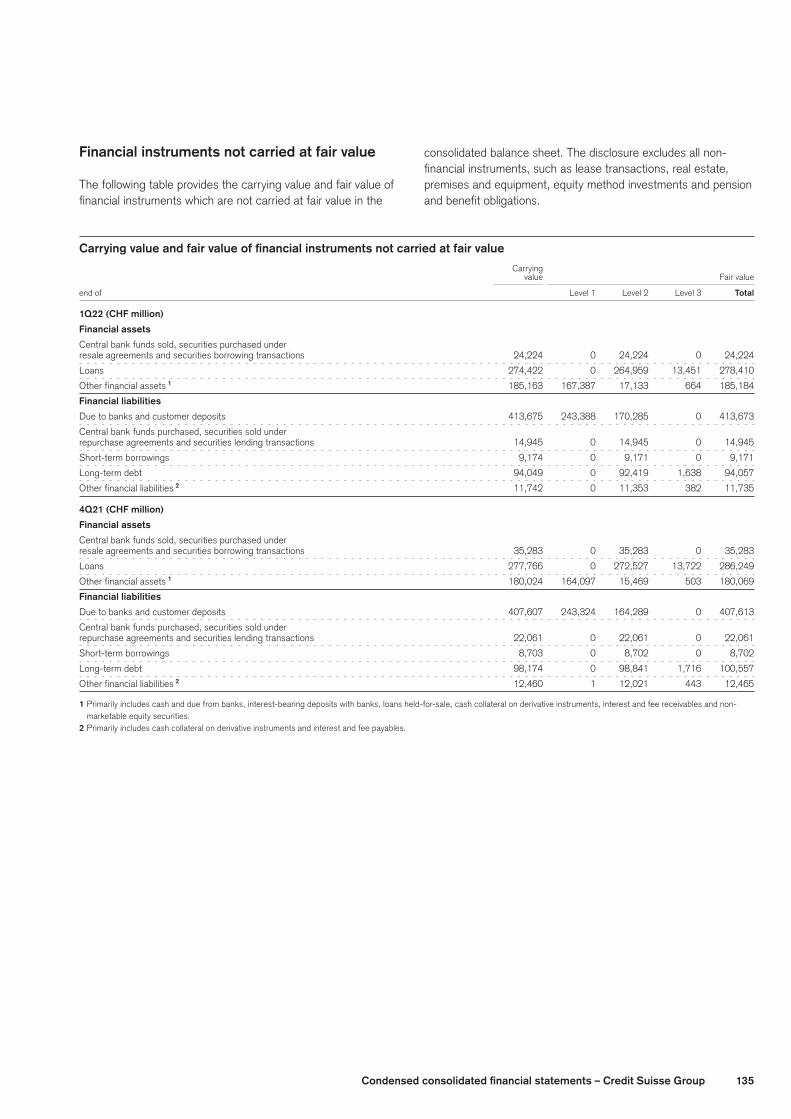
135Condensedconsolidatedfinancialstatements–CreditSuisseGroup
Financialinstrumentsnotcarriedatfairvalue
The following table provides the carrying value and fair value of financial instruments which are not carried at fair value in the
consolidated balance sheet. The disclosure excludes all non-financial instruments, such as lease transactions, real estate, premises and equipment, equity method investments and pension and benefit obligations.
Carryingvalueandfairvalueoffinancialinstrumentsnotcarriedatfairvalue Carrying value Fair value
end of Level 1 Level 2 Level 3 Total
1Q22(CHFmillion)
Financialassets
Central bank funds sold, securities purchased under
resale agreements and securities borrowing transactions 24,224 0 24,224 0 24,224
Loans 274,422 0 264,959 13,451 278,410
Other financial assets 1 185,163 167,387 17,133 664 185,184
Financialliabilities
Due to banks and customer deposits 413,675 243,388 170,285 0 413,673
Central bank funds purchased, securities sold under
repurchase agreements and securities lending transactions 14,945 0 14,945 0 14,945
Short-term borrowings 9,174 0 9,171 0 9,171
Long-term debt 94,049 0 92,419 1,638 94,057
Other financial liabilities 2 11,742 0 11,353 382 11,735
4Q21(CHFmillion)
Financialassets
Central bank funds sold, securities purchased under
resale agreements and securities borrowing transactions 35,283 0 35,283 0 35,283
Loans 277,766 0 272,527 13,722 286,249
Other financial assets 1 180,024 164,097 15,469 503 180,069
Financialliabilities
Due to banks and customer deposits 407,607 243,324 164,289 0 407,613
Central bank funds purchased, securities sold under
repurchase agreements and securities lending transactions 22,061 0 22,061 0 22,061
Short-term borrowings 8,703 0 8,702 0 8,702
Long-term debt 98,174 0 98,841 1,716 100,557
Other financial liabilities 2 12,460 1 12,021 443 12,465
1 Primarily includes cash and due from banks, interest-bearing deposits with banks, loans held-for-sale, cash collateral on derivative instruments, interest and fee receivables and non-marketable equity securities.
2 Primarily includes cash collateral on derivative instruments and interest and fee payables.
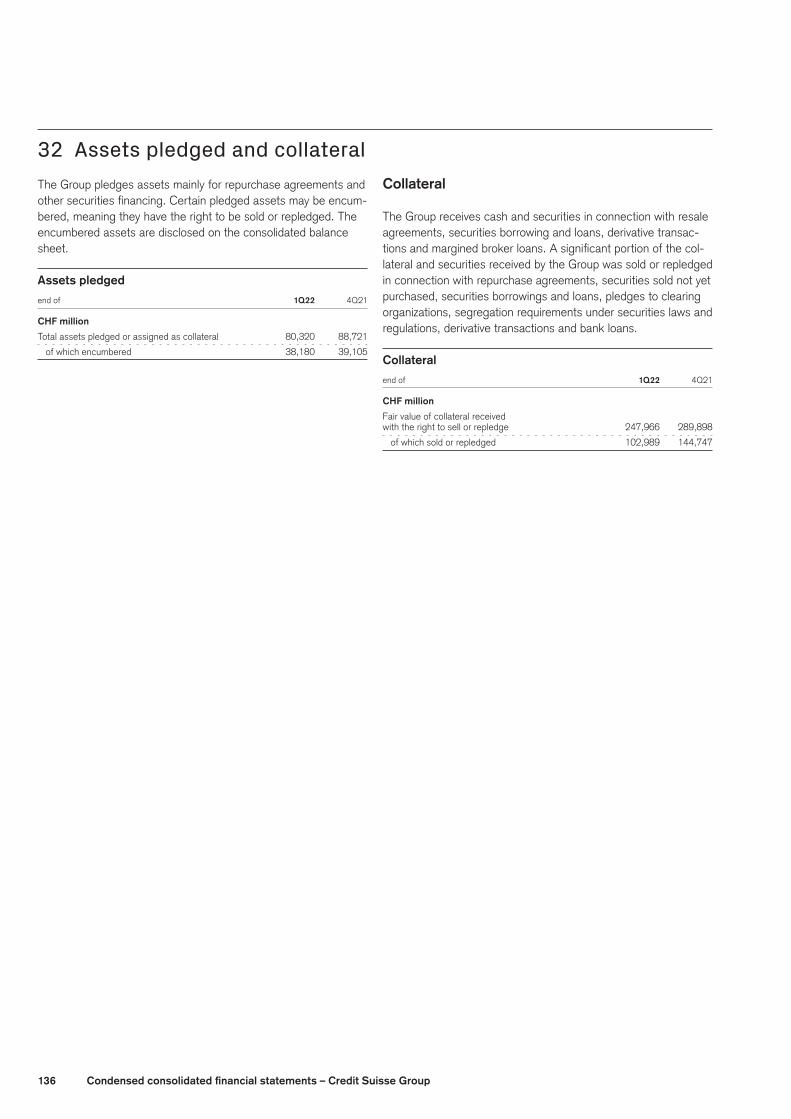
136 Condensedconsolidatedfinancialstatements–CreditSuisseGroup
32 Assets pledged and collateralThe Group pledges assets mainly for repurchase agreements and other securities financing. Certain pledged assets may be encum-bered, meaning they have the right to be sold or repledged. The encumbered assets are disclosed on the consolidated balance sheet.
Assetspledged
end of 1Q22 4Q21
CHFmillion
Total assets pledged or assigned as collateral 80,320 88,721
of which encumbered 38,180 39,105
Collateral
The Group receives cash and securities in connection with resale agreements, securities borrowing and loans, derivative transac-tions and margined broker loans. A significant portion of the col-lateral and securities received by the Group was sold or repledged in connection with repurchase agreements, securities sold not yet purchased, securities borrowings and loans, pledges to clearing organizations, segregation requirements under securities laws and regulations, derivative transactions and bank loans.
Collateral
end of 1Q22 4Q21
CHFmillion
Fair value of collateral received
with the right to sell or repledge 247,966 289,898
of which sold or repledged 102,989 144,747
137Condensedconsolidatedfinancialstatements–CreditSuisseGroup
33 LitigationThe Group is involved in a number of judicial, regulatory and arbi-tration proceedings concerning matters arising in connection with the conduct of its businesses. The Group’s material proceedings, related provisions and estimate of the aggregate range of reason-ably possible losses that are not covered by existing provisions are described in Note 40 – Litigation in VI – Consolidated finan-cial statements – Credit Suisse Group in the Credit Suisse Annual Report 2021 and updated in subsequent quarterly reports (includ-ing those discussed below). Some of these proceedings have been brought on behalf of various classes of claimants and seek damages of material and/or indeterminate amounts.
The Group accrues loss contingency litigation provisions and takes a charge to income in connection with certain proceedings when losses, additional losses or ranges of loss are probable and reasonably estimable. The Group also accrues litigation provisions for the estimated fees and expenses of external lawyers and other service providers in relation to such proceedings, including in cases for which it has not accrued a loss contingency provision. The Group accrues these fee and expense litigation provisions and takes a charge to income in connection therewith when such fees and expenses are probable and reasonably estimable. The Group reviews its legal proceedings each quarter to determine the adequacy of its litigation provisions and may increase or release provisions based on management’s judgment and the advice of counsel. This review includes consideration of management’s strategy for resolution of matters through settlement or trial, as well as changes in such strategy. The establishment of additional provisions or releases of litigation provisions may be necessary in the future as developments in such proceedings warrant.
The specific matters described include (a) proceedings where the Group has accrued a loss contingency provision, given that it is probable that a loss may be incurred and such loss is reasonably estimable; and (b) proceedings where the Group has not accrued such a loss contingency provision for various reasons, including, but not limited to, the fact that any related losses are not reason-ably estimable. The description of certain of the matters includes a statement that the Group has established a loss contingency provision and discloses the amount of such provision; for the other matters no such statement is made. With respect to the matters for which no such statement is made, either (a) the Group has not established a loss contingency provision, in which case the matter is treated as a contingent liability under the applicable accounting standard, or (b) the Group has established such a pro-vision but believes that disclosure of that fact would violate con-fidentiality obligations to which the Group is subject or otherwise compromise attorney-client privilege, work product protection or other protections against disclosure or compromise the Group’s management of the matter. The future outflow of funds in respect of any matter for which the Group has accrued loss contingency
provisions cannot be determined with certainty based on currently available information, and accordingly may ultimately prove to be substantially greater (or may be less) than the provision that is reflected on the Group’s balance sheet.
It is inherently difficult to determine whether a loss is probable or even reasonably possible or to estimate the amount of any loss or loss range for many of the Group’s legal proceedings. Estimates, by their nature, are based on judgment and currently available infor-mation and involve a variety of factors, including, but not limited to, the type and nature of the proceeding, the progress of the matter, the advice of counsel, the Group’s defenses and its experience in similar matters, as well as its assessment of matters, including set-tlements, involving other defendants in similar or related cases or proceedings. Factual and legal determinations, many of which are complex, must be made before a loss, additional losses or ranges of loss can be reasonably estimated for any proceeding.
Most matters pending against the Group seek damages of an indeterminate amount. While certain matters specify the damages claimed, such claimed amount may not represent the Group’s reasonably possible losses. For certain of the proceedings dis-cussed the Group has disclosed the amount of damages claimed and certain other quantifiable information that is publicly available.
The Group’s aggregate litigation provisions include estimates of losses, additional losses or ranges of loss for proceedings for which such losses are probable and can be reasonably estimated. The Group does not believe that it can estimate an aggregate range of reasonably possible losses for certain of its proceedings because of their complexity, the novelty of some of the claims, the early stage of the proceedings, the limited amount of discov-ery that has occurred and/or other factors. The Group’s estimate of the aggregate range of reasonably possible losses that are not covered by existing provisions for the proceedings discussed in Note 40 referenced above and updated in quarterly reports (including below) for which the Group believes an estimate is pos-sible is zero to CHF 1.4 billion.
In 1Q22, the Group recorded net litigation provisions of CHF 703 million. After taking into account its litigation provisions, the Group believes, based on currently available information and advice of counsel, that the results of its legal proceedings, in the aggregate, will not have a material adverse effect on the Group’s financial condition. However, in light of the inherent uncertainties of such proceedings, including those brought by regulators or other gov-ernmental authorities, the ultimate cost to the Group of resolving such proceedings may exceed current litigation provisions and any excess may be material to its operating results for any particu-lar period, depending, in part, upon the operating results for such period.
138 Condensedconsolidatedfinancialstatements–CreditSuisseGroup
Mortgage-relatedmatters
Civil litigationThe amounts disclosed below do not reflect actual realized plain-tiff losses to date or anticipated future litigation exposure. Rather, unless otherwise stated, these amounts reflect the original unpaid principal balance amounts as alleged in these actions and do not include any reduction in principal amounts since issuance.
Individual investor actionsOn April 12, 2022, in an action brought by IKB Deutsche Indus-triebank AG and affiliated entities in the Supreme Court for the State of New York, New York County (SCNY), in which claims against Credit Suisse Securities (USA) LLC (CSS LLC) and its affiliates related to approximately USD 97 million of residential mortgage-backed securities at issue, the parties executed an agreement to settle and dismiss all claims against CSS LLC and its affiliates.
Repurchase litigationsOn March 17, 2022, in the action brought by Home Equity Asset Trust 2007-1 against DLJ Mortgage Capital, Inc. (DLJ), in which plaintiff alleges damages of not less than USD 420 million, the New York State Court of Appeals reversed the decision of the Appellate Division First Department of the SCNY in DLJ’s sum-mary judgment appeal and ordered that DLJ’s motion for partial summary judgment be granted. On April 8, 2022, the SCNY postponed until January 23, 2023 the commencement of the trial in the action that had been scheduled to begin on May 31, 2022.
Rates-relatedmatters
Civil litigationUSDLIBORlitigationOn March 11, 2022, in the non-stayed putative class action brought on behalf of those who lent at rates tied to LIBOR, the US District Court for the Southern District of New York (SDNY) entered an order granting preliminary approval to the parties’ agreement to settle all claims. The settlement remains subject to final court approval.
ForeignexchangelitigationOn April 22, 2022, in the consolidated class action filed in the SDNY alleging manipulation of foreign exchange rates, Credit Suisse filed a motion to de-certify the issue class.
TreasurymarketslitigationOn March 31, 2022, in the consolidated putative class action relating to the US treasury markets, the SDNY granted defen-dants’ motion to dismiss and dismissed with prejudice all claims against the defendants. On April 28, 2022, plaintiffs filed a notice of appeal.
SSAbondslitigationOn March 3, 2022, in the putative consolidated class action liti-gation brought in the SDNY relating to supranational, sub-sover-eign and agency (SSA) bonds, plaintiffs moved to vacate the dis-missal of their case after the SDNY judge disclosed a conflict.
BankBillSwaplitigationOn January 21, 2022, in the putative class action brought in the SDNY alleging manipulation of the Australian Bank Bill Swap reference rate, the parties entered into an agreement to settle all claims. The settlement remains subject to court approval.
CreditdefaultswapauctionlitigationOn April 5, 2022, in the putative class action filed in the US Dis-trict Court for the District of New Mexico alleging manipulation of credit default swap final auction prices, defendants filed a motion to dismiss.
OTC trading cases
On February 25, 2022, in the putative class action brought against certain Credit Suisse AG affiliates, as well as other finan-cial institutions, alleging that the defendants conspired to keep stock loan trading in an over-the-counter market and collectively boycotted certain trading platforms that sought to enter the mar-ket, the court entered an order granting preliminary approval to the parties’ agreement to settle all class action claims. The settle-ment remains subject to final court approval.
On March 1, 2022, in the putative class action brought against CSS LLC and other financial institutions alleging a conspiracy to boycott electronic trading platforms and fix prices in the second-ary market for odd-lot corporate bonds, plaintiffs moved to stay the appeal so that plaintiffs could move to vacate the dismissal of their case after the SDNY judge disclosed a conflict. The motion to stay the appeal was denied on March 15, 2022. On March 30, 2022, because of the conflict, plaintiffs moved in the district court for an indicative ruling vacating the SDNY’s decision dis-missing the case.
Customeraccountmatters
In the civil lawsuit brought against a Credit Suisse affiliate in Ber-muda, the Supreme Court of Bermuda issued a first instance judgment on March 29, 2022, finding for the plaintiff. The judg-ment on damages is expected to be in an amount of approxi-mately USD 600 million.
139Condensedconsolidatedfinancialstatements–CreditSuisseGroup
Mozambiquematter
On February 23, 2022, Privinvest Holding SAL, the parent com-pany of certain entities involved in the Mozambique transactions, and its owner Iskandar Safa brought a defamation claim in a Lebanese court against Credit Suisse Securities (Europe) Limited and Credit Suisse Group AG. The lawsuit alleges damage to the claimants’ professional reputation in Lebanon due to statements that were allegedly made by Credit Suisse in documents relating to the October 2021 settlements with global regulators.
Under the terms of the October 2021 resolution with the US Department of Justice, Credit Suisse is required to pay restitu-tion to any eligible investors in the 2016 Eurobonds issued by the Republic of Mozambique. Investor eligibility and restitution amounts will be determined by the US District Court for the Eastern District of New York at a date currently expected to be in July 2022.
ETN-related litigation
On March 30, 2022, in the individual action brought in the SDNY by a purchaser of VelocityShares Daily Inverse VIX Short Term Exchange Traded Notes linked to the S&P 500 VIX Short-Term Futures Index due December 4, 2030, which asserts claims simi-lar to those brought in the consolidated class action complaint as well as additional claims under New York and Pennsylvania state law, the SDNY issued an order granting in part and denying in part defendants’ motion to dismiss.
SWM
On March 18, 2022, after a settlement, the German court dis-continued the lawsuit brought by the German public utility com-pany Stadtwerke München GmbH (SWM), in connection with a series of interest rate swaps entered into between 2008 and 2012.
SCFF
Additional civil actions relating to the supply chain finance funds (SCFF) matter have been filed by fund investors and other parties against Credit Suisse and/or certain officers and directors in vari-ous jurisdictions, which make allegations including mis-selling and breaches of duties of care, diligence and other fiduciary duties. Certain investors and other private parties have also filed criminal complaints against Credit Suisse and other parties in connection with this matter.
Archegos
Additional civil actions relating to Credit Suisse’s relationship with Archegos Capital Management (Archegos) have been filed against Credit Suisse and/or certain officers and directors, includ-ing claims for breaches of fiduciary duties.
140 List of abbreviations
List of abbreviations
A
ABS Asset-backed securities
ADS American Depositary Share
AGM Annual General Meeting
AMA Advanced measurement approach
AOCI Accumulated other comprehensive income/(loss)
ASC Accounting Standards Codification
ASU Accounting Standards Update
B
BCBS Basel Committee on Banking Supervision
BIS Bank for International Settlements
Board Board of Directors
BoE Bank of England
bp Basis point
C
CCA Contingent Capital Awards
CDO Collateralized debt obligation
CECL Current expected credit loss
CEO Chief Executive Officer
CET1 Common equity tier 1
CFO Chief Financial Officer
CLO Collateralized loan obligations
CMBS Commercial mortgage-backed securities
CP Commercial paper
CPR Constant prepayment rate
E
ECB European Central Bank
EMEA Europe, Middle East and Africa
ESG Environmental, Social and Governance
EU European Union
F
FASB Financial Accounting Standards Board
Fed US Federal Reserve
FINMA Swiss Financial Market Supervisory Authority FINMA
G
GAAP Generally accepted accounting principles
GDP Gross domestic product
GTS Global Trading Solutions
H
HNW High-net-worth
HQLA High-quality liquid assets
I
IPO Initial public offering
ISDA International Swaps and Derivatives Association
IT Information technology
L
LCR Liquidity coverage ratio
LIBOR London Interbank Offered Rate
M
M&A Mergers and acquisitions
MEF Macroeconomic factor
N
NAV Net asset value
NOL Net operating losses
NRV Negative replacement value
NSFR Net stable funding ratio
O
OTC Over-the-counter
P
PRV Positive replacement value
PSA Prepayment speed assumption
Q
QoQ Quarter on quarter
R
RMBS Residential mortgage-backed securities
RWA Risk-weighted assets
S
SCFF Supply chain finance funds
SEC US Securities and Exchange Commission
SEI Significant economic interest
SIX SIX Swiss Exchange
SNB Swiss National Bank
SPE Special purpose entity
SSA Supranational, sub-sovereign and agency
T
TLAC Total loss-absorbing capacity
TRS Total return swap
U
UHNW Ultra-high-net-worth
UK United Kingdom
US United States of America
US GAAP US generally accepted accounting principles
V
VaR Value-at-risk
VDAX Deutsche Börse AG DAX Volatility Index
VIE Variable interest entity
VIX Chicago Board Options Exchange Market Volatility Index
Y
YoY Year on year
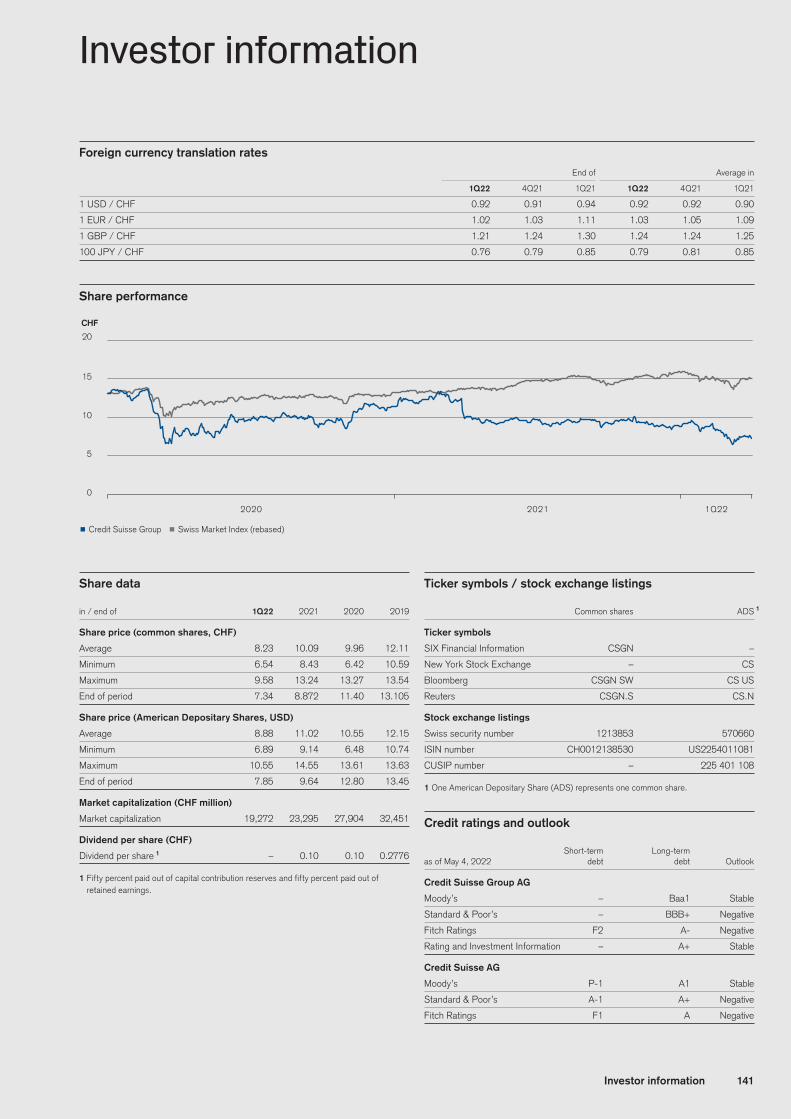
141Investor information
Share performance
p Credit Suisse Group p Swiss Market Index (rebased)
2020 2021 1Q22
0
5
10
15
20
CHF
Investor information
Foreign currency translation rates End of Average in
1Q22 4Q21 1Q21 1Q22 4Q21 1Q21
1 USD / CHF 0.92 0.91 0.94 0.92 0.92 0.90
1 EUR / CHF 1.02 1.03 1.11 1.03 1.05 1.09
1 GBP / CHF 1.21 1.24 1.30 1.24 1.24 1.25
100 JPY / CHF 0.76 0.79 0.85 0.79 0.81 0.85
Share data
in / end of 1Q22 2021 2020 2019
Share price (common shares, CHF)
Average 8.23 10.09 9.96 12.11
Minimum 6.54 8.43 6.42 10.59
Maximum 9.58 13.24 13.27 13.54
End of period 7.34 8.872 11.40 13.105
Share price (American Depositary Shares, USD)
Average 8.88 11.02 10.55 12.15
Minimum 6.89 9.14 6.48 10.74
Maximum 10.55 14.55 13.61 13.63
End of period 7.85 9.64 12.80 13.45
Market capitalization (CHF million)
Market capitalization 19,272 23,295 27,904 32,451
Dividend per share (CHF)
Dividend per share 1 – 0.10 0.10 0.2776
1 Fifty percent paid out of capital contribution reserves and fifty percent paid out of retained earnings.
Ticker symbols / stock exchange listings
Common shares ADS 1
Ticker symbols
SIX Financial Information CSGN –
New York Stock Exchange – CS
Bloomberg CSGN SW CS US
Reuters CSGN.S CS.N
Stock exchange listings
Swiss security number 1213853 570660
ISIN number CH0012138530 US2254011081
CUSIP number – 225 401 108
1 One American Depositary Share (ADS) represents one common share.
Credit ratings and outlook
Short-term Long-term
as of May 4, 2022 debt debt Outlook
Credit Suisse Group AG
Moody’s – Baa1 Stable
Standard & Poor’s – BBB+ Negative
Fitch Ratings F2 A- Negative
Rating and Investment Information – A+ Stable
Credit Suisse AG
Moody’s P-1 A1 Stable
Standard & Poor’s A-1 A+ Negative
Fitch Ratings F1 A Negative
142 Financial calendar and contacts
Production: Management Digital Data AGPrinter: Neidhart + Schön Print AG
Our 2021 annual publication suite consisting of Annual Report and Sustainability Report is available on our website credit-suisse.com/annualreporting.
Credit Suisse Annual Reporting Suite
Annual Report 2021Credit Suisse Group AG Credit Suisse AG
Sustainability Report 2021
Financial calendar and contacts
Financial calendar
Second quarter results 2022 Wednesday, July 27, 2022
Third quarter results 2022 Thursday, October 27, 2022
Investor relations
Phone +41 44 333 71 49
E-mail [email protected]
Internet credit-suisse.com/investors
Media relations
Phone +41 844 33 88 44
E-mail [email protected]
Internet credit-suisse.com/news
Financial information and printed copies
Annual reports credit-suisse.com/annualreporting
Interim reports credit-suisse.com/interimreporting
US share register and transfer agent
ADS depositary bank The Bank of New York Mellon
Shareholder correspondence address BNY Mellon Shareowner Services
P.O. Box 505000
Louisville, KY 40233-5000
Overnight correspondence address BNY Mellon Shareowner Services
462 South 4th Street, Suite 1600
Louisville, KY 40202
US and Canada phone +1 866 886 0788
Phone from outside US and Canada +1 201 680 6825
E-mail [email protected]
Swiss share register and transfer agent
Address Credit Suisse Group AG
Share Register
ROXS
8070 Zurich, Switzerland
Phone +41 44 332 02 02
E-mail [email protected]

143
Cautionary statement regarding forward-looking information
This document contains statements that constitute forward-looking state-
ments. In addition, in the future we, and others on our behalf, may make
statements that constitute forward-looking statements. Such forward-look-
ing statements may include, without limitation, statements relating to the
following:
p our plans, targets or goals;
p our future economic performance or prospects;
p the potential effect on our future performance of certain contingencies;
and
p assumptions underlying any such statements.
Words such as “believes,” “anticipates,” “expects,” “intends” and “plans”
and similar expressions are intended to identify forward-looking statements
but are not the exclusive means of identifying such statements. We do not
intend to update these forward-looking statements.
By their very nature, forward-looking statements involve inherent risks and
uncertainties, both general and specific, and risks exist that predictions,
forecasts, projections and other outcomes described or implied in forward-
looking statements will not be achieved. We caution you that a number of
important factors could cause results to differ materially from the plans,
targets, goals, expectations, estimates and intentions expressed in such
forward-looking statements and that the ongoing COVID-19 pandemic
creates significantly greater uncertainty about forward-looking statements
in addition to the factors that generally affect our business. These factors
include:
p the ability to maintain sufficient liquidity and access capital markets;
p market volatility, increases in inflation and interest rate fluctuations or
developments affecting interest rate levels;
p the ongoing significant negative consequences of the Archegos and
supply chain finance funds matters and our ability to successfully resolve
these matters;
p our ability to improve our risk management procedures and policies and
hedging strategies;
p the strength of the global economy in general and the strength of the
economies of the countries in which we conduct our operations, in par-
ticular the risk of negative impacts of COVID-19 on the global economy
and financial markets and the risk of continued slow economic recovery
or downturn in the EU, the US or other developed countries or in emerg-
ing markets in 2022 and beyond;
p the emergence of widespread health emergencies, infectious diseases
or pandemics, such as COVID-19, and the actions that may be taken by
governmental authorities to contain the outbreak or to counter its impact;
p potential risks and uncertainties relating to the severity of impacts from
COVID-19 and the duration of the pandemic, including potential mate-
rial adverse effects on our business, financial condition and results of
operations;
p the direct and indirect impacts of deterioration or slow recovery in resi-
dential and commercial real estate markets;
p adverse rating actions by credit rating agencies in respect of us, sover-
eign issuers, structured credit products or other credit-related exposures;
p the ability to achieve our strategic goals, including those related to our
targets, ambitions and financial goals;
p the ability of counterparties to meet their obligations to us and the ade-
quacy of our allowance for credit losses;
p the effects of, and changes in, fiscal, monetary, exchange rate, trade
and tax policies;
p the effects of currency fluctuations, including the related impact on our
business, financial condition and results of operations due to moves in
foreign exchange rates;
p geopolitical and diplomatic tensions, instabilities and conflicts, including
war, civil unrest, terrorist activity, sanctions or other geopolitical events
or escalations of hostilities;
p political, social and environmental developments, including climate
change;
p the ability to appropriately address social, environmental and sustainabil-
ity concerns that may arise from our business activities;
p the effects of, and the uncertainty arising from, the UK’s withdrawal
from the EU;
p the possibility of foreign exchange controls, expropriation, national-
ization or confiscation of assets in countries in which we conduct our
operations;
p operational factors such as systems failure, human error, or the failure to
implement procedures properly;
p the risk of cyber attacks, information or security breaches or technology
failures on our reputation, business or operations, the risk of which is
increased while large portions of our employees work remotely;
p the adverse resolution of litigation, regulatory proceedings and other
contingencies;
p actions taken by regulators with respect to our business and practices
and possible resulting changes to our business organization, practices
and policies in countries in which we conduct our operations;
p the effects of changes in laws, regulations or accounting or tax stan-
dards, policies or practices in countries in which we conduct our
operations;
p the discontinuation of LIBOR and other interbank offered rates and the
transition to alternative reference rates;
p the potential effects of changes in our legal entity structure;
p competition or changes in our competitive position in geographic and
business areas in which we conduct our operations;
p the ability to retain and recruit qualified personnel;
p the ability to protect our reputation and promote our brand;
p the ability to increase market share and control expenses;
p technological changes instituted by us, our counterparties or
competitors;
p the timely development and acceptance of our new products and ser-
vices and the perceived overall value of these products and services by
users;
p acquisitions, including the ability to integrate acquired businesses suc-
cessfully, and divestitures, including the ability to sell non-core assets;
and
p other unforeseen or unexpected events and our success at managing
these and the risks involved in the foregoing.
We caution you that the foregoing list of important factors is not exclusive.
When evaluating forward-looking statements, you should carefully consider
the foregoing factors and other uncertainties and events, including the
information set forth in “Risk factors” in I – Information on the company in
our Annual Report 2021.

5520
124
Eng
lish
/ 22
900
6E
CREDIT SUISSE GROUPParadeplatz 88070 ZurichSwitzerlandcredit-suisse.com
Related Documents