A STUDY ON FINANCIAL PERFORMANCE ANALYSIS OF PONNI SUGAR (ERODE) LIMITED Submitted by S.PRAVEENKUMAR (REG .NO.211414631142) Of PANIMALAR ENGINEERING COLLEGE PROJECT REPORT Submitted to the FACULTY OF MANAGEMENT STUDIES In partial fulfilment of the requirements For the award of the degree 1

Financial performance analysis in ponni sugar (erode) limited
Feb 22, 2017
Welcome message from author
This document is posted to help you gain knowledge. Please leave a comment to let me know what you think about it! Share it to your friends and learn new things together.
Transcript

A STUDY ON FINANCIAL PERFORMANCE
ANALYSIS OF PONNI SUGAR (ERODE) LIMITED
Submitted by
S.PRAVEENKUMAR
(REG .NO.211414631142)
Of
PANIMALAR ENGINEERING COLLEGE
PROJECT REPORT
Submitted to the
FACULTY OF MANAGEMENT STUDIES
In partial fulfilment of the requirementsFor the award of the degree
Of
MASTER OF BUSINESS ADMINISTRATION
OCTOBER-2015
PANIMALAR ENGINEERING COLLEGE(A CHRISTIAN MINORITY INSTITUTION)
1

JAISAKTHI EDUCATIONAL TRUSTBANGALORE TRUNK RECORD
VARADARAJAPURAM, NASARATHPETTAIPOONAMALLEE, CHENNAI – 602 102
DEPARTMENT OF MANAGEMENT STUDIES
CERTIFICATE
This is to certify that this project report titled, “A STUDY ON FINANCE PERFORMANCE ANALYSIS OF PONNI SUGAR (ERODE) LTD, AT SUGAR FACTORY” is the bonafide work of S.PRAVEENKUMAR who carried out the research under my supervision. Certified further, that to the best of my knowledge the work reported herein does not form part of any other project report or dissertation on the basis of which a degree or award was conferred on earlier occasion on this or any other candidate.
Internal Guide Head of the Department
ACKNOWLEDGEMENT
2

I would like to express my sincere gratitude to Our Chairman Dr. JEPPIAR
M.A.,B.L.,Ph.D., for providing excellent environment and infrastructure and for his valuable
support throughout the course of study.
I express my deep sense of gratitude and thanks to Our Secretary and
Correspondent Dr.P.CHINNADURAI M.A.,PH.D., and I express my sincere thanks to
Our Directors Mrs. C. VIJAYA RAJESHWARI, Mr. C.SAKTHIKUMAR, M.E.,
M.Phil. I also express my gratitude to my Principal Dr. K.MANI M.E.,Ph.D. for providing
all the required facilities for the successful completion of this work.
I take this opportunity to express my gratitude to the Dean & Head of the
Department of Management studies, Dr. V.MAHALAKSHMI M.L., M.B.A., Ph.D., for
providing me an opportunity and MR.I.YABESH ABRAHAM DURAIRAJ MBA., who
has given me guidance to do this work.
I express my deep sense of gratitude to Dr.V.MAHALAKSHMI M.L., M.B.A.,
Ph.D for giving me the opportunity to undertake my project in his esteemed concern and
guiding me throughout the entire work period.
I would like to thank other faculty members of M.B.A. Department for their
valuable guidance. Last but not least, I thank the almighty and my parents for their blessings
in successful completion of the project
(S.PRAVEENKUMR)
TABLE OF CONTENT
3
S.NO PARTICULARS PAGE NO
LIST OF TABLES
LIST OF CHART
ABSTRACT
V
VII
IX
1
1.1
1.2
1.3
1.4
CHAPTER-1 INTRODUCTION
INTRODUCTION
STATEMENT OF PROBLEM
COMPANY PROFILE
PRODUCT PROFILE
1
2
3
3
6
2
2.1
2.2
2.3
2.4
2.5
CHAPTER-2 DEVELOPMENT OF MAIN THEME
NEED OF THE STUDY
OBJECTIVE OF THE STUDY
SCOPE OF THE STUDY
LIMITATIONS OF THE STUDY
REVIEW OF LITRATURE
7
8
9
10
11
12
3
3.1
3.2
3.3
3.4
3.5
3.6
3.7
3.8
CHAPTER-3 ANALYSIS AND INTERPRETATION
RESEARCH METHODOLOGY
RESEARCH DESIGN
SOURCE OF DATA
TOOLS OF FINANCIAL PERFORMANCE ANALYSIS
PERIOD OF STUDY
ANALYSIS AND INTERPRETATION
FINDING AND SUGGESTIONS
CONCLUSION
16
17
17
18
19
19
20
71
76
APPENDIX
BALANCE SHEET (2011-2015)
THE STATEMENT OF PROFIT AND LOSS
BIBLOGRAPHY
78
79
81
83
LIST OF TABLES
TABLE
NO PARTICULARS PAGE .NO
4

3.6.1 Current ratio 28
3.6.2 Quick asset ratio 30
3.6.3 Cash position ratio 32
3.6.4 Inventory turnover ratio 34
3.6.5 Fixed asset turnover ratio 36
3.6.6 Working capital turnover ratio 38
3.6.7 Fixed asset ratio 40
3.6.8 Proprietary ratio 42
3.6.9 Return on total asset 44
3.6.10 Net profit ratio 46
3.6.11 Gross profit ratio 48
3.6.12 The comparative balance sheet 2010-11 50
3.6.13 The common size balance sheet 2010-11 52
3.6.14 The comparative balance sheet 2011-12 54
3.6.15 The common size balance sheet 2011-12 57
3.6.16 The comparative balance sheet 2012-13 59
3.6.17 The common size balance sheet 2012-13 61
3.6.18 The comparative balance sheet 2013-14 63
3.6.19 The common size balance sheet 2013-14 65
3.6.20 The comparative balance sheet 2014-15 67
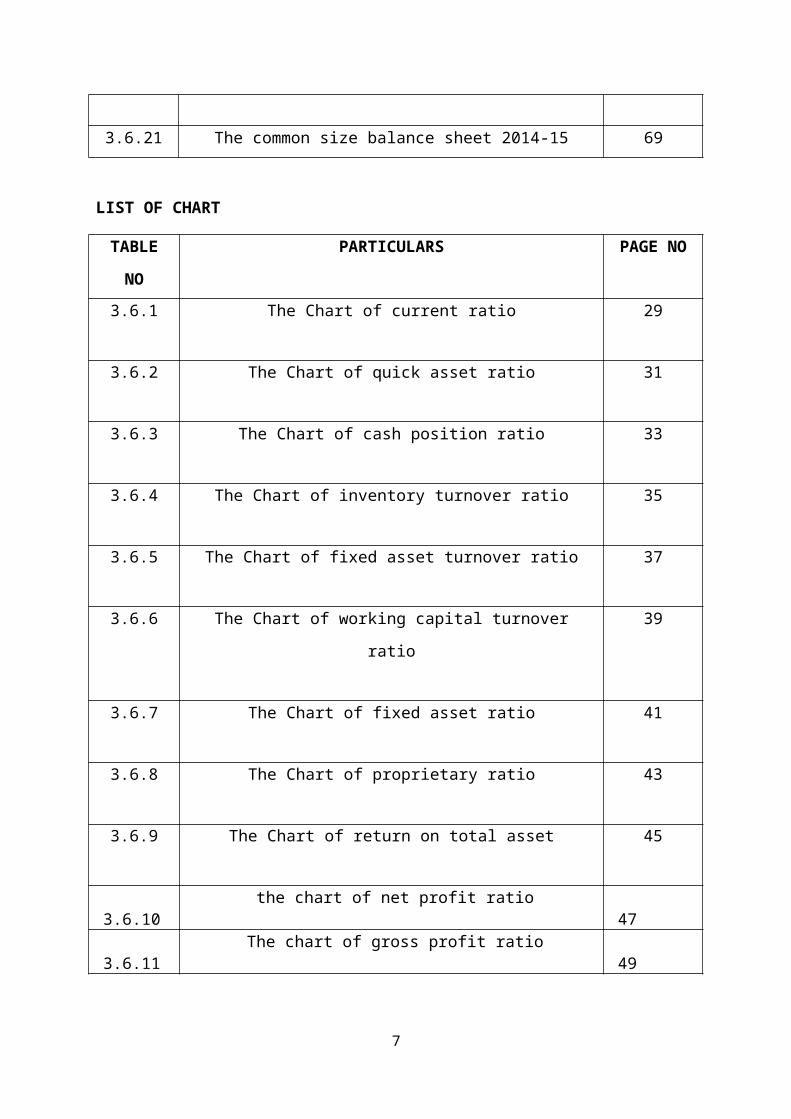
3.6.21 The common size balance sheet 2014-15 69
LIST OF CHART
TABLE
NO
PARTICULARS PAGE NO
3.6.1 The Chart of current ratio 29
3.6.2 The Chart of quick asset ratio 31
5

3.6.3 The Chart of cash position ratio 33
3.6.4 The Chart of inventory turnover ratio 35
3.6.5 The Chart of fixed asset turnover ratio 37
3.6.6 The Chart of working capital turnover ratio 39
3.6.7 The Chart of fixed asset ratio 41
3.6.8 The Chart of proprietary ratio 43
3.6.9 The Chart of return on total asset 45
3.6.10 the chart of net profit ratio 47
3.6.11 The chart of gross profit ratio 49
ABSTRACT
6
In this project, titled “A STUDY ON FINANCIAL PERFORMANCE OF PONNI
SUGAR (ERODE) LTD”. This aim is to analysis the liquidity and profitability position of
the company using the financial tools.
This study based on financial statements such as Ratio Analysis, Comparative
balance sheet and common size balance sheet. By using this tools combined it enables to
determine in an effective manner.
The study is made to evaluate the financial position, the operational results as well as
financial progress of a business concern.
This study explains ways in which ratio analysis can be of assistance in long-range
planning, budgeting and asset management to strengthen financial performance and help
avoid financial difficulties.
The study not only throws on the financial position of a firm but also serves as a
stepping stone to remedial measures for ponni sugar (erode) limited.
This project helps to identify and give suggestion the area of weaker position of
business transaction in “PONNI SUGAR (ERODE) LIMITED”.
7

CHAPTER -1
INTRODUCTION
1.1INTRODUCTION
The word ‘Performance is derived from the word ‘par fourmen’, which means
8

‘to do’, ‘to carry out’ or ‘to render’. It refers the act of per forming; execution,
accomplishment, fulfillment, etc. In border sense, performance refers to the
accomplishment of a given task measured against preset standards of accuracy,
completeness, cost, and speed. In other words, it refers to the degree to which
an achievement is being or has been accomplished. In the words ofFrich Kohlar
“The performance is a general term applied to a part or to all the conducts of
activities of an organization over a period of time often with reference to past or
projected cost efficiency, management responsibility or accountability or the
like. Thus, not just the presentation, but the quality of results achieved refers to
the performance. Performance is used to indicate firm’s success, conditions,
and compliance.
Financial performance refers to the act of performing financial activity. In
broader sense, financial performance refers to the degree to which financial
objectives being or has been accomplished. It is the process of measuring the
results of a firm's policies and operations in monetary terms. It is used to
measure firm's overall financial health over a given period of time and can also
be used to compare similar firms across the same industry or to compare
industries or sectors in aggregation.
The financial performance analysis identifies the financial strengths and
weaknesses of the firm by properly establishing relationships between the items
of the balance sheet and profit and loss account.
1.1 STATEMENT OF THE PROBLEM
9

Financial performance are prepared to review the state of investment in a
business and result achieved during specific period, financial performance
analyses are also of great importance to the financial lenders. The financial
performances are useful and meaningful only when they are analyzed.
Sugar industries are of the developing industries in our country after
liberalization. The government has opened new opportunities for the century old
sugar industry. There is a vast home market and export potential for sugar
industry. The process of consolidation and rationalization in the industry will
continue. This will lead to greater challenges in matching the right companies
and their product making facilities to the right market. On account of these
facts, it is of considerable interest to study the sugar industry.
1.2 COMPANY PROFILE
Ponni Sugars (Erode) Ltd is an off spring of Ponni Sugars and Chemicals
Ltd (PSCL) under a Demerger Scheme sanctioned by the High Court of Madras
on 10th September 2001. In terms of the Scheme, the company took over the
business of Erode Under taking with concurrent transfer of major part of
stakeholders’ interest in PSCL to the company.
The Erode sugar mill was set up with 1250 TCD capacity in 1984 in a
record time of 12 months. It achieved full capacity crushing during the very first
year of its commercial operation that enabled declaration of a maiden dividend
of 10% in that very first year, a record in the annals of sugar industry. It was a
trendsetter in mobilizing surplus cane during its infancy stage from neighboring
sugar mills and extending crushing season to well above industry average. Its
capacity was expanded to 2500 TCD In 1994.
The Erode sugar mill has successfully implemented an innovative Lift
10

Irrigation Scheme by bringing in dry lands under cane cultivation, utilizing the
effluent discharge of the neighboring paper mill. This has helped secure
multitudinal benefits – providing a dependable and perennial source of
irrigation to farmers in the neighborhood, increase of land value manifold in the
region, transforming the livelihood of local rural population, resolving the raw
material needs of sugar and paper mills and addressing ecological corners in
effluent discharge.
Right from its inception, Ponni was structured on the concept of total
diversion of bagasse for paper. Accordingly it installed a coal fired boiler and
later added a multi fuel boiler in place of conventional bagasse fired boilers. It
has a bagasse tie up arrangement with Seshasayee Paper and Boards Ltd for a
mutually beneficial and rewarding long term relationship.
Ponni is an efficient and quality producer of sugar, catering to both domestic
and international markets. It is a venerable partner for villagers growing
sugarcane in its neighborhood. It enjoys cordial relationship with employees. It
firmly believes in transparent and fair dealings with all its stakeholders by
following sound corporate governance norms both in letter and spirit.
11

A COMPANY WITH A DIFFERENCE
Innovative structuring as backward integration to paper.
First to commit bagasse for paper and derive value
addition.
Pioneered long sugar season.
Implemented a unique effluent irrigation scheme converting
waste to wealth.
ISO 9001:2008 certified for Quality Management system.
ISO 14001:2004 certified for Environmental Management system.
VISION
To excel as trusted socially responsible and customer driven organization
providing maximum value to all stakeholders.
MISSION
To manufacture quality products at competitive cost through technology and teamwork.
VALUES
Ethical practices Customer focus Commitment and transport management Empowerment and accountability Adaptability to “change” Innovation and creativity Emphasis on human resources development, cost reduction, productivity
enhancement and resource conservation.
12

FACTORY FACTSHEET
Year of Establishment 1984
Initial Capacity (TCD) 1250
Present Capacity (TCD) 3500
Factory Area (acres) 33.51
Colony Area (acres) 9.10
No of EmployeesRegular - 232
327Seasonal – 95
No. of Employee Quarters 145
No. of Cultivators 7475
Annual Cane Area under 21300Registration (acres)
1.3 PRODUCT PROFILE
Ponni Sugars (Erode) Limited is an India-based company. The Company is
engaged in the manufacture of sugar and its by-products. The Company’s products
include sugar, bagasse and molasses. During the fiscal year ended March31, 20015
(fiscal 2015), the Company crushed 745,644 tons of cane and produced 76464 tons
of sugar. The Company’s plant is located in Namakkal District, Tamil Nadu.
13

CHAPTER-2
DEVELOPMENT OF MAIN THEME
14

2.1CONCEPT OF THE STUDY
FINANCIAL PERFORMANCE:
Finance is the life blood of a business. Finance is one of the basic
foundations of all kinds of economic activities. Like any other functional
management in a firm (such as production, making, sales etc.,) “finance” is a vit al
functional organization of the firm. If the finance function does not operate will,
the whole organizational activity will be collapsed. The subject matter of financial
management has been defined in many ways depending upon the study of the
subject.
The level of performance of a business over a specified period of time,
expressed in terms of overall profits and losses during that time. Evaluating the
financial performance of a business allows decision-makers to judge the results of
business strategies and activities in objective monetary terms.
Financial performance is prepared primarily for decision making. It plays a
dominant role in setting the frame work of managerial decisions. But the
information provided in Financial performance is not an end in itself as no
meaningful conclusions can be drawn from these statements alone.
2.2 NEED FOR STUDY:
15

The financial performance analysis of overview sugar industry for financial strength and weakness of position in industry. Every business needs to view the financial performance analysis.
The study of financial data like to balance sheet and profit & loss a/c for past five years.
The study of effectiveness of operational and financial performance of ponni sugar (erode) limited is conducted to measure the overall performance of company. The financial strength the industry to make best use and to be able to spot out financial weakness of the industry to state suitable corrective action.
The study aims at analyzing the financial performance of the company by using various financial tools like comparative analysis, common size statement analysis and ratio analysis.
In recent year almost all industries have been facing a challenging scenario due to global competition, increase in input prices and overall economic slowdown which has imposed severe pressures on growth and profitability.
The sugar industry has also been facing weather agriculture farmers work rise sugar cane and increase profit. That is low of stage loss. It is based different weather of year to year.
16

2.3 OBJECTIVE OF THE STUDY:
Primary objective:
To study the financial performance analysis of ponni sugar (erode) limited.
Secondary objective:
To compare and analysis the financial statement for the past five financial years.
To know the profitability, liquidity, activities and solvency position of company.
To comparative and interpret financial statement of the ponni sugar (erode) limited with comparative and common size.
To forecast future sales of ponni sugar (erode) limited. To provide suggestions for improving the overall financial performance of
company.
17

2.4 SCOPE OF THE STUDY:
The data of the past five years are taken into a/c for the study. The performances compared within those periods. This study finds out the areas where ponni sugar factory can improve to increase the efficiency of its asst and funds employed.
The financial statements are analyzed for finding out the various aspects ranging from a simple analysis of the firm to a comprehensive management of the firm in various areas.
The study of financial performance will help the management in the decision making process. The concern is to understand its own position overtime.
Finance is the life blood of company. The study of the financial performance helps the company to understand their
overall profitability position, liquidity position, solvency position and activities long term financial performance of company.
The study gives practical experience researcher to analyzing performance of company.
The financial performance is analysis whether the company attains satisfactory level or not.
18

2.5 LIMITATIONS OF STUDY:
The data collected is not sufficient detailed study of project. The study is mainly based the sources of annual report of the company. The duration of the project work was also barriers to conduct details study. The study related with ponni sugar (erode) limited and project department only. Analysis of ratio can also be done with the help of alternative formulae. Changes in accounting procedures by firm may often financial analysis
misleading. Financial performance statement prepared on the basic certain accounting
concept and conventions. The financial performance analysis is based on monetary information are non
monetary information ignored. The calculation has been on the figures provided the published financial
statement hence, the study is subject to limitations inherited to financial accounting.
19

2.6 REVIEW OF LITERATURE:
1. “G. Malyadri, and B. Sudheer Kumar (2013) found 15 at Indian sugar
industry ishighly stragmented with organize and unorganized players. The
unorganized players mainly produce gur and khandsari, the fess refined forms
sugar. The sector has a number of transformational opportunities. These
opportunities have remained largely untapped. The industry has the potential to
cater to the large and growing domestic sugar consumption and emerge as a
significant carbon credit and power producer. Further, the industry can improve its
cost competitiveness through higher farm productivity and by managing the
domestic production variation through international trade with a focus on countries
in the Indian Ocean. Thus, transformed sector would be fess cyclical with greater
alignment between sugar cane and sugar prices, and will have stable diversified
sources of revenue. This study we have used analysis of Indian Sugar Industry
from Ratio’s Port Of View, Profitability Ratio, Turnover Ratio.”
2.“Miss paravathiin her financial analysis of Hindustan photo films, Ooty for the
years (2009). The researcher concluded that the gross profit has shown an
increasing trend. However the net profit shown a decreasing trend, due to steep rise
in operations cost. The long term solvency, debt equity ratio, proprietary ratio were
not satisfactory. It has been recommended that an increase in long term debts will
take advantage of debt capital.”
3. “Mr. vasanthamani (2006) has studied the financial performance of L.G
Balakrishnan & bros Itd. For the year 2003-2008, the tools used by him were the
ratio analysis, fund flow statement, cash flow statement and the working capital
analysis. It concluded that the financial position of the company was not steady;
20

the rate of return had decline trend till 2000. He found that company in spite of
earning huge gross profit of comparatively very low because of high operating
cost.”
4. “D.I Bhashyam (2003) financial statement analysis is largely a study of
relationship among various financial factors. The analysis and interpretation of
financial statement forecasting future earning ability to pay interest & debt matures
& profitability.”
5. “I M Pandey (financial management 9th edition) comparative statement
analysis is a simple method of tracing periodic changes in the financial
performance of to prepare comparatives statement. Comparative financial
statement will contain items at least for two period changes increased and
decreased in income statement and balance sheet.”
6. “S.K Khatik and P.K Singh made an effort to analyze the working capital
management of IFFCO during the period of (2001-2002). It was found the working
capital ratio, acid test ratio, absolute test ratio and short term liquidity is very much
satisfactory.”
7. “Pandy (1991) has sought to identify factors which influence corporate
economic performance. Importance of industrial characteristics which have been
used by industrial organization researchers as the determinants of financial
21

performance are concentration. Market, share, industry growth, research and
development expenditure, advertisement intensity and size of firms in the industry.
These characteristics may allow firms to be in a better position to implement their
strategies successfully and profitability consequently firms may reflect better
performance on account of favorable characteristics.”
8. “Rachchh minaxi (2011) have suggested that the financial statement analysis
involves analyzing the financial statement to extract information that can be
facilitating decision making. It is the process of evaluating the relationship
between components parts of the financial statement to obtain better understanding
of an entity is position and performance.
9. “John myer, a renowned authority on financial statement analysis has
reference that in the initial year of 20th century the hankers and securities exchange
authority were extensively relying on the financial statement of the companies for
analysis monitoring and control of activities and performance of business. The
history principles and financial statement analysis has been referred by other
authority.
10.“Attwood, D. W. (1995) found the reasons why cooperative sugar factories
inMaharashtra, India are given: (1) successful are examined. Two contradictory
explanations are generally the cooperative spirit already prevalent in the village
communities provided a sound basis for formal cooperatives; (2) village life is
governed by a few wealthy and powerful leaders who also control the cooperatives.
Both explanations are rejected. It is argued that despite a high level of inequality in
the past and the present, informal cooperation has flourished in the villages. The
22
success of the sugar cooperatives rests on the long-standing habit forming selective
alliances to overcome serious technical obstacles in production. The large farmers
depend on the cane supplied by the small farmers to maintain full capacity
utilization, which enables the factories to pay high cane prices.”
23

CHAPTER-3
ANALYSIS AND INTERPRETACTION
3.1 RESEARCH MEHTODLOGY:24

Research is often described as an active, diligent and systematic process of
inquiry aimed at discovering, interpreting and revising facts. This intellectual
investigation produces a greater understanding of events, behaviors or theories and
makes practical applications through laws and theories. The term research is also
used to describe a collection of information about a particular subject, and is
usually associated with science and scientific method.
BASIC RESEARCH
Basic research is also called as fundamental or pure research. Its primary
objective is the advancement of knowledge and the theoretical understanding of
the relations among the variables. It is exploratory and often driven by researcher s
curiosity or interest. It is conducted without any practical end in mind. Basic
research often lays down the foundation for further applied research.
APPLIED RESEARCH
Applied research is done to solve specific, practical questions. Its primary
objective is not to gain knowledge for its own sake. It is usually descriptive in
nature. It is almost always done on the basis of basic research.
3.2 RESEARCH DESIGN:
A research design is simply the framework or plan for a study that is used as guide
in collecting and analyzing the data. It is a blueprint that is following in
completing study.
Descriptive research
25

Descriptive research includes surveys and fact-finding enquiries of different
kinds. The major purpose of descriptive research is descriptive of the state of
affairs as it exists at present. In social science and business research we quite often
use the term. Example post facto research for descriptive research studies. The
main characteristic of this method is that the researcher has no control over the
variables; he can only report what has happened or what is happening.
3.3 SOURCE OF DATA:
1. Primary data.
2. Secondary data.
PRIMARY DATA:
Interviewing primary and secondary data have been source of data. The
study derives its data mainly from primary source of information from finance
employee of the company and the major source of secondary data was annual
report of ponni sugar (erode) limited for years 2010-11, 2011-12, 2012-13, 2013-
14 and 2014-15 from of the balance sheet and profit and loss account of company.
SECONDARY DATA:
There are source containing data which have been collected complied for another
purpose. The secondary source consists of reality available compendia and already
complied statistical statement and reports whose data may be used by researchers
for their studies e.g, census report, statistical statement, annual report and financial
statement of companies, reports of government departments, annual report on
currency and finance published by reserve bank of India.
3.4 TOOLS AND TECHNIQUES OF FINANCIAL PERFORMANCE ANALYSIS:
26

1. Ratio analysis2. Comparative analysis3. Common size analysis
3.5 PERIOD OF STUDY:
The study covers the period of 2011 to 2015 in ponni sugar (erode) limited.
3.6ANALYSIS AND INTERPRECTION:
FINANCIAL PERFORMANCE EVALUATION USING RATIO ANALYSIS:
Ratio analysis is a powerful tool of financial analysis. A ratio is defined as “The
Indicated Quotient of Two Mathematical Expressions” and as “The Relationship
between Two or More Things”. In financial analysis, a ratio is used as a
benchmark for evaluating the financial position and performance of firm. The
absolute accounting figures reported in the financial statement do not provide a
meaningful understanding of the performance and financial position of a firm. The
relationship between two accounting figures, expressed mathematically is known
as a financial ratio. Ratios help to summaries large quantities of financial data and
to make qualitative about the firm’s financial performance.
The point to note is that a ratio reflecting a quantitative relationship helps to
form a qualitative judgment. Such is the nature of all financial ratios.
Significance of Using Ratios:
The significance of a ratio can only truly be appreciated when:
1. It is compared with other ratios in the same set of financial statements.
2. It is compared with the same ratio in previous financial statements (trend
analysis).
3. It is compared with a standard of performance (industry average). Such a
standard may be either the ratio which represents the typical performance of
27

the trade or industry, or the ratio which represents the target set by
management as desirable for the business.
Types of Ratios
Liquidity Ratios
Liquidity refers to the ability of a firm to meet its short-term financial
obligations when and as they fall due.
The main concern of liquidity ratio is to measure the ability of the firms to
meet their short-term maturing obligations. Failure to do this will result in
the total failure of the business, as it would be forced into liquidation.
A. Current Ratio
The Current Ratio expresses the relationship between the firm’s current
assets and its current liabilities. Current assets normally include cash,
marketable securities, accounts receivable and inventories. Current liabilities
consist of accounts payable, short term notes payable, short-term loans,
current maturities of long term debt, accrued income taxes and other accrued
expenses (wages).
Current ratio = current asset / current liabilities
B. Quick asset ratio:
The ratio is also called ‘Liquidity assets or Acid test ratio. It is calculated by comparing the quick asset with current liabilities. Quick or liquid asset refers to assets which are quickly convertible into cash. Current asset other then stock and prepaid expenses are considered as quick assets.
28

Formula:
Liquid ratio= quick asset or liquid asset ------------------------------- Current liabilities
Liquid liabilities= current liabilities-bank O.D
C. Cash position ratio:
The ratio is also called ‘absolute liquidity ratio ‘or ‘super quick ratio’. This is a variation of quick ratio. This ratio is calculated when liquidity is highly restricted in terms of cash and cash equivalents. This ratio measures liquidity in terms of cash and near cash items and short term current liabilities.
Formula:
Cash position ratio= cash and bank balance + marketable securities
-------------------------------------------------------
Current liabilities
Activity Ratio:
If a business does not use its assets effectively, investors in the business would
rather take their money and place it somewhere else. In order for the assets to be
used effectively, the business needs a high turnover.
Unless the business continues to generate high turnover, assets will be idle as it is
impossible to buy and sell fixed assets continuously as turnover changes. Activity
ratios are therefore used to assess how active various assets are in the business.
A. Inventory turnover ratio:
29

This ratio measures the stock in relation to turnover in order to determine how
often the stock turns over in the business. It indicates the efficiency of the firm in
selling its product. It is calculated by dividing the cost of goods sold by the average
inventory.
Formula:
Inventory turnover ratio= cost of goods sold
----------------------------
Average inventory
Average inventory= opening stock + closing stock
-----------------------------------------
2
B. Fixed asset turnover ratio:
The fixed assets turnover ratio measures the efficiency with which the firm has
been using its fixed assets to generate sales. It is calculated by dividing the firm’s
sales by its net fixed assets as follows.
Formula:
Fixed asset turnover ratio= sales
-------------------
Net fixed asset
C. Working capital turnover ratio:
This ratio shows the number of times the working capital results in sales. In other
words, this ratio indicates the efficiency or otherwise in the utilization of short
term funds in making sales. Working capital means the excess of current assets
over current liabilities. In fact, in the short run, it is the current assets and current
liabilities which pay a major role. A careful handling of the short term assets and
30

funds will mean a reduction in the amount of capital employed, thereby improving
turnover. The following formula is used to measure this ratio:
Working capital turnover ratio= sales
-----------------------------
Net working capital
Long term solvency ratio:
a. Fixed asset ratio:
The ratio establishes the relationship between fixed assets and long-term funds. The objectives of calculating this ratio is to ascertain the proportion of long term funds invested in fixed assets.
Formula:
Fixed assets ratio= fixed assets ---------------------- Long term funds
b. Proprietary ratio:
.This ratio is also known as ‘Owners fund ratio’ (or) ‘Shareholders equity ratio’
(or) ‘Equity ratio’ (or) ‘Net worth ratio’. This ratio establishes the relationship
between the proprietors’ fund and total tangible assets. The formula for this
ratio may be written as follows.
Shareholders fund
Proprietary ratio = ---------------------------
Total tangible asset
Profitability Ratios
31

Profitability is the ability of a business to earn profit over a period of time.
Although the profit figure is the starting point for any calculation of cash flow, as
already pointed out, profitable companies can still fail for a lack of cash.
A company should earn profits to survive and grow over a long period of
time.
Profits are essential, but it would be wrong to assume that every action
initiated by management of a company should be aimed at maximizing
profits, irrespective of social consequences.
The ratios examined previously have tendered to measure management efficiency
and risk.
A. Gross Profit Margin
Normally the gross profit has to rise proportionately with sales.
It can also be useful to compare the gross profit margin across similar
businesses although there will often be good reasons for any disparity.
Gross profit margin= gross profit ---------------- *100 Net sales
B. Net Profit Margin
This is a widely used measure of performance and is comparable across companies
in similar industries. The fact that a business works on a very low margin need not
cause alarm because there are some sectors in the industry that work on a basis of
high turnover and low margins, for examples supermarkets and motorcar dealers.
32

What is more important in any trend is the margin and whether it compares well
with similar businesses.
Net profit margin= net profit
--------------- *100
Sales
C. Return on total assets
This ratio is also known as the profit-to-assets ratio. This ratio establishes the
relationship between net profits and assets. As these two terms have conceptual
differences, the ratio may be calculated taking the meaning of the terms according
to the purpose and intent of analysis. Usually, the following formula is used to
determine the return on total assets ratio.
Return on total assets = (Net profit after taxes and interest / Total assets) * 100
Comparative analysis:
Comparative study of financial statement is the comparison of the financial
statement of the business with the previous year’s financial statements and with the
performance of other competitive enterprises, so that weaknesses may be identified
and remedial measures applied.
Comparative statements can be prepared for both types of financial statements
i.e., Balance sheet as well as profit and loss account. The comparative profits and
loss account will present a review of operating activities of the business. The
comparative balance shows the effect of operations on the assets and liabilities that
change in the financial position during the period under consideration.
33

Comparative analysis is the study of trend of the same items and computed
items into or more financial statements of the same business enterprise on different
dates.The presentation of comparative financial statements, in annual and other
reports, enhances the usefulness of such reports and brings out more clearly the
nature and trends of current changes affecting the enterprise.
While the single balance sheet represents balances of accounts drawn at the end
of an accounting period, the comparative balance sheet represent not nearly the
balance of accounts drawn on two different dates, but also the extent of their
increase or decrease between these two dates. The single balance sheet focuses on
the financial status of the concern as on a particular date, the comparative balance
sheet focuses on the changes that have taken place in one accounting period. The
changes are the direct outcome of operational activities, conversion of assets,
liability and capital form into others as well as various interactions among assets,
liability and capital.
Common size analysis:
The common size statements indicate the relationship of various items with some
common items (expressed as percentage of the common items). In the income
statements, the sales figure is taken as basis and all other figures are expressed as
percentage of sales. Similarity, in the balance sheet the total assets and liabilities is
taken as base and all other figures are expressed as percentage of this total.
The percentages so calculated are compared with corresponding
percentage in other period or other firms and meaningful conclusions are drawn.
Generally, a common size income statement and common size balance sheet is
prepared.
34
TABLE-3.6.1
LIQUDITY MEASUREMENT RATIO
35

CURRENT RATIO
Year Current asset Current liabilities Current ratio 2011 9296 4017 2.312012 7794 7124 1.09 2013 10582 10251 1.032014 9463 7601 1.242015 9750 8521 1.14
FINDING:
Initially in financial year 2010-11 the current ratio is 2.31:1 which means there was ideal capital but there was decrease in the current ratio in 2011-12 to 2012-13 which was 1.09:1 and 1.03:1. The dramatically there was particle decrease in the current ratio 2013-14 1.24:1. This means there was ideal capital in 2014-15 there was decrease in current ratio 1.14:1.
INFERENCE:
The ideal current ratio is 2:1. As observed from the table current ratio shows average of 2:1 only during the year 2010-11. The following of year less than ideal ratio 2012 to 2015. It is lack of liquidity and shortage of working capital.
36

CHART -3.6.1
CURRENT RATIO
37
2011 2012 2013 2014 20150
0.5
1
1.5
2
2.5
Current ratio
Current ratio

TABLE-3.6.2
LIQUIDITY OR ACID TEST RATIO
year Liquid assets Current liabilities Liquid ratio
2011 2638 4017 0.656 2012 3100 7124 0.435 2013 3199 10251 0.312 2014 2249 7601 0.295 2015 2500 8521 0.293
FINDING:
Initially in the financial year 2010-11 the quick ratio is 0.656:1. This means there was no ideal capital but there was decrease in 2011-12 to 2012-13.which was 0.312:1 and dramatically there was decrease on the quick ratio 2013-14. This means there was ideal capital in 2014-15 there was decrease in quick ratio 0.293:1
INFERENCE:
The ideal quick ratio is 1:1. As observed from the table quick ratio not possible. Because all years no ideal ratio and less than ideal ratio. It is not better short term financial position of company.
CHART-3.6.2
38
LIQUIDITY OR ACID TEST RATIO
39
2011 2012 2013 2014 20150
0.1
0.2
0.3
0.4
0.5
0.6
0.7
liquidity ratio
liquidity ratio

TABLE-3.6.3
CASH POSITION RATIO
year Cash & bank and marketable securities
Current liabilities Cash position ratio
2011 1001 4017 0.2492012 2148 7124 0.301 2013 2220 10251 0.3122014 2158 7601 0.283 2015 2124 8521 0.249
FINDING:
Initially in financial year 2010-11 the cash position ratio is 0.249:1 which means there was no ideal capital but there was decrease in the cash position ratio in 2011-12 to 2012-13 which was 0.301:1 and 0.312:1 dramatically there was decrease in the cash position ratio 2013-14. This means there was ideal capital in 2014-15 there was decrease in cash position ratio 0.249:1
INFERENCE:
40

The ideal cash position ratio is 0.75:1. As observed from the table cash position ratio no average ideal ratio. It is less than ideal ratio of all years. Thereis not better cash position of company .
CHART-3.6.3
CASH POSITION RATIO
2011 2012 2013 2014 20150
0.05
0.1
0.15
0.2
0.25
0.3
0.35
Cash position ratio
Cash position ratio
41

TABLE-3.6.4
TURNOVER MEASUREMENT RATIO
a) INVENTORY TURNOVER RATIO
year Cost of goods sold
Average inventory
Inventory turnover ratio
2011 26948 3329 8.092012 26562 2347 11.312013 21248 3691.5 5.752014 16878 3607 4.672015 15876 3635 4.37
FINDING:
Initially in financial year 2010-11 the inventory turnover ratio is 8.09:1 which means there was increase in the inventory turnover ratio in 2011-12 which was 11.31:1 and dramatically there was decrease in the inventory turnover ratio
42

2012-13 to 2013-14 in 5.75:1 and 4.67:1 which means there was sales decrease in inventory turnover ratio 4.37:1
INFERENCE:
The inventory turnover ratio higher sales and lower inventory. It is higher inventory turnover ratio and better position of company. As observed table inventory turnover ratio shows that 11.31:1 only during the year 2011-12 over sales and low inventory and next 3 years decrease sales and high inventory.
CHART-3.6.4
INVENTORY TURNOVER RATIO
2011 2012 2013 2014 20150
2
4
6
8
10
12
inventoy turnover ratio
inventoy turnover ratio
43

TABLE-3.6.5
FIXED ASSET TURNOVER RATIO
Year Sales Net fixed assets Fixed asset turnover ratio
2011 26948 4521 5.960 2012 26893 12834 2.095 2013 21248 13336 1.590 2014 16878 13406 1.258 2015 15876 12789 1.241
FINDING:
Initially in financial year 2010-11 the fixed assets turnover ratio is 5.960:1 which means there was decrease in the fixed assets turnover ratio in 2011-12 to 2012-13 in 2.095:1 and 1.590:1. The dramatically decrease fixed asset turnover ratio 2013-14 in 1.258:1 which means there was no increase fixed asset turnover ratio 2014-15 in 1.241:1.
INFERENCE:
44

The fixed asset turnover ratio is increase any year and compared with all year rise or fall ratio. This ratio is higher better utilization fixed asset of company and fall ratio no efficiently used of asset. As on observed table show that 2010-2011 5.960:1 and compared all year of fall ratio and no efficiently use asset of company.
CHART-3.6.5
FIXED ASSETS TURNOVER RATIO
45
2011 2012 2013 2014 20150
1
2
3
4
5
6
7
Fixed asset turnover ratio
Fixed asset turnover ratio

TABLE-3.6.6
WORKING CAPITAL TURNOVER RATIO
Year Sales Net working capital
Working capital turnover ratio
2011 26948 5279 5.102012 26893 670 40.132013 21248 331 64.192014 16878 1862 9.062015 15876 1229 12.91
FINDING:
Initially in financial year 2010-11 the working capital turnover ratio is 5.10:1
which means there was increase working capital turnover ratio in 2011-12 to 2012-
2013 of 40.13:1 and 64.19:1 which means there was dramatically decrease 2013-14
to 2014-15 in 9.06:1 and 12.91:1.
46

INFERENCE:
The working capital turnover ratio is higher than efficiently use of company and
low working capital turnover ratio under utilization of company. As on observed
from the table shows that 64.19:1 in 2012-13 this year efficient use of company in
working capital turnover ratio and next two years low working capital ratio for
under utilization of company.
CHART -3.6.6
WORKING CAPITAL TURNOVER RATIO
2011 2012 2013 2014 20150
10
20
30
40
50
60
70
Working capital turnover ratio
Working capital turnover ratio
47

TABLE-3.6.7
DEBT MEASUREMENT RATIO
a) FIXED ASSETS RATIO
Year Fixed assets Long term funds Fixed asset ratio2011 4521 11270 0.4012012 12834 14831 0.8652013 13336 15914 0.8382014 13406 17302 0.7742015 12789 16249 0.787
FINDING:
Initially in financial year 2010-11 the fixed asset ratio is 0.40:1 which means
there was no ideal ratio but there was increase in the fixed asset ratio in 2011-12 to
2012-13 which was 0.865:1 and 0.838:1. The dramatically there was decrease on
48
the fixed asset ratio 2013-14 in 0.774:1 which means there was ideal capital in
2014-15 there was fixed asset ratio partly increase 0.787:1.
INFEENCE:
The ideal fixed asset ratio is 0.67:1. As observed from the table fixed asset
ratio shows that 2010-11decrease ideal ratio 0.404:1 and following next four years
increase ideal ratio. If ratio less than it indicate that a portion working capital has
been financing by long term funds on following year and not more than ideal ratio.
CHART-3.6.7
FIXED ASSETS RATIO
2011 2012 2013 2014 20150
0.10.20.30.40.50.60.70.80.9
1
Fixed asset ratio
Fixed asset ratio
49

TABLE-3.6.8
PROPRIETORY RATIO
Year Share holder funds
Total tangible asset
Proprietary ratio
2011 4521 11270 0.4902012 11154 22760 0.4902013 12914 26275 0.4912014 12376 25210 0.4902015 12011 24899 0.482
FINDING:
Initially in financial year 2010-2011 proprietary ratio is 0.490:1 which
means there was no ideal capital but there was constant of proprietary ratio in
2011-12 and 2013-14 which was 0.491:1 dramatically increase proprietary ratio in
2012-13 which means there was no ideal capital in 2014-15 there was decrease in
proprietary ratio 0.482:1.
50

INFERENCE:
The ideal proprietary ratio is 0.50:1. As observed from the table proprietary
ratio shows below .50 of all years the creditors since them to lose heavily in the
event of company’s liquidation. It is ratio shows that soundness of company.
CHART-3.6.8
PROPRIETORY RATIO
2011 2012 2013 2014 20150.476
0.478
0.48
0.482
0.484
0.486
0.488
0.49
0.492
Proprietary ratio
Proprietary ratio
51

TABLE-3.6.9
PROFITABILITY MEASUREMENT RATIO
a) RETURN ON TOTAL ASSETS
Year Profit after tax and interest
Total assets Return on total assets
2011 2009 12104 16.59%2012 1898 22760 8.33%2013 2269 26275 8.63%2014 1149 16878 6.80%2015 877 15876 5.52%
FINDING:
Initially in financial year 2010-11 the return on total asset is 16.59% which
means higher return on total asset is profit but there was decrease in the return on
total asset in 2011-12 to 2012-13 which was 8.33% and 8.63% dramatically there
52

was decrease in the proprietary ratio 2013-14 which means there was low return on
total asset in 2014-15 there was decrease in return on total asset 5.52%
INFERENCE:
The return on total asset higher than profit of business. As on observed from
the table return on total asset shows average 16.59% only during the year 2010-11
and next 4 years lower of return on total asset.
CHART-3.6.9
RETURN ON TOTAL ASSETS
2011 2012 2013 2014 20150.00%
2.00%
4.00%
6.00%
8.00%
10.00%
12.00%
14.00%
16.00%
18.00%
Return on total assets
Return on total assets
53

TABLE-3.6.10
NET PROFIT RATIO
Year Net profit Net sales Net profit ratio
2011 1861 26948 6.90%2012 1779 26562 6.69%2013 1911 21248 8.99%2014 478 16878 2.83%2015 365 15876 2.29%
FINDING:
Initially in financial year 2010-11net profit ratio is 6.90 which means no higher
profit but there was partly increase in the net profit ratio in 2011-12which was
6.69% and dramatically there was increase in the net profit ratio 2012-13 in 8.99%
which means there was decrease in net profit ratio 2013-14 and 2014-15 2.83 to
2.29%.
54

INFERENCE:
The net profit ratio is higher than and profit of business and lowers than a loss
of business. As on observed from table that shows average 8.99% in 2012-13 and
lower 2.29% in 2014-15.
CHART-3.6.10
NET PROFIT RATIO
2011 2012 2013 2014 20150.00%1.00%2.00%3.00%4.00%5.00%6.00%7.00%8.00%9.00%
10.00%
Net profit ratio
Net profit ratio
55
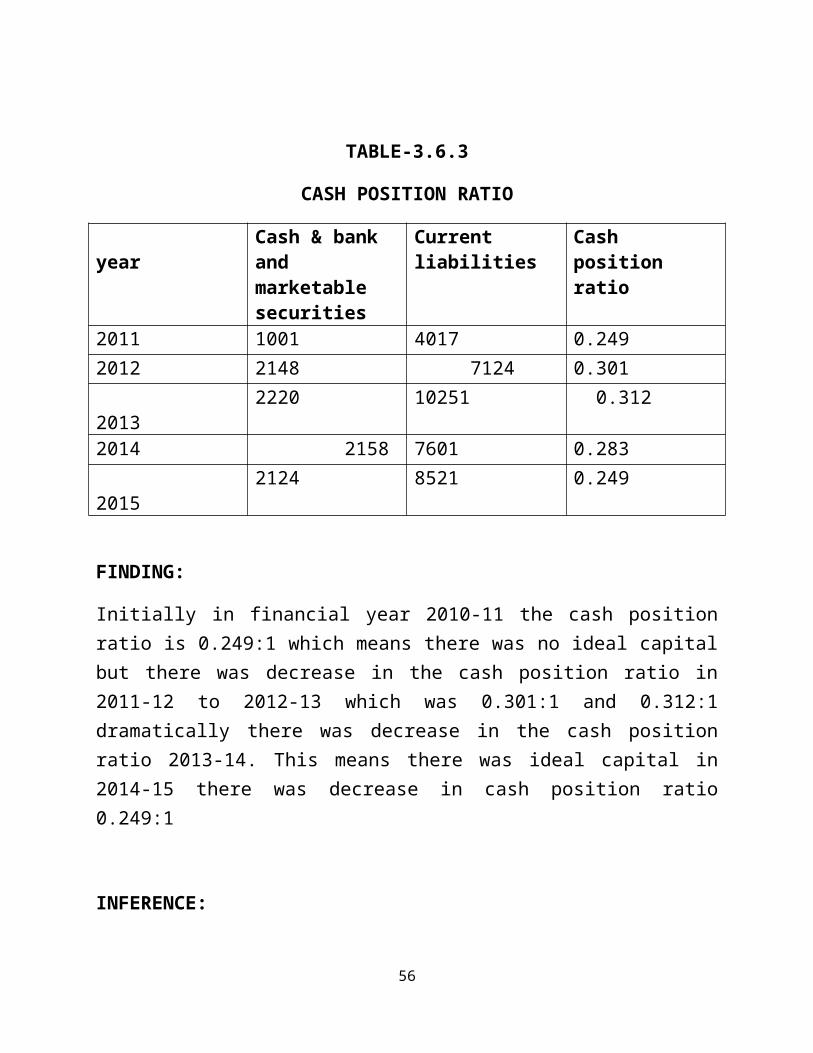
TABLE-3.6.11
GROSS PROFIT RATIO
Year Gross profit Net sales Gross profit ratio2011 1810 25016 7.25%2012 3272 26893 12.16%2013 2928 21428 13.66%2014 674 16878 3.99%2015 358 15876 2.25%
FINDING:
Initially in financial year 2010-2011gross profit ratio is 7.25% which means
there was higher ratio preferable higher profitability but there was increase gross
profit ratio in 2011-12 to 2012-13 which was 13.66% and dramatically there was
decrease in the gross profit ratio in 2013-14 3.99% and also decrease gross profit
ratio 2.25% in 2014-15.
56

INFERENCE:
The gross profit ratio higher profit ratio preferable for indicates of higher
profitability of business and low gross profit ratio losses of business. As on
observed from the table show that higher gross profit is 2012-13 in 13.66 and
lower gross profit ratio is 2.25 in 2014-2015.
CHART-3.6.11
GROSS PROFIT RATIO
2011 2012 2013 2014 20150.00%
2.00%
4.00%
6.00%
8.00%
10.00%
12.00%
14.00%
16.00%
Gross profit ratio
Gross profit ratio
57

TABLE-3.6.12
PONNI SUGAR (ERODE) LIMITED
COMPARATIVE BALANCE SHEET AS ON 31ST MARCH 2010 AND 2011
particular 2010 Rs. In lakh
2011Rs. In lakh
(+) increase and (-) decreaseAmount Rs.
Percentage %
ASSETS:1. CURRENT
ASSETS:a. Inventoriesb. Sundry debtorsc. Cash & bankd. Loan & advances
8,969 1,227 306 1,333
6,658 352 172 2,114
-2,311 -875 -134 +781
25.76 71.31 43.79 58.58
A. TOTAL CURRENT ASSETS
11,835 9,296 -2,539 21.45
2. FIXED ASSETS:a. Gross blockb. (-) depreciation
7,095 2,392
7,168 2,647
+73 -255
1.028 10.660
c. Net block 4,703 4,521 -182 3.869
58

d. Capital WISe. Cogon project
_ _
18 1,457
+18 +1,457
0 0
B. TOTAL FIXED ASSETS 4,703 5,996 +1,475 31.36
3. INVESTMENT 829 829 _ _4. CURRENT
LIABILITIESa. Current
liabilityb. Provision
3,595 2,035
3,817 200
-222 +1,875
6.175 90.170
C. TOTAL CURRENT LIABILITIES
5,630 4,017 +1,613 28.650
TOTAL ASSETS (A+B-C)
11,737 12,104 367 3.126
LIABILITIES:a. Share capitalb. Reserve &
surplusc. Secured loand. Deferred tax
860 7,104
3,430 343
860 8,765
1,645 834
_ +1,661
-1,785 +491
20.85
52.04 143.41
TOTAL LIABILITIES 11,835 12,104 367 3.126
FINDING:
The total current asset on 2010 Rs.11, 835(in lakh) and 2011 Rs.9, 296(in lakh). It was decrease of 2010 to 2011 -2539 based for decrease of inventory, sundry debtors, and cash& bank in 2011.
The total fixed asset on 2011 Rs 4, 703(in lakh) and 2010 Rs.5, 996(in lakh). It was increase of 2010 to 2011 +1475 based for increase capital work in progress , cogon project , and gross block in 2011
The total current liabilities is deducted in total asset on 2010 Rs.5, 630(in lakh) and 2011 Rs.4, 017(in lakh) increased of 2010 to 2011 +1,613 based for increase provision in 2011.
59

The long term liabilities on 2010 Rs.11, 835(in lakh) and 2011 Rs.12, 104(in lakh) based for increased reserve & surplus and deferred tax in 2011.
The total assets Rs. 11, 737(in lakh) in 2010 and increased asset Rs. 12, 104 (in lakh)in 2011.There was increase asset in 2010 to 2011 growing of company.
TABLE-3.6.12
PONNI SUGAR (ERODE) LIMITED
COMMON SIZE BALANCE SHEET AS ON 31ST MARCH 2010 AND 2011
Particular 2010 % 2011 %
ASSETS:1. CURRENT
ASSETS:a. Inventoriesb. Sundry debtorsc. Cash & bankd. Loans &
advances
8,969 1,227 306
1,333
76.41 10.45 2.60
11.35
6,658 352 172
2,114
55 2.90 1.42
17.46A. TOTAL
CURRENT ASSETS:
11,835 100.81 9,296 76.78
2. FIXED ASSETS:a. Gross blockb. (-) depreciation
7,095 2,392
60.44 20.38
7,168 2,647
59.22 21.86
c. Net block 4,703 40.06 4,521 31.26
60

d. Capital WISe. Cogon project
_ _
_ _
18 1,457
0.148 12.00
B. TOTAL FIXED ASSETS 4,703 40.06 5,996 49.53
3. INVESTMENT 829 7.063 829 6.844. CURRENT
LIABILITIES(-)a. Current liabilitiesb. Provision
3,595 2,035
30.62 17.33
3,817 200
31.53 1.65
C. TOTAL CURRENT LIABILITIES
5,630 47.96 4,017 33.19
TOTAL ASSETS (A+B-C)
11,737 100 12,104 100
LIABILITIES:a. Share capitalb. Reserve & surplusc. Secured loand. Deferred tax
860 7,104 3,430 343
7.32 60.52 29.22 2.92
860 8,765 1,645 834
7.10 72.41 13.59 6.81
TOTAL LIABILITIES 11,737 100% 12,104 100
FINDING:
The common size balance sheet is total current asset on Rs.11, 835( in lakhs) in 2010 percentage 100.8% and total current asset on Rs.9, 296 (in lakhs)decrease percentage 76.8% compare previous year
The total fixed asset on Rs.4, 703 (in lakhs) in 2010 percentage 40.06% and total fixed asset increase in Rs.5, 996(in lakhs) in 2011 increase percentage 49.53% compare previous year.
The investment constant level of 2010 and 2011. That is no increase or decrease of investment and percentage different level 7.06% and 6.84%.
The total current liabilities deducted total asset in 2010 Rs.5, 630(in lakhs) and percentage 47.96%. In 2011 total current liabilities Rs. 4, 017(in lakhs) decrease percentage 33.18% for previous year.
61

The total asset is Rs.11, 737(in lakhs) and Rs.12, 104(in lakhs) in 2010 to 2011 based for same percentage 100%
The liabilities total is Rs.12, 737(in lakhs) and Rs. 12, 1049in lakhs) in 2010 to 2011 decrease liabilities in 2011 for previous year.
TABLE- 3.6.13
PONNI SUGAR (ERODE) LIMITED
COMPARATIVE BALANCE SHEET AS ON 31ST MARCH 2011 AND 2012
particular 2011 Rs. In lakh
2012 Rs. In lakh
(+) increase and (-) decreaseAmount Rs.
Percentage %
ASSETS:1. CURRENT
ASSETS:a. Inventoriesb. Trade receivablec. Cash & bankd. Short term loane. Other current
asset
6,659 352 172 419
939
4,694 1,185 69 486
1,360
-1,965 +833 -103 +67
+421
29.50 236.64 59.88 15.99
44.83A. TOTAL
CURRENT ASSETS
8,541 7,794 -747 8.75
2. FIXED ASSETS
62

a. Tangible assetb. Capital WISc. Noncurrent
investmentd. Long term
loan advancese. Other
noncurrent asset
4,521 396
829
1,084
750
4,417 8,417
2,079
53
_
-104 +8,021
+1,250
-1,031
-750
2.30 2025
150.80
95
1
B. TOTAL FIXED ASSETS 7,580 14,966 +7,386 97.44
TOTAL ASSETS (A+B) 16,121 22,760 +6,639 41.18LIABILITIES:
3. CURRENT LIABILITIESa. Short term
borrowingb. Trade payablec. Other current
liabilitiesd. Short term
provision
_ 2,956
1,262
589
1,151 3,206
1,602
1,165
+1,151 +250
+340
+576
0 8.45
26.94
97.92
C. TOTAL CURRENT LIABILITIES
4,807 7,124 +2,317 48.02
4. NONCURRENT LIABILITIESa. Long term
borrowingb. Deferred taxc. Share capitald. Reserve &
surplus
855 834 860
8,765
3,677 805 860
10,294
+2,822 -29 _
+1,529
330 3.47 0
17.44
D. TOTAL NON CURRENT 11,314 15,636 +4,322 181.66
63

LIABILITIES
TOTAL LIABILITIES(C+D)
16,121 22,760 +6,639 41.88
FINDING:
The total current asset is Rs. 8, 541( in lakhs) in 2011 and total current asset decrease Rs.7, 794 (in lakhs) 2012 based decrease of inventories, cash and bank -737 in current asset.
The total fixed asset is Rs. 7, 580 (in lakhs) in 2011 and total current asset increase Rs.14, 996(in lakhs) in 2012 based for increase capital work in progress, investment +7386 in fixed asset.
The total asset is Rs.16, 121 (in lakhs) and increase Rs.22, 760(in lakhs) in 2011 to 2012.
The total current liabilities is Rs.4, 807(in lakhs) in 2011 and increase current liabilities Rs.7, 124(in lakhs) in 2012 based for all current liabilities increase of previous year.
The total long term liabilities are Rs.11, 314(in lakhs) in 2011 and increase of current liabilities Rs.15, 636(in lakhs) in 2012 based for increase long term borrowing, reserve & surplus for previous year.
The total liability is Rs.16, 121(in lakhs) in 2011 and increase liabilities Rs. 22, 760(in lakhs) in 2012.
64

TABLE-3.6.14
PONNI SUGAR (ERODE) LIMITED
COMMON SIZE BALANCE SHEET AS ON 31ST MARCH 2011 AND 2012
Particular 2011Rs. In lakh %
2012 Rs. In lakh %
ASSETS:1. CURRENT
ASSETS:a. Inventoriesb. Trade receivablec. Cash & bankd. Short term loan
& advancese. Other current
liabilities
6,659 352 172
419
939
41.30 2.18 1.06
2.59
5.82
4,694 1,185 69
486
1,360
20.62 5.206 0.303
2.135
5.975A. TOTAL
CURRENT ASSETS
8,541 52.98 7,794 34.24
65

2. FIXED ASSETSa. Tangible assetb. Capital WISc. Noncurrent
investmentd. Long term loan
&advancese. Other noncurrent
asset
4,521 396
829
1,084
750
28.04 2.45
0.051
6.72
4.65
4,417 8,417
2,079
53
_
19.40 36.98
9.13
0.232
0
B. TOTAL FIXED ASSETS 8,580 47.00 14,966 65.75
TOTAL ASSETS (A+B) 16,121 100.00 22,760 100LIABILITIES:
1. CURRENT LIABILITIESa. Short term
borrowingb. Trade payablec. Other current
liabilitiesd. Short term
provision
_
2,956
1,262
589
0
18.33
7.82
3.65
1,151
3,206
1,602
1,165
5.05
14
7.03
5.11C. TOTAL
CURRENT LIABILITIES
4,807 29.81 7,124 31.30
2. NONCURRENT LIABILITIESa. Long term
borrowingb. Deferred taxc. Share capitald. Reserve and
surplus
855 834 860
8,765
5.30 5.17 5.33
54.37
3,677 805 860
10,294
16.15 3.53 3.77
45.22
D. TOTAL NON CURRENT LIAB LITIES
11,314 70.17 15,636 80.30
66

TOTAL LIABILITIES (C+D)
16,121 100 22,760 100
FINDING:
The total current asset is Rs.8, 541 (in lakhs) and percentage 52.98% in 2011. There was current asset is Rs.7, 794(in lakhs) decrease percentage 34.24% in2012.
The total fixed asset is Rs.8, 580 (in lakhs) and percentage 47.0% in 2011 and there was fixed asset is Rs.14, 966( in lakhs) increase percentage 65.75% in 2012.
The total asset is Rs.16, 121( in lakhs) 100%in 2011 and Rs.22, 760( in lakhs) increased 100% in 2012.
The total current liabilities is Rs.4, 807(in lakhs )of percentage 29.81% in 2011 and Rs.7, 124 (in lakhs) increase percentage 31.30% in 2012.
The total long term liabilities is Rs.9, 625 (in lakhs) of percentage 59.70% in 2011 and Rs.11, 154(in lakhs)decrease percentage in 2012.
The total liabilities Rs.16, 121(in lakhs) 100% in 2011 and increased Rs.22, 760 in lakhs 100% in 2012.
TABLE-3.6.15
PONNI SUGAR (ERODE) LIMITED
COMPARATIVE BALANCE SHEET AS ON 31ST MARCH 2012 AND 2013
Particular 2012Rs. In lakh
2013Rs. In lakh
(+) increase and (-) decrease Amount Rs.
Percentage %
ASSETS:1. CURRENT ASSETS:
a. Inventoriesb. Trade receivablec. Cash &bankd. Short term loan &
advancese. Other current asset
4,694 1,185 69
1,099 735
7,383 1,689 141
675 694
+2,689 +504 +72
-424 -41
57.28 42.53 104.34
38.58 5.57
A. TOTAL CURRENT
67

ASSETS 7,782 10,582 +2,800 35.982. FIXED ASSETS
a. Tangible assetsb. Capital WISc. Noncurrent
investmentd. Long term
loans&advances
4,417 8,417
2,079
65
13,309 27
2,079
278
+8,892 -8,390
_
+213
201 99.61
_
327.60B. TOTAL FIXED
ASSETS14,978 15,963 +715 4.773
TOTAL ASSETS (A+B) 22,760 26,275 +3,515 15.214LIABILITIES:
1. CURRENT LIABILITIESa. Short term
borrowingb. Trade payablec. Other current
liabilitiesd. Short term provision
1,151 3,162 1,646
1,165
5,031 2,762 1,526
932
+3,880 -400 -120
-233
337.98 12.65 7.29
20
C. TOTALCURRENT LIABLITIES 7,124 10,251 +3,127 43.89
2. NON CURRENT LIABILITIESa. Long term
borrowingb. Deferred taxc. Share capitald. Reserve & surplus
3,677 805 860 10,294
3,000 110 860 12,054
-677 -695 _ +1,760
18.41 86.33 _ 17.09
D. TOTAL NON CURRENT LIABILITES
15,636 16,024 388 46.38
TOTAL LIABILITIES (C+D) 22,760 26,275 +3,515 31.51
FINDING:
68

The total current asset is Rs.7, 782( in lakhs) in 2012 and increase current asset Rs.10, 582( in lakhs) in 2013 based for inventories, trade receivable and cash& bank +2800 for previous year.
The total fixed asset is Rs.14, 978( in lakhs) in 2012 and increase fixed asset Rs.15, 963 (in lakhs) in 2013 based for tangible asset and long term loans & advances +715 for previous year.
The total asset is Rs.22, 760( in lakhs) in 2012 and increase fixed asset Rs.26, 275( in lakhs) in 2013.
The total current liabilities is Rs.7, 124( in lakhs) in 2012 and increased current liabilities is Rs.10, 251( in lakhs) in 2013 based for short term borrowing +3127 for previous year.
The long term liabilities is Rs.15, 636( in lakhs) in 2012 and increase long term liabilities Rs.16, 024( in lakhs )in 2013 based for reserve & surplus for previous year.
The total liabilities are Rs.22, 760 (in lakhs) in 2012 and an increase liability is Rs.26, 275 (in lakhs) in 2013.
TABLE -3.6.16
PONNI SUGAR (ERODE) LIMITED
COMMON SIZE BALANCE SHEET AS ON 31ST MARCH 2012 AND 2013
Particular 2012 % 2013 %ASSETS:
1. CURRENT ASSETSa. Inventoriesb. Trade receivablec. Cash & bankd. Short term loane. Other current
assets
4,694 1,185 69 1,099
735
20.62 5.20 0.303 4.82
3.22
7,383 1,689 141 675
694
28 6.42 0.53 2.56
2.64A. TOTAL
CURRENT ASSETS
7,782 34.16 10,582 40.15
2. FIXED ASSETSa. Tangible assets 4,417 19.40 13,309 50.65
69
b. Capital WISc. Long noncurrent
investmentd. Long term loan
and advances
8,417 2,079
65
36.98 9.13
0.28
27 2,079
278
0.10 7.91
1.05
B. TOTAL FIXED ASSETS 14,978 65.79 15,693 59.71
TOTAL ASSETS(A+B) 22,760 100 26,275 100LIABILITIES
1. CURRENT LIABILITIES
a. Short term borrowing
b. Trade receivablec. Other current
liabilitiesd. Short term provision
1,151 3,162
1,646 1,165
5.05 13.89
7.23 5.11
5,031 2,762
1,526 932
19.14 10.57
5.80 3.84
C. TOTAL CURRENT LIABILITIES
7,124 31.28 10,251 38.99
2. NON CURRENT LIABILITIESa. Long term
borrowingb. Deferred tax
liabilitiesc. Share capitald. Reserve &
surplus
3,677
805 860
10,294
16.15
3.53 3.77
45.22
3,000
110 860
12,054
11.41
0.41 3.27
45.87D. TOTAL NON
CURRENT LIABILITES
15,636 68.67 16,024 60.96
TOTAL LIABILITES(C+D)
22,760 100 26,275 100
FINDING:
70

The total current asset is Rs.7, 782( in lakhs) of percentage on 34.16% in 2012 and increase current asset is Rs.10, 582( in lakhs) of percentage of 40.16% in 2013.
The total fixed asset is Rs.14, 978( in lakhs )of percentage on 65.79% in 2012 and increase fixed asset is Rs.15, 693( in lakhs) of percentage on 59.7% in 2013.
The total asset is Rs.22, 760( in lakhs) of 100% in 2012 and increase asset Rs.26, 275 (in lakhs) of 100% in 2013.
The total current liabilities is Rs.7, 124( in lakhs )percentage of 31.28% in 2012 and increase current liabilities Rs.10, 251( in lakhs) of percentage on 38.99% in 2013.
The long term liabilities is Rs.15, 636 (in lakhs) percentage on 68.67% in 2012 and increase long term liabilities Rs.16, 024( in lakhs) percentage on 60.96% in 2013.
The total liabilities is Rs.22, 760( in lakhs) 100% in 2012 and increase liabilities Rs.26, 275( in lakhs) 100% in 2013.
TABLE-3.6.17
COMPARATIVE BALANCE SHEET AS ON 31ST MARCH 2013 AND 2014
Particular 2013 Rs. In lakh
2014 Rs. In lakh
(+) increase and (-) decreaseAmount Rs.
Percentage %
ASSETS:1. CURRENT
ASSETS:a. Inventoriesb. Trade receivablec. Cash & bankd. Short term loan
and advancese. Other current
asset
7,383 1,689 141
675
694
7,214 1,156 79
299
715
-169 -533 -62
-376
+21
2.289 31.557 43.971
55.703
3.025A. TOTAL
CURRENT ASSETS
10,582 9,463 -1,119 10.574
71

2. FIXED ASSETS:a. Tangible assetsb. Capital WISc. Noncurrent
investmentd. Long term loan
& advances
13,309 27
2,079
278
13,339 67
2,079
262
+30 +40
_
-16
0.225 148.148
_
5.755B. TOTAL FIXED
ASSETS 15,693 15,747 +54 0.344TOTAL ASSETS (A+B) 26,275 25,210 -1065 -4.053LIABILITIES:
1. CURRENT LIABILITIESa. Short term
borrowingb. Trade payablec. Other current
liabilityd. Short term
provision
5,031 2,762
1,526
932
3,214 2,541
636
1,210
-1,817 -221
-890
+278
36.116 8.001
58.322
29.821A. TOTAL
CURRENT LIABILITIES
10,251 7,601 -2,650 25.850
2. NON CURRENT LIABILITIESa. Long term
borrowingb. Deferred tax
liabilityc. Capitald. Reserve &
surplus
3,000
110 860
12,054
4,926
307 860
11,516
+1,926
+197 -527
-538
64.20
179.09 3.944
4.463B. TOTAL NON
CURRENT LIABILITIES
16,024 17,609 1,585 8.11
TOTAL LIABILITIES (C+D)
26,275 25,210 -1,065 -4.053
FINDING:
72

The total current asset is Rs.10, 582 (in lakhs) in 2013 and decrease current asset based for inventories, trade receivable, cash & bank and short term loan and advances Rs.9, 463 (in lakhs)in 2014 -1119 for previous year.
The total fixed asset is Rs.15, 693 (in lakhs) on 2013 and increase fixed asset based for tangible asset and capital work in progress Rs.15, 747(in lakhs) on 2014 is +54 for previous year.
The total asset is Rs.26, 275 (in lakhs) in 2013 and decrease current asset is Rs.25, 210( in lakh) in 2014.
The total current liabilities is Rs.10, 251 (in lakhs) in 2013 and decrease of current liabilities based for trade payable, short term borrowing and other current liabilities Rs.7, 601 (in lakhs) in 2014 -2650 compare previous year.
The total noncurrent liabilities is Rs.16, 024 (in lakhs) in 2013 and increase current liabilities based for long term borrowing and deferred tax Rs.17, 609 (in lakhs) in 2014 1585 for previous year.
The total liabilities is Rs.12, 914( in lakhs )in 2013 and decrease liabilities is Rs.12, 376 (in lakhs) in 2014.TABLE -3.6.18
PONNI SUGAR (ERODE) LIMITED
COMMON SIZE BALANCE SHEET AS ON 31ST MARCH 2013 AND 2014
Particular 2013 Rs. In lakh %
2014 Rs. In lakh %
ASSETS:1. CURRENT
ASSETS:a. Inventoriesb. Trade receivablec. Cash & bankd. Short term loane. Other current
asset
7,383 1,689 141 675
694
28.09 6.43 0.586 2.568
2.641
7,214 1,156 79 299
715
28.61 4.53 0.313 1.186
2.836A. TOTAL
CURRENT ASSETS
10,582 40.27 9,463 37.536
2. FIXED ASSETSa. Tangible asset 13,309 50.65 13,339 52.911
73

b. Capital WISc. Noncurrent asset
investmentd. Long term loan
& advances
27
2,079
278
0.102
7.912
1.058
67
2,079
262
0.265
8.246
1.039B. TOTAL FIXED
ASSETS 15,693 60.753 15,747 62.463TOTAL ASSETS (A+B) 26,275 100 25,210 100LIABILITIES:
1. CURRENT LIABILITIESa. Short term
borrowingb. Trade payablec. Other current
liabilityd. Short term
provision
5,031 2,762
1,526
932
19.14710.510
5.80
3.54
3,214 2,541
636
1,210
12.74 10.07
2.52
4.79C. TOTAL
CURRENT LIABILITIES
10,251 40.04 5,233 20.75
2. NON CURRENT LIABILITIESa. Long term
borrowingb. Deferred tax c. Share capitald. Reserve &
surplus
3,000 110 860
12,054
11.41 0.418 3.273
45.871
4,926 307 860
11,516
19.53 1.21 3.41
45.68D. TOTAL NON
CURRENT LIABILITES
16,024 60.985 17,609 49.09
TOTAL LIABLITIES (C+D)
26,275 100 25,210 100
FINDING:
74

The total current asset is Rs.10, 582(in lakhs) percentage on 40.27% in 2013 and decrease current asset is Rs.9, 463 percentages on 37.53% in 2014.
The total fixed asset is Rs.15, 693(in lakhs) percentage on 60.75% in 2013 and increase fixed asset is Rs.15, 747 (in lakhs) percentage on 62.42% in 2014.
The total asset is Rs.26, 275(in lakhs) 100% in 2013 and decrease asset Rs.25, 210 (in lakhs) 100% in 2014.
The total current liabilities is Rs.10, 251(in lakhs) percentage on 40.04% in 2013 and decrease current liabilities is Rs.5, 233( in lakhs )percentage on 20.75% in 2014.
The total noncurrent liabilities is Rs.16, 024(in lakhs) percentage on 60.98% in 2013 and increase noncurrent liabilities is Rs.17, 609 (in lakhs) percentage on 49.09% in 2014.
The total liability is Rs. 26, 275( in lakhs)100% in 2013 and decreased liabilities is Rs.25, 210( in lakhs) 100% in 2014.
TABLE-3.6.19
PONNI SUGAR (ERODE) LIMITED
COMPARATIVE BALANCE SHEET AS ON 31ST MARCH 2014 AND 2015
Particular 2014 Rs. In lakh
2015Rs. In lakh
(+) increase and (-) decreaseAmount Rs.
Percentage %
ASSETS:1. CURRENT
ASSETS:a. Inventoriesb. Trade receivablec. Cash & bankd. Short term loan
& advancese. Other current
7,214 1,156 79
299
7,250 1,504 45
260
+36 +348 -34
-39
0.49 30.70 43
13
75

asset 695 691 -4 0.57A. TOTAL
CURRENT ASSETS
9,443 9,750 +307 3.25
2. FIXED ASSETS:a. Tangible assetsb. Capital WISc. Noncurrent assetd. Long term loan
& advances
13,339 67 2,079
262
12,773 16 2,079
281
-566 -51 _
+19
4.24 76.11 _
7.25B. TOTAL FIXED
ASSETS 15,747 15,149 -598 3.79TOTAL ASSETS (A+B) 25,190 24,899 -291 1.15LIABILITIES:
1. CURRENT LIABILITIESa. Short term
borrowingb. Trade payablec. Other current
liabilitiesd. Short term
provision
3,214 2,541
616
1,210
3,438 3,175
749
1,159
+224 +634
+133
-51
6.96 24.95
21.54
4.21C. TOTAL
CURRENT LIABILITIES
7,581 8,521 +940 12.39
2. NONCURRENT LIABILITIES:
a. Long term borrowing
b. Deferred tax liability
c. Share capitald. Reserve & surplus
4,926 307 860 11,516
4,238 129 860 11,151
-688 -178 _ -365
13.96 57.98 _ 3.16
D. TOTAL NONCURRENT LIABILITIES
17,609 16,378 -1,231 19.48
TOTAL LIABILITIES (C+D)
25,190 24,899 -291 1.15
76

FINDING:
The total current asset is Rs.9, 443in lakhs in 2014 and increased current asset is Rs.9, 750 in lakhs based for inventories and trade receivable in 2015 +307 for previous year.
The total fixed asset is Rs.15, 747 in lakhs in 2014 and decrease fixed asset is Rs.15, 149in lakhs based for tangible asset and capital work in progress in 2015 -598 for previous year.
The total asset is Rs.25, 190 in lakhs in 2014 and decrease asset is Rs.24, 899 in lakhs in 2015.
The total current liabilities is Rs.7, 581 in lakhs in 2014 and increase current liabilities is Rs.8, 521 in lakhs based for short term borrowing, trade payable and other current liabilities in 2015 +940 for previous year.
The noncurrent liabilities is Rs.17, 609 in lakhs in 2014 and decrease noncurrent liabilities is Rs.16, 378 in lakhs based for all noncurrent liabilities in 2015 -1231 for previous year.
The total liabilities is Rs.25, 190 in lakhs in 2014 and decreased current liabilities Rs.24, 899 in lakhs in 2015. TABLE-3.6.20
PONNI SUGAR (ERODE) LIMITED
COMMON SIZE BALANCE SHEET AS ON 31ST MARCH 2014 AND 2015
Particular 2014 Rs. In lakh %
2015 Rs. In lakh %
ASSETS:1. CURRENT
ASSETS:a. Inventoriesb. Trade receivablec. Cash & bankd. Short term loane. Other current
asset
7,214 1,156 79 299
695
28.63 4.58 0.31 1.18
2.96
7,250 1,504 45 260
691
29.11 6 0.18 1
2.77A. TOTAL
CURRENT ASSETS
9,443 37.46 9,750 39.06
77

2. FIXED ASSETS:a. Tangible assetb. Capital WISc. Noncurrent
investmentd. Long term loan
& advances
13,339 67
2,079
262
52.95 0.26
8.25
1.04
12,773 16
2,079
281
51.29 0.06
8.34
1.12B. TOTAL FIXED
ASSETS 15,747 62.50 15,149 60.81TOTAL ASSETS (A+B) 25,190 100 24,899 100 LIABILITIES:
1. CURRENT LIABILITIESa. Short term
borrowingb. Trade payablec. Other current
liabilitiesd. Short term
provision
4,926 307
860
11,516
19.55 1.21
3.41
45.71
3,438 3,175
749
1,159
13.76 12.75
3
4.65C. TOTAL
CURRENT LIABILITIES
7,581 30 8,521 34.16
2. NONCURRENT LIABILITIES:a. Long term
borrowingb. Deferred tax
liabilityc. Share capitald. Reserve &
surplus
4,926
307 860
11,516
19.54
1.21 3.41
45.71
4,238
129 860
11,151
17
0.51 3.45
44.78D. TOTAL
NONCURRENT LIABILITIES
17,609 50.43 16,378 65.74
TOTAL LIABILITIES (C+D)
25,190 100 24,899 100
78

FINDING:
The total current asset is Rs.9, 443 (in lakhs)percentage on 37.46% in 2014 and increase current asset is Rs.9, 750 (in lakhs) percentage on 39.06% in 2015.
The total fixed asset is Rs.15, 747 (in lakhs) percentage on 62.40%in 2014 and decrease fixed asset is Rs.15, 149( in lakhs) percentage on 60.81% in 2015.
The total asset is Rs.25, 190 (in lakhs) 100% in 2014 and decrease asset Rs.24, 899 (in lakhs) 100% in 2015.
The total current liabilities is Rs.7, 581( in lakhs) percentage on 30% in 2014 and increase current liabilities is Rs.8, 521 (in lakhs) Percentage on 34.16% in 2015.
The total noncurrent liabilities is Rs.17, 609( in lakhs) percentage on 50.43% in 2014 and decrease noncurrent liabilities is Rs.16, 378( in lakhs ) percentage on 65.74% in 2015.
The total liabilities is Rs.25, 190( in lakhs )100% in 2014 and decrease current liabilities is Rs.24, 899( in lakhs) 100% in 2015.
FINDING AND SUGGESTION79

FINDINGS:
The current ratio is ideal ratio 2:1and highest current ratio 2.31:1 in 2010-11 the next following year decrease current ratio in 2012 to 2015.
The quick ratio is ideal ratio 1:1 and no ideal ratio in 2011to 2015 which means highest quick ratio is 0.645:1in 2010 -11 and lowest ratio 0.293:1 in 2014-15.
The cash position ratio is ideal ratio 0.75:1 and no ideal ratio in 2011 to 2015 which means highest ratio 0.312:1 in 2012-13 and lowest ratio is 0.249:1 in 2010-11 and 2014-15.
The inventory turnover ratio is highest sales and lower inventory of 11.31:1 in 2011-12 and lowest ratio 4.37:1 in 2014-15.
The fixed asset turnover ratio is highest ratio of 5.60:1 in 2010-11 and lowest ratio is 1.241:1in 2014-15.
The working capital turnover ratio is higher level of efficient use of company the highest ratio on 64.19:1 in 2012-13 and lowest ratio on 5.10:1 in 2010-11.
80

The fixed asset ratio is ideal capital 0.67:1 and there is highest ratio 0.868:1 in 2012-13 and lowest ratio is 0.404:1in 2010-11.
The proprietary ratio is ideal ratio 0.5:1 and there is no ideal ratio in 2011-15 which means highest ratio is 0.491:1 in 2012-13 and lowest ratio is 0.482:1 in 2014-15.
The return on total asset is highest ratio 16.59% in 2010-11 and lowest ratio is 5.52% in 2014-15.
The net profit ratio is higher than profit of business and lower than loss of business there was highest ratio on 8.99% in 2012-13 and lowest ratio is 2.29% in 2014-15.
The gross profit ratio is higher profit indicates profit of business and low profit loss of business there was highest ratio on 13.66% in 2012-13 and lowest ratio is 2.25% in 2014-15.
The comparative balance sheet is performance efficiency and financial position of company based for asset and liabilities of highest level on Rs. 26, 275 (in lakhs) and Rs.25, 210 (in lakhs) in 2013-14 and lowest level of Rs.11, 737 (in lakhs) and Rs.12, 104 (in lakhs) in 2010-11.
The common size balance sheet is performance efficiency and financial position of company based for asset and liabilities of highest level on Rs.26, 275 (in lakhs) 100% and Rs.25, 210 (in lakhs) 100% in 2013-14 and lowest level of Rs.11, 737 (in lakhs) 100% and Rs.12, 104 (in lakhs) 100% in 2010-11.
The liabilities total is Rs.12, 737(in lakh) and Rs. 12, 1049in lakh) in 2010 to 2011 decrease liabilities in 2011 for previous year.
The total asset is Rs.16, 121 (in lakhs) and increase Rs.22, 760(in lakhs) in 2011 to 2012.
The total liability is Rs.16, 121(in lakhs) in 2011 and increase liabilities Rs. 22, 760(in lakhs) in 2012.
The total asset is Rs.16, 121( in lakhs) 100%in 2011 and Rs.22, 760( in lakhs) increased 100% in 2012.
The total liability is Rs.16, 121(in lakhs) in 2011 and increase liabilities Rs. 22, 760(in lakhs) in 2012.
The total asset is Rs.22, 760( in lakhs) in 2012 and increase fixed asset Rs.26, 275( in lakhs) in 2013.
81

The total liabilities are Rs.22, 760 (in lakhs) in 2012 and an increase liability is Rs.26, 275 (in lakhs) in 2013.
The total asset is Rs.22, 760( in lakhs) of 100% in 2012 and increase asset Rs.26, 275 (in lakhs) of 100% in 2013.
The total liabilities is Rs.22, 760( in lakhs) 100% in 2012 and increase liabilities Rs.26, 275( in lakhs) 100% in 2013.
The total asset is Rs.25, 190 in lakhs in 2014 and decrease asset is Rs.24, 899 in lakhs in 2015.
The total liabilities is Rs.25, 190 in lakhs in 2014 and decreased current liabilities Rs.24, 899 in lakhs in 2015.
The total asset is Rs.25, 190 (in lakhs) 100% in 2014 and decrease asset Rs.24, 899 (in lakhs) 100% in 2015.
The total liabilities is Rs.25, 190( in lakhs )100% in 2014 and decrease current liabilities is Rs.24, 899( in lakhs) 100% in 2015.
SUGGESTIONS: The current ratio of the company is below the standard ratio last 4 years
under study, hence it should be improved at least standard ratio and 2010-11
for ideal capital good level of maintain current ratio of company.
The quick ratio or liquid ratio of the company quickly convertible cash is
below the standard ratio all years under study; hence it should be improved
at least to the standard ratio for short period.
The cash position ratio of the company is below standard ratio all years
under study, hence it be improved at least to the standard ratio available cash
of company.
The inventory turnover ratio of the company highest sales and lower
inventory for 2010-11 and 2011-12 better level of company. There was last 3
years lower level of inventory turnover, hence should be improved sales and
profit of business for future.
82

The fixed asset turnover higher of the company more efficient utilization in
2010-11 and less utilization of last 4 years. There should be improved of use
of asset of company.
The working capital turnover ratio higher efficiency use of company and
lower level under utilization of company. There was higher use efficient of
company following year in 2011-12 and 2012-13 and last 2 year under
utilization of company, hence should be improved use of working capital
running a business.
The fixed asset ratio less ideal ratio better use of the company for in 2010-11
and last 4 years more than ideal ratio not utilization of company so that
improved fixed asset ratio of company.
The proprietary ratio is soundness of company the ideal ratio below stage
based for greater risk of creditors for all years should be lower and improve
proprietary ratio for future lower risk of company.
The return on total asset higher than better position of company in 2010-11
and lower than loss of business in last 4 years, hence it should be improved
of return on total asset of company.
The net profit is higher level in 2012-13 and following 4 year lower level of
net profit based for profit or losses of business, hence it should be improve
of net profit of company.
The gross profit is higher ratio indicates high profit in 2011 to 2013fo th
company and lower ratio indicates low profit in 2014-15, hence it should be
improving gross profit of future years.
The comparative balance sheet of the company based for higher level of
asset and liabilities in 2013-14 and lower level asset and liabilities in 2014-
15 analysis financial position based for improving performance and maintain
of asset and liabilities of company.
83
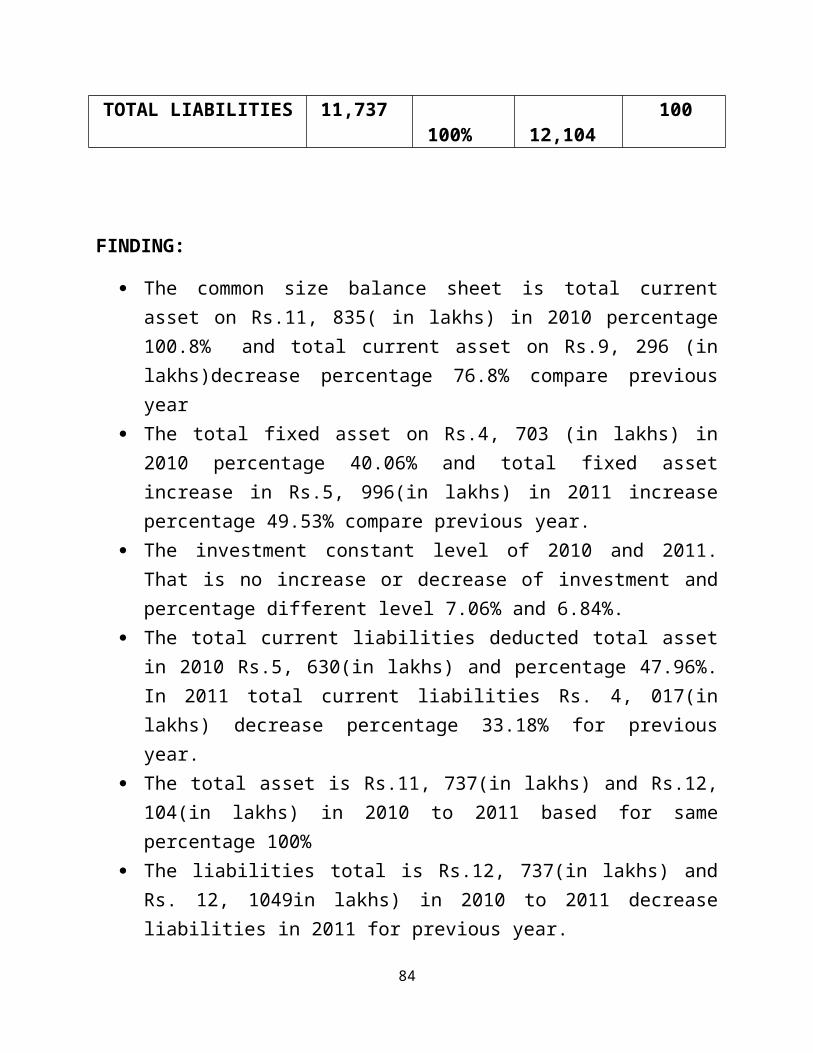
The common size balance sheet is based percentage increase performance
and maintains asset and liabilities of company.
The company may take one of the measures for improving more profits; sale
should be enhanced from into end through innovative marketing techniques.
In a competitive business world, unless & other wise aggressive it is very
difficult to achieve its required sales.
The company may continuously maintain its proper planning and control
techniques in order to regulate and optimize the use of cash balance.
Finally, the company improves performance of sales and production to
market and better position for future.
CONCLUSION
84
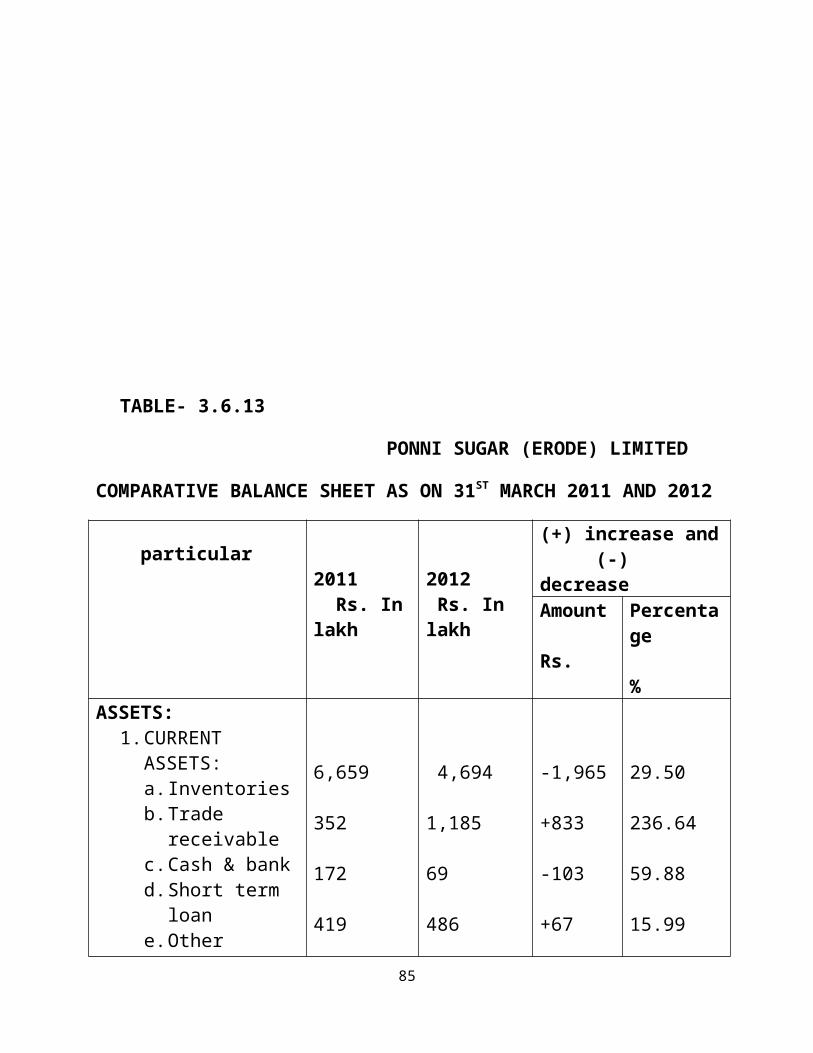
CONCLUSION:
The study is made on the topic financial performance using ratio analysis,
comparative and common size balance sheet with five years data in ponni sugar
(erode) Limited. There is financial performance analysis of the financial position
strength and weakness of the company.
The current and liquid ratio indicates the short term financial position of ponni
sugar (erode) Ltd. whereas fixed asset ratio and proprietary ratios shows the long
term financial position. The inventory, fixed asset and working capital turnover
ratio show the activity of operational efficiency refers to effective, profitable and
rational use of resource available to the financial position of company.
Similarly, profitability ratios are helpful in evaluating the efficiency of
performance in ponni sugar (erode) Ltd.Ponni Sugars consists of high capital and
investment but business performance will be only being in moderate level. If the
firms concentrate more on the financial aspects and reduce the unwanted costs, will
reach the higher profitable position in the near future.
85
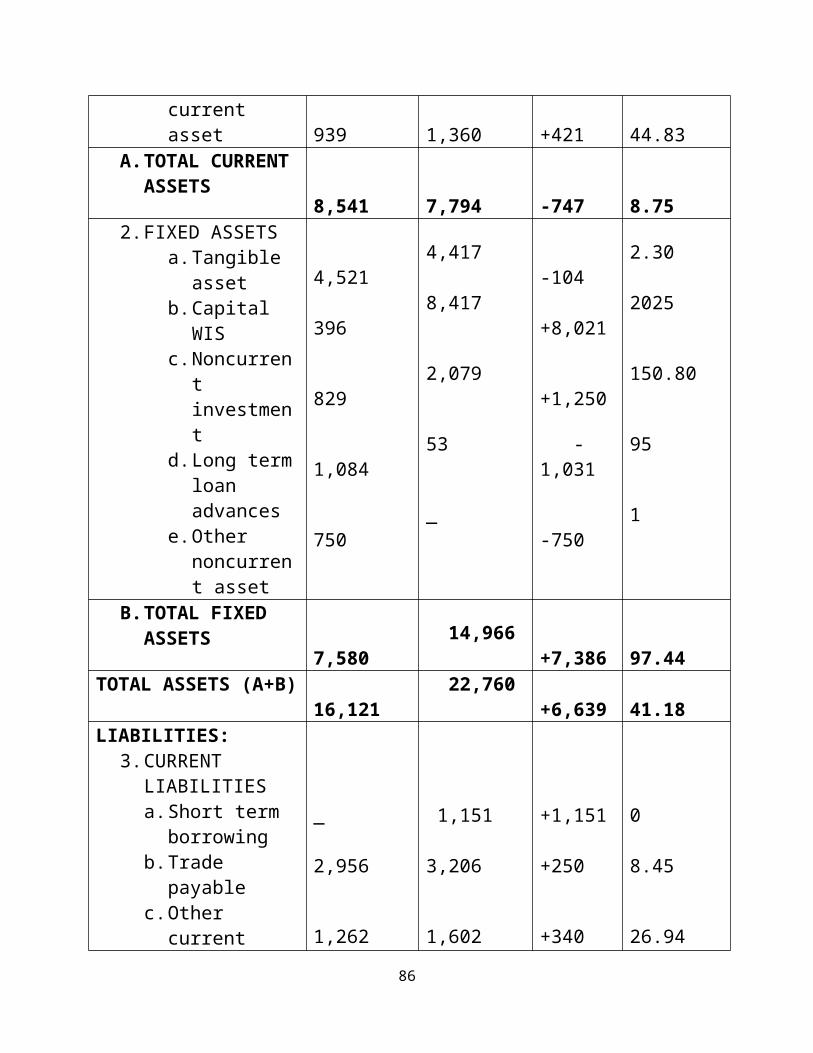
The financial performance of the company for the five years is analyzed and it is
proved that the company is financially sound. There is improving of sales and
production to the market potential of profit for future.
APPENDIX
86

BALANCE SHEET (Rs. In lakhs)
particular Mar’15 Mar’14 Mar’13 Mar’12 Mar’11 Liabilities 12
months 12 months
12 months
12Months
12months
1. Share holder funds
Share capital 860 860 860 860 860Reserve &surplus 11,151 11,516 12,054 10,294 8,765
2. Non-current liabilities
Long term borrowing 4,238 4,926 3,000 3,677 855Deferred tax liabilities 129 307 110 805 834
3. Current liabilities
Short term borrowing 3,438 3,214 5,031 1,151 _Trade payables 3,175 2,541 2,762 3,162 2,956Other current liabilities 749 616 1,526 1,646 1,262Short term provision 1,159 1,210 932 1,165 589
87

Total liabilities 24,899 25,190 26,275 22,760 16,121 Assets
1. Non-current assets
A) Fixed asseta) Tangible
asset 12,773 13,339 13,309 4,417 4,521
b) Capital work in progress
16 67 27 8,417 396
Non-current investment 2,079 2,079 2,079 2,079 829Long term loans and advances 281 262 278 65 1,084Other non-current
asset _ _ _ _ 7502. Current
asset:Inventories 7,250 7,214 7,383 4,694 6,659trade receivable 1,504 1,156 1,689 1,185 352Cash and bank balance 45 79 141 69 172Short-term loans and advances 260 299 675 1,099 419Other current asset 691 695 694 735 939Total assets 24,899 25,190 26,275 22,760 16,121
88

STATEMENT OF PROFIT AND LOSS
(in lakhs)
particular Mar’15 Mar’14 Mar’13 Mar’12 Mar’11Revenue from operationSale of product
16,340 17,372 21,911 27,557 28,095
(-)excise duty 553 591 799 995 1,147Net sale of product 15,787 16,781 21,112 26,562 26,948Other operating revenues
89 97 136 331 _
Other income 191 225 241 109 413Total revenue 16,067 17,103 21,489 27,002 27,361Expenses Cost of material 11,971 11,774 16,987 17,144 19,737Changes of inventory (53) 132 (2,788) 2,079 (2,345)
89

Power & fuel 2,047 2,363 1,870 2,175 1,703Employee benefit expenses
1,327 1,199 1,234 1,100 1,056
Repair & maintenance 666 556 740 680 513Other expenses 467 405 518 552 197 Total revenue 16,425 16,429 18,561 23,730 23,206Profit before finance cost and depreciation (358) 674 2,928 3,272 1,810Finance cost 512 671 358 119 148Depreciation 566 825 1,161 1,911 309Profit/loss before exceptional items
(1,436) (822) 1,409 2,824 1,353
Exceptional items 893 541 (193) 212 (1,411)PBT (543) (281) 1,216 2,612 2,764Tax expenses (178) 197 (695) 833 903PAT (365) (478) 1,911 1,779 2,133EPS 4.24 5.56 22.22 20.64 21.64
90

BIBLOGRAPHY
91

REFERENCE
Books:
The financial and management accounting written by T.S Reddy and Y.Hari prased reddy and published by Margham publications.
The management accounting written by M.Y Khan and P.K Jain and published by Tata Mcgraw hill, 2011.
The financial management, text and problems of cases written by M.Y Khan and P.K Jain and published by Tata Mcgraw Hill, 6th edition, 2011.
The financial management written by prasanna Chandra and published by Tata Mcgraw Hill, 9th edition, 2012.
Journals:
G. Malyadri, and B. Sudheer Kumar, Indian sugar industry, published by International Journal of Management and Strategy, 2013.
92

Kothari C.R., “Research Methodology – Methods & Techniques,Wishawa
Prakashan, New Delhi, 2011.
W. Attwood, cooperative sugar International Journal of Management and
Strategy, 2000.
Websites:
www.ponnisugars.com
www.economictimes.indiatimes.com
93
Related Documents