Financial markets

Financial markets. Selection of interest rates in the US money market per cent Chart 1:1 Source: Reuters EcoWin.
Dec 19, 2015
Welcome message from author
This document is posted to help you gain knowledge. Please leave a comment to let me know what you think about it! Share it to your friends and learn new things together.
Transcript
Financial markets
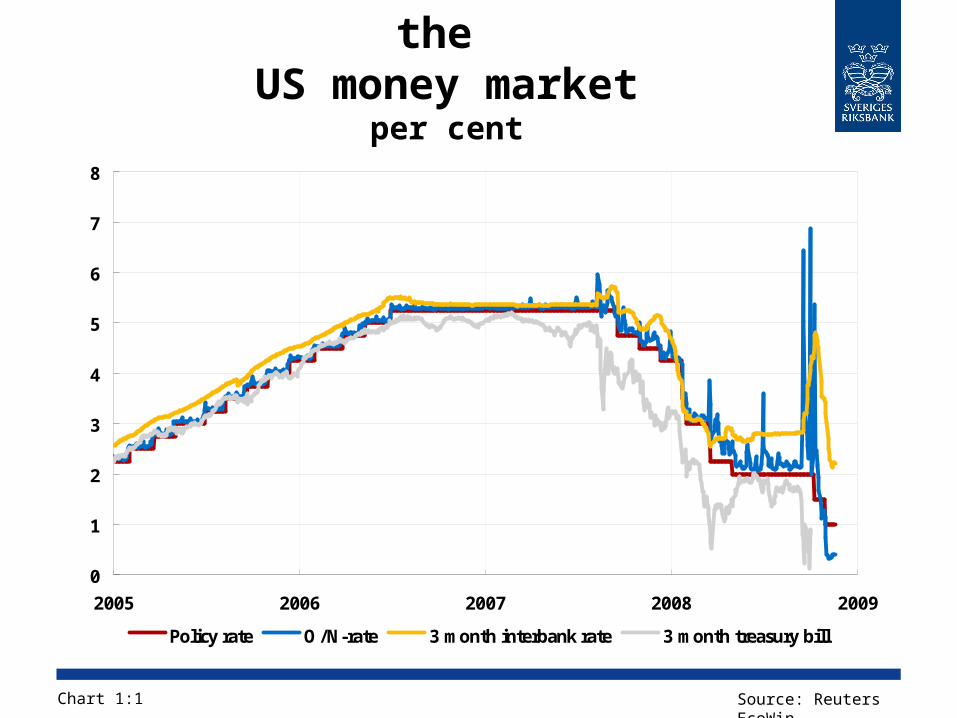
Selection of interest rates in the
US money marketper cent
Chart 1:1 Source: Reuters EcoWin
0
1
2
3
4
5
6
7
8
2005 2006 2007 2008 2009
Policy rate O/N-rate 3 month interbank rate 3 month treasury bill
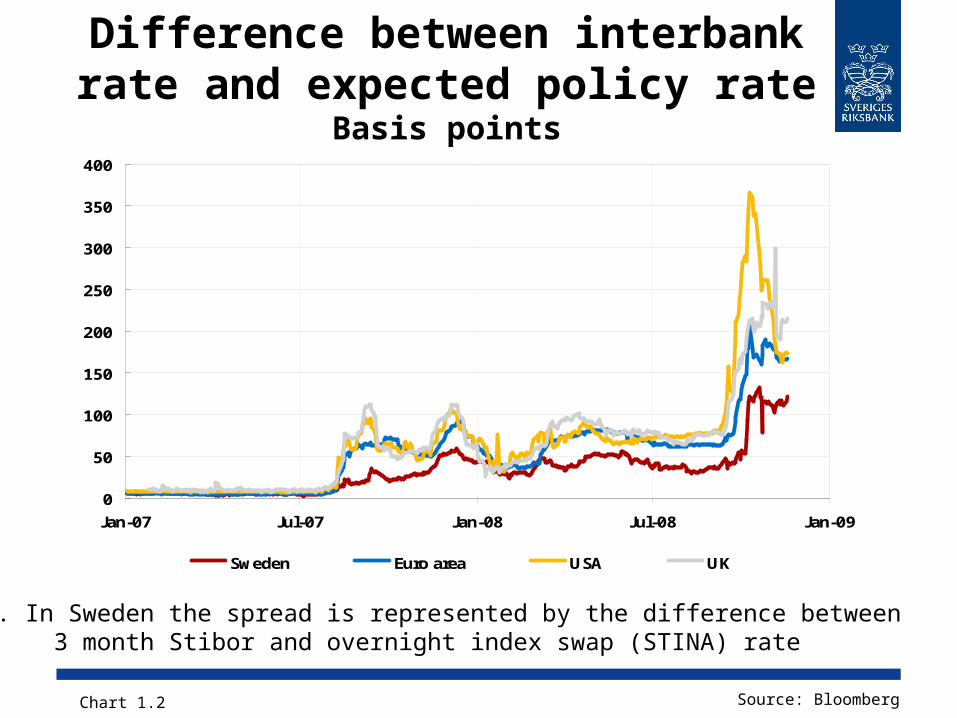
Difference between interbank rate and expected policy rate
Basis points
Note. In Sweden the spread is represented by the difference between 3 month Stibor and overnight index swap (STINA) rate
Chart 1.2 Source: Bloomberg
0
50
100
150
200
250
300
350
400
Jan-07 Jul-07 Jan-08 Jul-08 Jan-09
Sweden Euro area USA UK
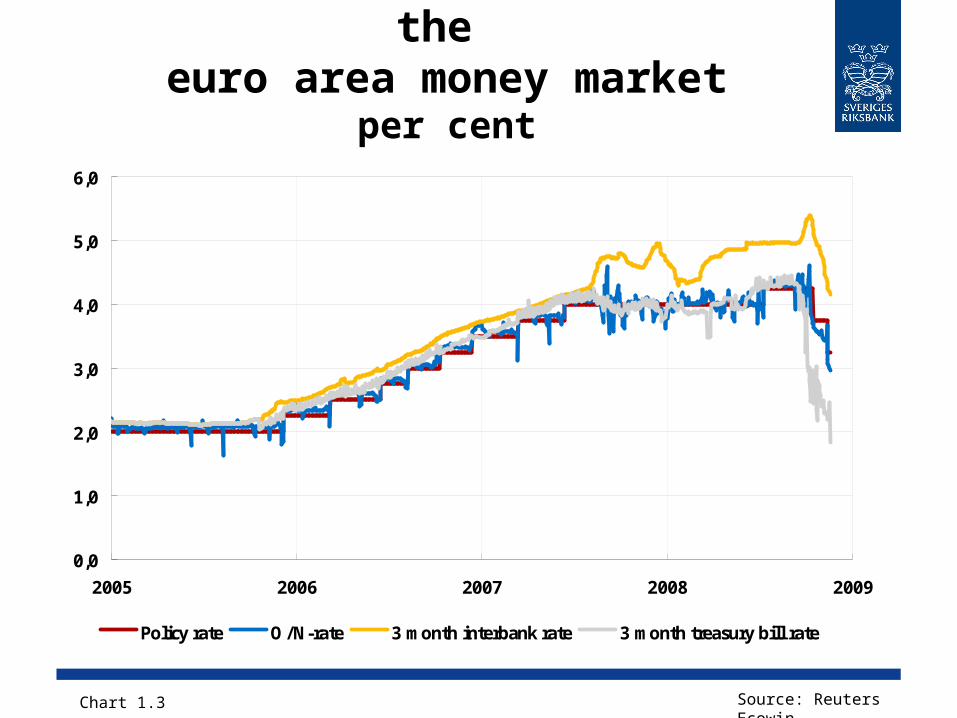
Selection of interest rates in the
euro area money marketper cent
Chart 1.3 Source: Reuters Ecowin
0,0
1,0
2,0
3,0
4,0
5,0
6,0
2005 2006 2007 2008 2009
Policy rate O/N-rate 3 month interbank rate 3 month treasury bill rate
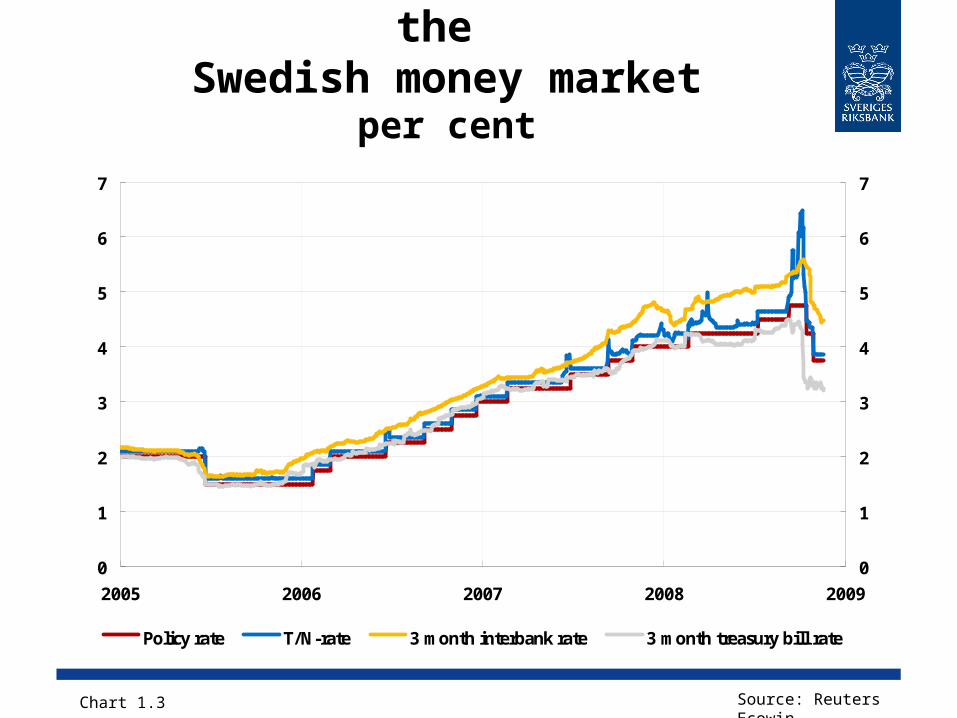
Selection of interest rates in the
Swedish money marketper cent
Chart 1.3 Source: Reuters Ecowin
0
1
2
3
4
5
6
7
2005 2006 2007 2008 2009
0
1
2
3
4
5
6
7
Policy rate T/N-rate 3 month interbank rate 3 month treasury bill rate
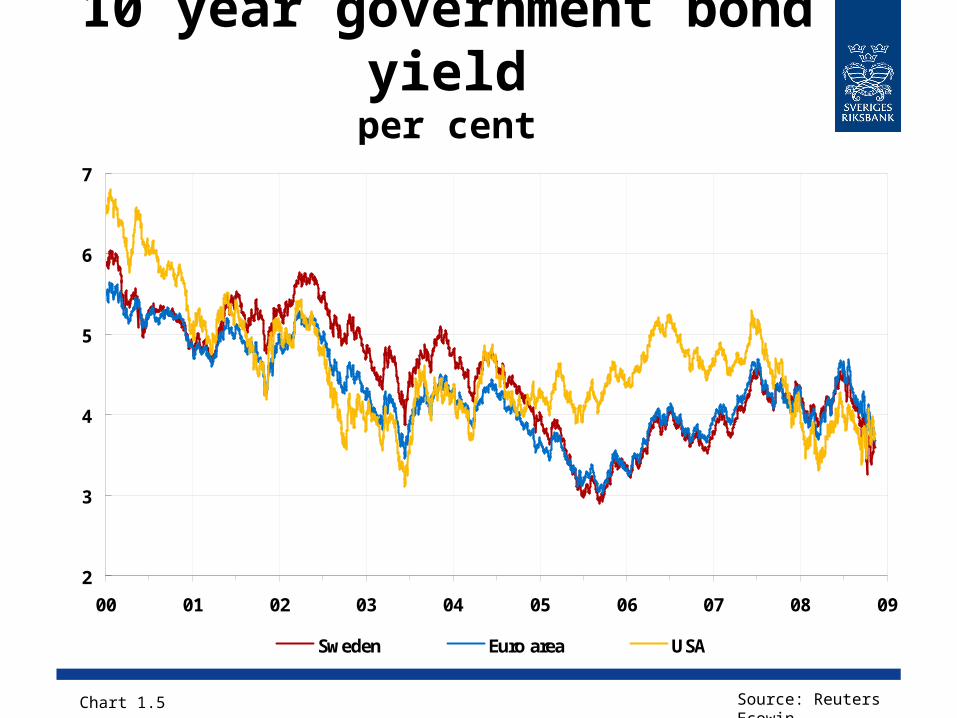
10 year government bond yield
per cent
Chart 1.5 Source: Reuters Ecowin
2
3
4
5
6
7
00 01 02 03 04 05 06 07 08 09
Sweden Euro area USA
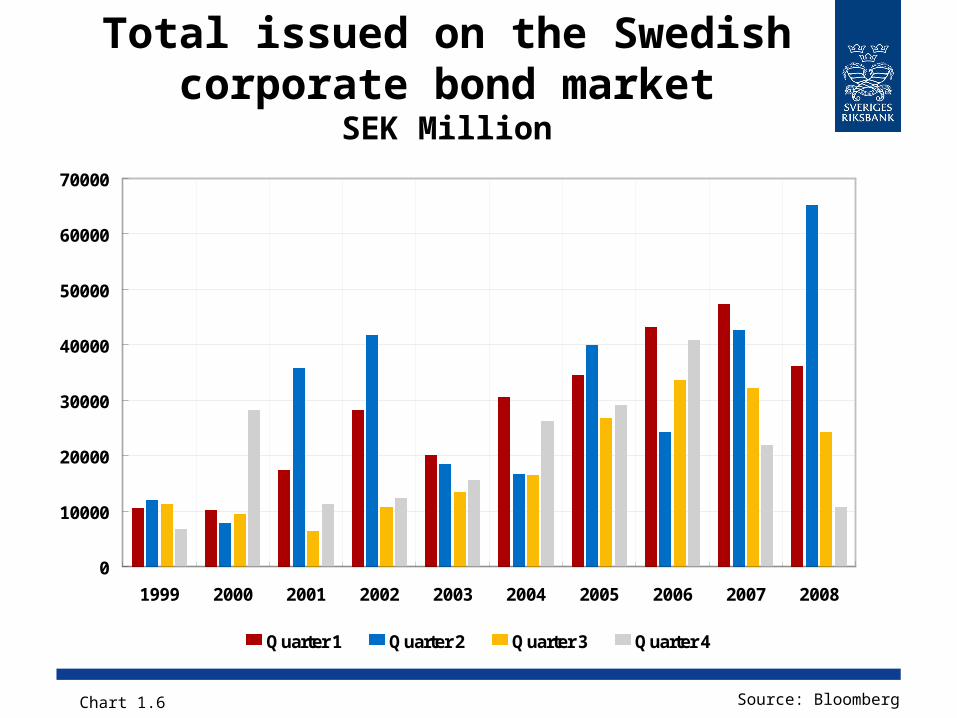
Total issued on the Swedish corporate bond market
SEK Million
Chart 1.6 Source: Bloomberg
0
10000
20000
30000
40000
50000
60000
70000
1999 2000 2001 2002 2003 2004 2005 2006 2007 2008
Quarter 1 Quarter 2 Quarter 3 Quarter 4
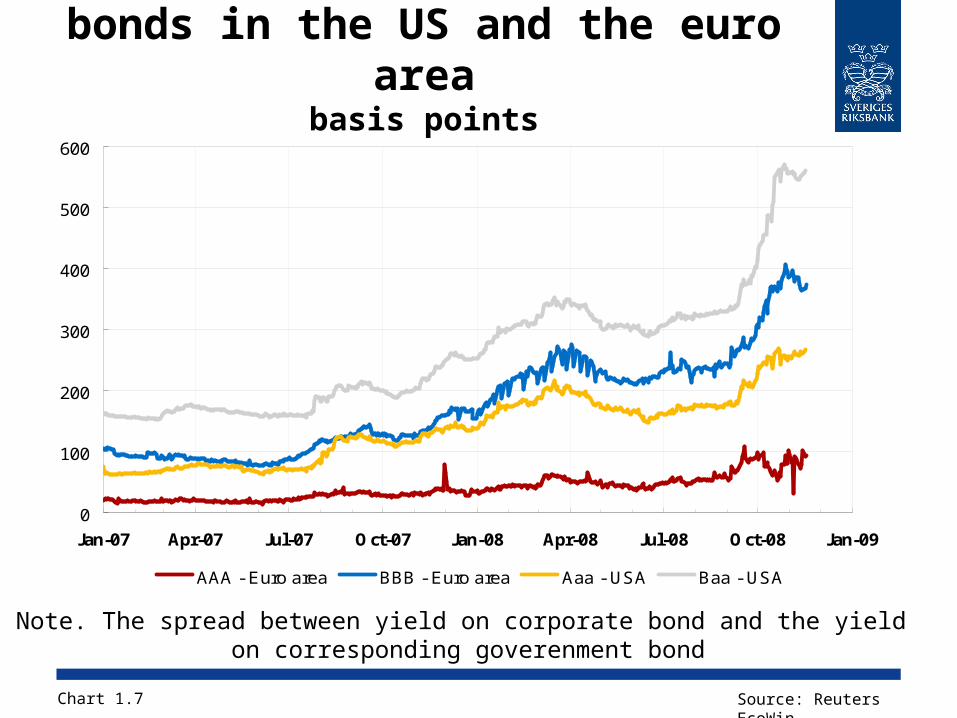
Credit spreads for corporate bonds in the US and the euro
areabasis points
Chart 1.7 Source: Reuters EcoWin
0
100
200
300
400
500
600
Jan-07 Apr-07 Jul-07 Oct-07 Jan-08 Apr-08 Jul-08 Oct-08 Jan-09
AAA - Euro area BBB - Euro area Aaa - USA Baa - USA
Note. The spread between yield on corporate bond and the yield on corresponding goverenment bond
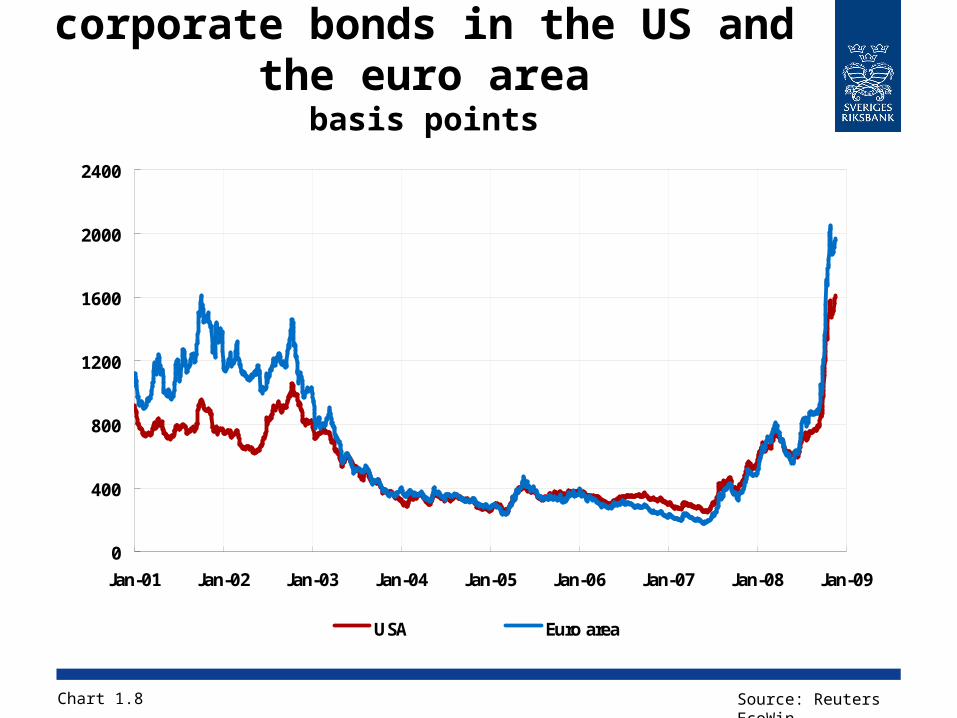
Credit spread for high-yield corporate bonds in the US and
the euro areabasis points
Chart 1.8 Source: Reuters EcoWin
0
400
800
1200
1600
2000
2400
Jan-01 Jan-02 Jan-03 Jan-04 Jan-05 Jan-06 Jan-07 Jan-08 Jan-09
USA Euro area
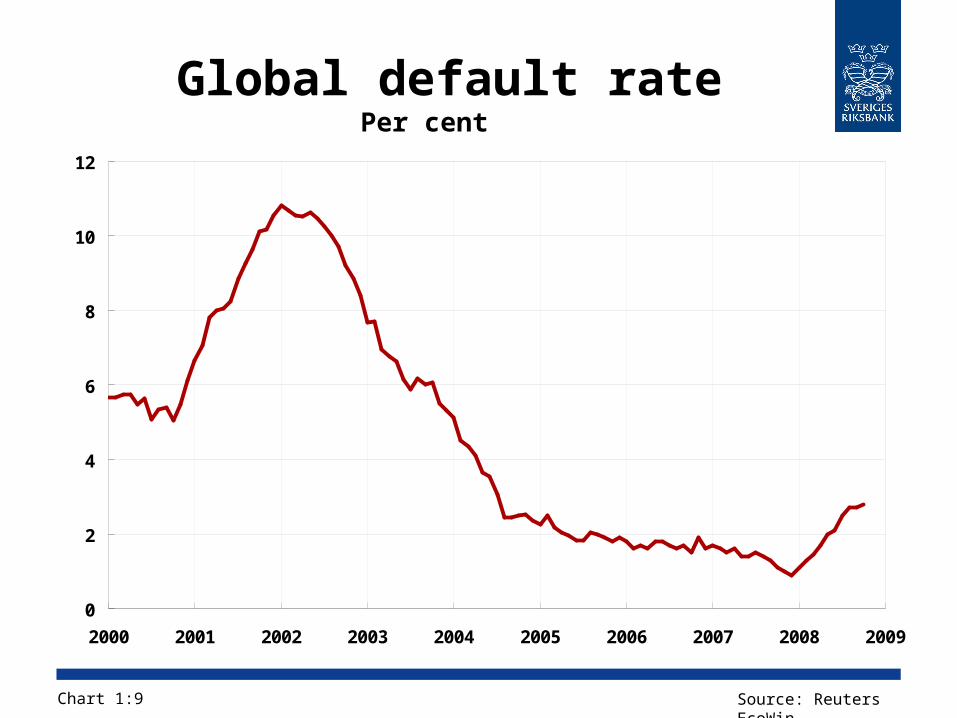
Global default ratePer cent
Chart 1:9 Source: Reuters EcoWin
0
2
4
6
8
10
12
2000 2001 2002 2003 2004 2005 2006 2007 2008 2009
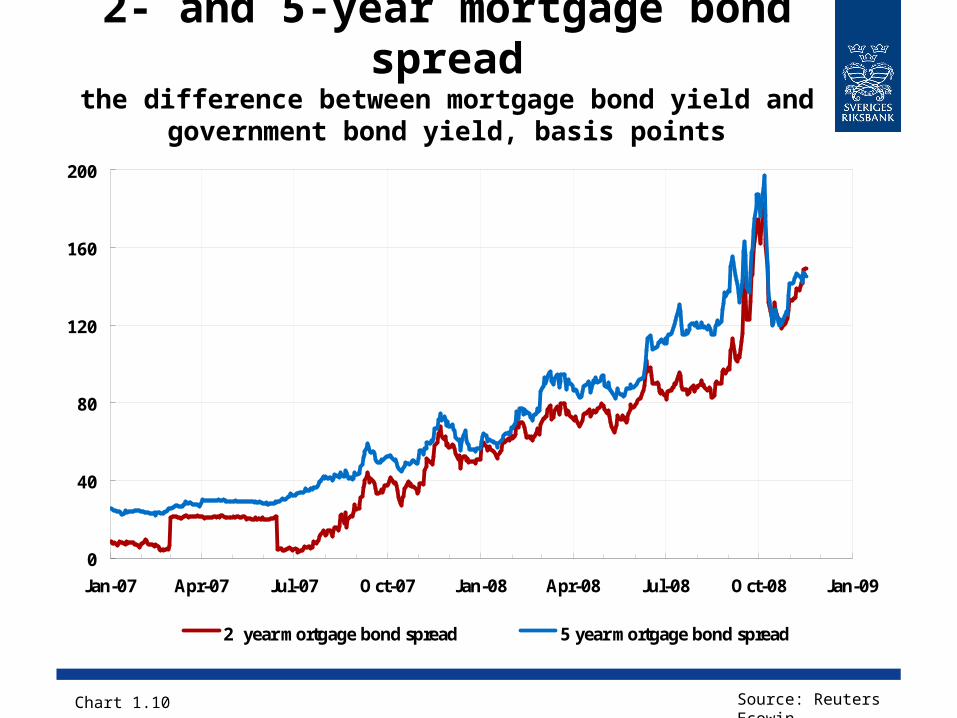
2- and 5-year mortgage bond spread
the difference between mortgage bond yield and government bond yield, basis points
Chart 1.10 Source: Reuters Ecowin
0
40
80
120
160
200
Jan-07 Apr-07 Jul-07 Oct-07 Jan-08 Apr-08 Jul-08 Oct-08 Jan-09
2 year mortgage bond spread 5 year mortgage bond spread
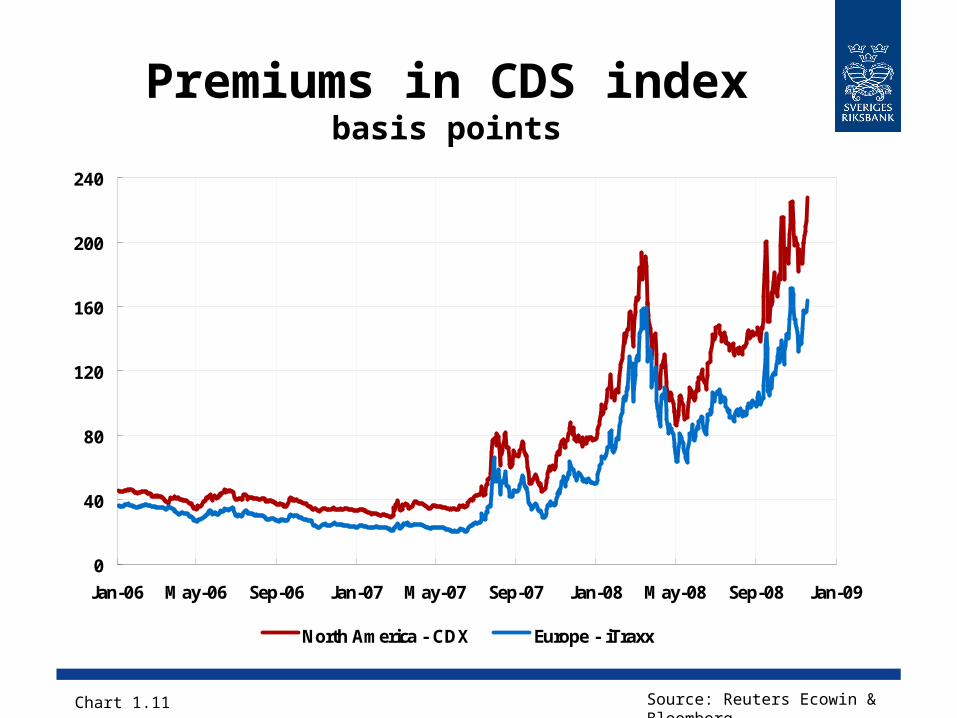
Premiums in CDS indexbasis points
Chart 1.11 Source: Reuters Ecowin & Bloomberg
0
40
80
120
160
200
240
Jan-06 May-06 Sep-06 Jan-07 May-07 Sep-07 Jan-08 May-08 Sep-08 Jan-09
North America - CDX Europe - iTraxx
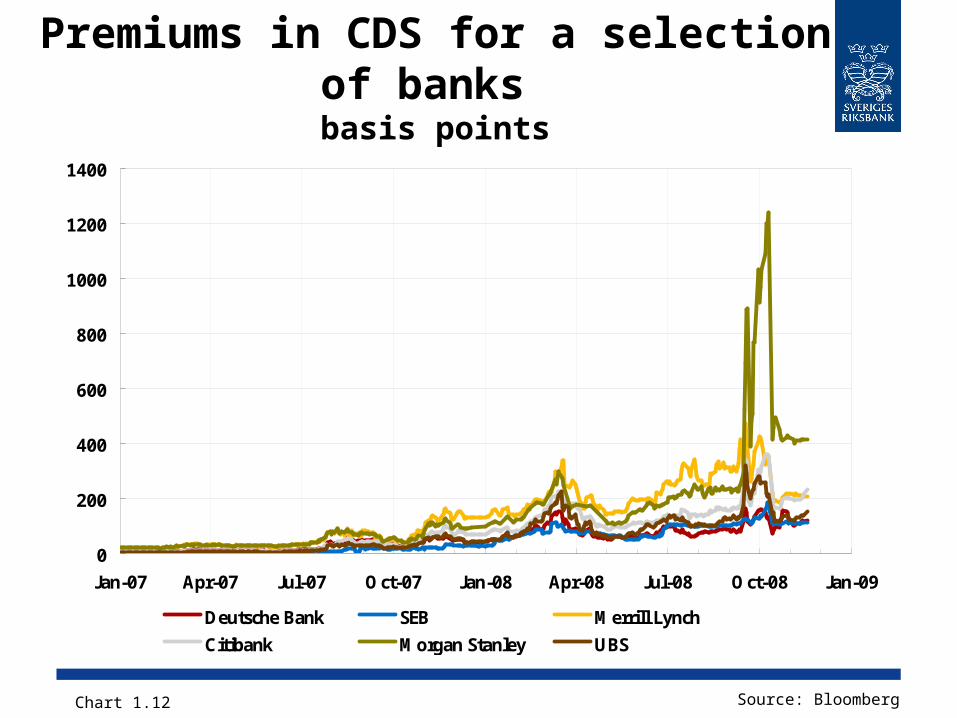
Premiums in CDS for a selection of banks basis points
Chart 1.12 Source: Bloomberg
0
200
400
600
800
1000
1200
1400
Jan-07 Apr-07 Jul-07 Oct-07 Jan-08 Apr-08 Jul-08 Oct-08 Jan-09
Deutsche Bank SEB Merrill Lynch
Citibank Morgan Stanley UBS
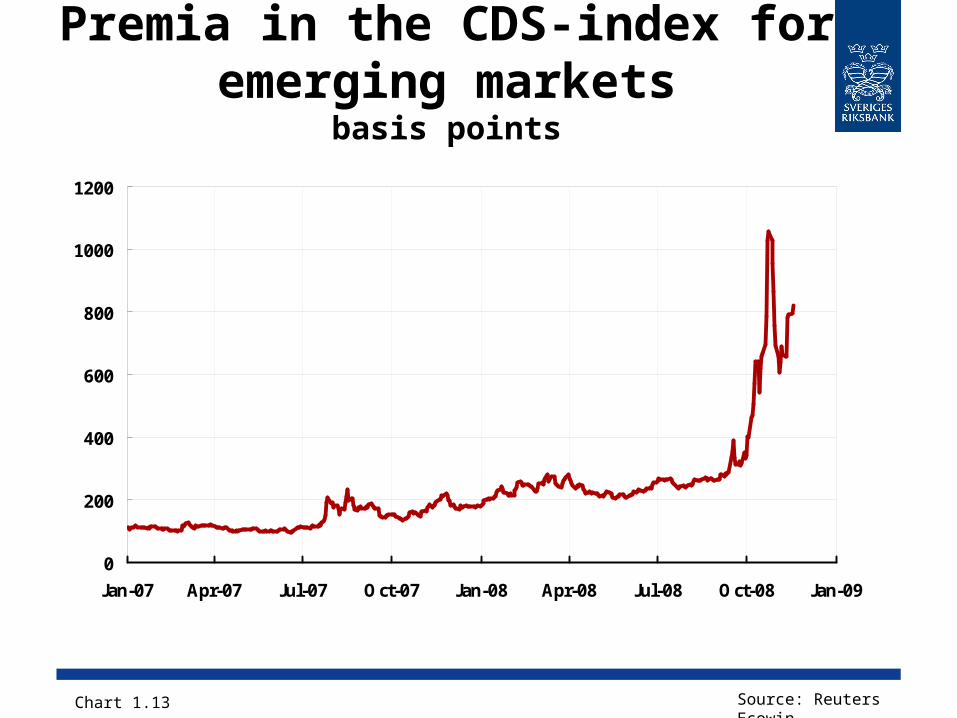
Premia in the CDS-index for emerging markets
basis points
Chart 1.13 Source: Reuters Ecowin
0
200
400
600
800
1000
1200
Jan-07 Apr-07 Jul-07 Oct-07 Jan-08 Apr-08 Jul-08 Oct-08 Jan-09
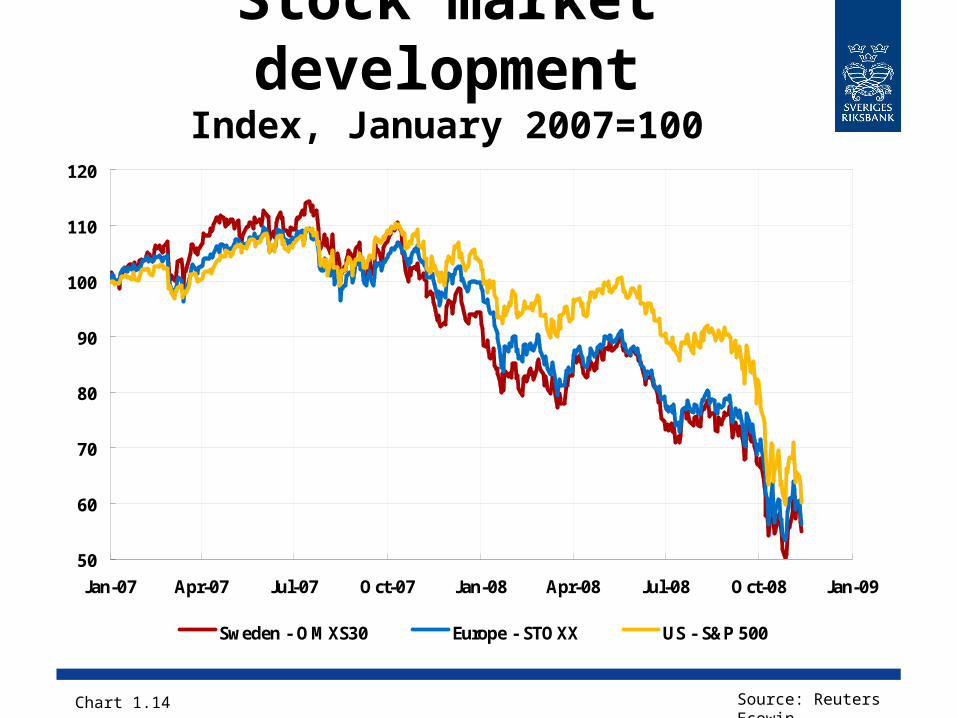
Stock market development
Index, January 2007=100
Chart 1.14 Source: Reuters Ecowin
50
60
70
80
90
100
110
120
Jan-07 Apr-07 Jul-07 Oct-07 Jan-08 Apr-08 Jul-08 Oct-08 Jan-09
Sweden - OMXS30 Europe - STOXX US - S&P 500
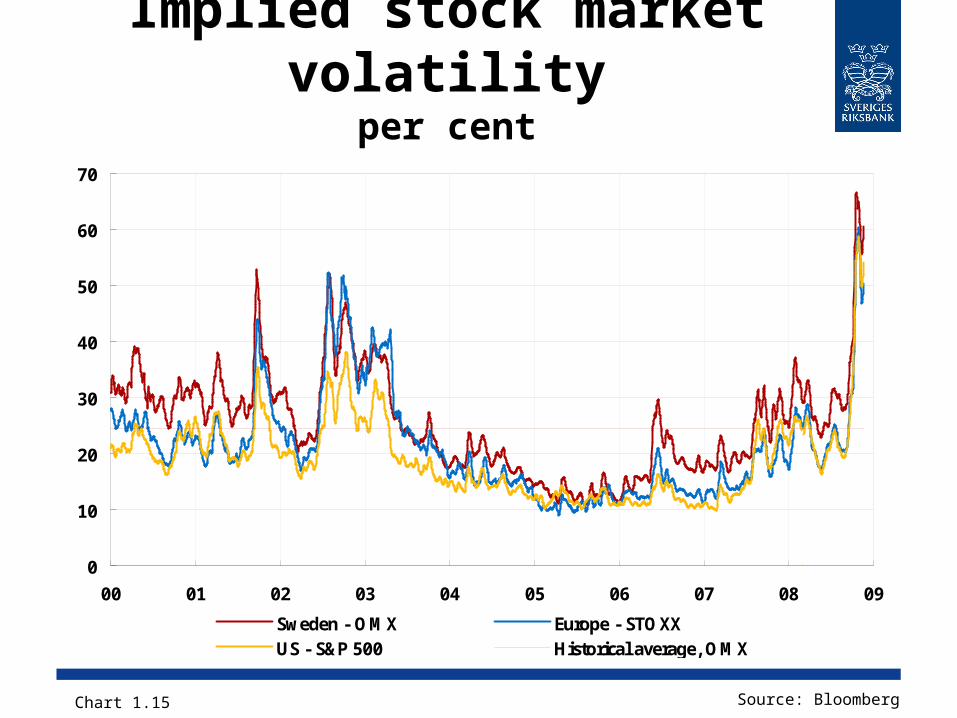
Implied stock market volatility
per cent
Chart 1.15 Source: Bloomberg
0
10
20
30
40
50
60
70
00 01 02 03 04 05 06 07 08 09
Sweden - OMX Europe - STOXXUS - S&P 500 Historical average, OMX
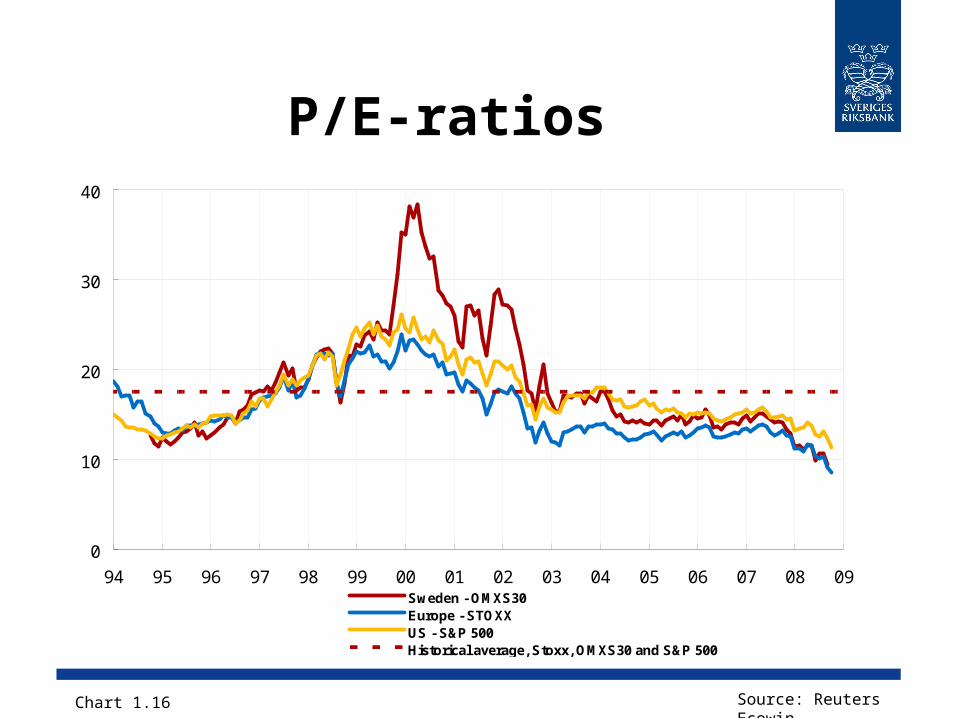
P/E-ratios
Chart 1.16 Source: Reuters Ecowin
0
10
20
30
40
94 95 96 97 98 99 00 01 02 03 04 05 06 07 08 09Sweden - OMXS30Europe - STOXXUS - S&P 500Historical average, Stoxx, OMXS30 and S&P 500
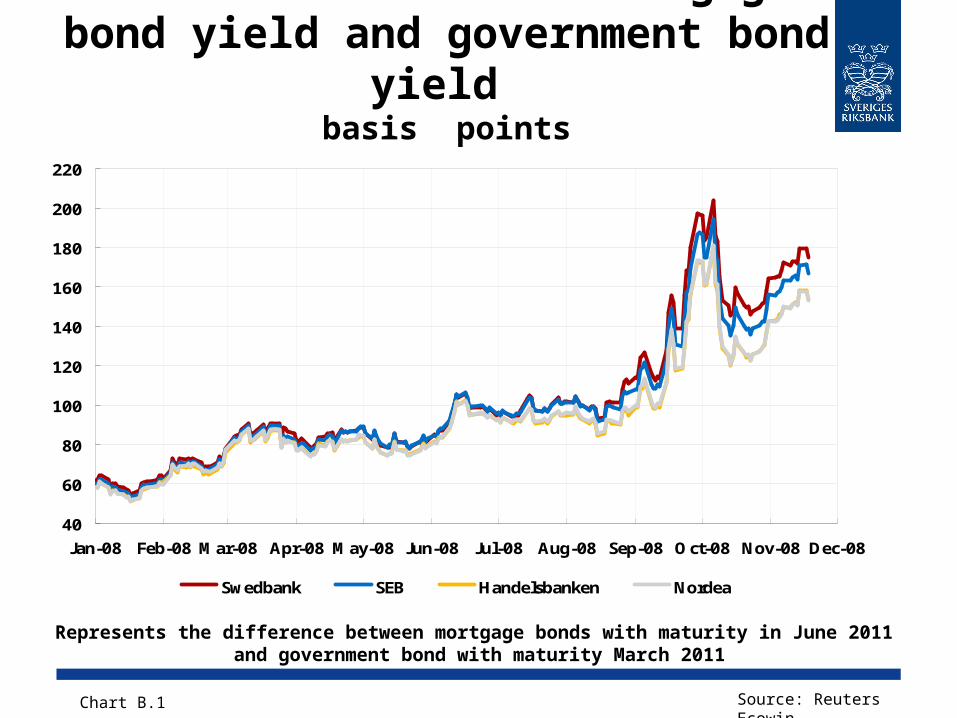
Difference between mortgage bond yield and government
bond yield basis points
Chart B.1 Source: Reuters Ecowin
Represents the difference between mortgage bonds with maturity in June 2011 and government bond with maturity March 2011
40
60
80
100
120
140
160
180
200
220
Jan-08 Feb-08 Mar-08 Apr-08 May-08 Jun-08 Jul-08 Aug-08 Sep-08 Oct-08 Nov-08 Dec-08
Swedbank SEB Handelsbanken Nordea
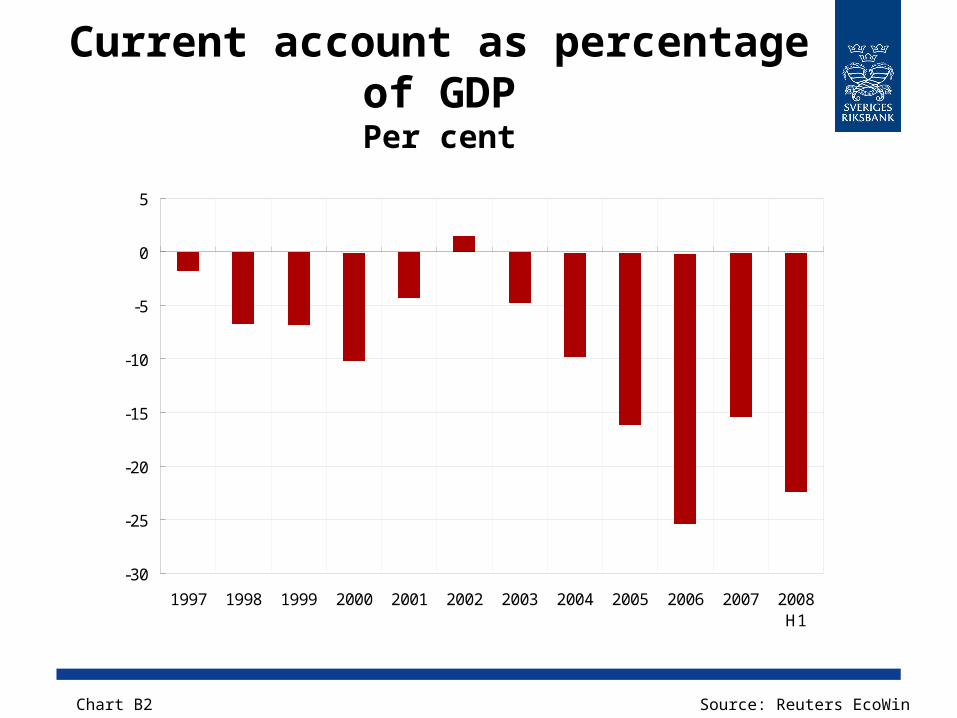
Current account as percentage of GDPPer cent
-30
-25
-20
-15
-10
-5
0
5
1997 1998 1999 2000 2001 2002 2003 2004 2005 2006 2007 2008H1
Chart B2 Source: Reuters EcoWin
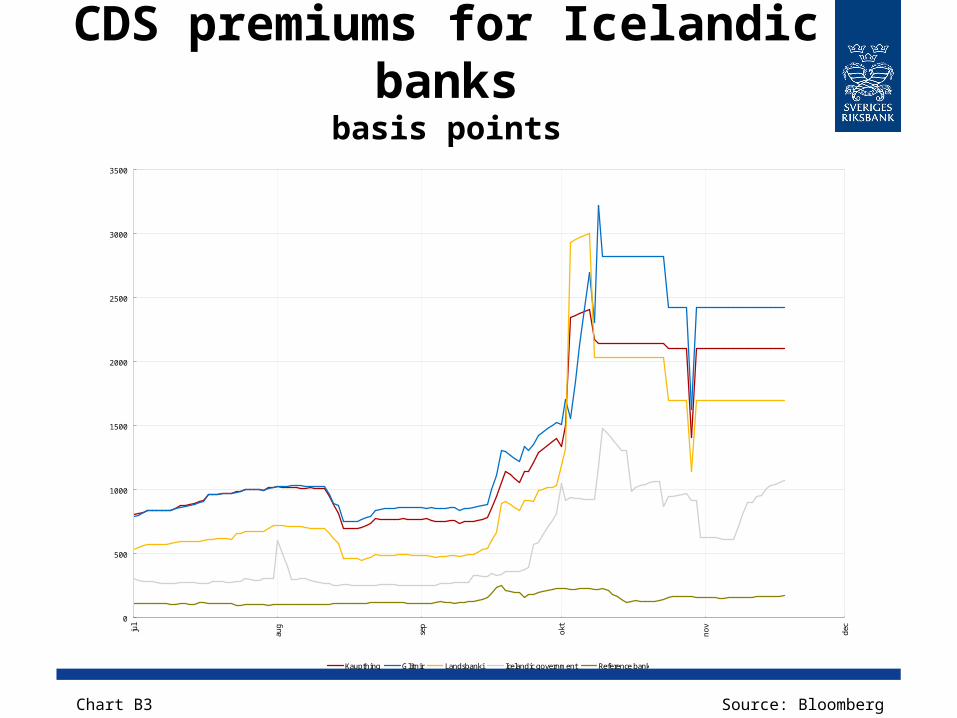
CDS premiums for Icelandic banks
basis points
0
500
1000
1500
2000
2500
3000
3500
jul
aug
sep
okt
nov
dec
Kaupthing Glitnir Landsbanki Icelandic government Reference bank
2008
Chart B3 Source: Bloomberg
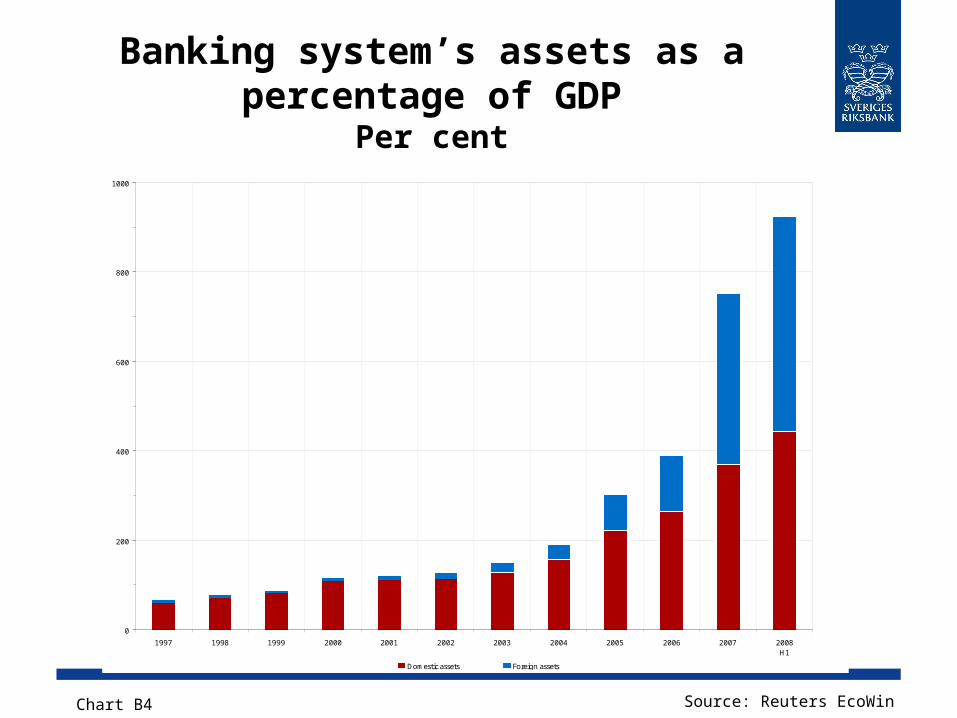
Banking system’s assets as a percentage of GDP
Per cent
0
200
400
600
800
1000
1997 1998 1999 2000 2001 2002 2003 2004 2005 2006 2007 2008H1
Domestic assets Foreign assets
Chart B4 Source: Reuters EcoWin
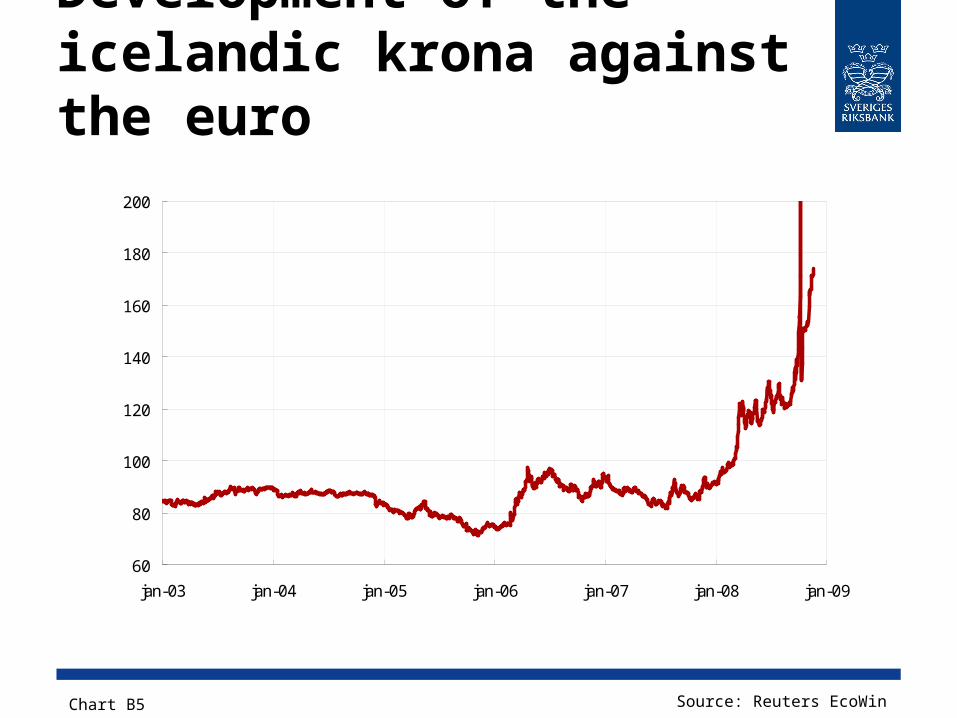
Development of the icelandic krona against the euro
60
80
100
120
140
160
180
200
jan-03 jan-04 jan-05 jan-06 jan-07 jan-08 jan-09
Chart B5 Source: Reuters EcoWin
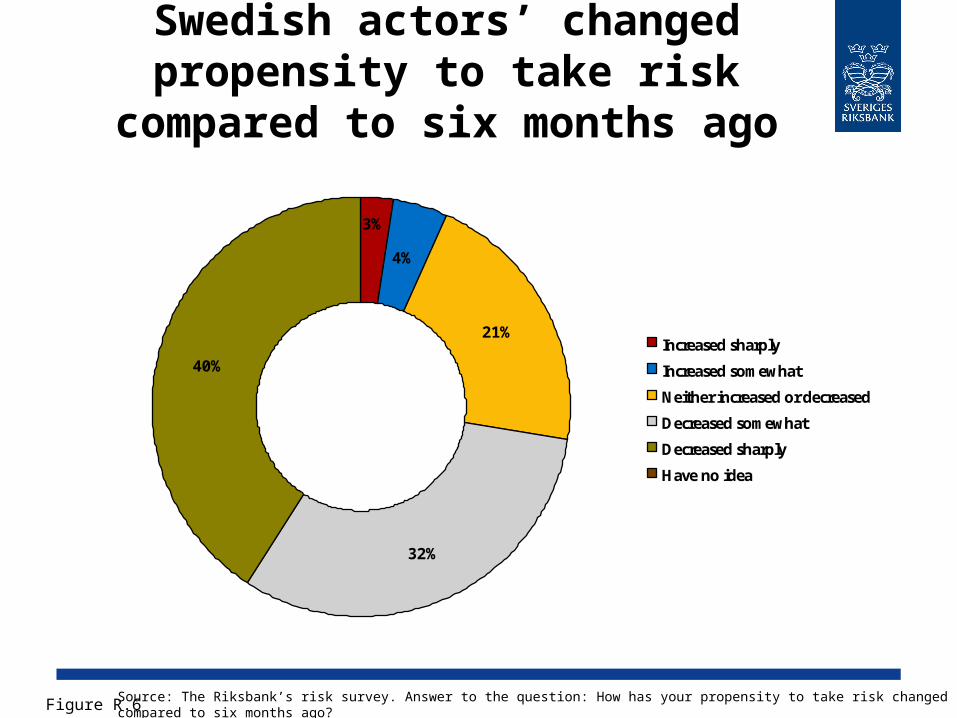
Swedish actors’ changed propensity to take risk
compared to six months ago
4%
21%
32%
40%
3%
Increased sharply
Increased somewhat
Neither increased or decreased
Decreased somewhat
Decreased sharply
Have no idea
Figure R.6 Source: The Riksbank’s risk survey. Answer to the question: How has your propensity to take risk changed compared to six months ago?
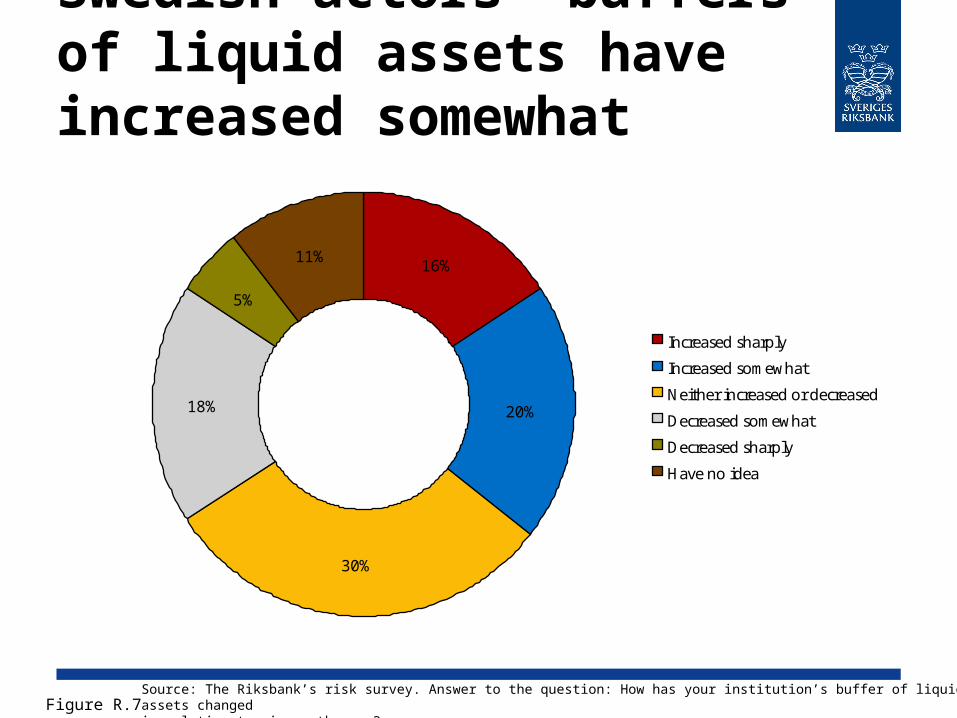
Swedish actors’ buffers of liquid assets have increased somewhat
16%
20%
30%
18%
5%
11%
Increased sharply
Increased somewhat
Neither increased or decreased
Decreased somewhat
Decreased sharply
Have no idea
Figure R.7Source: The Riksbank’s risk survey. Answer to the question: How has your institution’s buffer of liquid assets changedin relation to six months ago?
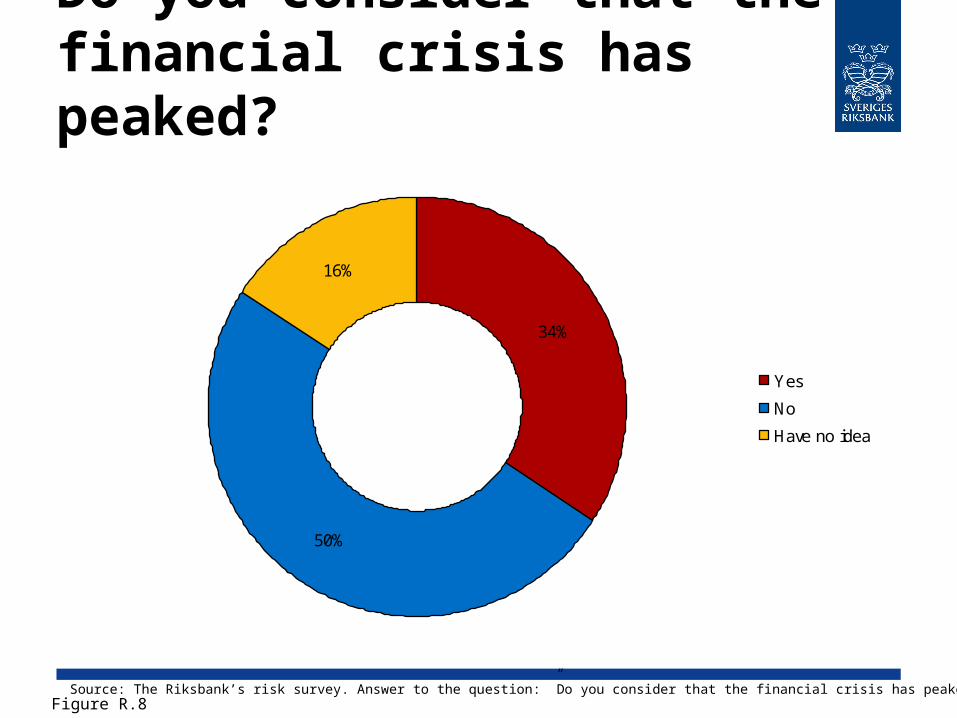
Do you consider that the financial crisis has peaked?
34%
50%
16%
Yes
No
Have no idea
Figure R.8Source: The Riksbank’s risk survey. Answer to the question: ”Do you consider that the financial crisis has peaked?
The Swedish Household Sector and
House Prices
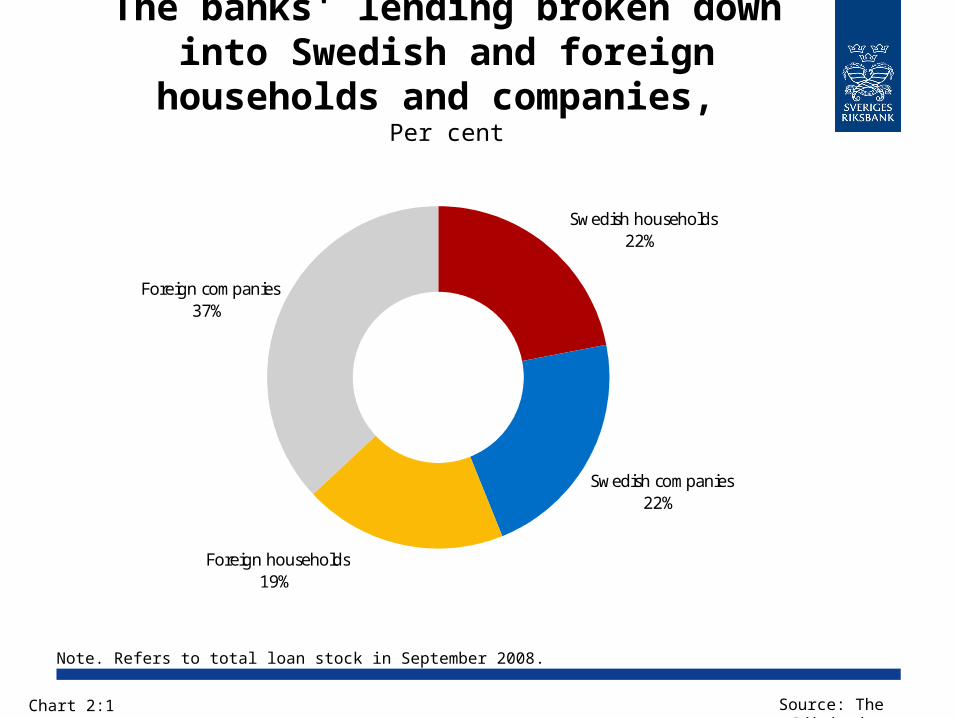
The banks' lending broken down into Swedish and foreign households and
companies, Per cent
Note. Refers to total loan stock in September 2008.
Source: The RiksbankChart 2:1
Swedish households 22%
Swedish companies 22%
Foreign households 19%
Foreign companies 37%
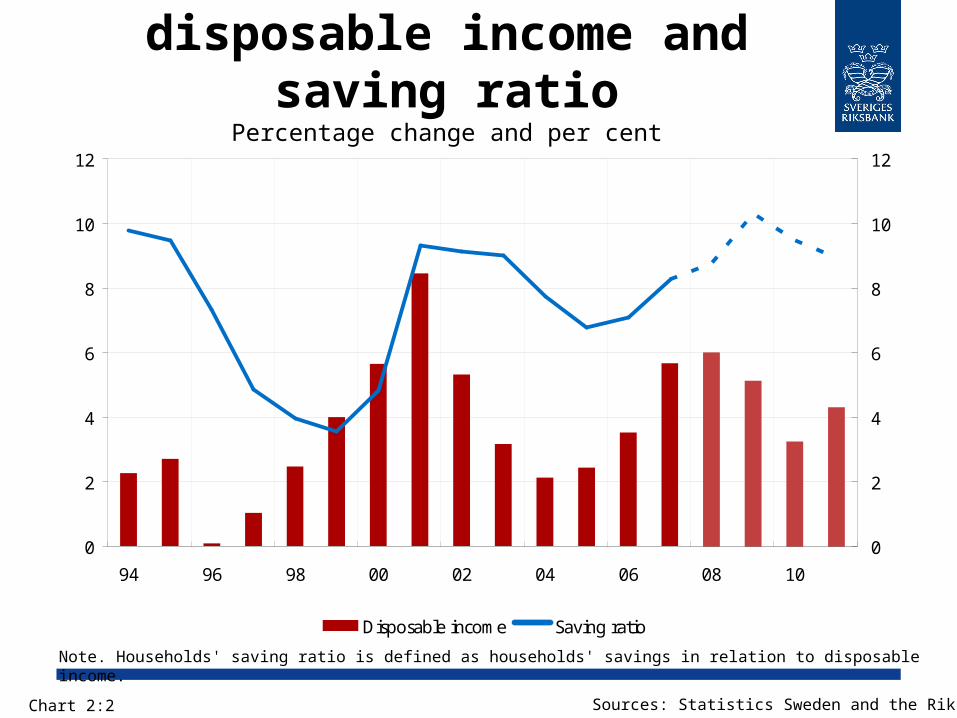
Households' nominal disposable income and
saving ratioPercentage change and per cent
Note. Households' saving ratio is defined as households' savings in relation to disposable income.
Sources: Statistics Sweden and the RiksbankChart 2:2
0
2
4
6
8
10
12
94 96 98 00 02 04 06 08 10
0
2
4
6
8
10
12
Disposable income Saving ratio
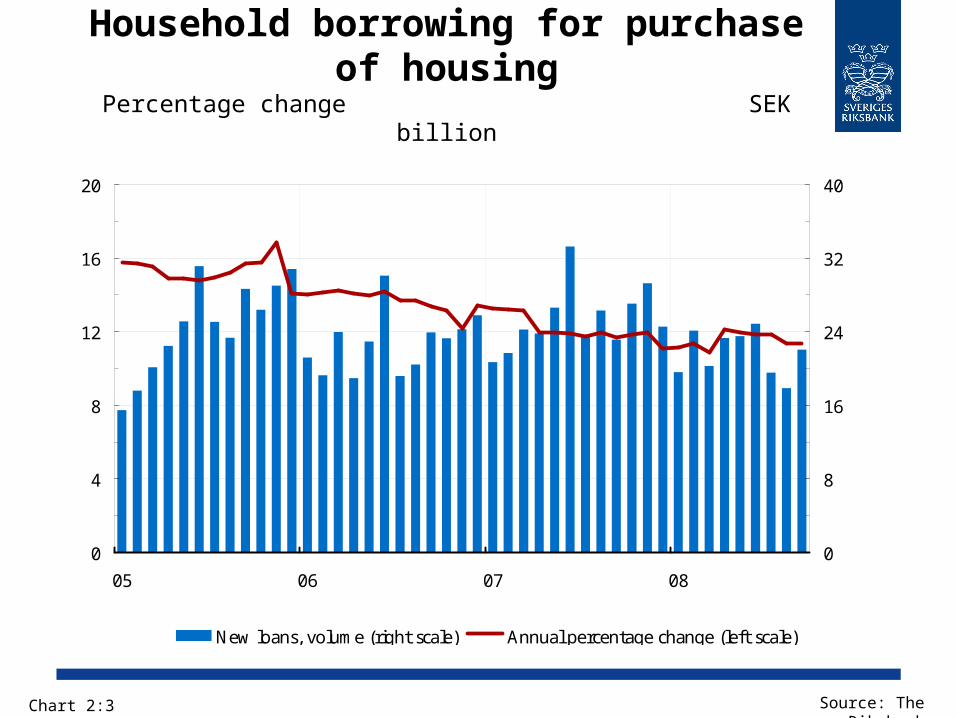
Household borrowing for purchase of housing
Percentage change SEK billion
Source: The RiksbankChart 2:3
0
4
8
12
16
20
05 06 07 08
0
8
16
24
32
40
New loans, volume (right scale) Annual percentage change (left scale)
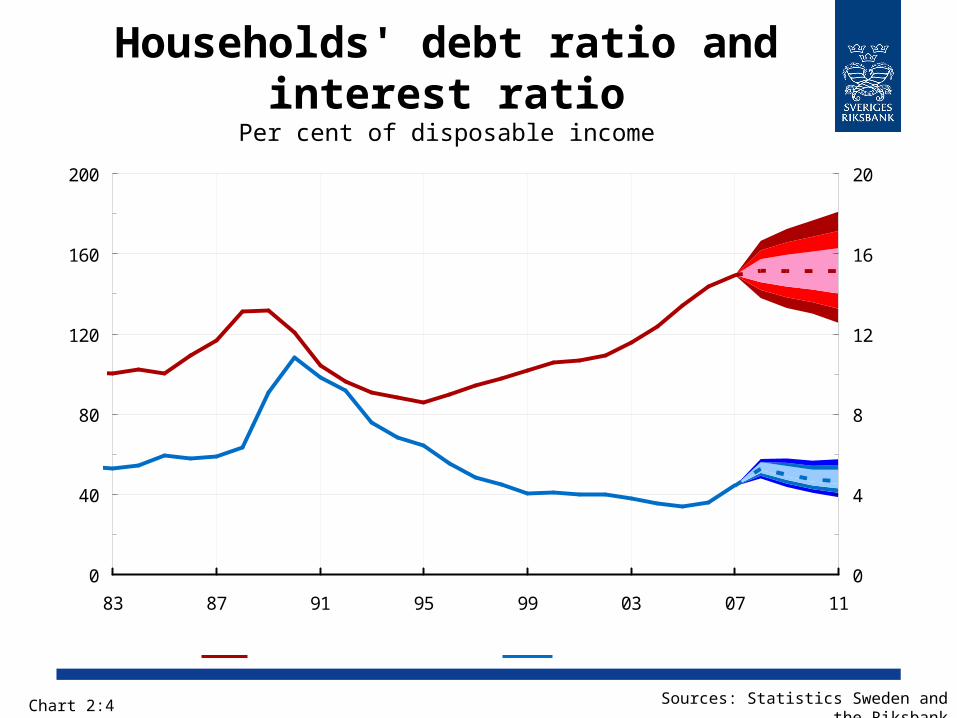
Households' debt ratio and interest ratio
Per cent of disposable income
Sources: Statistics Sweden and the Riksbank
Chart 2:4
0
40
80
120
160
200
83 87 91 95 99 03 07 11
0
4
8
12
16
20
Debt ratio (left scale) Interest ratio (right scale)
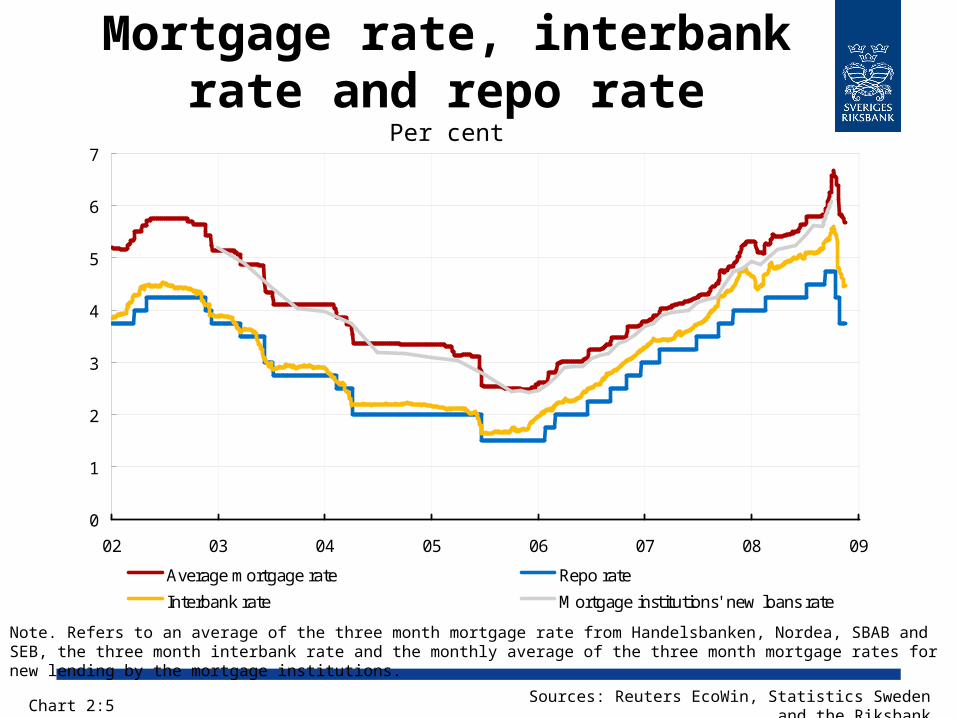
Mortgage rate, interbank rate and repo rate
Per cent
Note. Refers to an average of the three month mortgage rate from Handelsbanken, Nordea, SBAB and SEB, the three month interbank rate and the monthly average of the three month mortgage rates for new lending by the mortgage institutions.
Chart 2:5 Sources: Reuters EcoWin, Statistics Sweden and the Riksbank
0
1
2
3
4
5
6
7
02 03 04 05 06 07 08 09
Average mortgage rate Repo rate
Interbank rate Mortgage institutions' new loans rate
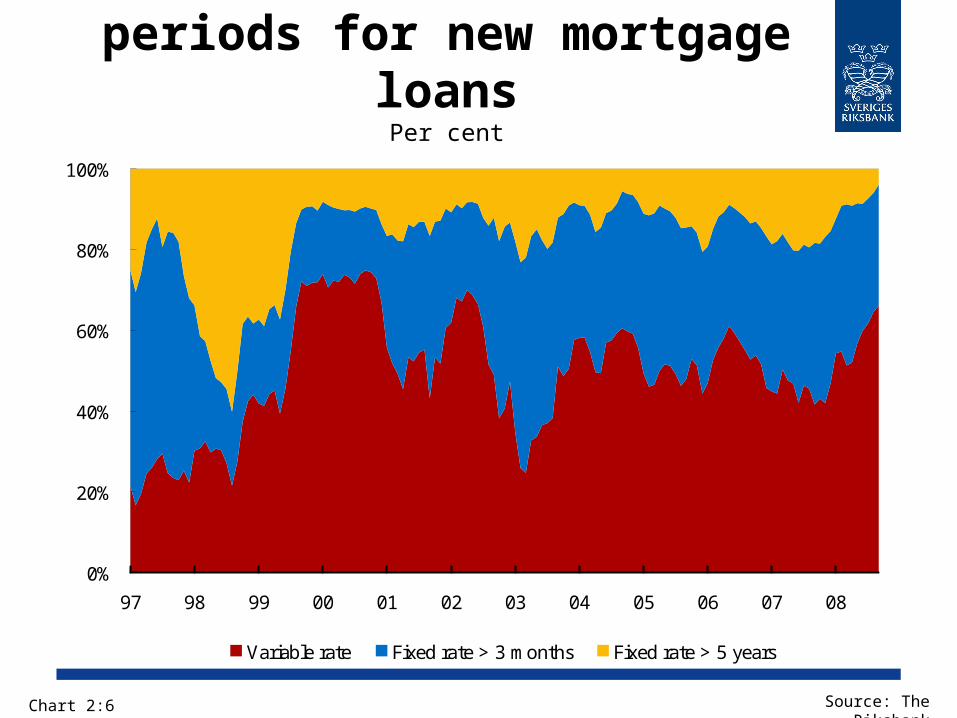
Duration of fixed interest periods for new mortgage
loansPer cent
Source: The Riksbank
Chart 2:6
0%
20%
40%
60%
80%
100%
97 98 99 00 01 02 03 04 05 06 07 08
Variable rate Fixed rate > 3 months Fixed rate > 5 years
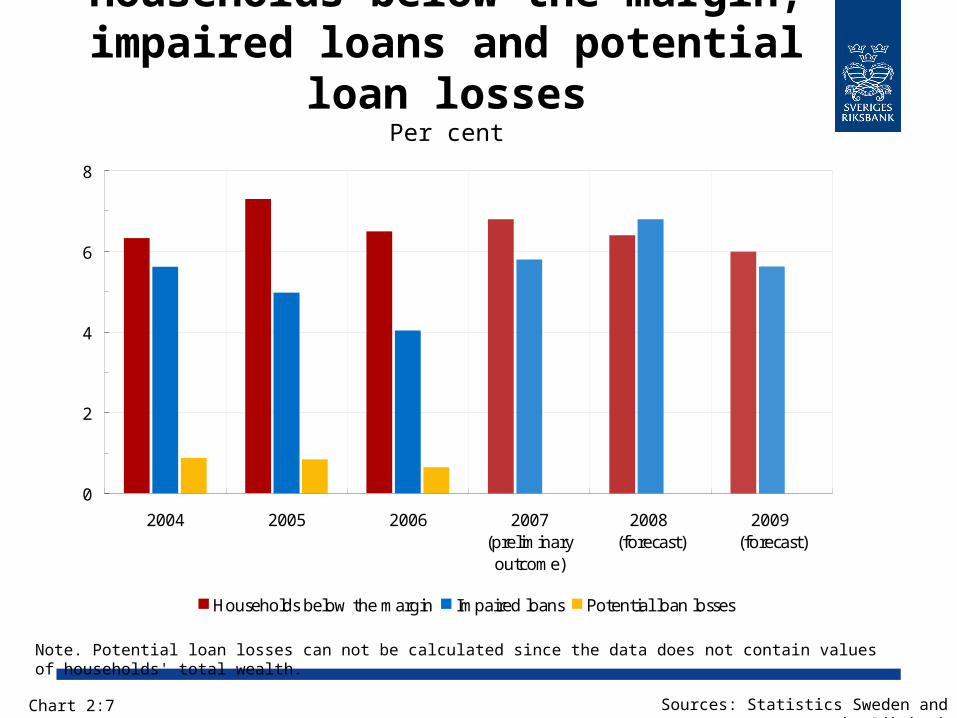
Households below the margin, impaired loans and potential
loan lossesPer cent
Note. Potential loan losses can not be calculated since the data does not contain values of households' total wealth.
Chart 2:7 Sources: Statistics Sweden and the Riksbank
0
2
4
6
8
2004 2005 2006 2007(preliminaryoutcome)
2008 (forecast)
2009 (forecast)
Households below the margin Impaired loans Potential loan losses
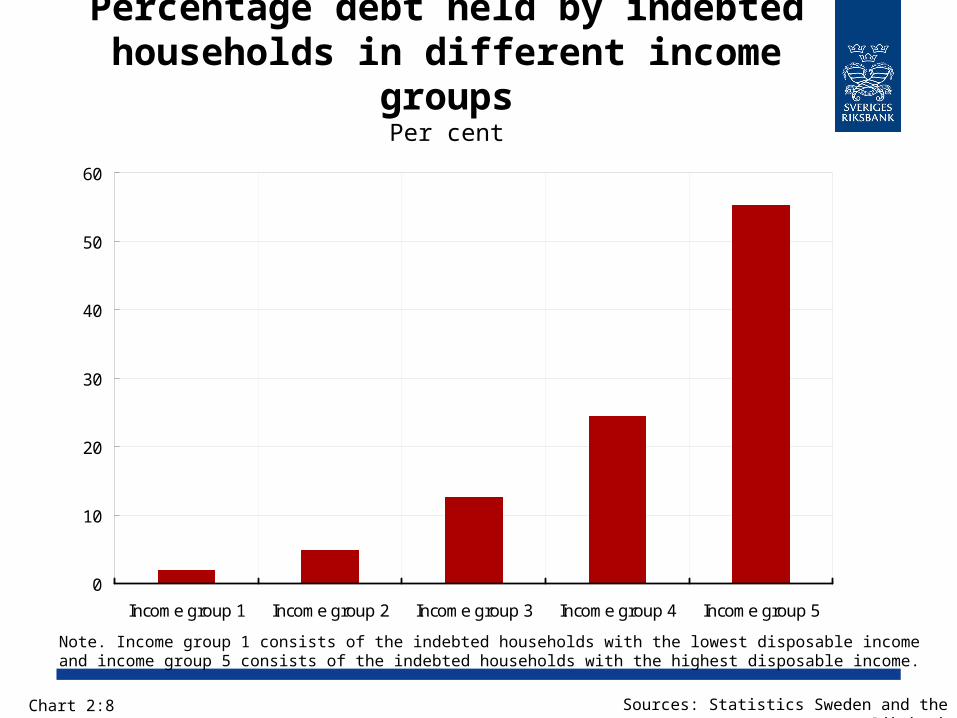
Percentage debt held by indebted households in different income
groupsPer cent
Note. Income group 1 consists of the indebted households with the lowest disposable income and income group 5 consists of the indebted households with the highest disposable income.
Sources: Statistics Sweden and the Riksbank
Chart 2:8
0
10
20
30
40
50
60
Income group 1 Income group 2 Income group 3 Income group 4 Income group 5
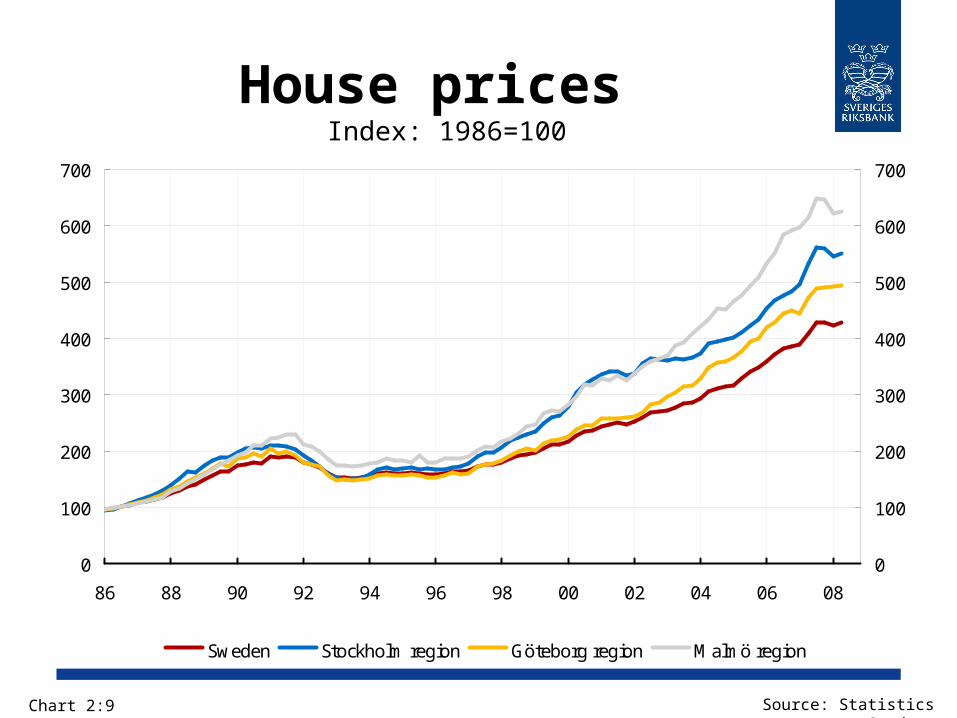
House prices Index: 1986=100
Source: Statistics Sweden
Chart 2:9
0
100
200
300
400
500
600
700
86 88 90 92 94 96 98 00 02 04 06 08
0
100
200
300
400
500
600
700
Sweden Stockholm region Göteborg region Malmö region
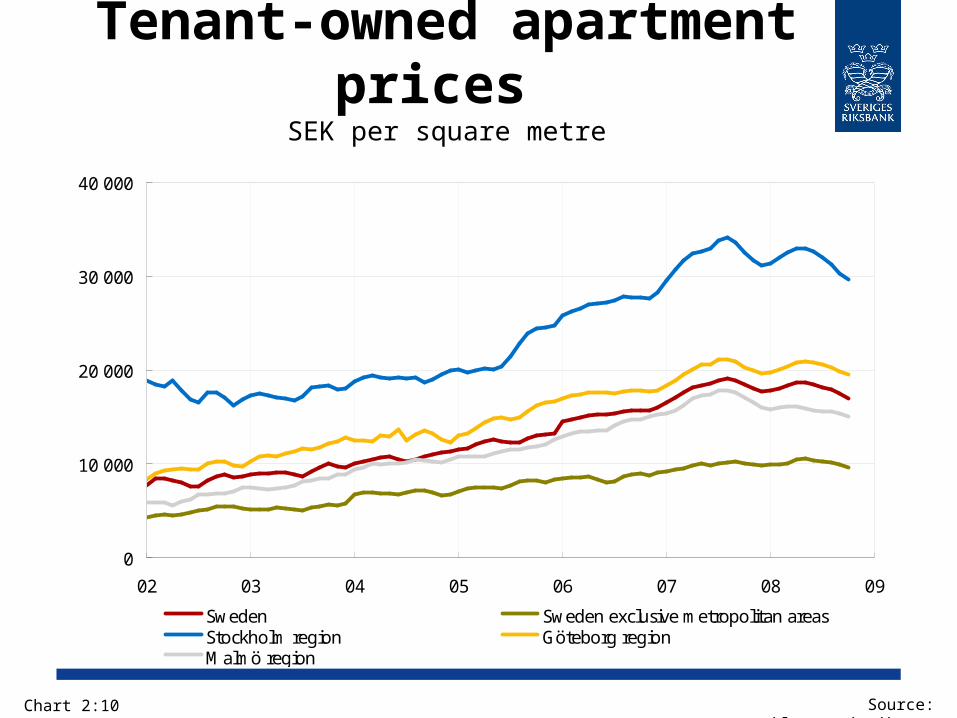
Tenant-owned apartment prices
SEK per square metre
Source: www.maklarstatistik.se
Chart 2:10
0
10 000
20 000
30 000
40 000
02 03 04 05 06 07 08 09
Sweden Sweden exclusive metropolitan areasStockholm region Göteborg regionMalmö region
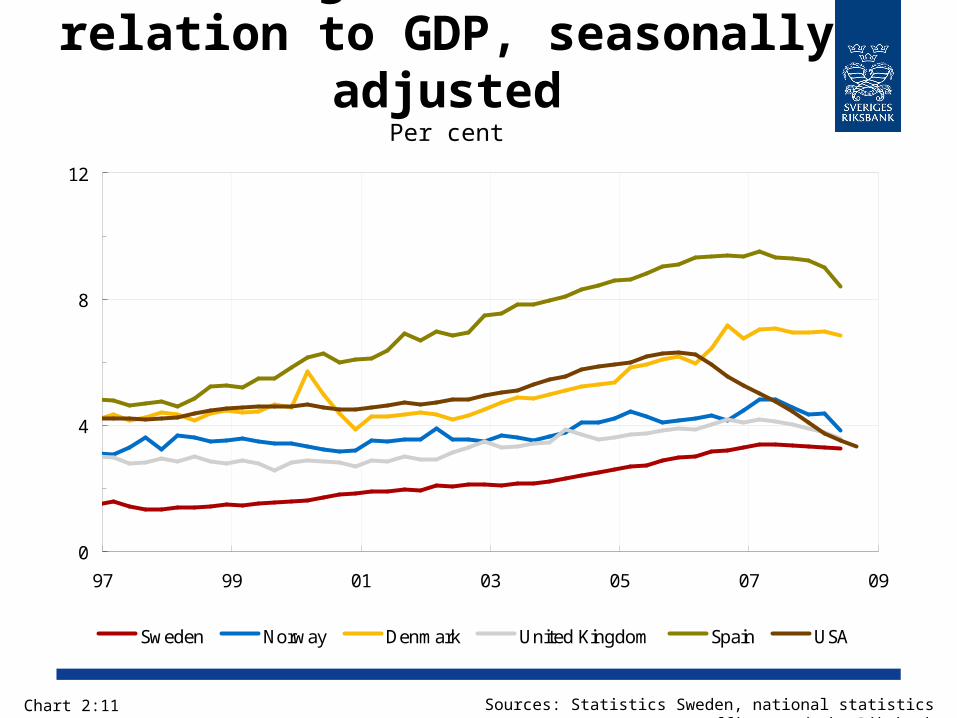
Housing investment in relation to GDP, seasonally
adjustedPer cent
Chart 2:11 Sources: Statistics Sweden, national statistics offices and the Riksbank
0
4
8
12
97 99 01 03 05 07 09
Sweden Norway Denmark United Kingdom Spain USA
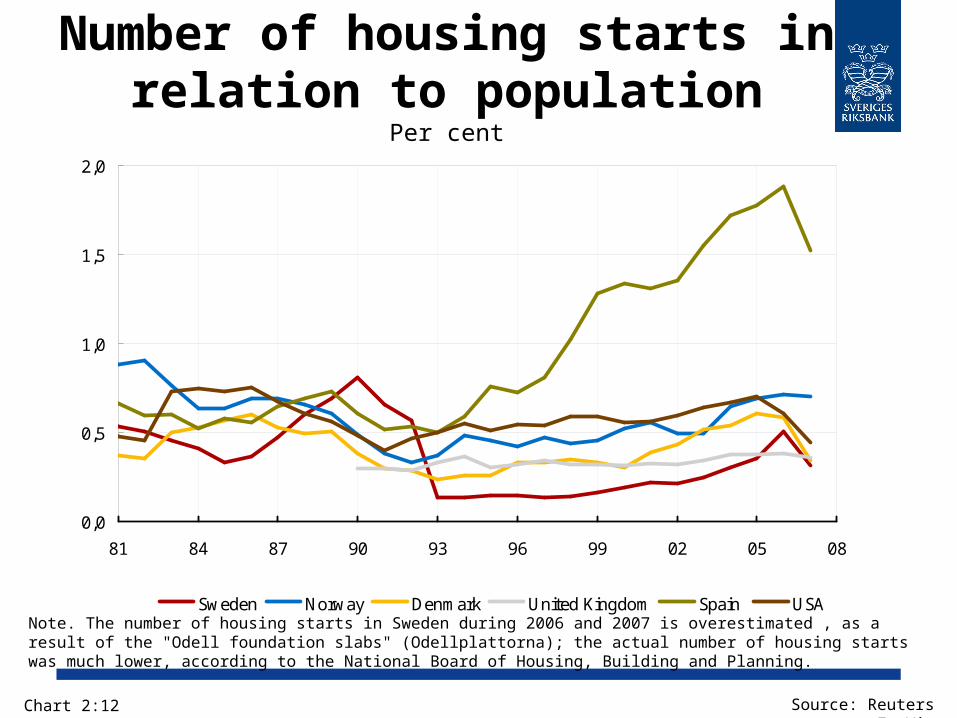
Number of housing starts in relation to population
Per cent
Chart 2:12 Source: Reuters EcoWin
Note. The number of housing starts in Sweden during 2006 and 2007 is overestimated , as a result of the "Odell foundation slabs" (Odellplattorna); the actual number of housing starts was much lower, according to the National Board of Housing, Building and Planning.
0,0
0,5
1,0
1,5
2,0
81 84 87 90 93 96 99 02 05 08
Sweden Norway Denmark United Kingdom Spain USA

The Swedish Corporate
Sector
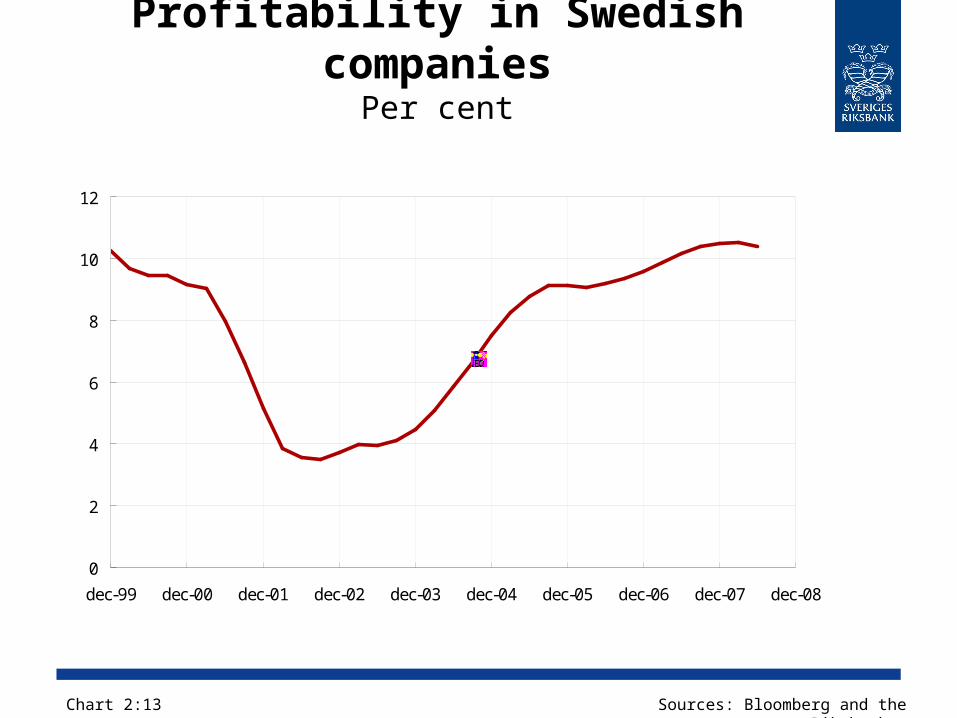
Profitability in Swedish companies
Per cent
Sources: Bloomberg and the Riksbanken
0
2
4
6
8
10
12
dec-99 dec-00 dec-01 dec-02 dec-03 dec-04 dec-05 dec-06 dec-07 dec-08
Chart 2:13
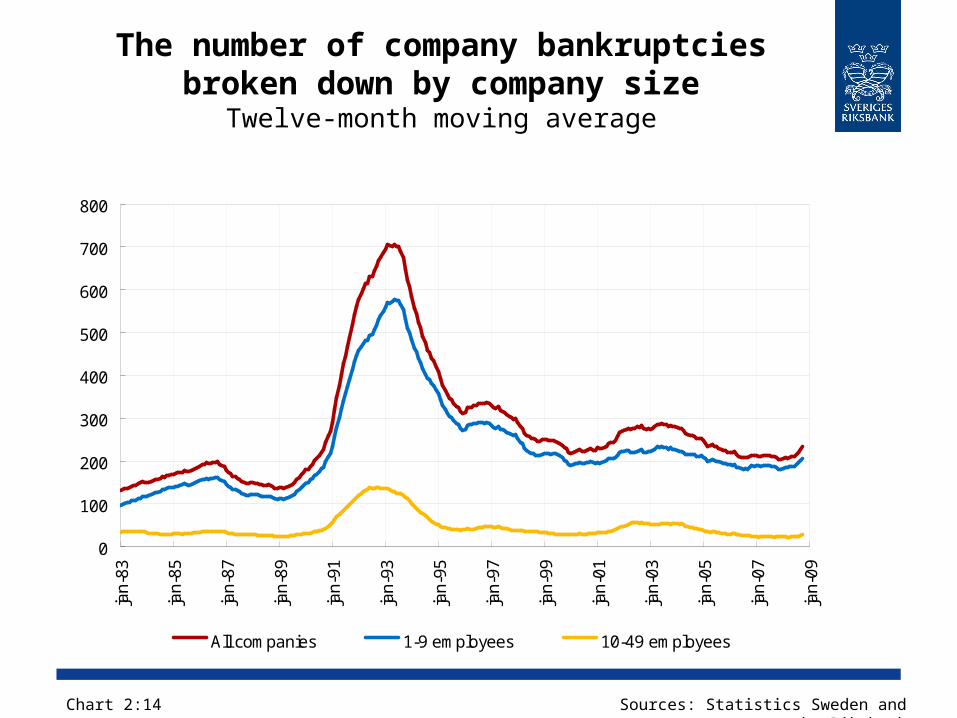
The number of company bankruptcies broken down by company size
Twelve-month moving average
Sources: Statistics Sweden and the Riksbank
Chart 2:14
0
100
200
300
400
500
600
700
800
jan-
83
jan-
85
jan-
87
jan-
89
jan-
91
jan-
93
jan-
95
jan-
97
jan-
99
jan-
01
jan-
03
jan-
05
jan-
07
jan-
09
All companies 1-9 employees 10-49 employees
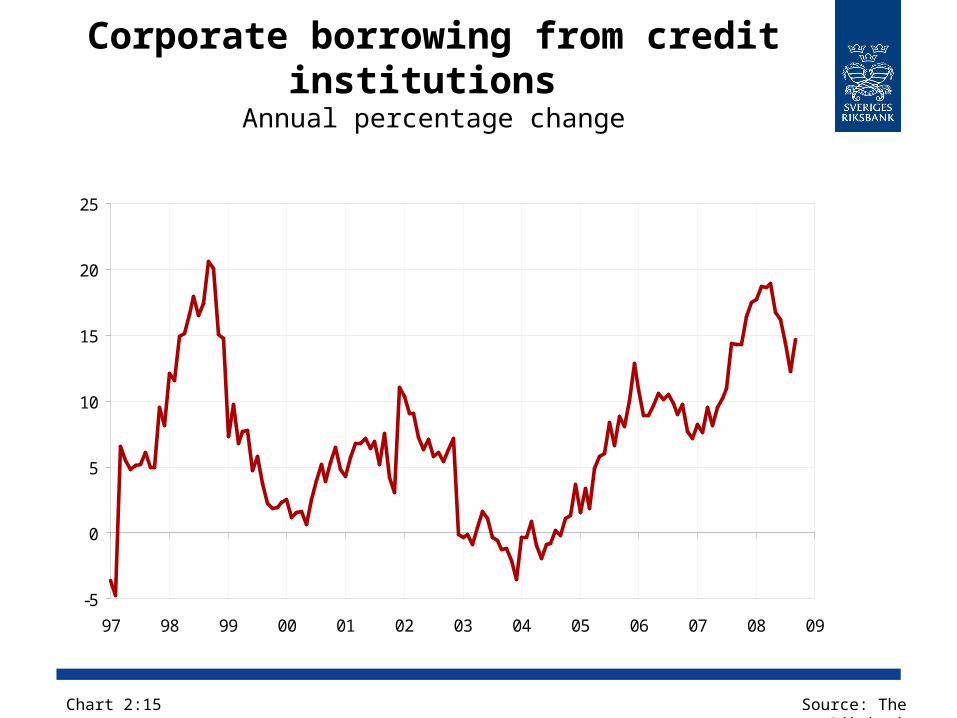
Corporate borrowing from credit institutions
Annual percentage change
Source: The Riksbank
-5
0
5
10
15
20
25
97 98 99 00 01 02 03 04 05 06 07 08 09
Chart 2:15
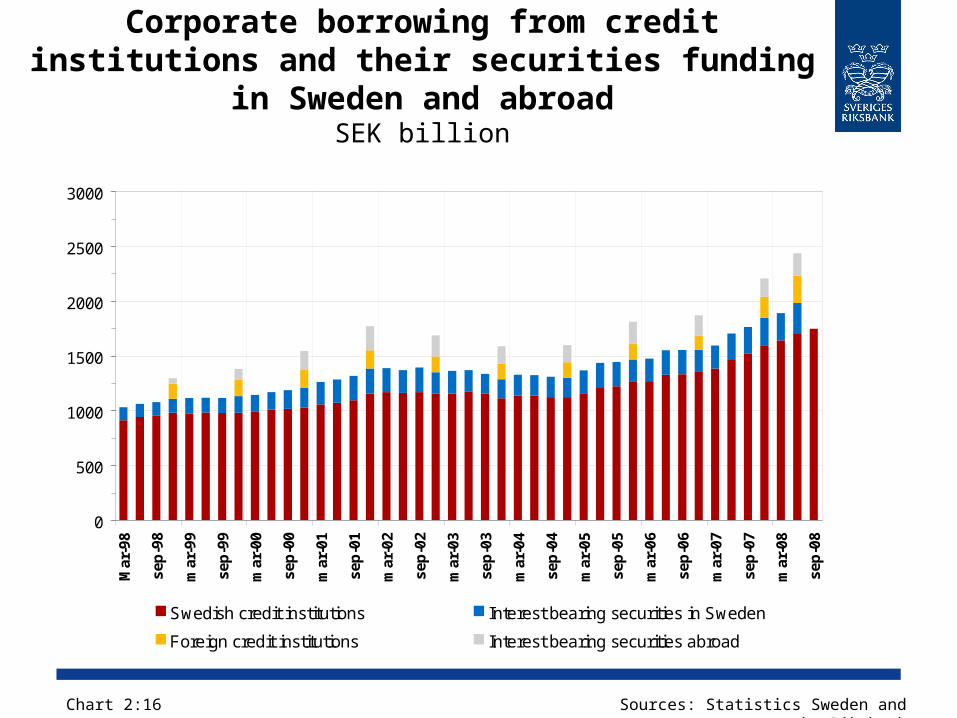
Corporate borrowing from credit institutions and their securities funding in Sweden and
abroadSEK billion
Chart 2:16
0
500
1000
1500
2000
2500
3000
Mar
-98
sep
-98
mar
-99
sep
-99
mar
-00
sep
-00
mar
-01
sep
-01
mar
-02
sep
-02
mar
-03
sep
-03
mar
-04
sep
-04
mar
-05
sep
-05
mar
-06
sep
-06
mar
-07
sep
-07
mar
-08
sep
-08
Swedish credit institutions Interest bearing securities in Sweden
Foreign credit institutions Interest bearing securities abroad
Sources: Statistics Sweden and the Riksbank
Corporate borrowing from credit institutions and gross fixed capital
investmentsAnnual percentage change
Chart 2:17
-10
-5
0
5
10
15
20
25
ma
r-9
8
ma
r-9
9
ma
r-0
0
ma
r-0
1
ma
r-0
2
ma
r-0
3
ma
r-0
4
ma
r-0
5
ma
r-0
6
ma
r-0
7
ma
r-0
8
ma
r-0
9
ma
r-1
0
ma
r-1
1
Corporate borrowing from credit institutions Gross fixed capital investments
Forecast
Sources: Bloomberg and the Riksbanken
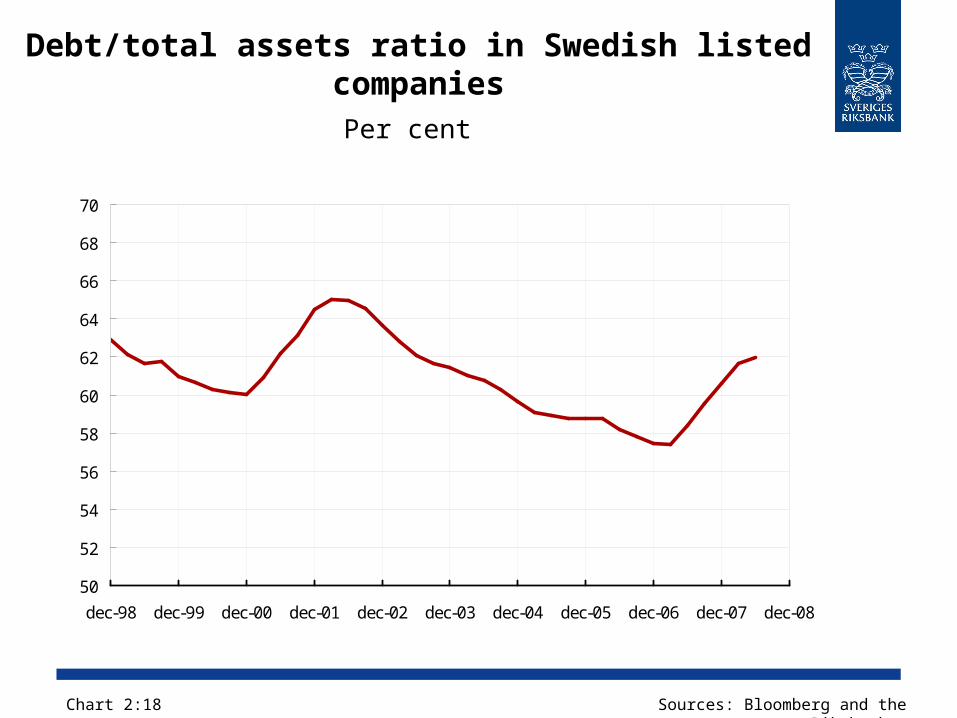
Debt/total assets ratio in Swedish listed companies
Per cent
50
52
54
56
58
60
62
64
66
68
70
dec-98 dec-99 dec-00 dec-01 dec-02 dec-03 dec-04 dec-05 dec-06 dec-07 dec-08
Chart 2:18 Sources: Bloomberg and the Riksbanken
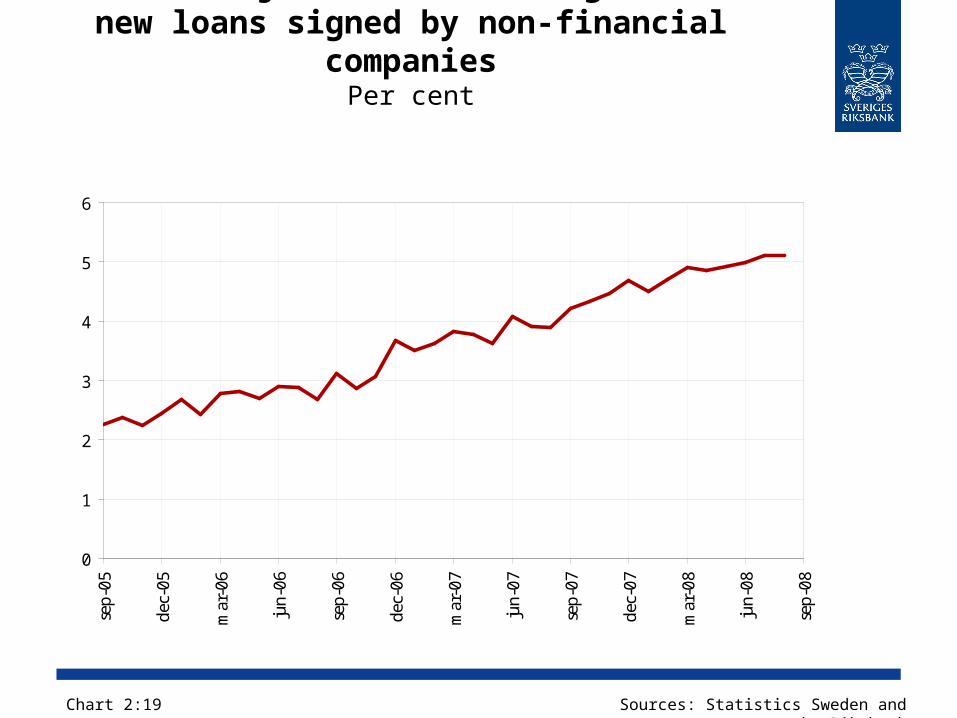
The four major banks’ lending rates on new loans signed by non-financial companies
Per cent
0
1
2
3
4
5
6
sep-
05
dec-
05
mar
-06
jun-
06
sep-
06
dec-
06
mar
-07
jun-
07
sep-
07
dec-
07
mar
-08
jun-
08
sep-
08
Chart 2:19 Sources: Statistics Sweden and the Riksbank
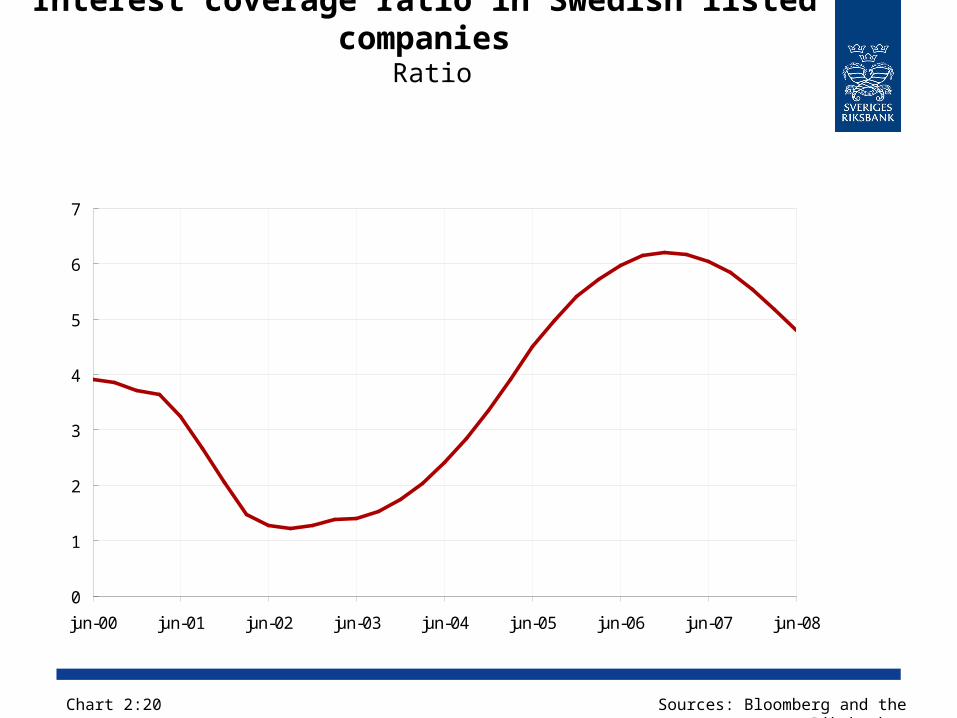
Interest coverage ratio in Swedish listed companies
Ratio
0
1
2
3
4
5
6
7
jun-00 jun-01 jun-02 jun-03 jun-04 jun-05 jun-06 jun-07 jun-08
Chart 2:20 Sources: Bloomberg and the Riksbanken
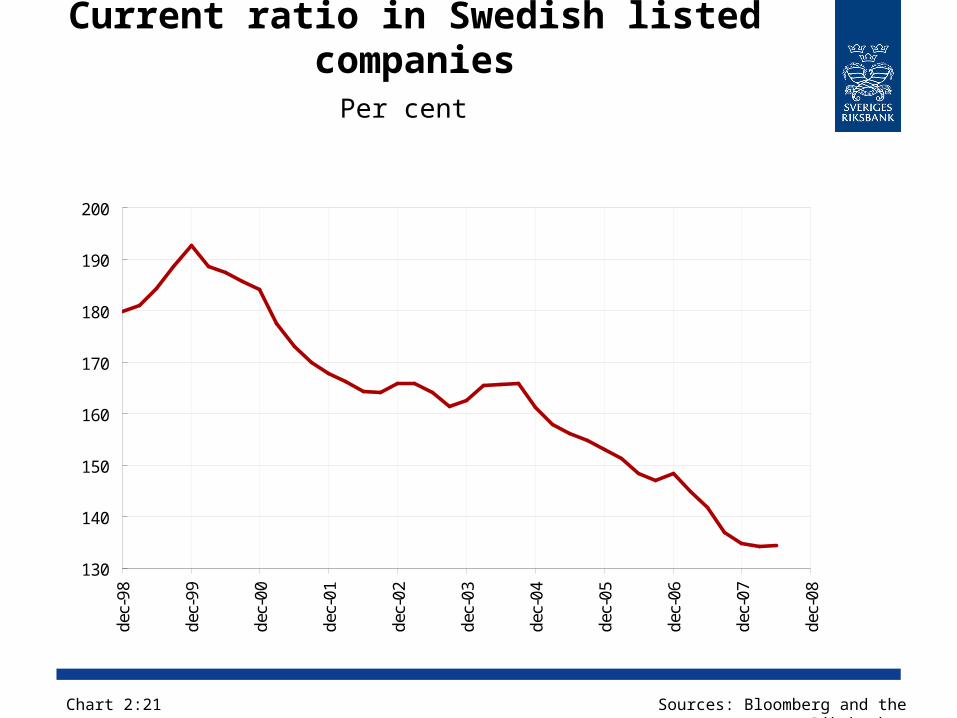
Current ratio in Swedish listed companies
Per cent
130
140
150
160
170
180
190
200
dec-
98
dec-
99
dec-
00
dec-
01
dec-
02
dec-
03
dec-
04
dec-
05
dec-
06
dec-
07
dec-
08
Chart 2:21 Sources: Bloomberg and the Riksbanken
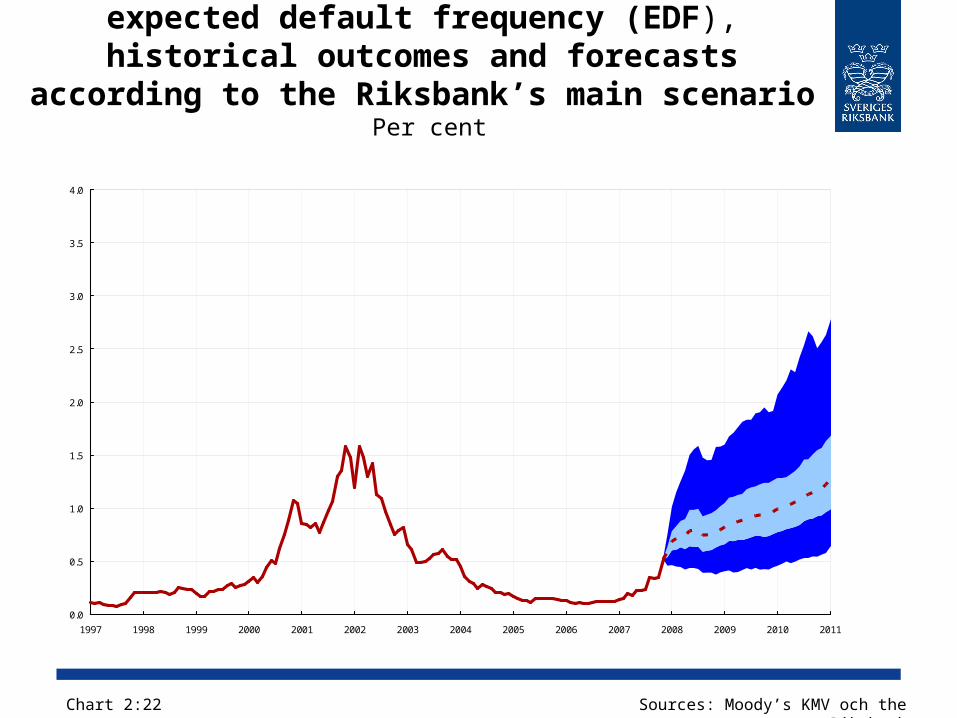
Corporate credit quality measured by expected default frequency (EDF), historical
outcomes and forecasts according to the Riksbank’s main scenario
Per cent
Sources: Moody’s KMV och the Riksbank
0.0
0.5
1.0
1.5
2.0
2.5
3.0
3.5
4.0
1997 1998 1999 2000 2001 2002 2003 2004 2005 2006 2007 2008 2009 2010 2011
Chart 2:22

Commercial property
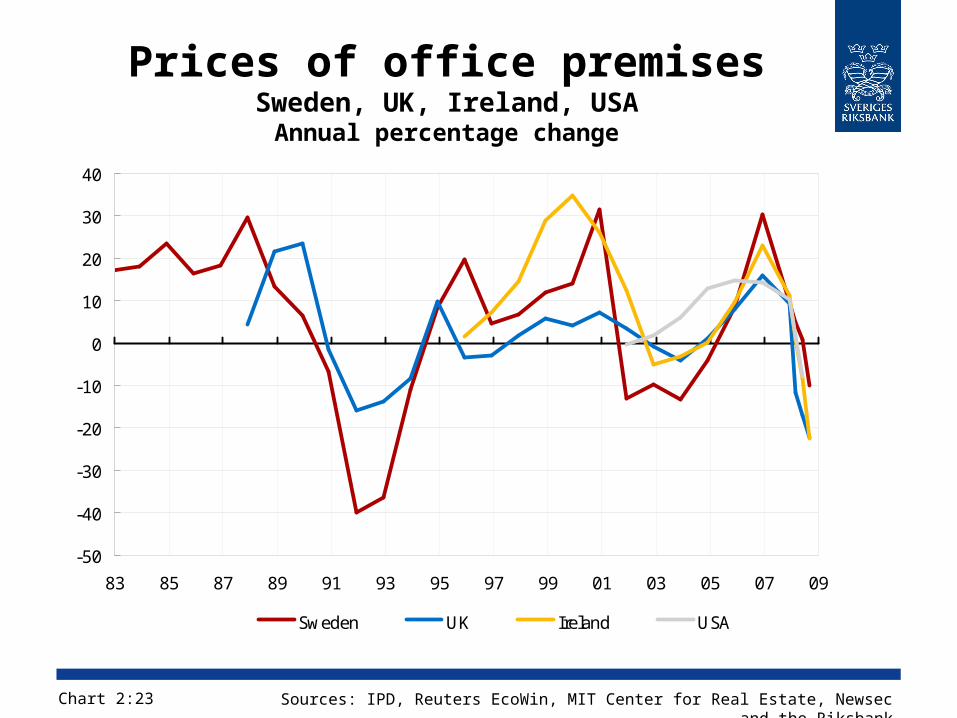
Prices of office premisesSweden, UK, Ireland, USAAnnual percentage change
Chart 2:23 Sources: IPD, Reuters EcoWin, MIT Center for Real Estate, Newsec and the Riksbank
-50
-40
-30
-20
-10
0
10
20
30
40
83 85 87 89 91 93 95 97 99 01 03 05 07 09
Sweden UK Ireland USA
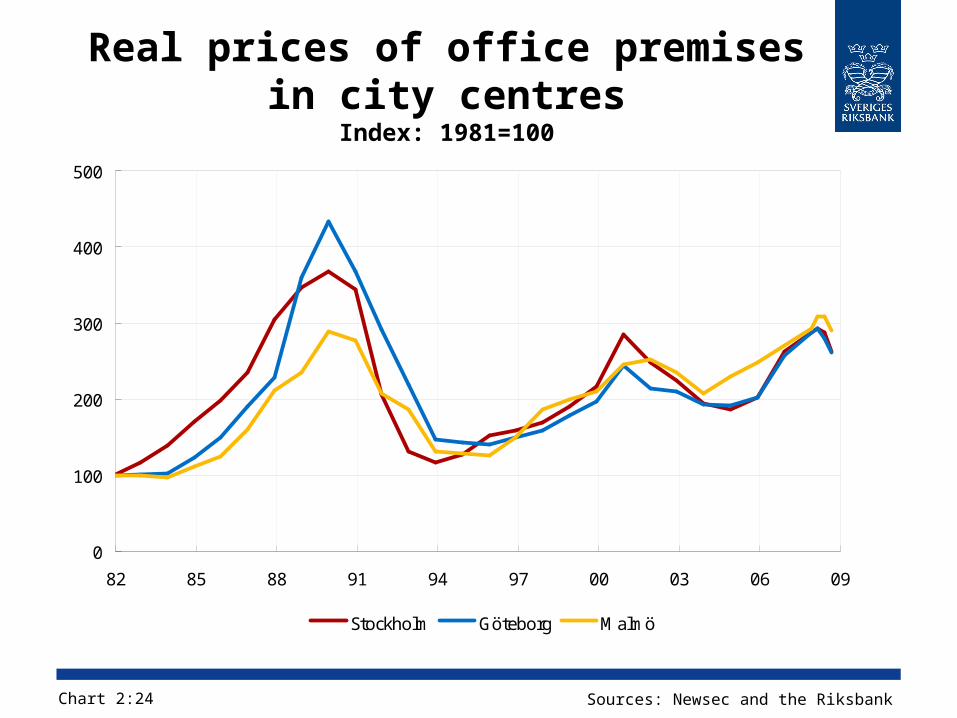
Real prices of office premises in city centres
Index: 1981=100
Chart 2:24 Sources: Newsec and the Riksbank
0
100
200
300
400
500
82 85 88 91 94 97 00 03 06 09
Stockholm Göteborg Malmö
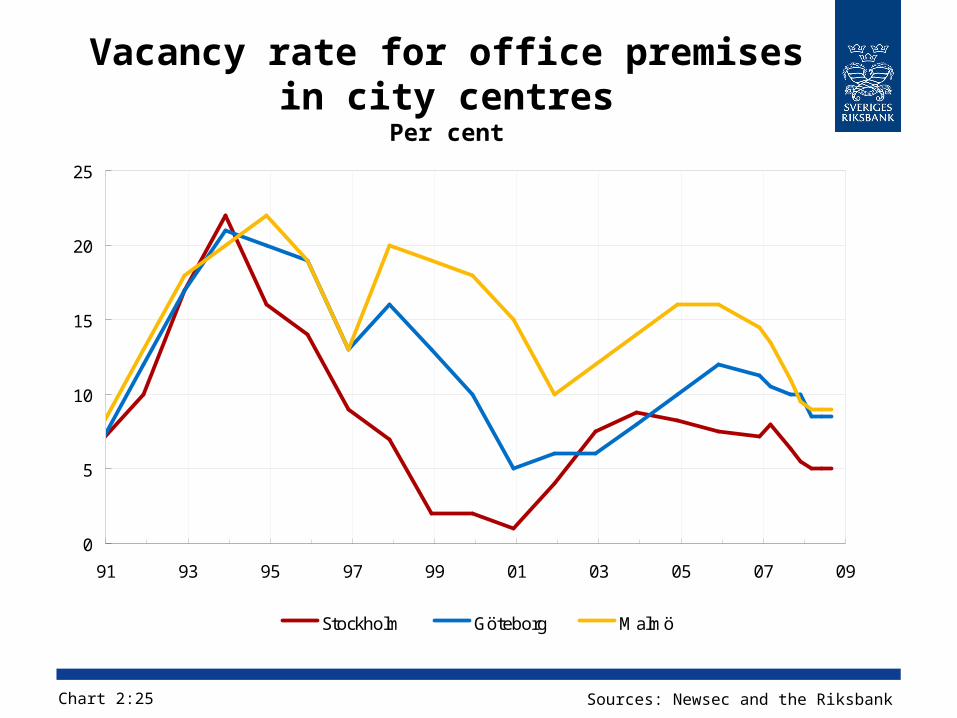
Vacancy rate for office premises in city centres
Per cent
Chart 2:25 Sources: Newsec and the Riksbank
0
5
10
15
20
25
91 93 95 97 99 01 03 05 07 09
Stockholm Göteborg Malmö
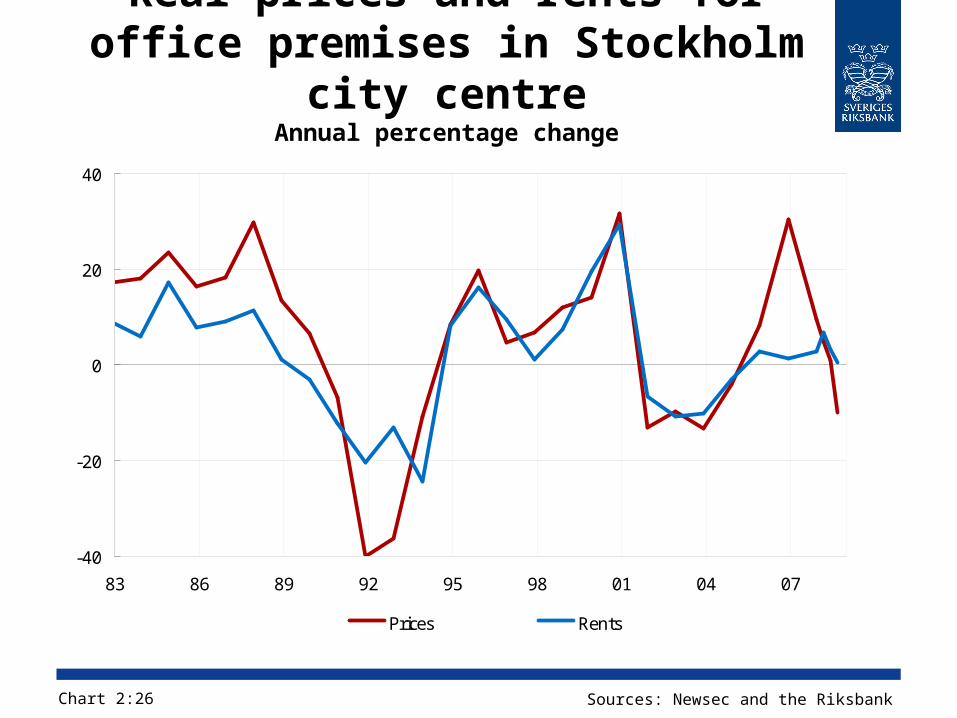
Real prices and rents for office premises in Stockholm city
centreAnnual percentage change
Chart 2:26 Sources: Newsec and the Riksbank
-40
-20
0
20
40
83 86 89 92 95 98 01 04 07
Prices Rents
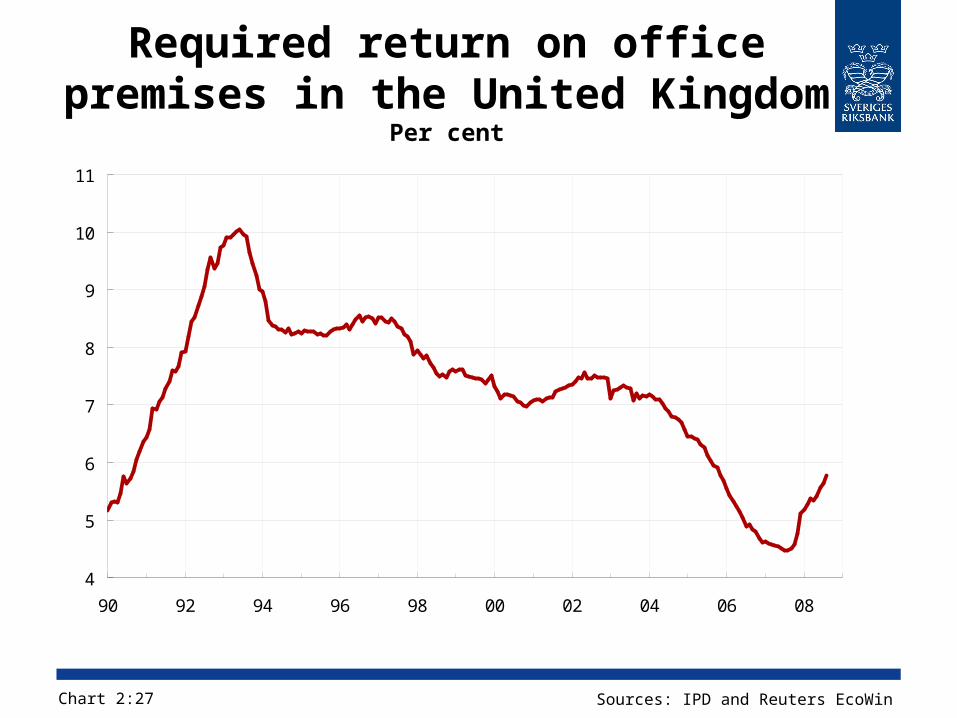
Required return on office premises in the United Kingdom
Per cent
Chart 2:27 Sources: IPD and Reuters EcoWin
4
5
6
7
8
9
10
11
90 92 94 96 98 00 02 04 06 08
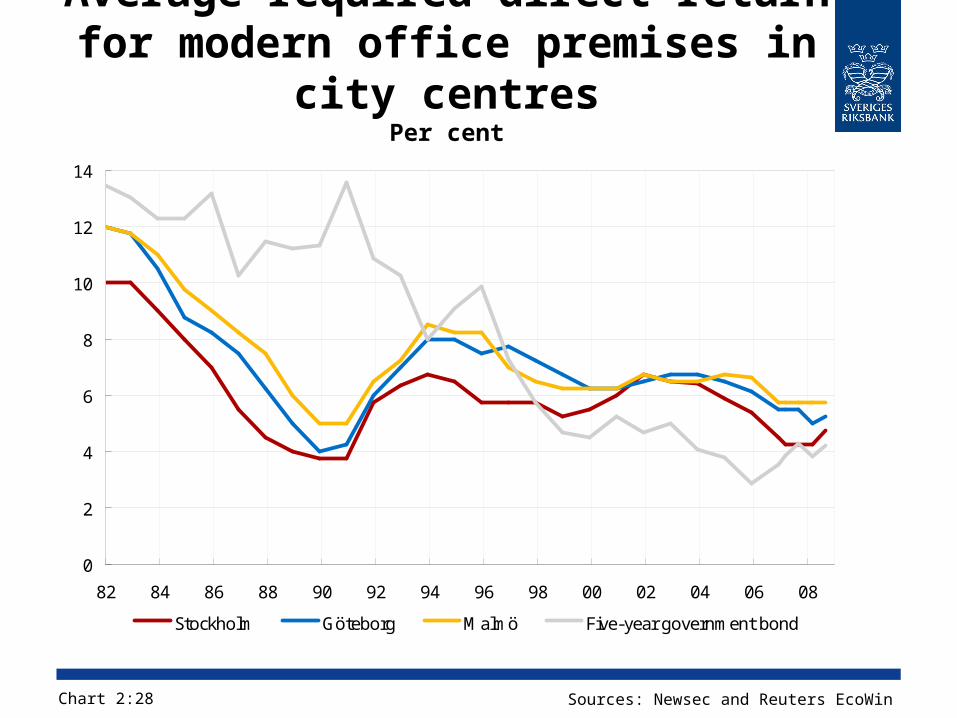
Average required direct return for modern office premises in
city centresPer cent
Chart 2:28 Sources: Newsec and Reuters EcoWin
0
2
4
6
8
10
12
14
82 84 86 88 90 92 94 96 98 00 02 04 06 08
Stockholm Göteborg Malmö Five-year government bond
The Swedish banks’
borrowers abroad
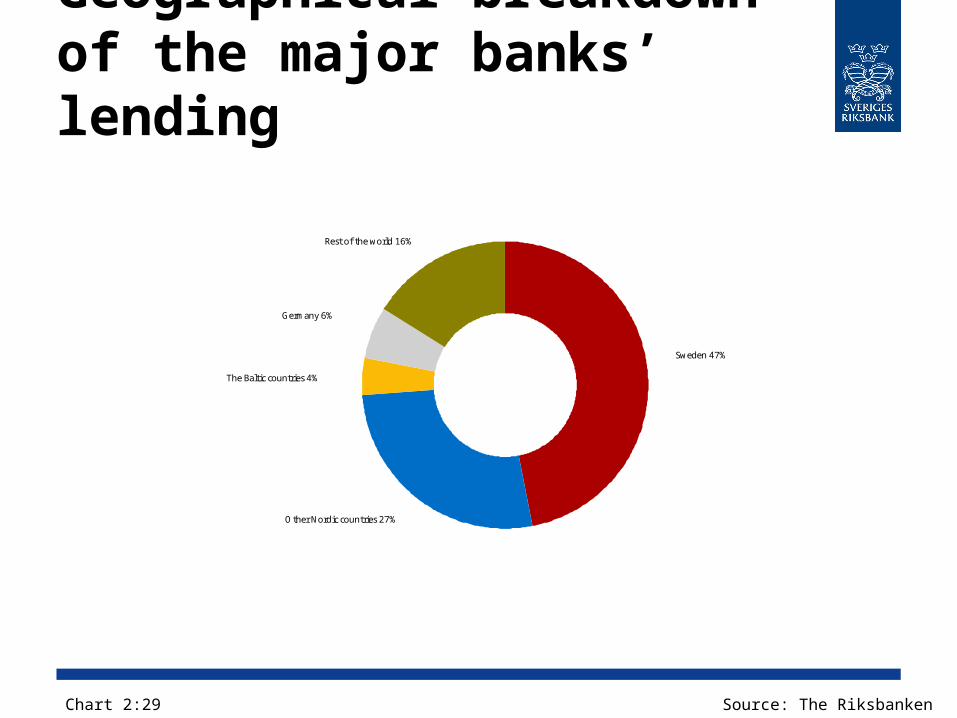
Geographical breakdown of the major banks’ lending
Rest of the world 16%
Germany 6%
Other Nordic countries 27%
Sweden 47%
The Baltic countries 4%
Chart 2:29 Source: The Riksbanken
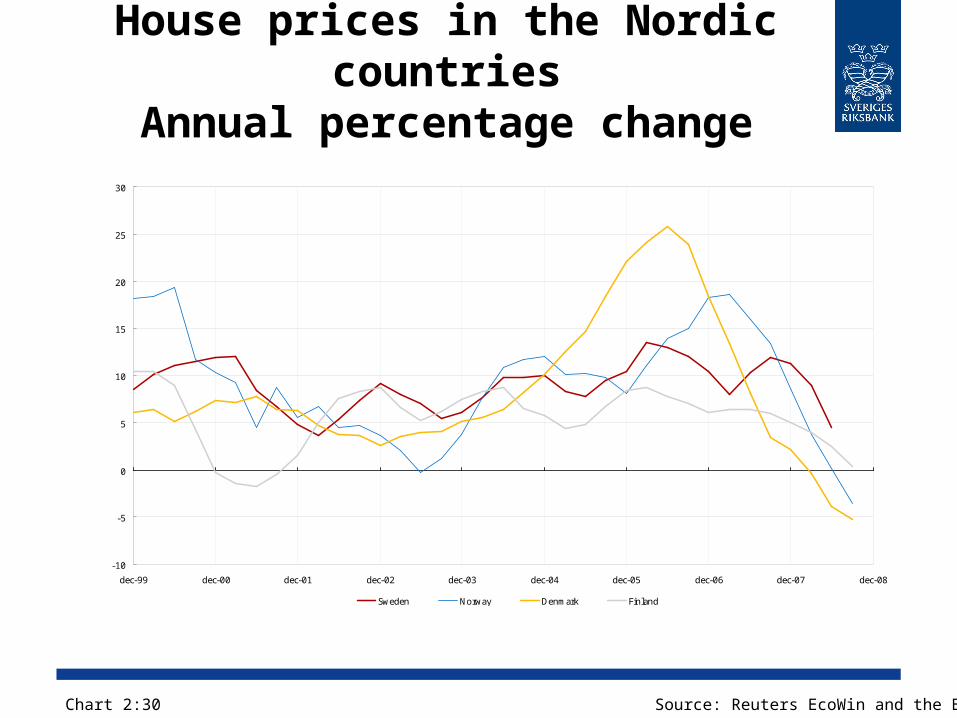
House prices in the Nordic countries
Annual percentage change
-10
-5
0
5
10
15
20
25
30
dec-99 dec-00 dec-01 dec-02 dec-03 dec-04 dec-05 dec-06 dec-07 dec-08
Sweden Norway Denmark Finland
Chart 2:30 Source: Reuters EcoWin and the BIS
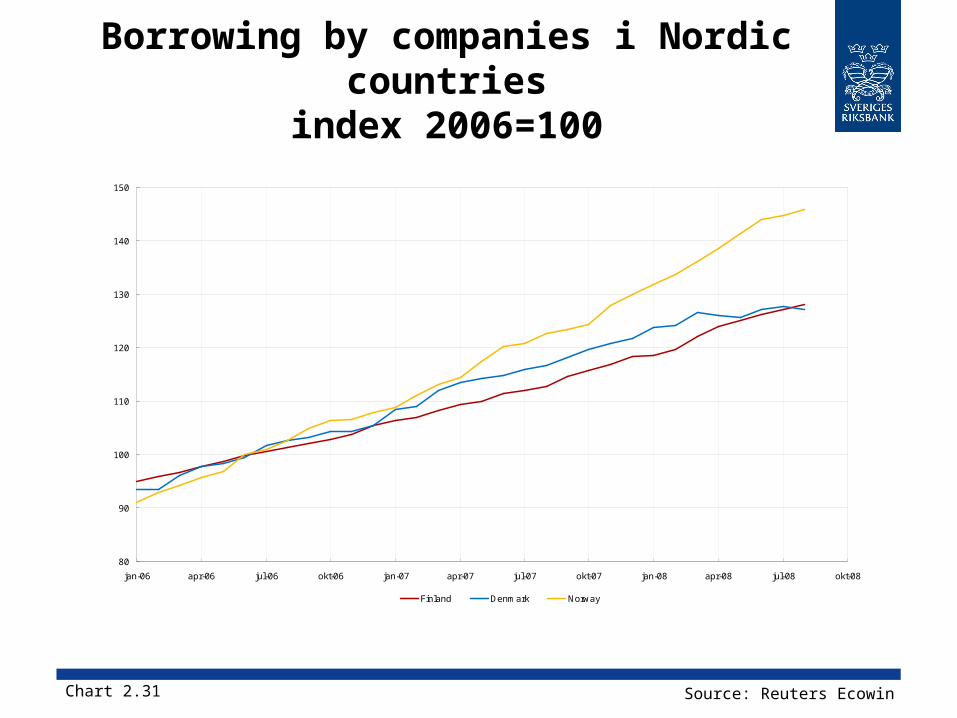
Borrowing by companies i Nordic countries
index 2006=100
80
90
100
110
120
130
140
150
jan-06 apr-06 jul-06 okt-06 jan-07 apr-07 jul-07 okt-07 jan-08 apr-08 jul-08 okt-08
Finland Denmark Norway
Chart 2.31 Source: Reuters Ecowin
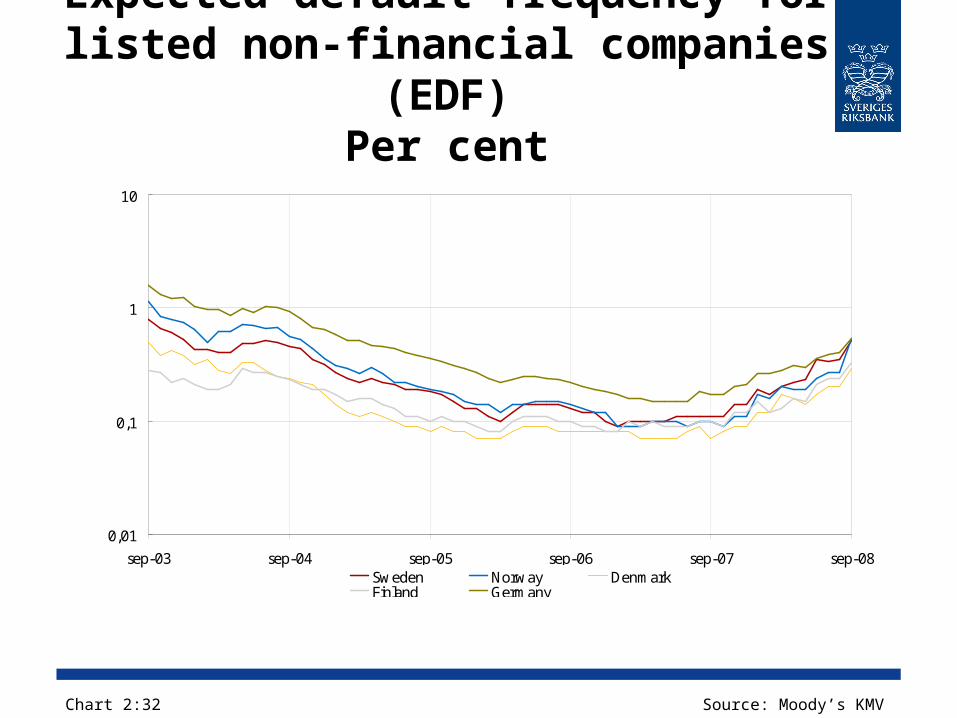
Expected default frequency for listed non-financial companies
(EDF)Per cent
0,01
0,1
1
10
sep-03 sep-04 sep-05 sep-06 sep-07 sep-08Sweden Norway DenmarkFinland Germany
Chart 2:32 Source: Moody’s KMV
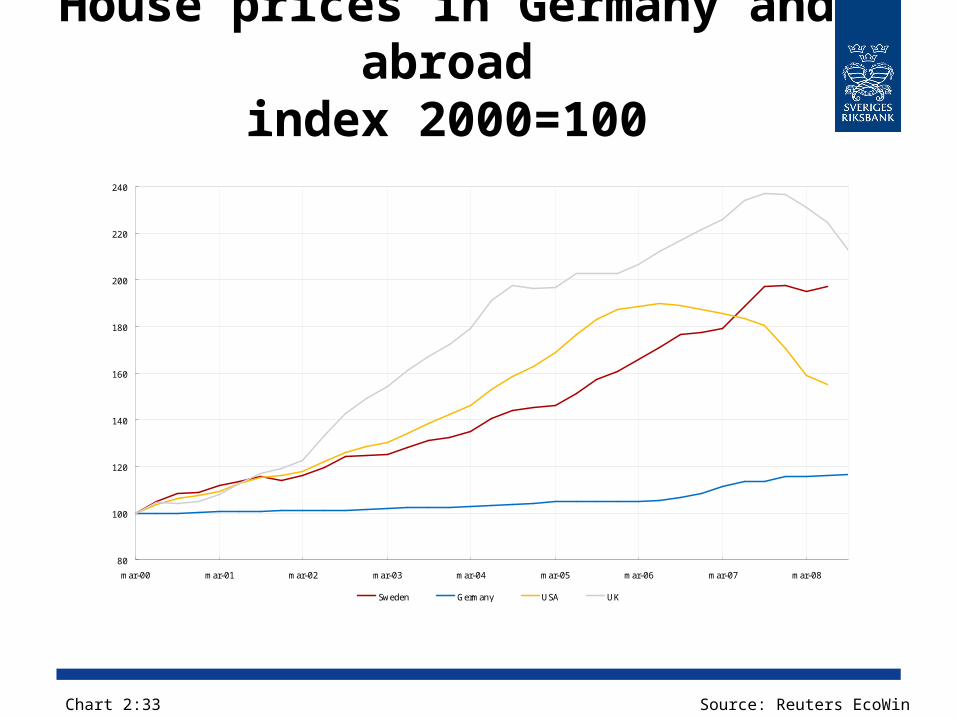
House prices in Germany and abroad
index 2000=100
80
100
120
140
160
180
200
220
240
mar-00 mar-01 mar-02 mar-03 mar-04 mar-05 mar-06 mar-07 mar-08
Sweden Germany USA UK
Chart 2:33 Source: Reuters EcoWin

The Baltic countries
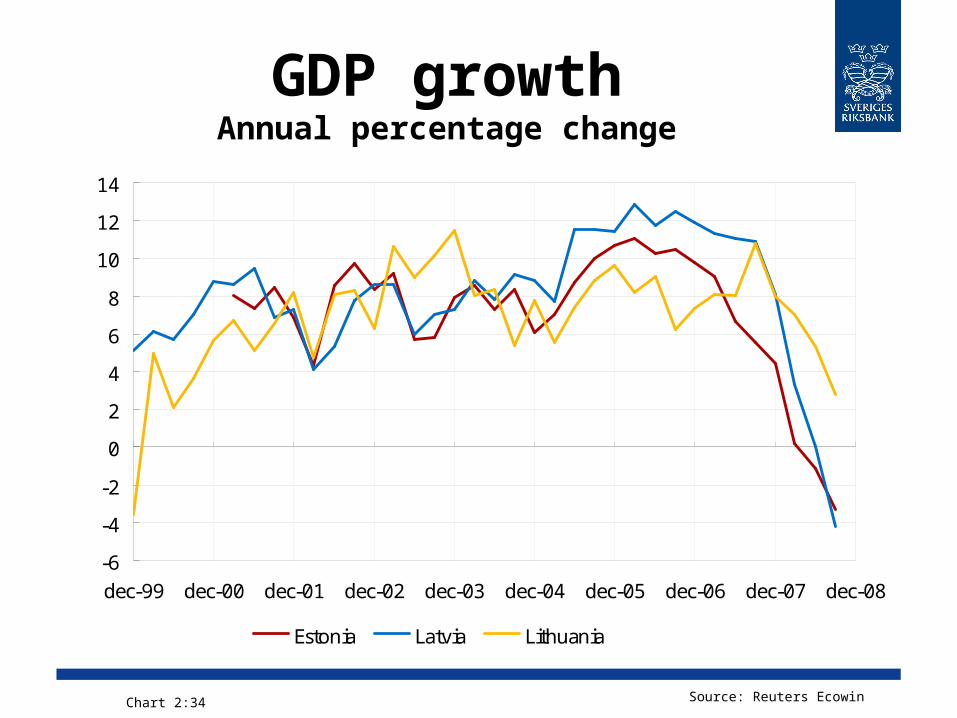
GDP growthAnnual percentage change
-6
-4
-2
0
2
4
6
8
10
12
14
dec-99 dec-00 dec-01 dec-02 dec-03 dec-04 dec-05 dec-06 dec-07 dec-08
Estonia Latvia Lithuania
Chart 2:34 Source: Reuters Ecowin
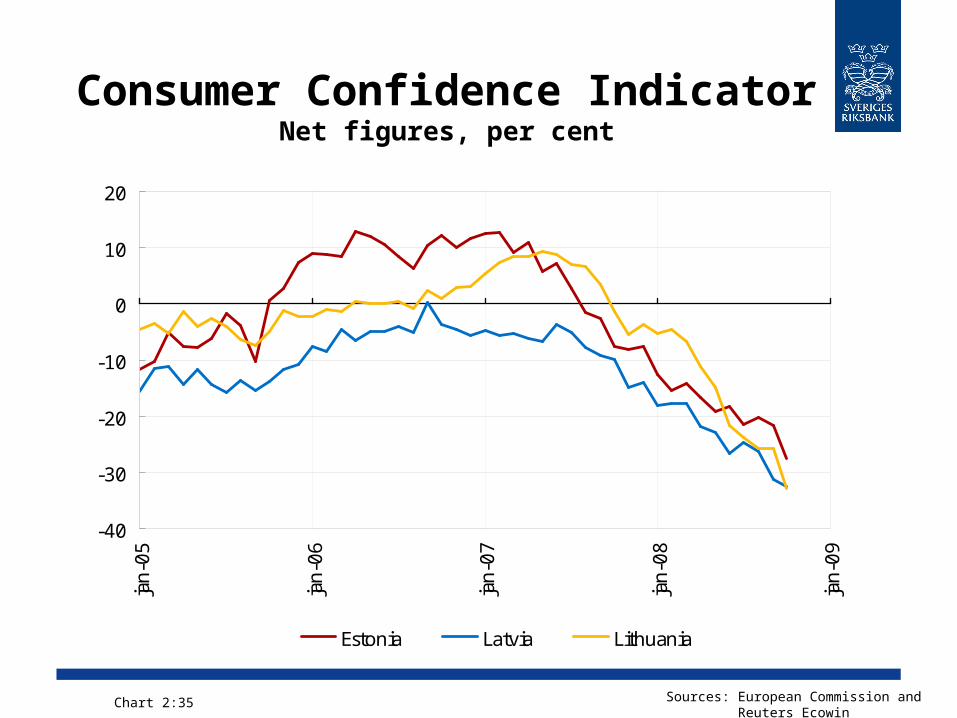
Consumer Confidence IndicatorNet figures, per cent
-40
-30
-20
-10
0
10
20
jan-
05
jan-
06
jan-
07
jan-
08
jan-
09
Estonia Latvia Lithuania
Chart 2:35 Sources: European Commission and Reuters Ecowin
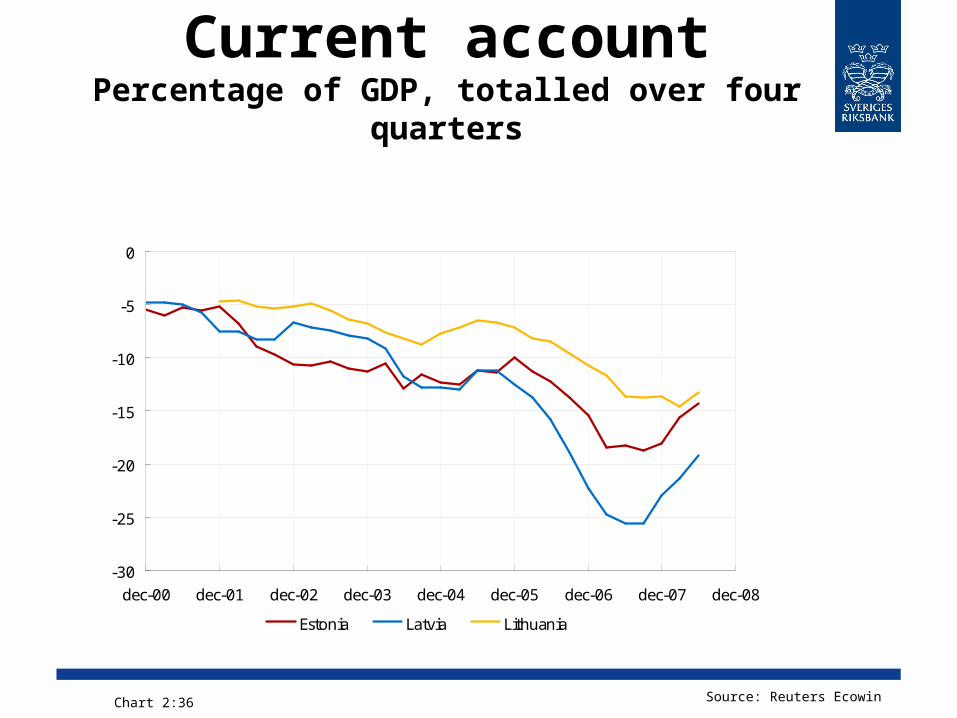
Current accountPercentage of GDP, totalled over four
quarters
-30
-25
-20
-15
-10
-5
0
dec-00 dec-01 dec-02 dec-03 dec-04 dec-05 dec-06 dec-07 dec-08
Estonia Latvia Lithuania
Chart 2:36 Source: Reuters Ecowin
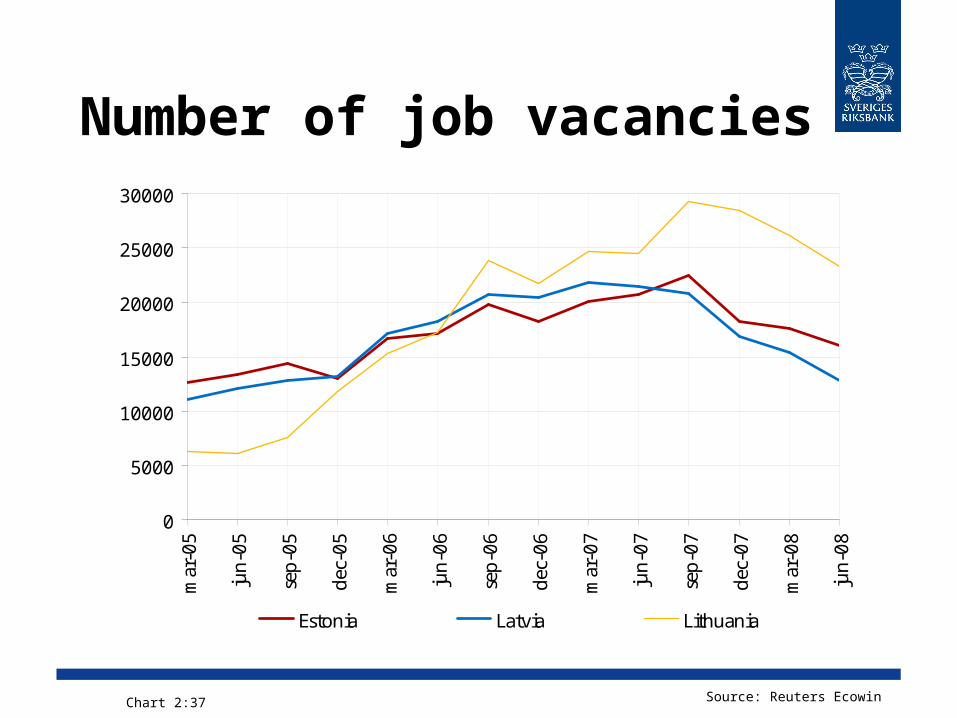
Number of job vacancies
0
5000
10000
15000
20000
25000
30000m
ar-0
5
jun-
05
sep-
05
dec-
05
mar
-06
jun-
06
sep-
06
dec-
06
mar
-07
jun-
07
sep-
07
dec-
07
mar
-08
jun-
08
Estonia Latvia Lithuania
Chart 2:37 Source: Reuters Ecowin
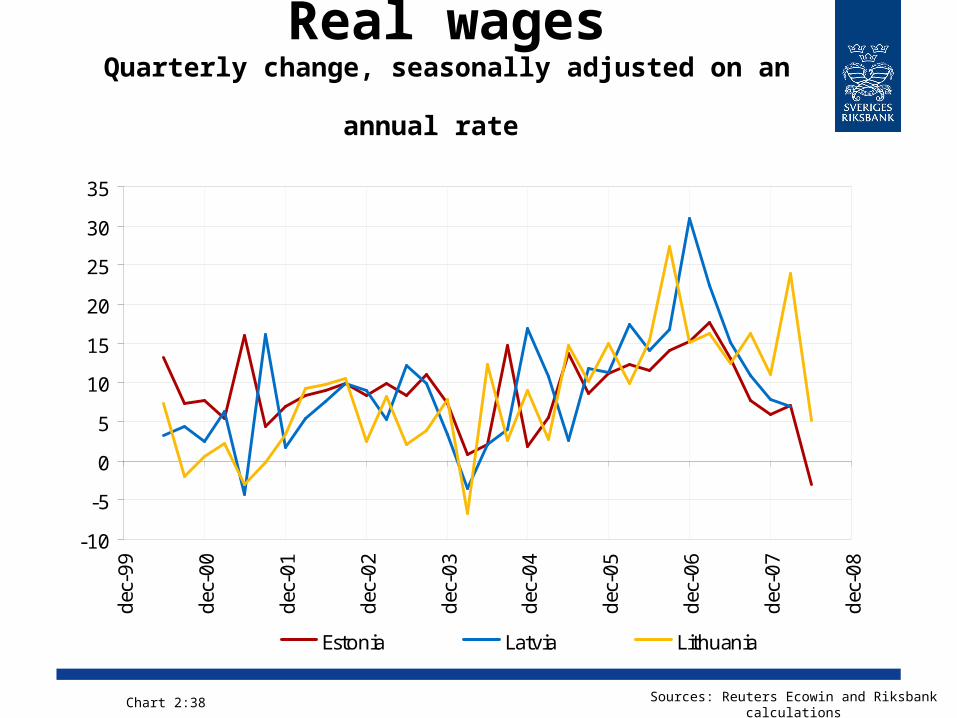
Real wagesQuarterly change, seasonally adjusted on an
annual rate
-10
-5
0
5
10
15
20
25
30
35
dec-
99
dec-
00
dec-
01
dec-
02
dec-
03
dec-
04
dec-
05
dec-
06
dec-
07
dec-
08
Estonia Latvia Lithuania
Chart 2:38 Sources: Reuters Ecowin and Riksbank calculations
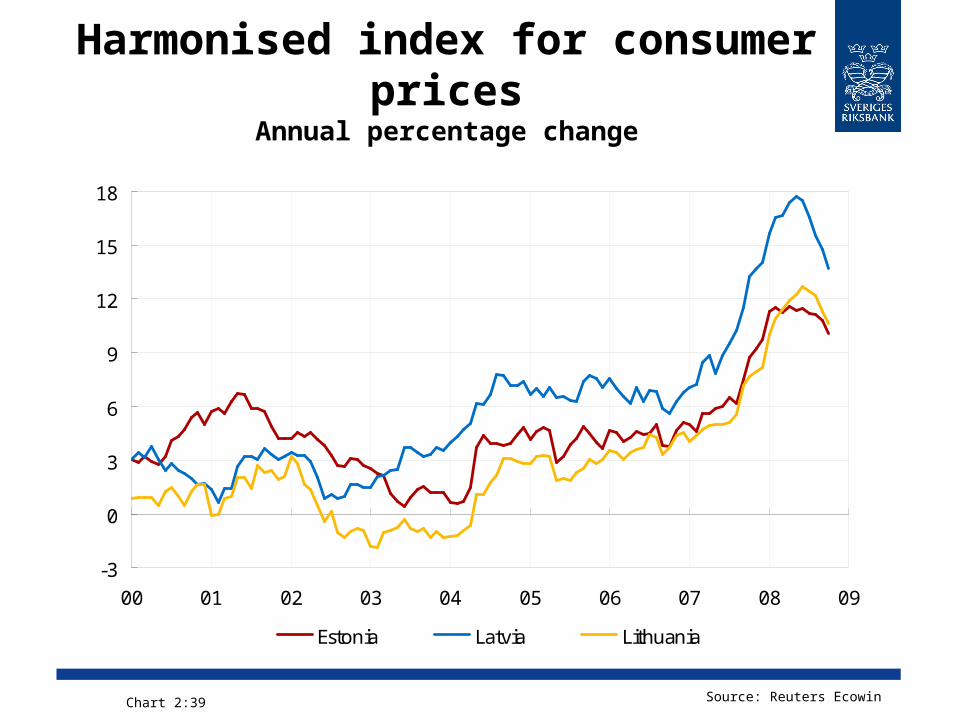
Harmonised index for consumer prices
Annual percentage change
-3
0
3
6
9
12
15
18
00 01 02 03 04 05 06 07 08 09
Estonia Latvia Lithuania
Chart 2:39 Source: Reuters Ecowin
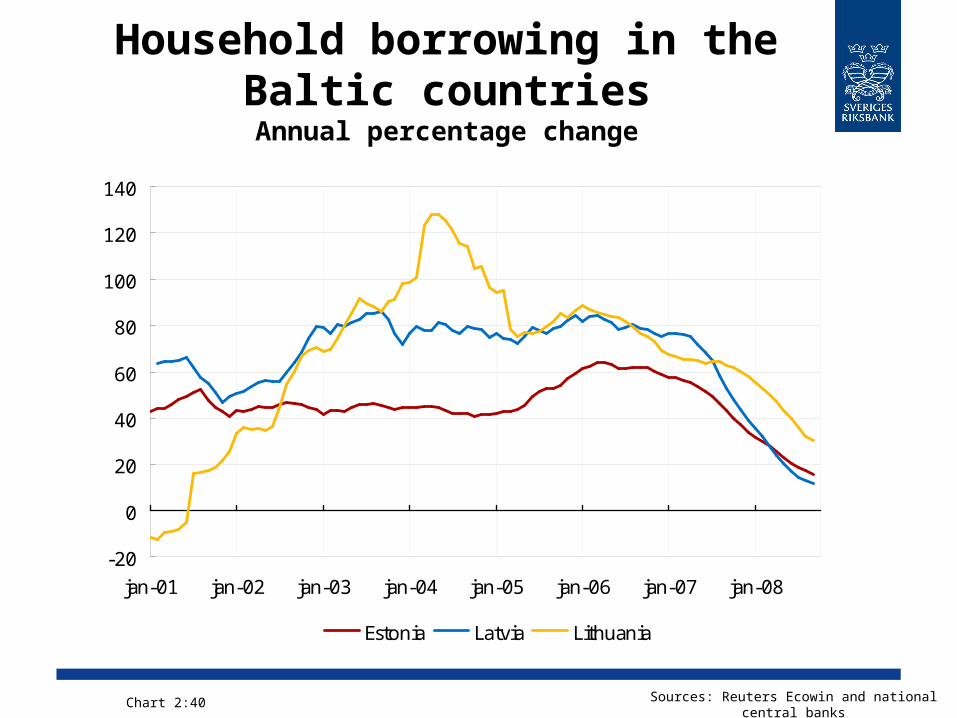
Household borrowing in the Baltic countries
Annual percentage change
-20
0
20
40
60
80
100
120
140
jan-01 jan-02 jan-03 jan-04 jan-05 jan-06 jan-07 jan-08
Estonia Latvia Lithuania
Chart 2:40 Sources: Reuters Ecowin and national central banks
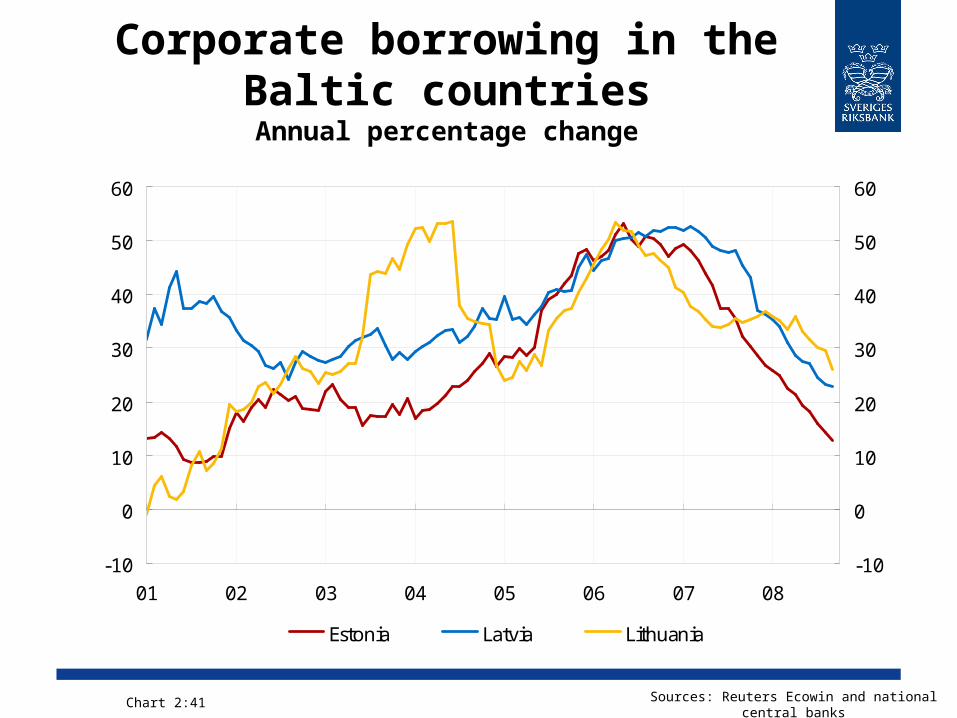
Corporate borrowing in the Baltic countries
Annual percentage change
-10
0
10
20
30
40
50
60
01 02 03 04 05 06 07 08-10
0
10
20
30
40
50
60
Estonia Latvia Lithuania
Chart 2:41 Sources: Reuters Ecowin and national central banks
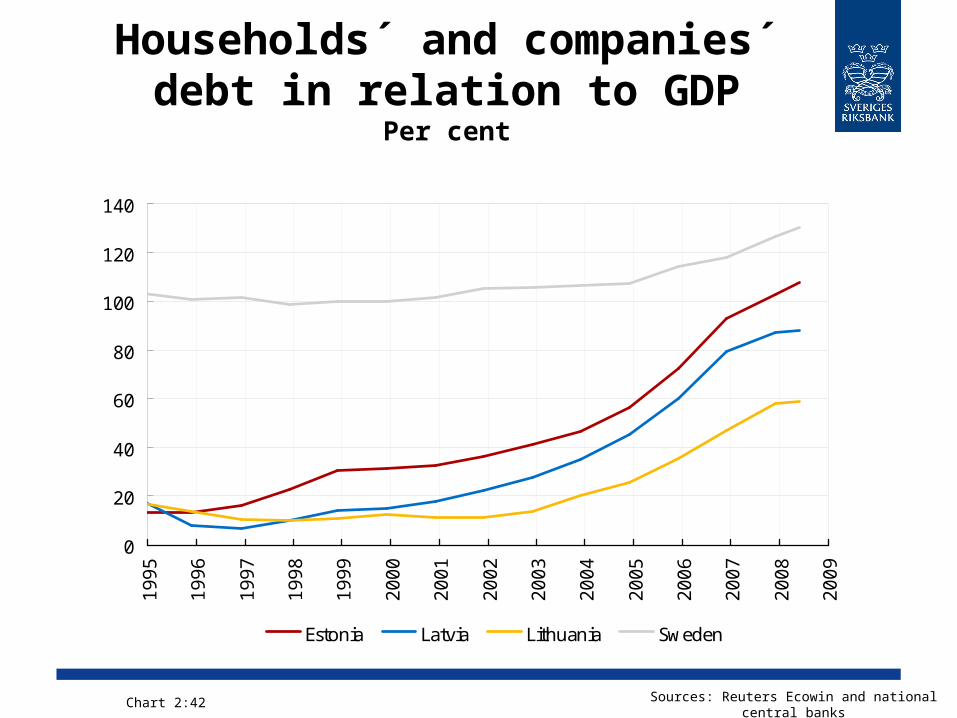
Households´ and companies´ debt in relation to GDP
Per cent
0
20
40
60
80
100
120
140
1995
1996
1997
1998
1999
2000
2001
2002
2003
2004
2005
2006
2007
2008
2009
Estonia Latvia Lithuania Sweden
Chart 2:42 Sources: Reuters Ecowin and national central banks
Developments in the banks
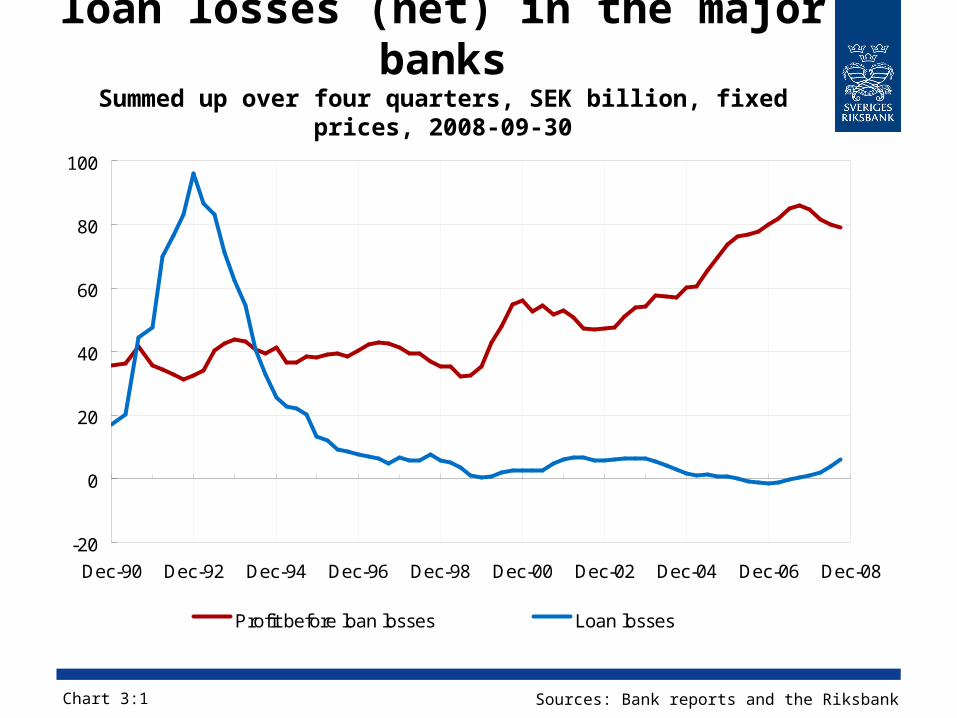
Profit before loan losses and loan losses (net) in the major
banksSummed up over four quarters, SEK billion, fixed prices,
2008-09-30
Chart 3:1 Sources: Bank reports and the Riksbank
-20
0
20
40
60
80
100
Dec-90 Dec-92 Dec-94 Dec-96 Dec-98 Dec-00 Dec-02 Dec-04 Dec-06 Dec-08
Profit before loan losses Loan losses
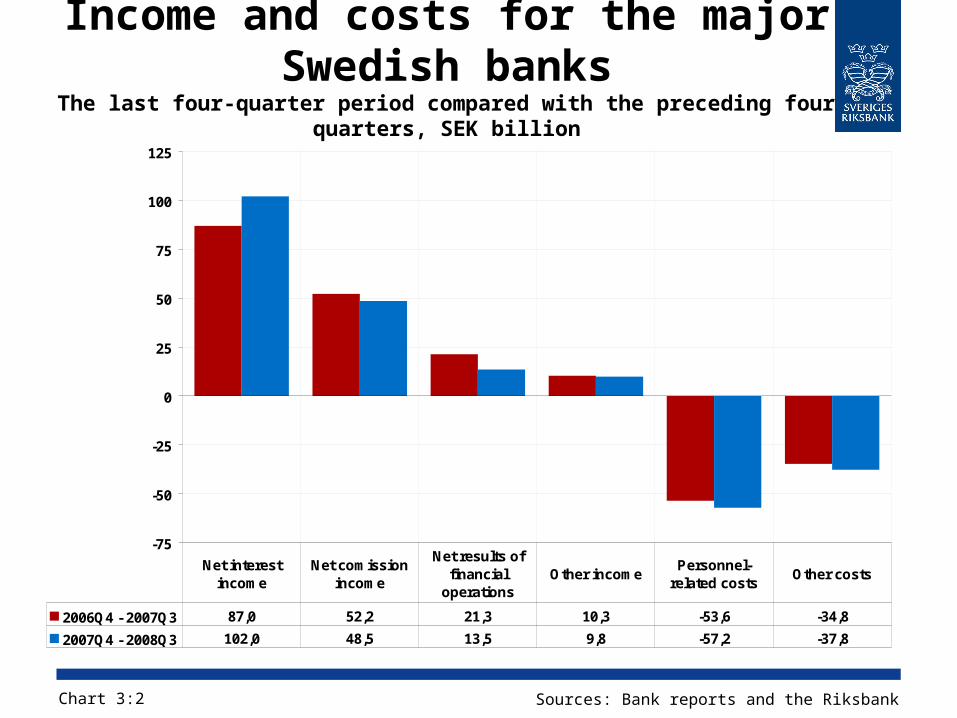
Income and costs for the major Swedish banks
The last four-quarter period compared with the preceding four quarters, SEK billion
Chart 3:2 Sources: Bank reports and the Riksbank
-75
-50
-25
0
25
50
75
100
125
2006Q4 - 2007Q3 87,0 52,2 21,3 10,3 -53,6 -34,8
2007Q4 - 2008Q3 102,0 48,5 13,5 9,8 -57,2 -37,8
Net interest income
Net comission income
Net results of financial
operationsOther income
Personnel-related costs
Other costs
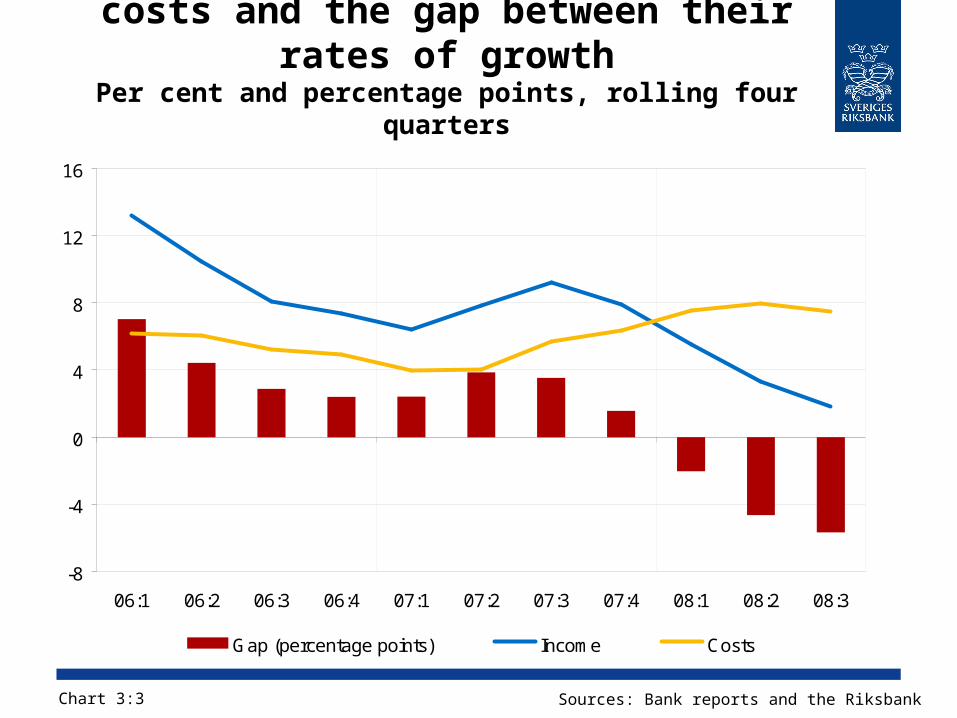
The development of income and costs and the gap between their
rates of growthPer cent and percentage points, rolling four
quarters
Chart 3:3 Sources: Bank reports and the Riksbank
-8
-4
0
4
8
12
16
06:1 06:2 06:3 06:4 07:1 07:2 07:3 07:4 08:1 08:2 08:3
Gap (percentage points) Income Costs
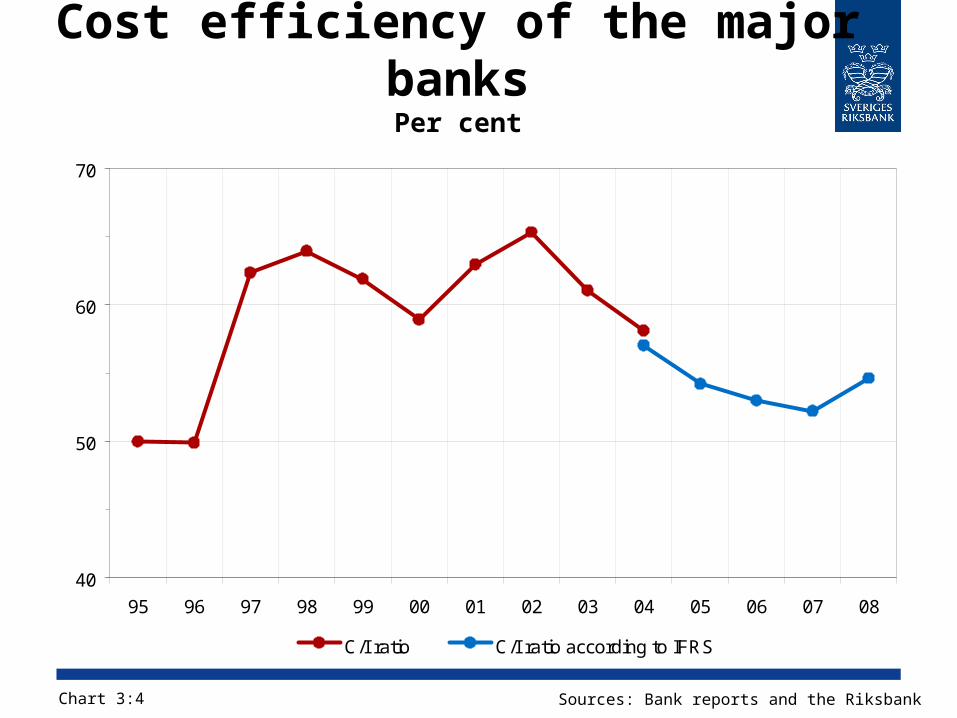
Cost efficiency of the major banksPer cent
Chart 3:4 Sources: Bank reports and the Riksbank
40
50
60
70
95 96 97 98 99 00 01 02 03 04 05 06 07 08
C/I ratio C/I ratio according to IFRS
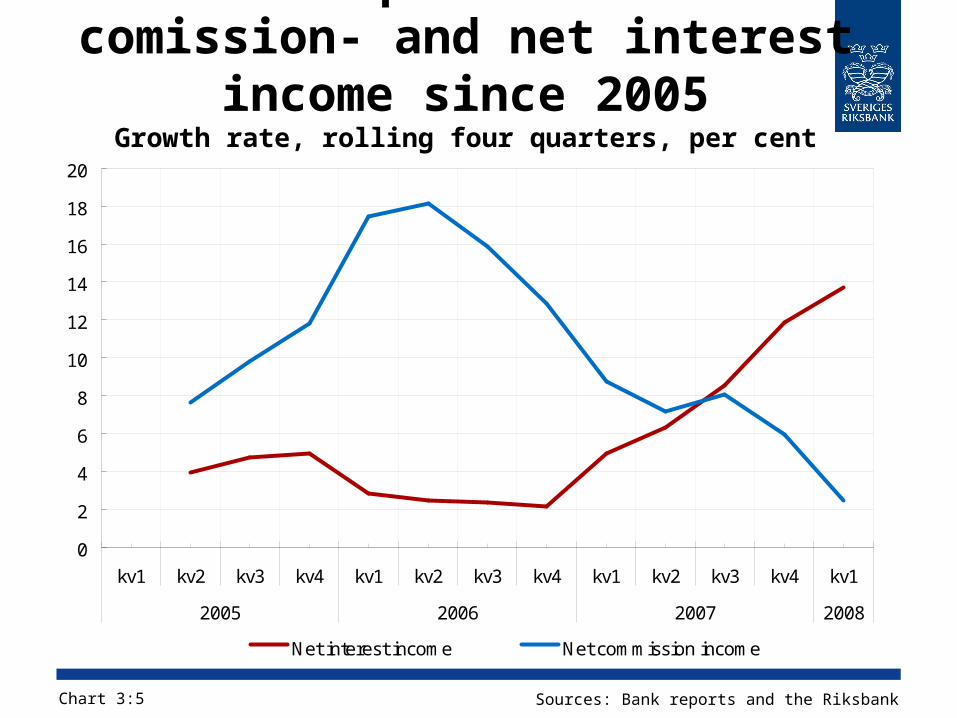
Development of net comission- and net interest
income since 2005Growth rate, rolling four quarters, per cent
Chart 3:5 Sources: Bank reports and the Riksbank
0
2
4
6
8
10
12
14
16
18
20
kv1 kv2 kv3 kv4 kv1 kv2 kv3 kv4 kv1 kv2 kv3 kv4 kv1
2005 2006 2007 2008
Net interest income Net commission income
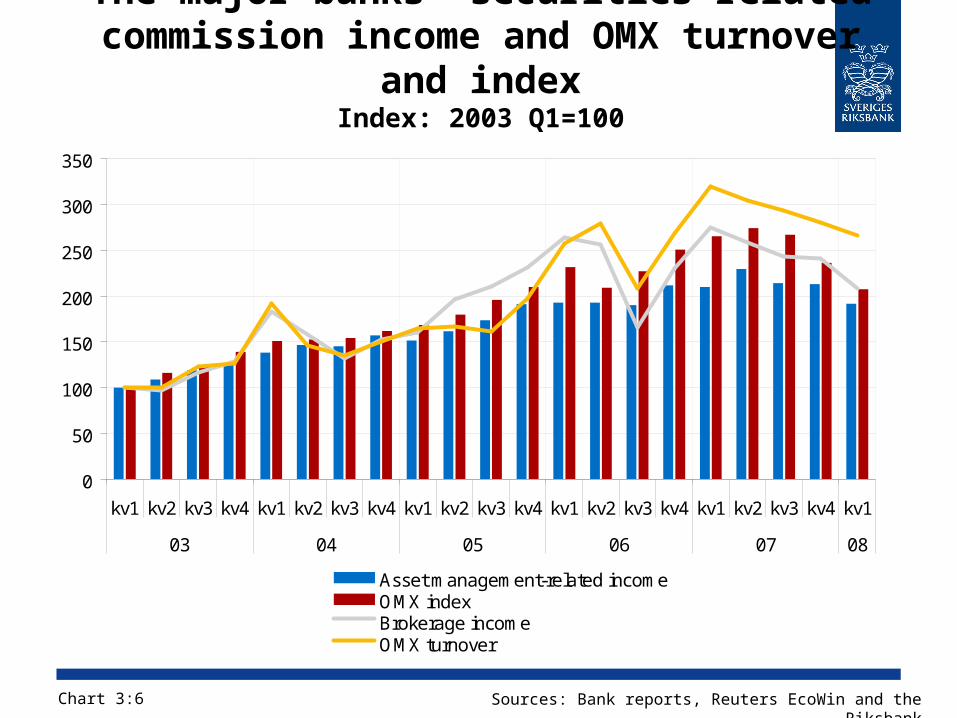
The major banks’ securities-related commission income and OMX turnover
and indexIndex: 2003 Q1=100
Chart 3:6 Sources: Bank reports, Reuters EcoWin and the Riksbank
0
50
100
150
200
250
300
350
kv1 kv2 kv3 kv4 kv1 kv2 kv3 kv4 kv1 kv2 kv3 kv4 kv1 kv2 kv3 kv4 kv1 kv2 kv3 kv4 kv1
03 04 05 06 07 08
Asset management-related incomeOMX indexBrokerage incomeOMX turnover
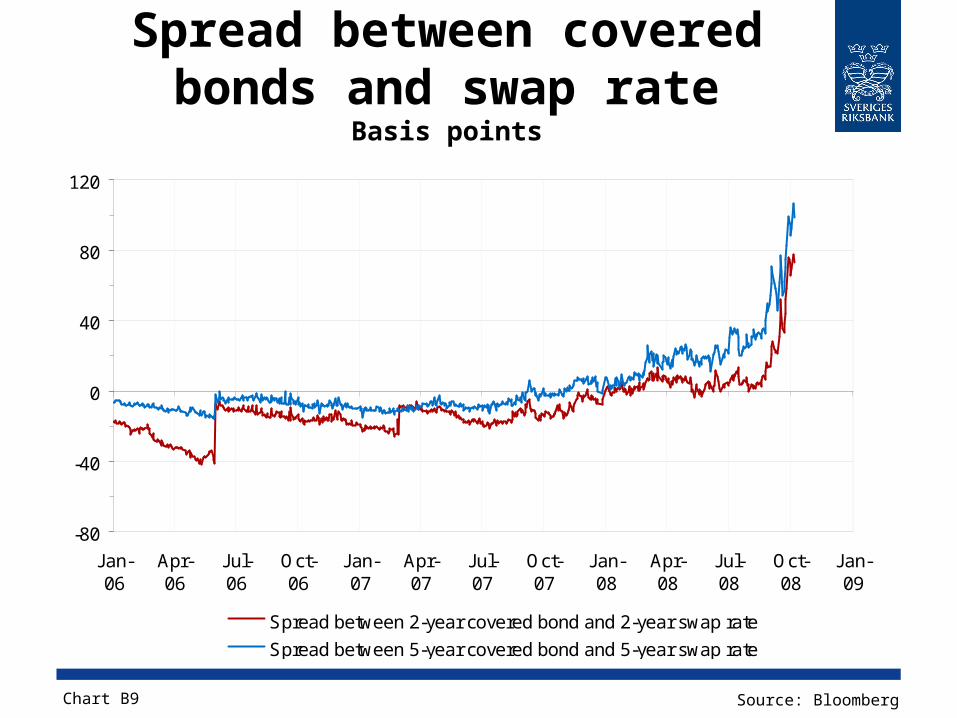
Spread between covered bonds and swap rate
Basis points
Chart B9 Source: Bloomberg
-80
-40
0
40
80
120
Jan-06
Apr-06
Jul-06
Oct-06
Jan-07
Apr-07
Jul-07
Oct-07
Jan-08
Apr-08
Jul-08
Oct-08
Jan-09
Spread between 2-year covered bond and 2-year swap rate
Spread between 5-year covered bond and 5-year swap rate
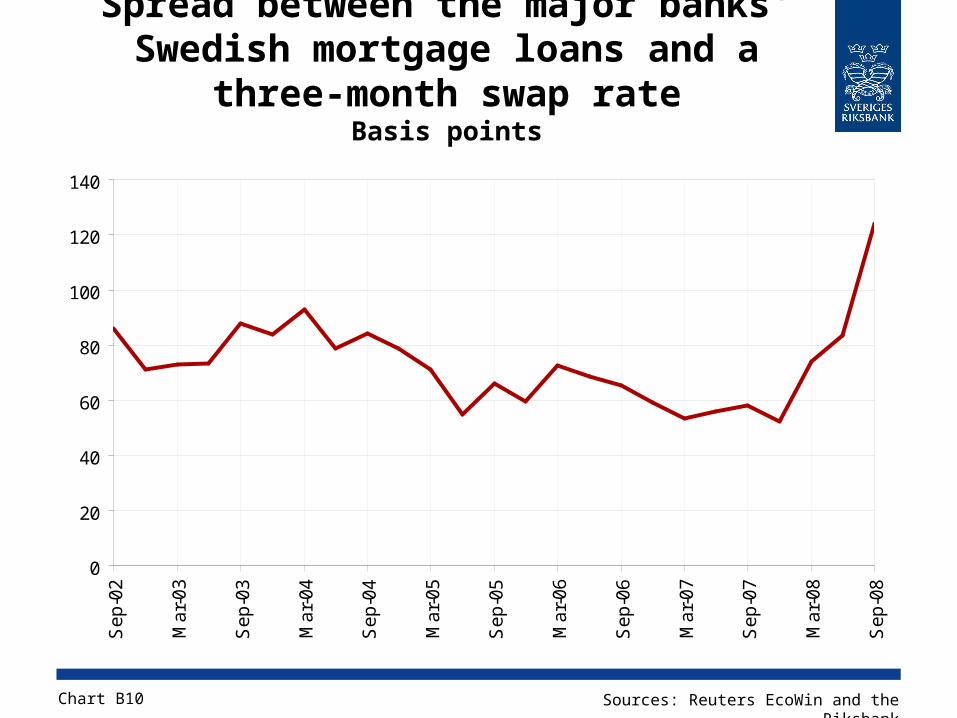
Spread between the major banks' Swedish mortgage loans and a
three-month swap rateBasis points
Chart B10 Sources: Reuters EcoWin and the Riksbank
0
20
40
60
80
100
120
140
Se
p-0
2
Ma
r-0
3
Se
p-0
3
Ma
r-0
4
Se
p-0
4
Ma
r-0
5
Se
p-0
5
Ma
r-0
6
Se
p-0
6
Ma
r-0
7
Se
p-0
7
Ma
r-0
8
Se
p-0
8
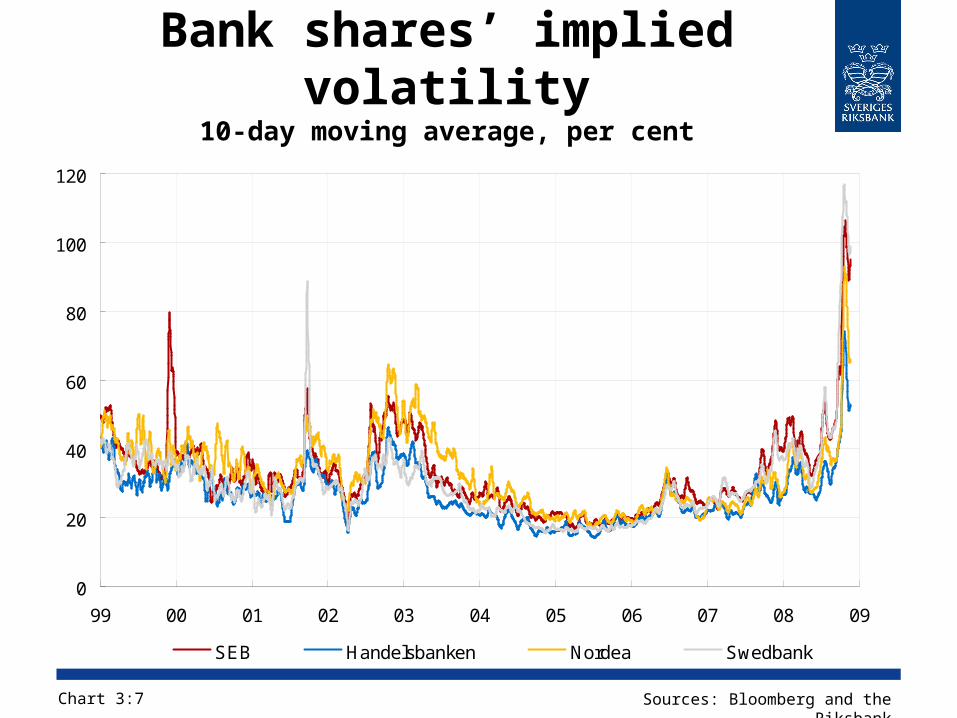
Bank shares’ implied volatility
10-day moving average, per cent
Chart 3:7 Sources: Bloomberg and the Riksbank
0
20
40
60
80
100
120
99 00 01 02 03 04 05 06 07 08 09
SEB Handelsbanken Nordea Swedbank
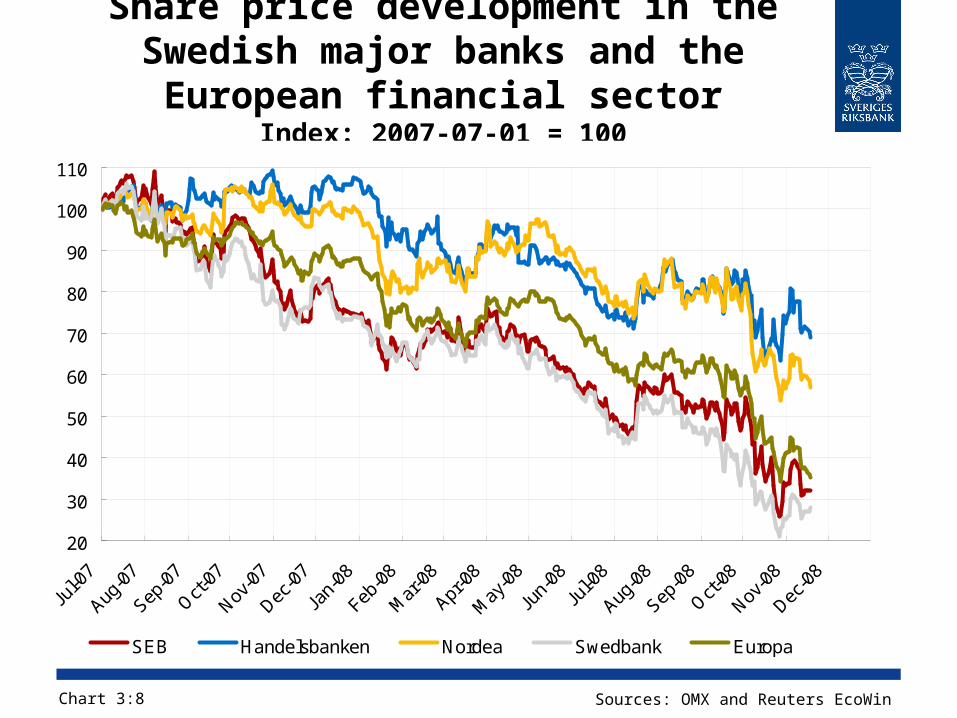
Share price development in the Swedish major banks and the
European financial sectorIndex: 2007-07-01 = 100
Chart 3:8 Sources: OMX and Reuters EcoWin
20
30
40
50
60
70
80
90
100
110
Jul-0
7
Aug-0
7
Sep-0
7
Oct-07
Nov-0
7
Dec-0
7
Jan-
08
Feb-0
8
Mar
-08
Apr-0
8
May
-08
Jun-
08
Jul-0
8
Aug-0
8
Sep-0
8
Oct-08
Nov-0
8
Dec-0
8
SEB Handelsbanken Nordea Swedbank Europa
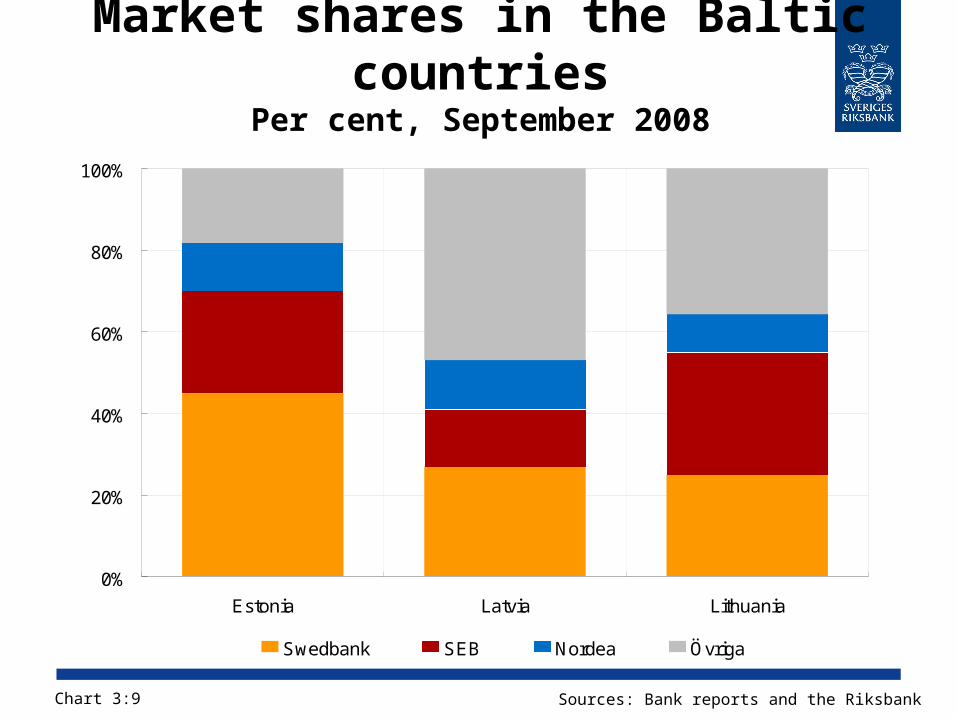
Market shares in the Baltic countries
Per cent, September 2008
Chart 3:9 Sources: Bank reports and the Riksbank
0%
20%
40%
60%
80%
100%
Estonia Latvia Lithuania
Swedbank SEB Nordea Övriga
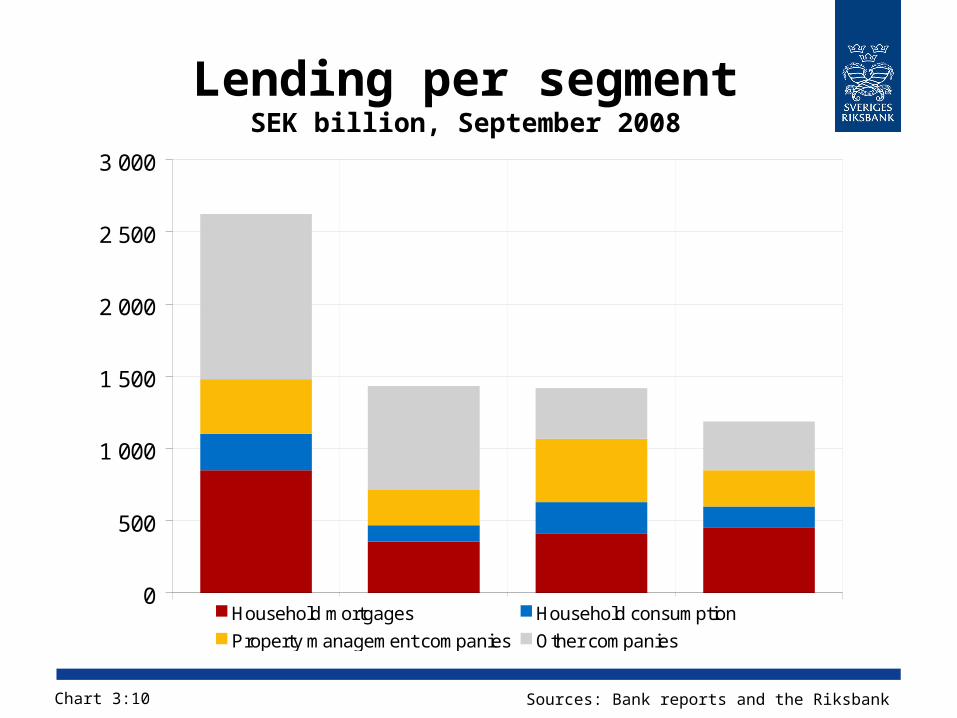
Lending per segmentSEK billion, September 2008
Chart 3:10 Sources: Bank reports and the Riksbank
0
500
1 000
1 500
2 000
2 500
3 000
Nordea SEB Handelsbanken SwedbankHousehold mortgages Household consumption
Property management companies Other companies
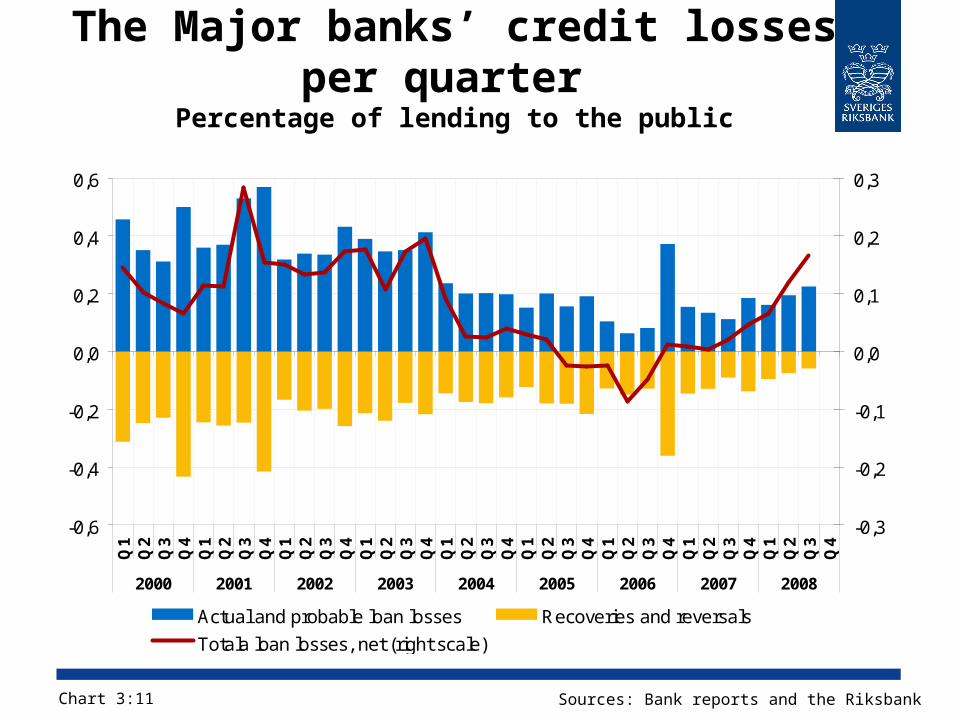
The Major banks’ credit losses per quarter
Percentage of lending to the public
Chart 3:11 Sources: Bank reports and the Riksbank
-0,6
-0,4
-0,2
0,0
0,2
0,4
0,6
Q1
Q2
Q3
Q4
Q1
Q2
Q3
Q4
Q1
Q2
Q3
Q4
Q1
Q2
Q3
Q4
Q1
Q2
Q3
Q4
Q1
Q2
Q3
Q4
Q1
Q2
Q3
Q4
Q1
Q2
Q3
Q4
Q1
Q2
Q3
Q4
2000 2001 2002 2003 2004 2005 2006 2007 2008
-0,3
-0,2
-0,1
0,0
0,1
0,2
0,3
Actual and probable loan losses Recoveries and reversals
Totala loan losses, net (right scale)
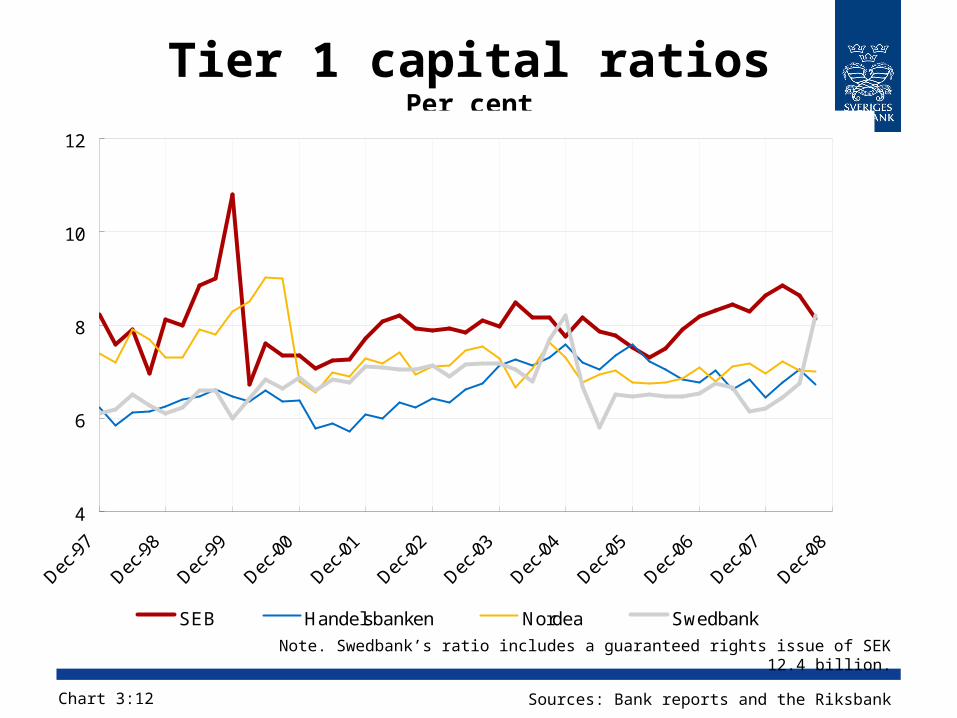
Tier 1 capital ratiosPer cent
Chart 3:12 Sources: Bank reports and the Riksbank
Note. Swedbank’s ratio includes a guaranteed rights issue of SEK 12.4 billion.
4
6
8
10
12
Dec-9
7
Dec-9
8
Dec-9
9
Dec-0
0
Dec-0
1
Dec-0
2
Dec-0
3
Dec-0
4
Dec-0
5
Dec-0
6
Dec-0
7
Dec-0
8
SEB Handelsbanken Nordea Swedbank
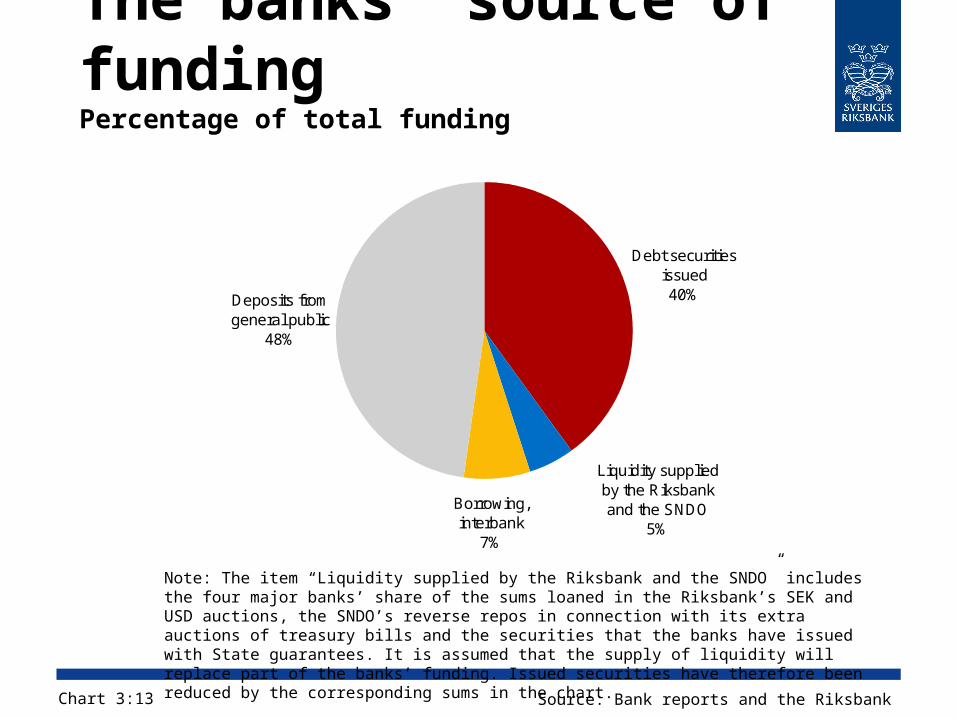
The banks' source of fundingPercentage of total funding
Chart 3:13 Source: Bank reports and the Riksbank
Note: The item “Liquidity supplied by the Riksbank and the SNDO” includes the four major banks’ share of the sums loaned in the Riksbank’s SEK and USD auctions, the SNDO’s reverse repos in connection with its extra auctions of treasury bills and the securities that the banks have issued with State guarantees. It is assumed that the supply of liquidity will replace part of the banks’ funding. Issued securities have therefore been reduced by the corresponding sums in the chart.
Debt securities issued40%Deposits from
general public48%
Borrowing, interbank
7%
Liquidity supplied by the Riksbank and the SNDO
5%
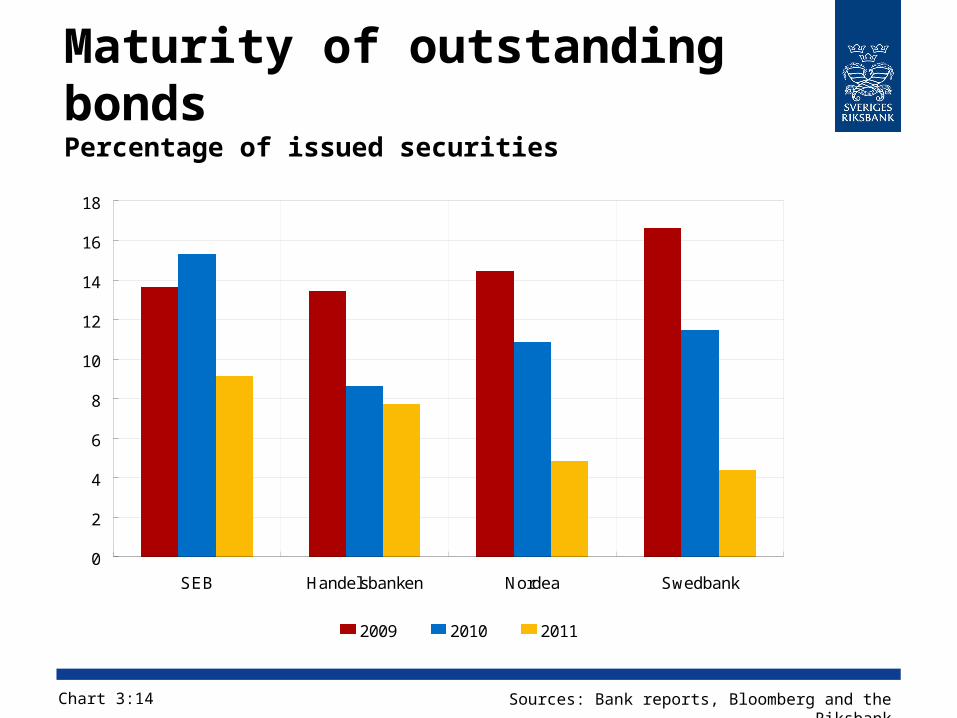
Maturity of outstanding bondsPercentage of issued securities
Chart 3:14 Sources: Bank reports, Bloomberg and the Riksbank
0
2
4
6
8
10
12
14
16
18
SEB Handelsbanken Nordea Swedbank
2009 2010 2011
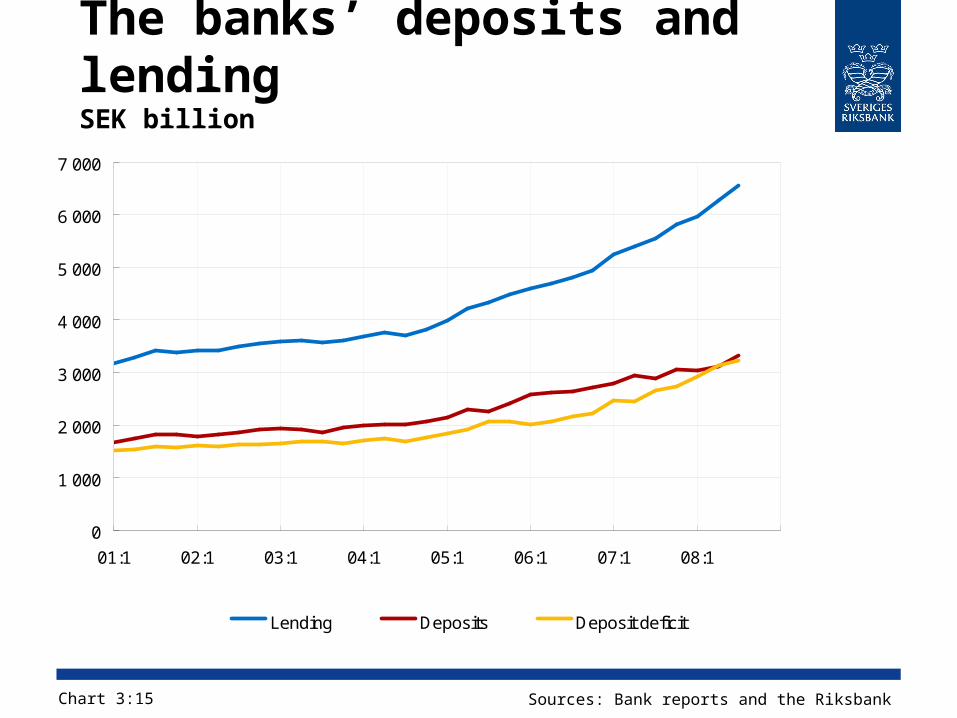
The banks’ deposits and lendingSEK billion
Chart 3:15 Sources: Bank reports and the Riksbank
0
1 000
2 000
3 000
4 000
5 000
6 000
7 000
01:1 02:1 03:1 04:1 05:1 06:1 07:1 08:1
Lending Deposits Deposit deficit
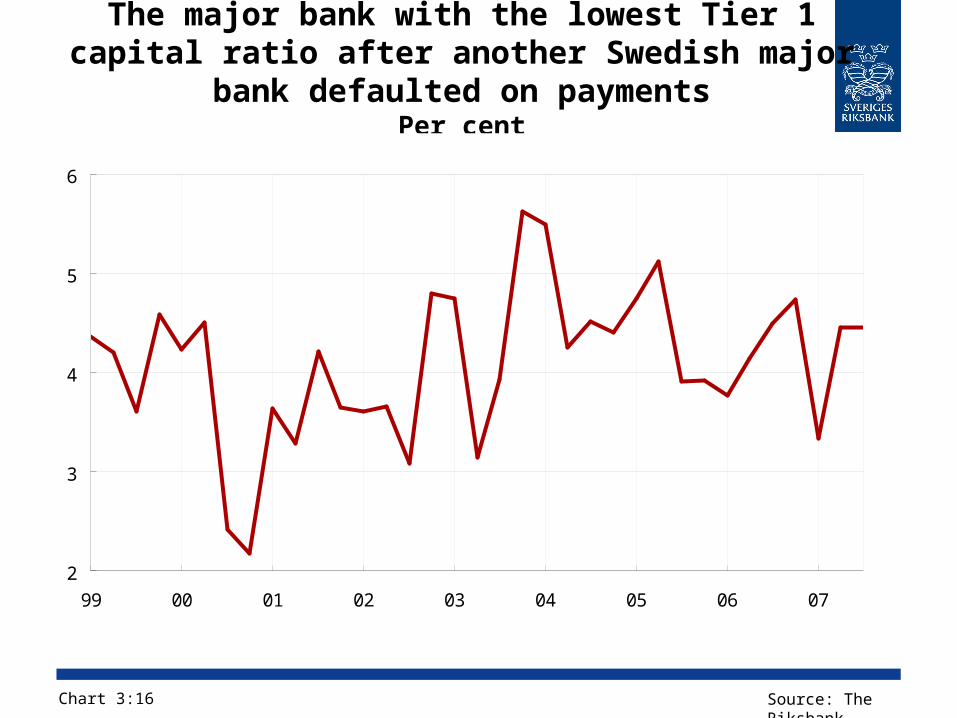
The major bank with the lowest Tier 1 capital ratio after another Swedish major
bank defaulted on paymentsPer cent
Chart 3:16 Source: The Riksbank
2
3
4
5
6
99 00 01 02 03 04 05 06 07
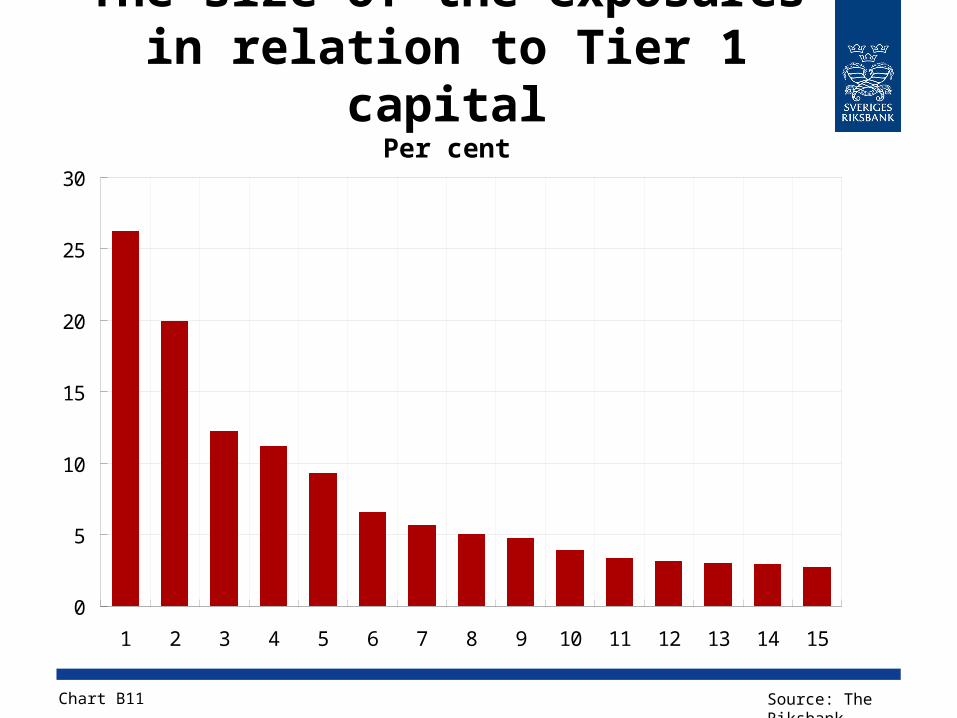
The size of the exposures in relation to Tier 1 capital
Per cent
Chart B11
0
5
10
15
20
25
30
1 2 3 4 5 6 7 8 9 10 11 12 13 14 15
Source: The Riksbank
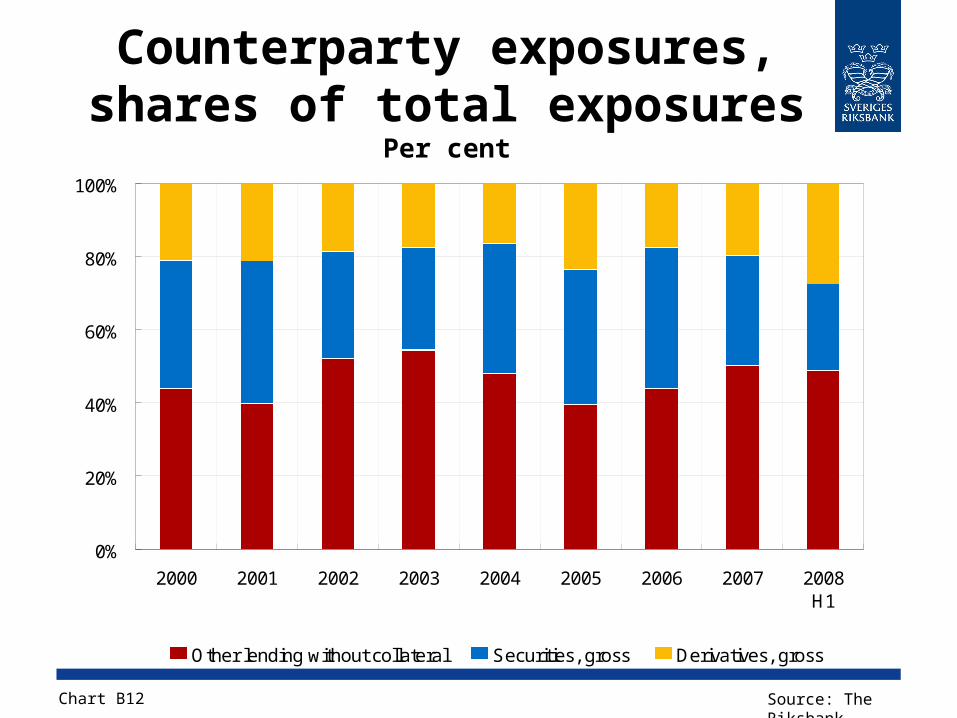
Counterparty exposures, shares of total exposures
Per cent
Chart B12 Source: The Riksbank
0%
20%
40%
60%
80%
100%
2000 2001 2002 2003 2004 2005 2006 2007 2008H1
Other lending without collateral Securities, gross Derivatives, gross
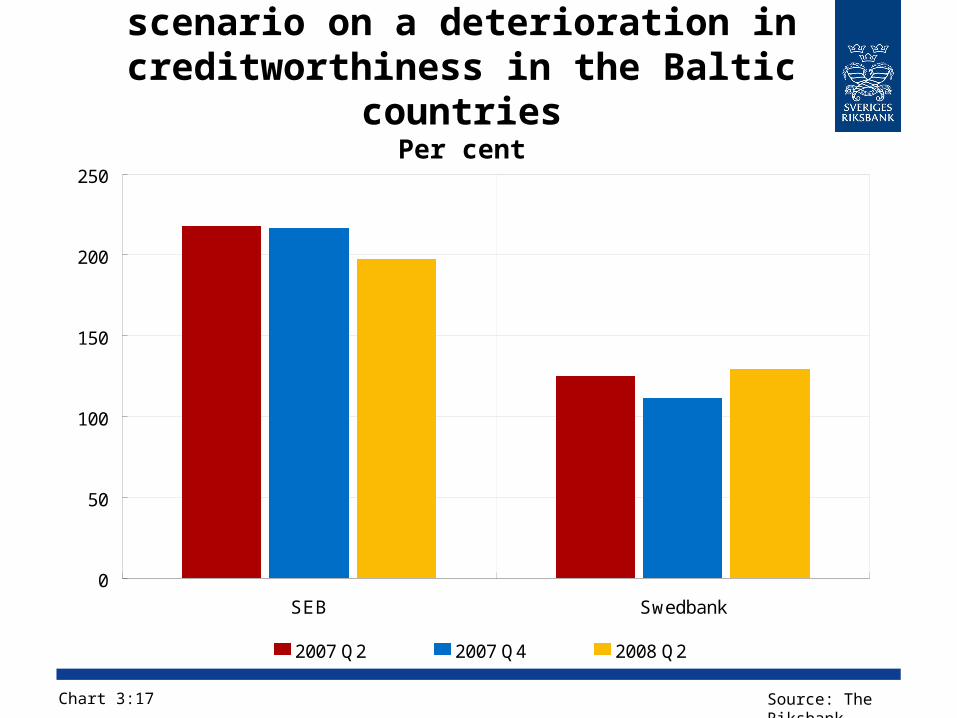
SEB and Swedbank’s credit risk cover, year 3, according to the scenario on a deterioration in creditworthiness in
the Baltic countriesPer cent
Chart 3:17
0
50
100
150
200
250
SEB Swedbank
2007 Q2 2007 Q4 2008 Q2
Source: The Riksbank
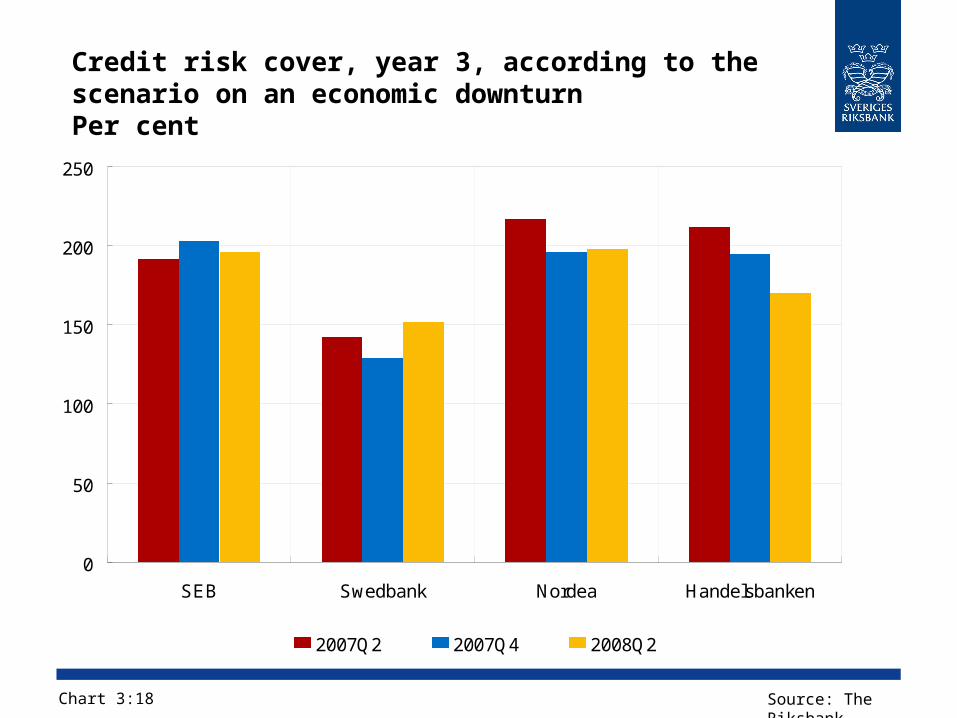
Credit risk cover, year 3, according to the scenario on an economic downturnPer cent
Chart 3:18
0
50
100
150
200
250
SEB Swedbank Nordea Handelsbanken
2007Q2 2007Q4 2008Q2
Source: The Riksbank
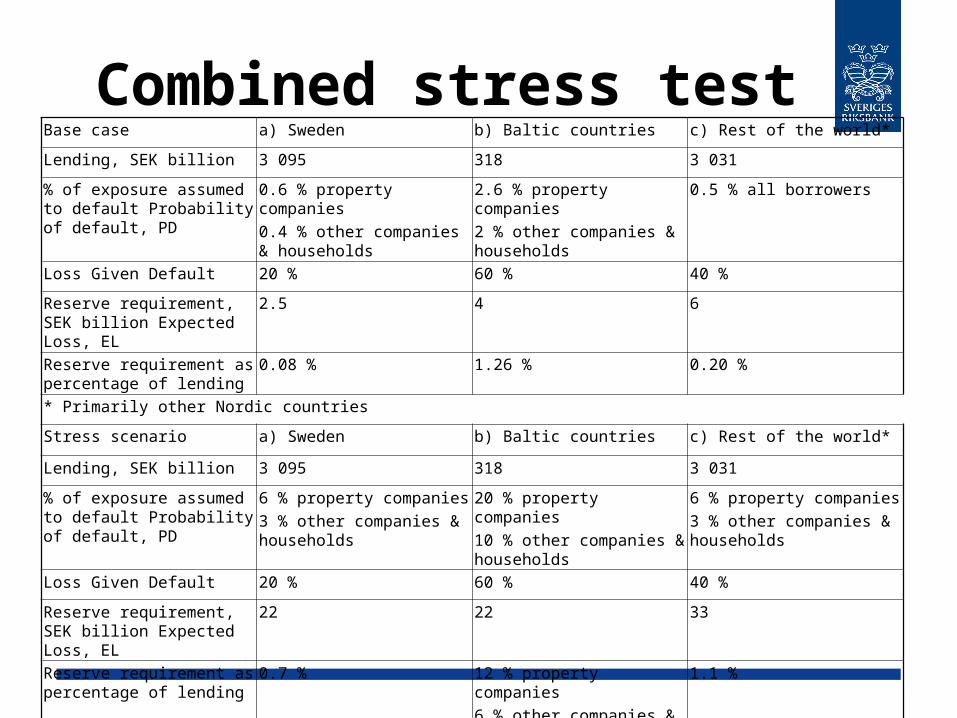
Combined stress testBase case a) Sweden b) Baltic countries c) Rest of the world*
Lending, SEK billion 3 095 318 3 031
% of exposure assumed to default Probability of default, PD
0.6 % property companies0.4 % other companies & households
2.6 % property companies2 % other companies & households
0.5 % all borrowers
Loss Given Default 20 % 60 % 40 %
Reserve requirement, SEK billion Expected Loss, EL
2.5 4 6
Reserve requirement as percentage of lending
0.08 % 1.26 % 0.20 %
* Primarily other Nordic countries
Stress scenario a) Sweden b) Baltic countries c) Rest of the world*
Lending, SEK billion 3 095 318 3 031
% of exposure assumed to default Probability of default, PD
6 % property companies3 % other companies & households
20 % property companies10 % other companies & households
6 % property companies3 % other companies & households
Loss Given Default 20 % 60 % 40 %
Reserve requirement, SEK billion Expected Loss, EL
22 22 33
Reserve requirement as percentage of lending
0.7 % 12 % property companies6 % other companies & households
1.1 %
* Primarily other Nordic countries
Combined stress test – results
Base case a) Sweden b) Baltic countries c) Rest of the world*
a) Sweden a) 22
b) Baltic countries a)+b)44
b)22
C) Rest of the world a)+c)55
b)+c)55
c)33
Combined scenario, a)+b)+c)77* Primarily other Nordic countries
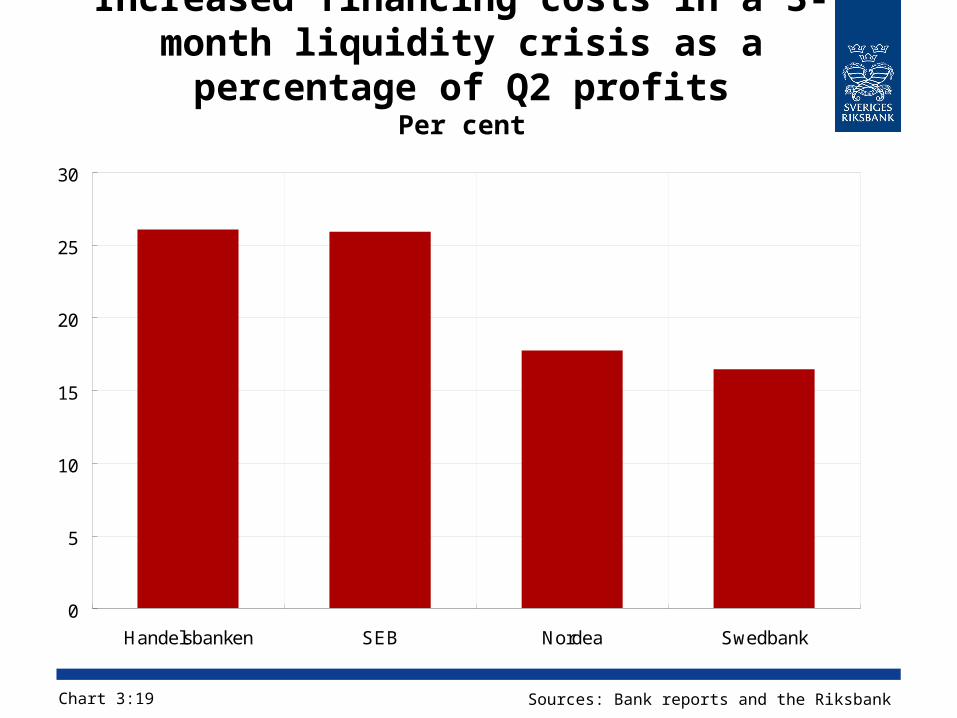
Increased financing costs in a 3-month liquidity crisis as a percentage of Q2
profitsPer cent
Chart 3:19 Sources: Bank reports and the Riksbank
0
5
10
15
20
25
30
Handelsbanken SEB Nordea Swedbank
EXTRA
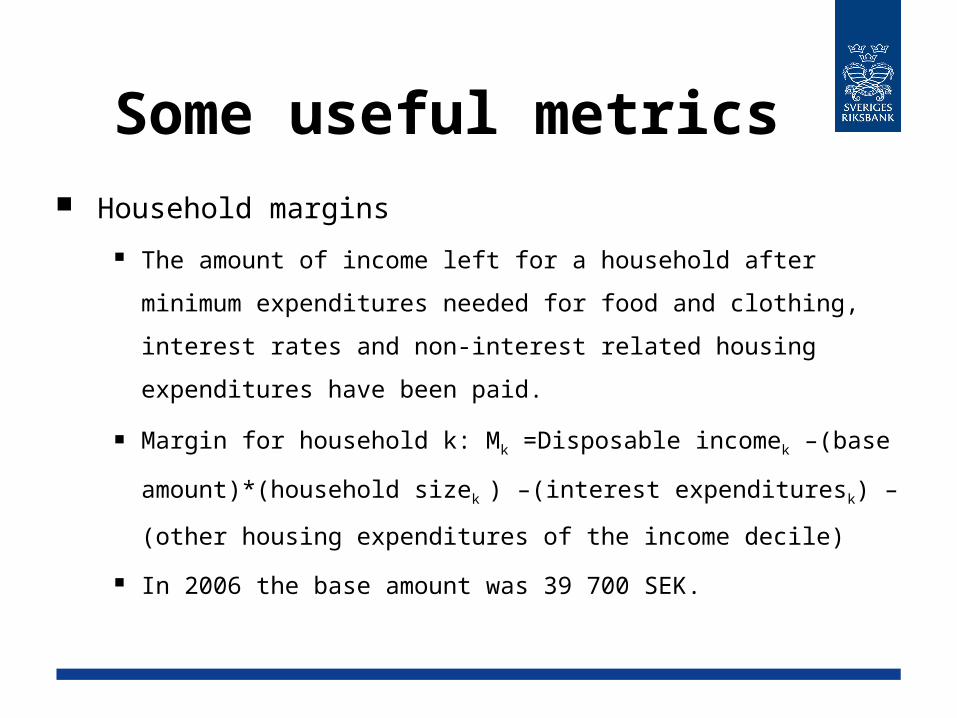
Some useful metrics Household margins
The amount of income left for a household after
minimum expenditures needed for food and clothing,
interest rates and non-interest related housing
expenditures have been paid.
Margin for household k: Mk =Disposable incomek –(base
amount)*(household sizek ) –(interest expendituresk) –
(other housing expenditures of the income decile)
In 2006 the base amount was 39 700 SEK.
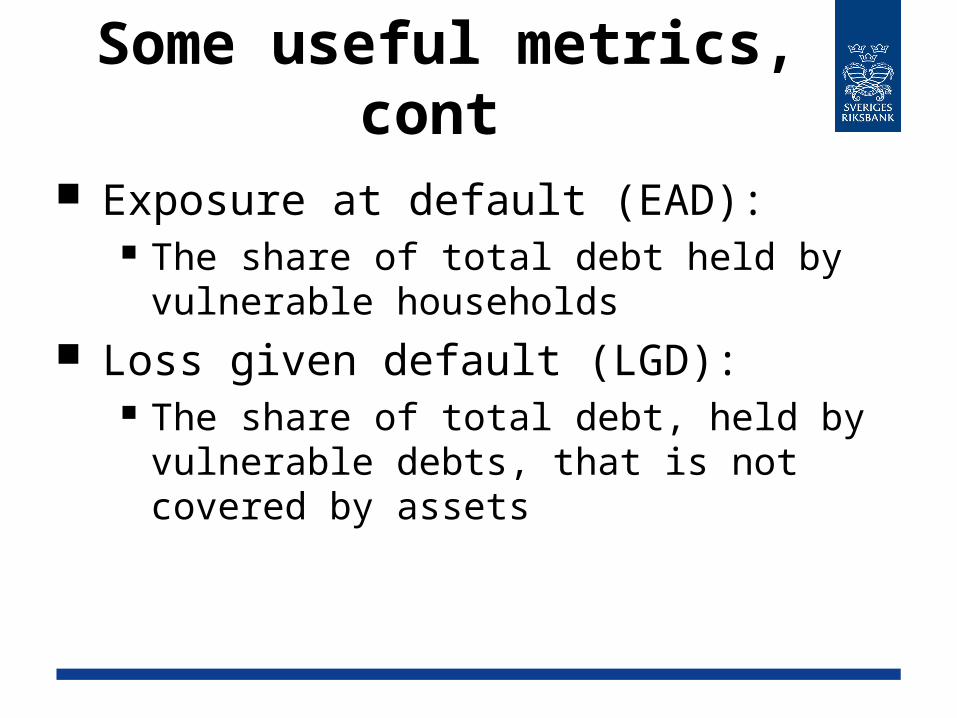
Some useful metrics, cont
Exposure at default (EAD): The share of total debt held by
vulnerable households Loss given default (LGD):
The share of total debt, held by vulnerable debts, that is not covered by assets
Related Documents


