Advances in Management & Applied Economics, vol. 3, no.4, 2013, 217-234 ISSN: 1792-7544 (print version), 1792-7552(online) Scienpress Ltd, 2013 Financial Indicators of Steady Success in Manufacturing Companies: Research on Big Manufacturing Companies in Turkey Cengiz Erdamar 1 , Burcu Adiloğlu 2 and Tuğba Gürsoy 3 Abstract Financial indicators (ratios) are calculated from the data found in basic financial statements. Balance sheets, income statements and cash flow statements are used in making different analyses for different information users. These indicators can be used to make inferences about a company's financial condition and its operations and attractiveness as an investment. They also can be used to analyze trends and compare companies’ financial performance and situation to other firms. This study empirically examines the common and distinctive financial indicators of steady and unsteady successful big manufacturing companies in Turkey by using data mining methodology. In this framework, the variables that affect the success of the company are identified by using logistic regression analysis. Then the differential values of the indicators are identified by using decision trees. Decision tree analysis is used for checking the logistic regression analysis results. As a result of different tries, the most appropriate decision tree algorithm, C&RT (Classification and Regression Trees) has been selected. According to logistic regression analysis, current ratio, quick ratio, debt ratio, short term debt/total debts, inventory turnover ratio, CFFO/total assets and CFFF/CFFI variables are found to be significant at the 95% confidence level. The results also reveal that quick ratio, debt ratio, short term debt/total debts and inventory turnover ratio variables are found to be distinctive financial indicators for successful companies by using decision trees. JEL classification number: M41 Keywords: Financial ratios, Data mining, Decision trees, Successful companies, Turkey 1 Istanbul University School of Business, Accounting Department. 2 Istanbul University School of Business, Accounting Department. Corresponding author. 3 Istanbul University School of Business, Quantative Methods Department. Article Info: Received : April 12, 2013. Revised : May 9, 2013. Published online : July 1, 2013

Welcome message from author
This document is posted to help you gain knowledge. Please leave a comment to let me know what you think about it! Share it to your friends and learn new things together.
Transcript

Advances in Management & Applied Economics, vol. 3, no.4, 2013, 217-234
ISSN: 1792-7544 (print version), 1792-7552(online)
Scienpress Ltd, 2013
Financial Indicators of Steady Success in Manufacturing
Companies: Research on Big Manufacturing Companies
in Turkey
Cengiz Erdamar1, Burcu Adiloğlu
2 and
Tuğba Gürsoy
3
Abstract
Financial indicators (ratios) are calculated from the data found in basic financial
statements. Balance sheets, income statements and cash flow statements are used in
making different analyses for different information users. These indicators can be used to
make inferences about a company's financial condition and its operations and
attractiveness as an investment. They also can be used to analyze trends and compare
companies’ financial performance and situation to other firms. This study empirically
examines the common and distinctive financial indicators of steady and unsteady
successful big manufacturing companies in Turkey by using data mining methodology. In
this framework, the variables that affect the success of the company are identified by
using logistic regression analysis. Then the differential values of the indicators are
identified by using decision trees. Decision tree analysis is used for checking the logistic
regression analysis results. As a result of different tries, the most appropriate decision tree
algorithm, C&RT (Classification and Regression Trees) has been selected. According to
logistic regression analysis, current ratio, quick ratio, debt ratio, short term debt/total
debts, inventory turnover ratio, CFFO/total assets and CFFF/CFFI variables are found to
be significant at the 95% confidence level. The results also reveal that quick ratio, debt
ratio, short term debt/total debts and inventory turnover ratio variables are found to be
distinctive financial indicators for successful companies by using decision trees.
JEL classification number: M41
Keywords: Financial ratios, Data mining, Decision trees, Successful companies, Turkey
1Istanbul University School of Business, Accounting Department. 2Istanbul University School of Business, Accounting Department. Corresponding author. 3Istanbul University School of Business, Quantative Methods Department.
Article Info: Received : April 12, 2013. Revised : May 9, 2013.
Published online : July 1, 2013

218 Cengiz Erdamar, Burcu Adiloğlu and Tuğba Gürsoy
1 Introduction
General purpose financial statements are intended to meet the needs of users who are not
in a position to require an entity to prepare reports tailored to their particular information
needs. (IAS 1) To fulfill this task, accounting departments have assumed the function of
preparation and interpretation of financial statements. The objective of financial
statements is to provide information in a structured representation about the financial
position, financial performance and cash flows of an entity that is useful to a wide range
of users in making economic decisions. Financial statements also show the results of the
management’s stewardship of the resources entrusted to it [1].
Financial ratio analysis is the calculation and comparison of ratios that are derived from
the information in a company's financial statements. These ratios can be used to make
inferences about a company's financial condition, its operations and attractiveness as an
investment. Financial ratios can be also used to analyze trends and compare companies’
financial performance and situation to other firms.
A financial analysis assists in identifying the major strengths and weaknesses of a
business enterprise. It indicates whether a firm has enough cash to meet obligations, a
reasonable accounts receivable collection period, an efficient inventory policy
management policy, sufficient plant, property, and equipment and an adequate capital
structure. All of them are necessary if the firm is to achieve the goal of maximizing
shareholder wealth. Financial analysis can be also used to assess a firm’s viability as an
ongoing enterprise and determine whether a satisfactory return is being earned for the
risks taken [2].
The basic expectation of all stakeholders is a steady successful company. With the results
of this study, stakeholders can observe the financial structure of these companies and can
identify their policies and make decisions.
This study empirically examines the common and distinctive financial indicators of steady
and unsteady successful big manufacturing companies in Turkey by using data mining
methodology.
Several studies have been and are still being realized in the area of financial ratios and
data mining separately. However, there was no study found in the existing literature that
combines these two areas together. This will be the first study in Turkey about financial
ratios using data mining. Therefore, the study is expected to contribute to the literature on
accounting ratios and data mining.
This remainder of this study is organized in three sections. In Section 2, the data set,
variables employed, research design and methodology are discussed. The empirical
findings are presented in Section 3, and Section 4 offers the study conclusions.
2 Data Set and Methodology
To examine the common and distinctive financial indicators of steady and unsteady
successful big manufacturing companies in Turkey, this section explains the sample size,
data set and variables employed, research design and methodology of the study.
Financial Indicators of Steady Success in Manufacturing Companies in Turkey 219
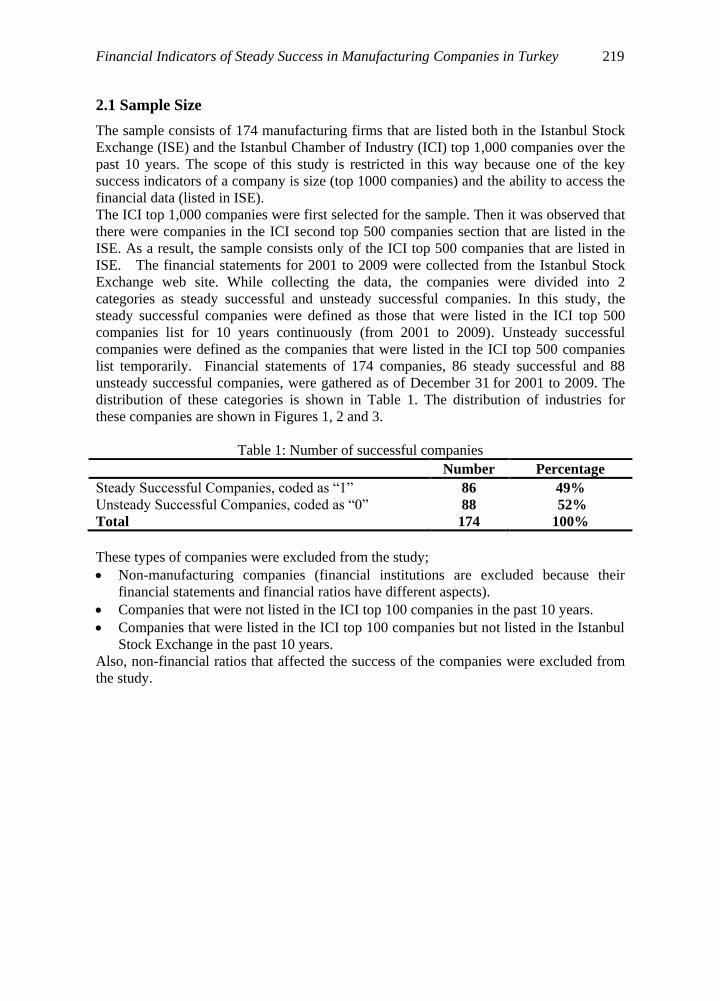
2.1 Sample Size
The sample consists of 174 manufacturing firms that are listed both in the Istanbul Stock
Exchange (ISE) and the Istanbul Chamber of Industry (ICI) top 1,000 companies over the
past 10 years. The scope of this study is restricted in this way because one of the key
success indicators of a company is size (top 1000 companies) and the ability to access the
financial data (listed in ISE).
The ICI top 1,000 companies were first selected for the sample. Then it was observed that
there were companies in the ICI second top 500 companies section that are listed in the
ISE. As a result, the sample consists only of the ICI top 500 companies that are listed in
ISE. The financial statements for 2001 to 2009 were collected from the Istanbul Stock
Exchange web site. While collecting the data, the companies were divided into 2
categories as steady successful and unsteady successful companies. In this study, the
steady successful companies were defined as those that were listed in the ICI top 500
companies list for 10 years continuously (from 2001 to 2009). Unsteady successful
companies were defined as the companies that were listed in the ICI top 500 companies
list temporarily. Financial statements of 174 companies, 86 steady successful and 88
unsteady successful companies, were gathered as of December 31 for 2001 to 2009. The
distribution of these categories is shown in Table 1. The distribution of industries for
these companies are shown in Figures 1, 2 and 3.
Table 1: Number of successful companies
Number Percentage
Steady Successful Companies, coded as “1” 86 49%
Unsteady Successful Companies, coded as “0” 88 52%
Total 174 100%
These types of companies were excluded from the study;
Non-manufacturing companies (financial institutions are excluded because their
financial statements and financial ratios have different aspects).
Companies that were not listed in the ICI top 100 companies in the past 10 years.
Companies that were listed in the ICI top 100 companies but not listed in the Istanbul
Stock Exchange in the past 10 years.
Also, non-financial ratios that affected the success of the companies were excluded from
the study.

220 Cengiz Erdamar, Burcu Adiloğlu and Tuğba Gürsoy
Figure 1: Percentage of steady successful companies by sector
Figure 2: Percentage of unsteady successful companies by sector
FOOD, BEVERAGE, TOBACCO
10%
TEXTILE, LEATHER10%
WOOD, PAPER, PRINTING
7%
CHEMICAL, PETROLEUM,
PLASTIC18%
NON-METALLIC MINERAL
25%
BASIC METAL9%
METAL PRODUCTS,
MACHINERY AND EQUIPMENT
16%
ELECTRICITY1%
TECHNOLOGY4%
STEADY SUCCESSFUL
FOOD, BEVERAGE, TOBACCO
15%
TEXTILE, LEATHER17%
WOOD, PAPER,
PRINTING15%CHEMICAL,
PETROLEUM, PLASTIC
17%
NON-METALLIC MINERAL
4%
BASIC METAL9%
METAL PRODUCTS,
MACHINERY AND EQUIPMENT
13%
ELECTRICITY4%
TECHNOLOGY6%
UNSTEADY SUCCESSFUL
Financial Indicators of Steady Success in Manufacturing Companies in Turkey 221
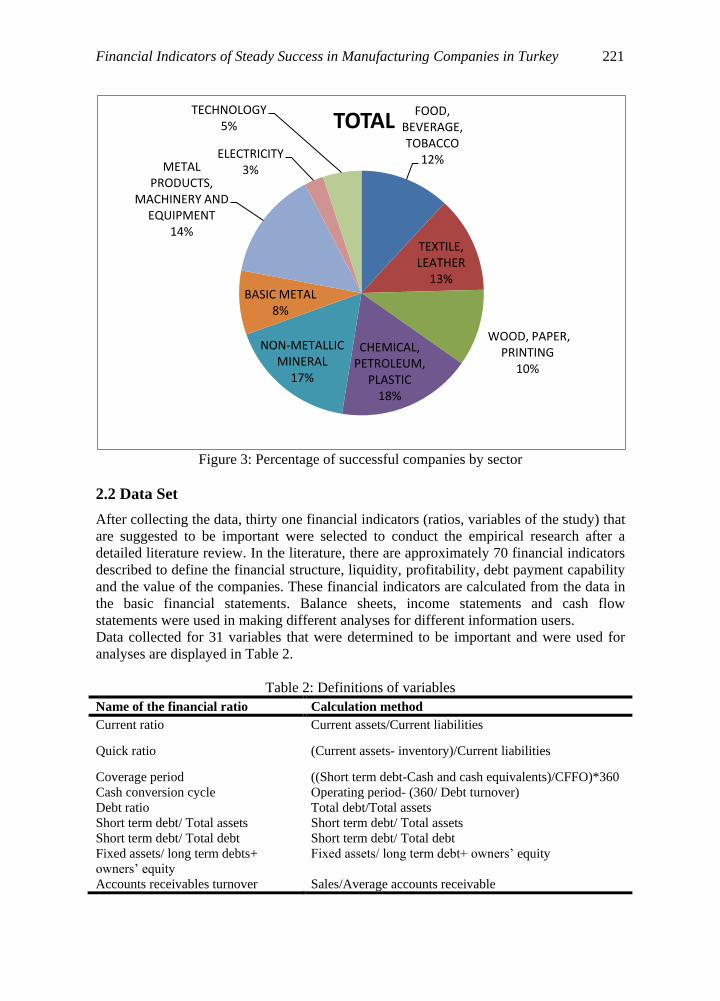
Figure 3: Percentage of successful companies by sector
2.2 Data Set
After collecting the data, thirty one financial indicators (ratios, variables of the study) that
are suggested to be important were selected to conduct the empirical research after a
detailed literature review. In the literature, there are approximately 70 financial indicators
described to define the financial structure, liquidity, profitability, debt payment capability
and the value of the companies. These financial indicators are calculated from the data in
the basic financial statements. Balance sheets, income statements and cash flow
statements were used in making different analyses for different information users.
Data collected for 31 variables that were determined to be important and were used for
analyses are displayed in Table 2.
Table 2: Definitions of variables
Name of the financial ratio Calculation method
Current ratio Current assets/Current liabilities
Quick ratio (Current assets- inventory)/Current liabilities
Coverage period ((Short term debt-Cash and cash equivalents)/CFFO)*360
Cash conversion cycle Operating period- (360/ Debt turnover)
Debt ratio Total debt/Total assets
Short term debt/ Total assets Short term debt/ Total assets
Short term debt/ Total debt Short term debt/ Total debt
Fixed assets/ long term debts+
owners’ equity
Fixed assets/ long term debt+ owners’ equity
Accounts receivables turnover Sales/Average accounts receivable
FOOD, BEVERAGE, TOBACCO
12%
TEXTILE, LEATHER
13%
WOOD, PAPER, PRINTING
10%
CHEMICAL, PETROLEUM,
PLASTIC18%
NON-METALLIC MINERAL
17%
BASIC METAL8%
METAL PRODUCTS,
MACHINERY AND EQUIPMENT
14%
ELECTRICITY3%
TECHNOLOGY5% TOTAL

222 Cengiz Erdamar, Burcu Adiloğlu and Tuğba Gürsoy
Inventory turnover Cost of goods sold/ Average inventory
Operating period (360/ Accounts receivables turnover) + (360/ Inventory
turnover)
Net working capital turnover Sales/ Average net working capital
Assets turnover Sales/ Average total assets
Debt turnover Cost of goods sold/ Average accounts payable
Return on equity (ROE) Net Income/ Equity
Return on assets (ROA) Net Income / Total Assets
EBIT/Total assets Earnings Before Interest and Taxes/Total assets
Gross profit margin Gross Profit / Sales
Operating income margin Earnings Before Interest and Taxes / Sales
Net income margin Net Income / Sales
Net income/ fixed asset Net income/ fixed asset
Operating income/Interest expense Operating income/Interest expense
CFFO/ total debt Cash flow from operations/ Total debt
CFFO/total sales Cash flow from operations/ Total sales
CFFO/total assets Cash flow from operations/ Total assets
CFFO/CFFF Cash flow from operations/ Cash flow from financing
activities
CFFF/CFFI Cash flow from operations/ Cash flow from financing
activities
Increase in sales (Sales t – Sales t-1)/ Sales t-1
Increase in net income (Net income t – Net income t-1)/ Net income t-1
Increase in owners’ equity (Owners’ equity t – Owners’ equity t-1)/ Owners’ equity t-1
Increase in assets (Assets t – Assets t-1)/ Assets t-1
After calculating each ratio for each company for 10 years, the data set (without
considering the missing data leading to missing observations), the sample consisted of 31
accounting ratios of 174 firms for 10 years leading to a sample size of 53,940, one of the
largest data sets used in tests on ISE firms. The average ratio for 10 years was calculated
for each ratio and each company. Then the empirical research was conducted.
To illustrate, a small portion of the data set coding is shown in Table 3, The “Success”
column represents the success of the company. If the company was steady successful, it
was coded as “1”; if it was unsteady it was coded s “0”.
Table 3: Data set

Financial Indicators of Steady Success in Manufacturing Companies in Turkey 223
2.3 Methodology
This study empirically examines the common and distinctive financial indicators of steady
and unsteady successful big manufacturing companies in Turkey by using data mining
methodology. The analysis was conducted using the SPSS Clementine program. In this
subsection, the methodology used in this study will be briefly explained.
2.3.1 Data mining
There is a huge amount of data stored in real-world databases, and this amount continues
to grow exponentially. This creates both an opportunity and a need for semi-automatic
and automatic methods that discover the knowledge hidden in such databases. If such
discovery activity is successful, discovered knowledge can be used to improve the
decision-making process of an organization. Data mining is the name often used to refer
to an interdisciplinary field that consists of using methods from several research areas to
extract knowledge from real-world databases [3].
Data mining deals with the discovery of hidden knowledge, unexpected patterns and new
rules from large databases. Data mining is not a single technique. Various different
techniques, some of which are listed below, are used for different purposes [4].
Statistical techniques
Visualization
Decision trees
Association rules
Neural networks
Genetic algorithms
In this study, since the dependent variable had two outcomes (“0” and “1”), logistic
regression was appropriate and applied for the analysis. Decision Trees Analysis was also
used for checking the logistic regression analysis results. As a result of different tries, the
most appropriate decision tree algorithm, C&RT (Classification and Regression Trees)
was selected.
2.3.2 Logistic Regression Analysis
The simple and multiple linear regression methods were used to model the relationship
between a quantitative response variable and one or more explanatory variables. A key
assumption for these models was that the deviations from the model fit are normally
distributed.
There are many important research topics for which the dependent variable is limited. For
example, voting, morbidity or mortality and participation data are not continuous or
distributed normally. Binary logistic regression is a type of regression analysis where the
dependent variable is a dummy variable: coded 0 or 1. The level 1 usually represents the
occurrence of an event of interest, often called a “Success”. A logistic regression model is
defined in terms of fitted values to be interpreted as probabilities that the event occurs in
different subpopulations [5].
Logistic regression has several advantages:
It is more robust: independent variables don't have to be normally distributed, or have
equal variance in each group.
It does not assume a linear relationship between the independent variables and
dependent variable.

224 Cengiz Erdamar, Burcu Adiloğlu and Tuğba Gürsoy
It may handle nonlinear effects.
Explicit interaction and power terms can be added.
Dependent variables need not be normally distributed.
There is no homogeneity of variance assumption.
Normally distributed error terms are not assumed.
It does not require that the independent variables be at intervals.
It does not require that the independent variables be unbounded.
The advantages of logistic regression come at a cost: it requires much more data to
achieve stable and meaningful results.
The statistical model for logistic regression is:
p
Log ( ) = β0 + β1x
1-p
where p is a binomial proportion and x is the explanatory variable. The parameters of the
logistic model are β0 and β1.
In standard regression, R (or R squared in particular) gives you an idea of how powerful
your equation is at predicting the variable of interest. An R close to 1 is a very strong
prediction, whereas a small R, closer to zero, indicates a weak relationship. There is no
direct equivalent of R for logistic regression.
However, for those who insist on an R value, statisticians have come up with several R-
like measures for logistic regression. They are not R itself, R has no meaning in logistic
regression. Some of the better known ones are:
• Cox and Snell's R-Square
• Pseudo-R-Square
• Hagle and Mitchell's Pseudo-R-Square
3 Empirical Findings
The data set was analyzed and the following results were obtained by using the SPSS
Clementine program. When the case processing summary in Table 4 is reviewed, it can be
seen that a total of 174 data were analyzed, with 6 missing data.
Table 4: Case processing summary (logistic regression )
N Marginal Percentage
Success 0.0 88 50.6%
1.0 86 49.4%
Valid 174 100.0%
Missing 6
Total 180
Subpopulation 174*
* The dependent variable has only one value observed in 174 (100.0%) subpopulations.
In logistic regression models, Cox-Snell and Nagelkerke R2 values show the correlation
between the dependent variable and independent variables.
Financial Indicators of Steady Success in Manufacturing Companies in Turkey 225
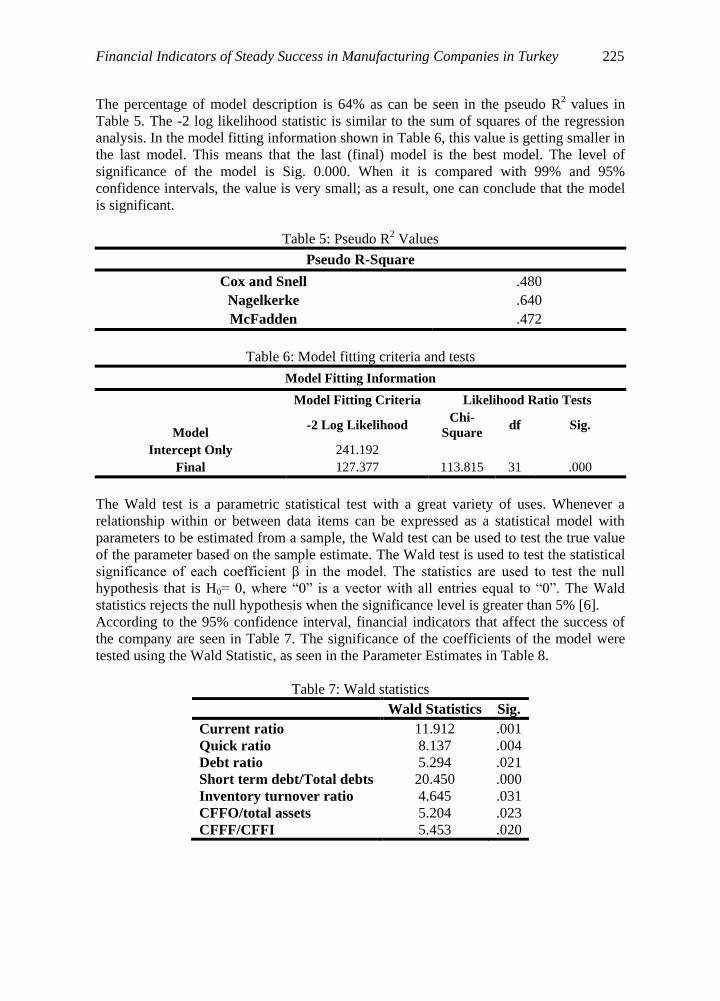
The percentage of model description is 64% as can be seen in the pseudo R2 values in
Table 5. The -2 log likelihood statistic is similar to the sum of squares of the regression
analysis. In the model fitting information shown in Table 6, this value is getting smaller in
the last model. This means that the last (final) model is the best model. The level of
significance of the model is Sig. 0.000. When it is compared with 99% and 95%
confidence intervals, the value is very small; as a result, one can conclude that the model
is significant.
Table 5: Pseudo R2 Values
Pseudo R-Square
Cox and Snell .480
Nagelkerke .640
McFadden .472
Table 6: Model fitting criteria and tests
Model Fitting Information
Model
Model Fitting Criteria Likelihood Ratio Tests
-2 Log Likelihood Chi-
Square df Sig.
Intercept Only 241.192
Final 127.377 113.815 31 .000
The Wald test is a parametric statistical test with a great variety of uses. Whenever a
relationship within or between data items can be expressed as a statistical model with
parameters to be estimated from a sample, the Wald test can be used to test the true value
of the parameter based on the sample estimate. The Wald test is used to test the statistical
significance of each coefficient β in the model. The statistics are used to test the null
hypothesis that is H0= 0, where “0” is a vector with all entries equal to “0”. The Wald
statistics rejects the null hypothesis when the significance level is greater than 5% [6].
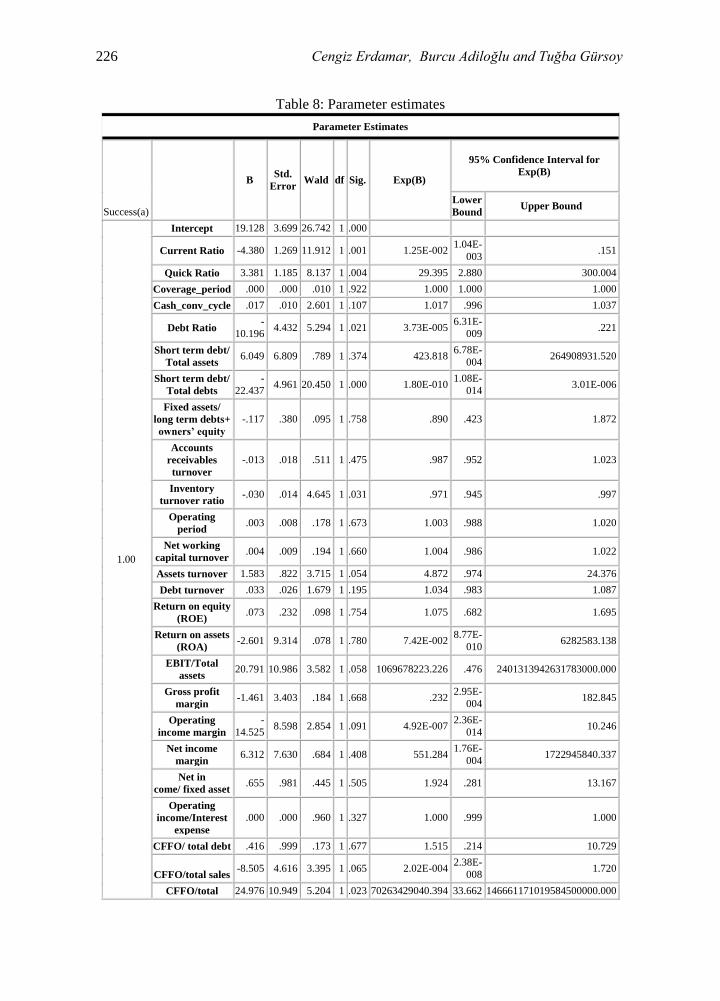
According to the 95% confidence interval, financial indicators that affect the success of
the company are seen in Table 7. The significance of the coefficients of the model were
tested using the Wald Statistic, as seen in the Parameter Estimates in Table 8.
Table 7: Wald statistics
Wald Statistics Sig.
Current ratio 11.912 .001
Quick ratio 8.137 .004
Debt ratio 5.294 .021
Short term debt/Total debts 20.450 .000
Inventory turnover ratio 4.645 .031
CFFO/total assets 5.204 .023
CFFF/CFFI 5.453 .020
226 Cengiz Erdamar, Burcu Adiloğlu and Tuğba Gürsoy
Table 8: Parameter estimates
Parameter Estimates
Success(a)
B Std.
Error Wald df Sig. Exp(B)
95% Confidence Interval for
Exp(B)
Lower
Bound Upper Bound
1.00
Intercept 19.128 3.699 26.742 1 .000
Current Ratio -4.380 1.269 11.912 1 .001 1.25E-002 1.04E-
003 .151
Quick Ratio 3.381 1.185 8.137 1 .004 29.395 2.880 300.004
Coverage_period .000 .000 .010 1 .922 1.000 1.000 1.000
Cash_conv_cycle .017 .010 2.601 1 .107 1.017 .996 1.037
Debt Ratio -
10.196 4.432 5.294 1 .021 3.73E-005
6.31E-
009 .221
Short term debt/
Total assets 6.049 6.809 .789 1 .374 423.818
6.78E-
004 264908931.520
Short term debt/
Total debts
-
22.437 4.961 20.450 1 .000 1.80E-010
1.08E-
014 3.01E-006
Fixed assets/
long term debts+
owners’ equity
-.117 .380 .095 1 .758 .890 .423 1.872
Accounts
receivables
turnover
-.013 .018 .511 1 .475 .987 .952 1.023
Inventory
turnover ratio -.030 .014 4.645 1 .031 .971 .945 .997
Operating
period .003 .008 .178 1 .673 1.003 .988 1.020
Net working
capital turnover .004 .009 .194 1 .660 1.004 .986 1.022
Assets turnover 1.583 .822 3.715 1 .054 4.872 .974 24.376
Debt turnover .033 .026 1.679 1 .195 1.034 .983 1.087
Return on equity
(ROE) .073 .232 .098 1 .754 1.075 .682 1.695
Return on assets
(ROA) -2.601 9.314 .078 1 .780 7.42E-002
8.77E-
010 6282583.138
EBIT/Total
assets 20.791 10.986 3.582 1 .058 1069678223.226 .476 2401313942631783000.000
Gross profit
margin -1.461 3.403 .184 1 .668 .232
2.95E-
004 182.845
Operating
income margin
-
14.525 8.598 2.854 1 .091 4.92E-007
2.36E-
014 10.246
Net income
margin 6.312 7.630 .684 1 .408 551.284
1.76E-
004 1722945840.337
Net in
come/ fixed asset .655 .981 .445 1 .505 1.924 .281 13.167
Operating
income/Interest
expense
.000 .000 .960 1 .327 1.000 .999 1.000
CFFO/ total debt .416 .999 .173 1 .677 1.515 .214 10.729
CFFO/total sales -8.505 4.616 3.395 1 .065 2.02E-004
2.38E-
008 1.720
CFFO/total 24.976 10.949 5.204 1 .023 70263429040.394 33.662 146661171019584500000.000

Financial Indicators of Steady Success in Manufacturing Companies in Turkey 227
Parameter Estimates
Success(a)
B Std.
Error Wald df Sig. Exp(B)
95% Confidence Interval for
Exp(B)
Lower
Bound Upper Bound
assets
CFFO/CFFF .001 .032 .002 1 .969 1.001 .940 1.067
CFFF/CFFI .142 .061 5.453 1 .020 1.153 1.023 1.299
Increase in sales -.063 .831 .006 1 .940 .939 .184 4.788
Increase in net
income -.019 .015 1.491 1 .222 .982 .953 1.011
Increase in
owners’ equity .101 .139 .534 1 .465 1.107 .843 1.452
Increase in
assets .412 .674 .373 1 .542 1.509 .403 5.659
a. The reference category is: .00.
3.1 Decision Trees
In this study, variables that affect the success of the company were identified by using
logistic regression analysis. Then the differential values of the indicators were identified
by using decision trees.
Classification is the process of finding a model that best describes and distinguishes data
classes or concepts, for the purpose of being able to use the model to predict the class of
objects whose class label is unknown. The derived model may be represented in various
forms, such as decision trees, IF-THEN rules, mathematical formulate or neural
networks. A decision tree is a flowchart-like tree structure, where each node denotes a test
on an attribute value. Each branch represents an outcome of the test, and tree leaves
represent classes or class distributions [7].
Decision trees are analytical tools to discover rules and relationships by systematically
breaking down and subdividing the information contained in data sets. Decision trees are
useful for problems in which the goal is to make broad categorical classifications or
predictions [8].
Decision tree methods are a good choice when the data mining task is classification of
records or prediction of outcomes. There are two main types of decision trees: [9]
Classification trees label records and assign them to the proper class. Classification trees
can also provide the confidence that the classification is correct.
Regression trees estimate the value of a target variable that affects numeric values.
Various decision tree algorithms such as CHAID, C4.5, CART and others produce trees
that differ from one another in the number of splits allowed at each level of the tree, how
those splits are chosen when the tree is built, and how the tree growth is limited to prevent
overfitting.
Among classification and regression trees, C&RT builds classification and regression
trees for predicting continuous dependent variables and categorical predictor variables.
The classic C&RT algorithm was popularized by Breiman, Friedman, Olshen and Stone.
In most general terms, the purpose of the analyses via tree-building algorithms is to
228 Cengiz Erdamar, Burcu Adiloğlu and Tuğba Gürsoy
determine a set of if-then logical (split) conditions that permit accurate prediction or
classification of cases. [10] (Classification and Regression Trees:
http://www.statsoft.com/textbook/classification-and-regression-trees/, 10.01.2012)
In most cases, the interpretation of results summarized in a tree is very simple. This
simplicity is useful not only for purposes of rapid classification of new observations. It is
much easier to evaluate just one or two logical conditions, than to compute classification
scores for each possible group, or predicted values, based on all predictors and using
possibly some complex nonlinear model equations). It can also often yield a much simpler
model for explaining why observations are classified or predicted in a particular manner.
SPSS Clementine and C&RT algorithm were used to analyze the data set. The aim of this
study was to determine financial ratios that affected 0-1 coded "Company Success
Condition”.
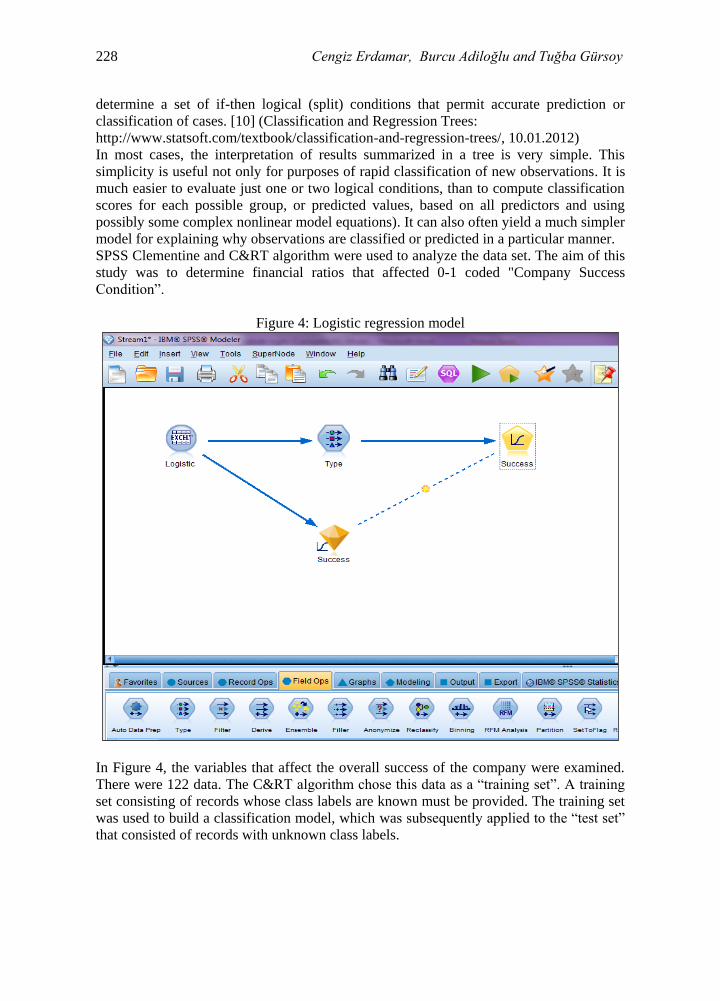
Figure 4: Logistic regression model
In Figure 4, the variables that affect the overall success of the company were examined.
There were 122 data. The C&RT algorithm chose this data as a “training set”. A training
set consisting of records whose class labels are known must be provided. The training set
was used to build a classification model, which was subsequently applied to the “test set”
that consisted of records with unknown class labels.
Financial Indicators of Steady Success in Manufacturing Companies in Turkey 229
Evaluation of the performance of a classification model is based on the counts of test
records correctly and incorrectly predicted by the model. These counts are tabulated in a
table known as a “confusion matrix”.
Although a confusion matrix provides the information needed to determine how well a
classification model performs, summarizing this information with a single number would
make it more convenient to compare the performance of different models. This can be
done using a performance metric such as “accuracy” [11].
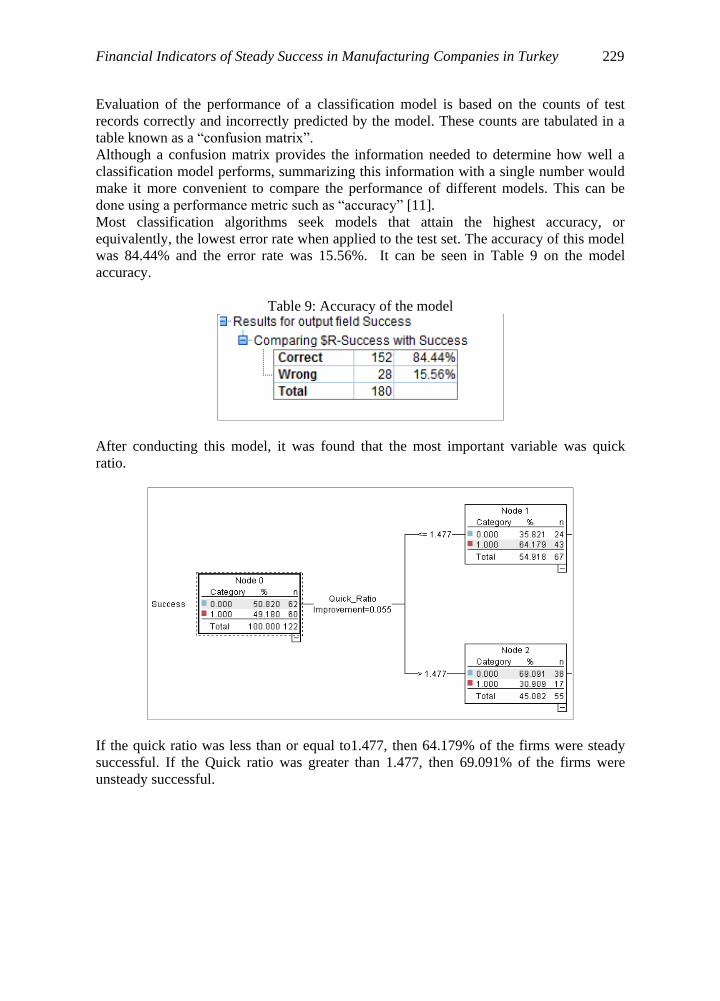
Most classification algorithms seek models that attain the highest accuracy, or
equivalently, the lowest error rate when applied to the test set. The accuracy of this model
was 84.44% and the error rate was 15.56%. It can be seen in Table 9 on the model
accuracy.
Table 9: Accuracy of the model
After conducting this model, it was found that the most important variable was quick
ratio.
If the quick ratio was less than or equal to1.477, then 64.179% of the firms were steady
successful. If the Quick ratio was greater than 1.477, then 69.091% of the firms were
unsteady successful.
230 Cengiz Erdamar, Burcu Adiloğlu and Tuğba Gürsoy
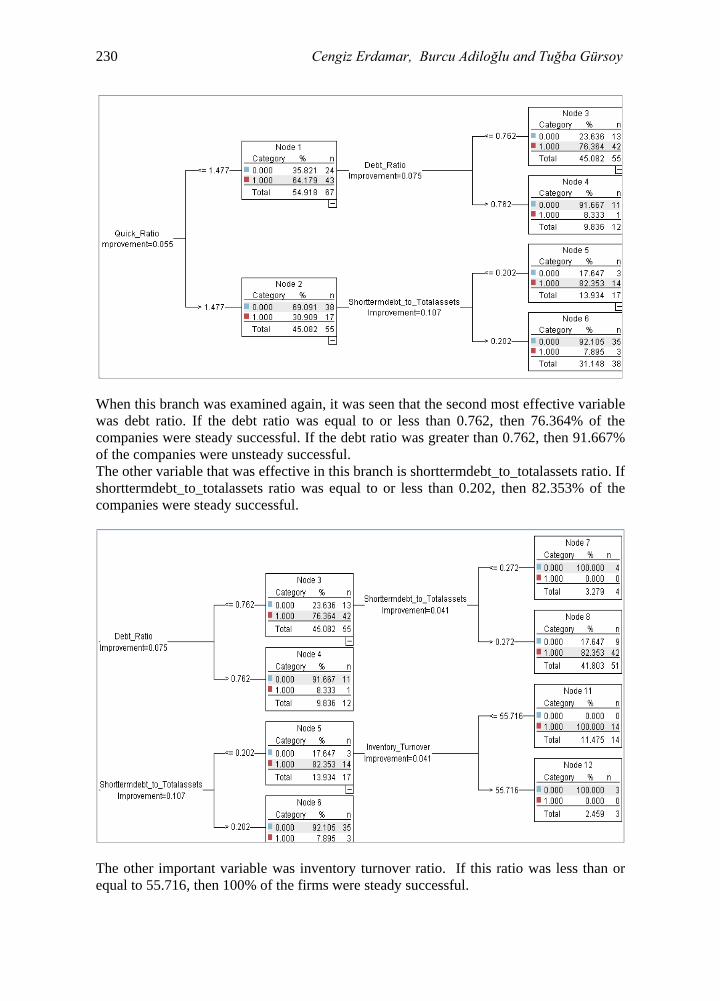
When this branch was examined again, it was seen that the second most effective variable
was debt ratio. If the debt ratio was equal to or less than 0.762, then 76.364% of the
companies were steady successful. If the debt ratio was greater than 0.762, then 91.667%
of the companies were unsteady successful.
The other variable that was effective in this branch is shorttermdebt_to_totalassets ratio. If
shorttermdebt_to_totalassets ratio was equal to or less than 0.202, then 82.353% of the
companies were steady successful.
The other important variable was inventory turnover ratio. If this ratio was less than or
equal to 55.716, then 100% of the firms were steady successful.

Financial Indicators of Steady Success in Manufacturing Companies in Turkey 231
Compared with the results of logistic regression analysis, variables that affected the
success of the companies were noteworthy are listed in Table 10.\
Table 10: Effective variables for decision trees
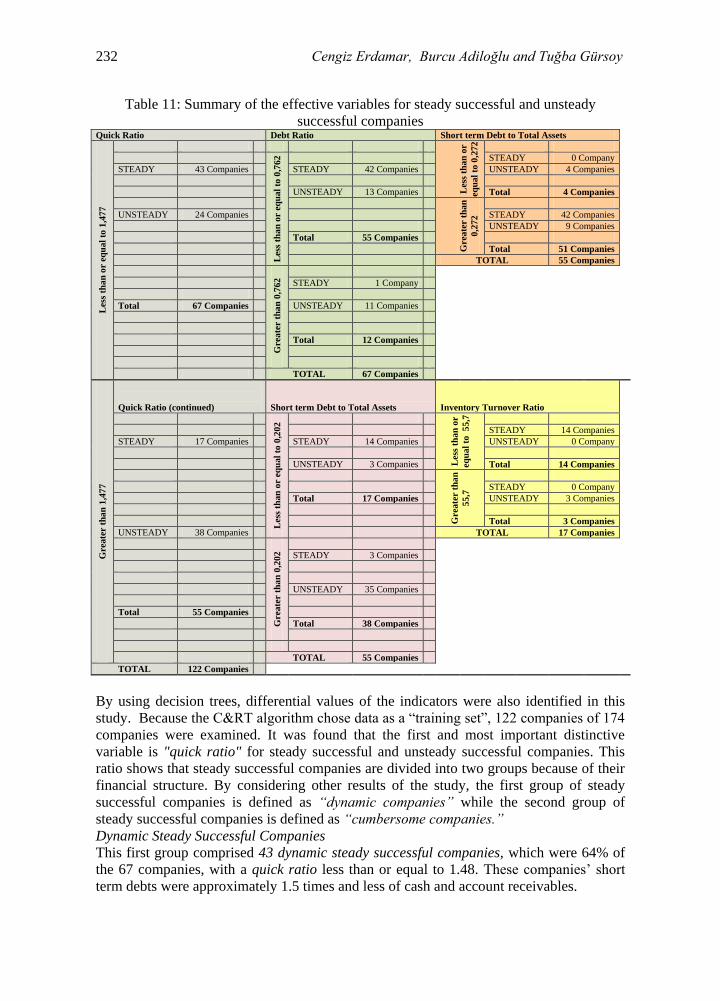
The effective variables for steady successful and unsteady successful companies are
shown in Table 11. This presents a brief summary of the decision tree results of the study.
4 Conclusions
The users of financial statements, which include present and potential investors,
employees, lenders, suppliers and other trade creditors, customers, governments and their
agencies and the public, use financial statements to satisfy some of their different needs
for information. For providing information about the financial position, performance and
changes in financial position of a company, financial indicators (ratios) are calculated
from data in the basic financial statements. These indicators can be used to make
inferences about a company's financial condition, its operations and attractiveness as an
investment. They can also be used to analyze trends and compare companies’ financial
performance end situation to other firms. The main desire of the investors is to invest in
companies that are steady successful.
This study empirically examines the common and distinctive financial indicators of steady
and unsteady successful big manufacturing companies in Turkey by using data mining
methodology. In this framework, the variables that affect the success of the company were
identified by using logistic regression analysis. Then the differential values of the
indicators were identified by using decision trees. Several studies have been and are still
being realized in the area of financial ratios and data mining separately. However, there is
no study in the literature that combines these two areas together. To our knowledge, this
will be the first study in Turkey about financial ratios using data mining. The study is
expected to contribute to the literature on accounting ratios and data mining.
According to logistic regression analysis current ratio, quick ratio, debt ratio, short term
debt/total debts, inventory turnover ratio, CFFO/total assets and CFFF/CFFI variables are
found to be significant at the 95% confidence level. These are the distinctive variables for
steady and unsteady successful companies.
Quick ratio
Debt ratio
Short term debt to Total assets
Inventory turnover ratio
232 Cengiz Erdamar, Burcu Adiloğlu and Tuğba Gürsoy
Table 11: Summary of the effective variables for steady successful and unsteady
successful companies Quick Ratio Debt Ratio Short term Debt to Total Assets
Les
s th
an
or
equ
al
to 1
,477
Les
s th
an
or
equ
al
to 0
,272
Les
s th
an
or
equ
al
to 0
,76
2
STEADY 0 Company
STEADY 43 Companies STEADY 42 Companies UNSTEADY 4 Companies
UNSTEADY 13 Companies Total 4 Companies
Gre
ate
r th
an
0,2
72
UNSTEADY 24 Companies
STEADY 42 Companies
UNSTEADY 9 Companies
Total 55 Companies
Total 51 Companies
TOTAL 55 Companies
G
rea
ter
tha
n 0
,762
STEADY 1 Company
Total 67 Companies UNSTEADY 11 Companies
Total 12 Companies
TOTAL 67 Companies
Gre
ate
r th
an
1,4
77
Quick Ratio (continued) Short term Debt to Total Assets Inventory Turnover Ratio
Les
s th
an
or
equ
al
to 0
,202
Les
s th
an
or
equ
al
to 5
5,7
STEADY 14 Companies
STEADY 17 Companies STEADY 14 Companies UNSTEADY 0 Company
UNSTEADY 3 Companies Total 14 Companies
Gre
ate
r th
an
55
,7
STEADY 0 Company
Total 17 Companies UNSTEADY 3 Companies
Total 3 Companies
UNSTEADY 38 Companies TOTAL 17 Companies
Gre
ate
r th
an
0,2
02
STEADY 3 Companies
UNSTEADY 35 Companies
Total 55 Companies
Total 38 Companies
TOTAL 55 Companies
TOTAL 122 Companies
By using decision trees, differential values of the indicators were also identified in this
study. Because the C&RT algorithm chose data as a “training set”, 122 companies of 174
companies were examined. It was found that the first and most important distinctive
variable is "quick ratio" for steady successful and unsteady successful companies. This
ratio shows that steady successful companies are divided into two groups because of their
financial structure. By considering other results of the study, the first group of steady
successful companies is defined as “dynamic companies” while the second group of
steady successful companies is defined as “cumbersome companies.”
Dynamic Steady Successful Companies
This first group comprised 43 dynamic steady successful companies, which were 64% of
the 67 companies, with a quick ratio less than or equal to 1.48. These companies’ short
term debts were approximately 1.5 times and less of cash and account receivables.

Financial Indicators of Steady Success in Manufacturing Companies in Turkey 233
The second distinctive financial indicator for the 67 steady and unsteady successful
companies in the first group is the “debt ratio”. The third distinctive financial indicator
is" short term debt/ total assets”.
42 companies, 63% of the 67 companies, constitutes the first group, where the debt ratio
is equal to or less than 0.762. In other words, these steady successful companies’ owner’s
equity was at least about 25% of the total assets.
These 42 companies in the first group had short term debt/ total assets greater than 0.27.
This also means that these companies’ short term debts were approximately 1/3 more than
their total assets.
Briefly to summarize dynamic steady successful companies:
Quick ratio was less than or equal to 1.48.
Debt ratio was less than or equal to 0.762.
Short term debt/ total assets was greater than 0.27.
(Too much short term debt, limited cash and short-term receivables to meet short term
obligations)
Cumbersome Steady Successful Companies
This second group comprised 17 cumbersome steady successful companies, which were
31% of the 55 companies, with a quick ratio greater than 1.48. These companies’ short
term debts were more than about 1.5 times cash and receivables.
The second distinctive financial indicator for the 55 steady and unsteady successful
companies in the second group was the “short term debt/ total assets”. The third
distinctive financial indicator was “inventory turnover ratio”.
14 companies, which was 25 % of the 55 companies with a quick ratio greater than 1.48
in the second group had short term debt/ total assets less than or equal to 0,202. This also
means that these companies’ short term debts were less than about 20% of their total
assets.
In 14 companies, which is 82% of the 17 companies with the short term debt/ total assets
less than or equal to 0.202, had a inventory turnover ratio less than or equal to 55.7.
These companies had at least about 7 days or more to sell inventory.
Briefly to summarize cumbersome steady successful companies:
Quick ratio was greater than 1.48.
Short term debt/ total assets was less than or equal to 0.202.
Inventory turnover ratio was less than or equal to 55.7.
(Less short term debt, more cash and short-term receivables than short term debt, at least
7 days or more to sell inventory )
In this study, empirical research was also conducted to find distinctive financial indicators
by sectors. After using this model to categorize companies by sectors, it was observed that
the results are not significant in accounting. As they were not interpreted in terms of
accounting, the results were excluded from the study. Further research that examines the
steady successful companies by sectors should continue to broaden the understanding.
234 Cengiz Erdamar, Burcu Adiloğlu and Tuğba Gürsoy
References
[1] IAS 1, International Accounting Standards 1: Presentation of Financial Statements,
paragraph 9, http://www.ifrs.org
[2] Moyer, R.C., McGuigan,J.R., Kretlow,W., Contemporary Financial Management,
West Publication Company, 1981.
[3] Alex A. Freitas, Data Mining and Knowledge Discovery with Evolutionary
Algorithms, Springer, 2002.
[4] Pieter Adriaans and Dolf Zantinge, Data Mining, Addison-Wesley, 1997.
[5] Paolo Guidici, Applied Data Mining: Statistical Methods for Business and Industry,
Wiley & Sons, 2003.
[6] T.Fears, J. Benichou and M.H. Gail, A Reminder of The Fallibility of The Wald
Statistics, The American Statistician, 50 (3), (1996), p.226.
[7] Jiawei Han and Micheline Kamber, Data Mining Concepts and Techniques,
Morgan Kaufmann, USA, 2006.
[8] Cristopher Westhpal and Teresa Blaxton, Data Mining Solutions: Methods and
Tools for Solving Real-World Problems, Wiley & Sons, USA, 1998.
[9] Michael J.A. Berry and Gordon Linoff, Mastering Data Mining: The Art and
Science of Customer Relationship Management, Wiley & Sons, USA, 2000.
[10] Classification and Regression Trees:
http://www.statsoft.com/textbook/classification-and-regression-trees/, 10.01.2012
[11] Pang-Ning Tan, Michael Steinbach, Vipin Kumar, Introduction to Data Mining”,
Pearson Int. Education, 2006.
Related Documents


