FINANCIAL DOCUMENT 2013

Welcome message from author
This document is posted to help you gain knowledge. Please leave a comment to let me know what you think about it! Share it to your friends and learn new things together.
Transcript

f i n a n c i a l d o c u m e n t 2 0 1 3


12013 Financial Document ~ Kering
TABLE OF CONTENTS
CHAPTER 1Kering in 2013 3
CHAPTER 2Our activities 15
CHAPTER 3Financial information 55
This is a free translation into English of the 2013 Financial Document issued in French and is provided solely for the convenience of English speaking users.
01_VA_V4 20/02/14 16:53 Page1

2 Kering ~ 2013 Financial Document
01_VA_V4 20/02/14 16:53 Page2
32013 Financial Document ~ Kering
CHAPter 1
Kering in 2013
1. History 4
2. Key consolidated figures 6
3. Kering Empowering Imagination 8
4. Kering Group Simplified Organisational Chart as of December 31, 2013 13
01_VA_V4 20/02/14 16:53 Page3

The Kering group was founded by François Pinault in 1963,as a timber and building materials business. In the mid-1990s the Group repositioned itself on the retail marketand soon became one of the leading players in the sector.
The acquisition of a controlling stake in Gucci Group in 1999and the establishment of a multi-brand Luxury Goodsgroup marked a new stage in the Group’s development.
In 2007, the Group seized a new growth opportunity withthe purchase of a controlling stake in PUMA, a world leaderand benchmark in sportlifestyle.
In 2013, the listing of Groupe Fnac and the announced disposalof La Redoute represent a major milestone in the processof divesting mass market retailing assets, a strategicdecision made a few years ago.
Kering strategy remains focused on growing apparel andaccessory brands that operate within two of the mostdynamic sectors – Luxury and Sport & Lifestyle.
1963• François Pinault establishes the Pinault group, specialising
in timber trading.
1988• Flotation on the Paris Stock Market’s Second Marché of
Pinault SA, a company specialising in timber trading,distribution and processing.
1990• Acquisition of Cfao, a group specialising in electrical
equipment distribution (through CDME, which becameRexel in 1993) and in trading with Africa.
1991• The Group acquires Conforama and enters the retail market.
1992• The Pinault-Printemps Group is born with the takeover
of Au Printemps SA, which held 54% of La Redoute andFinaref.
1994• La Redoute is merged into Pinault-Printemps, and the Group
is subsequently renamed Pinault-Printemps-Redoute.• Takeover of Fnac.
1995• Launch of the Group’s first website, laredoute.fr.
1996• Acquisition by Cfao of SCOA, the leading pharmaceutical
distributor in West Africa, through its subsidiary Eurapharma.• Creation of Orcanta, a women’s lingerie chain.
1997• Takeover by Redcats (Kering’s home shopping business)
of Ellos, the leader on the Scandinavian mail order market.• Creation of Fnac Junior, a concept store for children
under 12.
1998• Takeover of Guilbert, the European leader in office supplies
and furnishings.• Acquisition by Redcats of 49.9% of Brylane, the fourth-
largest home shopping company in the US.• Creation of Made in Sport, a chain of stores dedicated
to sports enthusiasts.
1999• Purchase of the remaining stake in Brylane.• The Group enters the Luxury Goods sector with the
acquisition of 42% of Gucci Group NV.• First steps towards the creation of a multi-brand Luxury
Goods group, with the acquisition by Gucci Group ofYves Saint Laurent, YSL Beauté and Sergio Rossi.
• Launch of fnac.com, the Fnac website.
2000• Acquisition of Surcouf, a specialised PC retailer.• Acquisition by Gucci Group of Boucheron.• Launch of Citadium, the new Printemps sports store.
2001• Gucci Group acquires Bottega Veneta and Balenciaga and
signs partnership agreements with Stella McCartneyand Alexander McQueen.
• Conforama enters the Italian market with the purchaseof the Emmezeta group, one of the leaders in the homefurnishings market in Italy.
• Pinault-Printemps-Redoute raises its stake in GucciGroup to 53.2%.
2002• The Group raises its stake in Gucci Group to 54.4%.• Sale of the Guilbert home shopping business to Staples Inc.• Partial disposal of the Credit and Financial Services
division in France and Scandinavia to Crédit Agricole SA(61% of Finaref) and BNP Paribas (90% of Facet).
2003• The Group raises its stake in Gucci Group to 67.6%.• Sale of Pinault Bois & Matériaux to the Wolseley group
in the UK.• Sale of the Guilbert Contract activity to the US group
Office Depot.• Sale of an additional 14.5% stake in Finaref.
1. HISTORy
4 Kering ~ 2013 Financial Document
1 KERING IN 2013 ~ HISTORY
01_VA_V4 20/02/14 16:53 Page4

2004• The Group raises its stake in Gucci Group to 99.4% further
to a tender offer.• Sale of Rexel.• Sale of the residual 24.5% stake in Finaref.
2005• Change of corporate name: Pinault-Printemps-Redoute
becomes PPR.• Sale of MobilePlanet.• Sale of the residual 10% stake in Facet.
2006• Sale of 51% of France Printemps to RREEF and the
Borletti group.• Sale of Orcanta to the Chantelle group.• Sale of the Bernay industrial site (YSL Beauté Recherche
et Industrie).• Discontinuation of Fnac Service’s activities.• Acquisition by Conforama of a majority stake in Sodice
Expansion.• Acquisition by Redcats group of The Sportsman’s Guide, Inc.
2007• Sale of the residual 49% stake in France Printemps to
RREEF and the Borletti group.• Sale of Kadéos to the Accor group.• Acquisition of a 27.1% controlling stake in PUMA. This
stake was increased to 62.1% further to a tender offer.• Acquisition by Redcats USA of United Retail group.
2008• Sale of YSL Beauté to L’Oréal.• Sale of Conforama Poland.• Sale by Redcats UK of Empire Stores.• Sale by Redcats USA of the Missy division.• Acquisition of a 23% stake in Girard-Perregaux.
2009• Acquisition by PUMA of Dobotex International BV.• Acquisition by PUMA of Brandon AB.• Sale of Bédat & Co.• Sale of Surcouf.• Flotation of 58% of Cfao.
2010• Acquisition by PUMA of a 20% stake in Wilderness
Holdings Ltd.• Acquisition by PUMA of COBRA.• Sale of Fnac éveil & jeux.• Sale of the controlling stake in Conforama to Steinhoff.
2011• Closing of the sale of Conforama to Steinhoff.• New organisation of the Luxury Division.• Acquisition of Volcom.• Increased stake (50.1%) in Sowind Group (Girard-Perregaux
and JEANRICHARD).• Announced acquisition of Brioni.
2012• Closing of the acquisition of Brioni.• Sale of the remaining 42% stake in Cfao to TTC.• Creation of a joint venture with Yoox S.p.A. dedicated to
e-commerce for several brands of the Luxury Division.• Announced project to demerge and list Fnac.• Sale of Fnac Italy.• Sale of Redcats USA business (The Sportsman’s Guide
and The Golf Warehouse, announced sale of OneStopPlus).• Announced acquisition of a majority stake in Chinese
fine jewellery brand Qeelin.
2013• Closing of the acquisition of a majority stake in Chinese
fine jewellery brand Qeelin (January 2013).• Acquisition of a majority stake in the luxury designer
brand Christopher Kane (January 2013).• Closing of the sale of OneStopPlus (February 2013).• Sale of the Children and Family division of Redcats, Cyrillus
and Vertbaudet (March 2013).• Acquisition of a majority stake in tannery France Croco
(March 2013).• Sale of the Nordic brands of Redcats, Ellos and Jotex
(June 2013).• Listing of Groupe Fnac (June 2013).• Change of corporate name: PPR becomes Kering
(June 2013).• Acquisition of a majority stake in Italian jewellery group
Pomellato (July 2013).• Kering enters into exclusive negotiations for the
disposal of La Redoute and Relais Colis (December 2013).
5
1
2013 Financial Document ~ Kering
HISTORY ~ KERING IN 2013
01_VA_V4 20/02/14 16:53 Page5

6 Kering ~ 2013 Financial Document
1 KERING IN 2013 ~ KEY CONSOLIDATED FIGURES
2. Key consolidated figures
(in € millions) 2013 2012
Revenue 9,748 9,736o/w generated in emerging countries (as a % of revenue) 37.6% 37.6%
EBITDA 2,046 2,067EBITDA margin (as a % of revenue) 21.0% 21.2%
Recurring operating income 1,750 1,792Recurring operating margin (as a % of revenue) 18.0% 18.4%
Net income attributable to owners of the parent 50 1,048o/w net income from continuing operations excluding non-recurring items 1,229 1,269
Gross operating investments (1) 678 442
Free cash flow from operations (2) 858 930
Average number of employees 31,415 29,378
(1) Purchases of property, plant and equipment and intangible assets.(2) Net cash flow from operating activities - net acquisitions of property, plant and equipment and intangible assets.
Per share data (in €) 2013 2012
Earnings per share attributable to owners of the parent 0.39 8.32o/w continuing operations excluding non-recurring items 9.76 10.07
Dividend per share (3) 3.75 3.75
(3) Subject to the approval of the Annual General Meeting on May 6, 2014.
Breakdown by regionBreakdown by Division
Luxury 67%2013
2012
Sport & Lifestyle 33%
Luxury 64%Sport & Lifestyle 36%
Revenue
* EEMEA : Eastern Europe, Middle East and Africa.
2013
2012 Western Europe 30%
Western Europe 31%North America 21%
Asia Pacific 25%EEMEA* 8%
South America 5%Japan 10%
North America 20%
Asia Pacific 25%EEMEA* 7%
South America 6%Japan 12%

7
1
2013 Financial Document ~ Kering
KEY CONSOLIDATED FIGURES ~ KERING IN 2013
Undrawn confirmedcredit lines
(in € millions)
Maturity schedule of net debt (1)
(€3,443 million)
2014*
310
4,126
2015**
815
2016**
61
2017**
360
2018**
505
Beyond**
1,392
* Gross borrowings after deduction of cash equivalents and financing of customer loans.** Gross borrowings.
Liquidity
Breakdown by Division *
Luxury 89%2013
2012
Sport & Lifestyle 11%
Luxury 84%Sport & Lifestyle 16%
* Excluding Corporate.
Recurring operatingincome
Equity (in € millions)
Solvency ratio (ND/EBITDA)
2011 2012
11,750
2013
2011 2012 2013
2011 (2) 2012 2013
(2) Published, not restated.
Net debt as a percentage of consolidated equity
28.9%30.8%
20.6%
1.78 1.21 1.68
Net debt (1) (ND) (in € millions)3,396 2,492 3,443
12,11911,196
Financial position debt-to-equity ratio
(1) Net debt defined in part 3.
01_VA_V4 20/02/14 16:53 Page7

The Kering of today and tomorrow is an integrated groupwith a coherent business mix. We concentrate exclusivelyon the design, manufacture and distribution of appareland accessories in two major segments: Luxury andSport & Lifestyle.
The Luxury and Sport & Lifestyle sectors are fuelled by soliddemographic and social trends, notably in emergingregions. To capture this growth, we have built up a uniqueensemble of complementary brands. The considerableorganic growth potential each one of them enjoys is basedon powerful brand equity, leading market positions,global recognition, huge consumer appeal and significantpricing power.
The success of our strategy rests on three main pillars.
First, our brands are in the step with major societal trends:people wish to enjoy and express themselves throughwhat they wear, and to look and feel good.
Second, a well-balanced geographical spread is core to thestrength of our brands: we carefully manage their growth
locations and ensure maximum flexibility to keep pacewith changing market conditions.
And third, the markets we are tapping are forecast torecord unprecedented growth in the coming years. In thepast 50 years, 800 million consumers in the USA, WesternEurope and Japan have generated most of the world’sgrowth. Over the next 50 years, China, India, Brazil,Indonesia and Mexico, with a combined population ofmore than three billion, will drive global economicexpansion(1). Furthermore, the younger generations inthese countries continue to enjoy increasing levels ofdisposable income.
Because of the inherent dynamics of our markets, ourgrowth strategy relies on the development of our existingbrands, which can take one or several forms:
• we nurture the international development of ourbrands by selectively entering new countries. Forexample, Brioni, which remains primarily Europe andNorth America driven, enjoys huge growth potential
Kering’S StrATEGY IS TO CREATE VALUE BY LIBERAtiNG THE ORGANIC GROWTH POTENtiAL OF ITS BRANDS
Kering’s ambition is to be the world leader in apparel andaccessories by concentrating on the two fastest-growingsegments: Luxury and Sport & Lifestyle.
Our mission is to offer products that enable ourcustomers to express their personality and to fulfil theirdreams. To achieve this, we empower an ensemble ofrobust, complementary brands to reach their potential byconstantly pushing them against the limits, in the mostimaginative and sustainable manner.
Since its inception in 1963, Kering has continuouslytransformed itself, constantly seeking growth andcreating value with the same entrepreneurial spirit. Withthe acquisition of Gucci in 1999, Kering initiated a majorstrategic move, amplified in 2007 with the takeover ofPUMA. These two milestones have enabled Kering tobenefit from the changes in the global economy andcapture the growth of emerging markets.
Since 2005 the Group has been evolving from a diverseconglomerate into a cohesive international group. In 2013,as we reached the final stage of our transformation weexited our remaining, legacy mass-retail businesses. Thechange in the name of the Group, approved by the AnnualGeneral Meeting on 18 June 2013, from PPR to Kering,therefore reflects this new identity.
Kering can be pronounced and understood as “ caring ”.The new name stands for more than a change in scope oractivity. It portrays the way we take care of our businesses,people, customers and stakeholders – as well as theenvironment.
We have a long-term entrepreneurial vision and a cleargrowth strategy to capitalise on consumer trends. We putsustainability at the core of everything we do. We embracee-business and any means of dialogue with our customersaround the world. Kering’s role is to release the full potentialof our brands while ensuring they stay true to their valuesand identity – that is what we call “ empowering imagination ”.
OWNER OF SOME OF THE WORLD’S MOST DESIRABLE LUXURYAND Sport & Lifestyle BRANDS, Kering IS WELL POSItiONEDFOR SUSTAINABLE, PROfiTABLE GROWTH
8 Kering ~ 2013 Financial Document
1 KERING IN 2013 ~ KERING EMPOWERING IMAGINATION
3. Kering Empowering Imagination
(1) Source : The $10 Trillion Prize, Harvard Business Review Press, 2012.
01_VA_V4 20/02/14 16:53 Page8

outside its home market, with plenty of room tobroaden its international presence of directly-operatedstores. A similar opportunity exists for two of our Britishluxury designer brands, Alexander McQueen and StellaMcCartney, both of which have recently embarked onmore ambitious expansion plans outside the UK andNorth American markets.
• we strengthen our distribution channels. In Luxury, weare constantly adjusting and consolidating our networkof directly-operated stores to optimise the sales mix; inSport and Lifestyle, we build relationships with third-party retailers who enjoy robust positions in theirrespective markets.
• we expand into new product categories. For example, atVolcom, which was acquired in 2011, we have launchedthe first closed-toe footwear styles this year, and a brandlike Bottega Veneta is clearly looking to further expandits men’s category, which is a promising source ofgrowth for the future.
• we aim at exploiting the huge potential of e-commerce.Our joint-venture set up in 2012 with Yoox, a leader inonline premium consumer goods shopping, willaccelerate the growth of e-commerce at most of ourLuxury brands.
Kering has employed an original approach and strategy indeveloping its portfolio of businesses. We have focused ontwo segments, Luxury and Sport & Lifestyle, with a multi-brand approach within both divisions. Each brand has itsown specific positioning, complementary with the others.There is therefore no direct competition between thebrands. This is how we have built the Luxury Division,while generating substantial synergies between thebrands and, since 2007, the Sport & Lifestyle Division.
Although organic growth remains the Group’s underlyingfocus, we have made acquisitions of small- to medium-sized brands in order to strengthen and complement theexisting brand portfolio, and therefore contribute to anincrease in revenue and earnings. While they may not alwaysbe central to Kering’s immediate value creation, they actas a catalyst for Group enlargement and internationaldevelopment.
We rely on the same strict acquisition criteria to consolidateour positions, as follows:
• we seek brands that have a truly distinctive identity: wellrooted values and a sought-after legacy; a unique scopeof expression through lasting codes and language; anability to broaden their territories independently orthrough alliances; an aptitude to gradually expand theirmarkets beyond their current borders.
• the Group only considers targets that offer genuinepotential to significantly improve financial performance,which it can identify and exploit in the long term, andwhich will go beyond the potential that the assets hadbefore being brought into the Group.
• external growth may be achieved through acquisitionsthat change or even reshape the Group – in which casethe investment will be made directly by Kering SA or aholding company from among its subsidiaries – orthrough targeted, tactical acquisitions aimed atbolstering an existing brand within a product categoryor in its operations – in which case the investment willbe made directly by the brand in question.
Our ambition for the two divisions can be characterisedas follows:
• for its Luxury brands, Kering aims at expanding themwhile striking the right balance between growth andeach brand’s exclusivity. The Group plans to continue todevelop its Luxury brands along defined paths, such asexpanding selectively their networks of directly-operated stores, launching new product categories, andimproving their long-term top-line performance,notably through ever-more efficient merchandising,effective communications, operational store excellenceand deeper customer knowledge.
• for its Sport & Lifestyle brands, Kering’s strategy is basedon expanding into new markets while bolstering growthin the most mature ones, developing distribution,launching new products that are consistent with eachbrand’s distinctive characteristics, and continuing to identifyand foster synergies between the brands, particularly insourcing, logistics and knowledge-sharing in the areasof product development, distribution and marketing.
Consistent with this strategy, in December 2012 (thetransaction was finalised in January 2013) Kering acquireda majority stake in Qeelin, a Chinese fine jewellery makerbased in Hong Kong. Kering thus increased its portfolio inthe hard luxury segment and its presence in the Chinesemarket. Qeelin has tremendous intrinsic growth potentialand Kering will enable it to accelerate its expansion, notablythrough store openings in mainland China and Hong Kong.
Similarly, in January 2013 Kering acquired a 51% interestin luxury designer brand Christopher Kane in order todevelop the business in partnership with its eponymousScottish creator and designer. By doing so, Kering is fulfillingits mission to empower new creative talent, while furtherstrengthening its portfolio of luxury brands. The Grouphas a strong track record of backing rising designers andhas enjoyed great success with brands such as AlexanderMcQueen and Stella McCartney. Kering will enable the brandto accelerate its expansion by providing the support itneeds to grow to the next level.
In July 2013, Kering acquired a majority stake in Pomellato,one of Europe’s major jewellery groups. It has two brands:Pomellato and Dodo, the former positioned in the finejewellery segment and the latter in accessible jewellery.Kering is thus extending and reinforcing its portfolio ofluxury brands in the high-growth jewellery market and willsupport the development and international expansion ofthe Pomellato group.
9
1
2013 Financial Document ~ Kering
KERING EMPOWERING IMAGINATION ~ KERING IN 2013
01_VA_V4 20/02/14 16:53 Page9

Each of our brands enjoys the high degree of autonomyand responsibility it requires to preserve its creativefreedom, its product and sourcing strategy, and itsdistinctive image and positioning towards its customers.
At the same time, at the Group level, we set out the guidelinesunder which our individual brands operate. We provide allthe “ behind-the-scene ” services that are more efficiently andeconomically carried out at a shared level. And we ensureconsistency across all our operations, notably when itcomes to financial management. We describe the way wemanage our operations as “ freedom within a framework ”.
This approach is consistent with our mission of “empoweringimagination”, which means giving our brands the autonomyand encouraging the creativity and market agility requiredto move beyond their natural limits. We nourish our brandsin terms of financial and managerial support, but we alsochallenge them on their strategy. We push them to go beyondtheir limits by developing new business, and also to sharetalent, expertise and best practice amongst themselves.
Empowering imagination also means providing ourbrands’ executives and Creative Directors with the visionto achieve ambitious targets, to develop talent and tofulfil their potential.
Organisational improvement
Regarding governance, the Kering Executive Committeereflects the integrated nature of the Group. Thus, theprincipal operational officers, the CEOs of Gucci, BottegaVeneta and PUMA, are all members.
In order to meet the needs of the brands more effectively,we have strengthened a number of functions, includingreal estate, e-business, indirect purchasing, intellectualproperty (IP), strategic marketing and media management.
Because our people are the force behind our transformation,we are developing a more ambitious, more integrated,worldwide human resources policy, based on increasedmobility across the brands. The idea behind the HR strategyis for our brands to flourish through accessing and sharing,among other things: a talent pool, expertise, standards,information systems and best practice. Kering is alreadymaking this new HR policy happen, which will largelyaffect our top 200 managers.
To further empower our brands as they expandinternationally, we have established Kering Americas andKering Asia Pacific (effected in 2011). Based respectivelyin New York and Hong Kong, these entities are staffed bylocal functional specialists (audit, HR, taxation, real estate,legal), which provide support to the brands’ operationsand facilitate their geographic expansion.
In addition, in 2013 we adapted the governance of Groupshared services, in particular management informationsystems and transactional finance, to improve theireffectiveness in our three most important regions:Europe, Americas and Asia Pacific.
Digital approach
Kering has embraced the digital revolution. It is speedingup the brands’ e-business projects and increasing digitaluse in an integrated programme across all Group-wideactivities, including HR, merchandising, distribution andsales. For example, the Kering Digital Academy facilitatesbest-practice exchange, expertise and professionaldevelopment in this field. We have also created a Group-wide dashboard and an internal web watch communityto share internal and external benchmarking.
THE Kering EffECT – BRINGING GROUP POWER TO THE SERVICE OF EACH OF OUR BRANDS
In September 2013, Kering became a minority shareholderof the New York-based Altuzarra luxury fashion brand.This investment marks the beginning of a relationship inwhich Kering will contribute to the growth of the brand,which was founded in 2008 by young Franco-Americandesigner Joseph Altuzarra.
In November 2013, Kering and Tomas Maier entered intoa joint venture to develop the business of the TomasMaier brand in partnership. Tomas Maier will continue tobe Creative Director of Bottega Veneta, a position he hasheld since 2001.
As part of the repositioning process, Kering carried outmany disposals of retail assets in 2013, as follows:
• in February, Kering finalised the sale of the Redcatsbusiness in the US, with the disposal of OneStopPlusGroup, its plus-size business, having already completed
the disposal of The Sportsman’s Guide and The GolfWarehouse in December 2012.
• in March, Kering completed the disposal of Cyrillus andVertBaudet, its children and family brands belonging tothe Group’s Redcats division, and in June, it completedthe sale of Ellos and Jotex, its Nordic brands.
• also in June, the demerger and flotation of Fnac,through the distribution of Fnac shares to theshareholders of Kering was achieved.
• in December, the Board of Directors entered intoexclusive negotiations with the chairman and CEO of LaRedoute and the Chief administrative officer of Redcatsto acquire La Redoute and Relais Colis (in the bestinterests of the company, its employees and the regionwhere it is based). The sale is expected to be concludedin the first half of 2014.
10 Kering ~ 2013 Financial Document
1 KERING IN 2013 ~ KERING EMPOWERING IMAGINATION
01_VA_V4 20/02/14 16:53 Page10

Kering believes sustainable business is smart business. Itgives us an opportunity to create value while helping to makea better world – economically, socially and environmentally.
The same vision that drives the Group’s business strategy(empowering an ensemble of brands to reach their potentialin the most imaginative and sustainable manner) also drivesour commitment to environmental and social sustainability.
It is our wish to give meaning to our business. Ourapproach to sustainability is therefore at the heart of thestrategy that guides the Group, our brands and all itsconstituent parts. Further, we believe sustainability isinherent in quality. Because quality is the quintessence ofour brands, the challenge of sustainability stimulates usto create products that are more imaginative, longerlasting and more desirable.
We believe our approach to sustainability representslong-term differentiation and competitive advantage byoffering new business development opportunities,stimulating innovation and in many cases helping reducecosts. It is also a motivating factor for our employees,helping us attract and retain the best.
Every employee has a part to play in making sustainabilitya reality. It is built into our structure, from the sustainabilitycommittee of the Kering Board of Directors to thecommitment of the CEO of every brand, and in the everydaydecisions and actions of our teams. A variable part of theremuneration of the CEOs of Kering brands is now partlybased on the degree to which they meet sustainabilityobjectives. Our Chief Sustainability Officer sits on theExecutive Committee, which ensures decision-making onsustainability is consistent and integrated across the Group.
The Kering sustainability department acts as a platformof resources to complement the brands’ own activities. Itprovides support in the form of 15 in-house experts insustainable sourcing, alternative materials, biodiversity,
energy, supply chain performance and change management,as well as social aspects. The sustainability departmentfacilitates change by providing knowledge and guidance,operational synergies and economies of scale that helpthe brands develop more sustainable practices. A networkof sustainability leads in each brand facilitates this process.
In 2013 Kering set up the sustainability technical advisorygroup (STAG) with the objective of providing technicaladvice and guidance to Kering’s board-level SustainableDevelopment Committee. Composed of external technicaland business environmental experts and internal businessleaders, STAG is helping the Group advance its overallsustainability strategy.
Kering has defined a number of quantifiable targets forits brands to reach ambitious environmental and socialmeasures for 2016. These relate to raw materials sourcing,including alternatives; paper and packaging; water use,waste and carbon emissions and hazardous chemicals; whileoffsetting our remaining CO2 emissions and supportingsuppliers in their progress. These targets highlight ourattention to sustainability at two intertwined levels:process and product.
By 2016, we will have rolled out a Group EnvironmentalProfit & Loss (EP&L) account across all of our brands. Firstlyit will measure the environmental impact across our ownoperations and entire supply chain, from sourcing rawmaterials to selling our products. Secondly, it will providea monetary valuation of the impact: the profit and loss forthe environment. It serves as a tool for deeper understandingand better decision-making. This is the first time that aglobal Group of companies has undertaken such an analysis.Pioneered by PUMA, the EP&L will lead us to new businessmodels and solutions that take nature into account.
Our social responsibility goes beyond compliance. Wework with our suppliers through our social audits and
SUSTAINABILIty IS AT THE HEART OF Kering group AND BRAND StrATEGY
E-business is a strategic priority for Kering. This is notonly for the business we conduct online but also becauseit influences demand across all sales channels, with moreand more shoppers affected by digital, regardless of wherethey purchase. Also, since our brands are global, we needonline flagship stores to be accessible all over the world.
In Luxury, Gucci has the size, resources and expertise to havedeveloped its own platform and is, in fact, a pioneer inluxury e-commerce. This was less the case for the otherLuxury brands in our portfolio, which is the reason whywe created (in August 2012) a joint venture with Yoox, toestablish a series of single-brand e-commerce websitesfor a number of our brands. Called E_lite, the Yoox partnerbrings its technology and worldwide logistics expertise
in this field. The joint venture is improving existing e-commerce sites, accelerating e-commerce developmentof their global digital presence and offering exclusiveonline shopping to customers.
By year-end 2013, all of the Group’s Luxury brands (BottegaVeneta, Saint Laurent, Sergio Rossi, Stella McCartney,Brioni, Balenciaga and Alexander McQueen) had theirown e-commerce sites, marking the first milestone of theprogramme. Some of these sites will be redesigned in 2014.Each brand remains in control of its brand image andmerchandising, whilst Yoox brings superior designknowledge, web business intelligence and performancemarketing.
11
1
2013 Financial Document ~ Kering
KERING EMPOWERING IMAGINATION ~ KERING IN 2013
01_VA_V4 20/02/14 16:53 Page11

In a context of slowing GDP trends, particularly in some keyemerging markets such as China, and in the absence of astrong rebound in Europe and the United States, growthin the global economy has remained muted throughout2013. Only Japan has seen a material pick-up in consumption,fuelled by a more accommodating monetary policy.
Against this uncertain and volatile back drop, Kering hasdemonstrated the pertinence of its multi-brand portfolio inLuxury. While Gucci has carried on making major investmentsaimed at further reinforcing its high-end positioning, Kering’sother luxury brands have acted as incremental drivers,allowing the Group to look to the future with confidence,thanks to its solid fundamentals. In Sport & Lifestyle, thearrival of a new management team at PUMA will provide anew impetus to the brand, as it rejuvenates its product rangeand refocuses its overall positioning. Such a far-reachingturnaround process should provide long-lasting benefitsand establish a more solid foundation for PUMA to growits sales and profits in the mid-term.
Kering enjoys healthy growth prospects. Its activities are alignedwith today’s consumer trends and aspirations, which willenable Kering to benefit from distinctive growth trends.At the same time, the Group’s Luxury brands are expected
to consolidate their store network expansion, selectivelyextending their footprint in those regions and for thosebrands where potential has been identified. By constantlystriving to make the products of each of its brands moreattractive and streamline operations, Kering should continueits long-term trend of improving sales and margins.
In addition, Kering is supporting the digital strategies ofits brands by systemising the fostering of inter-brandsynergies, co-ordinating e-business projects and encouragingknowledge sharing. Kering has thus pooled expertise insupport of its brands, to identify and share best digitalpractices, encourage innovation, improve the technicalcapacities and customer functionalities of websites, andincrease Internet penetration for the Group’s activities.
In 2014, Kering intends to pursue its policies to attractnew talent, promote skills and career development, andencourage fruitful exchanges within the Group. Wecontinue to devote energy to corporate environmentaland social sustainability, including people diversity, all ofwhich are crucial to our business objectives and to ourlong-term performance.
IN A StiLL UNSEttLED ECONOMIC ENVIRONMENT, Kering IS CONfiDENT IN ITS OUTLOOK FOR 2014
help them reach the standards laid out in our Code ofethics. We consider diversity, which is endorsed in our HRprocedures, to be a source for creativity and innovation.Social sustainability encompasses attention to workingconditions, which includes third-party workshops, andthe need to preserve artisanal businesses. Which is whyKering brands support a network of highly skilled craftworkers, providing training schemes and foundingtechnical schools.
In 2013, for its first year of participation in the review,Kering was added to the Dow Jones Sustainability Indices(DJSI) World and Europe. These indices track the best-in-class sustainability performers amongst the 2,500 largestcompanies in the Dow Jones Global Total Stock Market Index.Each year, applicant companies are rated against anindustry-specific questionnaire. Only the top ten per centof leading performers in terms of sustainability assessedagainst predefined criteria are listed in the DJSI.
At the same time, Kering leads the 2013 Carbon DisclosureProject (CDP) survey in the Luxury and Apparel Industry. Keringis also listed in the ethical rating indices FTSE4GOOD, Aspiand Ethibel Excellence. In addition, Kering’s sustainabilityreporting complies with Level A+ of the Global ReportingInitiative (GRI).
The Kering Corporate Foundation is dedicated to combatingviolence against women. The Kering Foundation is a separatelegal entity with its own slogan: Stop violence. Improve
women’s lives. Since its inception in 2009, it has supported47 NGOs and social entrepreneurs and benefited morethan 140,000 women.
Integrated in the Kering sustainability department, theFoundation embodies the social commitment of the Group.For example, in November 2013 Kering and the KeringFoundation signed a Charter with the Italian NGO Donnein Rete contro la violenza (D.i.Re). The Charter aims to raisethe awareness of all 6,000 employees of the Group in Italyregarding domestic violence and help them comprehendthis issue that affects all social classes. This partnershipechoes a similar one signed in France in 2010 with theNGO Fédération Nationale Solidarité Femmes (FNSF).There are plans to expand this action to other regions ofthe world where the Group operates.
In addition, many of our brands have been running theirown social-support programmes for some time. Forinstance, in February 2013 Gucci, with the support of theKering Foundation, launched Chime for Change, a globalcampaign to raise funds and awareness for girls’ andwomen’s empowerment with a focus on education,health and justice.
In line with the Group’s new identity, the Foundation hasrefocused its action on three geographic areas and willprioritise one cause in each: sexual violence in the Americas,harmful traditional practices in Western Europe anddomestic violence in Asia.
12 Kering ~ 2013 Financial Document
1 KERING IN 2013 ~ KERING EMPOWERING IMAGINATION
01_VA_V4 20/02/14 16:53 Page12

13
1
2013 Financial Document ~ Kering
KERING GROUP SIMPLIFIED ORGANISATIONAL CHART AS OF DECEMBER 31, 2013 ~ KERING IN 2013
4. Kering Group SimplifiedOrganisational Chart as of December 31, 2013
Luxury Division
Gucci100%
Sport & Lifestyle Division
Kering
Kering Americas Kering Asia Pacific
Bottega Veneta100%
PUMA 86%
Volcom 100%
Electric 100%YSL100%
Alexander McQueen100%
Balenciaga100%
Boucheron100%
Brioni100%
51(2)% Christopher Kane
Pomellato
Qeelin
75(2)%
70(2)%
100% Sergio Rossi
Sowind (3)
(1) Corporate defined p74.(2) Excluding put options.(2) The Sowind group owns the Girard-Perregaux and JEANRICHARD brands.
Stella McCartney
50%
50%
Kering Corporate (1)
01_VA_V4 20/02/14 16:53 Page13

14 Kering ~ 2013 Financial Document
01_VA_V4 20/02/14 16:53 Page14

CHAPTer 2
Our activities
1. Worldwide personal Luxury Goods market overview 16
2. Luxury Division 20Gucci 22Bottega Veneta 25Saint Laurent 28Other brands 31
3. Worldwide Sport & Lifestyle market overview 42
4. Sport & Lifestyle Division 46PUMA 48Other brands 51
152013 Financial Document ~ Kering
02_VA_V7 20/02/14 16:57 Page15

2 OUR ACTIVITIES ~ WORLDWIDE PERSONAL LUXURY GOODS MARKET OVERVIEW
MARKET OVERVIEW: SIZE, trENDS AND MAINGROWTH DRIVERS
The global personal Luxury Goods market has enjoyedsignificant growth over the past few years. In 2013, theglobal personal Luxury Goods market generatedestimated revenue of €217 billion, up 2% on 2012 asreported and up 6% at comparable exchange rates afterthree consecutive years of double-digit growth.
Worldwide personal Luxury Goods market trend (2006-2013e, in € billions, reported exchange rates).
Although the personal Luxury Goods market has seen stronggrowth since 2010, outpacing the global economy, it ishowever tied to changes in worldwide GDP, as evidencedby the fall in 2009.
In addition to economic factors, structural influences are alsoimpacting demand and growth on the personal Luxury Goodsmarket, including:
• positive demographic trends, especially in emerging markets;
• the emerging middle class in these countries, where theaverage disposable income and purchasing power ofconsumers has continued to grow;
• growth in the global population of high-net-worthindividuals (“HNWIs”)(1). Although the majority of HNWIslive in developed countries, the number of HNWIs in high-growth countries has increased rapidly in recent years.In 2012, the HNWI population rose 9.2% to 12 million.At the same time, the wealth of HNWIs grew 10% to arecord USD 46.2 trillion in 2012(Source: Capgemini/RBC 2013 World Wealth Report);
• increased tourism and the growing relevance of touristspending on Luxury Goods: according to the latest datafrom Global Blue, tourist spending was up 10% in 2013,driven by Chinese and Russian tourists, with countrieslike France, Italy and the United Kingdom among theleading destinations for shopping abroad.
Nevertheless, some factors could weigh down personal LuxuryGoods market development in the short term, such as:
• high import taxes on Luxury Goods in some emergingcountries;
• new, more restrictive regulations on travel and theacquisition of luxury goods.
COMPEtitiVE ENVIRONMENT
The global personal Luxury Goods market is highly fragmentedand is characterised by the presence of a few large globalplayers, often part of so called “multibrand groups”, and alarge number of smaller independent players. These playerscompete in different segments both in terms of productcategory and geographic location. Kering operates within theglobal personal Luxury Goods market alongside some of themost global groups, prominent among which are LVMH,Hermès, Prada, Burberry, Chanel and Richemont. A numberof brands with more accessible prices have appeared,which could compete with recognised Luxury brands.
This section contains information derived from studies conducted by organisations, such as Altagamma andBain & Company. Unless otherwise indicated, all historical and forecast statistical information, including trends, sales,market shares and growth levels, comes from the Bain Luxury Study – Altagamma Worldwide Market Monitor, published inDecember 2013. Luxury Goods industry segments and product categories correspond to the definitions used in the BainLuxury Study – Altagamma Worldwide Market Monitor.
In this document the global personal Luxury Goods market includes the following categories: apparel, acces sories, watchesand jewellery, and perfumes and cosmetics.
WORLDWIDE pERSONALLUXURY GOODS MARKETOVERVIEW
06
159
07
170
08
167
09
153
10
173
11
192
12
212
13e
217(+2%)(+10%)
(+11%)(+13%)
(%): annual change at reported exchange rates
(1) HNWIs are defined as those having assets of USD 1 million or more, excluding primary residence, collectibles, consumables, and consumer durables.
16 Kering ~ 2013 Financial Document
02_VA_V7 20/02/14 16:57 Page16

2WORLDWIDE PERSONAL LUXURY GOODS MARKET OVERVIEW ~ OUR ACTIVITIES
Accessories
This category includes shoes, leather goods (includinghandbags and wallets, and other leather products), eyewearand textile accessories.
In 2013, this category represented 28% of the total personalLuxury Goods market with total sales of €61 billion. It recordedthe fastest overall year-on-year growth in 2013 at 4%.
The two biggest sub-categories were:
a) Leather goods, with estimated revenue of €36 billionin 2013. Leather goods were the fastest growing sub-category between 2012 and 2013 with 5% growth,driven by outperformance in men’s products. Keringoperates in this product category mainly through theGucci brand, but also through Bottega Veneta, SaintLaurent and Balenciaga.
b) Shoes, with estimated 2013 revenue of €13 billion.The shoes sub-category grew at a rate of 4% between2012 and 2013. Kering operates in this productcategory mainly with Sergio Rossi, the shoe specialistbrand, with most of the larger brands, includingGucci, Bottega Veneta, Saint Laurent and Balenciagaalso offering shoes.
Apparel
This category includes ready-to-wear for both women andmen. It represented 25% of the total personal Luxury Goodsmarket in 2013 and was worth an estimated €55 billion.The market is evenly spread between men’s and women’sproducts, with a recent outperformance of the high-endsegment of menswear driven by made-to-measure andhigh demand in emerging countries.
All Kering brands operate in this product category especiallyStella McCartney, Alexander McQueen, Christopher Kaneand Saint Laurent, in addition to Brioni for menswear.
Watches and jewellery
The watches and jewellery category generated revenue of €48 billion in 2013, representing 23% of the totalpersonal Luxury Goods market, and grew by 2% between2012 and 2013.
Kering operates in this category across different price pointswith Gucci Timepieces, Girard-Perregaux and JEANRICHARDfor luxury watches, Boucheron, Pomellato and Qeelin forluxury jewellery.
Perfume and cosmetics
The perfume and cosmetics category represented 20% ofthe total personal Luxury Goods market in 2013 and wasworth an estimated €43 billion. Kering operates in thisproduct category through royalty licencing agreementsbetween its main brands and leading industry playerssuch as L’Oréal, Procter & Gamble, Coty and Interparfumsto develop and sell fragrances and cosmetics.
PRODUCT CATEGORIES
The global personal Luxury Goods market can be evenly spread into four product categories as shown below.
Worldwide personal Luxury Goods market: breakdown by category (2013)
Market value 2013 YoY change at reported 2013(in € billions) exchange rates market share
Accessories 61 +4% 28%Apparel 55 +1% 25%Watches and jewellery 48 +2% 23%Perfume and cosmetics 43 +2% 20%Other 10 +0% 4%
Total 217 +2% -
172013 Financial Document ~ Kering
02_VA_V7 20/02/14 16:57 Page17

18 Kering ~ 2013 Financial Document
2 OUR ACTIVITIES ~ WORLDWIDE PERSONAL LUXURY GOODS MARKET OVERVIEW
REGIONAL OVERVIEW
Worldwide personal Luxury Goods market: breakdown by region (2013e)
Size Reported YoY YoY change at comparable 2013(in € billions) change exchange rates market share
Europe 74 +2% +3% 34%Americas 69 +4% +7% 32%Japan 17 -12 % + 9% 8%Asia Pacific 46 + 4% +5% 21%Rest of the world 11 + 6% +8% 5%
The ten largest countries in terms of global personal Luxury Goods revenue in 2013 are as follows:
2013 Country Size Reported YoY YoY change at comparable Rank (in € billions) change exchange rates
1 United States 62.5 +4% +7%2 Japan 17.2 -12% +8%3 Italy 16.1 -2% -2%4 China 15.3 +2.5% +3.5%5 France 15.1 +4% +4%6 United Kingdom 12.1 +4% +9%7 Germany 9.9 +3% +3%8 South Korea 8.3 +1% +0%9 Hong Kong 7.7 +10% +13%10 Russia 5.8 +5% +10%
DIStrIBUtiON CHANNELS
Worldwide personal Luxury Goods market: breakdown by distribution channel (2011-2013e)
Retail channel
A strong directly-operated store network is important forthe success of a luxury brand as it allows greater controlover the consumer shopping experience and overproduct assortment, merchandising and customer service.In 2013 the retail channel accounts for sales amountingto 31% of the total global personal Luxury Goods market.
Wholesale channel
The wholesale channel typically includes departmentstores, independent high-end multi-brand stores andfranchise stores, and accounted for approximately 69% ofthe total global personal Luxury Goods market in 2013.
E-commerce
Online sales of Luxury Goods reached a record of around€10 billion (65% wholesale and 35% retail) in 2013 (up 28%versus 2012), representing about 5% of total globalpersonal Luxury Goods sales.
For Kering’s Luxury Division, the retail channel is predominant(68% of sales at the end of 2013), in particular for Gucci,Bottega Veneta, Saint Laurent, Balenciaga and Boucheron,while other luxury brands are generally distributedthrough wholesale channels. All Kering brands arepresent online with e-commerce websites, either operatedinternally, as is the case for Gucci, or managed by a jointventure signed with Yoox, E_Lite.
RetailWholesale2011 2012 2013e
€192 bn
€212 bn
€217 bn
29%
71%
31%
69%
28%
72%
02_VA_V7 20/02/14 16:57 Page18

19
2
2013 Financial Document ~ Kering
WORLDWIDE PERSONAL LUXURY GOODS MARKET OVERVIEW ~ OUR ACTIVITIES
Europe is the leading Luxury market with 2013 revenueup 3% on 2012 at comparable exchange rates. Growthwas fuelled by rising global tourism, as “travellingconsumers”, particularly from China, made significantpurchases in Paris, London and Milan.
The Americas is the second largest geographical region,with the United States accounting for the vast majority of revenue. The Americas accelerated to 7% growth atcomparable exchange rates thanks to greater consumerconfidence, strong momentum from tourism in majorcities and brand expansion in cities such as Miami, LasVegas and Los Angeles.
The Asia Pacific region, excluding Japan, was up 5% atcomparable exchange rates, and represented 21% of theglobal personal Luxury Goods market. Within the AsiaPacific region, Greater China, which encompasses MainlandChina, Hong Kong, Macau and Taiwan according to theaforementioned study, is the largest personal Luxury Goodsmarket in terms of sales, accounting for approximately €28billion in revenue in 2013, up 4% compared to 2012, butdown from the 19% growth figure reported in 2012.
Japan represented 8% of the global personal Luxury Goodsmarket in 2013. Japan is the second largest country in termsof personal Luxury Goods consumption after the UnitedStates. Since the beginning of 2013, the depreciation ofthe Japanese yen has redirected consumption locally. Atcomparable exchange rates, the market registered verypositive trends, driven by strong internal consumption,while Japanese tourist spending abroad declined.
The rest of the world represented 5% of the personalLuxury Goods market, with €11 billion in revenue in2013. The rest of the world mainly comprises the MiddleEast and Northern African markets.
MARKET OUTLOOK
Bain and Altagamma forecast that the global personalLuxury Goods market will reach between €245 billionand €255 billion by the end of 2016, representing 3% to5% average growth at comparable exchange rates overthe next three years.
Growth is expected to be driven by:
• new emerging countries: according to Bain andAltagamma, in addition to China, the Middle East, Brazil,Australia, Africa and India are key to the growth of theglobal personal Luxury Goods market. Within the Asiaregion, Indonesia, Malaysia, Vietnam and Thailand arethe new drivers of luxury growth;
• the continued expansion of tourism;
• development of new distribution channels such as e-commerce;
• increase in high-spending consumer classes such ashigh-net-worth individuals (HNWIs):
- the HNWI population is forecast to grow by 6.5% peryear to USD 55.8 trillion by 2015, driven mainly bygrowth in Asia Pacific HNWI wealth (Source: Capgemini/RBC 2013 World Wealth Report),
• the development of new high-end products and services;
• the robustness of the American market.
02_VA_V7 20/02/14 16:57 Page19
20 Kering ~ 2013 Financial Document
2 OUR ACTIVITIES ~ LUXURY DIVISION
Gucci 22Bottega Veneta 25Saint Laurent 28Other brands 31
Alexander McQueenBalenciagaBoucheronBrioniChristopher KaneGirard-Perregaux and JEANRICHARDPomellato and DodoQeelinSergio RossiStella McCartney
Luxury division
02_VA_V7 20/02/14 16:57 Page20

2LUXURY DIVISION ~ OUR ACTIVITIES
Breakdown by brand
Revenue and recurringoperating income
€6,470 millionin revenue
19,050average number of employees
1,149directly-operated stores
€1,683 millionin recurring operating income
Breakdown by brand
Breakdown by product category
Breakdown by region
Gucci 55%Bottega Veneta 16%
Saint Laurent 8%Other brands 21%
Leather goods 54%Shoes 13%
Ready-to-wear 16%Watches 4%Jewellery 5%
Other 8%
Western Europe 33%North America 19%
Japan 10%Asia Pacific 31%
Other countries 7%
2013 key figures
Gucci 67%Bottega Veneta 20%
Saint Laurent 5%Other brands 8%
Revenue (in € millions)
Recurring operating income (in € millions)2012 2013
6,470
1,683
6,212
1,612
Total 2012: 958Total 2013: 1,149
WesternEurope
NorthAmerica
Japan
237249
161197
245304
Emergingcountries
315
399
212013 Financial Document ~ Kering
02_VA_V7 20/02/14 16:57 Page21

2
2013 key figures
€3,561 millionin revenue
€1,132 millionin recurring operating income
9,415average number of employees
474directly-operated stores
Breakdown of 2013 revenueby product category
Breakdown of 2013 revenueby region
Leather goods 58%Shoes 14%
Ready-to-wear 11%Watches 5%Jewellery 2%
Other 10%
Western Europe 28%North America 20%
Other countries 6%Japan 10%
Asia Pacific 36%
BUSINESS CONCEPT
Founded in Florence in 1921, Gucci is one of the world’sleading luxury fashion brands.
Gucci’s legacy began more than 90 years ago with thefounder, Florentine artisan Guccio Gucci. Initially, theproduct was primarily focused on handcrafted leatherluggage, then expanded into all kinds of leather goodsand accessories. In a time before marketing and brandpositioning existed, Guccio Gucci set the tone for thebrand and what it would represent: a combination oftradition and modernity, craftsmanship and innovation.
From its foundation in the 1920s through the late 1970sthe brand stayed loyal to its values of superior Italiancraftsmanship and innovation, and Gucci became theexpression of Italian-made luxury for the international jetset. The following decades were the years of the brand’sinternational expansion, first in the US, then in Japan andAsia, while, in the 1990s, the brand became recognized asone of the most influential of its time.
Since Frida Giannini took over as Creative Director in2006, the brand has turned full circle to restore the visionof Guccio Gucci and find the right balance betweenfashion and heritage.
Gucci today designs, manufactures and distributes highlydesirable products for men and women, including leathergoods (handbags, small leather goods and luggage),shoes, ready-to-wear, silks, timepieces and fine jewellery.Eyewear and fragrances are manufactured and distributedunder license by global industry leaders in these twosectors. Gucci products are sold exclusively through anetwork of 474 directly-operated boutiques (77% of totalGucci revenues), a directly-operated e-commerce website(with more than 3,000 products available to customers)and a limited number of franchisees, as well as selecteddepartment and specialty stores.
COMPEtitiVE ENVIRONMENT
Gucci is one of the few luxury brands with truly worldwideoperations alongside Hermès, Chanel and Louis Vuitton.In a challenging environment Gucci is maintaining itsposition as one of the world’s largest Luxury Goodsbrands in terms of both revenue and profitability.
OUR ACTIVITIES ~ LUXURY DIVISION ~ GUCCI
22 Kering ~ 2013 Financial Document
02_VA_V7 20/02/14 16:57 Page22

2
StrATEGY
The luxury sector has grown strongly in the last few years,despite a challenging macroeconomic climate. In eachmarket, customers are at different stages in theirappreciation of luxury, yet most are adopting much moreprudent and thoughtful spending behaviours. They arelooking to be discreet, and they are seeking authenticvalues and an individual approach, accompanied by aunique brand experience.
Anticipating this shift in demand, over the last five yearsthe team led by Patrizio di Marco, Gucci President and CEO,and Frida Giannini, Gucci’s Creative Director, has continuedto move the brand towards a higher positioning, with afocus on products with a higher average value (driving higherprofitability), encapsulating Gucci’s quality, creativity,innovation and Italian craftsmanship. The long-term goal isto recapture the mid-high end of the market, re-attractingthe most sophisticated and exclusive luxury consumers witha more balanced product offer and a series of tacticalactions on communication and distribution.
Looking at distribution, a key element of the strategyworldwide has been the implementation of ongoingactions to reduce the proportion of indirect distribution,taking direct control wherever possible of the brand’sstore network and further enhancing the consistency ofthe consumer’s experience across different markets.
In this environment, Gucci intends to continue achievingbest-in-class profitability and long-term sustainablegrowth across product categories and geographic regions,while always maintaining high standards of socialresponsibility.
GUCCI ~ LUXURY DIVISION ~ OUR ACTIVITIES
2013 HIGHLIGHTS AND OUTLOOK FOR 2014
Gucci’s fashion authority – a fundamental part of thebrand’s DNA – was again on full display in 2013. Duringthe year Gucci introduced a series of new, iconic andsuccessful products, including the very sophisticated nologo leather handbags, the Lady Lock and BambooShopper, which both contain signature details such asthe bamboo handle. Launched in the Fall/Winter 2013-14 collections, the Lady Lock and Bamboo Shopperquickly joined the top-selling bags in most regions. 2013was also the sixtieth anniversary of Gucci’s legendaryhorsebit loafer, which was celebrated with thereinterpretation of the classic loafer for both women andmen, in seasonal colors and fine materials, supported byan innovative 360-degree communication effort.
Across most regions, the effective implementation ofGucci’s strategy was confirmed by the solid top-linegrowth posted by the retail business in most of theworld’s regions. In some countries – notably China – thisstrategy is currently being implemented and thereforerequires further time to be reflected in the sales trend.However, as already seen in regions where this strategywas first implemented, such as the US, Japan andWestern Europe, it should bring tangible benefits to thesales trend over time.
During the year, Gucci’s distribution strategy has beendriven by the goal to ensure coverage in untapped markets,such as Brazil, while also bolstering its presence in keyWestern European countries such as France. This cametogether with the effective roll-out of an ambitiousrefurbishment plan, in order to bring the store network tothe same high standard as Gucci’s products and to createa consistent brand image across regions.
Gucci also continued its buyback strategy across differentmarkets. In North America the process has been completedin many department stores, while in others there is stillroom to convert its presence into directly-operated stores.As of today, the most recent and evident achievements ofGucci’s wholesale conversion strategy are in NorthAmerica (with the completed buyback of SAKS and HoltRenfrew doors this year).
To meet the growing customer appetite for specificproduct categories, 2013 saw an increased number ofnew stores dedicated to the Children’s Collections andMen’s World. Specifically, in June Gucci opened its firstmen’s flagship in Europe, in Milan’s historic Brera district.The store was also the first to offer the capsule Made to
232013 Financial Document ~ Kering
02_VA_V7 20/02/14 16:57 Page23

2 OUR ACTIVITIES ~ LUXURY DIVISION ~ GUCCI
Measure collection designed by Creative Director FridaGiannini and Lapo Elkann, a contemporary statement ofclassic tailoring conceived as “Lapo’s Wardrobe”.
Respect for the House’s heritage and traditions goeshand-in-hand with the desire to keep the brand relevantand vibrant for new generations of customers. In thisregard, Gucci has indeed been successful in reaching newcustomers thanks to the attention paid to the internet inthe last ten years. Through the various and diversifieddigital channels, Gucci is able today to reach a broadaudience – more than 25 million of people – in a verydirect and content-rich way. As of today, Gucci operates e-commerce in 28 countries.
In 2013, Gucci again introduced several productinnovations as both a continuation of Gucci’s leadershipin social responsibility and a way to satisfy the modernconsumer’s desire for ethically-produced, sustainablefashion products. In July, Gucci also announced that ithad developed an innovative methodology to reduce theenvironmental impact of the leather tanning process.
Indicative of the company’s attention to its Florentineroots and in line with its strategy of showcasing theexcellence of Italian-manufactured products all over theworld, in April 2013 Gucci finalised the acquisition ofRichard Ginori 1735, the leading Italian brand in finechina tableware. The goal of the acquisition is to re-launch in the medium and long-term the historicFlorentine brand – which has always been synonymouswith quality, craftsmanship and made in Italy, the samevalues that lie at the heart of the Gucci brand’s success.
In February, Gucci announced the foundation of CHIMEFOR CHANGE, a global campaign to raise funds andawareness for girls’ and women’s empowerment. OnJune 1, the London concert “THE SOUND OF CHANGE LIVE”attended by more than 50,000 people and broadcast inover 150 countries – gathered together some of theworld’s most talented artists and renowned activists togive a voice to girls’ and women’s empowerment issuesworldwide, and in doing so raised almost USD 4 million inticket sales for around 210 projects in over 70 countriesaround the world.
In 2014, Gucci’s management team will continueinvesting to consolidate the uniqueness of the brandpositioning to build its brand equity and drive long-termsustainable growth, enhance its commitment tocustomers, and focus on nurturing further its higher-endproduct offering, both through novelties and carry-overs.
Gucci will also continue to enhance its retail excellence,both through selective store openings and by pursuing
retail excellence, either through wholesale conversions inEastern Europe and South-East Asia, or through retailstore refurbishments in key cities.
Revenue and recurringoperating income
Revenue (in € millions)
Recurring operating income (in € millions)2012 2013
3,561
1,132
3,639
1,126
Number of directly-operated stores by region
Total 2012: 429Total 2013: 474
WesternEurope
NorthAmerica
Japan
66 66
100116
97109
Emergingcountries
166183
24 Kering ~ 2013 Financial Document
02_VA_V7 20/02/14 16:57 Page24

2BOTTEGA VENETA ~ LUXURY DIVISION ~ OUR ACTIVITIES
2013 key figures
€1,016 millionin revenue
€331 millionin recurring operating income
2,891average number of employees
221directly-operated stores
Breakdown of 2013 revenueby product category
Breakdown of 2013 revenueby region
Leather goods 86%Shoes 6%
Ready-to-wear 6%Other 2%
Western Europe 28%North America 13%
Asia Pacific 40%
Japan 15%Other countries 4%
BUSINESS CONCEPT
Founded in 1966 in the Veneto Region of Italy, BottegaVeneta began as a leather goods House made famousthrough its signature intrecciato, a unique leatherweaving technique used by Bottega Veneta’ s artisans asa way to strengthen the soft leather, and to achieveproducts that are not only made of the utmost qualitymaterials, but also long lasting. The brand led the way inintroducing soft, deconstructed handbags – as opposedto the usual rigid structure that originated with theFrench school – and quickly became well recognised andappreciated in the market. Bottega Veneta has evolvedthrough the years from being a luxury leather goodsHouse into an absolute luxury Lifestyle brand byexpanding its product range respecting both the desiresof the customer and the aesthetic sensibility of thebrand. The brand’ s famous motto, “When your own initialsare enough”, now applies to a range of products includingleather goods (handbags, small leather goods and acomplete luggage collection), women’ s and men’ sready-to-wear, shoes, jewellery, furniture and more.
Over the years, the brand has also been engaged incollaborations with strategic partners that share the samevalues and commitment to quality and craftsmanship,such as Poltrona Frau (seating), KPM (porcelain), VictorMayer (fine jewellery), Girard-Perregaux (watches), CotyPrestige (fragrances), Safilo (eyewear), and Rizzoli (books).
Bottega Veneta products are sold exclusively through a distribution network of directly-operated stores,complemented by exclusive franchise stores and strictly-selected department and specialty stores worldwide. Inaddition, Bottega Veneta products are now availablethrough the brand’ s online store in 46 countries.
COMPEtitiVE ENVIRONMENT
Bottega Veneta is one of the only Italian brands to offertruly handcrafted products made with the expert know-how of its master Italian artisans, and a rare example ofan absolute luxury Lifestyle brand, never compromisingthe quality of its products, while always providing anunsurpassed level of service to clients, which places thebrand at the top of the luxury pyramid in terms ofpositioning, therefore competing with a very limitednumber of brands.
252013 Financial Document ~ Kering
02_VA_V7 20/02/14 16:57 Page25

StrATEGY
Bottega Veneta’ s strategy, implemented under the creativedirection of Tomas Maier and the leadership of Presidentand CEO Marco Bizzarri, aims to position Bottega Venetaas a high-end and exclusive luxury Lifestyle brand, forwhich consistency and continuity are the key elements tomaintaining differentiation in the industry.
The core of the business historically lies in the leather goodsproduct categories, characterised by the attention todetails and the use of the highest quality of materials,progressively integrating a wider range of productsappealing to a sophisticated clientele of women and men,through contemporary functionality and timeless design.
The predominant trait of exclusivity has been transferredto the distribution network; through a significantworldwide expansion, Bottega Veneta consolidated itspresence in the emerging markets, without compromisingthe investments in the mature markets, especially Europe,origin of Bottega Veneta’ s tradition and craftsmanship.
Always focused on nurturing core values, the brandoperates mainly through directly-operated stores, while asmall part of the business is covered by a distinctiveselection of franchise boutiques and department andspecialty stores.
2013 HIGHLIGHTS AND OUTLOOK FOR 2014
In 2013, the careful execution of the internationaldevelopment strategy, consistent with the exclusivepositioning of the brand, resulted in growth recorded inall geographic areas, of which mature markets accountfor 56% of total sales, and for both retail and wholesalechannels, which respectively account for 81% and 19% oftotal sales. Leather goods continue to be the core for thebrand, constituting 86% of total sales.
Iconic leather goods products, also in new seasonalvariations, continued to represent a very important part ofthe business in 2013, while men’ s categories performedexceptionally well, underlining Bottega Veneta’ s strategiceffort to expand in this clientele segment.
Consequent to the successful 2011 introduction of itssignature women’s fragrance, in June 2013 BottegaVeneta launched its first fragrance for men, BottegaVeneta Pour Homme, further leveraging the BottegaVeneta brand and expanding its brand awareness.
Bottega Veneta opened the new Atelier in MontebelloVicentino in 2013, marking a new milestone for thedevelopment of the brand. The new site, a 55,000 squaremetre park with a historical villa, includes the ScuolaDella Pelletteria Bottega Veneta, where young artisans aretrained and taught Bottega Veneta’s exceptionalcraftsmanship capabilities. In this way the company willsecure the presence of the tradition and know-how foryears to come.
In 2013, Bottega Veneta enhanced its retail network withselective store openings worldwide, in both emerging andmature markets, reaching 221 compared to 196 at theend of 2012. The new stores were equally distributed inemerging and mature markets (14 new stores in APACand 11 new stores among Europe, Japan and America).
As a further step in the implementation of its absolute brandpositioning strategy, Bottega Veneta opened the brand’sfirst Maison in the world in September 2013. Located inthe prestigious Milan location of Via Sant’Andrea 15, thedesign and approach to the customer renders the brand’slargest store in the world unique among the entire retailnetwork, and represents an addition to the historicflagship located at Via Montenapoleone 5. The Maisonshowcases the entire Bottega Veneta product range, whilemaintaining the level of intimacy and utmost quality ofservice that characterises the brand.
In addition, in 2013 Bottega Veneta opened a gallery-likeboutique in Los Angeles on Melrose Place. The boutique,measuring 2,727 square feet, illustrates the retailevolution of the brand, and is part of Bottega Veneta’sapproach to the shopping experience for cities in whichthe brand is already established. This concept has beentailored to meet proclivities and tastes of the clientele inthose specific local areas.
During the year, following the success of a similar initiativeorganised at the Shanghai Yfeng Galleria Flagship store inthe previous year, Bottega Veneta brought artisans fromits Italian atelier to Japan for the first time, in order tospread the knowledge of its unique craftsmanship in oneof its key mature markets. The occasion was the BottegaVeneta World Exclusive for the Japanese departmentstore Isetan, a two-week event that kicked off in May 2013,during which an extensive presentation of the brand’sproduct range was exclusively displayed throughout theShinjuku flagship location and in all 15 windows,ultimately becoming for Isetan and the brand the firstinstallation of this scale.
In 2014, Bottega Veneta will continue to build on itsaccomplishments and positioning, supported by further
26 Kering ~ 2013 Financial Document
2 OUR ACTIVITIES ~ LUXURY DIVISION ~ BOTTEGA VENETA
02_VA_V7 20/02/14 16:57 Page26
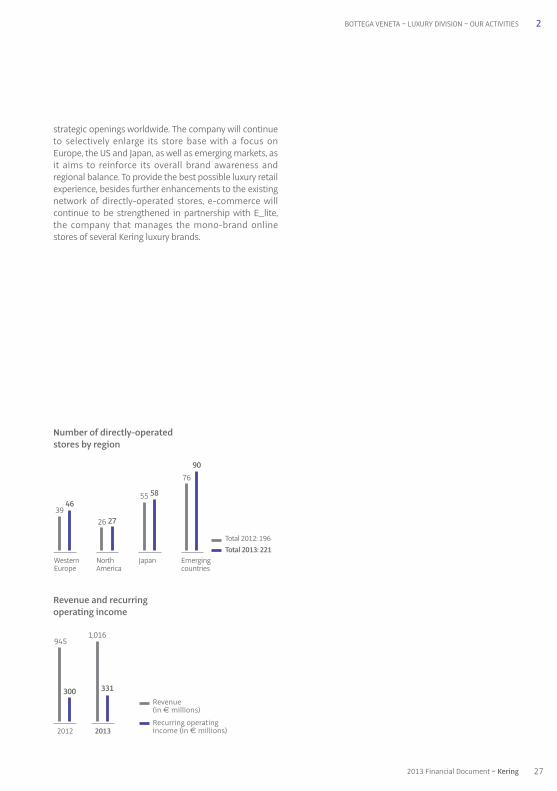
strategic openings worldwide. The company will continueto selectively enlarge its store base with a focus onEurope, the US and Japan, as well as emerging markets, asit aims to reinforce its overall brand awareness andregional balance. To provide the best possible luxury retailexperience, besides further enhancements to the existingnetwork of directly-operated stores, e-commerce willcontinue to be strengthened in partnership with E_lite,the company that manages the mono-brand onlinestores of several Kering luxury brands.
27
2
2013 Financial Document ~ Kering
BOTTEGA VENETA ~ LUXURY DIVISION ~ OUR ACTIVITIES
Revenue and recurringoperating income
Revenue (in € millions)
Recurring operating income (in € millions)2012 2013
1,016
331
945
300
Number of directly-operated stores by region
Total 2012: 196Total 2013: 221
WesternEurope
NorthAmerica
Japan
55 58
26 2739
46
Emergingcountries
7690
02_VA_V7 20/02/14 16:57 Page27

2 OUR ACTIVITIES ~ LUXURY DIVISION ~ SAINT LAURENT
2013 key figures
€557 millionin revenue
€77 millionin recurring operating income
1,445average number of employees
115directly-operated stores
Breakdown of 2013 revenueby product category
Breakdown of 2013 revenueby region
Leather goods 44%Shoes 22%
Ready-to-wear 24%Other 10%
Western Europe 42%North America 22%
Asia Pacific 20%
Japan 8%Other countries 8%
BUSINESS CONCEPT
Founded in 1961, Yves Saint Laurent is one of the mostprominent fashion houses of the 20th century. Originallyan haute couture House, in 1966 Yves Saint Laurentrevolutionised modern fashion through the introductionof luxury ready-to-wear under the name Saint LaurentRive Gauche.
Saint Laurent designs and markets a broad range ofmen’s and women’s ready-to-wear, handbags, shoes,small leather goods, jewellery, scarves, ties and eyewear.Production is divided between Italy and France, where anhistoric workshop manufactures ready-to-wear garments.Under worldwide licence agreements, the House alsoproduces and distributes eyewear through Safilo as wellas fragances and cosmetics with L’Oréal.
In March 2012, the House of Yves Saint Laurent announcedthe appointment of Hedi Slimane as Creative Director.Leading Yves Saint Laurent into a new era, Hedi Slimanerecaptured the impulses of ‘youth, freedom and modernity’that inspired the founder to launch Saint Laurent RiveGauche ready-to-wear in 1966.
As of December 31, 2013, Saint Laurent retail networkconsists of 115 directly-operated boutiques which togethergenerated 56% of total revenue for the year and includeflagships in Paris, London, New York, Hong Kong, Shanghai,Beijing and Los Angeles. the house is also represented inselect multi-brand boutiques and department storesaround the world.
At the end of 2013, the Saint Laurent business was verywell balanced in terms of both geographic markets andproduct categories, with leather goods and shoesaccounting for 66% of business and ready-to-wearposting the fastest growth at 51% compared to last year.
28 Kering ~ 2013 Financial Document
02_VA_V7 20/02/14 16:57 Page28

29
2
2013 Financial Document ~ Kering
SAINT LAURENT ~ LUXURY DIVISION ~ OUR ACTIVITIES
COMPEtitiVE ENVIRONMENT
Since its inception, Yves Saint Laurent has held enormousinfluence within and outside the fashion industry.Through the years, its founder, the couturier Yves SaintLaurent, secured a reputation as one of the 20th century’sforemost designers and personalities.
Saint Laurent now competes globally with other Frenchhigh-end exclusive luxury brands and occupies a leadingposition in ready-to-wear, fashion and leather goodssectors.
StrATEGY
Saint Laurent’s primary objective is to create and markethighly desirable products, which embody the core valuesof the brand through innovation and unparalleled qualityand design.
Since his arrival, Hedi Slimane has entirely redefined themen’s and women’s collections and worked on new linesfor all categories. The collections for men and womenhave been repositioned and made even in terms of depthof the offer and product ranges. This repositioning isaccompanied by a rejuvenation of the style, in line withYves Saint Laurent’s original message of 1966. Ready-to-wear is therefore once again becoming a strong componentof Saint Laurent’s overall product offer, across bothgenders. At the same time Saint Laurent aims to furthernurture the development of its leather goods, shoes andother accessories offering.
2013 HIGHLIGHTS AND OUTLOOK FOR 2014
Under the leadership of Hedi Slimane and FrancescaBellettini, appointed CEO in September of last year, 2013has been a very rich year for Saint Laurent, with aparticular focus on new product launches, across all themain categories.
During the year, the brand’s sales were fuelled by theextremely strong growth figures posted by ready-to-wearin both retail and wholesale channels. Accessories andshoes transitioned smoothly into the new brandaesthetic, driven by the success of new styles, such as theSac de Jour handbag and Paris shoes. Notable success andcritical acclaim were also achieved for Saint Laurentfashion collections during 2013, which received significantexposure through editorials and global celebrities.
Saint Laurent also marked a year of investment in 2013,enhancing its retail network with selective store openingsworldwide, in both emerging and mature markets, andkey refurbishments and relocations.
In May 2013, the opening of the Avenue Montaigne flagshipin Paris was a significant step in the evolution of SaintLaurent under Hedi Slimane. Being located in one of themost prestigious districts for luxury shopping, it was animportant move for Yves Saint Laurent as a couture Housethat is deeply rooted in Paris. In June 2013, SaintLaurent – which operates an Uptown store on New York’sEast 57th Street – opened a store in Soho.
The establishment of the new ysl.com website has alsoplayed a key role – redesigned at the end of 2012, it featuresrich content and is a dynamic e-commerce platform thatalso forms part of the overall cross channel retail strategy.From June 2013, ysl.com added 30 additional countries,and now offers e-commerce to 60 countries around theworld. Furthermore, ysl.com moved onto the Yooxplatform as part of E_lite, the joint venture between Keringand Yoox signed in 2012, whereby the latter provides theinfrastructure for managing operations while SaintLaurent remains in full control of the image, productassortment, editorial content and art direction of the site.
Social media initiatives were met with extraordinarysuccess as social platforms were fully integrated intoglobal communications practices and strategies. As ofDecember 2013, Yves Saint Laurent had nearly 1.8 millionfans on Facebook and was one of the most popularluxury brands on Twitter with over 1.7 million followers.
02_VA_V7 20/02/14 16:57 Page29
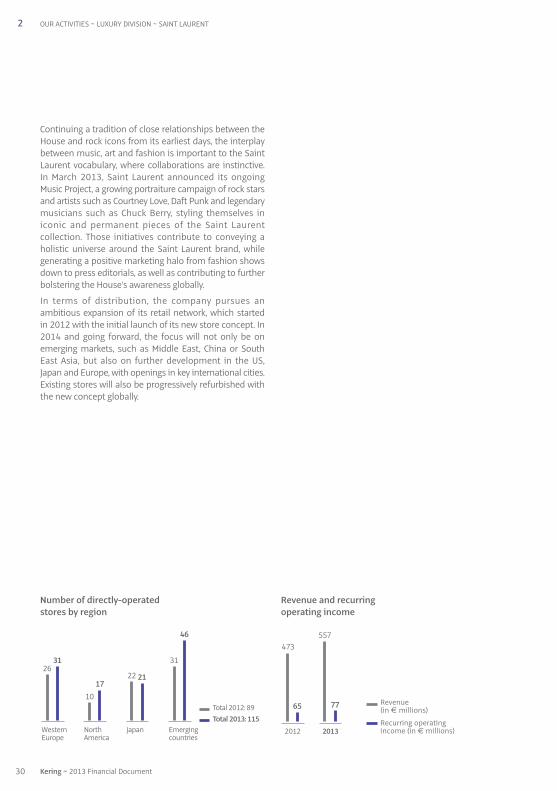
Continuing a tradition of close relationships between theHouse and rock icons from its earliest days, the interplaybetween music, art and fashion is important to the SaintLaurent vocabulary, where collaborations are instinctive.In March 2013, Saint Laurent announced its ongoingMusic Project, a growing portraiture campaign of rock starsand artists such as Courtney Love, Daft Punk and legendarymusicians such as Chuck Berry, styling themselves iniconic and permanent pieces of the Saint Laurentcollection. Those initiatives contribute to conveying aholistic universe around the Saint Laurent brand, whilegenerating a positive marketing halo from fashion showsdown to press editorials, as well as contributing to furtherbolstering the House’s awareness globally.
In terms of distribution, the company pursues anambitious expansion of its retail network, which startedin 2012 with the initial launch of its new store concept. In2014 and going forward, the focus will not only be onemerging markets, such as Middle East, China or SouthEast Asia, but also on further development in the US,Japan and Europe, with openings in key international cities.Existing stores will also be progressively refurbished withthe new concept globally.
30 Kering ~ 2013 Financial Document
2 OUR ACTIVITIES ~ LUXURY DIVISION ~ SAINT LAURENT
Revenue and recurringoperating income
Revenue (in € millions)
Recurring operating income (in € millions)2012 2013
557
77
473
65
Number of directly-operated stores by region
Total 2012: 89Total 2013: 115
WesternEurope
NorthAmerica
Japan
22 21
1017
2631
Emergingcountries
31
46
02_VA_V7 20/02/14 16:57 Page30

31
2
2013 Financial Document ~ Kering
OTHER BRANDS ~ LUXURY DIVISION ~ OUR ACTIVITIES
Revenue and recurringoperating income
Revenue (in € millions)
Recurring operatingincome (in € millions)2012 2013
1,337
144
1,156
120
Number of directly-operated stores by region
Total 2012: 244Total 2013: 339
WesternEurope
NorthAmerica
Japan
94104
2537
83
118
Emergingcountries
42
80
Other brands2013 key figures
€1,337 millionin revenue
€144 millionin recurring operating income
5,299average number of employees
339directly-operated stores
• Alexander McQueen
• Balenciaga
• Boucheron
• Brioni
• Christopher Kane
• Girard-Perregaux and JEANRICHARD
• Pomellato and Dodo
• Qeelin
• Sergio Rossi
• Stella McCartney
02_VA_V7 20/02/14 16:57 Page31

Founded in 1992 by Lee Alexander McQueen the brandquickly gained a reputation for conceptual design and astrong brand identity which led to a partnership withKering in 2001. The brand is now fully owned by Keringsince the passing of Lee Alexander McQueen in 2010.
Renowned for its unbridled creativity, Alexander McQueen –under the leadership of the CEO, Jonathan Akeroyd andthe vision of Sarah Burton, Creative Director since 2010 –has strongly developed its business internationallythrough both wholesale and retail channels over the pastdecade with wholesale being a key driver of growth. Inrecent years there has been an escalation of retailopenings which has enabled the brand to strengthen itsposition in the luxury arena.
Alexander McQueen currently has a total network of 24 directly-operated stores across all regions. This yearfive new stores were opened in Tokyo, Dallas, Shanghai,Hong Kong and San Francisco. In September 2013, thebrand relocated its New York flagship to Madison Avenue.Its London flagship was refurbished to complement a newstore concept that has helped to communicate a moreluxurious positioning for the brand. All collections arealso sold online in most countries, through the jointventure established with Yoox.
On the distribution side, the brand is sold in over 50 countriesand across more than 450 doors. Key partners are Saksand Neiman Marcus in the US, Harrods and Selfridges inthe UK and Lane Crawford in Asia. In all of these doorsAlexander McQueen is considered a successful brand.This has enabled the brand to open numerous shop-in-shops over recent years which has helped establish astronger brand image and business.
Franchises are also an important part of the distributionchannel and there are today 10 franchise boutiques,most of which are concentrated in the Middle East andEastern Europe.
Main product categories are women’s ready-to-wear andleather goods, although another strength of the brand isthat it has a good spread across all categories which givesit the opportunity to develop business further in manyareas. Silks and menswear have both developed stronglyin recent years and two men’s only stores were opened in2012 to help this category to develop further. There is also aneyewear licence with Safilo and a fragrance licence wassigned in 2013 with Procter & Gamble which will give thebrand an important platform to build on in coming years.
The company has also successfully developed McQ, anadditional brand which started as a licence in 2006 andwas re-launched as an in-house brand in 2011. The McQbrand has quickly established itself in the popularcontemporary market and is not only an importantcontributor to the overall Alexander McQueen businessbut also an important player in the contemporary sector.
McQ is distributed at a broader level and is sold primarilyas a wholesale business internationally with a total of more than 500 doors. Franchises are an important partof the business with nine openings in 2013 includingShanghai, Beijing and Seoul, leading to a total of 11franchise stores mainly in Asia and the Middle East. Afreestanding directly-operated store was opened in DoverStreet London in 2012 to help support the positioning ofthe brand to the market.
The development of McQ will enable the brand to pushfurther in the growing contemporary market and also enablethe Alexander McQueen brand to remain very exclusive.
In 2014 both brands will continue to develop further witha continued focus on product development especially inthe accessories categories. There will also be further retailopenings for Alexander McQueen. Marketing activities willalso be strengthened to build on the current momentumand improve brand awareness following on from thehugely successful brand exhibition “Savage Beauty” thatwas held at the Metropolitan Museum in New York andwhich will be shown in London in 2015.
32 Kering ~ 2013 Financial Document
2 OUR ACTIVITIES ~ LUXURY DIVISION~ OTHER BRANDS
02_VA_V7 20/02/14 16:57 Page32

Founded in 1919 by Cristóbal Balenciaga and establishedin Paris in 1936, the brand defined many of the greatestmovements in fashion from the 1930s to the 1960s. Themastery of techniques and cut, together with constantinnovation in fabrics, marked out a special place for Balenciagain the hearts and minds of its customers and followers.
In the 1990s and early 2000s, the brand experienced a re-birth,which saw an extension of its product universe onto abroader range of products, with particular focus on iconichandbag launches, together with increased focus onfashion shoes as well as accessories, without compromisingthe core ready-to-wear segment. The brand also witnesseda significant expansion of its retail network, furthercontributing to bolstering its brand awareness around theglobe. Reflecting this, Balenciaga is now equally distributedthrough directly-operated stores and e-commerce, as wellas through franchisees and leading multi-brand stores.
While the brand’s identity is firmly anchored on its highlysymbolic ready-to-wear collections, its bag and shoelines have also enjoyed phenomenal worldwide success.The women’s and men’s ready-to-wear collections span awide price range, from the most emblematic items tomore universal products, thus opening Balenciaga’s styleto a wider public.
In fragrance, the brand has established a solid licensepartnership with Coty and has released some successfulperfumes: Balenciaga Paris, L’Essence and Florabotanica.More recently, a similar partnership with Marcolin has beenbuilt up in eyewear with a first promising collection launchedat the end of 2013.
With his proven talent and cosmopolitan vision of design,Alexander Wang – appointed Creative Director inDecember 2012 – has embraced the heritage of thisfashion House.
Over the past years, under CEO Isabelle Guichot’s leadership,Balenciaga has been developing a project aimed atconsolidating a directly-operated store network worldwide.Today Balenciaga has a retail network of 81 stores welldeveloped in both mature markets (Western Europe, US and Japan) and Asia (Greater China and South Korea).In addition, Balenciaga e-commerce currently covers 91 countries and since May 2013 has been operated throughthe E_lite platform, under a new joint venture created byKering and Yoox.
2013 has been another milestone in Balenciaga’s retailstrategy, with the setup of direct operations in SouthKorea (seven directly-operated stores) and the opening inNovember of two new flagships (one dedicated toWomen and the other to Men) in New York’s Soho District,giving complete access to Balenciaga’s entire range ofproducts for the first time in such a premium retaillocation and unveiling the first version of its new retailconcept under Alexander Wang’s vision.
Balenciaga also continued to strengthen its position inmainland China, with two net store openings in additionto the twelve stores already existing in the country. Duringthe year the brand also extended its retail presence inupscale department stores with the opening of threeshop-in-shops in Paris, London and Tokyo.
In 2014, the brand will continue to leverage the impetusprovided by new product launches, together with a focuson further developing its retail concepts around theworld. Franchise and selective distribution remain keycontributors to the brand activity, but retail and e-commerce development will continue to be a priority forthe brand in 2014 and going forward, with new storeopenings planned in strategic locations in maturemarkets and in Asia.
33
2
2013 Financial Document ~ Kering
OTHER BRANDS ~ LUXURY DIVISION ~ OUR ACTIVITIES
02_VA_V7 20/02/14 16:57 Page33
Founded in Paris in 1858 by Frédéric Boucheron, theeponymous Maison grew up under four generations ofthe founder’s direct descendants and soon acquiredfame as an expert in precious stones and as a master ofsavoir-faire in creating innovative jewellery and watches.The jeweler, which decided to move to Place Vendôme in1893, was the first of the current neighbours to open aboutique on the square. For more than 150 years Boucheronhas embodied excellence in Jewellery, High Jewellery andWatchmaking.
Today, Boucheron creates and markets jewellery (bijoux,jewellery as well as high jewellery) and watches through37 directly-operated stores across the world, includingthe flagship Place Vendôme store, franchise boutiques,department stores and exclusive multi-brand boutiques.
For the Maison, 2013 marked the launch of a new boutiqueconcept, enhancing its high-end values of excellence andFrench know-how. By the end of the year, ten stores hadbeen refurbished in line with the new concept. TheFaubourg Saint-Honoré boutique in Paris, and the Harrodsshop-in-shop in London were the first stores offering thenew image of the Maison.
After the opening in 2012 of its first directly-operated storein Hong Kong, in 2013 Boucheron expanded its networkin the APAC region with a second DOS in Hong Kong andthe renovation of the Taipei boutique. In addition, twonew franchise stores were opened in Shanghai and AbuDhabi. The recent establishment of a Boucheron officeand local team in Hong Kong has also strengthened theMaison’s retail presence in this key area.
With the relaunch of iconic jewellery collections such asQuatre and Serpent Bohème in 2013, Boucheron experiencedsolid growth during the year. The second High Jewelrycollection designed by Claire Choisne enjoyed strong successwith both media and clients, giving the Maison a greatplatform to leverage for the years to come. In 2013, in orderto build brand awareness outside the home country,Boucheron strengthened its exposure to the luxury andcultural scenes, promoting two exhibitions with two majorJapanese artists, Makoto Azuma and Hiroshi Sugimoto.
In 2014 and in the following years Boucheron will continueto reinforce its retail network worldwide. The presentationof the collections during the renowned 2014 Biennale desAntiquaires in Paris should also help to consolidate Boucheron’spresence among the best international jewellers.
34 Kering ~ 2013 Financial Document
2 OUR ACTIVITIES ~ LUXURY DIVISION~ OTHER BRANDS
02_VA_V7 20/02/14 16:57 Page34

Brioni was founded in 1945 by two representatives ofItalian excellence, Nazareno Fonticoli, a tailor from Abruzzo,and an entrepreneur, Gaetano Savini, whose vision was toset a new reference in tailoring. Shortly after its creation,Brioni embodied the Dolce Vita spirit in menswear andbecame the first ambassador for Italian men’s fashion aroundthe world. Over the years Brioni developed a very stronginternational appeal, becoming one of the world’s mostfamous men’s tailoring houses and the symbol of masculineand contemporary elegance. Illustrating this, in 2007 andagain in 2011, the Luxury Institute of New York named Brionias the most prestigious men’s luxury fashion brand in America.
In January 2012, Brioni became part of the Kering group andin July of the same year, Brendan Mullane was appointedas Creative Director, to reinforce and achieve the company’sgrowth ambitions and to re-affirm its undisputed leadershipin the high-end menswear market. Beyond its coreformalwear offer, Brioni’s product range currently coversall categories of men’s attire, including casual ready-to-wear, leather goods, shoes and other accessories such aseyewear, launched in 2012.
Today, under the leadership of CEO Francesco Pesci, theHouse stands as much for the “Made in Brioni” promise,which goes even further than “Made in Italy” craftsmanship,as it does for its iconic and recognisable products. Mostof the production is carefully crafted in Brioni’s ateliers inPenne (Abruzzo), where its artisans apply a combinationof unique savoir-faire:
• the art of tailoring: a grand tradition combining highlyskilled master tailors and its own tailoring school toperpetuate know-how;
• a customised approach: a Brioni garment must reflectthe wearer’s personality and inner style. That is whyBrioni’s bespoke expertise is applied to both made-to-measure and to ready-to-wear, offering customers thehighest level of personalisation;
• a daring use of colour to stand out from the crowd. Brioniwas the only sartorial brand to use colour at a timewhen British codes stood for the conventional shadesof grey, blue and black.
While wholesale still represents Brioni’s major distributionchannel, in recent years the brand has developed a retailnetwork through both new store openings as well as thebuy-back of franchise stores.
At the end of 2013, Brioni had 45 directly-operated stores,mainly located in Western Europe, North America and Japan.During the year, Brioni expanded its retail network in NorthAmerica, Asia and Western Europe with 10 net openings,including three stores in the United States (Chicago, CostaMesa and Palm Beach), five franchise stores that have beenbought back in Mainland China and two stores in WesternEurope (Vienna and Frankfurt). Management’s goal for2014 and for the medium to long-term is to further expandthe retail network and to strengthen the company’spresence in Asia and onto other emerging markets.
35
2
2013 Financial Document ~ Kering
OTHER BRANDS ~ LUXURY DIVISION ~ OUR ACTIVITIES
02_VA_V7 20/02/14 16:57 Page35

Incepted in 2006 by eponymous designer, Christopher Kaneis a brand which is now widely acknowledged to havespearheaded a revival of British high fashion, through thelaunch of innovative ready-to-wear styles. After havingcompleted his Master of Arts (MA) in Fashion design at CentralSaint Martins College, Christopher Kane realised his ambitionto start his own label, in partnership with his older sister,Tammy Kane.
Today, the brand, driven by aesthetics, attitude and spiritof collections that are immediately recognisable, designsdistinctly identifiable high-end women’s and men’sready-to-wear pieces.
In January 2013 Kering announced the purchase of a 51%share of the company. In September, Christopher Kane andKering announced the appointment of Alexandre de Brettesas CEO of the brand, this announcement forms part of thecompany’s global development strategy. Finally, in DecemberChristopher Kane was awarded with the prestigious 2013Womenswear Designer of the Year by the British Fashion
Council (BFC). The award, which is given to a designer whohas been instrumental in enhancing women’s fashion,recognises a triumphant year for the London-based brand.The increased brand awareness in 2013 has resulted instrong growth across all product categories in thewholesale channel.
On the distribution side, Christopher Kane’s collectionsare now distributed in over 30 countries across more than150 wholesale accounts. The primary product category is women’s ready-to-wear. The menswear category wasadded in Spring 2011. The company also produces shoesto accompany these collections, which will be expandedover the next few years.
In 2014 the brand will open its first flagship store inLondon, which will be situated on Mount Street, Mayfair.Further growth is also planned in the wholesale channel,which will be assisted by the launch of the brand’s firstleather goods collection.
36 Kering ~ 2013 Financial Document
2 OUR ACTIVITIES ~ LUXURY DIVISION~ OTHER BRANDS
02_VA_V7 20/02/14 16:57 Page36
Based in La-Chaux-de-Fonds, Girard-Perregaux is a high-end Swiss watch manufacturer tracing its origins back to1791. The history of the brand is marked by watches thatcombine sharp design with innovative technology such asthe renowned Tourbillon with three Gold Bridges presentedby Constant Girard-Perregaux in 1889 at the ParisUniversal exhibition where he was awarded a gold medal.
Devoted to the creation of state-of-the-art Haute Horlogerie,Girard-Perregaux is one of the very few watchmakers tocombine all the skills of design and in-house manufacture,including the forging of the movements.
Since 2011, when Kering took a majority stake in SowindGroup, owner of Girard-Perregaux, the brand hasimplemented a new strategy aimed at creating a bridgebetween its rich past and its future. The collections werestreamlined while the launch of two new concepts in2013 (Hawk and Traveller) aimed at strengthening Girard-Perregaux’s position in Western markets and the Middle-East. In the high-end segment, the presentation of the“ Constant Force escapement ” at Baselworld 2013 wasacclaimed by the industry. As the result of more than eightyears of research and development, this groundbreakingconcept was awarded this year’s Aiguille d’or at the GrandPrix de Genève (GPHG), the most prestigious award withinthe global watch industry.
Mainly driven by wholesale business, Girard-Perregaux is nowpresent in over 70 countries across some 450 wholesaleaccounts (including prestigious department stores and specialties shops) as well as 17 mono brand stores(16 franchise stores and one directly-operated store)located in Asia, Europe and the United States. Newdistribution partners were added to drive the brand’sfuture growth in South America, in Europe and in theMiddle-East.
Based also in La Chaux-de-Fonds, JEANRICHARD was namedafter Daniel JEANRICHARD, who pioneered the Swisswatchmaking industry during the 17th century and inventedseveral machines and tools that are still crucial formanufacturing timepieces. This visionary and pioneeringspirit, which has been cultivated by his successors eversince, remains the soul of JEANRICHARD.
In 2012, JEANRICHARD launched its new identity andstrategic development based on the communicationpillars of traditional watchmaking, land, water and air. Inthis occasion, the overall positioning of JEANRICHARD hasbeen reviewed, in order to better anchor the brand at theforefront of the accessible luxury segment.
The collection – based on a common complex andinnovative “chassis” industrial platform case – embodiesthese four pillars with the “1681” (a contemporary re-interpretation of a traditional look, using the JR1000manufacture movement with automatic winding,created in 2004, conceived and built entirely in itsworkshops), the “Terrascope”, the “Aquascope” and the“Aeroscope”. For each of these environments, JEANRICHARDtells stories of people whose passions have driven themto do extraordinary things.
Today, JEANRICHARD is available in most regions of theworld through more than 150 points of sale with keyindependent retailers and high-end watch chains. Itsmost relevant presence today is in North America and LatinAmerica and the roll-out of the distribution network isexpected to continue in 2014 – particularly in Europe andAsia, where the brand already has a good presence in GreaterChina – and aims to reach 250-300 points of sale worldwide.
Sowind Haute Horlogerie Group, besides owning Girard-Perregaux and JEANRICHARD brands, incorporates amanufacturing activity that develops and produces acomplete portfolio of high-end watch movements andmechanical watches for its two brands and third parties,including Kering brands such as Gucci, Bottega Venetaand Boucheron.
37
2
2013 Financial Document ~ Kering
OTHER BRANDS ~ LUXURY DIVISION ~ OUR ACTIVITIES
02_VA_V7 20/02/14 16:57 Page37
2 OUR ACTIVITIES ~ LUXURY DIVISION~ OTHER BRANDS
38 Kering ~ 2013 Financial Document
Synonymous with creativity and character in theinternational jewellery scene, Pomellato was establishedin Milan in 1967, thanks to the intuition of its founder,Pino Rabolini, who was the first to introduce the prêt-à-porter philosophy into the world of jewellery. The brand’sstrong and distinctive identity enabled Pomellato torapidly gain ground in the Italian market and subsequentlyin the rest of the world.
Pomellato creations – unique in their blend of colourful stones,stone cutting and setting methods – are immediatelyrecognisable and have built a consistent, iconic style overtime. Jewels are crafted by the expert hands of goldsmiths,transforming the spirit of the brand into gold.
Dodo was created in 1995, the first jewellery line tocombine a decorative function with the idea of conveyinga message. With a unisex and multi-generational allure,Dodo became an independent brand in 2001.
To celebrate its 40th anniversary, in 2007 Pomellato madeits debut into high-end jewellery with the Pom Pom collection.Every ring is created around stones that are unique intheir rarity, large size or irregular shape. This results insophisticated, excessive, contemporary jewels, whosehigh value combines culture with an unconventional flair.
2012 was the debut year for Pomellato 67, with the brandreinterpreting the rock and transgressive spirit of the late60s in a stunning collection, translating the style codes ofthe Milanese Maison into solid silver.
In 2013 Pomellato created Rouge Passion, a capsulecollection dedicated to a woman’s most “sensual” side.Three intense red synthetic stones, backed with mother-of-pearl, epitomize the prêt-à-porter philosophy and theinnovative spirit of Pomellato.
The Pomellato group (which today includes the Pomellatoand Dodo brands) currently employs 590 people, 100 ofwhom are highly qualified goldsmiths, working in theheadquarters of the Milanese Maison. Today the companyis one of the leading European jewellery players in theinternational scene.
Thanks to an intensive programme of opening mono-brand stores, the two corporate brands – Pomellato andDodo – are currently present, with 55 directly-operated stores(35 for Pomellato and 20 for Dodo) and 30 franchiseboutiques (18 for Pomellato and 12 for Dodo), in the maincapital cities of Europe, the Middle East, Asia and theUnited States.
The group also relies upon a carefully selected distributionnetwork, through 600 wholesale partners worldwide.
In 2014 the group is planning to open several directly-operated stores worldwide, both in Europe and Asia Pacific.
In 2014 Pomellato group also plans to enter the femininewatch sector with two different collections, one forPomellato 67 and one for Dodo.
02_VA_V7 20/02/14 16:57 Page38
2OTHER BRANDS ~ LUXURY DIVISION ~ OUR ACTIVITIES
392013 Financial Document ~ Kering
Incepted in 2004 by Dennis Chan, Creative Director, andGuillaume Brochard, a French entrepreneur, and inspiredby a millennium-long Chinese cultural history, Qeelin turnsmythical and superstitious Chinese symbols into timeless,meaningful and state-of-the-art contemporary jewels.
Since its launch, Qeelin has been creatively blending traditionand modernity, embracing both the mythical essence ofChina’s cultural heritage and the excellence of Frenchcraftsmanship to design contemporary fine jewellery.
The brand’s name reflects its identity as it refers to the“Qilin”, an auspicious Chinese mythical animal and rootedsymbol of love, understanding and protection. The brand’siconic Wulu collection revisits the legendary Chinesegourd filled with auspicious associations. Qeelin is alsowell known for its Bo Bo collection, featuring an articulatedand playful diamond panda bear, China’s treasurednational hero.
The recent acquisition by Kering in December 2012 hasenabled Qeelin to accelerate its development, notablythrough an increase in marketing investments. Illustratingthis, Qeelin released its first advertising campaign inGreater China in fourth quarter 2013 to increase brandawareness. It has also continued to expand its storepresence with the opening of five new boutiques in 2013in Hong Kong and Shanghai, to reach a total of 19 boutiquesworldwide by the end of the year. This network expansionhas been supported by the reinforcement of the accessjewellery product offering with the successful launch ofthe Petite collection in May 2013, as well as the promisinglaunch of a new High Jewellery collection in October: theKing & Queen.
This expansion strategy will be continued in 2014.
02_VA_V7 20/02/14 16:57 Page39
Since its establishment in Italy in the late sixties, SergioRossi has become a world reference in women’s luxuryfootwear. The brand has always been synonymous withstyle and timeless elegance, acclaimed for its creativityand perfect fit.
Today the brand- under the direction of its CEO, ChristopheMélard, and the newly appointed Collection and DesignDirector, Angelo Ruggeri- creates shapes and silhouetteswith well-recognised Italian know-how and a propericonic brand signature.
The brand operates a workshop in San Mauro Pascoli, locatedin Emilia Romagna, in the heartland of artisan Italy, wherethe brand’s tradition is perpetuated, while also contributingto nurturing the brand’s modernity. Illustrating this, SergioRossi recently created a capsule collection, as a tribute tothe famous Italian designer Gabriella Crespi, which will alsoinspire the Spring Summer 2014 collection. In addition toits core women’s shoes category, Sergio Rossi has successfullystrengthened the men’s shoes category and, more recentlyhas launched an accessories line featuring handbags.
Over the years, from a mainly domestic wholesale-drivenbusiness, Sergio Rossi has developed a global retail presence.Today Sergio Rossi footwear and accessories are equally soldthrough the worldwide directly-operated stores network,as well as through franchise boutiques and selecteddepartment and specialty stores. Moreover, thanks to thecollaboration with Yoox, the Sergio Rossi online store isnow accessible in all key countries.
At the end of 2013, Sergio Rossi had 53 directly-operatedstores, mainly in Japan, Europe and Greater China. In 2013,Sergio Rossi opened another directly-operated store inHong Kong to reinforce its presence in the Asia region. Thebrand also opened a directly-operated store in Las Vegasduring the year. The new store concept launched in 2010in the Rome flagship store has now been rolled out in over30 stores worldwide as part of its global refurbishment plan.
In 2014, Sergio Rossi aims to expand growth through its retailnetwork, particularly in emerging markets, while continuingto strengthen its worldwide wholesale business, especiallythrough long-term franchise partnerships and key third-party distribution.
40 Kering ~ 2013 Financial Document
2 OUR ACTIVITIES ~ LUXURY DIVISION~ OTHER BRANDS
02_VA_V7 20/02/14 16:57 Page40

Stella McCartney is an eponymous luxury Lifestyle brandwhich was launched under the designer’s name inpartnership with Kering in 2001.
Since the brand’s foundation, women’s ready-to-wearhas been the core business, but during the past years thebrand has been successfully extending its portfolio,adding other product categories such as handbags, withthe iconic Falabella bag, shoes, and very promisingdiversification in Kids.
Product diversification has also been fuelled by long-lasting successful collaborations, such as the design ofsportswear apparel with Adidas or lingerie with Bendon.The brand also developed eyewear and fragrances throughlicense agreements, as well as initiated several one-offcollaborations, all have allowed the company to increasebrand awareness as well as sales.
A lifelong vegetarian, Stella, since the early days of thebrand, has been committed to reflecting her ethical valuesin the collections, contributing to the brand’s ongoing success.2013 has been a particularly successful year in buildingbrand awareness with a persistent and strong exposureto the fashion scene. The year culminated with Stellareceiving an OBE (Order of the British Empire) from theQueen of England for her services to the fashion industry.
Initially started as a primarily wholesale business, thebrand now has more than 650 doors worldwide in over50 countries, but most recently it has focused its strategyon the expansion of its retail channel.
After doubling its directly-operated store network in2012, the brand added a four further net openings in 2013,mainly in the Asian market (Shanghai, Beijing and Tokyo),bringing the total store count to 25 stores, and whichremains one of the key strategic priorities for further growth.2013 also saw the launch of the joint venture betweenYoox and Kering to develop the e-commerce businessand to support market penetration, both in terms ofimage and revenue.
During the year, Stella McCartney also added six franchiseboutiques to its franchise network, which now consists ofa total of 16 stores worldwide and continues to representan important part of the distribution network.
In 2014, the brand will focus on consolidating the latestopenings as well as exploiting its historical locations inboth the retail and wholesale distribution channels, anddeveloping strong synergies between the off-line and on-line shopping experience.
41
2
2013 Financial Document ~ Kering
OTHER BRANDS ~ LUXURY DIVISION ~ OUR ACTIVITIES
02_VA_V7 20/02/14 16:57 Page41
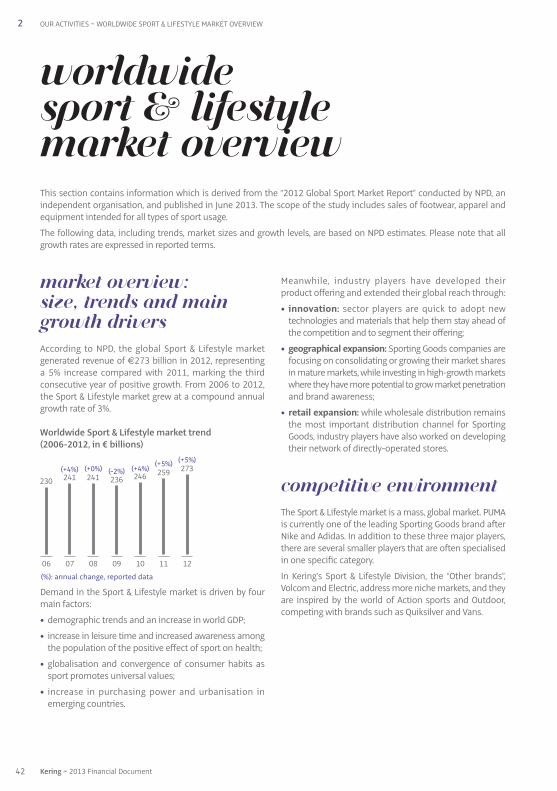
2 OUR ACTIVITIES ~ WORLDWIDE SPORT & LIFESTYLE MARKET OVERVIEW
MARKET OVERVIEW: SIZE, trENDS and MAINGROWTH DRIVERS
According to NPD, the global Sport & Lifestyle marketgenerated revenue of €273 billion in 2012, representinga 5% increase compared with 2011, marking the thirdconsecutive year of positive growth. From 2006 to 2012,the Sport & Lifestyle market grew at a compound annualgrowth rate of 3%.
Worldwide Sport & Lifestyle market trend (2006-2012, in € billions)
Demand in the Sport & Lifestyle market is driven by fourmain factors:
• demographic trends and an increase in world GDP;
• increase in leisure time and increased awareness amongthe population of the positive effect of sport on health;
• globalisation and convergence of consumer habits assport promotes universal values;
• increase in purchasing power and urbanisation inemerging countries.
Meanwhile, industry players have developed theirproduct offering and extended their global reach through:
• innovation: sector players are quick to adopt newtechnologies and materials that help them stay ahead ofthe competition and to segment their offering;
• geographical expansion: Sporting Goods companies arefocusing on consolidating or growing their market sharesin mature markets, while investing in high-growth marketswhere they have more potential to grow market penetrationand brand awareness;
• retail expansion: while wholesale distribution remainsthe most important distribution channel for SportingGoods, industry players have also worked on developingtheir network of directly-operated stores.
COMPEtitiVE ENVIRONMENT
The Sport & Lifestyle market is a mass, global market. PUMAis currently one of the leading Sporting Goods brand afterNike and Adidas. In addition to these three major players,there are several smaller players that are often specialisedin one specific category.
In Kering’s Sport & Lifestyle Division, the “Other brands”,Volcom and Electric, address more niche markets, and theyare inspired by the world of Action sports and Outdoor,competing with brands such as Quiksilver and Vans.
This section contains information which is derived from the “2012 Global Sport Market Report” conducted by NPD, anindependent organisation, and published in June 2013. The scope of the study includes sales of footwear, apparel andequipment intended for all types of sport usage.
The following data, including trends, market sizes and growth levels, are based on NPD estimates. Please note that allgrowth rates are expressed in reported terms.
WORLDWIDE SPORT & LIFEStyLE MARKET OVERVIEW
(%): annual change, reported data
06
230
07
241
08
241
09
236
10
246
11
259
12
273(+5%)(+5%)(+4%)(-2%)(+0%)(+4%)
42 Kering ~ 2013 Financial Document
02_VA_V7 20/02/14 16:57 Page42

2WORLDWIDE SPORT & LIFESTYLE MARKET OVERVIEW ~ OUR ACTIVITIES
DIStrIBUtiON CHANNELS
The Sport & Lifestyle industry is mainly a wholesale business.Key distributors of Sporting Goods brands include retailerssuch as Foot Locker and Finish Line in the United Statesand Intersport and Decathlon in Europe. In the UnitedStates, Action sports & Outdoor brands can be distributedin Pacsun, Zumiez and Tilly’s.
Along with wholesale distribution, industry playersincreasingly tend to develop more controlled retail spacesuch as directly-operated stores, shop-in-shops or jointventures with retailers. E-commerce is also gainingmomentum, yet still accounts for a fraction of total sales.
In 2012, five main sports represented almost 50% of the Sport & Lifestyle market:
Sport 2012 value Reported(in € billions) YoY change
Cycling 39 +2 %Fitness 29 + 8%Walking / Hiking 24 +5%Running 20 +10%Football/Soccer 12 +8%
When assessing industry trends in 2012, all categories grewwith footwear posting the highest growth (up 7%) followedby apparel (up 6%). More specifically, within the footwear
category, the lightweight/technical running, casual/skateand premium basketball trainer segments performed well.
PRODUCT CATEGORIES
According to NPD, the global Sporting Goods industry can be broken down into three main product categories – footwear,apparel and equipment (excluding the market for bicycles and accessories) – which correspond to the key productareas in which Kering Sport & Lifestyle brands operate.
Worldwide Sport & Lifestyle market: breakdown by category (2012)
Market value Reported YoY 2012 (in € billions) change market share
Footwear 73 +7 % 27%Apparel 91 +6% 33%Equipment 72 +4% 26%Bicycle and accessories 37 +2% 14%
Total 273 +5% -
432013 Financial Document ~ Kering
02_VA_V7 20/02/14 16:57 Page43

2 OUR ACTIVITIES ~ WORLDWIDE SPORT & LIFESTYLE MARKET OVERVIEW
REGIONAL OVERVIEW
Worldwide Sport & Lifestyle market: breakdown by region (2012)
The ten largest countries in terms of global revenue in 2012are as follows:
2012 rank Country
1 United States2 China3 Japan4 Germany5 Brazil6 France7 United Kingdom8 Russia9 Canada10 Italy
At industry level in 2012, the Americas were the leadingregion in terms of market share (39% of the totalSport & Lifestyle market, stable year-on-year), followed byEurope (29%, down one percentage point year-on-year, infavour of the Middle East & Africa).
By country, the United States are by far the largest market,representing 27% of the global Sport & Lifestyle market,followed by China, surpassing Japan in terms of marketshare for the first time.
In terms of growth, sales in Western Europe posted a modestincrease (up 2% in 2012), under pressure from macro-economic headwinds. However, results were mixed aspositive trends in Northern Europe (Germany and the UnitedKingdom) offset weaknesses in Southern Europe.
Emerging markets enjoyed the highest growth rates, asinternational brands saw rapid growth. Latin America led theway (up 16%), followed by Central & Eastern Europe (up 8%)and Middle East & Africa (up 7%). The top emerging countrieswere Brazil, South Africa and India.
MARKET OUTLOOK
In the medium term, NPD forecasts a compound annualgrowth rate of 3% for 2013-2016, in line with the periodfrom 2006 to 2012. The Sport & Lifestyle market shouldtherefore reach €308 billion by 2016, underpinned by a positive global GDP growth assumption. Indeed, Sport &Lifestyle market growth is evolving broadly in line withconsumer spending.
However, the top 5 sports -cycling, fitness, walking/hiking,running and football- should outperform overall Sport &Lifestyle market growth. For example, NPD forecasts annualgrowth rates of 6% for running, 4% for football and 4% forfitness by 2016.
Americas 39%
Asia 26%
Europe 29%
Middle East & Africa 6%
44 Kering ~ 2013 Financial Document
02_VA_V7 20/02/14 16:57 Page44

2WORLDWIDE SPORT & LIFESTYLE MARKET OVERVIEW ~ OUR ACTIVITIES
452013 Financial Document ~ Kering
02_VA_V7 20/02/14 16:57 Page45

46 Kering ~ 2013 Financial Document
2 OUR ACTIVITIES ~ SPORT & LIFESTYLE DIVISION
PUMA 48Other brands 51
VolcomElectric
sport & lifestyle Division
02_VA_V7 20/02/14 16:57 Page46

47
2
2013 Financial Document ~ Kering
SPORT & LIFESTYLE DIVISION ~ OUR ACTIVITIES
Breakdown by brand
Revenue and recurringoperating income
€3,247 millionin revenue
€200 millionin recurring operating income
Breakdown by brand
Breakdown by product category
Breakdown by region
PUMA 92%Other brands 8%
Footwear 43%Apparel 39%
Accessories 18%
Western Europe 30%North America 25%
Japan 10%Other countries 22%
Asia Pacific 13%
2013 key figures
PUMA 96%Other brands 4%
Revenue (in € millions)
Recurring operating income (in € millions)2012 2013
3,247
200
3,532
305
02_VA_V7 20/02/14 16:57 Page47
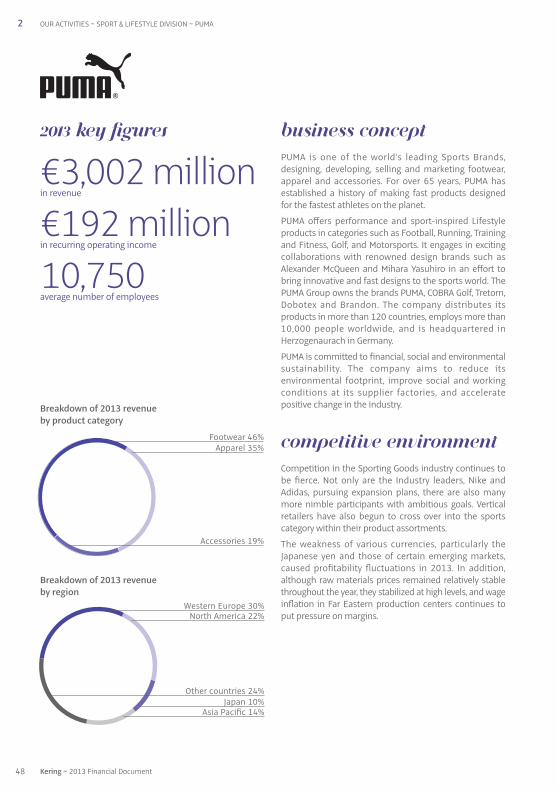
48 Kering ~ 2013 Financial Document
2 OUR ACTIVITIES ~ SPORT & LIFESTYLE DIVISION ~ PUMA
2013 key figures
€3,002 millionin revenue
€192 millionin recurring operating income
10,750average number of employees
Breakdown of 2013 revenueby product category
Breakdown of 2013 revenueby region
Footwear 46%Apparel 35%
Accessories 19%
Western Europe 30%North America 22%
Japan 10%Other countries 24%
Asia Pacific 14%
BUSINESS CONCEPT
PUMA is one of the world’s leading Sports Brands,designing, developing, selling and marketing footwear,apparel and accessories. For over 65 years, PUMA hasestablished a history of making fast products designedfor the fastest athletes on the planet.
PUMA offers performance and sport-inspired Lifestyleproducts in categories such as Football, Running, Trainingand Fitness, Golf, and Motorsports. It engages in excitingcollaborations with renowned design brands such asAlexander McQueen and Mihara Yasuhiro in an effort tobring innovative and fast designs to the sports world. ThePUMA Group owns the brands PUMA, COBRA Golf, Tretorn,Dobotex and Brandon. The company distributes itsproducts in more than 120 countries, employs more than10,000 people worldwide, and is headquartered inHerzogenaurach in Germany.
PUMA is committed to financial, social and environmentalsustainability. The company aims to reduce itsenvironmental footprint, improve social and workingconditions at its supplier factories, and acceleratepositive change in the industry.
COMPEtitiVE ENVIRONMENT
Competition in the Sporting Goods industry continues tobe fierce. Not only are the Industry leaders, Nike andAdidas, pursuing expansion plans, there are also manymore nimble participants with ambitious goals. Verticalretailers have also begun to cross over into the sportscategory within their product assortments.
The weakness of various currencies, particularly theJapanese yen and those of certain emerging markets,caused profitability fluctuations in 2013. In addition,although raw materials prices remained relatively stablethroughout the year, they stabilized at high levels, and wageinflation in Far Eastern production centers continues toput pressure on margins.
02_VA_V7 20/02/14 16:57 Page48

49
2
2013 Financial Document ~ Kering
PUMA ~ SPORT & LIFESTYLE DIVISION ~ OUR ACTIVITIES
StrATEGY
In 2013, PUMA created a newly unified Brand Platformthat is rooted in the Sports DNA of the company, andwhich reconciles the Performance and Lifestyle segmentsof the PUMA brand. With this significant milestone, PUMAis moving away from its approach of pursuing twodistinctive visions for each part of the business, whichhas led to confusion and a lack of clarity for employees,business partners, and consumers.
Going forward, PUMA will be the Fastest Sports Brand inthe World. This simplified mission will result in a singlebrand positioning, a single brand purpose, and a singleconsumer message. PUMA will be: “Forever Faster”. Thisstatement, a new tag line which will be launched toconsumers in 2014, reflects the 65 year history of makingfast product designs for the fastest athletes on the planet.
But “Forever” references more than just the brand’s history,and a commitment to classic products. It representsrecognition of the endless pursuit of whatever is next – inperformance innovations, in cultural trends and in styleand fashion. Forever also emphasizes PUMA’s long-termresponsibilities and underlines the importance ofsustainability to the brand. Of course the word “Faster”represents more than simply delivering the rationalbenefit of speed to athletes. PUMA will have a singleminded purpose of celebrating faster design in everysense of the word – lighter products, better fit for greateragility, enhanced flexibility and stability in the precisemeasure to allow for point to point speed, and any otherpossible way the brand can deliver the fastest products forthe fastest performers. The phrase simultaneously referencesthe emotional benefit of owning speed – the thrill, thefun, and the swagger of Usain Bolt himself, the man whobest personifies this new strategy and ambition.
Forever Faster will be a part of a long term effort to clearlyre-establish the brand in the minds of the customers. Inthe third quarter of 2014, PUMA will unleash this newbrand strategy in the market with a significant consumer-facing media campaign.
PUMA’s products are the ultimate embodiment of thenew brand strategy and the desire to produce the fastestproducts for the fastest athletes. Innovation efforts aredeveloping lighter, more agile products with better fit andimprovements in adaptation to the body in motion – bothextending training times and delivering faster resultswhen it counts. In addition to the “Forever Faster” innovationfocus, the product priorities are delivering commerciality,beauty in design, and overall product responsiveness.PUMA will focus on improving the commerciality of its
product range to meet the consumer’s price and valueexpectations. For PUMA, “Commerciality” means theconsumer is at the center of the design process, ensuringthat it delivers the performance, quality and aestheticscritical for success at the right price point.
Another key priority for PUMA is to focus on desirablewholesale distribution, shifting the balance from lower tohigher-tier wholesale channels. The quality of wholesaledistribution will be improved by focusing on and workingclosely together with key accounts on joint productprograms. Supported by significant marketing activities,this approach will lead to improved sell-through, drivingincreases in shelf-space at key wholesale accounts.
In the Direct-to-Consumer business, PUMA’s focus is tocapitalize on its Retail doors. While PUMA will finish closingthe loss-making stores earmarked in the TransformationProgram, it will also increase the number of outlet storesin currently under-penetrated markets – mainly in theAsia/Pacific region. In growth countries, selective full pricestores will continue to be opened in desirable locations. A key driver of growth in the direct-to-consumer businesswill be e-commerce. By going live with a completelyrefreshed site design in 2014, PUMA will integrate themarketing and commercial aspects of its digital strategyto drive growth and retention with compelling, “shoppable”content.
2013 HIGHLIGHTS AND OUTLOOK FOR 2014
2013 has been a transition year at PUMA with manyhighlights: a new management team is on board, a newbrand manifesto has been launched, progress was madewith the ongoing Transformation Program, and manyproduct and marketing successes were achieved.
As of summer 2013, PUMA has a new management teamin place that will shape the future of the company andmake PUMA the fastest Sports Brand in the world. At theBoard level, Bjoern Gulden joined as CEO and AndyKoehler came on-board as COO. Product teams werestrengthened at the senior level with the addition ofKevin Tolchard as Global Director of Merchandising andTorsten Hochstetter as Global Creative Director.
PUMA continues to execute its Transformation Programas announced in 2012. Key transformation achievementsin 2013 focused on complexity reduction. The successfulimplementation of a new European regional businessmodel created a regional layer and consolidated
02_VA_V7 20/02/14 16:57 Page49

23 countries into seven areas. Through year-end, PUMAclosed six warehouses in Europe, achieving significantmovement in its warehouse consolidation project.Alongside complexity reduction in terms of organizationand warehouses, meaningful progress was also achievedin reducing PUMA’s article count by more than 10% in 2013.Further measures are underway to achieve the articlereduction target of 30% by 2015. Finally, PUMA has alreadyclosed 73 of the announced 91 unprofitable stores withthe remaining 18 stores to be closed in 2014/15.
On the product side, PUMA celebrated successes of itsproduct launches underlining PUMA’s ambition to buildthe fastest products for the fastest athletes: PUMA’s top-selling adaptive running shoe, Mobium, won multipleawards across the globe, including Most Innovative(Competitor Magazine, US), Best New Technology (GoMulti, South Africa) and Best Debut (Runner’s World,China). PUMA also successfully introduced its ISPO –International Sporting Goods Trade Fair – award-winningPUMA ACTV and RCVR performance apparel, which is aproprietary technology fusing compression with built-inathletic taping.
2013 also provided further proof that PUMA equips thefastest athletes on the planet. The World Track and FieldChampionships in Moscow were once again dominatedby PUMA icon Usain Bolt, who took home another threegold medals to make him the fastest athlete of all time.With Usain Bolt, the Jamaican team achieved the thirdplace in the medals table, with six golds in total. Thisremarkable performance was accompanied by twofurther great achievements in PUMA’s core sports: PUMA -partnered football club Borussia Dortmund reached theChampions League Final and PUMA athlete Lexi Thompsonwon two LPGA tournaments in 2013, cementing herstatus as one of the world’s top female golfers.
Looking ahead to 2014, PUMA will focus on three key priorities:repositioning itself as the fastest Sports Brand in theWorld, elevating the product engine to new standards, andimproving the revenue quality. PUMA is excited to launchits new brand vision, Forever Faster, with a large scale mediacampaign globally in the Autumn/Winter season 2014.This brand relaunch is accompanied by the extension ofthe partnership with the fastest athlete on the planet,Usain Bolt, through the 2016 Olympic Games in Rio deJaneiro and beyond.
2014 will be the year of football for PUMA, at the WorldCup in Brazil, 25% of all participating teams will be PUMApartners. PUMA is proud that the teams of Italy,Switzerland, Chile, Uruguay, Algeria, Cameroon, Ghana,and the Ivory Coast will all be sporting the brand on the
world’s greatest football stage. The presence in football isfurther enhanced by new partnerships with two globalbrand properties – Arsenal Football Club and MarioBalotelli. Starting season 2014/15, PUMA will combine itssports performance expertise and proud heritage in thegame with Arsenal’s traditions, honors and global appeal.The partnership with Arsenal is a major milestone inPUMA’s history. It is the first time in modern history thatthe brand is associated with a truly international footballclub property including an extensive global fan base. ComeJuly 1st, PUMA will be the official kit supplier to Arsenal F.C.including the new playing kit, training line, fanwear andaccessories. The signing of Italian striker Mario Balotellihas two critical aspects to it. Firstly, PUMA is adding a primeand globally recognized striker to boost the footballfootwear business of the brand next to Sergio Aguero, CescFabregas, Marco Reus and Radamel Falcao. Secondly, theaddition of Mario Balotelli to the stable of talent adds atrue brand icon which fits perfectly with the PUMApersonality that will be rolled out under Forever Faster.
50 Kering ~ 2013 Financial Document
2 OUR ACTIVITIES ~ SPORT & LIFESTYLE DIVISION ~ PUMA
Revenue and recurringoperating income
Revenue (in € millions)
Recurring operating income (in € millions)2012 2013
3,002
192
3,271
290
02_VA_V7 20/02/14 16:57 Page50

51
2
2013 Financial Document ~ Kering
OUR ACTIVITIES ~ SPORT & LIFESTYLE DIVISION ~ OUR ACTIVITIES
Revenue and recurringoperating income
Revenue (in € millions)
Recurring operating income (in € millions)2012 2013
245
9
261
15
other brands2013 key figures
€245 millionin revenue
€9 millionin recurring operating income
771average number of employees
• Volcom
• Electric
02_VA_V7 20/02/14 16:57 Page51

52 Kering ~ 2013 Financial Document
2 OUR ACTIVITIES ~ SPORT & LIFESTYLE DIVISION ~ OTHER BRANDS
Founded in the early 1990’s, Volcom is a board sports-based modern Lifestyle brand that embodies the creativespirit of youth culture. The company was built onliberation, innovation and experimentation, and its goal isto provide sustainable lifestyle-enhancing apparel,outerwear, accessories and footwear to people who sharetheir passion for art, music, film and board sports. It is theonly company in its category founded on all three boardsports: skate, surf and snow. Volcom reinforces its brandimage through the sponsorship of world-class athletes,targeted grassroots marketing events, distinctiveadvertising and the production of board Sport and youthLifestyle related films, art and music.
With a broad array of products for men, women and boys,and key categories in denim, boardshorts, swim, outerwear,and footwear, Volcom aims to become one of the world’spremiere brands in the action Sport & Lifestyle market.The Volcom brand is constantly evolving and bringing theboard sports Lifestyle to an increasing number of peopleworldwide.
The action sports industry has been facing a strongeconomic downturn, pushing major competitors to reviewthe strategy and organisation in an effort to relaunchgrowth. 2013 was a productive year for Volcom as itaccomplished many significant initiatives. Volcomcontinued to strengthen the foundation of its business todrive operational excellence at every level. It added top talentto its teams and established a global organizationalstructure, particularly around marketing, merchandisingand design, sourcing, supply chain, logistics, retail andfinance. This new structure will help drive efficienciesaround product, planning, gross margin and expense
management. In addition, Volcom successfully deliveredits first closed-toe footwear line, which was well received bycustomers. In October, Volcom re-launched its Volcom.comwebsite, which combines the brand, athlete, product andcommunity into a single unified experience.
Branded retail was a key focus for Volcom, with four netstore openings particularly in France, Australia, the UnitedStates and Hong Kong during the year.
Volcom made significant investments in resources, marketingand operations in the Asia Pacific and Latin America regions,which are key markets for the Volcom brand and providepotential growth opportunities. These investments havebegun to yield results on some markets.
Volcom also hosted the World of Volcom Stone, a skate eventheld in Paris, celebrating the brand and its core values.The event was highlighted by the premiere of Volcom’snew movie “True to This”, a feature film which defines thebrand’s philosophy and captures the energy and artistryof board-riding in its purest forms.
The Volcom brand is well positioned for growth in 2014.Volcom will make further investments in resources,marketing and operations in the Asia Pacific and LatinAmerica regions, as Volcom looks to take advantage of itsrecent momentum.
It will also continue to enlarge its retail network in 2014.
With the recent re-launch of the Volcom website, Volcomwill expand the reach of its e-commerce platform toadditional regions with a focus on social media andenhanced content management.
02_VA_V7 20/02/14 16:57 Page52

53
2
2013 Financial Document ~ Kering
OUR ACTIVITIES ~ SPORT & LIFESTYLE DIVISION ~ OUR ACTIVITIES
Founded in 2000, Electric is a premium Lifestyle brandrooted in southern California’s action sports, music, artand customisation culture. It designs and marketssunglasses, snow goggles, backpacks, luggage, watchesand accessories through the Americas, Europe, Japan,China and Australasia. Electric sells in Lifestyle boutiques,department stores, sports shops and online, including itsown e-commerce website.
Competition in the action sports eyewear market ischaracterised by two main ideas. First, both young andestablished action Sport endemic competitors are vyingfor a decreasing retail footprint of core shops along withnon-endemic global brands. Second, many of the brandsthat are entering the market target lower margins andprice points.
The Lifestyle streetwear and department store channelsare also seeing a greater number of new brands,migrating from action sports, licensed from establishedfashion brands and original emerging brands. Many lackthe heritage, quality and authenticity to challenge themarket leaders.
Electric plans to leverage its newly expanded productportfolio, merchandising strategies, and re-organizedsales structure to challenge the leadership positions oflarger brands in the market. Geographic expansion willcontinue to play a key role in Electric’s growth strategy,while much focus will be placed on increased service toexisting distribution and expansion of retail footprintwithin the channel. Electric will manage its distributionexpansion through an increased focus on product linesegmentation. Electric’s newly launched premium collectionof eyewear, watches and small leather goods will bemarketed to premium Lifestyle boutique and departmentstore channels, while its technical and Sport driven productswill be targeted towards its existing action sports,premium Sporting Goods and outdoor channels.
Expansion in Europe, a currently under-penetrated market,from a central office in France will continue as the first phaseof an expanded international presence. The second phaseof Electric’s International expansion strategy will focus onbrand recognition and leadership in key cities.
2013 marked the completion of the Electric brand’scomplete reset. In March, Eric Crane was appointed CEOand continued to oversee the brand’s restructuring andgrowth initiatives.
In 2013, Electric began distribution of its newly rebrandedbags and accessories and successfully launched itsinaugural watch line to key existing retail partners. Electricalso successfully launched its e-commerce platform in theUS, and introduced a new global retail fixture program,driving gains in same store sales.
In 2014, Electric will release a new patent pending “quickchange” lens technology in snow goggles developed byco-founder and Chief Design Officer, Kip Arnette. Thetechnology will debut in the EG3 goggle, an update to itsbest selling EG2 goggle platform. A new outrigger-typegoggle will also be released, targeting helmet wearers inboth snowboarding and ski markets.
Electric will expand its watch product line offering, and openits distribution to all current retail partners and select newaccounts. A new line of luggage, helmets and accessories willbe launched in 2014, together with a restructured sunglassesoffering including capsule collections developed with keyambassadors and athletes, limited edition premiumItalian acetate styles and a new style featuring Electric’s firstmould injected hinge, all of which will feature Electric’ssignature melanin-injected lens technology.
02_VA_V7 20/02/14 16:57 Page53

54 Kering ~ 2013 Financial Document
2 OUR ACTIVITIES ~ SPORT & LIFESTYLE DIVISION ~ OTHER BRANDS
02_VA_V7 20/02/14 16:57 Page54

552013 Financial Document ~ Kering
CHAPTer 3
financial Information
1. Activity report 561.1. Foreword – Definitions 561.2. 2013 highlights 571.3. 2013 business review 591.4. Analysis of operating performances by brand 641.5. Comments on the Group’s financial position 741.6. Net income and dividend of the parent company 811.7. Transactions with related parties 821.8. Subsequent events 821.9. Outlook 82
2. Consolidated financial statements as of December 31, 2013 832.1. Consolidated income statement 832.2. Consolidated statement of comprehensive income 842.3. Consolidated statement of financial position 852.4. Consolidated statement of cash flows 862.5. Consolidated statement of changes in equity 87
Notes to the consolidated financial statements for the year ended December 31, 2013 88
3. Statutory Auditors’ special reporton the consolidated financial statements 169
4. Extracts of the parent company financial statements 170
03_A_VA_V4 20/02/14 16:56 Page55
IFRS 5 – Non-current assets held for sale and discontinued operations
In accordance with IFRS 5 – Non-current assets held for saleand discontinued operations, the Group has presentedcertain activities as “Non-current assets held for sale orfor distribution and discontinued operations”. The netincome or loss from these activities is shown on aseparate line of the income statement, “Net income (loss)from discontinued operations”, and is restated in thestatement of cash flows and income statement for allreported periods.
Assets and liabilities relating to assets held for sale or fordistribution and discontinued operations are presentedon separate lines in the Group’s statement of financialposition, without restatement for previous periods.
As stated in Note 12 to the consolidated financial statements,Groupe Fnac and Redcats are classified as “Non-currentassets held for sale or for distribution and discontinuedoperations”. As of January 1, 2013, Redcats Asia is no longerpresented under “Non-current assets held for sale or fordistribution and discontinued operations” following theGroup’s decision to retain this activity.
Definition of “reported” and “comparable” revenue
The Group’s “reported” revenue corresponds to publishedrevenue. The Group also uses “comparable” data to measureorganic growth. “Comparable” revenue is 2012 revenuerestated for the impact of changes in Group structure in2012 or 2013, and for translation differences relating toforeign subsidiaries’ revenue in 2012.
Definition of recurring operating income
The Group’s total operating income includes all revenuesand expenses directly related to Group activities, whetherthese revenues and expenses are recurring or arise fromnon-recurring decisions or transactions.
“Other non-recurring operating income and expenses”consists of unusual items, notably as concerns the natureor frequency, that could distort the assessment of Groupentities’ economic performance, as defined by Frenchnational accounting board (Conseil National de laComptabilité – CNC) recommendation No. 2009-R.03 of July 2, 2009.
Consequently, Kering monitors its operating performanceusing “Recurring operating income”, defined as thedifference between total operating income and othernon-recurring operating income and expenses (see Notes8 and 9 to the consolidated financial statements).
Recurring operating income is an intermediate line itemintended to facilitate the understanding of the entity’soperating performance and which can be used as a wayto estimate recurring performance. This indicator ispresented in a manner that is consistent and stable overthe long-term in order to ensure the continuity andrelevance of financial information.
Definition of EBITDA
The Group uses EBITDA to monitor its operating performance.This financial indicator corresponds to recurring operatingincome plus net charges to depreciation, amortisationand provisions on non-current operating assets recognisedin recurring operating income.
Definition of free cash flow from operations and available cash flow
The Group also uses an intermediate line item, “Free cashflow from operations”, to monitor its financial performance.This financial indicator measures net operating cash flow lessnet operating investments (defined as purchases and salesof property, plant and equipment and intangible assets).
“Available cash flow” corresponds to free cash flow fromoperations plus interest and dividends received lessinterest paid and equivalent.
Definition of net debt
As defined by CNC recommendation No. 2009-R.03, net debtcomprises gross borrowings, including accrued interest,less net cash.
Net debt includes fair value hedging instruments recordedin the statement of financial position relating to bankborrowings and bonds whose interest rate risk is fully orpartly hedged as part of a fair value relationship (see Note31 to the consolidated financial statements).
The financing of customer loans by fully-consolidatedconsumer credit businesses is presented in borrowings.Group net debt excludes the financing of customer loansby consumer credit businesses.
56 Kering ~ 2013 Financial Document
3 FINANCIAL INFORMATION ~ 2013 ACTIVITY REPORT
1. Activity report
1.1. Foreword – Definitions
03_A_VA_V4 20/02/14 16:56 Page56

PPR becomes Kering
Having completed its transformation into a global leader inapparel and accessories operating in the Luxury and Sport &Lifestyle markets, on March 22, 2013 the Group announcedits decision to change its name to “Kering” to better reflectits new identity. This name change was approved at theAnnual General Meeting held on June 18, 2013.
Distribution of Groupe Fnac shares to Keringshareholders and listing of Groupe Fnacshares on NYSE Euronext Paris
In line with the principle announced on October 9, 2012,at its April 17, 2013 meeting Kering’s Board of Directorsunanimously approved the listing of Groupe Fnac sharesthrough a distribution of Groupe Fnac shares to Keringshareholders. This listing had previously been approvedby the employee representative bodies of both GroupeFnac and Kering SA.
At the Annual General Meeting of June 18, 2013, Kering’sshareholders authorised the payment of an additionalcash dividend of €2.25 per share (following an interim cashdividend of €1.50 paid on January 24, 2013), and an additionaldividend in the form of Groupe Fnac shares at a ratio of oneGroupe Fnac share for every eight Kering shares held.
On June 20, 2013 prior to the start of market trading:
• the rights to the balance of the cash dividend for 2012 weredetached from the Kering shares and the dividend was paid;
• the rights to the allotment of Groupe Fnac shares weredetached from the Kering shares and the deliveries ofGroupe Fnac shares began.
Consequently, the Groupe Fnac share allotment rights begantrading on Euronext Paris on June 20, 2013.
Kering distributed a total of 15,672,034 shares representingjust under 95% of Groupe Fnac’s capital as of the ex-dividenddate, in view of the fact that a 5% stake in the companyhad already been sold in the first half of 2013 to KernicMet BV (a company indirectly held by Kering), which in turnhad transferred title to the 830,907 shares concerned aspart of a financial forward contract.
In accordance with IFRIC 17, as of June 20, 2013 – the dateon which the Groupe Fnac shares were delivered to theirshareholders and first listed – the Groupe Fnac shares werederecognised by Kering based on a fair value of €314 millionfor 95% of the shares (15,672,034 shares x €20.03).
The derecognition led to a €256 million post-tax disposalloss in 2013, taking into account the costs of the distributionand Groupe Fnac’s net income in the first half of the year.
This disposal loss was recorded in “Net income (loss)from discontinued operations”.
Kering continues its divestment of Redcatsand finalises the Group’s transformation
On January 3, 2013, Kering announced that it had receiveda firm offer from Alpha Private Equity Fund 6 (“APEF 6”) toacquire Redcats’ Children and Family division – comprisingthe Cyrillus and Vertbaudet brands – for an enterprisevalue of €119 million. The transaction was completed onMarch 28, 2013.
On February 5, 2013, Kering announced the closing of thesale of OneStopPlus to Charlesbank Capital Partners andWebster Capital in accordance with the terms of the definitivesale agreement announced on December 5, 2012. Thistransaction marked the final step in the sale of all ofRedcats USA’s operations.
On February 25, 2013, Kering announced that Redcats hadentered into an agreement to sell its Nordic activities,Ellos and Jotex to Nordic Capital Fund VII for an enterprisevalue of €275 million. The transaction was completed onJune 3, 2013.
During the second half of 2013, Kering continued the processfor its planned sale of La Redoute and Relais Colis. OnDecember 4, 2013, after examining the four takeover offers,Kering’s Board of Directors decided to enter into exclusivenegotiations with Nathalie Balla – the current Chairman andCEO of La Redoute – and Eric Courteille – Chief AdministrativeOfficer of Redcats – who presented a takeover plan supportedby a team of managers from the two companies. In linewith the undertakings it gave in relation to the takeover,Kering will recapitalise La Redoute and Relais Colis at thesame time as the sale is carried out. This recapitalisationwill ensure that both companies enjoy a healthy financialposition backed by a significant cash surplus and that thenew owners will be able to fund their transformation andmodernisation measures.
Nathalie Balla and Eric Courteille presented the details oftheir business plan to the relevant employee representativebodies in January 2014 in accordance with the standardinformation and consultation procedure required underFrench law, and they are currently pursuing negotiationswith La Redoute’s trade unions.
The results of Redcats’ businesses during the year amountedto a €562 million loss and were recorded under “Net income(loss) from discontinued operations”. This amount includesKering’s €315 million recapitalisation undertaking inrelation to La Redoute, the impairment losses recordedagainst Redcats’ residual assets and the disposal gainsand losses on activities sold during the period. It does notinclude the cost of financing the social guarantees to begranted to the employees concerned by the modernisationmeasures at La Redoute and Relais Colis. The total cost ofthis financing, which cannot as yet be reliably estimated,
1.2. 2013 highlights
57
3
2013 Financial Document ~ Kering
2013 ACTIVITY REPORT ~ FINANCIAL INFORMATION
03_A_VA_V4 20/02/14 16:56 Page57

will lead Kering to set up a trust guaranteeing the applicationof the employee measures approved in a majority collectiveagreement with trade unions. The associated costs willbe recognised in 2014.
Kering strengthens its portfolio of luxury brands
In early January 2013, Kering completed its acquisition ofa majority stake in the Chinese fine jewellery brand Qeelin.Launched in 2004, Qeelin is the first Chinese luxury jewellerto have developed an international network of stores in themost prestigious shopping districts worldwide. It currentlyoperates 14 stores (seven in Mainland China, four in HongKong and three in Europe) and is sold in a number of multi-brand stores such as Colette in Paris and Restir in Tokyo.
On January 15, 2013, Kering acquired a majority stake inthe luxury designer brand Christopher Kane with a view todeveloping the brand’s business in close partnership withits eponymous creator, the Scottish designer ChristopherKane. Founded in 2006, Christopher Kane is a distinctiveand exciting brand with a unique DNA.
Qeelin and Christopher Kane have been fully consolidatedin Kering’s financial statements since January 1, 2013. Asof December 31, 2013, Kering valued the Qeelin brand at€20 million on a provisional basis following the initialpurchase price allocation process, which will be completedduring 2014.
On March 25, 2013, Kering announced that it had acquireda majority stake in France Croco and Tannerie de Périers.Founded in 1974, France Croco is a leading independenttannery located in Normandy and specialised in thesourcing, tanning and processing of crocodile skins.
This acquisition will allow Kering’s brands to further securea sustainable supply of high quality crocodile skins andFrance Croco’s activities are highly complementary tothose of Caravel, another tannery owned by Kering whichspecialises in sourcing and tanning precious skins. FranceCroco and Tannerie de Périers have been consolidated inKering’s financial statements since the second quarter of2013. The purchase price allocation process for thisacquisition was still in progress at end-December 2013.
On April 22, 2013 Gucci further demonstrated its commitmentto the excellence of “Made in Italy” and to Tuscany byannouncing that it had acquired the Italian porcelain maker,Richard Ginori, as part of its plans to expand into thetableware market. Richard Ginori was not consolidated bythe Group at end-December 2013.
On April 24, 2013, Kering announced that it had signed anagreement with RA.MO SpA to acquire a majority stake in
the Italian jewellery group Pomellato. The Pomellatogroup has two brands: Pomellato, which is positioned inthe fine jewellery segment and Dodo, positioned in theaccessible jewellery segment. Through this acquisitionKering has extended and strengthened its portfolio ofluxury brands in the high-growth jewellery segment. Thetransaction was completed on July 5, 2013, followingclearance by the competition authorities. In view of thedate on which Kering took over control of the group,Pomellato has been consolidated since July 1, 2013. As ofDecember 31, 2013, Kering valued the Pomellato andDodo brands at €210 million on a provisional basisfollowing the initial purchase price allocation process,which will be completed during 2014.
On September 6, 2013, Kering announced that it wasacquiring a minority shareholding in the New York basedfashion brand Altuzarra, founded by the Franco-American designer Joseph Altuzarra in 2008. Thisinvestment marks the beginning of a partnership whichwill enable Kering to accompany Altuzarra in the nextstage of its growth. Altuzarra was not consolidated inKering’s financial statements at December 31 2013.
On November 19, 2013, Kering and Tomas Maier announcedthat they had entered into a joint venture to develop thebusiness of the Tomas Maier brand in partnership. TomasMaier will continue to be Creative Director of BottegaVeneta, a position he has held since 2001. The jointventure was not consolidated in Kering’s financialstatements at December 31, 2013.
Other highlights
On April 18, 2013, PUMA SE announced that it had appointedBjörn Gulden as Chief Executive Officer effective July 1,2013. Mr. Gulden – who is a member of Kering’s ExecutiveCommittee – brings to PUMA solid internationalexperience of nearly 20 years in the Sporting Goods andfootwear industry where he has held a variety ofmanagement positions, notably with Adidas, Helly Hansenand Deichman.
In the first half of 2013, Kering redeemed both the€600 million worth of bonds issued in 2005, includingthe additional bonds issued in 2006, and the second€200 million tranche of the bonds indexed to the Keringshare price that were issued in May 2008. To extend thematurity of its debt, Kering carried out a first bond issueon July 15, 2013, involving €500 million worth of seven-year bonds with a fixed-rate coupon of 2.5%, and asecond – which also represented €500 million – onOctober 8, 2013, involving five-year bonds with a 1.875%fixed-rate coupon.
58 Kering ~ 2013 Financial Document
3 FINANCIAL INFORMATION ~ 2013 ACTIVITY REPORT
03_A_VA_V4 20/02/14 16:56 Page58
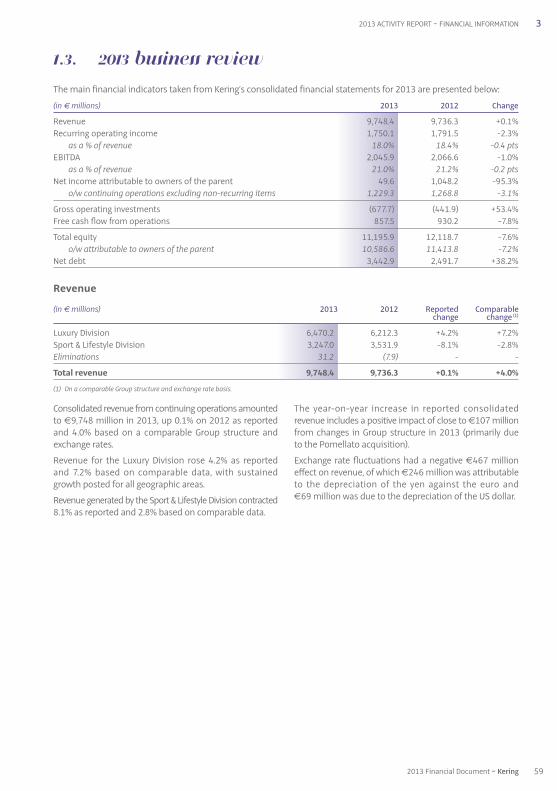
Consolidated revenue from continuing operations amountedto €9,748 million in 2013, up 0.1% on 2012 as reportedand 4.0% based on a comparable Group structure andexchange rates.
Revenue for the Luxury Division rose 4.2% as reportedand 7.2% based on comparable data, with sustainedgrowth posted for all geographic areas.
Revenue generated by the Sport & Lifestyle Division contracted8.1% as reported and 2.8% based on comparable data.
The year-on-year increase in reported consolidatedrevenue includes a positive impact of close to €107 millionfrom changes in Group structure in 2013 (primarily dueto the Pomellato acquisition).
Exchange rate fluctuations had a negative €467 millioneffect on revenue, of which €246 million was attributableto the depreciation of the yen against the euro and€69 million was due to the depreciation of the US dollar.
1.3. 2013 business review
The main financial indicators taken from Kering’s consolidated financial statements for 2013 are presented below:
(in € millions) 2013 2012 Change
Revenue 9,748.4 9,736.3 +0.1%Recurring operating income 1,750.1 1,791.5 -2.3%
as a % of revenue 18.0% 18.4% -0.4 ptsEBITDA 2,045.9 2,066.6 -1.0%
as a % of revenue 21.0% 21.2% -0.2 ptsNet income attributable to owners of the parent 49.6 1,048.2 -95.3%
o/w continuing operations excluding non-recurring items 1,229.3 1,268.8 -3.1%
Gross operating investments (677.7) (441.9) +53.4%Free cash flow from operations 857.5 930.2 -7.8%
Total equity 11,195.9 12,118.7 -7.6%o/w attributable to owners of the parent 10,586.6 11,413.8 -7.2%
Net debt 3,442.9 2,491.7 +38.2%
Revenue
(in € millions) 2013 2012 Reported Comparable change change (1)
Luxury Division 6,470.2 6,212.3 +4.2% +7.2%Sport & Lifestyle Division 3,247.0 3,531.9 -8.1% -2.8%Eliminations 31.2 (7.9) - -
Total revenue 9,748.4 9,736.3 +0.1% +4.0%
(1) On a comparable Group structure and exchange rate basis.
59
3
2013 Financial Document ~ Kering
2013 ACTIVITY REPORT ~ FINANCIAL INFORMATION
03_A_VA_V4 20/02/14 16:56 Page59

Quarterly information
(in € millions) First Second Third Fourth Total quarter quarter quarter quarter 2013
Gucci 865.9 888.9 864.8 941.2 3,560.8Bottega Veneta 229.0 236.6 259.3 290.9 1,015.8Yves Saint Laurent 127.2 128.1 139.3 162.3 556.9Other Luxury brands 301.3 301.4 353.7 380.3 1,336.7
Luxury Division 1,523.4 1,555.0 1,617.1 1,774.7 6,470.2
PUMA 781.6 692.3 824.8 703.2 3,001.9Other Sport & Lifestyle brands 61.1 51.9 71.4 60.7 245.1
Sport & Lifestyle Division 842.7 744.2 896.2 763.9 3,247.0
Corporate 4.3 8.8 9.7 8.4 31.2
Kering total 2,370.4 2,308.0 2,523.0 2,547.0 9,748.4
(in € millions) First Second Third Fourth Total quarter quarter quarter quarter 2012
Gucci 847.9 879.9 914.6 996.4 3,638.8Bottega Veneta 218.0 211.5 241.6 274.0 945.1Yves Saint Laurent 108.8 114.7 130.0 119.3 472.8Other Luxury brands 283.2 260.5 306.7 305.2 1,155.6
Luxury Division 1,457.9 1,466.6 1,592.9 1,694.9 6,212.3
PUMA 820.9 752.9 892.2 804.7 3,270.7Other Sport & Lifestyle brands 65.6 54.6 77.5 63.5 261.2
Sport & Lifestyle Division 886.5 807.5 969.7 868.2 3,531.9
Corporate (2.5) (2.3) (2.2) (0.9) (7.9)
Kering total 2,341.9 2,271.8 2,560.4 2,562.2 9,736.3
The Group’s balance in terms of geographic presence andsales formats makes it more resilient to changes in theeconomic environment despite the volatility in the globaleconomy over the last several quarters. Revenuegenerated outside the eurozone climbed 5.8% in 2013(based on comparable data) and accounted for 79% ofthe Group total.
Growth in mature markets was sustained at 4.3% (basedon comparable data), driven by Japan and North America.Emerging markets were up 3.4% on a comparable basis,and now account for 38% of sales with 25.3% of thisamount generated in the Asia-Pacific region (excludingJapan).
Revenue by geographic area
(in € millions) 2013 2012 Reported Comparable change change (1)
Western Europe 3,057.9 2,937.5 +4.1% +2.7%North America 2,038.3 1,978.9 +3.0% +5.7%Japan 982.8 1,158.3 -15.2% +6.7%
Sub-total – mature markets 6,079.0 6,074.7 +0.1% +4.3%
Eastern Europe, Middle East and Africa 723.6 685.2 +5.6% +9.3%South America 476.0 536.7 -11.3% -3.7%Asia-Pacific (excluding Japan) 2,469.8 2,439.7 +1.2% +3.2%
Sub-total – emerging markets 3,669.4 3,661.6 +0.2% +3.4%
Total revenue 9,748.4 9,736.3 +0.1% +4.0%
(1) On a comparable Group structure and exchange rate basis.
60 Kering ~ 2013 Financial Document
3 FINANCIAL INFORMATION ~ 2013 ACTIVITY REPORT
03_A_VA_V4 20/02/14 16:56 Page60

EBITDA
At €2,046 million, EBITDA was 1.0% lower than in 2012, and the EBITDA margin edged back 0.2 basis points to 21.0%from 21.2%.
(in € millions) 2013 2012 Change
Luxury Division 1,913.3 1,815.3 +5.4%Sport & Lifestyle Division 258.3 370.8 -30.3%Corporate (125.7) (119.5) -5.2%
EBITDA 2,045.9 2,066.6 -1.0%
The Group’s gross margin for 2013 amounted to€6,091 million, up €131 million or 2.2% on the previousyear as reported. Over the same period, operating
expenses increased by 4.1% as reported, including a 2.8%rise in payroll expenses. The Group’s average headcount was31,415 in 2013, representing a 6.9% increase on 2012.
(comparable change) First Second Third Fourth Full-year quarter quarter quarter quarter 2013
Gucci +4.0% +4.1% +0.6% +0.2% +2.2%Bottega Veneta +8.8% +17.2% +15.8% +13.4% +13.8%Yves Saint Laurent +18.7% +14.4% +12.0% +42.0% +21.6%Other Luxury brands +6.9% +18.7% +9.4% +11.4% +11.3%
Luxury Division +6.4% +9.4% +5.6% +7.4% +7.2%
PUMA -2.3% -4.0% -0.8% -4.5% -2.8%Other Sport & Lifestyle brands -5.7% -2.4% -2.3% +1.5% -2.3%
Sport & Lifestyle Division -2.5% -3.9% -0.9% -4.1% -2.8%
Corporate - - - - -
Kering total +3.3% +5.2% +3.4% +4.0% +4.0%
Recurring operating income
Kering’s recurring operating income came to €1,750 million in 2013, down 2.3% on 2012 on a reported basis. The recurringoperating margin was 18.0% for the year, with the Luxury Division reporting an improved margin, at 26.0%. The recurringoperating margin for the Sport & Lifestyle Division narrowed, down to 6.2%.
(in € millions) 2013 2012 Change
Luxury Division 1,682.6 1,611.6 +4.4%Sport & Lifestyle Division 200.4 304.8 -34.3%Corporate (132.9) (124.9) -6.4%
Recurring operating income 1,750.1 1,791.5 -2.3%
61
3
2013 Financial Document ~ Kering
2013 ACTIVITY REPORT ~ FINANCIAL INFORMATION
03_A_VA_V4 20/02/14 16:56 Page61

Corporate income tax
The Group’s income tax charge for 2013 breaks down as follows:
(in € millions) 2013 2012 Change
Tax on recurring income (267.4) (359.9) -25.7%Tax on non-recurring items 32.0 62.3 -48.6%
Total tax charge (235.4) (297.6) -20.9%
Effective tax rate 21.5% 18.4% +3.1 ptsRecurring tax rate 17.4% 21.9% -4.5 pts
In 2013, the cost of net debt was just under €176 million,17% lower than in 2012.
This year-on-year decrease was primarily due to adecrease in Kering’s average cost of borrowing, notably asa result of lower interest rates on its floating rate debt,and to the impacts of the reorganisation of the Group’sbond debt in 2012 and 2013.
The decrease in the cost of net debt was partly offset bythe slight year-on-year rise in average net debt outstanding.Despite the full-year impact of the gain on the disposal ofCfao in second-half 2012, the Group’s net debt increased
in line with the various acquisitions carried out by theLuxury Division in 2013 and the recapitalisation of GroupeFnac prior to its distribution.
The €100 million year-on-year negative swing in “ Otherfinancial income and expenses ” was mainly due to the accounting treatment of the ineffective portion ofcurrency hedges, as well as the application of IAS 39(chiefly corresponding to fair value remeasurements anddiscounting adjustments in respect of the 2008 bondissue indexed to the Kering share, which fell due inNovember 2012 and in May 2013.
Net finance costs
The Group’s net finance costs can be analysed as follows:
(in € millions) 2013 2012 Change
Cost of net debt (175.8) (211.4) -16.8%Other financial income and expenses (36.5) 63.7 -
Finance costs, net (212.3) (147.7) +43.7%
Other non-recurring operating income and expenses
Other non-recurring operating income and expensesconsist of unusual items that could distort theassessment of each brand’s financial performance.
In 2013, this item represented a net expense of almost€443 million and chiefly included (i) €361 million in assetimpairment losses (of which €280 million concernedgoodwill related to PUMA), (ii) €30 million in restructuringcosts (primarily in the Luxury Division). The remaining€50 million includes acquisition costs for new brands,the impacts of the reorganisation measures implemented
at PUMA as part of the strategic objectives of the newmanagement team, and expenses incurred in connectionwith disputes and litigation with external parties.
In 2012, this item represented a net expense of €25 millionand chiefly included (i) €159 million in restructuring costs(of which €125 million related to PUMA’s TransformationProgramme), (ii) €54 million in asset impairment losses(of which €50 million concerned the Sergio Rossi brand),(iii) €233 million in net gains on asset disposals (themajority of which corresponded to the gain on the sale ofthe Group’s stake in Cfao), and (iv) a €25 million expensefor the arbitration procedure in the dispute betweenPUMA and its former partner in Spain (Estudio 2000).
62 Kering ~ 2013 Financial Document
3 FINANCIAL INFORMATION ~ 2013 ACTIVITY REPORT
03_A_VA_V4 20/02/14 16:56 Page62

Kering’s effective tax rate rose sharply in 2013 due to thefact that there were a number of non-recurring factorswhich generated operating expenses without anycorresponding tax benefit.
Adjusted for the effect of non-recurring items and the relatedtaxes, the recurring tax rate contracted by 4.5 percentagepoints to 17.4%. This improvement is chiefly attributableto the increased weighting of Luxury brands withinconsolidated income and the utilisation of previouslyunrecognised tax losses.
Share in earnings of associates
The Group’s share in earnings of associates totalled€1.6 million in 2013, compared with €37 million in 2012.
The 2013 total corresponds to the contribution of Wilderness.The 2012 total primarily corresponded to the contributionof Cfao, which was accounted for by the equity method asfrom December 2009 based on Kering’s residual interestin the company (42% as of June 30, 2012). Kering soldthis residual stake during the second half of 2012.
Net income from continuing operations
Consolidated net income from continuing operationscame to €862 million in 2013 versus €1,358 million forthe previous year.
Attributable net income from continuing operationsamounted to €869 million compared with €1,324 millionin 2012.
Net income (loss) from discontinued operations
This item includes the income statement contributionsfrom all assets (or groups of assets) accounted for inaccordance with IFRS 5 – Non-current assets held for saleand discontinued operations (see Note 12 to theconsolidated financial statements).
For the year ended December 31, 2013, the Groupreported a net loss of €822 million under this item, mainlycorresponding to the €256 million net loss recognisedon the disposal of Groupe Fnac shares, after tax anddistribution costs and the contribution of Groupe Fnac tofirst-half earnings, and a net €562 million expense recognisedin relation to Redcats. The net expense for Redcats primarilyincludes disposal losses on the businesses sold during theyear, as well as impairment losses recorded against Redcats’residual assets, and the undertaking given by Kering to recapitalise La Redoute in an amount of €315 millionto cover future losses and the cost of enhancing La Redoute’sproduction base. It does not include the cost of financing thesocial guarantees to be granted to the employees concernedby the modernisation measures at La Redoute and RelaisColis. The total cost of this financing, which cannot as yetbe reliably estimated, will lead Kering to set up a trustguaranteeing the application of the employee measures
approved in a majority collective agreement with tradeunions. The associated costs will be recognised in 2014.
For the year ended December 31, 2012, the Group reporteda net loss of almost €276 million under “Net income(loss) from discontinued operations”.
Non-controlling interests
Net income attributable to non-controlling interestsrepresented a negative amount of approximately€10 million in 2013 versus a positive €34 million in 2012.
Non-controlling interests in PUMA’s net incomedecreased during the year due to the combined effects ofthe Group’s purchases of additional PUMA shares during2013, which raised Kering’s interest in PUMA to nearly86% at December 31, 2013 from almost 83% one yearearlier, and the decline in PUMA’s net income, which waspartly due to the recognition of non-recurring expenses.
This impact was significantly offset by an increase in thenet income generated by operations carried out by the Groupalongside non-controlling partners (including Sowind,Gucci in the Middle East, and Janed and Wheat at PUMA).
Net income attributable to owners of the parent
Adjusted for non-recurring items net of tax, attributablenet income from continuing operations edged back 3.1%,coming in at €1,229 million versus €1,269 million in 2012.Adjusted for non-recurring items and excluding the impactof the May 2008 indexed bond issue, attributable net incomefor 2013 came in 4.6% higher than one year earlier.
Net income attributable to owners of the parent totalledclose to €50 million, affected by significant non-recurringexpenses and heavy net losses on discontinued operations.In 2012, net income attributable to owners amounted to€1,048 million.
Earnings per share
The weighted average number of Kering shares used tocalculate earnings per share was 126.0 million in 2013,virtually unchanged from the number used for 2012.
Earnings per share from continuing operations came to€6.91, compared with €10.51 for the previous year.
Earnings per share stood at €0.39 in 2013 versus €8.32for the previous year.
Excluding non-recurring items, earnings per share fromcontinuing operations amounted to €9.76, down 3.1% onthe 2012 figure. Adjusted for non-recurring items andexcluding the impact of the May 2008 indexed bondissue, earnings per share for 2013 came in 4.6% higherthan one year earlier.
The impact of dilutive instruments on the calculation ofearnings per share was almost neutral in 2013.
63
3
2013 Financial Document ~ Kering
2013 ACTIVITY REPORT ~ FINANCIAL INFORMATION
03_A_VA_V4 20/02/14 16:56 Page63
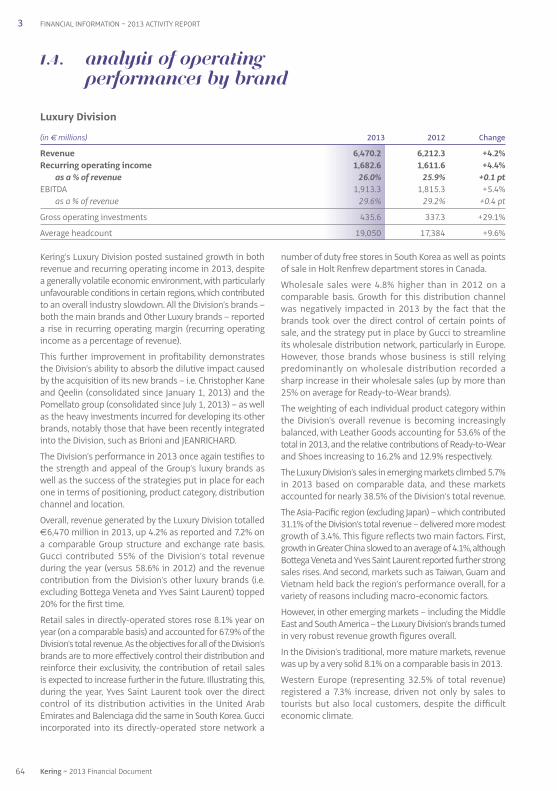
Kering’s Luxury Division posted sustained growth in bothrevenue and recurring operating income in 2013, despitea generally volatile economic environment, with particularlyunfavourable conditions in certain regions, which contributedto an overall industry slowdown. All the Division’s brands –both the main brands and Other Luxury brands – reporteda rise in recurring operating margin (recurring operatingincome as a percentage of revenue).
This further improvement in profitability demonstratesthe Division’s ability to absorb the dilutive impact causedby the acquisition of its new brands – i.e. Christopher Kaneand Qeelin (consolidated since January 1, 2013) and thePomellato group (consolidated since July 1, 2013) – as wellas the heavy investments incurred for developing its otherbrands, notably those that have been recently integratedinto the Division, such as Brioni and JEANRICHARD.
The Division’s performance in 2013 once again testifies tothe strength and appeal of the Group’s luxury brands aswell as the success of the strategies put in place for eachone in terms of positioning, product category, distributionchannel and location.
Overall, revenue generated by the Luxury Division totalled€6,470 million in 2013, up 4.2% as reported and 7.2% ona comparable Group structure and exchange rate basis.Gucci contributed 55% of the Division’s total revenueduring the year (versus 58.6% in 2012) and the revenuecontribution from the Division’s other luxury brands (i.e.excluding Bottega Veneta and Yves Saint Laurent) topped20% for the first time.
Retail sales in directly-operated stores rose 8.1% year onyear (on a comparable basis) and accounted for 67.9% of theDivision’s total revenue. As the objectives for all of the Division’sbrands are to more effectively control their distribution andreinforce their exclusivity, the contribution of retail salesis expected to increase further in the future. Illustrating this,during the year, Yves Saint Laurent took over the directcontrol of its distribution activities in the United ArabEmirates and Balenciaga did the same in South Korea. Gucciincorporated into its directly-operated store network a
number of duty free stores in South Korea as well as pointsof sale in Holt Renfrew department stores in Canada.
Wholesale sales were 4.8% higher than in 2012 on acomparable basis. Growth for this distribution channelwas negatively impacted in 2013 by the fact that thebrands took over the direct control of certain points ofsale, and the strategy put in place by Gucci to streamlineits wholesale distribution network, particularly in Europe.However, those brands whose business is still relyingpredominantly on wholesale distribution recorded asharp increase in their wholesale sales (up by more than25% on average for Ready-to-Wear brands).
The weighting of each individual product category withinthe Division’s overall revenue is becoming increasinglybalanced, with Leather Goods accounting for 53.6% of thetotal in 2013, and the relative contributions of Ready-to-Wearand Shoes increasing to 16.2% and 12.9% respectively.
The Luxury Division’s sales in emerging markets climbed 5.7%in 2013 based on comparable data, and these marketsaccounted for nearly 38.5% of the Division’s total revenue.
The Asia-Pacific region (excluding Japan) – which contributed31.1% of the Division’s total revenue – delivered more modestgrowth of 3.4%. This figure reflects two main factors. First,growth in Greater China slowed to an average of 4.1%, althoughBottega Veneta and Yves Saint Laurent reported further strongsales rises. And second, markets such as Taiwan, Guam andVietnam held back the region’s performance overall, for avariety of reasons including macro-economic factors.
However, in other emerging markets – including the MiddleEast and South America – the Luxury Division’s brands turnedin very robust revenue growth figures overall.
In the Division’s traditional, more mature markets, revenuewas up by a very solid 8.1% on a comparable basis in 2013.
Western Europe (representing 32.5% of total revenue)registered a 7.3% increase, driven not only by sales totourists but also local customers, despite the difficulteconomic climate.
1.4. Analysis of operating performances by brand
Luxury Division
(in € millions) 2013 2012 Change
Revenue 6,470.2 6,212.3 +4.2%Recurring operating income 1,682.6 1,611.6 +4.4%
as a % of revenue 26.0% 25.9% +0.1 ptEBITDA 1,913.3 1,815.3 +5.4%
as a % of revenue 29.6% 29.2% +0.4 pt
Gross operating investments 435.6 337.3 +29.1%
Average headcount 19,050 17,384 +9.6%
64 Kering ~ 2013 Financial Document
3 FINANCIAL INFORMATION ~ 2013 ACTIVITY REPORT
03_A_VA_V4 20/02/14 16:56 Page64

Gucci posted close to €3,561 million in revenue in 2013,down 2.1% year-on-year as reported but up 2.2% atcomparable exchange rates.
Two of the key components of the strategy put in place by Gucci to reposition its brand and further enhance its exclusivity include the strengthening of its directly-operated store network and the achieving in-storeoperational excellence. In line with this, retail salesgenerated in directly-operated stores accounted for76.8% of the brand’s total sales in 2013, representing a140 basis-point increase on 2012. Growth for thisdistribution channel came in at a very solid 4.8% overall atconstant exchange rates, with an extremely balancedbreakdown between mature markets (which reported a4.7% sales rise) and emerging markets (where the increasewas 4.8%). In the brand’s mature markets, the main growthdrivers were North America – where sales were buoyed byfavourable market conditions – and Japan. Gucci’s brandperception in North America and Japan is growing
constantly, illustrating the success of the repositioningstrategy implemented over the past few years.
Wholesale sales contracted 7.2% on a comparableexchange-rate basis, chiefly as a result of Gucci’s deliberatedecision to (i) limit the increase in sales of Ready-to-Wearand leather goods to certain distributors (notably in Italyand especially in the first half of the year), (ii) reduce thenumber of points of sale by bringing certain operationsback under direct management (notably in Canada), and(iii) incorporate 11 duty free points of sale in South Koreainto the directly-operated store network.
For Leather Goods – which represented approximately58% of the brand’s total sales – handbag sales postedsolid increases in sales, but luggage and small leathergoods saw declines. The positive effects of the measuresput in place over the last few seasons to fine-tune theoffering and focus on ever-more sophisticated productslargely benefited the overall performance of the handbagsrange in 2013. In 2013, this same repositioning effort
Gucci
(in € millions) 2013 2012 Change
Revenue 3,560.8 3,638.8 -2.1%Recurring operating income 1,131.8 1,126.4 +0.5%
as a % of revenue 31.8% 31.0% +0.8 ptEBITDA 1,275.8 1,260.3 +1.2%
as a % of revenue 35.8% 34.6% +1.2 pt
Gross operating investments 214.6 203.9 +5.2%
Average headcount 9,415 9,337 +0.8%
In North America (which accounted for 18.8% of the Division’ssales), revenue rose 7.6% year on year, led in particular by Gucciwhich is reaping the benefits of the measures undertakenover the past several years to more effectively control itsdistribution channels and enhance its brand perception.
Sales momentum was especially brisk in the Japanesemarket, where the Luxury Division’s brands posted 11.9%comparable-basis growth, propelled by the upswing inconsumer spending in Japan which began in late 2012, aswell as by an increase in purchases in the domesticmarket triggered by the weakening of the yen in 2013.
The Luxury Division’s recurring operating income rose 4.4%year on year to just under €1,683 million. At 26.0%, recurringoperating margin was up 10 basis points as reported,reflecting profitability gains achieved by the ensemble ofall brands. Currency hedges had a favourable impact duringthe year but were not the only reason for the rise inrecurring operating margin as the vast majority of thebrands also recorded an increase in gross margin atconstant exchange rates.
EBITDA rose 5.4% in 2013 to €1,913 million, which fuelleda 40 basis point increase in the EBITDA margin to 29.6%.
The Luxury Division’s gross operating investmentsamounted to €436 million in 2013, up 29.1% on 2012.This increase stemmed from store openings, expansionsand refurbishments (accounting for around 60% of thetotal) as well as significant investments in infrastructures,systems and the supply chain. It also reflects the Group’sobjective of allocating the resources required for developingthe brands’ businesses in line with their strategic plans. 2013was a key year for stepping up the pace of Yves Saint Laurent’sgrowth and integrating Brioni, with around two-thirds ofthe year-on-year increase in operating investments relatedto these two brands.
As of December 31, 2013 the Luxury Division had a networkof 1,149 directly-operated stores, including 750 in maturemarkets and 399 in emerging markets (201 in Greater China).Net store additions during the year totalled 191. However,when adjusted for transfers of existing points of salepreviously operated by third-party distributors (Yves SaintLaurent in the United Arab Emirates, Gucci and Balenciagain South Korea, Brioni in China and Gucci in Canada) andthe Qeelin store network as of January 1, 2013 and thePomellato/Dodo network as of July 1, 2013, the number ofnet store additions amounted to 94. Out of these additions,50 stores are in mature markets and 44 in emerging markets.
65
3
2013 Financial Document ~ Kering
2013 ACTIVITY REPORT ~ FINANCIAL INFORMATION
03_A_VA_V4 20/02/14 16:56 Page65

was stepped up in 2013 for luggage and small leathergoods, leading to a reduction in the distribution of certainentry price products. Within Leather Goods, theproportion of “ no logo ” products and products in pureleather and precious skins increased again during the year.For example, no-logo handbags accounted for almost halfthe product category’s overall revenue, versus 37% in 2012.
The brand’s other main product categories (shoes andReady-to-Wear, which together accounted for 25% ofGucci’s total revenue in 2013) recorded a rise in sales, buoyedby the commercial success of the Men’s shoe collections.
More generally, revenue generated from sales of Men’scollections increased sharply in 2013, as it had donealready in 2012.
The product categories that Gucci has launched orrevamped more recently – such as the children’s line andsilk products (scarves, ties, etc.) – have proved to be solidgrowth drivers and positively contributed to traffic intothe brand’s stores. In 2013 these categories all postedsignificant revenue increases.
Gucci’s sales in emerging markets were 0.4% higher thanin 2012 based on comparable data. A number of markets,such as the Middle East, Latin America and Eastern Europe,saw sustained growth but sales in the Asia-Pacific regionwere down slightly. The contraction in the Asia-Pacificregion was due to tougher macro-economic conditions andoperational reasons specific to the brand, with certainAsian markets such as Taiwan, Singapore and Vietnamweighing on performance during the year. In Mainland China,where the brand operated 61 stores as of December 31,2013, Gucci reported a moderate sales decline against abackdrop of consolidation, refurbishment of the existingstore network, and repositioning of the brand’s offering.
Revenue generated by Gucci in its mature markets rose 3.5%on a comparable basis. In Western Europe, revenue growthwas 1.0% in view of the difficult economic situation in theeurozone and despite the brand deliberately limitingsales to third-party distributors in the region, notably in thefirst half of the year. In North America, Gucci posted a solidincrease in sales, up 5.3%, driven by the brand’s successfulmarket repositioning in the region. This performance wasachieved despite a reduction in the number of Japanese
tourists as a result of the weaker yen, whose adverse effectswere notably felt in Hawaii. The Japanese domestic marketwas particularly buoyant in 2013, however, fuelling a 7.0%rise, at comparable exchange rates, in Gucci’s revenue inthat country.
Gucci’s recurring operating income for 2013 edged up 0.5%on a reported basis year on year, coming in at €1,132 million.This led to an 80 basis-point increase in recurringoperating margin to 31.8%, which represents a recordhigh for the brand. Although the year-on-year increasewas in part due to the positive impact of currency hedges,it also clearly reflects the underlying improvement ingross margin (at constant exchange rates) achieved as aresult of the brand’s effective product mix. At the sametime it demonstrates the results of Gucci’s strategy ofpositioning itself as a leading global brand in the Luxurymarket by further enhancing its exclusivity and increasingthe proportion of revenue generated in the highest-pricesegments. The rise in gross margin also helped offset theimpact of the increase in operating expenses during theyear, which primarily stemmed from the higher storerunning costs incurred in connection with the brand’sobjective of continually improving its store network.
EBITDA for 2013 totalled €1,276 million, up 1.2% as reported,and the EBITDA margin stood at 35.8%.
As of December 31, 2013, Gucci operated 474 stores directly,including 183 in emerging markets, of which 76 in GreaterChina. Excluding the incorporation into the directly-operatedstore network of 11 points of sale in South Korea and 8boutiques in Holt Renfrew department stores in Canada,Gucci added a net 26 new stores in 2013 (compared with53 net additions in 2012), of which 20 in mature markets.
Gucci’s gross operating investments amounted to€215 million in 2013, up 5.2% on 2012, when they rose byaround 83%. 2013 therefore marked the first stage towarda stabilisation of the brand’s investment spending. Store-related investments accounted for over half of the brand’stotal gross operating investments in 2013, with priority givento refurbishments in order to enhance both the network’sproductivity and customers’ shopping experience and to provide a retail environment aligned with the brand’songoing repositioning.
66 Kering ~ 2013 Financial Document
3 FINANCIAL INFORMATION ~ 2013 ACTIVITY REPORT
03_A_VA_V4 20/02/14 16:56 Page66

Bottega Veneta’s revenue topped €1 billion in 2013,coming in at just under €1,016 million, up 7.5% on areported basis and 13.8% at comparable exchange rates.Between 2011 and 2013, the brand’s revenue rose byalmost 50% based on comparable data, representing oneof the strongest growth rates among the luxury industry’shigh-end players.
With a view to preserving its high-end positioning andexclusivity, Bottega Veneta’s preferred distributionchannel is the brand’s directly-operated stores. In 2013, retailsales in directly-operated stores increased by 15.2% on acomparable basis and this distribution channel accountedfor 81.3% of the brand’s total sales (versus 80.6% in 2012).In line with its aim of continually differentiating andenhancing its store network, in September 2013 the brandopened its first Maison concept store, on Via Sant’ Andreain Milan.
Wholesale sales rose 7.9% in 2013, with momentum pickingup in the second half compared with the first six monthswhich were affected by the fact that Cruise collectiondeliveries had been anticipated in late 2012. Throughout thecourse of the year, Bottega Veneta continued to apply itsstrategy of streamlining its distributor network in order tostrengthen the brand’s exclusivity, particularly in Europe.
Leather Goods remained the brand’s core business,representing 85.6% of Bottega Veneta’s total sales. The salesperformance for this product category was extremelysolid during the year, propelled by an offering made up ofsignature collections enriched by new seasonal designsfeaturing different forms, colours and functions. Thebrand’s other product categories also saw sustained salesgrowth in 2013. For example, sales for the Men’s shoesand Ready-to-Wear collections advanced by some 25%year on year. Against this very favourable backdrop, thebrand launched its first Men’s fragrance.
Bottega Veneta’s sales growth in 2013 was evenly balancedbetween its traditional and emerging markets, whichrecorded respective revenue rises of 12.5% and 15.5% atcomparable exchange rates. These figures are consistentwith the brand’s expansion strategy which is aimed atstrengthening Bottega Veneta’s positioning in all theregions where it is present.
Emerging markets accounted for 44.0% of the brand’stotal sales in 2013, with the Asia-Pacific region (excludingJapan) making up a significant portion of this contribution.Bottega Veneta’s brand appeal is particularly high inMainland China, where its sales rose 26.6% year on yearon a comparable basis.
In its traditional markets, Bottega Veneta delivered anothervery solid showing despite the more complex macro-economic environment in Western Europe. Sales in thisregion – which represented 27.9% of the brand’s total –advanced 12.6% on a comparable basis, led by demandfrom both local customers and tourists (excluding Japanesetourists). In Japan – which made up 14.6% of total sales –business was extremely buoyant during the year, withcomparable-basis growth of 18.8% (down 5.8% on areported basis), powered both by the brand’s appeal andthe weak yen which boosted momentum in the domesticmarket. In North America the year-on-year sales increasewas 6.0% based on comparable data. Adjusted for thenegative trends in Hawaii resulting from the lowernumbers of Japanese tourists, sales in North Americaclimbed by almost 10%.
Bottega Veneta posted recurring operating income of closeto €331 million for 2013, with a record recurring operatingmargin of 32.5%, which represents a year-on-year increaseof 70 basis points as reported. The positive effects arisingfrom the brand’s currency hedges as well as better absorptionof fixed operating costs more than offset the initial dilutiveeffect on profitability caused by the store openings incurredin 2012 and 2013 and the launch of new product categories.
EBITDA totalled just under €355 million and the EBITDAmargin climbed to 34.9%, up 100 basis points as reported.
Bottega Veneta’s network of directly-operated storestotalled 221 as of December 31, 2013, including 90 inemerging markets. There were 25 net store additionsduring the year, versus 26 in 2012. In addition, the brandextended, refurbished or relocated or a total of 16 stores.
Bottega Veneta’s gross operating investments rose byaround 50% year on year to €62.0 million. Almost twothirds of these investments related to the store networkand the remainder included financing for a new atelierand offices at Montebello Vicentino.
Bottega Veneta
(in € millions) 2013 2012 Change
Revenue 1,015.8 945.1 +7.5%Recurring operating income 330.6 300.1 +10.2%
as a % of revenue 32.5% 31.8% +0.7 ptEBITDA 354.8 320.6 +10.7%
as a % of revenue 34.9% 33.9% +1.0 pt
Gross operating investments 62.0 41.3 +50.1%
Average headcount 2,891 2,339 +23.6%
67
3
2013 Financial Document ~ Kering
2013 ACTIVITY REPORT ~ FINANCIAL INFORMATION
03_A_VA_V4 20/02/14 16:56 Page67

Following on from 2012, which saw the appointment ofHedi Slimane as Creative Director with total responsibilityfor the brand’s image, 2013 marked a year of investmentfor Yves Saint Laurent, particularly in terms of opening newstores and strengthening the brand’s exclusivity, on-linedistribution and communications.
Against this backdrop of deep-seated change and aftertwo years of strong growth, Yves Saint Laurent’s revenuerose again in 2013, up 17.8% year on year as reported and21.6% based on comparable exchange rates. Total salestopped the €500 million mark, coming in at €557 million.
Wholesale sales jumped 42.6% on a comparable basis.While this performance was partly due to the brand’sdecision to postpone to the first quarter of 2013 certaindeliveries initially planned for 2012, it above all reflectsthe success of the brand’s new creative vision as well asthe depth and consistency of its product offering that leddistributors to increase their orders.
Retail sales in directly-operated stores – which accountedfor around 56% of the brand’s total sales – rose by a verysolid 14% on a comparable basis, with trends improvingconsistently quarter after quarter following on from atransition phase at the beginning of the year that wasrequired in order to adapt production and merchandisingprocesses and introduce the brand’s new store concept.To illustrate this, during the fourth quarter of the yearcomparable-basis growth in retail sales in directly-operated stores had reached 30.7%.
Revenue from royalties, however – primarily from L’Oréal forfragrances and cosmetics – were barely on a par with 2012.
All of Yves Saint Laurent’s main product categories registeredsharp sales growth during the period. Revenue fromReady-to-Wear surged by more than 50% on a comparablebasis and represented almost a quarter of the brand’s totalsales, proving that this category is regaining its essentialplace in the product offering. Leather Goods and Shoesdelivered a robust sales showing, driven by both new stylesand the brand’s signature products which have beenrevisited by Hedi Slimane.
Yves Saint Laurent posted increases in sales across allregions in 2013.
Sales growth in emerging markets came in at 19.4%, withthese markets accounting for 28.4% of the brand’s revenue.Yves Saint Laurent’s best-performing regions were theMiddle East – where it now directly manages distributionin the United Arab Emirates as part of a joint venture –and Greater China which saw a revenue jump of 23.1%,demonstrating the brand’s growing recognition anddesirability in that region.
In Yves Saint Laurent’s traditional markets, sales advancedby 22.5% on a comparable basis, reflecting the brand’srenewed appeal with local customers. Business wasparticularly buoyant in Japan, where sales jumped 29.6%at constant exchange rates, fuelled by customers’ verypositive reaction to the brand’s repositioning andrejuvenation. Sales in Western Europe and North Americawere also up sharply, with comparable-basis growthcoming in at 25.9% and 14.5% respectively.
Yves Saint Laurent ended 2013 with recurring operatingincome of close to €77 million, representing a year-on-year increase of 17.8%, and recurring operating margin stoodat 13.8%, up 10 basis points as reported. The positiveimpact of currency hedges was not significant in 2013.Although the costs incurred for expanding the business(extending the store network and putting in place a pro-active brand communication strategy) were much higherthan in 2012, the brand was able to maintain its operatingprofitability thanks primarily to its wider gross marginand capacity to tightly control other operating expenses.
Given the growing weight of depreciation and amortisation,EBITDA rose at a faster pace than recurring operatingincome, coming in at €93 million. The EBITDA margin was16.7%, up 70 basis points on 2012.
As of December 31, 2013, the Yves Saint Laurent branddirectly operated 115 stores, including 46 in emergingmarkets. In line with the brand’s aim of stepping up thepace of business expansion in 2013 by investing in thedistribution network, there were 20 net store additionsduring the year and the brand brought back under directmanagement another six points of sale in the UnitedArab Emirates.
As a result, gross operating investments increased three-fold in 2013 to €65 million, with nearly 80% of thisamount related to opening new stores and adaptingexisting stores to the new store concept.
Yves Saint Laurent
(in € millions) 2013 2012 Change
Revenue 556.9 472.8 +17.8%Recurring operating income 76.6 65.0 +17.8%
as a % of revenue 13.8% 13.7% +0.1 ptEBITDA 93.0 75.8 +22.7%
as a % of revenue 16.7% 16.0% +0.7 pt
Gross operating investments 65.3 21.8 +199.5%
Average headcount 1,445 1,208 +19.6%
68 Kering ~ 2013 Financial Document
3 FINANCIAL INFORMATION ~ 2013 ACTIVITY REPORT
03_A_VA_V4 20/02/14 16:56 Page68

Other Luxury brands have included Christopher Kane andQeelin since January 1, 2013 and the Pomellato and Dodobrands (the Pomellato group) since July 1, 2013.
Total revenue generated by Other Luxury brands amountedto €1,337 million in 2013, up 15.7% year on year as reportedand 11.3% on a comparable Group structure and exchangerate basis. Other Luxury brands contributed nearly 21% ofthe Luxury Division’s total revenue during the year.
Wholesale sales rose 10.2% on a comparable basis. Ready-to-Wear brands (Balenciaga and the three UK brands) sawtheir wholesale sales increase by around 20%, but overallperformance for this distribution channel was adverselyaffected by the reorganisation of Girard-Perregaux’sdistribution structure in Asia (which is still in progress), andthe streamlining measures put in place for Sergio Rossi’sdistributors’ network.
Retail sales in directly-operated stores advanced 12.8%on a comparable basis, and accounted for 39.0% of totalrevenue generated by Other Luxury brands in 2013.Developing an exclusive distribution network remains anobjective for all brands but has to be adapted in line witheach brand’s maturity and positioning in its traditionalmarkets as well as the depth and scope of its product offering.
All product categories of the Group’s Other Luxury brandsposted revenue increases for 2013. Ready-to-Wear wasthe best-selling category, representing 34.2% of totalrevenue generated by these brands, and recorded asignificant 17.3% sales rise on a comparable basis.Leather Goods (21.7% of revenue) and Shoes (12.3%) alsoreported buoyant sales growth. Although the Timepiecesand Jewellery category was penalised in the short term bythe reorganisation of Girard-Perregaux’s distribution in Asia,it nevertheless recorded a very solid increase in sales, partlythanks to a particularly strong showing from Boucheron.
Sales growth for Other Luxury brands was fairly balancedbetween mature markets and emerging markets, withrespective rises of 10.7% and 13.0% based on comparable data.
Mature markets, which are the traditional markets of theGroup’s Other Luxury brands, again made up 72.4% of thesebrands’ total revenue. Growth in these markets was led bylocal clienteles, especially in Japan and North America.
Overall, business in emerging markets was hampered in2013 by weaker spending on luxury products in China aswell as by a generally lacklustre market for timepieces in
the Asia-Pacific region at the beginning of the year. However,despite these unfavourable effects, the Group’s OtherLuxury brands reported sales growth of 8.8% in GreaterChina and well over 10% in their other emerging markets,notably the Middle East. These performances not onlyreflect the brands’ capacity to attract new customers butalso demonstrate the fact that emerging markets are stilla major growth vector.
Recurring operating income from Other Luxury brandsclimbed 19.6% to almost €144 million. Recurring operatingmargin rose by 30 basis points to 10.7% on a reported basisand was also up year on year based on constant exchangerates. These increases reflect the Group’s portfolio strategywhich targets a profitable growth model, while taking intoaccount the investments required to develop the businessof all of its brands and integrate newly-acquired brands.
EBITDA came in at just under €190 million, up 19.6% on2012 as reported.
The network of directly-operated stores owned by OtherLuxury brands totalled 339 stores as of December 31, 2013,including 55 in Greater China and 25 in other emergingmarkets. A total of 259 stores are located in these brands’traditional markets, mainly concentrated in Western Europeand Japan (118 and 104 stores respectively). There were 95net store additions during the year, reflecting the combinedimpacts of integrating Qeelin and Pomellato (60 storeadditions), transferring or purchasing points of sale that werepreviously operated by third parties (12 additions), openingnew stores (41 additions), and closing 18 existing stores.
The Group’s commitment to developing the business of itsOther Luxury brands is evidenced by the 33.3% increase intheir gross operating investments in 2013 to €94 million,the majority of which were related to store openings.
For Alexander McQueen and McQ, 2013 was another year ofstrong growth, with very solid sales rises across all regions,product categories and distribution channels. AlexanderMcQueen pursued the controlled expansion of its directly-operated store network, adding a net three new stores duringthe year. Against this backdrop of sustained growth in bothrevenue and gross margin, the brands’ operating incomeposted a significant increase.
For Balenciaga, 2013 was a transition year following AlexanderWang’s appointment as Creative Director in December 2012.The brand posted a robust increase in sales, with growth
Other Luxury brands
(in € millions) 2013 2012 Change
Revenue 1,336.7 1,155.6 +15.7%Recurring operating income 143.6 120.1 +19.6%
as a % of revenue 10.7% 10.4% +0.3 ptEBITDA 189.7 158.6 +19.6%
as a % of revenue 14.2% 13.7% +0.5 pt
Gross operating investments 93.7 70.3 +33.3%
Average headcount 5,299 4,500 +17.8%
69
3
2013 Financial Document ~ Kering
2013 ACTIVITY REPORT ~ FINANCIAL INFORMATION
03_A_VA_V4 20/02/14 16:56 Page69

picking up in the second half as the new collections graduallymade their mark. One of the best-performing categoriesduring the year was Women’s Ready-to-Wear, which is atthe heart of the brand’s identity and history. Balenciaga’soperating margin held firm, despite the investmentexpenditure required for the brand’s expansion.
Boucheron successfully pursued the expansion of its Bijouxand Jewellery lines in 2013, especially its signature line,Quatre, but also its Serpent Bohème line. At the sametime, following its successful return to the Biennale desAntiquaires event in Paris in late 2012, the brand postedstrong growth in High Jewellery sales. Also during the year,Boucheron strengthened its presence in Asia, opening anew store in Hong Kong and delivering a particularly solidperformance in Japan. It ended the year with a sharpincrease in recurring operating income, thanks to both itsrevenue growth and tight control over operating expenses.
For Brioni, 2013 was the first year in which the brand beganto reap the benefits of both its integration into the Group’sLuxury Division and the vision of its Creative Director, BrendanMullane. Brioni’s new collections were warmly acclaimed,and synergies with the Group were reinforced when thebrand joined the Luxury Division’s logistics platform inthe last quarter of the year. Against this backdrop, and inview of the expansion of the brand’s directly-operatedstore network (10 net additions in 2013, including thebuy-back of franchised stores in China), Brioni registeredsolid revenue growth for the year as well as an increase inoperating income.
Business for the Christopher Kane brand (which wasintegrated in Kering’s Luxury Division on January 1, 2013)developed considerably during the year. The brand iscurrently distributed in 30 countries through a network of150 points of sale operated by third parties, and its firststore is scheduled to open in 2014. Christopher Kane, theeponymous founder, was named Womenswear Designer ofthe Year at the 2013 British Fashion Awards in recognitionof his innovative design talent. This award will contribute toreinforce the brand awareness.
Sowind – which operates the Girard-Perregaux andJEANRICHARD brands – delivered a mixed performance in2013. Girard-Perregaux continued to streamline itsoffering and optimise its manufacturing capacity, and its
ground-breaking new high-end timepiece with arevolutionary “ Constant Force ” escapement was presentedto great acclaim at the 2013 Baselworld Watch andJewellery Show. JEANRICHARD began to market its newcollections having overhauled its range and launched itsnew brand identity. Sales momentum was good for bothbrands but Girard-Perregaux was hampered by thereorganisation of its distribution channels in Asia whichwill continue into the first half of 2014. Despite this,Sowind made a positive contribution to the Group’soperating income.
Pomellato and Dodo – which were integrated in Kering’sLuxury Division since July 1, 2013 – felt the benefits of theGroup’s support from the second half of the year, in termsof commercial property, brand marketing and corporatefunctions. The two brands pursued their respectivestrategies in 2013, with Pomellato focusing on targetedregional expansion and the introduction of new lines and collections, and Dodo aiming to consolidate itsmarket share.
Qeelin – which has been integrated since January 1, 2013 –stepped up the pace of its expansion during the year, openingnew stores in Hong Kong and Mainland China and increasingits marketing investments. Consequently, the brand wasable to deliver solid year-on-year growth despite lessfavourable conditions in the jewellery market in Asia.
Sergio Rossi posted revenue growth in 2013, particularlyin its directly-operated stores network. The brand is indeedpursuing its efforts to streamline and improve the qualityof its distributors network. At the same time, the sales inits directly-operated stores, which account for more thanhalf of total sales, have posted a solid increase.
2013 was another year of growth and expansion for StellaMcCartney. The brand recorded a surge in sales, buoyedby growing recognition and a well-balanced offeringbetween ready-to-wear, leather goods and the children’sline. The contribution of emerging markets is rising, and theyaccounted for over 20% of the brand’s total sales for the firsttime. A total of five new directly-operated stores were openedduring the year and one store was closed. Stella McCartneyalso reported robust growth in operating income.
70 Kering ~ 2013 Financial Document
3 FINANCIAL INFORMATION ~ 2013 ACTIVITY REPORT
03_A_VA_V4 20/02/14 16:56 Page70

2013 was a year of deep transformation for the Sport &Lifestyle Division, during which its brands:
• restructured their management teams;
• stepped up the streamlining of their organisationalstructures;
• pursued their strategy of repositioning and redefining theirproduct offerings, which in PUMA’s case is not expectedto deliver its full benefits until the second half of 2014at the earliest.
This transformation process was carried out against abackdrop of (i) a particularly difficult economic environmentin Western Europe which weighed on consumer spending,(ii) lacklustre markets for Surfwear and Action Sports, and(iii) the saturation of certain other markets, notably inAsia, which resulted in excess inventory levels for somethird-party distributors.
Reflecting these adverse factors, the Sport & LifestyleDivision reported revenue of €3,247 million in 2013, down8.1% as reported and down 2.8% based on a comparableGroup structure and exchange rates.
This unfavourable operating context, combined with theongoing reorganisation of Volcom’s distributors networkin North America, led to a 4.9% comparable-basis erosionin wholesale sales, which accounted for 79.2% of theDivision’s total revenue.
Conversely, retail sales in directly-operated stores rose 6.3%on a comparable basis, with solid growth also recorded atconstant store perimeter.
By product category, Footwear sales (which contributed42.5% of the Division’s total sales versus 45.3% in 2012)were down 8.2% on a comparable basis, reflecting strongcompetitive pressure. Apparel sales (38.6% of total revenueversus 39.1% in 2012) suffered from a difficult operatingcontext – notably in the European market – and weredown 1.5% on a comparable basis. Accessories sales rosesignificantly, up 8.7% on a comparable basis, driven by goodperformances for Cobra Puma Golf, Janed and Dobotex.
Revenue generated by the Sport & Lifestyle Division inemerging markets came down 3.8% on a comparablebasis and accounted for 35.3% of the Division’s totalrevenue for 2013.
In the Division’s more mature markets, the year-on-yearcontraction was more contained, with comparable-basissales down just 2.2% year-on-year. Sales levels declinedduring the year in Western Europe (which represented29.4% of the Division’s total revenue for the year) butremained solid in North America (25.4% of revenue), withsales up 3.0% based on comparable data.
The Sport & Lifestyle Division ended 2013 with recurringoperating income of just over €200 million, down 34.3%as reported.
Recurring operating margin narrowed by 240 basis pointsto 6.2%, with decreases recorded both for PUMA and the Division’s other brands. The cost savings achieved byall brands during the year were not sufficient to offset theimpact of the contraction in gross margins resulting frominventory write-offs and weight of the discounts grantedto distributors during the current transition phase for the Division.
EBITDA totalled just over €258 million, down 30.3%.
As of December 31, 2013, the Sport & Lifestyle Division’sdirectly-operated stores network amounted to 608 pointsof sale. A total of 67 new points of sale were opened in2013 – with 46 located in emerging markets – and 96 storeswere closed, including 53 as part of the TransformationProgramme announced by PUMA in July 2012.
In view of the transformation measures being undertakenwithin the Sport & Lifestyle Division and the contractionin its revenue, gross operating investments were reducedin 2013 to just under €75 million, representing a 17.9%decrease.
Sport & Lifestyle Division
(in € millions) 2013 2012 Change
Revenue 3,247.0 3,531.9 -8.1%Recurring operating income 200.4 304.8 -34.3%
as a % of revenue 6.2% 8.6% -2.4 ptsEBITDA 258.3 370.8 -30.3%
as a % of revenue 8.0% 10.5% -2.5 pts
Gross operating investments 74.8 91.1 -17.9%
Average headcount 11,521 11,720 -1.7%
71
3
2013 Financial Document ~ Kering
2013 ACTIVITY REPORT ~ FINANCIAL INFORMATION
03_A_VA_V4 20/02/14 16:56 Page71

PUMA’s revenue reached around €3,002 million in 2013,down 8.2% on a reported basis and 2.8% based on acomparable basis.
This revenue contraction is in line with PUMA’s forecasts,as announced on May 14, 2013, which called for a revenuedecrease in the full year. The decrease was partly attributableto external factors, namely an unfavourable consumerspending environment (particularly in Western Europe)and inventory saturation in certain emerging markets. Italso reflected some issues specific to PUMA, such as thediscontinuation of certain businesses, the closure ofunprofitable stores, and the measures currently underwayto streamline the brand’s product offering, especially in Footwear.
In that context, wholesale sales decreased 5.0% year-on-year on a comparable basis, with around 40% of the declineattributable to Western Europe where distributorsreduced their orders. PUMA also recorded lower wholesalesales in most of its emerging markets, due to the highinventory levels previously built up by distributors andthe unsettled economic environment in certain SouthAmerican countries. In North America, however, wholesalesales were up slightly year on year.
Revenue posted by PUMA’s directly-operated stores rose5.8% in 2013 on a comparable basis. Western Europe wasthe only underperforming region for this channel, but thisis partly due to the fact that the number of stores in thisregion has been significantly reduced in 2013 (19% fewerstores compared to last year).
By product categories, Footwear once again accounted forthe highest proportion of sales, representing 45.6% (versus48.8% in 2012), although revenue for this categorycontracted 8.5% year on year on a comparable basis. Positiveperformances from several footwear lines – including theMobium Elite – in the key segments of Running, Training& Fitness and Lifestyle were not sufficient to offset the downward trends experienced by the brand’sFootwear distributors in almost all regions, particularly inWestern Europe.
Apparel sales (35.4% of PUMA’s total revenue versus 35.2% in2012) posted a limited decline in sales, down just 1.1% on acomparable basis. The trends observed in the first six monthsof the year continued into the second half, with negativetrends in European markets but growth in North America.
Conversely, Accessories sales and other revenue were up10.0% on a comparable basis. Sales growth was particularlystrong in mature markets (especially North America), ledby robust performances by COBRA PUMA GOLF but alsoDobotex and Janed.
PUMA generated 37.1% of its total 2013 sales in emergingmarkets, where the brand reported a 3.8% comparable-basis revenue contraction for the year.
In Western Europe, PUMA’s revenue dropped 6.1%, withparticularly negative trends in France and Italy. However,business was up sharply in the United Kingdom, which isone of the brand’s three largest markets in the region.
In Japan, sales declined 3.2%, while they were up 3.9% in North America, fuelled by growth in the Apparel andAccessories categories.
PUMA’s contribution to the Group’s recurring operatingincome amounted to €192 million in 2013 (down 33.8% on2012) and the brand’s recurring operating margin retreatedby 250 basis points to 6.4%. EBITDA totalled €246 million,down 29.7% year-on-year.
This decrease in operating profitability is in line with theguidance issued by PUMA in its quarterly releases concerningits profitability for the full year.
The main reason for PUMA’s lower profitability levels was the190 basis-point narrowing of its gross margin comparedwith 2012, which was primarily due to adverse currencyeffects, the impact of discounts granted to third-partydistributors, and inventory clearance measures. At the sametime, purchasing conditions did not significantly improve.
Operating expenses fell by 6.6% on a reported basis. Thisreduction in the brand’s cost base is one of the initialeffects of the Transformation Programme announced inJuly 2012 and implemented since then, which hasenabled PUMA to limit the contraction in its recurringoperating margin.
However, the full effects of the Programme – notably anupswing in sales – are not expected to be felt until themedium term, i.e. after 2014. In order to implement themeasures related to product development, marketing andcommunications, some operating expense items mayincrease while others will be generally contained or reduced.
PUMA
(in € millions) 2013 2012 Change
Revenue 3,001.9 3,270.7 -8.2%Recurring operating income 191.9 290.0 -33.8%
as a % of revenue 6.4% 8.9% -2.5 ptsEBITDA 246.4 350.3 -29.7%
as a % of revenue 8.2% 10.7% -2.5 pts
Gross operating investments 67.7 81.2 -16.6%
Average headcount 10,750 10,935 -1.7%
72 Kering ~ 2013 Financial Document
3 FINANCIAL INFORMATION ~ 2013 ACTIVITY REPORT
03_A_VA_V4 20/02/14 16:56 Page72

Volcom and Electric recorded combined revenue of €245 million in 2013, down 6.2% year on year as reportedand 2.3% on a comparable basis. The second half of theyear saw the beginning of a recovery for these brands,however, with comparable-basis sales up 1.5% in thefourth quarter. As in 2012, sales for Volcom and Electric wereadversely affected by a tough operating environment in theSurfwear and Action Sports markets in general, combinedwith a major reorganisation of the point of sales networkat certain key distributors in the United States.
These negative market factors have weighed not only onVolcom and Electric but also on the vast majority of theircompetitors. They also led Volcom and Electric to redefinetheir offerings as early as in the second half of 2012, andto streamline their organisational structures and carryout an in-depth reorganisation of their managementteams in 2013.
In 2013, Electric continued to reposition itself in theaccessories market (which accounted for 82.6% of its sales)by drastically reducing its apparel offering. The benefitsof the revamping of the brand’s product offering aroundnew ranges of sunglasses, snow goggles and watchesstarted to bear fruit, in terms of improved revenue trendtowards year-end.
Volcom followed on its 2013 objective of safeguarding itsmargins and protecting its brand image by limiting thenumber of markdowns and discounts during the year,carefully selecting its distributors and increasing theweight of its retail distribution channel. This enabled thebrand to mitigate the decline of its sales to -1.4% (on acomparable basis) for the year as a whole, and even torecord a rise in revenue in the second half.
For the Apparel category – which remains Volcom’s corebusiness – the brand reported a relatively contained declinein sales despite the impact of both weak consumer spendingand the impact from the reorganisation measuresundertaken by some of its distributors. Volcom’s otherproduct categories (which now account for around 17% ofthe brand’s total revenue) however saw an increase in salesin 2013, with particularly encouraging business trends for the Footwear category which has been developed inconjunction with PUMA’s teams.
In North America, which is the main market for Volcom andElectric, – representing 62.6% of their aggregate sales –revenue decreased only slightly for the year as a whole,thanks to an improvement in the second half (on acomparable basis). However, the revenue decline wasmore pronounced in Western Europe (which accounted for19.2% of the two brands’ revenue). Meanwhile, in Japanand Central and South America – which are importantmarkets for Volcom – business was well oriented duringthe year.
Volcom and Electric’s combined recurring operating incomefor 2013 contracted by 42.6% year on year, coming in atslightly below €9 million, putting the recurring operatingmargin at 3.5% (versus 5.7% in 2012).
The year-on-year decrease in recurring operating income wasmainly due to the erosion of the two brands’ gross marginin absolute terms caused by the decline in revenue and, toa lesser extent, a contraction in gross margin percentage.
As of December 31, 2013, Volcom’s directly-operated storenetwork (Electric does not have any directly-operated stores)comprised 47 stores, including nine in emerging markets.
Volcom and Electric’s gross operating investments amountedto some €7 million in 2013, with a very sharp decreasecompared to 2012.
Other Sport & Lifestyle brands
(in € millions) 2013 2012 Change
Revenue 245.1 261.2 -6.2%Recurring operating income 8.5 14.8 -42.6%
as a % of revenue 3.5% 5.7% -2.2 ptsEBITDA 11.9 20.5 -42.0%
as a % of revenue 4.9% 7.8% -2.9 pts
Gross operating investments 7.1 9.9 -28.3%
Average headcount 771 785 -1.8%
As of December 31, 2013 PUMA’s directly-operated retailnetwork included 561 stores, with 33 net closures comparedwith December 31, 2012. A total of 92 stores were closedduring the year, including 53 as part of the TransformationProgramme announced in the summer of 2012 (on topof the 20 closures in 2012). An aggregate 59 new storeswere opened, including 43 in emerging markets.
In light of the financial discipline in the context of theTransformation Programme and strict management ofoperating cash flows, PUMA’s gross operating investmentswere scaled back to €68 million in 2013, down 16.6% on 2012.
73
3
2013 Financial Document ~ Kering
2013 ACTIVITY REPORT ~ FINANCIAL INFORMATION
03_A_VA_V4 20/02/14 16:56 Page73

Capital employed
As of December 31, 2013, capital employed was €538 millionhigher than at the previous year-end.
Goodwill, brands and other intangible assets, net
As of December 31, 2013, “Goodwill, brands and otherintangible assets, net” represented 63% of total assets(versus 57% as of December 31, 2012) and mainlycomprised:
• goodwill amounting to €3,770 million, of which€2,523 million related to the Luxury Division and€1,247 million to the Sport & Lifestyle Division. This
overall goodwill figure was lower than the end-2012total due to the €280 million impairment loss recordedagainst PUMA’s goodwill, although the impact of thiswritedown was partially offset by the effect of theacquisitions carried out during the year;
• brands valued at €10,470 million, of which €6,629 millionfor the Luxury Division and €3,841 million for the Sport &Lifestyle Division. The year-on-year increase in this figurewas primarily due to the acquisition of Pomellato.
Net of deferred tax liabilities relating to brands (which arerecorded under “Other non-current assets (liabilities),net”, as shown below), this item came to €11,738 millionas of December 31, 2013.
1.5. Comments on the Group’s financial position
(in € millions) 2013 2012 Change
Goodwill, brands and other intangible assets, net 14,472.9 14,360.9 +112.0Other non-current assets (liabilities), net (119.9) (467.4) +347.5Current assets, net 836.2 756.7 +79.5Provisions (365.9) (364.8) -1.1
Capital employed 14,823.3 14,285.4 +537.9
Net assets held for sale (184.5) 325.0 -509.5
Total equity 11,195.9 12,118.7 -922.8
Net debt 3,442.9 2,491.7 +951.2
The Corporate segment
The Corporate segment comprises (i) Kering’s corporatedepartments and headquarters teams, (ii) SharedServices, which provide services to the brands, and (iii)the Kering Sustainability Department which is responsiblefor the sustainability initiative launched by Kering in 2011.
Since January 1, 2013 this segment has also included Kering’snew Sourcing Department based on Redcats Asia –
Redcats’ sourcing business that the Group decided to retain.
Costs recorded by the Corporate segment for 2013totalled close to €133 million, up 6.4% year on year.
This increase reflects the cross-business assignments andprojects taken on by the Corporate segment on behalf ofthe Group’s brands, as well as the launch of new shared-services centres, notably in the Asia-Pacific region.
74 Kering ~ 2013 Financial Document
3 FINANCIAL INFORMATION ~ 2013 ACTIVITY REPORT
03_A_VA_V4 20/02/14 16:56 Page74

As of December 31, 2013, Kering’s net current asset figurewas almost €80 million higher than at the previous year-end. After stripping out the impact of fluctuations in exchange rates and changes in Group structure, changesin working capital requirement led to a cash outflow of€75 million.
Changes in inventories resulted in a cash outflow of€93 million during 2013. This mainly reflects the expansionof the Luxury Division’s store network (Gucci and Yves SaintLaurent), partially offset by the effect of inventoryoptimisation measures put in place during the year,particularly at Bottega Veneta.
Adjusted for the effect of fluctuations in exchange ratesand changes in Group structure, the year-on-year increasein trade receivables led to a €7 million cash requirementin 2013. The increase in trade payables resulted in anoverall cash inflow of €69 million, primarily attributableto the business growth reported by the Luxury Division.
The decrease in the net liability recorded under “Othercurrent assets and liabilities” gave rise to a €44 million cashoutflow in 2013, notably at PUMA due to the expenditureincurred in connection with the brand’s TransformationProgramme.
Current assets, net
As of December 31, 2013, net current assets totalled €836 million, versus €757 million as of December 31, 2012. Thisitem breaks down as follows:
(in € millions) 2013 2012 Change
Inventories 1,805.5 1,736.5 +69.0Trade receivables 949.9 985.3 -35.4Trade payables (766.1) (684.5) -81.6Current tax receivables/payables (191.0) (242.7) +51.7Other current assets and liabilities (962.1) (1,037.9) +75.8
Current assets, net 836.2 756.7 +79.5
Deferred taxes primarily correspond to deferred taxliabilities relating to brands recognised on businesscombinations (notably Gucci and PUMA).
As of December 31, 2013, investments in associatescomprised Wilderness shares. The year-on-year increasein non-current financial assets in 2013 was chiefly due tothe acquisition of shares in non-consolidated companies.
The Group’s operating infrastructure breaks down as follows:
Owned Finance Operating 2013 2012 outright leases leases
Sales outlets Luxury Division 21 4 994 1,019 958 Sport & Lifestyle Division 4 604 608 637
Logistics units Luxury Division 19 1 68 88 64 Sport & Lifestyle Division 5 39 44 43
Production units Luxury Division 3 1 18 22 55& other Sport & Lifestyle Division 3 4 7 7
“Property, plant and equipment, net” rose slightly in 2013,due to the impact of increases in the scope of consolidation,
recurring transactions (acquisitions/disposals anddepreciation) and exchange rate fluctuations.
Other non-current assets, net
(in € millions) 2013 2012 Change
Property, plant and equipment, net 1,676.9 1,376.3 +300.6Net deferred tax liabilities (2,160.3) (2,172.1) +11.8Investments in associates 17.3 25.8 -8.5Non-current financial assets 316.1 273.7 +42.4Other non-current assets 30.1 28.9 +1.2
Other non-current assets (liabilities), net (119.9) (467.4) +347.5
75
3
2013 Financial Document ~ Kering
2013 ACTIVITY REPORT ~ FINANCIAL INFORMATION
03_A_VA_V4 20/02/14 16:56 Page75

As of December 31, 2013, Kering’s total equity was lowerthan at the previous year-end, with equity attributable toowners of the parent down €827 million, mainly due tothe impact of:
• €50 million in net income attributable to owners of theparent;
• €471 million in dividends and interim dividends paidby Kering;
• a €314 million stock dividend paid by Kering in theform of Groupe Fnac shares;
• a €28 million negative effect from changes in treasuryshares;
• a €91 million negative effect from currency translationadjustments.
During the year, Kering carried out the following treasuryshare transactions:
• purchases and sales of shares under the liquidityagreement (1,585,556 shares purchased and 1,585,556shares sold);
• the purchase of 106,000 shares and the allotment of102,491 shares to employees in connection with the2009 and 2011 free share plans and 450 shares underthe 2008 and 2009 free share plans;
• the purchase of 130,000 shares and the sale of 103,037shares to employee beneficiaries under stock optionplans, notably the 2006 and 2007 plans;
• the purchase of 720,000 shares and the remittance of714,514 shares in connection with an external growthtransaction and the allocation of the balance of sharesacquired (5,486 shares) to be allotted to employeesunder stock option plans.
As of December 31, 2013, Kering’s share capital was madeup of 126,226,761 shares with a par value of €4 each. Atthat date Kering held no treasury shares in connectionwith the liquidity agreement. Excluding the liquidityagreement, Kering held 60,581 shares in treasury as ofDecember 31, 2013, compared with 25,073 as ofDecember 31, 2012.
As of December 31, 2013, equity attributable to non-controlling interests mainly related to PUMA, for a total of€533 million (versus €665 million the previous year),and the Luxury Division’s brands, for €101 million(€40 million as of December 31, 2012).
The year-on-year change in the amount of equityattributable to non-controlling interests primarilyincludes the impact of (i) acquisitions of additional PUMAshares which raised Kering’s interest in PUMA to almost86% as of December 31, 2013 from 83% one year earlier;and (ii) the first-time consolidation of the Pomellatogroup and Christopher Kane in 2013.
(in € millions) 2013 2012 Change
Provisions for pensions and other post-employment benefits 100.0 104.8 -4.8Other provisions for contingencies and losses 265.9 260.0 +5.9
Provisions 365.9 364.8 +1.1
Net assets held for sale
This item results from applying IFRS 5 to operations that were discontinued or sold during the period, or were in theprocess of being sold. As of December 31, 2013 these operations corresponded to the residual assets of Redcats.
Equity
(in € millions) 2013 2012 Change
Equity attributable to owners of the parent 10,586.6 11,413.8 -827.2Equity attributable to non-controlling interests 609.3 704.9 -95.6
Total equity 11,195.9 12,118.7 -922.8
Provisions
As of December 31, 2013, the portion of provisions forpensions and other post-employment benefits that will notgive rise to cash outflows in the coming 12 months (recordedunder non-current liabilities) amounted to €93 million,slightly lower than the December 31, 2012 figure as a resultof changes in the actuarial assumptions used.
Other provisions for contingencies and losses edged up in2013, mainly due to the combined impacts of (i) thepartial utilisation of the provisions set aside for the PUMATransformation Programme and (ii) the reclassification of provisions for tax disputes in various countries and the recognition of provisions for new disputes withexternal parties.
76 Kering ~ 2013 Financial Document
3 FINANCIAL INFORMATION ~ 2013 ACTIVITY REPORT
03_A_VA_V4 20/02/14 16:57 Page76

In the first half of 2013, Kering redeemed both the€600 million worth of bonds issued in 2005, includingthe additional bonds issued in 2006, and the second€200 million tranche of the bonds indexed to the Keringshare price that were issued in May 2008. To extend thematurity of its debt, Kering carried out a first bond issueon July 13, 2013, involving €500 million of seven-yearbonds with a fixed-rate coupon of 2.5%, and a second –which also represented €500 million – on October 8, 2013,involving five-year bonds with a 1.875% fixed-rate coupon.
As of December 31, 2013, the Group’s gross borrowingsincluded €324 million concerning put options granted tominority shareholders (€215 million as of December 31,2012). The year-on-year increase notably stemmed fromthe recognition of the liability related to the non-controllinginterests in the Pomellato group.
In accordance with the Group’s interest rate managementpolicy, fixed-rate borrowings accounted for 59.3% of theGroup’s total gross borrowings as of December 31, 2013(including hedges), compared with 60.4% one year earlier.
As of December 31, 2013, the Group’s gross borrowingsmainly comprised euro-denominated borrowings. Theproportion denominated in Japanese yen represented 6.8%of total gross borrowings (8.9% as of December 31, 2012)and the proportion denominated in other currenciesstood at 7.2% (7.5% as of December 31, 2012).
Kering minimises its exposure to concentration risk bydiversifying its sources of financing. Therefore, non-bankingdebt accounted for 74.9% of gross borrowings as ofDecember 31, 2013, versus 76.3% as of December 31, 2012.Kering’s credit facilities are taken out with a diversifiedpool of top-tier French and non-French banks. As ofDecember 31, 2013, 78.8% of the confirmed credit facilitiesgranted to Kering were provided by a total of ten banks.The Group’s three leading banking partners represented40% of the total and no single bank accounted for morethan 20% of the aggregate amount of confirmed creditfacilities available to the Group.
Kering only carries out borrowing and investmenttransactions with investment grade financial institutionsand it spreads these transactions amongst the variousinstitutions concerned.
Net debt
The Group’s net debt totalled €3,443 million as of December 31, 2013, representing an increase of €951 million or38.2% compared with the previous year-end. As of December 31, 2013, Kering’s net debt broke down as follows:
(in € millions) 2013 2012 Change
Bonds 3,290.5 3,048.3 +242.2Bank borrowings 454.2 566.4 -112.2Commercial paper 358.0 449.0 -91.0Other borrowings 767.1 520.3 +246.8
Gross borrowings(1) 4,869.8 4,584.0 285.8
Fair value hedges (interest rate) (7.7) (11.3) +3.6Cash and cash equivalents (1,419.2) (2,081.0) +661.8
Net debt 3,442.9 2,491.7 +951.2
(1) Excluding the financing of customer loans.
77
3
2013 Financial Document ~ Kering
2013 ACTIVITY REPORT ~ FINANCIAL INFORMATION
03_A_VA_V4 20/02/14 16:57 Page77
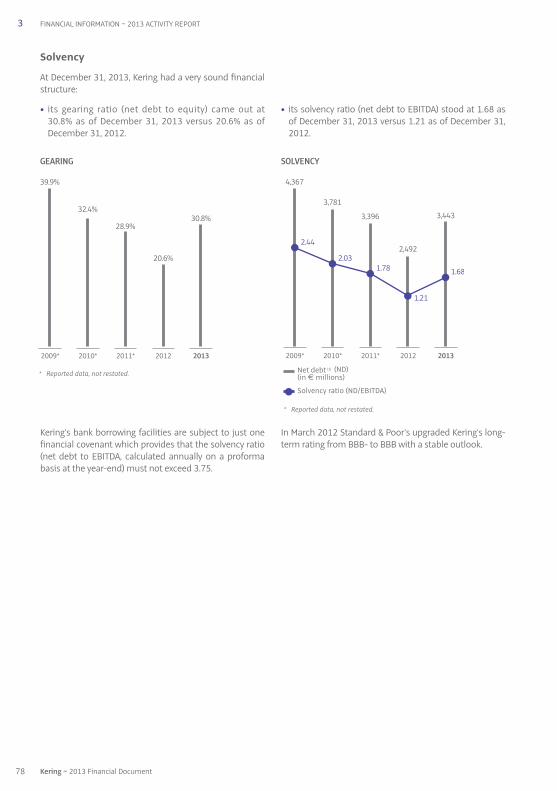
Kering’s bank borrowing facilities are subject to just onefinancial covenant which provides that the solvency ratio(net debt to EBITDA, calculated annually on a proformabasis at the year-end) must not exceed 3.75.
In March 2012 Standard & Poor’s upgraded Kering’s long-term rating from BBB- to BBB with a stable outlook.
GEARING SOLVENCY
• its gearing ratio (net debt to equity) came out at 30.8% as of December 31, 2013 versus 20.6% as ofDecember 31, 2012.
• its solvency ratio (net debt to EBITDA) stood at 1.68 asof December 31, 2013 versus 1.21 as of December 31,2012.
Solvency
At December 31, 2013, Kering had a very sound financialstructure:
78 Kering ~ 2013 Financial Document
3 FINANCIAL INFORMATION ~ 2013 ACTIVITY REPORT
2009* 2010*
32.4%
39.9%
2011*
28.9%
2012
20.6%
2013
30.8%
* Reported data, not restated.
2009* 2010*
3,781
4,367
2011*
3,396
2012
2,492
2013
3,443
* Reported data, not restated.
Net debt (1) (ND)(in € millions)
Solvency ratio (ND/EBITDA)
2.44
2.031.78
1.21
1.68
03_A_VA_V4 20/02/14 16:57 Page78

MATURITY SCHEDULE OF NET DEBT
In view of the above, the Group is not exposed to liquidity risk.
Short-term borrowings and borrowings maturing in fiveyears or beyond accounted for 36.3% and 38.5%respectively of total gross borrowings as of December 31,2013, compared with 38.4% and 23.4% respectively as ofDecember 31, 2012.
Cash and cash equivalents exclusively comprise cashinstruments and monetary UCITS that are not subject toany risk of changes in value. As of December 31, 2013, theGroup had access to €4,148 million in confirmed creditfacilities, versus €4,059 million as of December 31, 2012.
The Group’s loan agreements feature standard pari passu,cross default and negative pledge clauses.
The bonds issued between 2009 and 2013 within thescope of the EMTN programme are all subject to change-of-control clauses entitling bondholders to request earlyredemption at par if Kering’s rating is downgraded tonon-investment grade following a change of control.
In addition, the bonds issued in 2009 and 2010 –including the bonds added in January 2012 to thoseissued in April 2010 – include a “step-up coupon” clausethat applies in the event that Kering’s rating isdowngraded to non-investment grade.
All borrowings benefit from the rating awarded to theKering group by Standard & Poor’s (BBB with a stableoutlook) and are not subject to any financial covenants.
The Group’s debt contracts do not include any ratingtrigger clauses.
As of December 31, 2013, Kering had cash and cashequivalents totalling €1,419 million (€2,081 million as ofDecember 31, 2012), as well as confirmed undrawn
medium-term credit facilities amounting to €4,126 million(€4,024 million as of December 31, 2012).
Liquidity
79
3
2013 Financial Document ~ Kering
2013 ACTIVITY REPORT ~ FINANCIAL INFORMATION
Undrawn confirmedcredit lines
(in € millions)
Maturity schedule of net debt (1)
(€3,443 million)
2014*
310
4,126
2015**
815
2016**
61
2017**
360
2018**
505
Beyond**
1,392
* Gross borrowings after deduction of cash equivalents and financing of customer loans.** Gross borrowings.
03_A_VA_V4 20/02/14 16:57 Page79

Gross operating investments amounted to €678 million, up 53% year on year and breaking down as follows:
(in € millions) 2013 2012 Change
Luxury Division 435.6 337.3 +29.1%Sport & Lifestyle Division 74.8 91.1 -17.9%Corporate 167.3 13.5 +1,139.3%
Gross operating investments 677.7 441.9 +53.4%
Cash flow from operating activities before tax, dividendsand interest edged down slightly by €18 million (or 0.9%)compared with 2012, due to an erosion in PUMA’s recurringoperating income that was partially offset by the increasein profitability within the Luxury Division.
Changes in working capital requirement gave rise to a netcash outflow of €75 million in 2013 compared with a netcash outflow of €273 million in 2012.
This €198 million year-on-year decrease reflects thefollowing factors:
• a favourable impact of around €10 million resultingfrom an improved inventories management within theLuxury Division;
• a positive €24 million impact from a decrease in tradereceivables compared with the previous year, notablyfor PUMA;
• a positive impact of around €156 million due to the returnto a normal level of trade payables, which had decreasedsharply in 2012 mainly due to the significant scalingback of purchasing programmes at PUMA.
Corporate income tax paid was up slightly on 2012.
Net cash outflows relating to net operating investmentsrose by €232 million in 2013 compared with 2012. The 2013figure includes €10 million in proceeds from disposals ofproperty, plant and equipment and intangible assets(versus €6 million in 2012).
Changes in net debt
Changes in net debt during 2013 and 2012 can be analysed as follows:
(in € millions) 2013 2012
Net debt as of January 1 2,491.7 3,395.5
Free cash flow from operations (857.5) (930.2)Net interest paid and dividends received 117.1 162.3Dividends paid 497.2 473.3Acquisition of Kering shares 39.0 14.9Acquisition of PUMA shares 99.6 119.6Other acquisitions and disposals 1,154.7 (652.6)Other movements (98.9) (91.1)
Net debt as of December 31 3,442.9 2,491.7
Free cash flow from operations
The generation of free cash flow from operations is a key financial objective for all of the Group’s brands. In 2013, theGroup’s free cash flow from operations came to just under €858 million.
(in € millions) 2013 2012 Change
Cash flow from operating activities before tax, dividends and interest 1,983.1 2,000.7 -0.9%
Change in working capital requirement (excluding tax) (74.5) (272.5) -72.7%Corporate income tax paid (383.7) (362.2) +5.9%
Net cash from operating activities 1,524.9 1,366.0 +11.6%
Net operating investments (667.4) (435.8) +53.1%
Free cash flow from operations 857.5 930.2 -7.8%
80 Kering ~ 2013 Financial Document
3 FINANCIAL INFORMATION ~ 2013 ACTIVITY REPORT
03_A_VA_V4 20/02/14 16:57 Page80

The parent company ended 2013 with net income of€833 million, compared with €506 million in 2012. The2013 total includes €2,188 million in dividends receivedfrom subsidiaries (€876 million in 2012).
At its February 20, 2014 meeting, the Board decided thatat the Annual General Meeting to be held to approve thefinancial statements for the year ended December 31,2013 it will propose shareholders to approve a cashpayment for the 2013 dividend, corresponding to €3.75per share.
An interim dividend of €1.50 per share was paid onJanuary 24, 2014 pursuant to a decision by the Board ofDirectors on December 20, 2013.
If the final dividend is approved, the total dividend cashpayout in 2014 will amount to €473 million.
This recommended dividend reflects Kering’s goal ofmaintaining well-balanced payout ratios bearing in mind,on the one hand, changes in net income from continuingoperations (excluding non-recurring items) attributable toowners of the parent and, on the other hand, the amountof available cash flow. Kering’s payout ratios for 2013 areas follows:
• 38.5% of net income from continuing operations (excludingnon-recurring items) attributable to owners of theparent, versus 37.3% on a reported basis in 2012;
• 64% of available cash flow, compared with 61.6% on areported basis in 2012.
1.6. Net income and dividend of the parent company
In 2013, 46% of the Group’s gross operating investmentsconcerned store opening programmes, and around 19%related to store conversions and/or renovations (versus36% and 18% respectively in 2012).
The Luxury Division accounted for €98 million of theoverall increase in gross operating investments, reflectingstore openings and investments in the supply chain. Grossoperating investments for the Corporate segment includedKering’s acquisition of a building in the prestigiousOmotesandō district of Tokyo, which will be used toshowcase some of the Luxury Division brands.
Available cash flow
In 2013, net cash outflows relating to net finance costsincluded €70 million in interest and dividends received(versus €69 million in 2012). Out of this total, €62 millioncorresponded to the proceeds received following theredemption at 69.1% of par of the second tranche of thebonds indexed to Kering shares, which matured in May 2013.
Available cash flow for the year amounted to €740 millioncompared with €768 million in 2012.
Dividends paid
Dividends paid in 2013 were 5% higher than in 2012. The 2013 figure included €26 million paid to minorityshareholders of consolidated subsidiaries (€33 million in2012), of which almost €15 million related to PUMA andits subsidiaries (€23 million in 2012). The cash dividendpaid by Kering to its own shareholders in 2013 amountedto €471 million (including the interim dividend paid onJanuary 24, 2013), representing a slight increase comparedto 2012.
Acquisitions and disposals
In 2013, Kering purchased almost €100 million worth ofPUMA shares, increasing its interest in the company to85.81% at year-end 2013, from 82.99% at year-end 2012.
“ Acquisitions of Kering shares ” for an overall amount ofalmost €39 million relate to the purchase of 236,000shares in connection with the Group’s stock option andfree share plans.
The impact of other acquisitions and disposals of securitiesduring 2013 mainly concerned (i) the acquisitions carriedout during the period (including the Pomellato group,Richard Ginori, Christopher Kane and France Croco), (ii)€656 million in financial cash flows related to discontinuedoperations (primarily the recapitalisation of Groupe Fnacand collection of the sale price for assets disposed of inthe period, net of the financing provided for Redcats’operations).
In 2012, acquisitions and disposals of securities chieflyconcerned the acquisition of Brioni and the sale of Cfao,as well as cash flows related to operations that werediscontinued, sold or in the process of being sold duringthe year, notably corresponding to the proceeds from thesale of The Sportsman’s Guide and The Golf Warehouse.
Other movements
This item mainly includes the impact of (i) fluctuations inexchange rates, and (ii) fair value remeasurements offinancial instruments in accordance with IAS 32 and 39.
81
3
2013 Financial Document ~ Kering
2013 ACTIVITY REPORT ~ FINANCIAL INFORMATION
03_A_VA_V4 20/02/14 16:57 Page81

82 Kering ~ 2013 Financial Document
3 FINANCIAL INFORMATION ~ 2013 ACTIVITY REPORT
DIVIDEND PER SHARE (IN €)
PAYOUT RATIOS
2009 2010
3.503.30
2011
3.50
2012
3.75
2013*
3.75
* Subject to approval at the Annual General Meeting.
2009** 2010** 2011** 2012 2013*
* Subject to approval at the Annual General Meeting.** Reported data, not retstated.
% of attributable recurring net income, from continuing operations
% of free cash flow
58.6%
48.3%47.6%
52.9%
41.8%
59.8%
37.3% 38.5%
61.6%64.0%
Having completed its transformation, Kering has extremelysolid fundamentals which enable the Group to approach2014 with confidence.
Drawing on its positioning in structurally high-growthmarkets and its portfolio of powerful brands with strongpotential, Kering will continue to implement its strategyof rigorously managing and allocating its resources.
2014 will be marked by an ambitious relaunch plan forPUMA and by dedicated action plans for each of theLuxury Division’s brands, focusing on achieving profitableorganic growth.
In this context, Kering is forecasting growth for both itsrevenue and recurring operating income in 2014.
1.9. Outlook
The exclusive negotiations concerning the sale of LaRedoute and Relais Colis are still under way betweenKering and the executives concerned, who presented
their business plan to the relevant employee representativebodies in January 2014 as part of the standard informationand consultation procedure required under French law.
1.7. Transactions with related parties
Transactions with related parties are described in Note 34 to the consolidated financial statements.
1.8. Subsequent events
03_A_VA_V4 20/02/14 16:57 Page82

2. Consolidated financial statements as of December 31, 2013
2.1. Consolidated income statement For the years ended December 31, 2013 and 2012
(in € millions) Notes 2013 2012
CONTINUING OPERATIONS
Revenue 5 9,748.4 9,736.3Cost of sales (3,657.9) (3,776.2)
Gross margin 6,090.5 5,960.1
Payroll expenses 6-7 (1,534.7) (1,493.6)Other recurring operating income and expenses (2,805.7) (2,675.0)
Recurring operating income 8 1,750.1 1,791.5
Other non-recurring operating income and expenses 9 (442.5) (25.2)
Operating income 1,307.6 1,766.3
Finance costs, net 10 (212.3) (147.7)
Income before tax 1,095.3 1,618.6
Corporate income tax 11 (235.4) (297.6)Share in earnings of associates 1.6 36.9
Net income from continuing operations 861.5 1,357.9
o/w attributable to owners of the parent 869.4 1,323.7o/w attributable to non-controlling interests (7.9) 34.2
DISCONTINUED OPERATIONS
Net income (loss) from discontinued operations 12 (821.5) (275.5)
o/w attributable to owners of the parent (819.8) (275.5)o/w attributable to non-controlling interests (1.7)
Net income of consolidated companies 40.0 1,082.4
Net income attributable to owners of the parent 49.6 1,048.2Net income attributable to non-controlling interests (9.6) 34.2
Net income attributable to owners of the parent 49.6 1,048.2Earnings per share (in €) 13.1 0.39 8.32Fully diluted earnings per share (in €) 13.1 0.39 8.31
Net income from continuing operations attributable to owners of the parent 869.4 1,323.7
Earnings per share (in €) 13.1 6.91 10.51Fully diluted earnings per share (in €) 13.1 6.90 10.50
Net income from continuing operations (excluding non-recurring items) attributable to owners of the parent 1,229.3 1,268.8
Earnings per share (in €) 13.2 9.76 10.07Fully diluted earnings per share (in €) 13.2 9.75 10.06
83
3
2013 Financial Document ~ Kering
CONSOLIDATED FINANCIAL STATEMENTS AS OF DECEMBER 31, 2013 ~ FINANCIAL INFORMATION
03_B_VA_V4 20/02/14 16:53 Page83
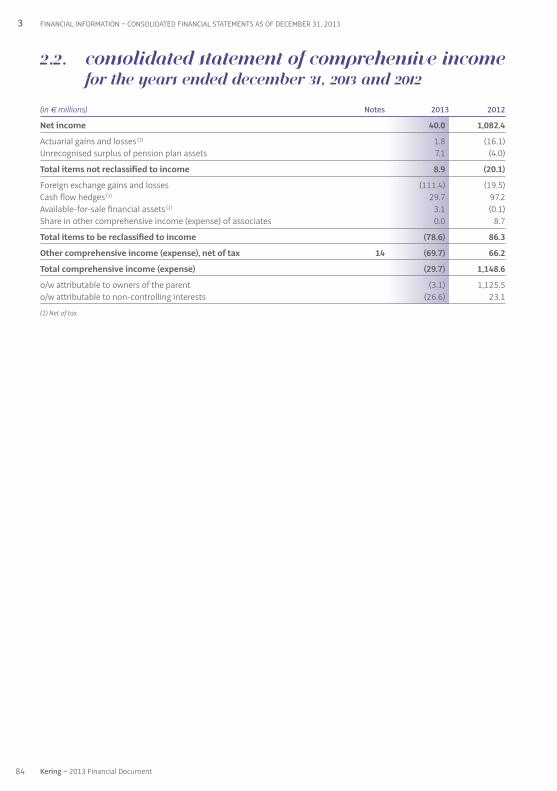
2.2. Consolidated statement of comprehensive incomefor the years ended December 31, 2013 and 2012
(in € millions) Notes 2013 2012
Net income 40.0 1,082.4
Actuarial gains and losses (1) 1.8 (16.1)Unrecognised surplus of pension plan assets 7.1 (4.0)
Total items not reclassified to income 8.9 (20.1)
Foreign exchange gains and losses (111.4) (19.5)Cash flow hedges (1) 29.7 97.2Available-for-sale financial assets (1) 3.1 (0.1)Share in other comprehensive income (expense) of associates 0.0 8.7
Total items to be reclassified to income (78.6) 86.3
Other comprehensive income (expense), net of tax 14 (69.7) 66.2
Total comprehensive income (expense) (29.7) 1,148.6
o/w attributable to owners of the parent (3.1) 1,125.5o/w attributable to non-controlling interests (26.6) 23.1
(1) Net of tax.
84 Kering ~ 2013 Financial Document
3 FINANCIAL INFORMATION ~ CONSOLIDATED FINANCIAL STATEMENTS AS OF DECEMBER 31, 2013
03_B_VA_V4 20/02/14 16:53 Page84

2.3. Consolidated statement of financial position as of December 31, 2013 and 2012
Assets(in € millions) Notes Dec. 31, 2013 Dec. 31, 2012
Goodwill 15 3,770.1 3,871.0Brands and other intangible assets 16 10,702.8 10,489.9Property, plant and equipment 17 1,676.9 1,376.3Investments in associates 19 17.3 25.8Non-current financial assets 20 316.8 273.7Deferred tax assets 11.2 649.9 600.2Other non-current assets 30.1 28.9
Non-current assets 17,163.9 16,665.8
Inventories 21 1,805.5 1,736.5Trade receivables 22 949.9 985.3Current tax receivables 11.2 119.1 75.7Other current financial assets 23 107.7 87.0Other current assets 23 523.4 494.7Cash and cash equivalents 27 1,419.2 2,081.0
Current assets 4,924.8 5,460.2
Assets classified as held for sale or for distribution to owners 12 722.1 3,130.5
TOTAL ASSETS 22,810.8 25,256.5
Equity and liabilities(in € millions) Notes Dec. 31, 2013 Dec. 31, 2012
Share capital 24 504.9 504.5Capital reserves 2,424.3 2,416.1Treasury shares (10.4) (3.3)Translation adjustments (115.3) (24.2)Remeasurement of financial instruments 69.8 41.4Other reserves 7,713.3 8,479.3
Equity attributable to owners of the parent 24 10,586.6 11,413.8
Non-controlling interests 609.3 704.9
Total equity 24 11,195.9 12,118.7
Non-current borrowings 28 3,132.4 2,988.9Other non-current financial assets 29 0.7 Provisions for pensions and other post-employment benefits 25 92.8 98.2Other provisions 26 113.2 92.3Deferred tax liabilities 11.2 2,810.2 2,772.3
Non-current liabilities 6,149.3 5,951.7
Current borrowings 28 1,737.4 1,595.1Other current financial liabilities 23-29 213.2 207.9Trade payables 23 766.1 684.5Provisions for pensions and other post-employment benefits 25 7.2 6.6Other provisions 26 152.7 167.7Current tax liabilities 11.2 310.1 318.4Other current liabilities 23 1,372.3 1,400.4
Current liabilities 4,559.0 4,380.6
Liabilities associated with assets classified as held for sale or for distribution to owners 12 906.6 2,805.5
TOTAL EQUITY AND LIABILITIES 22,810.8 25,256.5
85
3
2013 Financial Document ~ Kering
CONSOLIDATED FINANCIAL STATEMENTS AS OF DECEMBER 31, 2013 ~ FINANCIAL INFORMATION
03_B_VA_V4 20/02/14 16:53 Page85

2.4. Consolidated statement of cash flows for the years ended December 31, 2013 and 2012
(in € millions) Notes 2013 2012
Net income from continuing operations 861.5 1,357.9Net recurring charges to depreciation, amortisation and provisions on non-current operating assets 295.8 275.1Other non-cash income and expenses 389.9 (156.4)
Cash flow from operating activities 32.1 1,547.2 1,476.6
Interest paid/received 120.5 163.2Dividends received (0.3) (0.1)Net income tax payable 11.1 315.7 361.0
Cash flow from operating activities before tax, dividends and interest 1,983.1 2,000.7
Change in working capital requirement 23 (74.5) (272.5)Corporate income tax paid 11.2.1 (383.7) (362.2)
Net cash from operating activities 1,524.9 1,366.0
Purchases of property, plant and equipment and intangible assets 32.2 (677.7) (441.9)Proceeds from disposals of property, plant and equipment and intangible assets 10.3 6.1Purchases of subsidiaries, net of cash acquired 32.3 (345.0) (219.3)Proceeds from disposals of subsidiaries and associates, net of cash transferred 32.3 24.7 916.5Purchases of other financial assets (57.9) (92.5)Proceeds from sales of other financial assets 5.1 21.2Interest and dividends received 70.0 68.9
Net cash from (used in) investing activities (970.5) 259.0
Increase/decrease in share capital and other transactions with owners 32.4 (85.4) (204.9)Treasury share transactions 32.5 (39.0) (14.9)Dividends paid to owners of the parent company (471.2) (440.7)Dividends paid to non-controlling interests (26.0) (32.6)Bond issues 28-32.6 938.9 676.5Bond redemptions 28-32.6 (740.0) (138.7)Increase/decrease in other borrowings 28-32.6 (309.9) (565.9)Interest paid and equivalent (187.1) (231.1)
Net cash used in financing activities (919.7) (952.3)
Net cash from (used in) discontinued operations 12 (437.5) 97.1Impact of exchange rate variations 65.3 3.0
Net increase (decrease) in cash and cash equivalents (737.5) 772.8
Cash and cash equivalents at beginning of year 32 1,975.1 1,202.3Cash and cash equivalents at end of year 32 1,237.6 1,975.1
86 Kering ~ 2013 Financial Document
3 FINANCIAL INFORMATION ~ CONSOLIDATED FINANCIAL STATEMENTS AS OF DECEMBER 31, 2013
03_B_VA_V4 20/02/14 16:53 Page86
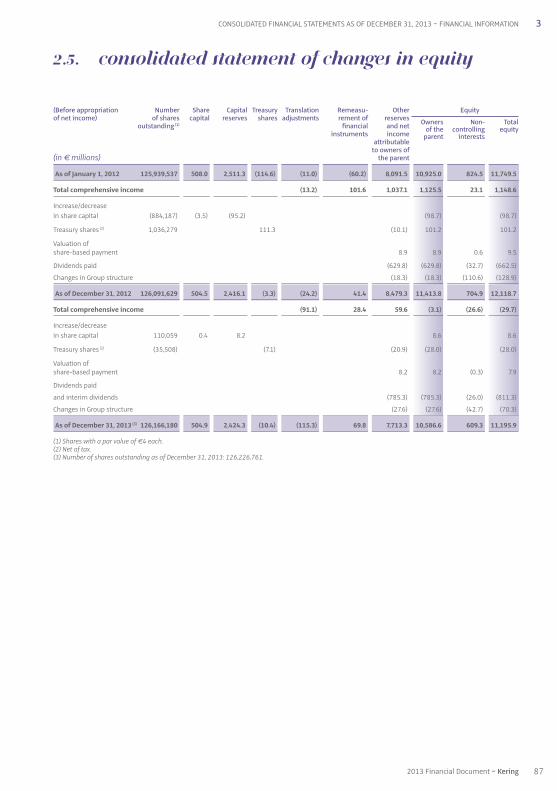
2.5. Consolidated statement of changes in equity
(Before appropriation Number Share Capital Treasury Translation Remeasu- Other Equityof net income) of shares capital reserves shares adjustments rement of reserves Owners Non- Totaloutstanding (1) financial and net of the controlling equity
instruments income parent interests attributable to owners of
(in € millions) the parent
As of January 1, 2012 125,939,537 508.0 2,511.3 (114.6) (11.0) (60.2) 8,091.5 10,925.0 824.5 11,749.5
Total comprehensive income (13.2) 101.6 1,037.1 1,125.5 23.1 1,148.6
Increase/decreasein share capital (884,187) (3.5) (95.2) (98.7) (98.7)
Treasury shares (2) 1,036,279 111.3 (10.1) 101.2 101.2
Valuation of share-based payment 8.9 8.9 0.6 9.5
Dividends paid (629.8) (629.8) (32.7) (662.5)
Changes in Group structure (18.3) (18.3) (110.6) (128.9)
As of December 31, 2012 126,091,629 504.5 2,416.1 (3.3) (24.2) 41.4 8,479.3 11,413.8 704.9 12,118.7
Total comprehensive income (91.1) 28.4 59.6 (3.1) (26.6) (29.7)
Increase/decreasein share capital 110,059 0.4 8.2 8.6 8.6
Treasury shares (2) (35,508) (7.1) (20.9) (28.0) (28.0)
Valuation of share-based payment 8.2 8.2 (0.3) 7.9
Dividends paid
and interim dividends (785.3) (785.3) (26.0) (811.3)
Changes in Group structure (27.6) (27.6) (42.7) (70.3)
As of December 31, 2013 (3) 126,166,180 504.9 2,424.3 (10.4) (115.3) 69.8 7,713.3 10,586.6 609.3 11,195.9
(1) Shares with a par value of €4 each.(2) Net of tax.(3) Number of shares outstanding as of December 31, 2013: 126,226,761.
87
3
2013 Financial Document ~ Kering
CONSOLIDATED FINANCIAL STATEMENTS AS OF DECEMBER 31, 2013 ~ FINANCIAL INFORMATION
03_B_VA_V4 20/02/14 16:53 Page87

Notes to the consolidated financial statements for the year ended December 31, 2013
Note 1 Introduction 89
Note 2 Accounting policies and methods 89
Note 3 Highlights 100
Note 4 Operating segments 102
Note 5 Revenue 105
Note 6 Payroll expenses 106
Note 7 Share-based payment 107
Note 8 Recurring operating income 111
Note 9 Other non-recurring operating income and expenses 111
Note 10 Finance costs (net) 112
Note 11 Income taxes 112
Note 12 Non-current assets held for sale or for distribution and discontinued operations 115
Note 13 Earnings per share 117
Note 14 Other comprehensive income 118
Note 15 Goodwill 119
Note 16 Brands and other intangible assets 120
Note 17 Property, plant and equipment 122
Note 18 Impairment tests on non-financial assets 124
Note 19 Investments in associates 125
Note 20 Non-current financial assets 125
Note 21 Inventories 126
Note 22 Trade receivables 126
Note 23 Other current assets and liabilities 127
Note 24 Equity 127
Note 25 Employee benefits 128
Note 26 Provisions 132
Note 27 Cash and cash equivalents 133
Note 28 Borrowings 134
Note 29 Exposure to interest rate, foreign exchange and equity risk 140
Note 30 Accounting classification and market value of financial instruments 150
Note 31 Net debt 153
Note 32 Statement of cash flows 153
Note 33 Contingent liabilities, contractual commitments not recognised and other contingencies 155
Note 34 Transactions with related parties 158
Note 35 Subsequent events 159
Note 36 List of consolidated subsidiaries as of December 31, 2013 160
88 Kering ~ 2013 Financial Document
3 FINANCIAL INFORMATION ~ CONSOLIDATED FINANCIAL STATEMENTS AS OF DECEMBER 31, 2013
03_B_VA_V4 20/02/14 16:53 Page88

2.1. General principles and statement of compliance
Pursuant to European Regulation No. 1606/2002 ofJuly 19, 2002, the consolidated financial statements ofthe Kering group for the year ended December 31, 2013were prepared in accordance with applicable internationalaccounting standards published and adopted by theEuropean Union and mandatorily applicable as of that date.
These international standards comprise International FinancialReporting Standards (IFRS), International Accounting Standards(IAS) and the interpretations of the International FinancialReporting Interpretations Committee (IFRIC).
The financial statements presented do not reflect the draftstandards and interpretations that were at the exposuredraft stage with the International Accounting StandardsBoard (IASB) and the IFRIC on the date these financialstatements were prepared.
All accounting standards and guidance adopted by the European Union may be consulted on the EuropeanCommission’s website: http://ec.europa.eu/internal_market/accounting/ias_en.htm.
2.2. IFRS basis adopted
2.2.1. Standards, amendments and interpretationseffective as of January 1, 2013
The Group’s consolidated financial statements comply withthe following amendments to published standards andinterpretations which came into effect on January 1, 2013and have been adopted by the European Union:
• the amendments contained in the Annual Improvementsto IFRSs published in May 2012;
• IFRS 13 – Fair Value Measurement;
• the amended version of IAS 19 – Employee Benefits;
• amendment to IFRS 7 – Financial Instruments: Disclosures –Offsetting Financial Assets and Financial Liabilities;
• amendment to IAS 1 – Presentation of Items of OtherComprehensive Income which the Group elected to earlyadopt as of January 1, 2012.
IFRS 13 provides a single IFRS framework for the measurementof fair value and the related disclosures. It also defines fairvalue and sets out the disclosures required in terms ofmeasurement methods, including the fair value hierarchycurrently included in IFRS 7.
The prospective application of this standard did not have animpact on the Group’s consolidated financial statements.
The impacts for the Group of the application of IAS 19 arelimited: since the Group already recognises all actuarial gainsand losses in other comprehensive income, the discontinuationof the “corridor method” provided for by the revised standarddoes not have any impact on the consolidated financialstatements. The other impacts of the amended version ofIAS 19 on plan assets and the treatment of past servicecosts, are not material for the Group.
The following standards and amendments are either notapplicable to the Group or did not have a material impacton the consolidated financial statements:
• amendment to IFRS 1 – First-time Adoption of InternationalFinancial Reporting Standards – Severe hyper-inflationand removal of fixed dates for first-time adopters;
• amendment to IAS 12 – Income Taxes – Deferred Tax –Recovery of Underlying Assets;
• IFRIC 20 – Stripping Costs in the Production Phase of aSurface Mine.
Note 2 – Accounting policies and methods
Kering, the Group’s parent company, is a société anonyme(French joint stock company) with a Board of Directors,incorporated under French law, whose registered office islocated at 10 avenue Hoche, 75008 Paris, France. It is registeredwith the Paris Trade and Companies Registry under reference552 075 020 RCS Paris, and is listed on the Paris Euronextstock exchange.
The consolidated financial statements for the year endedDecember 31, 2013 reflect the accounting position of Keringand its subsidiaries, together with its interests in associatesand joint ventures.
The Board of Directors approved the consolidated financialstatements for the year ended December 31, 2013 andauthorised their publication on February 20, 2014. Theseconsolidated financial statements will only be consideredas final after their adoption by the Annual General Meeting.
Note 1 – Introduction
89
3
2013 Financial Document ~ Kering
CONSOLIDATED FINANCIAL STATEMENTS AS OF DECEMBER 31, 2013 ~ FINANCIAL INFORMATION
03_B_VA_V4 20/02/14 16:53 Page89
2.2.2. Standards, amendments and interpretations not mandatorily applicable as of January 1, 2013
The Group has elected not to early adopt the standardsand amendments whose application is not mandatory forfinancial periods beginning on or after January 1, 2013.
The Group expects the impact of the application of IFRS 10,IFRS 11, IFRS 12 as well as the amendments to the revisedIAS 28, which are applicable to financial periods beginningon or after January 1, 2014 and were adopted by the EuropeanUnion at the end of December 2012, to be limited.
The Group is currently assessing the impacts of IFRIC 21 onthe levies imposed by governments. This interpretation,which specifies the date on which provisions must be setaside for taxes imposed by governments, has not beenadopted by the European Union.
2.2.3. Summary of options used on the first-time adoption of IFRS
On its transition to International Financial ReportingStandards in 2005, the Group applied the IFRS adopted bythe European Union and effective as of December 31, 2005with retroactive effect from January 1, 2004 in accordancewith IFRS 1, with the exception of the followingexemptions provided by the standards:
• business combinations: in accordance with IFRS 3,the Group elected to restate business combinationsretroactively to January 1, 1999;
• employee benefits: the Group adopted the IFRS 1option of recognising all actuarial gains and losses atthe transition date, offset against opening equity;
• cumulative translation differences: the Group decidedto use the optional exemption allowing the eliminationof cumulative translation differences at the transition datethrough an offsetting entry in consolidated reserves;
• assets and liabilities of subsidiaries, associates andjoint venture partners: IFRS 1 states that if the parentcompany of a group adopts IFRS for the first time in itsconsolidated financial statements after a subsidiary, theparent company must, in its opening IFRS consolidatedbalance sheet, value the assets and liabilities at the samecarrying amount as that appearing in the subsidiary’sfinancial statements, taking into account any consolidationadjustments. Since Gucci was already preparing itsfinancial statements in accordance with IFRS before thetransition date, the Group complied with this treatmentwhen preparing its opening balance sheet;
• share-based payment: in accordance with the optionallowed by IFRS 2 for equity-settled plans, the Groupdecided to apply this standard solely to plans issuedafter November 7, 2002 which had not vested as ofJanuary 1, 2005.
In addition, subsequent to the choice offered by theregulator as to the date of adoption of IAS 32 and IAS 39on financial instruments, the Group opted to apply thesestandards as from January 1, 2005. Accordingly:
• for the liability component of a hybrid instrument thatis no longer outstanding at the date of transition to IAS 32and IAS 39, the Group opted not to separate the equityportion relating to the cumulative interest accreted on theliability component from the initial equity component;
• financial assets and liabilities recorded prior to thetransition date were designated at fair value through theincome statement or as available for sale on the transitiondate (January 1, 2005).
2.3. Basis of preparation of the consolidated financial statements
2.3.1. Basis of measurement
The consolidated financial statements are prepared inaccordance with the historical cost convention, with theexception of:
• certain financial assets and liabilities measured at fair value;
• interests retained in a subsidiary or associate, which aremeasured at fair value at the date control or significantinfluence is lost;
• non-current assets held for sale, which are measured andrecognised at the lower of net carrying amount and fairvalue less costs to sell as soon as their sale is consideredhighly probable. These assets are no longer depreciatedfrom the time they qualify as assets (or disposal groups)held for sale.
2.3.2. Use of estimates and judgement
The preparation of consolidated financial statements requiresGroup management to make estimates and assumptionsthat can affect the carrying amounts of certain assets andliabilities, income and expenses, and the disclosures in theaccompanying notes. Group management reviews theseestimates and assumptions on a regular basis to ensure theirpertinence with respect to past experience and the currenteconomic situation. Items in future financial statementsmay differ from current estimates as a result of changes inthese assumptions. The impact of changes in accountingestimates is recognised during the period in which thechange occurs and all affected future periods.
The main estimates made by management in the preparationof the financial statements concern the valuations and usefullives of operating assets, property, plant and equipment,intangible assets and goodwill, the amount of contingencyprovisions and other provisions relating to operations, andassumptions underlying the calculation of obligations relatingto employee benefits, share-based payment, deferred tax
90 Kering ~ 2013 Financial Document
3 FINANCIAL INFORMATION ~ CONSOLIDATED FINANCIAL STATEMENTS AS OF DECEMBER 31, 2013
03_B_VA_V4 20/02/14 16:53 Page90

balances and derivatives. The Group notably uses discountrate assumptions based on market data to estimate thevalue of long-term assets and liabilities.
The main assumptions made by the Group are detailed inspecific sections of the notes to the consolidated financialstatements, and in particular:
• Note 7 – Share-based payment;
• Note 11 – Income taxes;
• Note 18 – Impairment tests on non-financial assets;
• Note 25 – Employee benefits;
• Note 26 – Provisions;
• Note 29 – Exposure to interest rate, foreign exchangeand equity risk;
• Note 30 – Accounting classification and market value offinancial instruments.
In addition to the use of estimates, Group managementuses judgement to determine the appropriate accountingtreatment for certain transactions, pending the clarificationof certain IFRS or where prevailing standards do not coverthe issue at hand. This is notably the case for put optionsgranted to non-controlling interests.
Put options granted to non-controlling interests
The Group has undertaken to repurchase the non-controllinginterests of shareholders of certain subsidiaries. The strikeprice of these put options may be set or determinedaccording to a predefined calculation formula, and theoptions may be exercised at any time or on a specific date.
The revised IAS 27 – applied by the Group in its consolidatedfinancial statements as of January 1, 2009 – prescribes theappropriate accounting treatment for acquisitions ofadditional shares in a subsidiary after control is obtained.As permitted by the French financial markets authority(Autorité des marchés financiers – AMF), the Group has decidedto apply two different accounting methods to these putoptions, depending on whether they were granted before orafter the date the revised standard first came into effect.
Put options granted before January 1, 2009: existing goodwill method retained
The Group records a financial liability in respect of the putoptions granted to holders of non-controlling interests inthe entities concerned. The corresponding non-controllinginterests are reclassified and included in this financialliability. The difference between the debt representingthe commitment to repurchase the non-controllinginterests and the carrying amount of reclassified non-controlling interests is recorded as goodwill.
This liability is initially recognised at its present value.Subsequent changes in the value of the commitment arerecorded by an adjustment to goodwill.
Put options granted after January 1, 2009
The revised IAS 27 states that all equity transactions withnon-controlling interests that do not result in a loss of controlare to be recognised within equity. The Group records afinancial liability at its present value in respect of the putoptions granted to holders of non-controlling interests inthe entities concerned. Subsequent changes in the valueof the commitment are recorded by an adjustment to equity.
The offsetting entry for this financial liability will differdepending on whether the non-controlling interests havemaintained access at present to the economic benefits ofthe entity.
In the first case (access at present to the economic benefits),non-controlling interests are maintained in the statementof financial position and the liability is recognised againstequity attributable to owners of the parent. In the secondcase, the corresponding non-controlling interests arederecognised. The difference between the debt representingthe commitment to repurchase the non-controlling interestsand the carrying amount of reclassified non-controllinginterests is recorded as a deduction from equity attributableto owners of the parent.
2.3.3. Statement of cash flows
The Group’s statement of cash flows is prepared in accordancewith IAS 7 – Statement of Cash Flows. The Group preparesits statement of cash flows using the indirect method.
2.4. Consolidation principles
The consolidated financial statements include the financialstatements of companies acquired as from the acquisitiondate and companies sold up until the date of disposal.
2.4.1. Subsidiaries
Subsidiaries are all entities (including special-purposeentities) over which the Group exercises control. Controlis defined as the ability to govern, directly or indirectly,the financial and operating policies of an entity so as toobtain economic benefit from its activities. This situationgenerally implies directly or indirectly holding more than50% of the voting rights. The existence and effect ofpotential voting rights that are exercisable or convertibleare taken into account in the assessment of control.
Subsidiaries are consolidated from the effective date of control.
Inter-company assets and liabilities and transactionsbetween fully consolidated companies are eliminated.Gains and losses on internal transactions with controlledcompanies are fully eliminated.
Accounting policies and methods are modified wherenecessary to ensure consistency of accounting treatmentat Group level.
91
3
2013 Financial Document ~ Kering
CONSOLIDATED FINANCIAL STATEMENTS AS OF DECEMBER 31, 2013 ~ FINANCIAL INFORMATION
03_B_VA_V4 20/02/14 16:53 Page91

2.4.2. Associates
Associates are all entities in which the Group exercises asignificant influence over the entity’s management andfinancial policy, without exercising control, and generallyimplies holding 20% to 50% of the voting rights.
Associates are recognised using the equity method andinitially measured at cost, except when the associateswere previously controlled by the Group, in which casethey are measured at fair value through the incomestatement as of the date control is lost.
Subsequently, the share in profits or losses of the associateattributable to owners of the parent is recognised in“Share in earnings of associates”, and the share in othercomprehensive income of associates is carried on aseparate line of the statement of comprehensive income.If the Group’s share in the losses of an associate equals orexceeds its investment in that associate, the Group nolonger recognises its share of losses, unless it has legal orconstructive obligations to make payments on behalf ofthe associate.
Goodwill related to an associate is included in the carryingamount of the investment, presented separately within“Investments in associates” in the statement of financialposition.
Gains or losses on internal transactions with equity-accounted associates are eliminated in the amount ofthe Group’s investment in these companies.
The accounting policies and methods of associates aremodified where necessary to ensure consistency ofaccounting treatment at Group level.
2.4.3. Joint ventures
In the event of joint control, which exists pursuant to thecontractually agreed sharing of control over an economicactivity, and when the strategic, financial and operatingdecisions relating to the activity require the unanimousconsent of the parties sharing control, the Group’s stake inthe joint venture is recognised using the equity method.
2.4.4. Business combinations
Business combinations, where the Group acquires controlof one or more other activities, are recognised using theacquisition method.
Business combinations carried out after January 1, 2009 arerecognised and measured in accordance with the provisionsof the revised IFRS 3. Accordingly, the considerationtransferred (acquisition cost) is measured at the fair valueof the assets transferred, equity interests issued andliabilities incurred by the acquirer at the date ofexchange. Identifiable assets and liabilities are measuredat their fair value on the acquisition date. Costs directlyattributable to the business combination are recognisedin expenses.
The excess of the consideration transferred over theGroup’s interest in the net fair value of the identifiableassets and liabilities of the acquired entity is recognisedas goodwill. The Group may choose to measure any non-controlling interests resulting from a business combinationat fair value. In this case, goodwill is recognised on all of theidentifiable assets and liabilities (full goodwill method).
Goodwill is determined at the date control over theacquired entity is obtained and may not be adjusted afterthe measurement period. No additional goodwill isrecognised on any subsequent acquisition of non-controllinginterests. Acquisitions and disposals of non-controllinginterests are recognised directly in consolidated equity.
If the consideration transferred is less than the Group’s interestin the net assets of the subsidiary acquired measured atfair value, the difference is recognised directly in netincome for the period.
The accounting for a business combination must be completedwithin 12 months of the acquisition date. This applies tothe measurement of identifiable assets and liabilities,consideration transferred and non-controlling interests.
2.5. Foreign currency translation
2.5.1. Functional and presentation currency
Items included in the financial statements of each Groupentity are valued using the currency of the primary economicenvironment in which the entity operates (functionalcurrency). The Group’s consolidated financial statements arepresented in euros, which serves as the presentation currency.
2.5.2. Foreign currency transactions
Transactions denominated in foreign currencies arerecognised in the entity’s functional currency at theexchange rate prevailing on the transaction date.
Monetary items in foreign currencies are translated at the endof each reporting period using the closing rate. Translationadjustments arising from the settlement of these itemsare recognised in income or expenses for the period.
Non-monetary items in foreign currencies valued athistorical cost are translated at the rate prevailing on thetransaction date, and non-monetary items in foreigncurrencies measured at fair value are translated at the rateprevailing on the date the fair value is determined. Whena gain or loss on a non-monetary item is recognised directlyin other comprehensive income, the foreign exchangecomponent is also recognised in other comprehensiveincome. Otherwise, the component is recognised inincome or expenses for the period.
The treatment of foreign exchange rate hedges in the formof derivatives is described in the section on derivativeinstruments in Note 2.11 – Financial assets and liabilities.
92 Kering ~ 2013 Financial Document
3 FINANCIAL INFORMATION ~ CONSOLIDATED FINANCIAL STATEMENTS AS OF DECEMBER 31, 2013
03_B_VA_V4 20/02/14 16:53 Page92

2.5.3. Translation of the financial statements of foreign subsidiaries
The results and financial statements of Group entities witha functional currency that differs from the presentationcurrency are translated into euros as follows:
• items recorded in the statement of financial positionother than equity are translated at the exchange rate atthe end of the reporting period;
• income and cash flow statement items are translatedat the average rate for the period, corresponding to anapproximate value for the rate at the transaction datein the absence of significant fluctuations;
• foreign exchange differences are recognised as translationadjustments in the statement of comprehensive incomeunder other comprehensive income. These include gainsand losses on foreign currency borrowings used to hedgeforeign currency investments and on permanent advancesto foreign subsidiaries.
Goodwill and fair value adjustments arising from a businesscombination with a foreign activity are recognised in thefunctional currency of the entity acquired. They aresubsequently translated at the closing exchange rate intothe Group’s presentation currency, and any resultingdifferences transferred to other comprehensive incomewithin the statement of comprehensive income.
2.5.4. Net investment in a foreign subsidiary
Foreign exchange gains or losses arising on the translationof a net investment in a foreign subsidiary are recognisedin the consolidated financial statements as a separatecomponent within the statement of comprehensiveincome, and in income on disposal of the net investment.
Foreign exchange gains or losses in respect of foreign currencyborrowings hedging foreign currency investments orpermanent advances to foreign subsidiaries are alsorecognised in other comprehensive income (to the extent thatthe hedge is effective), within the statement of comprehensiveincome, and in income on disposal of the net investment.
2.6. Goodwill
Goodwill is determined as indicated in Note 2.4.4.
Goodwill represents the excess of the considerationtransferred in a business combination over the acquirer’sinterest in the net fair value of the identifiable assets andliabilities on the acquisition date. If the Group chooses tomeasure non-controlling interests in a given businesscombination at fair value, goodwill is calculated on allidentifiable assets and liabilities.
Goodwill is allocated as of the acquisition date to cash-generating units (CGUs) or groups of CGUs defined by theGroup based on the characteristics of the core business,market or geographical segment of each brand. The CGUsor groups of CGUs to which goodwill has been allocated
are tested for impairment during the second half of eachfiscal year or whenever events or circumstances indicatethat an impairment loss is likely.
Any impairment losses are recorded in “Other non-recurringoperating income and expenses” in the consolidatedincome statement as part of operating income.
2.7. Brands and other intangible assets
Intangible assets acquired as part of a businesscombination, which are controlled by the Group and areseparable or arise from contractual or other legal rights,are recognised separately from goodwill. These assets, inthe same way as intangible assets acquired separately,are amortised over their useful life where this is finite andwritten down if their recoverable amount is less thantheir net carrying amount. Intangible assets withindefinite useful lives are not amortised but are tested forimpairment at least annually or more frequently whenthere is an indication that an impairment loss is likely.
Any impairment losses recognised at the time of impairmenttests are recorded in the consolidated income statementunder “Other non-recurring operating income and expenses”as part of operating income.
Brands representing a predominant category of theGroup’s intangible assets are recognised separately fromgoodwill when they meet the criteria set out in IAS 38.Recognition and durability criteria are then taken intoaccount to assess the useful life of the brand.
A brand representing an intangible asset with an indefiniteuseful life is not amortised but is tested for impairmentat least annually or more frequently when there is anindication that an impairment loss is likely. In addition tothe projected future cash flows method, the Group appliesthe royalties method, which consists of determining thevalue of a brand based on future royalty revenue receivablewhere it is assumed that the brand will be operatedunder licence by a third party.
Software acquired as part of recurring operations is usuallyamortised over a period not exceeding 12 months.
Software developed in-house by the Group and meeting allthe criteria set out in IAS 38 is capitalised and amortisedon a straight-line basis over its useful life, which isgenerally between three and ten years.
2.8. Property, plant and equipment
Property, plant and equipment are recognised at cost lessaccumulated depreciation and impairment losses withthe exception of land, which is presented at cost lessimpairment losses. The various components of property,plant and equipment are recognised separately whentheir estimated useful life and therefore theirdepreciation periods are significantly different. The costof an asset includes the expenses that are directlyattributable to its acquisition.
93
3
2013 Financial Document ~ Kering
CONSOLIDATED FINANCIAL STATEMENTS AS OF DECEMBER 31, 2013 ~ FINANCIAL INFORMATION
03_B_VA_V4 20/02/14 16:53 Page93
Subsequent costs are included in the carrying amount ofthe asset or recognised as a separate component, wherenecessary, if it is probable that future economic benefits willflow to the Group and the cost of the asset can be reliablymeasured. All other routine repair and maintenancecosts are expensed in the year they are incurred.
Depreciation is calculated using the straight-line method,based on the purchase or production cost, less any residualvalue which is reviewed annually if considered material,over a period corresponding to the useful life of each assetcategory, i.e., 10 to 40 years for buildings and improvementsto land and buildings, and 3 to 10 years for equipment.
Property, plant and equipment are tested for impairmentwhen an indication of impairment loss exists, such as ascheduled closure, a redundancy plan or a downwardrevision of market forecasts. When the asset’s recoverableamount is less than its net carrying amount, an impairmentloss is recognised. Where the recoverable amount of anindividual asset cannot be determined precisely, theGroup determines the recoverable amount of the CGU orgroup of CGUs to which the asset belongs.
Lease contracts
Agreements whose fulfilment depends on the use of oneor more specific assets and which transfer the right touse the asset are classified as lease contracts.
Lease contracts which transfer to the Group substantiallyall the risks and rewards incidental to ownership of anasset are classified as finance leases.
Assets acquired under finance leases are recognised inproperty, plant and equipment against the correspondingdebt recognised in borrowings for the same amount, atthe lower of the fair value of the asset and the presentvalue of minimum lease payments. The correspondingassets are depreciated over a useful life identical to thatof property, plant and equipment acquired outright, orover the term of the lease, whichever is shorter.
Lease contracts that do not transfer substantially all therisks and rewards incidental to ownership are classifiedas operating leases. Payments made under operatingleases are recognised in recurring operating expenses ona straight-line basis over the term of the lease.
Capital gains on the sale and leaseback of assets arerecognised in full in income at the time of disposal when thelease qualifies as an operating lease and the transactionis performed at fair value.
The same accounting treatment is applied to agreementsthat, while not presenting the legal form of a lease contract,confer on the Group the right to use a specific asset inexchange for a payment or series of payments.
2.9. Inventories
Inventories are valued at the lower of cost and netrealisable value. Net realisable value is the estimated sale
price in the normal course of operations, net of costs tobe incurred to complete the sale.
The same method for determining costs is adopted forinventories of a similar nature and use within the sameentity. Inventories are valued using the retail, first-in-first-out (FIFO) or weighted average cost method, dependingon the Group activity.
Interest expenses are excluded from inventories andexpensed as finance costs in the year they are incurred.
The Group may recognise an inventory allowance based onexpected turnover, if inventory items are damaged, havebecome wholly or partially obsolete, the selling price hasdeclined, or if the estimated costs to completion or to beincurred to make the sale have increased.
2.10. Asset impairment
Goodwill and intangible assets with an indefinite life,such as certain brands, and CGUs or groups of CGUscontaining these items, are tested for impairment at leastannually during the second half of each reporting period.
An impairment test is also performed when events orcircumstances indicate that goodwill, other intangibleassets, property, plant and equipment, and CGUs or groupsof CGUs may be impaired. Such events or circumstancesconcern material unfavourable changes of a permanentnature affecting either the economic environment or theassumptions or objectives used on the acquisition date.
Impairment tests seek to determine whether the recoverableamount of an asset, a CGU or a group of CGUs is less thanits net carrying amount.
The recoverable amount of an asset, a CGU or a group ofCGUs is the higher of its fair value less costs to sell and itsvalue in use.
The value in use is determined with respect to future cashflow projections, taking into account the time value ofmoney and the specific risks attributable to the asset orCGU or group of CGUs.
Future cash flow projections are based on medium-termbudgets and plans. These plans are drawn up for a periodof four years with the exception of certain CGUs or groups ofCGUs undergoing strategic repositioning, for which a longerperiod may be applied. To calculate value in use, a terminalvalue equal to the perpetual capitalisation of a normativeannual cash flow is added to the estimated future cash flows.
Fair value less costs to sell is the amount obtainable fromthe sale of an asset or group of assets in an arm’s lengthtransaction between knowledgeable, willing parties, lessthe costs of disposal. These values are determined based onmarket data (comparison with similar listed companies, valuesadopted in recent transactions and stock market prices).
When the recoverable amount of an asset, CGU or group ofCGUs is less than its net carrying amount, an impairment lossis recognised in respect of the asset or group of assets.
94 Kering ~ 2013 Financial Document
3 FINANCIAL INFORMATION ~ CONSOLIDATED FINANCIAL STATEMENTS AS OF DECEMBER 31, 2013
03_B_VA_V4 20/02/14 16:53 Page94
For a CGU or group of CGUs, impairment is charged first togoodwill where appropriate, and recognised under “Othernon-recurring operating income and expenses” in theincome statement.
Impairment losses recognised in respect of property,plant and equipment and other intangible assets may bereversed at a later date up to the amount of the lossesinitially recognised, when the recoverable amount onceagain exceeds the net carrying amount. Impairmentlosses in respect of goodwill may not be reversed.
Goodwill relating to the partial disposal of a CGU ismeasured on a proportionate basis, except where analternative method is more appropriate.
2.11. Financial assets and liabilities
Derivative instruments are recognised in the statement offinancial position at fair value, in assets (positive fairvalue) or liabilities (negative fair value).
2.11.1. Financial assets
Pursuant to IAS 39, financial assets are classified withinone of the following four categories:
• financial assets at fair value through the incomestatement;
• loans and receivables;
• held-to-maturity investments;
• available-for-sale financial assets.
The classification determines the accounting treatmentfor the instrument. It is defined by the Group on the initialrecognition date, based on the objective behind the asset’spurchase. Purchases and sales of financial assets arerecognised on the trade date, which is the date the Groupis committed to the purchase or sale of the asset. A financialasset is derecognised if the contractual rights to the cashflows from the financial asset expire or the asset istransferred.
1. Financial assets at fair value through the income statement
These are financial assets held by the Group for short-term profit, or assets voluntarily classified in this category.
These assets are measured at fair value, with changes infair value recognised in income.
The instruments primarily comprise eligible mutual orsimilar funds, and are classified as current assets undercash equivalents.
2. Loans and receivables
Loans and receivables are non-derivative financial assetswith fixed or determinable payments that are not listed inan active market and are not held for trading purposes orclassified as available for sale.
These assets are initially recognised at fair value andsubsequently at amortised cost using the effectiveinterest method. Short-term receivables without a statedinterest rate are valued at the amount of the originalinvoice unless the effective interest rate has a material impact.
These assets are subject to impairment tests when thereis an indication of impairment loss. An impairment loss isrecognised if the carrying amount exceeds the estimatedrecoverable amount.
Loans and receivables due from non-consolidatedinvestments, other loans and receivables and tradereceivables are included in this category and arepresented in non-current financial assets, tradereceivables and other non-current financial assets.
3. Held-to-maturity investments
Held-to-maturity investments are non-derivative financialassets, other than loans or receivables, with fixed ordeterminable payments and fixed maturity that theGroup has the positive intention and ability to hold tomaturity. These assets are initially recognised at fair valueand subsequently at amortised cost using the effectiveinterest method.
These assets are subject to impairment tests when thereis an indication of impairment loss. An impairment loss isrecognised if the carrying amount exceeds the estimatedrecoverable amount.
Held-to-maturity investments are presented in non-currentfinancial assets.
4. Available-for-sale financial assets
Available-for-sale financial assets are non-derivativefinancial assets that are not included in the aforementionedcategories. They are recognised at fair value. Unrealisedcapital gains or losses are recognised in other comprehensiveincome until the disposal of the assets. However, wherethere is an objective indication of loss in value of anavailable-for-sale financial asset, the accumulated loss isrecognised in income. Impairment losses recognised inrespect of variable-income securities cannot be reversedthrough the income statement at the end of a subsequentreporting period.
For listed securities, fair value corresponds to a market price.For unlisted securities, fair value is determined by referenceto recent transactions or using valuation techniquesbased on reliable and objective indicators. However, whenthe fair value of a security cannot be reasonably estimated,it is recorded at historical cost. These assets are subjectto impairment tests in order to assess whether they arerecoverable.
This category mainly comprises non-consolidatedinvestments and marketable securities that do not meetother financial asset definitions. They are presented innon-current financial assets.
95
3
2013 Financial Document ~ Kering
CONSOLIDATED FINANCIAL STATEMENTS AS OF DECEMBER 31, 2013 ~ FINANCIAL INFORMATION
03_B_VA_V4 20/02/14 16:53 Page95

2.11.2. Financial liabilities
The measurement of financial liabilities depends on theirIAS 39 classification. Excluding put options granted tonon-controlling interests, derivative liabilities andfinancial liabilities accounted for under the fair valueoption, the Group recognises all financial liabilities andparticularly borrowings, trade payables and otherliabilities initially at fair value less transaction costs andsubsequently at amortised cost, using the effectiveinterest method.
The effective interest rate is determined for each transactionand corresponds to the rate that would provide the netcarrying amount of the financial liability by discountingits estimated future cash flows until maturity or the nearestdate the price is reset to the market rate. The calculationincludes transaction costs and any premiums and/ordiscounts. Transaction costs correspond to the costs directlyattributable to the acquisition or issue of a financial liability.
The net carrying amount of financial liabilities that qualifyas hedged items as part of a fair value hedging relationshipand are valued at amortised cost, is adjusted with respectto the hedged risk.
Hedging relationships are described in the section onderivative instruments.
Financial liabilities accounted for under the fair value option,other than derivative liabilities, are carried at fair value.Changes in fair value are taken to the income statement.Transaction costs incurred in setting up these financialliabilities are recognised immediately in expenses.
2.11.3. Hybrid instruments
Certain financial instruments have both a standard debtcomponent and an equity component.
For the Group, this concerns in particular OCEANE bonds(bonds convertible or exchangeable into new or existingshares).
Under IAS 32, convertible bonds are considered hybridinstruments insofar as the conversion option provides forthe repayment of the instrument against a fixed numberof equity instruments. There are several components:
• a financial liability (corresponding to the contractualcommitment to pay cash), representing the bondcomponent;
• the option converting the bonds into a fixed number ofordinary shares, offered to the subscriber, similar to a calloption written by the issuer, representing an equityinstrument;
• potentially one or more embedded derivatives.
The accounting policies applicable to each of thesecomponents, at the issue date and at the end of eachsubsequent reporting period, are as follows:
• debt component: the amount initially recognised asdebt corresponds to the present value of the future
cash flows arising from interest and principal paymentsat the market rate for a similar bond with no conversionoption. If the convertible bond contains embeddedderivatives closely related to the borrowing within themeaning of IAS 39, the value of these components isallocated to the debt in order to determine the value ofthe equity component. The debt component issubsequently recognised at amortised cost;
• embedded derivatives not closely related to the debtare recognised at fair value with changes in fair valuerecognised in income;
• equity component: the value of the conversion optionis determined by deducting the value of any embeddedderivatives from the amount of the issue less the carryingamount of the debt component. The conversion optioncontinues to be recorded in equity at its initial value.Changes in value are not recognised;
• transaction costs are allocated pro rata to eachcomponent.
2.11.4. Derivative instruments
The Group uses various financial instruments to reduceits exposure to foreign exchange, interest rate and equityrisk. These instruments are listed on organised marketsor traded over the counter with leading counterparties.
All derivatives are recognised in the statement offinancial position under other current or non-currentassets and liabilities depending on their maturity andaccounting classification, and are valued at fair value asof the trade date. Changes in the fair value of derivativesare always recorded in income except in the case of cashflow and net investment hedges.
Derivatives designated as hedging instruments areclassified by category of hedge based on the nature of therisks being hedged:
• a cash flow hedge is used to hedge the risk of changesin cash flow from recognised assets or liabilities or ahighly probable transaction that would impactconsolidated net income;
• a fair value hedge is used to hedge the risk of changesin the fair value of recognised assets or liabilities or a firmcommitment not yet recognised that would impactconsolidated net income;
• a net investment hedge is used to hedge the foreignexchange risk arising on foreign activities.
Hedge accounting can only be applied if all the followingconditions are met:
• there is a clearly identified, formalised and documentedhedging relationship as of the date of inception;
• the effectiveness of the hedging relationship can bedemonstrated on a prospective and retrospective basis.The results obtained must attain a confidence level ofbetween 80% and 125%.
96 Kering ~ 2013 Financial Document
3 FINANCIAL INFORMATION ~ CONSOLIDATED FINANCIAL STATEMENTS AS OF DECEMBER 31, 2013
03_B_VA_V4 20/02/14 16:53 Page96
The accounting treatment of financial instruments qualifiedas hedging instruments, and their impact on the incomestatement and the statement of financial position,depends on the type of hedging relationship:
• cash flow and net investment hedges:- the effective portion of fair value gains and losses on
the hedging instrument is recognised directly in othercomprehensive income. These amounts are releasedto the income statement to match the recognition ofthe hedged items, mainly in gross profit for tradingtransaction hedges and in net finance costs forfinancial transaction hedges,
- the ineffective portion of the hedge is recognised inthe income statement,
• for fair value hedges, the hedged component of theseitems is measured on the statement of financial positionat fair value. Fair value gains and losses are recorded inthe income statement and offset, to the extent effective,by matching fair value gains and losses on the hedginginstrument.
2.11.5. Cash and cash equivalents
The “Cash and cash equivalents” line item recorded onthe assets side of the consolidated statement of financialposition comprises cash, mutual or similar funds, short-term investments and other highly liquid instrumentsthat are readily convertible to known amounts of cash,subject to an insignificant risk of changes in value, andhave a maximum maturity of three months as of thepurchase date.
Investments with a maturity exceeding three months,and blocked or pledged bank accounts, are excluded fromcash. Bank overdrafts are presented in borrowings on theliabilities side of the statement of financial position.
In the statement of cash flows, cash and cash equivalentsinclude accrued interest receivable on assets presented incash and cash equivalents and bank overdrafts. A schedulereconciling cash per the statement of cash flows and perthe statement of financial position is provided in Note 32.
2.11.6. Definition of Group consolidated net debt
The concept of net debt used by Group companies comprisesgross debt including accrued interest receivable less netcash as defined by French national accounting board(Conseil National de la Comptabilité – CNC) recommendationNo. 2009-R.03. Net debt includes fair value hedginginstruments recorded in the statement of financial positionrelating to bank borrowings and bonds whose interestrate risk is fully or partly hedged as part of a fair valuehedging relationship.
The financing of customer loans by fully-consolidatedconsumer credit businesses is presented in borrowings.Group net debt excludes the financing of customer loansby consumer credit businesses.
2.12. Treasury shares
Treasury shares, whether specifically allocated for grantto employees or allocated to the liquidity agreement or inany other case, as well as directly related transaction costs,are deducted from consolidated equity. On disposal, theconsideration received for these shares, net of transactioncosts and the related tax impacts, is recognised in equity.
2.13. Treasury share options
Treasury share options are treated according to theircharacteristics as derivative instruments, equityinstruments or financial liabilities.
Options classified as derivatives are recorded at fair valuethrough the income statement. Options classified asequity instruments are recorded in equity for their initialamount. Changes in value are not recognised. The accountingtreatment of financial liabilities is described in Note 2.11.
2.14. Share-based payment
Free share plans, stock purchase plans and stocksubscription plans are awarded by the Group and settled inshares. In accordance with IFRS 2 – Share-based Payment,the fair value of these plans, determined by reference tothe fair value of services rendered by the beneficiaries, isassessed at the grant date. The mathematical modelsused in these calculations are described in Note 7.
During the rights vesting period, the fair value of optionsand free shares calculated as described above is amortisedin proportion to the vesting of rights. This expense isrecorded in payroll expenses with an offsetting increasein equity.
Share appreciation rights (SARs) granted by the Groupalso result in the recognition of payroll expenses spreadover the rights vesting period and a matching liabilitywhich is measured at fair value through income at theend of each reporting period.
2.15. Income taxes
The income tax charge for the period comprises the currentand deferred tax charge.
Deferred tax is calculated using the liability method on alltemporary differences between the carrying amountrecorded in the consolidated statement of financialposition and the tax value of assets and liabilities, exceptfor goodwill that is not deductible for tax purposes. Thevaluation of deferred tax balances depends on the way inwhich the Group intends to recover or settle the carryingamount of assets and liabilities, using tax rates that havebeen enacted or substantively enacted at the end of thereporting period.
Deferred tax assets and liabilities are not discounted andare classified in the statement of financial position withinnon-current assets and liabilities.
97
3
2013 Financial Document ~ Kering
CONSOLIDATED FINANCIAL STATEMENTS AS OF DECEMBER 31, 2013 ~ FINANCIAL INFORMATION
03_B_VA_V4 20/02/14 16:53 Page97

A deferred tax asset is recognised on deductible temporarydifferences and for tax loss carry-forwards and tax creditsto the extent that their future offset is probable.
A deferred tax liability is recognised on taxable temporarydifferences relating to investments in subsidiaries,associates and joint ventures unless the Group is able tocontrol the timing of the reversal of the temporarydifference, and it is probable that the temporarydifference will not reverse in the foreseeable future.
2.16. Provisions
Provisions for litigation and disputes, and miscellaneouscontingencies and losses are recognised as soon as a presentobligation arises from past events, which is likely to resultin an outflow of resources embodying economic benefits,and the amount of which can be reliably estimated.
Provisions maturing in more than one year are valued at thediscounted amount representing the best estimate of theexpense necessary to extinguish the current obligation atthe end of the reporting period. The discount rate usedreflects current assessments of the time value of moneyand specific risks related to the liability.
A restructuring provision is recognised when there is aformal and detailed restructuring plan and the plan hasbegun to be implemented or its main features have beenannounced before the end of the reporting period.Restructuring costs for which a provision is made essentiallyrepresent employee costs (severance pay, early retirementplans, payment in lieu of notice, etc.), work stoppages andcompensation for breaches of contract with third parties.
2.17. Post-employment benefits and otherlong-term employee benefits
Based on the laws and practices of each country, theGroup recognises various types of employee benefits.
Under defined contribution plans, the Group is notobliged to make additional payments over and abovecontributions already made to a fund, if the fund doesnot have sufficient assets to cover the benefitscorresponding to services rendered by personnel duringthe current period and prior periods. Contributions paidinto these plans are expensed as incurred.
Under defined benefit plans, obligations are valued usingthe projected unit credit method based on agreements ineffect in each company. Under this method, each period ofservice gives rise to an additional unit of benefit entitlementand each unit is measured separately to build up the finalobligation. The obligation is then discounted. The actuarialassumptions used to determine the obligations varyaccording to the economic conditions of the countrywhere the plan is established. These plans are valued by
independent actuaries on an annual basis for the mostsignificant plans and at regular intervals for the otherplans. The valuations take into account the level of futurecompensation, the probable active life of employees, lifeexpectancy and staff turnover.
Actuarial gains and losses are primarily due to changes inassumptions and the difference between estimatedresults based on actuarial assumptions and actual results.All actuarial differences in respect of defined benefitplans are recognised in other comprehensive income.
The past service cost designating the increase in anobligation following the introduction of a new plan orchanges to an existing plan, is expensed immediatelywhether the benefit entitlement has already vested or isstill vesting.
Expenses relating to this type of plan are recognised inrecurring operating income (service cost) and net financecosts (interest cost and net interest on the net definedbenefit liability or asset). Curtailments, settlements and pastservice costs are recognised in recurring operatingincome. The provision recognised in the statement offinancial position corresponds to the present value of theobligations calculated as described above, less the fairvalue of plan assets.
2.18. Non-current assets (and disposalgroups) held for sale to owners
The Group applies IFRS 5 – Non-current Assets Held for Saleand Discontinued Operations. This requires the separaterecognition and presentation of non-current assets (ordisposal groups) held for sale and discontinued operations.
Non-current assets, or groups of assets and liabilities directlyassociated with those assets, are considered as held forsale if it is highly probable that their carrying amount willbe recovered principally through a sale rather than throughcontinuing use. Non-current assets (or disposal groups)held for sale are measured and recognised at the lower oftheir net carrying amount and their fair value less the costsof disposal. These assets are no longer depreciated fromthe time they qualify as assets (or disposal groups) held forsale. They are presented on separate lines in the consolidatedstatement of financial position, without restatement forprevious periods.
A discontinued operation is defined as a component of anentity that generates cash flows that can be clearlydistinguished from the rest of the entity and represents aseparate major line of business or geographical area ofoperations. For all periods presented, the net income(loss) from these activities is shown on a separate line ofthe income statement (“Discontinued operations”), and isrestated in the statement of cash flows.
98 Kering ~ 2013 Financial Document
3 FINANCIAL INFORMATION ~ CONSOLIDATED FINANCIAL STATEMENTS AS OF DECEMBER 31, 2013
03_B_VA_V4 20/02/14 16:53 Page98
2.19. Revenue recognition
Revenue mainly comprises sales of goods for resale, consumergoods and Luxury Goods, together with income fromsales-related services, royalties and operating licences.
Revenue is valued at the fair value of the considerationreceived for goods and services sold, royalties and licences,excluding taxes, net of rebates and discounts and afterelimination of inter-company sales.
In the event of deferred payment beyond the usual creditterms that is not assumed by a financing institution, therevenue from the sale is equal to the discounted price, withthe difference between the discounted price and the cashpayment recognised in financial income over the life ofthe deferred payment if the transaction is material.
Sales of goods are recognised when a Group entity hastransferred the risks and rewards incidental to ownershipto the buyer (generally on delivery), when revenue can bereliably measured and when recovery is reasonably assured.
Following the sale of goods, and depending on thecontractual clauses attached to these sales, provisionsmay be deducted from revenue to cover potential returnslikely to occur after the end of the reporting period.
Services such as warranty extensions or services directlyrelated to the sale of goods are recognised over the periodin which such services are rendered or, if the Group companyacts as an intermediary in the sale of these services, as of thedate the contractual agreement is signed by the customer.
2.20. Operating income
Operating income includes all revenue and expensesdirectly related to Group activities, whether these revenueand expenses are recurring or arise from non-recurringdecisions or transactions.
Recurring operating income is an analytical balanceintended to facilitate the understanding of the entity’soperating performance.
Other non-recurring operating income and expensesexcluded from recurring operating income as defined byCNC recommendation No. 2009-R.03, include:
• non-recurring items corresponding to revenue andexpenses that are unusual due to their frequency,nature or amount;
• impairment of goodwill and other intangible assets;
• gains or losses on disposals of property, plant andequipment and intangible assets, operating assets orinvestments;
• restructuring costs and costs relating to employeeretraining measures.
2.21. Earnings per share
Earnings per share is calculated by dividing net incomeattributable to owners of the parent by the weightedaverage number of outstanding shares during the year,after deduction of the weighted average number oftreasury shares held by consolidated companies.
Fully diluted earnings per share is calculated by adjustingnet income attributable to owners of the parent and thenumber of outstanding shares for all instruments grantingdeferred access to the share capital of the Company, whetherissued by Kering or one of its subsidiaries. Dilution isdetermined separately for each instrument based on thefollowing conditions:
• when the proceeds corresponding to potential futureshare issues are received at the time dilutive securities areissued (e.g., convertible bonds), the numerator is equal tonet income before dilution plus the interest expense thatwould be saved in the event of conversion, net of tax;
• when the proceeds are received at the time the rights areexercised (e.g., stock subscription options), the dilutionattached to the options is determined using the treasuryshares method (theoretical number of shares purchasedat market price [average over the period] based on theproceeds received at the time the rights are exercised).
In the case of material non-recurring items, earnings pershare excluding non-recurring items is calculated by adjustingnet income attributable to owners of the parent for non-recurring items net of taxes and non-controlling interests.Non-recurring items taken into account for this calculationcorrespond to all the items included under “Other non-recurring operating income and expenses” in the incomestatement.
2.22. Operating segments
In accordance with IFRS 8 – Operating Segments, segmentinformation is reported on the same basis as used internallyby the Chairman and Chief Executive Officer and DeputyCEO – the Group’s chief operating decision makers – inorder to allocate resources to segments and assess theirperformance.
An operating segment is a component of the Group thatengages in business activities from which it may earn revenuesand incur expenses, whose operating results are regularlyreviewed by the entity’s chief operating decision maker,and for which discrete financial information is available.
Each operating segment is monitored separately forinternal reporting purposes, according to performanceindicators common to all of the Group’s segments.
The segments presented are operating segments or groupsof similar operating segments.
99
3
2013 Financial Document ~ Kering
CONSOLIDATED FINANCIAL STATEMENTS AS OF DECEMBER 31, 2013 ~ FINANCIAL INFORMATION
03_B_VA_V4 20/02/14 16:53 Page99
The Kering group consolidated financial statements forthe year ended December 31, 2013 include the financialstatements of the companies listed in Note 36.
3.1. PPR becomes Kering
Having completed its transformation into a global leaderin apparel and accessories operating in the Luxury andSport & Lifestyle markets, on March 22, 2013 the Groupannounced its decision to change its name to “Kering” tobetter reflect its new identity. This name change was approvedat the Annual General Meeting held on June 18, 2013.
3.2. Changes in Group structure
3.2.1. Distribution of Groupe Fnac shares to Keringshareholders and listing of Groupe Fnacshares on NYSE Euronext Paris
In line with the principle announced on October 9, 2012,at its April 17, 2013 meeting Kering’s Board of Directorsunanimously approved the listing of Groupe Fnac sharesthrough a distribution of Groupe Fnac shares to Keringshareholders. This listing had previously been approvedby the employee representative bodies of both GroupeFnac and Kering SA.
At the Annual General Meeting of June 18, 2013, Kering’sshareholders authorised the payment of an additional cashdividend of €2.25 per share (following an interim cashdividend of €1.50 paid on January 24, 2013), and an additional dividend in the form of Groupe Fnac sharesat a ratio of one Groupe Fnac share for every eight Keringshares held.
On June 20, 2013 prior to the start of market trading:
• the rights to the balance of the cash dividend for 2012were detached from the Kering shares and the dividendwas paid;
• the rights to the allotment of Groupe Fnac shares weredetached from the Kering shares and the deliveries ofGroupe Fnac shares began.
Consequently, the Groupe Fnac share allotment rightsbegan trading on Euronext Paris on June 20, 2013.
Kering distributed a total of 15,672,034 shares representingjust under 95% of Groupe Fnac’s capital as of the ex-dividend date, in view of the fact that a 5% stake in thecompany had already been sold in the first half of 2013to Kernic Met BV (a company indirectly held by Kering),which in turn had transferred title to the 830,907 sharesconcerned as part of a financial forward contract.
In accordance with IFRIC 17, as of June 20, 2013 – the dateon which the Groupe Fnac shares were delivered to their
shareholders and first listed – the Groupe Fnac shares werederecognised by Kering based on a fair value of €314 millionfor 95% of the shares (15,672,034 shares x €20.03).
The derecognition led to a €256 million post-tax disposalloss in 2013, taking into account the costs of the distributionand Groupe Fnac’s net income in the first half of the year.
This disposal loss was recorded in “Net income (loss)from discontinued operations”.
3.2.2. Kering continues its divestment of Redcatsand finalises the Group’s transformation
On January 3, 2013, Kering announced that it hadreceived a firm offer from Alpha Private Equity Fund 6(“APEF 6”) to acquire Redcats’ Children and Familydivision – comprising the Cyrillus and Vertbaudet brands –for an enterprise value of €119 million. The transactionwas completed on March 28, 2013.
On February 5, 2013, Kering announced the closing of thesale of OneStopPlus to Charlesbank Capital Partners andWebster Capital in accordance with the terms of thedefinitive sale agreement announced on December 5, 2012.This transaction marked the final step in the sale of all ofRedcats USA’s operations.
On February 25, 2013, Kering announced that Redcatshad entered into an agreement to sell its Nordic activities,Ellos and Jotex to Nordic Capital Fund VII for an enterprisevalue of €275 million. The transaction was completed onJune 3, 2013.
During the second half of 2013, Kering continued the processfor its planned sale of La Redoute and Relais Colis. OnDecember 4, 2013, after examining the four takeover offers,Kering’s Board of Directors decided to enter into exclusivenegotiations with Nathalie Balla – the current chairman andCEO of La Redoute – and Eric Courteille – Chief AdministrativeOfficer of Redcats – who presented a takeover plan for LaRedoute and Relais Colis, supported by a team of managersfrom the two companies. In line with the undertakings it gave in relation to the takeover, Kering will recapitaliseLa Redoute and Relais Colis at the same time as the saleis carried out. This recapitalisation will ensure that bothcompanies enjoy a healthy financial position backed by asignificant cash surplus and that the new owners will be ableto fund their transformation and modernisation measures.
Nathalie Balla and Eric Courteille presented the details oftheir business plan to the relevant employee representativebodies in January 2014 in accordance with the standardinformation and consultation procedure required underFrench law, and they are currently pursuing negotiationswith La Redoute’s trade unions.
Note 3 – Highlights
100 Kering ~ 2013 Financial Document
3 FINANCIAL INFORMATION ~ CONSOLIDATED FINANCIAL STATEMENTS AS OF DECEMBER 31, 2013
03_B_VA_V4 20/02/14 16:53 Page100

The results of Redcats’ businesses during the yearamounted to €562 million and were recorded under “Netincome (loss) from discontinued operations”. This amountincludes Kering’s €315 million recapitalisation undertakingin relation to La Redoute, the impairment losses recordedagainst Redcats’ residual assets and the disposal gainsand losses on activities sold during the period. It does notinclude the cost of financing the social guarantees to begranted to the employees concerned by the modernisationmeasures at La Redoute and Relais Colis. The total cost ofthis financing, which cannot as yet be reliably estimated, willlead Kering to set up a trust guaranteeing the applicationof the employee measures approved in a majority collectiveagreement with trade unions. The associated costs willbe recognised in 2014.
3.2.3. Kering strengthens its portfolio of luxury brands
In early January 2013, Kering completed its acquisition ofa majority stake in the Chinese fine jewellery brand Qeelin.Launched in 2004, Qeelin is the first Chinese luxury jewellerto have developed an international network of stores in themost prestigious shopping districts worldwide. It currentlyoperates 14 stores (seven in Mainland China, four in Hong Kongand three in Europe) and is sold in a number of multi-brandstores such as Colette in Paris and Restir in Tokyo.
On January 15, 2013, Kering acquired a majority stake inthe luxury designer brand Christopher Kane with a view todeveloping the brand’s business in close partnership withits eponymous creator, the Scottish designer ChristopherKane. Founded in 2006, Christopher Kane is a distinctiveand exciting brand with a unique DNA.
Qeelin and Christopher Kane have been fully consolidatedin Kering’s financial statements since January 1, 2013. As of December 31, 2013, Kering valued the Qeelin brandat €20 million on a provisional basis following the initialpurchase price allocation process, which will be completedduring 2014.
On March 25, 2013, Kering announced that it had acquireda majority stake in France Croco and Tannerie de Périers.Founded in 1974, France Croco is a leading independenttannery located in Normandy and specialised in thesourcing, tanning and processing of crocodile skins.
This acquisition will allow Kering’s brands to further securea sustainable supply of high quality crocodile skins andtheir activities are highly complementary to those ofCaravel, another tannery owned by Kering which specialisesin sourcing and tanning precious skins. France Croco andTannerie de Périers have been consolidated in Kering’sfinancial statements since the second quarter of 2013.The purchase price allocation process for this acquisitionwas still in progress at end-December 2013.
On April 22, 2013 Gucci further demonstrated its commitmentto the excellence of “Made in Italy” and to Tuscany byannouncing that it had acquired the Italian porcelain maker,
Richard Ginori, as part of its plans to expand into thetableware market. Richard Ginori was not consolidated bythe Group at end-December 2013.
On April 24, 2013, Kering announced that it had signed anagreement with RA.MO SpA to acquire a majority stake inthe Italian jewellery group Pomellato. The Pomellatogroup has two brands: Pomellato, which is positioned inthe fine jewellery segment and Dodo, positioned in theaccessible jewellery segment. Through this acquisitionKering has extended and strengthened its portfolio ofluxury brands in the high-growth jewellery segment. Thetransaction was completed on July 5, 2013, followingclearance by the competition authorities. In view of thedate on which Kering took over control of the Group,Pomellato has been consolidated since July 1, 2013. As ofDecember 31, 2013, Kering valued the Pomellato and Dodobrands at €210 million on a provisional basis followingthe initial purchase price allocation process, which will becompleted during 2014.
On September 6, 2013, Kering announced that it wasacquiring a minority shareholding in the New York basedfashion brand, Altuzarra, founded by the Franco-Americandesigner Joseph Altuzarra in 2008. This investment marksthe beginning of a partnership which will enable Kering toaccompany Altuzarra in the next stage of its growth.Altuzarra was not consolidated in Kering’s financialstatements at December 31, 2013.
On November 19, 2013, Kering and Tomas Maier announcedthat they had entered into a joint venture to develop thebusiness of the Tomas Maier brand in partnership. TomasMaier will continue to be Creative Director of BottegaVeneta, a position he has held since 2001. The jointventure was not consolidated in Kering’s financialstatements at December 31, 2013.
3.3. Other highlights
On April 18, 2013, PUMA SE announced that it hadappointed Björn Gulden as Chief Executive Officereffective July 1, 2013. Mr Gulden – who is a member ofKering’s Executive Committee – brings to PUMA solidinternational experience of nearly 20 years in the SportingGoods and footwear industry where he has held a varietyof management positions, notably with Adidas, HellyHansen and Deichman.
In the first half of 2013, Kering redeemed both the€600 million worth of bonds issued in 2005, includingthe additional bonds issued in 2006, and the second€200 million tranche of the bonds indexed to the Keringshare price that were issued in May 2008. To extend thematurity of its debt, Kering carried out a first bond issueon July 15, 2013 involving €500 million worth of seven-year bonds with a fixed-rate coupon of 2.5%, and asecond – which also represented €500 million – onOctober 8, involving five-year bonds with a 1.875% fixed-rate coupon.
101
3
2013 Financial Document ~ Kering
CONSOLIDATED FINANCIAL STATEMENTS AS OF DECEMBER 31, 2013 ~ FINANCIAL INFORMATION
03_B_VA_V4 20/02/14 16:53 Page101
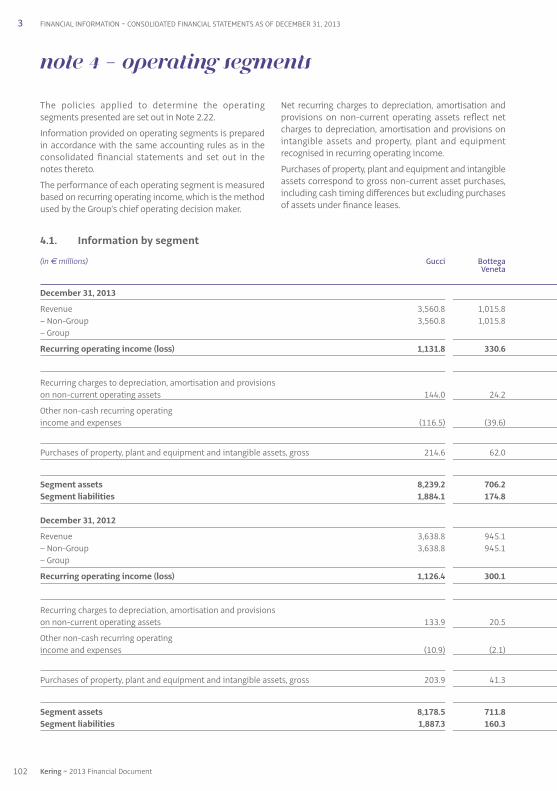
4.1. Information by segment
(in € millions) Gucci Bottega Veneta
December 31, 2013
Revenue 3,560.8 1,015.8 – Non-Group 3,560.8 1,015.8 – Group
Recurring operating income (loss) 1,131.8 330.6
Recurring charges to depreciation, amortisation and provisions on non-current operating assets 144.0 24.2
Other non-cash recurring operating income and expenses (116.5) (39.6)
Purchases of property, plant and equipment and intangible assets, gross 214.6 62.0
Segment assets 8,239.2 706.2 Segment liabilities 1,884.1 174.8
December 31, 2012
Revenue 3,638.8 945.1 – Non-Group 3,638.8 945.1 – Group
Recurring operating income (loss) 1,126.4 300.1
Recurring charges to depreciation, amortisation and provisions on non-current operating assets 133.9 20.5
Other non-cash recurring operating income and expenses (10.9) (2.1)
Purchases of property, plant and equipment and intangible assets, gross 203.9 41.3
Segment assets 8,178.5 711.8 Segment liabilities 1,887.3 160.3
The policies applied to determine the operatingsegments presented are set out in Note 2.22.
Information provided on operating segments is preparedin accordance with the same accounting rules as in theconsolidated financial statements and set out in thenotes thereto.
The performance of each operating segment is measuredbased on recurring operating income, which is the methodused by the Group’s chief operating decision maker.
Net recurring charges to depreciation, amortisation andprovisions on non-current operating assets reflect netcharges to depreciation, amortisation and provisions onintangible assets and property, plant and equipmentrecognised in recurring operating income.
Purchases of property, plant and equipment and intangibleassets correspond to gross non-current asset purchases,including cash timing differences but excluding purchasesof assets under finance leases.
Note 4 – Operating segments
3 FINANCIAL INFORMATION ~ CONSOLIDATED FINANCIAL STATEMENTS AS OF DECEMBER 31, 2013
102 Kering ~ 2013 Financial Document
03_B_VA_V4 20/02/14 16:54 Page102

3CONSOLIDATED FINANCIAL STATEMENTS AS OF DECEMBER 31, 2013 ~ FINANCIAL INFORMATION
Non-current segment assets comprise goodwill, brandsand other intangible assets, property, plant and equipmentand other non-current assets.
Segment assets comprise non-current segment assets,inventories, trade receivables and other current assets.
Segment liabilities comprise deferred tax liabilities onbrands, trade payables and other current liabilities.
Yves Saint Other Luxury PUMA Other Sport & Corporate Total Laurent brands Division brands Lifestyle Division
556.9 1,336.7 6,470.2 3,001.9 245.1 3,247.0 31.2 9,748.4 556.9 1,336.7 6,470.2 3,001.9 245.1 3,247.0 31.2 9,748.4
76.6 143.6 1,682.6 191.9 8.5 200.4 (132.9) 1,750.1
16.4 46.1 230.7 54.5 3.4 57.9 7.2 295.8
(16.0) (27.7) (199.8) (5.6) (2.7) (8.3) 105.4 (102.7)
65.3 93.7 435.6 67.7 7.1 74.8 167.3 677.7
1,246.3 2,522.8 12,714.5 5,960.8 546.5 6,507.3 236.9 19,458.7 241.6 587.6 2,888.1 1,625.8 128.8 1,754.6 230.3 4,873.0
472.8 1,155.6 6,212.3 3,270.7 261.2 3,531.9 (7.9) 9,736.3 472.8 1,155.1 6,211.8 3,263.3 261.2 3,524.5 9,736.3 0.5 0.5 7.4 7.4 (7.9)
65.0 120.1 1,611.6 290.0 14.8 304.8 (124.9) 1,791.5
10.8 38.5 203.7 60.3 5.7 66.0 5.4 275.1
(0.6) (0.5) (14.1) (4.2) 0.2 (4.0) 1.6 (16.5)
21.8 70.3 337.3 81.2 9.9 91.1 13.5 441.9
1,132.9 1,844.9 11,868.1 6,436.1 556.0 6,992.1 122.4 18,982.6 228.2 472.2 2,748.0 1,675.3 126.1 1,801.4 168.1 4,717.5
1032013 Financial Document ~ Kering
03_B_VA_V4 20/02/14 16:54 Page103

(in € millions) 2013 2012
Western Europe 3,057.9 2,937.5North America 2,038.3 1,978.9Japan 982.8 1,158.3
Sub-total – mature markets 6,079.0 6,074.7
Eastern Europe, Middle East and Africa 723.6 685.2South America 476.0 536.7Asia-Pacific (excluding Japan) 2,469.8 2,439.7
Sub-total – emerging markets 3,669.4 3,661.6
Total revenue 9,748.4 9,736.3
4.3. Reconciliation of segment assets and liabilities
The reconciliation of total segment assets and non-current segment assets with total Group assets is as follows:
(in € millions) 2013 2012
Goodwill 3,770.1 3,871.0Brands and other intangible assets 10,702.8 10,489.9Property, plant and equipment 1,676.9 1,376.3Other non-current assets 30.1 28.9
Non-current segment assets 16,179.9 15,766.1
Inventories 1,805.5 1,736.5Trade receivables 949.9 985.3Other current assets 523.4 494.7
Segment assets 19,458.7 18,982.6
Investments in associates 17.3 25.8Non-current financial assets 316.8 273.7Deferred tax assets 649.9 600.2Current tax receivables 119.1 75.7Other current financial assets 107.7 87.0Cash and cash equivalents 1,419.2 2,081.0Assets classified as held for sale or for distribution to owners 722.1 3,130.5
Total assets 22,810.8 25,256.5
4.2. Information by geographic area
The presentation of revenue by geographic area is basedon the geographic location of customers. Non-currentsegment assets are not broken down by geographic area
since a significant portion of these assets consists ofgoodwill and brands, which are to be analysed based onthe revenue they generate in each region, and not basedon their geographic location.
104 Kering ~ 2013 Financial Document
3 FINANCIAL INFORMATION ~ CONSOLIDATED FINANCIAL STATEMENTS AS OF DECEMBER 31, 2013
03_B_VA_V4 20/02/14 16:54 Page104

The reconciliation of total segment liabilities with total Group equity and liabilities is as follows:
(in € millions) 2013 2012
Deferred tax liabilities on brands 2,734.6 2,632.6Trade payables 766.1 684.5Other current liabilities 1,372.3 1,400.4
Segment liabilities 4,873.0 4,717.5
Total equity 11,195.9 12,118.7Non-current borrowings 3,132.4 2,988.9Other non-current financial assets 0.7 Non-current provisions for pensions and other post-employment benefits 92.8 98.2Other non-current provisions 113.2 92.3Other deferred tax liabilities 75.6 139.7Current borrowings 1,737.4 1,595.1Other current financial liabilities 213.2 207.9Current provisions for pensions and other post-employment benefits 7.2 6.6Other current provisions 152.7 167.7Current tax liabilities 310.1 318.4Liabilities associated with assets classified as held for sale or for distribution to owners 906.6 2,805.5
Total equity and liabilities 22,810.8 25,256.5
Note 5 – Revenue
(in € millions) 2013 2012
Net sales of goods 9,571.7 9,583.4Net sales of services 2.4 7.2Revenue from concessions and licences 168.4 145.2Other revenue 5.9 0.5
Total 9,748.4 9,736.3
105
3
2013 Financial Document ~ Kering
CONSOLIDATED FINANCIAL STATEMENTS AS OF DECEMBER 31, 2013 ~ FINANCIAL INFORMATION
03_B_VA_V4 20/02/14 16:54 Page105

(in € millions) 2013 2012
Luxury Division (985.5) (943.0)Sport & Lifestyle Division (452.4) (483.1)Corporate (96.8) (67.5)
Total (1,534.7) (1,493.6)
In 2013, payroll expenses recorded under “Corporate” include a €3.1 million charge (€4.0 million in 2012) relating tothe application of IFRS 2 to all transactions based on Kering shares (see Note 7.1).
The average headcount of continuing operations, on a full-time equivalent basis, breaks down as follows:
2013 2012
Luxury Division 19,050 17,384Sport & Lifestyle Division 11,521 11,720Corporate 844 274
Total 31,415 29,378
The total headcount of continuing operations is as follows:
2013 2012
Luxury Division 20,959 18,905Sport & Lifestyle Division 13,921 14,235Corporate 906 299
Total 35,786 33,439
Payroll expenses primarily include fixed and variableremuneration, social security charges, charges relating toemployee profit-sharing and other incentives, training
costs, share-based payment expenses (see Note 7) andexpenses relating to employee benefits recognised inrecurring operating income (see Note 25).
Note 6 – Payroll expenses
106 Kering ~ 2013 Financial Document
3 FINANCIAL INFORMATION ~ CONSOLIDATED FINANCIAL STATEMENTS AS OF DECEMBER 31, 2013
03_B_VA_V4 20/02/14 16:54 Page106

The nature and key characteristics of eligible plans are presented below:
Stock option and free 2003/1 2004/1 2005/1 2005/2 2005/3 2005/4 2006/1 2007/1share plans Plan Plan Plan Plan Plan Plan Plan Plan Sub- Sub- Sub- Sub- Sub- Sub- Purchase Purchase scription scription scription scription scription scription options options options options options options options options
Grant date 7/9/2003 5/25/2004 1/3/2005 5/19/2005 5/19/2005 7/6/2005 5/23/2006 5/14/2007Expiry date 7/8/2013 5/24/2014 1/2/2015 5/18/2015 5/18/2015 7/5/2015 5/22/2014 5/13/2015Vesting of rights (a) (a) (a) (b) (b) (b) (b) (b)Number of beneficiaries 721 846 13 458 22 15 450 248
Number initially granted 528,690 540,970 25,530 333,750 39,960 20,520 403,417 355,500
Number outstanding as of Jan. 1, 2013 21,890 67,820 750 94,260 1,520 1,920 157,030 244,130
Number forfeited in 2013 2,820 336 1,520 708 43,290Number exercised in 2013 19,260 30,735 59,344 720 44,867 55,670Number of shares issued Number expired in 2013 2,630
Number outstanding as of Dec. 31, 2013 34,265 750 34,580 800 400 111,455 145,170Number exercisable as of Dec. 31, 2013 34,265 750 34,580 800 400 111,455 145,170
Strike price (in €) 66.00 85.57 75.29 78.01 78.97 85.05 101.83 127.58
Fair value at measurement date (in €) 15.37 15.75 11.61 11.19 10.98 12.38 13.62 20.99
Weighted average price of options exercised/shares issued (in €) 131.61 128.03 129.00 128.24 131.97 130.63 130.15 138.62
In consideration for services rendered, the Group grantscertain employees share-based plans settled in shares or cash.
The Group recognises its obligation as services are renderedby beneficiaries, over the period from the grant date tothe vesting date.
• For transactions based on Kering shares, the grant dateis the date at which plans were individually approvedby the Executive Board, in the case of plans prior to May19, 2005, or by the Board of Directors of Kering for plansafter this date.
• For transactions based on Kering Holland NV and PUMAshares, the grant date is the date at which plans wereindividually approved by the Boards of Kering Holland NVand PUMA AG, respectively.
• The vesting date is the date at which all vesting conditionsare satisfied.
Vested rights may only be exercised by beneficiaries atthe end of a lock-in period, the length of which variesdepending on the type of plan.
7.1. Share-based payment transactionssettled in Kering equity instruments
In accordance with the transitional provisions of IFRS 2on equity-settled plans, only those plans issued afterNovember 7, 2002 and not having vested as of January 1,2005 were measured. At December 31, 2013, there wereno longer any plans falling outside the scope of IFRS 2(i.e., plans issued prior to November 7, 2002).
Note 7 – Share-based payment
107
3
2013 Financial Document ~ Kering
CONSOLIDATED FINANCIAL STATEMENTS AS OF DECEMBER 31, 2013 ~ FINANCIAL INFORMATION
03_B_VA_V4 20/02/14 16:54 Page107
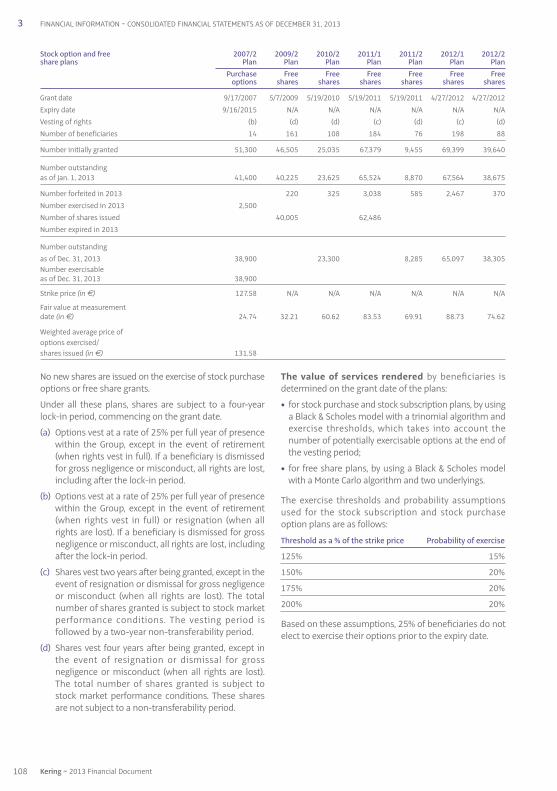
No new shares are issued on the exercise of stock purchaseoptions or free share grants.
Under all these plans, shares are subject to a four-yearlock-in period, commencing on the grant date.
(a) Options vest at a rate of 25% per full year of presencewithin the Group, except in the event of retirement(when rights vest in full). If a beneficiary is dismissedfor gross negligence or misconduct, all rights are lost,including after the lock-in period.
(b) Options vest at a rate of 25% per full year of presencewithin the Group, except in the event of retirement(when rights vest in full) or resignation (when allrights are lost). If a beneficiary is dismissed for grossnegligence or misconduct, all rights are lost, includingafter the lock-in period.
(c) Shares vest two years after being granted, except in theevent of resignation or dismissal for gross negligenceor misconduct (when all rights are lost). The totalnumber of shares granted is subject to stock marketperformance conditions. The vesting period isfollowed by a two-year non-transferability period.
(d) Shares vest four years after being granted, except inthe event of resignation or dismissal for grossnegligence or misconduct (when all rights are lost).The total number of shares granted is subject tostock market performance conditions. These sharesare not subject to a non-transferability period.
The value of services rendered by beneficiaries isdetermined on the grant date of the plans:
• for stock purchase and stock subscription plans, by usinga Black & Scholes model with a trinomial algorithm andexercise thresholds, which takes into account thenumber of potentially exercisable options at the end ofthe vesting period;
• for free share plans, by using a Black & Scholes modelwith a Monte Carlo algorithm and two underlyings.
The exercise thresholds and probability assumptionsused for the stock subscription and stock purchaseoption plans are as follows:
Threshold as a % of the strike price Probability of exercise
125% 15%
150% 20%
175% 20%
200% 20%
Based on these assumptions, 25% of beneficiaries do notelect to exercise their options prior to the expiry date.
Stock option and free 2007 / 2 2009 / 2 2010/2 2011/1 2011/2 2012/1 2012/2share plans Plan Plan Plan Plan Plan Plan Plan Purchase Free Free Free Free Free Free options shares shares shares shares shares shares
Grant date 9/17/2007 5/7/2009 5/19/2010 5/19/2011 5/19/2011 4/27/2012 4/27/2012Expiry date 9/16/2015 N/A N/A N/A N/A N/A N/AVesting of rights (b) (d) (d) (c) (d) (c) (d)Number of beneficiaries 14 161 108 184 76 198 88
Number initially granted 51,300 46,505 25,035 67,379 9,455 69,399 39,640
Number outstanding as of Jan. 1, 2013 41,400 40,225 23,625 65,524 8,870 67,564 38,675
Number forfeited in 2013 220 325 3,038 585 2,467 370Number exercised in 2013 2,500 Number of shares issued 40,005 62,486 Number expired in 2013
Number outstanding as of Dec. 31, 2013 38,900 23,300 8,285 65,097 38,305Number exercisable as of Dec. 31, 2013 38,900
Strike price (in €) 127.58 N/A N/A N/A N/A N/A N/A
Fair value at measurement date (in €) 24.74 32.21 60.62 83.53 69.91 88.73 74.62
Weighted average price of options exercised/shares issued (in €) 131.58
108 Kering ~ 2013 Financial Document
3 FINANCIAL INFORMATION ~ CONSOLIDATED FINANCIAL STATEMENTS AS OF DECEMBER 31, 2013
03_B_VA_V4 20/02/14 16:54 Page108

7.2. Share-based payment transactions settled in equity instruments of subsidiaries
PUMA set up stock subscription option plans based on its own shares for certain employees. The characteristics of theplans still in effect as of December 31, 2013 and their movements during the year are as follows:
2008/I Plan 2008/II Plan 2008/III Plan 2008/IV Plan 2008 / V Plan Subscription Subscription Subscription Subscription Subscription options options options options options
Grant date 7/21/2008 4/14/2009 4/22/2010 4/15/2011 4/30/2012Expiry date 7/20/2013 4/13/2014 4/21/2015 4/21/2016 4/21/2017
Number initially granted 113,000 139,002 126,184 151,290 145,375
Number outstanding as of Jan. 1, 2013 1,500 2,500 98,693 103,463 114,969
Number exercised in 2013 1,000 1,000 Number forfeited/(reinstated) in 2013 500 1,500
Number outstanding as of Dec. 31, 2013 1,500 98,693 103,463 113,469Number exercisable as of Dec. 31, 2013 1,500 98,693 103,463
Weighted average price of options exercised (in €) 220.83 214.57
Rights vest after a two-year period.
The number of shares attributed to beneficiaries is determined based on the share price at the exercise date and thenumber of options exercised. The exercise of options is subject to a PUMA share performance condition.
The above volatilities represent the expected volatilitiesof each plan based on the maturities and strike pricesavailable at the grant date. The dividends used forvaluation purposes are those expected by the market at the grant date.
The risk-free interest rates correspond to the one-to-tenyear interest rate curve for interbank swaps at the grant date.
The total charge recognised in 2013 in respect of stock option and free share plans was €3.1 million(€8.9 million, including €4.9 million shown within“Discontinued operations” in 2012).
The main valuation assumptions for the various plans are summarised below:
Stock option and free 2003/1 Plan 2004/1 Plan 2005/1 Plan 2005/2 Plan 2005 / 3 Planshare plans Subscription Subscription Subscription Subscription Subscription options options options options options
Volatility 33.25% 25.65% 23.75% 21.00% 21.00%Risk-free interest rate 4.08% 4.45% 3.83% 3.49% 3.49%
Stock option and free 2005/4 Plan 2006/1 Plan 2007/1 Plan 2007/2 Plan 2009 / 2 Planshare plans Subscription Purchase Purchase Purchase Free options options options options shares
Volatility 20.50% 23.00% 23.00% 24.50% 40.00%Risk-free interest rate 3.38% 4.08% 4.49% 4.47% 4.06%
Stock option and free 2010/2 Plan 2011/1 Plan 2011/2 Plan 2012/1 Plan 2012 / 2 Planshare plans Free Free Free Free Free shares shares shares shares shares
Volatility 35.00% 28.00% 28.00% 29.00% 29.00%Risk-free interest rate 1.85% 2.32% 2.32% 0.97% 0.97%
109
3
2013 Financial Document ~ Kering
CONSOLIDATED FINANCIAL STATEMENTS AS OF DECEMBER 31, 2013 ~ FINANCIAL INFORMATION
03_B_VA_V4 20/02/14 16:54 Page109

7.3.2. Characteristics of KMUs granted by Kering SA
Since 2013, the Group has granted Kering Monetary Units(KMUs) instead of free shares.
The unit value of the KMUs awarded (and any changes inthat value) is determined based on the intrinsic value ofthe Kering share price in comparison with the averageincrease in a basket of stocks from the Luxury and Sportsindustries. On July 21, 2013, 124,126 KMUs were granted,with a unit value of €152.
Subject to the beneficiaries’ continued presence withinthe Group, the KMUs granted will be settled in cash at theend of the three-year vesting period. The vesting period willbe followed by a two-year period (January to December)during which beneficiaries may opt, in April or October, tocash out some or all of their KMUs, at their discretion,based on the most recently determined value.
The value of services rendered by beneficiaries is recalculatedby an independent expert at the end of each reporting period.
In 2013, the Group recognised a €5.1 million expense inrespect of KMUs within recurring operating income.
Plan movements 2013 2012
SARs outstanding as of January 1 17,204 44,204Weighted average strike price (in €) 79.94 84.59
SARs granted during the year Weighted average strike price (in €)
SARs exercised during the year 200 27,000Weighted average strike price (in €) 82.26 87.55
SARs forfeited during the year Weighted average strike price (in €)
SARs outstanding as of December 31 17,004 17,204Weighted average strike price (in €) 79.91 79.94
SARs exercisable as of December 31 12,000 2,200Weighted average strike price (in €) 79.84 45.32
7.3. Cash-settled share-based payment transactions
The Group (Kering Holland NV and Kering SA) also grantscertain employees Share Appreciation Rights (SARs) and,since 2013, Kering Monetary Units (KMUs) that constitutecash-settled share-based plans.
7.3.1. Characteristics of SARs granted by Kering Holland NV
SAR plans have a term of six to ten years from their grant date.
SARs vest at a rate of 20% per full year of presence in theGroup, except in the event of dismissal (excluding dismissalfor gross negligence or misconduct) when all rights vestimmediately. If an employee is dismissed for grossnegligence or misconduct, all rights are lost.
The SAR strike price is determined by applying financialratios for a basket of comparable companies to the resultsof the Luxury Division.
The value of services rendered by beneficiaries isrecalculated at the end of each reporting period by anindependent expert using an option pricing modelcorresponding to the intrinsic value, to which a timevalue is added.
In 2013, Kering Holland NV recognised a €0.9 millionexpense in respect of SARs within recurring operatingincome (€1.6 million in 2012).
The strike price of SARs outstanding as of December 31, 2013is between €40.18 and €94.85 and the weighted averageremaining contractual term is 1.3 years (2.3 years as ofend-2012).
The carrying amount of the liability relating to these SARswas €3.1 million as of December 31, 2013, with an intrinsicvalue of €2.3 million (€2.3 million and €1.8 million,respectively, as of December 31, 2012).
The value of services rendered by beneficiaries at the grant date is primarily determined on the basis of the following assumptions:
2008 / I Plan 2008 / II Plan 2008 / III Plan 2008 / IV Plan 2008 / V Plan
Volatility 29.10% 47.70% 34.50% 29.20% 26.80%Risk-free interest rate 4.60% 1.97% 1.60% 2.40% 0.30%
In 2013, PUMA recognised an expense of €1.1 million (€2.8 million in 2012).
110 Kering ~ 2013 Financial Document
3 FINANCIAL INFORMATION ~ CONSOLIDATED FINANCIAL STATEMENTS AS OF DECEMBER 31, 2013
03_B_VA_V4 20/02/14 16:54 Page110

The Group’s other non-recurring operating income andexpenses consist of unusual items that could distort theassessment of each brand’s economic performance. The netbalance of this caption was an expense of €442.5 millionin 2013 and included the following items:
• restructuring costs of €29.7 million, mainly concerningthe Luxury Division;
• asset impairment totalling €361.2 million, including€280.1 million charged against PUMA goodwill;
• net capital losses of €1.2 million on asset disposals;
• other income and expenses relating primarily to newbrand acquisition fees, the impacts of the restructuringmeasures put in place at PUMA as part of the newmanagement’s strategy, and litigation and disputeswith third parties (Note 26).
The net balance of this caption was an expense of€25.2 million in 2012 and included the following items:
• restructuring costs of €158.5 million (chiefly relating toPUMA’s restructuring programme);
• asset impairment totalling €53.6 million, including€50.0 million for the Sergio Rossi brand ;
• net capital gains of €232.9 million on asset disposals,chiefly relating to the capital gains from the sale of theresidual interest in Cfao;
• other income and expenses primarily relating to claimsand litigation in relation to third parties.
Note 9 – Other non-recurring operating incomeand expenses
(in € millions) 2013 2012
Non-recurring operating expenses 444.0 (261.3)
Restructuring costs (29.7) (158.5)Asset impairment (361.2) (53.6)Capital losses on disposals (2.7) (0.5)Other (50.4) (48.7)
Non-recurring operating income 1.5 236.1
Capital gains on disposals 1.5 233.4Other 2.7
Total (442.5) (25.2)
Charges to depreciation, amortisation and provisions onnon-current operating assets included in recurringoperating income amounted to €295.8 million in 2013
(€275.1 million in 2012). Other net non-cash operatingincome amounted to €102.7 million in 2013(€16.5 million in 2012).
Note 8 – Recurring operating income
Recurring operating income is the primary indicator of the Group’s operating performance, and breaks down as follows:
(in € millions) 2013 2012
Luxury Division 1,682.6 1,611.6Sport & Lifestyle Division 200.4 304.8Corporate (132.9) (124.9)
Total 1,750.1 1,791.5
111
3
2013 Financial Document ~ Kering
CONSOLIDATED FINANCIAL STATEMENTS AS OF DECEMBER 31, 2013 ~ FINANCIAL INFORMATION
03_B_VA_V4 20/02/14 16:54 Page111

Note 10 – Finance costs (net)
This caption breaks down as follows:
(in € millions) 2013 2012
Cost of net debt (175.8) (211.4)
Income from cash and cash equivalents 9.3 6.7Finance costs at amortised cost (183.3) (196.2)Finance costs on financial liabilities at fair value through income (4.8) (24.3)Gains and losses on borrowings hedged by fair value hedges 2.8 0.3Gains and losses on fair value hedging derivatives 0.2 2.1
Other financial income and expenses (36.5) 63.7
Net losses on available-for-sale financial assets (7.6) (1.0)Gains and losses on financial liabilities at fair value through income 11.5 104.7Foreign exchange gains and losses (17.5) (3.2)Ineffective portion of cash flow hedges (11.3) (26.0)Gains and losses on derivative instruments not qualifying for hedge accounting (foreign exchange and interest rate hedges) 0.5 (2.0)Impact of discounting assets and liabilities (9.0) (6.3)Other finance costs (3.1) (2.5)
Total (212.3) (147.7)
Note 11 – Income taxes
11.1. Analysis of the income tax expense in respect of continuing operations
11.1.1. Income tax expense
(in € millions) 2013 2012
Income before tax 1,095.3 1,618.6
Taxes paid out of operating income (315.7) (361.0)Other taxes payable not impacting operating cash flow (9.0) (5.2)
Income tax payable (324.7) (366.2)Deferred tax income/(expense) 89.3 68.6
Total tax charge (235.4) (297.6)
Effective tax rate 21.49% 18.39%
Income tax expense on dividends was recognised in an amount of €23.6 million in 2013 (€5.7 million in 2012).
112 Kering ~ 2013 Financial Document
3 FINANCIAL INFORMATION ~ CONSOLIDATED FINANCIAL STATEMENTS AS OF DECEMBER 31, 2013
03_B_VA_V4 20/02/14 16:54 Page112

11.1.3. Recurring tax rate
Excluding non-recurring items, the Group income tax rate is as follows:
(in € millions) 2013 2012
Income before tax 1,095.3 1,618.6Non-recurring items (442.5) (25.2)
Recurring income before tax 1,537.8 1,643.8
Total tax charge (235.4) (297.6)Tax on non-recurring items 32.0 62.3
Recurring tax charge (267.4) (359.9)
Recurring tax rate 17.39% 21.89%
In 2013, the income tax rate applicable in France was thestandard rate of 33.33%, plus the social surtax of 3.3%and a 10.7% one-off levy for French companies withrevenue over €250 million, bringing the total to 38%.
As of end-December 2013, permanent differences mainlycomprised impairment losses taken against PUMAgoodwill (see Note 9).
The main changes relate to the "Other" line, which includesthe tax on dividends, the levy on value added paid byFrench companies, and the impact of tax reassessments.
11.1.2. Reconciliation of the tax rate
(as a % of pre-tax income) 2013 2012
Tax rate applicable in France 38.00% 36.10%Impact of taxation of foreign subsidiaries -14.23% -7.12%
Theoretical tax rate 23.77% 28.98%
Effect of items taxed at reduced rates -1.10% 2.12%Effect of permanent differences -1.79% -3.12%Effect of unrecognised temporary differences 0.07% 1.02%Effect of unrecognised tax losses carried forward -3.39% -3.43%Effect of changes in tax rates -0.10% 0.16%Effect of disposal of Cfao -3.34%Other 4.03% -4.00%
Effective tax rate 21.49% 18.39%
113
3
2013 Financial Document ~ Kering
CONSOLIDATED FINANCIAL STATEMENTS AS OF DECEMBER 31, 2013 ~ FINANCIAL INFORMATION
03_B_VA_V4 20/02/14 16:54 Page113

11.2. Movement in statement of financial position headings
11.2.1. Net current tax liabilities
Cash Cash outflows outflows Other Other relating to relating to changes items Net operating investing in Group recognised (in € millions) 2012 income activities activities structure in equity 2013
Current tax receivables 75.7 119.1Current tax liabilities (318.4) (310.1)
Net current tax liabilities (242.7) (315.7) 383.7 - (11.9) (4.4) (191.0)
11.2.2. Deferred tax
Other Other
changes items Net in Group recognised (in € millions) 2012 income structure in equity 2013
Deferred tax assets 600.2 649.9Deferred tax liabilities (2,772.3) (2,810.2)
Deferred tax (2,172.1) 89.3 (74.2) (3.3) (2,160.3)
Other Other
changes items Net in Group recognised (in € millions) 2012 income structure in equity 2013
Intangible assets (2,593.8) 7.0 (52.4) (2,639.2)Property, plant and equipment 15.3 (3.2) (3.1) 9.0Other non-current assets (5.7) (3.6) (3.7) (0.3) (13.3)Other current assets 276.4 44.7 (15.0) 306.1Total equity 10.2 0.7 10.9Borrowings (20.2) (0.5) (20.7)Provisions for pensions and other post-employment benefits 45.1 6.4 1.2 (1.0) 51.7Other provisions 25.1 (7.7) (0.8) 16.6Other current liabilities 65.5 27.0 7.7 (2.0) 98.2Recognised tax losses and tax credits 10.0 18.5 (8.1) 20.4
Net deferred tax assets (liabilities) (2,172.1) 89.3 (74.2) (3.3) (2,160.3)
Deferred tax assets 600.2 649.9Deferred tax liabilities (2,772.3) (2,810.2)
Deferred tax (2,172.1) 89.3 (74.2) (3.3) (2,160.3)
114 Kering ~ 2013 Financial Document
3 FINANCIAL INFORMATION ~ CONSOLIDATED FINANCIAL STATEMENTS AS OF DECEMBER 31, 2013
03_B_VA_V4 20/02/14 16:54 Page114
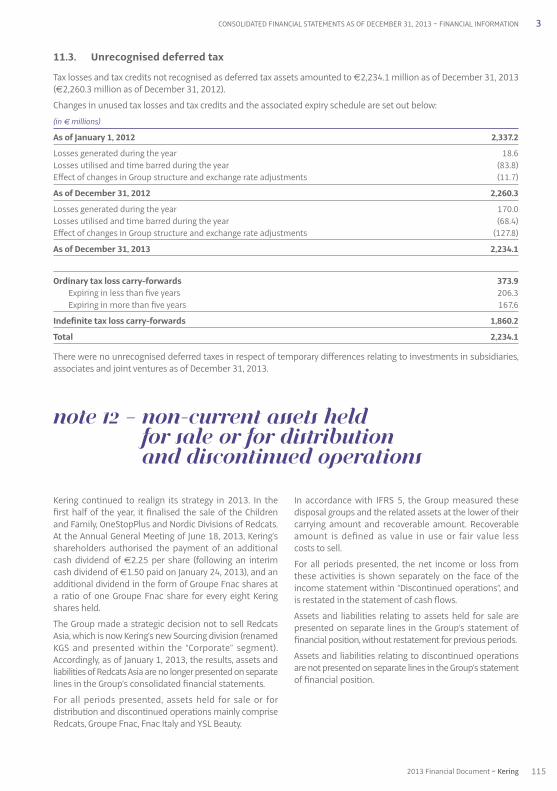
Kering continued to realign its strategy in 2013. In thefirst half of the year, it finalised the sale of the Childrenand Family, OneStopPlus and Nordic Divisions of Redcats.At the Annual General Meeting of June 18, 2013, Kering’sshareholders authorised the payment of an additionalcash dividend of €2.25 per share (following an interimcash dividend of €1.50 paid on January 24, 2013), and anadditional dividend in the form of Groupe Fnac shares ata ratio of one Groupe Fnac share for every eight Keringshares held.
The Group made a strategic decision not to sell RedcatsAsia, which is now Kering’s new Sourcing division (renamedKGS and presented within the “Corporate” segment).Accordingly, as of January 1, 2013, the results, assets andliabilities of Redcats Asia are no longer presented on separatelines in the Group’s consolidated financial statements.
For all periods presented, assets held for sale or fordistribution and discontinued operations mainly compriseRedcats, Groupe Fnac, Fnac Italy and YSL Beauty.
In accordance with IFRS 5, the Group measured thesedisposal groups and the related assets at the lower of theircarrying amount and recoverable amount. Recoverableamount is defined as value in use or fair value less costs to sell.
For all periods presented, the net income or loss fromthese activities is shown separately on the face of theincome statement within “Discontinued operations”, andis restated in the statement of cash flows.
Assets and liabilities relating to assets held for sale arepresented on separate lines in the Group’s statement offinancial position, without restatement for previous periods.
Assets and liabilities relating to discontinued operationsare not presented on separate lines in the Group’s statementof financial position.
11.3. Unrecognised deferred tax
Tax losses and tax credits not recognised as deferred tax assets amounted to €2,234.1 million as of December 31, 2013(€2,260.3 million as of December 31, 2012).
Changes in unused tax losses and tax credits and the associated expiry schedule are set out below:
(in € millions)
As of January 1, 2012 2,337.2
Losses generated during the year 18.6Losses utilised and time barred during the year (83.8)Effect of changes in Group structure and exchange rate adjustments (11.7)
As of December 31, 2012 2,260.3
Losses generated during the year 170.0Losses utilised and time barred during the year (68.4)Effect of changes in Group structure and exchange rate adjustments (127.8)
As of December 31, 2013 2,234.1
Ordinary tax loss carry-forwards 373.9Expiring in less than five years 206.3Expiring in more than five years 167.6
Indefinite tax loss carry-forwards 1,860.2
Total 2,234.1
There were no unrecognised deferred taxes in respect of temporary differences relating to investments in subsidiaries,associates and joint ventures as of December 31, 2013.
Note 12 – Non-current assets held for sale or for distribution and discontinued operations
115
3
2013 Financial Document ~ Kering
CONSOLIDATED FINANCIAL STATEMENTS AS OF DECEMBER 31, 2013 ~ FINANCIAL INFORMATION
03_B_VA_V4 20/02/14 16:54 Page115

The impact of assets held for sale and discontinued operations on the Group’s consolidated statement of financial positionwas as follows:
(in € millions) 2013 2012
Assets classified as held for sale 722.1 3,130.5Liabilities associated with assets classified as held for sale 906.6 2,805.5
Cash flows related to discontinued operations result from therecapitalisation of Groupe Fnac and the collection of the sale
price for assets disposed of in the period, net of the financingprovided for Redcats' operations.
(in € millions) 2013 2012
Net cash from operating activities (154.5) 135.9Net cash from investing activities 517.0 18.6Net cash from financing activities (690.0) 54.1Impact of exchange rate variations 11.5 (1.4)
Net change in cash and cash equivalents (316.0) 207.2
Opening cash and changes in intra-Group cash flows (121.5) (110.1)
Net cash from discontinued operations (1) (437.5) 97.1
(1) Line item in the consolidated statement of cash flows.
In 2013, the Fnac and Redcats groups were the maincontributors to the net loss arising on “Non-current assetsheld for sale or for distribution and discontinued operations”.
In 2013, this item mainly corresponds to the net capital lossof €256 million after the tax effect, share distributioncosts and net loss for the first half of the year recognisedfollowing the distribution of Groupe Fnac shares, as wellas a €562 million net expense in respect of Redcats. Thisamount includes Kering's €315 million recapitalisationundertaking in relation to La Redoute, as well as the
impairment losses recorded against Redcats' residualassets and the disposal gains and losses on activities soldduring the period. It does not include the cost of financingthe social guarantees to be granted to the employeesconcerned by the modernisation measures at La Redouteand Relais Colis. The total cost of this financing, which cannotas yet be reliably estimated, will lead Kering to set up a trustguaranteeing the application of the employee measuresapproved in a majority collective agreement with tradeunions. The associated costs will be recognised in 2014.
Impact on the financial statements
The income statement and statement of cash flows for non-current assets held for sale or for distribution and discontinuedoperations are as follows:
(in € millions) 2013 2012
Revenue 3,083.3 7,077.3Cost of sales (1,782.5) (4,168.5)
Gross margin 1,300.8 2,908.8
Payroll expenses (520.0) (1,066.6)Other recurring operating income and expenses (842.9) (1,655.2)
Recurring operating income (62.1) 187.0
Other non-recurring operating income and expenses (708.4) (437.0)
Operating income (770.5) (250.0)
Finance costs, net (13.6) (35.9)
Income before tax (784.1) (285.9)
Corporate income tax (31.1) (33.0)Share in earnings of associates 0.9 1.5Net income (loss) on disposal of discontinued operations (7.2) 41.9
Net income (821.5) (275.5)o/w attributable to owners of the parent (819.8) (275.5)o/w attributable to non-controlling interests (1.7)
116 Kering ~ 2013 Financial Document
3 FINANCIAL INFORMATION ~ CONSOLIDATED FINANCIAL STATEMENTS AS OF DECEMBER 31, 2013
03_B_VA_V4 20/02/14 16:54 Page116

13.1. Earnings per share
Earnings per share as of December 31, 2013
(in € millions) Consolidated Continuing Discontinued Group operations operations
Net income attributable to ordinary shareholders 49.6 869.4 (819.8)
Weighted average number of ordinary shares outstanding 126,245,102 126,245,102 126,245,102Weighted average number of treasury shares (332,896) (332,896) (332,896)Weighted average number of ordinary shares 125,912,206 125,912,206 125,912,206
Basic earnings per share (in €) 0.39 6.91 (6.52)
Net income attributable to ordinary shareholders 49.6 869.4 (819.8)
Convertible and exchangeable instruments
Diluted net income attributable to owners of the parent 49.6 869.4 (819.8)
Weighted average number of ordinary shares 125,912,206 125,912,206 125,912,206Potentially dilutive ordinary shares 114,760 114,760 114,760Weighted average number of diluted ordinary shares 126,026,966 126,026,966 126,026,966
Fully diluted earnings per share (in €) 0.39 6.90 (6.51)
Earnings per share as of December 31, 2012
(in € millions) Consolidated Continuing Discontinued Group operations operations
Net income attributable to ordinary shareholders 1,048.2 1,323.7 (275.5)
Weighted average number of ordinary shares outstanding 126,174,343 126,174,343 126,174,343Weighted average number of treasury shares (188,871) (188,871) (188,871)Weighted average number of ordinary shares 125,985,472 125,985,472 125,985,472
Basic earnings per share (in €) 8.32 10.51 (2.19)
Net income attributable to ordinary shareholders 1,048.2 1,323.7 (275.5)
Convertible and exchangeable instruments
Diluted net income attributable to owners of the parent 1,048.2 1,323.7 (275.5)
Weighted average number of ordinary shares 125,985,472 125,985,472 125,985,472Potentially dilutive ordinary shares 97,738 97,738 97,738Weighted average number of diluted ordinary shares 126,083,210 126,083,210 126,083,210
Fully diluted earnings per share (in €) 8.31 10.50 (2.19)
Basic earnings per share are calculated on the basis ofthe weighted average number of shares outstanding, afterdeduction of the weighted average number of sharesheld by consolidated companies.
Fully diluted earnings per share are based on the weightedaverage number of shares as defined above for thecalculation of basic earnings per share, plus the weighted
average number of potentially dilutive ordinary shares.Potentially dilutive shares correspond to shares grantedto employees as part of equity-settled share-basedpayment plans (see Note 7).
Earnings are adjusted for the theoretical interest charge,net of tax, on convertible and exchangeable instruments.
Note 13 – Earnings per share
117
3
2013 Financial Document ~ Kering
CONSOLIDATED FINANCIAL STATEMENTS AS OF DECEMBER 31, 2013 ~ FINANCIAL INFORMATION
03_B_VA_V4 20/02/14 16:54 Page117

The amounts of these components before and after the related tax effects, together with reclassification adjustmentstaken to income, are shown in the table below:
(in € millions) Gross Income tax Net
Foreign exchange gains and losses (19.5) (19.5)Cash flow hedges 84.7 12.5 97.2
– change in fair value 44.7 – gains and losses reclassified to income 40.0
Available-for-sale assets (0.1) (0.1)– change in fair value (0.1) – gains and losses reclassified to income
Unrecognised surplus of pension plan assets (4.0) (4.0)Actuarial gains and losses (20.4) 4.3 (16.1)Share in other comprehensive income (expense) of associates 8.7 8.7
Other comprehensive income as of December 31, 2012 49.4 16.8 66.2
The components of other comprehensive income include:
• gains and losses arising from translating the financialstatements of foreign operations ;
• the effective portion of gains and losses on cash flowhedging instruments ;
• gains and losses on remeasuring available-for-salefinancial assets and other financial instruments ;
• components relating to the measurement of employeebenefit obligations: unrecognised surplus of pensionplan assets and actuarial gains and losses on definedbenefit plans.
13.2. Earnings per share from continuing operations excluding non-recurring items
Non-recurring items consist of the income statement line “Other non-recurring operating income and expenses”reported net of tax and non-controlling interests.
(in € millions) 2013 2012
Net income attributable to ordinary shareholders 869.4 1,323.7
Other non-recurring operating income and expenses (442.5) (25.2)Income tax on other non-recurring operating income and expenses 32.0 62.3Non-controlling interests in other non-recurring operating income and expenses 50.6 17.8
Net income excluding non-recurring items 1,229.3 1,268.8
Weighted average number of ordinary shares outstanding 126,245,102 126,174,343Weighted average number of treasury shares (332,896) (188,871)Weighted average number of ordinary shares 125,912,206 125,985,472
Basic earnings per share excluding non-recurring items (in €) 9.76 10.07
Net income excluding non-recurring items 1,229.3 1,268.8
Convertible and exchangeable instruments
Diluted net income attributable to owners of the parent 1,229.3 1,268.8
Weighted average number of ordinary shares 125,912,206 125,985,472Potentially dilutive ordinary shares 114,760 97,738Weighted average number of diluted ordinary shares 126,026,966 126,083,210
Fully diluted earnings per share (in €) 9.75 10.06
Note 14 – Other comprehensive income
118 Kering ~ 2013 Financial Document
3 FINANCIAL INFORMATION ~ CONSOLIDATED FINANCIAL STATEMENTS AS OF DECEMBER 31, 2013
03_B_VA_V4 20/02/14 16:54 Page118

Note 15 – Goodwill
(in € millions) Gross Impairment Net losses
Goodwill as of January 1, 2012 4,302.9 (88.0) 4,214.9
Acquisitions 117.6 117.6Non-current assets held for sale or for distribution and discontinued operations (433.2) 29.5 (403.7)Impairment losses Put options granted to non-controlling shareholders (47.0) (47.0)Translation adjustments (10.8) (10.8)Other movements (0.3) 0.3
Goodwill as of December 31, 2012 3,929.2 (58.2) 3,871.0
Acquisitions 172.2 172.2Non-current assets held for sale or for distribution and discontinued operations Impairment losses (see Note 18) (280.1) (280.1)Put options granted to non-controlling shareholders 38.4 38.4Translation adjustments (30.9) 1.0 (29.9)Other movements (1.5) (1.5)
Goodwill as of December 31, 2013 4,107.4 (337.3) 3,770.1
All goodwill recognised in 2013 was allocated to CGUs at year-end.
The breakdown of the net amount of goodwill by activity and brand is as follows:
(in € millions) 2013 2012
Luxury Division 2,523.4 2,319.5Sport & Lifestyle Division 1,246.7 1,551.5
Total 3,770.1 3,871.0
A negative amount on the “Gains and losses reclassifiedto income” line item corresponds to a gain recognised inthe income statement.
Gains and losses on cash flow hedging instrumentsreclassified to income are recognised under gross margin.
Gains and losses on available-for-sale financial assetsreclassified to income are recognised under net finance costs.
(in € millions) Gross Income tax Net
Foreign exchange gains and losses (111.4) (111.4)Cash flow hedges 34.0 (4.3) 29.7
– change in fair value 129.2 – gains and losses reclassified to income (95.2)
Available-for-sale assets 4.7 (1.6) 3.1– change in fair value 4.7 – gains and losses reclassified to income
Unrecognised surplus of pension plan assets 7.1 7.1Actuarial gains and losses 2.7 (0.9) 1.8Share in other comprehensive income (expense) of associates
Other comprehensive income as of December 31, 2013 (62.9) (6.8) (69.7)
119
3
2013 Financial Document ~ Kering
CONSOLIDATED FINANCIAL STATEMENTS AS OF DECEMBER 31, 2013 ~ FINANCIAL INFORMATION
03_B_VA_V4 20/02/14 16:54 Page119

Note 16 – Brands and other intangible assets
(in € millions) Brands Other Total intangible assets
Gross amount as of December 31, 2012 10,341.3 611.3 10,952.6
Changes in Group structure 230.0 9.6 239.6Acquisitions 0.4 82.6 83.0Other disposals (11.0) (11.0)Translation adjustments (16.6) (6.4) (23.0)Other movements 0.9 (26.4) (25.5)
Gross amount as of December 31, 2013 10,556.0 659.7 11,215.7
Accumulated amortisation and impairment as of December 31, 2012 (85.3) (377.4) (462.7)
Changes in Group structure (6.3) (6.3)Other disposals 9.7 9.7Amortisation (83.2) (83.2)Impairment losses (see Note 18) Translation adjustments 2.6 2.6Other movements (0.7) 27.7 27.0
Accumulated amortisation and impairment as of December 31, 2013 (86.0) (426.9) (512.9)
Carrying amount as of December 31, 2012 10,256.0 233.9 10,489.9
Changes in Group structure 230.0 3.3 233.3Acquisitions 0.4 82.6 83.0Other disposals (1.3) (1.3)Amortisation (83.2) (83.2)Impairment losses (see Note 18) Translation adjustments (16.6) (3.8) (20.4)Other movements 0.2 1.3 1.5
Carrying amount as of December 31, 2013 10,470.0 232.8 10,702.8
120 Kering ~ 2013 Financial Document
3 FINANCIAL INFORMATION ~ CONSOLIDATED FINANCIAL STATEMENTS AS OF DECEMBER 31, 2013
03_B_VA_V4 20/02/14 16:54 Page120
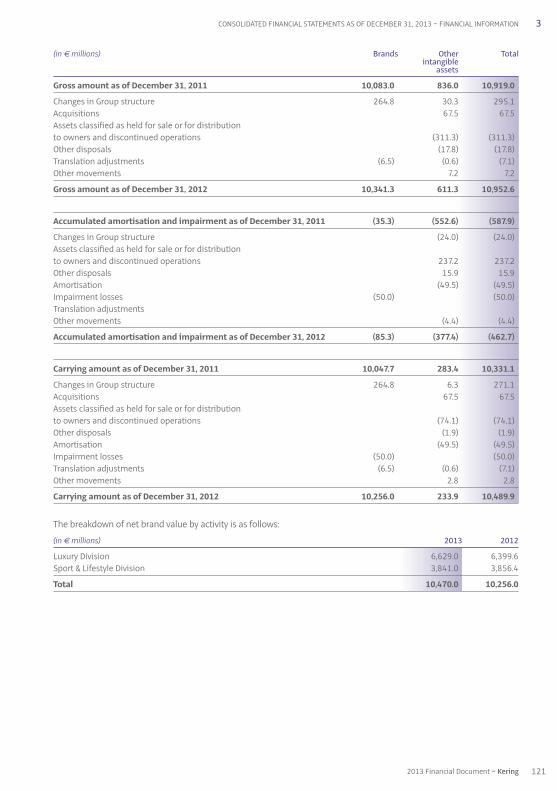
(in € millions) Brands Other Total intangible assets
Gross amount as of December 31, 2011 10,083.0 836.0 10,919.0
Changes in Group structure 264.8 30.3 295.1Acquisitions 67.5 67.5Assets classified as held for sale or for distribution to owners and discontinued operations (311.3) (311.3)Other disposals (17.8) (17.8)Translation adjustments (6.5) (0.6) (7.1)Other movements 7.2 7.2
Gross amount as of December 31, 2012 10,341.3 611.3 10,952.6
Accumulated amortisation and impairment as of December 31, 2011 (35.3) (552.6) (587.9)
Changes in Group structure (24.0) (24.0)Assets classified as held for sale or for distribution to owners and discontinued operations 237.2 237.2Other disposals 15.9 15.9Amortisation (49.5) (49.5)Impairment losses (50.0) (50.0)Translation adjustments Other movements (4.4) (4.4)
Accumulated amortisation and impairment as of December 31, 2012 (85.3) (377.4) (462.7)
Carrying amount as of December 31, 2011 10,047.7 283.4 10,331.1
Changes in Group structure 264.8 6.3 271.1Acquisitions 67.5 67.5Assets classified as held for sale or for distribution to owners and discontinued operations (74.1) (74.1)Other disposals (1.9) (1.9)Amortisation (49.5) (49.5)Impairment losses (50.0) (50.0)Translation adjustments (6.5) (0.6) (7.1)Other movements 2.8 2.8
Carrying amount as of December 31, 2012 10,256.0 233.9 10,489.9
The breakdown of net brand value by activity is as follows:
(in € millions) 2013 2012
Luxury Division 6,629.0 6,399.6Sport & Lifestyle Division 3,841.0 3,856.4
Total 10,470.0 10,256.0
121
3
2013 Financial Document ~ Kering
CONSOLIDATED FINANCIAL STATEMENTS AS OF DECEMBER 31, 2013 ~ FINANCIAL INFORMATION
03_B_VA_V4 20/02/14 16:54 Page121

Note 17 – Property, plant and equipment
(in € millions) Land and Plant and Other Total buildings equipment PP&E
Gross amount as of December 31, 2012 752.8 1,700.7 275.3 2,728.8
Changes in Group structure 17.1 41.0 (0.2) 57.9Acquisitions 207.7 325.8 50.9 584.4Assets classified as held for sale to owners and discontinued operations 0.7 8.3 9.0Disposals (97.3) (19.7) (117.0)Translation adjustments (27.0) (79.2) (14.3) (120.5)Other movements 16.6 51.4 (52.0) 16.0
Gross amount as of December 31, 2013 967.2 1,943.1 248.3 3,158.6
Accumulated depreciation and impairment as of December 31, 2012 (188.1) (1,027.6) (136.8) (1,352.5)
Changes in Group structure (7.2) (22.8) (30.0)Assets classified as held for sale to owners and discontinued operations 0.2 0.2Disposals 89.5 19.9 109.4Depreciation (26.1) (208.5) (21.1) (255.7)Impairment losses (see Note 18) Translation adjustments 4.2 46.5 7.2 57.9Other movements (0.3) (14.1) 3.4 (11.0)
Accumulated depreciation and impairment as of December 31, 2013 (217.5) (1,136.8) (127.4) (1,481.7)
Carrying amount as of December 31, 2012 564.7 673.1 138.5 1,376.3
Changes in Group structure 9.9 18.2 (0.2) 27.9Acquisitions 207.7 325.8 50.9 584.4Assets classified as held for sale to owners and discontinued operations 0.9 8.3 9.2Disposals (7.8) 0.2 (7.6)Depreciation (26.1) (208.5) (21.1) (255.7)Impairment losses (see Note 18) Translation adjustments (22.8) (32.7) (7.1) (62.6)Other movements 16.3 37.3 (48.6) 5.0
Carrying amount as of December 31, 2013 749.7 806.3 120.9 1,676.9
o/w assets owned outright 691.1 806.3 120.2 1,617.6o/w assets held under finance leases 58.6 0.7 59.3
122 Kering ~ 2013 Financial Document
3 FINANCIAL INFORMATION ~ CONSOLIDATED FINANCIAL STATEMENTS AS OF DECEMBER 31, 2013
03_B_VA_V4 20/02/14 16:55 Page122

(in € millions) Land and Plant and Other Total buildings equipment PP&E
Gross amount as of December 31, 2011 680.4 2,193.8 283.6 3,157.8
Changes in Group structure 59.8 47.1 0.2 107.1Acquisitions 5.6 269.9 110.8 386.3Assets classified as held for sale or for distribution to owners and discontinued operations (755.9) (52.0) (807.9)Disposals 2.5 (78.0) (26.2) (101.7)Translation adjustments (1.5) (26.6) (2.4) (30.5)Other movements 6.0 50.4 (38.7) 17.7
Gross amount as of December 31, 2012 752.8 1,700.7 275.3 2,728.8
Accumulated depreciation and impairment as of December 31, 2011 (160.5) (1,473.7) (151.6) (1,785.8)
Changes in Group structure (5.4) (36.3) (41.7)Assets classified as held for sale or for distribution to owners and discontinued operations 594.8 16.5 611.3Disposals 0.2 63.7 24.5 88.4Depreciation (21.7) (183.0) (28.7) (233.4)Impairment losses (see Note 18) Translation adjustments 0.7 16.0 1.5 18.2Other movements (1.4) (9.1) 1.0 (9.5)
Accumulated depreciation and impairment as of December 31, 2012 (188.1) (1,027.6) (136.8) (1,352.5)
Carrying amount as of December 31, 2011 519.9 720.1 132.0 1,372.0
Changes in Group structure 54.4 10.8 0.2 65.4Acquisitions 5.6 269.9 110.8 386.3Assets classified as held for sale or for distribution to owners and discontinued operations (161.1) (35.5) (196.6)Disposals 2.7 (14.3) (1.7) (13.3)Depreciation (21.7) (183.0) (28.7) (233.4)Impairment losses (see Note 18) Translation adjustments (0.8) (10.6) (0.9) (12.3)Other movements 4.6 41.3 (37.7) 8.2
Carrying amount as of December 31, 2012 564.7 673.1 138.5 1,376.3
o/w assets owned outright 514.4 673.1 136.4 1,323.9o/w assets held under finance leases 50.3 2.1 52.4
Charges to depreciation are recognised under “Cost of sales” and “Other recurring operating income and expenses” in the income statement.
123
3
2013 Financial Document ~ Kering
CONSOLIDATED FINANCIAL STATEMENTS AS OF DECEMBER 31, 2013 ~ FINANCIAL INFORMATION
03_B_VA_V4 20/02/14 16:55 Page123
18.2. Impairment tests on major items
In the case of the Gucci CGU, which accounts for a significantportion of the goodwill in the Luxury Division, the CGU’srecoverable amount was determined on the basis of itsvalue in use. Value in use is determined with respect toprojected future cash flows, taking into account the timevalue and specific risks associated with the CGU. Futurecash flow projections were prepared during the secondhalf of the year on the basis of budgets and medium-term plans with a four-year timescale. To calculate value inuse, a terminal value equal to the perpetual capitalisationof a normative annual cash flow is added to the estimatedfuture cash flows.
The growth rate used to extrapolate projected cash flowsto perpetuity is 3.5%.
The pre-tax discount rate applied to projected cash flowsis 8.9%.
In the case of the Gucci brand, which is the highest-valued brand in the Luxury Division, the value based onfuture royalty revenue receivable on the assumption thatthe brand will be operated under licence by a third partywas calculated using a royalty rate of 15.0%, a 3.5% perpetualgrowth rate and a 9.2% pre-tax discount rate.
In the case of the PUMA CGU, which accounts for asignificant portion of the goodwill in the Sport & LifestyleDivision, the CGU’s recoverable amount was determinedon the basis of its value in use. Value in use is determinedwith respect to projected future cash flows, taking intoaccount the time value and specific risks associated withthe CGU. Future cash flow projections were prepared
during the second half of the year on the basis of budgetsand medium-term plans with a four-year timescale. Tocalculate value in use, a terminal value equal to theperpetual capitalisation of a normative annual cash flowis added to the estimated future cash flows.
The growth rate used to extrapolate projected cash flowsto perpetuity is 2.5%.
The pre-tax discount rate applied to projected cash flowsis 10.2%.
For information purposes, PUMA’s market capitalisationwas €3.5 billion as of December 31, 2013. This valuationdoes not represent a relevant indication of impairment giventhe limited free float and resulting lack of liquidity of thePUMA share. As of December 31, 2013, Kering holds an85.81% controlling interest in PUMA.
In the case of the PUMA brand, which is the highest-valuedbrand in the Sport & Lifestyle Division, the value based onfuture royalty revenue receivable on the assumption thatthe brand will be operated under licence by a third partywas calculated using a royalty rate of 8.0%, a 2.5% perpetualgrowth rate and a 10.1% pre-tax discount rate.
The impairment tests carried out by the Group in 2013gave rise to the recognition of an impairment loss againstPUMA goodwill amounting to €280.1 million (see Note18.3). Besides the PUMA goodwill impairment loss, theGroup considers that, based on events that are foreseeablewithin reason, any changes impacting the key assumptionsdescribed below would not give rise to the recognition ofimpairment against other CGUs.
18.1. Assumptions underlying impairment tests
The pre-tax discount and perpetual growth rates applied to expected cash flows in connection with the economicassumptions and forecast operating conditions retained by the Group are as follows:
Discount rate Perpetual growth rate2013 2012 2013 2012
Luxury Division 8.9%-10.4% 9.5%-12.5% 3.5% 3.5%Sport & Lifestyle Division 10.1%-12.2% 10.9%-13.2% 2.5% 2.5%
The growth rates are appropriate in view of the country mix (the Group now operates in regions whose markets areenjoying faster-paced growth than in Europe), the rise in the cost of raw materials and inflation.
As discussed in Note 2.10, the business plans for certain CGUs are drawn up over longer periods of 10 years. These CGUscurrently being repositioned are Boucheron, Sergio Rossi, Volcom, Brioni and Sowind.
The principles governing the impairment of non-financialassets are set out in Note 2.10.
The main items of goodwill, brands and other intangibleassets are broken down by activity in Notes 15 and 16.
Note 18 – Impairment tests on non-financial assets
124 Kering ~ 2013 Financial Document
3 FINANCIAL INFORMATION ~ CONSOLIDATED FINANCIAL STATEMENTS AS OF DECEMBER 31, 2013
03_B_VA_V4 20/02/14 16:55 Page124

Note 20 – Non-current financial assets
Non-current financial assets break down as follows:
(in € millions) 2013 2012
Non-consolidated investments 74.7 53.9Derivative financial instruments (see Note 29) 0.4 12.4Available-for-sale financial assets 74.7 10.3Loans and receivables due from non-consolidated investments 21.6 34.5Deposits and guarantees 116.1 110.5Other 29.3 52.1
Total 316.8 273.7
As of December 31, 2013, investments in associatesmainly comprised the investments in Wilderness furtherto the sale during second-half 2012 of the entire residualinterest in Cfao (i.e., 42%).
The market value of the Group’s interest in Wildernessamounts to €17.3 million. Wilderness’ consolidatedfinancial statements are available on its website, athttp://www.wilderness-holdings.com.
Note 19 – Investments in associates
(in € millions) 2013 2012
Investments in associates 17.3 25.8
Sensitivity to a rise of 10 basis points in the post-taxdiscount rate and a decrease of 10 basis points in theperpetual growth rate and in the normative cash flowsconcerns the PUMA CGU only.
18.3. Impairment losses recognised during the period
The impairment tests carried out by the Group in 2013 ledto the recognition of an impairment loss against PUMAgoodwill totalling €280.1 million.
This loss reflects the difference between the carryingamount of the PUMA CGU and its recoverable amount andis recognised in the income statement under “Other non-recurring operating income and expenses” (see Note 9).
The impairment tests carried out by the Group in 2012led to the recognition of an impairment loss on the brandSergio Rossi totalling €50.0 million. Historic goodwill waswritten down in full in 2010.
The sensitivity to changes in key assumptions is shown below:
(in € millions) Impairment loss due to: Value of intangible net 10 basis point 10 basis point 10 basis point assets concerned at increase in post-tax decrease in perpetual decrease in normative Dec. 31, 2013 discount rate growth rate cash flows
Luxury CGU 9,354 - - -
Sport & Lifestyle CGU 5,102 87 71 40
Gucci brand 4,800 - - -
PUMA brand 3,500 - - -
125
3
2013 Financial Document ~ Kering
CONSOLIDATED FINANCIAL STATEMENTS AS OF DECEMBER 31, 2013 ~ FINANCIAL INFORMATION
03_B_VA_V4 20/02/14 16:55 Page125
Note 21 – Inventories
(in € millions) 2013 2012
Commercial inventories 1,996.5 1,940.6Industrial inventories 377.7 348.2
Gross amount 2,374.2 2,288.8
Allowances (568.7) (552.3)
Carrying amount 1,805.5 1,736.5
Movements in allowances 2013
As of January 1 (552.3)
Additions (39.3)Reversals 7.3Changes in Group structure (2.4)Assets classified as held for sale to owners and discontinued operationsTranslation adjustments 18.0
As of December 31 (568.7)
The carrying amount of inventories pledged to secure liabilities was €0.7 million as of December 31, 2013 (€103.0 millionas of December 31, 2012). The amount of inventories recognised during the period under “ Cost of sales ” is €127.8 million.
Note 22 – Trade receivables
(in € millions) 2013 2012
Trade receivables 1,036.4 1,083.2Allowances (86.5) (97.9)
Carrying amount 949.9 985.3
Movements in allowances 2013
As of January 1 (97.9)
Net reversals 10.3Changes in Group structureAssets classified as held for sale to owners and discontinued operations (0.5)Translation adjustments 1.6
As of December 31 (86.5)
Provisions are calculated on the basis of the probability of recovering the receivables concerned. Trade receivablesbreak down by age as follows:
(in € millions) 2013 2012
Not past due 787.9 801.4Less than one month past due 124.4 132.0One to six months past due 54.6 65.8More than six months past due 69.5 84.0Allowance for doubtful receivables (86.5) (97.9)
Carrying amount 949.9 985.3
No trade receivables were pledged to secure liabilities as of December 31, 2013 (€54.1 million pledged as of December 31, 2012).
126 Kering ~ 2013 Financial Document
3 FINANCIAL INFORMATION ~ CONSOLIDATED FINANCIAL STATEMENTS AS OF DECEMBER 31, 2013
03_B_VA_V4 20/02/14 16:55 Page126

As of December 31, 2013, the share capital amounted to€504,907,044, comprising 126,226,761 fully paid-upshares with a par value of €4 each (126,116,702 shareswith a par value of €4 each as of December 31, 2012).
24.1. Kering treasury shares and optionson Kering shares
In 2013, treasury shares increased by 35,508 as a resultof the following transactions:
• the acquisition of 1,585,556 shares under the liquidityagreement ;
• the disposal of 1,585,556 shares under the liquidityagreement ;
• the acquisition of 106,000 Kering shares to be allottedto employees under 2009 and 2011 free share plans ;
• the allotment of 102,491 shares to employees underthe May 2009 and May 2011 free share plans maturingin May 2013 and 450 shares under the 2008 and 2009free share plans ;
• the acquisition of 130,000 Kering shares to be allottedto employees under the 2006 and 2007 stock purchaseoption plans ;
• the disposal of 103,037 shares to employees under the2006 and 2007 stock purchase option plans ;
• the acquisition of 720,000 shares as part of an externalgrowth transaction ;
• the tender of 714,514 shares as part of an externalgrowth transaction and the allocation of the remaining5,486 shares acquired to be allotted under stock purchaseoption plans.
As a result of the various stock subscription options exercisedin 2013, the share capital increased by 110,059 shares.
As of December 31, 2013, Kering’s share capital thereforecomprises 126,226,761 shares with a par value of €4 each.
On May 26, 2004, Kering signed an agreement with afinancial broker in order to improve the liquidity of theGroup’s shares and ensure share price stability. Thisagreement complies with the Professional Code ofConduct drawn up by the French Association of Financialand Investment Firms (Association française des marchésfinanciers – AMAFI) and approved by the French financialmarkets authority (Autorité des Marchés Financiers – AMF).The agreement was initially endowed with €40 million, halfof which was provided in cash and half in Kering shares.An additional €20 million in cash was allocated to theagreement on September 3, 2004, and a further€30 million on December 18, 2007.
As of December 31, 2013, Kering did not hold any treasuryshares in connection with the liquidity agreement (notreasury shares were held under the agreement as ofDecember 31, 2012). Outside the scope of the liquidityagreement, Kering held 60,581 treasury shares (25,073treasury shares held as of December 31, 2012).
Note 24 – Equity
Other current financial assets and liabilities primarilycomprise derivative financial instruments (see Note 29).
Given the nature of its activities, the Group’s exposure tocustomer default would not have a material impact on itsbusiness, financial position or net assets.
Note 23 – Other current assets and liabilities
Working Changes in Translation capital Other Group adjustments (in € millions) 2012 cash flows cash flows structure and other 2013
Inventories 1,736.5 92.9 85.4 (109.3) 1,805.5Trade receivables 985.3 6.8 24.3 (66.5) 949.9Other current financial assets and liabilities (120.9) (9.1) 24.5 (105.5)Current tax receivables/payables (242.7) 68.0 (11.9) (4.4) (191.0)Trade payables (684.5) (69.3) (20.6) 8.3 (766.1)Other (905.7) 44.1 4.9 (7.2) 15.0 (848.9)
Other current assets and liabilities 768.0 74.5 63.8 70.0 (132.4) 843.9
127
3
2013 Financial Document ~ Kering
CONSOLIDATED FINANCIAL STATEMENTS AS OF DECEMBER 31, 2013 ~ FINANCIAL INFORMATION
03_B_VA_V4 20/02/14 16:55 Page127

In accordance with the laws and practices in eachcountry, Group employees receive long-term or post-employment benefits in addition to their short-termremuneration. These additional benefits take the form ofdefined contribution or defined benefit plans.
Under defined contribution plans, the Group is not obligedto make any additional payments beyond contributionsalready made. Contributions to these plans are expensedas incurred.
An actuarial valuation of defined benefit plans is carriedout by independent experts. These benefits primarilyconcern retirement termination payments and long-servicebonuses in France, final salary type supplementarypension plans in the United Kingdom, statutory dismissalcompensation in Italy (TFR), and mandatory supplementarypension plans (LPP) in Switzerland.
• retirement termination payments and long-service bonuses – France
In France, retirement termination payments are fixed andpaid by the company to the employee on retirement. Theamount paid depends on the years of service on retirementand is defined in the relevant collective bargainingagreements.
Payments under retirement plans do not confer any vestedentitlement to employees until they reach retirement age(unvested rights).
Termination payments are not related to other statutoryretirement benefits such as pensions paid by social securitybodies or top-up pension funds such as ARRCO and AGIRCin France.
Long-service bonuses are not compulsory in France (thereis no legal option to pay such awards to employees), buthold a symbolic value. Nevertheless, Kering’s French entitieschoose to pay long-service bonuses after 20, 30, 35 and40 years of service.
• final salary type supplementary pension plans – UK
In the UK, the Group operates two pension plans: a standardplan and a special plan for managerial-grade employees(cadres).
These plans are subject to the minimum fundingrequirement introduced in the UK by the Pensions Act2004. The value of the plans is assessed at least onceevery three years to determine if the minimum fundingrequirement is satisfied.
The plans are managed by a Board of Trustees appointedby plan participants. The Board is responsible forobtaining plan valuations, fixing the desired fundingthreshold and the contributions payable by the Company,managing benefit payments, investing plan assets, anddetermining the plan’s investment strategy afterconsulting with the Company.
• statutory dismissal compensation (TFR) – Italy
The TFR (Trattamento di Fine Rapporto) plans in Italy werecreated by Act no. 297 adopted on May 29, 1982.
They offer a deferred benefit and are applicable to all workersin the private sector.
Payments are due under these plans on termination ofemployment. The benefits paid are the same regardlessof the reason for departure (resignation, termination atthe employer’s initiative, death, incapacity, retirement).
Since 2007, companies with at least 50 employees (i.e., mostKering group entities in Italy) are required to transfer theirTFR funding to an external fund manager.
• mandatory supplementary pension plans(LPP) – Switzerland
In Switzerland, pension plans are defined contribution planswhich guarantee a minimum yield and provide for a fixedsalary conversion rate on retirement.
The pension plan operated by each entity in Switzerland offersbenefits over and above those stipulated in the LPP/BVGpension law, which contains a minimum requirement forSwiss companies to sponsor pension plans.
Note 25 – Employee benefits
24.2. Appropriation of 2013 net income
At its February 20, 2014 meeting, the Board decided thatat the Annual General Meeting to be held to approve thefinancial statements for the year ended December 31,2013 it will ask shareholders to approve a cash paymentfor the 2013 dividend, corresponding to €3.75 per share.
An interim dividend in the amount of €1.50 per sharewas paid on January 24, 2014 pursuant to a decision bythe Board of Directors on December 20, 2013.
If this dividend is approved, the total dividend cashpayout – to be made in 2014 – would amount to€473.4 million.
The cash dividend paid in respect of 2012 was €3.75 pershare and the dividend paid in kind was in the form of GroupeFnac shares at a ratio of one Groupe Fnac share for everyeight Kering shares held (€313.9 million including Keringtreasury shares).
128 Kering ~ 2013 Financial Document
3 FINANCIAL INFORMATION ~ CONSOLIDATED FINANCIAL STATEMENTS AS OF DECEMBER 31, 2013
03_B_VA_V4 20/02/14 16:55 Page128

25.1. Changes during the year
Changes in the present value of the defined benefit obligation and fair value of plan assets in the year are shown below:
(in € millions) 2013 Other Present Fair value compre- value of plan Financial hensive Expense of obligation assets position Change Provision income recognised
As of January 1 439.6 223.7 215.9 15.6 231.5
Current service cost 9.3 9.3 9.3 (9.3)Curtailments and settlements (1.0) (1.0) 1.0Interest cost 5.4 5.4 5.4 (5.4)Interest income on plan assets 2.3 (2.3) (2.3) 2.3Past service cost (0.7) (0.7) 0.7 Actuarial gains and losses
Impact of changes in demographic assumptions 3.8 3.8 3.8 (3.8) Impact of changes in financial assumptions (3.3) (3.3) (3.3) 3.3 Impact of experience adjustments (4.8) (4.8) (4.8) 4.8 Return on plan assets
(excluding interest income) 2.9 (2.9) (2.9) 2.9 Effect of asset ceiling (7.1) (7.1) 7.1
Benefits paid (9.8) (4.3) (5.5) (5.5) Contributions paid by beneficiaries 3.4 3.4 Contributions paid by employer 5.3 (5.3) (5.3) Changes in Group structure (115.6) (15.6) (100.0) 0.1 (99.9) Non-current assets held for sale or fordistribution and discontinued operations 6.0 0.4 5.6 5.6 (4.5) (3.0)Insurance premium for risks benefits (0.8) (0.8) 0.8Adminstrative expense (0.3) 0.3 0.3 (0.3)Exchange differences (2.6) (1.3) (1.3) (1.3)
As of December 31 328.9 214.7 114.2 9.3 123.5 9.8 (13.9)
o/w continuing operations 100 (10.9)o/w discontinued operations 23.5 (3.0)
Most of the Group’s pension plans in Switzerland areoperated as separate legal entities. The Board of Trusteesof the foundation, comprising an equal number ofemployer and employee representatives, is responsiblefor administering the plan. The foundation bears anyinvestment and longevity risks.
Other plans operated by the Group’s Swiss entities areaffiliated to two different plans, or collective foundations.The pensions committee is responsible for supervising
the plan, and comprises an equal number of employerand employee representatives. The foundation bears anyinvestment and longevity risks and insures some of itsrisk with an insurance company.
The large majority of plans operated by Kering groupcompanies in Switzerland are currently over-fundedcompared to local practices and no additional funding istherefore required.
129
3
2013 Financial Document ~ Kering
CONSOLIDATED FINANCIAL STATEMENTS AS OF DECEMBER 31, 2013 ~ FINANCIAL INFORMATION
03_B_VA_V4 20/02/14 16:55 Page129
As of December 31, 2013, the present value of the obligationamounted to €328.9 million, breaking down as:
• €76.5 million in respect of wholly unfunded plans(€115.2 million as of end-2012);
• €252.4 million in respect of fully or partially funded plans(€324.4 million as of end-2012).
(in € millions) 2012 Other Present Fair value compre- value of plan Financial hensive Expense
of obligation assets position Change Provision income recognised
As of January 1 385.7 202.7 183.0 12.0 195.0
Current service cost 14.5 14.5 14.5 (14.5)Curtailments and settlements (23.2) (15.4) (7.8) (7.8) 6.9Interest cost 16.2 16.2 16.2 (16.3)Interest income on plan assets 8.9 (8.9) (8.9) 8.9Past service cost (0.7) (0.7) 0.9Actuarial gains and losses Impact of changes
in demographic assumptions 0.7 0.7 0.7 (0.6) (0.1) Impact of changes in financial assumptions 17.6 17.6 17.6 (17.5) (0.1) Impact of experience adjustments 12.3 12.3 12.3 (12.1) (0.2) Return on plan assets
(excluding interest income) 9.8 (9.8) (9.8) 9.8 Effect of asset ceiling 4.0 4.0 (4.0)
Benefits paid (22.2) (17.4) (4.8) (4.8) Contributions paid by beneficiaries 4.3 4.3 Contributions paid by employer 12.5 (12.5) (12.5) Changes in Group structure 30.2 15.2 15.0 (0.1) 14.9 Non-current assets held for sale or for distribution and discontinued operations (1.1) (0.8) (0.3) 0.1 (0.2) Reclassifications (0.4) (0.4) 0.3 (0.1) Exchange differences 5.0 3.9 1.1 1.1
As of December 31 439.6 223.7 215.9 15.6 231.5 (24.4) (14.5)
o/w continuing operations 104.8 (10.5)o/w discontinued operations 126.8 (4.0)
130 Kering ~ 2013 Financial Document
3 FINANCIAL INFORMATION ~ CONSOLIDATED FINANCIAL STATEMENTS AS OF DECEMBER 31, 2013
03_B_VA_V4 20/02/14 16:55 Page130

Based on the actuarial assumptions in the table above,the sensitivity tests carried out show that the impact of a50 basis-point increase or decrease in the discount ratewould not be material and would represent less than0.2% of consolidated equity.
The Group’s discount rate is determined by reference tothe yield on corporate bonds rated AA with a maturitysimilar to the plans in question.
25.2. Actuarial assumptions
The main actuarial assumptions used to estimate the Group’s obligations are as follows:
France Switzerland Italy UK2013 2012 2013 2012 2013 2012 2013 2012
Average maturity of plans 11.1 11.1 18.3 18.3 14.6 14.6 15.3 15.3Discount rate 3.25% 3.50% 2.30% 2.00% 3.25% 3.50% 4.08% 4.35%Expected rate of increase in salaries 2.90% 2.95% 1.90% 1.85% 3.00% 2.00% 4.30% (1) 4.00% (1)
Inflation rate 2.00% 2.00% 0.60% 0.60% 2.00% 2.00% 3.20% 3.00%
(1) Only applicable to current employees.
Funded defined benefit plan assets break down as follows :
• debt instruments account for 51.2%, or €109.8 million(57.8%, or €129.4 million at end-2012);
• equity instruments account for 26.0%, or €55.9 million(22.7%, or €50.9 million at end-2012);
• insurance policies account for 6.1%, or €13.0 million, andinvestment funds 7.3%, or €15.5 million (15% of the totalfair value of plan assets, or €33.5 million, at end-2012);
• real estate accounts for 4.8%, or €10.4 million ;
• other assets account for 4.6%, or €10.3 million (4.5%,or €9.9 million at end-2012).
In accordance with the option provided under IAS 19 asrevised in December 2004 and the obligation set out inIAS 19R effective as of January 1, 2013, the Grouprecognises actuarial gains and losses on defined benefitplans in other comprehensive income for the period.
In 2013, actuarial losses were recognised for a total of€2.7 million (see Note 14).
Cumulative actuarial gains and losses recognised in othercomprehensive income since January 1, 2004 amountedto €102.9 million as of December 31, 2013.
The breakdown in the present value of the obligation by type of plan and country as of December 31, 2013 was as follows:
(in € millions) 2013 2012
Retirement gratuities – France 43.1 96.1Long-service awards – France 0.3 2.5Statutory termination indemnities (TFR) – Italy 31.3 29.9Supplementary plans – United Kingdom 141.9 132.7Supplementary plans (LPP) – Switzerland 77.6 91.7Other 34.7 86.7
Present value of obligation as of December 31 328.9 439.6
The Group expects to pay an estimated €8.5 million in contributions in 2014.
(in € millions) Total 2013 France Switzerland Italy UK Other
Employer contributions in respect of 2014 8.5 0.5 3.7 1.6 0.7 2.0
Benefits
2014 11.8 0.5 3.3 1.6 4.9 1.52015 11.8 0.9 2.9 1.5 5.3 1.22016 12.4 1.8 2.8 1.4 5.2 1.22017 13.4 2.2 3 1.5 5.4 1.32018 14.8 2.7 3 1.5 6.2 1.42019/2023 81.6 19.7 12.4 9.4 33.1 7.0
131
3
2013 Financial Document ~ Kering
CONSOLIDATED FINANCIAL STATEMENTS AS OF DECEMBER 31, 2013 ~ FINANCIAL INFORMATION
03_B_VA_V4 20/02/14 16:55 Page131

Provisions for claims and litigation mainly relate to claimsbrought by third parties and litigation with tax authoritiesin various countries. Provisions for restructuring costschiefly reflect additions recognised and write-backsutilised during the year in connection with PUMA’s
Transformation Programme. Other provisions chiefly coverthe impact of restructuring measures implemented at PUMAas part of the new management’s strategy (see Note 9)and risks relating to vendor warranties (see Note 33.1).
Note 26 – ProvisionsReversal Reversal(utilised (surplus Translation
(in € millions) 2012 Charge provision) provision) adjustments Other 2013
Provisions for restructuring costs
Provisionsfor claims and litigation 17.4 2.1 (5.6) (1.3) (0.1) 1.9 14.4
Other non-current provisions 74.9 4.3 (2.7) (3.1) (1.5) 26.9 98.8
Other non-current provisions 92.3 6.4 (8.3) (4.4) (1.6) 28.8 113.2
Provisions for restructuring costs 95.2 16.6 (59.7) (8.9) (1.9) (7.6) 33.7
Provisions for claims and litigation 36.0 20.9 (3.0) 0.1 (0.2) 2.4 56.2
Other current provisions 36.5 39.8 (14.6) (6.9) (0.4) 8.4 62.8
Current provisions 167.7 77.3 (77.3) (15.7) (2.5) 3.2 152.7
Total 260.0 83.7 (85.6) (20.1) (4.1) 32.0 265.9
Impact on income (163.4) (83.7) 20.1 (63.6)
– on recurring operating income (7.8) (19.8) 4.4 (15.4)
– on other non-recurring operating income and expenses (135.5) (60.3) 15.7 (44.6)
– on net finance costs
– on income taxes
– on income (loss) fromdiscontinued operations (20.1) (3.6) (3.6)
132 Kering ~ 2013 Financial Document
3 FINANCIAL INFORMATION ~ CONSOLIDATED FINANCIAL STATEMENTS AS OF DECEMBER 31, 2013
03_B_VA_V4 20/02/14 16:55 Page132

27.2. Breakdown by currency
(in € millions) 2013 % 2012 %
EUR 868.4 61.2% 1,495.7 71.9%USD 165.9 11.7% 180.7 8.7%HKD 52.4 3.7% 42.9 2.0%JPY 37.2 2.6% 27.5 1.3%CHF 35.8 2.5% 38.4 1.9%CNY 35.2 2.5% 44.4 2.1%GBP 32.0 2.3% 45.7 2.2%Other currencies 192.3 13.5% 205.7 9.9%
Total 1,419.2 2,081.0
As of December 31, 2013, cash equivalents include UCITS,certificates of deposit and term deposits with a maturityof less than three months.
The items classified by the Group as cash and cashequivalents strictly comply with the AMF’s positionpublished in 2008 and updated in 2011. In particular,
cash investments are reviewed on a regular basis inaccordance with Group procedures and in strictcompliance with the eligibility criteria set out in IAS 7 andthe AMF’s recommendations. As of December 31, 2013, noreclassifications were made as a result of these reviews.
Note 27 – Cash and cash equivalents
27.1. Breakdown by category
Cash and cash equivalents break down as follows:
(in € millions) 2013 2012
Cash 1,161.6 1,232.5Cash equivalents 257.6 848.5
Total 1,419.2 2,081.0
133
3
2013 Financial Document ~ Kering
CONSOLIDATED FINANCIAL STATEMENTS AS OF DECEMBER 31, 2013 ~ FINANCIAL INFORMATION
03_B_VA_V4 20/02/14 16:55 Page133

All gross borrowings as of December 31, 2013 are recognisedat amortised cost based on an effective interest ratedetermined after taking into account any identified issuecosts and redemption or issue premiums relating to eachliability. However, the May 2008 bond issues indexed tochanges in the Kering share price were recognised at fairvalue through income.
As of December 31, 2013, a fair value adjustment of€1.4 million (€4.3 million as of December 31, 2012) wasrecognised in respect of borrowings – mainly bond issues –partially or fully hedged in a fair value hedging relationship.
Bond issues represented 66.9% of gross borrowings as ofDecember 31, 2013 and 62.8% as of end-2012.
Borrowings with a maturity of more than one year represented63.7% of total gross borrowings as of December 31, 2013and 61.6% as of December 31, 2012.
Note 28 – Borrowings
28.1. Breakdown of borrowings by maturity
(in € millions) 2013 Y+1 Y+2 Y+3 Y+4 Y+5 Beyond
Non-current borrowings 3,132.4 814.7 61.0 359.6 504.6 1,392.5
Bonds 2,589.6 750.6 349.0 497.0 993.0Confirmed lines of credit Other bank borrowings 152.1 58.0 57.0 6.6 3.7 26.8Obligations under finance leases 67.0 4.0 4.0 4.0 3.9 51.1Other borrowings 323.7 2.1 321.6
Current borrowings 1,788.8 1,788.8
Bonds 700.9 700.9 Confirmed lines of credit Drawdowns on unconfirmed lines of credit 152.8 152.8 Other bank borrowings 302.1 302.1 Obligations under finance leases 4.1 4.1 Bank overdrafts 181.6 181.6 Commercial paper 358.0 358.0 Other borrowings 89.3 89.3
Total 4,921.2 1,788.8 814.7 61.0 359.6 504.6 1,392.5% 36.3% 16.6% 1.2% 7.3% 10.3% 28.3%
(in € millions) 2012 Y+1 Y+2 Y+3 Y+4 Y+5 Beyond
Non-current borrowings 2,988.9 1,003.6 822.1 25.5 360.3 777.4
Bonds 2,298.9 704.2 751.3 348.8 494.6Confirmed lines of credit Other bank borrowings 419.1 294.7 64.3 21.6 7.6 30.9Obligations under finance leases 58.6 4.0 3.9 3.9 3.9 42.9Other borrowings 212.3 0.7 2.6 209.0
Current borrowings 1,864.9 1,864.9
Bonds 749.4 749.4 Confirmed lines of credit Drawdowns on unconfirmed lines of credit 295.2 295.2 Other bank borrowings 147.4 147.4 Obligations under finance leases 4.1 4.1 Bank overdrafts 105.9 105.9 Commercial paper 449.0 449.0 Other borrowings 113.9 113.9
Total 4,853.8 1,864.9 1,003.6 822.1 25.5 360.3 777.4% 38.4% 20.7% 16.9% 0.6% 7.4% 16.0%
134 Kering ~ 2013 Financial Document
3 FINANCIAL INFORMATION ~ CONSOLIDATED FINANCIAL STATEMENTS AS OF DECEMBER 31, 2013
03_B_VA_V4 20/02/14 16:55 Page134
Group borrowings primarily consist of bonds, bankborrowings, drawdowns on confirmed lines of credit andcommercial paper issues, which account for 91.8% ofgross borrowings as of December 31, 2013 (90.4% as ofDecember 31, 2012).
As of December 31, 2013, other borrowings include€324.2 million in respect of put options granted tominority shareholders (see Note 2.3.2), including theliability in respect of the put options granted to Sowindand Pomellato group shareholders.
28.4. Description of the main bond issues
Kering bond issues
The Group has a Euro Medium Term Notes (EMTN) programmecapped at €5,000 million as of December 31, 2013.
This programme was signed and approved by Luxembourg’sfinancial sector supervisory commission (Conseil deSurveillance du Secteur Financier – CSSF) on December 3, 2013.The programme existing as of December 31, 2013 expireson December 3, 2014.
As of December 31, 2013, the bonds issued under thisprogramme totalled €3,300.1 million.
All borrowings benefit from the rating awarded to theKering group by Standard & Poor’s (“BBB” with a stableoutlook) and are not subject to any financial covenants.
28.2. Breakdown by repayment currency
Non-current Current(in € millions) 2013 borrowings borrowings % 2012 %
EUR 4,233.0 2,851.9 1,381.1 86.0% 4,058.8 83.6%JPY 334.5 97.2 237.3 6.8% 432.2 8.9%CHF 179.6 128.4 51.2 3.7% 180.7 3.7%CNY 80.3 80.3 1.6% 39.9 0.8%USD 54.1 44.2 9.9 1.1% 96.5 2.0%HKD 6.9 6.9 0.1% Other currencies 32.8 3.8 29.0 0.7% 45.7 1.0%
Total 4,921.2 3,132.4 1,788.8 4,853.8
Borrowings denominated in currencies other than the euro are distributed to Group subsidiaries for local financing purposes.
28.3. Breakdown of gross borrowings by category
The Kering group gross borrowings break down as follows:
(in € millions) 2013 2012
Bonds 3,290.5 3,048.3Other bank borrowings 454.2 566.5Confirmed lines of credit Drawdowns on unconfirmed lines of credit 152.8 295.2Commercial paper 358.0 449.0Obligations under finance leases 71.1 62.7Bank overdrafts 181.6 105.9Other borrowings 413.0 326.2
Total 4,921.2 4,853.8
The total amount of confirmed lines of credit was€4,148.0 million at the end of the reporting period, including€22.1 million available in the form of short-term loans.
Short-term drawdowns on facilities backed by confirmedlines of credit maturing in more than one year areincluded in non-current borrowings.
Accrued interest is recorded in “Other borrowings”.
The financing of Redcats customer loans contributed€51.4 million to gross borrowings as of December 31, 2013.
135
3
2013 Financial Document ~ Kering
CONSOLIDATED FINANCIAL STATEMENTS AS OF DECEMBER 31, 2013 ~ FINANCIAL INFORMATION
03_B_VA_V4 20/02/14 16:55 Page135

(in € millions)
Issue Effective Documented/interest interest Issue non-documented
Par value rate rate date hedge Maturity 2013 2012
600.0 (1) 4.00% fixed 4.08% 6/29/2005 - 1/29/2013& 4.79% &6/19/2006 599.7
200.0 (2) 6.536% fixed - 5/16/2008 - 5/16/2013 149.7
550.1 (3) 8.625% fixed 8.86% 4/3/2009 - 4/3/2014 549.8 550.4& 7.86%
150.0 (4) 7.75% fixed 7.94% 6/3/2009 6-month Euribor 6/3/2014 151.1 153.8floating rate swap
for €150 millionDocumented
under IFRS
150.0 (5) 6.50% fixed 6.57% 6/29/2009 - 6/29/2017 149.6 149.5
200.0 (6) 6.50% fixed 6.57% 11/6/2009 - 11/6/2017 199.4 199.3
750.0 (7) 3.75% fixed 3.87% 4/8/2010 - 4/8/2015 750.6 751.3& 3.24% & 1/26/2012
500.0 (8) 3.125% fixed 3.31% 4/23/2012 - 4/23/2019 495.4 494.6
500.0 (9) 2.50% fixed 2.58% 7/15/2013 - 7/15/2020 497.6
500.0 (10) 1.875% fixed 2.01% 10/8/2013 - 10/8/2018 497.0
(1) Issue price: bond issue, comprised of 600,000 bonds with a par value of €1,000 each under the EMTN programme, with 300,000 bonds issued on June 29, 2005and 300,000 additional bonds issued on June 19, 2006, thereby raising the issue to 600,000 bonds.Redemption: in full on January 29, 2013.
(2) Issue price: bond issue indexed to Kering shares, issued on May 16, 2008 under the EMTN programme, comprised of 2,362,907 bonds with a par value of €84.64 each.Redemption: the redemption price, indexed to changes in the Kering share price, was €138.2 million maturing on May 16, 2013.
(3) Issue price: bond issue, comprised of 550,100 bonds with a par value of €1,000 each under the EMTN programme, with 600,000 bonds issued on April 3, 2009and 200,000 additional bonds issued on May 13, 2009, thereby raising the issue to 800,000 bonds. A total of 249,900 of these bonds were redeemed onApril 26, 2011.Redemption: in full on April 3, 2014.
(4) Issue price: bond issue on June 3, 2009, comprised of 150,000 bonds with a par value of €1,000 each under the EMTN programme.Redemption: in full on June 3, 2014.
(5) Issue price: bond issue on June 29, 2009, comprised of 3,000 bonds with a par value of €50,000 each under the EMTN programme.Redemption: in full on June 29, 2017.
(6) Issue price: bond issue on November 6, 2009, comprised of 4,000 bonds with a par value of €50,000 each under the EMTN programme.Redemption: in full on November 6, 2017.
(7) Issue price: bond issue on April 8, 2010, comprised of 500,000 bonds with a par value of €1,000 each under the EMTN programme, and 250,000 additionalbonds issued on January 26, 2012, thereby raising the issue to 750,000 bonds.Redemption: in full on April 8, 2015.
(8) Issue price: bond issue on April 23, 2012, comprised of 500,000 bonds with a par value of €1,000 each under the EMTN programme.Redemption: in full on April 23, 2019.
(9) Issue price: bond issue on July 15, 2013, comprised of 5,000 bonds with a par value of €100,000 each under the EMTN programme.Redemption: in full on July 15, 2020.
(10) Issue price: bond issue on October 8, 2013, comprised of 5,000 bonds with a par value of €100,000 each under the EMTN programme.Redemption: in full on October 8, 2018.
136 Kering ~ 2013 Financial Document
3 FINANCIAL INFORMATION ~ CONSOLIDATED FINANCIAL STATEMENTS AS OF DECEMBER 31, 2013
03_B_VA_V4 20/02/14 16:55 Page136
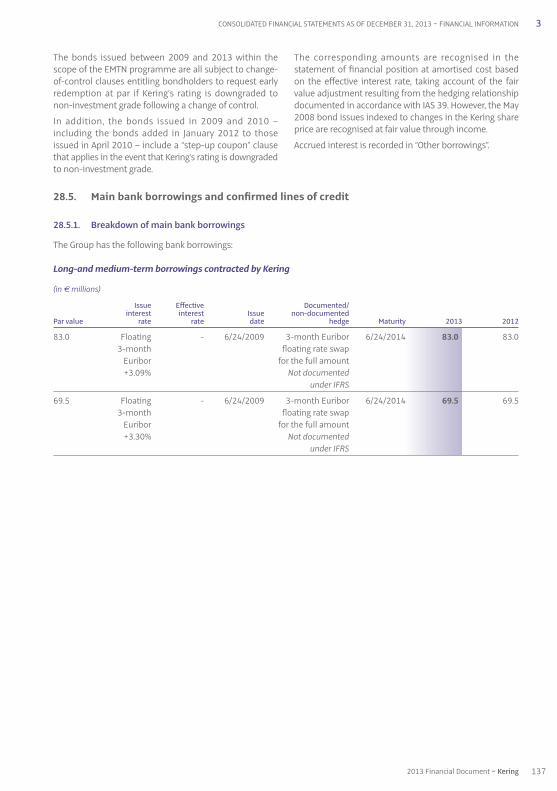
28.5. Main bank borrowings and confirmed lines of credit
28.5.1. Breakdown of main bank borrowings
The Group has the following bank borrowings:
Long-and medium-term borrowings contracted by Kering
(in € millions)
Issue Effective Documented/ interest interest Issue non-documented Par value rate rate date hedge Maturity 2013 2012
83.0 Floating - 6/24/2009 3-month Euribor 6/24/2014 83.0 83.0 3-month floating rate swap Euribor for the full amount +3.09% Not documented under IFRS
69.5 Floating - 6/24/2009 3-month Euribor 6/24/2014 69.5 69.5 3-month floating rate swap Euribor for the full amount +3.30% Not documented under IFRS
The bonds issued between 2009 and 2013 within thescope of the EMTN programme are all subject to change-of-control clauses entitling bondholders to request earlyredemption at par if Kering’s rating is downgraded tonon-investment grade following a change of control.
In addition, the bonds issued in 2009 and 2010 –including the bonds added in January 2012 to thoseissued in April 2010 – include a “step-up coupon” clausethat applies in the event that Kering’s rating is downgradedto non-investment grade.
The corresponding amounts are recognised in thestatement of financial position at amortised cost basedon the effective interest rate, taking account of the fairvalue adjustment resulting from the hedging relationshipdocumented in accordance with IAS 39. However, the May2008 bond issues indexed to changes in the Kering shareprice are recognised at fair value through income.
Accrued interest is recorded in “Other borrowings”.
137
3
2013 Financial Document ~ Kering
CONSOLIDATED FINANCIAL STATEMENTS AS OF DECEMBER 31, 2013 ~ FINANCIAL INFORMATION
03_B_VA_V4 20/02/14 16:55 Page137

Long-and medium-term borrowings contracted by the Luxury Division
(in € millions)
Issue Effective Documented/ interest interest Issue non-documented Par value rate rate date hedge Maturity 2013 2012
36.3 (1) Floating - 8/8/2003 - 8/15/2013 3.8USD Libor
+1.00%
35.0 (2) Floating - 3/29/2004 - 6/30/2014 1.4 4.1 Euribor +0.70%
38.3 (3) Floating - 11/15/2010 - 11/15/2013 39.6JPY Tibor
+0.65%
27.6 (4) Floating - 3/31/2011 - 3/31/2016 13.8 24.6JPY Tibor
+0.35%
41.5 (5) Floating - 5/15/2011 - 4/15/2014 32.6 45.8JPY Tibor
+0.38%
27.6 (6) Floating - 12/14/2011 - 12/14/2014 27.6 35.2JPY Tibor
+0.45%
29.4 (7) Floating - 12/14/2011 - 9/15/2016 17.6 29.9JPY Tibor
+0.45%
32.5 (8) Floating - 9/27/2012 - 9/28/2015 21.7 41.4JPY Tibor
+0.50%
39.8 (9) Floating - 9/30/2013 - 9/30/2016 38.6JPY Tibor
+0.45%
(1) Redeemable loan initially contracted by Gucci America Inc. for USD 50 million (€36.3 million).
(2) Loan redeemable as from 2006 initially contracted for €35 million.
(3) Redeemable loan contracted in November 2010 for JPY 5,540 million (€38.3 million).
(4) Redeemable loan contracted in March 2011 for JPY 4,000 million (€27.6 million). The outstanding balance on this loan was JPY 2,000 million (€13.8 million) asof December 31, 2013.
(5) Redeemable loan contracted in May 2011 for JPY 6,000 million (€41.5 million). The outstanding balance on this loan was JPY 4,720 million (€32.6 million) as ofDecember 31, 2013.
(6) Loan contracted in December 2011 for JPY 4,000 million (€27.6 million).
(7) Redeemable loan contracted in December 2011 for JPY 4,250 million (€29.4 million). The outstanding balance on this loan was JPY 2,550 million (€17.6 million)as of December 31, 2013.
(8) Redeemable loan contracted in September 2012 for JPY 4,700 million (€32.5 million). The outstanding balance on this loan was JPY 3,140 million(€21.7 million) as of December 31, 2013.
(9) Redeemable loan contracted in September 2013 for JPY 5,756 million (€39.8 million). The outstanding balance on this loan was JPY 5,586 million(€38.6 million) as of December 31, 2013.
138 Kering ~ 2013 Financial Document
3 FINANCIAL INFORMATION ~ CONSOLIDATED FINANCIAL STATEMENTS AS OF DECEMBER 31, 2013
03_B_VA_V4 20/02/14 16:55 Page138

The Group’s confirmed bank lines of credit are governedby the standard commitment and default clausescustomarily included in this type of agreement: paripassu ranking, a negative-pledge clause that limits thesecurity that can be granted to other lenders, and a cross-default obligation.
Kering and Kering Finance SNC confirmed lines of creditinclude a default clause (early repayment) in the event offailure to comply with the following financial covenant:Consolidated net debt/Consolidated EBITDA less than or equal to 3.75. This ratio is calculated based on proforma data.
As of December 31, 2013, Kering and Kering Finance SNChad not drawn down any of the €3,901.0 million availableunder confirmed lines of credit subject to this covenant.
The Group was in compliance with all these covenants as of December 31, 2013 and there is no foreseeable riskof breach.
The undrawn balance on these confirmed lines of credit asof December 31, 2013 was €4,125.9 million (€4,023.6 millionas of December 31, 2012).
The undrawn confirmed lines of credit guarantee theGroup’s liquidity and back the commercial paper issueprogramme, on which a total of €358.0 million remainedoutstanding as of December 31, 2013 (€449.0 million asof December 31, 2012).
Other confirmed lines of credit: €247.0 million breaking down by maturity as follows:
(in € millions) 20 13 Less than One to More than 20 12 one year five years five years
Redcats 372.7PUMA (1) 247.0 247.0 247.9
247.0 247.0 620.6
(1) PUMA: including €22.1 million drawn down in the form of bank borrowings as of the end of December 2013.
The confirmed lines of credit include a syndicated line for€2.5 billion set up on January 14, 2011 and maturing inJanuary 2016.
As of December 31, 2013, no amounts had been drawndown under the January 2011 syndicated facility.
Total confirmed undrawn credit lines available to Keringand Kering Finance SNC as of December 31, 2013amounted to €3,901.0 million.
28.5.2. Confirmed lines of credit available to the Group
As of December 31, 2013, the Group had access to €4,148.0 million in confirmed lines of credit (versus€4,431.6 million as of December 31, 2012).
28.5.3. Breakdown of confirmed lines of credit
Kering and Kering Finance SNC: €3,901.0 million breaking down by maturity as follows:
(in € millions) 20 13 Less than One to More than 20 12 one year five years five years
Confirmed lines of credit 3,901.0 3,901.0 3,811.0
139
3
2013 Financial Document ~ Kering
CONSOLIDATED FINANCIAL STATEMENTS AS OF DECEMBER 31, 2013 ~ FINANCIAL INFORMATION
03_B_VA_V4 20/02/14 16:55 Page139

These interest rate derivatives are recognised in thestatement of financial position at their market value atthe end of the reporting period.
The accounting treatment of fair value movementsdepends on the purpose of the derivative instrument andthe resulting accounting classification.
In the case of interest rate derivatives designated as fairvalue hedges, fair value movements are recognised in netincome for the period, fully or partly offsetting symmetricalchanges in the fair value of the hedged debt. The ineffectiveportion impacts net finance costs for the period.
As of December 31, 2013, fair value hedges concerned fixed-rate bonds issued by the Group in June 2009, hedged byinterest rate swaps for a nominal amount of €150 million.
In the case of interest rate derivatives designated as cashflow hedges, the effective portion of changes in fair valueis initially recognised in other comprehensive income andsubsequently taken to income when the hedged positionitself affects income. The ineffective portion impacts netfinance costs for the period.
Movements in the fair value of non-documented derivativeinstruments are recognised directly in income, with animpact on net finance costs for the period.
As of December 31, 2013, derivative instruments that did notqualify for hedge accounting under IAS 39 primarilycomprised options in the form of interest rate swaps intendedto hedge revolving financing issued at fixed rates.
As of December 31, 2013, documented and non-documented financial instruments can be analysed as follows:
(in € millions) 2013 Fair value Cash flow Non-documented hedges hedges hedges
Swaps: fixed-rate lender 650.0 150.0 500.0Swaps: fixed-rate borrower 14.3 14.3Other interest rate instruments 252.5 252.5
Total 916.8 150.0 14.3 752.5
As part of the Group’s interest rate hedging strategy, theseinstruments are primarily designed to:
• convert fixed-rate bonds into floating-rate debt: the Grouphas entered into interest rate swaps as a fixed-rate lenderin an amount of €150 million to hedge Kering bond issues;
• convert fixed-rate negotiable debt securities, borrowingsand credit-line drawdowns into floating-rate debt: theGroup has entered into interest rate swaps as a fixed-rate lender in an amount of €600 million.
In accordance with IAS 39, these financial instrumentswere analysed with respect to hedge accounting eligibilitycriteria.
Note 29 – Exposure to interest rate, foreignexchange and equity risk
The Group uses derivative financial instruments to manage its exposure to market risks.
Derivatives used by the Group as of December 31, 2013 are described below.
29.1. Exposure to interest rate risk
To manage interest rate risk on its financial assets and liabilities, and particularly on its borrowings, the Kering groupuses instruments with the following outstanding notional amounts:
(in € millions) 20 13 Y+1 Y+2 Y+3 Y+4 Y+5 Beyond 20 12
Swaps: fixed-rate lender 650.0 550.0 100.0 431.9Swaps: fixed-rate borrower 14.3 14.3 Other interest rate instruments (1) 252.5 152.5 100.0 152.5
Total 916.8 702.5 100.0 100.0 14.3 584.4
(1) Including floating/floating rate swaps.
140 Kering ~ 2013 Financial Document
3 FINANCIAL INFORMATION ~ CONSOLIDATED FINANCIAL STATEMENTS AS OF DECEMBER 31, 2013
03_B_VA_V4 20/02/14 16:55 Page140

The Group’s exposure to interest rate risk before the impact of hedging is presented below, with a distinction made between:
• fixed-rate financial assets and liabilities, exposed to a price risk before hedging:
2013 maturities(in € millions) 2013 Less than One to More than 2012
one year five years five years
Fixed-rate financial assets 79.0 67.4 10.8 0.8 252.3
Bonds 3,290.5 700.9 1,596.6 993.0 3,048.3Commercial paper 358.0 358.0 312.0Other borrowings 4.4 0.6 2.4 1.4 8.1
Fixed-rate financial liabilities 3,652.9 1,059.5 1,599.0 994.4 3,368.4
• floating-rate financial assets and liabilities, exposed to a cash flow risk before hedging:
2013 maturities(in € millions) 2013 Less than One to More than 2012
one year five years five years
Floating-rate financial assets 1,397.2 1,381.3 15.9 1,924.5
Bonds Commercial paper 137.0Other borrowings 1,268.3 729.3 140.9 398.1 1,348.4
Floating-rate financial liabilities 1,268.3 729.3 140.9 398.1 1,485.4
The Group’s exposure to interest rate risk after the impact of hedging is presented below, with a distinction made between:
• fixed-rate financial assets and liabilities, exposed to a price risk after hedging:
2013 maturities(in € millions) 2013 Less than One to More than 2012
one year five years five years
Fixed-rate financial assets 79.0 67.4 10.8 0.8 252.3
Bonds 2,897.4 507.8 1,396.6 993.0 2,894.5Commercial paper 30.1Other borrowings 18.7 1.8 7.6 9.3 8.1
Fixed-rate financial liabilities 2,916.1 509.6 1,404.2 1,002.3 2,932.7
• floating-rate financial assets and liabilities, exposed to a cash flow risk after hedging:
2013 maturities(in € millions) 2013 Less than One to More than 2012
one year five years five years
Floating-rate financial assets 1,397.2 1,381.3 15.9 1,924.5
Bonds 393.1 193.1 200.0 153.7Commercial paper 358.0 358.0 419.0Other borrowings 1,254.0 728.1 135.7 390.2 1,348.4
Floating-rate financial liabilities 2,005.1 1,279.2 335.7 390.2 1,921.1
Financial assets and liabilities consist of interest-bearing items recorded in the statement of financial position.
141
3
2013 Financial Document ~ Kering
CONSOLIDATED FINANCIAL STATEMENTS AS OF DECEMBER 31, 2013 ~ FINANCIAL INFORMATION
03_B_VA_V4 20/02/14 16:55 Page141

All other market variables were assumed to remainunchanged for the purpose of the sensitivity analysis.
The impact on equity is generated by interest rateinstruments eligible for cash flow hedge accounting andwas not material as of December 31, 2013.
The impact on net finance costs arises from interest rateinstruments not eligible for hedge accounting and fromfinancial liabilities carried at fair value through income.
These amounts are shown before tax.
(in € millions) Impact Impact on reserves on income
As of December 31, 2013
Increase of 50 basis points 1.6Decrease of 50 basis points (2.0)
As of December 31, 2012
Increase of 50 basis points 0.4Decrease of 50 basis points (0.5)
Analysis of sensitivity to interest rate risk
Based on the fixed/floating rate mix after hedging, asudden 50 basis point increase or decrease in interestrates would have a full-year impact of €4.9 million onpre-tax consolidated net income. As of December 31,2012, the impact of a sudden 50 basis point increase ordecrease in interest rates was estimated at €2.7 million(assumption consistent with relative interest rate levelsobserved at year-end).
Based on market data at the end of the reporting period,and the particularly low benchmark interest rates for theGroup, the impact of interest rate derivatives and financialliabilities carried at fair value through income wasdetermined assuming a sudden increase or decrease of 50basis points in the euro yield curve as of December 31, 2013.
The breakdown of gross borrowings by type of interest rate before and after hedging transactions is as follows:
(in € millions) 2013 Before hedging After hedgingFixed-rate Floating-rate Fixed-rate Floating-rate
Gross borrowings 4,921.2 3,652.9 1,268.3 2,916.1 2,005.1
% 74.2% 25.8% 59.3% 40.7%
(in € millions) 2012 Before hedging After hedgingFixed-rate Floating-rate Fixed-rate Floating-rate
Gross borrowings 4,853.8 3,368.4 1,485.4 2,932.7 1,921.1
% 69.4% 30.6% 60.4% 39.6%
142 Kering ~ 2013 Financial Document
3 FINANCIAL INFORMATION ~ CONSOLIDATED FINANCIAL STATEMENTS AS OF DECEMBER 31, 2013
03_B_VA_V4 20/02/14 16:55 Page142
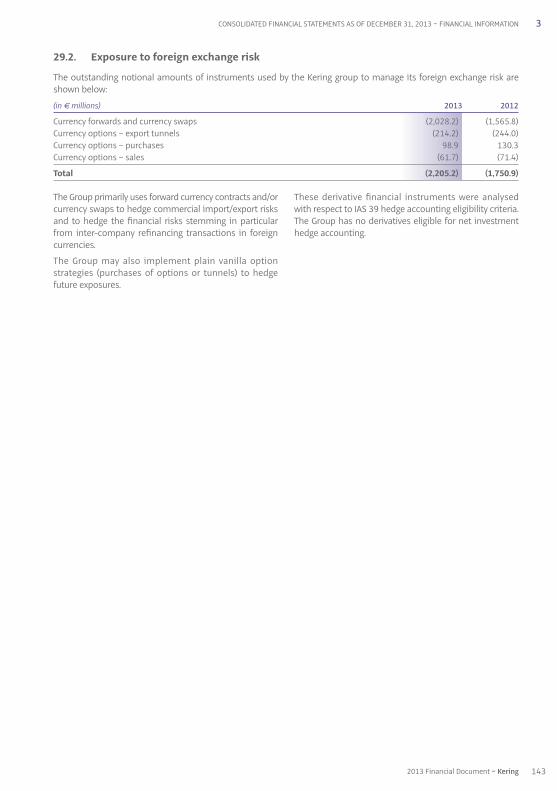
The Group primarily uses forward currency contracts and/orcurrency swaps to hedge commercial import/export risksand to hedge the financial risks stemming in particularfrom inter-company refinancing transactions in foreigncurrencies.
The Group may also implement plain vanilla optionstrategies (purchases of options or tunnels) to hedgefuture exposures.
These derivative financial instruments were analysedwith respect to IAS 39 hedge accounting eligibility criteria.The Group has no derivatives eligible for net investmenthedge accounting.
29.2. Exposure to foreign exchange risk
The outstanding notional amounts of instruments used by the Kering group to manage its foreign exchange risk areshown below:
(in € millions) 2013 2012
Currency forwards and currency swaps (2,028.2) (1,565.8)Currency options – export tunnels (214.2) (244.0)Currency options – purchases 98.9 130.3Currency options – sales (61.7) (71.4)
Total (2,205.2) (1,750.9)
143
3
2013 Financial Document ~ Kering
CONSOLIDATED FINANCIAL STATEMENTS AS OF DECEMBER 31, 2013 ~ FINANCIAL INFORMATION
03_B_VA_V4 20/02/14 16:55 Page143

Foreign exchange derivatives are recognised in thestatement of financial position at their market value atthe end of the reporting period.
Derivatives qualifying as cash flow hedges are used to hedgehighly probable future cash flows (not yet recognised)based on a budget for the current budget period (seasonor catalogue, quarter, half-year, etc.) or certain future cashflows not yet recognised (firm orders).
As of December 31, 2013, the majority of foreign exchangederivatives qualifying as cash flow hedges had a residualmaturity of less than one year and are used to hedgecash flows expected to be realised and recorded in theaccounts in the coming reporting period.
Derivatives qualifying as fair value hedges are used tohedge items recognised in the consolidated statement offinancial position at the end of the reporting period, orcertain future cash flows not yet recognised (firm orders).Hedges of items recognised in the statement of financialposition chiefly concern brands in the Luxury Division.
Certain foreign exchange derivatives treated as hedges formanagement purposes are not documented in accordancewith IAS 39 hedge accounting and are therefore recordedas derivatives, with any changes in their fair value impactingnet finance costs.
These derivatives mainly hedge items recorded in thestatement of financial position and future cash flows whichdo not satisfy the ’highly probable’ criteria required by IAS 39.
(in € millions) 20 13 EUR USD JPY
Cash flow hedges
Forward purchases and forward purchase swaps 787.8 0.1 778.7 Forward sales and forward sale swaps (1,597.0) (692.5) Currency options – purchases of export tunnels (214.2) (214.2)
Fair value hedges
Forward purchases and forward purchase swaps 232.8 4.2 90.7 33.4 Forward sales and forward sale swaps (763.0) (23.1) (144.7) (55.8)
Not documented
Forward purchases and forward purchase swaps 304.8 17.5 129.1 21.1 Forward sales and forward sale swaps (993.6) (17.3) (777.2) (95.2) Currency options – purchases 98.9 6.6 81.9 Currency options – sales (61.7) (6.6) (25.9)
Maturity
Less than one year
Forward purchases and forward purchase swaps 1,267.5 21.8 940.6 54.5 Forward sales and forward sale swaps (3,332.2) (40.4) (1,614.4) (151.0) Currency options – purchases of export tunnels (206.3) (206.3) Currency options – purchases 98.9 6.6 81.9 Currency options – sales (61.7) (6.6) (25.9)
More than one year
Forward purchases and forward purchase swaps 57.9 57.9 Forward sales and forward sale swaps (21.4) Currency options – purchases of export tunnels (7.9) (7.9) Currency options – purchases Currency options – sales
As of December 31, 2013, documented and non-documented derivative instruments were as follows:
144 Kering ~ 2013 Financial Document
3 FINANCIAL INFORMATION ~ CONSOLIDATED FINANCIAL STATEMENTS AS OF DECEMBER 31, 2013
03_B_VA_V4 20/02/14 16:55 Page144

145
3
2013 Financial Document ~ Kering
CONSOLIDATED FINANCIAL STATEMENTS AS OF DECEMBER 31, 2013 ~ FINANCIAL INFORMATION
GBP CHF SEK HKD CNY KRW Other 20 12
0.4 1.5 3.4 3.7 962.3 (138.0) (22.2) (19.9) (254.8) (265.9) (105.1) (98.6) (1,583.3) (244.0)
14.1 22.0 0.3 25.3 7.1 14.4 21.3 268.0 (103.3) (84.3) (1.4) (77.9) (146.3) (28.2) (98.0) (834.2)
45.8 56.3 1.3 3.5 30.2 330.2 (8.2) (43.0) (19.0) (3.5) (30.2) (708.8) 1.6 2.4 1.1 5.3 130.3 (11.1) (7.7) (5.1) (5.3) (71.4)
60.3 79.8 5.0 32.5 7.1 14.4 51.5 1,535.4 (247.3) (147.9) (38.9) (336.2) (402.6) (129.2) (224.3) (3,095.4) (228.2) 1.6 2.4 1.1 5.3 130.3 (11.1) (7.7) (5.1) (5.3) (71.4)
25.1 (2.2) (1.6) (1.4) (9.6) (4.1) (2.5) (30.9) (15.8)
03_B_VA_V4 20/02/14 16:55 Page145

All other market variables were assumed to remainunchanged for the purpose of the sensitivity analysis.
The impact on equity is generated by foreign exchangeinstruments qualifying for cash flow hedge accounting.
The impact on net finance costs arises from foreignexchange instruments not qualifying for cash flow hedgeaccounting and from the change in the ineffective portionof cash flow hedges.
These amounts are shown before tax.
29.3. Exposure to equity risk
In the normal course of its business, the Group entersinto transactions involving shares in consolidatedcompanies or shares issued by Kering.
Shares held in connection with non-consolidatedinvestments represent a low exposure risk for the Groupand are not hedged.
As of December 31, 2013, no equity risk hedging transactionhad been recognised as a derivative instrument inaccordance with IAS 39.
As of December 31, 2013 Impact on reserves Impact on income(in € millions) +10% increase -10% decrease +10% increase -10% decrease
USD (7.4) 12.3 2.7JPY 9.5 (8.7) (0.1) (0.1)CNY 24.2 (29.5) (0.3) 0.3
As of December 31, 2012 Impact on reserves Impact on income(in € millions) +10% increase -10% decrease +10% increase -10% decrease
USD (33.6) 41.0 (1.7) 8.4JPY 22.2 (26.6) (0.2) (0.1)CNY 22.4 (27.4) (0.4) 0.4
Monetary assets comprise loans and receivables, bankbalances, investments and cash equivalents maturingwithin three months of the acquisition date.
Monetary liabilities comprise borrowings, operatingpayables and other payables.
Most of these monetary items are denominated in thefunctional currency in which the subsidiary operates orare converted into the Group’s functional currency usingforeign exchange derivatives in accordance withapplicable procedures.
Analysis of sensitivity to foreign exchange risk
This analysis excludes the impact of translating thefinancial statements of each Group entity into thepresentation currency (euro) and the measurement ofthe foreign exchange position of the statement offinancial position, not considered material as of the endof the reporting period.
Based on market data as of December 31, 2013, the impactof foreign exchange derivative instruments in the event ofa sudden 10% increase or decrease in the euro exchangerate against the principal currencies to which the Group isexposed (USD, JPY and CNY) would be as follows:
As of December 31, 2013, the exposure to foreign exchange risk on the statement of financial position was as follows:
(in € millions) 20 13 EUR USD JPY
Monetary assets 2,364.2 23.9 1,026.9 220.7 Monetary liabilities 1,092.1 25.9 290.5 341.0
Gross exposure in the statement of financial position 1,272.1 (2.0) 736.4 (120.3)
Forecast gross exposure 1,051.6 (55.4) 214.2
Gross exposure before hedging 2,323.7 (2.0) 681.0 93.9
Hedging instruments (2,200.0) (18.8) (559.8) (310.7)
Gross exposure after hedging 123.7 (20.8) 121.2 (216.8)
146 Kering ~ 2013 Financial Document
3 FINANCIAL INFORMATION ~ CONSOLIDATED FINANCIAL STATEMENTS AS OF DECEMBER 31, 2013
03_B_VA_V4 20/02/14 16:55 Page146

(in € millions) 2013 Interest Foreign Other 2012 rate risk exchange risk market risks
Derivative assets 101.5 8.5 93.0 89.6
Non-current 0.4 0.4 12.4At fair value through income 0.4 0.4 1.1Cash flow hedges Fair value hedges 11.3
Current 101.1 8.1 93.0 77.2At fair value through income 14.7 0.4 14.3 5.5Cash flow hedges 78.6 78.6 66.2Fair value hedges 7.8 7.7 0.1 5.5
Derivative liabilities 26.3 0.7 25.6 18.7
Non-current 0.7 0.7 At fair value through income Cash flow hedges 0.7 0.7 Fair value hedges
Current 25.6 25.6 18.7At fair value through income 5.3 5.3 2.4Cash flow hedges 19.9 19.9 16.3Fair value hedges 0.4 0.4
TOTAL 75.2 7.8 67.4 70.9
29.4. Other market risks – Credit risk
The Group uses derivative instruments solely to reduceits overall exposure to foreign exchange, interest rate andequity risk arising in the normal course of business. Alltransactions involving derivatives are carried out onorganised markets or over-the-counter with leading firms.
All bonds issued in 2009 and 2010 within the scope ofthe EMTN programme, including the additional bondsissued in January 2012 for the April 2010 bond issue, aresubject to a “step-up coupon” clause in the event thatKering’s rating is downgraded to non-investment grade.This would increase the coupon payable on each issue by1.25%, and could lead to an increase of €22.5 million infinance costs over a full year.
The Group has a large number of customers in a widerange of business segments and is therefore not exposedto any concentration of credit risk on its receivables.Generally, the Group considers that it is not exposed toany specific credit risk on these financial assets.
29.5. Derivative instruments at market value
As of December 31, 2013, and in accordance with IAS 39,the market value of derivative financial instruments isrecognised in assets under the headings “Non-currentfinancial assets” and “Other current financial assets”, andin liabilities under the headings “Other non-currentfinancial liabilities” and “Other current financial liabilities”.
The fair value of derivatives hedging interest rate risk isrecognised in non-current or current assets or liabilitiesdepending on the maturity of the underlying debt.
The fair value of foreign exchange derivatives isrecognised in other current financial assets or liabilities.
147
3
2013 Financial Document ~ Kering
CONSOLIDATED FINANCIAL STATEMENTS AS OF DECEMBER 31, 2013 ~ FINANCIAL INFORMATION
GBP CHF SEK HKD CNY KRW Other 20 12
128.0 142.5 35.3 99.4 191.8 37.7 458.0 2,340.6 42.0 230.4 3.0 15.1 89.4 1.4 53.4 1,225.2
86.0 (87.9) 32.3 84.3 102.4 36.3 404.6 1,115.4
137.9 20.0 15.6 251.1 265.9 105.1 97.2 831.5
223.9 (67.9) 47.9 335.4 368.3 141.4 501.8 1,946.9
(198.7) (83.2) (25.8) (303.7) (405.1) (118.9) (175.3) (1,835.3)
25.2 (151.1) 22.1 31.7 (36.8) 22.5 326.5 111.6
03_B_VA_V4 20/02/14 16:56 Page147

Derivatives qualifying for fair value hedge accountingmainly hedge debt in the form of bonds. They are presentedin assets for an amount of €7.7 million as of December 31,2013 and €11.3 million as of December 31, 2012.
The effective portion of derivatives hedging future cashflows is recorded against equity.
Changes in the cash flow hedging reserve in 2013 arepresented in Note 14.
In accordance with IFRS 13, derivatives were measured asof December 31, 2013 taking into account credit and debitvalue adjustments (CVA/DVA). The probability of default usedis based on market data where this is available for thecounterparty. The impact of this revised measurementwas not material for the Group as of the end of thereporting period and is recognised in net finance costs.
29.6. Liquidity risk
Liquidity risk management for the Group and each of itssubsidiaries is closely monitored and periodically assessedby Kering within the scope of Group financial reportingprocedures.
In order to guarantee its liquidity, the Group holds confirmedlines of credit totalling €4,148.0 million. As of December 31,2013, this includes an amount of €4,125.9 million notyet drawn and available cash of €1,419.2 million.
The table below shows contractual commitments relatingto borrowings and trade payables. It includes accruedinterest payable and excludes the impact of nettingagreements. The table also includes Group commitmentsrelating to derivative instruments recorded in assets or liabilities.
Forecast cash flows relating to interest payable areincluded in “Other borrowings” and calculated up to thecontractual maturity of the borrowings to which theyrelate. Future floating-rate interest is set based on thelast coupon for the current period, based on fixingsapplicable at the end of the reporting period for flowsassociated with subsequent maturities.
The future cash flows presented have not been discounted.
Based on data available as of the end of the reportingperiod, the Group does not expect that the cash flowsindicated will materialise before the scheduled date orthat the amounts concerned will differ significantly fromthose set out in the maturity schedule.
This analysis excludes non-derivative financial assets inthe statement of financial position and in particular, thecash and cash equivalents and trade receivables captions,which amounted to €1,419.2 million and €949.9 million,respectively, as of December 31, 2013.
148 Kering ~ 2013 Financial Document
3 FINANCIAL INFORMATION ~ CONSOLIDATED FINANCIAL STATEMENTS AS OF DECEMBER 31, 2013
03_B_VA_V4 20/02/14 16:56 Page148

(in € millions) 2013 Carrying Cash flow Less than One to More thanamount one year five years five years
Non-derivative financial instruments
Bonds 3,290.5 (3,300.1) (700.1) (1,600.0) (1,000.0)Commercial paper 358.0 (358.0) (358.0) Other borrowings 1,272.7 (1,656.5) (803.9) (412.9) (439.7)Trade payables 766.1 (766.1) (766.1)
Other non-derivative financial instruments associated with assets classified as heldfor sale or for distribution 259.1 (259.1) (252.1) (7.0)
Derivative financial instruments
Interest rate hedges (7.8)
Interest rate swaps 8.2 8.4 0.2 (0.4)Other interest rate instruments
Foreign exchange hedges (67.4)
Currency forwards and currency swaps Outflows (4,056.7) (3,991.7) (65.0) Inflows 4,085.3 4,020.8 64.5 Other foreign exchange instruments Outflows (235.7) (227.8) (7.9) Inflows 262.7 254.1 8.6
Total 5,871.2 (6,276.0) (2,816.4) (2,019.5) (1,440.1)
(in € millions) 2012 Carrying Cash flow Less than One to More thanamount one year five years five years
Non-derivative financial instruments
Bonds 3,048.3 (3,038.3) (738.2) (1,800.1) (500.0)Commercial paper 449.0 (449.0) (449.0) Other borrowings 1,356.5 (1,753.2) (730.3) (697.3) (325.6)Trade payables 684.5 (684.5) (684.5) Other non-derivative financial instruments associated with assets classified as held for sale or for distribution 1,484.8 (1,493.7) (1,393.6) (100.1)
Derivative financial instruments
Interest rate hedges (12.4)
Interest rate swaps 12.6 4.5 8.1 Other interest rate instruments
Foreign exchange hedges (58.5)
Currency forwards and currency swaps Outflows (3,990.2) (3,953.4) (36.8) Inflows 4,004.5 3,968.8 35.7 Other foreign exchange instruments Outflows (320.1) (304.3) (15.8) Inflows 349.2 331.6 17.6
Total 6,952.2 (7,362.7) (3,948.4) (2,588.7) (825.6)
149
3
2013 Financial Document ~ Kering
CONSOLIDATED FINANCIAL STATEMENTS AS OF DECEMBER 31, 2013 ~ FINANCIAL INFORMATION
03_B_VA_V4 20/02/14 16:56 Page149
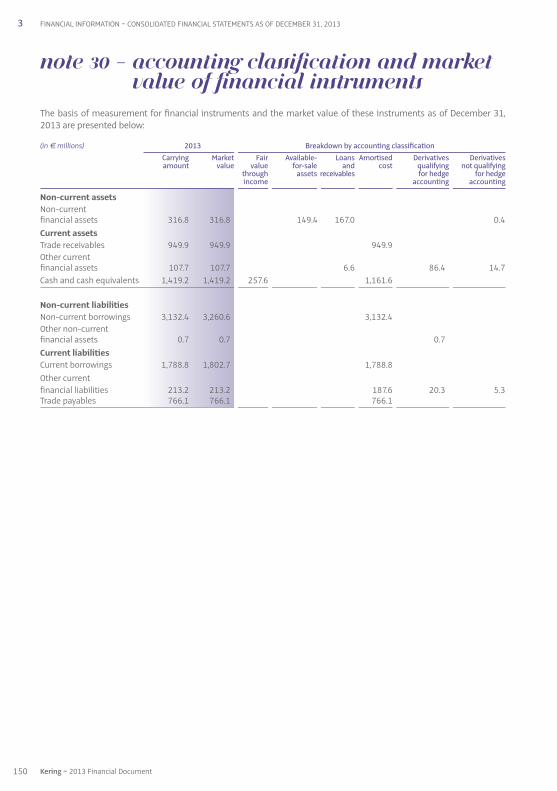
Note 30 – Accounting classification and marketvalue of financial instruments
The basis of measurement for financial instruments and the market value of these instruments as of December 31,2013 are presented below:
(in € millions) 2013 Breakdown by accounting classificationCarrying Market Fair Available- Loans Amortised Derivatives Derivativesamount value value for-sale and cost qualifying not qualifying
through assets receivables for hedge for hedgeincome accounting accounting
Non-current assets Non-current financial assets 316.8 316.8 149.4 167.0 0.4Current assets Trade receivables 949.9 949.9 949.9 Other current financial assets 107.7 107.7 6.6 86.4 14.7Cash and cash equivalents 1,419.2 1,419.2 257.6 1,161.6
Non-current liabilities Non-current borrowings 3,132.4 3,260.6 3,132.4 Other non-current financial assets 0.7 0.7 0.7Current liabilities Current borrowings 1,788.8 1,802.7 1,788.8 Other current financial liabilities 213.2 213.2 187.6 20.3 5.3Trade payables 766.1 766.1 766.1
150 Kering ~ 2013 Financial Document
3 FINANCIAL INFORMATION ~ CONSOLIDATED FINANCIAL STATEMENTS AS OF DECEMBER 31, 2013
03_B_VA_V4 20/02/14 16:56 Page150

As of December 31, 2013, the following methods wereused to price financial instruments:
• Financial instruments other than derivatives recorded in assets:
Carrying amounts are based on reasonable estimates ofmarket value, with the exception of marketable securitiesand investments in non-consolidated companies, whosemarket value was determined based on the last knownstock market price as of December 31, 2013 for listedsecurities.
• Financial instruments other than derivatives recorded in liabilities:
The market value of listed bonds was determined on thebasis of the last market price at the end of the reportingperiod.
The market value of other borrowings was calculatedusing other valuation techniques such as discountedfuture cash flows, taking into account the Group’s creditrisk and interest rate conditions as of the end of thereporting period. For indexed bond issues, the valuationalso takes into account the Kering share price andvolatility assumptions.
• Derivative financial instruments:
The market value of derivative financial instruments wasprovided by the financial institutions involved in thetransactions or calculated using standard valuationmethods that factor in market conditions as of the end ofthe reporting period.
The Group has identified three financial instrumentcategories based on the two valuation methods used (listedprices and valuation techniques). In accordance withinternational accounting standards, this classification isused as a basis for presenting the characteristics of financialinstruments recognised in the statement of financialposition at fair value through income as of the end of thereporting period:
Level 1 category: financial instruments quoted on anactive market ;
Level 2 category: financial instruments whose fair valueis determined using valuation techniques drawing onobservable market inputs ;
Level 3 category: financial instruments whose fair valueis determined using valuation techniques drawing onnon-observable inputs (inputs whose value does notresult from the price of observable market transactionsfor the same instrument or from observable market dataavailable as of the end of the reporting period) or inputswhich are only partly observable.
(in € millions) 2012 Breakdown by accounting classificationCarrying Market Fair Available- Loans Amortised Derivatives Derivativesamount value value for-sale and cost qualifying not qualifying
through assets receivables for hedge for hedgeincome accounting accounting
Non-current assets Non-current financial assets 273.7 273.7 64.2 197.1 11.3 1.1Current assets Trade receivables 985.3 985.3 985.3 Other current financial assets 87.0 87.0 9.8 71.7 5.5Cash and cash equivalents 2,081.0 2,081.0 848.5 1,232.5
Non-current liabilities Non-current borrowings 2,988.9 3,225.2 2,988.9 Current liabilities Current borrowings 1,595.1 1,596.7 149.7 1,445.4 Other current financial liabilities 207.9 207.9 189.2 16.3 2.4Trade payables 684.5 684.5 684.5
151
3
2013 Financial Document ~ Kering
CONSOLIDATED FINANCIAL STATEMENTS AS OF DECEMBER 31, 2013 ~ FINANCIAL INFORMATION
03_B_VA_V4 20/02/14 16:56 Page151
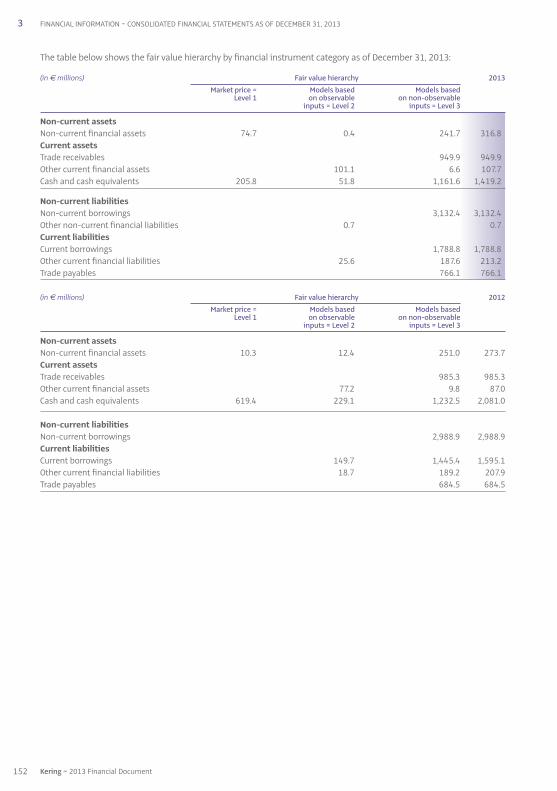
The table below shows the fair value hierarchy by financial instrument category as of December 31, 2013:
(in € millions) Fair value hierarchy 2013Market price = Models based Models based
Level 1 on observable on non-observable inputs = Level 2 inputs = Level 3
Non-current assetsNon-current financial assets 74.7 0.4 241.7 316.8Current assetsTrade receivables 949.9 949.9Other current financial assets 101.1 6.6 107.7Cash and cash equivalents 205.8 51.8 1,161.6 1,419.2
Non-current liabilitiesNon-current borrowings 3,132.4 3,132.4Other non-current financial liabilities 0.7 0.7Current liabilitiesCurrent borrowings 1,788.8 1,788.8Other current financial liabilities 25.6 187.6 213.2Trade payables 766.1 766.1
(in € millions) Fair value hierarchy 2012 Market price = Models based Models based Level 1 on observable on non-observable inputs = Level 2 inputs = Level 3
Non-current assets Non-current financial assets 10.3 12.4 251.0 273.7Current assets Trade receivables 985.3 985.3Other current financial assets 77.2 9.8 87.0Cash and cash equivalents 619.4 229.1 1,232.5 2,081.0
Non-current liabilities Non-current borrowings 2,988.9 2,988.9Current liabilities Current borrowings 149.7 1,445.4 1,595.1Other current financial liabilities 18.7 189.2 207.9Trade payables 684.5 684.5
152 Kering ~ 2013 Financial Document
3 FINANCIAL INFORMATION ~ CONSOLIDATED FINANCIAL STATEMENTS AS OF DECEMBER 31, 2013
03_B_VA_V4 20/02/14 16:56 Page152

Note 31 – Net debt
Group net debt breaks down as follows:
(in € millions) 2013 2012
Gross borrowings excluding the financing of customer loans 4,869.8 4,584.0Fair value hedges (interest rate) (7.7) (11.3)Cash and cash equivalents (1,419.2) (2,081.0)
Net debt 3,442.9 2,491.7
Note 32 – Statement of cash flows
Cash and cash equivalents net of bank overdrafts amounted to €1,237.6 million as of December 31, 2013, reflectingtotal cash and cash equivalents presented in the statement of cash flows.
(in € millions) 2013 2012
Cash and cash equivalents as reported in the statement of financial position 1,419.2 2,081.0
Bank overdrafts (181.6) (105.9)
Cash and cash equivalents as reported in the statement of cash flows 1,237.6 1,975.1
32.1. Cash flow from operating activities
Cash flow from operating activities breaks down as follows:
(in € millions) 2013 2012
Net income from continuing operations 861.5 1,357.9Net recurring charges to depreciation, amortisationand provisions on non-current operating assets 295.8 275.1Expenses relating to share-based payment (4.8) 7.5Impairment losses on non-current operating assets 361.2 53.6Gains/(losses) on asset disposals, net of tax 1.2 (233.4)Income/(expenses) in respect of fair value movements 8.0 (51.2)Deferred tax (89.3) (68.6)Share in earnings of associates (1.6) (36.9)Dividends received from associates - 22.6Other non-cash income and expenses 115.2 150.0
Cash flow from operating activities 1,547.2 1,476.6
32.2. Purchases of property, plant and equipment and intangible assets
Purchases of property, plant and equipment and intangible assets totalled €677.7 million in 2013 and €441.9 millionin 2012 (see section 1.5. of the activity report).
32.3. Acquisitions and disposals of subsidiaries
(in € millions) 2013 2012
Acquisitions of subsidiaries, net of cash acquired (345.0) (219.3)Proceeds from disposals of subsidiaries and associates, net of cash transferred 24.7 916.5
Total (320.3) 697.2
In 2013, acquisitions of subsidiaries mainly concerned Pomellato group, Christopher Kane, Qeelin, France Croco andTannerie de Périers (see Note 3.2.3).
153
3
2013 Financial Document ~ Kering
CONSOLIDATED FINANCIAL STATEMENTS AS OF DECEMBER 31, 2013 ~ FINANCIAL INFORMATION
03_B_VA_V4 20/02/14 16:56 Page153
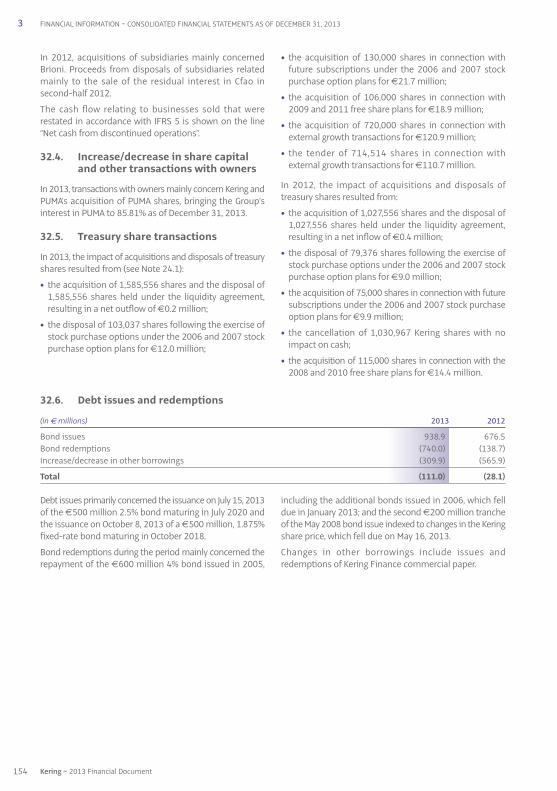
Debt issues primarily concerned the issuance on July 15, 2013of the €500 million 2.5% bond maturing in July 2020 andthe issuance on October 8, 2013 of a €500 million, 1.875%fixed-rate bond maturing in October 2018.
Bond redemptions during the period mainly concerned therepayment of the €600 million 4% bond issued in 2005,
including the additional bonds issued in 2006, which felldue in January 2013; and the second €200 million trancheof the May 2008 bond issue indexed to changes in the Keringshare price, which fell due on May 16, 2013.
Changes in other borrowings include issues andredemptions of Kering Finance commercial paper.
32.6. Debt issues and redemptions
(in € millions) 2013 2012
Bond issues 938.9 676.5Bond redemptions (740.0) (138.7)Increase/decrease in other borrowings (309.9) (565.9)
Total (111.0) (28.1)
In 2012, acquisitions of subsidiaries mainly concernedBrioni. Proceeds from disposals of subsidiaries relatedmainly to the sale of the residual interest in Cfao insecond-half 2012.
The cash flow relating to businesses sold that wererestated in accordance with IFRS 5 is shown on the line“Net cash from discontinued operations”.
32.4. Increase/decrease in share capitaland other transactions with owners
In 2013, transactions with owners mainly concern Kering andPUMA’s acquisition of PUMA shares, bringing the Group’sinterest in PUMA to 85.81% as of December 31, 2013.
32.5. Treasury share transactions
In 2013, the impact of acquisitions and disposals of treasuryshares resulted from (see Note 24.1):
• the acquisition of 1,585,556 shares and the disposal of1,585,556 shares held under the liquidity agreement,resulting in a net outflow of €0.2 million ;
• the disposal of 103,037 shares following the exercise ofstock purchase options under the 2006 and 2007 stockpurchase option plans for €12.0 million ;
• the acquisition of 130,000 shares in connection withfuture subscriptions under the 2006 and 2007 stockpurchase option plans for €21.7 million ;
• the acquisition of 106,000 shares in connection with2009 and 2011 free share plans for €18.9 million ;
• the acquisition of 720,000 shares in connection withexternal growth transactions for €120.9 million ;
• the tender of 714,514 shares in connection withexternal growth transactions for €110.7 million.
In 2012, the impact of acquisitions and disposals oftreasury shares resulted from:
• the acquisition of 1,027,556 shares and the disposal of1,027,556 shares held under the liquidity agreement,resulting in a net inflow of €0.4 million ;
• the disposal of 79,376 shares following the exercise ofstock purchase options under the 2006 and 2007 stockpurchase option plans for €9.0 million ;
• the acquisition of 75,000 shares in connection with futuresubscriptions under the 2006 and 2007 stock purchaseoption plans for €9.9 million ;
• the cancellation of 1,030,967 Kering shares with noimpact on cash ;
• the acquisition of 115,000 shares in connection with the2008 and 2010 free share plans for €14.4 million.
154 Kering ~ 2013 Financial Document
3 FINANCIAL INFORMATION ~ CONSOLIDATED FINANCIAL STATEMENTS AS OF DECEMBER 31, 2013
03_B_VA_V4 20/02/14 16:56 Page154
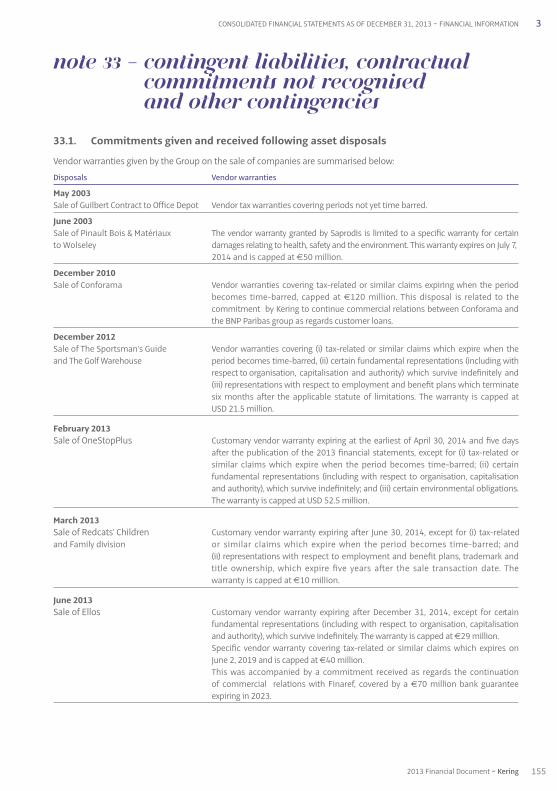
Note 33 – Contingent liabilities, contractualcommitments not recognised and other contingencies
33.1. Commitments given and received following asset disposals
Vendor warranties given by the Group on the sale of companies are summarised below:
Disposals Vendor warranties
May 2003 Sale of Guilbert Contract to Office Depot Vendor tax warranties covering periods not yet time barred.
June 2003 Sale of Pinault Bois & Matériaux The vendor warranty granted by Saprodis is limited to a specific warranty for certainto Wolseley damages relating to health, safety and the environment. This warranty expires on July 7, 2014 and is capped at €50 million.
December 2010 Sale of Conforama Vendor warranties covering tax-related or similar claims expiring when the period
becomes time-barred, capped at €120 million. This disposal is related to thecommitment by Kering to continue commercial relations between Conforama andthe BNP Paribas group as regards customer loans.
December 2012 Sale of The Sportsman’s Guide Vendor warranties covering (i) tax-related or similar claims which expire when the and The Golf Warehouse period becomes time-barred, (ii) certain fundamental representations (including with
respect to organisation, capitalisation and authority) which survive indefinitely and(iii) representations with respect to employment and benefit plans which terminatesix months after the applicable statute of limitations. The warranty is capped at USD 21.5 million.
February 2013 Sale of OneStopPlus Customary vendor warranty expiring at the earliest of April 30, 2014 and five days
after the publication of the 2013 financial statements, except for (i) tax-related orsimilar claims which expire when the period becomes time-barred; (ii) certainfundamental representations (including with respect to organisation, capitalisationand authority), which survive indefinitely; and (iii) certain environmental obligations.The warranty is capped at USD 52.5 million.
March 2013 Sale of Redcats’ Children Customary vendor warranty expiring after June 30, 2014, except for (i) tax-relatedand Family division or similar claims which expire when the period becomes time-barred; and
(ii) representations with respect to employment and benefit plans, trademark andtitle ownership, which expire five years after the sale transaction date. Thewarranty is capped at €10 million.
June 2013 Sale of Ellos Customary vendor warranty expiring after December 31, 2014, except for certain
fundamental representations (including with respect to organisation, capitalisationand authority), which survive indefinitely. The warranty is capped at €29 million.
Specific vendor warranty covering tax-related or similar claims which expires onJune 2, 2019 and is capped at €40 million.
This was accompanied by a commitment received as regards the continuation of commercial relations with Finaref, covered by a €70 million bank guaranteeexpiring in 2023.
155
3
2013 Financial Document ~ Kering
CONSOLIDATED FINANCIAL STATEMENTS AS OF DECEMBER 31, 2013 ~ FINANCIAL INFORMATION
03_B_VA_V4 20/02/14 16:56 Page155

Finance leases
The present value of future lease payments included in “Borrowings” and relating to capitalised assets meeting thedefinition of a finance lease set out in IAS 17 is as follows:
(in € millions) 2013 2012
Less than one year 9.4 9.2One to five years 36.4 31.9More than five years 49.1 52.6 94.9 93.7
Finance costs included (23.9) (28.7)
Present value of future minimum lease payments 71.0 65.0
As of December 31, 2013, the Group does not expect to receive future minimum lease payments under non-cancellablesub-lease agreements.
Operating leases
The amount of contractual obligations presented on theline “Operating lease agreements” represents futureminimum lease payments under operating leaseagreements for the period, which cannot be cancelled bythe lessee. These mainly include non-cancellable rentalpayments in respect of stores, logistics hubs and otherbuildings (head offices and administrative offices).
As of December 31, 2013, total future minimum leasepayments which the Group expects to receive under non-cancellable sub-lease agreements amounted to€2.4 million (€3.3 million as of December 31, 2012).
The 2013 rental charge in respect of minimum lease paymentsamounted to €488.3 million (€622.0 million in 2012), andthe charge for contingent payments was €315.9 million(€327.6 million in 2012), based on actual revenue.
Sub-lease revenue totalled €0.9 million in 2013(€3.5 million in 2012).
33.2. Other commitments given
33.2.1. Contractual obligations
The table below shows all the Group’s contractual commitments and obligations, excluding employee benefitobligations presented in the previous notes.
(in € millions) Payments due by periodLess than One to More thanone year five years five years 2013 2012
Non-current borrowings (see Note 28) 1,788.8 1,739.9 1,392.5 4,921.2 4,853.8Operating lease agreements 481.1 1,080.5 574.5 2,136.1 2,509.7Binding purchase commitments 22.6 22.6 177.1
Total commitments given 2,292.5 2,820.4 1,967.0 7,079.9 7,540.6
Total commitments received
In addition to the vendor warranties described above,minor vendor warranty agreements with standard terms
were set up for the purchasers of the other companiessold by the Group.
156 Kering ~ 2013 Financial Document
3 FINANCIAL INFORMATION ~ CONSOLIDATED FINANCIAL STATEMENTS AS OF DECEMBER 31, 2013
03_B_VA_V4 20/02/14 16:56 Page156
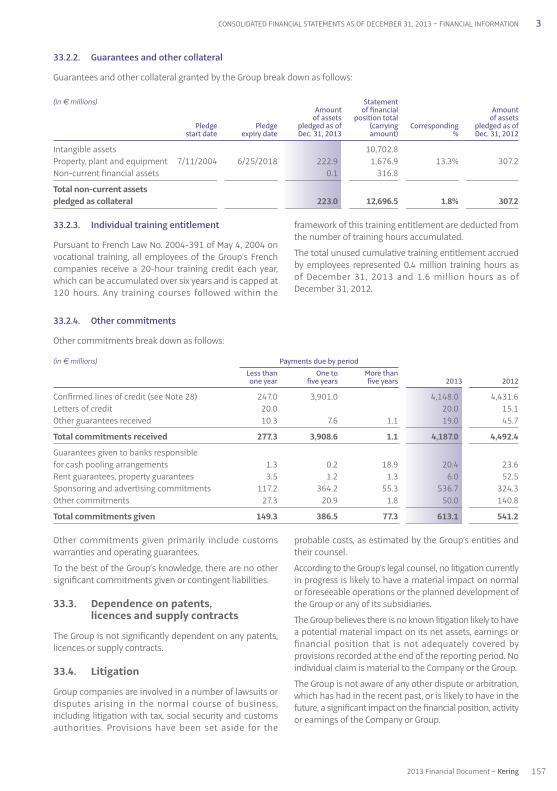
Other commitments given primarily include customswarranties and operating guarantees.
To the best of the Group’s knowledge, there are no othersignificant commitments given or contingent liabilities.
33.3. Dependence on patents, licences and supply contracts
The Group is not significantly dependent on any patents,licences or supply contracts.
33.4. Litigation
Group companies are involved in a number of lawsuits ordisputes arising in the normal course of business,including litigation with tax, social security and customsauthorities. Provisions have been set aside for the
probable costs, as estimated by the Group’s entities andtheir counsel.
According to the Group’s legal counsel, no litigation currentlyin progress is likely to have a material impact on normalor foreseeable operations or the planned development ofthe Group or any of its subsidiaries.
The Group believes there is no known litigation likely to havea potential material impact on its net assets, earnings orfinancial position that is not adequately covered byprovisions recorded at the end of the reporting period. Noindividual claim is material to the Company or the Group.
The Group is not aware of any other dispute or arbitration,which has had in the recent past, or is likely to have in thefuture, a significant impact on the financial position, activityor earnings of the Company or Group.
33.2.4. Other commitments
Other commitments break down as follows:
(in € millions) Payments due by periodLess than One to More thanone year five years five years 2013 2012
Confirmed lines of credit (see Note 28) 247.0 3,901.0 4,148.0 4,431.6Letters of credit 20.0 20.0 15.1Other guarantees received 10.3 7.6 1.1 19.0 45.7
Total commitments received 277.3 3,908.6 1.1 4,187.0 4,492.4
Guarantees given to banks responsible for cash pooling arrangements 1.3 0.2 18.9 20.4 23.6Rent guarantees, property guarantees 3.5 1.2 1.3 6.0 52.5Sponsoring and advertising commitments 117.2 364.2 55.3 536.7 324.3Other commitments 27.3 20.9 1.8 50.0 140.8
Total commitments given 149.3 386.5 77.3 613.1 541.2
33.2.3. Individual training entitlement
Pursuant to French Law No. 2004-391 of May 4, 2004 onvocational training, all employees of the Group’s Frenchcompanies receive a 20-hour training credit each year,which can be accumulated over six years and is capped at120 hours. Any training courses followed within the
framework of this training entitlement are deducted fromthe number of training hours accumulated.
The total unused cumulative training entitlement accruedby employees represented 0.4 million training hours as of December 31, 2013 and 1.6 million hours as ofDecember 31, 2012.
33.2.2. Guarantees and other collateral
Guarantees and other collateral granted by the Group break down as follows:
(in € millions) StatementAmount of financial Amount
of assets position total of assetsPledge Pledge pledged as of (carrying Corresponding pledged as of
start date expiry date Dec. 31, 2013 amount) % Dec. 31, 2012
Intangible assets 10,702.8 Property, plant and equipment 7/11/2004 6/25/2018 222.9 1,676.9 13.3% 307.2Non-current financial assets 0.1 316.8
Total non-current assets pledged as collateral 223.0 12,696.5 1.8% 307.2
157
3
2013 Financial Document ~ Kering
CONSOLIDATED FINANCIAL STATEMENTS AS OF DECEMBER 31, 2013 ~ FINANCIAL INFORMATION
03_B_VA_V4 20/02/14 16:56 Page157

Short-term benefits, long-term benefits and terminationbenefits correspond to amounts paid during the year;post-employment benefits and share-based paymentcorrespond to the amounts recognised as expenses.
A list of the members of the Board of Directors and ExecutiveCommittee is provided in the “ Corporate Governance ”section of the Reference Document.
34.2. Associates
In the normal course of business, the Group enters into transactions with associates on an arm’s length basis.
The main transactions with associates are summarised in the following table:
(in € millions) 2013 2012
Trade receivables - 1.6Sales of goods and services - 17.9
34.3. Senior executive remuneration
The table below shows remuneration paid to members of the Board of Directors and the Group’s Executive Committee:
(in € millions) 2013 2012
Short-term benefits 20.0 24.7Payroll taxes 4.3 6.1High income tax 2.0 -Post-employment benefits 0.9 0.6Other long-term benefits 2.0 1.0Termination indemnities - 4.3Share-based payment 3.7 6.5
Total 32.9 43.2
34.1. Related party controlling the Group
Kering is controlled by Artémis, which in turn is wholly ownedby Société Financière Pinault. As of December 31, 2013,the Artémis group held 40.9% of Kering’s share capitaland 57.5% of its voting rights.
The main transactions carried out between Kering’sconsolidated companies and Artémis in 2013 aredescribed below:
• payment of an interim dividend in respect of 2013totalling €77.4 million in January 2014 ;
• balancing payment of the cash dividend for 2012 of €116.1 million, further to the payment of an interimdividend of €77.4 million in January 2013 (€180.7 millionin 2011) and a complementary in-kind dividend settledin Groupe Fnac shares for €129.2 million;
• recognition of fees totalling €1.0 million (€2.2 millionin 2012) for (i) business development consulting servicesand complex transaction support, and (ii) the supply ofdevelopment opportunities, new business and costreduction solutions. These fees are governed by anagreement reviewed by the Audit Committee andapproved by the Board of Directors.
Note 34 – Transactions with related parties
158 Kering ~ 2013 Financial Document
3 FINANCIAL INFORMATION ~ CONSOLIDATED FINANCIAL STATEMENTS AS OF DECEMBER 31, 2013
03_B_VA_V4 20/02/14 16:56 Page158

Exclusive negotiations for the disposal of La Redoute andRelais Colis continued between Kering and the Directors,who presented the details of the methods and
procedures of their business plan to the staffrepresentative bodies as part of the normal information-consultation process prior to the transfer in January 2014.
Note 35 – Subsequent events
159
3
2013 Financial Document ~ Kering
CONSOLIDATED FINANCIAL STATEMENTS AS OF DECEMBER 31, 2013 ~ FINANCIAL INFORMATION
03_B_VA_V4 20/02/14 16:56 Page159

Kering Parent company
LUXURY DIVISION
France
ARCADES PONTHIEU F 95.00 F 95.00
BALENCIAGA SA F 100.00 F 100.00
BOTTEGA VENETA France SAS F 100.00 F 100.00
BOUCHERON HOLDING SAS F 100.00 F 100.00
BOUCHERON PARFUM SAS F 100.00 F 100.00
BOUCHERON SAS F 100.00 F 100.00
BRIONI France SA F 100.00 F 100.00
C. MENDES SAS F 100.00 F 100.00
DODO PARIS SAS F 81.00 Acquisition
France CROCO SAS F 85.00 Acquisition
TANNERIE DE PERIERS SAS F 85.00 Acquisition
GG FRANCE 11 SAS F 100.00 F 100.00
GG FRANCE HOLDING SAS F 100.00 F 100.00
GG FRANCE SERVICES SAS F 100.00 F 100.00
GPO HOLDING SAS F 100.00 Creation
GUCCI FRANCE SAS F 100.00 F 100.00
GUCCI GROUP WATCHES France SAS F 100.00 F 100.00
LES BOUTIQUES BOUCHERON SAS F 100.00 F 100.00
POMELLATO PARIS SA F 81.00 Acquisition
QEELIN France SARL F 100.00 Acquisition
SOWIND France SAS(1) F 50.00 F 50.00
STELLA MCCARTNEY France SAS F 50.00 F 50.00
YSL VENTES PRIVEES France SAS F 100.00 F 100.00
YVES SAINT LAURENT BOUTIQUE France SAS F 100.00 F 100.00
YVES SAINT LAURENT PARFUMS SAS F 100.00 F 100.00
YVES SAINT LAURENT SAS(1) F 100.00 F 100.00
Germany
BOTTEGA VENETA GERMANY GmbH F 100.00 F 100.00
DODO DEUTSCHLAND GmbH F 81.00 Acquisition
GG LUXURY GOODS GmbH F 100.00 F 100.00
POMELLATO DEUTSCHLAND GmbH F 81.00 Acquisition
TRADEMA GmbH(1) F 50.00 F 50.00
YVES SAINT LAURENT GERMANY GmbH F 100.00 F 100.00
Austria
BOTTEGA VENETA AUSTRIA GmbH F 100.00 Creation
GUCCI AUSTRIA GmbH F 100.00 F 100.00
YVES SAINT LAURENT AUSTRIA GmbH F 100.00 F 100.00
Belgium
GUCCI BELGIUM SA Liquidation F 100.00
LA MERIDIANA FASHION SA F 100.00 F 100.00
SERGIO ROSSI BELGIUM SPRL F 100.00 F 100.00
Spain
BOTTEGA VENETA ESPANA SL F 100.00 F 100.00
BRIONI RETAIL SPAGNA SRL F 100.00 F 100.00
DODO SPAIN SA F 81.00 Acquisition
LUXURY GOODS SPAIN SL F 100.00 F 100.00
LUXURY TIMEPIECES ESPAÑA SL F 100.00 F 100.00
NOGA LUXE SL F 100.00 F 100.00
SERGIO ROSSI ESPANA SL F 100.00 F 100.00
STELLA MCCARTNEY SPAIN SL F 50.00 F 50.00
YVES SAINT LAURENT SPAIN SA F 100.00 F 100.00
United Kingdom
ALEXANDER MCQUEEN TRADING Ltd F 100.00 F 100.00
AUTUMNPAPER Limited F 100.00 F 100.00
BALENCIAGA UK Ltd F 100.00 F 100.00
BIRDSWAN SOLUTIONS Ltd F 100.00 F 100.00
BOTTEGA VENETA UK CO. Limited F 100.00 F 100.00
BOUCHERON UK Ltd F 100.00 F 100.00
BRIONI UK Ltd F 100.00 F 100.00
CHRISTOPHER KANE Ltd(1) F 80.00 Acquisition
DODO UK Ltd F 81.00 Acquisition
GUCCI Limited F 100.00 F 100.00
LUXURY TIMEPIECES (UK) Ltd F 100.00 F 100.00
PAINTGATE Limited F 100.00 F 100.00
POMELLATO UK Ltd F 81.00 Acquisition
QEELIN UK Ltd F 100.00 Acquisition
Company % interestDec. 31, 2013 Dec. 31, 2012
Company % interestDec. 31, 2013 Dec. 31, 2012
Note 36 – List of consolidated subsidiaries as of December 31, 2013
Details of Group subsidiaries are provided below.
Consolidation method: Full consolidation : F
Equity method : E
160 Kering ~ 2013 Financial Document
3 FINANCIAL INFORMATION ~ CONSOLIDATED FINANCIAL STATEMENTS AS OF DECEMBER 31, 2013
03_B_VA_V4 20/02/14 16:56 Page160

SERGIO ROSSI UK Limited F 100.00 F 100.00
STELLA MCCARTNEY Limited F 50.00 F 50.00
YVES SAINT LAURENT UK Ltd F 100.00 F 100.00
Greece
LUXURY GOODS GREECE AE F 94.75 F 94.75
Hungary
GUCCI HUNGARY KFT F 100.00 F 100.00
Ireland
GUCCI IRELAND Limited F 100.00 F 100.00
Italy
ALEXANDER MCQUEEN ITALIA SRL F 100.00 Creation
ALTO VICENTINO PELLETTERIE SRL F 100.00 F 100.00
ARDORA SRL F 100.00 F 100.00
BRIONI SPA F 100.00 F 100.00
BRIONI OUTLET SRL F 100.00 F 100.00
BRIONI RETAIL SRL F 100.00 F 100.00
BRIONI RETAIL EUROPA SRL F 100.00 F 100.00
BRIONI RETAIL ITALIA SRL F 100.00 F 100.00
BURINI SRL F 100.00 F 100.00
B.V. CALZATURE SRL F 100.00 Creation
B.V. ITALIA SRL F 100.00 F 100.00
B.V. OUTLETS SRL F 100.00 F 100.00
B.V. SERVIZI SRL F 100.00 F 100.00
BOTTEGA VENETA SRL F 100.00 F 100.00
CALZATURIFICIO FLORA SRL F 100.00 F 100.00
CONCERIA BLU TONIC SpA F 51.00 F 51.00
CAPRI GROUP SRL F 100.00 F 100.00
CARAVEL PELLI PREGIATE SpA F 100.00 F 100.00
DESIGN MANAGEMENT SRL F 100.00 F 100.00
E_lite Spa(1) F 51.00 F 51.00
GARPE SRL(1) F 100.00 F 100.00
GAUGUIN SRL F 100.00 F 100.00
G-CARDS EUROPE SRL F 100.00 F 100.00
G COMMERCE EUROPE SpA F 100.00 F 100.00
G.F. LOGISTICA SRL F 100.00 F 100.00
G.F. SERVICES SRL F 100.00 F 100.00
GGW ITALIA SRL F 100.00 F 100.00
GJP SRL F 100.00 F 100.00
GPA SRL(1) F 100.00 F 100.00
GUCCI IMMOBILLARE LECCIO SRL(1) F 100.00 F 100.00
GUCCI LOGISTICA SPA F 100.00 F 100.00
GUCCIO GUCCI SpA F 100.00 F 100.00
GT SRL(1) F 100.00 F 100.00
LUXURY GOODS ITALIA SpA F 100.00 F 100.00
LUXURY GOODS OUTLET SRL F 100.00 F 100.00
MANIFATTURA VENETA PELLETERIE SRL F 51.00 F 51.00
PIGINI SRL(1) F 100.00 F 100.00
POMELLATO SpA F 81.00 Acquisition
POMELLATO EUROPA SpA F 81.00 Acquisition
REGAIN 1957 SRL(1) F 100.00 F 100.00
ROMAN MODE SRL F 100.00 F 100.00
ROMAN STYLE SpA F 100.00 F 100.00
SERGIO ROSSI MANUFACTURING SRL F 100.00 F 100.00
SERGIO ROSSI RETAIL SRL F 100.00 F 100.00
SERGIO ROSSI SpA F 100.00 F 100.00
SFORZA SRL F 100.00 F 100.00
SOWIND ITALIA SRL(1) F 50.00 F 50.00
STELLA MCCARTNEY ITALIA SRL F 50.00 F 50.00
TIGER FLEX SRL(1) F 100.00 F 100.00
TRAMOR SRL Disposal F 100.00
YVES SAINT LAURENT DEVELOPMENT SRL F 100.00 F 100.00
YVES SAINT LAURENT LOGISTICA SRL F 100.00 Creation
Luxembourg
BOTTEGA VENETA INTERNATIONAL SARL F 100.00 F 100.00
BOUCHERON LUXEMBOURG SARL F 100.00 F 100.00
CASTERA SARL F 100.00 F 100.00
LUXURY FASHION LUXEMBOURG SA F 50.00 Creation
QEELIN HOLDING LUXEMBOURG SA F 100.00 Creation
SERGIO ROSSI INTERNATIONAL SARL F 100.00 F 100.00
Monaco
BOUCHERON SAM F 100.00 F 100.00
GUCCI SAM F 100.00 F 100.00
SMHJ SAM F 81.00 Acquisition
SAM YVES SAINT LAURENTOF MONACO F 100.00 F 100.00
Netherlands
BOTTEGA VENETA HOLDING BV F 100.00 F 100.00
GEMINI ARUBA NV F 100.00 F 100.00
GG MIDDLE EAST BV F 100.00 F 100.00
GUCCI ASIAN HOLDING BV F 100.00 F 100.00
GUCCI NETHERLANDS BV F 100.00 F 100.00
GG OTHER TERRITORIES BV F 100.00 Creation
161
3
2013 Financial Document ~ Kering
CONSOLIDATED FINANCIAL STATEMENTS AS OF DECEMBER 31, 2013 ~ FINANCIAL INFORMATION
Company % interestDec. 31, 2013 Dec. 31, 2012
Company % interestDec. 31, 2013 Dec. 31, 2012
03_B_VA_V4 20/02/14 16:56 Page161

G DISTRIBUTION BV F 100.00 Creation
G OPERATIONS BV F 100.00 F 100.00
OLIMA BV F 100.00 F 100.00
Czech Republic
BRIONI PRAGUE SRO F 100.00 F 100.00
LUXURY GOODS CZECH REPUBLIC SRO F 100.00 F 100.00
Russia
GUCCI RUS OOO F 100.00 Creation
Serbia
GUCCI LUXURY TANNERY DOO F 51.00 Creation
Switzerland
BOUCHERON (SUISSE) SA F 100.00 F 100.00
BOTTEGA VENETA SA F 100.00 Creation
BRIONI SWITZERLAND SA F 100.00 F 100.00
FABBRICA QUADRANTI SA F 51.00 Acquisition
LUXURY FASHION SWITZERLAND SA F 50.00 Creation
LUXURY GOODS INTERNATIONAL SA F 100.00 F 100.00
LUXURY GOODS LOGISTIC SA F 51.00 F 51.00
LUXURY GOODS OPERATIONS SA F 51.00 F 51.00
LUXURY GOODS OUTLET EUROPE SAGL F 100.00 F 100.00
LUXURY TIMEPIECES INTERNATIONAL SA Merger F 100.00
SOWIND GROUP SA(1) F 50.00 F 50.00
SOWIND SA(1) F 50.00 F 50.00
Sweden
GUCCI SWEDEN AB F 100.00 F 100.00
Brazil
BOTTEGA VENETA HOLDING Ltda F 100.00 F 100.00
GUCCI BRASIL IMPORTACAO E EXPORTACAO Ltda F 100.00 F 100.00
Canada
G. BOUTIQUES Inc. F 100.00 F 100.00
United States
741 MADISON AVENUE Corp. F 60.00 Acquisition
BALENCIAGA AMERICA Inc. F 100.00 F 100.00
BOTTEGA VENETA Inc. F 100.00 F 100.00
BOUCHERON JOAILLERIE (USA) Inc. F 100.00 F 100.00
BRIONI RETAIL ASPEN Inc. F 100.00 F 100.00
BRIONI RETAIL BAL HARBOUR LLC F 100.00 F 100.00
BRIONI RETAIL BEVERLY HILLS Inc. F 100.00 F 100.00
BRIONI RETAIL HOLDING Inc. F 100.00 F 100.00
BRIONI RETAIL NEW YORK Inc. F 100.00 F 100.00
BRIONI ROMAN STYLE USA CORPORATION Ltd F 100.00 F 100.00
BRIONI STORE LLC F 100.00 F 100.00
B/W CLOTHIERS LLC F 50.00 F 50.00
DODO RETAIL Inc. F 60.00 Acquisition
E_LITE US Inc.(1) F 51.00 F 51.00
GUCCI AMERICA Inc. F 100.00 F 100.00
GUCCI CARIBBEAN Inc. F 100.00 F 100.00
GUCCI GROUP WATCHES Inc. F 100.00 F 100.00
LUXURY HOLDINGS Inc. F 100.00 F 100.00
POMELLATO USA Inc. F 60.00 Acquisition
ROMAN LOOK Ltd F 100.00 F 100.00
SERGIO ROSSI USA Inc. F 100.00 F 100.00
STELLA MCCARTNEY AMERICA Inc. F 50.00 F 50.00
TRADEMA OF AMERICA Inc.(1) F 50.00 F 50.00
YVES SAINT LAURENT AMERICA HOLDING Inc. F 100.00 F 100.00
YVES SAINT LAURENT AMERICA Inc. F 100.00 F 100.00
Mexico
BOTTEGA VENETA MEXICO, S DE RL DE CV F 100.00 F 100.00
BOTTEGA VENETA SERVICIOS, S DE RL DE CV F 100.00 F 100.00
D ITALIAN CHARMS SA DE CV F 81.00 Acquisition
GUCCI IMPORTACIONES SA DE CV F 100.00 F 100.00
GUCCI MEXICO SA DE CV F 100.00 F 100.00
RETAIL LUXURY SERVICIOS SA DE CV F 100.00 F 100.00
Australia
BOTTEGA VENETA AUSTRALIA PTY Ltd F 100.00 F 100.00
GUCCI AUSTRALIA PTY Limited F 100.00 F 100.00
New Zealand
GUCCI NEW ZEALAND Ltd F 100.00 F 100.00
China
ALEXANDER MCQUEEN (HONG KONG) Limited F 100.00 F 100.00
ALEXANDER MCQUEEN (SHANGHAI) TRADING Ltd F 100.00 F 100.00
BALENCIAGA ASIA PACIFIC Limited F 100.00 F 100.00
BALENCIAGA FASHION SHANGHAI CO Ltd F 100.00 F 100.00
BOTTEGA VENETA HONG KONG Limited F 100.00 F 100.00
BOTTEGA VENETA (CHINA) TRADING Ltd F 100.00 F 100.00
162 Kering ~ 2013 Financial Document
3 FINANCIAL INFORMATION ~ CONSOLIDATED FINANCIAL STATEMENTS AS OF DECEMBER 31, 2013
Company % interestDec. 31, 2013 Dec. 31, 2012
Company % interestDec. 31, 2013 Dec. 31, 2012
03_B_VA_V4 20/02/14 16:56 Page162

BOTTEGA VENETA MACAU Ltd F 100.00 F 100.00
BRIONI (SHANGHAI) TRADING Ltd F 100.00 F 100.00
BOUCHERON HONG KONG Limited F 100.00 F 100.00
GUCCI (CHINA) TRADING Ltd F 100.00 F 100.00
GUCCI ASIA COMPANY Ltd F 100.00 Creation
GUCCI GROUP (HONG KONG) Limited F 100.00 F 100.00
GUCCI MACAU Limited F 100.00 F 100.00
LGI (SHANGHAI) ENTERPRISE MANAGEMENT Ltd F 100.00 F 100.00
GUCCI WATCHES MARKETING CONSULTING (SHANGHAI) Ltd F 100.00 F 100.00
LUXURY TIMEPIECES (HONG KONG) Limited F 100.00 F 100.00
POMELLATO CHINA Ltd F 49.00 Acquisition
POMELLATO SHANGHAI Co. Ltd F 49.00 Acquisition
POMELLATO PACIFIC Ltd F 61.00 Acquisition
QEELIN Limited F 100.00 Acquisition
QEELIN TRADING (SHANGHAI) Co. Limited F 100.00 Acquisition
SERGIO ROSSI (SHANGHAI) TRADING Ltd F 100.00 F 100.00
SERGIO ROSSI MACAU Ltd F 100.00 F 100.00
STELLA MCCARTNEY (SHANGHAI) TRADING Ltd F 50.00 F 50.00
SOWIND ASIA Ltd(1) F 50.00 F 50.00
YVES SAINT LAURENT MACAU Limited F 100.00 F 100.00
YVES SAINT LAURENT (SHANGHAI) TRADING Limited F 100.00 F 100.00
Korea
BALENCIAGA KOREA Ltd F 100.00 F 100.00
BOTTEGA VENETA KOREA Ltd F 100.00 F 100.00
BOUCHERON KOREA Ltd F 100.00 Creation
GUCCI GROUP KOREA Ltd F 100.00 F 100.00
Guam
BOTTEGA VENETA GUAM Inc. F 100.00 F 100.00
GUCCI GROUP GUAM Inc. F 100.00 F 100.00
India
GUCCI INDIA PRIVATE Ltd(1) F 100.00 F 100.00
LUXURY GOODS RETAIL PRIVATE LGR F 51.00 F 51.00
Japan
BALENCIAGA JAPAN Ltd F 100.00 F 100.00
BOTTEGA VENETA JAPAN Limited F 100.00 F 100.00
BRIONI JAPAN & CO. Limited F 100.00 F 100.00
E_LITE JAPAN Ltd(1) F 51.00 Creation
GUCCI YUGEN KAISHA F 100.00 F 100.00
LUXURY TIMEPIECES JAPAN Limited F 100.00 F 100.00
POMELLATO JAPAN Co Ltd F 61.00 Acquisition
STELLA MCCARTNEY JAPAN Limited F 50.00 F 50.00
SOWIND JAPAN KK(1) F 50.00 F 50.00
Bahrain
FLORENCE 1921 WLL F 49.00 Creation
United Arab Emirates
LUXURY GOODS GULF LLC F 49.00 F 49.00
LUXURY FASHION GULF LLC F 49.00 Creation
Kuwait
LUXURY GOODS KUWAIT Wll F 49.00 F 49.00
Qatar
LUXURY GOODS QATAR LLC F 49.00 F 49.00
Malaysia
BOTTEGA VENETA MALAYSIA Sdn Bhd F 100.00 F 100.00
GUCCI (MALAYSIA) Sdn Bhd F 100.00 F 100.00
Singapore
BOTTEGA VENETA SINGAPORE PRIVATE Limited F 100.00 F 100.00
GUCCI SINGAPORE PTE Limited F 100.00 F 100.00
Taiwan
BOUCHERON TAIWAN CO Ltd(1) F 100.00 F 100.00
GUCCI GROUP WATCHES TAIWAN Limited F 100.00 F 100.00
Turkey
POMELLATO MUCEVHERAT VE AKSESUAR DAGITIM VE TIKARET Limited SIRKETI F 81.00 Acquisition
Thailand
GUCCI THAILAND CO Ltd F 100.00 F 100.00
G-OPERATIONS FRASEC Ltd F 49.00 Acquisition
CLOSED-CYCLE BREEDING INTERNATIONAL Ltd F 48.00 Acquisition
FNAC
GROUPE FNAC Disposal F 100.00
France
FNAC SA Disposal F 100.00
ALIZE – SFL Disposal F 100.00
ATTITUDE Disposal F 100.00
CODIREP Disposal F 100.00
FRANCE BILLET Disposal F 100.00
163
3
2013 Financial Document ~ Kering
CONSOLIDATED FINANCIAL STATEMENTS AS OF DECEMBER 31, 2013 ~ FINANCIAL INFORMATION
Company % interestDec. 31, 2013 Dec. 31, 2012
Company % interestDec. 31, 2013 Dec. 31, 2012
03_B_VA_V4 20/02/14 16:56 Page163
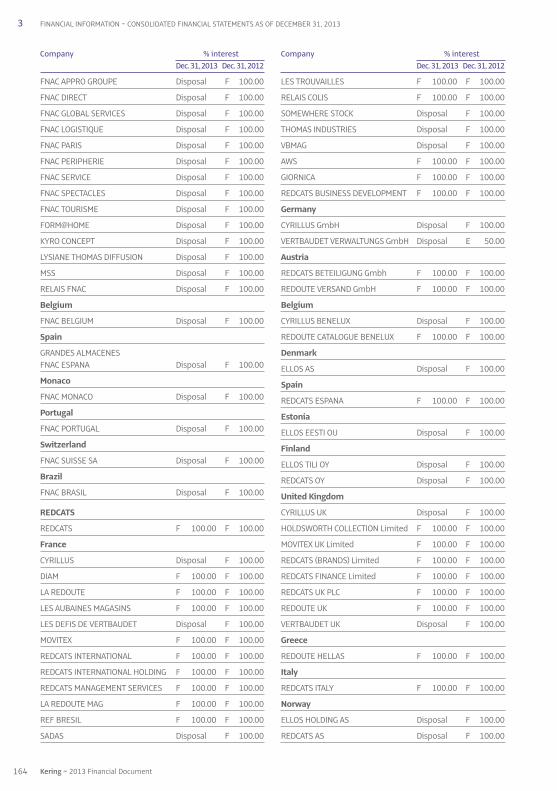
FNAC APPRO GROUPE Disposal F 100.00
FNAC DIRECT Disposal F 100.00
FNAC GLOBAL SERVICES Disposal F 100.00
FNAC LOGISTIQUE Disposal F 100.00
FNAC PARIS Disposal F 100.00
FNAC PERIPHERIE Disposal F 100.00
FNAC SERVICE Disposal F 100.00
FNAC SPECTACLES Disposal F 100.00
FNAC TOURISME Disposal F 100.00
FORM@HOME Disposal F 100.00
KYRO CONCEPT Disposal F 100.00
LYSIANE THOMAS DIFFUSION Disposal F 100.00
MSS Disposal F 100.00
RELAIS FNAC Disposal F 100.00
Belgium
FNAC BELGIUM Disposal F 100.00
Spain
GRANDES ALMACENES FNAC ESPANA Disposal F 100.00
Monaco
FNAC MONACO Disposal F 100.00
Portugal
FNAC PORTUGAL Disposal F 100.00
Switzerland
FNAC SUISSE SA Disposal F 100.00
Brazil
FNAC BRASIL Disposal F 100.00
REDCATS
REDCATS F 100.00 F 100.00
France
CYRILLUS Disposal F 100.00
DIAM F 100.00 F 100.00
LA REDOUTE F 100.00 F 100.00
LES AUBAINES MAGASINS F 100.00 F 100.00
LES DEFIS DE VERTBAUDET Disposal F 100.00
MOVITEX F 100.00 F 100.00
REDCATS INTERNATIONAL F 100.00 F 100.00
REDCATS INTERNATIONAL HOLDING F 100.00 F 100.00
REDCATS MANAGEMENT SERVICES F 100.00 F 100.00
LA REDOUTE MAG F 100.00 F 100.00
REF BRESIL F 100.00 F 100.00
SADAS Disposal F 100.00
LES TROUVAILLES F 100.00 F 100.00
RELAIS COLIS F 100.00 F 100.00
SOMEWHERE STOCK Disposal F 100.00
THOMAS INDUSTRIES Disposal F 100.00
VBMAG Disposal F 100.00
AWS F 100.00 F 100.00
GIORNICA F 100.00 F 100.00
REDCATS BUSINESS DEVELOPMENT F 100.00 F 100.00
Germany
CYRILLUS GmbH Disposal F 100.00
VERTBAUDET VERWALTUNGS GmbH Disposal E 50.00
Austria
REDCATS BETEILIGUNG Gmbh F 100.00 F 100.00
REDOUTE VERSAND GmbH F 100.00 F 100.00
Belgium
CYRILLUS BENELUX Disposal F 100.00
REDOUTE CATALOGUE BENELUX F 100.00 F 100.00
Denmark
ELLOS AS Disposal F 100.00
Spain
REDCATS ESPANA F 100.00 F 100.00
Estonia
ELLOS EESTI OU Disposal F 100.00
Finland
ELLOS TILI OY Disposal F 100.00
REDCATS OY Disposal F 100.00
United Kingdom
CYRILLUS UK Disposal F 100.00
HOLDSWORTH COLLECTION Limited F 100.00 F 100.00
MOVITEX UK Limited F 100.00 F 100.00
REDCATS (BRANDS) Limited F 100.00 F 100.00
REDCATS FINANCE Limited F 100.00 F 100.00
REDCATS UK PLC F 100.00 F 100.00
REDOUTE UK F 100.00 F 100.00
VERTBAUDET UK Disposal F 100.00
Greece
REDOUTE HELLAS F 100.00 F 100.00
Italy
REDCATS ITALY F 100.00 F 100.00
Norway
ELLOS HOLDING AS Disposal F 100.00
REDCATS AS Disposal F 100.00
164 Kering ~ 2013 Financial Document
3 FINANCIAL INFORMATION ~ CONSOLIDATED FINANCIAL STATEMENTS AS OF DECEMBER 31, 2013
Company % interestDec. 31, 2013 Dec. 31, 2012
Company % interestDec. 31, 2013 Dec. 31, 2012
03_B_VA_V4 20/02/14 16:56 Page164

REDOUTE NORWAY AS F 100.00 F 100.00
Portugal
REDCATS PORTUGAL F 100.00 F 100.00
Russia
LA REDOUTE RUS F 100.00 F 100.00
Sweden
ELLOS AB Disposal F 100.00
JOTEX AB Disposal F 100.00
REDCATS NORDIC AB Disposal F 100.00
REDCATS FINANS AB Disposal F 100.00
REDOUTE SVERIGE AB F 100.00 F 100.00
Switzerland
CYRILLUS SUISSE Disposal F 100.00
REDCATS SUISSE F 100.00 F 100.00
Brazil
REDCATS DO BRASIL F 100.00 F 100.00
Canada
REDCATS USA CANADA HOLDING Inc. Disposal F 100.00
United States
AVENUE GIFT CARDS, Inc. Disposal F 100.00
BNY SERVICE CORPORATION Disposal F 100.00
JESSICA LONDON Inc. Disposal F 100.00
REDCATS USA DROP SHIP Disposal F 100.00
REDCATS USA GIFT CARDS Disposal F 100.00
REDCATS USA LLC Disposal F 100.00
REDCATS USA LP Disposal F 100.00
REDCATS USA MANAGEMENT SERVICES LP Disposal F 100.00
REDCATS USA, Inc. Disposal F 100.00
SPS INVESTMENT LLC Disposal F 100.00
VLP CORPORATION Disposal F 100.00
RUSA TEXAS LLC Disposal F 100.00
Hong Kong
REDCATS ASIA F 100.00 F 100.00
REDCATS MANAGEMENT CONSULTING (SHANGHAI) F 100.00 F 100.00
India
REDCATS INDIA PRIVATE Limited F 100.00 F 100.00
Japan
CYRILLUS JAPON Disposal F 100.00
Turkey
REDCATS TEKSTIL ITHALAT VE IHRACAT TICARET F 100.00 F 100.00
China
REDCATS COMMERCE ET TRADING F 100.00 F 100.00
PUMA
PUMA SE (GERMANY) F 85.81 F 82.99
France
DOBOTEX FRANCE SAS(1) F 100.00 F 100.00
PUMA FRANCE SAS F 100.00 F 100.00
PUMA SPEEDCAT SAS F 100.00 F 100.00
Germany
DOBOTEX DEUTSCHLAND GmbH(1) F 100.00 F 100.00
BRANDON GERMANY GmbH F 100.00 F 100.00
PUMA AVANTI GmbH Merger F 100.00
PUMA MOSTRO GmbH F 100.00 F 100.00
PUMA SPRINT GmbH F 100.00 F 100.00
PUMA VERTRIEB GmbH F 100.00 F 100.00
Austria
AUSTRIA PUMA DASSLER GmbH F 100.00 F 100.00
DOBOTEX ÖSTERREICH GmbH(1) F 100.00 F 100.00
Bulgaria
PUMA BULGARIA EOOD F 100.00 F 100.00
Cyprus
PUMA CYPRUS Ltd(1) F 100.00 F 100.00
Croatia
PUMA Sport HRVATSKA DOO F 100.00 F 100.00
Denmark
PUMA DENMARK A/S F 100.00 F 100.00
Spain
PUMA IBERIA SLU F 100.00 F 100.00
DOBOTEX SPAIN SL(1) F 100.00 F 100.00
Estonia
PUMA ESTONIA OU F 100.00 F 100.00
Finland
BRANDON OY F 100.00 F 100.00
PUMA FINLAND OY F 100.00 F 100.00
TRETORN FINLAND OY F 100.00 F 100.00
United Kingdom
DOBOTEX UK Ltd(1) F 100.00 F 100.00
BRANDON MERCHANDISE UK Ltd F 100.00 F 100.00
165
3
2013 Financial Document ~ Kering
CONSOLIDATED FINANCIAL STATEMENTS AS OF DECEMBER 31, 2013 ~ FINANCIAL INFORMATION
Company % interestDec. 31, 2013 Dec. 31, 2012
Company % interestDec. 31, 2013 Dec. 31, 2012
03_B_VA_V4 20/02/14 16:56 Page165

PUMA PREMIER Ltd F 100.00 F 100.00
PUMA UNITED KINGDOM Ltd F 100.00 F 100.00
Greece
PUMA HELLAS SA(1) F 100.00 F 100.00
Hungary
PUMA HUNGARY KFT F 100.00 F 100.00
Ireland
TRETORN R&D Ltd F 100.00 F 100.00
Israel
PUMA Sport ISRAEL Ltd F 100.00 F 100.00
Italy
DOBOTEX ITALIA SRL(1) F 100.00 F 100.00
PUMA ITALIA SRL F 100.00 F 100.00
Lithuania
PUMA BALTIC UAB F 100.00 F 100.00
Malta
PUMA BLUE SEA Ltd F 100.00 F 100.00
PUMA MALTA Ltd F 100.00 F 100.00
PUMA RACING Ltd F 100.00 F 100.00
Norway
BRANDON AS Liquidation F 100.00
PUMA NORWAY AS F 100.00 F 100.00
TRETORN NORWAY AS F 100.00 F 100.00
Netherlands
DOBO LOGIC BV(1) F 100.00 F 100.00
DOBOTEX LICENSING HOLDING BV F 100.00 F 100.00
DOBOTEX BV(1) F 100.00 F 100.00
DOBOTEX INTERNATIONAL BV(1) F 100.00 F 100.00
PUMA INTERNATIONAL SPORTS MARKETING BV F 100.00 Creation
PUMA BENELUX BV F 100.00 F 100.00
Poland
PUMA POLSKA SPOLKA ZOO F 100.00 F 100.00
Portugal
PUMA PORTUGAL ARTIGOS DESPORTIVOS Lda Merger F 100.00
Czech Republic
PUMA CZECH REPUBLIC SRO F 100.00 F 100.00
Romania
PUMA Sport ROMANIA SRL F 100.00 F 100.00
Russia
PUMA-RUS Ltd F 100.00 F 100.00
Serbia
PUMA SERBIA DOO F 100.00 F 100.00
Slovakia
PUMA SLOVAKIA SRO F 100.00 F 100.00
Slovenia
PUMA LJUBLJANA, TRGOVINA, DOO Liquidation F 100.00
Sweden
BRANDON AB F 100.00 F 100.00
BRANDON COMPANY AB F 100.00 F 100.00
BRANDON SERVICES AB Disposal F 100.00
HUNT Sport AB F 100.00 F 100.00
PUMA NORDIC AB F 100.00 F 100.00
TRETORN AB F 100.00 F 100.00
TRETORN SWEDEN AB F 100.00 F 100.00
2EXPRESSIONS MERCHANDISE SVENSKA AB F 100.00 F 100.00
Switzerland
DOBOTEX SWITZERLAND AG(1) F 100.00 F 100.00
MOUNT PUMA AG (SWITZERLAND) F 100.00 F 100.00
PUMA RETAIL AG F 100.00 F 100.00
PUMA SCHWEIZ AG F 100.00 F 100.00
Ukraine
PUMA UKRAINE Ltd F 100.00 F 100.00
Argentina
UNISOL SA F 100.00 F 100.00
Brazil
PUMA SPORTS Ltda F 100.00 F 100.00
Canada
PUMA CANADA, Inc. F 100.00 F 100.00
Chile
PUMA CHILE SA F 100.00 F 100.00
PUMA SERVICIOS SpA F 100.00 F 100.00
United States
COBRA Golf Inc. F 100.00 F 100.00
PUMA NORTH AMERICA, Inc. F 100.00 F 100.00
PUMA SUEDE HOLDING, Inc. F 100.00 F 100.00
BRANDON USA, Inc. F 100.00 F 100.00
PUMA WHEAT ACCESSORIES, Ltd F 51.00 F 51.00
JANED LLC F 51.00 F 51.00
British Virgin Islands
LIBERTY CHINA HOLDING Ltd(1) F 100.00 F 100.00
166 Kering ~ 2013 Financial Document
3 FINANCIAL INFORMATION ~ CONSOLIDATED FINANCIAL STATEMENTS AS OF DECEMBER 31, 2013
Company % interestDec. 31, 2013 Dec. 31, 2012
Company % interestDec. 31, 2013 Dec. 31, 2012
03_B_VA_V4 20/02/14 16:56 Page166

Mexico
DOBOTEX DE MEXICO SA DE CV F 100.00 F 100.00
IMPORTACIONES RDS SA DE CV F 100.00 F 100.00
PUMA MEXICO SPORT SA DE CV F 100.00 F 100.00
SERVICIOS PROFESIONALES RDS SA DE CV F 100.00 F 100.00
Peru
DISTRUIBUIDORA DEPORTIVA PUMA SAC F 100.00 F 100.00
DISTRUIBUIDORA DEPORTIVA PUMA TACNA SAC F 100.00 F 100.00
PUMA RETAIL PERU SAC F 100.00 F 100.00
Uruguay
PUMA SPORTS LA SA F 100.00 F 100.00
Botswana
WILDERNESS HOLDINGS Ltd E 25.10 E 25.10
South Africa
PUMA SPORTS DISTRIBUTORS (PTY) Ltd F 100.00 F 100.00
PUMA SPORTS SA F 100.00 F 100.00
Australia
KALOLA PTY Ltd F 100.00 F 100.00
PUMA AUSTRALIA PTY Ltd F 100.00 F 100.00
WHITE DIAMOND AUSTRALIA PTY Ltd F 100.00 F 100.00
WHITE DIAMOND PROPERTIES F 100.00 F 100.00
New Zealand
PUMA NEW ZEALAND Ltd F 100.00 F 100.00
United Arab Emirates
PUMA MIDDLE EAST FZ LLC F 100.00 F 100.00
PUMA UAE LLC(1) F 100.00 F 100.00
Turkey
PUMA SPOR GIYIM SANANYI VE TICARET AS F 100.00 F 100.00
China
BRANDON TRADING (SHANGHAI) Ltd F 100.00 Creation
DOBOTEX CHINA Ltd(1) F 100.00 F 100.00
PUMA CHINA Ltd F 100.00 F 100.00
GUANGZHOU WORLD CAT INFORMATION CONSULTING SERVICES CO. Ltd F 100.00 F 100.00
Hong Kong
BRANDON HONG KONG Ltd F 100.00 F 100.00
DEVELOPMENT SERVICES Ltd F 100.00 F 100.00
DOBOTEX Ltd(1) F 100.00 F 100.00
PUMA ASIA PACIFIC Ltd F 100.00 F 100.00
PUMA HONG KONG Ltd F 100.00 F 100.00
WORLD CAT Ltd F 100.00 F 100.00
India
PUMA SPORTS INDIA PVT Ltd F 100.00 F 100.00
PUMA INDIA RETAIL PVT Ltd(1) F 100.00 F 100.00
WORLD CAT SOURCING INDIA Ltd F 100.00 F 100.00
Japan
PUMA JAPAN KK F 100.00 F 100.00
Korea
PUMA KOREA Ltd F 100.00 F 100.00
DOBOTEX KOREA Ltd(1) F 100.00 F 100.00
Malaysia
PUMA SPORTS GOODS SDN BHD F 100.00 F 100.00
Singapore
PUMA SPORTS SINGAPORE PTE Ltd F 100.00 F 100.00
Taiwan
PUMA TAIWAN SPORTS Ltd(1) F 100.00 F 100.00
Vietnam
WORLD CAT VIETNAM CO. Ltd F 100.00 F 100.00
WORLD CAT VIETNAM SOURCING & DEVELOPMENT SERVICES CO. Ltd F 100.00 F 100.00
VOLCOM
VOLCOM Inc. F 100.00 F 100.00
United States
VOLCOM RETAIL Inc. F 100.00 F 100.00
VOLCOM ENTERTAINMENT Inc. F 100.00 F 100.00
LS&S RETAIL Inc. F 100.00 F 100.00
VOLCOM OUTLET Inc. F 100.00 F 100.00
ELECTRIC VISUAL EVOLUTION LLC F 100.00 F 100.00
Luxembourg
VOLCOM LUXEMBOURG HOLDING SA F 100.00 F 100.00
Switzerland
VOLCOM INTERNATIONAL SARL F 100.00 F 100.00
WELCOM DISTRIBUTION SARL F 100.00 F 100.00
Spain
VOLCOM DISTRIBUTION SPAIN SL F 100.00 F 100.00
ELECTRIC VISUAL EVOLUTION SPAIN F 100.00 F 100.00
167
3
2013 Financial Document ~ Kering
CONSOLIDATED FINANCIAL STATEMENTS AS OF DECEMBER 31, 2013 ~ FINANCIAL INFORMATION
Company % interestDec. 31, 2013 Dec. 31, 2012
Company % interestDec. 31, 2013 Dec. 31, 2012
03_B_VA_V4 20/02/14 16:56 Page167

France
VOLCOM SAS F 100.00 F 100.00
VOLCOM RETAIL FRANCE F 100.00 F 100.00
SARL ELECTRIC EUROPE F 100.00 F 100.00
United Kingdom
VOLCOM DISTRIBUTION (UK) Limited F 100.00 F 100.00
VOLCOM RETAIL (UK) Limited F 100.00 F 100.00
Australia
VOLCOM AUSTRALIA HOLDING COMPANY PTY Ltd F 100.00 F 100.00
VOLCOM AUSTRALIA PTY Ltd F 100.00 F 100.00
ELECTRIC VISUAL EVOLUTION AUSTRALIA PTY Ltd F 100.00 F 100.00
New Zealand
VOLCOM NEW ZEALAND Limited F 100.00 F 100.00
ELECTRIC VISUAL EVOLUTION NEW ZEALAND Limited Liquidation F 100.00
Japan
VOLCOM JAPAN GODOGAISHIYA F 100.00 F 100.00
China
VOLCOM HONG KONG F 100.00 Creation
HOLDING COMPANIES AND OTHER
France
CONSEIL ET ASSISTANCE F 100.00 F 100.00
DISCODIS F 100.00 F 100.00
FINANCIERE MAROTHI Merger F 100.00
KERING FINANCE F 100.00 F 100.00
SAPARDIS F 100.00 F 100.00
GG FRANCE 13 SAS F 100.00 F 100.00
GG FRANCE 14 F 100.00 Creation
SAPRODIS SERVICES SAS F 100.00 F 100.00
YSL BEAUTE CONSULTING - - F 100.00
GG France 10 - - F 100.00
United Kingdom
KERING INTERNATIONAL Limited F 100.00 Creation
KERING UK SERVICES Limited F 100.00 F 100.00
Germany
SAPARDIS DEUTSCHLAND SE F 100.00 F 100.00
Italy
KERING ITALIA SpA F 100.00 F 100.00
KERING SERVICE ITALIA SpA F 100.00 F 100.00
REXCOURTA SpA F 100.00 F 100.00
Luxembourg
ABBEY REINSURANCE F 100.00 Acquisition
E-KERING LUX SA F 100.00 F 100.00
FI HOLDING LUX SA Disposal F 100.00
PPR DISTRI LUX SA F 100.00 F 100.00
PPR INTERNATIONAL F 100.00 F 100.00
PRINTEMPS REASSURANCE F 100.00 F 100.00
KERING LUXEMBOURG SA F 100.00 F 100.00
Netherlands
KERING HOLLAND NV F 100.00 F 100.00
GUCCI INTERNATIONAL NV F 100.00 F 100.00
GUCCI PARTICIPATION BV F 100.00 F 100.00
KERING NETHERLANDS BV F 100.00 F 100.00
Switzerland
LUXURY GOODS SERVICES SA F 100.00 F 100.00
Hong Kong
KGS F 100.00 F 100.00
China
KERING ASIA PACIFIC Ltd F 100.00 F 100.00
KERING (CHINA) ENTERPRISE MANAGEMENT Ltd F 100.00 Creation
PPR HOLDING Limited F 100.00 F 100.00
Korea
KERING KOREA Limited F 100.00 Creation
Japan
KERING JAPAN Limited F 100.00 F 100.00
KERING TOKYO INVESTMENTS F 100.00 Creation
United States
KERING AMERICAS F 100.00 F 100.00
(1) Income of these consolidated companies is consolidated based on theGroup’s contractual share in their operations which may differ from theGroup’s share in capital.
168 Kering ~ 2013 Financial Document
3 FINANCIAL INFORMATION ~ CONSOLIDATED FINANCIAL STATEMENTS AS OF DECEMBER 31, 2013
Company % interestDec. 31, 2013 Dec. 31, 2012
Company % interestDec. 31, 2013 Dec. 31, 2012
03_B_VA_V4 20/02/14 16:56 Page168

3. Statutory Auditors’ special reporton the consolidated financial statements for the year ended December 31, 2013
This is a free translation into English of the Statutory Auditors’ report issued in French and is provided solely for theconvenience of English speaking users. The Statutory Auditors’ report includes information specifically required byFrench law in such reports, whether modified or not. This information is presented below the opinion on theconsolidated financial statements and includes an explanatory paragraph discussing the auditors’ assessments ofcertain significant accounting and auditing matters. These assessments were considered for the purpose of issuing anaudit opinion on the consolidated financial statements taken as a whole and not to provide separate assurance onindividual account captions or on information taken outside of the consolidated financial statements. This reportshould be read in conjunction and construed in accordance with French law and professional auditing standardsapplicable in France.
To the Chairman,
In our capacity as Statutory Auditors of Kering SA and at your request, we have audited the accompanying consolidatedfinancial statements of Kering SA for the year ended December 31, 2013.
The consolidated financial statements have been approved by the Board of Directors. Our role is to express an opinionon these consolidated financial statements, based on our audit.
We conducted our audit in accordance with professional standards applicable in France. These standards require thatwe plan and perform the audit to obtain reasonable assurance about whether the consolidated financial statementsare free of material misstatement. An audit includes examining, using sample testing techniques or other selection methods,evidence supporting the amounts and disclosures in the consolidated financial statements. An audit also includesassessing the accounting principles used and significant estimates made, as well as evaluating the overall financialstatement presentation. We believe that the audit evidence we have obtained is sufficient and appropriate to provide areasonable basis for our opinion.
In our opinion, the consolidated financial statements give a true and fair view of the financial position and the assets andliabilities of the Group as of December 31, 2013 and the results of its operations for the period then ended in accordancewith the IFRSs as adopted in the European Union.
This report does not constitute the legal report on the consolidated financial statements that will subsequently be issued.In addition to the disclosures regarding the specific verification required by law, covering the Group’s ManagementReport, this legal report will comprise a justification of our assessments, pursuant to article L. 823-9 paragraph 2 of theFrench Commercial Code. The latter will take into account any events arising after the date of this report.
This report is governed by French law. The French courts shall have exclusive jurisdiction over any claim, dispute ordifference arising from our engagement letter, this report or any related issues.
Paris La Défense et Neuilly-sur-Seine, February 20, 2014
The Statutory Auditors
KPMG Audit Deloitte & AssociésDivision of KPMG SA
Hervé Chopin Antoine de Riedmatten
169
3
2013 Financial Document ~ Kering
STATUTORY AUDITORS’ SPECIAL REPORT ON THE CONSOLIDATED FINANCIAL STATEMENTS ~ FINANCIAL INFOMATION
03_B_VA_V4 20/02/14 16:56 Page169

4. Extracts of the parent company financial statements
The annual financial statements are prepared in accordance with the provisions of the French accounting standardssetter (Comité de la réglementation comptable – CRC) regulation no. 99-03 of April 29, 1999 on the revision of theGeneral Chart of Accounts and the new accounting rules on assets introduced by CRC regulation no. 2002-10, asamended by CRC regulation no. 2003-07 and CRC regulation no. 2004-06.
4.1. Balance sheet – assets as of December 31, 2013 and 2012
(in € millions) Dec. 31, 2013 Dec. 31, 2012
Investments 8,775.8 10,191.5Other long-term investments (1) 0.3 0.5Other non-current assets 349.0 3.5
Non-current assets 9,125.1 10,195.5
Receivables (2) (3) 72.6 93.3Marketable securities 71.9 61.8Cash 1,406.8 2.5
Current assets 1,551.3 157.6
Total assets 10,676.4 10,353.1
(1) o/w due in less than one year: 0.1 0.2
(2) o/w due in more than one year:
(3) o/w concerning associates: 1,440.0 64.8
4.2. Balance sheet – shareholders’ equity and liabilitiesas of December 31, 2013 and 2012
(in € millions) Dec. 31, 2013 Dec. 31, 2012
Share capital 504.9 504.5Additional paid-in capital 2,048.3 2,040.1Reserves 1,587.9 1,588.7Retained earnings 1,426.3 1,706.1Net income for the year 832.9 505.6
Shareholders’ equity 6,400.3 6,345.0
Provisions 463.0 50.8Bonds (1) 3,300.1 3,100.1Other borrowings (1) (3) 241.7 594.5Other liabilities (2) (3) 271.3 262.7
Liabilities 3,813.1 3,957.3
Total shareholders’ equity and liabilities 10,676.4 10,353.1
(1) o/w due in more than one year: 2,600.0 2,452.6
(2) o/w due in more than one year:
(3) o/w concerning associates: 30.4 354.6
170 Kering ~ 2013 Financial Document
3 FINANCIAL INFOMATION ~ EXTRACTS OF THE PARENT COMPANY FINANCIAL STATEMENTS
03_B_VA_V4 20/02/14 16:56 Page170

4.3. Income statement for the years ended December 31, 2013 and 2012
(in € millions) 2013 2012
Net operating loss (16.2) (16.5)
Dividends 2,188.2 876.1Other financial income and expenses (96.7) (129.4)
Net financial income 2,091.5 746.7
Recurring income before tax 2,075.3 730.2
Net non-recurring income/(expense) (1,259.2) (364.7)Employee profit-sharing (3.3) (2.0)Income tax 20.1 142.1
Net income for the year 832.9 505.6
4.4. Statement of cash flows for the years ended December 31, 2013 and 2012
(in € millions) 2013 2012
Dividends received 2,188.2 876.1Interest on borrowings (145.5) (174.8)Income tax received 42.2 111.6Other (28.9) (11.3)
Change in cash resulting from operating activities 2,056.0 801.6
(Acquisitions)/disposals of operating assets (3.9) (1.8)Change in long-term investments (87.5) (574.9)
Change in cash resulting from investing activities (91.4) (576.7)
Net change in borrowings (155.0) 206.5Share capital increases 8.6 12.1Dividends paid by Kering (471.2) (440.6)
Change in cash resulting from financing activities (617.6) (222.0)
Changes in Group structure 67.4
Change in cash and cash equivalents 1,414.4 2.8
Cash and cash equivalents at beginning of year 64.3 61.5Cash and cash equivalents at end of year 1,478.7 64.3
171
3
2013 Financial Document ~ Kering
EXTRACTS OF THE PARENT COMPANY FINANCIAL STATEMENTS ~ FINANCIAL INFOMATION
03_B_VA_V4 20/02/14 16:56 Page171

Kering
Société anonyme (a French corporation) with a share capital of €504,907,044Registered office: 10 avenue Hoche – 75381 Paris Cedex 08
552 075 020 RCS Paris
Tel.: +33 1 45 64 61 00 – Fax: +33 1 45 64 60 00kering.com
This document was produced by an “Imprim’Vert” eco-responsible printer on PEFC certified paper from sustainably managed forests.
Design and Production: Agence Marc Praquin
03_B_VA_V4 20/02/14 16:56 Page172


Related Documents


![Resep Kue Kering Terbaru___ue Kering] - Thekaltara](https://static.cupdf.com/doc/110x72/55cf9417550346f57b9f94be/resep-kue-kering-terbaruue-kering-thekaltara.jpg)