I M F S T A F F D I S C U S S I O N N O T E October 19, 2011 SDN/11/16 Financial Deepening and International Monetary Stability Rishi Goyal, Chris Marsh, Narayanan Raman, Shengzu Wang, and Swarnali Ahmed I N T E R N A T I O N A L M O N E T A R Y F U N D

Welcome message from author
This document is posted to help you gain knowledge. Please leave a comment to let me know what you think about it! Share it to your friends and learn new things together.
Transcript

I M F S T A F F D I S C U S S I O N N O T E
October 19, 2011 SDN/11/16
Financial Deepening and International Monetary Stability
Rishi Goyal, Chris Marsh, Narayanan Raman, Shengzu Wang, and Swarnali Ahmed
I N T E R N A T I O N A L M O N E T A R Y F U N D
INTERNATIONAL MONETARY FUND
Strategy, Policy, and Review Department
Financial Deepening and International Monetary Stability
Prepared by Rishi Goyal, Chris Marsh, Narayanan Raman,
Shengzu Wang, and Swarnali Ahmed1
Authorized for distribution by Ranjit Teja
October 19, 2011
JEL Classification Numbers: F32, F33, F34, F42, G01
Keywords:
International monetary system (IMS); financial
deepening; financial index; crises
Author‘s E-mail Address:
[email protected], [email protected],
[email protected], [email protected],
1 Udaibir Das and Robert Rennhack (MCM) provided valuable advice, for which we are grateful. We thank
Ranjit Teja (SPR) for guidance and direction, and we thank Isabelle Mateos y Lago (SPR), David Marston
(SPR), Jeff Chelsky (World Bank), seminar participants, and departmental reviewers at the IMF for helpful
comments. Stephanie Segal and S. Ramachandran provided inputs at an early stage of the project. Swarnali
Ahmed is a summer intern, currently at Oxford University.
DISCLAIMER: This Staff Discussion Note represents the views of the authors and
does not necessarily represent IMF views or IMF policy. The views expressed herein
should be attributed to the authors and not to the IMF, its Executive Board, or its
management. Staff Discussion Notes are published to elicit comments and to further
debate.

2
CONTENTS PAGE
Executive Summary .................................................................................................................. 3
I. Motivation ............................................................................................................................. 4
II. Patterns of Financial Deepening and International Monetary Stability ............................... 5
III. Risks and Policies ............................................................................................................. 13
IV. Implications and Conclusions ........................................................................................... 16
References ............................................................................................................................... 18
Table 1. Ranking of Countries by Depth and Contribution to Total Depth ...............................7
Figures
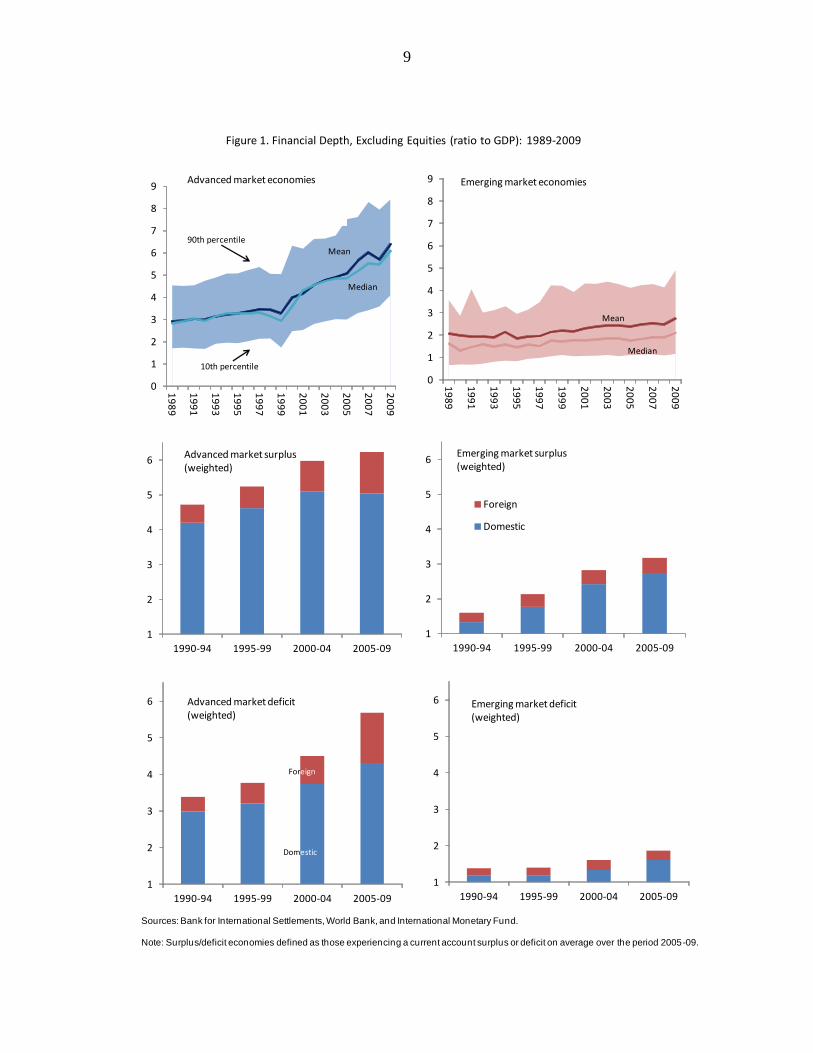
1. Financial Depth, Excluding Equities (ratio to GDP), 1989–2009 .........................................9
2. Dimensions of Balance Sheet Expansion ............................................................................10
3. Stock Market Capitalization and Turnover ..........................................................................11
4. Bond Market Size and Issuer (percent of GDP) ..................................................................12
5. Derivative Turnover in AMs and EMDCs ...........................................................................12
6A. Pension Fund Assets, 2009 ...............................................................................................13
6B. Insurance Penetration, 2009 ..............................................................................................13
7. Risk and Financial Depth: A Stylized Depiction .................................................................13
8. Incidence and Cost of Crises, and Financial Depth .............................................................14
9. EMs: Volatility of Net Inflows Before/After Sudden Stops ................................................15
10A. Share of Global Financial Depth and Policies ................................................................16
10B. Reserve Accumulation and Policies ................................................................................16
Box 1. An Index of Financial Depth ..........................................................................................6
Appendix 1. Facilitating Financial Deepening ........................................................................17
3
EXECUTIVE SUMMARY
Recent discussions at the IMF and the G-20 on strengthening the international monetary
system have emphasized, among other efforts, increasing the financial depth of emerging
markets. Such deepening is widely believed to confer important stability benefits, helping
countries limit swings in asset prices, find alternative sources of funding, and attenuate the
need for reserve accumulation.
This paper seeks to shed light on the role of financial deepening in promoting the stability of
the system as a whole. A simple balance sheet metric of financial depth shows a growing
divergence in the financial depth of advanced versus emerging markets, pointing to scope for
catch-up. But catch-up has implications for global imbalances, insofar as international
adjustment requires slower growth of domestic claims in advanced deficit countries (slower
credit growth lowers domestic demand) and faster growth in surplus economies and
emerging markets (which would raise domestic demand). Deepening is also related to crisis
incidence and costs. Crisis risks and costs are high in the initial stages of deepening, during
which policymakers tend to build reserve buffers, constrain capital mobility, and limit
exchange rate flexibility. In later stages, alongside flexible exchange rates, open capital
accounts and smaller reserve buffers, crisis incidence is found to decline.
Although financial deepening can contribute to lowering imbalances and crisis incidence and
costs, it is a long-term process. Therefore, it remains crucial to make progress in the near
term to strengthen the international monetary system, including building a strong global
financial safety net and developing a framework for coping with capital flows.

4
I. MOTIVATION
Context. The reform of the international monetary system (IMS) has been high on the agenda
of policymakers (see the April 2011 IMFC and G-20 communiqués). Key areas of reform
have included improving the surveillance of macroeconomic and financial policies,
strengthening the global financial safety net, and progressing toward a comprehensive and
balanced approach for coping with volatile capital flows. In that context, attention has also
been given recently to deepening the financial sectors of emerging markets (EMs).
Deepening. Conceptually, financial depth is often understood to mean that: (i) sectors and
agents are able to use a range of financial markets for savings and investment decisions,
including at long maturities (access); (ii) financial intermediaries and markets are able to
deploy larger volumes of capital and handle larger turnover, without necessitating large
corresponding movements in asset prices (market liquidity); and (iii) the financial sector can
create a broad menu of assets for risk-sharing purposes (hedging or diversification). In other
words, deep markets allow savers to invest in a broad range of quality investment and risk-
sharing instruments and allow borrowers to likewise tap a broad range of financing and risk
management instruments (King and Levine, 1993; Rajan and Zingales, 1998; Chami,
Fullenkamp and Sharma, 2009; Goswami and Sharma, 2011).
Stability benefits. Deepening is widely believed to confer important stability benefits to an
economy, albeit with caveats. For instance, by increasing transaction volumes, it can enhance
the capacity to intermediate capital flows without large swings in asset prices and exchange
rates. But it can also attract volatile capital inflows, complicating macroeconomic
management (IMF, 2011a). It can lower the reliance on foreign savings and attenuate balance
sheet mismatches by increasing the scope to raise funds in domestic currencies and at longer
maturities (World Bank, 2011; IMF, World Bank, and FSB, forthcoming). Deeper markets
can provide alternative sources of funding during times of international stress, limiting
adverse spillovers, as evidenced in the global crisis. At the same time though, deepening can
occur too quickly, leading to credit booms and subsequent busts. It has also been argued that
deepening can increase the capacity of EMs to generate their own ―safe‖ or reserve assets,
rather than to rely predominantly on U.S. treasuries (Gourinchas and Rey, 2005; Caballero,
Farhi, and Gourinchas, 2008). At the systemic level, all these factors, if properly managed,
can attenuate the need to accumulate foreign assets, thus promoting global adjustment. In
time, they could facilitate currency internationalization and a shift to a more multipolar IMS
(Maziad et al., 2011).
This paper. This paper seeks to shed light on the relationship between financial deepening in
EMs and the stability of the IMS as a whole. Using a simple metric, it compares the patterns
of financial deepening across advanced and emerging markets over the past two decades
(section II). These patterns show not only that there has been a growing divergence in the
depth of advanced versus emerging markets but also that, over the past decade, this
divergence reflects the lack of adjustment in the IMS. Thus deepening has implications for
global imbalances. The paper then relates financial deepening to crisis incidence and costs
(section III). Crisis risks are found to rise in the initial stages of deepening, during which
policymakers have sought to build reserve buffers, constrain capital mobility, and limit
exchange rate flexibility. In later stages, crisis incidence falls, and policymakers have tended
5
to adopt more flexible exchange rates, open capital accounts, and keep smaller reserve
buffers. The paper concludes with implications for enhancing the stability of the IMS
(section IV). Appendix I provides a brief overview of policies that could promote deepening.
II. PATTERNS OF FINANCIAL DEEPENING AND INTERNATIONAL MONETARY STABILITY
Analyzing depth. One approach to analyzing financial deepening is from a markets and
sectoral perspective—broadening the set of markets beyond a core banking sector to
encompass capital markets, and expanding the range of actors, such as nonbank financial
intermediaries, including pension funds and foreign investors. Underpinning deep markets is
a credible legal system that inter alia allows for the effective enforcement of contracts and
property rights and provides investor protection (Appendix I). Each type of market provides a
different set of opportunities for investment and risk, and each requires prerequisites. Capital
markets, for example, provide for arms-length, anonymous transactions and therefore call for
greater information disclosure and trading arrangements to become viable. Not all countries
will find it possible to develop local capital markets, such as local currency bond markets.
Different actors bring different preferences for financial exposure and different attitudes
about risk, which creates opportunities for gains from trade. For example, while banks
transform maturities (borrowing short term to lend long), pension funds and insurance
companies invariably match maturities (borrowing and lending long term), making them
natural buyers of longer-term bonds and facilitating the development of these markets. The
sectoral patterns of deepening are analyzed below across advanced markets (AMs) and EMs.2
A balance sheet approach. A more general approach is to think of deepening in terms of
enhancing the capacity of an economy to manage its aggregate balance sheet in a smooth
and balanced manner, including in response to shocks. A deep financial sector is one that
facilitates the orderly and balanced growth of its balance sheet (i.e., with expansion or
contraction that is not too rapid, excessive, or unsustained) and allows for smooth adjustment
to shocks. Such capacity depends on a number of factors, including the structure of balance
sheets (e.g., maturity of debt, size of rollover needs, currency composition of liabilities); the
ability of various sectors to issue claims in a cost-effective manner (e.g., if the corporate
sector must de-lever, the aggregate effects can be attenuated if the household sector can
countercyclically expand its balance sheet); the ability of the government to employ
countercyclical macroeconomic and financial policies and serve as a lender of last resort; and
prudent financial regulation and supervision.
A metric. The size of the aggregate balance sheet thus provides a simple metric by which to
track financial deepening over time and compare depth across economies. It measures the
total financial claims and counterclaims of an economy, both at home and abroad (see
Box 1). As such, it is more comprehensive than the commonly used liquid liability measure
or even broad money (M2/GDP).
2 The definitions of AMs and EMs are generally consistent with the classification used in the World Economic
Outlook. However, a few economies defined as AMs in the WEO are treated here as EMs because they
transitioned from the latter category during the period under investigation. These are the four Asian NIEs (Hong
Kong SAR, Korea, Singapore, and Taiwan Province of China) and three transition economies in central and
eastern Europe (Czech Republic, Slovakia, and Slovenia).

6
Box 1. An Index of Financial Depth
There are a number of ways to measure financial depth or integration. Adding up the total financial claims within
an economy as a share of GDP gives a sense of the domestic financial depth. Adding up external assets and
liabilities as a share of GDP, on the other hand, gives a sense of international financial integration.
A composite index of financial depth (IFD) of an economy is proposed to capture the stock of both domestic and
external financial claims. It measures the total stock of domestic financial assets, DA, and liabilities, DL, as well
as the foreign assets, FA, and liabilities, FL, as follows:
Y
FF
Y
D
Y
FF
Y
DDIFD LALLALA )(
2
1)(
2
1)(
2
1
Since, by definition, domestic liabilities equal domestic assets, the index measures the total stock of the domestic
balance sheet. The ½ weighting on foreign assets and liabilities means that when FA = FL the index of financial
depth reflects the total domestic and foreign liabilities of the economy.
The weighted sum of this index over the entire world gives a measure of global financial liabilities as a share of
GDP, since the sum of foreign assets must equal the sum of foreign liabilities (see text figure). There has been
considerable growth in the past two decades. It can also give a sense of relative domestic versus external
financial depth; the latter has dominated in recent years. Sub-indices can also be constructed for AMs and EMs
(see below).
The index was constructed for 50 countries – half AMs and
half EMs – that collectively account for over 90 percent of
global GDP. The data on external assets and liabilities come
from the updated and extended version of the Lane and
Milesi-Ferretti (2007) dataset. These data are available
through 2009 (admittedly an awkward end-point, given the
crisis, and which could generate some anomalous results; see
Table 1 below). Domestic claims are defined as the total
domestic financial liabilities, including broad money, resident
claims on the banks, domestic securities, and stock market
capitalization, using datasets constructed by the World Bank
and the Bank for International Settlements. The index was
constructed with and without equities, to side-step large
swings in valuation in the former case.
Index of Global Financial Depth (Excluding
Equities):1989–2009
Limits. Isn‘t such a metric too simple, partial, and imperfect? Of course, it is—as would be
any single metric of depth that could be compared across countries and time. To gain a
comprehensive picture of both the state of financial depth and the process of deepening, it is
essential to complement this aggregate measure by other measures. Useful insights would be
gleaned, for instance, by examining the resilience of balance sheets (such as currency and
maturity mismatches and prudential indicators), the quality of regulation and supervision (as
obtained, for instance, in the Financial Sector Assessment Programs, or FSAPs, of the IMF
and World Bank; see also IMF, World Bank, and FSB forthcoming), institutional capacity,
and market development (e.g., of sectors and actors, as described below).
Value. For the purposes of analyzing international monetary stability—the focus of this
paper—the aggregate balance sheet metric contains a wealth of information. For instance, the
differential growth of domestic and external balance sheets can help account for the
persistence of global imbalances and lack of adjustment. Too rapid a growth in balance
sheets can point to increasing risks and vulnerabilities, such as those related to excessive
leverage or reliance on short-term financing. Early stages of deepening can also be related to

7
Table 1. Ranking of Countries by Depth and Contribution to Total Depth
Top 5 financially deep economies Top 5 contributors to global financial depth
1989 2009 1989 2009
World 4.25 6.71
Advanced countries Advanced countries 3.93 5.50
Japan 7.25 Ireland 21.61 United States 1.38 United States 1.96
Switzerland 6.48 United Kingdom 12.64 Japan 1.20 Japan 0.88
Belgium 5.45 Switzerland 11.48 United Kingdom 0.24 United Kingdom 0.52
United Kingdom 5.03 Netherlands 10.63 Germany 0.23 Germany 0.41
United States 4.51 Japan 9.31 France 0.19 France 0.36
Emerging markets Emerging markets 0.32 1.21
Lebanon 8.94 Hong Kong SAR 26.67 Brazil 0.08 China 0.48
Hong Kong SAR 7.44 Singapore 10.47 China 0.04 Brazil 0.11
Malaysia 4.92 Lebanon 7.44 Hong Kong SAR 0.03 Hong Kong SAR 0.10
Singapore 4.76 South Africa 6.47 Korea 0.03 Korea 0.08
South Africa 3.96 Malaysia 6.30 India 0.02 India 0.08
(in percent of own GDP) (in percent of all countries' GDP)
Source: BIS, World Bank, updated and extended Lane and Milesi-Feretti (2007) dataset, IMF staff calculations.
Notes: Summing all assets and liabilities (held against residents and non-residents) as a share of GDP gives a measure of the weight of total financial claims and counter-claims of an economy—both at home and abroad. Domestic claims are defined as the total domestic financial liabilities, including broad money, residentclaims on the banks, domestic securities, and stock market capitalization. Data are from the BIS, the World Bank, and Lane and Milesi-Feretti's “external wealth of nations”database, for 50 countries, half advanced and half emerging, that collectively account for over 90 percent of global GDP.
rising risks, since capital flows can be relatively large compared with the capacity of an
economy and its institutional framework to cope with them. Moreover, while risks can
decline beyond a threshold (see, e.g., Kose, Prasad, and Taylor, 2009), economies with great
depth are not necessarily immune, if risks build up and the regulatory framework does not
keep pace, as the crisis has demonstrated (e.g., Arcand, Berkes, and Panizza, 2011, argue that
finance has a negative effect on growth when credit to the private sector exceeds 110 percent
of GDP). Finally, information on the size and sectoral distribution can also shed light on the
ability of an economy to smooth the effects of shocks.
Results. Table 1 shows the countries with the largest balance sheets relative to GDP in 1989
and 2009 (left columns). The important financial centers stand out (except the United States,
given that the measure is against own GDP), but so does Ireland in 2009. This reflects the
very rapid cyclical increase in its balance sheet size in recent years, pointing out that rapid
borrowing brings growing risks as much as risk sharing. The table also shows overall
financial size as a share of global size (right columns; each country‘s contribution is
weighted by global GDP): the Euro Area, Japan, the United Kingdom, and the United States
dominate. Among EMs, China‘s total financial claims are now comparable with those of
large European countries as a share of global GDP, underscoring the possible future role of
China in the global financial system.
Overall trends. AMs and EMs have deepened their financial sectors over the past two
decades (Figure 1). Reflecting the growth of financial centers such as Hong Kong SAR and
Singapore, some EMs exhibit levels of depth comparable to AMs. Some other EMs, on the
other hand, experienced virtually no deepening. Overall, depth in AMs has grown far more
rapidly than in EMs, especially in the last decade. Thus, in stark contrast to average real

8
incomes, which have been converging, financial depth has been diverging between AMs and
EMs. This points to the scope for financial catch-up.
Deficit vs. surplus economies. The divergence should not be entirely surprising. It reflects
increased globalization and the rapid rise in cross-border claims among advanced economies.
It also reflects the continued large increases over the past decade in the balance sheets of
advanced current-account-deficit economies (see the lower panels of Figure 1):
Advanced deficit economies have sustained domestic demand through borrowing, as
is well known; what is noteworthy is that their domestic balance sheets have
expanded rapidly even as their external liabilities have grown.
Advanced surplus economies, on the other hand, have not leveraged their growing
foreign assets; domestic claims have remained virtually constant as a share of GDP
over the past decade, albeit at a high level.
EMs. Both deficit and surplus EMs have expanded their domestic balance sheets over
time, but at a more measured pace than advanced deficit economies.
Conclusion: Deepening can help international adjustment insofar as adjustment
requires slower growth of domestic claims in advanced deficit economies and faster
growth in surplus economies and EMs. Slower secular credit growth in advanced
deficit economies would slow domestic absorption, while faster secular credit growth
in EMs would increase domestic demand.
Sectoral patterns. The sectoral patterns of deepening have also varied substantially between
AMs and EMs. Figures 2–6 illustrate some of these differences, identifying areas for further
deepening in the latter:
EMs remain largely bank based (Figure 2). As several studies have noted, capital
flows intermediated through banks are the most volatile (Cetorelli and Goldberg,
2010; IMF, 2010b).3 Given the prominence of bank intermediation in EMs, this may
induce policymakers to adopt policies that preserve stability in the banking sector,
and could help account for the more measured pace of deepening and slower growth
of credit to the private sector (IMF, 2010a). The rates of growth of domestic liquid
liabilities in AMs and EMs have been roughly identical, but AMs have differed
crucially due to the expansion of credit to the private sector and the increasingly
important role of capital markets.
AMs have experienced more rapid growth in their external balance sheets than EMs,
though the latter continue to be more significant net borrowers. External balance
sheets in AMs have experienced a nearly 10-fold increase since 1970, compared with
3½ times in EMs. Assets and liabilities have risen in lockstep in AMs, leading to a
3 The experience of EMs varies, depending on the business model used by international banks in their respective
jurisdictions. In particular, EMs where these banks funded their activities by raising local deposits experienced
less volatility, as was the case of Spanish banks in Latin America (Kamil and Rai, 2010).
9
Figure 1. Financial Depth, Excluding Equities (ratio to GDP): 1989-2009
Sources: Bank for International Settlements, World Bank, and International Monetary Fund.
Note: Surplus/deficit economies defined as those experiencing a current account surplus or deficit on average over the period 2005-09.
0
1
2
3
4
5
6
7
8
9
19
89
19
91
19
93
19
95
19
97
19
99
20
01
20
03
20
05
20
07
20
09
90th percentile
10th percentile
Mean
Median
0
1
2
3
4
5
6
7
8
9
19
89
19
91
19
93
19
95
19
97
19
99
20
01
20
03
20
05
20
07
20
09
Emerging market economies
Mean
Median
Advanced market economies
1
2
3
4
5
6
1990-94 1995-99 2000-04 2005-09
Advanced market surplus(weighted)
1
2
3
4
5
6
1990-94 1995-99 2000-04 2005-09
Foreign
Domestic
Emerging market surplus(weighted)
1
2
3
4
5
6
1990-94 1995-99 2000-04 2005-09
Advanced market deficit(weighted)
Foreign
1
2
3
4
5
6
1990-94 1995-99 2000-04 2005-09
Emerging market deficit (weighted)
Domestic

10
narrow net position (median of 15½ percent of GDP in 2009) compared to a large
net liability position in EMs (40.1 percent).
EMs have increasingly substituted foreign direct investment (FDI) for debt liabilities.
In 2000, gross debt liabilities for the median EM amounted to 55½ percent of GDP,
while FDI liabilities stood at 20½ percent. By 2009, FDI liabilities had risen to over
40 percent, while debt liabilities had fallen to just over 42 percent. Even among EM
financial centers, there is a revealed preference for external liabilities geared more
towards FDI than debt instruments. This general preference for FDI over debt may
Figure 2. Dimensions of Balance Sheet Expansion
Sources: World Bank, Bank for International Settlements, updated and extended version of the Lane and Milesi-Ferretti dataset (2007), and IMF staff calculations.
0
20
40
60
80
100
120
140
16019
70
1973
1976
1979
1982
1985
1988
1991
1994
1997
2000
2003
2006
2009
Bank liquid liabilities (median, percent of GDP)
Advanced
Emerging
0
20
40
60
80
100
120
140
160
1970
1973
1976
1979
1982
1985
1988
1991
1994
1997
2000
2003
2006
2009
Total credit to private sector(median, percent of GDP)
0
20
40
60
80
100
120
140
160
1990
1992
1994
1996
1998
2000
2002
2004
2006
2008
Private bonds outstanding(median, percent of GDP)
0
100
200
300
400
500
600
1970
1973
1976
1979
1982
1985
1988
1991
1994
1997
2000
2003
2006
2009
Foreign assets plus liabilities(median, percent of GDP)
-300
-200
-100
0
100
200
300
1970
1973
1976
1979
1982
1985
1988
1991
1994
1997
2000
2003
2006
2009
FDI■ Debt (port. + other inv.)■ Portfolio equity■ Financial derivatives■ Reserves
Advanced: External position of the
median country (percent of GDP)
-300
-200
-100
0
100
200
300
1970
1973
1976
1979
1982
1985
1988
1991
1994
1997
2000
2003
2006
2009
Emerging: External position of the median country (percent of GDP)
External assets
External liabilities

11
reflect a desire to manage the balance sheet in a manner that reduces crisis risks
(Gourinchas and Rey, 2005; see also next section). There are exceptions: for instance,
in Europe, the large expansion has been due to external debt liabilities (portfolio plus
other liabilities).
There is significant scope in EMs to develop capital markets (Figures 3-4). In advanced
economies, capital markets are not only larger, but also have significantly higher turnover
and liquidity. This is true across equity, bond, and derivative markets:
Equity. At 120 percent of GDP in 2009, median AM capitalization was around twice
that of EMs (Figure 3).
Bonds. The gap in the size of bond markets is even larger. At 200 percent of GDP at
end 2010, the median value of bonds outstanding in AM markets was four times as
large as the median value in EMs, with even some of the smallest AM bond markets
larger than the largest EM ones (Figure 4). Longer-term bond markets were also
significantly larger in AMs: for 19 AMs and 12 EMs for which data were available,
bonds outstanding with maturities over a year in the median AM were equivalent to
75 percent of GDP, compared with 33 percent of GDP for the median EM.

12
Derivatives. Despite experiencing rapid growth in recent years, derivatives markets in
EMs remain small compared to those in AMs. Average daily turnover in EMs where
data are available was $1.2 trillion in April 2010 (6.2 percent of those economies‘
GDP), compared to $13.8 trillion (36 percent of GDP) in AMs (Figure 5). Derivative
markets in EMs are primarily in
foreign exchange derivatives, while
interest-rate derivatives predominate in
AMs. As foreign exchange derivatives
are generally of short duration
compared to interest-rate derivatives,
developing the latter could offer
greater scope for risk sharing. It
requires, among other things,
developing longer-term debt markets
and extending the yield curve.
Players such as pension funds can facilitate the development of long-term debt markets. Pension funds and insurance companies play a much larger role in advanced economies than
they do in EMs (Figure 6). As providers of financial services such as for long-term savings
and risk sharing (e.g., health, life, property, employment), they are natural holders of equity
and long-term securities. Hence, development of these players should facilitate the growth of
capital markets.

13
III. RISKS AND POLICIES
Crisis risks. How are crisis risks related to financial deepening? Lax regulation and excessive
credit growth could precipitate crises even if the financial sector is deep (measured by the
aggregate balance sheet concept), as the global crisis indicates. And the costs would be
commensurately larger were it to occur in one of the core financial centers of the world. That
said, and all else equal, as deepening occurs
and the capacity of balance sheets to manage
shocks increases, crises would be expected
to become less frequent and less costly.
Were a crisis to occur, however, it is
conceivable that it would more likely occur
at ―medium‖ (or ―medium-low‖) levels of
depth and that costs would also be higher at
these levels (Figure 7). This could occur, for
instance, if balance sheets were not yet large
enough to cope with volatile cross-border
capital flows, or if regulatory and
supervisory capacities were lagging.
Evidence. To examine the hypothesis that deepening could lead to (i) a greater likelihood and
a rising cost of crises at early stages of deepening and (ii) a lower likelihood and falling costs
of crises at higher levels of financial depth, the frequency of crises and costs of crises
(calculated as the 2-3 year loss in GDP) were examined at various levels of depth as
Figure 6A. Pension Fund Assets, 2009 As percentage of GDP 1/
Source: OECD Global Pension and Insurance Statistics, country authorities, and IMF staff calculations.1/ End-2007 data for India.
2/ Insurance penetration defined as total gross insurance premiums as percent of GDP.3/ End-2008 data for Argentina, Austria, Denmark, Russia, South Africa, and United Kingdom.
0 50 100 150
Luxembourg
Italy
Austria
Germany
Norway
Spain
New Zealand
Portugal
Japan
Median
Denmark
Ireland
Canada
United States
United Kingdom
Finland
Australia
Switzerland
Iceland
Netherlands
Advanced: Pension Funds Assets
0 50 100 150
Korea
Turkey
China
Slovenia
Czech Republic
India
Trinidad
Slovak
Median
Mexico
Hungary
Poland
Jamaica
Brazil
Hong Kong SAR
Isarel
Chile
Emerging: Pension Funds Assets
0 25 50
Greece
Iceland
Norway
New Zealand
Finland
Austria
Spain
Australia
Sweden
Germany
Italy
Netherlands
Median
Belgium
Portugal
Canada
Japan
Denmark
France
Switzerland
United States
United Kingdom
Ireland
Luxembourg
Advanced: Insurance Penetration
0 25 50
Turkey
Mexico
Russia
Agentina
Hungary
Slovak Republic
China
Poland
Median
Czech Republic
Chile
India
Brazil
Hong Kong SAR
Korea
South Africa
Emerging: Insurance Penetration
Figure 6B. Insurance Penetration,2009 As percentage of GDP 2/ 3/
Medium HighLow
Risk/Instablility
Financial Depth
Figure 7. Risk and Financial Depth: A Stylized Depiction

14
measured by the balance sheet metric above. Based on Laeven and Valencia (2008), which
was updated through end 2009, 49 crisis cases were identified. Of these, 36 crises occurred in
EMs and 13 in AMs; there were 30 banking crises and 21 currency crises, with overlaps
reflecting twin or triple crises. The following conclusions are drawn:
Based on this dataset, the (unconditional) probability of crises generally declines with
depth. It rises slightly at very high levels of depth, reflecting the recent crisis.
Were a crisis to occur, the (conditional) probability rises before falling off (Figure 8,
top left panel). Crisis incidence has historically been high at levels of financial depth
associated with EMs (index lower than 3). The vast majority (83 percent) of all EM
crises have occurred when the depth index was lower than 3, with a further 11 percent
above 3 but below 4.5. At very high levels of depth, the incidence of crises,
particularly banking crises, can re-emerge.
Even though the frequency of crises declines with deepening, the costs of crises
remain high (Figure 8, lower panels). Among EMs, the average costs of crises have
historically been highest at the levels of depth that many economies are currently at,
even though the maximum cost in the sample declines monotonically with depth. For
EMs, the average two-year cumulative losses for levels of depth between 3 and 4½—
the level where the incidence of crises declines—are about 12¼ percent of precrisis
GDP. The costs of currency crises at these levels are even higher, nearly 15½ percent,
suggesting that currency mismatches play an important role in determining risk. The
Figure 8. Incidence and Cost of Crises, and Financial Depth
Source: World Economic Outlook, Laeven and Valencia (2008) and IMF staff calculations.
1/ Loss at time t is measured as:
where t is the crisis start date based on the Laeven and Valencia dataset. In practice we examined n=1 and 2 (i.e., 2- and 3-year cumulative losses), and show the 2-year losses here.
-0.3
-0.25
-0.2
-0.15
-0.1
-0.05
0
0.05
<1.5 1.5-<3 3-<4.5 4.5-<6 >=6
Losses 1/
All countries, all crises
Average losses
Maximum losses
-0.3
-0.25
-0.2
-0.15
-0.1
-0.05
0
0.05
<1.5 1.5-<3 3-<4.5 4.5-<6 >=6
Financial depth
Losses 1/
EMs, all crises
0
0.2
0.4
0.6
0.8
1
0
0.2
0.4
0.6
0.8
1
<1.5 1.5-<3 3-<4.5 4.5-<6 >=6
Distribution of all crises across financial depth index
All
EMs
AMs
11
19
4 2
1
2
3
1 6
0
5
10
15
20
25
30
<1.5 1.5-<3 3-<4.5 4.5-<6 >=6
Histogram of crises AMs
EMs1991 Norway 1991 Finland
2009 Greece
1997 Japan2008 Iceland
2007 US UK2009 Ireland Spain
1989 Iceland
1993 Finland1991, 1993 Sweden
𝐿𝑜𝑠𝑠𝑡 = 𝐺𝐷𝑃𝑡+𝑖 − 𝐺𝐷𝑃𝑡−1𝐺𝐷𝑃𝑡−1
𝑛
𝑖=0

15
dynamic is different for AM crises, however. Based on a smaller set of crises, the
average cost rises with depth, although the magnitude of losses tends to remain lower.
Capital flows. What is the role of volatile capital flows in accounting for the high average
cost of crises in EMs? To explore how the volatility of capital flows varies with financial
depth, Figure 9 plots the standard deviation of capital flows as a proportion of financial
depth, before and after ―sudden stop‖ episodes, against different levels of depth, as measured
by the aggregate balance sheet metric. (These episodes are taken from IMF, 2011a.) A
number of features stand out:
First, the volatility of net capital outflows following a sudden stop (the red bars)
declines unambiguously as depth rises, suggesting that greater depth helps cushion
against outflows. This echoes previous findings that more developed domestic
financial markets in EMs helps reduce the volatility of capital flows (IMF, 2007).
Second, once depth exceeds 1½,
further deepening is associated with
greater volatility in net flows during
the inflows phase of the cycle (the blue
bars), which then falls off when depth
exceeds 3. This may account for why
EMs continue to experience large
average output declines following
crises even as the crisis frequency falls.
Finally, at levels of depth similar to
AMs, relative volatility, both before
and after sudden stops, becomes
negligible.
How deep is deep enough? Crisis risks and costs can—and have—re-emerged at greater
levels of depth. Crises can occur at any level of financial development. But, as the recent
crisis in the advanced economy core of the global financial system has shown, there may be
limits to the pace of balance-sheet expansion. Notwithstanding the increased ability to cope
with volatile capital flows, and absent work on the ―optimal‖ level of depth, the above data
suggest that, all else being equal, deepening in EMs does not need to increase as much as it
has in AMs for them to benefit from reduced crisis risks and costs.
Policies. Countries with lower levels of depth—and higher crisis risks and costs—typically
also have less exchange-rate flexibility, more capital account restrictions, and high reserves
accumulation; the last of these may serve as buffers against costly crises (Figure 10). If crisis
risks and costs are perceived to be high during the process of financial deepening,
precautionary reserve accumulation may increase. This could result in delays in global
adjustment. However, countries with greater levels of depth and lower crisis incidence and
costs tend to have more open capital accounts, free floating exchange rates, and far lower
reserves as a percent of GDP.
Source: IFS, and IMF staff calculations.
0.0
0.5
1.0
1.5
2.0
2.5
3.0
3.5
4.0
<1.5 1.5-2.0 2.0-2.5 2.5-3.0 3.0-5.0 >5.0
Vola
tilit
y of
net
infl
ows
as a
sha
re o
f fi
nanc
ial d
epth
Financial depth index (total)
Previous Four Quarters
Next Four Quarters
Figure 9. EMs: Volatility of Net Inflows Before/After Sudden Stops

16
IV. IMPLICATIONS AND CONCLUSIONS
Deepening. Financial deepening in EMs can bring important benefits to these economies.
This paper has shown that deepening is associated with a reduced incidence and lower costs
of crises and an improved capacity to manage volatile capital flows. That said, risks and costs
can rise in the process of deepening, and mechanisms are needed to help cope with them.
Scope. There is a substantial gap in the financial depths of EMs compared to their AM
counterparts. A degree of catch-up has implications for global imbalances, insofar as
international adjustment requires slower growth of domestic claims in advanced deficit
countries (slower credit growth lowers domestic demand) and faster growth in surplus
economies and emerging markets (which would raise domestic demand).
Adjustment. Even as EMs deepen, and given the still high costs of crises in the process, they
may continue to operate policies that can help shield them against external shocks. Policies to
build reserve buffers, manage capital flows, and limit exchange rate flexibility may bolster
stability at the country level. Moreover, even though some EMs (e.g., China, Korea, South
Africa, and Thailand) are close to the threshold of financial depth where crisis costs decline,
the fragility of the global recovery may induce countries to remain cautious. However, at the
systemic level, a result could be the postponement of adjustment, which could adversely
impact systemic stability and growth. In time, greater financial depth would be expected to
lower crisis costs, and policies too could transition to reduced precautionary demand for
reserves, greater openness in the capital account, and more flexibility in exchange rates.
Strengthening the IMS. Deepening is a long-term process, and the transition could be a long
one. It remains essential therefore that progress be made at the multilateral level to help cope
with risks. This includes progress to resolve external imbalances through surveillance of and
cooperation on policies (e.g., IMF surveillance and the G-20 Mutual Assessment Process);
reforms to the global safety net to close remaining gaps, which would limit the need for
precautionary reserve accumulation; and progress to develop a coherent framework to cope
with volatile capital flows, which could also limit risks and costs.
17
Appendix I. Facilitating Financial Deepening
Deepening is a gradual and largely organic process, and policy recommendations need to
account for country-specific circumstances and institutions. While further work is needed
to sketch out specific policy advice, some basic areas of emphasis that can nevertheless be
extracted from the prevailing wisdom and some references to the literature are provided:
Macro policy framework. A sound policy framework is essential for macroeconomic
and financial stability (World Bank-IMF Handbook, 2001; Eichengreen, 2008; Arvai
and Heenan, 2008; Chami, Fullenkamp, and Sharma, 2009). It would support demand
for domestic assets, and enhance the credibility of the government as an issuer of debt
securities.
Market infrastructure. A robust market infrastructure is necessary. For instance, a
benchmark yield curve is a key requirement for market development and facilitates
the reliable valuation of financial assets. This, in turn, necessitates sound public debt
management policies (Arvai and Heenan, 2008; Chami, Fullenkamp, and Sharma,
2009).
Legal framework. A strong and transparent legal framework is critical to investor
protection and property and creditor rights. The regulator could, for instance, codify
and enforce accurate and timely accounting standards, while the private sector could
build the necessary infrastructure such as exchanges and credit bureaus. A robust
payments and settlements infrastructure is also essential. The positive relationship
among sound institutions, financial development, and long-term growth has been
confirmed in many empirical analyses (Fergusson, 2006; Chinn and Ito, 2006).
Regulatory and supervisory regime. A sound regulatory and supervisory system
needs to be established with the capacity to ensure financial stability. A balance is
needed whereby regulation can foster prudent market conduct without hindering
development: too rapid a deregulation risks engendering instability (Reinhart and
Rogoff, 2008; Rodrick and Subramaniam, 2009), but highly restrictive rules may
hinder financial market development (Chami, Fullenkamp, and Sharma 2009;
Goswami and Sharma, 2011). Such regulation needs to address disclosure and
transparency among market participants, limit market dominance, and enforce risk
management practices. In addition, IMF (2002) discusses the linkages between
financial sector development and capital account liberalization, setting out an
operational framework for sequencing financial deregulation and liberalizing cross-
border capital flows.
Cooperative mechanisms. There may also be a role for cooperative solutions, such as
by countries in Asia to develop local currency bond markets. In particular, efforts
aimed at addressing various impediments to bond market development—focusing
efforts to achieve a critical scale, building information systems and transparency,
improving market infrastructure and regulation, and creating a vibrant investor
community—appear to have had a large impact (BIS, 2011).

18
REFERENCES
Abiad, A., E. Detragiache, and T. Tressel, 2008, ―A New Database of Financial Reforms,‖
IMF Working Paper No. WP/08/266 (Washington: International Monetary Fund,
December).
Arcand, J.L., E. Berkes, and U. Panizza, 2011, ―Too Much Finance?‖, Unpublished draft
(available at Ugo Panizza‘s website at http://sites.google.com/site/upanizza/), March.
Arnone, M., and G. Iden, 2003, ―Primary Dealers in Government Securities: Policy Issues
and Selected Countries' Experience,‖ IMF Working Paper No. WP/03/45
(Washington: International Monetary Fund, March).
Árvai, Z., and G. Heenan, 2008, ―A Framework for Developing Secondary Markets for
Government Securities,‖ IMF Working Paper No. WP/08/174 (Washington:
International Monetary Fund, July).
Bank for International Settlements (BIS), 2011, ―Local Currency Bond Markets and the
Asian Bond Fund 2 Initiative,‖ available for download at
http://www.bis.org/publ/othp15.pdf, July.
Bayoumi, T., T. Oni, A. Vamvakidis, and F. Vitek, 2010, ―How Far Do Differences in
Financial Regulation Drive Global Imbalances?‖, Mimeo (Washington: International
Monetary Fund, October).
Beck, T., A. Demirgüç-Kunt, and R. Levine, 2000, ―A new database on the structure and
development of the financial sector,‖ World Bank Economic Review, Vol. 14, No. 3,
pp. 597-605.
Bernanke, B.S., 2005, ―The Global Saving Glut and the U.S. Current Account Deficit,‖
speech delivered at the Sandridge Lecture, Virginia Association of Economists,
Richmond, VA., March 10.
Bernanke, B.S., C. Bertaut, L.P. DeMarco, and S. Kamin, 2011, ―International Capital Flows
and the Returns to Safe Assets in the United States, 2003-2007,‖ International
Finance Discussion Paper no. 1014, Board of Governors of the Federal Reserve
System, February.
Boissay, F., 2011, ―Financial Imbalances and Financial Fragility,‖ ECB Working Paper
No. 1317 (Frankfurt am Main: European Central Bank, April).
Burger, J.D., F.E. Warnock, and V.C. Warnock, 2010, ―Investing in Local Currency Bond
Markets,‖ NBER Working Paper No. 16249 (Cambridge, MA: National Bureau of
Economic Research, August).
Caballero, R.J., E. Farhi, and P.O. Gourinchas, 2008, ―An Equilibrium Model of ‗Global
Imbalances‘ and Low Interest Rates,‖ American Economic Review, Vol. 98:1, 358-93.
Cetorelli, N., and L.S. Goldberg, 2010, ―Global Banks and the International Shock
Transmission: Evidence from the Crisis,‖ NBER Working Paper No. 15974
(Cambridge, MA: National Bureau of Economic Research, May).

19
Chami, R., C. Fullenkamp, and S. Sharma, 2009, ―A Framework for Financial Market
Development,‖ IMF Working Paper No. WP/09/156 (Washington: International
Monetary Fund, July).
Chen, J., and P. Imam, 2011, ―Causes of Asset Shortages in Emerging Markets,‖ IMF
Working Paper No. WP/11/114, May.
Chinn, M., and J. Frankel, 2008, ―Why the Euro Will Rival the Dollar,‖ International
Finance, Vol. 11, No. 1, pp. 49-73.
Chinn, M., and H. Ito, 2006, ―What matters for financial development? Capital controls,
institutions, and interactions,‖ Journal of Development Economics, Vol. 81, pp. 163-
92.
__________, 2008, ―A New Measure of Financial Openness,‖ Journal of Comparative
Policy Analysis, Vol. 10 (3), September, 309-22.
Cohen, B.J., 2009, ―The Future of Reserve Currencies,‖ Finance and Development,
Vol. 46(3), September.
Committee on the Global Financial System, 2007, ―Institutional Investors, Global Savings
And Asset Allocation,‖ CGFS Paper No. 27 (Basel: Bank For International
Settlements, February).
__________, 2007, ―Financial Stability and Local Currency Bond Markets,‖ CGFS Paper
No. 28 (Basel: Bank For International Settlements, June).
__________, 2009, ―Capital Flows and Emerging Market Economies,‖ CGFS Paper No. 33
(Basel: Bank for International Settlements, January).
Cooper, R.N., 2007, ―Living With Global Imbalances,‖ Brookings Papers on Economic
Activity, Vol. 2.
Dooley, M.P., D. Folkerts-Landau, and P. Garber, 2004, ―The Revised Bretton Woods
System,‖ International Journal of Finance and Economics, Vol 9(4), October, 307-
313.
Eichengreen, B., 2008, ―Field of Dreams: Measures for Overcoming the Obstacles to Bond
Market Development,‖ Guest Commentary, Gemloc Advisory Services, World Bank,
June.
Fergusson, L., 2006, ―Institutions for Financial Development: What Are They and Where Do
They Come From?‖, Journal of Economic Surveys, Vol. 20, No. 1, February, 27-70.
Ferhani, H.J., M.R. Stone, A. Nordstrom, and S. Shimizu, 2009, Developing Essential
Financial Markets in Smaller Economies: Stylized Facts and Policy Options, IMF
Occasional Paper No. 265 (Washington: International Monetary Fund).
Goswami, M. and S. Sharma, 2011, ―The Development of Local Debt Markets in Asia,‖ IMF
Working Paper No. WP/11/132 (Washington: International Monetary Fund, June).
Gourinchas, P.O., and H. Rey, 2005, ―From World Banker to World Venture Capitalist: U.S.
External Adjustment and the Exorbitant Privilege,‖ NBER Working Paper No. 11563
(Cambridge, MA: National Bureau of Economic Research, August).

20
International Monetary Fund, 2002, Capital Account Liberalization and Financial Sector
Stability, IMF Occasional Paper No. 211 (Washington).
__________, 2003, ―Local Securities and Derivative Markets in Emerging Markets: Selected
Policy Issues,‖ Chapter IV in Global Financial Stability Report (Washington,
March), pp. 70–94.
__________, 2005, ―Development of Corporate Bond Markets in Emerging Market
Countries,‖ Chapter IV in Global Financial Stability Report (Washington,
September), pp. 103–41.
__________, 2006, ―Structural Changes in Emerging Sovereign Debt and Implications for
Financial Stability,‖ Chapter III in Global Financial Stability Report (Washington,
April), pp. 86–126.
__________, 2007, ―The Quality of Domestic Financial Markets and Capital Inflows,‖
Chapter III in Global Financial Stability Report (Washington, September), pp. 77-
109.
__________, 2010a, Cross-Cutting Themes in Countries with Large Banking Systems,
available for download at http://www.imf.org/external/np/pp/eng/2010/041610.pdf.
__________, 2010b, The Fund’s Role Regarding Cross-Border Capital Flows, available for
download at http://www.imf.org/external/np/pp/eng/2010/111510.pdf.
__________, 2011a, Recent Experiences in Managing Capital Inflows—Cross-Cutting
Themes and Possible Guidelines, available for download at
http://www.imf.org/external/np/pp/eng/2011/021411a.pdf.
__________, 2011b, Mapping Cross-Border Financial Linkages: A Supporting Case for
Global Financial Safety Nets, available for download at
http://www.imf.org/external/np/pp/eng/2011/060111.pdf.
International Monetary Fund, World Bank, and Financial Stability Board, forthcoming,
―Financial Stability Issues in Emerging Market and Developing Economies,‖ A
Report to the G-20 Finance Ministers and Central Bank Governors.
Kamil, H., and K. Rai, 2010, ―The Global Credit Crunch and Foreign Banks‘ Lending to
Emerging Markets: Why Did Latin America Fare Better?‖, IMF Working Paper
No. WP/10/102 (Washington: International Monetary Fund, April).
King, R.G. and R. Levine, 1993, ―Finance and Growth: Schumpeter Might be Right,‖
Quarterly Journal of Economics, Vol. 108, No. 3 (August), 717-37.
Klein, M.W., and G.P. Olivei, 2008, ―Capital Account Liberalization, Financial Depth, and
Economic Growth,‖ Journal of International Money and Finance, Vol. 27, pp. 861-
75.
Kose, M.A., E.S. Prasad, and A.D. Taylor, 2009, ―Thresholds in the Process of International
Financial Integration,‖ Global Economy and Development Working Paper No. 35
(Washington: Brookings Institution, May).

21
Laeven, L., and F. Valencia, 2008, ―Systemic Banking Crises: A New Database,‖ IMF
Working Paper No. WP/08/224 (Washington: International Monetary Fund,
November).
Lane, P.R., and G.M. Milesi-Feretti, 2007, ―The External Wealth of Nations Mark II:
Revised and Extended Estimates of Foreign Assets and Liabilities, 1970–2004,‖
Journal of International Economics, Vol. 73, pp. 223–50.
Maziad, S., P. Farahmand, S. Wang, S. Segal, and F. Ahmed, 2011, ―Internationalization of
Emerging Market Currencies—A Balance Between Risks and Rewards,‖ IMF Staff
Discussion Note No. SDN/11/17 (Washington: International Monetary Fund).
Obstfeld, M., and K.S. Rogoff, 2009, ―Global Imbalances and the Financial Crisis: Products
of Common Causes,‖ Proceedings of the Asia Economic Policy Conference on Asia
and the Global Financial Crisis (R. Glick and M.M. Spiegel, eds.), October, 131-72.
Padoa-Schioppa, T., 2010, ―The Ghost of Bancor: The Economic Crisis and Global Monetary
Disorder,‖ Speech delivered at the launch of the Initiative Triffin 21, Louvain-la-
Neuve, February.
Prasad, E.S., K. Rogoff, S.J. Wei, and M.A. Kose, 2003, ―Effects of Financial Globalization
on Developing Countries: Some Empirical Evidence,‖ IMF Occasional Paper No. 220
(Washington: International Monetary Fund).
Rajan, R.G., and L. Zingales, 1998, ―Financial Dependence and Growth,‖ American
Economic Review, Vol. 88, No. 3, pp. 559-86.
Reinhart, C.M., and K.S. Rogoff, 2008, ―This Time is Different: A Panoramic View of Eight
Centuries of Financial Crises,‖ NBER Working Paper No. 13882 (Cambridge, MA:
National Bureau of Economic Research).
Rodrik, D., and A. Subramaniam, 2009, ―Why Did Financial Globalization Disappoint?‖,
IMF Staff Papers, Volume 56, Number 1, March, 112-38.
World Bank and International Monetary Fund, 2001, Developing Government Bond Markets:
A Handbook (Washington: World Bank).
World Bank Group, 2011, Local Currency Bond Markets in Emerging Markets: A
Contribution to the Stability of the International Monetary System (Washington,
April).
Related Documents