Masaryk University Faculty of Economics and Administration Field of study: Finance The Appraisal of Financial Performance of Adidas Group Master’s Thesis Supervisor: Author: Ing. Bc. Jana HVOZDENSKÁ Chhengkeang CHENG Brno, 2019

Welcome message from author
This document is posted to help you gain knowledge. Please leave a comment to let me know what you think about it! Share it to your friends and learn new things together.
Transcript

Masaryk University
Faculty of Economics and Administration
Field of study: Finance
The Appraisal of Financial Performance of Adidas Group
Master’s Thesis
Supervisor: Author:
Ing. Bc. Jana HVOZDENSKÁ Chhengkeang CHENG
Brno, 2019


Name and surname of the author: Chhengkeang Cheng
Master’s thesis title: The Appraisal of Financial Performance of Adidas Group
Department: Finance
Master’s thesis supervisor: Ing. Bc. Jana Hvozdenská
Master’s thesis date: 2019
Annotation
The goal of the submitted thesis: The appraisal of financial performance of Adidas group” is to
perform financial analysis of Adidas group from 2013 to 2018 and beyond 2019. The first part
is focused on describing the characteristics of Adidas group. The second part is focused on
financial analysis of financial statements of Adidas group from 2013 to 2018 and revenue
forecast and pro-forma financial statements for 2019. And the final part is focused on providing
general view of financial performance of Adidas group and recommendations for inefficiencies
areas.
Keywords
Appraisal, financial performance, Adidas group, financial statements, revenue forecast,
pro-forma financial statements, general view of financial performance, and recommendations.


Declaration
“I hereby would like to certify that I have written the Master’s Thesis “The appraisal of financial
performance of Adidas group” by myself under the supervision of Ing. Bc. Jana Hvozdenská
and I have listed all the literary and other specialist sources in accordance with legal regulations,
Masaryk University internal regulations, and the internal procedural deeds of Masaryk
University and the Faculty of Economics and Administration.”
Brno,
______________________________
Author’s signature

Acknowledgement
I would like to thank my supervisor Ing. Bc. Jana Hvozdenská. Without her, I would have been
able to complete this diploma thesis. Her advices and recommendations have mainly
contributed to the completion of my thesis.
……………………………
Chhengkeang CHENG

CONTENTS
INTRODUCTION…..…………………………………………………….…………………. 13
I FUNDEMENTAL OF FINANCIAL ANALYSIS………………………………………… 17
1.1 Characteristic of financial statement analysis …………..…………………….... 17
1.2 Financial statements ……………………………………………………………. 17
1.3 Comparative analysis……………………………………………………………. 18
1.4 Uses of financial statements…………………………………………………….. 18
1.5 Limitations of financial analysis………………………………………………… 19
2 TOOLS OF FINANCIAL ANALYSIS………………………………………………….. 23
2.1 Fundamental Vs. Technical analysis…………………………………………….. 23
2.2 Analysis of absolute indicators…………………………………………………... 24
2.2.1 Horizontal analysis………………………………………………………...24
2.2.2 Vertical analysis ………………………………………………………….. 25
2.2.3 Net-working capital………………………………………………………..26
2.3 Ratio analysis……………………………………..………………………………26
2.3.1 Profitability ratios………………………………………………………….28
2.3.2 Activity ratios……………………………………………………………...30
2.3.3 Liquidity ratios……………………………………………………………. 32
2.3.4 Debt management ratios…………………………………………………...34
2.3.5 Financial market ratios……………………………………………………. 36
2.4 Analysis of cumulative indicators………………………………………………. 38
2.4.1 Du Pont pyramidal decomposition………………………………………...38
2.4.2 Bankruptcy indicators and credibility models……………………………..39
2.5 WACC and EVA………………………………………………………………...40
2.5.1 WACC …………………………………………………………………….40
2.5.2 EVA ……………………………………………………………………….43
2.6 Revenue forecast………………………………………………………………... 43
2.7 Financial statements forecast...…………………………………………………. 44
3 FINANCIAL ANALYSIS OF ADIDAS GROUP …..………………………………….. 45
3.1 Characteristics of Adidas group………………..………………………………... 45
3.1.1 Introduction……………………………………………………………… 45
3.1.2 Corporate Bodies of Adidas Group …...………………………………… 46
3.1.3 Businesses of Adidas Group ….………………………………………… 49

3.1.4 Product of Adidas Group..……………………………………………….. 51
3.2 Financial analysis of the financial statements of Adidas group…......................... 52
3.2.1 Horizontal analysis of Balance sheet and Income statement of Adidas…… 55
3.2.2 Vertical analysis of Balance sheet and Income statement of Adidas……….59
3.2.3 Net working capital of Adidas …………………………………………….. 61
3.2.4 Ratio analysis………………………………………………………………. 62
3.2.5 Du Pont pyramidal decomposition………………………………………….79
3.2.6 Altman Z score and credibility models.……………………………………. 80
3.2.7 WACC and EVA of Adidas in 2018……………………………………...... 81
3.3 Comparison with competitor…………………………………………………….. 84
3.3.1 Selection of competitors…………..……………………………………...... 84
3.3.2 Scope of comparison and data collection………………………………...... 85
3.3.3 General information and accounting principles..………………………...... 85
3.3.4 Comparison of capital structure…...……………………………………...... 88
3.3.5 Comparison of revenue and profitability ………………………………...... 89
3.3.6 Comparison of net profit margin and ROE.……………………………...... 92
3.3.7 Comparison of liquidity…………...……………………………………...... 93
3.3.8 Comparison of debt management ratios…......…………………………...... 95
3.3.9 Comparison of share……………………………………………………...... 97
3.4 Revenue forecast for 2019………………………………………………………. 98
3.4.1 Data collection…………..…………………………………….................... 99
3.4.2 Forecast method selection………..…………………………………….........99
3.4.3 Revenue forecast ……..…………..……………………………………........99
3.5 Financial statements forecast for 2019 …………………………………………..102
3.5.1 Assumption…………..…………………………………….........................102
3.5.2 Initial calculation……...…………..…………………………………….....103
3.5.3 Pro-forma income statement and balance sheet for 2019………………......104
3.5.4 Earning per share for 2019………..…………………………………….... 110
3.5.5 Return on equity ROE for 2019…..……………………………………......111
3.5.6 Limitation and conclusion………………………………………………… 111
CONCLUSION……………………………………………………………………………...113
LIST OF REFERENCES…………………………………………………………………… 121
LIST OF PICTURES……………………………………………………………………….. 125
LIST OF TABLES…………………………………………………………………………..127
LIST OF GRAPH.………………………………………………………………………….. 129
LIST OF APPENDICES……………………………………………………………………. 131


13
INTRODUCTION
Financial analysis is a process of appraising business and finance-related entity to
determine the performances and suitability. It is used to analyze whether an entity is stable,
solvent, liquid or profitable enough to make decision on a monetary investment.
Financial analysis compares past performance of many consecutive historical periods of the
same company. Moreover, in order to know whether the performance of a company is better or
worse than other companies within the same industry, comparative performance is conducted.
By obtaining the result of comparing past and comparative performance, the future performance
can be prospectively predicted.
The role of the financial analysis is to supply reliable financial information to managers
to utilize to predict future events. Most big companies might analysis only a specific part of
the company’s performance, and supply this financial analysis information to the relevant
executives. Those executives are communicators spreading the financial analysis information
to other influential managers. In case they forecast radical perturbations in the future, they will
persuade management to take precautionary actions. However, in case the company forecast
to have extremely best performance, their expectations will be extended to highlight that the
long term performance will need cautious re-investment of earnings.
Financial statements of a company are the main sources of financial information for
financial analysis to derive ratios, create trend and compare against other companies in the
industry.
This master thesis will devote for analysis of financial performance of Adidas group for
financial analysis of five consecutive accounting periods and of other two companies of similar
size in the same industry using financial analysis methods and provide recommendations for
improvements.
Adidas group is chosen for expanding the thesis and as the source of information,
consolidated financial statements of Adidas such as balance sheet and income statement will be
used for the purpose of analysis.
Adidas is well-known for its famous high quality sport wear products worldwide. The
company has its headquarter in Germany, and its name was inspired by its founder Adolf
Dassler. He began producing shoes together with his brother Rudolf Dassler and enable their
product recognized around the world its three stripes logo in parallel shape. The world
recognized company confronted many financial encounters however company still survived by
exploring external factors distressing Adidas.

14
Aim of the thesis
The main aim of the thesis is to perform financial analysis of Adidas Group and on the basis of
its results to appraise the company’s financial health and to formulate recommendation for
improving its economic and financial efficiency.
The performance of financial analysis will be conducted by using tools based on comparison of
financial analysis of five consecutive accounting periods and of other two companies of similar
size in the same industry. The results will be compared with industry average and any deviation
will be investigated. After appraising all outcomes, recommendations will be formulated to
enhance the economic and financial efficiency, profitability and management of the company
for further improvements.
Partial objectives of the thesis
The objectives of this master diploma thesis are:
. Judging Adidas’ ability to meet all its financial obligations
. Assessing the past performance and current position whether the financial condition of Adidas
is sound and recommendation for any difficulty
. Assessing the bankruptcy and failure probability
. Predicting the future growth prospects
In order to achieve the above objectives, the thesis will contain two parts: theory part
and practical part. The theory part describes and explains the relevant basic tools analysis of
financial statements and its usage, which is applied in practical part. The theory part will be
detailed in section of Methodology which mainly describes relevant scientific literature and
annual reports of ADIDAS GROUP are the main source for practical part of this thesis.
All theory part will be put into practice in the practical part which will be detailed in Chapter
3: Financial analysis of Adidas group
Methodology
This section is covered by theatrical aspects of methods which will be employed for the
appraisal of financial performance of Adidas. Horizontal and vertical analysis, net-working
capital, financial ratio analysis, DuPont analysis, bankruptcy prediction method, weighted
average cost of capital WACC and economic value added EVA, and financial forecasting
method will be used for the appraisal. The analysis are to be performed by using ratio analysis.

15
Using the above mentioned methods, the following aspects will be taken into account
for the appraisal of the company:
. Profitability
. Activity
. Liquidity
. Debt management
. Financial market
. Bankruptcy prediction
The appraisal of financial performance of Adidas group through methods based on
comparison of financial analysis of six consecutive accounting periods and of other two
companies of similar size in the same industry. The results will be compared with industry
average and any deviation will be investigated. After appraising all outcomes,
recommendations will be formulated to enhance the economic and financial efficiency,
profitability and management of the company for further improvements.

16

17
1 FUNDEMENTAL OF FINANCIAL ANALYSIS
1.1 Characteristic of financial statement analysis
Financial statement analysis engages in study of the link among numbers in financial
statements and the tendency of those numbers over the years.
Examining those tendencies enables a company to forecast what company is going to carry out
for the future. Moreover financial statement analysis enables a company to appraise its
performance aiming at determining issue areas. To sum up, financial statement analysis are both
examination the issues of company and forecast the way a company will carry out for the future.
(Stice, et al., 2011, p. 665)
The financial information comprising in financial statements have to be relevance.
Obviously, for the purpose of being beneficial, information has to be relevant for its intention
toward making economic-decision. This needs forecasts of forthcoming cash flow by relevant
stakeholders who are able to depend partially on related past and present information containing
in financial statements being statement of financial position and statement of comprehensive
income. Relevance will be enhanced when the information is most up to date.
(Alexander, et al., 2016, p.45, 47)
1.2 Financial statements
The three beneficial financial statements are statement of financial position, statement
of comprehensive income and statement of cash flow.
Statement of financial position displays amount of resources (assets) controlled by a company
and in what way it allocates its finance to those assets. Particularly it displays the current and
fixed assets of a company at a specific time (monthly end, quarterly end or year-end). Most of
the time, the company possesses those assets, but some other companies lease those assets on a
long term basis. The way a company allocates its finance for acquiring those assets is shown
by the combination of current liabilities (accounts payable and/or short term borrowing), long
term liabilities (fixed debts and leases), and owner’s equity (preference share, common share,
and retained earnings).
Statement of comprehensive income comprises of information of the company’s operating
performance during a certain period of time (a month, a quarter or a year). Unlike the statement
of financial position, which is at specific point of time, the statement of comprehensive income
shows the movement of sales, expenses, and earnings during a certain period of time.

18
Statement of cash flow combines the outcomes of a company’s cash flow of income movement
(depending on the most recent year’s statement of comprehensive income) and the variation on
the statement of financial position (depending on the most recent year’s annual statement of
financial position). Expert employs these cash flow values to forecast the value of a company
and to appraise the risk and return of the company’s bond and stock.
(Reilly, et al., 2012, p. 261)
1.3 Comparative analysis
In order to make explanation of appraisal from financial statement analysis, we have to
determine if the appraisal shows excellent, poor, or medium performance. To conduct that
assessment, it is required yardstick benchmark for comparisons as the following:
- Intra-company-The company being appraised allows benchmark for comparisons due to
its own past performance and link of those financial items. For example, we can compare
the company’s current income with its past years’ income based on its revenues and/or
total assets.
- Competitor- Same or similar competitor of a company being appraised allows benchmark
for comparisons. For example, Adidas’ profit margin can be compared with Nike’s profit
margin.
- Industry-Industry data allows benchmark of comparisons. Those data can be found from
service providers namely Dun & Bradstreet, Standard & Poor’s, and Moody’s.
- Guidelines (rules of thumb)-General benchmark of comparisons is made from experience.
For example, the 2:1 level for current ratio being 2 of current asset against 1 current
liabilities or 1:1 level for the acid-test ratio being 1 current assets by taken off inventory
and prepaid expense against 1 current liabilities. We must use guidelines carefully and it
is important to exercise it in appropriate circumstances.
(Wild, et al., 2009, p. 548)
1.4 Use of financial statements
Internal Uses-information in financial statements provides many utilizations internally
of a company. One of the most important of utilization is performance appraisal. For instance,
executives are regularly appraised and remunerated based on financial assessment of
performance namely profit margin and return on equity. Moreover, numerous division company
regularly conducts comparison the performance of those divisions by making use of the

19
financial statement information. One more important internal use is preparation for the future.
Past financial statement information is beneficial to produce predictions for forthcoming and to
examine the faithfulness of hypothesis produced in those predictions.
External Uses-Financial statements are beneficial to stakeholders outside the company,
such as short-term and long-term creditors and potential investors. For instance, creditor will
require the information when granting loan to the company.
This information is used to appraise the suppliers, and suppliers also examine financial
statements of company in deciding to prolong credit to the company. Customers make use of
this information to forecast if company is probable to continue its operation in the future. Credit-
rating agencies depends on information from financial statements when making appraisal of a
company’s overall creditworthiness. The general idea right here is that financial statements are
the main source of information of a company’s financial condition. Such information is
beneficial when appraising main competitors of a company. When thinking of starting a new
product, the main fear will be that whether the competitor will start the same product soon after.
For this case, a company will be fascinate studying its competitors’ financial health to evaluate
whether they are able to develop any vital expansion. Lastly, a company want to acquire another
company. Financial statement information is important to examine prospective purposes and
conclude the proposal. (Ross, et al., 2010, p. 69)
1.5 Limitations of financial analysis
Financial analysis is very beneficial to study a company’s financial health as it enable
to identify many strengths and weaknesses of the company. Nevertheless, there are limitations
occur leading to deficient decisions:
- Once a company perform in multiple industries, conducting comparison of its
ratios to the average of a specific industry will be evidenced pointless. Think of
a company having three kind of industries: sport equipment and tires,
restaurants, and beer product. If we compare that company to restaurant industry
in which that company operates most, divergences of the company’s ratios of
the industry norm might be affected by the characteristics of the other industries
that company also operates.
- Moreover, the industry used as a yardstick benchmark for comparison might
contain companies involving in many businesses. It might misrepresent the
average ratios of the industry.

20
- Companies employ different accounting practices. Because financial ratios are
obtained from financial statements, a company’s financial ratios might diverge
from the standard due to the variations of accounting methods used instead of
variations of company’s operations. Some companies have been condemned for
employing “creative accounting” to hide the real financial condition. Those
activities might restraint the ability of financial analysis to appraise the
company. When the internal analyst of the company being evaluated, the issue
might be fewer severe, as more information might handily be acquired. External
analyst usually can’t approach the required information.
- Companies whose financial statements differ by the season of the year might
indicate big divergence from the standard at certain of times but not at other
time.
- There might be very good rationales that a company’s ratios arise to show an
issue when nothing happen, and other way round. Remember the case of a
company that just acquires a new issue of long term debt. From the time that
company gets the proceeds from issuing the bonds and the time that the finance
is spent for its intended purpose, the company might face an unusual big current
ratio. The analyst inspecting this issue, the analyst might improperly infer that
executives are performing bad job of overseeing company’s asset.
- Industry standards are relied on historical data and are not fundamentally suggest
what should be in the future. So management shall not base their decisions
relying entirely on ratio analysis.
- Under specific circumstances, the industry average ratios should be formed the
ratios of companies with similar capacity. In fact, small companies might tend
to possess considerably different ratios than big companies within the operating
industry.
- Big inflation lead the company’s asset to be undervalue in its financial
statements (Purchase price minus depreciation). Inflation can raise the value of
asset. Because the assets are undervalue, ratios namely return on investment,
ROCE, asset turnover are misrepresented.
- Rise of interest rate usually follows the rise of inflation rates. The rise of interest
rates might lower the value of bonds. If the value of a company’s liabilities is

21
lowered less than its book value, the liabilities on the company’s financial
statements and the degree of financial leverage will be overvalued.
(Madura, et al., 1988, p. 171-172)
- No discussion of non-financial issues: Merely numerical information are
contained in the financial statements and are shown in financial terms. However
financial statements do not indicate non-financial issues on the qualitative
information on eco-friendly concern of the company's operations toward local
community, effectiveness of top executives, goodwill of the company,
connection between employee and employer, workers’ proficiency, customers’
satisfaction and loyalty, competitive strength and so on which are not shown in
financial terms. These qualitative information are important for a company to
realize the true financial position and the performance outcomes of the company.
A successful company can fail by these issues.
(https://www.accountingtools.com/articles/limitations-of-financial-statements.html).

22

23
2 TOOLS OF FINANCIAL ANALYSIS
2.1 Fundamental Vs. Technical analysis
Fundamental analysis is an investing technique used by investors who seek winning
company’s stock price by analyzing the company’s past performance such as financial
statements, daily management, and other related factors that might influence rate of return of
the company. By looking at historical performance of company, the method is used to forecast
the future value of stock by studying and comparing fiscal data in the previous period to indicate
the true value of equity of a company.
On the other hand, another technique is known as technical analysis. Based on the
historical chart and trend, it can predict the future value of a company’s stock price. People
believe that past performance of a company indicate the trend and pattern which will continue
until some factors change.
The difference is that technical analyst believe that securities change in quite foreseeable
trends and patterns
Differences between fundamental and technical analysis
Fundamental analysis
- Fundamental analyst begin with financial
statements of a company
- From financial statements, the intrinsic
value of company is measured and
decisions are made whether to invest in the
said company or not. Moreover analyst
perform other tasks in addition to the
financial statements.
- Use long term approach to evaluate the
securities. Fundamental analysis employs
data over number of years
- Use for investor hoping that stock price of
a company will increase.
Technical analysis
- Technical analyst begin with charts and
trend
- Technical analyst will not analyze
fundamental of company as this
information is in the charts.
- Use short term approach such as weeks,
days or minutes to evaluate the
securities.
- Use for trader hoping that it can be sold
at a higher price.
(Kulkarni, et al., 2013, p. 236)

24
2.2 Analysis of absolute indicators
The basic methodical instrument and the link structure of financial information and
other primary data for financial analysis are expressed by proportion indicators. These
indicators expresses the ratio of two absolute indicators, the connection of a number to another.
The benefit of proportion indicators is the contraction of absolute data which differ on the basis
of the company’s size to the common and comparable basis. It is the better way to perform
comparison most up-to-date financial information of a company in respecting to its past data or
the data of different companies, big or small, or a group of company.
Absolute indicators, basic financial technique aiming at evaluating financial performance of
company, shows the size of financial statement elements. They present information of the
degree of the company’s assets and liabilities, income and expense, by using money as the way
of measure unit.
2.2.1 Horizontal analysis
Analysis of a sole financial figure will restrict its value. One the other hand, most of
financial statement analysis engage in determining and elaborating links among figures, group
of figures, and variation of those figures. Horizontal analysis involve in identifying the financial
statement data over the time. The word “horizontal analysis” emerges the movement from the
left to right of eyes as comparative financial statements is examined over the time.
Comparative financial statements: comparison the figure of more consecutive period of time
usually assists in examining the financial statements. Comparative financial statement assists
this comparison by presenting financial figures shoulder to shoulder row of individual
statement, known as a comparable form.
Change = Analysis period amount - Base period amount
It is calculated the differences for financial statement element as following: period being
analyzed is the point of the financial statements being analyzed and base period is the point or
period for financial statements used to compare against this base period. The base period is
usually the preceding year. We divide amount difference by amount of base period and multiply
by 100 to get percentage difference:
Percentage change % = Analysis period amount−Base period amount
Base period amount x 100

25
In general, when horizontal analysis is used to compare amounts to average or median
amount of preceding periods (average or median amount smooth out exceptional variation),
percentage and ratios are regularly rounded to one or two decimal places, however in real
practice, this matter is inconsistent. It is important to evaluate whether the rounding of
calculation will influence decision making of user. The calculation should not be exaggeratedly
thorough leading to lose the important link among a peak of decimal point and digits.
(Wild, et al., 2009, p. 548)
2.2.2 Vertical analysis
Vertical investigation is a device to assess each financial statement elements or a bunch
of elements in terms of a particular base amount. We commonly characterize a key total figure
as the base for statement of comprehensive income which is usually income and for a statement
of financial position is usually total assets. The word “vertical analysis” emerges movement
from up to down (or down-up) of eyes as we study common volume financial statements.
Vertical analysis is also known as common size analysis.
The comparable financial statements (statement of financial position and statement of
comprehensive income) indicate the difference of every element over period of time however
it does not underline the comparable significance of individual element. Vertical analysis is
used to show the difference of the comparable significance of every financial statement element.
Each amount in vertical analysis are reexamined by using percentage. The dividing each
financial statement amount being examined by related base amount gives the examined percent:
Percent % = Analysis amount
Base amount x 100
Vertical analysis of statement of financial position shows every element being the
percentage of a base amount, which total assets is a normal vertical analysis of statement of
financial position. The base amount is determined a 100% value. This indicates that the total
value of liabilities and equity equals to 100% as this amount equals to total assets. Now we
calculate the vertical analysis percent of asset, liability and equity elements as base amount
being total assets. When showing a consecutive statement of financial position in this way,
differences of combination of assets, liabilities, and equity appear.
Vertical analysis of statement of comprehensive income is useful by using statement of
comprehensive income. The base amount is usually income determined to be 100% value. Each

26
normal volume of statement of comprehensive income elements appears a percent of income.
When we consider 100% income amount expressing a dollar sale, the rest of elements display
the amount income dollar is apportioned to the cost expense and net income.
(Wild, et al., 2009, p. 553)
2.2.3 Net working capital
Without taking fixed asset into calculation, all other elements of a company and
combination of those elements into one called net-working capital (or working capital).
Net-working Capital = Raw material stock + Work in progress + Finished goods stocks
+ Trade debtors + Other debtors + Prepayments – Trade creditors – Accruals-Social
security and other taxes- Cash in advance –Other creditors
Net-working capital is the different between a company current assets and current
liabilities. It is the amount of cash available for a company needs to finance its daily operations.
Let consider that it is cash that a company deposits in the bank when the company does not
have to finance inventories, offer sale on credit to customers, process prepayments, and more.
When a company carries out the above activities, it will require cash for investment in net-
working capital.
The working capital cycle is the length of time that convert the net of current assets and
current liabilities into cash. When working capital is long, more capital is tied up in its working
capital, so the tied up capital does not generate any return to the company. Therefore, the
company tries to decrease this working capital cycle by receiving account receivables faster
and delaying payment to suppliers as long as possible.
(Rice, 2003, p.156-157)
A company needs adequate working capital to meet current debts, to carry out sufficient
inventory, and to take the advantage of cash discount. A company that runs low on working
capital is less likely to meet current obligations or to continue operation.
(Wild, at al., 2009, p. 557)
2.3 Ratio analysis
Since a sole figure gives little sense, analyst employs financial ratios to explore more
meaning. For instance, a company with net profit of 100000 currency unit will not so revealing

27
except when the company realizes the sale figure of 1 million currency unit producing this net
profit. So ratios are aimed at giving purposeful links of each amounts in the financial statements.
A company is able to provide a number of possible ratios since the main financial statements
record many separate elements. Many of ratios will have little value. A company should
produce the most appropriate and important ratios to fit the economic situation of the company.
One single number from financial statement is small benefit and a separate ratio produces small
value unless it is related to comparative ratios from other companies. Relevance is produced by
relative financial ratios. So company’s performance is compared relatively to:
- the aggregate economy
- Its industry yardstick benchmark
- Its main competitors
- Its operational budgets
- Its historical performance
As economic situation affects all companies that operate in, having the comparison to
aggregate economy is very beneficial. For instance, during recession, a company will not
foresee to have bigger generating profit margin; with such situation, instead a steady profit
margin can be stimulated. One the other hand, it is an indication of deficiency when a company
produces a little rise in the profit margin during main business development. So economic
situation assist investors in perceiving the way of a company responds toward economic cycle
and forecast of future performance will be enhanced during subsequent economic cycle.
It is very beneficial to compare a company’s performance to the industry that it operates
in because different industry influences the company differently. Industry has significant effect
on the companies with homogeneous product such as steel, rubber, glass and wood product as
these companies, within these industries, are facing simultaneous demand changes. In
conclusion, a well-managed steel company also faces a lower sale and profit margin during a
recession. In this case, the doubt is not related to sale or profit margin decreased; it should be
related to sale decrease of whole steel industry. Moreover, investors ought to study industry’s
performance in relation to the economy to perceive the way industry reacts to the economic
cycle.

28
By comparing to its competitors, the ratio analysis produces a performance benchmark
against which to explain those companies’ ratios. The comparison against a company’s
competitors gives a big picture whether a company is performing well or badly. In general, a
company is facing competition of the same industry. It is true that benchmark assists a company
in identifying chances or space available for improvement to stable its stand better toward its
success among different companies
An operational budget describes in a forecast spreadsheet as a company plans to achieve
income and expenses for future years. The budget is then split into month or quarter in order
present needed information for executives to monitor the performance and later make necessary
adjustments. This budget is based on the company’s prior year-performance and future
expectations. A company traces its operational budget comparing to its actual revenues and
expenses.
Historical trend analysis provides the financial story of a business in recent years to
produce a perspective of what a company is going to do. It allows executive to go in the right
direction. It assists executive in overseeing the main decisions to ensure that company is
financially viable. Comparison of three or more years ensure the trend analysis and assist the
executive in measuring operating performance and making adjustment as needed. Executives
might identify each individual division to find the root cause when usual issue occurs. Investor
or stakeholders can compare company’s result of multiple years to see the improvement of the
company performance.
(Reilly, et al., 2012, p. 266)
2.3.1 Profitability ratios
Profitability is the ability of a company to utilize its assets efficiently to make profits
and we are interested in a company’s ability to use its assets efficiently to produce profits and
favorable cash flow. So it is the company’s ability to yield an adequate return to the invested
capital of shareholders by evaluating earnings in relation to the degree and sources of capital.
Profit margin: Profit margin shows a company’s ability to generate net income from sales.
Profit margin is evaluated by net income as a percent of sales.
Profit margin = Net income
Sales

29
To make appraisal of profit margin of company, industry must be taken into
consideration. Each industry might need different profit margin. For example, an appliance
company needs profit margin ranging from 10% to 15% whereas a supermarket might need a
profit margin from 1% to 2%.
(Wild, et al., 2009, p. 562)
Return on total assets: To evaluate a company’s performance how effectively a company is
utilizing its assets to generate net income. Return on total assets is calculated as:
Return on total assets = Net income
Average total assets
The bigger ratio, the more effectively that a company is utilizing its assets.
The profit margin and total asset turnover are the basic two basic elements of a
company’s overall performance efficiency. The below equation presents the relation between
return on total assets, profit margin and total asset turnover:
Return on total assets = Profit margin x Total asset turnover
= Net income
Sales x
Sales
Average total assets
(Wild, et al., 2009, p. 563)
Return on capital employed: ROCE
For a company, capital employed is the net operating assets combining between owner’s
equity and long term borrowings. The executives aim at generating high profit as possible using
this assets. The assessment of a company’s performance of efficient use of resources is so called
return on capital employed ROCE. Since capital employed strives to include all the long term
finances used by the company, the return on capital employed reveal the efficiency of the whole
company’s performance instead of any certain financier such as stockholders.
As long term borrowings is included, interest expense is added back to net income to calculate
ROCE. So earnings before interest and tax EBIT is used for calculate ROCE.
Return on capital employed = Earning before intest and tax
Owners′equity+Long term borrowings
EBIT is used because interest expense is tax deductible, so interest net of tax is needed for
adjustment of tax charge.
(Alexander, et al., 2016, p. 137)

30
Return on owners’ equity: It is probably the most important aim of a company to run the
business to earn net income and maximize shareholders’ wealth. The return on owners’ equity
assesses a company’s performance in arriving this aim. Return on owners’ equity is calculated
as:
Return on owners’ equity = Net income−Preferred dividends
Shareholders′equity
Shareholders’ equity is the book value including minority interest in the company’s accounting
records. The dividends on cumulative preferred stock are deducted accordingly regardless the
time it is declared. In case of noncumulative preferred stock, dividends are deducted when it is
declared
(Wild, et al., 2009, p. 563)
2.3.2 Activity ratios
Activity ratios are indicators of how fast a company turns assets into sales or cash.
Generally, the faster executives are able to turn the company’s assets into sales or cash, the
more effectively the firm is performing.
Account receivable turnover assesses how many times a company is able to turn its account
receivables into cash. It is calculated as:
Account receivable turnover = Sales
Average account recceivable
Short term receivables from customers should be taken into account in account receivables.
Account receivable turnover is favorable if a company can collect its account receivables faster.
A high turnover is great since the company does not require to tie big amount of fund to its
account receivables. But an account receivable turnover will be too high; this situation will
happen, so company can apply more restrictive credit term as it negatively impacts sales
volume.
(Wild, et al., 2009, p. 559)
Inventory turnover: The length of time between a company’s inventories are retained and the
inventories are sold might change the requirement of working capital. Inventory turnover is a
measure of this change. Inventory turnover is calculated as:
Inventory turnover = Sales
Average Inventory
Average inventory is used since opening and closing inventory of the period do not show their
common amount.

31
Inventory turnover assists a company in deciding on pricing its products, manufacturing
process, influencing promotions to proceed excess inventory, and acquiring new inventory.
Inventory turnover might be too high when a company holds its inventory very small. It will
lead to limit sales volume. A low inventory turnover indicates a company does not employ its
assets efficiently. In some cases, extra inventory is hold to maintain sales volume of the
company. There is no common standard for inventory turnover besides declaring that it is
favorable to have high ratio if sufficient inventory is satisfied the sale demand.
(Wild, et al., 2009, p. 559)
Day’s sales uncollected: Day’s sales uncollected is the number of day a company will take to
collect cash when inventory is sold out. It is calculated as:
Day’s sales uncollected = Account receivables
Sales x 365
The short term receivables from customers are also included in account receivables.
Day’s sales uncollected measures how many days a company is able to convert current amount
of account receivables into cash. The long duration between the time of sales and the time
collecting cash leads to cash flow difficulty. A day’s sales uncollected means that a company
takes few days to receive its accounts receivable payment. It will be great when the company’s
credit term is available. A good guideline standard determines Day’s sales uncollected should
not be over 1 1/3 times the days in its 1 credit period without discount or its 2 credit period with
discount.
(Wild, et al., 2009, p. 559)
Day’s sales in inventory: A useful measure to assess inventory liquidity of a company.
It shows how long inventory is hold in term of days’ sales. It can explain as the number of days
inventory can be sold out of warehouse when no new are acquired or it can be said that the
number of days of funds are tied up in inventory before it is sold out. Day’s sales in inventory
is calculated as:
Day’s sales in inventory = Ending inventory
Cost of goods sold x 365
Closing inventory is used for Day’s sales in inventory focuses on ending inventory.
(Wild, et al., 2009, p. 559)
Total asset turnover: Total asset turnover assesses a company’s ability to employ its assets to
generate sales and income and is a significant evidence of operating efficiency as executives

32
dedicate great deal of attention to make decision the amount to invest in assets and to employ
the assets efficiently and effectively. The ratio is calculated as follow:
Total asset turnover = Sales
Average total assets
If asset turnover ratio is high, a company is said utilizing its assets effectively to generate sales.
However there are new and old assets with their accounting value as the old assets contain a
lower value than that of new assets. Moreover, each industry might have different investment
in fixed assets. Companies with small investments in fixed assets such as retail and wholesale
trade companies are likely to possess high ratios of total asset turnover than that of
manufacturing company which invest large amount in its fixed assets. The company with high
labor intensive will produce high total asset turnover.
(Ross, et al., 2005, p. 34)
2.3.3 Liquidity ratios
Liquidity is the concerns of a company’s resource available to meet short term
obligation requirements. Analysis of liquidity is aimed at evaluating a company’s funding
requirement to see how profitable a company is in utilizing its assets.
When a company can’t meet its current obligation, its existence will not be sure that it can
continue its operation in the future. In case accounting measurement believes the company’s
existence continues, more analysis must be conducted to validate this belief using liquidity
measures. Moreover, a lack of liquidity causes lower profitability and fewer opportunities. To
company’s creditors, the lack of liquidity might cause problem of interest and principal
collection for company’s creditors. A company’s customers and suppliers of goods and services
also affected by Short term liquidity problems imply that a company is not able to fulfil the
contracts and possible impairment to relation between customer and supplier.
It is not taken into account only the amount of current assets and current liabilities but
also the ratio of the two items. The current ratio is calculated as:
Current ratio = Current assets
Current liabilities
A company with high current ratio indicates a good liquidation stand and an ability to meet its
current obligations. High current ratio indicates more fund invested in current assets in
comparison to current obligations. It is not efficient to use the fund as having an excessive
investment in current assets since current assets usually yield small return on investment in

33
comparison to long term assets. A good guideline is 2:1 or 1.5:1 for the current ratio when
appraising a company’s ability to pay its current debt. The current ratio 2:1 or higher current
ratio is normally considered to be strong credit risk in the short run.
In addition to the above guideline, analysis of current ratio must take more three factors:
type of business, component of current assets, and turnover rate of current asset components:
- Type of business: A service company usually providing small or no credit sales and hold small
inventory tends to have a current ratio less than 1:1 provided that revenues generated is
sufficient to meet its current debt. But a company selling high-priced products or furniture will
have a higher current ratio due to the difficulties in estimating sales demand and sales receipt.
Consequently, a comparison with ratios of successful companies within industry and preceding
periods is more useful when conducting analysis of current ratios. The company’s accounting
method must also be considered, notably inventory method used, which effects the current ratio.
In the time of high cost, LIFO method will report small current asset than that when FIFO is
used.
- Component of current assets: The combination of a company’s current assets is vital to assess
its short term liquidity. For example, cash, cash equivalent, and short-term investment provide
more liquidity than accounts and notes receivable do. Furthermore, short term receivables
usually provide more liquid than inventory does. Certainly cash is the most liquid assets used
immediately to pay current debts. More funds tied up in receivable and inventory will lower a
company’s ability to pay current debt.
- Turnover rate of current assets components: Assets turnover evaluates a company’s efficiency
in utilizing its assets in relation to sales generated. Also, evaluation of turnover for each separate
current assets is first beneficial.
(Wild, et al., 2009, p. 557)
Cash ratio: Cash and cash equivalent are the most liquid asset of a company. Cash ratio can
be calculated as:
Cash ratio= 𝐂𝐚𝐬𝐡 and cash equivalent
𝐂𝐮𝐫𝐫𝐞𝐧𝐭 𝐥𝐢𝐚𝐛𝐢𝐥𝐢𝐭𝐢𝐞𝐬
A low cash ratio will not be a problem if the company is able to obtain loan on short notice. But
the sources of borrowing are not known whether from bank or by using guaranteed credit line
whenever the company can choose. There is no standard measure on liquidity of a company’s
reserve borrow power.
(Brealy, et al., 2011, p. 719)

34
Acid-test ratio: The acid-test ratio (quick ratio) measures a company’s ability of short term
liquidity without relying on inventory. Quick asset are cash, cash equivalents (short term
investments), and account receivables.
Acid-test ratio = Cash and cash equivalents+Account receivables
Current liabilities
The standard guideline for a good acid test ratio is 1:1 indicating that a company will not face
short term liquidity matter. It leads to liquidity concern when the ratio is smaller than 1 showing
that that current liabilities is bigger than quick assets. Make sure that company is able to obtain
enough cash from sales or from other source faster to pay off its obligation or due date of the
obligation is late until next period.
(Wild, et al., 2009, p. 558)
2.3.4 Debt management ratios
Debt management ratios aim at evaluating a company’s long run financial viability and
its ability to meet long term liabilities. The most important component of debt management
analysis is the combination of a company’s capital structure ranging from the most permanent
equity financing to riskier or more temporary short term financing. Debt financing is viewed to
be less expensive than equity financing because interest expense is tax deductible but dividend
is not so most companies seek to have an optimum capital structure that will maximize
shareholders’ wealth. The analysis stresses on a company’s ability to both meet its long term
obligation and provides protection to those creditors.
Debt and equity ratio: one component of analysis to evaluate the share of a company’s assets
contributing to its shareholders and creditors. The debt ratio presents total liabilities being a
percent of total assets. The equity ratio presents the supportive evidence by expressing total
equity being a percent of total assets.
A company is said to be less risky when its capital structure (equity and long term liabilities)
possesses larger share of equity. Interest and principal payment is a risk factor for debt
financing. One more factor is equity financing; in case of loss incurred to the company, equity
financing takes in the share of that loss absorb and later the assets will be satisfied creditors’
claims. For shareholder believe that when a company generate a return on borrowed capital
higher than the cost of borrowing, the extra net income will increase to shareholders’ wealth.
The combination of debt into capital structure is known as financial leverage since debt might

35
effect on generating net income to shareholders. A company is considered be largely leveraged
when a big portion of their assets is financed by debt financing.
Debt to equity ratio: is the proportion of total liabilities to equity. It is an evaluation of financial
leverage degree of a company’s capital structure. It is calculated as:
Debt to equity ratio = Total liabilities
Total equity
A company in variable industry will have lower ratios while the other in the stable industry,
less risky, will have higher ratios. The Lower the debt-to-equity ratio, the more preferable for a
company because it represents less risk.
(Wild, et al., 2009, p. 559)
The debt ratio: also known as debt to assets ratio, a financial ratio shows the level of a
company’s leverage. It is the proportion of a company’s assets that are employed by debt.
When ratio greater than 1 shows that a considerable portion of debt is funded by assets. In other
words, the company has more liabilities than assets.
The Formula of Debt Ratio Is: Debt ratio=Total debt/Total assets
When ratio is bigger than 1, a large portion of debt is used to finance the assets or we can say a
company has more liabilities than equity. A high ratio shows that a company may be at risk of
default on its loans in case creditor were to raise interest rates immediately.
Debt ratio is employed for company’s growth as it provides sustainable uses of debt for
businesses.
https://www.investopedia.com/terms/d/debtratio.asp
Financial Leverage
The amount of debt that a company employs to finance more assets is called Financial
Leverage or equity multiplier.
Formula: Financial leverage = Total assets/Shareholders’ equity
Too much level of financial leverage leads to the risk of failure as the company is facing more
difficulties to pay back the debt.

36
When the debt portion rises, the amount of financial leverage also rises. It is good if the
uses of debt which provides returns bigger than the financial expense related to the debt.
Nowadays more companies employ financial leverage rather than raising more equity portion
that can lower the earnings per share for shareholders.
Financial leverage enables a company to generate a disproportionate amount to its
assets and its financial expenses is tax deductible. So financial leverage enables a company to
generate extra returns to shareholders, however it contains the risk of outright bankruptcy in
case cash flows fall less than what company predict its expectations.
https://www.accountingtools.com/articles/2017/5/14/financial-leverage
Time interest earned: It measures company’s ability to meet interest obligation. The available
amount of earnings before interest and tax is used to cover interest expense. Time interest
earned is calculated as:
Time interest earned = Earnings before interest and tax
Interest expense
The ratio suggest how many times a company is able to pay the interest expense with its
earnings before interest and tax. The bigger the ratio, the safer for creditors. One guideline
claims that creditors are pretty safe when a company generates earnings before interest and tax
two times or more than interest expense each period.
(Wild, et al., 2009, p. 559)
2.3.5 Financial market ratios
Financial market evaluation is beneficial for assessment of a public company. This
evaluation employs publicly traded stock price by prospect market of risk and return for the
company.
Price earnings ratio: A better sense of stock market value of a company is evaluated by its
expected future cash flow as investors want to purchase stock at a financially sound company.
Earnings are very important when valuing a company stock price since investors are interested
in how profitable a company is and will be in the future. Earnings per share comparing to stock
market value per share indicates the fact of what market will expect or at what price that a
company’s current earnings will be bought.
Price earnings ratio = Market price per share
Earning per share

37
Generally investors will not make decisions based on one single ratio. A company’s stock price
with high PE ratio will be great for investment when its earnings last longer beyond current
market expectations. Likewise, a company’s stock price with low PE ratio is said to be a bad
investment when it is not able to maintain earnings and fall under market expectation.
(Wild, et al., 2009, p. 563)
Book value per share: It represent the value of equity available to common shareholders as per
share basis.
Book value per share = Equity available to common share
Number of common share outstanding
Conceptually, book value per share is the net assets, which assets minus debt, and it might be
viewed what will happen when a company’s operations stop.
(Wild, et al., 2009, p. 470)
Basic earnings per share: EPS or known as net income per share measures the amount of net
income generated per share of company’s common stock or the amount of money that each
share will receive when all net income is distributed. Weighted average common share
outstanding is used for income period. BEPS is calculated as:
Basic earnings per share = Net income−Preferred dividend
Weighted average common share outstanding
Basic earnings per share is similar to other profitability or financial market prospect ratios. The
higher earnings per share, the better since a company is able to generate more net income for
its shareholders. A high basic earnings per share always leads to higher stock price of a
company. However many factors can manipulate this ratio, so investors should carefully make
decision on their investment opportunity.
(Wild, et al., 2009, p. 468)
Diluted earnings per share
A company is said to possess complex capital structure when its capital structure
contains options or convertible securities (preferred share or debt). This company shall
acknowledge the possible effect on its EPS as those securities will be converted to lower EPS.
Diluted EPS takes into account the maximum possible dilution effect resulting from convertible
securities that are not regarded as common stockholder’s equity for current period.
Diluted EPS = Net income−Preferred dividend
Weighted average share outstanding+Diluted share
(White, et al., 1997, p.173)

38
Dividend cover: The dividend cover states the number of times a company is able to cover
current year’s dividend from net income of year. This provides the evidence of assurance level
for the future dividend distribution will be.
Dividend cover = Net income
Total dividend of common share
The higher the ratio is perceived to be greater coverage or safer margin from net income to
dividends which will result in higher dividend payout in the future. It is absolutely workable
for a company to keep the dividend cover lower than 1 or even negative. Executives always
prefer to maintain level of dividend as an indicator to market expectation of performance even
in period of bad results.
(Alexander, et al., 2016, p. 331)
Dividend yield: A method of estimate of dividend return of stock by measuring cash dividend
paid out in relation to market price of share.
Dividend yield is determined by the annual amount of dividend attributable to common shares
as a percentage of market price:
Dividend yield = Dividend per share
Market price per share
Investor purchases shares in a company’s stock hoping to have gain in the form of cash dividend
and of stock price rise. Investors are interested in a company with high dividend because they
want their investments to produce regular cash flow for them. On the other hand, a company
might have small or even no dividends since the company uses this fund to finance the
expansion of operation. Yet this company is still attractive to investors as they believe that its
stock price will rise in the future.
(Wild, et al., 2009, p. 563)
2.4 Analysis of cumulative indicators
2.4.1 Du Pont pyramidal
DuPont analysis is a useful tool used to break down related elements of return on equity.
Breaking down of ROE enables investors to evaluate the main financial performance to
discover strengths and weaknesses.
Basically, return on equity ROE is calculated by net income divided by equity
ROE = Net income/ equity

39
The tool explores more than profit margin analysis to know how efficiently a company is using
its assets and how well a company is using debt financing to generate return in the form of sales
and cash.
Financial leverage links the difference between ROA and ROE. Below is the breakdown of
ROE:
ROE = Profit margin x Asset turnover x Financial leverage
= Net income
Sale x
Sale
Total asset x
Total asset
Equity
= ROA x Financial leverage
(ROA = Net income/Total asset)
Due to these three performances, a company might increase ROE by sustaining a high profit
margin, raising asset turnover, and leveraging assets more effectively.
(Ross, et al., 2005, p.37)
2.4.2 Bankruptcy indicator model
Altman Z-Score
The Altman Z-Score was named after Edward Altman who was a professor at the New
York University. It is a statistical technique used to evaluate the probability of bankruptcy of a
company.
Its formula identifies seven common pieces of information, which can be found at the
company's public disclosure.
The Standard Z-Score = (1.2 x X1) + (1.4 x X2) + (3.3 x X3) + (0.6 x X4) + (1.0 x X5)
X1 = (Working Capital/Total Assets)
X2 = (Retained Earnings/Total Assets)
X3 = (Operating Earnings/Total Assets)
X4 = (Market value of equity/Total Liabilities)
X5 = (Sales/Total Assets)
The meaning of range of overall Z score:
Z ≤ 1.80 : Bankruptcy zone
1.80 < Z ≤ 3.00 : Grey area
Z > 3.00 : Safe zone

40
The lower score, the higher the chance of bankruptcy. When a company has a Z-Score
more than 3.0 showing financial soundness; less than 1.8 showing a high chance of
bankruptcy.
https://investinganswers.com/financial-dictionary/financial-statement-analysis/altman-z-score-5188
2.5 Weighted average cost of capital WACC and Economic value added EVA
2.5.1 WACC
WACC technique starts a long with perception that task of levered company is financed
by debt and equity at the same time. The weighted average of the cost of debt and cost of equity
is the cost of capital.
E is assigned for equity portion of company’s total assets
D is assigned for debt portion of company’s total assets
Re is assigned for the cost of equity and
Rd is assigned for the cost of debt.
When a company pays corporate tax rate, the correct cost of debt is Rd(1-tax rate), known as
after tax cost of debt. The formula Rwacc to identify the weighted average cost of capital is:
Rwacc= E/(E+D) x Re + D/(E+D) x Rd (1-tax rate)
E/(E+D) is the weighted average target ratio of equity and D/(E+D) is weighted average ratio
of debt. Target ratios are usually shown based on market value but not accounting value (book
value)
(Ross, et al., 2005, p. 481)
Cost of equity Re:
The cost of equity is the rate of return a shareholder require to invest in the equity of a
company. Using capital asset pricing model (CAPM), Re = Rf – β(E(Rm)-Rf)
Rf: A security will contain risk and return as risk is defined as risk free and expected
return of asset as the risk free rate. The risk free rate is used to measure the expected return on
risky investment, with risk creating an expected risk premium that is included to risk free rate.
The risk-free rate shall conform to a country that the security is being traded, and maturity of
security shall agree with the time horizon of the security.

41
Beta β measures the risk of investment by evaluate sensitivity of an investment to the
price changes in market portfolio (risk determination estimates security level of risk to total
market portfolio). The higher sensitivity of a company to market condition, the bigger the beta.
A company’s beta is 1.5 meaning that the security possesses 150% of the return volatility of
market average. The beta is 1 meaning that the expected return of a security is same as the
average market return. The beta is -1 meaning that security possesses an ideal adverse
correlation to the market.
Beta β is determined by the following factors:
- Type of business: Other things staying the same, cyclical industry might possess higher
beta than non-cyclical industry does. Company having business of housing and
automobile possesses higher beta than company having business of food processing and
tobacco that are not so sensitive to economic cycle.
- Operating leverage: Degree of operating leverage shows the link of fixed cost and total
cost of the cost structure of a company. Higher operating leverage meaning high fixed
cost compared to total cost leads to higher operating income and also lead to bigger beta
for the high operating leverage company.
Degree of operating leverage = % change in operating profit
% change in sale
- Financial leverage: When financial leverage rises, beta of company will also rise. It is
foreseen fixed interest charged on liability raising earnings per share at right period and
lowering it at terrible period. The rise of financial leverage raises the variance in earning
per share and forces security of the company more risky. In case a company is operated by
equity portion without debt portion so zero beta debt, and interest expense is a tax
deductible to a company.
Unlevered beta is the comparison of the risk of an unlevered company (company with no
debt) to the risk of the market. Beta is unlevered to eliminate the financial effect of debt.
Making comparison to a company’s unlevered betas provide an investor a greater concept
of evaluating the level of risk taken when he or she acquires the stock.
βL = βU (1+(1-tax rate)(D/E))
βL: levered beta for equity company βU: unlevered beta (beta of asset) of the company
Tax rate: marginal tax rate D/E: Debt to equity ratio (in market value term)
(Damodaran, 2011, p. 101-105)

42
The marginal tax rate is the tax rate on the last dollar of income earned by the firm and
generally will not be equal to the effective or average rate. It is used because interest expense
save tax on the marginal income. We expect that as leverage increase (measured by debt to
equity ratio) equity investors bear increase amount of market risk of company leading to high
beta. The tax factor in the equation capture the benefit created by tax deductible interest
payment.
The unlevered beta of a firm is determined by the type of business company operates
and its operating leverage. This unlevered beta is often referred to as asset beta because its value
is determined by assets owned by company. Thus the equity (levered) beta is determined by
riskiness of business and amount of financial leverage risk it has taken on. Because financial
leverage multiplies the underlying business risk, it stand the reason that firm have high business
risk should be reluctant to take on financial leverage. It also stand to reason that firm operating
in stable business should be much more willing to take on financial leverage. Utilities for
example, have high debt ratios but not high beta.
E((Rm)-Rf): risk premium is equals to expected return of the market minus the risk-
free rate. It is a compensation required by investor for investing security in the market portfolio
containing all risky assets without any riskless asset in the market. This premium does not
associate with each separate risky asset but to the class of those risky assets. It shows the extra
return in addition to the risk free rate. It is also said that when market or an asset class is so
volatile, investor will require higher risk premium.
(Damodaran, 2011, p. 135)
Cost of debt: It is a measurement of the current cost of borrowing that a company obtains
to finance its operation. It is identified by two factors. The first factor is the current level of
interest rate. When market rate rises, the cost of debt will rises. The other factor is default risk
of company. Higher default risk, higher interest rate (default spread) charged by lender to offset
for the extra risk.
Tax provides advantage to cost of debt. Interest expense is allowed for tax deduction.
Tax rate is used to calculate the after tax cost of debt. Tax benefit cumulating from interest
expense produces the after-tax cost of debt smaller than pre-tax cost of debt. High tax rate
makes high tax benefit.
After tax cost of debt Rd = (risk free rate+default spread) x (1-tax rate) (Damodaran, 2011, p. 155)

43
2.5.2 EVA
One technique to calculate the return of a net dollar to investors. What will earnings be?
after expense of the cost of capital is subtracted from earnings.
To calculate net income, a company begins with revenues and then subtract other cost and
expense such as wages, cost of goods sold, administration expense, interest expense and taxes.
However a company never subtract the cost of capital. After subtracting the dollar return
required by investors from net income is known as economic value added (EVA). It is the
additional return to shareholders’ wealth:
Economic value added = Residual income = Income earned – Income required
= Income earned–Cost of capital x investment
The economic value added will be zero if the rate of return on investment is equals to
the cost of capital. Economic value added measure is more superior to earnings or earnings
growth, the way of measuring performance. A company making more EVA will make award
to its executives and value to its shareholders. Moreover EVA might stress on the section of the
business that is not operating well.
(Brealy, et al., 2011, p. 299)
2.6 Revenue forecast
Holt-Winters method takes into account the seasonality. The Holt-Winters seasonal
method consists of the forecast equation and three smoothing equations: one for the level Lt,
one for the trend Tt , and one for the seasonal component St, with corresponding smoothing
parameters α, β and γ. n is used for the frequency of the seasonality for example, for quarterly
data n=4 or monthly data n=12. Number of periods in a season is p.
There are two variations, depending on the nature of seasonal item.
. Additive method
. Multiplicative method
Additive method
The additive method is employed when the seasonal variations are nearly steady through
the series. Using the additive method, the seasonal component is appeared in absolute terms
within the scale of the observed series, and within the level equation the series is seasonally
modified by deducting the seasonal component. Within each year, the seasonal component will
add together to nearly zero.

44
The equation for the additive method: Ft+n = Lt + nTt +St-p+n
Lt = α (Yt –St-p) + (1−α) (Lt-1+Tt-1)
Tt = β (Lt−Lt-1) + (1−β) Tt-1
St = γ (Yt−Tt) + (1−γ) St-p
Multiplicative method
The multiplicative method is favored when the seasonal variations fluctuates in
proportion to the level of the series. Using the multiplicative method, the seasonal component
is appeared within relative terms (percentages), and the series is seasonally modified by
splitting through the use of seasonal component. Within a specific period, the seasonal
component will make up to n.
The equation of the multiplicative method: Ft+n = (Lt + nTt) St-p+n
Lt = α (𝑌𝑡
𝑆𝑡−𝑝)+ (1−α) (Lt-1+Tt-1)
Tt = β (Lt – Lt-1) + (1−β) Tt-1
St = γ (𝑌𝑡
𝐿𝑡) + (1−γ) St-p
(https://otexts.com/fpp2/holt-winters.html)
2.7 Financial statements forecast
Forecasting financial statements is an important task of the company’s predictive
accounting system concerning the forecast of the future financial performance using statistical
understanding processes. The pro-forma financial statements are future financial performance
showing predictive revenue and expense hence the overall operating results. One of the basic
method used is related to the percent of sales method with the assumption that specific assets,
liabilities and expense are continuously proportional to sale volume.
Some fixed asset accounts that usually do not change proportionately to sales and stay at
specific amount however it will increase unrelated to sale volume sometimes during the year.
(https://bizfluent.com/how-7791703-forecast-financial-statements.html)

45
3 FINANCIAL ANALYSIS OF ADIDAS GROUP
4.1 Characteristics of Adidas group
4.1.1 Introduction
Adidas group refers to Adidas group AG, a world’s number two footwear and apparel
Germany-based public company which is going for the gold (pursue to achieve best possible
outcome). In 2005, Adidas group concluded a merging agreement with Reebok International
Inc. which is the world's number three sports footwear and apparel brand. The company resulted
revenues of lager than around $9.5 billion, making a real competitor to the world's dominant
brand in the industry, Nike’s revenues of $12.5 billion in 2005. Moreover the merger shown
Adidas's decision to put more focus directly over its main footwear and apparel operations.
Apart of that endeavor, the company finished proceeds of its Salomon winter sports division,
acquired in 1997, to Finland's Amer Sports Corporation in October 2005. The proceeds were
the company's Mavic bicycle division, and other brands, containing Arc'Teryx, Bonfire and
Cliché. However Adidas has maintained its golf equipment, footwear and apparel division,
TaylorMade-Adidas, as well as its Maxfli line of golf balls, golf clubs, and accessories. In 2018,
a worldwide operating company, with some 94 subsidiaries around the world, Adidas has
marked China to be a vital growth market and the company has struggled to be an official
supporter and provider to that country's Olympic Games event in 2008. Doing so, the company
expect to stand itself as the brand of preference when the Chinese market changes from merely
manufacturing the world's sports shoes to the world's largest consumer sports footwear market.
Adidas stays listed on the Frankfurt Stock Exchange and now is managed by CEO Kasper
Rorsted in 2018.
Chronological Key Dates:
1926: Dassler family builds a factory to make athletic shoes.
1936: American runner Jesse Owens, wearing Dassler shoes, wins a gold medal in the
1936 Olympic Games.
1948: The Dassler brothers part ways, and Adi Dassler starts his own shoe company.
1949: Adidas is registered as a company.
1957: Adidas introduces a pioneering soccer shoe.
1978: Adi Dassler dies, and control of his company is handed to his family.
1990: French entrepreneur Bernard Tapie buys Adidas.

46
1993: Adidas acquires Sports Inc., a U.S. company; Tapie sells Adidas to a group of
European investors, and Robert Louis-Dreyfus joins Adidas as CEO.
1995: Adidas goes public.
1997: Adidas acquires Salomon Worldwide and is renamed Adidas- Salomon AG.
2000: The company restructures in an effort to boost its image as a "lifestyle" brand.
2001: First Adidas Originals retail stores open in Berlin and Tokyo.
2002: The company acquires Arc'Teryx, a high-end equipment and apparel group
based in Vancouver; opens first Adidas Originals store in United States.
2003: Cycling division Mavic-Adidas Cycling is formed; company fails in attempt to
acquire golf ball manufacturer Top Flite.
2005: The company agrees to sell Salomon to Amer Sports in Finland; announces
acquisition of Reebok International, to be completed in 2006.
Company Perspectives:
The Adidas group endeavors to be the worldwide pioneer within sporting products
industry with sports brands built on an enthusiasm for sports and a sporting lifestyle. They are
buyer centered as they persistently make better the quality, appearance, feel and picture of their
products and their organizational structures to coordinate and surpass customer expectation and
to supply them with the most noteworthy esteem. They are advancement and plan pioneers who
look for to assist athletes of all expertise levels achieve high performance with all goods brought
to the market. They are a worldwide social and environmentally responsible organization,
inventive and monetarily remunerating for their staff and shareholders. They are committed to
persistently fortifying their brands and products to enhance their competitive position and
financial performance.
(https://www.referenceforbusiness.com/history2/99/Adidas-Group-AG.html)
3.1.2 Corporate Bodies of Adidas
Being a worldwide operating public listed company headquartered in Herzogenaurach,
Germany, Adidas AG is subject to the provisions of the German stock corporation law. The
Executive Board, the Supervisory Board and the Annual General Meeting makes up the central
corporate bodies of adidas AG. Every corporate body has its own responsibilities which are
rigidly isolated in compliance with German stock corporation law.

47
Below Picture exhibits the important connections among the Executive Board, the Supervisory
Board and the Annual General Meeting of adidas AG.
Picture 1: Corporate bodies of Adidas
Source: www.adidas-group.com/en/investors/corporate-governance/bodies/
Executive board
The Executive Board is accountable for managing the company, especially for its
strategic orientation, for the internal control and risk management system further as for
compliance. It demonstrates the company judicially and extra-judicially. Moreover it identifies
business targets, company policy and the organization of the company. The executive Board
reports to the supervisory Board frequently, comprehensively and on a timely manner on all
issues related to the company's strategy, planning, business development, financial position and
operation results furthermore as on specific issues of company risk and opportunity. The
Supervisory board approves all important decisions.
The rights and responsibilities of supervisory Board are locked in German stock law, within the
Articles of Association of adidas AG and within the service contracts of the members of the
executive Board. More details of the cooperation of the executive Board are controlled by the
Rules of Procedure of the executive Board and the Business Allocation plan. The documents

48
particularly specify necessities for meetings and resolutions furthermore for the cooperation
with the supervisory Board.
Supervisory board
The Supervisory Board is responsible for the appointment and dismissal of members of
the executive board furthermore for supervising and guiding the executive Board for running
business. The executive Board reports to the Supervisory Board frequently and
comprehensively on business development and planning furthermore on the risk management
comprising of compliance, and facilitates the company’s strategy and its execution along with
the Supervisory Board. Furthermore, the Official Board supplies and get the approval by the
Supervisory Board the annual financial statements of Adidas AG and the annual consolidated
financial statements of the adidas group in the view of the auditor’s reports. Supervisory Board
approves certain business transactions and measures of the Executive Board with particular
significance.
The rights and duties of the Supervisory Board are tied down in German stock enterprise
law, within the Co-Determination Act and within the Articles of Affiliation of adidas AG.
Besides directing tasks and duties, the Rules of Strategy of the Supervisory Board and of the
audit Committee further set out the individual requirements for being selected as member, the
meeting procedures, and approving resolutions.
The Supervisory Board of adidas AG comprises of sixteen individuals, and as per
German Co-Determination Act (Mitbestimmungsgesetz - MitBestG), it comprises of an
equivalent number of shareholder representatives and of employee representatives. According
to the rule, Supervisory Board member’s seat is for a-five-year term. The future election of
Supervisory Board is planned for the year 2019.
Annual general meeting
The corporate body is the Annual General Meeting where our shareholders use their
membership rights and exercise their voting rights. In term of guideline, every share entitles to
the equal voting rights ("One share - one vote").
Adidas AG has its Annual General Meeting in the first six months of each financial year. The
Annual General Meeting specifically decides upon the apportionment of retained earnings,
approval of the activities of the executive Board and of the Supervisory Board, amendment of
the Articles of Association, and on measures to extend or decrease capital furthermore on the

49
appointment of auditor. More than that, the Annual General Meeting chooses the shareholder
representatives to the Supervisory Board.
The invitation letter along with agenda of Annual General Meeting is delivered by
executive board to all shareholders who are recorded within the share register of adidas AG.
Reports and reports that are lawfully required for the Annual General Meeting, along with the
agenda, are produced and are accessible at the Company's website as of the day the meeting is
gathered.
Shareholder recorded within the share registered of adidas group AG at the day of the
Annual General Meeting and who lists for the Annual General Meeting in a timely manner is
called to attend the Annual General Meeting. Shareholders who are not able to attend the
Annual General Meeting personally can appoint a bank, a shareholders’ affiliation or any other
individual of their preferences to practice their voting rights on their behalf. Moreover, the
Company supplies its shareholders the opportunity of conceding power of representation and
voting guidance to proxies designated by the Company for the purpose of representation at the
Annual General Meeting. It is conceivable to enroll on the Company's website by making use
of the Company's password-protected shareholder entrance. Shareholders who enlist by means
of the shareholder entrance have the opportunity to straightforwardly print out their entrance
pass themselves also to alter power and guidance online up to the conclusion of the general
debate.
The advantage of mail and Web administrations is reasonably assisted by adidas AG.
The whole Annual General Meeting is air live and in full length online. Resolutions passed by
the Annual General Meeting, along with the discourse and statement of our Chief Executive
Officer Mr. Kasper Rorsted, are made accessible immediately on the Company's website.
(https://www.adidas-group.com/en/investors/corporate-governance/bodies/)
3.1.3 Businesses of Adidas
Brand
There are two main brands of Adidas AG: Adidas brand and Reebok brand.

50
Picture 2: Brand of Adidas
(source: www.adidas-group.com/en/group/profile/)
Adidas brand
The adidas brand incorporates a long history and deep-rooted association with sport.
Everything we do is based in sport.
This is often what ‘The Badge of Sport’ symbolize as a brand mark. Our wide and
different sports portfolio, ranging from major worldwide sports such as soccer and running, to
territorial pulse sports such as American soccer and rugby, has empowered the brand to rise
above the societies and turned to be one of the foremost recognized and famous global brands,
on and off the field of play. The adidas brand’s mission is to be the finest sports brand within
the globe, by planning, building and offering the finest sports items around the world, with the
leading benefit and experience.
(https://www.adidas-group.com/en/brands/adidas/)
Reebok brand
Reebok is an American-motivated worldwide brand with a profound wellness legacy
and a clear mission: To be the finest fitness brand in the world. Not a simple one. However in
the event that there's one brand that could make it occur, Reebok, the brand that was essentially
portion of a wellness development that until the end of time changed the way we see at spandex
and headbands. Beyond any doubt, typically not the 1980s any longer – the world has gone
forward. But so has Reebok and it proceeds to be brave. Brave is knowing enormity doesn’t
come from sameness. The past long time have been marked by a change from conventional
sports to wellness. The three sides of the Reebok Delta, an image of change and transformation,

51
portray the physical, mental and social changes that happen when people grasp the issue of
improving themselves within the gym, within their lives and within the world.
(https://www.adidas-group.com/en/brands/reebok/)
3.1.4 Product of Adidas
Picture 3: Product range of Adidas
(Source:https://images.search.yahoo.com/yhs/search;_ylt=AwrVk9hTh5BcLToASKgPxQt.=click)
The Adidas gather has 4 primary subsidiaries. The primary brand is its possess brand
title – Adidas, which is display in dress and footwear. The secondary brand is Reebok which
has overwhelmed Adidas and is one of the driving subsidiaries within the Adidas group. Rock,
the third brand, specializes in outdoor footwear, apparel’s and extras and 4th is Taylor made
which is centered on playing golf dress, outfit etc. Out of all the over subsidiary’s, Reebok is
the most grounded taken after by Adidas.
Adidas possesses diverse products. The main product of Adidas is, off course, footwear.
Coming in different pattern and fashion, Adidas footwear is powerful and strong. The
subordinate product of Adidas is apparel’s and accessories. Apparel’s like T-Shirts, coats,
sweatshirts, shorts etc are in awesome request. Where Reebok is more grounded in footwear,
Adidas is more grounded in apparel’s.
(https://www.marketing91.com/marketing-mix-adidas/)

52
3.2 Financial analysis of the financial statements of Adidas group
The analysis data are based on the annual reports and the audited consolidated financial
statements of Adidas group, which are prepared in accordance with the International Financial
Reporting Standards (IFRS).
Adidas group prepared and presented annual report at the 31 December of the year, and
the annual report is made available publicly on the company’s website.
Adidas group uses euro currency (€) to prepare and report its consolidated financial statements.
Rounding numbers presented in those financial statements may not add up equally to the total
figures provided.
Consolidated financial statements; consolidated financial position (Balance sheet),
consolidated statements of income (Income statement), and consolidated statements of cash
flow (Cash flow statement) from 2013 to 2018 and other important information will be used for
focusing and performing analysis.
Both theory and practice provided by result of financial methods are entirely compared
to the competitors. Two companies, Nike Inc. and Puma AG are carefully chosen for
comparison based on two main criteria. Firstly, a competitive and comparable company should
have its market capitalization similar to that of Adidas group, making to compare the result to
those of Nike Inc. and Puma AG, similar size and format. Secondly, Nike Inc, and Puma AG
are operating in the same industry of Adidas group.
Rounding differences may arise in percentages and totals.

53
Balance sheet of Adidas
Table 1: Balance sheet of Adidas (€ million)
Year 2013 2014 2015 2016 2017 2018
Assets
Current assets
Non-current assets
6,857
4,742
7,347
5,070
7,497
5,846
8,886
6,290
8,645
5,374
9,813
5,799
Total assets 11,599 12,417 13,343 15,176 14,019 15,612
Liabilities
Current liabilities
Non-current liabilities
Total liabilities
Equity
Attributable to shareholder
Non control interest
Total equity
4,732
1,386
6,117
5,489
(8)
5,481
4,378
2,422
6,799
5,624
(7)
5,618
5,364
2,332
7,696
5,666
(18)
5,648
6,765
1,957
8,721
6,472
(17)
6,455
6,291
1,711
8,002
6,032
(15)
6,017
6,834
2,414
9,248
6,377
(13)
6,364
Total liabilities and equity 11,599 12,417 13,343 15,176 14,019 15,612
Source: Annual report of Adidas from 2013 to 2018
Appendix A: Balance sheet of Adidas from 2013 to 2018

54
Income statement of Adidas
Table 2: Income statement of Adidas (€ million)
Year 2013 2014 2015 2016 2017 2018
Net sales
Cost of sales
Gross profit
Royalty and commission income
Other operating income
Other operating expense
Goodwill impairment losses
Operating profit
Financial income
Finance expense
Income before taxes
Income taxes
Net income from continuing
operation
Income (loss) from discontinued
operation, net of taxes
14,203
(7,202)
7,001
103
142
(6,013)
(52)
1,181
26
(94)
1,113
(340)
773
17
14,534
(7,610)
6,924
102
138
(6,203)
(78)
883
19
(67)
835
(271)
564
(68)
16,915
(8,748)
8,168
119
96
(7,2890
(34)
1,059
46
(67)
1,039
(353)
686
(46)
18,483
(9,383)
9,100
105
262
(7,885)
-
1,582
28
(74)
1,536
(454)
1,082
(62)
21,218
(10,514)
10,704
115
133
(8,882)
-
2,070
46
(93)
2,023
(668)
1,354
(254)
21,915
(10,552)
11,363
129
48
(9,172)
-
2,368
57
(47)
2,378
(669)
1,709
(5)
Net income
Shareholder
Non-controlling interests
790
787
3
496
490
6
640
634
6
1,020
1,017
2
1,100
1,097
3
1,704
1,702
3
Source: Annual report of Adidas from 2013 to 2018
Appendix B: Income statement of Adidas from 2013 to 2018

3.2.1 Horizontal analysis of Balance sheet and Income statement of Adidas
Horizontal analysis of Balance sheet
Table 3: Horizontal analysis of balance sheet (€ million)
Year
2014/2013 2015/2014 2016/2015 2017/2016 2018/2017
Absolute
change
Percentage
change
Absolute
change
Percentage
change
Absolute
change
Percentage
change
Absolute
change
Percentage
change
Absolute
change
Percentage
change
Assets
Current assets
Non-current assets
491
328
7.16%
6.91%
150
777
2.04%
15.32%
1,389
444
18.52%
7.59%
(241)
(916)
-2.71%
-14.56%
1,168
425
13.51%
7.91%
Total assets 818 7.05% 927 7.46% 1,833 13.73% (1,157) -7.62% 1,593 7.51%
Liabilities
Current liabilities
Non-current liabilities
Total liabilities
Equity
Attributable to shareholder
Non control interest
Total equity
(354)
1,036
682
135
1
137
-7.48%
74.72%
11.14%
2.47%
-15.49%
2.49%
987
(90)
897
41
(11)
30
22.45%
-3.71%
13.19%
0.73%
166.21%
0.53%
1,401
(375)
1,026
806
1
807
26.11%
-16.09%
13.33%
14.23%
-4.01%
14.29%
(474)
(246)
(719)
(440)
2
(438)
-7.00%
-12.55%
-8.25%
-6.80%
-13.01%
-6.78%
543
703
1,246
345
2
347
8.63%
41.09%
15.57%
5.72%
-13.33%
5.77%
Total liabilities and equity 818 7.05% 927 7.46% 1,833 13.73% (1,157) -7.62% 1,593 11.36%
Source: own calculation
55

56
The result of horizontal analysis of the main asset items of Adidas from 2013 to 2018
are shown in table 3. According to analysis, current assets increased gradually year to year from
7.16% in 2014 to 18.52% in 2016. This was result of increase the use of natural hedge and
arranges forward exchange contract and currency option to protect against foreign exchange
rate risk in 2014 (annual report of Adidas 2014, p. 232) and decreased slightly by 2.71% in
2017 then increased again 13.51% in 2018 being 0.43 time bigger than that of 2013.
Non-current assets growth fluctuated from 6.91% in 2014, then arrived 15.32% in 2015
and declined to 7.59% in 2016, and continued to decline by 14.56% in 2017 and a small rise
7.91% in 2018. Besides the impairment loss of furniture and fixture, there was significant
investment in PPE during the periods. In 2014, Adidas acquired land, land lease and building
improvements which previously leased (annual report of Adidas 2014, p. 210), and in 2016,
construction progress at the company’s headquarter and expansion of warehouse (annual report
of Adidas 2016, p. 161). Big portion of decline of goodwill and trademark in 2017 was the
result from selling out golf equipment business (annual report of Adidas 2017, p. 172) and CCM
Hockey business (annual report of Adidas 2017, p.173) trademark and the increase in
construction of company’s headquarter in 2018 (annual report of Adidas 2018, p. 174).
Overall, total assets of Adidas grew gradually by 7.05% from 2014 to its peak of 13.73%
in 2016 except decline by 7.62% in 2017 then raised by 7.51% in 2018.
Current liabilities mostly were short-term borrowing, account payable, other current financial
liabilities and current accrued liabilities fluctuated over the periods. It decreased by 7.48% in
2014 even though there was increased in income taxes liabilities, the short term borrowing,
account payable, and other current financial liabilities reduced by 57.70%, 9.50%, and 19.60%
respectively. Then it gradually increased 22.45% in 2015 and 26.11% in 2016 and declined by
7.00% in 2017 after that slightly increased 8.63% in 2018.
Non-current liabilities increased dramatically 74.70% in 2014 due to increase 142.70% of
Eurobond issued to finance company’s operation then slightly decreased from 2015 to 2017
due to redeem of bond and dramatically increased 41.09% in 2018 due to new issued equity
neutral convertible bond.
Equity increased from 2014 to 2018 over the period except small declined in 2017. In
2014, Adidas pay backed treasury share amount 5 million euros leading to small decrease in
share capital. Reserves comprised of capital reserve, hedging reserve, cumulative currency
translation differences, and other reserves. As capital reserve stayed the same from 2013, in
2014, there were rise of cumulative currency translation differences by 29.20% (106 million
euros) arising from translation of financial statements of foreign operations and heading reserve

57
617.65% (210 million euros) due to re-measurement of defined benefit plans. The small decline
of equity in 2017 was result from the decrease of reserve amount of 830 million euros being
110.80% offset the increase of retained earnings by 806 million euros 14.6% making equity
better. In 2018, Adidas reissued of treasury shares of conversion of convertible bond making
increase in capital reserve. This adding up with retained earnings of the year even though there
was decline of other reserve.

58
Table 4: Horizontal analysis of Income statement (€ million)
Year
2014/2013 2015/2014 2016/2015 2017/2016 2018/2017
Absolute
change
Percentage
change
Absolute
change
Percentage
change
Absolute
change
Percentage
change
Absolute
change
Percentage
change
Absolute
change
Percentage
change
Net sales
Cost of sales
Gross profit
Royalty and commission
income
Other operating income
Other operating expense
Goodwill impairment
losses
Operating profit
Financial income
Finance expense
Income before taxes
Income taxes
Net income from
continuing operation
Income (loss) from
discontinued operation,
net of taxes
331
408
(77)
(1)
(4)
190
25
(297)
(7)
(27)
(278)
(69)
(209)
(84)
2.33%
5.67%
-1.10%
-1.09%
-2.62%
3.16%
48.50%
-25.18%
-26.67%
-28.36%
-24.95%
-20.18%
27.04%
-509.36%
2,381
1,137
1,244
16
(42)
1,086
(44)
176
27
(1)
203
82
122
22
16.38%
14.95%
17.96%
16.09%
-30.32%
17.51%
-55.94%
19.90%
140.45%
-1.18%
24.36%
30.11%
21.60%
32.41%
1,568
635
932
(14)
166
596
(34)
523
(18)
7
497
101
396
(16)
9.72%
7.26%
11.41%
-11.47%
171.54%
8.17%
-100.00%
49.34%
-39.09%
11.27%
47.87%
28.6%
57.79%
-35.25%
2,735
1,131
1,604
10
(129)
997
-
488
18
19
487
214
273
(192)
14.80%
12.05%
17.63%
9.52%
-49.24%
12.64%
-
30.85%
64.29%
25.68%
31.71%
47.14%
25.23%
-309.68%
697
38
659
14
(85)
290
-
298
11
(46)
355
1
354
249
3.28%
0.36%
6.16%
12.17%
-63.91%
3.27%
-
14.40%
23.91%
-49.46%
17.55%
0.15%
26.13%
98.03%
Net income
Shareholder
Non-controlling interests
(293)
(297)
2
-37.17%
-37.71%
67.16%
144
144
-
28.98%
29.32%
0.50%
380
383
(4)
59.40%
60.40%
-65.81%
80
80
1
7.84%
7.87%
50.00%
604
605
-
54.91%
55.15%
-
Source: own calculation

59
As result of horizontal analysis of income statement in table 4, the revenue (net sales)
keep on increasing over the periods from 2014 to 2018. The increase was at least 2.33% in 2014
to the highest 16.38% in 2015. Although the sale growth year by year, there was a small decline
of gross profit 1.10% in 2014 because increase of cost of sale 5.67% was faster than increase
of revenue 2.33%. The increase of operating expense and goodwill impairment loss further
deteriorated operating profit by 25.18% in 2014. Even though financial expense was in favor
condition, there was a big loss from discontinued operation, making net income decline by
37.17%.
The gross profit in remaining periods increased at least 6.16% in 2018 and the highest
increase 17.96% in 2015. Finally, net income kept on increasing considerably from 2015 to
2018.
3.2.2 Vertical analysis of Balance sheet and Income statement of Adidas
Table 5: Vertical analysis of balance sheet
Year 2013 2014 2015 2016 2017 2018
Assets
Current assets
Non-current assets
59.12%
40.88%
59.17%
40.83%
56.19%
43.83%
58.55%
41.45%
59.53%
40.47%
62.86%
37.14%
Total assets 100% 100% 100% 100% 100% 100%
Liabilities
Current liabilities
Non-current liabilities
Total liabilities
Equity
Attributable to shareholder
Non control interest
Total equity
40.79%
11.95%
52.74%
47.33%
-0.07%
47.26%
35.25%
19.50%
54.76%
45.30%
-0.05%
45.24%
40.20%
17.47%
57.67%
42.46%
-0.13%
42.33%
44.58%
12.37%
57.47%
42.65%
-0.11%
42.53%
43.32%
12.37%
55.69%
44.42%
-0.10%
44.31%
43.77%
15.46%
59.24%
40.85%
-0.08%
40.76%
Total liabilities and equity 100% 100% 100% 100% 100% 100%
Source: own calculation
The vertical analysis was conducted to Adidas’ balance sheet to identify the composition
of its capital structure and its funding sources. Table 5 demonstrated the assets structure of
Adidas for the period from 2013 to 2018. The portion of current assets made up on average
59.59% while portion of non-current assets was on average around 40.41% of its total assets.
Adidas was a low capital-intensive company as it was allocating its capital more to current
assets as company needed more short-term cash for its liquidity.

60
The total current assets made up considerably of account receivable of between 24.64%
to 27.33% and inventory of from 34.38% to 42.71% over the periods.
The big portion of non-current assets were PPE of average of 31.51%, goodwill of average of
23.14% and trademarks of average of 23.71% over the period from 2013 to 2018. Accounts
payable was the big portion around 31.4% to 38.6% of current liabilities in all years from 2013
to 2018.
Over the period, the portion of total liabilities gradually increased from 52.74% to
59.24% exceeding Adidas’ net assets (equity). Most of company’s assets were financed by
liabilities.
There were rising of long term and short term borrowing to replace equity portion from
2013 to 2018 that’s why equity portion gradually declined annually from 47.26% in 2013 to
40.76% in 2018.
Table 6: Vertical analysis of Income statement
Year 2013 2014 2015 2016 2017 2018
Net sales
Cost of sales
Gross profit
Royalty and commission income
Other operating income
Other operating expense
Goodwill impairment losses
Operating profit
Financial income
Finance expense
Income before taxes
Income taxes
Net income from continuing
operation
Income (loss) from discontinued
operation, net of taxes
100%
50.71%
49.29%
0.73%
1.00%
42.34%
0.37%
8.31%
0.18%
0.66%
7.84%
2.39%
5.44%
0.12%
100%
52.36%
47.64%
0.70%
0.95%
42.68%
0.54%
6.08%
0.13%
0.46%
5.75%
1.87%
3.88%
-0.47%
100%
51.71%
48.29%
0.70%
0.57%
43.09%
0.20%
6.26%
0.27%
0.39%
6.14%
2.09%
4.05%
-0.27%
100%
50.77%
49.23%
0.57%
1.42%
42.66%
-
8.565
0.15%
0.40%
8.31%
2.46%
5.85%
-0.34%
100%
49.55%
50.45%
0.54%
0.63%
41.86%
-
9.76%
0.22%
0.44%
9.53%
3.15%
6.39%
-1.20%
100%
48.15%
51.85%
0.59%
0.22%
41.85%
-
10.81%
0.26%
0.21%
10.85%
3.05%
7.80%
-0.02%
Net income
Shareholder
Non-controlling interests
5.56%
5.54%
0.02%
3.41%
3.37%
0.04%
3.78%
3.75%
0.03%
5.52%
5.50%
0.01%
5.18%
5.17%
0.01%
7.78%
7.77%
0.01%
Source: own calculation

61
According to table 6, on average, gross profit stand around 49.45% of revenue annually.
There were a bit increase in cost of sale in 2014 and 2015 being 52.36% and 51.71%
respectively increasing faster than the increase of revenue deteriorating gross profit of those
years.
Goodwill impairment losses incurred from 2013 to 2015 but not in remaining period.
In 2013, Adidas incurred considerably the financial expense 0.66% even though liabilities was
so low yet comparing to later periods.
Overall, Adidas was performing well over the year 2013 to 2018 as net income
accounted for 5.56% in 2013, a bit lower of 3.41% in 2014 and 3.78% in 2015 then increased
to 5.52% in 2016 and finally reached 7.78% in 2018.
3.2.3 Net working capital of Adidas
Table 7: Net working capital of Adidas (€ million)
Year 2013 2014 2015 2016 2017 2018
Current asset 6,857 7,347 7,497 8,886 8,645 9,813
Current liabilities 4,732 4,378 5,364 6,765 6,291 6,834
NWC 2,125 2,970 2,133 2,121 2,354 2,979
Source: Own calculation
According to table 7, the net working capital of Adidas were improved over the period
from 2013 to 2018. The lowest was in 2016 and the highest was in 2018. It showed good
indicator that the current assets were greater than current liabilities indicating that Adidas had
enough current assets to pay off its current liabilities in case those current liabilities were fall
due immediately.

62
Graph 1: Net working capital of Adidas
Source: own graph
3.2.4 Ratio analysis
Profitability analysis
Profit margin
Table 8: Profit margin (€ million, except profit margin)
Year 2013 2014 2015 2016 2017 2018
Net income 790 496 640 1,020 1,100 1,704
Revenue 14,203 14,534 16,915 18,483 21,218 21,915
Profit margin 5.56% 3.41% 3.78% 5.52% 5.18% 7.78%
Source: own calculation
According to table 8, except the decline in 2014 and 2015, profit margin increased
gradually reaching the highest of 7.78% in 2018. Adidas was performing well.
2,125
2,970
2,133 2,121 2,354
2,979
-
500
1,000
1,500
2,000
2,500
3,000
3,500
-
2,000
4,000
6,000
8,000
10,000
12,000
2013 2014 2015 2016 2017 2018
Net
wo
rkin
g ca
pit
al €
mill
ion
€m
illio
n
Year
Net working captital of Adidas
Current assets Current liabilities NWC
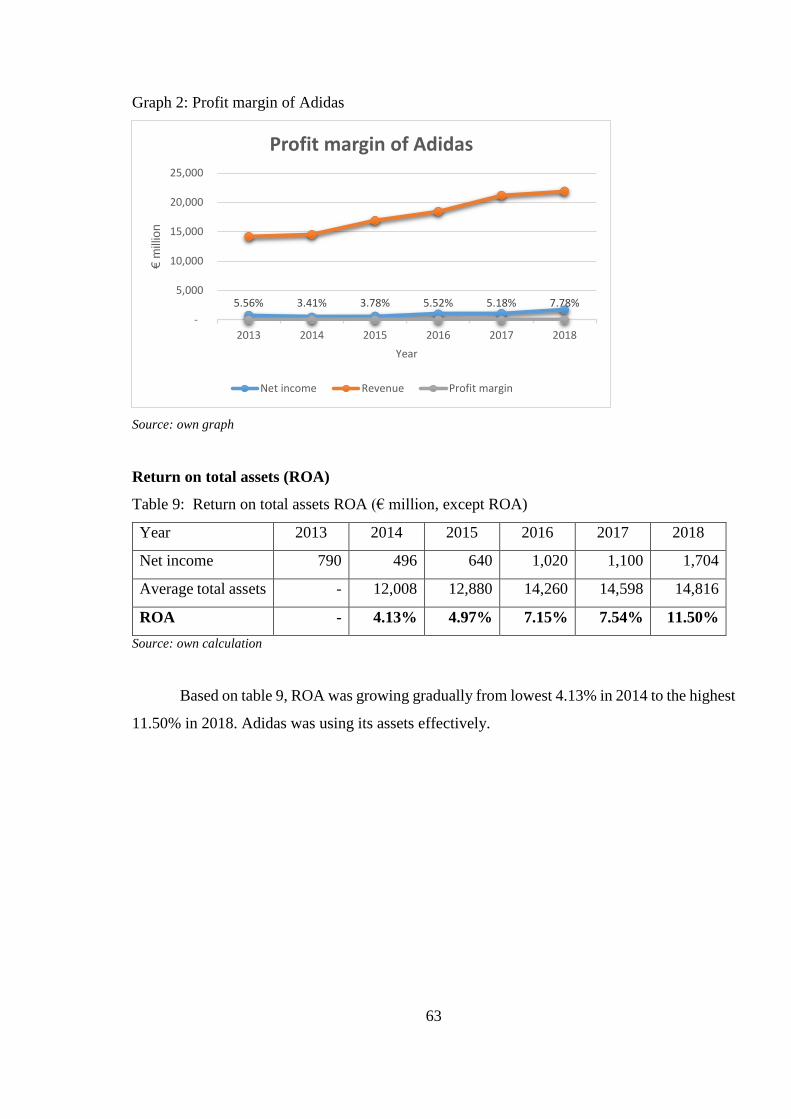
63
Graph 2: Profit margin of Adidas
Source: own graph
Return on total assets (ROA)
Table 9: Return on total assets ROA (€ million, except ROA)
Year 2013 2014 2015 2016 2017 2018
Net income 790 496 640 1,020 1,100 1,704
Average total assets - 12,008 12,880 14,260 14,598 14,816
ROA - 4.13% 4.97% 7.15% 7.54% 11.50%
Source: own calculation
Based on table 9, ROA was growing gradually from lowest 4.13% in 2014 to the highest
11.50% in 2018. Adidas was using its assets effectively.
5.56% 3.41% 3.78% 5.52% 5.18% 7.78%
-
5,000
10,000
15,000
20,000
25,000
2013 2014 2015 2016 2017 2018
€m
illio
n
Year
Profit margin of Adidas
Net income Revenue Profit margin

64
Graph 3: Return on total assets ROA of Adidas (€ million, except ROA)
Source: Own graph
Return on capital employed (ROCE)
Table 10: Return on capital employed ROCE (€ million, except ROCE)
Year 2013 2014 2015 2016 2017 2018
EBIT 1,207 903 1,105 1,610 2,116 2,425
Average capital employed - 7,453 8,009 8,195 8,070 8,253
ROCE - 12.11% 13.80% 19.65% 26.22% 29.38%
Source: own calculation
ROCE was growing gradually every year from 12.11% in 2014 to 29.38% in 2018.
Adidas was employing its capital employed effectively.
-
4.13%4.97%
7.15% 7.54%
11.50%
-
0.02
0.04
0.06
0.08
0.10
0.12
0.14
-
2,000
4,000
6,000
8,000
10,000
12,000
14,000
16,000
2013 2014 2015 2016 2017 2018
RO
A %
€m
illio
n
Year
ROA of Adidas
Net income Average total assets ROA

65
Graph 4: Return on capital employed ROCE of Adidas
Source: own graph
Return on owners’ equity
Table 11: Return on owners’ equity ROE (€ million)
Year 2013 2014 2015 2016 2017 2018
Net income 790 496 640 1,020 1,100 1,704
Shareholders’ equity - 5,549 5,633 6,051 6,236 6,191
ROE - 8.94% 11.36% 16.86% 17.64% 27.53%
Source: own calculation
ROE was growing gradually every year from 8.94% in 2014 to 27.53% in 2018. Adidas
was using its shareholders’ equity fund more effectively.
Summary of profitability ratios
Table 12: Summary of profitability ratios
Year 2013 2014 2015 2016 2017 2018
Profit margin 5.56% 3.41% 3.78% 5.52% 5.18% 7.78%
ROA - 4.13% 4.97% 7.15% 7.54% 11.50%
ROCE - 12.11% 13.80% 19.65% 26.22% 29.38%
ROE - 8.94% 11.36% 16.86% 17.64% 27.53%
Source: own calculation
-
12.11%13.80%
19.65%
26.22%29.38%
-
0.05
0.10
0.15
0.20
0.25
0.30
0.35
-
1,000
2,000
3,000
4,000
5,000
6,000
7,000
8,000
9,000
2013 2014 2015 2016 2017 2018
RO
CE
%
€m
illio
n
Year
ROCE of Adidas
EBIT Average capital employed ROCE

66
Activity ratios
Account receivable turnover
Table 13: Account receivable turnover (€ million, except turnover)
Year 2013 2014 2015 2016 2017 2018
Revenue 14,203 14,534 16,915 18,483 21,218 21,915
Average account receivable - 1,877 1,998 2,125 2,258 2,367
Account receivable turnover - 7.74 8.47 8.7 9.4 9.26
Source: own calculation
Account receivable turnover was growing gradually from 7.74 times in 2014 to 9.26
times in 2018 due to increase in revenue every year as Adidas was performing more
effectively.
Inventory turnover
Table 14: Inventory turnover (€ million, except turnover)
Year 2013 2014 2015 2016 2017 2018
Revenue 14,203 14,534 16,915 18,483 21,218 21,915
Average inventory - 2,580 2,820 3,438 3,728 3,569
Inventory turnover - 5.63 6.00 5.38 5.69 6.14
Source: own calculation
Due to effective performance that increase revenue every year, inventory turnover (revenue
comparing to average inventory) was growing gradually from 5.63 times in 2014 to 6.14 times
in 2018
Day’s sales uncollected
Table 15: Day’s sales uncollected (days)
Year 2013 2014 2015 2016 2017 2018
Account receivable 1,809 1,946 2,049 2,200 2,315 2,418
Revenue 14,203 14,534 16,915 18,483 21,218 21,915
Day’s sales uncollected 46.48 48.87 44.22 43.45 39.82 40.27
Source: own calculation
This ratio indicates how many days company takes to collect its accounts receivable,
the smaller, the better. Day’s sales uncollected was becoming better and better as it decreased

67
year by year from 46.48 days in 2013 to 39.82 days in 2017 and a bit increase to 40.27 days in
2018.
Day’s sales in inventory (days)
Table 16: Day’s sales in inventory (days)
Year 2013 2014 2015 2016 2017 2018
Ending inventory 2,634 2,526 3,113 3,763 3,692 3,445
Cost of goods sold 7,202 7,610 8,748 9,383 10,514 10,552
Day’s sales in inventory 133 121 130 146 128 119
Source: own calculation
The longest inventory day was 146 days in 2015 then declined to 119 days in 2018. The
shorter days, the better.
Total assets turnover
Table 17: Total assets turnover (€ million, except turnover)
Year 2013 2014 2015 2016 2017 2018
Revenue 14,203 14,534 16,915 18,483 21,218 21,915
Average total assets - 12,008 12,880 14,260 14,598 14,816
Total assets turnover - 1.21 1.31 1.30 1.45 1.48
Source: own calculation
Total assets turnover kept on increasing from 1.21 times in 2014 to 1.48 times in 2018.
Summary of activity ratios
Table 18: Summary of activity ratios
Year 2013 2014 2015 2016 2017 2018
Account receivable turnover - 7.74 8.47 8.7 9.4 9.26
Inventory turnover - 5.63 6.00 5.38 5.69 6.14
Day’s sales uncollected 46.48 48.87 44.22 43.45 39.82 40.27
Day’s sales in inventory 133 121 130 146 128 119
Total assets turnover - 1.21 1.31 1.30 1.45 1.48
Source: own calculation

68
Liquidity ratios
Current ratio
Table 19: Current ratio (€ million, except ratio)
Year 2013 2014 2015 2016 2017 2018
Current assets 6,857 7,347 7,497 8,886 8,645 9,813
Current liabilities 4,732 4,378 5,364 6,765 6,291 6,834
Current ratio 1.45 1.68 1.4 1.31 1.37 1.44
Source: own calculation
For good practice, current ratio should be equal to 1 the lowest as this ratio represent
the cover of current asset over current liabilities. Adidas possessed its current assets more than
enough which was bigger than 1 from 1.45 times to 1.68 times each year from 2013 to 2018.
Cash ratio
Table 20: cash ratio (€ million, except ratio)
Year 2013 2014 2015 2016 2017 2018
Cash and cash equivalent 1,587 1,683 1,365 1,510 1,598 2,629
Current liabilities 4,732 4,378 5,364 6,765 6,291 6,834
Cash ratio 0.34 0.38 0.25 0.22 0.25 0.38
Source: own calculation
When using cash and cash equivalent to cover the current liabilities, cash and cash
equivalent was not enough to cover its current liabilities. Cash and cash equivalent of Adidas
accounted for 34% in 2013 and declined to 22% lowest in 2016 and raised to 38% in 2018 of
current liabilities.
Acid-test ratio
Table 21: Acid-test ratio (€ million, except ratio)
Year 2013 2014 2015 2016 2017 2018
Cash and cash equivalent 1,587 1,683 1,365 1,510 1,598 2,629
Account receivable 1,809 1,946 2,049 2,200 2,315 2,418
Current liabilities 4,732 4,378 5,364 6,765 6,291 6,834
Acid-test ratio 0.72 0.83 0.64 0.55 0.62 0.74
Source: own calculation

69
When using cash and cash equivalent and account receivable to cover current liabilities,
Adidas did not have enough (around 55% to 83%) of cash and cash equivalent and account
receivable to cover its current liabilities. The ratios were 0.72 in 2013 and reaching the highest
0.83 in 2014 and declined to 0.55 in 2016 and raised to 0.74 in 2018.
Summary of liquidity ratios
Table 22: summary of liquidity ratios
Year 2013 2014 2015 2016 2017 2018
Current ratio 1.45 1.68 1.4 1.31 1.37 1.44
Cash ratio 0.34 0.38 0.25 0.22 0.25 0.38
Acid-test ratio 0.72 0.83 0.64 0.55 0.62 0.74
Source: own calculation
Graph 5: Liquidity ratios of Adidas
Source: own graph
Debt management ratios
Debt to equity ratio
Table 23: Debt to equity ratio of Adidas (€ million, except ratio)
Year 2013 2014 2015 2016 2017 2018
Total liabilities 6,117 6,799 7,696 8,721 8,002 9,248
Total equity 5,481 5,618 5,648 6,455 6,017 6,364
Debt to equity ratio 1.12 1.21 1.36 1.35 1.33 1.45
Source: own calculation
1.45 1.68
1.40 1.31 1.37 1.44
0.34 0.38 0.25 0.22 0.25 0.38 0.72 0.83
0.64 0.55 0.62 0.74
-
0.50
1.00
1.50
2.00
2013 2014 2015 2016 2017 2018
Liq
uid
ity
rati
os
Year
Liquidity ratios of Adidas
Current ratio Cash ratio Acid-test ratio

70
This ratio indicated how bigger comparing total liabilities to total equity. The total
liabilities of Adidas were bigger than its total equity. Total liabilities of Adidas kept on rising
comparing to its equity. The lowest was 1.12 times in 2013 to the highest 1.45 times in 2018.
Adidas used more liabilities to finance its assets.
Graph 6: Debt to equity ratio of Adidas
Source: Own graph
Debt ratio
Table 24: Debt ratio of Adidas (€ million, except ratio)
Year 2013 2014 2015 2016 2017 2018
Total liabilities 6,117 6,799 7,696 8,721 8,002 9,248
Total assets 11,599 12,417 13,343 15,176 14,019 15,612
Debt ratio 0.53 0.55 0.58 0.57 0.57 0.59
Source: Own calculation
Comparing debt to assets of Adidas, its debt accounted for 53% of total assets in 2013
and it was increasing every year reaching the highest 59% in 2018. Adidas was using more
liabilities to finance its assets.
1.12 1.21
1.36 1.35 1.33 1.45
-
0.20
0.40
0.60
0.80
1.00
1.20
1.40
1.60
-
2,000
4,000
6,000
8,000
10,000
2013 2014 2015 2016 2017 2018
Deb
t to
eq
uit
y ra
tio
€m
illio
n
Year
Debt to equity ratio of Adidas
Total liabilities Total equity Debt to equity ratio

71
Graph 7: Debt ratio of Adidas
Source: Own graph
Financial leverage
Table 25: Financial leverage of Adidas (€ million, except leverage)
Year 2013 2014 2015 2016 2017 2018
Total assets 11,599 12,417 13,343 15,176 14,019 15,612
Shareholders’ equity 5,481 5,618 5,648 6,455 6,017 6,364
Financial leverage 2.12 2.21 2.36 2.35 2.33 2.45
Source: Own calculation
Comparing total assets to shareholders’ equity, the financial leverage of Adidas was
2.12 times in 2013. The total assets of Adidas was from 1.12 times bigger than its shareholders’
equity in 2013 to 1.45 times in 2018. Adidas was using more liabilities to finance its assets.
0.53
0.55
0.58 0.57 0.57
0.59
0.48
0.50
0.52
0.54
0.56
0.58
0.60
-
2,000
4,000
6,000
8,000
10,000
12,000
14,000
16,000
18,000
2013 2014 2015 2016 2017 2018
Deb
t ra
tio
€m
illio
n
Year
Debt ratio of Adidas
Total liabilities Total assets Debt ratio

72
Graph 8: Financial leverage of Adidas
Source: Own graph
Time interest earned ratio
Table 26: Time interest earned ratio of Adidas (€ million, except ratio)
Year 2013 2014 2015 2016 2017 2018
EBIT 1,207 903 1,105 1,610 2,116 2,425
Finance expense 94 67 67 74 93 47
Time interest earned ratio 12.85 13.41 16.62 21.76 22.75 51.60
Source: own calculation
Comparing EBIT to finance expense, Adidas generated its EBIT 11.85 times bigger than
its finance expense in 2013 and the trend was increasing gradually to 50.60 times in 2018.
Adidas had enough EBIT to cover its finance expense every year.
2.12
2.21
2.36 2.35 2.33
2.45
1.90
2.00
2.10
2.20
2.30
2.40
2.50
-
2,000
4,000
6,000
8,000
10,000
12,000
14,000
16,000
18,000
2013 2014 2015 2016 2017 2018
Fin
anci
al le
vera
ge
€m
illio
n
Year
Financial leverage of Adidas
Total assets Shareholders' equity Financial leverage

73
Graph 9: Time interest earned ratio of Adidas
Source: Own graph
Summary of Debt management ratios
Table 27: Summary of debt management ratios
Year 2013 2014 2015 2016 2017 2018
Debt to equity ratio 1.12 1.21 1.36 1.35 1.33 1.45
Debt ratio 0.53 0.55 0.58 0.57 0.57 0.59
Financial leverage 2.12 2.21 2.36 2.35 2.33 2.45
Time interest earned
ratio 12.85 13.41 16.62 21.76 22.75 51.60
Source: own calculation
12.85 13.41 16.62
21.76 22.75
51.60
-
10.00
20.00
30.00
40.00
50.00
60.00
-
500
1,000
1,500
2,000
2,500
3,000
2013 2014 2015 2016 2017 2018
Tim
e in
tere
st e
arn
ed r
atio
€m
illio
n
Year
Time interest earned ratio of Adidas
EBIT Interest expense Time interest earned ratio

74
Graph 10: Debt management ratios of Adidas
Source: Own graph
Financial market ratios
Table 28: Data of share of Adidas
Year 2013 2014 2015 2016 2017 2018
Share price at year end 92.64 € 57.62 € 89.91 € 150.15 € 167.15 € 182.40 €
Dividend per share 1.50 € 1.50 € 1.60 € 2.00 € 2.60 € 3.35 €
Number of share
outstanding at year end
209,216,186 204,327,044 200,197,417 201,489,310 203,861,234 199,171,345
Number of Dilutive share - - - 5,958,632 1,848,957 285,955
Source: Annual report of Adidas from 2013 to 2018
Price earnings ratio
Table 29: Price earnings ratio of Adidas (€, except ratio)
Year 2013 2014 2015 2016 2017 2018
Share price at year end 92.64 € 57.62 € 89.91 € 150.15 € 167.15 € 182.40 €
Earnings per share - 2.37 € 3.13 € 5.06 € 5.41 € 8.45 €
Price earnings ratio - 24.30 28.68 29.65 30.88 21.60
Source: own calculation
0.53 0.55 0.58 0.57 0.57 0.59
2.12 2.21 2.36 2.35 2.33 2.45
12.85 13.4116.62
21.76 22.75
51.60
0.00
10.00
20.00
30.00
40.00
50.00
60.00
0.00
0.20
0.40
0.60
0.80
1.00
1.20
1.40
1.60
2013 2014 2015 2016 2017 2018
Tim
e in
tere
st e
arn
ed r
atio
Deb
t m
anag
emen
t ra
tio
s
Year
Debt management ratios of Adidas
Debt to equity ratio Debt ratio Financial leverage Time interest earned ratio

75
The ratio showed how big the share price was comparing earnings per share. The share
price at year end of Adidas was 23.30 times bigger than its earnings per share and it continue
to rise till 2017 then declined to 20.60 times in 2018.
Book value per share
Table 30: Book value per share of Adidas (€)
Year 2013 2014 2015 2016 2017 2018
Equity for shareholders
5,489,055,767
5,624,428,951
5,665,630,566
6,471,851,762
6,032,000,00
6,377,000,00
# of share outstanding
at year end
209,216,186 204,327,044 200,197,417 201,489,310 203,861,234 199,171,345
Book value per share 26.24 27.53 28.30 32.12 29.59 32.02
Source: own calculation
The book value per share of Adidas was lowest 26.24 € per share in 2013 and it
increasing gradually to highest 32.12 € per share in 2016 and a bit decline to 32.02 € per share
in 2018.
Basic earnings per share EPS
Table 31: Basic earnings per share EPS (€, except weighted average of common share)
Year 2013 2014 2015 2016 2017 2018
Net income attributable
to shareholders
787,096,092
490,308,376
634,050,381
1,017,000,000
1,097,000,000
1,702,000,000
Weighted average
of common share
-
206,771,615
202,262,231
200,843,364
202,675,272
201,516,290
Basic earnings per share - 2.37 3.13 5.06 5.41 8.45
Source: own calculation
Basic earnings per share of Adidas was increasing every year from 2.37 € per share in
2014 to 8.45 € per share in 2018. Adidas was generating more and more net income as it
performed more effectively.

76
Diluted earnings per share
Table 32: Diluted earnings per share of Adidas (€, except weighted average common share
and number of dilutive share)
Year 2013 2014 2015 2016 2017 2018
Net income attributable
to shareholders
787,096,092
490,308,376
634,050,381
1,017,000,000
1,097,000,000
1,702,000,000
Weighted average
of common share
-
206,771,615
202,262,231
200,843,364
202,675,272
201,516,290
Number of Dilutive share - - - 5,958,632 1,848,957 285,955
Diluted earnings per share - 2.37 3.13 4.92 5.36 8.42
Source: own calculation
When taking into account all convertible diluted share, diluted earnings per share and
basic earnings per share of Adidas were the same in 2014 and 2015 as there was no any
convertible share. But they were slightly lower than basic EPS from 2016 to 2018.
Graph 11: Basic earnings per share EPS and Diluted earnings per share of Adidas
Source: own graph
-
1.00
2.00
3.00
4.00
5.00
6.00
7.00
8.00
9.00
2013 2014 2015 2016 2017 2018
€
Year
Basic EPS and Diluted EPS of Adidas
Basic earning per share Diluted earning per share

77
Dividend cover
Table 33: Dividend cover of Adidas (€, except cover)
Year 2013 2014 2015 2016 2017 2018
Net income attributable
to shareholders
787,096,092
490,308,376
634,050,381
1,017,000,000
1,097,000,000
1,702,000,000
Total dividend for
shareholder
282,000,000 314,000,000 303,000,000 320,000,000 405,000,000 528,000,000
Dividend cover 2.79 1.56 2.09 3.18 2.71 3.22
Source: own calculation
The net income attributable to shareholders of Adidas were enough to cover its total
dividend for shareholder. Adidas’ net income attributable to shareholders was 1.79 bigger than
its total dividend for shareholders in 2013 and it declined in 2014 and arriving the highest 3.22
times (2.22 times bigger than total dividend for shareholders).
Dividend yield
Table 34: Dividend yield of Adidas (€, except dividend yield)
Year 2013 2014 2015 2016 2017 2018
Dividend per share 1.50 1.50 1.60 2.00 2.60 3.35
Market price per
share at year end
92.64 57.62 89.91 150.15 167.15 182.40
Dividend yield 1.62% 2.60% 1.78% 1.33% 1.56% 1.84%
Source: own calculation
Dividend per share of Adidas increased every year. But its market price per share
declined in 2014 then increase gradually since then to 182.40 € per share in 2018.
The dividend yield of Adidas rise from 1.62% in 2013 to 2.6% in 2014 then declined to 1.33%
in 2016 and increased to 1.84% in 2018.

78
Graph 12: Dividend yield of Adidas
Source: own graph
Summary of financial market ratios
Table 35: Summary of financial ratios of Adidas (€, except price earnings ratio, dividend
cover, dividend yield)
Year 2013 2014 2015 2016 2017 2018
Price earnings ratio - 24.30 28.68 29.65 30.88 21.60
Book value per share - 24.30 28.68 29.65 30.88 21.60
Basic earnings per
share
- 2.37 3.13 5.06 5.41 8.45
Diluted earnings per
share
- 2.37 3.13 4.92 5.36 8.42
Dividend cover 2.79 1.56 2.09 3.18 2.71 3.22
Dividend yield 0.02 0.03 0.02 0.01 0.02 0.02
Source: own calculation
1.50 1.50 1.60 2.00 2.60 3.35
92.64
57.62
89.91
150.15
167.15
182.40
1.62%
2.60%
1.78%
1.33%
1.56%
1.84%
0.00%
0.50%
1.00%
1.50%
2.00%
2.50%
3.00%
0.00
20.00
40.00
60.00
80.00
100.00
120.00
140.00
160.00
180.00
200.00
2013 2014 2015 2016 2017 2018
Div
iden
d y
ield
(%
i)
€
Year
Dividend yield of Adidas
Dividend per share
Market price per share
Dividend yield

79
3.2.5 Du Pont pyramidal decomposition
Table 36: Du Pont analysis of Adidas
Year 2013 2014 2015 2016 2017 2018
Profit margin 5.56% 3.14% 3.78% 5.52% 5.18% 7.78%
Assets turnover - 1.21 1.31 1.30 1.45 1.48
Financial leverage - 2.16 2.29 2.36 2.34 2.39
ROE - 8.94% 11.36% 16.86% 17.64% 27.53%
Source: own calculation
Note: Assets turnover is calculated by revenue over the average of total assets
Financial leverage is calculated by average total assets over average equity
As Adidas was performing more effectively to generate more net income making profit
margin rise year by year, even though its profit margin declined in 2014, it started to increase
gradually from 2015 to 2018.
The assets turnover of Adidas increased year by year from 1.21 times in 2014 to 1.48 times in
2018.
The financial leverage of Adidas also increased year by year as Adidas used more
liabilities to finance its assets. As Adidas used more liabilities to finance its assets (total
liabilities were bigger than shareholders’ equity) and profit margin increase year by year, its
ROE gradually increased from 8.94% in 2014 to 27.53% in 2018.

80
3.2.6 Altman Z score
Table 37: Altman Z score of Adidas (€ million, except score)
Year 2013 2014 2015 2016 2017 2018
Net working capital
Total assets
2,125
11,599
2,970
12,417
2,133
13,343
2,121
15,176
2,354
14,019
2,979
15,612
X1 0.18 0.24 0.16 0.14 0.17 0.19
Retained earnings
Total assets
4,959
11,599
4,839
12,417
4,874
13,343
5,521
15,176
5,858
14,019
6,054
15,612
X2 0.43 0.39 0.37 0.36 0.42 0.39
Operating profit
Total assets
1,181
11,599
883
12,417
1,059
13,343
1,582
15,176
2,070
14,019
2,368
15,612
X3 0.10 0.10 0.15 0.15
Market value of equity
Book value of total
liabilities
19,382
6,117
11,773
6,799
18,000
7,696
30,254
8,721
34,075
8,002
36,329
9,248
X4 3.17 1.73 2.34 3.47 4.26 3.93
Revenue
Total assets
14,203
11,599
14,534
12,417
16,915
13,343
18,483
15,176
21,218
14,019
21,915
15,612
X5 1.22 1.17 1.27 1.22 1.51 1.40
Z score 4.28 3.28 3.64 4.32 5.34 5.03
Source: own calculation
Note: market value of equity was calculated by multiplying the number of share outstanding
with the share price at year end.
Z score is up to 1.80 showing that the company is in bankruptcy zone, Z score ranges
from 1.80 to 3.00, showing that the company is in grey zone, and Z score is bigger than 3.00,
the company is in the safe zone.
According to table 37 of Adidas’ 6 years performance, its Z score were the lowest of
3.28 in 2014 and the highest of 5.34 in 2017. Adidas possessed no Z score less than 3.00. So
Adidas were all years in safe zone as it performed effectively from 2013 to 2018.

81
Graph 13: Z score of Adidas
Source: own graph
3.2.7 WACC and EVA
Weighted average cost of capital WACC of Adidas in 2018
Cost of debt of Adidas for 2018
Table 38: Gross debt as at December 2018 (€ million)
Period Up to 1 year Between
1 and 3 years
Between
3 to 5 years
More than
5 years
Total
Bank borrowings including
commercial paper
66 38 38 66 207
Eurobond - 597 - 387 984
Equity neutral convertible bond - - 484 - 484
Total 66 635 522 453 1,676
Source: annual report of Adidas 2018, p. 177
In 2018, weighted average interest rate on gross borrowings was 2.1% (annual report of
Adidas 2018, p. 177)
The cost of debt was calculated using financial expense divided by total debt. Since
financial expense was the amount paid out to creditors in that particular year, so cost of debt
was expressed in percentage:
Financial expense in 2018: 47
Total debt in 2018: 1,676
4.28
3.283.64
4.32
5.345.03
0.00
1.80
3.60
5.40
7.20
2013 2014 2015 2016 2017 2018
Z sc
ore
Year
Z score of Adidas

82
Pre-tax cost of debt in 2018: 47
1,676 = 2.80%
Note: Financial expense and total debt were in € million.
Cost of equity of Adidas for 2018
Capital asset pricing model CAPM, most widely used, will be used to calculate the cost
of equity: Re = Rf – β(E(Rm-Rf). We need to find Rf β and E(Rm) in order to apply the above
formula.
Data
To calculate cost of equity of Adidas, each value of component of model has to be found from
the following source:
- Historical share price of Adidas from 01 January 2013 to 31 December 2018 at
https://www.investing.com/equities/adidas-salomon-historical-data
- Historical price of DAX index from 01 January 2013 to 31 December 2018 from
http://en.boerse-frankfurt.de/index/pricehistory/DAX/1.1.2013_30.12.2018#History
- Data of German 10-year government bond yield at https://fred.stlouisfed.org/series/
IRLTLT01DEM156N#0
The value components of CAPM are:
Rf = 𝟎.𝟒𝟕%+𝟎.𝟔𝟔%+𝟎.𝟓𝟑%+𝟎.𝟒𝟖%+𝟎.𝟒𝟓%+𝟎.𝟑𝟑%+𝟎.𝟐𝟖%+𝟎.𝟐𝟗%+𝟎.𝟑𝟕%+𝟎.𝟒𝟎%+𝟎.𝟑𝟏%+𝟎.𝟏𝟗%
𝟏𝟐= 0.40%
β = 0.793
E(Rm) = 5.46%
Then Re = 0.40% + 0.793 (5.46%-0.40%) = 4.41%
Note:
. Rf was calculated by averaging twelve-month yield of the German 10-year government bond
yield from January 2018 to December 2018
. Beta is sensitivity of the expected excess asset returns to the expected excess market returns
how share price of Adidas changed relative to the DAX index.
. E(Rm) was calculated by sum of monthly return from DAX from 01 January 2013 to 31
December 2018 and dividing it by 6 (6 years data). Monthly return of DAX index was calculated
by using closing price minus opening price then dividing the opening price.

83
Weighted average cost of capital WACC of Adidas for 2018
WACC of Adidas is calculated using the following components:
Market value of equity € 36,329 million (182.4 € * 199,171,345 share = € 36,328,853,328 (share
price at year end 31 December 2018)
Book value of Debt = € 1,676 million at 31 December 2018 (Annual report of Adidas 2018,
p.177)
Re = 4.41%
Rd = 2.80%
Corporate tax rate was 28.13% in 2018
WACC = 𝐸
𝐸+𝐷∗ 𝑅𝑒 +
𝐸
𝐸+𝐷∗ 𝑅𝑑(1 − 𝑡𝑎𝑥 𝑟𝑎𝑡𝑒)
= 36,329
36,329+1,676∗ 4.41% +
36,329
36,329+1,676∗ 2.8% (1-28.13%) = 4.30%
Note:
. Book value of debt in 2018 was used instead of market value of debt since the market value
of debt was typically difficult to find.
. Cost of equity in 2018
. Cost of debt in 2018
. Corporate tax rate was calculated by using income tax expense dividing income from
continuing operation before income tax expense in 2018: 669
2,378 = 28.13%
Economic value added EVA of Adidas for 2018
Economic value added = Residual income = Income earned – Income required
= Income earned – (Cost of capital * investment)
= Net income attributable to shareholders – (WACC * capital employed)
= 1,702 – (4.30% * 8,791) = 1,323.99 € million
Note: Investment equals to capital employed made up of Equity and long term liabilities that is
(6,377 + 2,414= 8,791 € million) in 2018.
The result shows that Adidas generated the return of 1,323.99 € million to shareholders.
The economic value added was positive implying that the rate of return on investment of Adidas
was bigger than its cost of capital. Adidas was making more EVA awarding to its executives
and value to its shareholders. But Adidas should be aware to improve some of business
operating which was not processing well.

84
3.3 Comparison with competitor
Certain financial indicators will be compared with those of selected Adidas’ competitors
as it's very important to evaluate the financial performance of Adidas compared to its
competitors. Here is the list of top ten competitors of Adidas:
Table 39: Top ten competitors of Adidas
N Name
1 Nike Inc
2 Callaway Gold company
3 Puma AG
4 Fila Holding S.P.A
5 Converse
6 New Balance corporation
7 K-Swiss
8 Asics
9 Li Ning
10 Air Jordan
Source: https://www.marketing91.com/top-10-adidas-competitors/
3.3.1 Selection of competitors
As far as the market force is concerned in term of market capitalization and industries,
there were two serous competitors, namely Nike Inc., number one competitor, and PUMA AG,
sibling rivalry. Nike Inc. and PUMA AG are all famous companies for sport wears
manufacturers. They all operates in the same industry of that of Adidas.
Here are brief introductions of the two chosen companies:
Nike Inc., incorporated on September 8, 1969, is engaging in the design, development,
marketing and selling of sport wear such as footwear, apparel, equipment, accessories and
services. The segments operation of company consist of North America, Western Europe,
Central & Eastern Europe, Greater China, Japan and Emerging Markets. The portfolio brands
of Nike inc., consists of NIKE Brand, Jordan Brand, Hurley and Converse. Nike supplies its
products to retail accounts through its retail outlet and online web, and through a combined
independent wholesalers and agents across the world. Nike’s products are produced by
independent suppliers.
https://www.reuters.com/finance/stocks/company-profile/NKE.N

85
At 31 May 2018, the closing share price of NIKE was 71.80 USD with share outstanding
of 1,601 million making its market capitalization of 114,983,000,000.00 USD or
98,284,000,000.00 € million (1EUR=1.1699 USD at 31 May 2018) on New York stock
exchange.
Puma AG is a sport wear company that fashions, creates, supplies, and markets
footwear, attire, and embellishments. The Company supplies performance and sport-inspired
lifestyle products in many categories, such as football, running and preparing, golf, and
motorsports. It too authorizes licenses to authorized independent contractors to fashion, create,
produce, and supply fragrances, eyewear, and watches. The Company makes its sales through
Puma retail stores and manufacturing plant outlets, and online. It supplies its products using
brand name of Puma, Cobra Golf, and Dobotex.
https://craft.co/puma
At 31 December 2018, the closing share price of Puma was 427 € with share outstanding
of 14,915,470 making its market capitalization of 6,384,277,690 € on Frankfurt stock exchange.
3.3.2 Scope of comparison and data collection
The comparison of financial indicators will be conducted over previous 6 financial
years: 2013, 2014, 2015, 2016, 2017 and 2018. General information and accounting principle,
total assets, revenue and profitability, liquidity, capital structure and Equity information are to
be compared. The exchange rate at each year end will be used to convert those currency into
EURO currency.
In order to have data available to conduct comparison, annual report of Nike Inc and
that of Puma AG were obtained through their respective websites.
3.3.3 General information and accounting principles
Adidas: The statutory annual financial statements of Adidas AG related to the
distribution of dividend were prepared in accordance with the German Commercial Code
(Handelsgesetzbuch - HGB) and the German Stock Enterprise Act (Aktiengesetz - AktG). The
annual consolidated financial statements and the interim financial report of the Adidas AG were
prepared by the executive Board in agreement with the principles of the international financial
reporting standards (IFRS) as pertinent within the European Union. The supervisory board
examined and approved the annual accounts. The annual financial statements of Adidas AG

86
were prepared in accordance with the German Commercial Code were therewith embraced.
Adidas has its financial year end on 31 December every year.
https://www.adidas-group.com/en/investors/corporate-governance/accounting-and-annual-audit/
Nike Inc,: Management of NIKE, Inc. is dependable for the information and
representations attached in the annual report. The financial statements were prepared in
accordance with accounting principles generally accepted (US GAAP) in the United States of
America and contained specific sums based on best estimates and judgments. Other financial
related information is reliable with these financial statements. Nike has its financial year end
on 31 May every year and its consolidated financial statements were prepared in USD (USD or
$). (Annual report of NIKE 2018, p.91)
Table 40: Financial information of Nike from 2013 to 2018 ($ million)
Year 2013 2014 2015 2016 2017 2018
Total assets 17,584 18,594 21,600 21,396 23,259 22,536
Revenue 25,313 27,799 30,601 32,376 34,350 36,397
Net income 2,485 2,693 3,273 3,760 4,240 1,933
Basic EPS 2.76 3.05 3.80 2.21 2.56 1.19
Total liabilities 6,428 7,770 8,893 9,138 10,852 12,724
Total equity 11,156 10,824 12,707 12,258 12,407 9,812
Source: Annual report of Nike from 2013 to 2018
Table 41: Financial information of Nike from 2013 to 2018 (€ million)
Year 2013 2014 2015 2016 2017 2018
Total assets 13,520 13,665 19,690 19,182 20,728 19,263
Revenue 19,463 20,430 27,895 29,026 30,612 31,111
Net income 1,911 1,979 2,984 3,371 3,779 1,652
Basic EPS 2.12 2.24 3.46 1.98 2.28 1.02
Total liabilities 4,942 5,710 8,107 8,193 9,671 10,876
Total equity 8,578 7,955 11,583 10,990 11,057 8,387
Source: own calculation using exchange rate at 31 May from 2013 to 2018
available at www.ecb.europa.eu/stats/eurofxref/

87
Table 42: Exchange rate at 31 May from 2013 to 2018
Year 2013 2014 2015 2016 2017 2018
Exchange rate EURO to USD 1.3006 1.3607 1.0970 1.1154 1.1221 1.1699
Source: www.ecb.europa.eu/stats/eurofxref/
Puma, with the “PUMA” brand name, PUMA SE and its subsidiaries are engaged in the
development and sale of a broad range of sports and sports lifestyle products, including
footwear, apparel and accessories. The company is a European stock corporation (Societas
Europaea/SE) and parent company of the PUMA Group; its registered office is on PUMA WAY
1, 91074 Herzogenaurach, Germany. The competent registry court is in Fürth (Bavaria), the
register number is HRB 13085. The consolidated financial statements of PUMA SE and its
subsidiaries (hereinafter shortly referred to as the “Group” or “PUMA”) were prepared in
accordance with the “International Financial Reporting Standards (IFRS)” accounting standards
issued by the International Accounting Standards Board (IASB), as they are to be applied in the
EU, and the supplementary accounting principles to be applied in accordance with Section 315e
(1) of the German Commercial Code. The IASB standards and interpretations, as they are to be
applied in the EU, which are mandatory for financial years as of January 1, 2018, have been
applied. The preparation of the consolidated financial statements was based on historical
acquisition and manufacturing costs, with the exception of the profit or loss assessment of
financial assets and liabilities at fair value. The items contained in the financial statements of
the individual Group companies are measured based on the currency that corresponds to the
currency of the primary economic environment in which the company operates. The
consolidated financial statements are prepared in Euros (EUR or €). The presentation of
amounts in millions of Euros with one decimal place may lead to rounding differences since
the calculation of individual items is based on figures presented in thousands.
(Annual report of PUMA 2018, p. 5)
Puma has its year end at 31 December every year.

88
Table 43: Financial information of Puma from 2013 to 2018 (€ million, except Basic EPS)
Year 2013 2014 2015 2016 2017 2018
Total assets 2,309 2,550 2,620 2,765 2,854 3,207
Revenue 2,985 2,972 3,387 3,627 4,136 4,648
Net income 21 85 62 88 168 230
Basic EPS 0.36 4.29 2.48 4.17 9.09 12.54
Total liabilities 811 932 1,001 1,043 1,197 1,485
Total equity 1,497 1,618 1,619 1,722 1,657 1,722
Source: Annual report of Puma from 2013 to 2018
3.3.4 Comparison of capital structure
Table 44: Comparison of capital structure (€ million)
Year 2013 2014 2015 2016 2017 2018
Total assets
Adidas
Nike
Puma
11,599
13,520
2,309
12,417
13,665
2,550
13,343
19,690
2,620
15,176
19,182
2,765
14,019
20,728
2,854
15,612
19,263
3,207
Total liabilities
Adidas
Nike
Puma
6,117
4,942
811
6,799
5,710
932
7,696
8,107
1,001
8,721
8,193
1,043
8,002
9,671
1,197
9,248
10,876
1,485
Total equity
Adidas
Nike
Puma
5,481
8,578
1,497
5,618
7,955
1,618
5,648
11,583
1,619
6,455
10,990
1,722
6,017
11,057
1,657
6,364
8,387
1,722
Source: Own compilation
In term of total assets, Nike is the biggest assets than Adidas and Puma. Adidas was the
second in term of total assets. If combining total assets of Adidas and Nike, it is nearly or equal
to that of Nike. Puma possessed the least total asses among the three companies. All of the three
companies’ total assets were increasing from year to year.
Considering the total liabilities, Adidas had the largest total liabilities than the other two
in 2013 and 2014. Nike’s total liabilities increased gradually year to year. From 2015, its total

89
liabilities was the largest companies in term of total liabilities, which 10 times bigger than Puma
in 2018. The total liabilities of Puma was the smallest among the three. Its total liabilities also
increased gradually over the period from 2013 to 2018.
In terms of total equity, Nike had the highest amount of total equity and Puma had the
lowest amount. Nike had around 5 times of total equity comparing to Puma over the period.
Adidas came the second among the three companies. The total equity of Adidas increased
gradually from 2013 to 2016 then fluctuated by decreasing in 2017 and increasing in 2018. Nike
were around twice of Adidas in 2017. Puma, the smallest company in term of equity, possessed
its total equity at small change over the period since it started to increase its total equity in 2014.
3.3.5 Comparison of Revenue and profitability
Table 45: Comparison of revenue and profitability (€ million, except basic EPS)
Year 2013 2014 2015 2016 2017 2018
Revenue
Adidas
Nike
Puma
14,203
18,355
2,985
14,534
22,897
2,972
16,915
28,108
3,387
18,483
30,714
3,627
21,218
28,642
4,136
21,915
31,788
4,648
Net income
Adidas
Nike
Puma
790
1,802
21
496
2,218
85
640
3,006
62
1,020
3,567
88
1,100
3,535
168
1,704
1,688
230
Basic EPS
Adidas
Nike
Puma
4.01
2.12
0.36
2.37
2.24
4.29
3.13
3.46
2.48
5.06
1.98
4.17
5.41
2.28
9.09
8.45
1.02
12.54
Source: own compilation
Nike generated the largest revenue in the period being compared. Its revenue increased
from 18,355 EUR million in 2013 to 31,788 EUR million in 2018. Nike increased its revenue
faster than Adidas did over the period. Adidas generated the second largest amount of revenue
over the period. Adidas’ revenue increased over the period. It generated 21,915 EUR million in
2018. Adidas came the second for revenue comparison. Its revenue increased year by year over
the period. In 2018, Adidas generated revenue of 21,915 EUR million. Puma came the smallest

90
in terms of revenue. Its revenue increased gradually over the period being compared. In 2018,
Puma generated a revenue of 4,648 EUR million.
Comparing net income, Nike, the first company in term of net income, had its
performance from 1,802 EUR million in 2013 to 3,567 EUR million in 2016, then its net income
dropped sharply to 3,535 EUR million in 2017 to 1,688 EUR million EUR in 2018. Although
its net income declined to 496 EUR million in 2014, Adidas had its best performance as its net
income increased year by year from 640 EUR million in 2015 to 1,704 EUR million in 2018.
Puma generated the third in term of net income during the period. Its net income raised
gradually from 21 EUR million in 2013 to 230 EUR million in 2018.
Comparing basic EPS, Puma generated the highest EPS of 9.09 EUR in 2017 and 12.54
EUR in 2018 than Adidas and Nike even though its EPS were used to be lowest among the
three company from 0.36 EUR in 2013 to 4.17 EUR in 2016. EPS of Adidas used to be the
highest ranging from 4.01 EUR in 2013 to 5.06 EUR in 2016, then it came the second in term
of EPS in 2017 and 2018 after Puma. Nike was the second in term of EPS from 2.12 EUR in
2013 but EPS increased slowly to 3.46 EUR in 2015 then fluctuated to 1.98 EUR, 2.28 EUR
and 1.02 in 2016, 2017 and 2018 respectively.
Graph 14: Revenue comparison among Adidas, Nike, and Puma
Source: own graph
0
5,000
10,000
15,000
20,000
25,000
30,000
35,000
2013 2014 2015 2016 2017 2018
Rev
enu
e (€
mill
ion
)
Year
Revenue comparison
Adidas Nike Puma

91
Graph 15: Net income comparison among Adidas, Nike and Puma
Source: own graph
Graph 16: Basic earnings per share EPS comparison among Adidas, Nike, and Puma
Source: own graph
0
500
1000
1500
2000
2500
3000
3500
4000
2013 2014 2015 2016 2017 2018
Net
inco
me
(€m
illio
n)
Year
Net income comparison
Adidas Nike Puma
4.01
2.373.13
5.06 5.41
8.45
2.12 2.243.46
1.98 2.281.02
0.36
4.29
2.48
4.17
9.09
12.54
0
2
4
6
8
10
12
14
2013 2014 2015 2016 2017 2018
Bas
ic E
PS
(€)
Year
Basic EPS comparison
Adidas Nike Puma

92
3.3.6 Comparison of net profit margin and Return on equity ROE
Table 46: Comparison of net profit margin and Return on equity ROE among Adidas, Nike,
and Puma
Year 2013 2014 2015 2016 2017 2018
Net profit margin
Adidas
Nike
Puma
Average
5.56%
9.82%
0.71%
5.36%
3.41%
9.69%
2.85%
5.32%
3.78%
10.70%
1.82%
5.43%
5.52%
11.61%
2.44%
6.52%
5.18%
12.34%
4.06%
7.19%
7.78%
5.31%
4.94%
6.01%
ROE
Adidas
Nike
Puma
Average
-
-
-
-
8.94%
24.5%
5.44%
12.96%
11.36%
27.82%
3.81%
14.33%
16.86%
30.12%
5.29%
17.42%
17.64%
34.38%
9.94%
20.65%
27.53%
17.40%
13.60%
19.51%
Source: own calculation
Nike had the highest net profit margin from 2013 to 2017 then it declined in 2018 as it
came the second with 5.31% being lower than average after Adidas whose net profit margin of
7.78% being higher than average. Puma came the third in term of net profit margin over the
period. Beside the decline in 2015, net profit margin of Puma increased year to year. In 2018
Puma generated net profit margin of 4.94% which was below average.
Considering ROE, ROE of Adidas increased year to year over the period while ROE of
Nike decreased sharply in 2018, and also ROE increased over the time from 2016 to 2018 even
though it decline in 2015. Nike had the highest ROE from 2014 to 2017 compared with its
competitors. Its ROE were 24.5%, 27.82%, 30.12%, and 34.38% in 2014, 2015, 2016 and 2017
respectively. But Adidas came first in term of ROE of 27.53% comparing Nike’s ROE of
17.40% and that of 13.60% of Puma in 2018.

93
3.3.7 Comparison of Liquidity
Table 47: Comparison of liquidity among Adidas, Nike, and Puma
Year 2013 2014 2015 2016 2017 2018
Current ratio
Adidas
Nike
Puma
Average
1.45
3.47
2.19
2.37
1.68
2.72
2.05
2.15
1.40
2.52
1.91
1.94
1.31
2.80
1.97
2.03
1.37
2.93
1.78
2.03
1.44
2.51
1.83
1.93
Quick ratio
Adidas
Nike
Puma
Average
0.72
1.64
1.18
1.18
0.83
1.12
1.03
0.99
0.64
1.14
0.93
0.90
0.55
1.19
0.92
0.89
0.62
1.37
0.87
0.95
0.74
1.28
0.85
0.96
Cash ratio
Adidas
Nike
Puma
Average
0.34
0.85
0.56
0.58
0.38
0.44
0.49
0.44
0.25
0.61
0.39
0.42
0.22
0.59
0.37
0.39
0.25
0.70
0.39
0.45
0.38
0.70
0.39
0.49
Source: own calculation
From table 47, even though its current ratio fluctuated over the period, Nike has the
highest current ratio among the companies being compared. Its current ratio were 3.47, 2.72,
2.52, 2.80, 2.93 and 2.51 in the year 2013, 2014, 2015, 2016, 2017 and 2018 respectively higher
than average value of all years compared. This indicated that Nike had the highest ability to pay
off its short-term obligations when it came due.
Puma was the second company for current ratios. Its current ratio were 2.19, 2.05, 1.91,
1.97, 1.78 and 1.83 in 2013, 2014, 2015, 2016, 2017 and 2018 respectively. Its current ratio
dropped gradually since 2013 till 2018. Puma’s current ratios were lower than the average value
over the period being compared. However Puma had enough current assets to cover its current
liabilities once it felt due immediately.
Adidas’ current ratio, the third, were 1.45, 1.68, 1.40, 1.31, 1.37, and 1.44 in 2013, 2014,
2015, 2016, 2017, and 2018 respectively. Its current ratio was below the average value of the
ratio. The result indicated that current assets of Adidas were higher than its current liabilities.

94
So, Adidas had enough ability pay off its current liabilities using its current assets. The current
ratio of Adidas decreased in 2015, and increased in 2018.
Comparing quick ratio, Nike’s quick ratios were the highest among all companies.
These ratios were 1.64, 1.12, 1.14, 1.19, 1.37, and 1.28 in 2013, 2014 2015, 2016, 2017 and
2018, respectively. Its quick ratios fluctuated over the period. Nike had more than enough cash
and cash equivalent and account receivable to cover its current liabilities
Puma came the second in term of quick ratio. Puma’s quick ratio, similar level to average, were
1.18, 1.03, 0.93, 0.92, 0.87 and 0.85 in 2013, 2014, 2015, 2016, 2017, and 2018 respectively.
Its quick ratios were higher than those of Adidas over the period as immediate rise of its cash
and cash equivalents.
Adidas’ quick ratio was the lowest among all companies. Its quick ratios were ranging
0.55 to 0.83 over the period. These figures were lower than the average value of all years. The
result of those ratios indicated that Adidas had around 55% to 83% to meet its current
obligations using its most liquid assets.
Comparing cash ratio, Nike’s cash ratio were higher than the average value of the ratio.
These ratio showed the ability of Nike to meet its short-term obligations using only its cash and
cash equivalents. The ratios decreased in 2014 and in 2016. Nike could cover 44% to 85% of
its current liabilities using cash and cash equivalents over the period. Its ratio was lower than
that of Puma in 2014.
Puma’s cash ratio were 0.56, 0.49, 0.39, 0.37, 0.39, and 0.39 in 2013, 2014, 2015, 2016,
2017 and 2018, respectively. Its cash ratios were, the second after Nike, a bit below the average
over the period except in 2014. These ratio indicates that Puma could cover around 37% to 56%
of its current liabilities using only cash and cash equivalents over the period compared.
Adidas’ cash ratio were 0.34, 0.38, 0.25, 0.22, 0.25, and 0.38 in 2013, 2014, 2015, 2016,
2017 and 2018 respectively. Adidas could cover around 0.22%% to 38% of its current liabilities
with cash and cash equivalents only. This mean that Adidas had the lowest cash and cash
equivalents available among the companies. In fact, Nike had more cash and cash equivalents
equaling to the total cash and cash equivalent of Adidas and of Puma each year except in 2014.

95
3.3.8 Comparison of debt management ratios
Table 48: Comparison of debt management ratios among Adidas, Nike, and Puma
Year 2013 2014 2015 2016 2017 2018
Financial leverage
Adidas
Nike
Puma
Average
2.12
1.58
1.54
1.75
2.21
1.72
1.58
1.84
2.36
1.70
1.62
1.89
2.35
1.75
1.61
1.90
2.33
1.87
1.72
1.97
2.45
2.30
1.86
2.20
Debt ratio
Adidas
Nike
Puma
Average
0.53
0.37
0.37
0.42
0.55
0.42
0.38
0.45
0.58
0.41
0.38
0.46
0.57
0.43
0.38
0.46
0.57
0.47
0.42
0.49
0.59
0.56
0.46
0.54
Debt to equity ratio
Adidas
Nike
Puma
Average
1.12
0.58
0.54
0.75
1.21
0.72
0.58
0.84
1.36
0.70
0.62
0.89
1.35
0.75
0.61
0.90
1.33
0.87
0.72
0.97
1.45
1.30
0.86
1.20
Source: own calculation
Adidas possessed the highest financial leverage, being 2.12, 2.21, 2.36, 2.35, 2.33 and
2.45 in 2013, 2014, 2015, 2016, 2017 and 2018 respectively. It showed how leveraged a
company was, the lower the ratio, the better. Adidas had financial leverage higher than the
average level. Debt ratio of Adidas were 53%, 55%, 58%, 57%, 57%, and 59% in 2013, 2014,
2015, 2016, 2017 and 2018 respectively. Debt to equity ratio of Adidas were 1.12, 1.21, 1.36,
1.35, 1.33, and 1.45 in 2013, 2014, 2015, 2016, 2017, and 2018 respectively. Also, these ratios
were higher than average. High financial leverage, high debt ratio and debt to equity ratio mean
that Adidas used more debt than the other to finance its total assets.
Nike came the second in terms of financial leverage ranging from 1.58 to 2.30 from
2013 to 2018, debt ratio ranging from 0.37 to 0.56 and debt to equity ratio ranging from 0.58 to
1.30 over the period. Its financial leverage, debt ratio, and debt to equity ratio were a bit lower
than the average level except in 2018.

96
Puma had the least financial leverage, debt ratio and debt to equity ratio. All those ratios
were lower than average level. Puma’s financial leverage were 1.54, 1.58, 1.62, 1.61, 1.72, and
1.86 in 2013, 2014, 2015, 2016, 2017, and 2018 respectively. Its financial leverage increased
gradually over the period. This mean that Puma employed less debt than equity to finance its
total assets. Debt ratio of Puma increased from 0.37 in 2013 to 0.46 in 2018. Even though the
ratios increased, Puma’s debt were smaller than its equity portion all years as it mean that less
financial stress toward the company. Debt to equity ratio of Puma were 0.54, 0.58, 0.62, 0.61,
0.72, and 0.86 in 2013, 2014, 2015, 2016, 2017 and 2018 respectively. These ratios were lower
than average level.
In short, Puma had lowest debt than equity comparing to other two companies. It
possessed the least leveraged, with the lowest debt level to its total assets and had the lowest
debt to equity ratio.

97
3.3.9 Comparison of share
Table 49: Comparison of capital structure among Adidas, Nike, and Puma
Year 2013 2014 2015 2016 2017 2018
Adidas
Number of share
outstanding at year end
Weighted average number
of share outstanding
Share price at year end (€)
Dividend per share (€)
Dividend yield
Market capitalization
at year end (€)
209,216,186
-
92.64
1.50
1.62%
19,381,787,471
204,327,044
206,771,615
57.62
1.50
2.60%
11,773,324,275
200,197,417
202,262,231
89.91
1.60
1.78%
17,999,749,762
201,489,310
200,843,364
150.15
2.00
1.33%
30,253,619,897
203,861,234
202,675,272
167.15
2.60
1.56%
34,075,405,263
199,171,345
201,516,290
182.4
3.35
1.84%
36,328,853,328
Nike
Number of share
outstanding at year end
Weighted average number
of share outstanding
Share price at year end (€)
Dividend per share (€)
Dividend yield
Market capitalization
at year end
1,791,000,000
-
23.70
0.62
2.63%
42,384,000,000
1,742,000,000
1,767,000,000
28.26
0.68
2.42%
49,181,000,000
1,712,000,000
1,724,000,000
46.34
0.98
2.12%
79,347,000,000
1,682,000,000
1,698,000,000
49.51
0.56
1.12%
83,259,000,000
1,643,000,000
1,658,000,000
47.22
0.62
1.32%
77,608,000,000
1,601,000,000
1,624,000,000
61.37
0.67
1.09%
98,284,000,000
Puma
Number of share
outstanding at year end
Weighted average number
of share outstanding
Share price at year end (€)
Dividend per share (€)
Dividend yield
Market capitalization
at year end
14,939,913
-
235.00
0.50
0.21%
3,510,879,555
14,939,913
14,939,913
172.55
0.50
0.29%
2,577,881,988
14,939,913
14,939,913
198.65
0.50
0.25%
2,967,813,717
14,939,913
14,939,913
249.65
0.75
0.30%
3,729,749,280
14,946,356
14,943,161
363.00
12.50
3.44%
5,425,527,228
14,951,470
14,947,323
427.00
3.50
0.82%
6,384,277,690
Source: own calculation
Adidas had the second highest number of share outstanding around 200 million of shares
so the weighted average number of share also highest among other companies over the period.
Its market price of share also came the second, which were 92.64 EUR in 2013, dropped in
2014 to 57.62 EUR then increased gradually to 182.4 EUR in 2018 after Puma. Dividend per
share of Adidas were the highest, being 1.5 EUR per share in 2013 and this increased year to
year to 1.6 EUR per share in 2015, 2 EUR, 2.6 EUR and 3.35 EUR per share in 2016, 2017 and

98
2018 respectively. Adidas came the first in term of dividend yield after Nike over the period
except in 2013 that dividend yield of Adidas was lower than that of Nike. Adidas’ dividend
yield were 1.62%, 2.6%, 1.78%, 1.33%, 1.56%, and 1.84% in 2013, 2014, 2015, 2016, 2017,
and 2018. Even though Adidas had the highest number of share outstanding but its market price
of share were lower than those of Puma. This made market capitalization of Adidas being the
second after Nike.
Nike’s DPS comes the second after Adidas. Nike’s DPS stood at 0.62 EUR in 2013 and
it rise to 0.98 EUR per share in 2015 but dropped to 0.56 EUR per share in 2016 then increased
gradually to 0.67 EUR per share in 2018. Nike’s market prices of share were traded at lowest
prices of all companies being 23.70 EUR, 28.60 EUR, 46.34 EUR, 49.51 EUR, 47.22 EUR,
and 61.37 EUR in 2013, 2014, 2015, 2016, 2017, and 2018 respectively. Dividend yield of Nike
was the highest 2.63% only in 2013, then its dividend yield started to drop lower than those of
Adidas. Even though Nike had lowest market price of share but it possessed highest number of
share outstanding so weighted average number of share outstanding, it made Nike to be a
company with the highest market capitalization as its market capitalization were higher than
sum of those of Adidas and of Puma each year over the period.
Puma paid out dividend of 0.5 EUR for 2013, 2014 and 2015 and it increased to
0.75EUR, 12.50 EUR and 3.50 EUR in 2016, 2017, and 2018 respectively making Puma being
the first company with highest dividend per share in 2017 and 2018. Its dividend yield was the
lowest among the companies in three consecutive years (2013, 2014, and 2015) but it become
the highest dividend yield 3.44% in 2017 as that time Puma increased its DPS to 12.50 EUR.
Puma possessed number of share outstanding around 15 million and market price of share,
except decline of its market price of share in 2014, increased gradually from 172.5 EUR in 2014
to 427 EUR in 2018 being the highest market price of share among all three companies. Puma
possessed smallest number of share outstanding but its market price of share increase year to
year; its market capitalization stood the third being 3,510,879,555 EUR, 2,577,881,988 EUR,
2,967,813,717 EUR , 3,729,749,280 EUR, 5,425,527,228 EUR, 6,384,277,690 EUR in 2013,
2014, 2015, 2016, 2017, and 2018 respectively.
3.4 Revenue forecast for 2019
Financial forecasting is a critical part of business planning even though some events
may affect business unpredictably, company still enable to employ the forecasts for guidance
of decision making.

99
3.4.1 Data collection
Totally there were twenty-four (24) quarter data of revenue, quarter 1 to quarter 4 from
2013 to 2018. Those data were accessible and obtained from Adidas’ annual report through the
website of Adidas at https://www.adidas-group.com/media/filer_public
3.4.2 Forecast method selection
There are a lot of methods used to forecast revenue. Since Adidas’ revenue of previous
years contained sequential time series data showing the trend and seasonality, Trend and
seasonality were observed from its quarterly revenue data, multiplicative Holt-Winter method
will be used to forecast the revenue of Adidas for 2019.
3.4.3 Revenue forecast
α = 0.5 β = 0.5 γ = 0.5 p = 4

100
Table 50: Revenue forecast of Adidas for 2019
St Lt Tt
96.4125 3309.719
alpha gamma delta 1.03745895
0.5 0.5 0.5 0.952766206
1.089839637
Year Quarter Yt T 0.919935207
2013 1 3751 1 148.7709 3510.848 1.052930899
2 3383 2 121.5446 3605.166 0.945570894
3 3879 3 79.67667 3642.975 1.077314352
4 3190 4 15.92262 3595.144 0.903621646
2014 1 3533 5 -47.995 3483.231 1.033609526
2 3465 6 9.309233 3549.844 0.960834995
3 4118 7 75.13789 3690.811 1.09652914
4 3419 8 79.56646 3774.806 0.90468177
2015 1 4083 9 103.532 3902.304 1.039957304
2 3907 10 118.6368 4036.045 0.96443091
3 4758 11 164.7528 4246.914 1.108436029
4 4167 12 213.346 4508.853 0.914431781
2016 1 4769 13 179.2375 4653.982 1.032335579
2 4422 14 117.2044 4709.154 0.951726586
3 5413 15 131.4793 4854.908 1.111695151
4 4687 16 166.2794 5055.987 0.920725773
2017 1 5447 17 179.809 5249.326 1.034996324
2 5038 18 145.9096 5361.336 0.945708873
3 5677 19 45.75215 5306.931 1.090714183
4 5056 20 80.41149 5422.001 0.926611375
2018 1 5548 21 44.90962 5431.409 1.028231173
2 5261 22 66.5856 5519.671 0.949422711
3 5873 23 16.15784 5485.401 1.080687154
4 5234 24 52.90277 5575.049 0.932718636
2019 1 5787 25
2 5394 26
3 6196 27
4 5397 28
Ft
Notes:
p-number of periods
T-period
Yt-Actual revenue
Lt-Expected revenue
St-Seasonality
Tt-Trend
Ft-Revenue forecast

101
Let assume that (all fluctuations are on average 0.5 - value ranging from 0.00 to 1.00):
- α the coefficient for the level smoothing = 0.5,
- β the coefficient for the trend smoothing = 0.5 and
- γ the coefficient for the seasonal smoothing = 0.5
The initial St and Lt is to be found for the first season. First, initial St is calculated by
yearly average of first year (year 2013) minus center average of those period T to yearly average
of final year (year 2018) subtracting center of average of that year. Second, specific seasonal
indexes are computed using revenue of each quarter compare to yearly average, initial center
of average and initial slope. Raw seasonal index is the sum of average of specific seasonal
index. Then normalized seasonal index is calculated by comparing each total raw seasonal index
to average of those total raw seasonal.
Initial trend Tt is then calculated by yearly average of 2013 subtracting center of average of
2013 and initial St.
center of avg
Q1 Q2 Q3 Q4 yearly avg t
3751 3383 3879 3190 3550.75 2.5
3533 3465 4118 3419 3633.75 6.5
4083 3907 4758 4167 4228.75 10.5
4769 4422 5413 4687 4822.75 14.5
5447 5038 5677 5056 5304.50 18.5
5548 5261 5873 5234 5479.00 22.5
1.101249 0.965869 1.077812 0.86324267
1.012573 0.966381 1.118427 0.90488786
0.999723 0.934567 1.112473 0.95281241 <--- specific seasonal indexes
1.019424 0.926162 1.111281 0.94355789
1.055644 0.95847 1.060585 0.92785645
1.040046 0.968735 1.062562 0.93071743
1.03811 0.953364 1.090523 0.92051245 <--- raw seasonal
1.037459 0.952766 1.08984 0.91993521 <--- normalized seasonal
96.4125 : slope estimated by average of first difference
of yearly averages
3,309.719 : level estimated by subtracting 2.5*
(slope estimate) from first year's average
Next step is to apply the below equation in order to find Tt of each quarter in 2018.
[1]𝐿𝑡 = 0.5 (𝑌𝑡
𝑆𝑡−𝑝) + (1 − 0.5)(𝐿𝑡−1 + 𝑇𝑡−1)
[2] 𝑇𝑡 = 0.5 (𝐿𝑡 − 𝐿𝑡−1) + (1 − 0.5)𝑇𝑡−1
[3] 𝑆𝑡 = 0.5 (𝑌𝑡
𝐿𝑡) + (1 − 0.5)𝑆𝑡−𝑝

102
n equals to 4 (4 quarters of year 2019) using 𝐹𝑡+𝑛 = (𝐿𝑡 + 𝑛 𝑇𝑡)𝑆𝑡−𝑝+𝑛, the forecast revenue
for 2019 are as below:
Quarter 1: 5,787 € million
Quarter 2: 5,394 € million
Quarter 3: 6,196 € million
Quarter 4: 5,397 € million
Total forecast revenue for 2019: 22,774 € million (It is the result of forecast only, the actual
revenue will be different)
Graph 17: Revenue and revenue forecast of Adidas for 2019
Source: own graph
3.5 Financial statements forecast for 2019
Using the percentage of forecast revenue, Pro-forma income statement and pro-forma
Balance sheet will be produced for 2019.
3.5.1 Assumption
Assumptions are needed to produce for overall items of income statement and balance
sheet. Some specific items increase proportionately to the revenue meaning changing following
the same percentage change of revenue. Below items of income statements are proportional to
revenue:
0
1000
2000
3000
4000
5000
6000
7000
0 5 10 15 20 25 30
Re
ve
nu
e (€
mill
ion
)
Quarter
Revenue and Revenue forecast of Adidas
forecasts yt

103
. Cost of sales
.Other operating expense
The below items are not proportional, so they will be kept the same amount for 2019.
. Royalty and commission income
.Other operating income
.Financial income
The below items are proportional to other items:
. Financial expense is proportional to the sum of short term borrowings and long term
borrowings
.Income tax expense is proportional to income from continuing operation before income taxes
The below are the assumption for balance sheet items that are proportional to revenue:
. Cash and cash equivalent
. Account receivables
.Inventories
. Account payable
.Retained earnings
Retained earnings changes proportionately to revenue since the retained earnings are
affected by net income, comprehensive income, dividend etc.
In case the total assets does not equal total liabilities and equity and the total assets is
bigger than total liabilities and equity, the difference will be financed by short term borrowing.
3.5.2 Initial calculation
Some calculations are needed to produce such as revenue growth comparing to previous
year (2018). The percentage of each items are found proportionately to revenue. The percentage
of financial expense and income tax expense will also be calculated. The calculation of forecast
items will be produced using the financial result data of 2018.
Revenue growth rate = Revenue in 2019−Revenue in 2018
Revenue in 2018x100 =
𝟐𝟐,𝟕𝟕𝟒−𝟐𝟏𝟐𝟏𝟖
21218 x100 = 3.92%

104
Table 51: Percentage of items proportional to revenue
Year 2018 % of revenue
Revenue
Cost of sales
Other operating expense
Cash and cash equivalents
Account receivable
Inventories
Account payable
Retained earnings
21,915
10,552
9,172
2,629
2,418
3,445
2,300
6,054
100.00%
48.15%
41.85%
12.00%
11.03%
15.72%
10.50%
27.62%
Source: own calculation
Assume that all the above percentage of items from income statement and balance sheet will
occur in proportion to revenue for 2019.
Interest rate and income tax rate are calculated as the following:
Interest rate = Financial expense/(short term borrowings + long term borrowings)
= 47/(66+1,609) = 2.81%
Income tax rate = Income tax expense/income before taxes
= 669/1,709 = 28.13%
3.5.3 Pro-forma Income Statement and Balance Sheet for 2019
Revenue forecast for 2019 = 22,774 € million
Revenue growth = 3.92%
Interest rate = 2.81%
Income tax rate = 28.13%

105
Table 52: Income Statement in 2018 and Pro-forma Income Statement for 2019 of Adidas
(€ million)
Year 2018 2019
Revenue (net sales)
Cost of sales
Gross profit
Royalty and commission income
Other operating income
Other operating expense
Goodwill impairment losses
Operating profit
Financial income
Earning before interest and taxes
Financial expense
Income before taxes
Income taxes
Net income from continuing operations
Losses from discontinued operations, net of tax
Net income
Net income attributable to shareholders
Net income attributable to NCI
21,915
10,552
11,363
129
48
9,172
-
2,368
57
2,424
47
2,378
669
1,709
5
1,704
1,702
3
22,774.00
10,965.61
11,808.39
129.00
48.00
9,531.51
-
2,453.88
57.00
2,510.88
47.00
2,463.88
693.16
1,770.72
5.00
1,765.72
1,762.54
3.18
Source: own calculation
Financial expense and Income tax expense for 2019 are calculated as the following:
. Financial expense = 2.81% * (66+1,609) = 47 € million
. Income tax expense = 28.13% * 2,463.88 = 693.16 € million

106
Table 53: Balance sheet in 2018 and Pro-forma Balance sheet for 2019 of Adidas (€ million)
Year 2018 2019
ASSETS
Cash and cash equivalents
Short-term financial assets
Accounts receivable
Other current financial assets
Inventories
Income tax receivable
Other current assets
Assets classified as held for sale
Total current assets
Property, plant and equipment
Good will
Trademarks
Other intangible assets
Long-term financial assets
Other non-current financial assets
Deferred tax assets
Other non-current assets
Total non-current assets
2,629
6
2,418
542
3,445
48
725
-
9,813
2,237
1,245
844
196
276
256
651
94
5,799
2,732.05
6.00
2,512.78
542.00
3,580.03
48.00
725.00
-
10,145.86
2,237.00
1,245.00
844.00
196.00
276.00
256.00
651.00
94.00
5,799.00
TOTAL ASSETS 15,612 15,944.86

107
Year 2018 2019
LIABILITIES
Short-term borrowings
Accounts payable
Other current financial liabilities
Income taxes
Other current provisions
Current accrued liabilities
Other current liabilities
Liabilities classified as held for sale
Total current liabilities
Long-term borrowings
Other non-current financial liabilities
Pensions and similar obligations
Deferred tax liabilities
Other non-current provisions
Non-current accrued liabilities
Other non-current liabilities
Total non-current liabilities
TOTAL LIABILITIES
EQUITY
Share capital
Reserves
Retained earnings
Shareholder’s equity
Non-controlling interest
TOTAL EQUITY
66
2,300
186
268
1,232
2,305
477
-
6,834
1,609
103
246
241
128
19
68
2,414
9,248
199
123
6,054
(13)
6,364
66.00
2,390.15
186.00
268.00
1,232.00
2,305.00
477.00
-
6,924.15
1,609.00
103.00
246.00
241.00
128.00
19.00
68.00
2,414.00
9,338.15
199.00
123.00
6,291.30
(13.00)
6,600.30
TOTAL LIABILITIES AND EQUITY 15,612 15,938.45
Source: own calculation
Total assets in 2019 is 15,944.86 € million and Total liabilities and equity in 2019 is
15,938.45 € million, making difference of 6.41 € million. This 6.41 € million is assumed to

108
finance through short term borrowings, so short-term borrowings will increase by 6.41 € million
in 2019. Then Income statement and Balance sheet for 2019 are re-calculated as the following:
Table 54: Income Statement in 2018 and Pro-forma Income Statement for 2019 (€ million)
Year 2018 2019
Revenue (net sales)
Cost of sales
Gross profit
Royalty and commission income
Other operating income
Other operating expense
Goodwill impairment losses
Operating profit
Financial income
Earning before interest and taxes
Financial expense
Income before taxes
Income taxes
Net income from continuing operations
Losses from discontinued operations, net of tax
Net income
Net income attributable to shareholders
Net income attributable to NCI
21,915
10,552
11,363
129
48
9,172
-
2,368
57
2,424
47
2,378
669
1,709
5
1,704
1,702
3
22,774.00
10,965.61
11,808.39
129.00
48.00
9,531.51
-
2,453.88
57.00
2,510.88
47.18
2,463.70
693.11
1,770.59
5.00
1,765.59
1,762.41
3.18
Source: Own calculation
Financial expense and income tax expense are recalculated as below:
. Financial expense = 2.81% * (72.41+1,609) = 47.18 € million
. Income tax expense = 28.13% * 2,463.70 = 693.11 € million

109
Table 55: Balance sheet in 2018 and Pro-forma Balance sheet for 2019 of Adidas (€ million)
Year 2018 2019
ASSETS
Cash and cash equivalents
Short-term financial assets
Accounts receivable
Other current financial assets
Inventories
Income tax receivable
Other current assets
Assets classified as held for sale
Total current assets
Property, plant and equipment
Good will
Trademarks
Other intangible assets
Long-term financial assets
Other non-current financial assets
Deferred tax assets
Other non-current assets
Total non-current assets
2,629
6
2,418
542
3,445
48
725
-
9,813
2,237
1,245
844
196
276
256
651
94
5,799
2,732.05
6.00
2,512.78
542.00
3,580.03
48.00
725.00
-
10,145.86
2,237.00
1,245.00
844.00
196.00
276.00
256.00
651.00
94.00
5,799.00
TOTAL ASSETS 15,612 15,944.86

110
LIABILITIES
Short-term borrowings
Accounts payable
Other current financial liabilities
Income taxes
Other current provisions
Current accrued liabilities
Other current liabilities
Liabilities classified as held for sale
Total current liabilities
Long-term borrowings
Other non-current financial liabilities
Pensions and similar obligations
Deferred tax liabilities
Other non-current provisions
Non-current accrued liabilities
Other non-current liabilities
Total non-current liabilities
TOTAL LIABILITIES
EQUITY
Share capital
Reserves
Retained earnings
Shareholder’s equity
Non-controlling interest
TOTAL EQUITY
66
2,300
186
268
1,232
2,305
477
-
6,834
1,609
103
246
241
128
19
68
2,414
9,248
199
123
6,054
(13)
6,364
72.41
2,390.15
186.00
268.00
1,232.00
2,305.00
477.00
-
6,930.56
1,609.00
103.00
246.00
241.00
128.00
19.00
68.00
2,414.00
9,344.56
199.00
123.00
6,291.30
(13.00)
6,600.30
TOTAL LIABILITIES AND EQUITY 15,612 15,944.86
Source: own calculation
3.5.4 Earnings per share for 2019
Weighted average number of share outstanding and weighted average number of diluted
share are used to calculate basic and diluted EPS. The number of weighted average of share

111
outstanding and weighted average of diluted share were known in 2018 and it is assume that
those will not change in 2019, then basic EPS and diluted EPS can be calculated as below:
Table 56: Basic EPS and diluted EPS for 2019 of Adidas
(€, except weighted average number of share outstanding)
Year 2018 2019
Net income attributable to shareholders 1,702,000,000 1,762,410,000
Weighted average number of share outstanding-basic
Basic EPS
201,516,290
8.45
201,516,290
8.75
Weighted number of share outstanding-diluted
Diluted EPS
201,802,245
8.43
201,802,245
8.73
Source: own calculation
3.5.5 Return on equity ROE for 2019
Return on equity ROE for 2019 is calculated using net income and Shareholders’ equity
as the following:
Table 57: Return on equity ROE for 2019 (€ million, except ROE)
Year 2018 2019
Net income
Average shareholders’ equity
1,704.00
6,190.50
1,765.59
6,494.65
ROE 27.53% 27.19%
Source: own calculation
Note: Average shareholders’ equity for 2019 is calculated by using shareholders’ equity in 2018
and forecasted shareholders’ equity in 2019.
3.5.6 Limitation and conclusion
The percentage-of-sales method is the fastest method to predict the forecast and it
produces a high-quality forecast for the items proportional, however there are some limitations
as follows:
. The assessments made is approximations and it generally lack detail of what will change of
operation (type of assets) in the future.
. Revenue will be depend on economic environment that the demand may fluctuate over the
time in the future so there will be problems arising when using assumption of the past
experience to forecast for the future

112
. The model pays more attention to Income statement and balance sheet but not cash flow
statement
The pro-forma income statement and pro-forma balance sheet of Adidas for 2019 are
produced under the assumptions and those pro-forma financial statements are only predicted
that the actual results of financial performance of Adidas in 2019 will be different from the
forecast results of pro-forma income statement and of pro-forma balance sheet for 2019.

113
CONCLUSION
The appraisal of financial performance of Adidas group is done by performing the
financial analysis using the methods stated in the Methodology, Introduction, with the aim to
obtain the answers for the thesis partial objectives stated in Partial objectives, Introduction.
Financial statements of Adidas group covering the period of last 8 years, from 01 January 2013
to 31 December 2018, and more other sources of data were used for the analysis.
The view on Adidas group is very good. Adidas is a well-known company, sound
financial company with a long famous and prestige history as it is also shown by the analysis
results being performed. The analysis paid focus on the following areas of the company’s
financial performances:
. Profitability
. Activity
. Liquidity
. Debt management
. Financial market
. Bankruptcy prediction
These financial indicators are interconnected to each other as it affects each other that’s
why they are so important to be part of the analysis to obtain the whole view of the past and
present financial performance of Adidas group.
Furthermore, to examine Adidas’ past and current performance, the comparison was
done with its competitors, Nike and Puma. The comparison evidently proved that Adidas has a
greater position among its competitors.
As the general view is already provided, in the conclusion, the focus on responses to the
thesis objectives with the assistance from the results obtained by performing financial analysis.
The responses will be provided to the following four objectives:
- Past and current performance of financial condition of Adidas
- Adidas’ ability to meet all its financial obligations
- Difficulties and recommendations
- Adidas in 2019 and Adidas beyond 2019
Past and current performance of financial condition of Adidas
Past and current performance of financial condition of Adidas can be described by
financial result from the year 2013 to the recent result of 2018.

114
Adidas increased its revenue year to year from 2013 to 2018. As in 2018, Adidas generated the
revenue amount of 21,915 € millions which produced the net income amount of 1,704 €
millions. Adidas had the profit margin of 7.78% in 2018. Comparing this result to those of its
competitors in the same period, Adidas came first for the great result in term of net income, as
Adidas’ net profit margin used to be the second compared to its competitors from 2013 to 2017.
Please refer to 3.3.6: Comparison of net profit and Return on equity ROE.
Adidas’ total assets grew over the period from 11,599 € millions in 2013 to 15,612 €
millions in 2018. This mean that its total assets grew by 35% or 4,013 € millions in absolute
term. Please refer to Section 3.2.1: Horizontal Analysis of Balance Sheet.
Retained earnings is also the best indicator to evaluate the performance of a company.
Adidas’ retained earnings was 4,959 € millions in 2013 and 6,054 € millions in 2018 meaning
it growth at 22% or 1,095 € millions in 2018. This was the big growth in retained earnings
indicating that Adidas was performing very well.
From the above condition, certainly it could be said that Adidas’ past and current
performance of financial condition is very financially sound as it was generating and increased
good revenue and profit comparing to its competitors. Furthermore, its total assets were
increasing, indicating the company had more resources to generate extra revenue.
Adidas’ ability to meet all its financial obligations
The financial obligations are the liabilities of a company arising during its course of
business operations. Since the liability also includes debt of the company, there are two kinds
of liabilities: current (short term borrowings, account payable, other current financial liabilities,
income taxes and other current provisions etc.) and non-current liabilities (long term
borrowings, other non-current financial liabilities, pensions and similar obligations, deferred
tax liabilities, etc).
Current liabilities are those which must be settle within one year, and non-current
liabilities are those obligation that must be settled longer than one year.
The following judgments for current liabilities and non-current liabilities:
Ability to meet its current Liabilities
The ability to meet its current liabilities was connected to the liquidity of Adidas. The
liquidity ratios were used to measure liquidity of Adidas.

115
Looking at current assets and current liabilities of Adidas in the last 6 years from 2013
to 2018, Adidas possessed more current assets than current liabilities in all 6 years indicating
that its net working capital were positive in all years. Adidas had enough ability to meet its
current financial obligation when it fall due immediately. Adidas’ current assets and current
liabilities were growing over the period from 6,857 € millions and 4,732 € millions in 2013 to
9,813 € millions and 6,834 € millions 2018 by increasing 43% or 2,956 € millions and 44% or
2,102 € millions respectively. The growth of the current assets was bigger than that of the
current liabilities.
Considering the trend of liquidity ratios, they were not so good as current ratio, quick
ratio and cash ratio fluctuated by increasing in 2014 then declined till 2017 and rise in 2018. If
comparing the results with the competitors, Adidas had the worst results in term liquidity.
Please refer to section 3.2.4: Summary of Liquidity Ratios and section 3.3.7: Comparison of
Liquidity Ratios.
With its current assets level to generate more revenue, certainly it could be said that
Adidas will not have any difficulties to meet its current obligations when it fall due
immediately.
Ability to meet non-current financial obligation
All liabilities items which are longer than one year are categorized into this group. The
largest portion of this group is long term borrowings. Long term borrowings of Adidas were
653 € millions, 1,584 € millions, 1,463 € millions, 982 € millions, 983 € millions, 1,609 €
millions which were 65%, 63%, 50%, 57%, 67% of total non-current liabilities in 2013, 2014,
2015, 2016, 2017, and 2018 respectively. The Adidas’ ability to meet the long-term
liabilities can be assessed by using debt management ratios. The conclusion will be based on
the comparison with the competitors. The comparison with competitors using debt management
ratios were: financial leverage, debt ratio and debt to equity ratio. For comparing with
competitors, the average ratios were calculated using each indicators of all three companies,
Adidas, Nike, and Puma. And this average is different from industry average.
Generally, the lower liabilities, the better the company. Investors will prefer low ratios.
The result of Adidas’ debt management ratios were higher than those of Nike and of Puma and
even they were higher than the average value of the three companies. It can be said that the non-
current liabilities of Adidas were higher than those of its competitors. Please refer to section
3.3.8: Comparison of debt management ratios.

116
Considering the size of Adidas, it would obviously need big external financing. Adidas
built its brand name and its fame over the long period of time and Adidas always followed the
requirement of its creditors and never defaulted its debts. Even though, Adidas was in a risky
position as it employed more debt than equity to finance its total assets, Adidas generated and
increased its revenue over the period of time since 2013 till 2018 and even increase of its
forecast revenue in 2019. It is sure that in the long run Adidas will be able to generate enough
income to increase its net asset.
Problems and recommendations
Some problems of Adidas were determined during writing this thesis. Those problems
were derived from assessing its past and current results of its financial performance. Since the
assessment of those problems was done on the basis of only numbers, the following problems
occurred but not limited to:
-Profit margin was decreasing from 2014 to 2017
-Current ratio was decreasing from 2015 to 2018
-Cash ratio was decreasing from 2015 to 2017
-Acid test ratio was decreasing from 2015 to 2017
-Financial leverage was increasing from 2013 to 2018
For the above results of financial analysis, Please see Chapter 4: Financial Analysis of Adidas
Group,
The following recommendations were produced for the above problems:
- Boost sale;
- Cut down cost of sales and operational expense at lower level;
- Increase net income
- Submit invoice early and switch short term borrowings to long term borrowings, negotiate
for longer payment to suppliers
- Increase more cash and cash equivalents level
- Find more equity finance instead of obtaining more debt to finance assets for operation in
order to reduce financial risk
Being the big size and long history of Adidas, these recommendations will not be easy
to attain as some factors may affect the performance of Adidas and some other external factors

117
that are out of control of Adidas such as the world economy situation, competitions from other
companies in the same industry, politics and government policy, and customer’s preference.
Adidas in 2019 and Beyond 2019
In this section, the general view of what occurred till 2018 and financial forecast of
Adidas for 2019 will be elaborated. More than that, strategy and goals of Adidas after 2019 will
be presented.
Adidas in 2019
Annual general meeting of Adidas in May 2019
Adidas will organize an annual general meeting on 09 May 2019 in the Stadthalle Furth,
Furth, Germany.
There are some issues which will be discussed in this annual general meeting. Firstly,
Supervisory board will discuss and approve consolidated financial statement for the year 2018
and other important management reports. Secondly, the executive board and the supervisory
board propose to resolve the appropriation of payment of a dividend of 3.35 € per share.
Thirdly, the executive board and the supervisory board propose to approve the actions of
member of executive board in office for 2018. Fourthly, the executive board and the supervisory
board propose to approve the actions of member of supervisory board in office for 2018. Fifthly,
Supervisory board election will be conducted for the term of office of al supervisory board
member.
https://www.adidas-group.com/en/investors/annual-general-meeting/
Financial forecast 2019
Using Holt-Winters method, the forecast of financial performance of Adidas was
conducted for revenue forecast and percentage of sale model to derive the pro-forma financial
statements for 2019. Please refer to section 3.4: Revenue forecast for 2019 and section 3.5.3:
Pro-forma Financial statements for 2019.
The followings the main indicators of the forecast for 2019:
- Revenue-22,774 € million
- Net income- 1,765.59 € million
- Profit margin- 7.75%
- Basic EPS-8.75 €

118
- ROE- 27.19%
Mr. Kasper Rorsted, CEO of Adidas, presented his view for 2019 outlook in annual
report 2018 as below:
“Staying true to our core belief, through sport we have the power to change lives, we will
continue to create value in 2019. And we will do this by executing upon our strategic choices
and acceleration topics with diligence. Regarding our financial performance, we are targeting
a currency-neutral sales increase between 5% and 8%. By further leveraging our scalable
operating model, net income is expected to once again grow significantly faster than revenues
to a level of around 1.9 € billion. Operating margin is expected to increase to at least 11.3%.
These figures will keep us firmly on track toward our 2020 financial ambition.” (Kasper R.,
Adidas, Annual report 2018, p. 20, visited on 15 AprilMarch 2019)
Beyond 2019
On 08 March 2017, Adidas released its goals on increasing sales and earnings until 2020
as part of its long term strategic business plan for the followings:
- Strategy execution to be accelerated
- Currency-neutral revenues to increase on average between 10% to 12% annually
from 2015 to 2020
- Growth of net income on average from 20% to 22% annually
- E-commerce revenues forecast to receive 4 € billions by 2020
In order to achieve the above goals, Adidas set out the following strategies:
. Company culture: Adidas’ unique culture plays a vital role for achieving this long term goals
. Digital: websites of Adidas drive direct sales
. One Adidas: One Adidas’ roof with the set of measures are to unify all businesses process
with the company.
. North America: Adidas will continue to invest more into its US market share together with
other regions such as Western Europe and China.
. Portfolio: Adidas will continue its focus on its brand portfolio namely Adidas and Reebok
brands.
. Speed: Adidas put itself aiming to be the first true fast sport company.
. Cities: Adidas possesses its 6 core sale and marketing activities centers namely New York,
Los Angeles, London, Paris, Shanghai, and Tokyo.

119
. Open source: The model of collaboration with external partners from world industry of sport
and entertainment and consumers.
https://www.adidas-group.com/en/media/news-archive/press-releases/2017/adidas-increases-sales-and-
earnings-guidance-until-2020/
Final remarks
As already stated, the appraisal of financial performance of Adidas was conducted on
many areas of the company. Those areas were profitability, activity, liquidity, debt
management, and financial market. Furthermore, comparison of Adidas to its competitors, Nike
and Puma, was conducted to be a good source of reference to assist in forming the overall view
of financial performance of Adidas in the last 6 years and how it stood among its competitors
from the same industry.
Finally, Adidas has an obvious long-term strategy and financial goals. At the same time,
it possesses full of knowledge, experience and enough resources to attain its goals. It is believed
that Adidas will continue to generate and increase revenue year to year and achieve its goals in
2019 and after 2019. It is time to wait and see that all those goals will come true.

120

121
LIST OF REFERENCES
Book sources:
[1] BREALEY, Richard A., Stewart C. MYERS and Franklin ALLEN. Principles of
corporate finance. 8th ed. Boston: McGraw-Hill, 2006. xxviii, 10. ISBN 0072957239.,
[2] DAMODARAN, Aswath. Applied corporate finance. 3rd ed. Hoboken: John Wiley &
Sons, 2011. xiv, 738. ISBN 9780470384640
[3] David Alexander & Christopher Nobes, Financial Accounting, 6th edition, 2016
[4] Earl K. Stice, James D. Stice, W. Steve Albrecht, Monte R. Swain, Accounting concepts,
11th edition, 2011
[5] Frank K. Reilly & Keith C. Brown, Analysis of Investments & Management of Portfolios,
10th edition, 2012
[6] Jeff Madura & E. Theodore Veit, Introduction to financial management, 1988
[7] John J. Wild, Ken W. Shaw, Barbara Chiappetta, Financial and Managerial Accounting,
3rd edition, 2009
[8] Kulkarni, K. G. & Kulkarni, G. A., 2013, Fundamental Analysis Vs. Technical Analysis:
A choice of Sectoral Analysis. International Journal of Engineering and Management
Sciences, 4(2)
[9] RICE, Anthony. Accounts demystified: how to understand financial accounting and
analysis. 4th ed. London: Pearson Education, 2003. ISBN 0-273-66334-8.
[10] Stephen A. Ross, Randolph W. Westerfield, Bradford D. Jordan, Fundamentals of
corporate finance, 9th edition, 2010
Electronic sources:
[1] Accounting tools, limitations of financial statements available at
https://www.accountingtools.com/articles/limitations-of-financial-statements.html
01 December 2018
[2] Accounting tools, financial leverage available at
https://www.accountingtools.com/articles/2017/ 5/14/financial-leverage 15 March 2019

122
[3] Adidas, Corporate governance Bodies available at https://www.adidas-
group.com/en/investors/corporate-governance/bodies/, 16 March 2019
[4] Adidas, Brands available at https://www.adidas-group.com/en/brands/adidas/,
19 March 2019
[5] Adidas, Company profile available at www.adidas-group.com/en/group/profile/,
19 March 2019
[6] Adidas, share price history available at https://www.adidas-group.com/en/investors/share/
share-price/, 10 April 2019
[7] Bizfluent, How to forecast financial statements available at https://bizfluent.com/how-
7791703-forecast-financial-statements.html, 15 April 2019
[8] Borse Frangkfurt, Historic prices for DAX available at http://en.boerse-
frankfurt.de/index/pricehistory/DAX/1.1.2013_30.12.2018#History, 10 April 2019
[9] Craft, Overview of Puma available at https://craft.co/puma, 01 April 2019
[10] European central bank, Euro foreign exchange reference rates available at
www.ecb.europa.eu/stats/eurofxref/, 03 April 2019
[11] Investing answers, Altman-z score available at https://investinganswers.com/financial-
dictionary/financial-statement-analysis/altman-z-score-5188, 31 March 2019
[12] Investopedia, Debt ratio definition available at https://www.investopedia.com/terms/d/
debtratio.asp, 15 April 2019
[13] Marketing91, Marketing mix of Adidas available at https://www.marketing91.com/
marketing-mix-adidas/, 15 April 2019

123
[14] Marketing91, Top 10 Adidas competitors-Adidas competitor analysis available at
https://www.marketing91.com/top-10-adidas-competitors/, 15 April 2019
[15] Otexts, Holt-Winters seasonal method available at https://otexts.com/fpp2/holt-
winters.html, 15 April 2019
[16] Reference for business, History of Adidas available at https://www.referenceforbusiness.
com/history2/99/Adidas-Group-AG.html, 01 April 2019
[17] Reuters, Profile of Nike Inc. available at https://www.reuters.com/finance/stocks/
company-profile/NKE.N, 01 April 2019
[18] Yahoo, Product range of Adidas available at https://images.search.yahoo.com
/yhs/search;_ylt=AwrVk9hTh5BcLToASKgPxQt.=click, 19 March 2019
Annual reports:
[1] Adidas- Annual report 2013 available at https://www.adidas-group.com/media/filer_public
/2014/03/05/adidas-group_gb_2013_en.pdf, 19 August 2018
[2] Adidas- Annual report 2014 available at https://www.adidasgroup.com/media/filer
public/2b/2f/2b2fd619-5444-4ee8-9c07-baa878d658c4/2014_gb_en.pdf,
19 August 2018
[3] Adidas- Annual report 2015 available at https://www.adidas-roup.com/media/filer_public/
e9/73/e973acf3-f889-43e5-b3c0-bc870d53b964/2015_gb_en.pdf, 19 August 2018
[4] Adidas- Annual report 2016 available at https://www.adidas-group.com/media/filer_public
/a3/fb/a3fb7068-c556-4a24-8eea-cc00951a1061/2016_eng_gb.pdf, 19 August 2018
[5] Adidas- Annual report 2017 available at https://report.adidas-group.com/media/pdf/EN/
adidas_AR_2017_EN.pdf, 19 August 2018

124
[6] Adidas- Annual report 2018 available at https://www.adidas-group.com/en/investors
/financial-reports/2018/, 13 March 2019
[7] Nike- Annual report 2013 to 2018 available at https://investors.nike.com/investors/
news-events-and-reports/?toggle=earnings, 03 April 2019
[8] Puma-Annual report 2013 to 2018 available at https://about.puma.com/en/investor-
relations/financial-reports, 03 April 2019

125
LIST OF PICTURES
Picture 1: Corporate bodies of Adidas……………………………………………………. 47
Picture 2: Brand of Adidas ………………………………………………………………. 50
Picture 3: Product range of Adidas……………………………………………………...... 51

126

127
LIST OF TABLES
Table 1: Balance sheet of Adidas ………………………………………………………... 53
Table 2: Income statement of Adidas…………………………………………………….. 54
Table 3: Horizontal analysis of balance sheet……………………………………………. 55
Table 4: Horizontal analysis of Income statement………………………………………...58
Table 5: Vertical analysis of balance sheet………………………………………………..59
Table 6: Vertical analysis of Income statement ………………………………………….. 60
Table 7: Net working capital of Adidas…………………………………………………... 61
Table 8: Profit margin…………………………………………………………………….. 62
Table 9: Return on total assets ROA…………………………………………………….. 63
Table 10: Return on capital employed ROCE……………………………………………. 63
Table 11: Return on owners’ equity ROE………………………………………………... 65
Table 12: Summary of profitability ratios………………………………………………... 65
Table 13: Account receivable turnover……………………………………………………65
Table 14: Inventory turnover……………………………………………………………... 66
Table 15: Day’s sales uncollected…………………………………………………………66
Table 16: Day’s sales in inventory………………………………………………………...67
Table 17: Total assets turnover…………………………………………………………… 67
Table 18: Summary of activity ratios…………………………………………………….. 67
Table 19: Current ratio…………………………………………………………………….68
Table 20: cash ratio……………………………………………………………………….. 68
Table 21: Acid-test ratio………………………………………………………………….. 68
Table 22: summary of liquidity ratios……………………………………………………..69
Table 23: Debt to equity ratio of Adidas…………………………………………………. 69
Table 24: Debt ratio of Adidas…………………………………………………………… 70
Table 25: Financial leverage of Adidas…………………………………………………... 71
Table 26: Time interest earned ratio of Adidas…………………………………………... 72
Table 27: Summary of debt management ratios …………………………………………. 73
Table 28: Data of share of Adidas………………………………………………………... 74
Table 29: Price earnings ratio of Adidas…………………………………………………. 74
Table 30: Book value per share of Adidas ……………………………………………….. 75
Table 31: Basic earnings per share EPS …………………………………………………. 75
Table 32: Diluted earnings per share of Adidas …………………………………………. 76

128
Table 33: Dividend cover of Adidas …………………………………………………….. 77
Table 34: Dividend yield of Adidas ………………………………………………………77
Table 35: Summary of financial ratios of Adidas ………………………………………... 78
Table 36: Du Pont analysis of Adidas …………………………………………………… 79
Table 37: Altman Z score of Adidas …………………………………………………….. 80
Table 38: Gross debt as at December 2018 ……………………………………………… 81
Table 39: Top ten competitors of Adidas ………………………………………………... 84
Table 40: Financial information of Nike from 2013 to 2018…………………………….. 86
Table 41: Financial information of Nike from 2013 to 2018…………………………….. 86
Table 42: Exchange rate at 31 May from 2013 to 2018 …………………………………. 87
Table 43: Financial information of Puma from 2013 to 2018……………………………. 88
Table 44: Comparison of capital structure………………………………………………...88
Table 45: Comparison of revenue and profitability………………………………………. 89
Table 46: Comparison of net profit margin and Return on equity ROE
among Adidas, Nike, and Puma ………………………………………………..92
Table 47: Comparison of liquidity among Adidas, Nike, and Puma …………………….. 93
Table 48: Comparison of debt management ratios among Adidas, Nike, and Puma…….. 95
Table 49: Comparison of capital structure among Adidas, Nike, and Puma……………... 97
Table 50: Revenue forecast of Adidas for 2019……………………………………….... 100
Table 51: Percentage of items proportional to revenue…………………………………. 104
Table 52: Income Statement in 2018 and Pro-forma Income Statement for 2019……….105
Table 53: Balance sheet in 2018 and Pro-forma Balance sheet for 2019 of Adidas……..106
Table 54: Income Statement in 2018 and Pro-forma Income Statement for 2019……….108
Table 55: Balance sheet in 2018 and Pro-forma Balance sheet for 2019 of Adidas……. 109
Table 56: Basic EPS and diluted EPS for 2019 of Adidas……………………………….111
Table 57: Return on equity ROE for 2019………………………………………….……111

129
LIST OF GRAPH
Graph 1: Net working capital of Adidas ………………………………………………… 62
Graph 2: Profit margin of Adidas………………………………………………………… 63
Graph 3: Return on total assets ROA of Adidas…………………………………………. 64
Graph 4: Return on capital employed ROCE of Adidas…………………………………..65 Graph 5: Liquidity ratios of Adidas……………………………………………………… 69
Graph 6: Debt to equity ratio of Adidas…………………………………………………. 70
Graph 7: Debt ratio of Adidas …………………………………………………………… 71
Graph 8: Financial leverage of Adidas…………………………………………………… 72
Graph 9: Time interest earned ratio of Adidas ……………………………………………73
Graph 10: Debt management ratios of Adidas ……………………………………………74
Graph 11: Basic earnings per share EPS and Diluted earnings per share of Adidas……... 76
Graph 12: Dividend yield of Adidas………………………………………………………78
Graph 13: Z score of Adidas……………………………………………………………… 81
Graph 14: Revenue comparison among Adidas, Nike, and Puma………………………... 90
Graph 15: Net income comparison among Adidas, Nike and Puma …………………...... 91
Graph 16: Basic earnings per share EPS comparison among Adidas, Nike, and Puma …. 91
Graph 17: Revenue and revenue forecast of Adidas for 2019…………………………...102

130

131
LIST OF APPENDICES
Appendix A: Balance sheet of Adidas from 2013 to 2018
Year 2013 2014 2015 2016 2017 2018
Assets
Cash and cash equivalents
Short term financial assets
Accounts receivable
Other current financial assets
Inventories
Income tax receivable
Other current assets
Assets classified as held for sale
Total Current assets
Property, plant and equipment
Goodwill
Trademarks
Other intangible assets
Long term financial assets
Other non-current financial assets
Deferred tax assets
Other non-current assets
Total non-current assets
1,587
41
1,809
183
2,634
86
506
11
6,857
1,238
1,204
1,419
164
120
30
486
81
4,742
1,683
5
1,946
398
2,526
92
425
272
7,347
1,454
1,169
1,432
162
129
42
577
105
5,070
1,365
5
2,049
367
3,113
97
489
12
7,497
1,638
1,392
1,628
188
140
99
637
124
5,846
1,510
5
2,200
729
3,763
98
580
-
8,886
1,915
1,412
1,680
167
194
96
732
94
6,290
1,598
5
2,315
393
3,692
71
498
72
8,645
2,000
1,220
806
154
236
219
630
108
5,374
2,629
6
2,418
542
3,445
48
725
-
9,813
2,237
1,245
844
196
276
256
651
94
5,799
Total assets 11,599 12,417 13,343 15,176 14,019 15,612
Liabilities
Short term borrowings
Accounts payable
Other current financial liabilities
Income taxes
Other current provisions
Current accrued liabilities
Other current liabilities
Liabilities classified as held for sale
Total current liabilities
Long term borrowings
Other non-current financial liabilities
Pensions and similar obligations
Deferred tax liabilities
Other non-current provisions
681
1,825
113
240
450
1,147
276
-
4,732
653
22
255
338
25
288
1,652
91
294
470
1,249
287
46
4,378
1,584
9
284
390
38
366
2,024
143
359
456
1,684
331
-
5,364
1,463
18
273
368
50
636
2,496
201
402
573
2,023
434
-
6,765
982
22
355
387
44
137
1,975
362
424
741
2,180
473
-
6,291
983
22
298
190
80
66
2,300
186
268
1,232
2,305
477
-
6,834
1,609
103
246
241
128

132
Non-current accrued liabilities
Other non-current liabilities
Total non-current liabilities
Total liabilities
Share capital
Reserves
Retained earnings
Shareholder’s Equity
Non control interest
Total equity
64
29
1,386
6,117
209
321
4,959
5,489
(8)
5,481
81
35
2,422
6,799
204
581
4,839
5,624
(7)
5,618
120
40
2,332
7,696
200
592
4,874
5,666
(18)
5,648
120
46
1,957
8,721
201
749
5,521
6,472
(17)
6,455
85
53
1,711
8,002
204
(29)
5,858
6,032
(15)
6,017
19
68
2,414
9,248
199
123
6,054
6,377
(13)
6,364
Total liabilities and equity 11,599 12,417 13,343 15,176 14,019 15,612
Source: Annual report of Adidas from 2013 to 2018
Appendix B: Income statement of Adidas from 2013 to 2018
Year 2013 2014 2015 2016 2017 2018
Net sales
Cost of sales
Gross profit
Royalty and commission income
Other operating income
Other operating expense
Goodwill impairment losses
Operating profit
Financial income
Finance expense
Income before taxes
Income taxes
Net income from continuing
operation
Income (loss) from discontinued
operation, net of taxes
14,203
(7,202)
7,001
103
142
(6,013)
(52)
1,181
26
(94)
1,113
(340)
773
17
14,534
(7,610)
6,924
102
138
(6,203)
(78)
883
19
(67)
835
(271)
564
(68)
16,915
(8,748)
8,168
119
96
(7,2890
(34)
1,059
46
(67)
1,039
(353)
686
(46)
18,483
(9,383)
9,100
105
262
(7,885)
-
1,582
28
(74)
1,536
(454)
1,082
(62)
21,218
(10,514)
10,704
115
133
(8,882)
-
2,070
46
(93)
2,023
(668)
1,354
(254)
21,915
(10,552)
11,363
129
48
(9,172)
-
2,368
57
(47)
2,378
(669)
1,709
(5)
Net income
Shareholder
Non-controlling interests
790
787
3
496
490
6
640
634
6
1,020
1,017
2
1,100
1,097
3
1,704
1,702
3
Source: Annual report of Adidas from 2013 to 2018
Related Documents