P R O V I N C I A L P A R L I A M E N T • P R O V I N S I A L E P A R L E M E N T • I P A L A M E N T E Y E P H O N D O • W e s t e r n C a p e W e s - K a a p N t s h o n a K o l o n i

Welcome message from author
This document is posted to help you gain knowledge. Please leave a comment to let me know what you think about it! Share it to your friends and learn new things together.
Transcript

PR
OV
I N C I A L P A R L I A ME N
T•
PR
OV
IN
SI
AL
EP
A
RLEMENT•IPALAM
E
NT
EY
EP
HO
ND
O• W
e s t e r n C a p
e
We
s-
Ka
a
pNtshon
aK
olo
ni

Staff receiving training certificates
Employee being assessed during a Wellness Day event
Annual Report 2012/13
Vote 2: Western Cape Provincial Parliament
PART D: Human Resources Management
59
1. Introduction
This section of the Annual Report provides the reader with a high level overview of what has
transpired in the Provincial Parliament in terms of the management of its Human Resources. While a
substantial portion of the document is statistical in nature, it also seeks to provide some meaningful
information and insights on how certain changes or shifts came about and why such changes and
shifts occurred.
NOTE: Please note that in all statistical information provided, the figures will relate to all employees
who were employed at the Provincial Parliament for the entire financial year. Only where it is
expressly stated “01 April 2012 or 31 March 2013” will the figures speak of a snapshot.
2. The Human Resources Strategy
The Human Resources Strategy for the period 2011 to 2015 was aligned to achieve the following
core objectives:
• successful implementation of strategies developed in terms of previous strategy;
• introduce and foster value added processes in the Provincial Parliament;
• more focused, performance driven and outcomes based employee development;
• modern work systems and synergy; and
• devolution of and integration of Human Resources Management processes into
Management processes.
The Human Resources Strategy focuses on two broad areas in the discipline of Human Resources
Management:
Recruitment, Selection and Retention, which includes recruitment and selection, orientation, skills
development, career management, remuneration, employee wellness and assistance; and
Organisational Human Resources Management, which includes gender and disability
mainstreaming, employment equity, organisational development, performance management and
management information.
In terms of Recruitment, Selection and Retention, the Provincial Parliament has been very successful
in the financial year under review. The Provincial Parliament made 19 appointments during the year
of which 14 were external and five were internal appointments. As a result of five resignations, the
employee complement increased by only seven for the annum. Of the resignees, two took up
employment at the Parliament of South Africa and two at other legislatures. This is indicative of the
disadvantage that the Provincial Parliament has in terms of retaining skills that are sector specific.
In order to address this matter, the Provincial Parliament implemented a remuneration structure
that would take it to the median (middle) of the market. This impacted positively on the Provincial
Parliament’s ability to attract and retain employees, although the WCPP does not have the
budgetary capacity to remunerate at the same level as the other institutions in the sector.
Alternative retention strategies thus have to be employed.
The Provincial Parliament hosted a very successful Health Day on 9 October 2012. Fifty-two
employees participated, which yielded an above average participation of 67%. By making employees
aware of their vital statistics, we aim to encourage them to live a healthier and happier life.
Employee wellness also includes counseling with professionals registered with the relevant councils
Annual Report 2012/13
Vote 2: Western Cape Provincial Parliament
PART D: Human Resources Management
60
and the usage thereof indicates that employees are utilising the facilities in order to address
problematic areas in their lives. This not only improves performance, but results in happier, more
content employees.
Following a long process of seeking solutions to address the serious challenges faced by leave
management relying on non-secure databases, such as Excel, the Provincial Parliament procured an
electronic leave system. This will go a long way to address the integrity of leave information. In
addition to that, it provides immediate access to management information for Managers and
comprehensive reports on leave matters.
After the moratorium on short skills development interventions was eventually lifted, the Provincial
Parliament has been carefully planning skills development interventions, which spans more than one
financial year and will continue its roll out in the 2013/14 financial year while further assessment
and planning will take place. The Provincial Parliament facilitated 12 external skills development
interventions to a combined value of R327, 616.00.

OF
FIC
EO
FT
HE
SP
EA
KE
R
PA
RL
IAM
EN
TA
RY
TR
EA
SU
RE
Ch
ief
Tre
asu
ry O
ffice
r
PA
RL
IAM
EN
TA
RY
SE
RV
ICE
Se
cre
tary
Exe
cu"
ve P
ers
on
al
Ass
ista
nt
Se
rvic
e O
ffice
r
Co
rpo
rate
Le
ga
l A
dv
ise
r (U
F)
2 x
Le
ga
l A
dv
ise
r
PR
OC
ED
UR
AL
SE
RV
ICE
S
De
pu
ty S
ecr
eta
ry
Offi
ce A
dm
inis
tra
tor
Ch
ief
Pa
rlia
me
nta
ry O
ffice
r
2 x
Se
rvic
e O
ffice
r
CO
RP
OR
AT
ES
ER
VIC
ES
De
pu
ty S
ecr
eta
ry (
V)
Offi
ce A
dm
inis
tra
tor
Se
rvic
e O
ffice
r
Offi
ce o
f th
e C
hie
f
Fin
an
cia
l O
ffice
r
Ch
ief
Fin
an
cia
l O
ffice
r
Inte
rna
l C
on
tro
l
Offi
ce A
dm
inis
tra
tor
Se
rvic
e O
ffice
r
Ma
na
ge
r
Sn
r H
R O
FF
ICE
R
2 x
HR
O
ffice
r
2 x
HR
Offi
cer
2 x
Me
mb
er`
s A
ffa
irs
Offi
cer
HR
Cle
rk
Hu
ma
n R
eso
urc
es
Ma
na
ge
me
nt
Ma
na
ge
r
Sn
r A
dm
in O
ffice
r
Ad
min
Offi
cer
2 x
Ad
min
Cle
rk
Re
gis
try
Cle
rk
Dri
ver/
Se
rvic
e O
ffice
r
Sw
itch
bo
ard
Op
era
tor
Se
curi
ty a
nd
Fa
cili
"e
s
Ma
na
ge
rme
nt
Ma
na
ge
r
Sn
r IC
T O
ffice
r (V
)
ITC
Offi
cer
(V)
2 x
IC
T A
ssis
tan
t (1
V)
ICT
Ass
ista
nt
(Ne
two
rk)
Info
rma
"o
n a
nd
Co
mm
un
ica
"o
ns
tech
no
log
y
Ma
na
ge
r
Sn
r A
cco
un
tan
t
2 x
Acc
ou
nta
nt
3 x
Acc
ou
nts
Cle
rk
Fin
an
ce
Ma
na
ge
r
Sn
r S
CM
Offi
cer
2 x
SC
M O
ffice
r
2 x
SC
M C
lerk
Ad
min
Offi
cer
Su
pp
ly C
ha
in
Ma
na
ge
me
nt
Ma
na
ge
r
Ne
w M
ed
ia O
ffice
r
PR
Offi
cer
PR
Ass
ista
nt
Re
cep
"o
nis
t
Sn
r Li
bra
ria
n
Lib
rari
an
Co
mm
un
ica
"o
ns
an
d
Info
rma
"o
n
Ma
na
ge
r
Sn
r P
EO
Offi
cer
(UF
)
2 x
PE
O O
ffice
r
PE
O A
ssis
tan
t
Pu
bli
c E
du
ca"
on
an
d
Ou
tre
ach
Ed
ito
r (V
)
Sn
r La
ng
ua
ge
Pr a
c""
on
er
Lan
gu
ag
e P
r ac"
"o
ne
r
Lan
gu
ag
e S
er v
ice
s
Man
age
r
3 x
Sn
r C
om
mi$
ee
Co
ord
inat
or
(1V
)
9 x
Co
mm
i$e
e
Co
or d
inat
or
(1V
)
NC
OP
Offi
cer
3 x
Co
mm
i$e
e A
ssis
tan
ts
Snr
Re
sear
che
r (U
F)
3 x
Re
sear
che
r (1
V)
Co
mm
ite
es
Ma
na
ge
r
2 x
Sn
r P
arl
iam
en
tar y
Offi
cer
Pa
rlia
me
nta
ry
Offi
cer
Cle
rk o
f th
e P
ap
ers
Ple
na
rie
s

Annual Report 2012/13
Vote 2: Western Cape Provincial Parliament
PART D: Human Resources Management
62
4. Personnel related expenditure
The Provincial Parliament budgets in terms of clearly defined programmes. The following tables
summarise final audited expenditure by programme (Table 4.1) and by salary bands (Table 4.2). In
particular, it provides an indication of the amount spent on personnel costs in terms of each of the
programmes or salary bands within the Provincial Parliament.
IMPORTANT NOTE: Please note that some employees were on more than one salary band/level
during the financial year. They would then be reflected in more than one level, resulting in
employee totals seeming peculiar.
4.1 Personnel costs by programme, 2012/2013
Programme
Personnel
Expenditure
(R’000)
Total Expenditure
(R’000)
Personnel cost as a
percent of total
expenditure
Average personnel cost
per employee
(R’000)
Programme 1
(Administration)
22 084 39 031 56 60% 334
Programme 3
(Parliamentary Services)
9 957 16 693 59 88% 301
TOTAL *32 041 *55 724 57 57% 323
*This amount excludes statutory appropriation for Members of the WCPP and Programme 2: Facilities and Benefits for Members and
Political Parties.
Programme 3 historically has fewer employees than Programme 1 as a result of more Sections being
included in Programme 1. This includes the offices of the Speaker and Secretary. On 31 March 2013
there were 60 employees in Programme 1 and 28 in Programme 3.
68.80%
31.20%
Personnel Cost
Programme 1
Programme 3

Annual Report 2012/13
Vote 2: Western Cape Provincial Parliament
PART D: Human Resources Management
63
4.2 Personnel costs by salary bands, 2012/13
Salary Bands No. of e’e
Personnel
Expenditure
(R’000)
% of total Personnel
Cost
Average Personnel
Cost per employee
(R’000)
Lower Skilled (Band A1 – B1) 6 1 249 3.90% 208
Skilled (Band B2 – C3) 57 13 886 43.33% 243
Highly skilled production (Band C4 – C5) 12 5 431 16.95% 452
Highly skilled supervision (Band D1 – D3) 14 7 630 23.81% 545
Senior Management (Band D4 – E2) 4 3 696 11.54% 924
Interns 6 149 0.47% 24
Total 99 32 041 100% 323
* Other payments refer to Life Insurance for employees that are paid monthly for the entire employee complement.
4.2.1 Personnel costs by race, 2012/2013
Beneficiary Profile No. of e’e Personnel Cost by Race
(R’000) % of total Personnel Cost
African 27 7 305 22.80%
Indian 1 1 180 3.68%
Coloured 53 18 672 58.28%
White 12 4 735 14.77%
Interns and *Other Payments 6 149 0.47%
TOTAL 99 32 041 100%
4.2.2 Personnel costs by gender, 2012/2013
Beneficiary Profile No. of e’e Personnel Cost by Gender
(R’000) % of total Personnel Cost
Male 42 15 407 48.08%
Female 51 16 485 51.45%
Interns and Other Payments 6 149 0.47%
TOTAL 99 32 041 100%
The following tables provide a summary per programme (Table 4.3) and salary bands as a
percentage of total personnel cost (Table 4.4) and salary bands as a percentage of the total
personnel cost for that band (Table 4.5) of expenditure incurred as a result of salaries, overtime,
home owners allowance and medical assistance. These tables exclude Interns and Other Payments
as explained above.
4.3 Salaries, overtime, home owners allowance and medical aid by programme, 2012/2013
Programme
Salaries Overtime Home Owners Allowance Medical Assistance
Amount
(R’000)
Salaries as a
% of
Personnel
Cost per
programme
Amount
(R’000)
Overtime as
a % of
Personnel
Cost
Amount
(R’000)
HOA as a %
of
Personnel
Cost
Amount
(R’000)
Medical
Assistance
as a % of
Personnel
Cost
Programme 1 15 350 69.51% 140 0.63% 1 087 4.90% 318 1.44%
Programme 3 6 955 70.00% 123 1.24% 631 6.32% 155 1.56%
TOTAL 22 305 69.61% 263 0.82% 1 718 5.36% 473 1.48%

Annual Report 2012/13
Vote 2: Western Cape Provincial Parliament
PART D: Human Resources Management
64
4.4 Salaries, overtime, home owners allowance and medical aid by salary bands, 2012/2013 (% of
the total personnel cost)
Salary Bands
Salaries Overtime Home Owners Allowance Medical Assistance
Amount
(R’000)
Salaries as a
% of Total
Personnel
Cost
Amount
(R’000)
Overtime as
a % of Total
Personnel
Cost
Amount
(R’000)
HOA as a % of
Total
Personnel
Cost
Amount
(R’000)
Medical
Assistance
as a % of
Total
Personnel
Cost
Lower skilled
(Band A1 – B1)
717 2.23% 40 0.13% 189 0.59% - -
Skilled (Band
B2 – C3)
9 772 30.49% 93 0.29% 1 174 3.66% 303 0.95%
Highly skilled
production
(Band C4 – C5)
3 910 12.21% 94 0.29% 355 1.11% 81 0.25%
Highly skilled
supervision
(Band D1 – D3)
5 508 17.19% 34 0.10% - - 61 0.19%
Senior
Management
(Band D4 – E2)
2 249 7.02% 2 0.01% - - 27 0.09%
Interns 149 0.47% - - - - - -
TOTAL 22 305 69.61% 263 0.82% 1 718 5.36% 472 1.48%
4.5 Salaries, overtime, home owners allowance and medical aid by salary bands, 2012/2013 (% of
the respective salary bands)
Salary Bands
Salaries Overtime Home Owners Allowance Medical Assistance
Amount
(R’000)
Salaries as a
% of
Personnel
Cost per
Salary Band
Amount
(R’000)
Overtime as a
% of
Personnel
Cost per
Salary Band
Amount
(R’000)
HOA as a % of
Personnel
Cost per
Salary Band
Amount
(R’000)
Medical
Assistance
as a % of
Personnel
Cost per
Salary Band
Lower skilled
(Band A1 – B1)
717 57.41% 40 3.20% 189 15.13% - -
Skilled (Band
B2 – C3)
9 772 70.37% 93 0.67% 1 174 8.45% 303 2.19%
Highly skilled
production
(Band C4 – C5)
3 910 72.00% 94 1.73% 355 6.54% 81 1.49%
Highly skilled
supervision
(Band D1 – D3)
5 508 72.19% 34 0.44% - - 61 0.80%
Senior
Management
(Band D4 – E2)
2 249 60.85% 2 0.05% - - 27 0.73%
Interns 149 100% - - - - - -
TOTAL 22 305 69.61% 263 0.82% 1 718 5.36% 472 1.48%

Annual Report 2012/13
Vote 2: Western Cape Provincial Parliament
PART D: Human Resources Management
65
5. Employment and vacancies
The following tables summarises the number of posts, funded and unfunded, on the establishment,
the number of employees and the vacancy rates. The information is presented in terms of three key
variables, to wit Programme (Table 5.1), Salary Band (Table 5.2) and critical occupations.
There has been a steady decline in the vacancy rate of the Provincial Parliament since 2007/8. The
Provincial Parliament embarked on an aggressive recruitment campaign combined with the
implementation of the median of the relevant labour market remuneration, which clearly reflects in
the lowest vacancy rate (9.3%) since 2007/8. This was achieved despite five resignations during the
period.
5.1 Employment and Vacancies by Programme, 31 March 2013
Programme Number of posts Number of funded
posts
Number of filled
posts Vacancy Rate
Vacancy Rate
for Funded
Posts
Programme 1 66 65 60 9.09% 7.70%
Programme 3 34 32 28 17.65% 12.5%
TOTAL 100 97 88 12.00% 9.30%
5.2 Employment and vacancies by salary bands, 31 March 2013
The information in each case reflects the situation as at 31 March 2013. For an indication of the
staffing changes during the period under review, please refer to Part F of this report.
Salary Band Number of
posts
Number of
funded
posts
Number of
posts filled Vacancy Rate
Vacancy Rate
for Funded
Posts
Lower Skilled (Band A1 – B1) 6 6 6 0.00% 0.00%
Skilled (Band B2 – C3) 59 59 54 8.50% 8.50%
Highly skilled production (Band C4 – C5) 16 14 12 25.00% 14.30%
Highly skilled supervision (Band D1 – D3) 14 13 12 84.62% 92.00%
Senior Management (Band D4 – E2) 5 5 4 80.00% 80.00%
TOTAL 100 97 88 12.00% 9.28%
0%
5%
10%
15%
20%
25%
30%
35%
40%
2007/8 2008/9 2009/10 2010/11 2011/12 2012/13
Vacancy Rate
Vacancy Rate
Annual Report 2012/13
Vote 2: Western Cape Provincial Parliament
PART D: Human Resources Management
66
5.3 Employment and vacancies by critical occupation, 31 March 2013
No critical occupation was identified at the beginning of the 2012/2013 financial year.
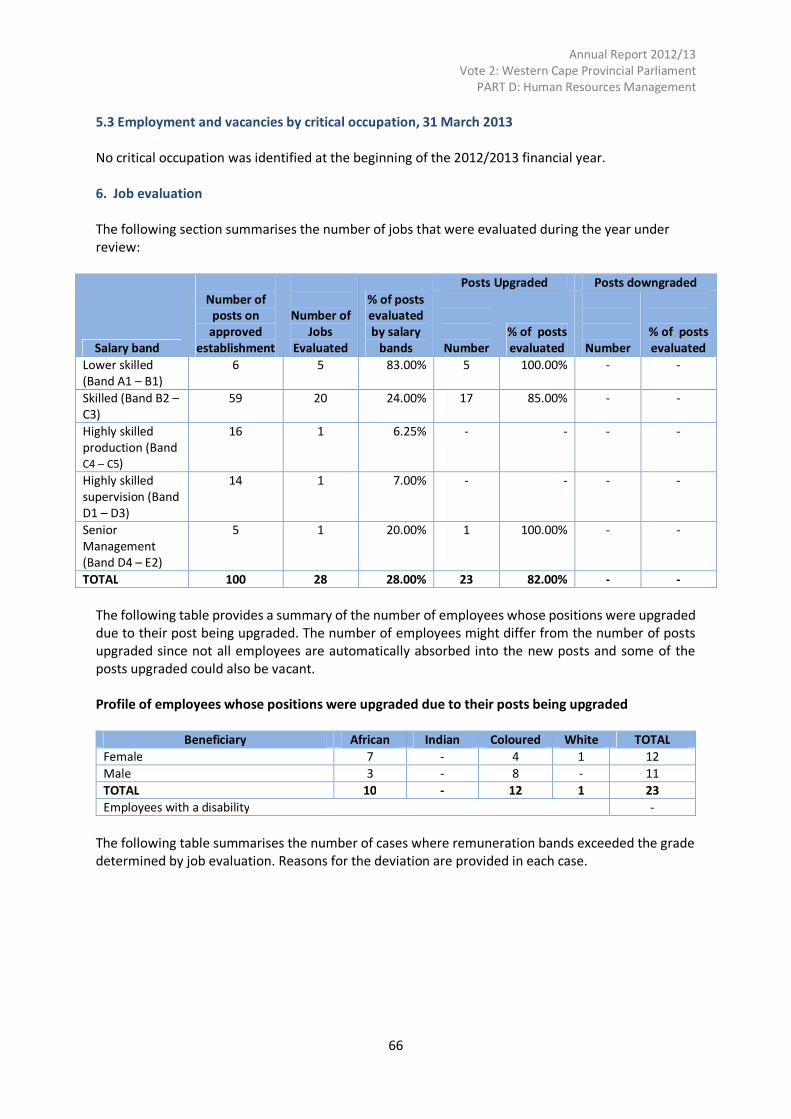
6. Job evaluation
The following section summarises the number of jobs that were evaluated during the year under
review:
Salary band
Number of
posts on
approved
establishment
Number of
Jobs
Evaluated
% of posts
evaluated
by salary
bands
Posts Upgraded Posts downgraded
Number
% of posts
evaluated
Number
% of posts
evaluated
Lower skilled
(Band A1 – B1)
6 5 83.00% 5 100.00% - -
Skilled (Band B2 –
C3)
59 20 24.00% 17 85.00% - -
Highly skilled
production (Band
C4 – C5)
16 1 6.25% - - - -
Highly skilled
supervision (Band
D1 – D3)
14 1 7.00% - - - -
Senior
Management
(Band D4 – E2)
5 1 20.00% 1 100.00% - -
TOTAL 100 28 28.00% 23 82.00% - -
The following table provides a summary of the number of employees whose positions were upgraded
due to their post being upgraded. The number of employees might differ from the number of posts
upgraded since not all employees are automatically absorbed into the new posts and some of the
posts upgraded could also be vacant.
Profile of employees whose positions were upgraded due to their posts being upgraded
Beneficiary African Indian Coloured White TOTAL
Female 7 - 4 1 12
Male 3 - 8 - 11
TOTAL 10 - 12 1 23
Employees with a disability -
The following table summarises the number of cases where remuneration bands exceeded the grade
determined by job evaluation. Reasons for the deviation are provided in each case.

Annual Report 2012/13
Vote 2: Western Cape Provincial Parliament
PART D: Human Resources Management
67
Employees with salary levels higher than those determined by job evaluation by occupation
Occupation Number of
employees Job evaluation level
Remuneration
level Reason for deviation
Supervisory 1 C3 C4 Historic Reasons
Clerical 1 B3 B5 Historic Grade Creep
Service Worker 1 B1 B2 Historic Grade Creep
Clerical 1 B4 B5 Historic Grade Creep
PERCENTAGE OF TOTAL EMPLOYED 3.5%
These employees are all red-circled and specific principles apply to their remuneration.
The following table summarises the beneficiaries of the above in terms of race, gender, and
disability.
Profile of employees who have salary levels higher than those determined by job evaluation
Beneficiary African Asian Coloured White TOTAL
Female - - 1 1 2
Male - - 2 - 2
TOTAL - - - - 4
Employees with a disability - - - - -
Total Number of Employees whose remuneration exceeded the grade determined by job evaluation in
2012/13 4
7. Employment changes
This section provides information on changes in employment for the financial year. Turnover rates
provide an indication of trends in the employment profile of the Provincial Parliament. The
following tables provide a summary of turnover rates by salary band.
7.1 Annual turnover rates by salary band for the period 1 April 2012 to 31 March 2013
Salary Band
Number of
employees per
band as on
1 April 2012
Appointments & Transfers into
the Legislature Terminations and
transfers out of the
Legislature Turnover rate Internal External
Lower Skilled (Band A1 – B1) 5
- 1
- 20.00%
Skilled (Band B2 – C3) 49
3 9
3
30.60%
Highly skilled production
(Band C4 – C5)
10
1 - - 10.00%
Highly skilled supervision
(Band D1 – D3)
12
1 1 2 25.00%
Senior Management (Band D4
– E2)
3 - 1 - 25.00%
TOTAL NUMBER OF
EMPLOYEES
79 5 14 5 88
Interns 6
- - 5 -
The Provincial Parliament was able to turn the tables drastically with regard to appointments and
resignations with the ratio of appointments to resignations rose to 4:1 (four appointments for each
resignation) from 4:3 in the 2011/12 financial year.

Annual Report 2012/13
Vote 2: Western Cape Provincial Parliament
PART D: Human Resources Management
68
The staff complement of the Western Cape Provincial Parliament increased with 9 over the past
year, from 79 on 1 April 2012 to 88 on 31 March 2013. Two employees joined the Provincial
Parliament during April 2012, resulting in the highest number of employees in April 2012, reflecting
as 81.
7.2 Annual turnover rates by critical occupation for the period 1 April 2012 to 31 March 2013
None
7.3 Reasons why staff are leaving the Provincial Parliament
Termination Type Number % of total
Death - -
Resignation 5 100%
Expiry of contract - -
Dismissal – operational reasons - -
Dismissal – inefficiency - -
Discharged due to ill-health - -
Retirement - -
Other - -
Transfers to other Public Service Departments - -
TOTAL 100%
Total number of employees who left as a % of the total employment
Interns 5 83.33%
Of the five employees who left the employ of the Provincial Parliament, four took up employment in
the legislative sector.
72
74
76
78
80
82
84
86
88
90

Annual Report 2012/13
Vote 2: Western Cape Provincial Parliament
PART D: Human Resources Management
69
7.4 Promotions by critical occupation
The Provincial Parliament’s Recruitment and Selection Policy did not make provision for promotion
during the financial year under review. At this stage no critical occupations have been identified.
7.5 Promotions by salary bands
The Provincial Parliament’s Recruitment and Selection Policy did not make provision for promotion
during the financial year under review.
8. Employment Equity
NOTE: For the purposes of this report - Professionals are defined as occupations that require
registration with a professional body in order to be employed at the Provincial Parliament. Please
note that figures and totals in terms of occupational categories and occupational levels might differ
due to employees being internally appointed to positions in a different occupational level, but the
same occupational category, during the year in review.
8.1 Total number of employees (including employees with disabilities) in each of the following
occupational categories South African Standard Classification of Occupations (SASCO) from
1 April 2012 to 31 March 2013
Occupational
Categories
Male Female
TOTAL African Coloured Indian White African Coloured Indian White
Legislators, senior
officials and
managers (1)
2 8 - 1 - 3 1 1 16
Professionals (2)
- - - 1 - - - - 1
Technicians and
Associate
Professionals (3)
5 6 - 2 8 15 - 3 39
Clerks (4)
3 4 - - 7 7 - 1 22
Service Workers (5)
1 4 - - 1 - - - 6
TOTAL 11 22 4 16 25 1 5 84
Contract
employees (Non-
permanent
Employees)
1 2 - 2 - 2 - 1 8
GRAND TOTAL 12 24 - 6 16 27 1 6 92
Annual Report 2012/13
Vote 2: Western Cape Provincial Parliament
PART D: Human Resources Management
70
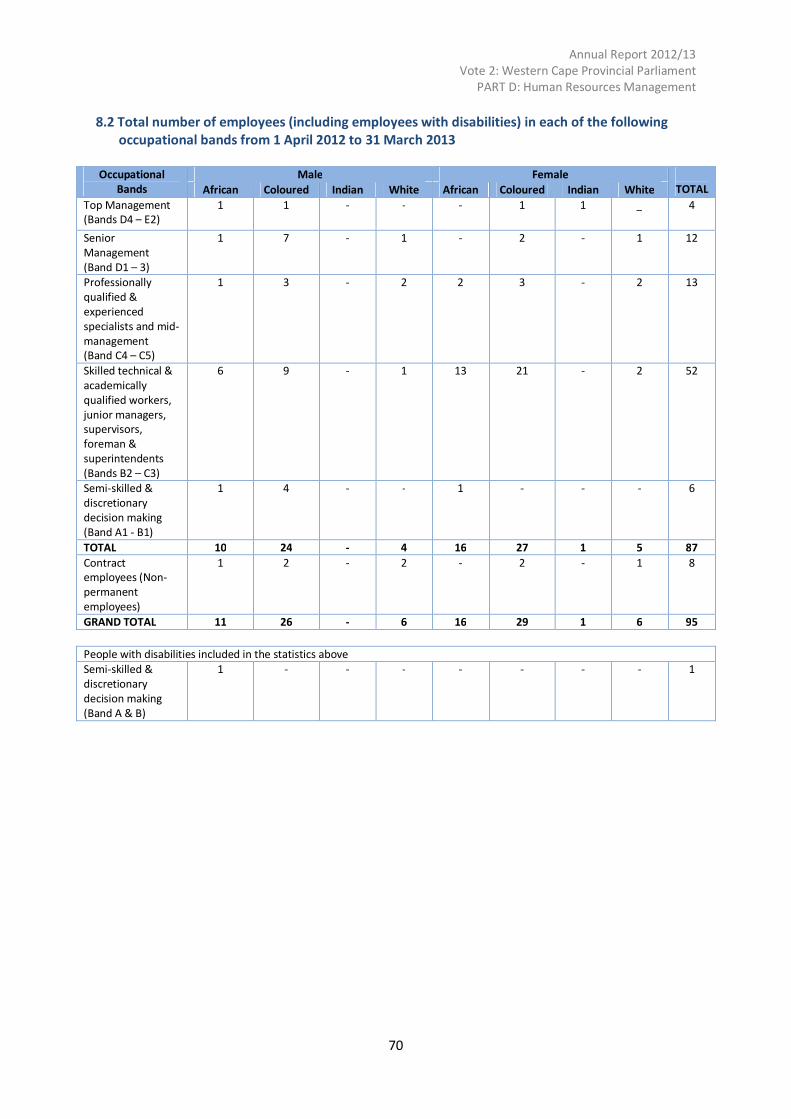
8.2 Total number of employees (including employees with disabilities) in each of the following
occupational bands from 1 April 2012 to 31 March 2013
Occupational
Bands
Male Female
TOTAL African Coloured Indian White African Coloured Indian White
Top Management
(Bands D4 – E2)
1 1 - - - 1 1
_ 4
Senior
Management
(Band D1 – 3)
1
7
- 1
- 2
- 1
12
Professionally
qualified &
experienced
specialists and mid-
management
(Band C4 – C5)
1
3
- 2
2
3
- 2
13
Skilled technical &
academically
qualified workers,
junior managers,
supervisors,
foreman &
superintendents
(Bands B2 – C3)
6
9
- 1
13
21
- 2
52
Semi-skilled &
discretionary
decision making
(Band A1 - B1)
1
4
- - 1
- - - 6
TOTAL 10 24 - 4 16 27 1 5 87
Contract
employees (Non-
permanent
employees)
1
2
- 2
- 2
- 1
8
GRAND TOTAL 11 26 - 6 16 29 1 6 95
People with disabilities included in the statistics above
Semi-skilled &
discretionary
decision making
(Band A & B)
1 - - - - - - - 1

Annual Report 2012/13
Vote 2: Western Cape Provincial Parliament
PART D: Human Resources Management
71
The graph below indicates the number of employees, including non-permanent employees, but
excluding interns, on various salary bands in the Provincial Parliament as at 31 March 2013.
8.3 Recruitment for the period 1 April 2012 to 31 March 2013
Occupational
Bands
Male Female
African Coloured Indian White African Coloured Indian White TOTAL
Senior
Management
(Band D4 – E2)
1 - - - - - - - 1
Highly Skilled
Supervision (Band
D1 – D3)
- 1 - - - - - - 1
Highly skilled
production (Band
C4-C5)
- - - 2
- - - - 2
Skilled (Band B2 –
C3)
- 1 - 1 1 6 - - 9
Lower Skilled
(Band A1 – B1)
1 - - - - - - - 1
TOTAL 2 2 - 3 1 6 - - 14
Employees with
disabilities
- - - - - - - -
8.4 Promotions for the period 1 April 2012 to 31 March 2013
As per point 7.5 above, the Provincial Parliament’s Recruitment and Selection Policy did not make
provision for promotion during the financial year under review.
0
5
10
15
20
25
30
35
Bands D4 -
E2
Bands D1 -
D3
Bands C4-
C5
Bands B2 -
C3
Bands A1 -
B1
African
Coloured
Indian
White

Annual Report 2012/13
Vote 2: Western Cape Provincial Parliament
PART D: Human Resources Management
72
8.5 Terminations for the period 1 April 2012 to 31 March 2013
Occupational
Bands
Male Female
TOTAL African Coloured Indian White African Coloured Indian White
Top Management - - - - - - - - -
Senior
Management
- - - 1 - 1 - - 2
Professionally
qualified &
experienced
specialists and mid-
management
- - - - - -
Skilled technical &
academically
qualified workers,
junior
management,
supervisors,
foreman &
superintendents
1 - - - 1 1 - - 3
Semi-skilled &
discretionary
decision making
- - - - - -
TOTAL 1 - - 1 1 2 - - 5
Employees with
disabilities
- - - - - - -
8.6 Disciplinary action for the period 1 April 2012 to 31 March 2013
Disciplinary
action
Male Female
African Coloured Indian White African Coloured Indian White TOTAL
1 3 - - 1 - - - 5

Annual Report 2012/13
Vote 2: Western Cape Provincial Parliament
PART D: Human Resources Management
73
8.7 Skills development for the period 1 April 2012 to 31 March 2013
Training course attendance
Occupational
Categories
Male Female
TOTAL African Coloured Indian White African Coloured Indian White
Legislators, Senior
Officials and
Managers (1)
2 9 - 1 - 3 2 1 18
Professionals (2)
- - - - - - - - -
Technicians and
associate
professionals (3)
10 9 - - 10 26 - 7 62
Clerks (4)
1 9 - - 21 15 - 2 48
Service Workers (5)
- 5 - - 3 - - - 8
TOTAL 13 32 0 1 34 44 2 10 136
Interns
- - - - - - - - -
Employees with
disabilities
1 - - - - - - - -
Note:
Please note that this indicates incidents of training and not individuals who attended training. Internal training programmers are included.
Study Assistance provided for formal education
Occupational
Categories
Male Female
TOTAL African Coloured Indian White African Coloured Indian White
Legislators, senior
officials and
managers (1)
- 2 - - - - 1 - 3
Professionals (2)
- - - - - - - - -
Technicians and
associate
professionals (3)
- 1 - - 1 2 - 1 5
Clerks (4)
- 1 - - 1 1 - - 3
Service Workers (5)
- 1 - - - - - - 1
TOTAL - 5 - - 2 3 1 1 12
Employees with
disabilities
- - - - - - - - -
Annual Report 2012/13
Vote 2: Western Cape Provincial Parliament
PART D: Human Resources Management
74
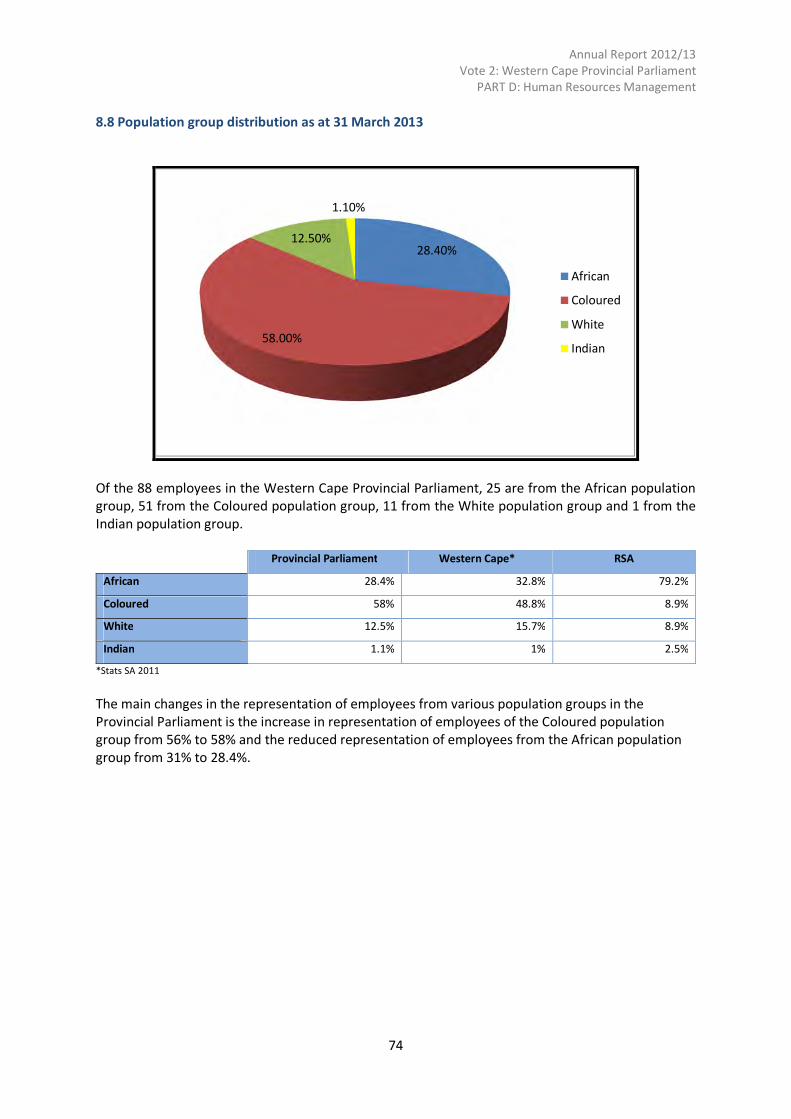
8.8 Population group distribution as at 31 March 2013
Of the 88 employees in the Western Cape Provincial Parliament, 25 are from the African population
group, 51 from the Coloured population group, 11 from the White population group and 1 from the
Indian population group.
Provincial Parliament Western Cape* RSA
African 28.4% 32.8% 79.2%
Coloured 58% 48.8% 8.9%
White 12.5% 15.7% 8.9%
Indian 1.1% 1% 2.5%
*Stats SA 2011
The main changes in the representation of employees from various population groups in the
Provincial Parliament is the increase in representation of employees of the Coloured population
group from 56% to 58% and the reduced representation of employees from the African population
group from 31% to 28.4%.
28.40%
58.00%
12.50%
1.10%
African
Coloured
White
Indian

Annual Report 2012/13
Vote 2: Western Cape Provincial Parliament
PART D: Human Resources Management
75
8.9 Gender composition as at 31 March 2013
On 31 March 2013, 48 of the employees in the Western Cape Provincial Parliament were female and
40 were male.
Provincial Parliament Western Cape RSA
Female 54.5% 50.9% 51.5%
Male 45.5% 49.1% 48.5% *Stats SA 2011
The Provincial Parliament has succeeded in bringing its gender representation more in line with
provincial representation with a 1.5% reduction in the representation of female employees from
56% in 2011/12 to 54.5% in 2012/13. This being said, the vertical integration of women through all
levels of the institution is still glaringly skewed.
Figure: As on 31 March 2013
40
48
Male
Female
0
10
20
30
40
50
60
Band A1 -
B1
Band B2 -
C3
Band C4 -
C5
Band D1 -
D3
Band D4 -
E2
Male
Female
Annual Report 2012/13
Vote 2: Western Cape Provincial Parliament
PART D: Human Resources Management
76
The highest representation of female employees in the Western Cape Provincial Parliament is on
salary Bands B2 – C3, which represents the clerical and administrative level of the Provincial
Parliament. While females account for 54.5% of total employment at the Provincial Parliament, they
make up 67.30% of employment on salary bands B2 – C3 (Clerks and Administrative Officers).
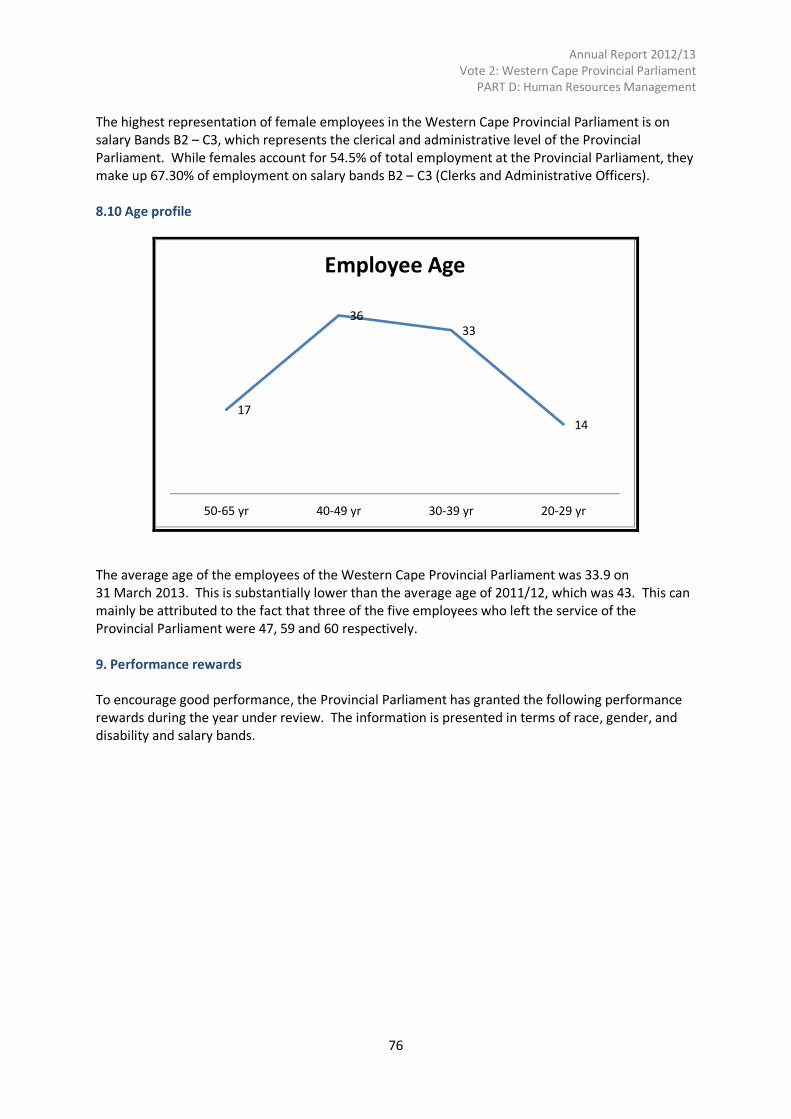
8.10 Age profile
The average age of the employees of the Western Cape Provincial Parliament was 33.9 on
31 March 2013. This is substantially lower than the average age of 2011/12, which was 43. This can
mainly be attributed to the fact that three of the five employees who left the service of the
Provincial Parliament were 47, 59 and 60 respectively.
9. Performance rewards
To encourage good performance, the Provincial Parliament has granted the following performance
rewards during the year under review. The information is presented in terms of race, gender, and
disability and salary bands.
17
36
33
14
50-65 yr 40-49 yr 30-39 yr 20-29 yr
Employee Age


Annual Report 2012/13
Vote 2: Western Cape Provincial Parliament
PART D: Human Resources Management
79
9.3 Performance by critical occupations, 1 April 2012 to 31 March 2013
No critical occupations were identified for the period 1 April 2012 to 31 March 2013.
10. Foreign workers
The information below summarises the employment of foreign nationals in the Provincial
Parliament.
10.1 Foreign workers, 1 April 2012 to 31 March 2013, by salary band
No foreign workers were appointed.
10.2 Foreign workers, 1 April 2012 to 31 March 2013, by major occupation
No foreign workers were appointed.
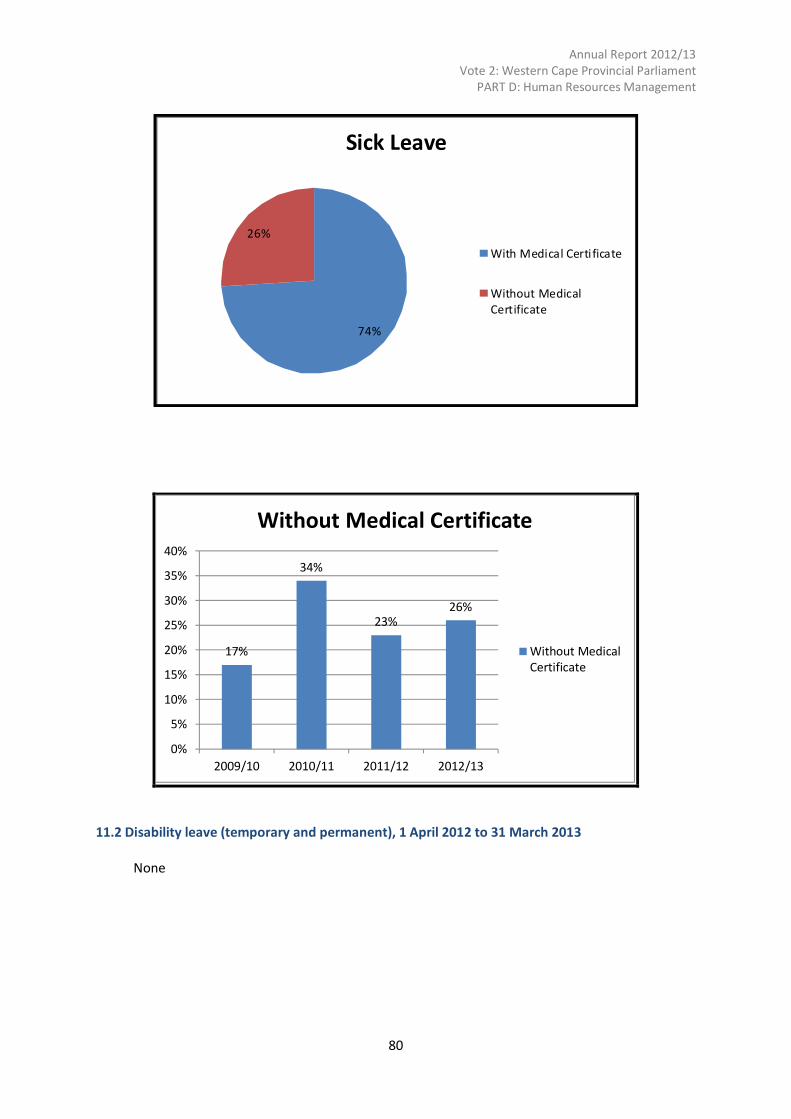
11. Leave utilization
The following tables indicate the use of sick leave, with an estimated cost. The use of annual leave
and annual leave payouts is also provided.
11.1 Sick leave, 1 January 2012 to 31 December 2012
Salary Band Total Days
% of days with
medical
certification
Number of
Employees
using sick leave
% of total
employees
per band
using sick
leave
Average
days per
employee
Estimated
Cost (R’000)
Lower Skilled (Band A1 – B1) 57 68.00% 6 100.00% 10 24
Skilled (Band B2 – C3) 295 75.00% 39 65.00% 5 252
Highly skilled production (Band
C4-C5)
39 72.00% 9 69.00% 3 47
Highly skilled supervision (Band
D1 – D3)
46 76.00% 8 57.00% 3 75
Senior Management (Band D4 –
E2)
13 62.00% 1 25.00% 3 42
TOTAL 450 74.00% 63 65.00% 5 439
Annual Report 2012/13
Vote 2: Western Cape Provincial Parliament
PART D: Human Resources Management
80
11.2 Disability leave (temporary and permanent), 1 April 2012 to 31 March 2013
None
74%
26%
Sick Leave
With Medical Certi ficate
Without Medical
Certificate
17%
34%
23%26%
0%
5%
10%
15%
20%
25%
30%
35%
40%
2009/10 2010/11 2011/12 2012/13
Without Medical Certificate
Without Medical
Certificate

Annual Report 2012/13
Vote 2: Western Cape Provincial Parliament
PART D: Human Resources Management
81
11.3 Annual Leave, 1 January 2012 to 31 December 2012
Salary Bands Total days taken Average per employee
Lower Skilled (Band A1 – B1) 133 22
Skilled (Band B2 – C3) 1 080.24 19
Highly skilled production (Band C4 – C5) 204 17
Highly skilled supervision (Band D1 – D3) 219 16
Senior Management (Band D4 – E2) 61 15
TOTAL 1 697.24 18
11.4 Leave payouts for the period 1 April 2012 to 31 March 2013
Band Total number of
Employees
Total costs
(R‘000)
Average Cost per
Employee
(R‘000)
Lower Skilled (Band A1 – B1) 6 4 0.7
Skilled (Band B2 – C3) 57 64 1
Highly skilled production (Band C4 – C5) 12 7 0.5
Highly skilled supervision (Band D1 –
D3)
14 33 2
Senior Management (Band D4 – E2) 4 - -
TOTAL 93 108 1
Interns 6 2 0.3
11.5 Capped leave 1 April 2012 – 31 March 2013
Salary Band Total days of
capped leave taken
Number of
Employees using
capped leave
Average number of
days taken per
employee
Average capped
leave per employee
as at 31 March
Lower skilled (Band A1
– B1)
- - - 4
Skilled Levels (Band B2
– C3)
4 2 2 2
Highly skilled
production (Band C4 –
C5)
- - - 2
Highly skilled
supervision(Band D1 –
D3)
- - - 3
Senior management
(Band D4 – E2)
- - - 34
TOTAL 4 2 2 4

Annual Report 2012/13
Vote 2: Western Cape Provincial Parliament
PART D: Human Resources Management
82
12. HIV/AIDS and health promotion programmes
12.1 Steps taken to reduce the risk of occupational exposure
As reported last year, Universal Infection Control measures are maintained.
12.2 Details of health promotion and HIV/AIDS programmes (2012/2013)
On 9 October 2012, the Provincial Parliament facilitated a Health Day at no cost to the employees.
This included:
• Health screenings – blood pressure, cholesterol, glucose and body mass index
• An optometrist
• Voluntary counselling and testing for HIV/AIDS
• A nutritional adviser
• Beauty therapy (hand massage)
• A fitness instructor
Fifty-two employees participated in this initiative.
13. Labor relations
13.1 Collective agreements, 1 April 2012 to 31 March 2013
Subject Matter Date
2012/13 Salary Agreement 3 December 2012
13.2 Misconduct and disciplinary hearings finalised, 1 April 2012 to 31 March 2013
Outcomes of disciplinary hearings Number % of total
Correctional counseling - -
Verbal warning 4 80%
Written warning 1 20%
Final written warning - -
Suspended without pay - -
Fine - -
Demotion - -
Dismissal - -
Not guilty - -
Case withdrawn - -
TOTAL 5 100%

Annual Report 2012/13
Vote 2: Western Cape Provincial Parliament
PART D: Human Resources Management
83
13.3 Types of misconduct addressed, 1 April 2012 to 31 March 2013
Type of misconduct Number % of total
Misuse of Parliament’s property 1 20%
Negligently failing to adhere to WCPP procedures 2 40%
Absenteeism 1 20%
Dereliction of Duty 1 20%
TOTAL 5 100%
13.4 Grievances lodged for the period 1 April 2012 to 31 March 2013
One
13.5 Disputes lodged with Councils for the period 1 April 2012 to 31 March 2013
A wage dispute was lodged with the CCMA on 15 October 2012 and 30 November 2012.
After a referral to Essential Services Commission regarding the status of the Provincial Parliament as
an Essential Service, the determination from Essential Services Commission on 15 January 2013 was
that the Provincial Parliament is not an essential service.
13.6 Strike action for the period 1 April 2012 to 31 March 2012
No strikes occurred during the period under review.
13.7 Precautionary suspensions for the period 1 April 2012 to 31 March 2013
None

Annual Report 2012/13
Vote 2: Western Cape Provincial Parliament
PART D: Human Resources Management
84
14. Skills Development
14.1 Training needs identified 1 April 2012 to 31 March 2013
Occupational Categories Gender
Number of
employees as at 31
March 2013
Training needs identified at start of
reporting period
Skills Programmes &
other short course TOTAL
Legislators, senior officials and
managers (1)
Female 4 6 6
Male 12 12 12
Professionals (2)
Female - - -
Male 1 - -
Technicians and associate
professionals (3)
Female 28 43 43
Male 13 19 19
Administrative Workers and
Clerks (4)
Female 15 38 38
Male 9 10 10
Service Workers (5)
Female 1 3 3
Male 5 5 5
Sub Total Female 48 90 90
Male 40 46 46
TOTAL 88 136 136
Interns* Female 1 - -
Male - - -
* Internal on the job training was provided to interns.
14.2 Training provided 1 April 2012 to 31 March 2013
Occupational Categories Gender
Number of
employees as at 31
March 2013
Skills Programmes &
other short course TOTAL
Legislators, senior
officials and managers (1)
Female 4 6 6
Male 12 12 12
Professionals (2)
Female - - -
Male 1 - -
Technicians and associate
professionals (3)
Female 28 43 43
Male 13 19 19
Administrative Workers
and Clerks (4)
Female 15 38 38
Male 9 10 10
Service Workers (5)
Female 1 3 3
Male 5 5 5
Sub Total Female 48 90 90
Male 40 46 46
TOTAL 88 136 136
Interns Female 1 - -
Male - - -
15. Injury on Duty
None
Annual Report 2012/13
Vote 2: Western Cape Provincial Parliament
PART D: Human Resources Management
85
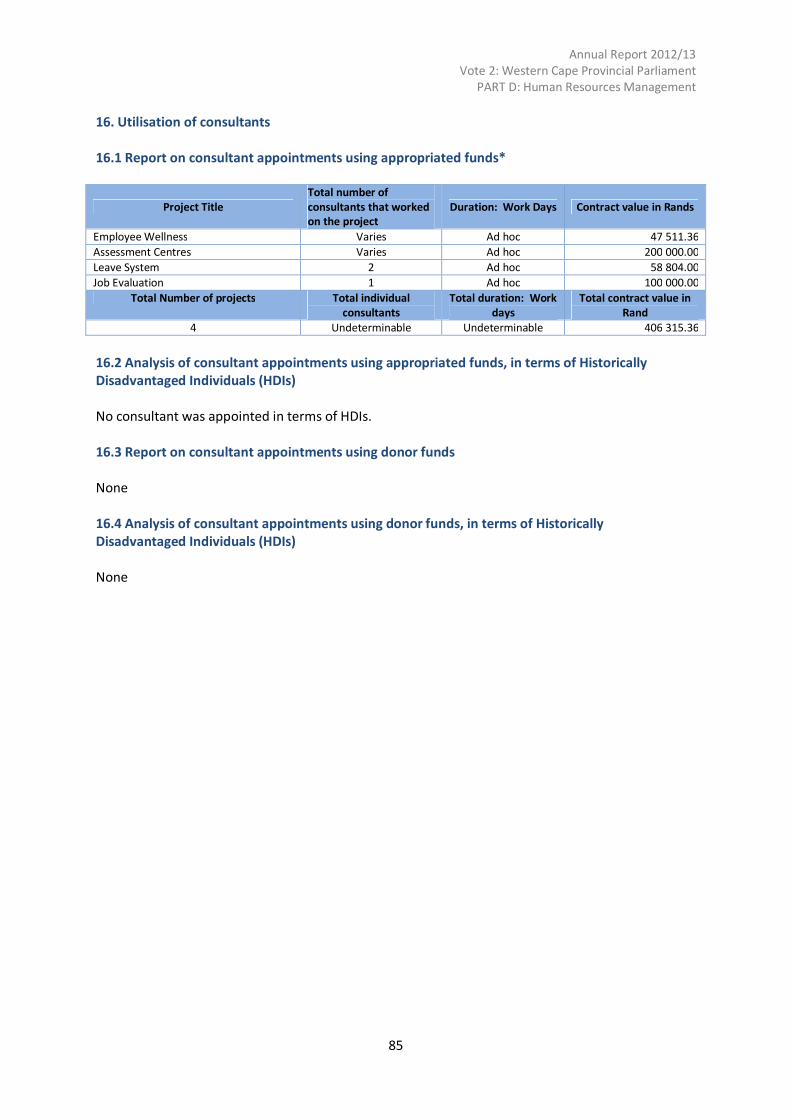
16. Utilisation of consultants
16.1 Report on consultant appointments using appropriated funds*
Project Title
Total number of
consultants that worked
on the project
Duration: Work Days Contract value in Rands
Employee Wellness Varies Ad hoc 47 511.36
Assessment Centres Varies Ad hoc 200 000.00
Leave System 2 Ad hoc 58 804.00
Job Evaluation 1 Ad hoc 100 000.00
Total Number of projects Total individual
consultants
Total duration: Work
days
Total contract value in
Rand
4 Undeterminable Undeterminable 406 315.36
16.2 Analysis of consultant appointments using appropriated funds, in terms of Historically
Disadvantaged Individuals (HDIs)
No consultant was appointed in terms of HDIs.
16.3 Report on consultant appointments using donor funds
None
16.4 Analysis of consultant appointments using donor funds, in terms of Historically
Disadvantaged Individuals (HDIs)
None

Annual Report 2012/13
Vote 2: Western Cape Provincial Parliament
PART D: Human Resources Management
86
Related Documents