FINAL ENVIRONMENTAL ASSESSMENT DELAWARE RIVER MAIN CHANNEL DEEPENING PROJECT DELAWARE BAY ECONOMIC LOADING, MECHANICAL DREDGING AND PLACEMENT OF DREDGED MATERIAL AT THE FORT MIFFLIN CONFINED DISPOSAL FACILITY U.S. Army Corps of Engineers Philadelphia District November 2013

Welcome message from author
This document is posted to help you gain knowledge. Please leave a comment to let me know what you think about it! Share it to your friends and learn new things together.
Transcript
FINAL ENVIRONMENTAL ASSESSMENT DELAWARE RIVER MAIN CHANNEL DEEPENING PROJECT
DELAWARE BAY ECONOMIC LOADING, MECHANICAL DREDGING AND
PLACEMENT OF DREDGED MATERIAL AT THE FORT MIFFLIN CONFINED DISPOSAL FACILITY
U.S. Army Corps of Engineers Philadelphia District
November 2013


i
FINAL ENVIRONMENTAL ASSESSMENT DELAWARE RIVER MAIN CHANNEL DEEPENING PROJECT
DELAWARE BAY ECONOMIC LOADING, MECHANICAL DREDGING AND
PLACEMENT OF DREDGED MATERIAL AT THE FORT MIFFLIN CONFINED DISPOSAL FACILITY
TABLE OF CONTENTS
PAGE 1.0 Introduction ......................................................................................................................... 1
1.1 Purpose of this Environmental Assessment ............................................................ 1
1.2 Project Description.................................................................................................. 1
1.3 Status of Project Construction ................................................................................ 1
2.0 Economic Loading of Hopper Dredges and Hopper Scows ............................................... 2
2.1 Hopper Dredges and Hopper Scows ....................................................................... 2
2.2 Economic Loading .................................................................................................. 3
2.3 Economic Loading with Reach E Channel Sediments ........................................... 4
3.0 Existing Environment (Reach E – Delaware Bay) ............................................................. 5
3.1 Delaware Bay Environmental Resources ................................................................ 5
3.2 Delaware Bay Sediment Quality ............................................................................. 6
3.3 Reach C Dredge Monitoring Study......................................................................... 7
3.4 Reach E - Delaware Bay Navigation Channel Sediment Grain Size ...................... 8
4.0 Environmental Effects of Economic Loading................................................................... 11
4.1 Field Evaluation of Hopper Dredge Overflow for the Delaware River ................ 11
4.1.1 Purpose and Scope of the ERDC Study .................................................... 11
4.1.2 ERDC Field Methods ................................................................................ 12
4.1.3 ERDC Study Findings............................................................................... 16
4.1.3.1 Background Sediment and Water Quality .................................... 16
4.1.3.2 Hopper Sediment Density Monitoring .......................................... 16
4.1.3.3 Hopper Overflow Monitoring ....................................................... 17
4.1.3.4 Plume Monitoring ......................................................................... 17
4.1.3.5 Sediment Profile Camera Results ................................................. 18
ii
4.1.3.6 Standard Elutriate Test Results ..................................................... 18
4.1.3.7 96-Hour Water Column Bioassay ................................................. 18
4.1.4 Potential Impacts to Oyster Beds Resulting From Economic Loading .... 19
4.1.5 Delaware Bay Economic Loading Dredging Window ............................. 21
4.1.6 Reach E – Delaware Bay Economic Loading Conclusion ........................ 22
5.0 Mechanical Dredges.......................................................................................................... 22
6.0 Existing Environment (Delaware River Main Channel Deepening Project Area) ........... 23
6.1 Delaware River Main Channel Deepening Project Area Environmental Resources
............................................................................................................................... 23
6.2 Delaware River Main Channel Deepening Project Area Sediment Quality ......... 23
7.0 Environmental Effects of Mechanical Dredging within the Delaware River Main Channel
Deepening Project Area .................................................................................................... 23
7.1 Delaware River Basin Fish and Wildlife Management Cooperative Recommended
Mechanical Dredging Restrictions ........................................................................ 23
7.1.1 Delaware Bay Mouth to River Mile 32..................................................... 24
7.1.2 Delaware Memorial Bridge to Betsy Ross Bridge .................................... 24
7.2 Sediment Contamination and Water Quality ........................................................ 25
7.3 Mechanical Dredging within the Delaware River Main Channel Deepening
Project Area Conclusion ....................................................................................... 26
8.0 Fort Mifflin Confined Disposal Facility (CDF) ................................................................ 26
8.1 Fort Mifflin Location ............................................................................................ 26
8.2 CDF Operation and Description ........................................................................... 26
8.2.1 Fort Mifflin CDF Description ................................................................... 27
8.2.2 Fort Mifflin CDF Utilization .................................................................... 27
8.2.3 Fort Mifflin Dredged Material Capacity ................................................... 27
8.3 Utilization of the Fort Mifflin CDF for the Delaware River Deepening Project .. 28
9.0 Environmental Effects of Placing Material Dredged for the Delaware River Deepening
Project at the Fort Mifflin CDF ........................................................................................ 28
9.1 Impact to Habitat................................................................................................... 28
9.2 Sediment Contaminants ........................................................................................ 28
9.3 Water Quality Monitoring During Fort Mifflin CDF Operation .......................... 30

iii
9.4 Impact to Cultural Resources ................................................................................ 30
9.5 Placement of Dredged Material at the Fort Mifflin CDF for the Delaware River
Main Channel Deepening Project Conclusion ...................................................... 31
10.0 Cumulative Effects............................................................................................................ 31
11.0 Regulatory Requirements /Public Coordination of this Environmental Assessment ....... 31
12.0 Conclusion and Findings................................................................................................... 33
13.0 References ......................................................................................................................... 35
Appendix A – Turbidity Monitoring..............................................................................................37
LIST OF FIGURES
Figure 1. Hopper Dredge ............................................................................................................... 3
Figure 2. Reach E Economic Loading Sub-Reaches ................................................................... 10
Figure 3. Oyster Bed Distribution in the Delaware Bay .............................................................. 20
Figure 4. Clamshell Dredge ......................................................................................................... 23
LIST OF TABLES
Table 1. Delaware River Bulk Sediment Data Collected in Reaches AA and A of the Main
Channel Deepening Project........................................................................................................... 29

iv
1
FINAL ENVIRONMENTAL ASSESSMENT DELAWARE RIVER MAIN CHANNEL DEEPENING PROJECT
DELAWARE BAY ECONOMIC LOADING, MECHANICAL DREDGING AND
PLACEMENT OF DREDGED MATERIAL AT THE FORT MIFFLIN CONFINED DISPOSAL FACILITY
1.0 Introduction 1.1 Purpose of this Environmental Assessment The purpose of this Environmental Assessment (EA) is to evaluate the impacts of changes to the Congressionally authorized Delaware River Main Channel Deepening (DRMCD) Project, from that described in the 1992 Environmental Impact Statement (USACE, 1992), 1997 Supplemental Environmental Impact Statement (USACE, 1997), 1998 Record of Decision (USACE, 1998) and the 2009 and 2011 Environmental Assessments (USACE, 2009 and 2011). Specifically, this document addresses economic loading of hopper dredges and hopper scows in the Delaware Bay portion of the DRMCD Project, the use of mechanical dredging in project reaches other than the rock removal area, and placement of dredged material from the upper reaches of the project in the existing Federally-owned Fort Mifflin Confined Upland Disposal Facility (CDF). Evaluations of impacts on resources addressed previously in the Environmental Impact Statement (1992 EIS), Supplemental Environmental Impact Statement (1997 SEIS), and Environmental Assessments (2009 EA and 2011 EA) are not discussed in this EA and are incorporated by reference. The 2011 Biological Assessment (USACE, 2011a) and the 2012 Biological Opinion (NMFS, 2012) prepared for the project are also incorporated by reference. 1.2 Project Description The project was most recently described in Section 1.2 of the 2011 EA and is not repeated here. The 2011 EA can be accessed on the DRMCD Project website using the following link:
http://www.nap.usace.army.mil/Portals/39/docs/Civil/Deepening/DRMCD%20-%20Final%20Environmental%20Assessment%20-%20September%202011.pdf
1.3 Status of Project Construction The following project Reaches (see Figure 1 of the 2011 EA) have been completed:
• Reach C, which extends from the Delaware Memorial Bridge to just below the Chesapeake & Delaware Canal, was deepened between March 1, 2010 and September 18,
2
2010. Approximately 3,594,963 cubic yards (CY) of material was removed from Reach C and placed in the Federally-owned Killcohook CDF.
• Reach B, the lower portion, extending from Oldmans Creek, New Jersey, to just upstream of the Delaware Memorial Bridge, was deepened between November 9, 2011 and December 29, 2011. Approximately 769,916 CY of material was dredged and placed in the Federally-owned Pedricktown South CDF.
• Reach A dredging began on September 9, 2012 and was completed on February 3, 2013. The dredging area extended from approximately the Walt Whitman Bridge to just upstream of Chester Island. Approximately 1,356,613 CY of material was dredged and placed in the Federally-owned National Park CDF.
• Reach D dredging began on January 10, 2013 and was completed on May 17, 2013. The dredging area extended from approximately Port Penn, DE to the Delaware State Cedar Creek Wildlife Management Area. Approximately 1,012,428 CY of material was dredged and was placed in the Federally-owned Artificial Island CDF.
The remaining portions of the DRMCD Project include beneficial use projects in the Delaware Bay (Reach E), dredging of sediment and removal of rock in Reach B, dredging of upper Reach B, and dredging of Reach AA. These portions of the project are expected to be completed by the end of calendar year 2017. 2.0 Economic Loading of Hopper Dredges and Hopper Scows 2.1 Hopper Dredges and Hopper Scows Of the three major types of dredges available (hopper, cutter suction, and mechanical), hopper dredges are the most likely to be used to deepen Reach E (which is located within Delaware Bay) because of the exposed conditions in the Delaware Bay and the relatively long distances between the Delaware River Federal channel and dredged material placement sites. Hopper dredges (Figure 1) are self-propelled ships equipped with propulsion machinery, hoppers for dredged material storage, and dredge pumps. Dredged material is hydraulically raised through trailing dragarms in contact with the channel bottom and is discharged into the hoppers. The material is stored in the hoppers through transportation to the placement site. While most hopper dredges are equipped with bottom doors or split hulls for release of material at open water sites, they can also be equipped for pumpout of material to a CDF, beach nourishment, or a beneficial use site.

3
Due to coastal conditions and the distance of the Delaware River Federal channel to the dredged material placement sites, it is unlikely that hydraulic cutter suction dredges with direct pump (pipeline) to the placement sites will be used to deepen Reach E; however, cutter suction dredges could be used in conjunction with a spider barge to load hopper scows with dredged material. When full, the hopper scows are transported by tugboats to the placement site or pumpout location. Hopper scows could also be loaded directly using mechanical dredges (see Section 5). 2.2 Economic Loading Although different in size and shape, the primary component of hopper dredges and hopper scows is the hopper, which is used to contain and transport dredged material. During the dredging process, sediments are mixed with water to create a slurry, which is typically about 25 percent solids and 75 percent water, and the slurry is pumped into the hopper. As the hopper fills with the slurry, the sediments begin to settle to the bottom of the hopper, creating a bottom layer of higher-density sediment with a top layer of lower-density supernatant. Coarse grained sediments (sediments with high percentages of sand/gravel) and consolidated clay sediments settle to the bottom faster than fine grained sediments (unconsolidated silts and clays). If the slurry is pumped into the hopper until the hopper is full, the overall density of the dredged material in the hopper will be about 25 percent solids and 75 percent water (i.e. the same as the incoming slurry). Dredging such a large amount of water and a relatively smaller amount of sediment per load is very inefficient. However, the proportion of solids in each load can be
Figure 1. Hopper Dredge
4
increased if the low-density supernatant is allowed to overflow the hopper and flow back into the water body and the sediment in the incoming slurry continues to settle to the bottom of the hopper. Depending on the composition of the dredged sediments, the proportion of solids retained in each hopper load can increase to as much as 70 to 90 percent. The practice of filling a hopper beyond overflow to achieve a higher density load is referred to as economic loading. The result is fewer loads required to transport the same amount of dredged material, which decreases the overall operating time and, hence, the project cost. Economic loading is most effective when dredging coarse grained sediments or consolidated clay sediments due to higher settling velocities. Conversely, there is less potential for benefits from economic loading of fine-grained sediments due to lower settling velocities. In considering economic loading, potential environmental effects must be reviewed as overflow of the supernatant may result in increased water column turbidity when compared to non-overflow dredging. Therefore, the relationship between dredge production, density of the hopper load, and the rate of material overflow are important variables in maximizing the efficiency of the dredging operation while minimizing environmental impacts. 2.3 Economic Loading with Reach E Channel Sediments Reach E of the DRMCD Project extends from approximately River Mile 5 to River Mile 41.5. Economic loading is being considered for portions of Reach E where channel sediments are greater than or equal to 90 percent coarse grained material. Prior to the signing of the construction agreement (Project Partnership Agreement) for the DRMCD Project, the state environmental resource agencies expressed concerns regarding turbidity, sedimentation of suspended solids, and potential contaminant release from hopper dredge overflow (economic loading) in the vicinity of oyster seedbeds. To address these concerns, the U.S. Army Engineer Research and Development Center (ERDC) conducted a field evaluation of hopper dredge overflow in the Delaware River for the U.S. Army Corps of Engineers (USACE) Philadelphia District (ERDC/EL, 2002). This study is discussed in greater detail in Section 4 of this EA. The study considered both the environmental effects of economic loading and the economic benefits and concluded that economic loading could be conducted in Delaware Bay with minimal adverse environmental impacts and significant economic benefits. Further, since construction of the DRMCD Project began in 2010, it became clear based on inquiries from and discussions with dredging contractors that economic loading was a technique that they would likely use if allowed, with the potential for substantial cost savings. Although the results of the 2002 ERDC study supported the conclusion that economic loading could be conducted in Delaware Bay with minimal adverse environmental impacts, the Corps has not until

5
now proposed using economic loading as concerns were raised during the review of the 2009 EA about the adequacy of the information available to characterize the material in Reach E for economic loading. To address those concerns and in order to confirm the prior material characterization, additional sediment data was collected and analyzed. That analysis reconfirmed the previous nature and distribution of the sediments in Reach E. Therefore, the Corps has revaluated the use of economic loading and has reinitiated coordination with the state environmental resource agencies. The 2002 ERDC study site within Reach E was in the Brandywine Range (Lower Reach E) of the lower Delaware Bay. Sediment samples collected for grain-size distribution at the hopper inflow averaged 84 percent coarse grained material (also referred to as granular material) based on weight of dry solids retained on the No. 200 sieve. The results ranged from 52 to 98 percent. Eliminating the outlier in the dataset, the 52 percent sample, resulted in a coarse grained composition of 92 percent with a range from 86 to 98 percent. During the study event, it took 9 minutes of dredging to reach the overflow capacity within the hopper. During these first 9 minutes, material increased at a rate of 147 yd3/min. Once overflow began, the increase in material loading was determined to be 30 yd3/min. Overflow continued for 57 minutes with a gain of 130 percent realized. At the end of the overflow period, the hopper was fully loaded with granular material. Based on similar past projects, this result was consistent with what was expected of dredging granular material with a hopper dredge using overflow. The coarse grained material settles at a rapid rate, facilitating a significant gain in material within the hopper with overflow as compared to without overflow. Because of the large yields realized at the Brandywine Range site, a rate of return of about 50 to 60 percent may be realized based on the amount of material retained in the hopper and the round-trip travel time required to the placement site. Basically, for every 3 days of non-overflow dredging, approximately the same amount of material can be removed by allowing overflow dredging in a 2-day period. 3.0 Existing Environment (Reach E – Delaware Bay) 3.1 Delaware Bay Environmental Resources The environmental resources of Reach E are adequately described in the 1992 EIS (USACE, 1992), 1997 SEIS (USACE, 1997), the 2009 EA, and 2011 EA (USACE, 2009 and 2011). This information is not repeated here, but is incorporated by reference.
6
3.2 Delaware Bay Sediment Quality In 2002, Region III of the U.S. Environmental Protection Agency published the Mid-Atlantic Integrated Assessment (MAIA) Estuaries 1997 – 98 Summary Report Environmental Conditions in the Mid-Atlantic Estuaries (USEPA, 2002). The summary report reviews the results of an extensive study of estuaries in the mid-Atlantic region of the United States in the summers of 1997-98. The Delaware Estuary was included in this study. Sediment contamination was one focus of the MAIA study. The study measured the concentrations of 91 chemical constituents in sediments, as well as the toxic effects of the sediments on amphipods (crustaceans living in the sediments). The analytes measured include: 1) metals such as arsenic, cadmium, lead, mercury and zinc, which can be toxic at high enough levels; 2) polycyclic aromatic hydrocarbons (PAHs) and aliphatic hydrocarbons, which are petroleum residues and components produced by combustion, as well as biogenic and naturally occurring substances; and 3) synthetic organic chemicals, including polychlorinated biphenyls (PCBs) used in insulators and capacitors, pesticides, and organotins (a component of anti-fouling paint). To characterize the data, sediment concentrations were compared to ERL and ERM values developed by Long et al. (1995). These two values are referred to as effects range-low (ERL) and effects range-median (ERM). Long et al. (1995) state: “The two guideline values, ERL and ERM, delineate three concentration ranges for a particular chemical. The concentrations below the ERL value represent a minimal-effects range; a range intended to estimate conditions in which effects would be rarely observed. Concentrations equal to and above the ERL, but below the ERM, represent a possible-effects range within which effects would occasionally occur. Finally, the concentrations equivalent to and above the ERM value represent a probable-effects range within which effects would frequently occur.” For Delaware Bay, the MAIA summary report shows that approximately 95 percent of the sediments are rated good (no ERL exceedances) for both metals and organic contaminants. The remaining sediments are rated intermediate with some ERL exceedances but no ERM exceedances. In addition to measuring the concentrations of toxic chemicals in sediments, the MAIA study performed several bioassay analyses in which sensitive organisms were exposed directly to the sediments. The MAIA summary report presents the results of a static ten-day assay using the amphipod Ampelisca abdita, a common but ecologically important crustacean that lives in estuarine sediments. All Delaware Bay sediments are characterized as low toxicity with greater than 80 percent survival. Hartwell and Hameedi (2006) summarized results from NOAA’s National Status and Trends Program for marine environmental quality in Delaware Bay. As part of their work, they collected sediment samples from 23 stations within Reach E of Delaware Bay. Sediment samples were analyzed for metals, PAHs, PCBs, chlorinated pesticides, furans and dioxins. In
7
summary they state: “Chemical concentrations in the lower estuary, and coastal zone stations outside of the bay proper were basically uncontaminated beyond trace levels.” Except for one station located close to the shoreline in Maurice River Cove, there were no ERL exceedances. 3.3 Reach C Dredge Monitoring Study In 2010, Reach C (approximately Delaware Memorial Bridge to the mouth of the Chesapeake and Delaware Canal) was deepened from 40 to 45 feet MLLW. Reach C channel sediment was mostly fine grained silts and clays with a coarse grained percentage much less than 90 percent as is proposed for economic loading in Reach E. Two hydraulic cutter suction dredges were used to deepen Reach C. Cutter suction dredges work by pumping a mixture of dredged material and water from the channel bottom directly to an upland CDF via pipeline. The primary component of a cutter suction dredge is the cutterhead, which is a mechanical device with rotating blades or teeth that break up and loosen the bottom material so that it can be pumped through the dredge. The cutterhead is buried in the bottom sediment during operation. Sediment suspended into the water column during the dredging process may result in the release of sediment contaminants, which can then be available for uptake by aquatic organisms. As part of Reach C deepening, periodic water quality monitoring was conducted at the working dredge, at a distance of 200 feet directly down-current, to capture any plume generated by the dredge (Pasquale and Burton, 2011). Water samples were also collected at background locations in the Delaware River for comparison to dredge plume data. Monitoring included the collection of detailed data on total suspended sediments (TSS) and turbidity in the dredge plume and at background locations. Water samples were also collected within the dredge plume and at background locations in the Delaware River for contaminant testing. Samples were analyzed for inorganics, pesticides, PCBs and semi-volatile organics including PAHs. Water samples were analyzed in a laboratory for TSS concentrations. Turbidity data was collected in the field using an YSI water quality meter. Among seven sampling events for TSS and turbidity a total of 157 paired samples were collected. A regression analysis was applied to compare TSS concentrations to turbidity data. With the regression analysis, TSS concentrations could be calculated from the turbidity data collected in the field. During the dredge monitoring study over 16,000 measurements of turbidity were logged at 0.5, 6 and 11 meter depth increments during active dredging 200 feet from the cutterhead. A TSS performance standard of 250 mg/L at a distance of 200 feet down-current of the cutterhead has been established through modeling calculations as a TSS level at which acute water quality criteria for the protection of aquatic life would be met. Based on the regression analysis, this TSS concentration equated to a turbidity reading of 170 nephelometric turbidity units (NTUs).

8
At the point of dredging, essentially no values over 170 NTUs were observed at the surface during active dredging and only a small percentage of the 6 and 11 meter observations were over 170 NTUs. Background measurements had a similar turbidity pattern to that observed at the 11-m depth increment 200 feet behind the working cutterhead. Fourteen percent of the background turbidity measurements were higher than 170 NTUs (primarily recorded from the lower depths), while 9% of the 11-m and 3% of the 6-m turbidity values at the point of dredging were over this benchmark. Water samples collected for chemical analysis at the 6 and 11 meter depth increments indicated that water quality behind the working dredge was maintained. Sample data indicated that during active dredging, contaminants were either not detected, or detected at concentrations similar to those detected in background samples. Considering the fine grained nature of the sediment dredged from Reach C, sediment suspended in the water column by the dredge would settle out of the water column at a slower rate than coarser grained sediments suspended in Reach E during economic loading. Sediment contaminant concentrations would also be higher as Reach C is closer to the industrialized portion of the river than Reach E. Previous sediment quality investigations conducted by the Corps (USACE, 1997) have documented that Reach E channel sediments are very clean. The Reach C dredge monitoring study demonstrated that the dredge did not change Delaware River water quality at 200 feet from the active dredge relative to background. This was true for both TSS and contaminant concentrations in the water column. Based on those results it is concluded that economic loading of Reach E channel sediment greater than 90 percent coarse grained material will not impact water quality. 3.4 Reach E - Delaware Bay Navigation Channel Sediment Grain Size Information regarding sediment grain size was collected during several investigations by the Corps, dating from 1991 to 2013, and included approximately 176 sample locations. The information was reviewed to evaluate the type and distribution of the material present within Reach E. The Dredged Material Characterization for Reach E (available on the project website at www.nap.usace.army.mil/Missions/CivilWorks/DelawareRiverMainChannelDeepening.aspx) presents an overview of the available data and the general distribution of sediments within Reach E. The data shown regarding grain size distribution are similar to the data presented in the 2002 ERDC study (ERDC/EL 2002).
9
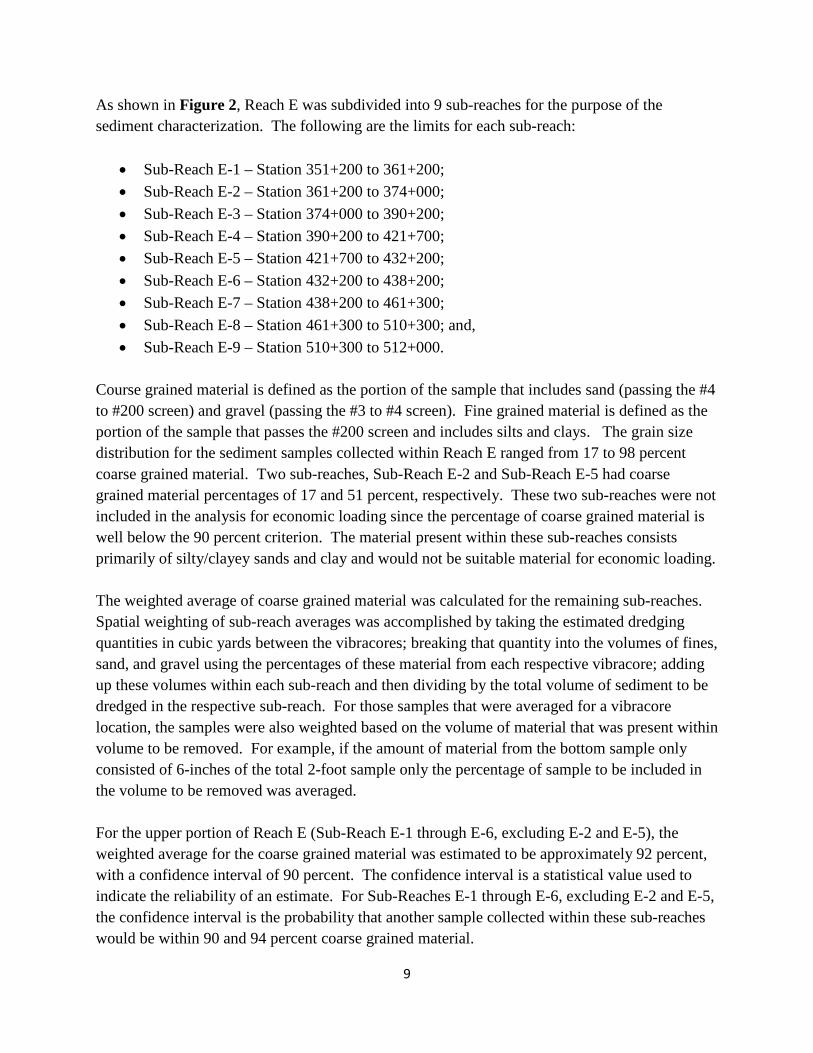
As shown in Figure 2, Reach E was subdivided into 9 sub-reaches for the purpose of the sediment characterization. The following are the limits for each sub-reach:
• Sub-Reach E-1 – Station 351+200 to 361+200; • Sub-Reach E-2 – Station 361+200 to 374+000; • Sub-Reach E-3 – Station 374+000 to 390+200; • Sub-Reach E-4 – Station 390+200 to 421+700; • Sub-Reach E-5 – Station 421+700 to 432+200; • Sub-Reach E-6 – Station 432+200 to 438+200; • Sub-Reach E-7 – Station 438+200 to 461+300; • Sub-Reach E-8 – Station 461+300 to 510+300; and, • Sub-Reach E-9 – Station 510+300 to 512+000.
Course grained material is defined as the portion of the sample that includes sand (passing the #4 to #200 screen) and gravel (passing the #3 to #4 screen). Fine grained material is defined as the portion of the sample that passes the #200 screen and includes silts and clays. The grain size distribution for the sediment samples collected within Reach E ranged from 17 to 98 percent coarse grained material. Two sub-reaches, Sub-Reach E-2 and Sub-Reach E-5 had coarse grained material percentages of 17 and 51 percent, respectively. These two sub-reaches were not included in the analysis for economic loading since the percentage of coarse grained material is well below the 90 percent criterion. The material present within these sub-reaches consists primarily of silty/clayey sands and clay and would not be suitable material for economic loading. The weighted average of coarse grained material was calculated for the remaining sub-reaches. Spatial weighting of sub-reach averages was accomplished by taking the estimated dredging quantities in cubic yards between the vibracores; breaking that quantity into the volumes of fines, sand, and gravel using the percentages of these material from each respective vibracore; adding up these volumes within each sub-reach and then dividing by the total volume of sediment to be dredged in the respective sub-reach. For those samples that were averaged for a vibracore location, the samples were also weighted based on the volume of material that was present within volume to be removed. For example, if the amount of material from the bottom sample only consisted of 6-inches of the total 2-foot sample only the percentage of sample to be included in the volume to be removed was averaged. For the upper portion of Reach E (Sub-Reach E-1 through E-6, excluding E-2 and E-5), the weighted average for the coarse grained material was estimated to be approximately 92 percent, with a confidence interval of 90 percent. The confidence interval is a statistical value used to indicate the reliability of an estimate. For Sub-Reaches E-1 through E-6, excluding E-2 and E-5, the confidence interval is the probability that another sample collected within these sub-reaches would be within 90 and 94 percent coarse grained material.
10
Figure 2. Reach E Economic Loading Sub-Reaches

11
For the lower portion of Reach E (Sub-Reach E-7 through E-9), which includes the material intended for the Broadkill Beach project, the weighted average for the coarse grained material was estimated to be approximately 93 percent, with a confidence interval of 90 percent that another sample collected within E-7 through E-9 would be between 90 and 95 percent coarse grained material. 4.0 Environmental Effects of Economic Loading 4.1 Field Evaluation of Hopper Dredge Overflow for the Delaware River One of the two sites evaluated in the 2002 ERDC study was the Brandywine Range (Lower Reach E) in the lower Delaware Bay (River Mile 17.7). This site was selected as a representative area in the Delaware Bay consisting of predominantly coarse-grained material. The second site was located in the Deepwater Point Range just below the Delaware Memorial Bridge (River Mile 67.9) and was selected to represent a typical fine-grained material. This second site will not be discussed in this EA because it is upstream of Reach E and economic loading is not being considered for this area or for use in fine-grained sediments. 4.1.1 Purpose and Scope of the ERDC Study The following excerpt from the 2002 ERDC report provides the purpose and scope of the study:
The purpose of this study was to evaluate the efficiency of economic loading of a hopper dredge and the physical and chemical characteristics of hopper overflow for the Delaware River dredging project. The study was designed to evaluate the effectiveness of increasing the hopper load during overflow and to determine the physical and chemical characteristics of the overflow into the Delaware River.
The study involved the following activities:
• Loading data collection - measurements of the load in the hopper at and following overflow.
• Characterization of in situ sediment - physical and chemical analysis including elutriate testing.
• Hopper inflow monitoring - physical and chemical analysis.
• Hopper contents monitoring - physical and chemical analysis.

12
• Hopper overflow monitoring - physical and chemical analysis.
• Plume monitoring - physical and chemical analysis; and in situ turbidity measurements.
• Sedimentation assessment - photo imagery of recent sediment deposits.
• Elutriate and Bioassay Testing - elutriate tests and acute toxicity testing on
a fish and a crustacean species were performed for purposes of prediction and potential effects of overflow for the entire project.
These activities provided information to characterize the in situ sediment, hopper inflow as pumped from the draghead, and hopper overflow. Measurement of the material density in the hopper, solids concentration, particle size, and rate of overflow provided information for the development of hopper filling relationships. Elutriate tests were performed to predict the contaminant release back into the water column. These test results were also compared with the data results of the hopper overflow for consistency in sample analysis. Samples taken from the water column defined the relative difference between sediment resuspended by the draghead and that caused by overflow. One overflow and one non-overflow dredge pass or overflow event was monitored in each of the two reaches of the river. 4.1.2 ERDC Field Methods The following excerpt from the 2002 report describes field methods:
Dredging Equipment and Sampling Operations The Dredge McFarland was used on September 15 and 16, 1998, to dredge in the two test reaches. The field sampling and monitoring was conducted during representative hopper operations with and without overflow in both reaches. The tasks described in this technical report were the responsibility of the ERDC, Vicksburg, MS, with support provided by the USAED, Philadelphia. The USAED, Philadelphia, provided the necessary boats and personnel to assist the ERDC in all field monitoring, in situ data collection, and sample collection. ERDC staff members were present at the dredging site during the monitoring effort to direct the field efforts and assist in data and sample collection. ERDC performed all subsequent laboratory testing of samples, data analysis, and report preparation.

13
Dredge Operation Variables At a minimum, it was necessary to have a complete record of the dredge operating variables during the monitoring and sampling periods. In addition to these standard dredge data, the time and duration of overflow during sampling events were recorded along with loading charts using the automated charts of the McFarland. Collection of In Situ Sediment and Site Water On September 14, in situ sediment and site water were collected at the two study sites prior to dredging to provide samples for sediment and water characterization and elutriate testing. Fifteen (15) sediment samples were taken at even intervals in a transect along which the dredge was expected to pass during overflow and non-overflow conditions. Samples were collected with a grab-type apparatus. A 200-ml portion of the sample was retained from each of the 15 samples for water content and density analysis (15 individual analyses). The remaining material of the 15 samples, were composited for sediment and water characterization and elutriate tests. Composited samples were also obtained for elutriate testing from three sampling locations. Thus, five buckets and fifteen 250-ml bottles of sediment were obtained and shipped to the ERDC to characterize the in situ sediment. The five buckets of sediment were further composited to produce a single uniform composite. From this composite, standard elutriate testing was performed using the site water to prepare the samples. Density (or water content) estimates were made on all 15 samples, and the other physical and chemical tests were performed on the composite sediment sample. Hopper Inflow Monitoring The sediment slurry that was picked up by the draghead and transported through the hydraulic suction line was sampled as it entered the hopper (in 3-min intervals during filling and overflow). Grab samples at the inflow port(s) were collected and analyzed for solids concentration and appropriately composited and analyzed for grain size distribution, particle size distribution of fines, and chemical concentrations. The composited samples represented sediment from five equal time intervals during hopper loading.
14
Hopper Contents Monitoring As material is pumped into the hoppers, a layer of high-density settled material is formed in the lower portion of the hopper with a layer of water with suspended material in the upper portion of the hopper. The vertical distribution of suspended material density or concentration in the upper portion of the hopper was measured. These data, in conjunction with overflow concentration data, can be used to determine when an economic load is achieved and when material density in the hopper is at a maximum. A second use for hopper vertical density measurements is to examine the potential for equipment modification, such as introducing settling tubes to enhance settling rates of solids in hopper bins. Hopper sampling at three depths was taken at the beginning of overflow and at the end of overflow. Three locations in the hopper were sampled. Hopper Overflow Monitoring Because of the variability in solids concentration at the hopper overflow, 40 samples were taken to determine suspended solids for each overflow period. Samples were composited for chemical contaminant determination of chemical concentrations, grain size, particle size distribution of fines, and toxicity testing.
Plume Monitoring Plume monitoring provided an evaluation of the amount of sediment in the water column resuspended by the operating draghead vs. the amount of sediment contributed by overflow. Data on plume concentrations as a function of distance and time provided information to determine an appropriate buffer distance from the oyster beds in which overflow should be restricted. Differentiation between the magnitude of sediment plumes caused by the draghead and plumes from overflow materials required monitoring both overflow and non-overflow periods. Monitoring one dredge pass without overflow and one dredge pass with overflow was the minimal plume monitoring effort. To reduce the variability of results between tests, the dredge was required to be moving in the same direction relative to the current flow for every overflow and non-overflow test monitored. Plume monitoring also provided information on contaminant dispersion in the water column. Plume monitoring required two boats. One boat was positioned behind the hopper dredge in its path immediately after it passed and began sampling the water column to evaluate the rate of settling of the plume. The other boat towed a turbidimeter (in situ-type probe) across the plume to give information on lateral plume dispersion. Thus, the duration and geometry of the plume could be
15
estimated. Both boats in the monitoring area carried out background sampling immediately before the dredging began. Lateral plume dispersion measurements were made at mid-depth by locating the turbidimeter probe at the midpoint of the water column. Background turbidity was extensively measured. The boat towing the turbidimeter monitored distance from the dredge, using a range finder and hand bearing compass, and distance from the anchored sample boat. The whole plume was traversed, going outside of the plume at each extreme of the turbidity plume. While the mobile boat was measuring lateral plume dispersion, the anchored boat measured decay of the plume as it settled through the water column. Water samples were taken at the surface (less than 1 m deep), mid-depth, and near bottom (within 1 to 2 m of the bottom). Fifteen samples at three depths for a 50-min period were taken to characterize background total suspended solids (TSS) conditions, and about 30 samples at three depths in a 30-min time frame were taken to characterize the overflow plume after the dredging pass. The latter sampling protocol was also used for the non-overflow sediment plume measurements. TSS was measured for all plume samples and a compositing scheme was used to reduce the number of samples for chemical analysis. Three composite samples for the plume monitoring were obtained (one at each of the three depths) by mixing portions of the samples taken at all three depths over one-third of the plume monitoring effort. Chemical analysis included heavy metals, PCBs, and PAHs and provided data on potential contamination of the water column by the dredging operation. Sedimentation Assessment One difficulty in assessing potential impacts of sedimentation resulting from hopper overflow is detection of thin overburdens in habitats in the vicinity of the dredging operation. Although thin (<5 cm) overburdens could have detrimental impacts, for example on the settlement and attachment of oyster larvae, this exceeds the detection limits of most conventional techniques. One method effective in measuring sedimentation events of less than 1 cm is sediment-profiling imagery using a sediment profile camera. This technique involves insertion of a prism into the substrate through which images of the sediment-water interface are obtained. The images provide rapid, accurate measures of recent sedimentation, particularly if the overburden sediments are dissimilar from the ambient substrate. The images also provide indications of impacts to benthic communities (e.g., distribution and position of annelid worms and bivalve mollusks relative to the relict and overburden surface) and changes in physical/chemical conditions of the sediment (e.g., altered redox potential discontinuity, evidence of hypoxia). This camera system is unaffected by ambient
16
turbidity. An attached plan-view underwater camera also provided photographs at the sediment profile stations. The sediment profiling camera system was deployed at the Delaware River overflow operation site. Because the area is tidally influenced, stations were occupied both up and down current from the dredging project. Stations were allocated to gather information for transects across several cross sections of the river reach potentially influenced by overflow, including any charted oyster bars. Bioassay Samples were taken at the hopper overflow for use in a 96-hr water column bioassay. This portion of the study will help in determining the possible biological effects of water column exposure to Delaware River sediment.
4.1.3 ERDC Study Findings The following sections summarize the findings of the hopper dredge overflow study. 4.1.3.1 Background Sediment and Water Quality Background water chemical concentrations were compared with the contaminants of concern as listed in the acute marine objectives for toxic pollutants for the protection of aquatic life in the Delaware River estuary. This information was found in the Delaware River Basin Commission West Trenton, New Jersey, Administrative Manual-Part III, Water Quality Regulations, with Amendments Through December 8, 2010. The only parameter above the marine acute criterion for protection of aquatic life was background dissolved copper. The criterion for copper is 4.8 μg/l, and the background value was 13 μg/l. Background sediment chemical concentrations did not identify any contaminants of concern. Similar to (USEPA, 2002) and (Hartwell and Hameedi, 2006), all contaminant concentrations were below ERL values (Long et al., 1995). 4.1.3.2 Hopper Sediment Density Monitoring Suspended solids concentrations in the hopper at the coarse-grained site were <15 g/l. This indicates that settling was occurring very rapidly. Although the samples should be representative of the water column, it should be realized that the agitation occurring inside the hopper will keep the material in suspension for an extended period of time. Therefore, when the sample was collected, the material being agitated quickly settled and was not collected in the 250-ml sample bottle.
17
4.1.3.3 Hopper Overflow Monitoring Samples collected for grain-size distribution during hopper overflow averaged 81.1 percent sand with a range from 24.4 to 96.1 percent. Composites of five samples were obtained and the average grain-size distribution was 78.1 percent with a range from 66.7 to 87.7 percent. This shows that a large amount of the sandy material was being agitated in the hopper and being washed out during overflow. This is consistent with the loading data that show a loading of about 147 yd3/min before overflow and an average loading of about 30 yd3/min over the 57-min period during overflow. However, the rate of loading in the initial stages of overflow was likely much higher with the material in the overflow increasing as the hopper filled and retention time was decreased. None of the chemistry parameters analyzed in the overflow samples collected at the coarse-grained site exceeded marine acute objectives for protection of aquatic life as listed in the Delaware River Basin Water Quality Regulations for dissolved criteria limits, except dissolved copper. Although the background value for copper (13 μg/l) exceeded the criterion (4.8 μg/l), the dissolved value for copper in the overflow was 5 μg/l, indicating a scavenging of metals by the suspended material during dredging with overflow. 4.1.3.4 Plume Monitoring Monitoring of the sediment plumes was accomplished using a boat-mounted 1,200-kHz Broad-Band Acoustic Doppler Current Profiler (ADCP). The instrument collects velocity vectors in the water column together with backscatter levels to determine the position and relative intensity of the sediment plume. Along with the ADCP, a MicroLite recording instrument with an Optical Backscatterance (OBS) Sensor was towed by the vessel at a depth of 15 ft. The MicroLite recorded data at 0.5-sec intervals. Navigation data for monitoring were obtained by a Starlink differential Global Positioning System (GPS). The GPS monitors the boat position from the starting and ending points along each transect. Transects were monitored to obtain the background levels of suspended materials prior to dredging activities. A period of 8 minutes following the dredge passing during non-overflow dredging showed the level of suspended material to be returning to background levels. No lateral dispersion of the plume out of the channel was observed during the non-overflow dredging operation. During overflow dredging, a wider transect was performed to determine the lateral extent of the plume. No significant change above background levels could be detected. At 1-hr elapsed time following the end of the overflow dredging operation, the levels of suspended material returned

18
to background conditions. Again, no lateral dispersion of the plume out of the channel area was observed. 4.1.3.5 Sediment Profile Camera Results Sediment profile images from a total of 14 stations were analyzed. There was evidence that recent sedimentation had occurred at several of the stations within the channel, possibly a result of the dredging operations. Gray colored suspended material, indicative of hopper overflow material, was observed at two of the stations. Four of the stations had layering from grain size changes but are assumed to have occurred because of normal sediment transport processes rather than hopper overflow operations. There was no indication of newly deposited dredged material at stations outside the edge of the navigation channel. Although the sampling station coverage was not extensive, the risk of significant sedimentation as a consequence of the hopper dredging operations appears to be restricted to the bottom and side slopes of the channel. 4.1.3.6 Standard Elutriate Test Results The standard elutriate analysis was performed using the composited insitu sediment and site water. The purpose of the standard elutriate testing was to gain data on possible application of the test for prediction of overflow contaminant concentrations. The mean predicted dissolved values from the elutriates were calculated using the EFQUAL computer program, a module of the ADDAMS software package (Palermo and Schroder, 1991). The elutriate test was conducted using standard procedures (USEPA and USACE, 1998). Background dissolved copper was the only contaminant of concern that was predicted to be above DRBC marine acute criteria for protection of aquatic life. The program predicted that copper would be discharged at 7 micrograms per liter (μg/l) which is above the marine objective but well below the background value of 13 μg/l. Therefore, a dilution of the background with respect to copper would naturally occur as a result of the dredging operation, and a mixing zone would not be required. The actual value recorded at the hopper overflow (effluent) for copper was 5 μg/l, which was below the background and slightly above the criterion of 4.8 μg/l. 4.1.3.7 96-Hour Water Column Bioassay This test was performed to determine the possible biological effects of water column exposure to Delaware Bay overflow. Two species were used in performing the bioassays, the mysid shrimp, a crustacean species, Mysidopsis bahia, and the inland silverside, a fish species, Menidia beryllina. These species were selected based on conversations with personnel from the Delaware Department of Natural Resources and Environmental Control. The filtered elutriate was diluted with standard laboratory control seawater (30-ppt salinity) to yield the following concentrations:
19
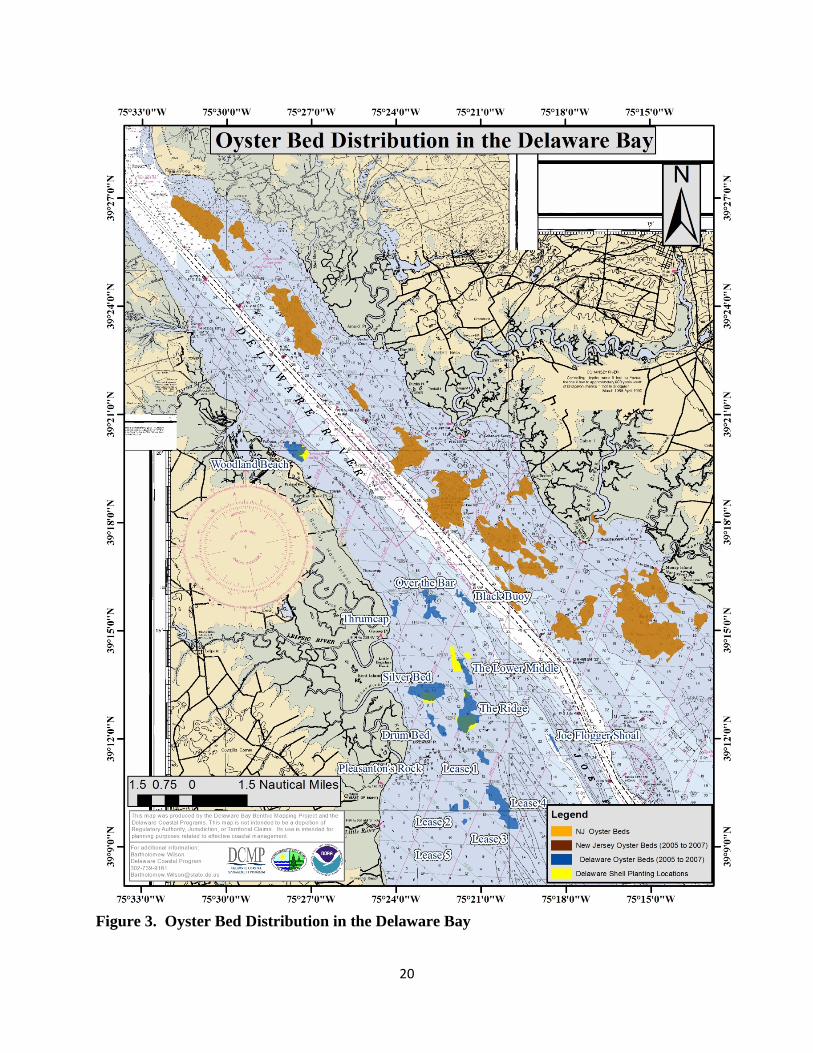
0-, 6.25-, 12.5-, 25-, 50-, and 100-percent elutriate. Each treatment was replicated five times. The trimmed Spearman-Karber method was used to calculate Lethal Concentration 50 (LC50) values. Survival in test concentrations ranged from 100 to 88 percent for Mysidopsis bahia and from 88 to 68 percent for Menidia beryllina. Exposures in elutriate test concentrations from the site did not adversely affect survival of either test species. Since neither test species had mortality values greater than 50 percent, an LC50 value could not be calculated. 4.1.4 Potential Impacts to Oyster Beds Resulting From Economic Loading Turbidity generated by a hopper dredge working in the Delaware Bay Federal channel is a concern where the channel is in close proximity to oyster beds. Figure 3 was provided by the Delaware Department of Natural Resources and Environmental Control (DNREC) to show oyster bed distribution in Delaware Bay. Oysters are broadcast spawners, meaning they release eggs and sperm into the water column. Fertilized eggs develop into planktonic (free-swimming) larvae. After a period of growth, a foot develops and the larvae settle to the bottom of the water column where they seek a hard substrate (cultch). When a suitable surface (ideally adult oyster shell) is located, the larvae cement themselves and grow to the adult form. Sediment accumulation on oyster beds reduces the ability of the bed to provide the appropriate substrate for larvae to successfully set. Elevated suspended solids concentrations in the water column could also have a detrimental impact on filter feeding organisms such as oysters. The amount of turbidity generated and the distribution of that turbidity resulting from economic loading was addressed as part of the ERDC study. Section 4.1.3.4 discusses the plume monitoring results from that study. The findings of plume monitoring were: (1) no lateral dispersion of a plume outside of the channel was observed as a result of economic loading; (2) at the surface, mid-depth and bottom there was no significant difference in solids concentrations measured with and without economic loading; and (3) all solids concentrations measured with and without economic loading fell within the total minimum and maximum range measured in the background prior to dredging. As can be seen on Figure 3, there are no oyster beds in State of Delaware waters in close proximity to the Delaware River main channel. The closest bed, Black Buoy, is more than 0.5 nautical miles away. Based on the findings of the ERDC plume monitoring study and the location of the oyster beds, there is no concern that economic loading will result in sediment accumulation on State of Delaware beds. In State of New Jersey waters, the majority of beds are also considerably distant from the Delaware River main channel. While the outer edges of the Ship John bed and a small portion of the Shell Rock bed are mapped close to the channel, the plume monitoring study found no difference between background and economic loading
20
Figure 3. Oyster Bed Distribution in the Delaware Bay
21
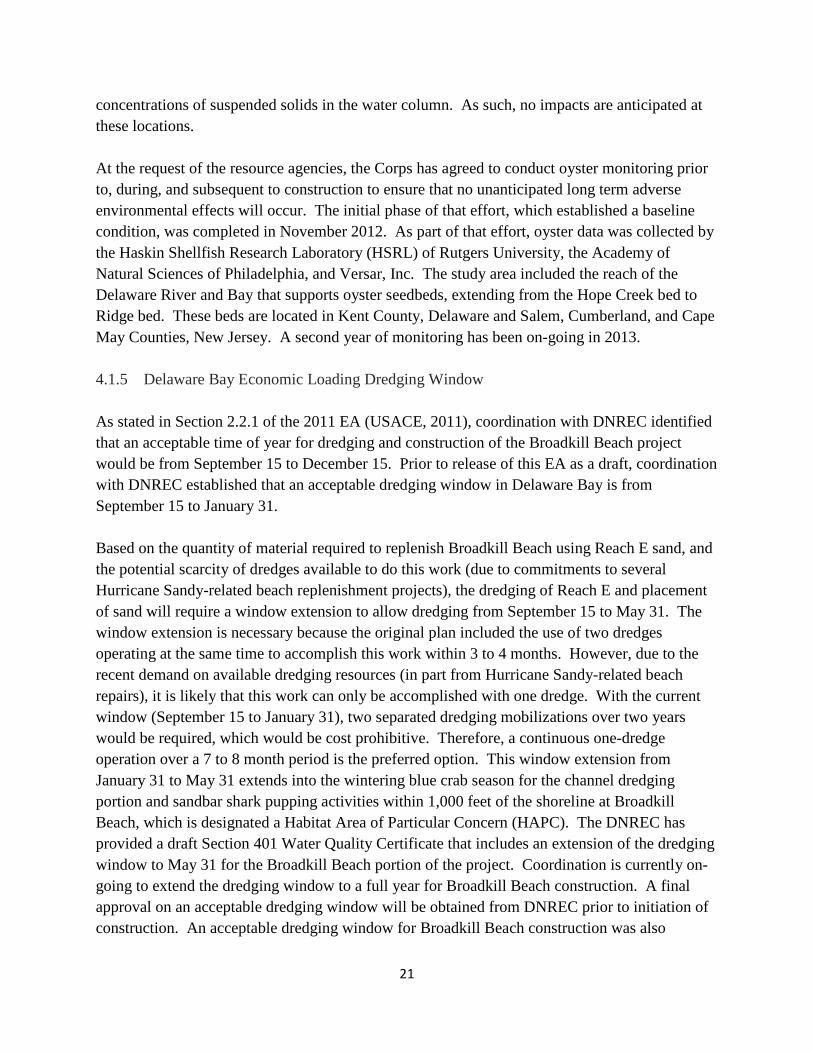
concentrations of suspended solids in the water column. As such, no impacts are anticipated at these locations. At the request of the resource agencies, the Corps has agreed to conduct oyster monitoring prior to, during, and subsequent to construction to ensure that no unanticipated long term adverse environmental effects will occur. The initial phase of that effort, which established a baseline condition, was completed in November 2012. As part of that effort, oyster data was collected by the Haskin Shellfish Research Laboratory (HSRL) of Rutgers University, the Academy of Natural Sciences of Philadelphia, and Versar, Inc. The study area included the reach of the Delaware River and Bay that supports oyster seedbeds, extending from the Hope Creek bed to Ridge bed. These beds are located in Kent County, Delaware and Salem, Cumberland, and Cape May Counties, New Jersey. A second year of monitoring has been on-going in 2013. 4.1.5 Delaware Bay Economic Loading Dredging Window As stated in Section 2.2.1 of the 2011 EA (USACE, 2011), coordination with DNREC identified that an acceptable time of year for dredging and construction of the Broadkill Beach project would be from September 15 to December 15. Prior to release of this EA as a draft, coordination with DNREC established that an acceptable dredging window in Delaware Bay is from September 15 to January 31. Based on the quantity of material required to replenish Broadkill Beach using Reach E sand, and the potential scarcity of dredges available to do this work (due to commitments to several Hurricane Sandy-related beach replenishment projects), the dredging of Reach E and placement of sand will require a window extension to allow dredging from September 15 to May 31. The window extension is necessary because the original plan included the use of two dredges operating at the same time to accomplish this work within 3 to 4 months. However, due to the recent demand on available dredging resources (in part from Hurricane Sandy-related beach repairs), it is likely that this work can only be accomplished with one dredge. With the current window (September 15 to January 31), two separated dredging mobilizations over two years would be required, which would be cost prohibitive. Therefore, a continuous one-dredge operation over a 7 to 8 month period is the preferred option. This window extension from January 31 to May 31 extends into the wintering blue crab season for the channel dredging portion and sandbar shark pupping activities within 1,000 feet of the shoreline at Broadkill Beach, which is designated a Habitat Area of Particular Concern (HAPC). The DNREC has provided a draft Section 401 Water Quality Certificate that includes an extension of the dredging window to May 31 for the Broadkill Beach portion of the project. Coordination is currently on-going to extend the dredging window to a full year for Broadkill Beach construction. A final approval on an acceptable dredging window will be obtained from DNREC prior to initiation of construction. An acceptable dredging window for Broadkill Beach construction was also
22
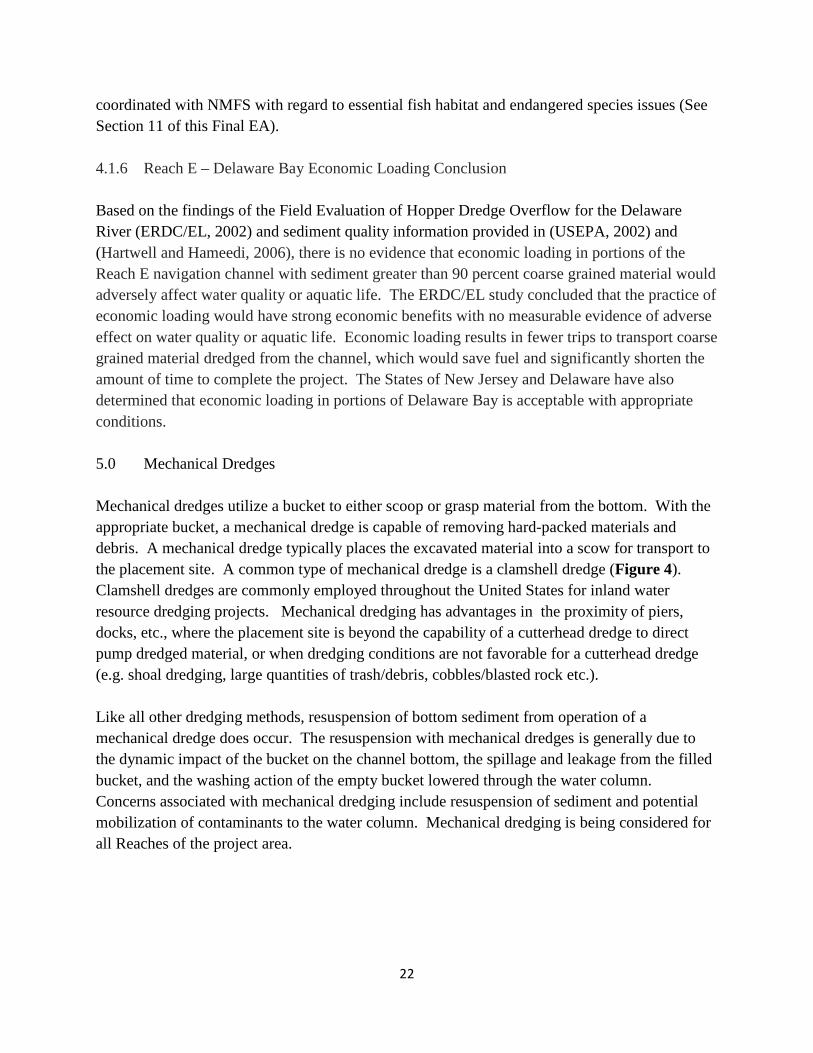
coordinated with NMFS with regard to essential fish habitat and endangered species issues (See Section 11 of this Final EA). 4.1.6 Reach E – Delaware Bay Economic Loading Conclusion Based on the findings of the Field Evaluation of Hopper Dredge Overflow for the Delaware River (ERDC/EL, 2002) and sediment quality information provided in (USEPA, 2002) and (Hartwell and Hameedi, 2006), there is no evidence that economic loading in portions of the Reach E navigation channel with sediment greater than 90 percent coarse grained material would adversely affect water quality or aquatic life. The ERDC/EL study concluded that the practice of economic loading would have strong economic benefits with no measurable evidence of adverse effect on water quality or aquatic life. Economic loading results in fewer trips to transport coarse grained material dredged from the channel, which would save fuel and significantly shorten the amount of time to complete the project. The States of New Jersey and Delaware have also determined that economic loading in portions of Delaware Bay is acceptable with appropriate conditions. 5.0 Mechanical Dredges Mechanical dredges utilize a bucket to either scoop or grasp material from the bottom. With the appropriate bucket, a mechanical dredge is capable of removing hard-packed materials and debris. A mechanical dredge typically places the excavated material into a scow for transport to the placement site. A common type of mechanical dredge is a clamshell dredge (Figure 4). Clamshell dredges are commonly employed throughout the United States for inland water resource dredging projects. Mechanical dredging has advantages in the proximity of piers, docks, etc., where the placement site is beyond the capability of a cutterhead dredge to direct pump dredged material, or when dredging conditions are not favorable for a cutterhead dredge (e.g. shoal dredging, large quantities of trash/debris, cobbles/blasted rock etc.). Like all other dredging methods, resuspension of bottom sediment from operation of a mechanical dredge does occur. The resuspension with mechanical dredges is generally due to the dynamic impact of the bucket on the channel bottom, the spillage and leakage from the filled bucket, and the washing action of the empty bucket lowered through the water column. Concerns associated with mechanical dredging include resuspension of sediment and potential mobilization of contaminants to the water column. Mechanical dredging is being considered for all Reaches of the project area.

23
Figure 4. Clamshell Dredge
6.0 Existing Environment (Delaware River Main Channel Deepening Project Area) 6.1 Delaware River Main Channel Deepening Project Area Environmental Resources The environmental resources of the project area are adequately described in the 1992 Environmental Impact Statement (USACE, 1992), 1997 Supplemental Environmental Impact Statement (USACE, 1997), and the 2009 and 2011 Environmental Assessments (USACE, 2009 and 2011). This information is not repeated here, but is incorporated by reference. 6.2 Delaware River Main Channel Deepening Project Area Sediment Quality Navigation channel sediment contaminant levels are most comprehensively discussed in the 1997 Supplemental Environmental Impact Statement (USACE, 1997). A more recent discussion is provided in the 2009 Environmental Assessment (USACE, 2009). This information is not repeated here, but is incorporated by reference. 7.0 Environmental Effects of Mechanical Dredging within the Delaware River Main Channel Deepening Project Area 7.1 Delaware River Basin Fish and Wildlife Management Cooperative Recommended Mechanical Dredging Restrictions

24
7.1.1 Delaware Bay Mouth to River Mile 32 Prior to release of this EA as a draft, coordination with DNREC established that an acceptable dredging window in Delaware Bay is from September 15 to January 31. See Section 4.1.5 for additional discussion on an acceptable dredging window for construction of the Broadkill Beach portion of the project. 7.1.2 Delaware Memorial Bridge to Betsy Ross Bridge The Delaware River Basin Fish and Wildlife Management Cooperative recommends a mechanical dredging restriction from March 15 to June 30 to protect Atlantic sturgeon, striped bass, American shad and river herring. This restriction applies to Reaches AA, A, and B of the project area. The Delaware Estuary provides a migratory pathway and spawning, nursery, and forage habitat for a number of anadromous and catadromous fishes including American shad, alewife, blueback herring, American eel, and striped bass. Striped bass and possibly American shad spawn in this reach of the Delaware River and its tributaries. It is also crucial juvenile nursery habitat for these as well as other important species of fish. The major striped bass spawning habitat is located throughout this section of the river while American shad spawning is not as well delineated (Delaware River Basin Fish and Wildlife Management Cooperative, Fisheries Technical Committee, 2011). Based upon the knowledge of spawning seasons for striped bass, American shad and river herring, the Delaware River Basin Fish and Wildlife Management Cooperative, Fisheries Technical Committee recommends that mechanical dredging should be avoided from 15 March to 30 June from the Delaware Memorial Bridge to the Betsy Ross Bridge. The New York Bight Distinct Population Segment of Atlantic sturgeon, which includes the Delaware River population, was Federally-listed as endangered in February 2012. Atlantic sturgeon are known to inhabit the Delaware River year-round. The Delaware River between the Delaware Memorial Bridge and the Betsy Ross Bridge has been shown to be an important nursery area for juvenile Atlantic sturgeon (Environmental Research and Consulting, 2012). Spawning is thought to occur in this area in April and May (NMFS, 2012). For these reasons the Delaware River Basin Fish and Wildlife Management Cooperative, Fisheries Technical Committee also recommends that mechanical dredging should be avoided from March 15 to June 30 from the Delaware Memorial Bridge to the Betsy Ross Bridge. Therefore, to protect Atlantic sturgeon, striped bass, American shad and river herring, no mechanical dredging will occur in Reaches AA, A, and B of the project area from March 15 to June 30.
25
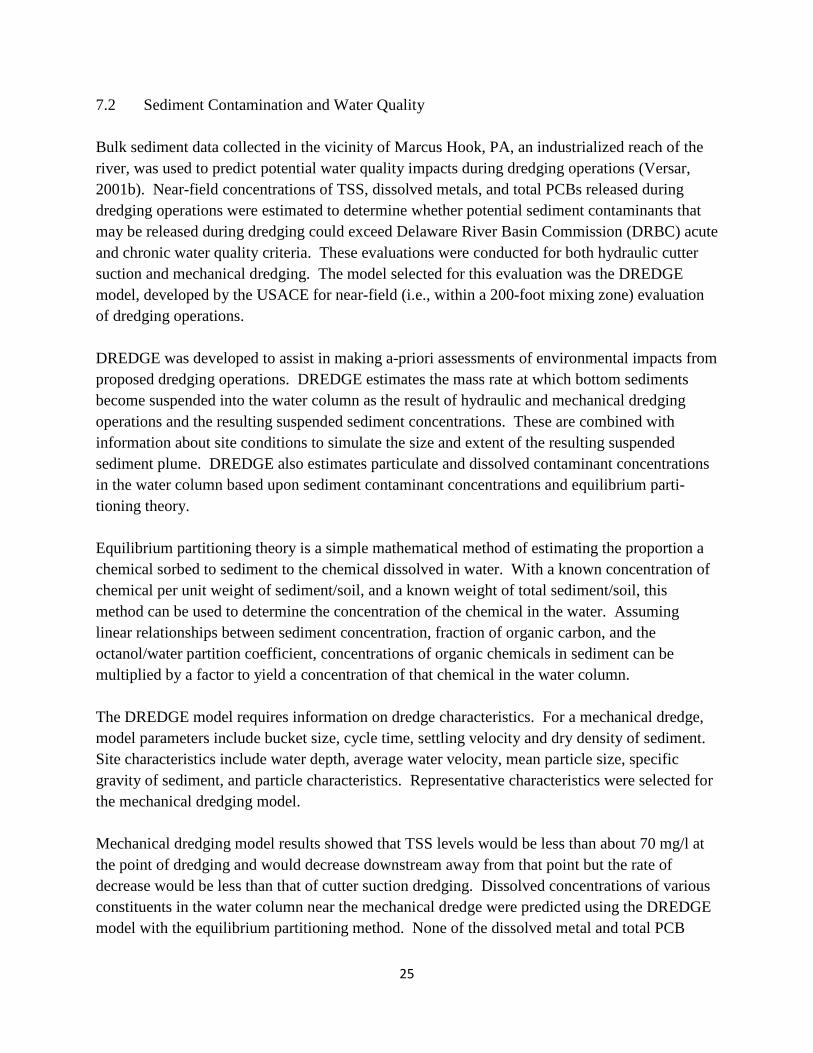
7.2 Sediment Contamination and Water Quality Bulk sediment data collected in the vicinity of Marcus Hook, PA, an industrialized reach of the river, was used to predict potential water quality impacts during dredging operations (Versar, 2001b). Near-field concentrations of TSS, dissolved metals, and total PCBs released during dredging operations were estimated to determine whether potential sediment contaminants that may be released during dredging could exceed Delaware River Basin Commission (DRBC) acute and chronic water quality criteria. These evaluations were conducted for both hydraulic cutter suction and mechanical dredging. The model selected for this evaluation was the DREDGE model, developed by the USACE for near-field (i.e., within a 200-foot mixing zone) evaluation of dredging operations. DREDGE was developed to assist in making a-priori assessments of environmental impacts from proposed dredging operations. DREDGE estimates the mass rate at which bottom sediments become suspended into the water column as the result of hydraulic and mechanical dredging operations and the resulting suspended sediment concentrations. These are combined with information about site conditions to simulate the size and extent of the resulting suspended sediment plume. DREDGE also estimates particulate and dissolved contaminant concentrations in the water column based upon sediment contaminant concentrations and equilibrium parti-tioning theory. Equilibrium partitioning theory is a simple mathematical method of estimating the proportion a chemical sorbed to sediment to the chemical dissolved in water. With a known concentration of chemical per unit weight of sediment/soil, and a known weight of total sediment/soil, this method can be used to determine the concentration of the chemical in the water. Assuming linear relationships between sediment concentration, fraction of organic carbon, and the octanol/water partition coefficient, concentrations of organic chemicals in sediment can be multiplied by a factor to yield a concentration of that chemical in the water column. The DREDGE model requires information on dredge characteristics. For a mechanical dredge, model parameters include bucket size, cycle time, settling velocity and dry density of sediment. Site characteristics include water depth, average water velocity, mean particle size, specific gravity of sediment, and particle characteristics. Representative characteristics were selected for the mechanical dredging model. Mechanical dredging model results showed that TSS levels would be less than about 70 mg/l at the point of dredging and would decrease downstream away from that point but the rate of decrease would be less than that of cutter suction dredging. Dissolved concentrations of various constituents in the water column near the mechanical dredge were predicted using the DREDGE model with the equilibrium partitioning method. None of the dissolved metal and total PCB

26
concentrations were above DRBC acute or chronic water quality criteria, even using the maximum sediment concentrations used in the model. As a much more conservative approach, TSS predictions from the DREDGE model were used to estimate dissolved metal values, assuming 80% of the metal sorbed to sediment may become dissolved upon suspension into the water column. No metals were predicted to exceed any criterion level at any point in the model, using this approach. Thus, even with a very conservative estimation approach, no metals would exceed water quality criteria outside of a 60-meter mixing zone or at the point of dredging. 7.3 Mechanical Dredging within the Delaware River Main Channel Deepening Project Area Conclusion Based on the results of the DREDGE model and following Delaware River Basin Fish and Wildlife Management Cooperative, Fisheries Technical Committee recommended dredging restrictions for protection of fishery resources in the Delaware River and Bay, it is concluded that the use of mechanical dredges for the DRMCD Project is an acceptable practice. 8.0 Fort Mifflin Confined Disposal Facility (CDF) 8.1 Fort Mifflin Location The Fort Mifflin CDF is located in Southeast Pennsylvania in Philadelphia County. The site is at the confluence of the Schuylkill and Delaware Rivers on the former Hog Island. The facility and all of its operations are entirely within Federally-owned property. The Fort Mifflin CDF has been used as a dredged material placement site since the late 18th century. 8.2 CDF Operation and Description A CDF is simply a large settling basin designed to accept and dewater dredged material. When in operation, a mixture of dredged material and water is pumped into one end of the CDF. As the mixture flows through the CDF, the solids settle to the bottom and the water flows to the discharge location where it flows back into the river. Often baffle dikes are constructed within the cells of the CDF to lengthen the path the dredged material mixture must take to reach the discharge location. This increases the settling time and, thus, increases the efficiency of the CDF in dewatering the material. Water pumped with the dredged material must be contained in the CDF until sufficient solids settle out to allow the discharge to meet specified conditions. Heavier, coarser-grained sands and gravels drop out of the water column close to where material enters the CDF. As the water moves through the CDF it slows, allowing finer-grained sediment particles to settle out. Finally, water reaches the weir and is discharged from the site. The purpose of the weir structure is to regulate the release of ponded water from the CDF. Proper weir design and operation can control potential resuspension and release of solids. As the height

27
of the weir is increased, the depth of the pond increases and only the cleaner surface waters of the pond are released. 8.2.1 Fort Mifflin CDF Description The Fort Mifflin CDF is divided into three cells. Cells A, B and C are 85, 82 and 80 acres in size, respectively. Cells A and B discharge water to the Schuylkill River; Cell C discharges to the Delaware River. Each cell has a baffle dike to increase the residence time that water remains in the cells allowing suspended sediment to settle out of the water before discharge occurs. The surface of the three cells are covered with dense vegetation, primarily weeds, phragmites, and brush. Vegetation slows water movement, which also facilitates settling of suspended sediment. 8.2.2 Fort Mifflin CDF Utilization The Fort Mifflin CDF is an active site and has been used on an almost annual basis for decades. In between uses, the cells are ditched to promote drainage of excess water. Water drainage facilitates drying of recently placed dredged material and enhances storage capacity within each cell as the dried material consolidates. Periodically, dikes have been raised using the dredged material from the interior of the cells to increase the dike height and the resulting cell capacity. 8.2.3 Fort Mifflin Dredged Material Capacity The Fort Mifflin CDF is primarily used for disposal of material from Schuylkill River maintenance dredging. In order to ensure sufficient available capacity for the Schuylkill River project, the Corps had previously determined that the Fort Mifflin CDF could be used for the DRMCD Project only for the disposal of rock removed in the vicinity of Marcus Hook, Pennsylvania. However, because of the continued decline of maintenance requirements for the Schuylkill River project, the Corps reevaluated the available capacity at the Fort Mifflin CDF to determine if the site could be used for placement of additional dredged material from the DRMCD Project. An updated capacity analysis showed that the Fort Mifflin CDF has in excess of 9.8 million cubic yards (MCYs) of capacity and over 70 years of existing life. Placing up to 2 MCYs of material from the initial construction of the DRMCD Project has little impact on the 50 year life requirements for the Schuylkill River project (i.e. with the 2 MCYs from the DRMCD Project the service life is 72 years, without the additional 2 MCYs of material the service life is 78 years). Thus, the use of the Fort Mifflin CDF for placement of dredged material from DRMCD Project will have negligible impact on the management and future use of the facility.
28
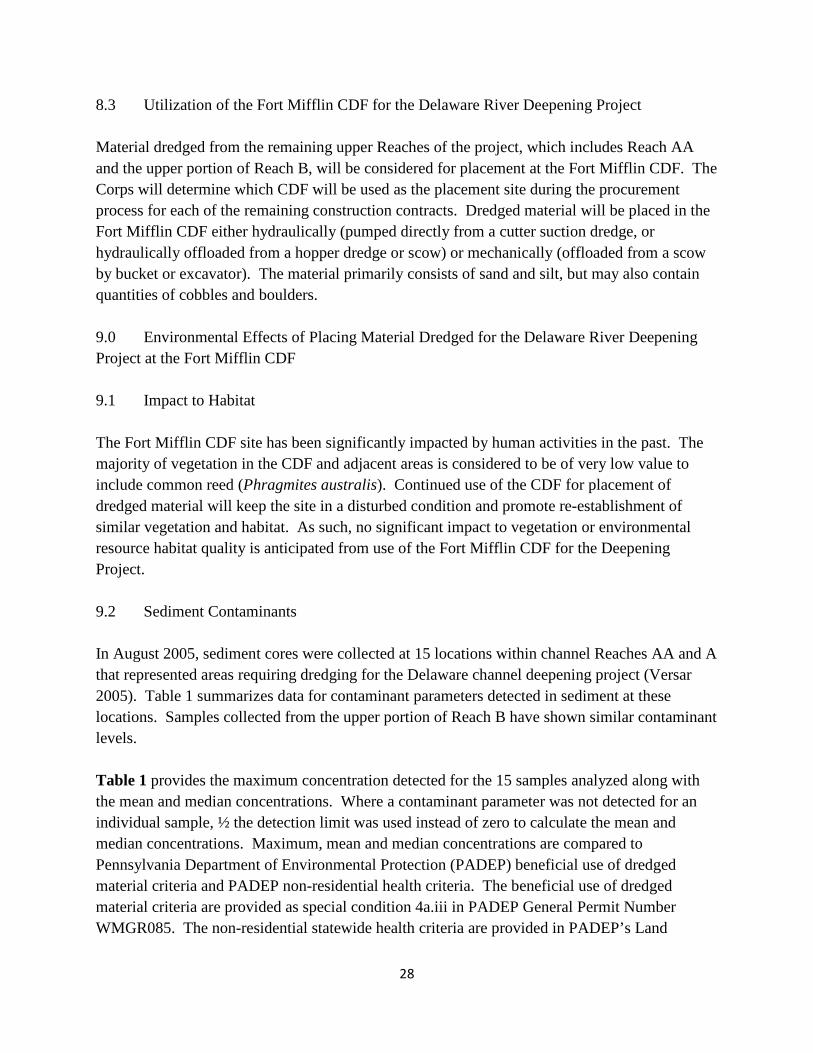
8.3 Utilization of the Fort Mifflin CDF for the Delaware River Deepening Project Material dredged from the remaining upper Reaches of the project, which includes Reach AA and the upper portion of Reach B, will be considered for placement at the Fort Mifflin CDF. The Corps will determine which CDF will be used as the placement site during the procurement process for each of the remaining construction contracts. Dredged material will be placed in the Fort Mifflin CDF either hydraulically (pumped directly from a cutter suction dredge, or hydraulically offloaded from a hopper dredge or scow) or mechanically (offloaded from a scow by bucket or excavator). The material primarily consists of sand and silt, but may also contain quantities of cobbles and boulders. 9.0 Environmental Effects of Placing Material Dredged for the Delaware River Deepening Project at the Fort Mifflin CDF 9.1 Impact to Habitat The Fort Mifflin CDF site has been significantly impacted by human activities in the past. The majority of vegetation in the CDF and adjacent areas is considered to be of very low value to include common reed (Phragmites australis). Continued use of the CDF for placement of dredged material will keep the site in a disturbed condition and promote re-establishment of similar vegetation and habitat. As such, no significant impact to vegetation or environmental resource habitat quality is anticipated from use of the Fort Mifflin CDF for the Deepening Project. 9.2 Sediment Contaminants In August 2005, sediment cores were collected at 15 locations within channel Reaches AA and A that represented areas requiring dredging for the Delaware channel deepening project (Versar 2005). Table 1 summarizes data for contaminant parameters detected in sediment at these locations. Samples collected from the upper portion of Reach B have shown similar contaminant levels. Table 1 provides the maximum concentration detected for the 15 samples analyzed along with the mean and median concentrations. Where a contaminant parameter was not detected for an individual sample, ½ the detection limit was used instead of zero to calculate the mean and median concentrations. Maximum, mean and median concentrations are compared to Pennsylvania Department of Environmental Protection (PADEP) beneficial use of dredged material criteria and PADEP non-residential health criteria. The beneficial use of dredged material criteria are provided as special condition 4a.iii in PADEP General Permit Number WMGR085. The non-residential statewide health criteria are provided in PADEP’s Land

29
Table 1. Delaware River Bulk Sediment Data Collected in Reaches AA and A of the Main Channel Deepening Project
PADEP PADEP
Beneficial
Use Non-
Residential
Parameter Max. Conc.
Mean Conc.
Median Conc. Criteria
Health Criteria
Arsenic 13.4 5.12 5.17 41 53 Barium 156 67.70 74.2 5000 190000 Beryllium 1.22 0.65 0.75 6.0 5600 Cadmium 5.69 0.84 0.28 39 1400 Chromium 104 33.98 33.4 2500 8400 Copper 91.3 18.56 8.76 1500 100000 Lead 141 23.44 8.82 200 1000 Mercury 0.297 0.050 0.016 20 450 Nickel 31.7 17.08 20.2 420 56000 Selenium 0.815 0.71 0.71 60 14000 Silver 2.34 0.49 0.14 5.0 14000 Thallium 5.33 1.92 1.72 6.0 200 Vanadium 53 29.50 34.2 72 20000 Zinc 525 105 51.7 2800 190000 Heptachlor Epoxide 0.074 0.006 0.0007 0.5 8.7 DDD 0.0022 0.0019 0.0014 20 330 DDE 0.47 0.047 0.0014 10 230 PCB-1248 0.87 0.112 0.045 4.0 40 PCB-1254 0.99 0.090 0.014 4.0 40 PCB-1260 0.66 0.098 0.045 4.0 40 2-Methylnaphthalene 0.067 0.042 0.028 20 11000 4-Chloroaniline 0.35 0.053 0.026 NEL 400 Acenaphthene 0.25 0.055 0.028 380 170000 Acenaphthylene 0.086 0.044 0.028 8.0 170000 Anthracene 0.58 0.099 0.028 70 190000 Benzo(a)anthracene 1.20 0.219 0.028 6.0 110 Benzo(a)pyrene 1.10 0.208 0.028 1.8 11 Benzo(b)fluoranthene 1.30 0.242 0.028 6.0 110 Benzo(g,h,i)perylene 0.64 0.135 0.028 500 170000 Benzo(k)fluoranthene 0.60 0.134 0.028 60 1100 bis(2- 5.20 0.717 0.055 300 5700

30
Ethylhexyl)phthalate Carbazole 0.29 0.057 0.028 1.3 4000 Chrysene 1.50 0.250 0.028 500 11000 Dibenz(a,h)anthracene 0.17 0.049 0.028 0.6 11 Dibenzofuran 0.18 0.050 0.028 NEL 2800 Fluoranthene 2.50 0.415 0.028 400 110000 Fluorene 0.24 0.054 0.028 40 110000 Indeno(1,2,3-cd)pyrene 0.53 0.113 0.028 6.0 110 Naphthalene 0.26 0.063 0.028 8.0 56000 Phenanthrene 2.80 0.335 0.028 80 190000 Pyrene 2.50 0.417 0.028 300 84000 2-Butanone 0.033 0.018 0.023 580 NEL 2-Hexanone 0.016 0.004 0.003 NEL 92000 Acetone 0.16 0.088 0.10 1000 10000 Carbon Disulfide 0.002 0.0008 0.001 410 10000 Methylene Chloride 0.007 0.0021 0.002 0.2 1200 Trichloroethene 0.007 0.0016 0.001 2.0 NEL Xylene 0.002 0.0008 0.001 500 8000 NEL - No Established Level All Concentrations mg/Kg
Recycling Regulations. For all contaminant parameters detected in the 15 sediment samples collected from Reaches AA and A, no maximum, mean or median concentration was above the respective criteria. As such, it is concluded that placing sediment dredged from Reach AA and the upper portion of Reach B into the Fort Mifflin CDF will not create an unsafe condition and that the sediment can be beneficially used. 9.3 Water Quality Monitoring During Fort Mifflin CDF Operation A water quality monitoring program consistent with what has been implemented at other Delaware River CDFs will be in place during operation of the Fort Mifflin CDF. 9.4 Impact to Cultural Resources Use of the Fort Mifflin CDF for disposal of material dredged for the Deepening project will have no effect on significant prehistoric or historic resources. No construction is required for undisturbed locations outside of, or immediately adjacent to, the existing Cells A, B and C.
31
Placement of additional material into these existing cells will also have no effect on significant cultural resources. 9.5 Placement of Dredged Material at the Fort Mifflin CDF for the Delaware River Main Channel Deepening Project Conclusion The Fort Mifflin CDF is an existing, actively used site for placement of dredged material. As a result, continued use of the site would perpetuate existing vegetation and habitat for existing environmental resources. The site has sufficient capacity for the DRMCD Project and continued maintenance of the Schuylkill River project. Results of sediment contaminant testing indicate that sediment to be placed in the site is clean and can be beneficially used according to PADEP criteria. There would be no impact to cultural resources as all activities would take place within the existing dikes. Based on the above it is concluded that placing material dredged from the upper portion of the DRMCD Project at the Fort Mifflin CDF is acceptable. 10.0 Cumulative Effects The CEQ defines cumulative impacts as “the impact on the environment, which results from the incremental impact of the action when added to other past, present, and reasonably forseeable future actions regardless of what agency (Federal or non-Federal) or person undertakes such other actions. Cumulative impacts can result from individually minor but collectively significant actions taking place over a period of time.” Cumulative effects associated with the Deepening project are addressed in Section 2.3.3 of the 2011 EA and are incorporated here by reference (USACE, 2011). Changes in dredging equipment or dredging practices will not result in additional cumulative effects as the quantity of material to be dredged will not change. 11.0 Regulatory Requirements /Public Coordination of this Environmental Assessment The overboard discharge of dredged material during economic loading of hopper dredges and hopper scows is a regulated discharge under Section 404 of the Clean Water Act. Therefore, it is necessary for the Corps to comply with Section 401 of the Clean Water Act (water quality certification) in the states where these discharges may occur (New Jersey and Delaware). The New Jersey Department of Environmental Protection provided a 401 Water Quality Certificate for economic loading in Delaware Bay in a letter dated April 30, 2013. The Water Quality Certificate designates portions of the Delaware Bay channel where economic loading is acceptable, and requires a program to monitor and manage turbidity generated by economic loading operations. A monitoring and management plan has been developed in coordination with the NJDEP, and is provided as Appendix A. The Delaware Department of Natural Resources and Environmental Control has provided a draft Water Quality Certificate. A final certificate will be obtained prior to construction of the Broadkill Beach portion of the project.

32
The discharge of return water into the Delaware River resulting from utilization of the Fort Mifflin CDF requires a Section 401 Water Quality Certification. By letter dated June 5, 2012 (from Kenneth Murin, Chief, Division of Wetlands, Encroachments and Training to William Seib, U.S. Army Corps of Engineers – Baltimore District Regulatory Branch), Pennsylvania DEP generically issued a section 401 water quality certification for all activities authorized by the 2012 U.S. Army Corps of Engineers Nationwide Permits. Nationwide Permit 16 specifically authorizes return water from upland contained disposal areas. Therefore, the June 5, 2012 Pennsylvania DEP letter serves as the water quality certification for the discharge of return water from the Fort Mifflin CDF resulting from the DRMCD Project. Project changes discussed in this EA have been coordinated with the National Marine Fisheries Service regarding issues related to Section 7 of the Endangered Species Act of 1977 (16 U.S. C. 1531 et seq.) and Essential Fish Habitat pursuant to Section 305(b)(2) of the Magnuson-Stevens Fishery Conservation and Management Act (1996 amendments). An updated Biological Opinion for the project was provided by NMFS in 2012 (NMFS, 2012). In a letter dated October 17, 2013 NMFS stated that review of the project changes proposed in this EA by the NMFS Northeast Regional Office’s Protected Resources Division has led to the determination that reinitiation of consultation pursuant to Section 7 of the Endangered Species Act is not required. All potential impacts of the proposed project changes on ESA-listed species under NMFS jurisdiction have already been considered in their 2012 Biological Opinion. An updated Essential Fish Habitat Assessment was provided to NMFS for review and comment on July 3, 2013. In a letter dated September 26, 2013 the NMFS Northeast Regional Office’s Habitat Conservation Division provided conservation recommendations pursuant to the Magnuson-Stevens Act. Three recommendations were provided as follows:
1) Seasonal work windows:
“A. Dredging, barge overflow and the placement of material on the Broadkill Beach should be avoided from May 1 to September 15 to protect sandbar shark HPAC as well as horseshoe crab spawning and nursery habitat.
B. Dredging in Reach E should be avoided during the overwintering season for blue crabs from December 1 to Mar 31.”
2) “If recommendation 1A above is not adopted and dredging is allowed to occur during May as currently proposed, no barge overflow should be permitted. The dredge pipe should be placed upon pontoons and any material placed on the beach should be deposited above the mean high water line, behind a sand dike”

33
3) Additional coordination or consultation will be required if Kelly Island or Egg Island Point are to be used for beneficial use of dredged material sites to address potential winter flounder concerns.
With regard to recommendation 1, in a letter dated April 30, 2013 the New Jersey Department of Environmental Protection provided a Water Quality Certificate for dredging and the use of economic loading in Reach E. The WQC restricts economic loading in portions of Delaware Bay based on their review of grain size information. The WQC does not restrict dredging or economic loading based on the time of year. The Delaware Department of Natural Resources and Environmental Control has provided a draft WQC for construction of the Broadkill Beach portion of the project. A final WQC will be provided prior to any construction at Broadkill Beach when a final determination has been made on required time of year restrictions. Coordination between the Corps and the DNREC is currently on-going for this. The Corps will follow the time of year construction restrictions required by these State resource agencies. Based on this and the findings of the Field Evaluation of Hopper Dredge Overflow for the Delaware River (Miller et al., 2002), it is concluded that the proposed project changes proposed in this EA can be conducted in a manner that will not impact the affected environment. With regard to recommendation 2, Section 4.2.4.1 of the 2009 EA provides construction measures that would be taken to protect sandbar shark between 1 May and 15 September. These measures include floating the dredge pipe and placement of sand behind a sand dike located above mean high water, which are the same measures recommended by NMFS. Economic loading and associated overflow would occur contrary to the NMFS recommendation for the reasons provided above. Recommendation 3 indicates that additional coordination would be required if the Kelly Island and/or Egg Island Point sites are advanced as sites for beneficial use of dredged material. The Corps agrees with this recommendation and will request additional coordination if these sites are selected for use. The public was invited to comment on the draft EA. A 30-day comment period was provided (20 February – 22 March 2013). Comments were received from the National Marine Fisheries Service, the New Jersey Department of Environmental Protection and the Delaware Riverkeeper Network. The Corps reviewed and appropriately considered all comments prior to finalizing this EA. 12.0 Conclusion and Findings This EA concludes that economic loading of hopper dredges and hopper scows in Reach E (Delaware Bay) of the project, the use of mechanical dredging in any Reach of the project and

34
placement of dredged material at the Fort Mifflin CDF does not result in any impacts different from those evaluated in USACE (1992), USACE (1997), USACE (2009) and USACE (2011). Therefore, the actions proposed and evaluated in this EA are consistent with the project actions previously detailed and documented, and do not result in any new or significant impacts to the affected environment. Since it is concluded that potential project impacts are similar to those previously evaluated, it has been determined that preparation of a new or Supplemental Environmental Impact Statement is not warranted for the project changes identified herein, and a Finding of No Significant Impact (FONSI) for the proposed changes is appropriate.
35
13.0 References Delaware River Basin Commission West Trenton, New Jersey, Administrative Manual-Part III, Water Quality Regulations, October 23, 1996. Delaware River Basin Fish and Wildlife Management Cooperative, Fisheries Technical Committee. 2011. Final Draft Report Policy for Dredging, Blasting and Overboard Disposal Update. Environmental Research and Consulting, Inc. 2012. Acoustic Telemetry Study of the Movements of Juvenile Sturgeons in Reach B of the Delaware River During Dredging Operations. Prepared for USACE, Philadelphia District. Contract No. W912BU-06-D-0003 Task Order No. 81. Hartwell, S.I. and M.J. Hameedi. 2006. Habitat Conditions and Correlations of Sediment Quality Triad Indicators in Delaware Bay. Environmental Monitoring and Assessment 121: 181-212. Long, E.R., MacDonald, D.D., Smith, S.L. and Calder, F.D. (1995). Incidence of adverse biological effects within ranges of chemical concentrations in marine and estuarine sediments. Environmental Management 19(1): 81-97. Miller, J.L., M.R. Palermo, and T.W. Groff. 2002. Field Evaluation of Hopper Dredge Overflow for the Delaware River. ERDC/EL TR-02-17. National Marine Fisheries Service . 2012. Endangered Species Act Biological Opinion Deepening of the Delaware River Federal Navigation Channel (Reinitiation). F/NER/2011/00574. Palermo, M. R., and Schroder, P. R. (1991). Documentation of the EFQUAL module for ADDAMS: Comparison of predicted effluent water quality with standards. Technical Note EEDP-06-13, U.S. Army Engineer Waterways Experiment Station, Vicksburg, MS Pasquale, J., and Burton, W. H. (2011). Delaware River Reach C Main Channel Deepening Project Killcohook (Cells 2 and 3) Confined Disposal Facility Monitoring and Water Quality Monitoring at the Point of Dredging. U.S. Army Corps of Engineers (USACE), Philadelphia District. 1992. Delaware River Comprehensive Navigation Study, Main Channel Deepening, Final Interim Feasibility Study and Environmental Impact Statement.
36
U.S. Army Corps of Engineers (USACE), Philadelphia District. 1997. Delaware River Main Channel Deepening Project (Pennsylvania, New Jersey, and Delaware) Supplemental Environmental Impact Statement. U.S. Army Corps of Engineers (USACE) Philadelphia District. 2009. Delaware River Main Stem and Channel Deepening Project, Environmental Assessment. U.S. Army Corps of Engineers (USACE) Philadelphia District. 2011. Final Environmental Assessment Delaware River Main Channel Deepening Project. U.S. Army Corps of Engineers (USACE) Philadelphia District. 2011a. A Supplemental Biological Assessment for Potential Impacts to the New York Bight Distinct Population Segment of Atlantic Sturgeon (Acipenser oxyrinchus oxyrinchus) which is Proposed for Federal Endangered Species Listing Resulting from the Delaware River Main Stem and ChannelDeepening Project U.S. Environmental Protection Agency and U.S. Army Corps of Engineers. (1998). Evaluation of dredged material proposed for discharge in inland and near-coastal waters - Testing Manual. EPA-823-B-98-004, U.S. Environmental Protection Agency, Washington, DC. U.S. Environmental Protection Agency. 2002. Mid-Atlantic Integrated Assessment 1997-98 Summary Report, EPA/620/R-02/003. U.S. Environmental Protection Agency, Atlantic Ecology Division, Narragansett, RI. Versar, Inc. 2001a. Delaware River Main Channel Deepening Project Delaware Bay Winter Crab Survey 2000/2001. Prepared for USACE, Philadelphia District. Contract No. DACW61-00-D-0009 Task Order No. 0009. Versar, Inc. 2001b. Near-Field Water Quality Modeling of Dredging Operations in the Delaware River. Prepared for USACE, Philadelphia District. Contract No. DACW61-00-D-0009 Task Order No. 0026. Versar, Inc. 2005. Delaware River Philadelphia, Pennsylvania to New Castle, Delaware Chemical Analysis of Dredged River Sediments. Prepared for USACE, Philadelphia District. Contract No. DACW61-00-D-0009 Task Order No. 0076.

37
APPENDIX A
Turbidity Monitoring

38

39
TURBIDITY MONITORING
PART 1 GENERAL
1.1 SCOPE
The work covered by this section consists of furnishing all labor, materials, and equipment, and performing all work required to obtain, analyze, and report the results of turbidity monitoring during overflow dredging (economic loading). This section does not apply to non-overflow dredging.
1.2 SUBMITTALS
Government approval is required for submittals with a "G" designation; submittals not having a "G" designation are for information only. When used, a designation following the "G" designation identifies the office that will review the submittal for the Government. Submit the following in accordance with Section 01 33 00 SUBMITTAL PROCEDURES:
SD-01 Preconstruction Submittals
Work plan; G
Submit a work plan, describing the personnel, equipment and methods to
be used to monitor the effects of the overflow dredging operations on turbidity, including qualifications of the personnel developing the monitoring plan; qualifications of personnel who shall do the monitoring; communication procedures between the monitoring crew and dredging crew; frequency of monitoring during construction; and Best Management Practices (BMPs) to be implemented if turbidity limits are approached or exceeded.
SD-03 Product Data
Calibration Standard; G
Prior to commencing overflow dredging operations, submit a copy of the
operating instructions and standard for calibrating equipment used in collecting turbidity measurements.

40
SD-06 Test Reports
Equipment Certification Turbidity Monitoring Reports
Submit required turbidity monitoring reports in the specified format,
within 24 hours after completion of each test, daily during the first two weeks and once every week thereafter.
PART 2 PRODUCTS (Not Used) PART 3 EXECUTION
3.1 GENERAL MONITORING REQUIREMENTS
Monitor turbidity during overflow dredging (economic loading) operations. Use this data in real time to determine if turbidity during overflow dredging exceeds the specified level over background measurements. If this level is exceeded, implement Best Management Practices (BMP's) in order to decrease water column turbidity below the allowable maximum level above background levels.
3.2 TURBIDITY TESTS
3.2.1 Turbidity Monitoring Equipment
Monitoring required for turbidity shall be measured in Nephelometric Turbidity Units (NTU) using a standard Nephelometer. Global Positioning System (GPS) is also required to record sampling stations. Submit an equipment certification, attesting to the accuracy of the testing equipment and procedure. In addition, submit a copy of the Calibration Standard used to calibrate the testing instrument and a complete set of operating instructions for the turbidity testing equipment. Use this standard throughout the project to maintain the calibration of the equipment.
3.2.2 Monitoring Locations
Perform turbidity monitoring at the following locations:

41
Background (pre-dredge conditions):
One meter and seven meters below the water surface in the immediate vicinity of the next dredging load, approximately 30 minutes prior to the start of dredging.
Pre-Overflow:
One meter and seven meters below the water surface at approximately 200 meters down-current of the working dredge, after dredging has begun, but before overflow commences.
Compliance:
One meter and seven meters below the water surface at approximately 200 meters down-current of the working dredge and within the center of the visible overflow plume, if any. Take measurements no more than 10 minutes after overflow commences, or when the monitoring boat is fully within the visible overflow plume, whichever occurs first. Notation will be made of the direction of the current (ebb or flow) at the time of sampling.
Post-Compliance:
One meter and seven meters below the water surface at the same location as the compliance monitoring location after overflow dredging has ceased.
3.2.3 Monitoring Frequency and Duration
Perform turbidity monitoring at the frequencies and durations specified below. All monitoring will be conducted during daylight hours only. Suspend monitoring if inclement weather or sea conditions make monitoring unsafe.
Background (pre-dredge conditions):
Once for each dredging load. Measure turbidity for 5 minutes and record the average measurement.
Pre-Overflow:

42
Once for each dredging load. Measure turbidity for 5 minutes and record the average measurement.
Compliance:
Up to two times for each dredging load. Measure turbidity for 5 minutes and record the average measurement. If the first compliance monitoring measurement indicates an exceedance of the performance standard, obtain a second compliance monitoring measurement after implementation of BMPs to reduce turbidity.
Post-Compliance:
For each dredging load, after overflow dredging has ceased, measure turbidity continuously for up to one hour, or until turbidity returns to background levels, whichever occurs first.
3.2.4 Reporting
Record the Turbidity Monitoring data specified in the following paragraphs and submit all data electronically to the Contracting Officer's Representative. Submit data daily during the first two weeks and once every week thereafter during the period of collection. Provide reports in Excel Spreadsheet (.xls) files, Version 2003 or later.
3.2.4.1 Monitoring Reports
At a minimum, include the following information in the monitoring reports for each turbidity measurement taken:
a. Time of day and date measurement was taken. b. Depth of water body. c. Depth of measurement. d. Antecedent weather conditions. e. Tidal stage and direction of flow. f. Dredge location (station location and map). g. Measurement location in State plane coordinates (x and y). h. Distance between measurement location and the dredge. i. Wind direction and velocity. j. Water temperature. k. Salinity.

43
l. Dissolved oxygen. m. NTU. n. Monitoring personnel.
The monitoring reports shall also list and describe any BMPs implemented, if necessary, and include a description of any factors influencing the sampling program. When sampling is not conducted, a brief statement shall be given explaining the reason for not conducting the sampling, i.e. "no sampling taken due to high seas". State plane coordinates (x and y) shall be provided for all sampling locations, including the coordinates of the dredge and the distance between the sampling location and dredge for each sampling event to demonstrate compliance with the stated sampling distances.
3.2.5 Total Suspended Solids (TSS)
For one dredging load per day, collect water samples for analysis of TSS. Obtain the samples from one meter and seven meters below the water surface at the Background, Pre-overflow, and Compliance locations. Store and preserve samples as prescribed in Appendix B of "The Management and Regulation of Dredging Activities and Dredged Material in New Jersey’s Tidal Waters" (New Jersey Department of Environmental Protection, 1997). Analyze water samples for TSS according to USEPA Method 160.2. Provide the results of all TSS analyses within 45 calendar days after the completion of all dredging.
3.2.6 Additional Testing
The Contracting Officer may direct that additional tests be performed, at no additional cost to the Government.
3.3 TURBIDITY CONTROL
3.3.1 Implementation
Establish and maintain communication between the dredge and the monitoring personnel to allow for real time reporting of NTU results. If turbidity exceeds background levels by more than 40 NTU at the corresponding depth, immediately implement Best Management Practices (BMPs) to allow turbidity levels to return to less than 40 NTU above background levels. Maintain the BMPs to ensure the specified turbidity level is not exceeded. If compliance with the performance standard is not achieved after the second compliance monitoring measurement, cease overflow for that dredging load. If compliance with the performance standard is not achieved for three consecutive dredging loads, cease all overflow dredging until the Contracting Officer allows overflow dredging to resume.
44
3.3.2 Notification
If turbidity exceeds background levels by more than the specified turbidity level, immediately notify the Contracting Officer Representative, or on the morning of the following work day if it occurs after normal work hours. Notification shall include a description of the BMPs implemented and a plan for avoiding further exceedances of the performance standard.
3.4 WORK DELAY
Delays in work due to the fault or negligence of the Contractor or the Contractor's failure to comply with this specification shall not be compensable. Any adjustments to the contract performance period or price that are required as a result of compliance with this section shall be made in accordance with the provisions of the Clause SUSPENSION OF WORK of Section 00700 CONTRACT CLAUSES.
3.5 MEASUREMENT AND PAYMENT
The work specified in this section will not be measured for payment and all costs in connection therewith shall be included in the contract lump sum price for Bid Item No. 2, titled "Dredging and Beachfill".
-- End of Section --
Related Documents