-~ fficiency and Equity Implications of Subsidies to Secondary Education in Kenya Y Jane Armitage Richard Sabot - - -- Reprinted from The Theory of Tar ..'ion for Developing Countries (ed. D. Newbery and N. Stern) Oxford University Press, 1987

Welcome message from author
This document is posted to help you gain knowledge. Please leave a comment to let me know what you think about it! Share it to your friends and learn new things together.
Transcript
-~
fficiency and Equity Implications of Subsidies to Secondary Education in Kenya
Y Jane Armitage Richard Sabot
- - --
Reprinted from The Theory of Tar ..'ion for Developing Countries (ed. D. Newbery and N. Stern) Oxford University Press, 1987

Efficiency and Equity Implications of Subsidies to Secondary Education
in Kenya Jane Armituge and Richard Sabot
Pwntno~w OF THE NEW ECONOMICS of public finance w a rule of thumb when searching for candidates for taxation: goods and services that have low price elasticities of demand and high income elasticities ofdemand are likely to prove to be particularly appropriate choices. These characmistics imply that the reduction of demand (and of potential revenues) and the cansequent distortion of consumption patterns resulting from the imposition of a tax will be relatively small and that the share of revenue accming from those in the upper portions of the income distribution will be relatively large. The same rule of thumb applies when an existing program of subsidies is scrutinized to identify candidates for reduction. In this chapter we exploit this syrnmeny, using a Kenyan example to show how such an assessment might be conducted in the educatron sector.
That education expenditures should be subjected to critical scrutiny is obvious: public spending on education as a proportion of GDP and as a propor. tion of puhlic expenditure is high in all regions of the world. In 1970, on average, developing countries spent 4 percent of GDP and 15 percent of total public expenditure on education (Zymelman, 1982). Moreover, enrollment ratios that remain low by comparison with thm of industrialized countries, combined with rapid population growth and high private rates of return to investment in education, mean that demand for educa ' ..A (and hence pressure to increase subsidies) is high and growing.
As a consequence of the recession of the early 1980s. and as much br structural reasons, budgetary constraints on educatianal expenditure in de- veloping counmes are tighter than they were in the 1950s and 1960s, when many subsidy programs were put into place or were gteatly expanded. Govern- ments' share of output grew substantially over the last twenty years; today public expenditure is no longer growing as a percentage of ~ D P . Likewisc the
We art grateful to P. Diamond, 1. St&, and the editors of this volume for derailed commma on an earlier draft of the present chapter.

590 JANE ARMITAGE AND RICHARD SABOT
proprrion of the budget spent on human rrsourca increased in the 1960s and 1970s. Today expenditures on education and health face increasing compcti- tion from other claims (Bowman and Sabot, 1982).
There is a further reason for scrutinizing education ex~endinues: after twenty to thirty years of economic development, the original justification for the subsidies may not apply with equal force or may not have proven sound. The belief that the dismbution of x h w l places (and thence the rate of intergenerational mobility) should not be determined by the ability to pay xhool f m provided one justification for these subsidies. Capital market imperfections generally prevent the poor from borrowing to finance education expenditure.
There is also the belief that various externalities generated by the educa- tional process drive a substantial wedge between private and social returns and that. in the absence of subsidies, invesmrent in education would be less than socially optimal. These externalities include the compression of the earnings structure and consequent reduction of the inequality of pay resulting from an increase in the supply of humar. capital relative to other factors of production.' If, as it has been argued, education has a negative effect on frrtility and on child mortality and a positive effect on political awareness and participation, then these external benetits also support subsidization (see Bowen and Sabot, 1983; Coc hrane, 1979).
The need to set standards ofquality in the face of inadequate information is a third reason for government regulation and possibly also subsidization of schooling. In an environment in which many parents of xhool children are themselves uneducated and are thus unable to reach informed judgments about the relative costs and benefits of relatively high-quality schooling, there is concern that quality will be less than socially optimal.
The public finance rule of thumb and the arguments advanced to justify educational subsidies suggest that an assessment of a program of education subsidies should address the following questions:
Would a reduction of subsidies have a large negative impact on enroll- ments. or is the price elasticity of demand sufficiently low for that not to be the case? Would a reduction of subsidies have an adverse efkt on the distribution of schooling, or contrary to intentions, have the relatively well-to-do benefited disproportionately from the subsidization of education! Would a reduction of per pupil subsidies result in a deterioration of school quality, r,r would private funds simply substitute for public funds, leaving per pup1 expenditures 62 education inputs unchanged?
We attempt to answer these questions with regard to government subsidies of secondary education in Kenya. In so do~ng we will find it important to distinguish between the consequences of the two means of duc ing per capita subsidies of secondary education: first, by raising fees in govemment schools,

EFFIClf NCY AND EQUITY lWIUCAl7ONS 591
a d second by leaving the growth of secondary enrollments to relatively unsubsidixd private schools.
The next section presents background infomatior. on the Kenyan second- ary s)-m and program of education subsidies. The model of a dual school system suggested by the stylized facts can be used to make a prima facie case tb~ raising user f m in govemment sccondrv schools. We then discuss the yp.zious econometric methods employed in the subsequent empirical analysis, our sources of data, and a possible problem with sample selection bias. Wage functions and educational attainment functions are uxd to improve measures of key relationships, to test competing hypotheses regarding the interpretation of thox relationships, to estimate, using simulation techniques, the extent to which user fees can be raised, and to assess the efficacy of leavine further secondar). expansion to private schools.
The Dual Secondary System in Kenya
Setween 1963, the year of independence, and 1380, enrollments in the highly subsidized govemment secondary system expanded rapidly at 12 parent per year. Demand grew even faster than supply. The excess demand was satisfied by the establ~shment of large numbers of harambee, church, and private xhools, which receive only small subsidies f-om the govemmer?t.: Since 1963, private school enmllments, including assisted harambee school enrollments, have been growing at the rate of 2 1 percent. Secondary school enrollment in nongovemment xhools first exceeded that in govemment- supported schools in 1975. In 1981,40 percent of enrollment was in govern- ment schwis, a b u t 20 percent in assisted harambee schools and unaided harambee schools, respectively, and the remainder in church or private schools. The state secondary system is clearly the system of preference. With few exceptions, harambee schools are filled with primary school leavers who did not qualify (on the basis of meritocratic criteria) for a government second* a v education. Tables 22-1-22-3, and the tables in the text below, which present characteristics of govemment and harambee schools for 1980, explain
Table 22-1. Cosu per Pupil, Gouemment unrf Hmambee Schodr, 1980 (hilling5 p c r yeat)
-
Pnuate kwlc T d wqes
- School dirra dmct dnc~i
&vemmmt 1,557 2,071 1,628 6,960 Harambee 2.460 227 2.687 6,960 -
a. Rimsty vpeer fotgone, rnnurl average o m hm four years, predicted with wage funct/ON prrmcnted in ublc 22-8.
h e : Annul Cmrur of Pr~maw and Sec0nd.y Education (1979), the Approplrt(o~ Account, 1980-81.
592 JANE ARMITAGE AND U C I U R D SABOT
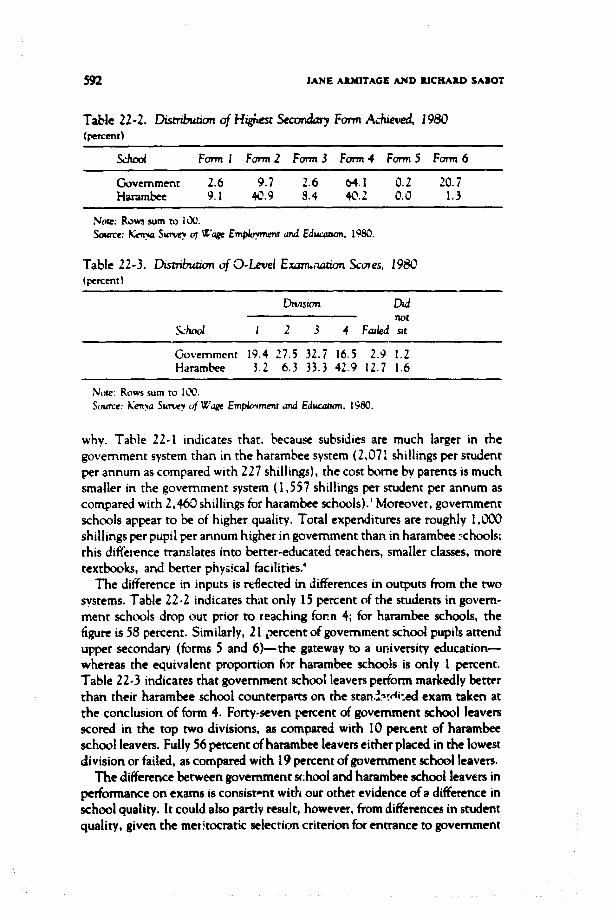
Table 22-2. Dismbunon of Hzghm Secondaq F m Acfueved 1980 (percent)
SsM F m l F m 2 Fonn 3 F m 4 Frnm 5 F m 6
Government 2.6 9 . 7 2.6 64.1 0.2 20.i Harambee 9.1 G.9 8.4 M.2 0.3 1.3
Table 22-3. Dsmbuaon of 3 - k u e l E x z m . ; w i a L-mes, 1980 ( p e n t l
Government 19.4 27.5 32 .7 16.5 2.9 1.2 Haramhe 3.2 6 . 3 33 .3 42.9 12.7 1.6
Nore: Raws sum to Icy. Source: k'enqa Surwv of W'qe Empbvment mi Educanon. IF@.
why. Tahle 22-1 indicates that, because subsidies are much larger in the government system than in the harambee system (2,07: shillings per student per annum as compared with 227 shillings), the cost borne by parents is much smaller in the government system (1,557 shillings per student per annum as compared with 2,469 shillings for harambee schools).' Moreover, govemment schools appear to be of higher quality. Total expenditures are roughly 1,000 shillings per pupil per annum higher in govemment than in harambee schools; this JiKe~ence translates into better-educated teachers, smaller classes, more textbooks, and hetter physical facilities.'
The difference in inptits is reflected in differences in outputs from the two svsterns. Table 22-2 indicates thi~t only 15 percent of the students in govem- ment schools drop out prior to reaching fonn 4; for harambee schools, the tigure is 58 percent. Similarly, 21 ,=Kent of govemment school pupils attend upper secondary (forms 5 and 6)-the gateway to a university education- whereas the equivalent proportion fix hararnbee schools is only 1 percent. Table 22-3 indicates that government. school leaven perform markedly bemr than their harambee school counterparts on the stan5rdixd exam taken at the conclusion of form 4. Forty-seven percent of government school leavers scored in the top two divisions, as compared with 10 percent of harambee school leavers. Fully 56 percent of hatambee leavers either placed in the lowest division or failed, as compand with 19 percent of government school leaven.
The difference between govemment school and harambee school leaven in performance on exams is consist-nt with our other evidence of a difference in school quality. It could also partly result, however, from difYerences in student quality, given the metitocratic selectir~n criterion for entrance to govemment

EFFICIENCY AND EQUITY IIIPUCAnONS 593
schools. Although we do not have evidence on ability levels for the entire sampk, a subsample of fonn 4 leavers was given Raven's Pmgrcssive Mamca, a test of reasoning abrliy that is widely used in developing counmes. Tht results, shouc below, indicate that the d8krence in abtlity scores between harambee and government school leavers is small; indeed, it proved to be statistically insignificant.'
lrem Gouemm~nr Hmmnbce Mean abl l l~ 30.52 28.32 SD 4.85 7.90
Nevertheless, govemment school students are likely to be bemr qualified on entrance than haramke school students because of diffemxa krween the two groups tn the quality of primary schooling and in academic skills acquired at home.
The difference between government and harambee school leaven in levels of skills measured by the exams is, in turn, reflected in a large dlffercnce ktween the two groups in the earnings they command in the lahor market. As we see from the table klow, although the predicted mean wages of workers (with ten years' experience) h m both types of secondary school are substan- tially higher for 1980 than the predicted wages of primary school leavm, those from government secondary schcwls earn 23 percent more in shillings per year than those from harambee schools."
temm grw4 W q e Pnmary xhmd 9.2 73 Haramke form 4 12,518 Government form 4 16.897
In the parlance of cost-benefit analysis, these stylized Cacts suggest that the private costs of investing in a secondary education are lower and the private r e r ~ r n p are higher for those who gain access to a government secondary school tlian for those who must attend a harambee school. The resulting difference in net private returns explains parents' strong preference for sending their chil- dren to government schools. If we abstract, for now, from individual con- straints on tinancing secondary education when the market for secondary education is segmented, the implication is that per pupil subsidies to govem- ment schools can be reduced (with user fees increased) without affecting the demand for places in government schools or the level of expenditure per pupil and hence school quality. A simple economic model of the demand for schooling predicts that, in a dual school system, there will be exczo demand for places in the relatively small, highly subsidized segment of the system. The elasticity of demand in that segment will therefon be zero and will m a i n zero until fees are raised sufficiently to equate the private net rates of return in the two segments.' If the highly subsidized segment is also higher in quality, hence in gross returns, the fees charged in that segment will actually have to bc higher than the fees in the other segments before net rates of return arc q u a l i d .
5% JANE AIMITACE A N D RICHARD SABOT
Raising user fees in Kenyan govemment xcondaq schools would ease tudgetary constraints on education, which have nghtened in the 198Lk" Moreover, public resources for secondary education a111 also k limited by the higher government pnorities attached to pnmary a d higher education. The Kenyan govemment is committed to free and universal primav education.' Whether the Kenyan govemment takes advantage of rhe revenue-generating p t e ~ t i a l of user tees in govemment schools, however, also depends on the consequences of a rise in those fees for the disrnhution of secondary schcml places and tor the aggregate size of the secondaw system. An important consideration is whether a substantial increase in u e r fees would force children of relatively low-income families either to transfer their children to the private schocl system or to terminate thew education.
The predicted prohability of a child's attending a govemment secondan, school rises monotonically and steeply with the educational level of the child's parents, an indicator ofsocioeconomtc status (prohability is predicted at mean age for those horn o u t d e Nairobi).
Probabll~e Rlth parents wlth no educatton . I6 One parent w~rh no educatton,
one wtrh prrmam 2 3 b t h prlrnarv or one wtth seconjary
or more. one wtrh none . 3 3 One w~th prlrnarv, one wtth seclondarv or more,
or h t h with secondary or more 5 1
The probability rises from . I6 for the chtldren of uneducated parents to . 5 1 for ch~ldren of parents with at least some secondary educaticm. Those with the greatest ability to bear the cost of their education are the most likely to receive large subs~dies. The explanation may Ite with differences among socioeco- nomic groups in the quality of primary schooling, in the quantity and qualiry of training provided within the home, or in the ability to "purchase" p!aces in government schools. Whatever the cause, it appears that in Kenya the inci- dence of subsidies of secondary education, a private "good" that substantially raises the lifetime income of the recipient, strongly favors those households that stand relatively high with respect to the distribution of income. A rise in user fees is likely, therefore, to reduce the inequality of income (consumption) among househoUs.
A zero aggregate price elasticity of demand (given the rationing of places) implies that a rise in user fees w~l l not result in any underutilization of government schools. If some students withdraw from the govemment system. others from the haramhee system will take their places in the preferred system. The nature of the change in aggregate secondary enrollments as user fees are increased, however, depends on the numbers who leave the govemment system and on whether they switch to the harambee system or leave the secondary system entirely.'%ese magnitudes will depend on the composition of the govemment system. If, at one extreme, the govemment system is entirely composed of the children of the group with the highest education

EFFICIENCY AND EQUITY fWPLKATIONS 59s
(income), then a rise in fees is unNel.g to induce withdrawals. As we see from the t a b k l o w . in Kenya, despite their low p b a h l i t y of atredance, chil- dren of parents with no fwr*tal educatian still compose 38 percent of the government secondary system, because such a hlgh proportion of parents had little or no formal education. Another 25 percent of places are filled by children who have one parent with primary education. This statistic s u m that, unless the rise in school fres is discriminatory, that is, i m p x d only on those "able ro pay," i t may i nhce substantial withdrawals fnrm the govem- ment system and perhaps entirely tnxn the secondary system.
Both parents with no education One parent with no education,
one wth primary Both pnmary or one with secondary
or more, one with nune One with primaty, one wlth secondary or more.
or both with secondary or more
Per- of children in
Methods and Data
Our concern is with the apparent dualism in the market for secondary education ktween the high-quality, high-sukidv government system and the low-quality, low-subsidy haramhee system. Therefore, we depart from the conveirtional procedure and disaggregate the benefits and costs of secondary schooling by type of school and calculate separate rates of rerum to govem- ment schooling and to haramke schooling.
In the conventional measurement of tt: rate of return to (say) secondary education, the benefit stream is measured by means of an earnings function (see Mincer, 1974), of which the following, estimated first for a sample of primary school leavers and then for a sample of secondary school leavers, is an example:
(22-1) lop W = a + b L + c L ? + I ; d , X , + u J
where
log W = log of eamings of tire individual L = the number of years of employment experience of the individual X = a vector of other characteristics of the individual u = a disturbance term
These cross-section eamings functions are used to simulate two time series, wP and ws, representing the predicted wages, over their expected working lives, of primary and secondary school leavers, respectivelv. The difference between
% JANE ARMITAGE A N D RICHARD SABOT
the educational gmups in pmiictcrl lifetime earnings is interpreted as a proxy for the coqnitive skills ot other marketable traits acquired in secondary educa- tion and is used as the estimate of the gross benetits of x c o n & ~ education. When we calculate the internal pRvate rate of retum that equates the present value of these benefits to :em, we net out only the opprtcnity costs (wages forgone) of attending secondary school and the private direct costs." When calculating the s a d rate ot return, we must also take into account the public direct costs (subid:es) .I:
On the benetits .Be, disaggregation involves est~mating earnings functions that w~ll yield W,, and Vt),h. representing the predicted wages, over their expected working Ilves. of govemment and harambee secondary school leav- ers. respectively. W'e do this with the follcwing mcditication otequation 22-1:
where S, = dummy variables signttj~ng hrp ci schcwl." Excess demand for government schcwling is suficient to establish that the price elasticity of demand is zero. The comparison c>f the private rate of return to Investment in government schooling, I.:, with the private rate of retum to haramke school- ing, r:, provides the basis for assessing the extent to which user fees can he raised (subsidies lowered) without inducing a reduction in enrollments. Given that r: > ti , and there are no financial constraints, this pnxdure involves raising direct costs in our calculation of private rates of retum until ti = r:.
Khes the practice of reducing per pupil subsidies of secondary education by leaving further expansion to the low-cost, low-quality private sector result in the sacrifice of allocative efficiency? Because both the total costs and the total benefits of government schooling appear to exceed those of haramke school- ing, our stylized facts did not permit even a preliminary answer to this question, which involves the comparison of social rates of retum, r i and ti. The answer depends on whether the difference between the two systems in costs or the difference in benefits has the greater effect on the relationship oft; and ti. Ifri s ri, then reducing per pupil subsidies in this way would not reduce the aggregate economic productivity of the school system. If r; > r i , then allowing the haramke system, as currently constituted, to increase its share of enrollments would result in expected output forgone.
The deficiencies of cost-benefit analysis as a guide to the allocation of resources between secondary schools and other types of investments such as health clinics or railroads are well known (see chapter 10, by Fields), and various more or less ad hoc adjustments have been devised to correct them (see Knight and Sabot, 1983b; Psacharopoulos and Hinchliffe, 1973). Our more limited aim of comparing social rates of return to two components of the secondary system as a means of assessing the efficiency consequences of reducing per pupil subsidies is less subject to some of the biases that have been a source of concern. The precise nature of the relationship between wages and the marginal product of labor in the public sector, for example, may have a large influence on the aggregate social rate of return to secondary education but
EFFICIENCY AND EQUIlY tWPUCATIONS 597
only a small impact on the relative rates of rctum to government and hanmbtc schooling." Wage-experience profiles dcrivcd from cross-section data arc only crude approximations of earnings over the life cycle." Again, the aggregate ran of return to secondary education is likely to be more subjm to bias from this source than is the relative rate of return to government and h a r a m k schools.'"
We do, however, empirically examine the following bu r issues that could have an important bearing on relative private or social rates of retum. and where appropriate we devise methods-descrihed in detail klow--of adjusting our estimates:
We use more refined measures of human capital-scorn on the 0-level exams taken in form +to assess whe:her the lifetime earnings of govern- ment school leaven are higher than those of harambee school leaven lrczcause of the former p u p ' s higher level of ski!ls. The difference could instead be due to credentialism, that is, to discrimination by empioyen on the hasis of the worker's "old schcml tie." We have measures d time devoted to job search on leaving schcwl (unemployment) that allow us to assess whether government and haram- hee x h m l leaven differ in this regard and whether relative rates of return are sensitive to the observed differences. We assess whether relative rates of return must he adjusted tor the difference noted above herween govemment and haramke schools in wastage rates. The answer depends on whether the returns to schcmling. as well as the costs, are a h e a r or nonlinear function of yean of schooling. We assess the extent to which the difference between government and harambee school leaven in skill levels and earnings is due to the govern- ment system's greater tendency to seiect children from more educated backgrounds rather than to dilcferences in the quality of school~ng. To t h ~ s end we estimate an education production function to isolate the effect of family background, independent of type of school, on performance on the exam at the end of schooling. We then simulate the difference between govemment and harambee school leaven in performence and in earnings if the two groups did not differ in family background.
Apart from opportunity costs (derived from the earntngs function estimated for primary school leaven using data from our survey, described below 1. we do not have individual data on costs. In our rate-of-return calculations, all government school leavers are assumed to have paid the average current costs of govemment schools; similarly, all harambee school leaven are assumed to have paid the average current costs of harambee schools. Official govemment natistics provided our sources for the private and public cost data. Our estimates of private direct costs-tuition and board, uniforms, caution fees, activity fees, medical fees, books and equipment, and contributions to the building fund-sre obtained from the Annual Census of Primary and Secondup

ScM (1 979)." Our estimates of public costs arc obtained from 77u Appropm- da A~CQWUS, 19W1.iB
The h y a SUN^ of %'age EmpbqmeW and &cation 1980 is our source for the opportunity costs and returns to government and harambee secondary education. The survey was designed and administered in 1980 by a team chat included one of the authors. The sample. containing nearly 2,000 employees, was randomly selected on an establishment basis. using a two-stage procedure, from among the wage-labor force of Nairobi.
For ocr purposes the s w e y has two smngths-accuracy and richness- though it also has a weakness. Data on wages collected from an establishment- based surIey are I~kely to be more accurate than similar data &rived from a household survey hecause the inquiry does not rely solely on the recollection of the employee; co~tfirmatory information can be (and was) obtained from the employer. The richness of the data is a product of the specially designed questionnaire. Respondents were asked detailed questions about their t.2uca- tional and employment histories, their family background, and other things. One advantage is that it is possible to identify the type of secondary school attended and hence to compare the rates of return that a n central to our analysis. The experience variable in our earnings functions is the actual number of years in wage employment rather than the usual crude proxy based on age and years of education. The variable indicating performance on 0-level exams pennits the test of competing hypotheses regarding the cause of the difference between harambee and government school leavers in earnings streams (essential for the measurement of the eap between the two tvpes of school in gross socd returns). I t also permits us to estimate an education production function and to correct, if only crudeiv, for the bias in the measure of the gap that arises from the selectivity of the government system.
The weakness of an establishment-based survey such as the Kenya Surve? for cost-benefit analysis is that the sample does not include those educated workers who are not in urban wage employment." Our estimate of the relative rate of return to government and harambee schools may therefore be subject to sample selection bias. In particular it seems l~kely that a higher proportion of harambee school leavers than of g0vernmer.t school leavers are not in urban wage employment and that those harambee school leaven who were unsuc- cessful in obtaining such employment are from the porest-quality schools. If those schools have below-average costs as well as below-average returns, then our comparison need not he biased. If, however, the returns alone are below average, the implication would be that we are overestimating the returns to harambee schools relative to the retums to govemment schools.
Private and Social Rates of Return to Government and Harambee Schools and Some Adjustments
Table 22-4 presents estimates of the various earnings functions used in the analysis. in both equation 22-1, estimated for primary leavers, and equation

EFFICIENCY AND EQUXlY IMPLICATIONS
Table 22-4. Eumuag! F m c h u
Lcovm -
SIondrad F m 4 F m f Funnf l n d c p m d m t d 7 m 8 ormcm ormon or-
Equation Years of emplqrnnt
ewperimcc (L)
Haamke secondary school (S:Y
Private secondary x h m l (S3Y
Government technical school (S4)'
Post-furm 4 schooling (Es)'
First division (DIP
Second division (D?)'
Third d~vision (D3Ic
Fourth division (041'
Upper division (Dl or D2)d
Constant R Number
- Not applicable. Nous: The dependent variable is the log of monthly wages (IogW). The figure in patmrh-
beneath a coefficient is its t statistic. a. Government school SI is the k. b. Lower secondary leaven is the b w . c. Failed or did not sit O-level exam is the base. d. Lower divisions (third, fourth, or hit) am the base.
22-2. estimated for leavers at form 4 or later, the coefficient on the experience variable is positive and highly significant and the coefficient on the quadratic term is negative and highly significant. Differences between the two equations in constant terms and coefficients on the experience variables indicate that, as usual, the earnings profile of secondary school leavers lies above a d rises more steeply than that of primary school leavers.

EFFICIENCY A N D EQUITY IMPLICATIONS 601
The coefficient on the harambee dummy ~ r i a b l e in equation 22-2 is negative, large, and significant: the implication is that, if we standardk for employment experience, the eamings of harambee xhool leavers are consider- ably lower (more than 21 percent) than those of government school leavers. This estimate of the standardized differential in earnings may be biased, because in equation 22-2 the returns to experience are constrained to k the same for government and haramtree school leaven. An F test on an uncon- srrained version of the equation (not sho-an), however, did not allow us to reject the null hypothesis that the returns to experience are the same for both groups. The F statistic was helow the critical value, at the 5 percent level of signiticance.
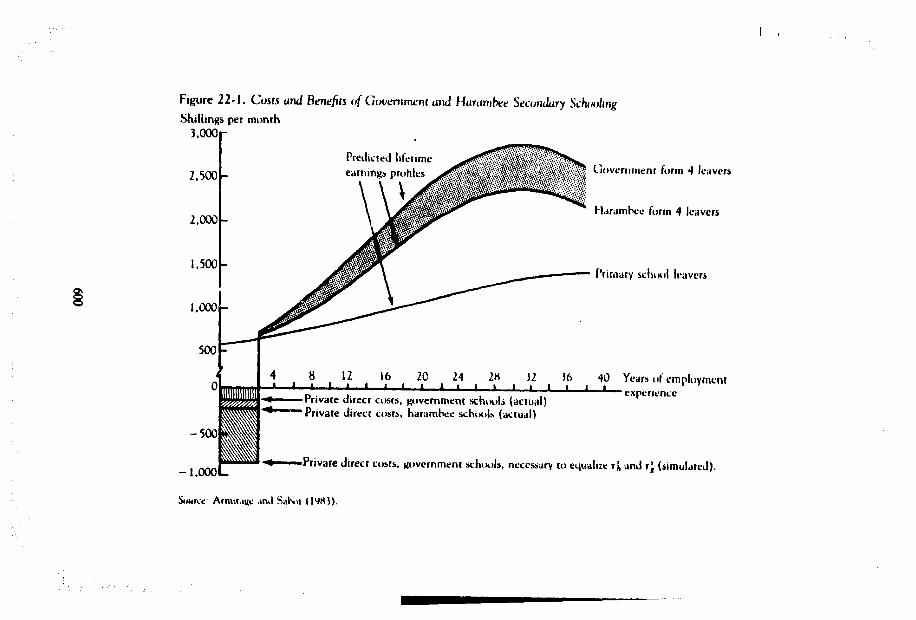
Figure 22- 1, a rendering of the 1;fetime eamings streams of primary xhool leavers, gcvemment school form 4 ieavers, and harambee school fom 4 leavers derived from equations 22-1 and 22-2, summarizes these findings. The lower shaded areas represent the opportunity cost of secondary schooling; the upper shaded area represents the higher gross private returns to government secondary schooling than to harambee secondary schooling."
Table 22-5 presents our estimates of private and social ra te of return to government and haramhee schcoling based on the data underlying the
Table 22-5. Pntlate a d Social Return to Secondary f F a n 4) Education (percent)
Item Gmfernmen~ schoois Harambee schools
Rase calculat~nn Pr~vate return 14.5 9.5 Social return 13.0 9.5
Ad!usrlng for credentlalism Pr~vate return 14.5 9.5 Social return 13.0 9.5
Adjustlng tor wastage Frlvate return 14.5 7.5 Social return 13.0 7.5
Adjusring for search time Private return 21.0 11.5 Social return 17.0 11.5
Adjustlng for selectiviry of government schools'
Base private 15.5 11.0 Base m ~ a l 13.5 11.0 Adjusted pnvate 15.0 - Adjusted social 13.0 -
- Not appl~cahle. a. The haw private and social returns are recalculated becaw a slightly different specification
of the esmlngs funct~on underlying our estimate of returns is wed m make the adjustment.
602 JANE ARMITAGE AND RICYARD SABOT
above-mentioned estimates of returns and opportunity costs and on the esti- mates of private and government expendirures presented in table 22-1. Con- firming what the stylized facts strongly suggested, the private returns to government schooling are higher-50 percent higher-than the private re- turns to harambee schooling. The implication is that user fees in government schools would have to be raised substantially to equalize ;rivate returns in the two systems. Our simulations indicate that, to accomplish such an equaliza- tion, private direct costs in govemment schools would have to be rawd from 1,557 shillings per year to 10,000 shillings per year (see figure 22-!I.:' The difference between what the govemment couid charge, given perfect capital markets, and what it actually charges over four yean is therefore in excess of 33,000 shillings. This sum is double the mean annual earnings of all workers in our sample, considered by some observers to be the urban elite; it is 3.5 times the mean annual earnings of the manual workers in our sample.
If, as we have assumed, the elasticity of demand for govemment schooling remains zero until private returns in the two segments of the system are equalized, the revenue potential of raising user fees is then simply the differ- ence ktween current user fees and the maximum potential fee multiplied by aggregate enrollment in government lower secondary schools. This amount is 75,600,000 pounds, a sum that represents more than 300 percent of govern- ment recurrent expenditures on lower secondary educa t i~n .~~ Capital market imperfections imply that it is not feasible to levy the maximum potential user fee without a decline in demand for government schooling. Nevertheless, the patential revenue associated with an increase in school fee. is likely to be s~bstantial.'~
The private and social returns to harambee secondary schcols are essentially the same. Adding the negligible govemment subsidies onto private costs of harambee schools increases total costs by only 9.2 percent. This increase does not measurably reduce the rate of return. There is, however, a gap between the private and social returns to government schools because per pupil subsidies in that system are far from negligible. Adding government subsidies onto private costs increases total costs by 133 percent. The result is tihat the social rate of return to government schools is some 13 percent, which is less than the private rate of return of 14.5 percent.
The gap between govemment and harambee schools in the social rate of return is less than the gap in private returns. Nevertheless, social retums to investment in government schools remain substantially higher than the social returns to investment in private schools. This difference suggests that, from the perspective of costs and benefits to the economy as a whole, not just to the individual or household, the government system is the more cost-effective system--output per shilling of input is higher in govemment schools than in harambee schools.**
The measured difference between the two systems in economic efficiency could be due to a difference in the quality of management. Alternatively, it could reflect increasing returns in the education production function. Recall
EFFICIENCY AND EQUITY IYPLICARCNS 603
that total per pupil expenditures are substantially lower in harambee schools than in government schools. The returns to the exnh 1,000 shillings per pupil per year spent irr government xhools may have substantially exceeded average returtis. Educationaliso generally preslme that the learning curve, relating inputs on the horizontal axis and skills acquired on the vemcal axis, has a logistic form, increasing rapidly at first, then more slowly. Kenyan secondary xhools may be on the steeply sloped pomon of an aggregate venion of such a curve where a small increase in inputs yields a disproportionately large increase in outputs (Armitage and Sabot, 1983).
One implication of this efficiency differential for the assessment of govem- ment subsidies of secondary education is that a policy of reducing per pupil subsidies by allowing the relatively unsubsidued harambee system to provide a disproportionate share of new secondary places would entail allocative in- efficiency. Such a policy would result in potential output forgone. Because of the higher total costs of the government system, however, the efficiency differential benveen the two systems is less than the 20 + percent differential between government school leavers and harambee xizool leaven in economic productivity estimated by our wage functton. If, as hypothesized, the education production function is characterized by increasing retunis, it may take only a small increase in the quality of harambee schmls to reduce the difference betwrco the two systems in qoss social returns. Narrowing the gap between the two systems in total expenditure per pupil may therefore narrow the gap in sociri rates of return.
lust how robust are these assessments of the economic costs and benefits of ~ d u c i n g per pupil subsidies of secondary education in Kenya? The following adjustments of our estimates of relative private and social rates of return to govemment and harambee schooling provide a basis for judgment.
@us ting for Credentialism
To what extent does credentialism account for the higher earnings of government than of harambee school leaven? To what extent is the difference in earnings due to the greater skill of govemment leavers as indicated by their superior performance (see table 22-3) on the nationwide form 4 exam? To answer these questions, we add to the wage function for form 4 or more (equation 22-2 above and in table 22-4) a set of dummy variables (4) signifying the division achieved on the 0-level exams. The estimated quation 22-3 is presented in table 2 2 4 .
Exam scores clearly have a powerful influence on earnings. The coefficients - on the dummy variables increase monotonically and in large increments; all four arc highly significant. The equation predicts that, if we standardize for oi:ter characteristics, a form 4 leaver who was placed in the first division will earn in excess of 100 percent more than a form 4 leaver who failed or did not sit the exam. Most striking is that adding exam scores to the explanatory variables entirely eliminates the influence of type of schoolpn earnings. If we compare

604 JANE ARMRACE AND RICHARD SABOT
equations 22-2 and 22-3, the cxfficient on the harambee dummy (Sz) declines from - 0.2 1 to - 0.024 and is no longer statistically signiticant.
All of the difference in earnings herween government xhool and harambee school leavers appears to reflect differences in skills; none appears due to cred=ntialism." Therefore, no adjustment needs to he made to our estimate of the rate of return to haramke schools; the rates of return in rows 3 and 4 of table 22-5 are the same as the base calculations.
As documented in table 22-2, the dropout rate from harambee schools (59 percent) is greater than the rate of dropouts from govemment !3wer secont!*ry schools (15 percent). Whether our estimates of rates of re.urn have to be adjusted for differential wastage depends on whether gross returns to schooling are a linear function or an increasing function of the number of yeas of schooling. If the ren, n5 function is linear, then no adjustment need he made; if the cost function is ,near, the rare of return per year of harambee xhool will be the same, irrespective of the number of years completed, as will the relative rates of return of government schools and haramke schools.:' If, however, retums per year of harambee schooling are lcwer for form 2 than for form 4 leavers, our base estimates of rates of return to harambee schooling are biased upward. To assess this issue of linearity, we calcul?;.c the rate of return to two fears of harambee schooling. This involves estimating a wage function tor form 2 harambee sckwl dropouts and predicting the lifetime stream of net benefits, taking into account only two years of forgone primary wages and direct costs. The result of these calculations is a rate of return (private and social) of 6.5 prcent, considerably less than the rate of return to four years of harambee schooling (9 .5 percent).
To arrive at an adjusted aggregate rate of return to harambee schools, we weight the rates of retum to forms 2 and 4 b: the proportions of students who left haramber school at those levels. Rows 5 and 6 of table 22-5 indicate that the a$.~:cci rate of return is 7.5 percent, thereby widening the gap hetween government and harambee schools in private and social rates of return.:'
Musting fur Search Time
N o wages are earned during the time spent searching ior a job on completion of schooling." We did not take into account this period of search when we predicted the lifetime earning3 -sf school leavers and calculated the base rates of retum. Because there ar . iarge differences between harambee and govemment school leavers in search time, relative rates of return may be biased by this omission. Thirty-five percent of govemment school form 4 leavers found a wage jo j immediately, compared with 19 percent of harambee school leavers. The average time taken to find a wage job for government school leavers was

EFFlCIENCY A N D EQUITY IMrUCATIONS L a
9.5 months. as compared with 16 months for haram& xhool leavers and 32 months for primary xhool leavers.
Rows 7 and 8 of table 22-5 show the mults of taking into account search time.:' Because primary school itavers take a longer time ro find a job than secondary school leavers. the rates of return to b t h goveinmen: and haramhee schools are higher than in the base calculation. The returns to government schools rise more, houvver. Therefore, as in rows 5 and 6. the gap between government and harambee schools in h t h private and social rates of return is widened by the adjustment.
Although we have contirmei rnat the difference between govemment and haramke school leavers in wages results from dikrences in cognitive skills. the question remains: how much of this d~fference iq cognitive skills is due to the higher quality of government schools. and how much is due to the higher achievement at the start of secondary schooling otgovernment school entrants and to their higher ahilitv and socioeconomic background? If. to take an extreme case, all of the difference in skills is due to the selectivity of the government system, then there would he no gap ktween the rwo systems in either gross private or gross social returns. Because of differences in costs, net private returns would still be higher in the government system, but net social retums would actuallv he h~gher in the harambee system.
We attempt to answer t h ~ s question with regard to socioeconomic back- ground; hecause we do not have measures of cognitive skill levels at the beginning of secondary school, we cannot answer it with regard to this dimension of selectivity. Recall. however, that we were able to show for a subsample of form 4 leavers that there is no significant difference in ability between government and haramhe school leavers. Family background may, however, he partly sewing as a proxy for differences in achievement at the start of secondary school. Table 22-6 presents probit estimates of the following simple educational production function for form 4 leaven, together with predicted probabilities for different family background groups and for govern- ment and harambee students:
where H is a dichotomous variable that takes the value 1 where the individual obtained a high score (division 1 or 2) on the 0-level exam. The vector of exogenous variables, X,, includes P,, the family background dummies; S,, the qpe of school dummies; and, to capture the cohort effect, A,, the age of the worker. @ is the cumulative-unit normal-distribution function.
The three coefficients on the family background variables are significantly positive. They indicate that the probability of attaininga high grade increases monotonically as the educational level of the parents of students increases.

606 JANE ARMITAGE AND RICHARD SABOT
Table 22-6. Robu FAurnrumnl RodUCLMI Furuaons
Nevertheless, the coefficient on the harambee dummy (S2) is of larger absolute size and more highly significant than the coefficients on any of the family background variables. The predicted probabilities more clearly illustrate these findings. In both the govemment and the harambee systems, there is consider- able variation in performance on O-level exams by family background. The impact of type of school on the probability of attaining a high grade on the O-levels, however, appears to be larger still: it is nearly five times higher for government school leavers (0.47) than fbr harambee school leaven (0.11)- For reasons noted above, the composition by family background of the two second- ary systems is not very d k n t (see the text table above). The dCect of family background on performance in school is therefore unlikely to have a large effcct on the difference tittween government school leavm and haram-
caf- l ndepmdc l l ld futlmt - - - - -- - - -
One parent with no 1 2 .34 .06
w ofnamnmg lPgh grd'
Goummcnx Hmmnkc P lunrcr Lawr
educanon, one wth P""I (PI) 0.337
(2.1) Both parenrs with
primary, or one wth vxonjary or more; one with none (PJ 0.539
(3.5) One parent with pnmar.
oire wtth secondary or mcre. or hoth wtth xco.idary or mom (P,) 0.979
(4.3) Haram,xe secondary
x i~oo l (SJ - 1.159 (4.9)
Pnvate secondary sclrool 6,) - 0.903
(4.9) Government
tcchn~cal school (S,) 5.153 (0.5)
Age (A1 0.010 (0.5)
Constant - 0.699 x 78.2 Number - 4%
.47 .11 p1 .55 -15 p, .71 .27 Avengeb .47 .I3
Now: Figum in parentheses are t statist~cs. a. The probability that Y = 1 is the area under the standard normal curve b e w e n - m and
X'B. Pmbabilina are predicted for individuals with mean age. b. Avt!raged over all family background group, with weights qua1 to mean fam~ly background ,
for sample.
EFFICIENCY AND EQUITY IMPLICATIONS 607
bee school leaven in predicted cognitive skill levels and thus in predicted wages and rehi;% to secondary schooling. The results of sirnulanng the rerum to government and haramke schooling in the ahsence of government school selectiviry by family background. presented in rows 5 and 6 of table 22-5. confirm this point.'; The pap in both private and social returns narrows only marginally.
In sum. although our adlustments are not comprehensive, neither do they give conflicting signals. Two of our four adjusrment.4Crr credentialism and for the selectivity of govemment schools-have little impact on the relative rates of return of government and haramke schools. The other two adjust- ments-for differences in length of job search and in wastage rates--widen rire gap between government and harambee schools in both private and social rates of return. The widening of the gap in private returns implies that our simula- tions with the base-rdte calculations underestimated the i n ~ w a s e in user fees necessary to equa1i:e pnvate returns to investment In the two systems. I t appears that 8.0~Y1 shillings per annum would not he sufficient. The widening o t the gap in social returns implies that allowing the haramhee system to increase its share ot enrollments entails somewhat h~gher efticiency costs than we had suppi>sed.
Access to Government Schools and Family Background
Our asseament of the consequences for the distribution of schoolirig of reducing per pupil subsidies is based on estimates of a simple educational attainment function. llsing binomial probit, we obtain maximum likelihood estimates of the paramtters In the following reduced-form equation:
where G is a dichotomous variable that takes the value 1 where an individual attended a government secondary school (and thus benefited from govemment subsidies) and O where the individual did not; X is a vector of exogenous variables. The exogenous variables include a set of four dummy variables signihing the education level of the parents of the fndividila!. In another specification of the education attainment function, estimated only for indi- viduals whose fathers were farmers, a variable signifying the size of the farm is also included among the exogenous variables. @(X' B) is the cumulative-unit normal-distribution function."
Table 22-7 presents estimates of our prohit educational attainment function and predicted probabilities of attending a govemment secondary school for various family background groups. In equation 22-7, estimated for the entire sample, the coefficients on the parents' education variables are positive and increase monotonically; all are significant. As we noted above, the predicted probabilities of reaping the very large private Benefits from the subsidies of govemment education rise sharply with the educational level :sf the parents.

60% JANE -AGE AND RICHARD SABOT
Now F~gures In parentheses are I statlsttcs. a. The probahtllty that Y = I IS the area under the standard normal curve ktween - -c mJ
X'B. Probab~l~tles are preillcted fot .A~vtduals horn outs~de Nalroh~, at the mean age. b Pmbab~ltt~es are predicted tor ~nd~vtduals uwh uneduc.trd parents, at the mean age.
Table 22-7. Probit W Attr.rinment FwrcPbtrr
Access to the govemment secondary system is meritocratic; selection is based largely on performance on the ex4,nination at the end of primary school. The education production function - re estimated (table 22-6) therefore sug- gests one explanation for the relationship between parents' education and access to govemment secondary schools. It indicated that the education level of parents matters to performance in both high-quality (govemment) and low-quality (harambee) schools." Though we have no direct evidence, there is a strong presumption that, standardizing for school quality, the educational level of parents is aim positively related to performance in primary schools." Moreover, chi'tdren of more educated parents are likely to attend primary schools of above-average quality because of the concentration of both educated parents and high-quality primary schools in urban areas.
Our second educational attainment function (equation 22-8 in table 21-71 indicates that family wealth has an influence on the probability of attending a govemment secondary school independent of parents' education. The q u a - tion is estimated only for those workers whose fathers wen farmers and includes a measure, 4, of the size in acres of the family farm among the
coeftinmc
1-WnnMc ( 1 ) (2)
Equanon (22-i) 122-8) One parent with no
educar~on. one w ~ t h primary (P:) 0.,6l 3.131
(1.9) (I..?) Both parents r ~ t h
pnmary. or one wlth wxondarv or more:
3.581 0. 59i one wlrh none (Pi) (6.1) (3.4)
One parent v ~ c h pnmaty; tme u -~ th secondary cr more. or kith w~rh xcnndarv or more ( P4) I 242 0.743
(6.1 ) (1.3) Born ~n N a ~ r o b ~ (.I;) 3. l i6 -
(: 8) - Ace ( .A) -0.241 -0.041
(8.1 ) (4.6) .Acreage oi farm (-4,) - 0.010
12.5) Constant 3.355 0.319 X : 193.2 48.0 Number 1.650 5 39
t o a m sec* school'
Fmm (22-7) PI .I6 p: .23 P, .33 p* . 5 1
Fmm (226)' 1.5 a c m . I7 3.5acm .I9 - I a c m .I9 15 acres .21 25acm .24
EFFICIENCY AND EQUITY IMPLICATIONS 609
independent vaiiables. Although coefiiciena of the parenn' education vari- ables continue to k posirive and increase monotonxally, they arc reduced in troth magnitude and significance relative to equation 22-7. The coefficient on the size-of-farm variable is posirive and significant. For students with unedu- cated krmers as parents, the predicted probability is some 40 percent higher for those from fanns of 25 acres than for those from farms of 1.5 acres. This relationship may indicate a nonmeritocratic corqonent in the influence of family background on access to government secondary schooling.
The equations represented by table 22-7 measure the relationship between the socioeconomic status of the parents of the worken in our sample and the educational attainment of the workers. To confirm that the effect of family background is not merely a historical phenomenon, we also estimated by probit the relationship between the educational attainment of the workers and the probability that their children would attend a government secondary school. The results (not shown) for the younger two generations are qualita- tively the same as those for the older two generations: the richer the family, the greater the likelihood that it will benefit from government subsidies of second- ary education." This outccme is especially perverse, kcause in Kenya, as in many developing countries, the govemment generates much of its revenue hum regressive import and excise duties rather than from progressive income taxes. "
Conclusions
The private rate of return to investment in secondart. education is markedly higher for children who attend government secondaq schools than for chil- dren who attend haramhee schools. The reason is partly the lower private costs of government schcwling and partly the higher gross returns. The latter phenomenon is the result of the higher level of cognitive skills of government school graduates." Mor~over, a positive relationship between family income and the probability of reaping the subsidies to government schools contributes to the difference in private rates of return. These tindings provide the basis for efficiency and equip arguments for reducing per pupil subsidies in government schools by selectively increasing user fees.
Our simulations indicate that it would take an increase in user fees in excess of 8,000 shillings per student per annum to equalize private rates of return in the two systems. The revenue potential of user fees in government schools is therefore substantial-more than 300 percent of government per student recurrent expenditures on secondary education. In part, the revenue potential is so large hecause in the relevant range the price elasticity of demand for government schooling appears to be so small. It must be emphasized, however, that, in practice, the revenue potential will he less than the amount indicated kcause of the inability of some families to bomw in formal credit markets to finance schooling. Nevertheless, a substantial proportion of students in gov-

610 JANE ARMITAGE AND UCHAID SABOT
emment schools are from families with the means to pay the cost of their children's education who would be willing to do so in the absence of a highly subsidized alternative. The willingness of relatively low-income families paying high fees to send children to low-quality haramhee schools that yield low private returns p v i d e s the evidence for the latter assertion.
Government schools are unlikely to k underutilized as a consequence of even suhstanrial increases in user fees. nor wouid a reduction of per pupil subsidies result in a deterioration of school quality. as private funds would simply substitute for public funds, leaving per pupil expenditures unchanged. There is some danger of inefficient changes in the composition of the student body of govemment schools and of a reduction in the size of the secondary system as a whole as a consequence of increases in user fees. There is some reason to believe that those students from uneducated ( p r ) backgrounds forced to withdraw tiom the school system by the rise in fees will be the most able. The reason is that students who gain access to government secondary schools without having the advaxages of educated parents are likely to be unusually bright. If the increases in fees are uniform, relatively bright but p o r students may terminate their education and may be replaced by less able students from higher-income tamdies who would otherwise have gone to haramhv schools.
To avoid this eventuality, increases in user fees could be discriminatory. In eifect, a yteeds-based scholarship program could ensure that admissions deci- sions would connnue to reflect solely meritocratic criteria. Such a program is hound to suHer horn one of the two following problems: if the criteria for awarding scholarshtps are too loose, the scholarship program will cost too much; if the criteria are too tight, then the govemment secondary system may lose students who would qualify on meritocratic grounds. Though the difficul- ties of assessing ab~liry to pay should not be underestimated, this system is likely to distribute government subsidies more equitably than the current system. At present, the least needy have the highest probability of obtaining a subsidy. The gap between what the govemment could charge and what it does charge is equal in value to income from two years of work at the mean urban wage. One alternative to raising who01 fees and providing scholarships to the needy would be to raise fees and then to provide all students with loans to finance the private costs of a govemment secondary school education. This approach would have the advantage of avoiding the application of means tests. The disadvantage lies in the administration of a program for repayment. In Kenya the "pay-as-you-earn" tax system could be used for this purpose.
Reducing per student subsidies by allowing low-subsidy harambee schools to satisfy an increasing proportion of the growing demand for secondary schooling has been a de facto policy of the Kenyan govemment for more than a decade. Our results suggest that, for reascns of allocative efficiency, the case for this approach is actually not as strong as the case for raising user fees in govemment schools. The difference between the two systems in social rates of return indicates that harambee schools are less efficient than govemment schools,

EFFICIENCY AND E Q L ~ IMPLICATIONS 61 1
tha t is, they raise worker productivity less per shilling of total expenditure. Government regulation of quality in harambee schools together with small subsidies (relative to those given to government schools) for quality-improving purposes, however, may substantially curtail the efficiency costs of this means of reducing per student subsidies in the entire secondary system.'7 S w h would be the case if the difference in efficiency between the two systems was explained by the higher total expenditure per pupil in government than in ha ramtw xhoo l s and by the finding that Kenyan secondary xhools lie o n a portion of t he education production function that is characterized by increas- ing returns.
Notes
1. The wider gaps observed m the structure ofearnings In low-income counties than in high-income countries could k amihted to the rlative x a ~ i r y of educated l a h in the former. For evidence of substantial compression of the educational structure of wages and reituct~on in the inequality of pay in East Afnca as a consequence of the expansion of secondav education, see Knight and Sahot (19830).
2. Haramhee IS a Swahili w ~ r d meaning "let's pull together": harambee schools are those built and financed by the local community.
3. The exchange rate in 1980 was i . 57 shillings to the U. S. dollar. The mean annual earnings of the manual workers In our sample was a b u t 9.503 sh~llings. Per caplta income was a b u t $420 in 1981. Throughout, our analysis compares government with haramhe xhools to the exclusion of other private xhools. The reason is the heter- ogenelty of the "other" category. Some few of these pnvate schools are very good and very costlv; most are of very poor quality and low in cost. Thus this category would have had to he further disaggregated, and some key data were not available for the compo- nent pam. The omission does not pqse a serious problem, as ~t appears that haramhec xhools are representative in key respects of the larger group of low-cost private schools.
4. We do not suggest that haramke schools are attempting to offer a qualitatively different type of education, for example more practical or vocat~onal training rather than an academic education. Their curriculum is or~ented toward preparation for the same lower exams at the end of secondary school that are taken by government school students.
5. For detailed discussion of the nature of the ab~lity tests and the influence of ability on accumulation of cognitive skills and on earnings, see Boissiere. Knight, and Sabot (1985).
6. Predictions are made with wage functions presented in table 22-2. They do not allow for any compression of the educational structure of wages that might result from educational expansion.
7. In this model, whether an individual demands secondary schwlingdepcnds solely on whether the expected present value of net benetits is positive and on whether the individual chooses between segments of the secondary system solely on the basis of the relative magnitude of present values.
8. Government guidelines call for holding expenditures for education to 30 percent or less of the recurrent nondefense budget. For 1981-63, the share was estimated to be nearly 35 percent.
9. The estimated net enrollment ratio in primary schools in 1981 is still only 0.83. Hence, in addition to keeping pace with population growth (3.8 percent per annum).
612 JANE AIMITAGE AND RICHARD SABOT
the primazy system must expand sufficiently to enroll the 17 percent of school-age children & arc not yet in xhwl . 10. Although the returns to government schooling are high if people are capital
c o n s t a d . a rix in user im may force them to withdraw from the government system. A duction oigovernment school fees to a level k l w that ofharamkc school fees will mean students' withdrawal from the secondary xhool system entirely. When fees in government xhools are ralsed above those in harambee xhools, people facing liquidity constaints may be forced to switch into the harambee system even though the private returns are lower.
1 1. If the net benefits of secondary education are B, per year, extending over a period of n years. the internal rate of return (r) to investment by an individual m four years of secondary education (during which B, is negative) is calculatd by solving the iollowing equation for r:
12. Suc11 estimates d social returns of course do not take into account the extemali- ties mentioned above that are generated by the secondary system, which would tend to increase the social returns.
If. We also estimate a version of equation 22-2 in which S, interacts with the other dependent variables, hut we conclude, using F tests, that this is not a superior specification.
14. The assumprion here is that, although there will be a large difference hetween pmary and secondary school leavers with respect to their proportions in the white- collar intensive public sector, the difference between govemment and h a r a m h secondary school leavers in this regard will k relatively small.
15. There are likely to Ix differences In profiles ktween cohorts of school leavers because of the changes in the education-occupation matrix associated with rapid educational expansion. See Knight and Sabot (1981 ).
16. Recall that b t h the government and the harambee secondaw systems have been growing very rapidly.
17. The s w e y is administered by the Central Bureau of Statistics in collaboration with the Ministries of Bas~c and Higher Education. The figure fot average private expenditure per student for harambee schools is a weighted average of the expenditures in assisted harambee xhools and unaided harambee schools, where the weights are the proportion of total haranbee enrollments in the two types of schools. Similarly, the figure for private expenditure per pupil for government schools is a weighted average oi the expenditures in the various types of government schools where the weights are the proportions in the different types of government xhools.
I< The government expenditure figures are aggregates; to obtain per pupil expendi- tures, it is necessary to use the appropriate enrollments. Although public expenditures on haramhee K~IOO~S are conhned to assisted harambee schools, the appropriate enrollment ligure for our purposes is total harambec enrollments., Because our other costs and our returns data refer to 1979, it is necessary to deflate government expendi- tures. To do so we use I 2 percent, the official government estimate of t k rate of inflation for 1980.
19. The large majority of ratesf-return studies share this weaknew of focusing exclusively on urban wage employment. See Psacharopoub and Hinchliffe (1973). 20. We assume that the wages of primary xhool leavets arc an acculate measure of
opportunity costs of secondary xhool leaven. If entrance to secondaq xhools is meritocratic, this measure of opportunity costs will be too low. Moreover, to the extent that government secondary entrants are of higher quality than harambet entrants, the opportunity coats of the former will be still higher.
EFFICIENCY AND EQUITY IMPLICATIONS 613
21. The 6,372-shilling difference knvcm the total cost of schooling (3,368 shill- ings per annum) and rhe fee that could be charged, given perfect capital markets, would be a tax on educational expenditure.
22. See b n d and Griffin ( 1983). This &mate ignores the general equilibrium e k n of a nse in user fns: if pcople spend more of their income on education, they may spend less on other goods that the govemmnent tax=, which will have a negative impact on public revenues. or less on goods that are subsidized, which will have a positive impact on public revenues.
23. High-cost, highquality private schools enroll only a small proportion of secon- dam students. Some expansion could drain revenue fiom the government system.
24. The actual cast of one shilling in pu'olic money is greater than the nominal cost kcause of rhe administrative and efficiency costs of collecting public money via the tax system. Taking this factor into account would lower the social return to government schools. H a r a m k schools, however, are often built and supponed with v o l u n q l a h r and other inputs that are not "costed," in which case one shilling of private money mav also be an underestimate of resources d.
25. The fact that government and h a r a m k school leavers with tire same exam scores are predicted to earn the same wages reinforces our assumption that the only characteristic that differentiates government and harambee leavers is their exam results.
26. Strictly speaking. linearity of wages in education docs not imply constancy in rate of return over education of different lengths, because the length of the working life decreases as vean oi education increase. This qualificanon is unlikely to k quantita- tiveiv immrtant. * r
27. Because so few pupils drop out of government school, then is no need to adjust these rerums.
28. School leavers mav have ohtained income f m other sources during this period. The survey does not yield estimates of such income.
29. The following procedure was adopted: when we predict the lifetime wage profile for priman. school leaven r e impose nm wages for the first two years, a third of a year's rape for the third vear, and wages in the Tth year equivalent to (T - 2.7) years of exprience. When we predict the wage profile for government secondary xhool leavers. the wages tor the first four vears after primary xhool are zero as kfore. In the fifth year, 0.2 of a year's wages are imposed, and in the Tth year wages equivalent to (T - 4.8) vears dexprience. For haramhee school leavers zero wages are imposed for the first five yean after primary school, in the sixth year half of a year's wages, and in the Tth year wages equivalent to (T - 5.5) years of exprience.
30. The simulation was conducted -, tollows: wage function 22-3 in table 22.4 was reestimated (see equation 22-41, and we substituted for the disaggregand set of dum- mies the r a r e aggregate exam score variable used in the probit education production function. We then substirute the 0-level scores for the graduates of the two types of school that were predicted when family background is set at the sample mean into the wage function to predict, in turn, the respective earnings streams for the gnduates from the two types d xhool. The simulation removes the pan of the higher cognitive achievement and earnings of government school leavers due to their more educated family background.
3 1. Note that in this m d e l the coefficients do not represent the marginal change in the probability associated with each independent variable as they do in a simple linear probability model. For heuristic reasons. therefore, in our results, predicted probabili- ties for various representative groups are presented.
32. This relationship is not unique to Kenya. For reviews of studies that have documented such a relationship in other contexts, KC Alexander and Simmons (1975) and Bridge, Judd, and Moock (1979).
614 JANE ARMITAGE AND RICHARD SABOT
33. Virtually all primary education is provided by the government; t h m is no equivalent to harambee schools or the primav level in Kenya.
34. Kenya not unique in this rgard. For evidence of a similar outcome in the United States. xe Hanxn and Weisbtod (1969). and in Colombia xe Jallade (1974).
35. See Fields (197%) for evidence that the ovcrall incid-nce of taxes in Kenya is regressive.
36. Thne is some expectation that the scarcity rents earned by the highest achievers in secondary schools may be reduced over time. See Knight and Sabot (1983a).
37. Such as buying textbooks, hiring ktter-mined teachers. and reducing teacher1 student ranos.
Related Documents